West Slope, OR Map & Demographics
West Slope Map
West Slope Overview
$60,915
PER CAPITA INCOME
$149,643
AVG FAMILY INCOME
$89,154
AVG HOUSEHOLD INCOME
13.3%
WAGE / INCOME GAP [ % ]
86.7¢/ $1
WAGE / INCOME GAP [ $ ]
0.48
INEQUALITY / GINI INDEX
6,663
TOTAL POPULATION
3,550
MALE POPULATION
3,113
FEMALE POPULATION
114.04
MALES / 100 FEMALES
87.69
FEMALES / 100 MALES
42.3
MEDIAN AGE
2.9
AVG FAMILY SIZE
2.2
AVG HOUSEHOLD SIZE
3,793
LABOR FORCE [ PEOPLE ]
65.8%
PERCENT IN LABOR FORCE
3.2%
UNEMPLOYMENT RATE
Income in West Slope
Income Overview in West Slope
Per Capita Income in West Slope is $60,915, while median incomes of families and households are $149,643 and $89,154 respectively.
| Characteristic | Number | Measure |
| Per Capita Income | 6,663 | $60,915 |
| Median Family Income | 1,466 | $149,643 |
| Mean Family Income | 1,466 | $174,926 |
| Median Household Income | 2,932 | $89,154 |
| Mean Household Income | 2,932 | $135,189 |
| Income Deficit | 1,466 | $0 |
| Wage / Income Gap (%) | 6,663 | 13.27% |
| Wage / Income Gap ($) | 6,663 | 86.73¢ per $1 |
| Gini / Inequality Index | 6,663 | 0.48 |
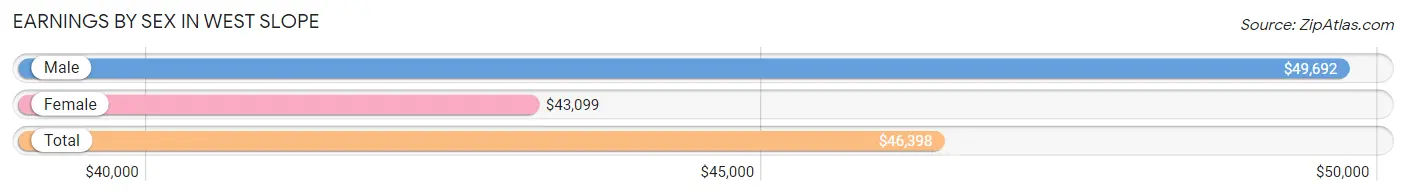
Earnings by Sex in West Slope
Average Earnings in West Slope are $46,398, $49,692 for men and $43,099 for women, a difference of 13.3%.
| Sex | Number | Average Earnings |
| Male | 2,195 (55.1%) | $49,692 |
| Female | 1,789 (44.9%) | $43,099 |
| Total | 3,984 (100.0%) | $46,398 |
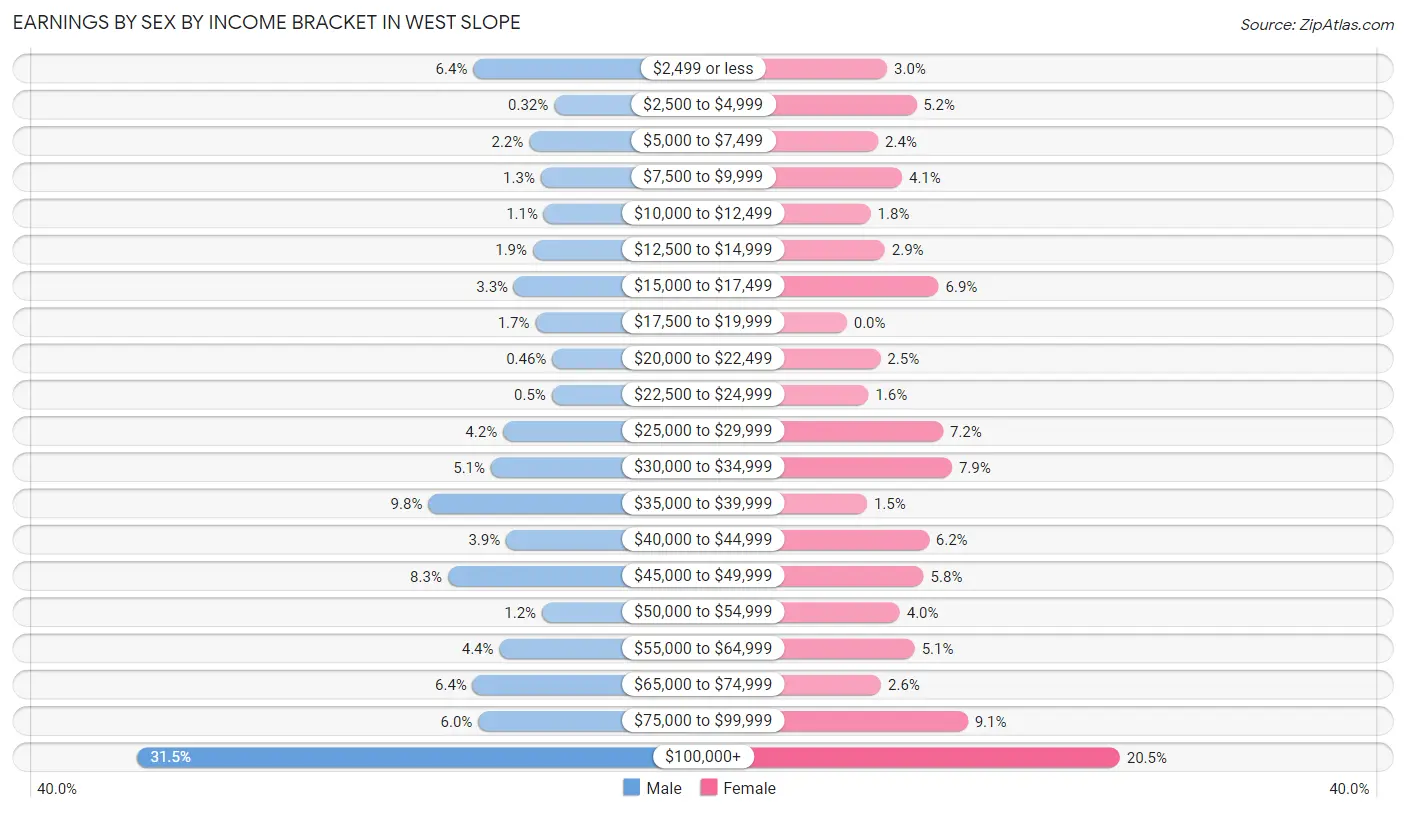
Earnings by Sex by Income Bracket in West Slope
The most common earnings brackets in West Slope are $100,000+ for men (692 | 31.5%) and $100,000+ for women (366 | 20.5%).
| Income | Male | Female |
| $2,499 or less | 140 (6.4%) | 54 (3.0%) |
| $2,500 to $4,999 | 7 (0.3%) | 93 (5.2%) |
| $5,000 to $7,499 | 48 (2.2%) | 42 (2.4%) |
| $7,500 to $9,999 | 29 (1.3%) | 74 (4.1%) |
| $10,000 to $12,499 | 24 (1.1%) | 32 (1.8%) |
| $12,500 to $14,999 | 42 (1.9%) | 51 (2.9%) |
| $15,000 to $17,499 | 73 (3.3%) | 123 (6.9%) |
| $17,500 to $19,999 | 38 (1.7%) | 0 (0.0%) |
| $20,000 to $22,499 | 10 (0.5%) | 45 (2.5%) |
| $22,500 to $24,999 | 11 (0.5%) | 29 (1.6%) |
| $25,000 to $29,999 | 91 (4.2%) | 129 (7.2%) |
| $30,000 to $34,999 | 111 (5.1%) | 141 (7.9%) |
| $35,000 to $39,999 | 214 (9.8%) | 27 (1.5%) |
| $40,000 to $44,999 | 86 (3.9%) | 110 (6.1%) |
| $45,000 to $49,999 | 182 (8.3%) | 103 (5.8%) |
| $50,000 to $54,999 | 27 (1.2%) | 71 (4.0%) |
| $55,000 to $64,999 | 97 (4.4%) | 91 (5.1%) |
| $65,000 to $74,999 | 141 (6.4%) | 46 (2.6%) |
| $75,000 to $99,999 | 132 (6.0%) | 162 (9.1%) |
| $100,000+ | 692 (31.5%) | 366 (20.5%) |
| Total | 2,195 (100.0%) | 1,789 (100.0%) |
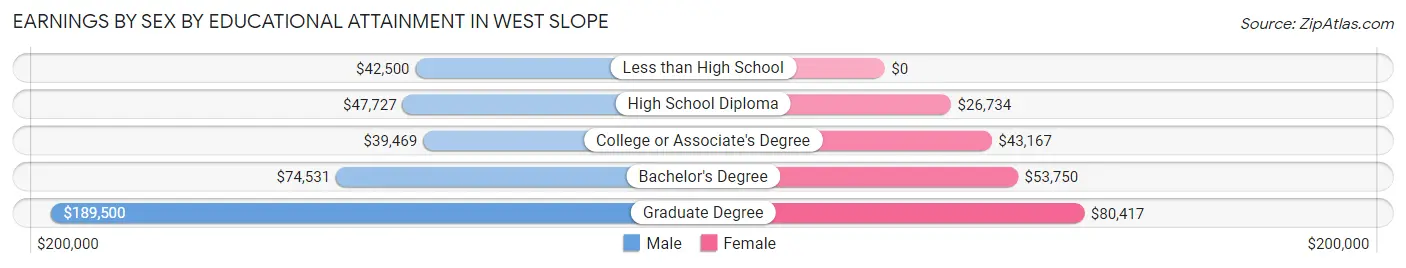
Earnings by Sex by Educational Attainment in West Slope
Average earnings in West Slope are $61,282 for men and $45,179 for women, a difference of 26.3%. Men with an educational attainment of graduate degree enjoy the highest average annual earnings of $189,500, while those with college or associate's degree education earn the least with $39,469. Women with an educational attainment of graduate degree earn the most with the average annual earnings of $80,417, while those with high school diploma education have the smallest earnings of $26,734.
| Educational Attainment | Male Income | Female Income |
| Less than High School | $42,500 | $0 |
| High School Diploma | $47,727 | $26,734 |
| College or Associate's Degree | $39,469 | $43,167 |
| Bachelor's Degree | $74,531 | $53,750 |
| Graduate Degree | $189,500 | $80,417 |
| Total | $61,282 | $45,179 |
Family Income in West Slope
Family Income Brackets in West Slope
According to the West Slope family income data, there are 570 families falling into the $200,000+ income range, which is the most common income bracket and makes up 38.9% of all families.
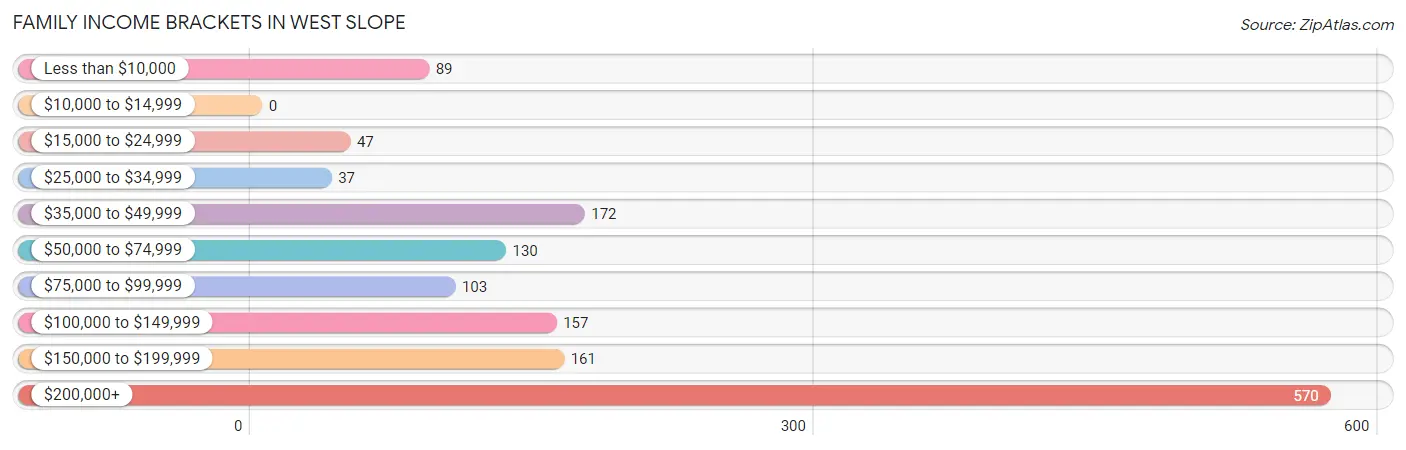
| Income Bracket | # Families | % Families |
| Less than $10,000 | 89 | 6.1% |
| $10,000 to $14,999 | 0 | 0.0% |
| $15,000 to $24,999 | 47 | 3.2% |
| $25,000 to $34,999 | 37 | 2.5% |
| $35,000 to $49,999 | 172 | 11.7% |
| $50,000 to $74,999 | 130 | 8.9% |
| $75,000 to $99,999 | 103 | 7.0% |
| $100,000 to $149,999 | 157 | 10.7% |
| $150,000 to $199,999 | 161 | 11.0% |
| $200,000+ | 570 | 38.9% |
Family Income by Famaliy Size in West Slope
5-person families (24 | 1.6%) account for the highest median family income in West Slope with $250,001 per family, while 3-person families (394 | 26.9%) have the highest median income of $69,167 per family member.
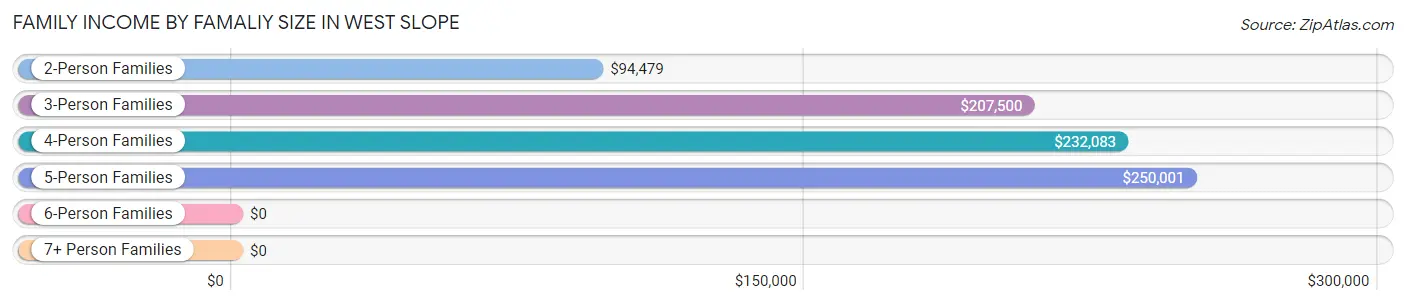
| Income Bracket | # Families | Median Income |
| 2-Person Families | 735 (50.1%) | $94,479 |
| 3-Person Families | 394 (26.9%) | $207,500 |
| 4-Person Families | 298 (20.3%) | $232,083 |
| 5-Person Families | 24 (1.6%) | $250,001 |
| 6-Person Families | 0 (0.0%) | $0 |
| 7+ Person Families | 15 (1.0%) | $0 |
| Total | 1,466 (100.0%) | $149,643 |
Family Income by Number of Earners in West Slope
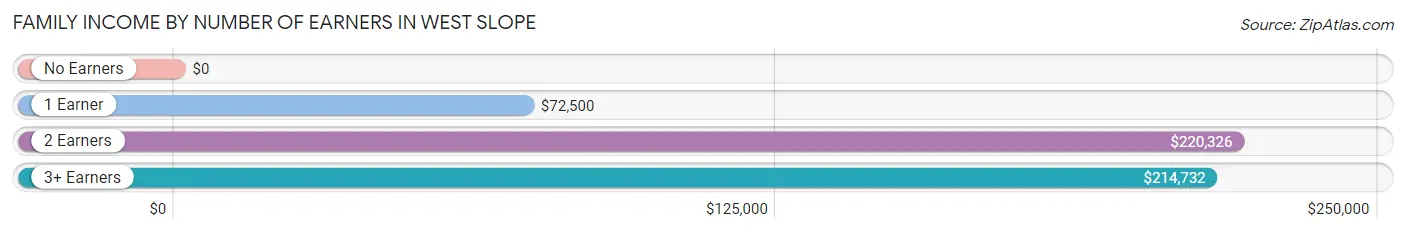
| Number of Earners | # Families | Median Income |
| No Earners | 181 (12.3%) | $0 |
| 1 Earner | 520 (35.5%) | $72,500 |
| 2 Earners | 654 (44.6%) | $220,326 |
| 3+ Earners | 111 (7.6%) | $214,732 |
| Total | 1,466 (100.0%) | $149,643 |
Household Income in West Slope
Household Income Brackets in West Slope
With 712 households falling in the category, the $200,000+ income range is the most frequent in West Slope, accounting for 24.3% of all households. In contrast, only 23 households (0.8%) fall into the $10,000 to $14,999 income bracket, making it the least populous group.
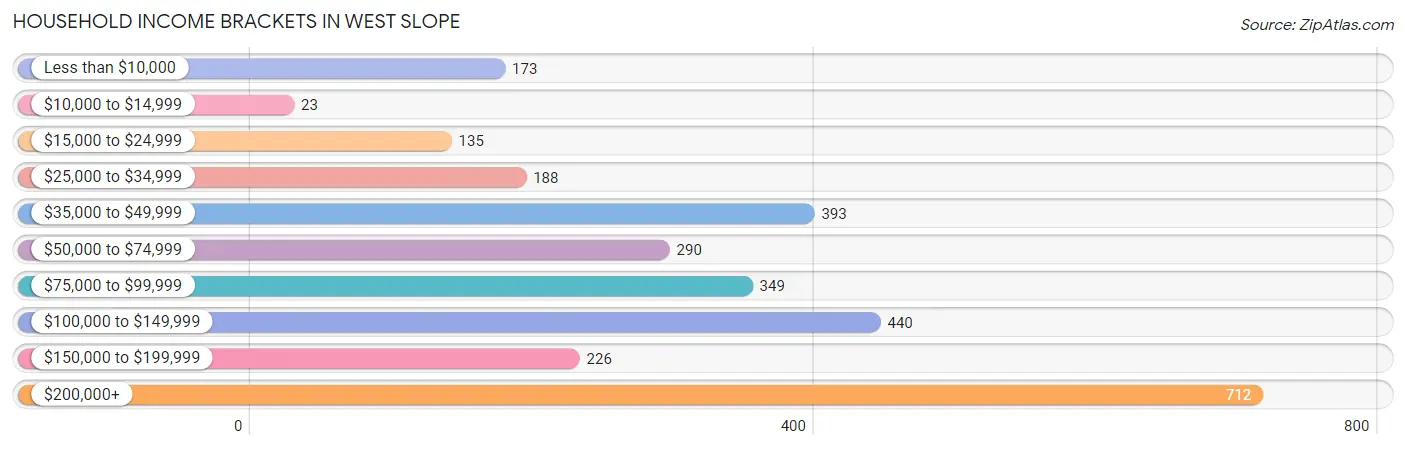
| Income Bracket | # Households | % Households |
| Less than $10,000 | 173 | 5.9% |
| $10,000 to $14,999 | 23 | 0.8% |
| $15,000 to $24,999 | 135 | 4.6% |
| $25,000 to $34,999 | 188 | 6.4% |
| $35,000 to $49,999 | 393 | 13.4% |
| $50,000 to $74,999 | 290 | 9.9% |
| $75,000 to $99,999 | 349 | 11.9% |
| $100,000 to $149,999 | 440 | 15.0% |
| $150,000 to $199,999 | 226 | 7.7% |
| $200,000+ | 712 | 24.3% |
Household Income by Householder Age in West Slope
The median household income in West Slope is $89,154, with the highest median household income of $103,063 found in the 45 to 64 years age bracket for the primary householder. A total of 1,115 households (38.0%) fall into this category. Meanwhile, the 15 to 24 years age bracket for the primary householder has the lowest median household income of $81,000, with 166 households (5.7%) in this group.
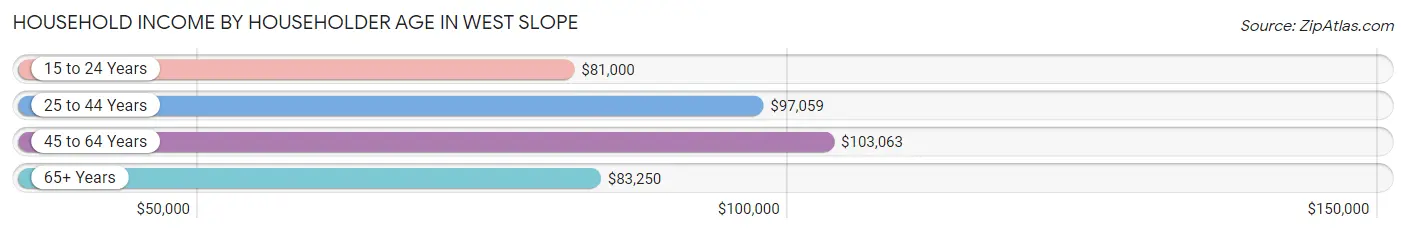
| Income Bracket | # Households | Median Income |
| 15 to 24 Years | 166 (5.7%) | $81,000 |
| 25 to 44 Years | 832 (28.4%) | $97,059 |
| 45 to 64 Years | 1,115 (38.0%) | $103,063 |
| 65+ Years | 819 (27.9%) | $83,250 |
| Total | 2,932 (100.0%) | $89,154 |
Poverty in West Slope
Income Below Poverty by Sex and Age in West Slope
With 10.6% poverty level for males and 10.0% for females among the residents of West Slope, 6 to 11 year old males and 25 to 34 year old females are the most vulnerable to poverty, with 55 males (31.8%) and 91 females (23.7%) in their respective age groups living below the poverty level.
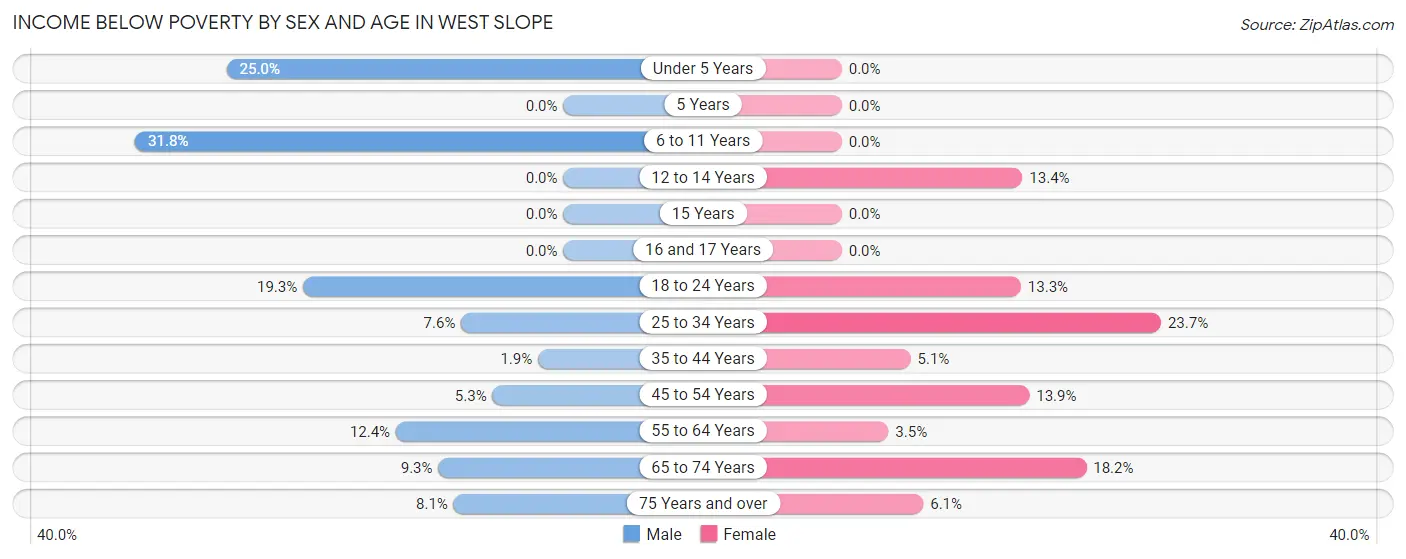
| Age Bracket | Male | Female |
| Under 5 Years | 61 (25.0%) | 0 (0.0%) |
| 5 Years | 0 (0.0%) | 0 (0.0%) |
| 6 to 11 Years | 55 (31.8%) | 0 (0.0%) |
| 12 to 14 Years | 0 (0.0%) | 11 (13.4%) |
| 15 Years | 0 (0.0%) | 0 (0.0%) |
| 16 and 17 Years | 0 (0.0%) | 0 (0.0%) |
| 18 to 24 Years | 58 (19.3%) | 31 (13.3%) |
| 25 to 34 Years | 50 (7.6%) | 91 (23.7%) |
| 35 to 44 Years | 8 (1.9%) | 25 (5.1%) |
| 45 to 54 Years | 22 (5.3%) | 54 (13.9%) |
| 55 to 64 Years | 65 (12.4%) | 22 (3.5%) |
| 65 to 74 Years | 32 (9.3%) | 59 (18.1%) |
| 75 Years and over | 21 (8.1%) | 13 (6.0%) |
| Total | 372 (10.6%) | 306 (10.0%) |
Income Above Poverty by Sex and Age in West Slope
According to the poverty statistics in West Slope, males aged 5 years and females aged under 5 years are the age groups that are most secure financially, with 100.0% of males and 100.0% of females in these age groups living above the poverty line.
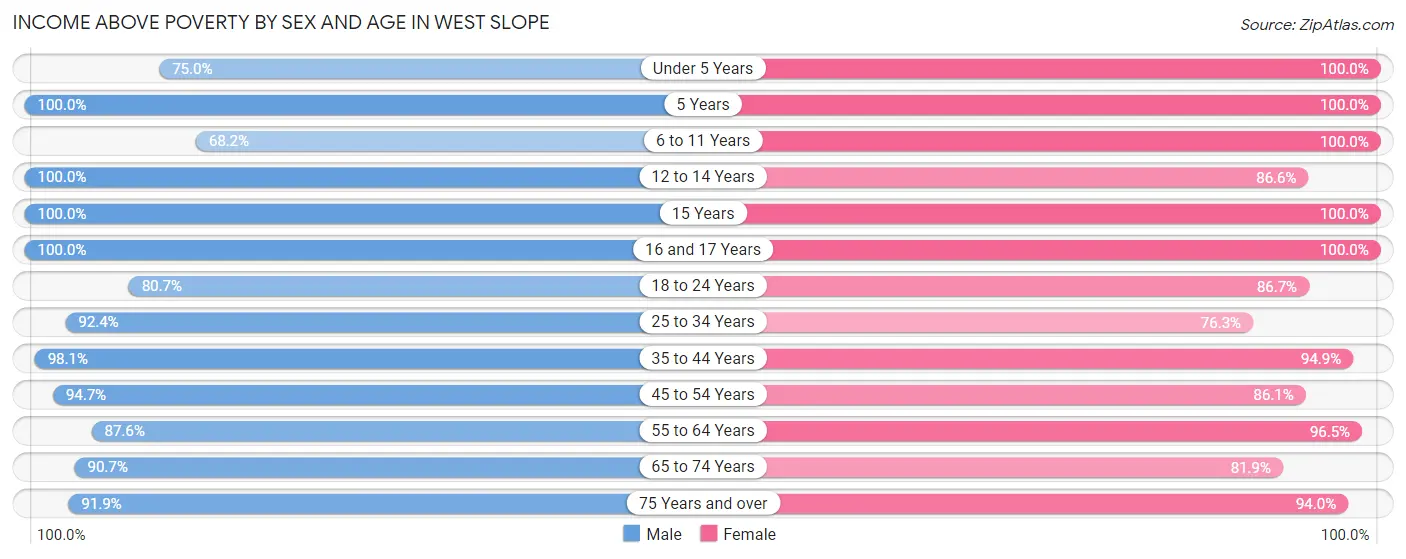
| Age Bracket | Male | Female |
| Under 5 Years | 183 (75.0%) | 39 (100.0%) |
| 5 Years | 34 (100.0%) | 15 (100.0%) |
| 6 to 11 Years | 118 (68.2%) | 138 (100.0%) |
| 12 to 14 Years | 44 (100.0%) | 71 (86.6%) |
| 15 Years | 56 (100.0%) | 43 (100.0%) |
| 16 and 17 Years | 38 (100.0%) | 80 (100.0%) |
| 18 to 24 Years | 242 (80.7%) | 202 (86.7%) |
| 25 to 34 Years | 610 (92.4%) | 293 (76.3%) |
| 35 to 44 Years | 417 (98.1%) | 464 (94.9%) |
| 45 to 54 Years | 396 (94.7%) | 334 (86.1%) |
| 55 to 64 Years | 458 (87.6%) | 614 (96.5%) |
| 65 to 74 Years | 313 (90.7%) | 266 (81.9%) |
| 75 Years and over | 237 (91.9%) | 202 (94.0%) |
| Total | 3,146 (89.4%) | 2,761 (90.0%) |
Income Below Poverty Among Married-Couple Families in West Slope
The poverty statistics for married-couple families in West Slope show that 4.3% or 50 of the total 1,149 families live below the poverty line. Families with 1 or 2 children have the highest poverty rate of 11.0%, comprising of 50 families. On the other hand, families with no children have the lowest poverty rate of 0.0%, which includes 0 families.
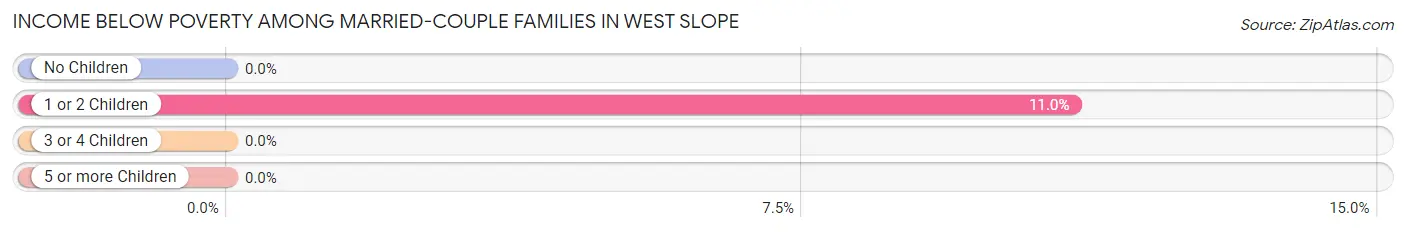
| Children | Above Poverty | Below Poverty |
| No Children | 673 (100.0%) | 0 (0.0%) |
| 1 or 2 Children | 404 (89.0%) | 50 (11.0%) |
| 3 or 4 Children | 22 (100.0%) | 0 (0.0%) |
| 5 or more Children | 0 (0.0%) | 0 (0.0%) |
| Total | 1,099 (95.7%) | 50 (4.3%) |
Income Below Poverty Among Single-Parent Households in West Slope
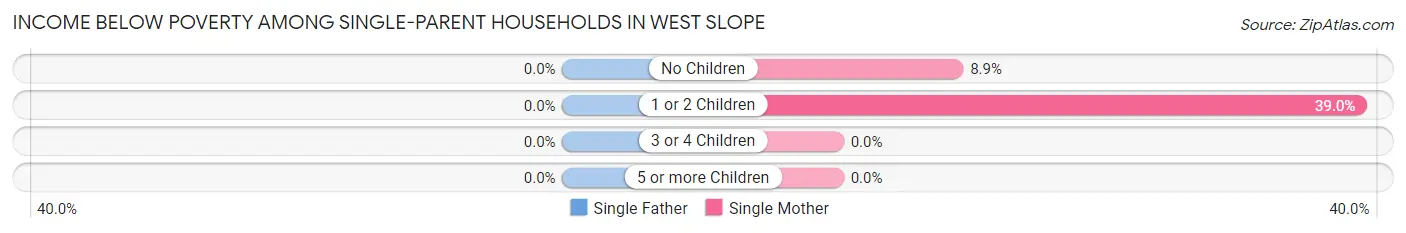
| Children | Single Father | Single Mother |
| No Children | 0 (0.0%) | 9 (8.9%) |
| 1 or 2 Children | 0 (0.0%) | 39 (39.0%) |
| 3 or 4 Children | 0 (0.0%) | 0 (0.0%) |
| 5 or more Children | 0 (0.0%) | 0 (0.0%) |
| Total | 0 (0.0%) | 48 (23.9%) |
Income Below Poverty Among Married-Couple vs Single-Parent Households in West Slope
The poverty data for West Slope shows that 50 of the married-couple family households (4.3%) and 48 of the single-parent households (15.1%) are living below the poverty level. Within the married-couple family households, those with 1 or 2 children have the highest poverty rate, with 50 households (11.0%) falling below the poverty line. Among the single-parent households, those with 1 or 2 children have the highest poverty rate, with 39 household (30.2%) living below poverty.
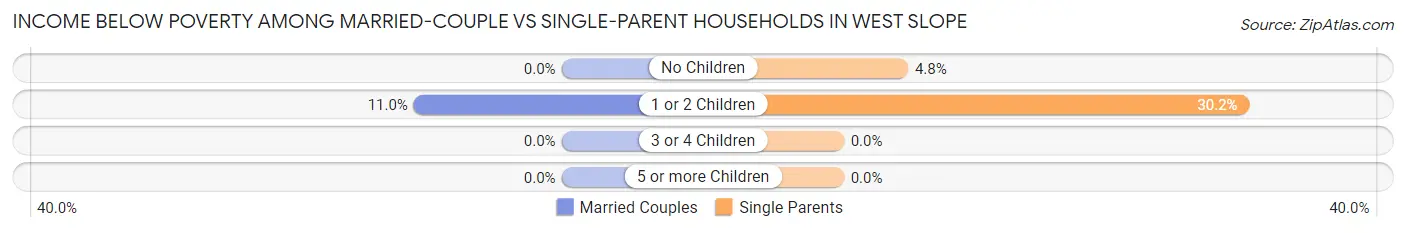
| Children | Married-Couple Families | Single-Parent Households |
| No Children | 0 (0.0%) | 9 (4.8%) |
| 1 or 2 Children | 50 (11.0%) | 39 (30.2%) |
| 3 or 4 Children | 0 (0.0%) | 0 (0.0%) |
| 5 or more Children | 0 (0.0%) | 0 (0.0%) |
| Total | 50 (4.3%) | 48 (15.1%) |
Race in West Slope
The most populous races in West Slope are White / Caucasian (5,383 | 80.8%), Hispanic or Latino (697 | 10.5%), and Two or more Races (537 | 8.1%).
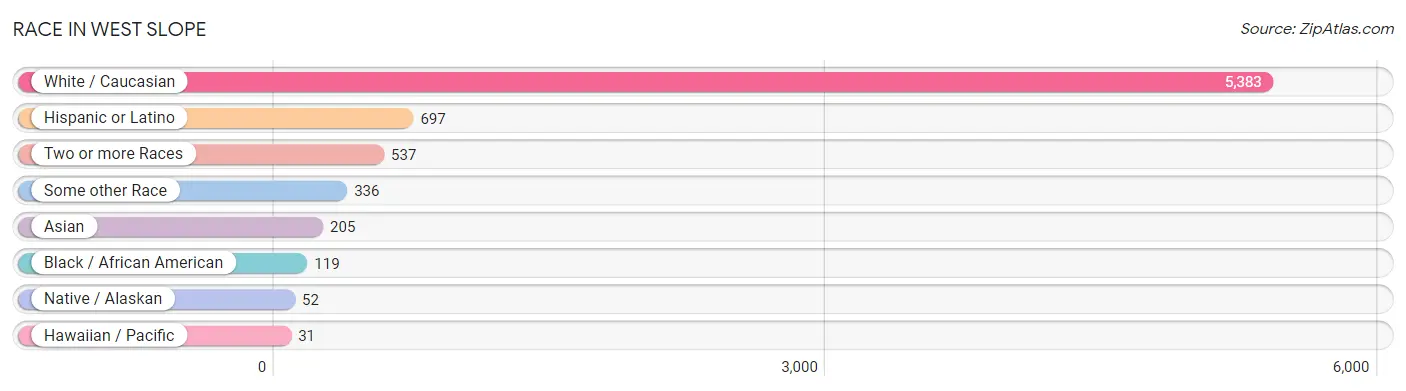
| Race | # Population | % Population |
| Asian | 205 | 3.1% |
| Black / African American | 119 | 1.8% |
| Hawaiian / Pacific | 31 | 0.5% |
| Hispanic or Latino | 697 | 10.5% |
| Native / Alaskan | 52 | 0.8% |
| White / Caucasian | 5,383 | 80.8% |
| Two or more Races | 537 | 8.1% |
| Some other Race | 336 | 5.0% |
| Total | 6,663 | 100.0% |
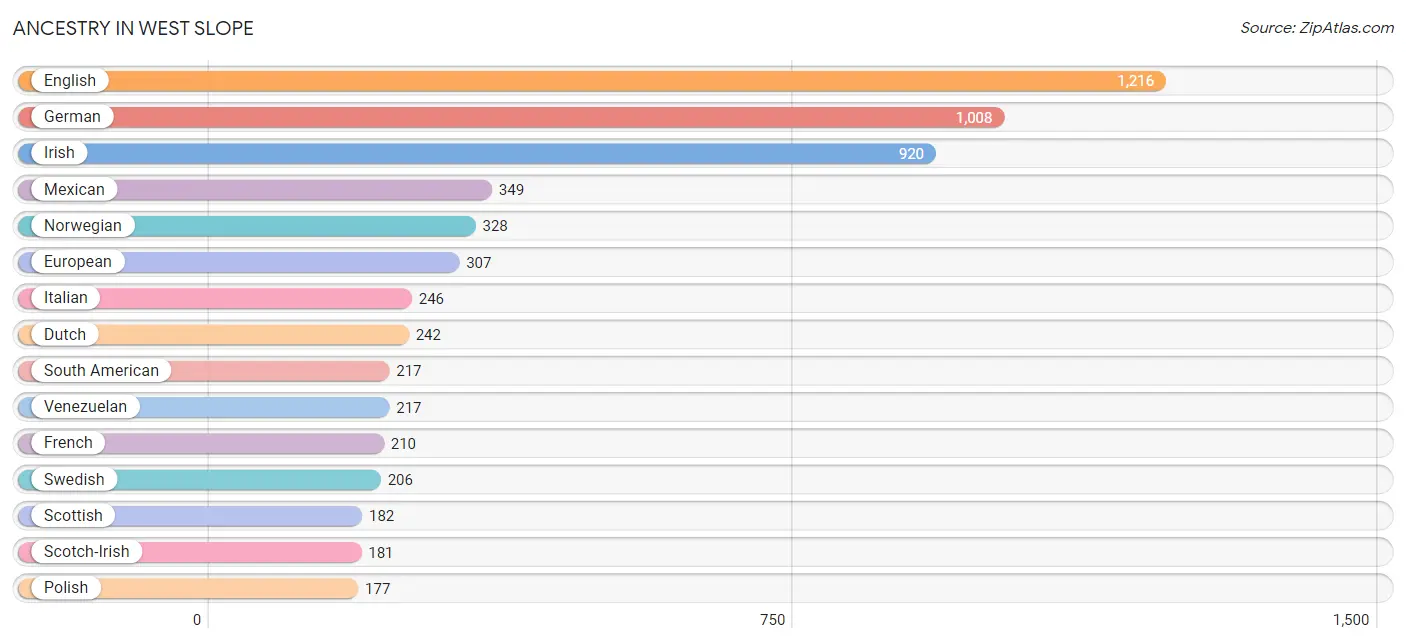
Ancestry in West Slope
The most populous ancestries reported in West Slope are English (1,216 | 18.2%), German (1,008 | 15.1%), Irish (920 | 13.8%), Mexican (349 | 5.2%), and Norwegian (328 | 4.9%), together accounting for 57.4% of all West Slope residents.
| Ancestry | # Population | % Population |
| African | 25 | 0.4% |
| American | 139 | 2.1% |
| Arab | 20 | 0.3% |
| Austrian | 28 | 0.4% |
| Bhutanese | 67 | 1.0% |
| Blackfeet | 32 | 0.5% |
| Brazilian | 76 | 1.1% |
| British | 76 | 1.1% |
| Burmese | 18 | 0.3% |
| Canadian | 36 | 0.5% |
| Central American | 23 | 0.4% |
| Cherokee | 36 | 0.5% |
| Croatian | 8 | 0.1% |
| Cuban | 43 | 0.6% |
| Czech | 14 | 0.2% |
| Danish | 54 | 0.8% |
| Dutch | 242 | 3.6% |
| Eastern European | 55 | 0.8% |
| English | 1,216 | 18.2% |
| Estonian | 8 | 0.1% |
| European | 307 | 4.6% |
| Filipino | 38 | 0.6% |
| Finnish | 21 | 0.3% |
| French | 210 | 3.2% |
| French Canadian | 26 | 0.4% |
| German | 1,008 | 15.1% |
| Greek | 13 | 0.2% |
| Hungarian | 48 | 0.7% |
| Indian (Asian) | 32 | 0.5% |
| Irish | 920 | 13.8% |
| Italian | 246 | 3.7% |
| Japanese | 14 | 0.2% |
| Korean | 69 | 1.0% |
| Lebanese | 20 | 0.3% |
| Lithuanian | 21 | 0.3% |
| Mexican | 349 | 5.2% |
| Native Hawaiian | 45 | 0.7% |
| Northern European | 16 | 0.2% |
| Norwegian | 328 | 4.9% |
| Pakistani | 13 | 0.2% |
| Polish | 177 | 2.7% |
| Portuguese | 32 | 0.5% |
| Puerto Rican | 24 | 0.4% |
| Romanian | 13 | 0.2% |
| Russian | 69 | 1.0% |
| Salvadoran | 23 | 0.4% |
| Scandinavian | 108 | 1.6% |
| Scotch-Irish | 181 | 2.7% |
| Scottish | 182 | 2.7% |
| Serbian | 16 | 0.2% |
| Slavic | 14 | 0.2% |
| South American | 217 | 3.3% |
| Spaniard | 9 | 0.1% |
| Spanish | 32 | 0.5% |
| Sri Lankan | 62 | 0.9% |
| Subsaharan African | 25 | 0.4% |
| Swedish | 206 | 3.1% |
| Swiss | 78 | 1.2% |
| Syrian | 20 | 0.3% |
| Thai | 54 | 0.8% |
| Ukrainian | 32 | 0.5% |
| Venezuelan | 217 | 3.3% |
| Welsh | 51 | 0.8% |
| Yugoslavian | 57 | 0.9% | View All 64 Rows |
Immigrants in West Slope
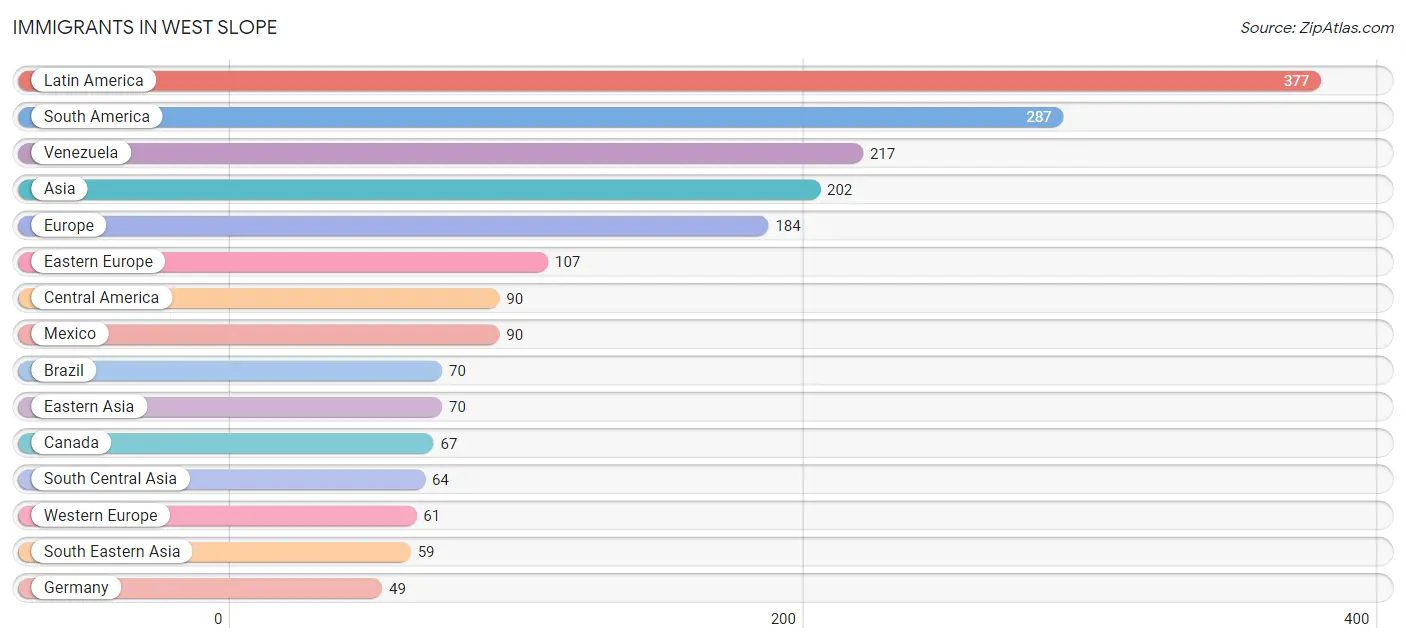
The most numerous immigrant groups reported in West Slope came from Latin America (377 | 5.7%), South America (287 | 4.3%), Venezuela (217 | 3.3%), Asia (202 | 3.0%), and Europe (184 | 2.8%), together accounting for 19.0% of all West Slope residents.
| Immigration Origin | # Population | % Population |
| Africa | 25 | 0.4% |
| Asia | 202 | 3.0% |
| Bosnia and Herzegovina | 34 | 0.5% |
| Brazil | 70 | 1.1% |
| Canada | 67 | 1.0% |
| Central America | 90 | 1.3% |
| China | 23 | 0.4% |
| Eastern Africa | 25 | 0.4% |
| Eastern Asia | 70 | 1.1% |
| Eastern Europe | 107 | 1.6% |
| England | 6 | 0.1% |
| Europe | 184 | 2.8% |
| Germany | 49 | 0.7% |
| Hungary | 18 | 0.3% |
| India | 12 | 0.2% |
| Iran | 28 | 0.4% |
| Japan | 29 | 0.4% |
| Korea | 18 | 0.3% |
| Latin America | 377 | 5.7% |
| Mexico | 90 | 1.3% |
| Northern Europe | 16 | 0.2% |
| Philippines | 10 | 0.2% |
| Romania | 13 | 0.2% |
| Russia | 26 | 0.4% |
| Singapore | 8 | 0.1% |
| South America | 287 | 4.3% |
| South Central Asia | 64 | 1.0% |
| South Eastern Asia | 59 | 0.9% |
| Switzerland | 12 | 0.2% |
| Syria | 9 | 0.1% |
| Taiwan | 12 | 0.2% |
| Thailand | 13 | 0.2% |
| Uzbekistan | 24 | 0.4% |
| Venezuela | 217 | 3.3% |
| Vietnam | 28 | 0.4% |
| Western Asia | 9 | 0.1% |
| Western Europe | 61 | 0.9% | View All 37 Rows |
Sex and Age in West Slope
Sex and Age in West Slope
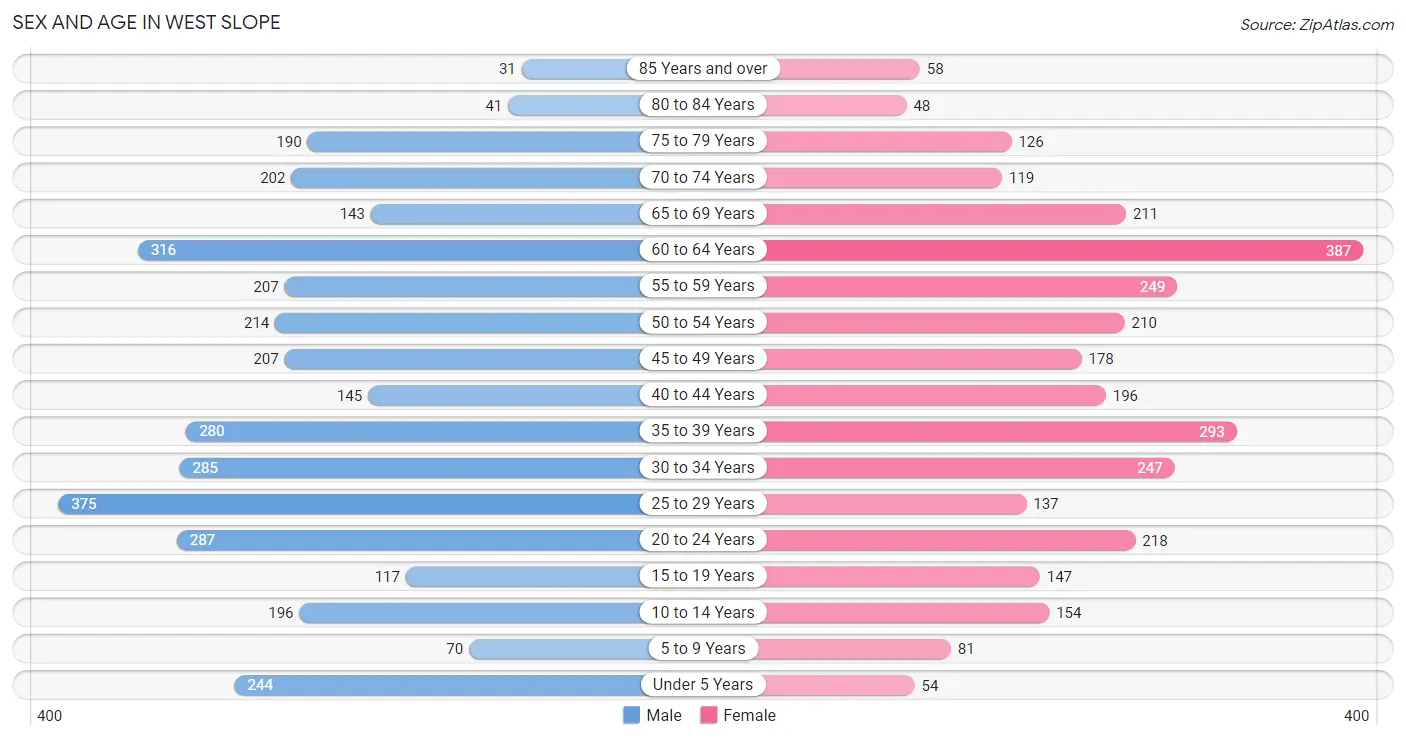
The most populous age groups in West Slope are 25 to 29 Years (375 | 10.6%) for men and 60 to 64 Years (387 | 12.4%) for women.
| Age Bracket | Male | Female |
| Under 5 Years | 244 (6.9%) | 54 (1.7%) |
| 5 to 9 Years | 70 (2.0%) | 81 (2.6%) |
| 10 to 14 Years | 196 (5.5%) | 154 (5.0%) |
| 15 to 19 Years | 117 (3.3%) | 147 (4.7%) |
| 20 to 24 Years | 287 (8.1%) | 218 (7.0%) |
| 25 to 29 Years | 375 (10.6%) | 137 (4.4%) |
| 30 to 34 Years | 285 (8.0%) | 247 (7.9%) |
| 35 to 39 Years | 280 (7.9%) | 293 (9.4%) |
| 40 to 44 Years | 145 (4.1%) | 196 (6.3%) |
| 45 to 49 Years | 207 (5.8%) | 178 (5.7%) |
| 50 to 54 Years | 214 (6.0%) | 210 (6.8%) |
| 55 to 59 Years | 207 (5.8%) | 249 (8.0%) |
| 60 to 64 Years | 316 (8.9%) | 387 (12.4%) |
| 65 to 69 Years | 143 (4.0%) | 211 (6.8%) |
| 70 to 74 Years | 202 (5.7%) | 119 (3.8%) |
| 75 to 79 Years | 190 (5.3%) | 126 (4.1%) |
| 80 to 84 Years | 41 (1.1%) | 48 (1.5%) |
| 85 Years and over | 31 (0.9%) | 58 (1.9%) |
| Total | 3,550 (100.0%) | 3,113 (100.0%) |
Families and Households in West Slope
Median Family Size in West Slope
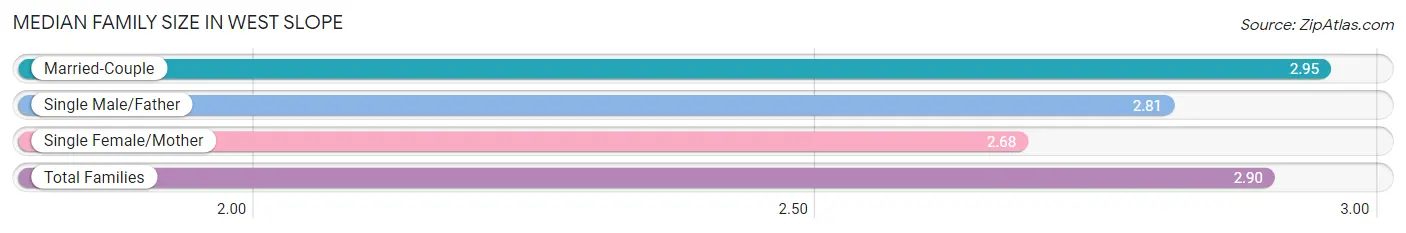
The median family size in West Slope is 2.90 persons per family, with married-couple families (1,149 | 78.4%) accounting for the largest median family size of 2.95 persons per family. On the other hand, single female/mother families (201 | 13.7%) represent the smallest median family size with 2.68 persons per family.
| Family Type | # Families | Family Size |
| Married-Couple | 1,149 (78.4%) | 2.95 |
| Single Male/Father | 116 (7.9%) | 2.81 |
| Single Female/Mother | 201 (13.7%) | 2.68 |
| Total Families | 1,466 (100.0%) | 2.90 |
Median Household Size in West Slope
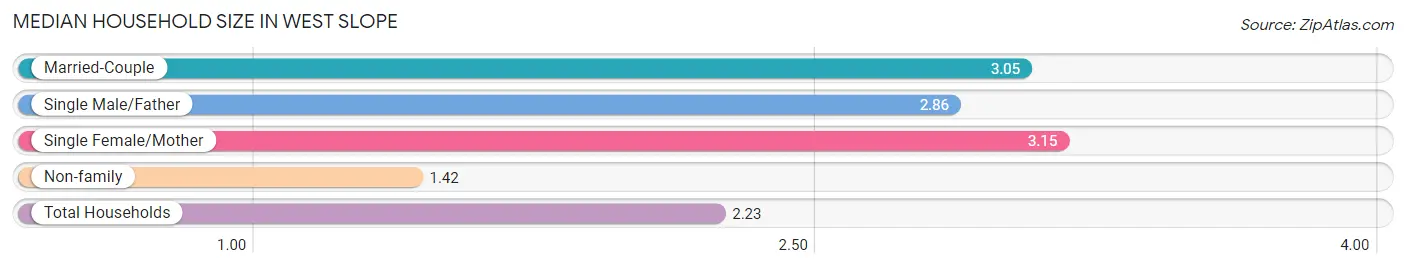
The median household size in West Slope is 2.23 persons per household, with single female/mother households (201 | 6.9%) accounting for the largest median household size of 3.15 persons per household. non-family households (1,466 | 50.0%) represent the smallest median household size with 1.42 persons per household.
| Household Type | # Households | Household Size |
| Married-Couple | 1,149 (39.2%) | 3.05 |
| Single Male/Father | 116 (4.0%) | 2.86 |
| Single Female/Mother | 201 (6.9%) | 3.15 |
| Non-family | 1,466 (50.0%) | 1.42 |
| Total Households | 2,932 (100.0%) | 2.23 |
Household Size by Marriage Status in West Slope
Out of a total of 2,932 households in West Slope, 1,466 (50.0%) are family households, while 1,466 (50.0%) are nonfamily households. The most numerous type of family households are 2-person households, comprising 698, and the most common type of nonfamily households are 1-person households, comprising 1,041.
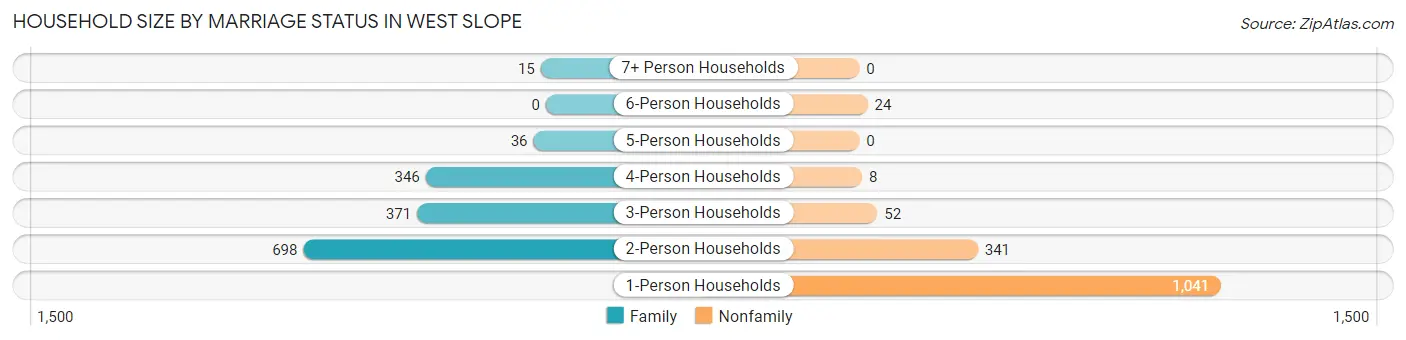
| Household Size | Family Households | Nonfamily Households |
| 1-Person Households | - | 1,041 (35.5%) |
| 2-Person Households | 698 (23.8%) | 341 (11.6%) |
| 3-Person Households | 371 (12.7%) | 52 (1.8%) |
| 4-Person Households | 346 (11.8%) | 8 (0.3%) |
| 5-Person Households | 36 (1.2%) | 0 (0.0%) |
| 6-Person Households | 0 (0.0%) | 24 (0.8%) |
| 7+ Person Households | 15 (0.5%) | 0 (0.0%) |
| Total | 1,466 (50.0%) | 1,466 (50.0%) |
Female Fertility in West Slope
Fertility by Age in West Slope
Average fertility rate in West Slope is 29.0 births per 1,000 women. Women in the age bracket of 20 to 34 years have the highest fertility rate with 70.0 births per 1,000 women. Women in the age bracket of 20 to 34 years acount for 100.0% of all women with births.
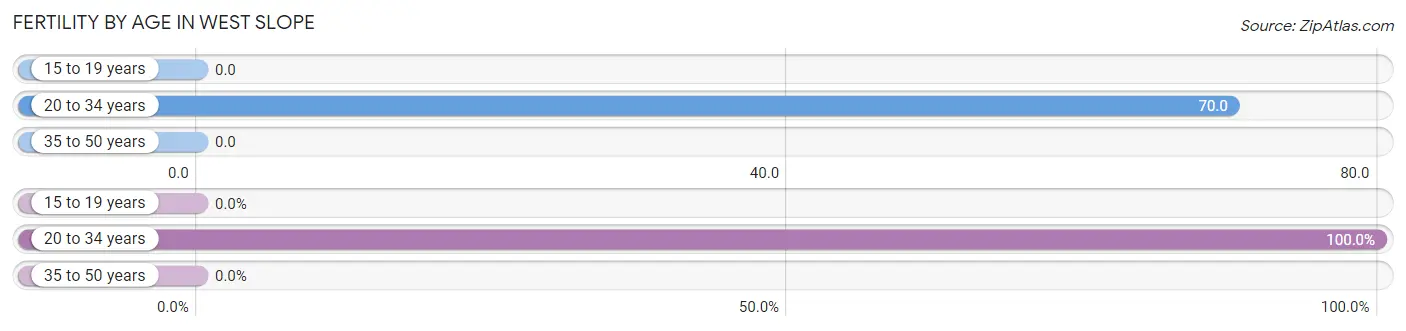
| Age Bracket | Women with Births | Births / 1,000 Women |
| 15 to 19 years | 0 (0.0%) | 0.0 |
| 20 to 34 years | 42 (100.0%) | 70.0 |
| 35 to 50 years | 0 (0.0%) | 0.0 |
| Total | 42 (100.0%) | 29.0 |
Fertility by Age by Marriage Status in West Slope
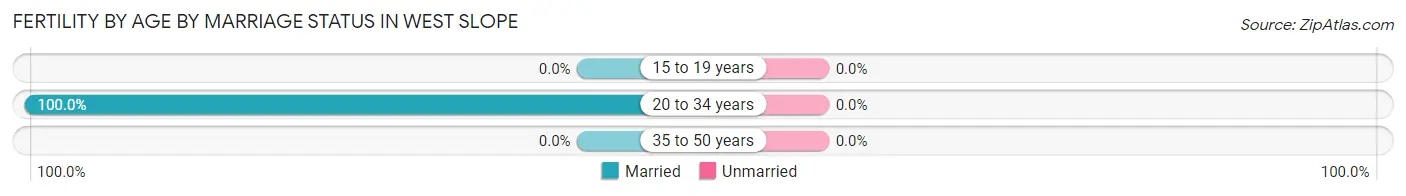
| Age Bracket | Married | Unmarried |
| 15 to 19 years | 0 (0.0%) | 0 (0.0%) |
| 20 to 34 years | 42 (100.0%) | 0 (0.0%) |
| 35 to 50 years | 0 (0.0%) | 0 (0.0%) |
| Total | 42 (100.0%) | 0 (0.0%) |
Fertility by Education in West Slope
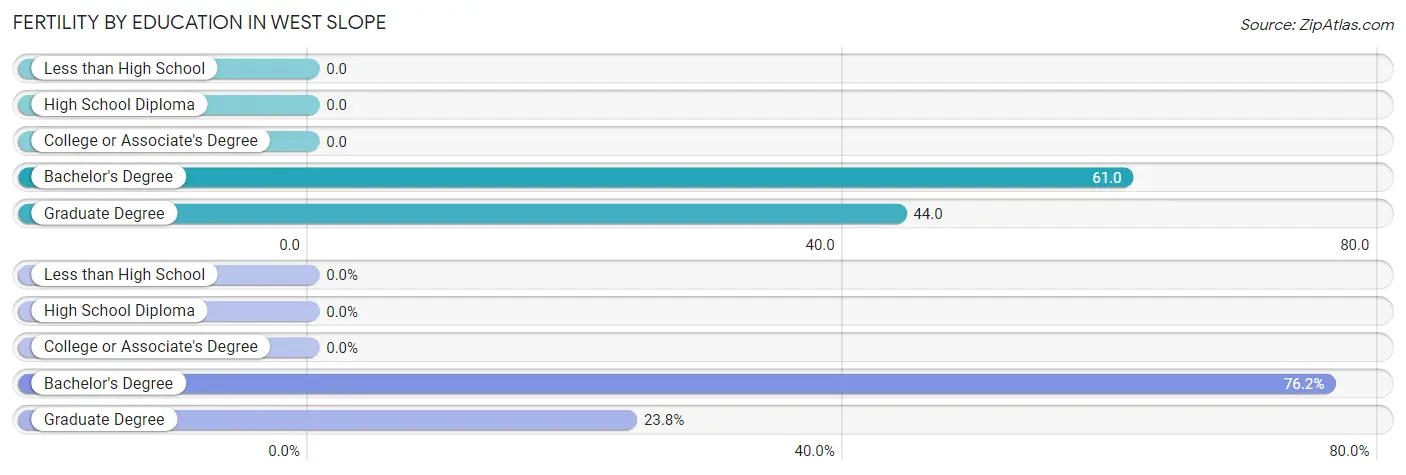
| Educational Attainment | Women with Births | Births / 1,000 Women |
| Less than High School | 0 (0.0%) | 0.0 |
| High School Diploma | 0 (0.0%) | 0.0 |
| College or Associate's Degree | 0 (0.0%) | 0.0 |
| Bachelor's Degree | 32 (76.2%) | 61.0 |
| Graduate Degree | 10 (23.8%) | 44.0 |
| Total | 42 (100.0%) | 29.0 |
Fertility by Education by Marriage Status in West Slope
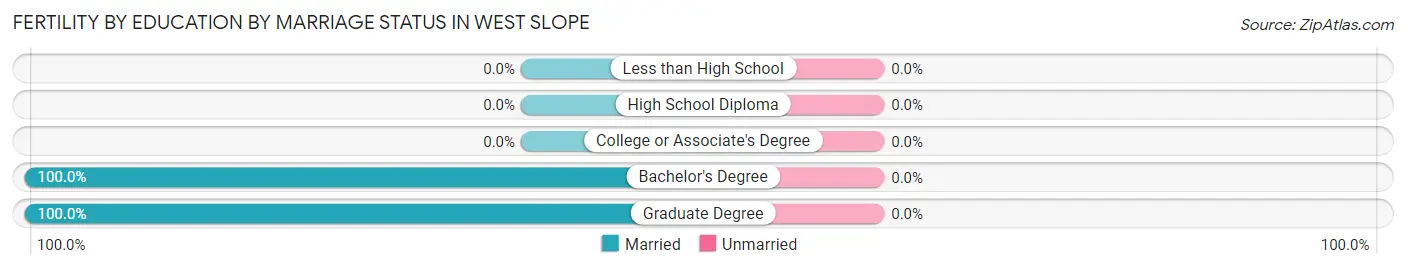
| Educational Attainment | Married | Unmarried |
| Less than High School | 0 (0.0%) | 0 (0.0%) |
| High School Diploma | 0 (0.0%) | 0 (0.0%) |
| College or Associate's Degree | 0 (0.0%) | 0 (0.0%) |
| Bachelor's Degree | 32 (100.0%) | 0 (0.0%) |
| Graduate Degree | 10 (100.0%) | 0 (0.0%) |
| Total | 42 (100.0%) | 0 (0.0%) |
Employment Characteristics in West Slope
Employment by Class of Employer in West Slope
Among the 3,625 employed individuals in West Slope, private company employees (2,557 | 70.5%), self-employed (not incorporated) (287 | 7.9%), and not-for-profit organizations (218 | 6.0%) make up the most common classes of employment.
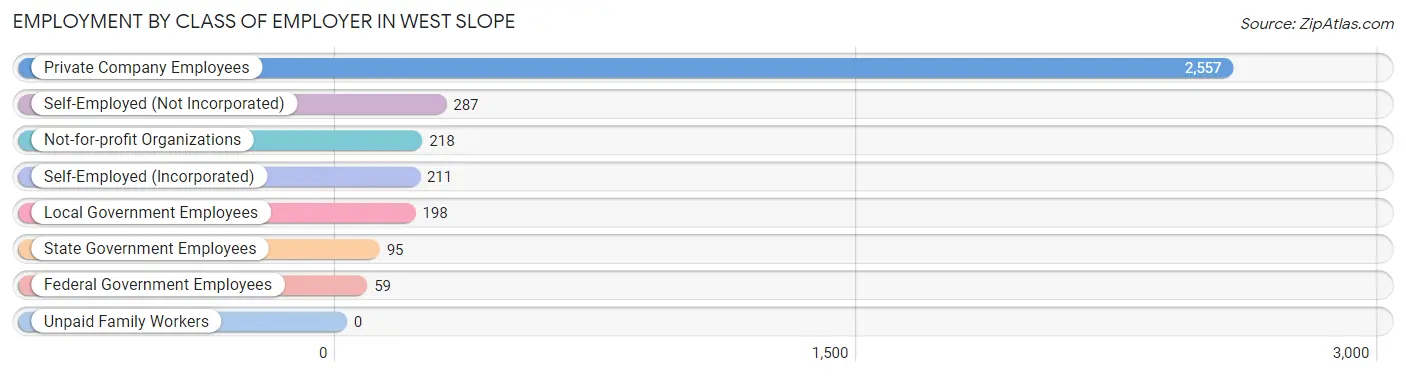
| Employer Class | # Employees | % Employees |
| Private Company Employees | 2,557 | 70.5% |
| Self-Employed (Incorporated) | 211 | 5.8% |
| Self-Employed (Not Incorporated) | 287 | 7.9% |
| Not-for-profit Organizations | 218 | 6.0% |
| Local Government Employees | 198 | 5.5% |
| State Government Employees | 95 | 2.6% |
| Federal Government Employees | 59 | 1.6% |
| Unpaid Family Workers | 0 | 0.0% |
| Total | 3,625 | 100.0% |
Employment Status by Age in West Slope
According to the labor force statistics for West Slope, out of the total population over 16 years of age (5,765), 65.8% or 3,793 individuals are in the labor force, with 3.2% or 121 of them unemployed. The age group with the highest labor force participation rate is 35 to 44 years, with 97.7% or 893 individuals in the labor force. Within the labor force, the 45 to 54 years age range has the highest percentage of unemployed individuals, with 13.8% or 93 of them being unemployed.
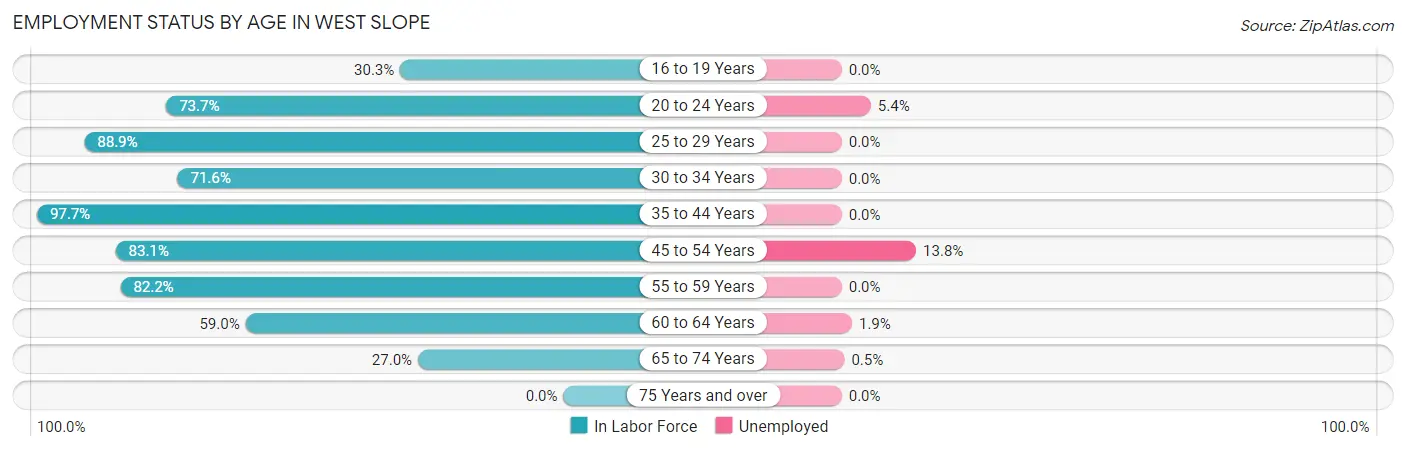
| Age Bracket | In Labor Force | Unemployed |
| 16 to 19 Years | 50 (30.3%) | 0 (0.0%) |
| 20 to 24 Years | 372 (73.7%) | 20 (5.4%) |
| 25 to 29 Years | 455 (88.9%) | 0 (0.0%) |
| 30 to 34 Years | 381 (71.6%) | 0 (0.0%) |
| 35 to 44 Years | 893 (97.7%) | 0 (0.0%) |
| 45 to 54 Years | 672 (83.1%) | 93 (13.8%) |
| 55 to 59 Years | 375 (82.2%) | 0 (0.0%) |
| 60 to 64 Years | 415 (59.0%) | 8 (1.9%) |
| 65 to 74 Years | 182 (27.0%) | 1 (0.5%) |
| 75 Years and over | 0 (0.0%) | 0 (0.0%) |
| Total | 3,793 (65.8%) | 121 (3.2%) |
Employment Status by Educational Attainment in West Slope
According to labor force statistics for West Slope, 81.3% of individuals (3,192) out of the total population between 25 and 64 years of age (3,926) are in the labor force, with 3.2% or 102 of them being unemployed. The group with the highest labor force participation rate are those with the educational attainment of less than high school, with 100.0% or 180 individuals in the labor force. Within the labor force, individuals with college / associate degree education have the highest percentage of unemployment, with 7.2% or 58 of them being unemployed.
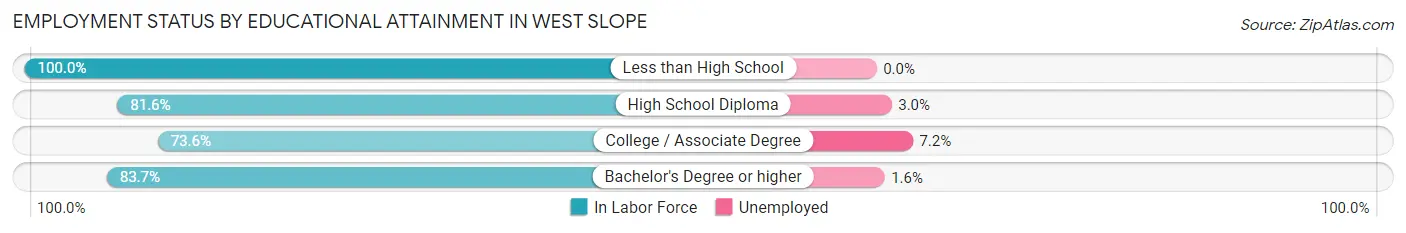
| Educational Attainment | In Labor Force | Unemployed |
| Less than High School | 180 (100.0%) | 0 (0.0%) |
| High School Diploma | 544 (81.6%) | 20 (3.0%) |
| College / Associate Degree | 810 (73.6%) | 79 (7.2%) |
| Bachelor's Degree or higher | 1,656 (83.7%) | 32 (1.6%) |
| Total | 3,192 (81.3%) | 126 (3.2%) |
Employment Occupations by Sex in West Slope
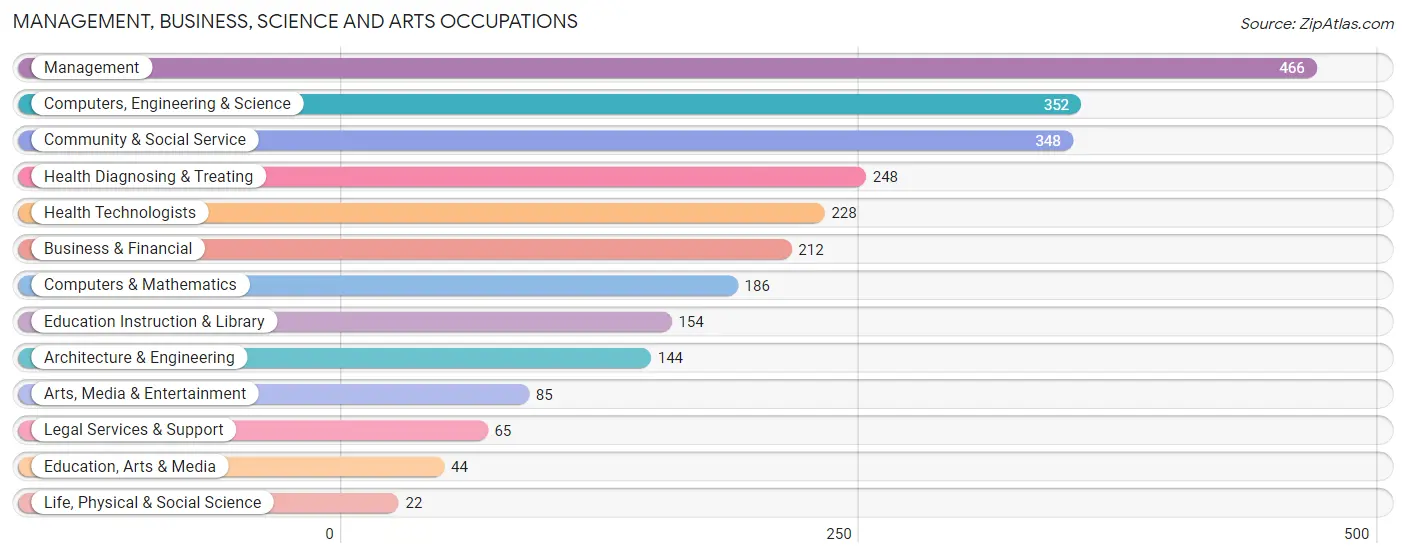
Management, Business, Science and Arts Occupations
The most common Management, Business, Science and Arts occupations in West Slope are Management (466 | 12.7%), Computers, Engineering & Science (352 | 9.6%), Community & Social Service (348 | 9.5%), Health Diagnosing & Treating (248 | 6.8%), and Health Technologists (228 | 6.2%).
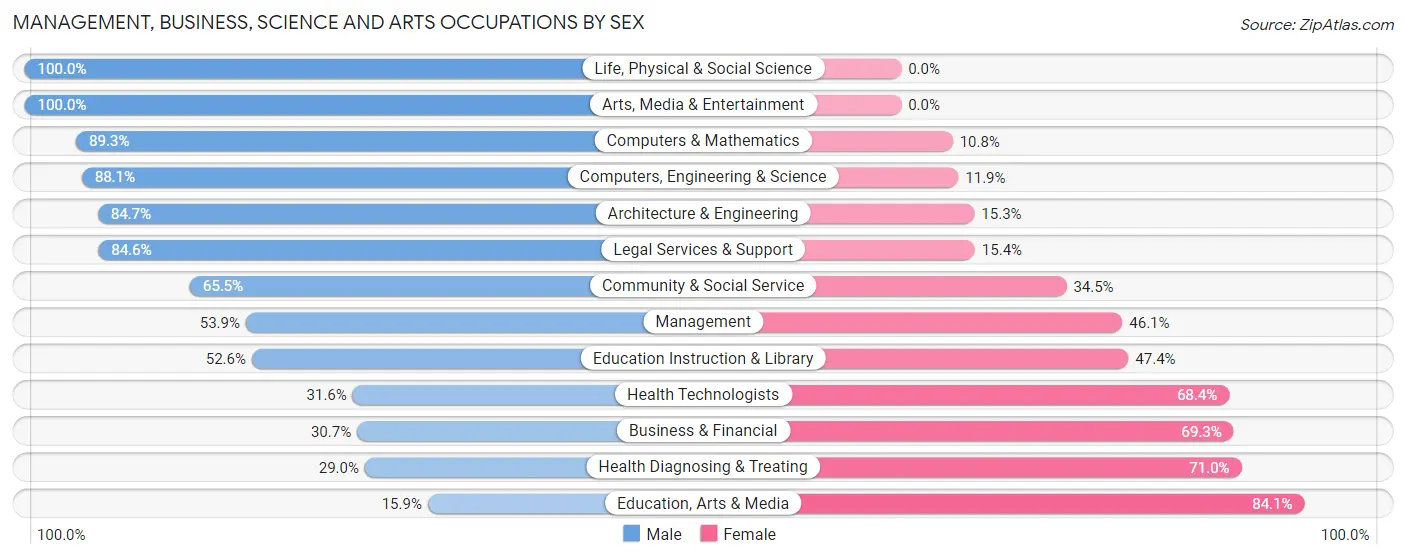
Management, Business, Science and Arts Occupations by Sex
Within the Management, Business, Science and Arts occupations in West Slope, the most male-oriented occupations are Life, Physical & Social Science (100.0%), Arts, Media & Entertainment (100.0%), and Computers & Mathematics (89.2%), while the most female-oriented occupations are Education, Arts & Media (84.1%), Health Diagnosing & Treating (71.0%), and Business & Financial (69.3%).
| Occupation | Male | Female |
| Management | 251 (53.9%) | 215 (46.1%) |
| Business & Financial | 65 (30.7%) | 147 (69.3%) |
| Computers, Engineering & Science | 310 (88.1%) | 42 (11.9%) |
| Computers & Mathematics | 166 (89.2%) | 20 (10.7%) |
| Architecture & Engineering | 122 (84.7%) | 22 (15.3%) |
| Life, Physical & Social Science | 22 (100.0%) | 0 (0.0%) |
| Community & Social Service | 228 (65.5%) | 120 (34.5%) |
| Education, Arts & Media | 7 (15.9%) | 37 (84.1%) |
| Legal Services & Support | 55 (84.6%) | 10 (15.4%) |
| Education Instruction & Library | 81 (52.6%) | 73 (47.4%) |
| Arts, Media & Entertainment | 85 (100.0%) | 0 (0.0%) |
| Health Diagnosing & Treating | 72 (29.0%) | 176 (71.0%) |
| Health Technologists | 72 (31.6%) | 156 (68.4%) |
| Total (Category) | 926 (57.0%) | 700 (43.0%) |
| Total (Overall) | 2,003 (54.8%) | 1,654 (45.2%) |
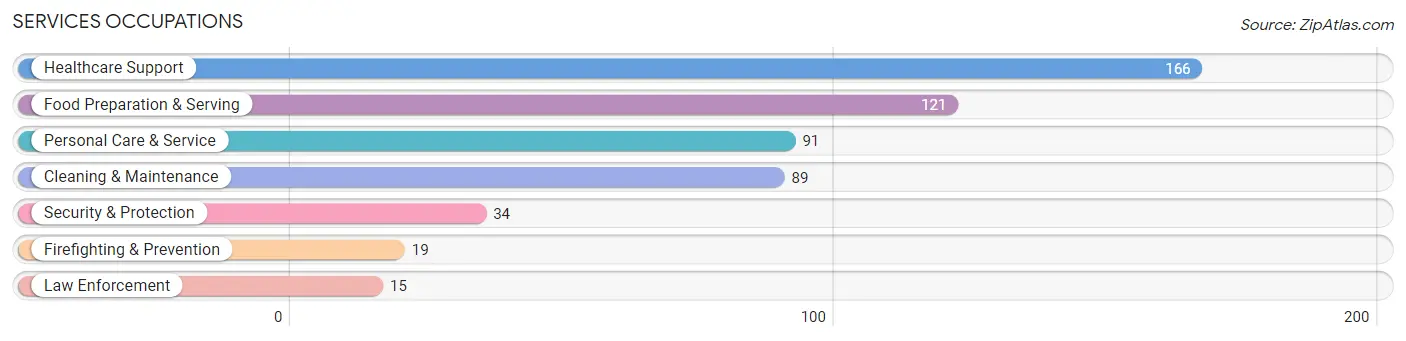
Services Occupations
The most common Services occupations in West Slope are Healthcare Support (166 | 4.5%), Food Preparation & Serving (121 | 3.3%), Personal Care & Service (91 | 2.5%), Cleaning & Maintenance (89 | 2.4%), and Security & Protection (34 | 0.9%).
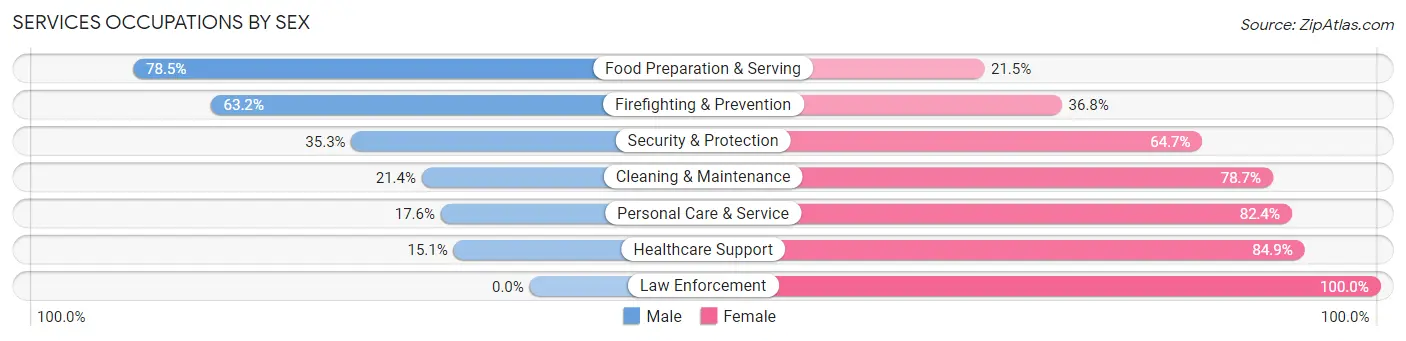
Services Occupations by Sex
Within the Services occupations in West Slope, the most male-oriented occupations are Food Preparation & Serving (78.5%), Firefighting & Prevention (63.2%), and Security & Protection (35.3%), while the most female-oriented occupations are Law Enforcement (100.0%), Healthcare Support (84.9%), and Personal Care & Service (82.4%).
| Occupation | Male | Female |
| Healthcare Support | 25 (15.1%) | 141 (84.9%) |
| Security & Protection | 12 (35.3%) | 22 (64.7%) |
| Firefighting & Prevention | 12 (63.2%) | 7 (36.8%) |
| Law Enforcement | 0 (0.0%) | 15 (100.0%) |
| Food Preparation & Serving | 95 (78.5%) | 26 (21.5%) |
| Cleaning & Maintenance | 19 (21.3%) | 70 (78.6%) |
| Personal Care & Service | 16 (17.6%) | 75 (82.4%) |
| Total (Category) | 167 (33.3%) | 334 (66.7%) |
| Total (Overall) | 2,003 (54.8%) | 1,654 (45.2%) |
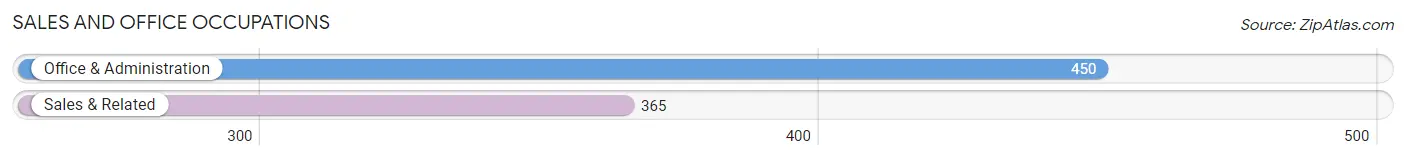
Sales and Office Occupations
The most common Sales and Office occupations in West Slope are Office & Administration (450 | 12.3%), and Sales & Related (365 | 10.0%).
Sales and Office Occupations by Sex
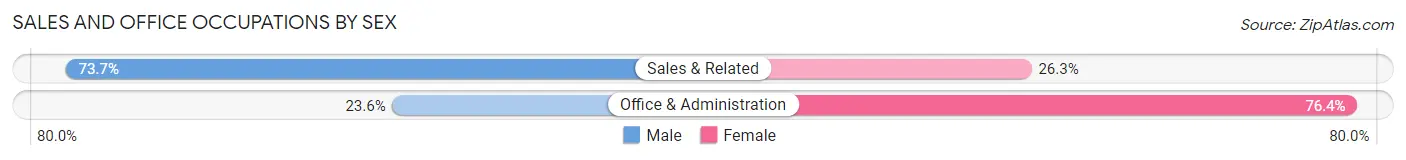
| Occupation | Male | Female |
| Sales & Related | 269 (73.7%) | 96 (26.3%) |
| Office & Administration | 106 (23.6%) | 344 (76.4%) |
| Total (Category) | 375 (46.0%) | 440 (54.0%) |
| Total (Overall) | 2,003 (54.8%) | 1,654 (45.2%) |
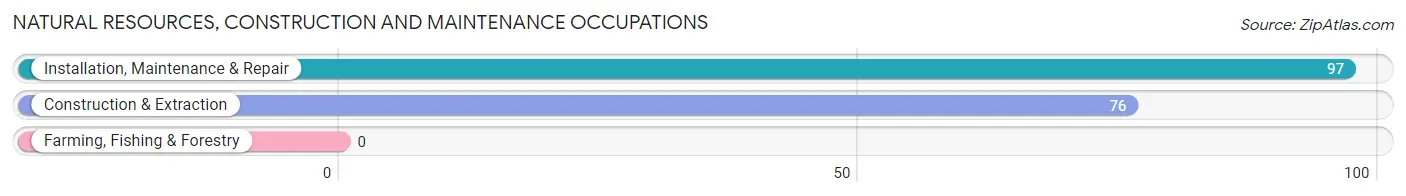
Natural Resources, Construction and Maintenance Occupations
The most common Natural Resources, Construction and Maintenance occupations in West Slope are Installation, Maintenance & Repair (97 | 2.6%), and Construction & Extraction (76 | 2.1%).
Natural Resources, Construction and Maintenance Occupations by Sex
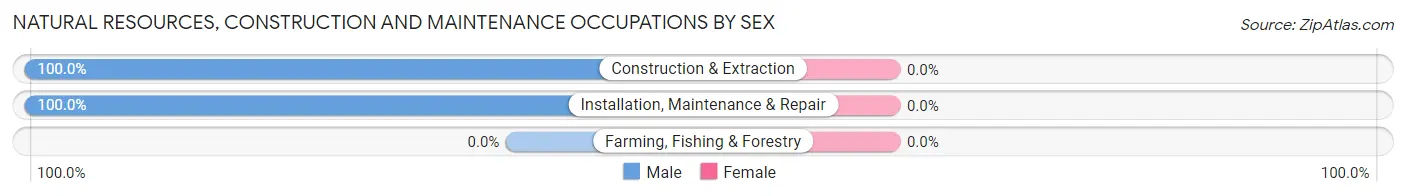
| Occupation | Male | Female |
| Farming, Fishing & Forestry | 0 (0.0%) | 0 (0.0%) |
| Construction & Extraction | 76 (100.0%) | 0 (0.0%) |
| Installation, Maintenance & Repair | 97 (100.0%) | 0 (0.0%) |
| Total (Category) | 173 (100.0%) | 0 (0.0%) |
| Total (Overall) | 2,003 (54.8%) | 1,654 (45.2%) |
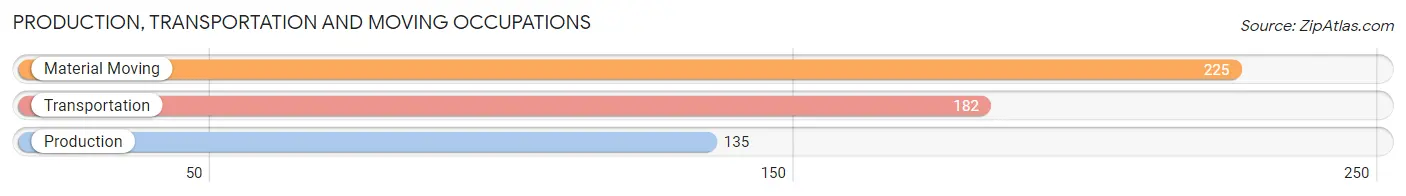
Production, Transportation and Moving Occupations
The most common Production, Transportation and Moving occupations in West Slope are Material Moving (225 | 6.1%), Transportation (182 | 5.0%), and Production (135 | 3.7%).
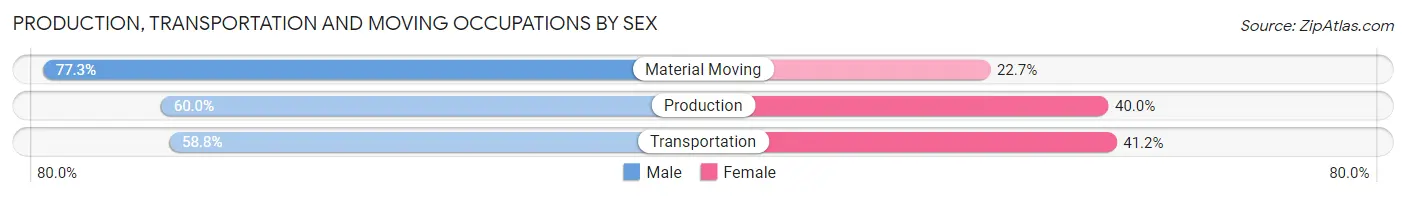
Production, Transportation and Moving Occupations by Sex
| Occupation | Male | Female |
| Production | 81 (60.0%) | 54 (40.0%) |
| Transportation | 107 (58.8%) | 75 (41.2%) |
| Material Moving | 174 (77.3%) | 51 (22.7%) |
| Total (Category) | 362 (66.8%) | 180 (33.2%) |
| Total (Overall) | 2,003 (54.8%) | 1,654 (45.2%) |
Employment Industries by Sex in West Slope
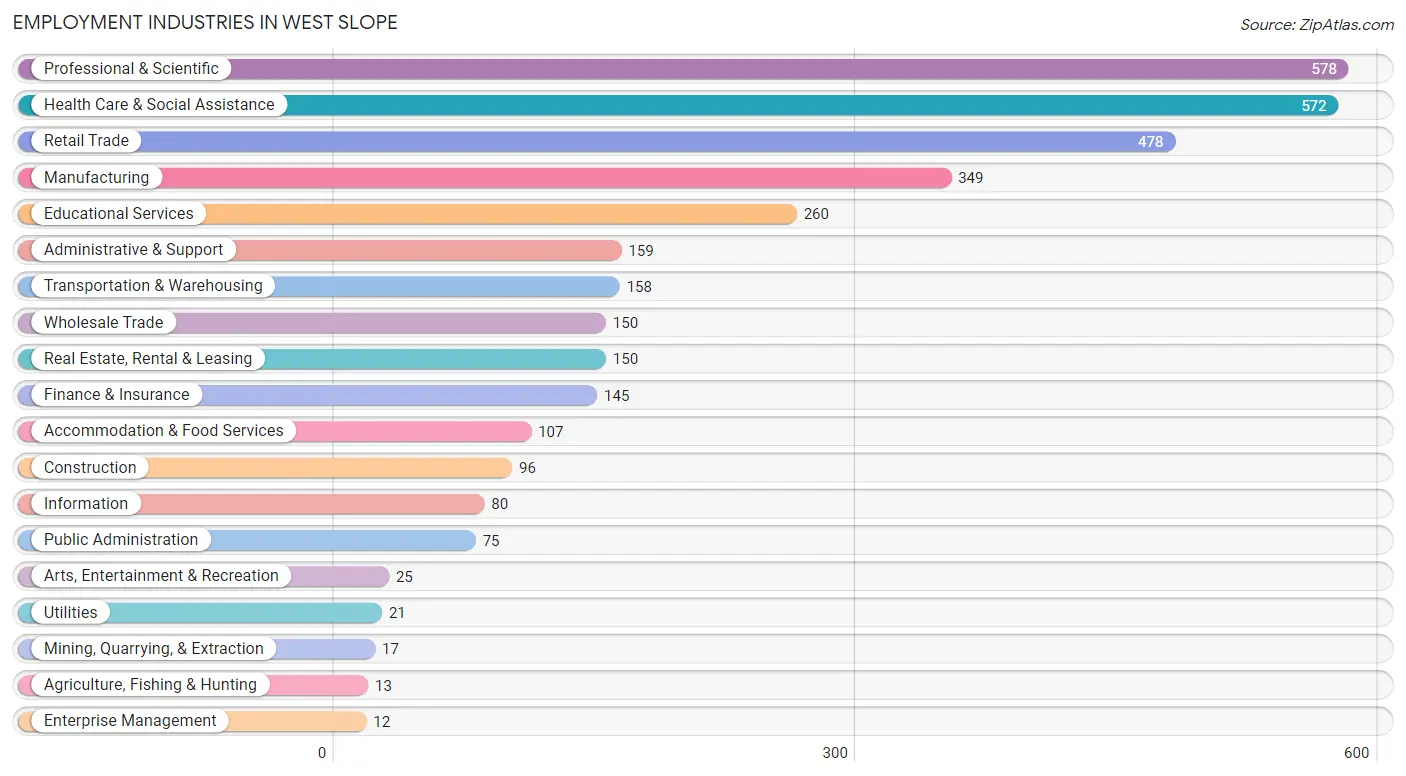
Employment Industries in West Slope
The major employment industries in West Slope include Professional & Scientific (578 | 15.8%), Health Care & Social Assistance (572 | 15.6%), Retail Trade (478 | 13.1%), Manufacturing (349 | 9.5%), and Educational Services (260 | 7.1%).
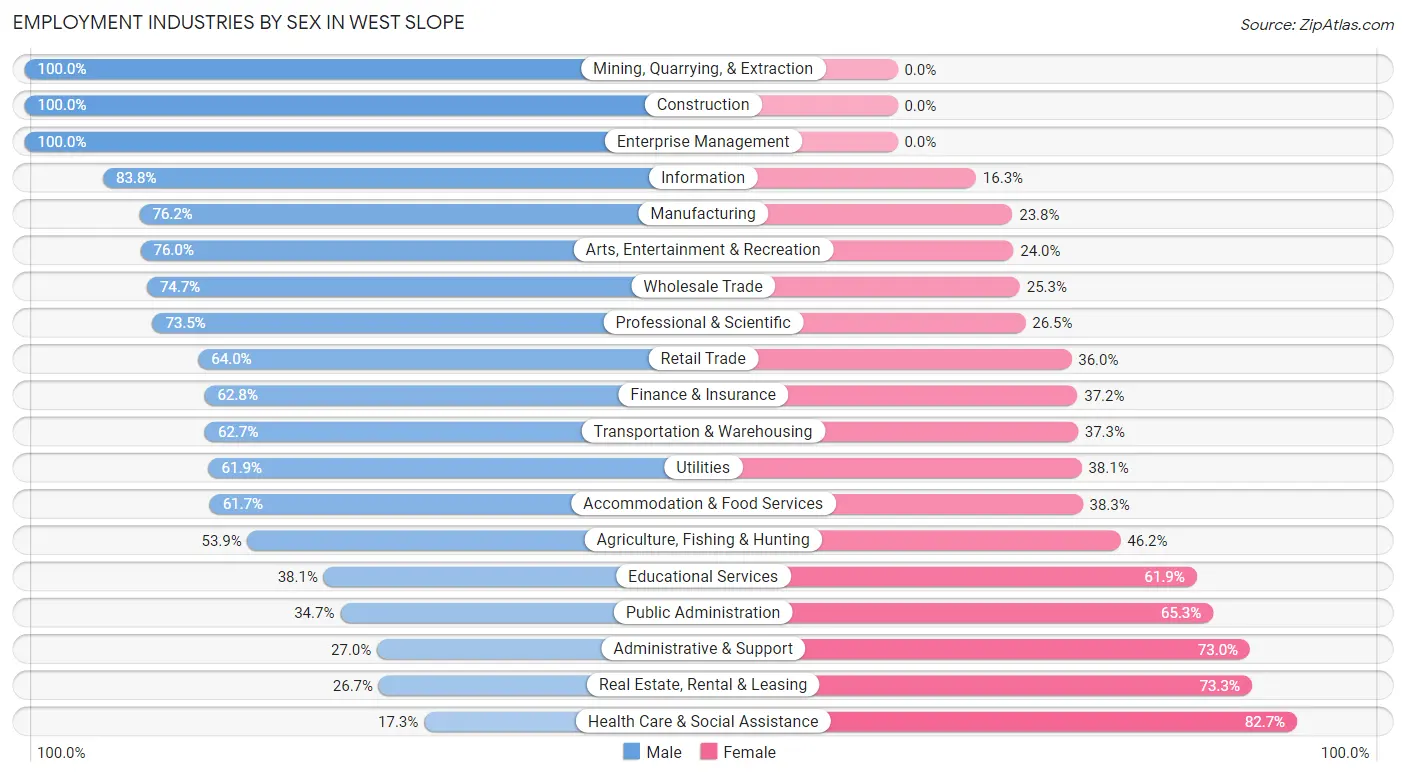
Employment Industries by Sex in West Slope
The West Slope industries that see more men than women are Mining, Quarrying, & Extraction (100.0%), Construction (100.0%), and Enterprise Management (100.0%), whereas the industries that tend to have a higher number of women are Health Care & Social Assistance (82.7%), Real Estate, Rental & Leasing (73.3%), and Administrative & Support (73.0%).
| Industry | Male | Female |
| Agriculture, Fishing & Hunting | 7 (53.8%) | 6 (46.2%) |
| Mining, Quarrying, & Extraction | 17 (100.0%) | 0 (0.0%) |
| Construction | 96 (100.0%) | 0 (0.0%) |
| Manufacturing | 266 (76.2%) | 83 (23.8%) |
| Wholesale Trade | 112 (74.7%) | 38 (25.3%) |
| Retail Trade | 306 (64.0%) | 172 (36.0%) |
| Transportation & Warehousing | 99 (62.7%) | 59 (37.3%) |
| Utilities | 13 (61.9%) | 8 (38.1%) |
| Information | 67 (83.8%) | 13 (16.3%) |
| Finance & Insurance | 91 (62.8%) | 54 (37.2%) |
| Real Estate, Rental & Leasing | 40 (26.7%) | 110 (73.3%) |
| Professional & Scientific | 425 (73.5%) | 153 (26.5%) |
| Enterprise Management | 12 (100.0%) | 0 (0.0%) |
| Administrative & Support | 43 (27.0%) | 116 (73.0%) |
| Educational Services | 99 (38.1%) | 161 (61.9%) |
| Health Care & Social Assistance | 99 (17.3%) | 473 (82.7%) |
| Arts, Entertainment & Recreation | 19 (76.0%) | 6 (24.0%) |
| Accommodation & Food Services | 66 (61.7%) | 41 (38.3%) |
| Public Administration | 26 (34.7%) | 49 (65.3%) |
| Total | 2,003 (54.8%) | 1,654 (45.2%) |
Education in West Slope
School Enrollment in West Slope
The most common levels of schooling among the 1,308 students in West Slope are college / undergraduate (346 | 26.5%), middle school (252 | 19.3%), and high school (238 | 18.2%).
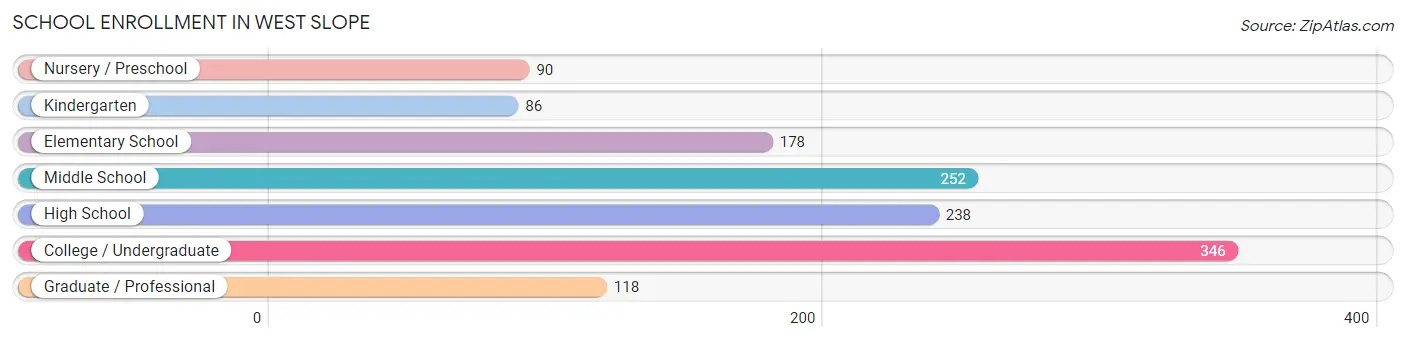
| School Level | # Students | % Students |
| Nursery / Preschool | 90 | 6.9% |
| Kindergarten | 86 | 6.6% |
| Elementary School | 178 | 13.6% |
| Middle School | 252 | 19.3% |
| High School | 238 | 18.2% |
| College / Undergraduate | 346 | 26.5% |
| Graduate / Professional | 118 | 9.0% |
| Total | 1,308 | 100.0% |
School Enrollment by Age by Funding Source in West Slope
Out of a total of 1,308 students who are enrolled in schools in West Slope, 392 (30.0%) attend a private institution, while the remaining 916 (70.0%) are enrolled in public schools. The age group of 18 to 19 year olds has the highest likelihood of being enrolled in private schools, with 17 (58.6% in the age bracket) enrolled. Conversely, the age group of 35 years and over has the lowest likelihood of being enrolled in a private school, with 96 (100.0% in the age bracket) attending a public institution.
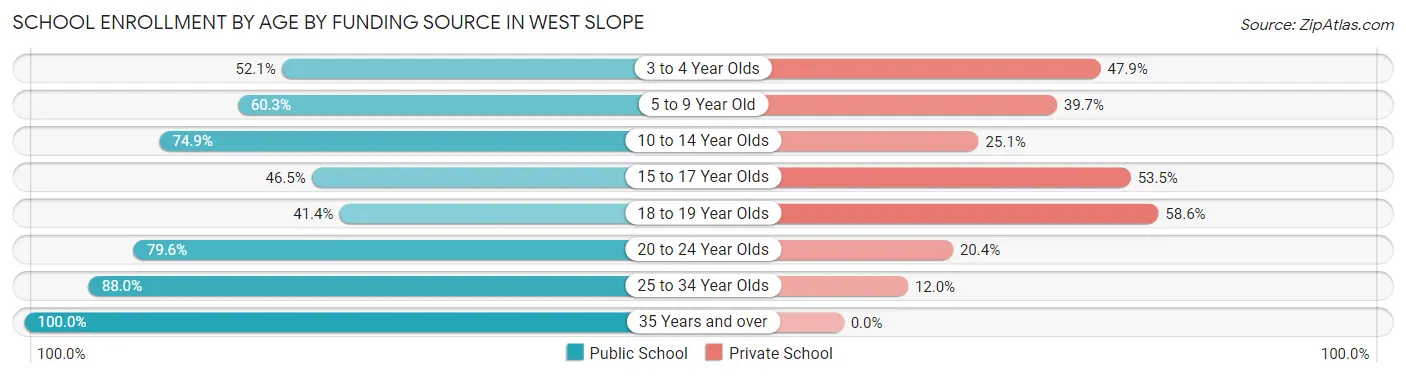
| Age Bracket | Public School | Private School |
| 3 to 4 Year Olds | 61 (52.1%) | 56 (47.9%) |
| 5 to 9 Year Old | 82 (60.3%) | 54 (39.7%) |
| 10 to 14 Year Olds | 262 (74.9%) | 88 (25.1%) |
| 15 to 17 Year Olds | 101 (46.5%) | 116 (53.5%) |
| 18 to 19 Year Olds | 12 (41.4%) | 17 (58.6%) |
| 20 to 24 Year Olds | 176 (79.6%) | 45 (20.4%) |
| 25 to 34 Year Olds | 125 (88.0%) | 17 (12.0%) |
| 35 Years and over | 96 (100.0%) | 0 (0.0%) |
| Total | 916 (70.0%) | 392 (30.0%) |
Educational Attainment by Field of Study in West Slope
Business (550 | 17.9%), literature & languages (305 | 9.9%), psychology (284 | 9.2%), education (240 | 7.8%), and bio, nature & agricultural (234 | 7.6%) are the most common fields of study among 3,073 individuals in West Slope who have obtained a bachelor's degree or higher.
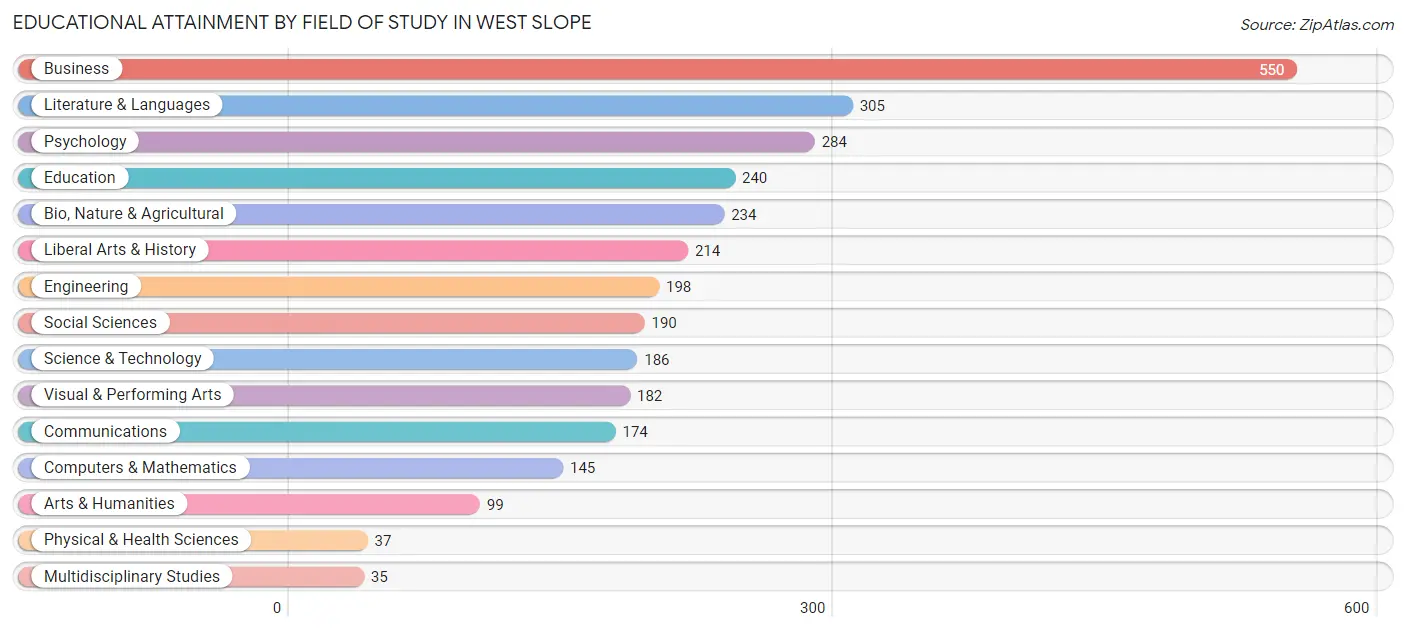
| Field of Study | # Graduates | % Graduates |
| Computers & Mathematics | 145 | 4.7% |
| Bio, Nature & Agricultural | 234 | 7.6% |
| Physical & Health Sciences | 37 | 1.2% |
| Psychology | 284 | 9.2% |
| Social Sciences | 190 | 6.2% |
| Engineering | 198 | 6.4% |
| Multidisciplinary Studies | 35 | 1.1% |
| Science & Technology | 186 | 6.0% |
| Business | 550 | 17.9% |
| Education | 240 | 7.8% |
| Literature & Languages | 305 | 9.9% |
| Liberal Arts & History | 214 | 7.0% |
| Visual & Performing Arts | 182 | 5.9% |
| Communications | 174 | 5.7% |
| Arts & Humanities | 99 | 3.2% |
| Total | 3,073 | 100.0% |
Transportation & Commute in West Slope
Vehicle Availability by Sex in West Slope
The most prevalent vehicle ownership categories in West Slope are males with 2 vehicles (819, accounting for 41.0%) and females with 2 vehicles (594, making up 51.1%).
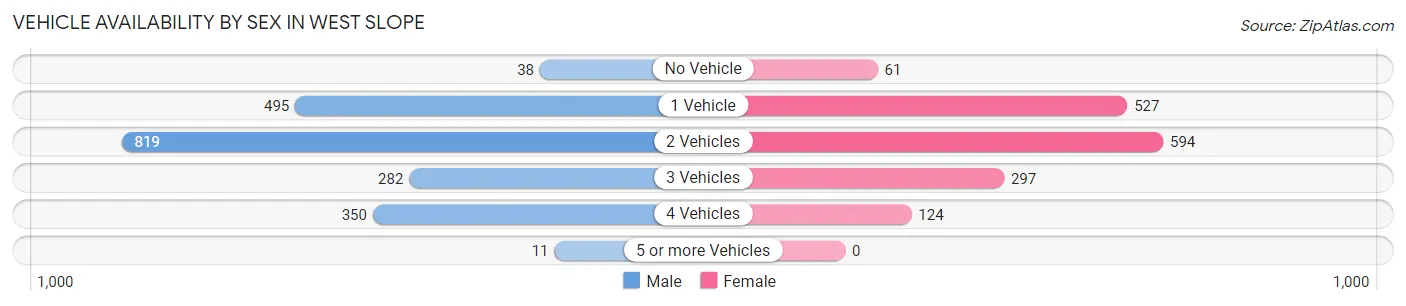
| Vehicles Available | Male | Female |
| No Vehicle | 38 (1.9%) | 61 (3.8%) |
| 1 Vehicle | 495 (24.8%) | 527 (32.9%) |
| 2 Vehicles | 819 (41.0%) | 594 (37.1%) |
| 3 Vehicles | 282 (14.1%) | 297 (18.5%) |
| 4 Vehicles | 350 (17.5%) | 124 (7.7%) |
| 5 or more Vehicles | 11 (0.5%) | 0 (0.0%) |
| Total | 1,995 (100.0%) | 1,603 (100.0%) |
Commute Time in West Slope
The most frequently occuring commute durations in West Slope are 15 to 19 minutes (717 commuters, 24.1%), 20 to 24 minutes (582 commuters, 19.6%), and 30 to 34 minutes (376 commuters, 12.7%).
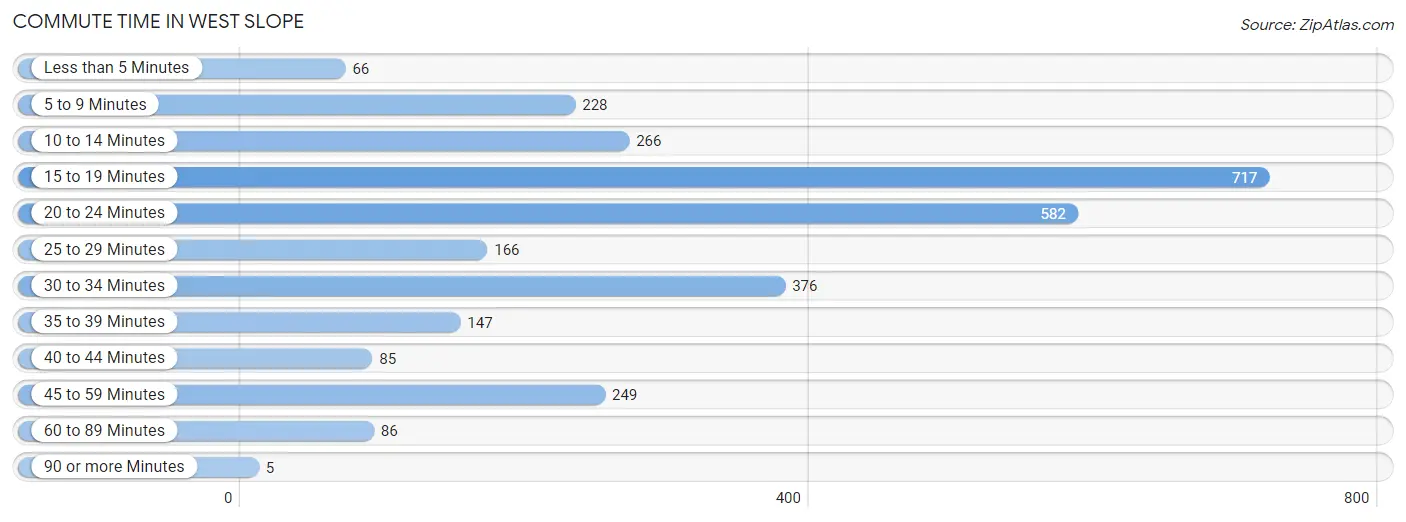
| Commute Time | # Commuters | % Commuters |
| Less than 5 Minutes | 66 | 2.2% |
| 5 to 9 Minutes | 228 | 7.7% |
| 10 to 14 Minutes | 266 | 8.9% |
| 15 to 19 Minutes | 717 | 24.1% |
| 20 to 24 Minutes | 582 | 19.6% |
| 25 to 29 Minutes | 166 | 5.6% |
| 30 to 34 Minutes | 376 | 12.7% |
| 35 to 39 Minutes | 147 | 4.9% |
| 40 to 44 Minutes | 85 | 2.9% |
| 45 to 59 Minutes | 249 | 8.4% |
| 60 to 89 Minutes | 86 | 2.9% |
| 90 or more Minutes | 5 | 0.2% |
Commute Time by Sex in West Slope
The most common commute times in West Slope are 20 to 24 minutes (348 commuters, 20.7%) for males and 15 to 19 minutes (417 commuters, 32.2%) for females.
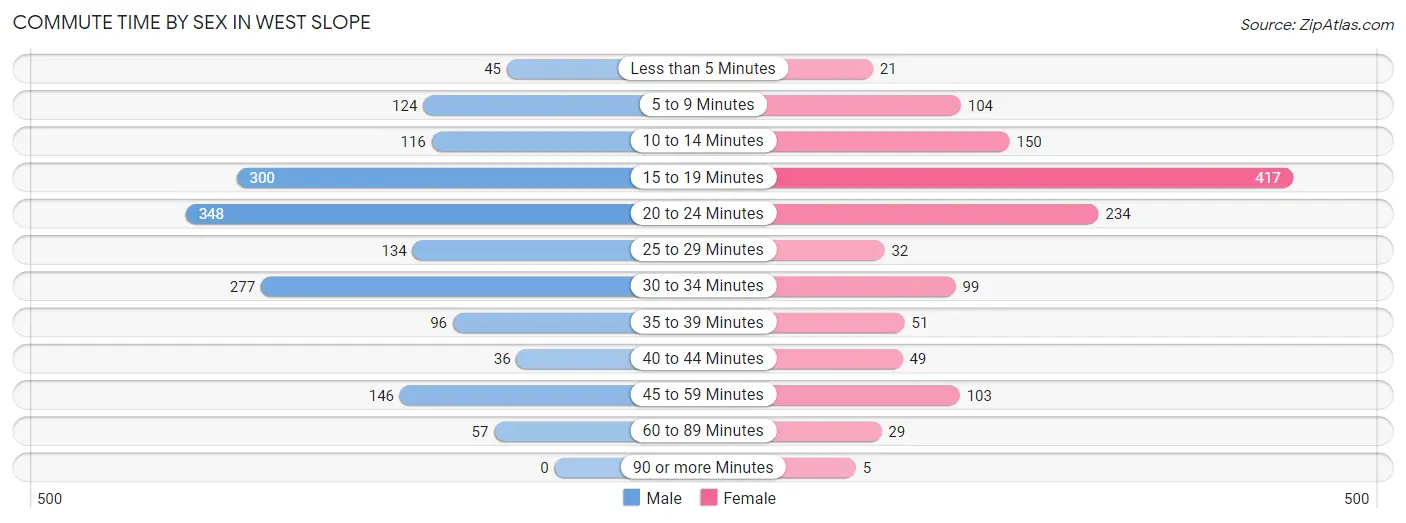
| Commute Time | Male | Female |
| Less than 5 Minutes | 45 (2.7%) | 21 (1.6%) |
| 5 to 9 Minutes | 124 (7.4%) | 104 (8.0%) |
| 10 to 14 Minutes | 116 (6.9%) | 150 (11.6%) |
| 15 to 19 Minutes | 300 (17.9%) | 417 (32.2%) |
| 20 to 24 Minutes | 348 (20.7%) | 234 (18.1%) |
| 25 to 29 Minutes | 134 (8.0%) | 32 (2.5%) |
| 30 to 34 Minutes | 277 (16.5%) | 99 (7.6%) |
| 35 to 39 Minutes | 96 (5.7%) | 51 (3.9%) |
| 40 to 44 Minutes | 36 (2.1%) | 49 (3.8%) |
| 45 to 59 Minutes | 146 (8.7%) | 103 (8.0%) |
| 60 to 89 Minutes | 57 (3.4%) | 29 (2.2%) |
| 90 or more Minutes | 0 (0.0%) | 5 (0.4%) |
Time of Departure to Work by Sex in West Slope
The most frequent times of departure to work in West Slope are 9:00 AM to 9:59 AM (334, 19.9%) for males and 7:30 AM to 7:59 AM (249, 19.2%) for females.
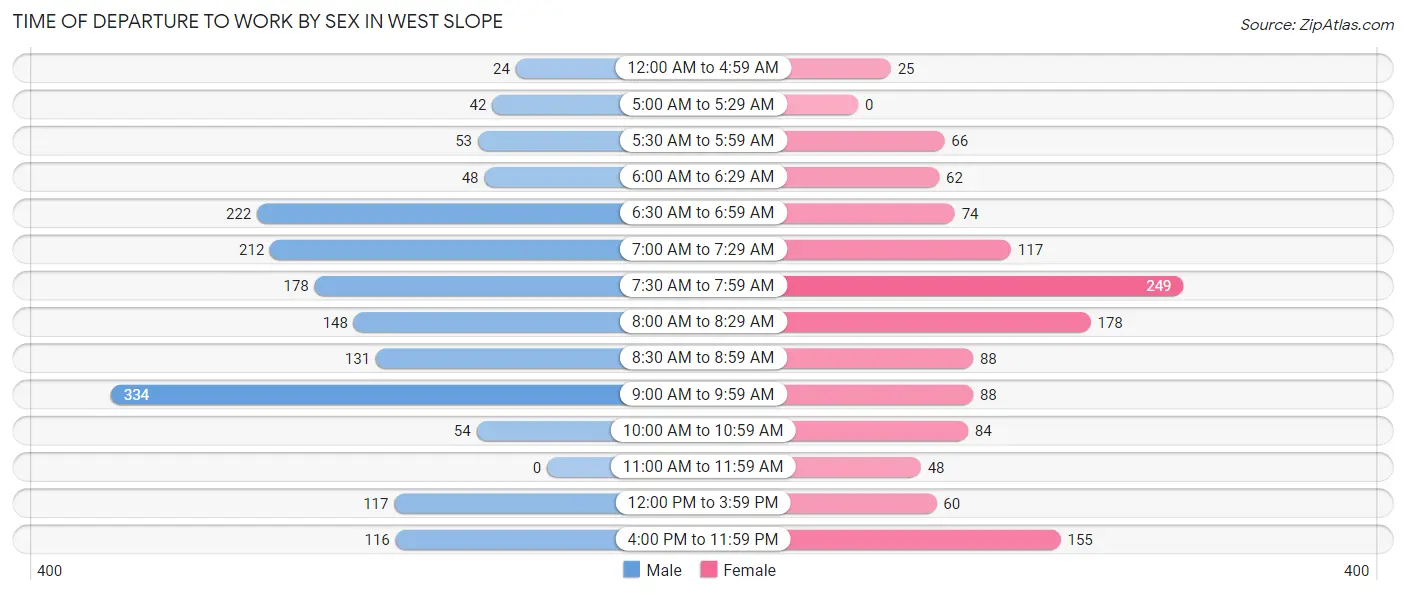
| Time of Departure | Male | Female |
| 12:00 AM to 4:59 AM | 24 (1.4%) | 25 (1.9%) |
| 5:00 AM to 5:29 AM | 42 (2.5%) | 0 (0.0%) |
| 5:30 AM to 5:59 AM | 53 (3.2%) | 66 (5.1%) |
| 6:00 AM to 6:29 AM | 48 (2.9%) | 62 (4.8%) |
| 6:30 AM to 6:59 AM | 222 (13.2%) | 74 (5.7%) |
| 7:00 AM to 7:29 AM | 212 (12.6%) | 117 (9.0%) |
| 7:30 AM to 7:59 AM | 178 (10.6%) | 249 (19.2%) |
| 8:00 AM to 8:29 AM | 148 (8.8%) | 178 (13.8%) |
| 8:30 AM to 8:59 AM | 131 (7.8%) | 88 (6.8%) |
| 9:00 AM to 9:59 AM | 334 (19.9%) | 88 (6.8%) |
| 10:00 AM to 10:59 AM | 54 (3.2%) | 84 (6.5%) |
| 11:00 AM to 11:59 AM | 0 (0.0%) | 48 (3.7%) |
| 12:00 PM to 3:59 PM | 117 (7.0%) | 60 (4.6%) |
| 4:00 PM to 11:59 PM | 116 (6.9%) | 155 (12.0%) |
| Total | 1,679 (100.0%) | 1,294 (100.0%) |
Housing Occupancy in West Slope
Occupancy by Ownership in West Slope
Of the total 2,932 dwellings in West Slope, owner-occupied units account for 1,764 (60.2%), while renter-occupied units make up 1,168 (39.8%).
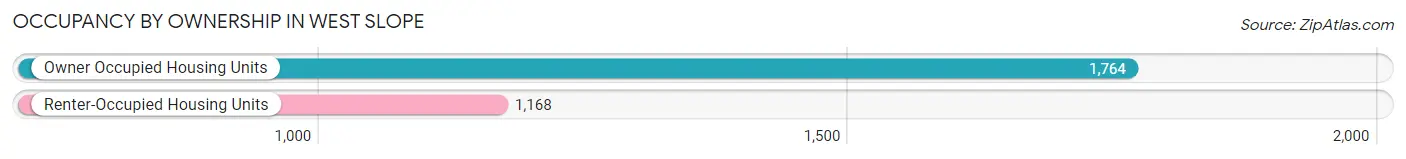
| Occupancy | # Housing Units | % Housing Units |
| Owner Occupied Housing Units | 1,764 | 60.2% |
| Renter-Occupied Housing Units | 1,168 | 39.8% |
| Total Occupied Housing Units | 2,932 | 100.0% |
Occupancy by Household Size in West Slope
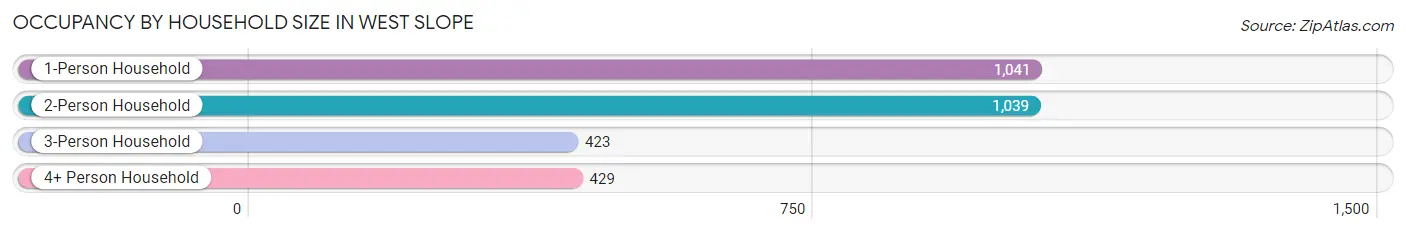
| Household Size | # Housing Units | % Housing Units |
| 1-Person Household | 1,041 | 35.5% |
| 2-Person Household | 1,039 | 35.4% |
| 3-Person Household | 423 | 14.4% |
| 4+ Person Household | 429 | 14.6% |
| Total Housing Units | 2,932 | 100.0% |
Occupancy by Ownership by Household Size in West Slope
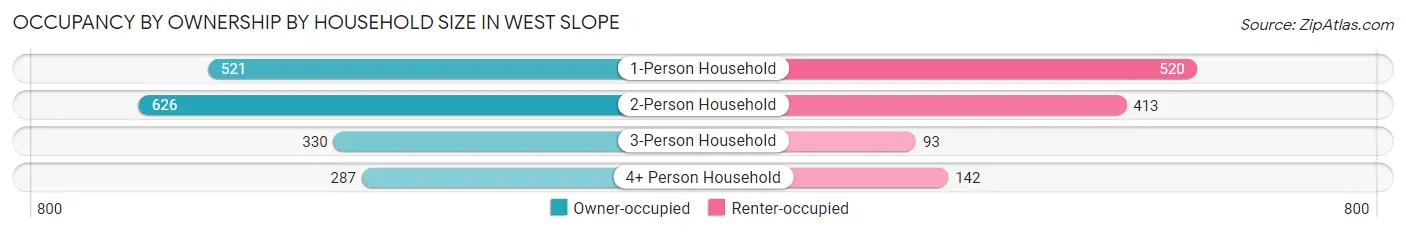
| Household Size | Owner-occupied | Renter-occupied |
| 1-Person Household | 521 (50.0%) | 520 (49.9%) |
| 2-Person Household | 626 (60.3%) | 413 (39.8%) |
| 3-Person Household | 330 (78.0%) | 93 (22.0%) |
| 4+ Person Household | 287 (66.9%) | 142 (33.1%) |
| Total Housing Units | 1,764 (60.2%) | 1,168 (39.8%) |
Occupancy by Educational Attainment in West Slope
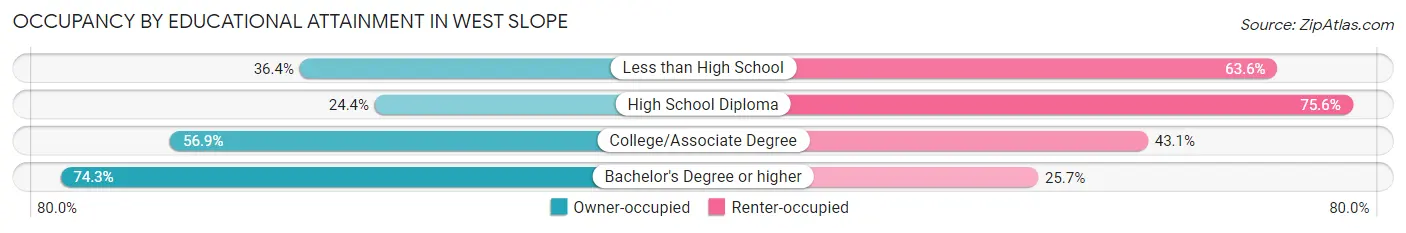
| Household Size | Owner-occupied | Renter-occupied |
| Less than High School | 36 (36.4%) | 63 (63.6%) |
| High School Diploma | 119 (24.4%) | 368 (75.6%) |
| College/Associate Degree | 440 (56.9%) | 333 (43.1%) |
| Bachelor's Degree or higher | 1,169 (74.3%) | 404 (25.7%) |
Occupancy by Age of Householder in West Slope
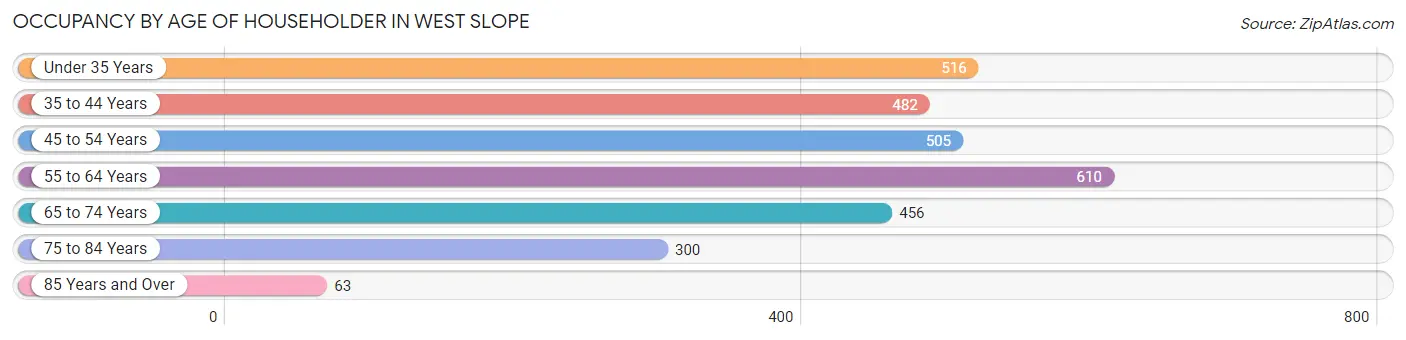
| Age Bracket | # Households | % Households |
| Under 35 Years | 516 | 17.6% |
| 35 to 44 Years | 482 | 16.4% |
| 45 to 54 Years | 505 | 17.2% |
| 55 to 64 Years | 610 | 20.8% |
| 65 to 74 Years | 456 | 15.5% |
| 75 to 84 Years | 300 | 10.2% |
| 85 Years and Over | 63 | 2.1% |
| Total | 2,932 | 100.0% |
Housing Finances in West Slope
Median Income by Occupancy in West Slope
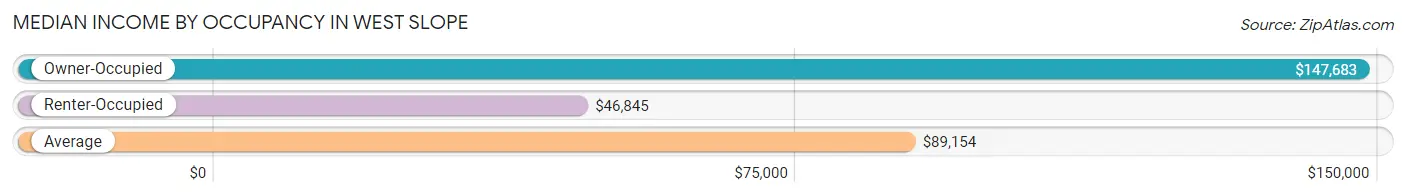
| Occupancy Type | # Households | Median Income |
| Owner-Occupied | 1,764 (60.2%) | $147,683 |
| Renter-Occupied | 1,168 (39.8%) | $46,845 |
| Average | 2,932 (100.0%) | $89,154 |
Occupancy by Householder Income Bracket in West Slope
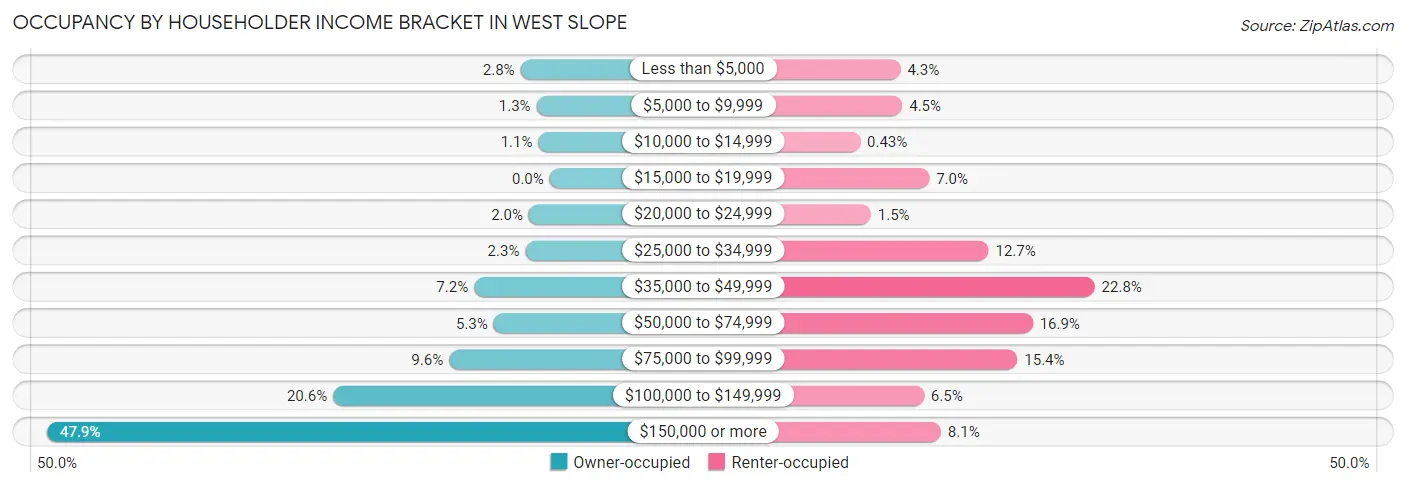
| Income Bracket | Owner-occupied | Renter-occupied |
| Less than $5,000 | 49 (2.8%) | 50 (4.3%) |
| $5,000 to $9,999 | 22 (1.3%) | 52 (4.4%) |
| $10,000 to $14,999 | 19 (1.1%) | 5 (0.4%) |
| $15,000 to $19,999 | 0 (0.0%) | 82 (7.0%) |
| $20,000 to $24,999 | 35 (2.0%) | 17 (1.5%) |
| $25,000 to $34,999 | 41 (2.3%) | 148 (12.7%) |
| $35,000 to $49,999 | 127 (7.2%) | 266 (22.8%) |
| $50,000 to $74,999 | 94 (5.3%) | 197 (16.9%) |
| $75,000 to $99,999 | 169 (9.6%) | 180 (15.4%) |
| $100,000 to $149,999 | 364 (20.6%) | 76 (6.5%) |
| $150,000 or more | 844 (47.8%) | 95 (8.1%) |
| Total | 1,764 (100.0%) | 1,168 (100.0%) |
Monthly Housing Cost Tiers in West Slope
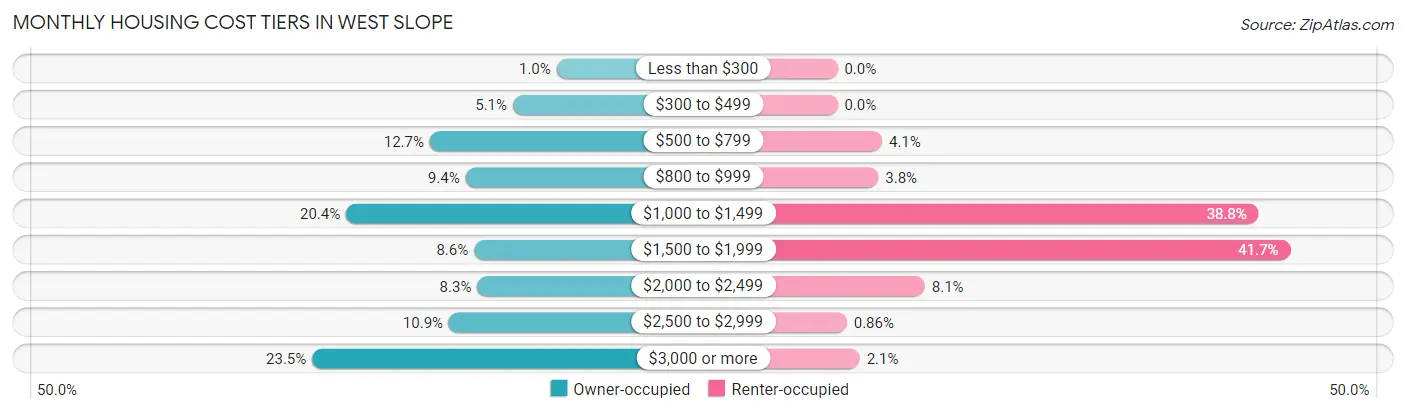
| Monthly Cost | Owner-occupied | Renter-occupied |
| Less than $300 | 18 (1.0%) | 0 (0.0%) |
| $300 to $499 | 89 (5.1%) | 0 (0.0%) |
| $500 to $799 | 224 (12.7%) | 48 (4.1%) |
| $800 to $999 | 166 (9.4%) | 44 (3.8%) |
| $1,000 to $1,499 | 360 (20.4%) | 453 (38.8%) |
| $1,500 to $1,999 | 152 (8.6%) | 487 (41.7%) |
| $2,000 to $2,499 | 147 (8.3%) | 94 (8.1%) |
| $2,500 to $2,999 | 193 (10.9%) | 10 (0.9%) |
| $3,000 or more | 415 (23.5%) | 24 (2.1%) |
| Total | 1,764 (100.0%) | 1,168 (100.0%) |
Physical Housing Characteristics in West Slope
Housing Structures in West Slope
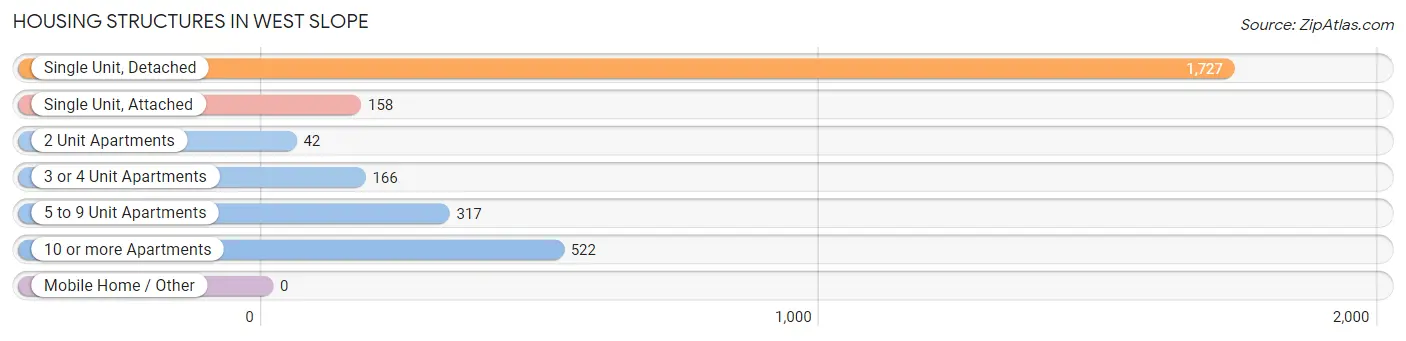
| Structure Type | # Housing Units | % Housing Units |
| Single Unit, Detached | 1,727 | 58.9% |
| Single Unit, Attached | 158 | 5.4% |
| 2 Unit Apartments | 42 | 1.4% |
| 3 or 4 Unit Apartments | 166 | 5.7% |
| 5 to 9 Unit Apartments | 317 | 10.8% |
| 10 or more Apartments | 522 | 17.8% |
| Mobile Home / Other | 0 | 0.0% |
| Total | 2,932 | 100.0% |
Housing Structures by Occupancy in West Slope
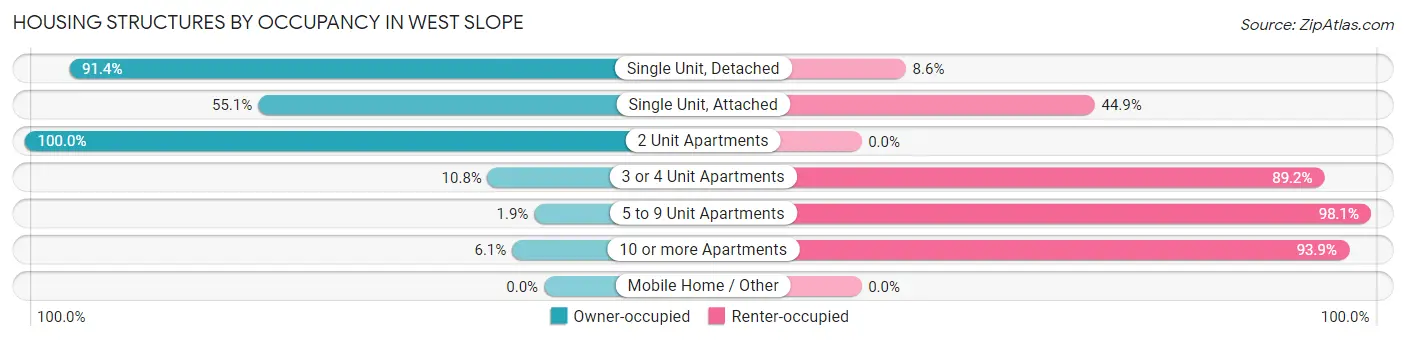
| Structure Type | Owner-occupied | Renter-occupied |
| Single Unit, Detached | 1,579 (91.4%) | 148 (8.6%) |
| Single Unit, Attached | 87 (55.1%) | 71 (44.9%) |
| 2 Unit Apartments | 42 (100.0%) | 0 (0.0%) |
| 3 or 4 Unit Apartments | 18 (10.8%) | 148 (89.2%) |
| 5 to 9 Unit Apartments | 6 (1.9%) | 311 (98.1%) |
| 10 or more Apartments | 32 (6.1%) | 490 (93.9%) |
| Mobile Home / Other | 0 (0.0%) | 0 (0.0%) |
| Total | 1,764 (60.2%) | 1,168 (39.8%) |
Housing Structures by Number of Rooms in West Slope
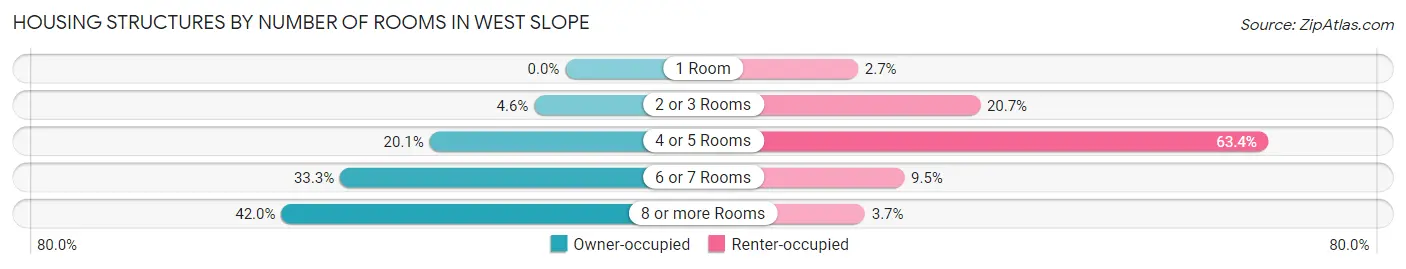
| Number of Rooms | Owner-occupied | Renter-occupied |
| 1 Room | 0 (0.0%) | 31 (2.6%) |
| 2 or 3 Rooms | 81 (4.6%) | 242 (20.7%) |
| 4 or 5 Rooms | 354 (20.1%) | 741 (63.4%) |
| 6 or 7 Rooms | 588 (33.3%) | 111 (9.5%) |
| 8 or more Rooms | 741 (42.0%) | 43 (3.7%) |
| Total | 1,764 (100.0%) | 1,168 (100.0%) |
Housing Structure by Heating Type in West Slope
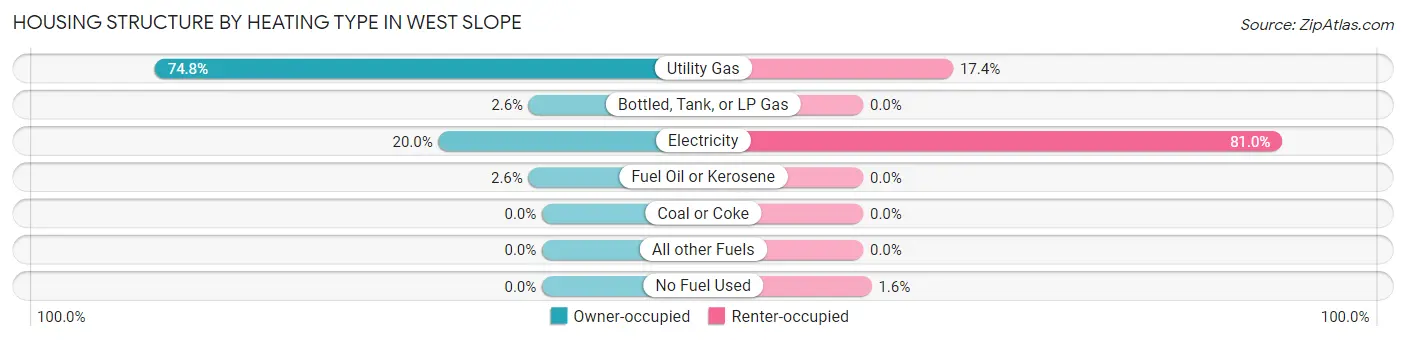
| Heating Type | Owner-occupied | Renter-occupied |
| Utility Gas | 1,320 (74.8%) | 203 (17.4%) |
| Bottled, Tank, or LP Gas | 45 (2.5%) | 0 (0.0%) |
| Electricity | 353 (20.0%) | 946 (81.0%) |
| Fuel Oil or Kerosene | 46 (2.6%) | 0 (0.0%) |
| Coal or Coke | 0 (0.0%) | 0 (0.0%) |
| All other Fuels | 0 (0.0%) | 0 (0.0%) |
| No Fuel Used | 0 (0.0%) | 19 (1.6%) |
| Total | 1,764 (100.0%) | 1,168 (100.0%) |
Household Vehicle Usage in West Slope
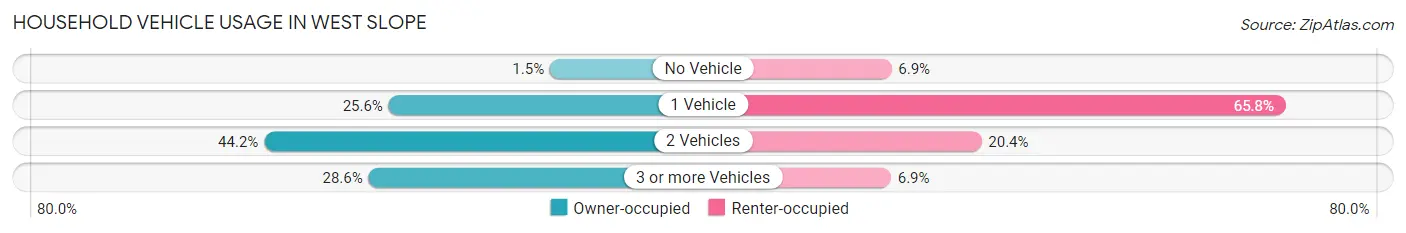
| Vehicles per Household | Owner-occupied | Renter-occupied |
| No Vehicle | 27 (1.5%) | 81 (6.9%) |
| 1 Vehicle | 452 (25.6%) | 769 (65.8%) |
| 2 Vehicles | 780 (44.2%) | 238 (20.4%) |
| 3 or more Vehicles | 505 (28.6%) | 80 (6.9%) |
| Total | 1,764 (100.0%) | 1,168 (100.0%) |
Real Estate & Mortgages in West Slope
Real Estate and Mortgage Overview in West Slope
| Characteristic | Without Mortgage | With Mortgage |
| Housing Units | 720 | 1,044 |
| Median Property Value | $588,800 | $692,800 |
| Median Household Income | $82,333 | $594 |
| Monthly Housing Costs | $873 | $415 |
| Real Estate Taxes | $5,550 | $0 |
Property Value by Mortgage Status in West Slope

| Property Value | Without Mortgage | With Mortgage |
| Less than $50,000 | 0 (0.0%) | 14 (1.3%) |
| $50,000 to $99,999 | 6 (0.8%) | 0 (0.0%) |
| $100,000 to $299,999 | 18 (2.5%) | 37 (3.5%) |
| $300,000 to $499,999 | 271 (37.6%) | 188 (18.0%) |
| $500,000 to $749,999 | 183 (25.4%) | 367 (35.1%) |
| $750,000 to $999,999 | 199 (27.6%) | 256 (24.5%) |
| $1,000,000 or more | 43 (6.0%) | 182 (17.4%) |
| Total | 720 (100.0%) | 1,044 (100.0%) |
Household Income by Mortgage Status in West Slope
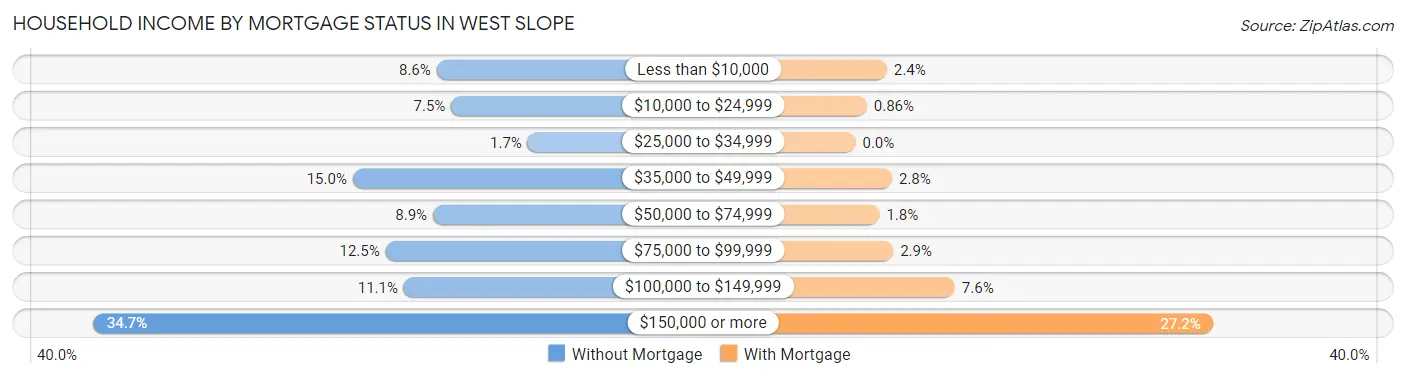
| Household Income | Without Mortgage | With Mortgage |
| Less than $10,000 | 62 (8.6%) | 25 (2.4%) |
| $10,000 to $24,999 | 54 (7.5%) | 9 (0.9%) |
| $25,000 to $34,999 | 12 (1.7%) | 0 (0.0%) |
| $35,000 to $49,999 | 108 (15.0%) | 29 (2.8%) |
| $50,000 to $74,999 | 64 (8.9%) | 19 (1.8%) |
| $75,000 to $99,999 | 90 (12.5%) | 30 (2.9%) |
| $100,000 to $149,999 | 80 (11.1%) | 79 (7.6%) |
| $150,000 or more | 250 (34.7%) | 284 (27.2%) |
| Total | 720 (100.0%) | 1,044 (100.0%) |
Property Value to Household Income Ratio in West Slope
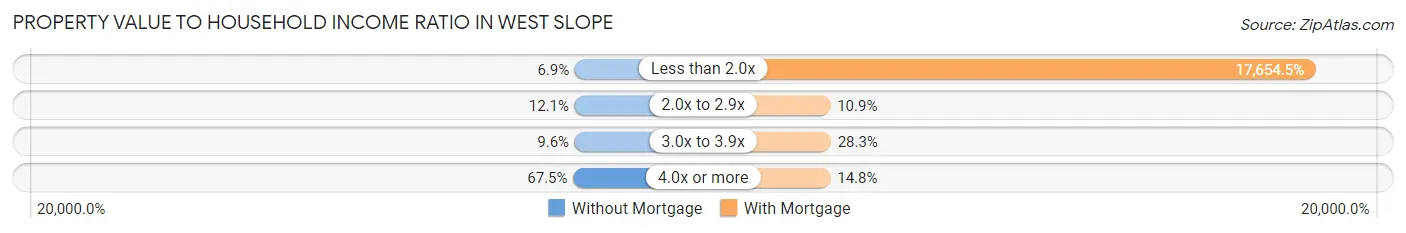
| Value-to-Income Ratio | Without Mortgage | With Mortgage |
| Less than 2.0x | 50 (6.9%) | 184,313 (17,654.5%) |
| 2.0x to 2.9x | 87 (12.1%) | 114 (10.9%) |
| 3.0x to 3.9x | 69 (9.6%) | 295 (28.3%) |
| 4.0x or more | 486 (67.5%) | 154 (14.7%) |
| Total | 720 (100.0%) | 1,044 (100.0%) |
Real Estate Taxes by Mortgage Status in West Slope
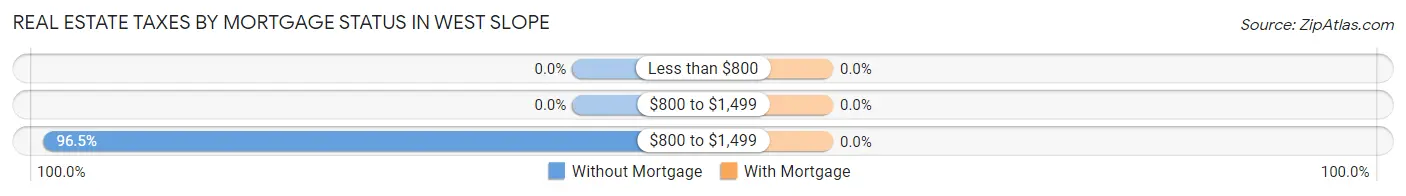
| Property Taxes | Without Mortgage | With Mortgage |
| Less than $800 | 0 (0.0%) | 0 (0.0%) |
| $800 to $1,499 | 0 (0.0%) | 0 (0.0%) |
| $800 to $1,499 | 695 (96.5%) | 0 (0.0%) |
| Total | 720 (100.0%) | 1,044 (100.0%) |
Health & Disability in West Slope
Health Insurance Coverage by Age in West Slope
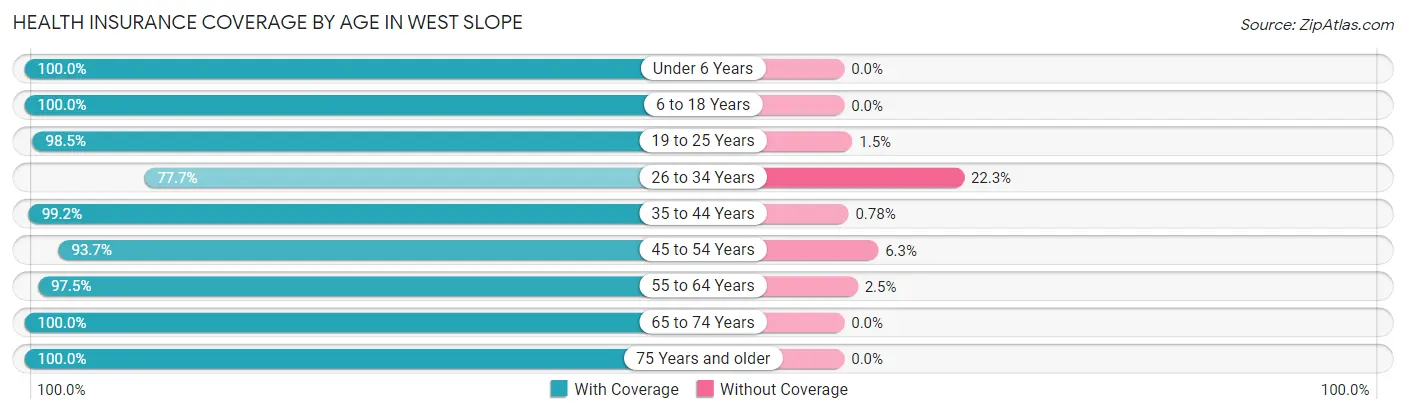
| Age Bracket | With Coverage | Without Coverage |
| Under 6 Years | 347 (100.0%) | 0 (0.0%) |
| 6 to 18 Years | 705 (100.0%) | 0 (0.0%) |
| 19 to 25 Years | 658 (98.5%) | 10 (1.5%) |
| 26 to 34 Years | 693 (77.7%) | 199 (22.3%) |
| 35 to 44 Years | 891 (99.2%) | 7 (0.8%) |
| 45 to 54 Years | 755 (93.7%) | 51 (6.3%) |
| 55 to 64 Years | 1,130 (97.5%) | 29 (2.5%) |
| 65 to 74 Years | 670 (100.0%) | 0 (0.0%) |
| 75 Years and older | 473 (100.0%) | 0 (0.0%) |
| Total | 6,322 (95.5%) | 296 (4.5%) |
Health Insurance Coverage by Citizenship Status in West Slope
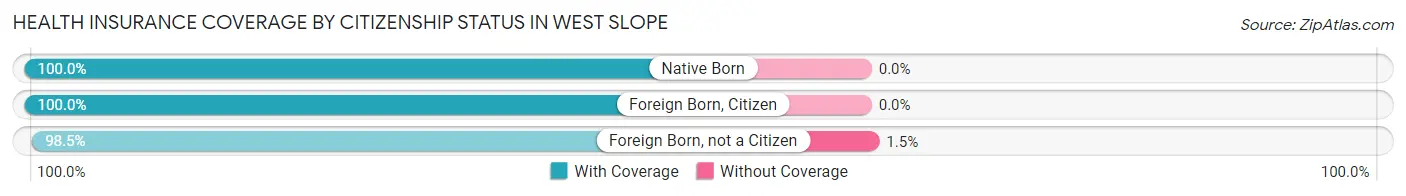
| Citizenship Status | With Coverage | Without Coverage |
| Native Born | 347 (100.0%) | 0 (0.0%) |
| Foreign Born, Citizen | 705 (100.0%) | 0 (0.0%) |
| Foreign Born, not a Citizen | 658 (98.5%) | 10 (1.5%) |
Health Insurance Coverage by Household Income in West Slope
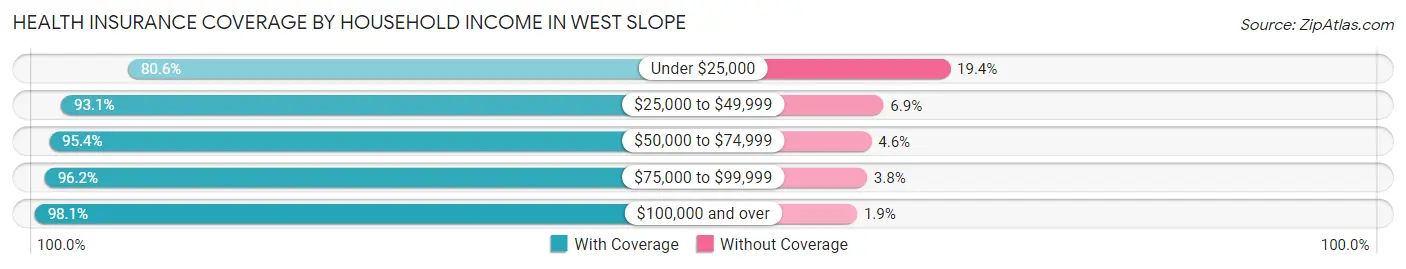
| Household Income | With Coverage | Without Coverage |
| Under $25,000 | 454 (80.6%) | 109 (19.4%) |
| $25,000 to $49,999 | 910 (93.1%) | 67 (6.9%) |
| $50,000 to $74,999 | 415 (95.4%) | 20 (4.6%) |
| $75,000 to $99,999 | 689 (96.2%) | 27 (3.8%) |
| $100,000 and over | 3,762 (98.1%) | 73 (1.9%) |
Public vs Private Health Insurance Coverage by Age in West Slope
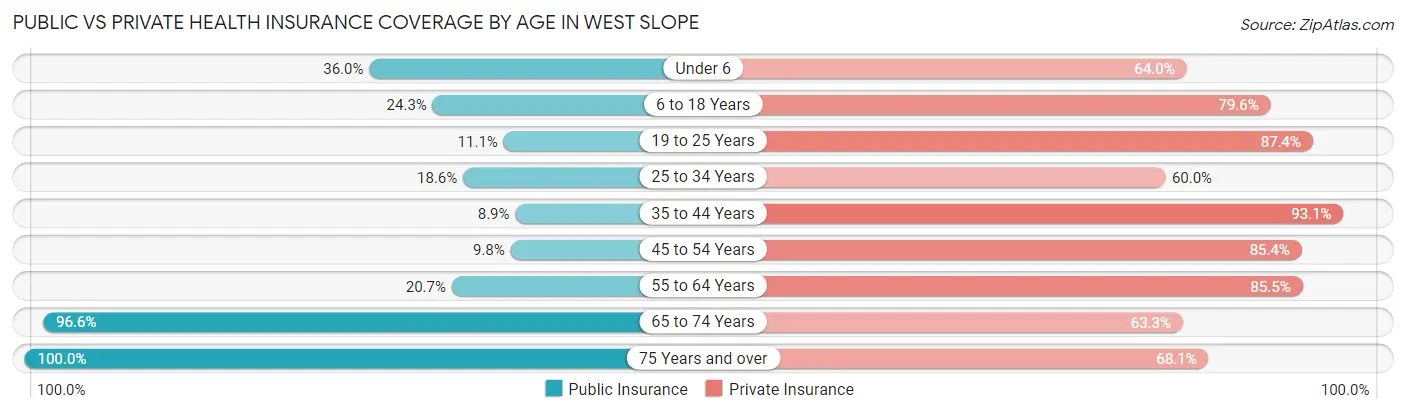
| Age Bracket | Public Insurance | Private Insurance |
| Under 6 | 125 (36.0%) | 222 (64.0%) |
| 6 to 18 Years | 171 (24.3%) | 561 (79.6%) |
| 19 to 25 Years | 74 (11.1%) | 584 (87.4%) |
| 25 to 34 Years | 166 (18.6%) | 535 (60.0%) |
| 35 to 44 Years | 80 (8.9%) | 836 (93.1%) |
| 45 to 54 Years | 79 (9.8%) | 688 (85.4%) |
| 55 to 64 Years | 240 (20.7%) | 991 (85.5%) |
| 65 to 74 Years | 647 (96.6%) | 424 (63.3%) |
| 75 Years and over | 473 (100.0%) | 322 (68.1%) |
| Total | 2,055 (31.0%) | 5,163 (78.0%) |
Disability Status by Sex by Age in West Slope
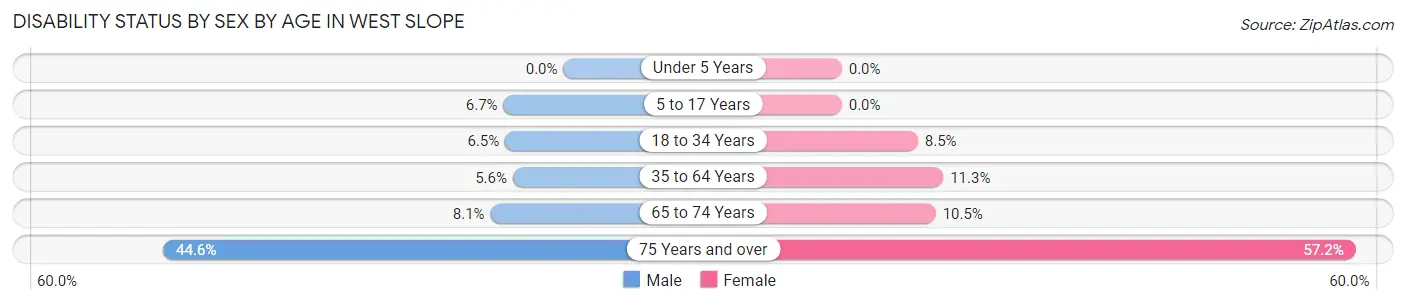
| Age Bracket | Male | Female |
| Under 5 Years | 0 (0.0%) | 0 (0.0%) |
| 5 to 17 Years | 24 (6.7%) | 0 (0.0%) |
| 18 to 34 Years | 63 (6.5%) | 53 (8.5%) |
| 35 to 64 Years | 76 (5.6%) | 171 (11.3%) |
| 65 to 74 Years | 28 (8.1%) | 34 (10.5%) |
| 75 Years and over | 115 (44.6%) | 123 (57.2%) |
Disability Class by Sex by Age in West Slope
Disability Class: Hearing Difficulty
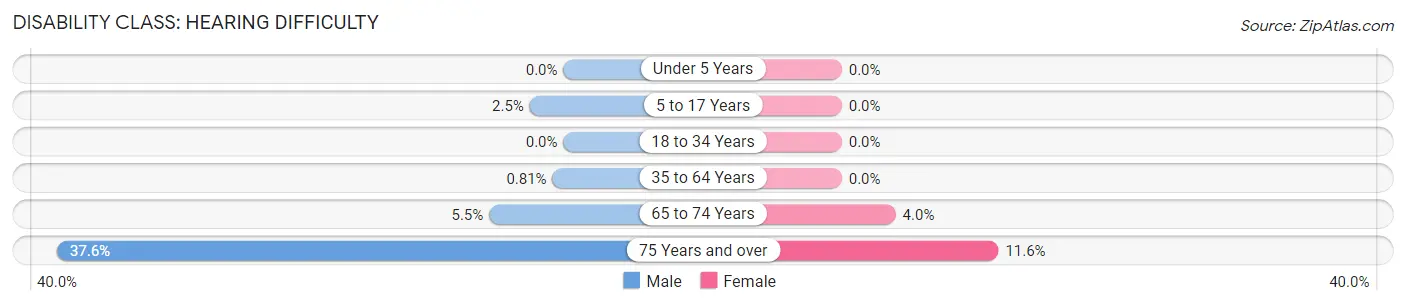
| Age Bracket | Male | Female |
| Under 5 Years | 0 (0.0%) | 0 (0.0%) |
| 5 to 17 Years | 9 (2.5%) | 0 (0.0%) |
| 18 to 34 Years | 0 (0.0%) | 0 (0.0%) |
| 35 to 64 Years | 11 (0.8%) | 0 (0.0%) |
| 65 to 74 Years | 19 (5.5%) | 13 (4.0%) |
| 75 Years and over | 97 (37.6%) | 25 (11.6%) |
Disability Class: Vision Difficulty
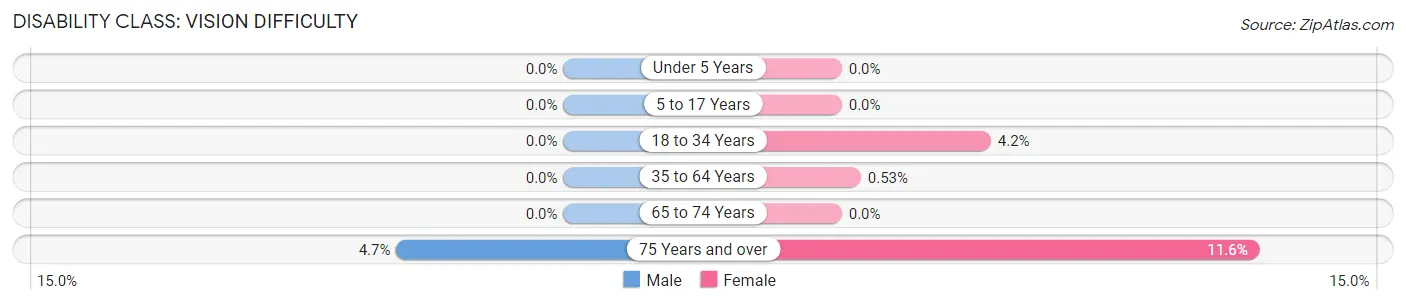
| Age Bracket | Male | Female |
| Under 5 Years | 0 (0.0%) | 0 (0.0%) |
| 5 to 17 Years | 0 (0.0%) | 0 (0.0%) |
| 18 to 34 Years | 0 (0.0%) | 26 (4.2%) |
| 35 to 64 Years | 0 (0.0%) | 8 (0.5%) |
| 65 to 74 Years | 0 (0.0%) | 0 (0.0%) |
| 75 Years and over | 12 (4.6%) | 25 (11.6%) |
Disability Class: Cognitive Difficulty
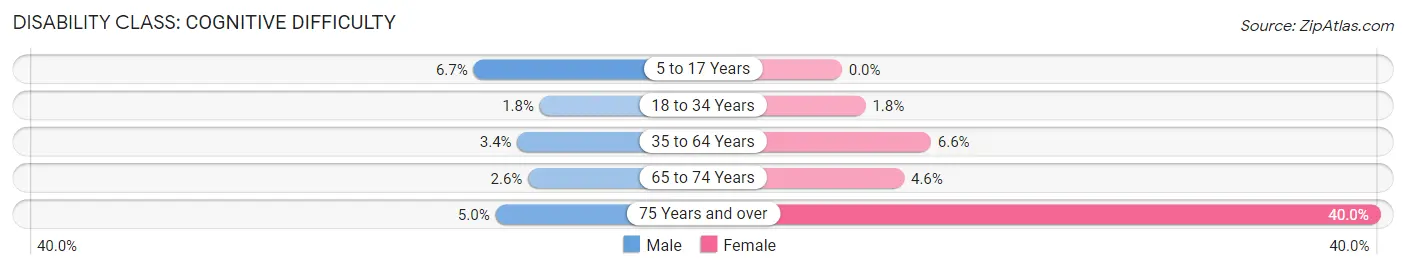
| Age Bracket | Male | Female |
| 5 to 17 Years | 24 (6.7%) | 0 (0.0%) |
| 18 to 34 Years | 17 (1.8%) | 11 (1.8%) |
| 35 to 64 Years | 46 (3.4%) | 100 (6.6%) |
| 65 to 74 Years | 9 (2.6%) | 15 (4.6%) |
| 75 Years and over | 13 (5.0%) | 86 (40.0%) |
Disability Class: Ambulatory Difficulty
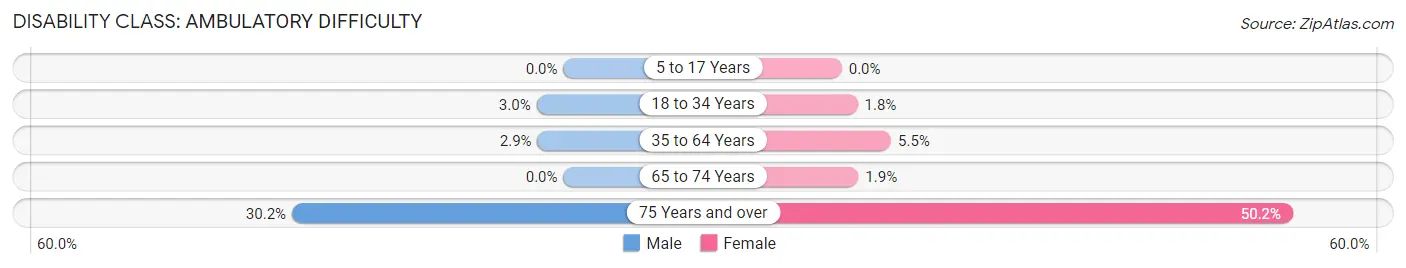
| Age Bracket | Male | Female |
| 5 to 17 Years | 0 (0.0%) | 0 (0.0%) |
| 18 to 34 Years | 29 (3.0%) | 11 (1.8%) |
| 35 to 64 Years | 39 (2.9%) | 83 (5.5%) |
| 65 to 74 Years | 0 (0.0%) | 6 (1.8%) |
| 75 Years and over | 78 (30.2%) | 108 (50.2%) |
Disability Class: Self-Care Difficulty
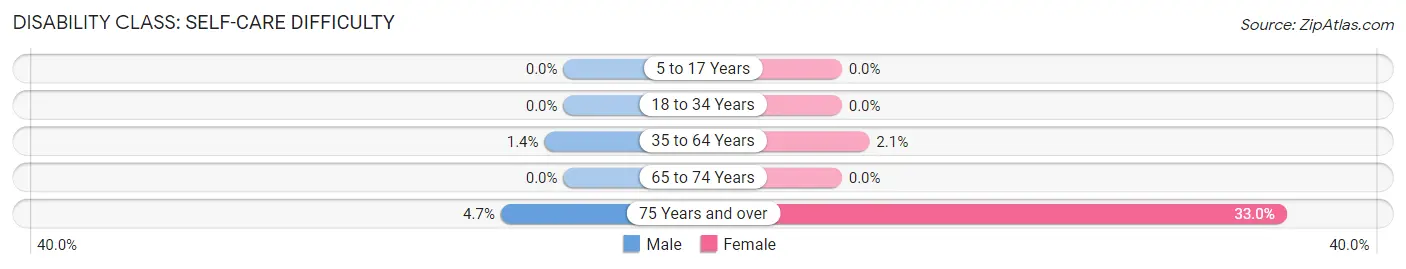
| Age Bracket | Male | Female |
| 5 to 17 Years | 0 (0.0%) | 0 (0.0%) |
| 18 to 34 Years | 0 (0.0%) | 0 (0.0%) |
| 35 to 64 Years | 19 (1.4%) | 31 (2.1%) |
| 65 to 74 Years | 0 (0.0%) | 0 (0.0%) |
| 75 Years and over | 12 (4.6%) | 71 (33.0%) |
Technology Access in West Slope
Computing Device Access in West Slope
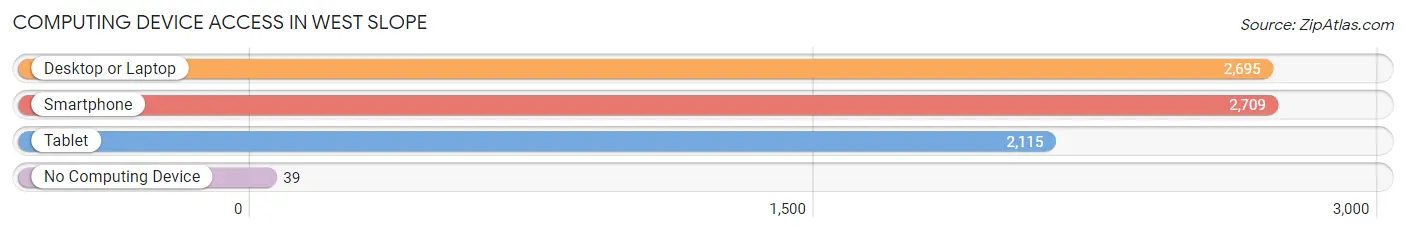
| Device Type | # Households | % Households |
| Desktop or Laptop | 2,695 | 91.9% |
| Smartphone | 2,709 | 92.4% |
| Tablet | 2,115 | 72.1% |
| No Computing Device | 39 | 1.3% |
| Total | 2,932 | 100.0% |
Internet Access in West Slope
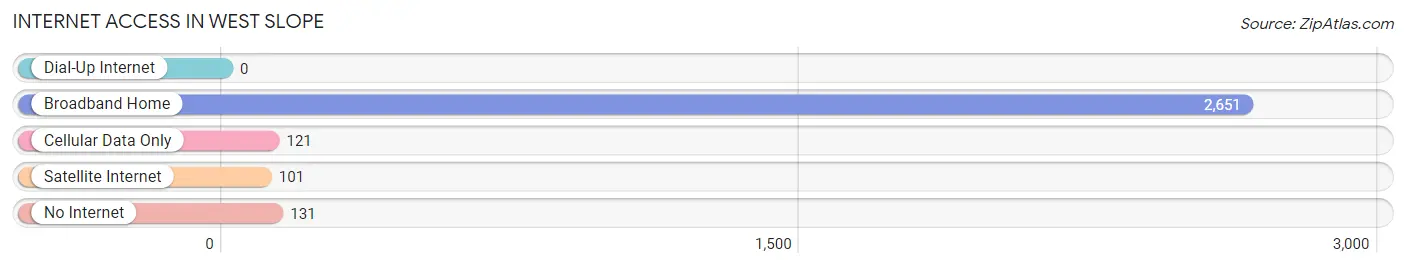
| Internet Type | # Households | % Households |
| Dial-Up Internet | 0 | 0.0% |
| Broadband Home | 2,651 | 90.4% |
| Cellular Data Only | 121 | 4.1% |
| Satellite Internet | 101 | 3.4% |
| No Internet | 131 | 4.5% |
| Total | 2,932 | 100.0% |
West Slope Summary
West Slope is a census-designated place (CDP) located in Washington County, Oregon, United States. It is located in the Tualatin Valley, just west of the city of Beaverton. The population was 8,845 at the 2010 census.
History
The area that is now West Slope was originally inhabited by the Atfalati tribe of the Kalapuya Native American people. The first European settlers arrived in the area in the early 1800s, and the area was officially incorporated as the West Slope Precinct in 1876. The area was primarily agricultural, with dairy farms and orchards being the main sources of income.
In the 1950s, the area began to experience rapid growth as the Portland metropolitan area expanded. The area was annexed by the city of Beaverton in the 1970s, and the West Slope Precinct was dissolved.
Geography
West Slope is located in the Tualatin Valley, just west of the city of Beaverton. It is bordered to the north by the city of Hillsboro, to the east by the city of Beaverton, to the south by the city of Tigard, and to the west by the city of Forest Grove.
The terrain of West Slope is mostly flat, with some rolling hills. The area is located in the foothills of the Tualatin Mountains, and is part of the Willamette Valley.
Economy
West Slope is primarily a residential area, with most of its residents commuting to nearby cities for work. The area is home to several small businesses, including restaurants, retail stores, and professional services.
The area is also home to several large employers, including Intel, Nike, and Tektronix. These companies provide thousands of jobs to the area, and have helped to fuel the area's economic growth.
Demographics
As of the 2010 census, there were 8,845 people, 3,541 households, and 2,541 families residing in West Slope. The population density was 2,845.3 people per square mile (1,098.7/km2). The racial makeup of West Slope was 79.2% White, 5.2% African American, 0.7% Native American, 8.2% Asian, 0.2% Pacific Islander, 3.2% from other races, and 3.3% from two or more races. Hispanic or Latino of any race were 8.2% of the population.
The median income for a household in West Slope was $63,945, and the median income for a family was $76,945. The per capita income for the CDP was $30,945. About 4.2% of families and 6.2% of the population were below the poverty line, including 8.2% of those under age 18 and 4.2% of those age 65 or over.
Common Questions
What is Per Capita Income in West Slope?
Per Capita income in West Slope is $60,915.
What is the Median Family Income in West Slope?
Median Family Income in West Slope is $149,643.
What is the Median Household income in West Slope?
Median Household Income in West Slope is $89,154.
What is Income or Wage Gap in West Slope?
Income or Wage Gap in West Slope is 13.3%.
Women in West Slope earn 86.7 cents for every dollar earned by a man.
What is Inequality or Gini Index in West Slope?
Inequality or Gini Index in West Slope is 0.48.
What is the Total Population of West Slope?
Total Population of West Slope is 6,663.
What is the Total Male Population of West Slope?
Total Male Population of West Slope is 3,550.
What is the Total Female Population of West Slope?
Total Female Population of West Slope is 3,113.
What is the Ratio of Males per 100 Females in West Slope?
There are 114.04 Males per 100 Females in West Slope.
What is the Ratio of Females per 100 Males in West Slope?
There are 87.69 Females per 100 Males in West Slope.
What is the Median Population Age in West Slope?
Median Population Age in West Slope is 42.3 Years.
What is the Average Family Size in West Slope
Average Family Size in West Slope is 2.9 People.
What is the Average Household Size in West Slope
Average Household Size in West Slope is 2.2 People.
How Large is the Labor Force in West Slope?
There are 3,793 People in the Labor Forcein in West Slope.
What is the Percentage of People in the Labor Force in West Slope?
65.8% of People are in the Labor Force in West Slope.
What is the Unemployment Rate in West Slope?
Unemployment Rate in West Slope is 3.2%.