Johns Creek, GA Map & Demographics
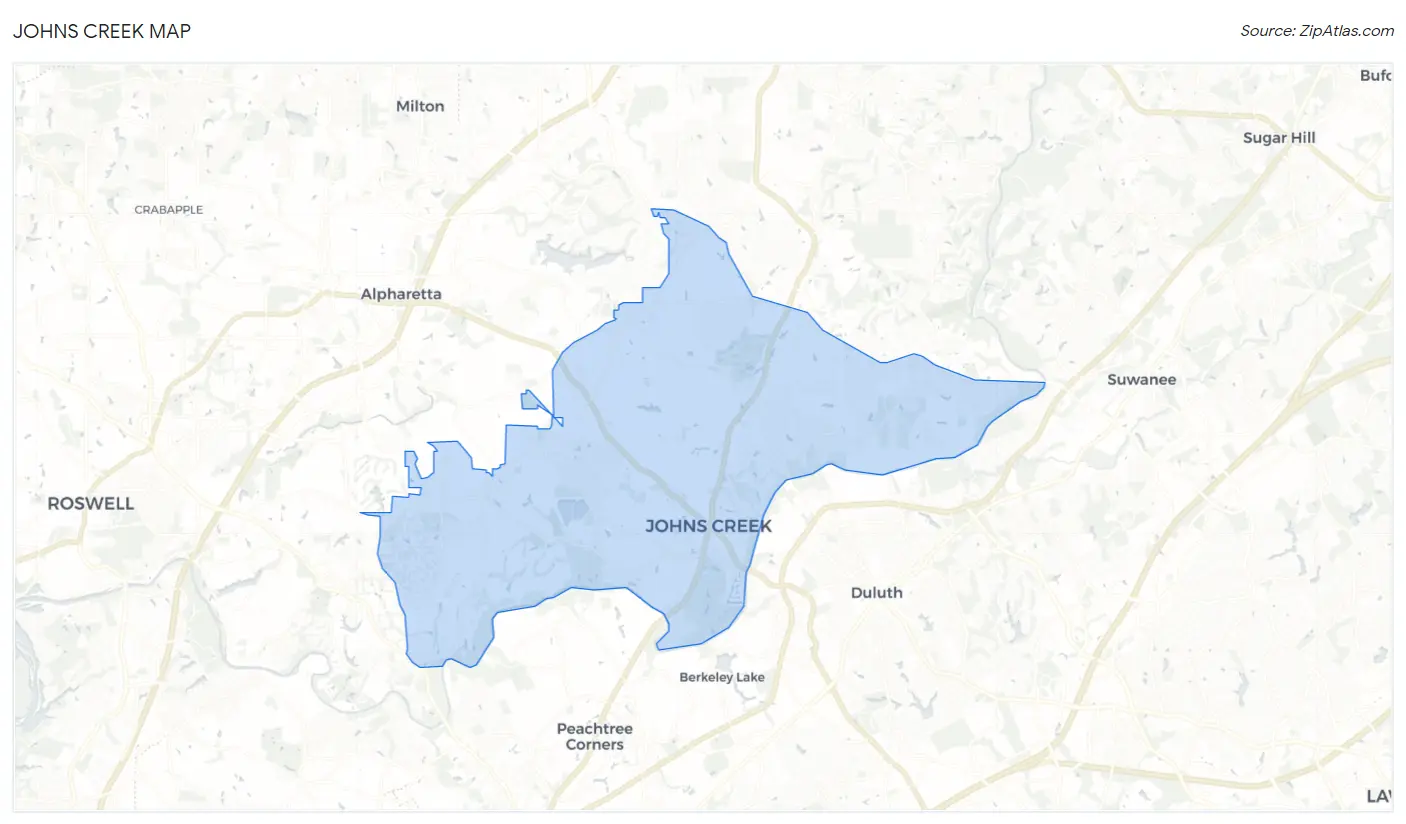
Johns Creek Map
Johns Creek Overview
$62,080
PER CAPITA INCOME
$166,627
AVG FAMILY INCOME
$153,882
AVG HOUSEHOLD INCOME
48.0%
WAGE / INCOME GAP [ % ]
52.0¢/ $1
WAGE / INCOME GAP [ $ ]
0.39
INEQUALITY / GINI INDEX
82,230
TOTAL POPULATION
40,652
MALE POPULATION
41,578
FEMALE POPULATION
97.77
MALES / 100 FEMALES
102.28
FEMALES / 100 MALES
42.4
MEDIAN AGE
3.2
AVG FAMILY SIZE
2.9
AVG HOUSEHOLD SIZE
42,385
LABOR FORCE [ PEOPLE ]
66.0%
PERCENT IN LABOR FORCE
3.7%
UNEMPLOYMENT RATE
Income in Johns Creek
Income Overview in Johns Creek
Per Capita Income in Johns Creek is $62,080, while median incomes of families and households are $166,627 and $153,882 respectively.
| Characteristic | Number | Measure |
| Per Capita Income | 82,230 | $62,080 |
| Median Family Income | 22,997 | $166,627 |
| Mean Family Income | 22,997 | $190,403 |
| Median Household Income | 28,439 | $153,882 |
| Mean Household Income | 28,439 | $177,740 |
| Income Deficit | 22,997 | $0 |
| Wage / Income Gap (%) | 82,230 | 48.04% |
| Wage / Income Gap ($) | 82,230 | 51.96¢ per $1 |
| Gini / Inequality Index | 82,230 | 0.39 |
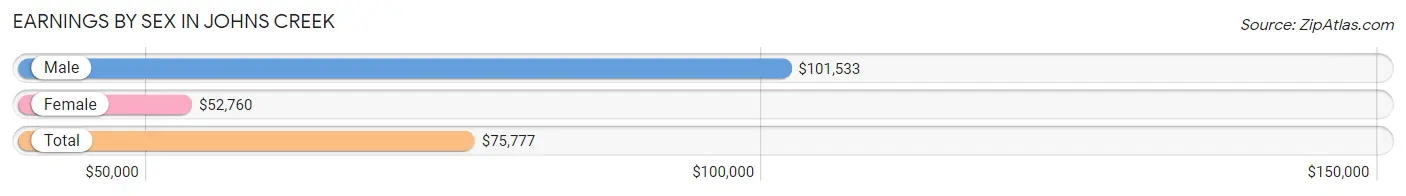
Earnings by Sex in Johns Creek
Average Earnings in Johns Creek are $75,777, $101,533 for men and $52,760 for women, a difference of 48.0%.
| Sex | Number | Average Earnings |
| Male | 24,533 (54.0%) | $101,533 |
| Female | 20,867 (46.0%) | $52,760 |
| Total | 45,400 (100.0%) | $75,777 |
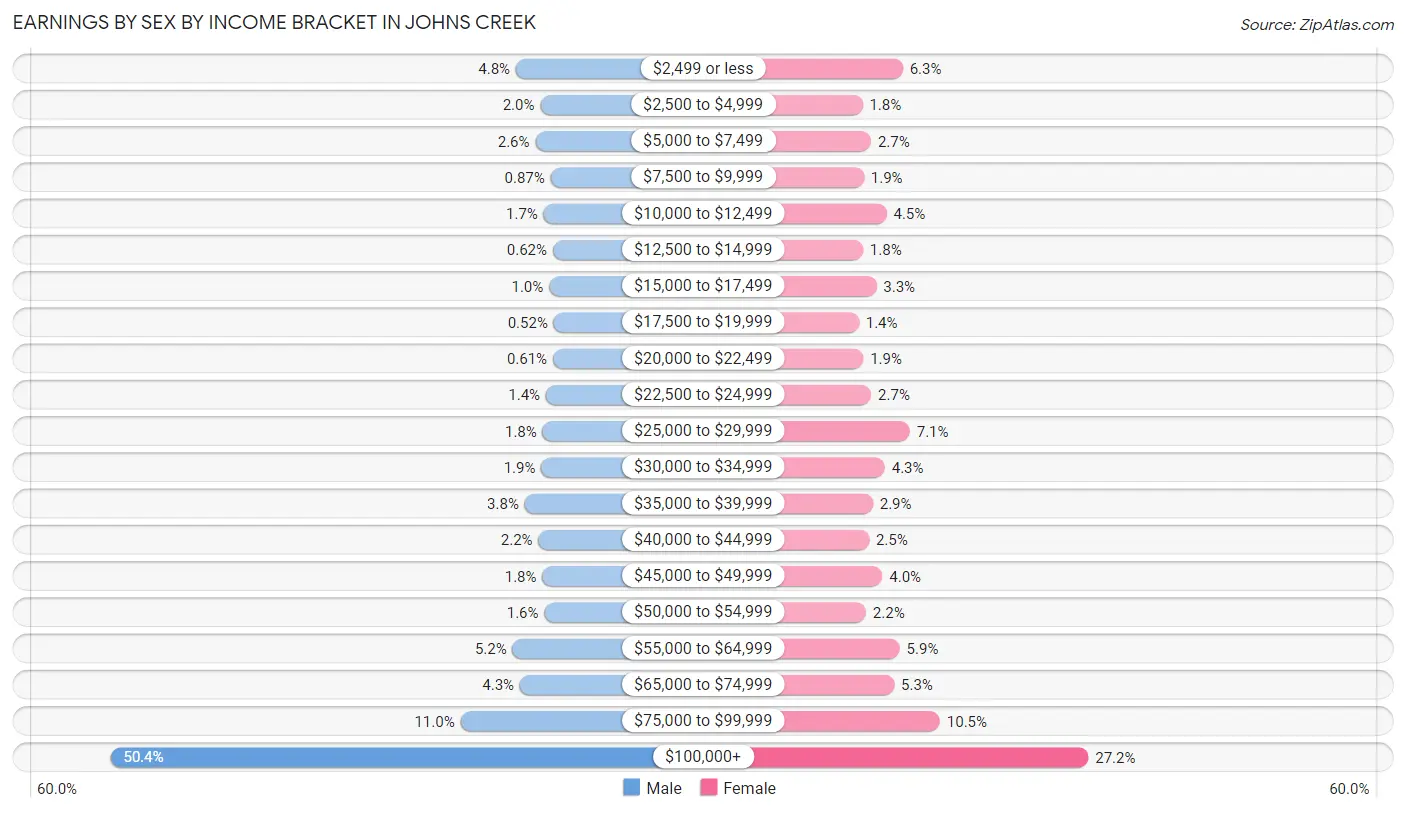
Earnings by Sex by Income Bracket in Johns Creek
The most common earnings brackets in Johns Creek are $100,000+ for men (12,356 | 50.4%) and $100,000+ for women (5,665 | 27.2%).
| Income | Male | Female |
| $2,499 or less | 1,171 (4.8%) | 1,312 (6.3%) |
| $2,500 to $4,999 | 498 (2.0%) | 368 (1.8%) |
| $5,000 to $7,499 | 634 (2.6%) | 567 (2.7%) |
| $7,500 to $9,999 | 213 (0.9%) | 400 (1.9%) |
| $10,000 to $12,499 | 405 (1.7%) | 932 (4.5%) |
| $12,500 to $14,999 | 151 (0.6%) | 378 (1.8%) |
| $15,000 to $17,499 | 255 (1.0%) | 692 (3.3%) |
| $17,500 to $19,999 | 128 (0.5%) | 282 (1.3%) |
| $20,000 to $22,499 | 149 (0.6%) | 387 (1.8%) |
| $22,500 to $24,999 | 343 (1.4%) | 572 (2.7%) |
| $25,000 to $29,999 | 435 (1.8%) | 1,477 (7.1%) |
| $30,000 to $34,999 | 471 (1.9%) | 891 (4.3%) |
| $35,000 to $39,999 | 927 (3.8%) | 609 (2.9%) |
| $40,000 to $44,999 | 550 (2.2%) | 520 (2.5%) |
| $45,000 to $49,999 | 442 (1.8%) | 835 (4.0%) |
| $50,000 to $54,999 | 384 (1.6%) | 448 (2.1%) |
| $55,000 to $64,999 | 1,263 (5.1%) | 1,239 (5.9%) |
| $65,000 to $74,999 | 1,059 (4.3%) | 1,110 (5.3%) |
| $75,000 to $99,999 | 2,699 (11.0%) | 2,183 (10.5%) |
| $100,000+ | 12,356 (50.4%) | 5,665 (27.2%) |
| Total | 24,533 (100.0%) | 20,867 (100.0%) |
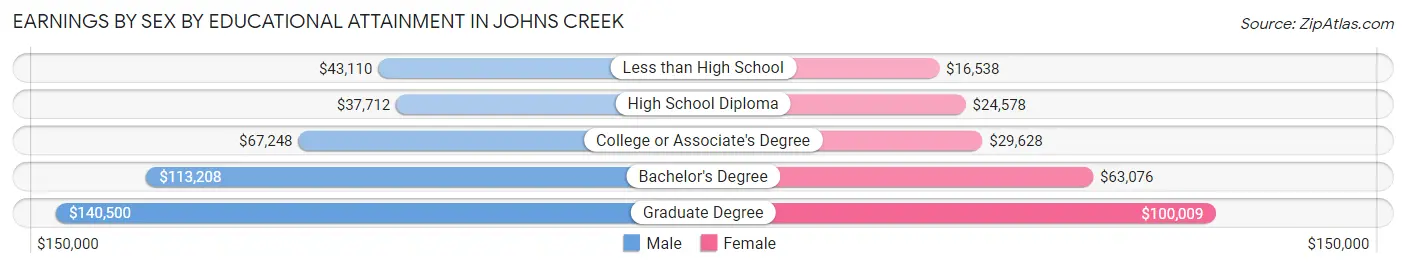
Earnings by Sex by Educational Attainment in Johns Creek
Average earnings in Johns Creek are $112,850 for men and $58,923 for women, a difference of 47.8%. Men with an educational attainment of graduate degree enjoy the highest average annual earnings of $140,500, while those with high school diploma education earn the least with $37,712. Women with an educational attainment of graduate degree earn the most with the average annual earnings of $100,009, while those with less than high school education have the smallest earnings of $16,538.
| Educational Attainment | Male Income | Female Income |
| Less than High School | $43,110 | $16,538 |
| High School Diploma | $37,712 | $24,578 |
| College or Associate's Degree | $67,248 | $29,628 |
| Bachelor's Degree | $113,208 | $63,076 |
| Graduate Degree | $140,500 | $100,009 |
| Total | $112,850 | $58,923 |
Family Income in Johns Creek
Family Income Brackets in Johns Creek
According to the Johns Creek family income data, there are 8,624 families falling into the $200,000+ income range, which is the most common income bracket and makes up 37.5% of all families. Conversely, the $10,000 to $14,999 income bracket is the least frequent group with only 207 families (0.9%) belonging to this category.
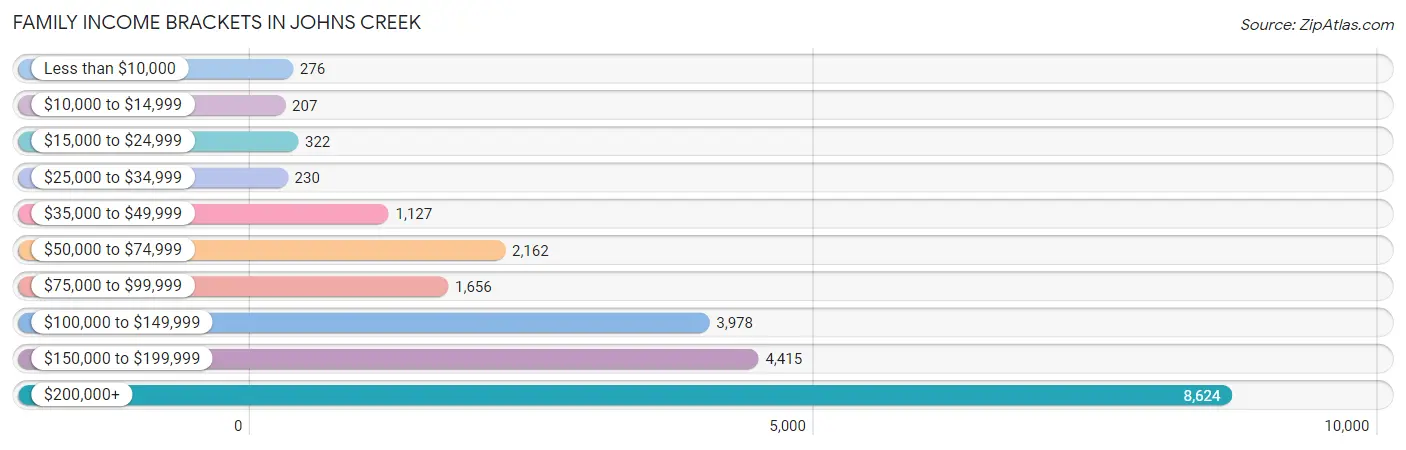
| Income Bracket | # Families | % Families |
| Less than $10,000 | 276 | 1.2% |
| $10,000 to $14,999 | 207 | 0.9% |
| $15,000 to $24,999 | 322 | 1.4% |
| $25,000 to $34,999 | 230 | 1.0% |
| $35,000 to $49,999 | 1,127 | 4.9% |
| $50,000 to $74,999 | 2,162 | 9.4% |
| $75,000 to $99,999 | 1,656 | 7.2% |
| $100,000 to $149,999 | 3,978 | 17.3% |
| $150,000 to $199,999 | 4,415 | 19.2% |
| $200,000+ | 8,624 | 37.5% |
Family Income by Famaliy Size in Johns Creek
7+ person families (396 | 1.7%) account for the highest median family income in Johns Creek with $250,001 per family, while 2-person families (8,789 | 38.2%) have the highest median income of $67,136 per family member.
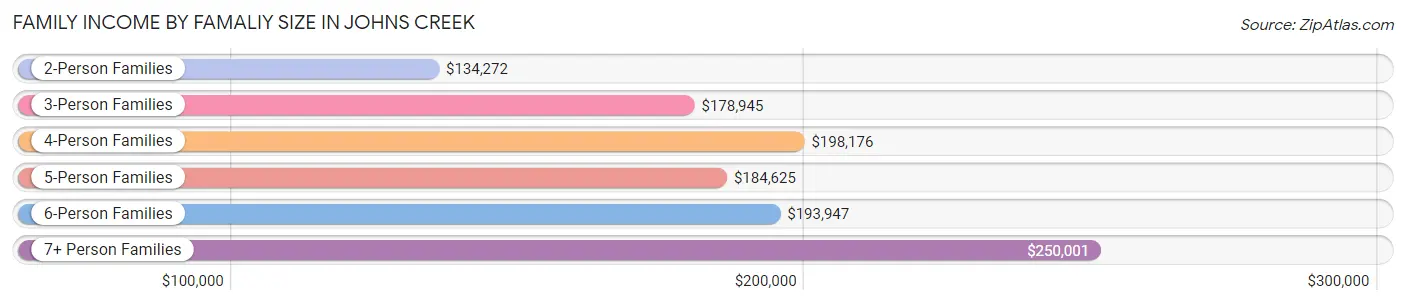
| Income Bracket | # Families | Median Income |
| 2-Person Families | 8,789 (38.2%) | $134,272 |
| 3-Person Families | 5,589 (24.3%) | $178,945 |
| 4-Person Families | 6,105 (26.6%) | $198,176 |
| 5-Person Families | 1,578 (6.9%) | $184,625 |
| 6-Person Families | 540 (2.4%) | $193,947 |
| 7+ Person Families | 396 (1.7%) | $250,001 |
| Total | 22,997 (100.0%) | $166,627 |
Family Income by Number of Earners in Johns Creek
The median family income in Johns Creek is $166,627, with families comprising 3+ earners (3,317) having the highest median family income of $209,952, while families with no earners (1,783) have the lowest median family income of $74,063, accounting for 14.4% and 7.7% of families, respectively.
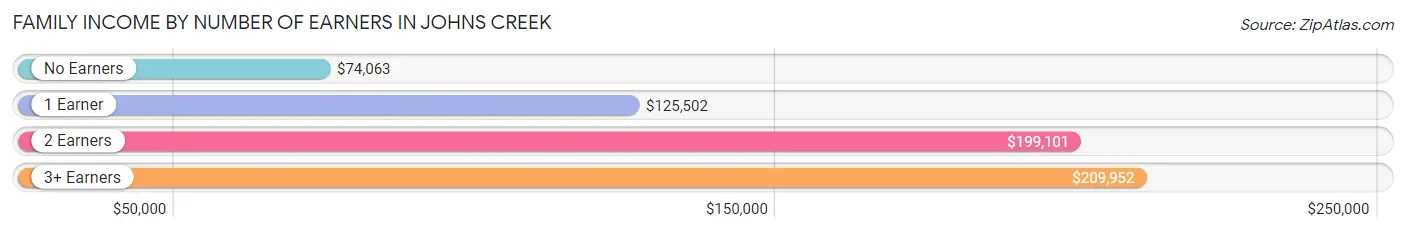
| Number of Earners | # Families | Median Income |
| No Earners | 1,783 (7.7%) | $74,063 |
| 1 Earner | 7,571 (32.9%) | $125,502 |
| 2 Earners | 10,326 (44.9%) | $199,101 |
| 3+ Earners | 3,317 (14.4%) | $209,952 |
| Total | 22,997 (100.0%) | $166,627 |
Household Income in Johns Creek
Household Income Brackets in Johns Creek
With 9,385 households falling in the category, the $200,000+ income range is the most frequent in Johns Creek, accounting for 33.0% of all households. In contrast, only 313 households (1.1%) fall into the $10,000 to $14,999 income bracket, making it the least populous group.
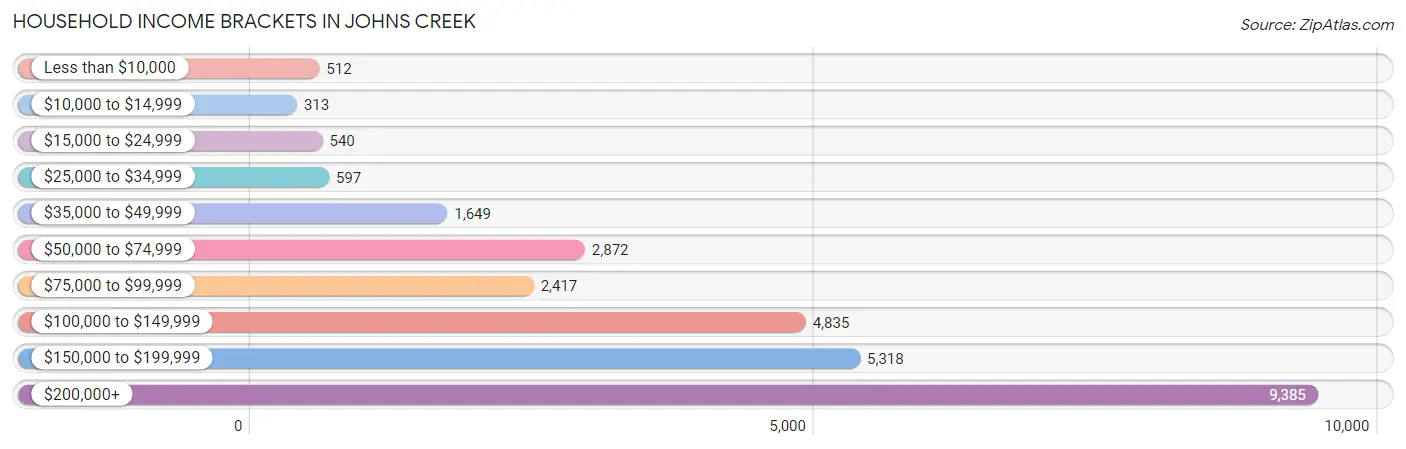
| Income Bracket | # Households | % Households |
| Less than $10,000 | 512 | 1.8% |
| $10,000 to $14,999 | 313 | 1.1% |
| $15,000 to $24,999 | 540 | 1.9% |
| $25,000 to $34,999 | 597 | 2.1% |
| $35,000 to $49,999 | 1,649 | 5.8% |
| $50,000 to $74,999 | 2,872 | 10.1% |
| $75,000 to $99,999 | 2,417 | 8.5% |
| $100,000 to $149,999 | 4,835 | 17.0% |
| $150,000 to $199,999 | 5,318 | 18.7% |
| $200,000+ | 9,385 | 33.0% |
Household Income by Householder Age in Johns Creek
The median household income in Johns Creek is $153,882, with the highest median household income of $171,755 found in the 45 to 64 years age bracket for the primary householder. A total of 14,963 households (52.6%) fall into this category. Meanwhile, the 15 to 24 years age bracket for the primary householder has the lowest median household income of $64,340, with 258 households (0.9%) in this group.
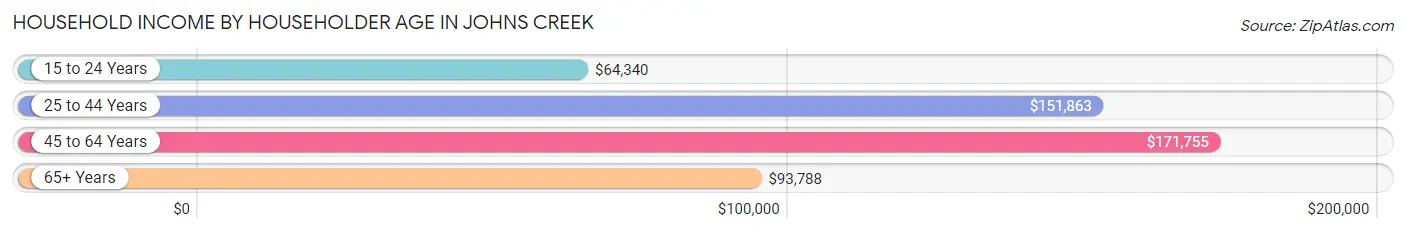
| Income Bracket | # Households | Median Income |
| 15 to 24 Years | 258 (0.9%) | $64,340 |
| 25 to 44 Years | 8,398 (29.5%) | $151,863 |
| 45 to 64 Years | 14,963 (52.6%) | $171,755 |
| 65+ Years | 4,820 (17.0%) | $93,788 |
| Total | 28,439 (100.0%) | $153,882 |
Poverty in Johns Creek
Income Below Poverty by Sex and Age in Johns Creek
With 2.8% poverty level for males and 4.8% for females among the residents of Johns Creek, 18 to 24 year old males and 12 to 14 year old females are the most vulnerable to poverty, with 217 males (7.5%) and 230 females (11.4%) in their respective age groups living below the poverty level.
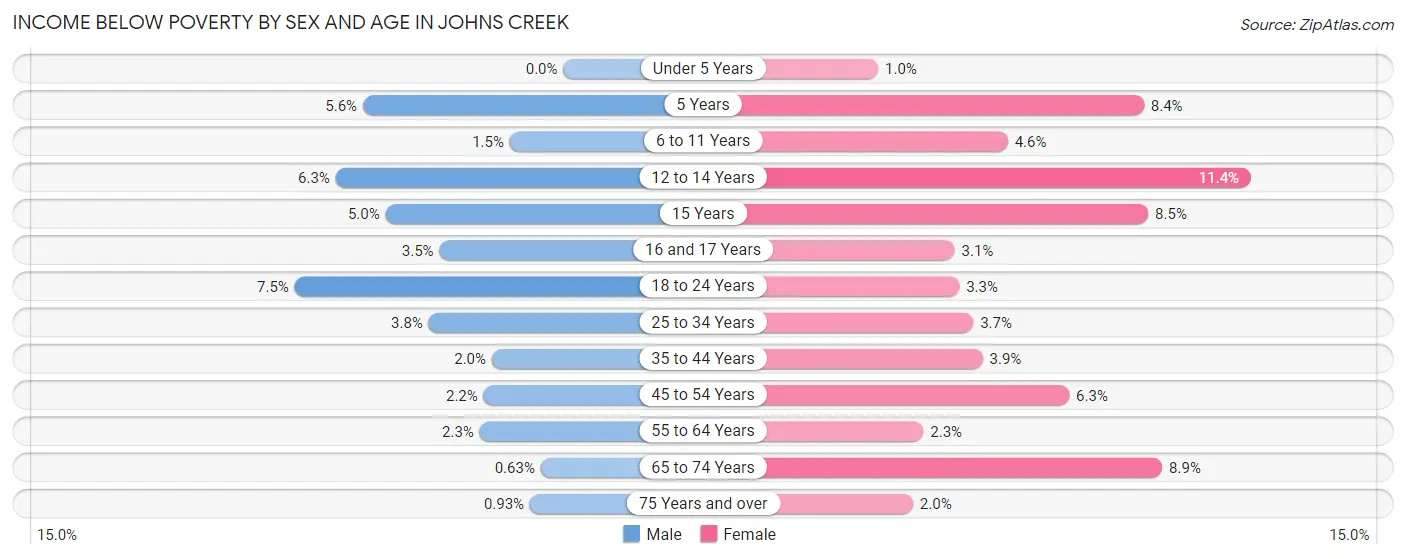
| Age Bracket | Male | Female |
| Under 5 Years | 0 (0.0%) | 18 (1.0%) |
| 5 Years | 23 (5.6%) | 27 (8.4%) |
| 6 to 11 Years | 56 (1.5%) | 167 (4.6%) |
| 12 to 14 Years | 154 (6.3%) | 230 (11.4%) |
| 15 Years | 48 (5.0%) | 58 (8.5%) |
| 16 and 17 Years | 68 (3.5%) | 47 (3.1%) |
| 18 to 24 Years | 217 (7.5%) | 74 (3.3%) |
| 25 to 34 Years | 110 (3.7%) | 131 (3.7%) |
| 35 to 44 Years | 107 (2.0%) | 263 (3.9%) |
| 45 to 54 Years | 173 (2.2%) | 460 (6.3%) |
| 55 to 64 Years | 139 (2.3%) | 136 (2.3%) |
| 65 to 74 Years | 18 (0.6%) | 317 (8.9%) |
| 75 Years and over | 13 (0.9%) | 39 (2.0%) |
| Total | 1,126 (2.8%) | 1,967 (4.8%) |
Income Above Poverty by Sex and Age in Johns Creek
According to the poverty statistics in Johns Creek, males aged under 5 years and females aged under 5 years are the age groups that are most secure financially, with 100.0% of males and 99.0% of females in these age groups living above the poverty line.
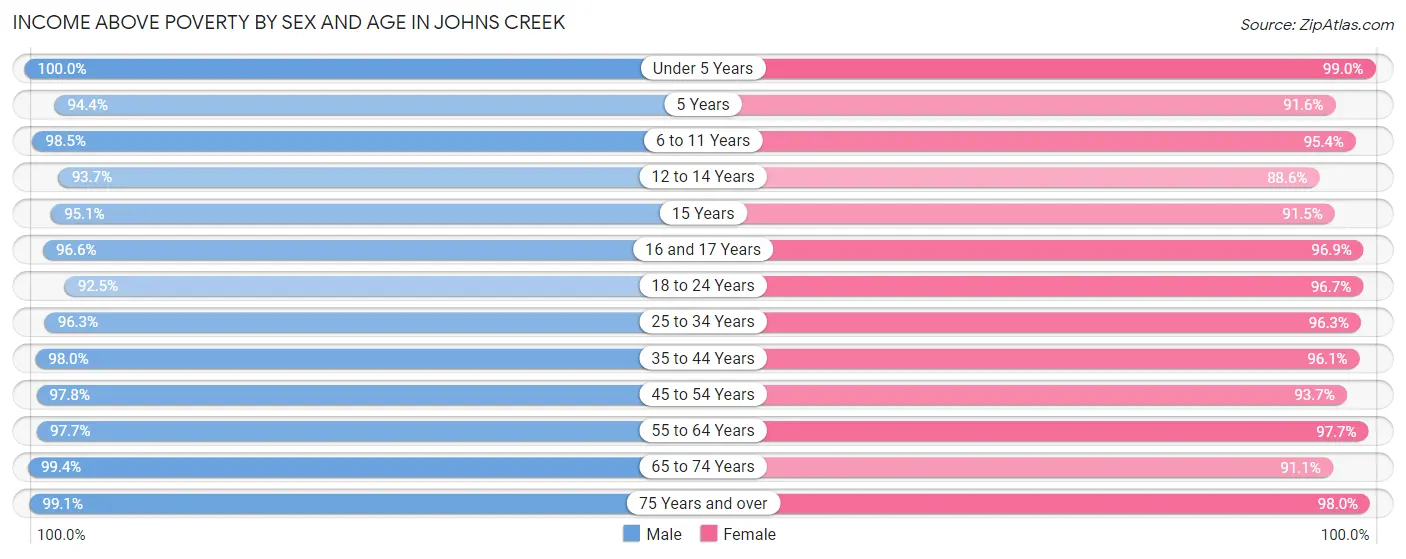
| Age Bracket | Male | Female |
| Under 5 Years | 1,719 (100.0%) | 1,771 (99.0%) |
| 5 Years | 389 (94.4%) | 294 (91.6%) |
| 6 to 11 Years | 3,699 (98.5%) | 3,450 (95.4%) |
| 12 to 14 Years | 2,275 (93.7%) | 1,790 (88.6%) |
| 15 Years | 922 (95.1%) | 622 (91.5%) |
| 16 and 17 Years | 1,902 (96.6%) | 1,450 (96.9%) |
| 18 to 24 Years | 2,686 (92.5%) | 2,188 (96.7%) |
| 25 to 34 Years | 2,820 (96.3%) | 3,444 (96.3%) |
| 35 to 44 Years | 5,263 (98.0%) | 6,440 (96.1%) |
| 45 to 54 Years | 7,613 (97.8%) | 6,802 (93.7%) |
| 55 to 64 Years | 5,820 (97.7%) | 5,865 (97.7%) |
| 65 to 74 Years | 2,833 (99.4%) | 3,237 (91.1%) |
| 75 Years and over | 1,385 (99.1%) | 1,933 (98.0%) |
| Total | 39,326 (97.2%) | 39,286 (95.2%) |
Income Below Poverty Among Married-Couple Families in Johns Creek
The poverty statistics for married-couple families in Johns Creek show that 1.1% or 219 of the total 19,728 families live below the poverty line. Families with 1 or 2 children have the highest poverty rate of 1.5%, comprising of 122 families. On the other hand, families with 5 or more children have the lowest poverty rate of 0.0%, which includes 0 families.
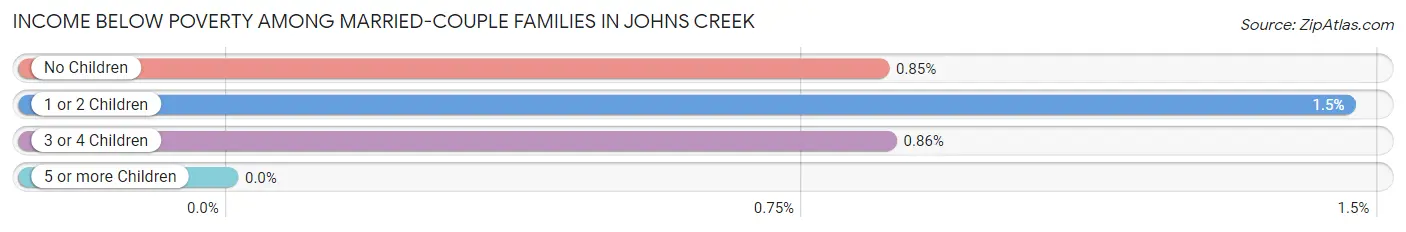
| Children | Above Poverty | Below Poverty |
| No Children | 9,862 (99.2%) | 85 (0.9%) |
| 1 or 2 Children | 8,209 (98.5%) | 122 (1.5%) |
| 3 or 4 Children | 1,383 (99.1%) | 12 (0.9%) |
| 5 or more Children | 55 (100.0%) | 0 (0.0%) |
| Total | 19,509 (98.9%) | 219 (1.1%) |
Income Below Poverty Among Single-Parent Households in Johns Creek
According to the poverty data in Johns Creek, 7.1% or 54 single-father households and 13.7% or 343 single-mother households are living below the poverty line. Among single-father households, those with 1 or 2 children have the highest poverty rate, with 54 households (11.9%) experiencing poverty. Likewise, among single-mother households, those with 3 or 4 children have the highest poverty rate, with 67 households (62.0%) falling below the poverty line.
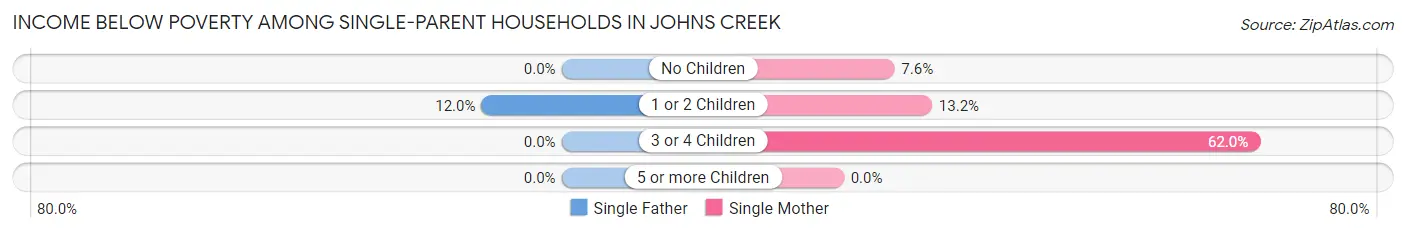
| Children | Single Father | Single Mother |
| No Children | 0 (0.0%) | 54 (7.6%) |
| 1 or 2 Children | 54 (11.9%) | 222 (13.2%) |
| 3 or 4 Children | 0 (0.0%) | 67 (62.0%) |
| 5 or more Children | 0 (0.0%) | 0 (0.0%) |
| Total | 54 (7.1%) | 343 (13.7%) |
Income Below Poverty Among Married-Couple vs Single-Parent Households in Johns Creek
The poverty data for Johns Creek shows that 219 of the married-couple family households (1.1%) and 397 of the single-parent households (12.1%) are living below the poverty level. Within the married-couple family households, those with 1 or 2 children have the highest poverty rate, with 122 households (1.5%) falling below the poverty line. Among the single-parent households, those with 3 or 4 children have the highest poverty rate, with 67 household (37.2%) living below poverty.
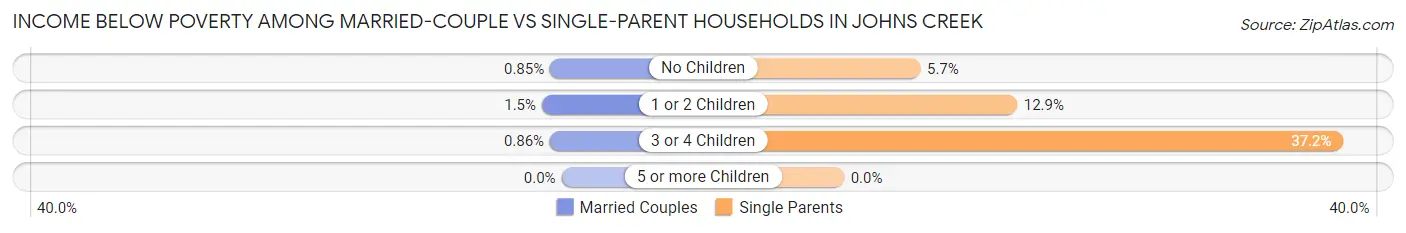
| Children | Married-Couple Families | Single-Parent Households |
| No Children | 85 (0.9%) | 54 (5.7%) |
| 1 or 2 Children | 122 (1.5%) | 276 (12.9%) |
| 3 or 4 Children | 12 (0.9%) | 67 (37.2%) |
| 5 or more Children | 0 (0.0%) | 0 (0.0%) |
| Total | 219 (1.1%) | 397 (12.1%) |
Race in Johns Creek
The most populous races in Johns Creek are White / Caucasian (43,426 | 52.8%), Asian (22,294 | 27.1%), and Black / African American (9,049 | 11.0%).
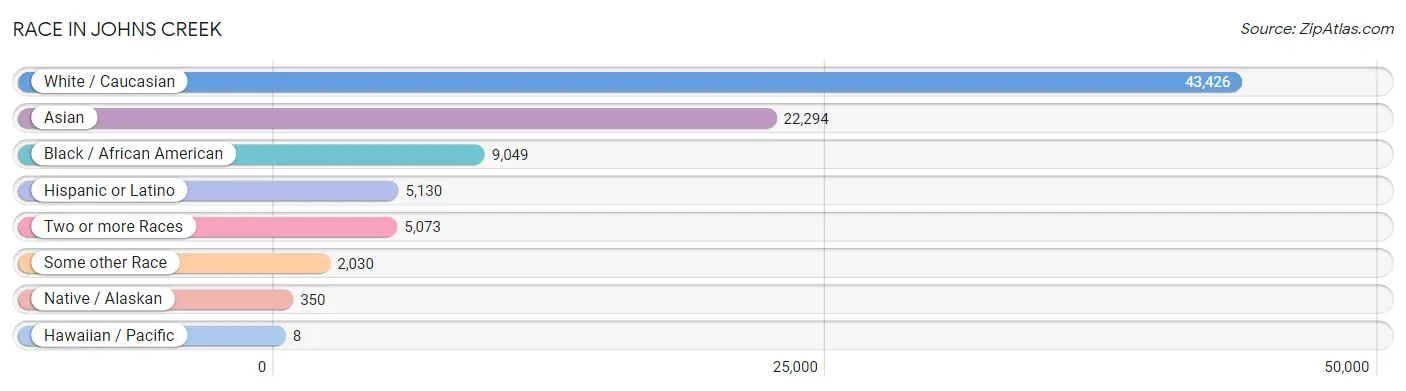
| Race | # Population | % Population |
| Asian | 22,294 | 27.1% |
| Black / African American | 9,049 | 11.0% |
| Hawaiian / Pacific | 8 | 0.0% |
| Hispanic or Latino | 5,130 | 6.2% |
| Native / Alaskan | 350 | 0.4% |
| White / Caucasian | 43,426 | 52.8% |
| Two or more Races | 5,073 | 6.2% |
| Some other Race | 2,030 | 2.5% |
| Total | 82,230 | 100.0% |
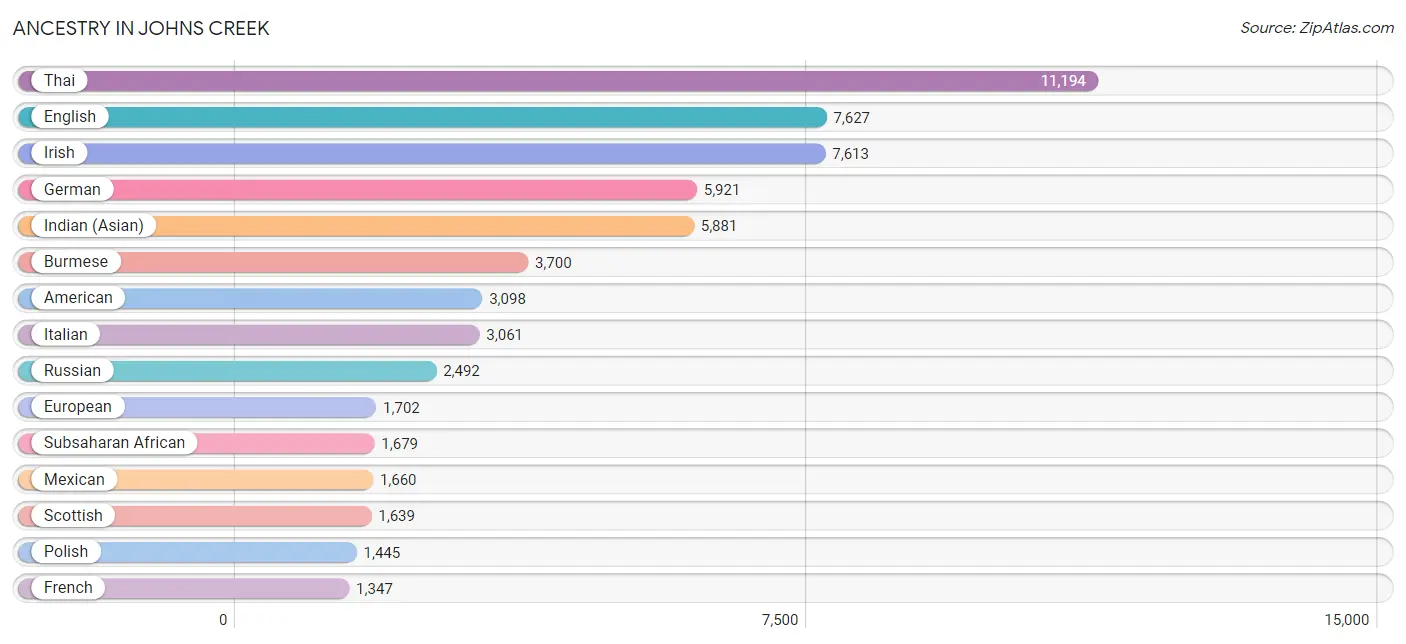
Ancestry in Johns Creek
The most populous ancestries reported in Johns Creek are Thai (11,194 | 13.6%), English (7,627 | 9.3%), Irish (7,613 | 9.3%), German (5,921 | 7.2%), and Indian (Asian) (5,881 | 7.1%), together accounting for 46.5% of all Johns Creek residents.
| Ancestry | # Population | % Population |
| African | 796 | 1.0% |
| Albanian | 66 | 0.1% |
| American | 3,098 | 3.8% |
| Arab | 995 | 1.2% |
| Argentinean | 67 | 0.1% |
| Armenian | 13 | 0.0% |
| Australian | 46 | 0.1% |
| Austrian | 272 | 0.3% |
| Bahamian | 98 | 0.1% |
| Bangladeshi | 35 | 0.0% |
| Basque | 7 | 0.0% |
| Belgian | 26 | 0.0% |
| Bhutanese | 429 | 0.5% |
| Brazilian | 547 | 0.7% |
| British | 870 | 1.1% |
| Bulgarian | 171 | 0.2% |
| Burmese | 3,700 | 4.5% |
| Canadian | 117 | 0.1% |
| Celtic | 8 | 0.0% |
| Central American | 714 | 0.9% |
| Central American Indian | 430 | 0.5% |
| Cherokee | 140 | 0.2% |
| Chilean | 43 | 0.1% |
| Chippewa | 38 | 0.1% |
| Colombian | 349 | 0.4% |
| Costa Rican | 16 | 0.0% |
| Croatian | 66 | 0.1% |
| Cuban | 276 | 0.3% |
| Czech | 56 | 0.1% |
| Czechoslovakian | 46 | 0.1% |
| Danish | 189 | 0.2% |
| Dominican | 28 | 0.0% |
| Dutch | 249 | 0.3% |
| Eastern European | 476 | 0.6% |
| Ecuadorian | 40 | 0.1% |
| Egyptian | 57 | 0.1% |
| English | 7,627 | 9.3% |
| Ethiopian | 71 | 0.1% |
| European | 1,702 | 2.1% |
| Filipino | 280 | 0.3% |
| Finnish | 62 | 0.1% |
| French | 1,347 | 1.6% |
| French American Indian | 10 | 0.0% |
| French Canadian | 230 | 0.3% |
| German | 5,921 | 7.2% |
| Ghanaian | 12 | 0.0% |
| Greek | 418 | 0.5% |
| Guatemalan | 68 | 0.1% |
| Guyanese | 6 | 0.0% |
| Haitian | 525 | 0.6% |
| Honduran | 5 | 0.0% |
| Hungarian | 367 | 0.4% |
| Indian (Asian) | 5,881 | 7.1% |
| Iranian | 628 | 0.8% |
| Irish | 7,613 | 9.3% |
| Iroquois | 14 | 0.0% |
| Israeli | 51 | 0.1% |
| Italian | 3,061 | 3.7% |
| Jamaican | 547 | 0.7% |
| Japanese | 171 | 0.2% |
| Jordanian | 56 | 0.1% |
| Kenyan | 43 | 0.1% |
| Korean | 785 | 0.9% |
| Laotian | 17 | 0.0% |
| Latvian | 30 | 0.0% |
| Lebanese | 173 | 0.2% |
| Liberian | 49 | 0.1% |
| Lithuanian | 211 | 0.3% |
| Luxembourger | 16 | 0.0% |
| Malaysian | 94 | 0.1% |
| Mexican | 1,660 | 2.0% |
| Mexican American Indian | 38 | 0.1% |
| Moroccan | 121 | 0.2% |
| Navajo | 12 | 0.0% |
| Nicaraguan | 55 | 0.1% |
| Nigerian | 469 | 0.6% |
| Northern European | 126 | 0.2% |
| Norwegian | 535 | 0.6% |
| Pakistani | 46 | 0.1% |
| Palestinian | 39 | 0.1% |
| Panamanian | 73 | 0.1% |
| Pennsylvania German | 19 | 0.0% |
| Peruvian | 144 | 0.2% |
| Polish | 1,445 | 1.8% |
| Portuguese | 492 | 0.6% |
| Puerto Rican | 687 | 0.8% |
| Romanian | 60 | 0.1% |
| Russian | 2,492 | 3.0% |
| Salvadoran | 497 | 0.6% |
| Scandinavian | 168 | 0.2% |
| Scotch-Irish | 699 | 0.9% |
| Scottish | 1,639 | 2.0% |
| Senegalese | 64 | 0.1% |
| Serbian | 20 | 0.0% |
| Slavic | 29 | 0.0% |
| Slovak | 145 | 0.2% |
| Slovene | 33 | 0.0% |
| South African | 60 | 0.1% |
| South American | 1,167 | 1.4% |
| South American Indian | 13 | 0.0% |
| Spaniard | 57 | 0.1% |
| Spanish | 366 | 0.4% |
| Sri Lankan | 669 | 0.8% |
| Subsaharan African | 1,679 | 2.0% |
| Sudanese | 8 | 0.0% |
| Swedish | 445 | 0.5% |
| Swiss | 123 | 0.2% |
| Syrian | 208 | 0.3% |
| Thai | 11,194 | 13.6% |
| Trinidadian and Tobagonian | 454 | 0.5% |
| Turkish | 81 | 0.1% |
| Ukrainian | 312 | 0.4% |
| Venezuelan | 457 | 0.6% |
| Vietnamese | 64 | 0.1% |
| Welsh | 320 | 0.4% |
| West Indian | 132 | 0.2% |
| Yugoslavian | 237 | 0.3% | View All 117 Rows |
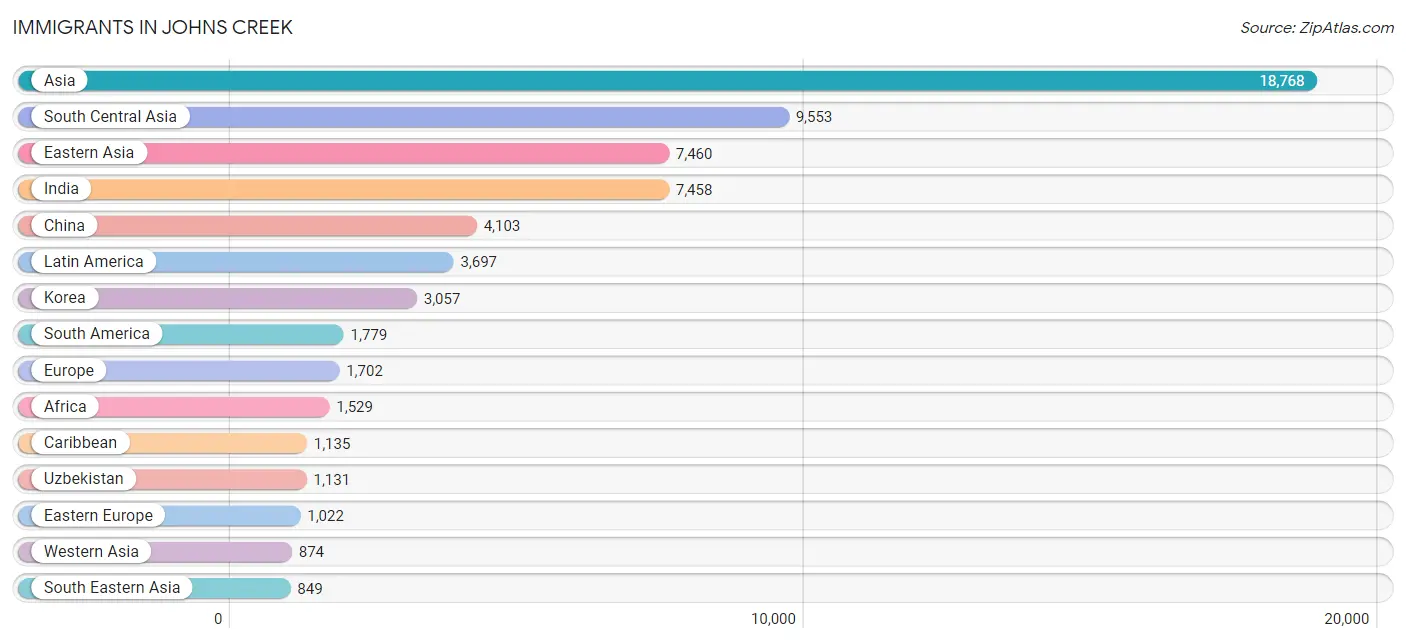
Immigrants in Johns Creek
The most numerous immigrant groups reported in Johns Creek came from Asia (18,768 | 22.8%), South Central Asia (9,553 | 11.6%), Eastern Asia (7,460 | 9.1%), India (7,458 | 9.1%), and China (4,103 | 5.0%), together accounting for 57.6% of all Johns Creek residents.
| Immigration Origin | # Population | % Population |
| Africa | 1,529 | 1.9% |
| Argentina | 38 | 0.1% |
| Asia | 18,768 | 22.8% |
| Australia | 112 | 0.1% |
| Bahamas | 19 | 0.0% |
| Bangladesh | 63 | 0.1% |
| Belarus | 18 | 0.0% |
| Belgium | 7 | 0.0% |
| Bolivia | 11 | 0.0% |
| Bosnia and Herzegovina | 94 | 0.1% |
| Brazil | 617 | 0.7% |
| Bulgaria | 110 | 0.1% |
| Cambodia | 87 | 0.1% |
| Canada | 324 | 0.4% |
| Caribbean | 1,135 | 1.4% |
| Central America | 783 | 0.9% |
| Chile | 3 | 0.0% |
| China | 4,103 | 5.0% |
| Colombia | 206 | 0.3% |
| Congo | 35 | 0.0% |
| Costa Rica | 16 | 0.0% |
| Cuba | 73 | 0.1% |
| Eastern Africa | 333 | 0.4% |
| Eastern Asia | 7,460 | 9.1% |
| Eastern Europe | 1,022 | 1.2% |
| Ecuador | 34 | 0.0% |
| Egypt | 49 | 0.1% |
| El Salvador | 196 | 0.2% |
| England | 44 | 0.1% |
| Ethiopia | 46 | 0.1% |
| Europe | 1,702 | 2.1% |
| France | 23 | 0.0% |
| Germany | 69 | 0.1% |
| Ghana | 12 | 0.0% |
| Greece | 32 | 0.0% |
| Guatemala | 42 | 0.1% |
| Guyana | 20 | 0.0% |
| Haiti | 349 | 0.4% |
| Hong Kong | 191 | 0.2% |
| Hungary | 25 | 0.0% |
| India | 7,458 | 9.1% |
| Indonesia | 17 | 0.0% |
| Iran | 448 | 0.5% |
| Iraq | 160 | 0.2% |
| Ireland | 11 | 0.0% |
| Israel | 123 | 0.2% |
| Italy | 14 | 0.0% |
| Jamaica | 575 | 0.7% |
| Japan | 300 | 0.4% |
| Jordan | 79 | 0.1% |
| Kenya | 88 | 0.1% |
| Korea | 3,057 | 3.7% |
| Kuwait | 60 | 0.1% |
| Laos | 54 | 0.1% |
| Latin America | 3,697 | 4.5% |
| Latvia | 17 | 0.0% |
| Lebanon | 62 | 0.1% |
| Liberia | 57 | 0.1% |
| Lithuania | 70 | 0.1% |
| Malaysia | 10 | 0.0% |
| Mexico | 504 | 0.6% |
| Middle Africa | 43 | 0.1% |
| Moldova | 9 | 0.0% |
| Morocco | 112 | 0.1% |
| Netherlands | 20 | 0.0% |
| Nicaragua | 7 | 0.0% |
| Nigeria | 281 | 0.3% |
| Northern Africa | 180 | 0.2% |
| Northern Europe | 481 | 0.6% |
| Oceania | 132 | 0.2% |
| Pakistan | 194 | 0.2% |
| Panama | 18 | 0.0% |
| Peru | 129 | 0.2% |
| Philippines | 292 | 0.4% |
| Poland | 38 | 0.1% |
| Romania | 30 | 0.0% |
| Russia | 263 | 0.3% |
| Saudi Arabia | 26 | 0.0% |
| Scotland | 11 | 0.0% |
| Senegal | 29 | 0.0% |
| Sierra Leone | 311 | 0.4% |
| Singapore | 41 | 0.1% |
| South Africa | 266 | 0.3% |
| South America | 1,779 | 2.2% |
| South Central Asia | 9,553 | 11.6% |
| South Eastern Asia | 849 | 1.0% |
| Southern Europe | 64 | 0.1% |
| Spain | 18 | 0.0% |
| Sri Lanka | 223 | 0.3% |
| Sudan | 8 | 0.0% |
| Syria | 132 | 0.2% |
| Taiwan | 523 | 0.6% |
| Thailand | 12 | 0.0% |
| Trinidad and Tobago | 106 | 0.1% |
| Turkey | 100 | 0.1% |
| Uganda | 7 | 0.0% |
| Ukraine | 308 | 0.4% |
| Uzbekistan | 1,131 | 1.4% |
| Venezuela | 714 | 0.9% |
| Vietnam | 336 | 0.4% |
| Western Africa | 707 | 0.9% |
| Western Asia | 874 | 1.1% |
| Western Europe | 135 | 0.2% |
| Zaire | 8 | 0.0% | View All 104 Rows |
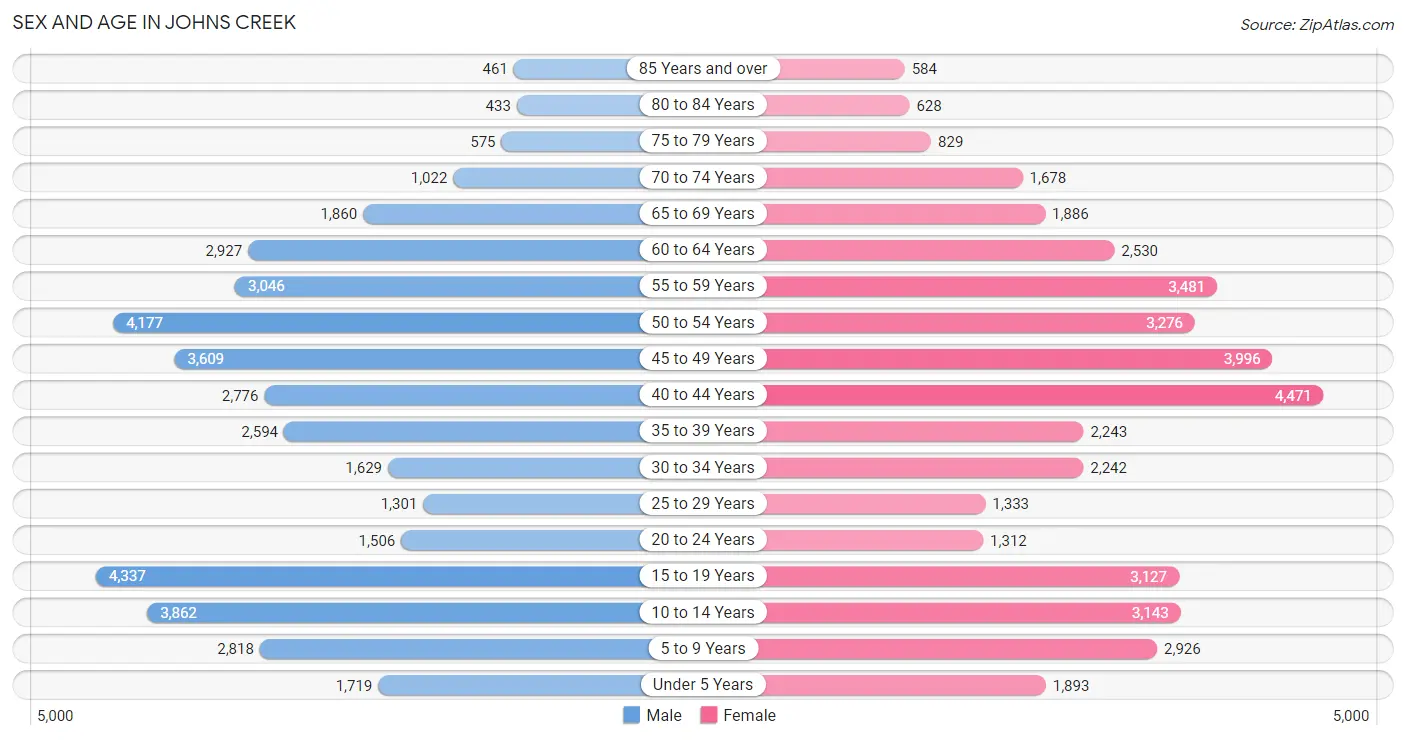
Sex and Age in Johns Creek
Sex and Age in Johns Creek
The most populous age groups in Johns Creek are 15 to 19 Years (4,337 | 10.7%) for men and 40 to 44 Years (4,471 | 10.7%) for women.
| Age Bracket | Male | Female |
| Under 5 Years | 1,719 (4.2%) | 1,893 (4.5%) |
| 5 to 9 Years | 2,818 (6.9%) | 2,926 (7.0%) |
| 10 to 14 Years | 3,862 (9.5%) | 3,143 (7.6%) |
| 15 to 19 Years | 4,337 (10.7%) | 3,127 (7.5%) |
| 20 to 24 Years | 1,506 (3.7%) | 1,312 (3.2%) |
| 25 to 29 Years | 1,301 (3.2%) | 1,333 (3.2%) |
| 30 to 34 Years | 1,629 (4.0%) | 2,242 (5.4%) |
| 35 to 39 Years | 2,594 (6.4%) | 2,243 (5.4%) |
| 40 to 44 Years | 2,776 (6.8%) | 4,471 (10.7%) |
| 45 to 49 Years | 3,609 (8.9%) | 3,996 (9.6%) |
| 50 to 54 Years | 4,177 (10.3%) | 3,276 (7.9%) |
| 55 to 59 Years | 3,046 (7.5%) | 3,481 (8.4%) |
| 60 to 64 Years | 2,927 (7.2%) | 2,530 (6.1%) |
| 65 to 69 Years | 1,860 (4.6%) | 1,886 (4.5%) |
| 70 to 74 Years | 1,022 (2.5%) | 1,678 (4.0%) |
| 75 to 79 Years | 575 (1.4%) | 829 (2.0%) |
| 80 to 84 Years | 433 (1.1%) | 628 (1.5%) |
| 85 Years and over | 461 (1.1%) | 584 (1.4%) |
| Total | 40,652 (100.0%) | 41,578 (100.0%) |
Families and Households in Johns Creek
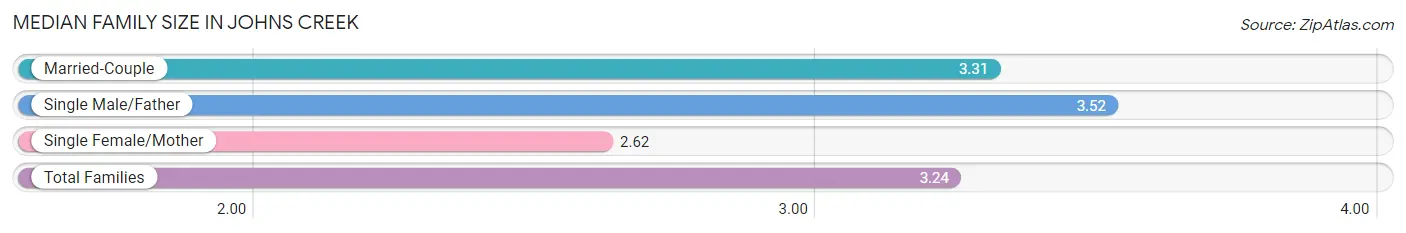
Median Family Size in Johns Creek
The median family size in Johns Creek is 3.24 persons per family, with single male/father families (759 | 3.3%) accounting for the largest median family size of 3.52 persons per family. On the other hand, single female/mother families (2,510 | 10.9%) represent the smallest median family size with 2.62 persons per family.
| Family Type | # Families | Family Size |
| Married-Couple | 19,728 (85.8%) | 3.31 |
| Single Male/Father | 759 (3.3%) | 3.52 |
| Single Female/Mother | 2,510 (10.9%) | 2.62 |
| Total Families | 22,997 (100.0%) | 3.24 |
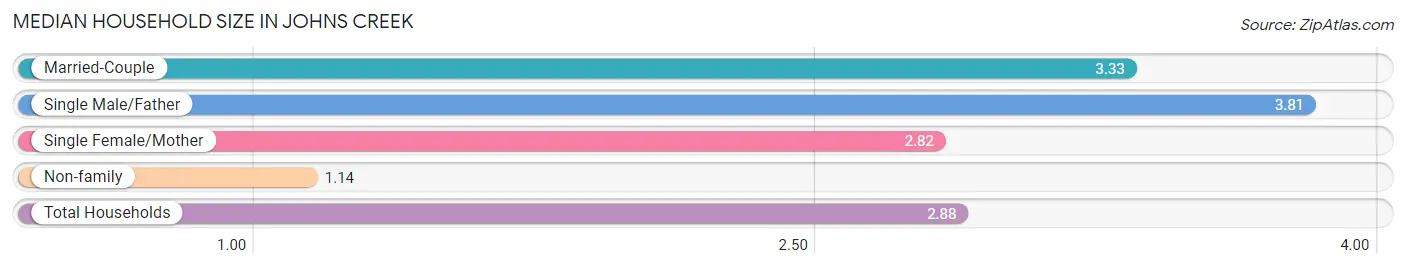
Median Household Size in Johns Creek
The median household size in Johns Creek is 2.88 persons per household, with single male/father households (759 | 2.7%) accounting for the largest median household size of 3.81 persons per household. non-family households (5,442 | 19.1%) represent the smallest median household size with 1.14 persons per household.
| Household Type | # Households | Household Size |
| Married-Couple | 19,728 (69.4%) | 3.33 |
| Single Male/Father | 759 (2.7%) | 3.81 |
| Single Female/Mother | 2,510 (8.8%) | 2.82 |
| Non-family | 5,442 (19.1%) | 1.14 |
| Total Households | 28,439 (100.0%) | 2.88 |
Household Size by Marriage Status in Johns Creek
Out of a total of 28,439 households in Johns Creek, 22,997 (80.9%) are family households, while 5,442 (19.1%) are nonfamily households. The most numerous type of family households are 2-person households, comprising 8,594, and the most common type of nonfamily households are 1-person households, comprising 4,724.
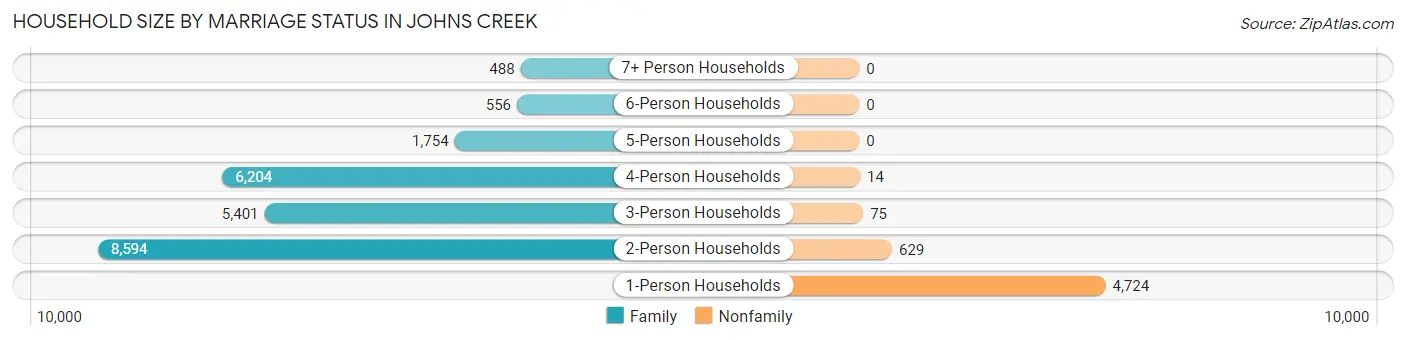
| Household Size | Family Households | Nonfamily Households |
| 1-Person Households | - | 4,724 (16.6%) |
| 2-Person Households | 8,594 (30.2%) | 629 (2.2%) |
| 3-Person Households | 5,401 (19.0%) | 75 (0.3%) |
| 4-Person Households | 6,204 (21.8%) | 14 (0.1%) |
| 5-Person Households | 1,754 (6.2%) | 0 (0.0%) |
| 6-Person Households | 556 (2.0%) | 0 (0.0%) |
| 7+ Person Households | 488 (1.7%) | 0 (0.0%) |
| Total | 22,997 (80.9%) | 5,442 (19.1%) |
Female Fertility in Johns Creek
Fertility by Age in Johns Creek
Average fertility rate in Johns Creek is 38.0 births per 1,000 women. Women in the age bracket of 20 to 34 years have the highest fertility rate with 81.0 births per 1,000 women. Women in the age bracket of 20 to 34 years acount for 54.5% of all women with births.
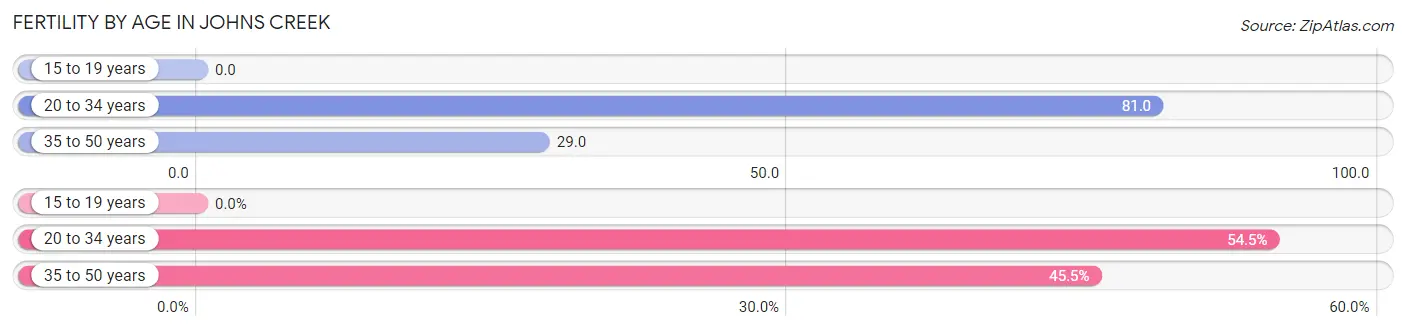
| Age Bracket | Women with Births | Births / 1,000 Women |
| 15 to 19 years | 0 (0.0%) | 0.0 |
| 20 to 34 years | 397 (54.5%) | 81.0 |
| 35 to 50 years | 331 (45.5%) | 29.0 |
| Total | 728 (100.0%) | 38.0 |
Fertility by Age by Marriage Status in Johns Creek
99.0% of women with births (728) in Johns Creek are married. The highest percentage of unmarried women with births falls into 20 to 34 years age bracket with 1.8% of them unmarried at the time of birth, while the lowest percentage of unmarried women with births belong to 35 to 50 years age bracket with 0.0% of them unmarried.
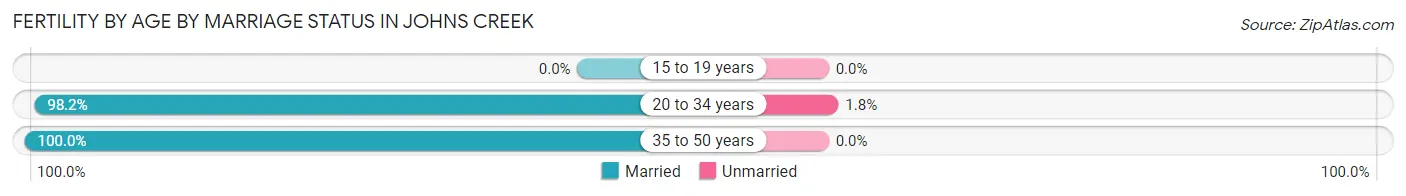
| Age Bracket | Married | Unmarried |
| 15 to 19 years | 0 (0.0%) | 0 (0.0%) |
| 20 to 34 years | 390 (98.2%) | 7 (1.8%) |
| 35 to 50 years | 331 (100.0%) | 0 (0.0%) |
| Total | 721 (99.0%) | 7 (1.0%) |
Fertility by Education in Johns Creek
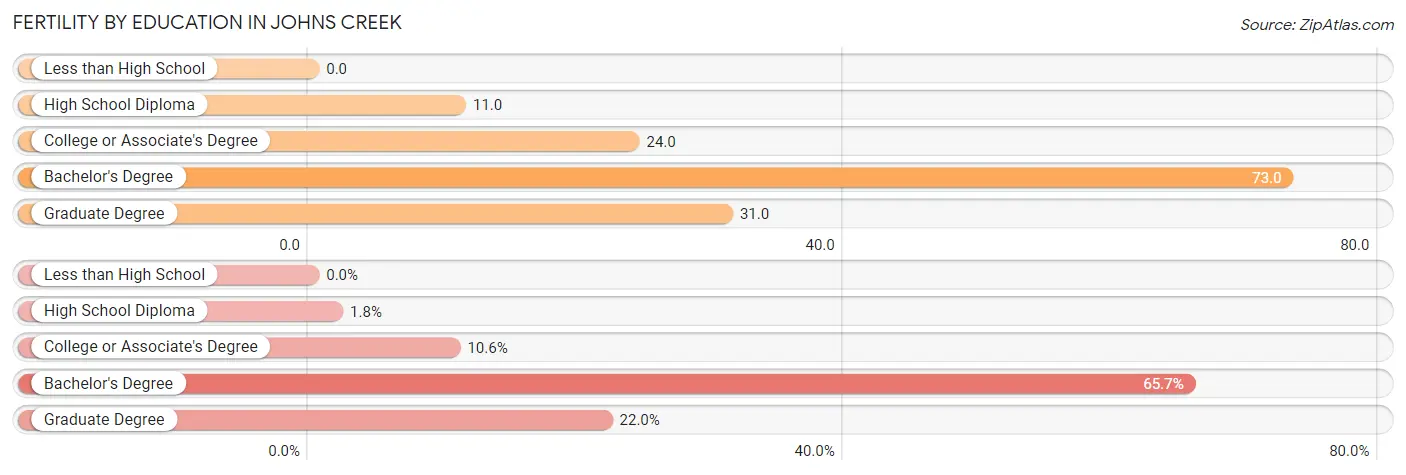
| Educational Attainment | Women with Births | Births / 1,000 Women |
| Less than High School | 0 (0.0%) | 0.0 |
| High School Diploma | 13 (1.8%) | 11.0 |
| College or Associate's Degree | 77 (10.6%) | 24.0 |
| Bachelor's Degree | 478 (65.7%) | 73.0 |
| Graduate Degree | 160 (22.0%) | 31.0 |
| Total | 728 (100.0%) | 38.0 |
Fertility by Education by Marriage Status in Johns Creek
1.0% of women with births in Johns Creek are unmarried. Women with the educational attainment of high school diploma are most likely to be married with 100.0% of them married at childbirth, while women with the educational attainment of graduate degree are least likely to be married with 4.4% of them unmarried at childbirth.
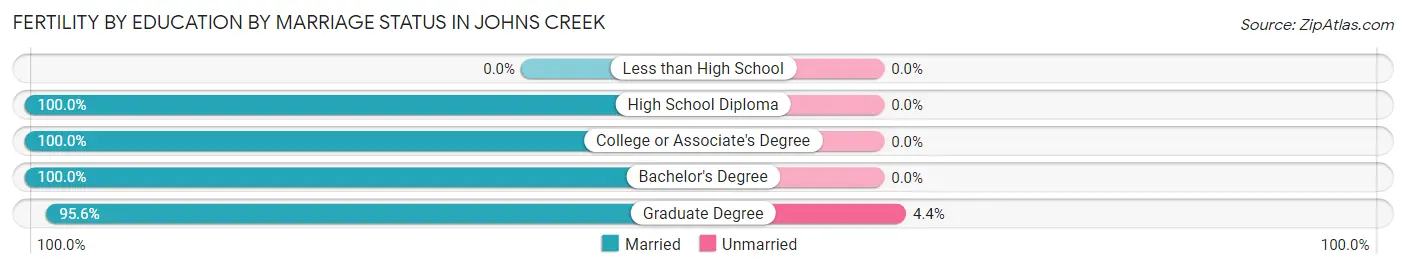
| Educational Attainment | Married | Unmarried |
| Less than High School | 0 (0.0%) | 0 (0.0%) |
| High School Diploma | 13 (100.0%) | 0 (0.0%) |
| College or Associate's Degree | 77 (100.0%) | 0 (0.0%) |
| Bachelor's Degree | 478 (100.0%) | 0 (0.0%) |
| Graduate Degree | 153 (95.6%) | 7 (4.4%) |
| Total | 721 (99.0%) | 7 (1.0%) |
Employment Characteristics in Johns Creek
Employment by Class of Employer in Johns Creek
Among the 39,892 employed individuals in Johns Creek, private company employees (29,714 | 74.5%), self-employed (incorporated) (2,944 | 7.4%), and not-for-profit organizations (2,351 | 5.9%) make up the most common classes of employment.
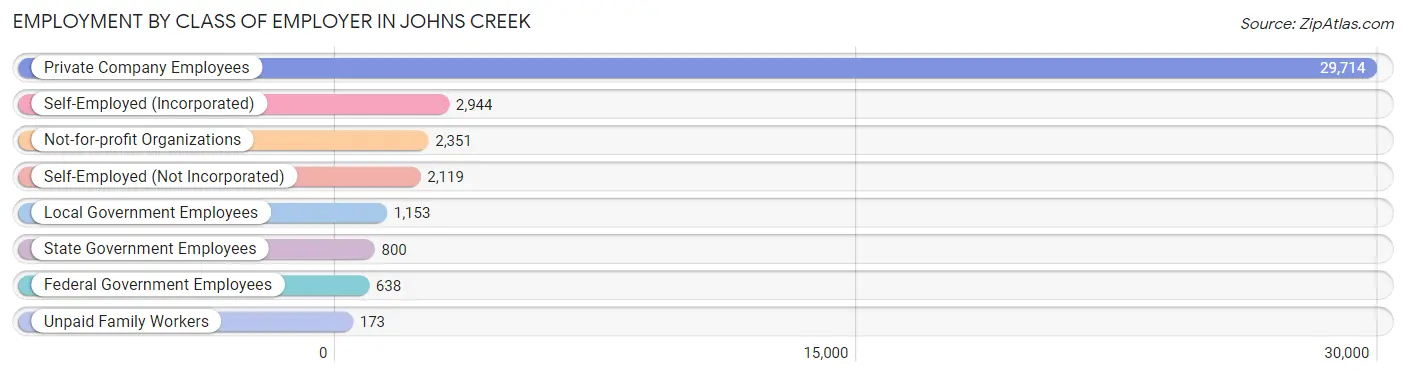
| Employer Class | # Employees | % Employees |
| Private Company Employees | 29,714 | 74.5% |
| Self-Employed (Incorporated) | 2,944 | 7.4% |
| Self-Employed (Not Incorporated) | 2,119 | 5.3% |
| Not-for-profit Organizations | 2,351 | 5.9% |
| Local Government Employees | 1,153 | 2.9% |
| State Government Employees | 800 | 2.0% |
| Federal Government Employees | 638 | 1.6% |
| Unpaid Family Workers | 173 | 0.4% |
| Total | 39,892 | 100.0% |
Employment Status by Age in Johns Creek
According to the labor force statistics for Johns Creek, out of the total population over 16 years of age (64,219), 66.0% or 42,385 individuals are in the labor force, with 3.7% or 1,568 of them unemployed. The age group with the highest labor force participation rate is 45 to 54 years, with 85.0% or 12,799 individuals in the labor force. Within the labor force, the 20 to 24 years age range has the highest percentage of unemployed individuals, with 12.7% or 223 of them being unemployed.
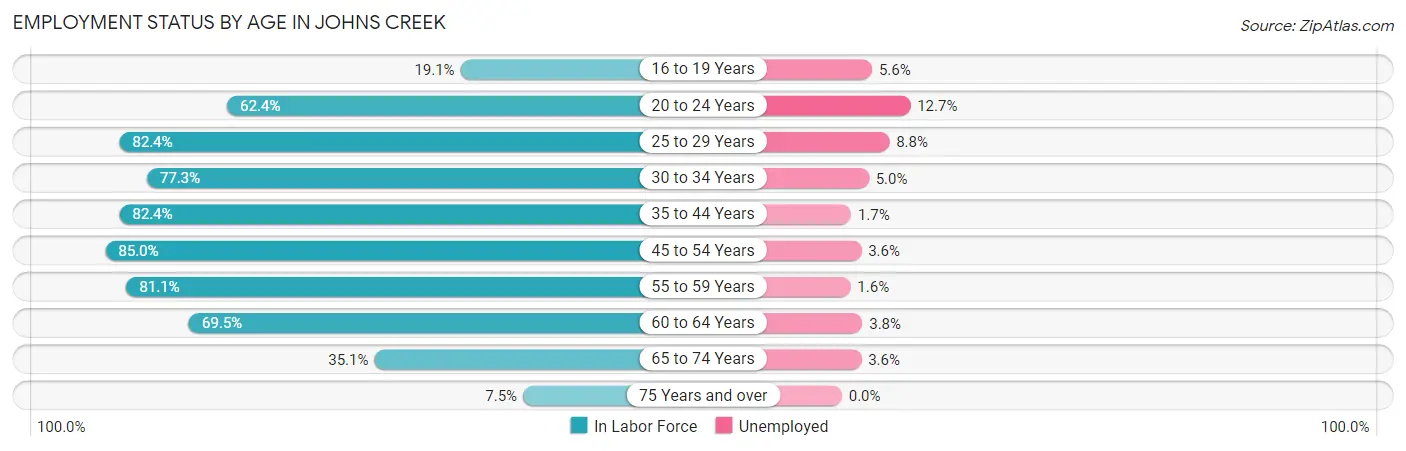
| Age Bracket | In Labor Force | Unemployed |
| 16 to 19 Years | 1,110 (19.1%) | 62 (5.6%) |
| 20 to 24 Years | 1,758 (62.4%) | 223 (12.7%) |
| 25 to 29 Years | 2,170 (82.4%) | 191 (8.8%) |
| 30 to 34 Years | 2,992 (77.3%) | 150 (5.0%) |
| 35 to 44 Years | 9,957 (82.4%) | 169 (1.7%) |
| 45 to 54 Years | 12,799 (85.0%) | 461 (3.6%) |
| 55 to 59 Years | 5,293 (81.1%) | 85 (1.6%) |
| 60 to 64 Years | 3,793 (69.5%) | 144 (3.8%) |
| 65 to 74 Years | 2,263 (35.1%) | 81 (3.6%) |
| 75 Years and over | 263 (7.5%) | 0 (0.0%) |
| Total | 42,385 (66.0%) | 1,568 (3.7%) |
Employment Status by Educational Attainment in Johns Creek
According to labor force statistics for Johns Creek, 81.1% of individuals (37,007) out of the total population between 25 and 64 years of age (45,631) are in the labor force, with 3.2% or 1,184 of them being unemployed. The group with the highest labor force participation rate are those with the educational attainment of bachelor's degree or higher, with 85.3% or 28,276 individuals in the labor force. Within the labor force, individuals with high school diploma education have the highest percentage of unemployment, with 5.8% or 117 of them being unemployed.
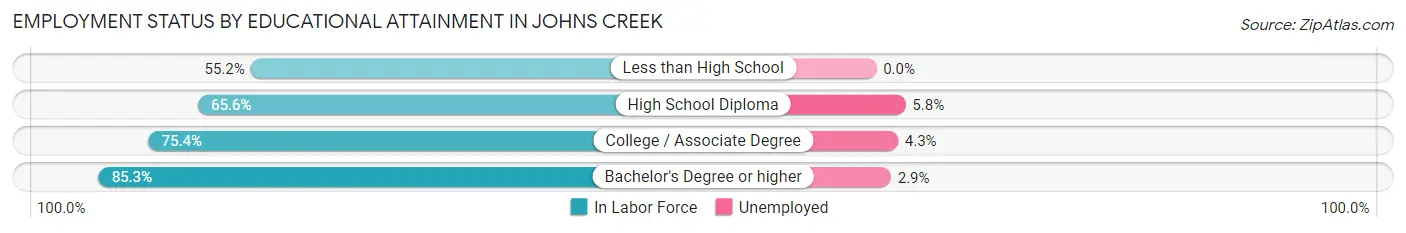
| Educational Attainment | In Labor Force | Unemployed |
| Less than High School | 1,023 (55.2%) | 0 (0.0%) |
| High School Diploma | 2,013 (65.6%) | 178 (5.8%) |
| College / Associate Degree | 5,700 (75.4%) | 325 (4.3%) |
| Bachelor's Degree or higher | 28,276 (85.3%) | 961 (2.9%) |
| Total | 37,007 (81.1%) | 1,460 (3.2%) |
Employment Occupations by Sex in Johns Creek
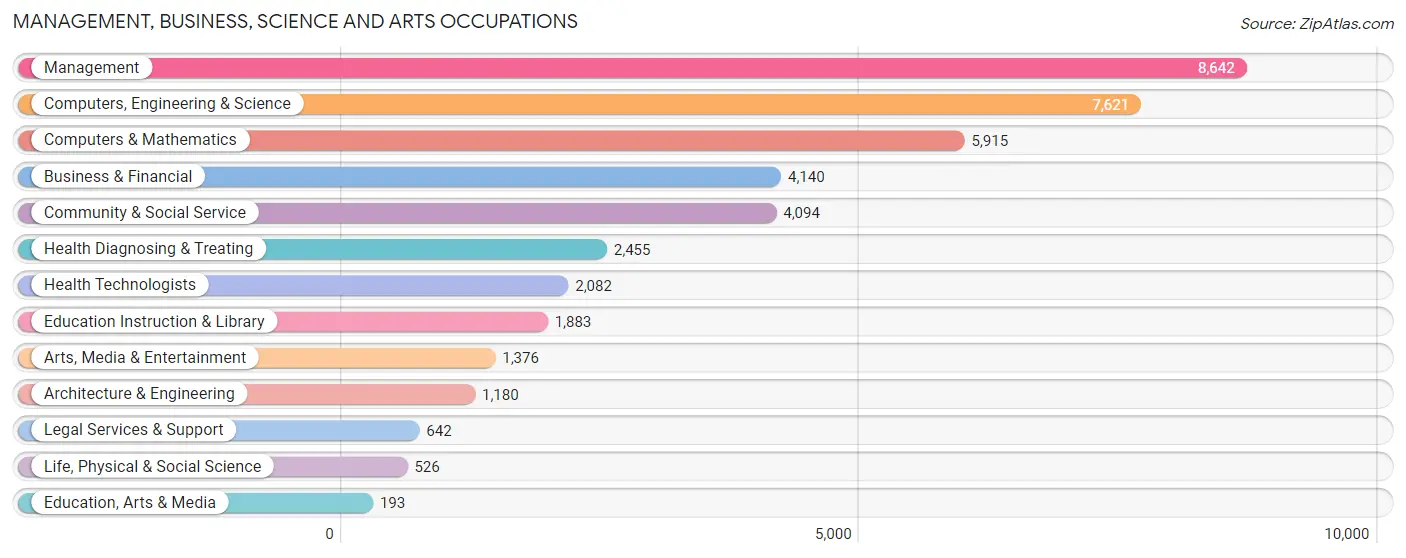
Management, Business, Science and Arts Occupations
The most common Management, Business, Science and Arts occupations in Johns Creek are Management (8,642 | 21.2%), Computers, Engineering & Science (7,621 | 18.7%), Computers & Mathematics (5,915 | 14.5%), Business & Financial (4,140 | 10.1%), and Community & Social Service (4,094 | 10.0%).
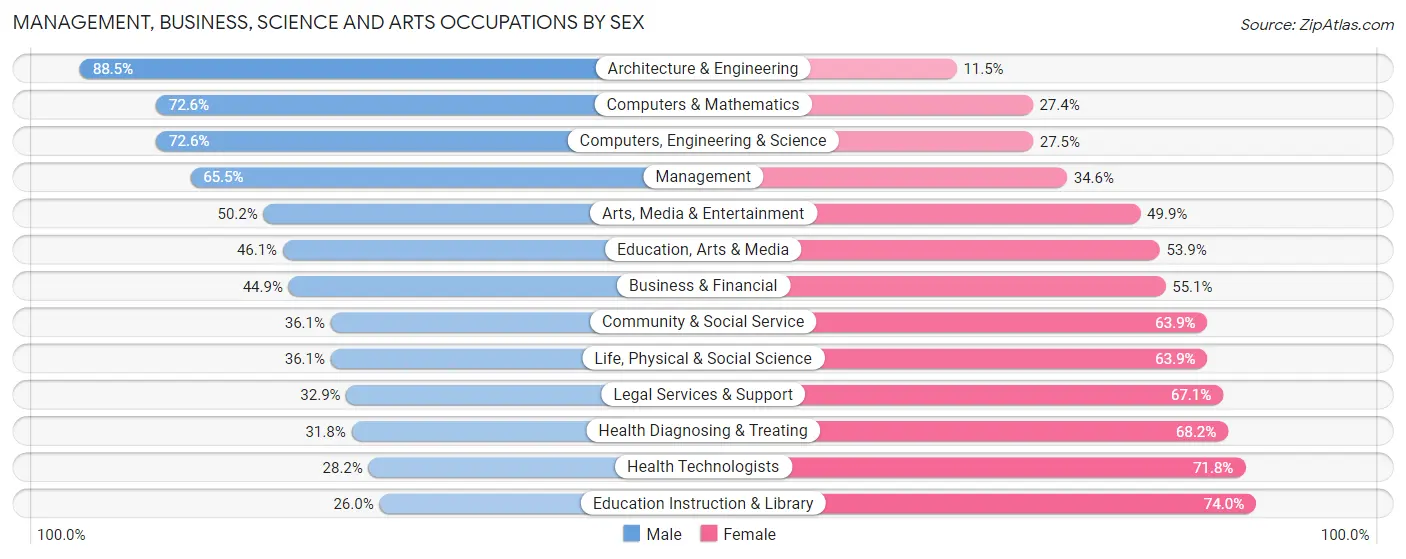
Management, Business, Science and Arts Occupations by Sex
Within the Management, Business, Science and Arts occupations in Johns Creek, the most male-oriented occupations are Architecture & Engineering (88.5%), Computers & Mathematics (72.6%), and Computers, Engineering & Science (72.6%), while the most female-oriented occupations are Education Instruction & Library (74.0%), Health Technologists (71.8%), and Health Diagnosing & Treating (68.2%).
| Occupation | Male | Female |
| Management | 5,656 (65.4%) | 2,986 (34.5%) |
| Business & Financial | 1,859 (44.9%) | 2,281 (55.1%) |
| Computers, Engineering & Science | 5,529 (72.6%) | 2,092 (27.5%) |
| Computers & Mathematics | 4,295 (72.6%) | 1,620 (27.4%) |
| Architecture & Engineering | 1,044 (88.5%) | 136 (11.5%) |
| Life, Physical & Social Science | 190 (36.1%) | 336 (63.9%) |
| Community & Social Service | 1,479 (36.1%) | 2,615 (63.9%) |
| Education, Arts & Media | 89 (46.1%) | 104 (53.9%) |
| Legal Services & Support | 211 (32.9%) | 431 (67.1%) |
| Education Instruction & Library | 489 (26.0%) | 1,394 (74.0%) |
| Arts, Media & Entertainment | 690 (50.1%) | 686 (49.8%) |
| Health Diagnosing & Treating | 781 (31.8%) | 1,674 (68.2%) |
| Health Technologists | 588 (28.2%) | 1,494 (71.8%) |
| Total (Category) | 15,304 (56.8%) | 11,648 (43.2%) |
| Total (Overall) | 22,430 (54.9%) | 18,402 (45.1%) |
Services Occupations
The most common Services occupations in Johns Creek are Food Preparation & Serving (1,218 | 3.0%), Personal Care & Service (514 | 1.3%), Healthcare Support (475 | 1.2%), Cleaning & Maintenance (396 | 1.0%), and Security & Protection (82 | 0.2%).

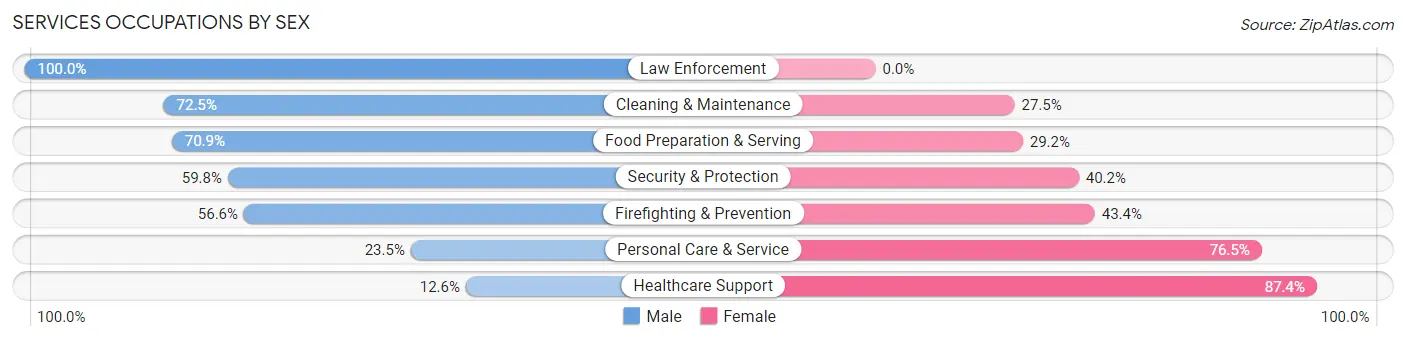
Services Occupations by Sex
Within the Services occupations in Johns Creek, the most male-oriented occupations are Law Enforcement (100.0%), Cleaning & Maintenance (72.5%), and Food Preparation & Serving (70.9%), while the most female-oriented occupations are Healthcare Support (87.4%), Personal Care & Service (76.5%), and Firefighting & Prevention (43.4%).
| Occupation | Male | Female |
| Healthcare Support | 60 (12.6%) | 415 (87.4%) |
| Security & Protection | 49 (59.8%) | 33 (40.2%) |
| Firefighting & Prevention | 43 (56.6%) | 33 (43.4%) |
| Law Enforcement | 6 (100.0%) | 0 (0.0%) |
| Food Preparation & Serving | 863 (70.9%) | 355 (29.1%) |
| Cleaning & Maintenance | 287 (72.5%) | 109 (27.5%) |
| Personal Care & Service | 121 (23.5%) | 393 (76.5%) |
| Total (Category) | 1,380 (51.4%) | 1,305 (48.6%) |
| Total (Overall) | 22,430 (54.9%) | 18,402 (45.1%) |
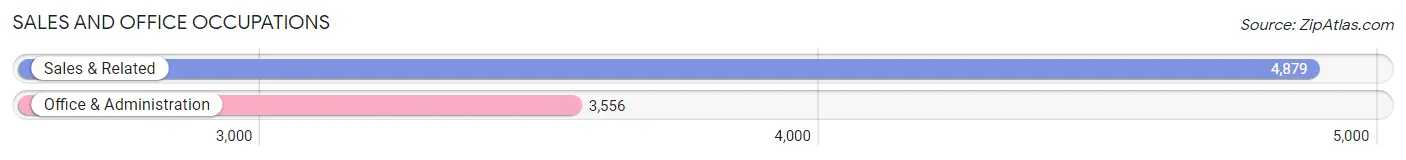
Sales and Office Occupations
The most common Sales and Office occupations in Johns Creek are Sales & Related (4,879 | 11.9%), and Office & Administration (3,556 | 8.7%).
Sales and Office Occupations by Sex
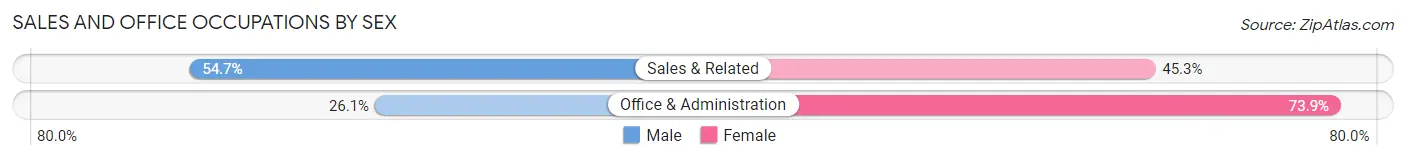
| Occupation | Male | Female |
| Sales & Related | 2,667 (54.7%) | 2,212 (45.3%) |
| Office & Administration | 928 (26.1%) | 2,628 (73.9%) |
| Total (Category) | 3,595 (42.6%) | 4,840 (57.4%) |
| Total (Overall) | 22,430 (54.9%) | 18,402 (45.1%) |
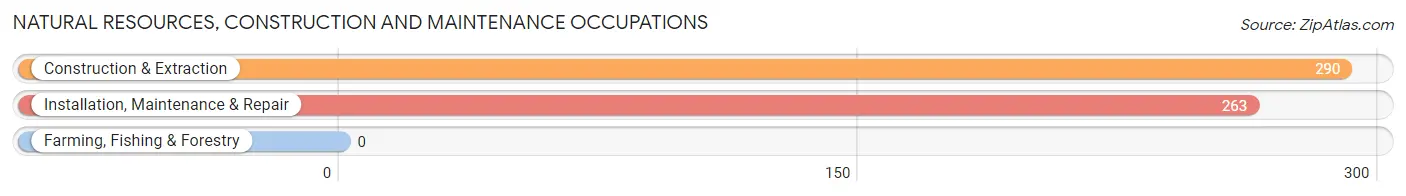
Natural Resources, Construction and Maintenance Occupations
The most common Natural Resources, Construction and Maintenance occupations in Johns Creek are Construction & Extraction (290 | 0.7%), and Installation, Maintenance & Repair (263 | 0.6%).
Natural Resources, Construction and Maintenance Occupations by Sex
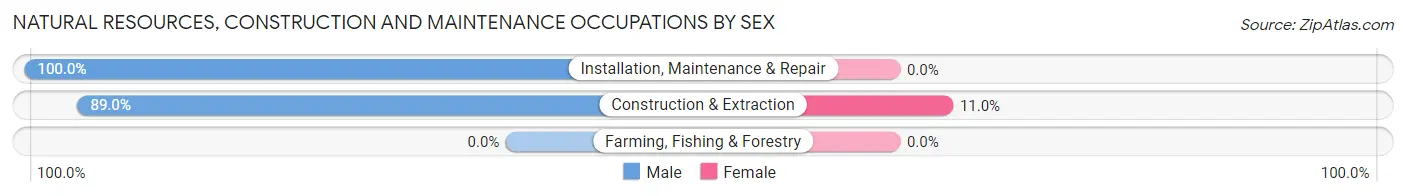
| Occupation | Male | Female |
| Farming, Fishing & Forestry | 0 (0.0%) | 0 (0.0%) |
| Construction & Extraction | 258 (89.0%) | 32 (11.0%) |
| Installation, Maintenance & Repair | 263 (100.0%) | 0 (0.0%) |
| Total (Category) | 521 (94.2%) | 32 (5.8%) |
| Total (Overall) | 22,430 (54.9%) | 18,402 (45.1%) |
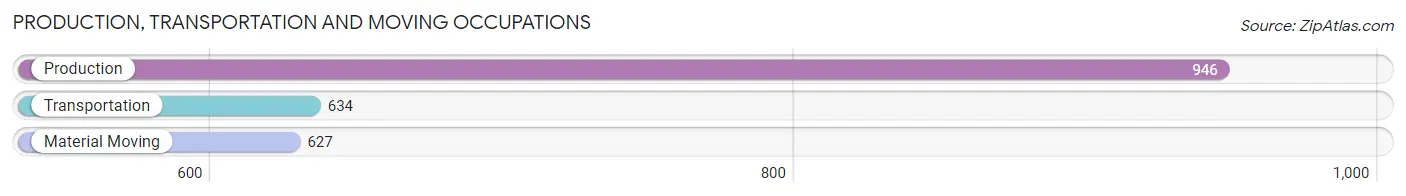
Production, Transportation and Moving Occupations
The most common Production, Transportation and Moving occupations in Johns Creek are Production (946 | 2.3%), Transportation (634 | 1.5%), and Material Moving (627 | 1.5%).
Production, Transportation and Moving Occupations by Sex
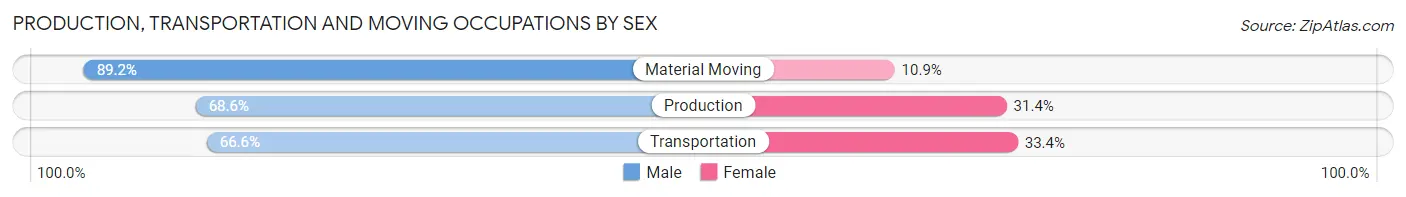
| Occupation | Male | Female |
| Production | 649 (68.6%) | 297 (31.4%) |
| Transportation | 422 (66.6%) | 212 (33.4%) |
| Material Moving | 559 (89.1%) | 68 (10.8%) |
| Total (Category) | 1,630 (73.9%) | 577 (26.1%) |
| Total (Overall) | 22,430 (54.9%) | 18,402 (45.1%) |
Employment Industries by Sex in Johns Creek
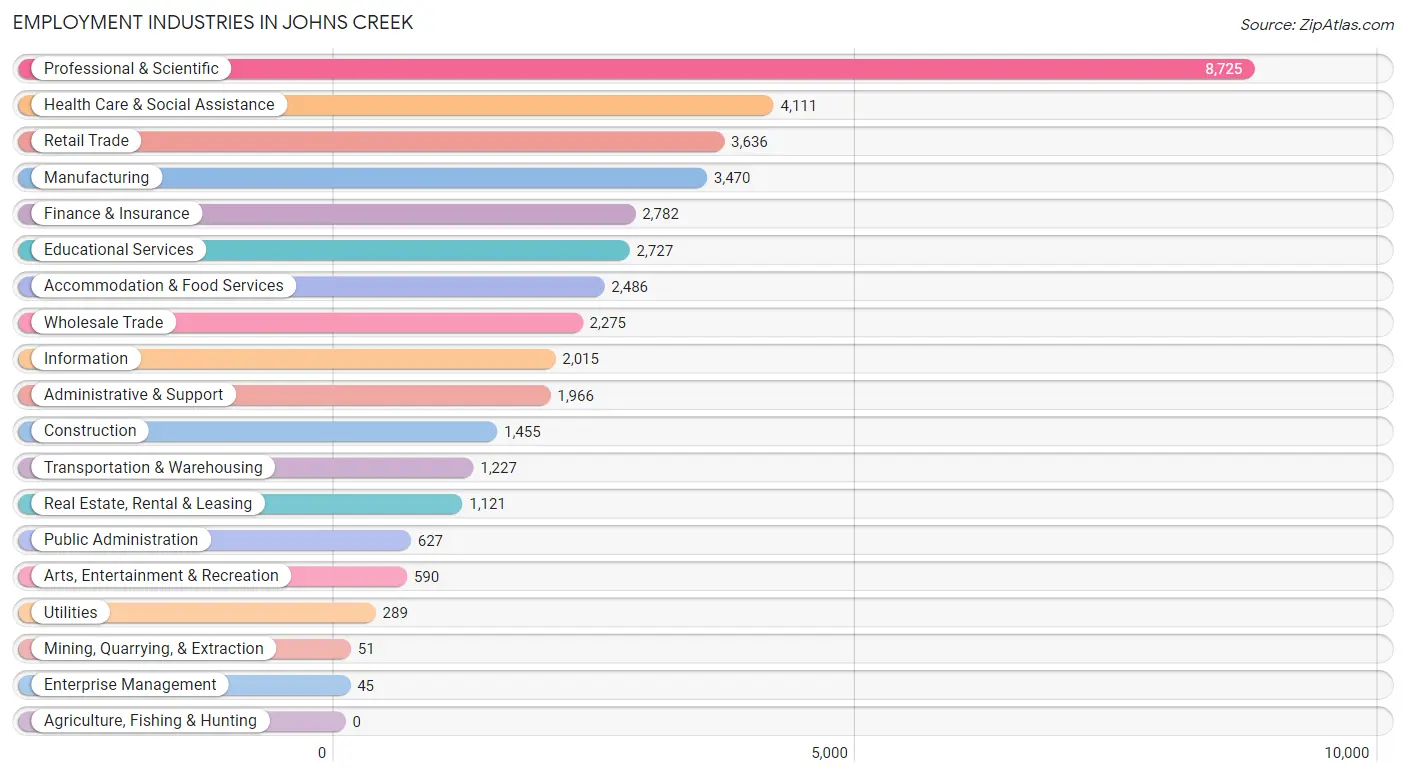
Employment Industries in Johns Creek
The major employment industries in Johns Creek include Professional & Scientific (8,725 | 21.4%), Health Care & Social Assistance (4,111 | 10.1%), Retail Trade (3,636 | 8.9%), Manufacturing (3,470 | 8.5%), and Finance & Insurance (2,782 | 6.8%).
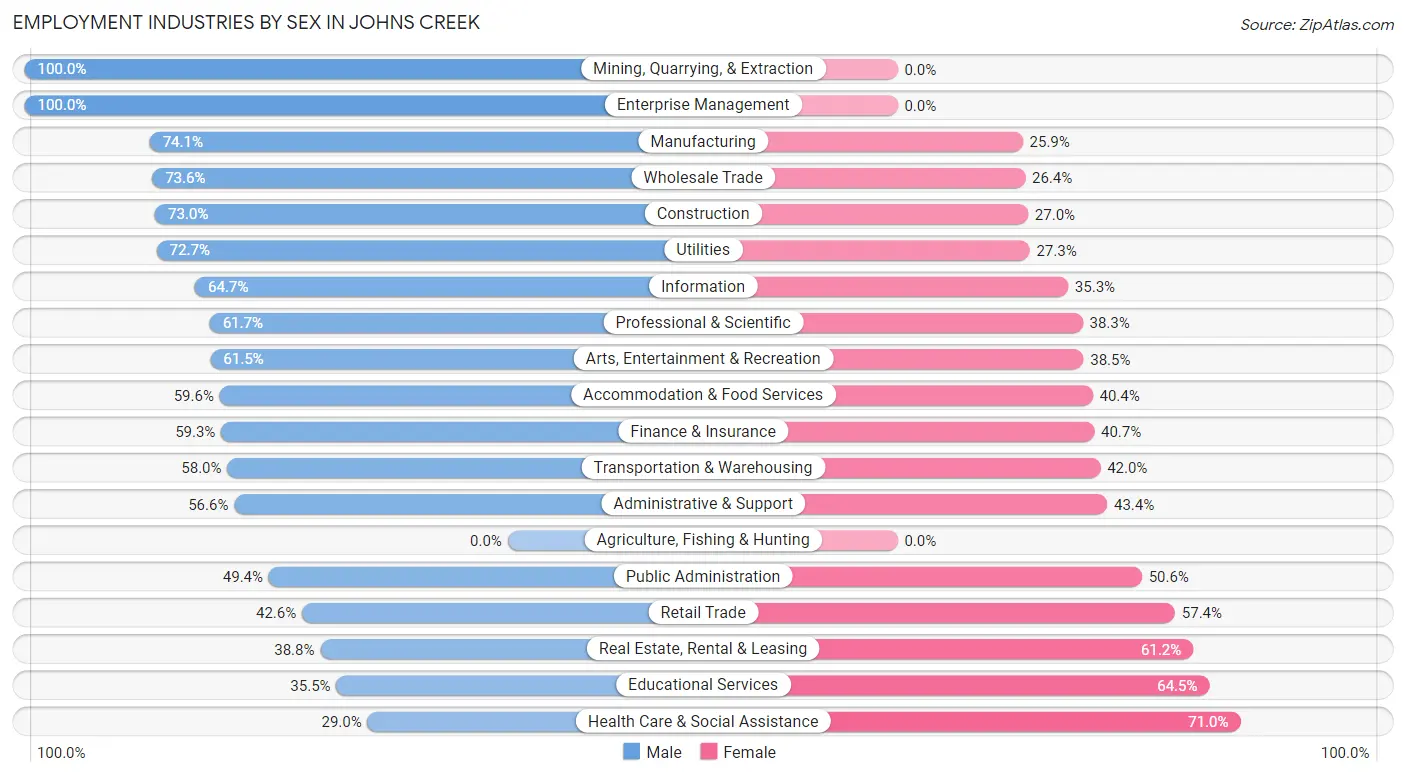
Employment Industries by Sex in Johns Creek
The Johns Creek industries that see more men than women are Mining, Quarrying, & Extraction (100.0%), Enterprise Management (100.0%), and Manufacturing (74.1%), whereas the industries that tend to have a higher number of women are Health Care & Social Assistance (71.0%), Educational Services (64.5%), and Real Estate, Rental & Leasing (61.2%).
| Industry | Male | Female |
| Agriculture, Fishing & Hunting | 0 (0.0%) | 0 (0.0%) |
| Mining, Quarrying, & Extraction | 51 (100.0%) | 0 (0.0%) |
| Construction | 1,062 (73.0%) | 393 (27.0%) |
| Manufacturing | 2,571 (74.1%) | 899 (25.9%) |
| Wholesale Trade | 1,674 (73.6%) | 601 (26.4%) |
| Retail Trade | 1,548 (42.6%) | 2,088 (57.4%) |
| Transportation & Warehousing | 712 (58.0%) | 515 (42.0%) |
| Utilities | 210 (72.7%) | 79 (27.3%) |
| Information | 1,304 (64.7%) | 711 (35.3%) |
| Finance & Insurance | 1,650 (59.3%) | 1,132 (40.7%) |
| Real Estate, Rental & Leasing | 435 (38.8%) | 686 (61.2%) |
| Professional & Scientific | 5,382 (61.7%) | 3,343 (38.3%) |
| Enterprise Management | 45 (100.0%) | 0 (0.0%) |
| Administrative & Support | 1,113 (56.6%) | 853 (43.4%) |
| Educational Services | 967 (35.5%) | 1,760 (64.5%) |
| Health Care & Social Assistance | 1,193 (29.0%) | 2,918 (71.0%) |
| Arts, Entertainment & Recreation | 363 (61.5%) | 227 (38.5%) |
| Accommodation & Food Services | 1,482 (59.6%) | 1,004 (40.4%) |
| Public Administration | 310 (49.4%) | 317 (50.6%) |
| Total | 22,430 (54.9%) | 18,402 (45.1%) |
Education in Johns Creek
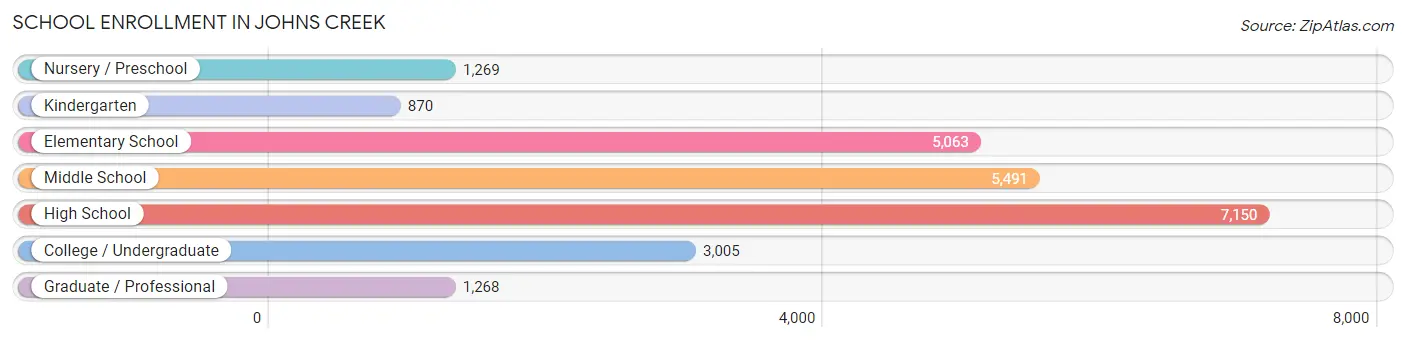
School Enrollment in Johns Creek
The most common levels of schooling among the 24,116 students in Johns Creek are high school (7,150 | 29.6%), middle school (5,491 | 22.8%), and elementary school (5,063 | 21.0%).
| School Level | # Students | % Students |
| Nursery / Preschool | 1,269 | 5.3% |
| Kindergarten | 870 | 3.6% |
| Elementary School | 5,063 | 21.0% |
| Middle School | 5,491 | 22.8% |
| High School | 7,150 | 29.6% |
| College / Undergraduate | 3,005 | 12.5% |
| Graduate / Professional | 1,268 | 5.3% |
| Total | 24,116 | 100.0% |
School Enrollment by Age by Funding Source in Johns Creek
Out of a total of 24,116 students who are enrolled in schools in Johns Creek, 4,920 (20.4%) attend a private institution, while the remaining 19,196 (79.6%) are enrolled in public schools. The age group of 3 to 4 year olds has the highest likelihood of being enrolled in private schools, with 650 (64.5% in the age bracket) enrolled. Conversely, the age group of 5 to 9 year old has the lowest likelihood of being enrolled in a private school, with 4,845 (88.6% in the age bracket) attending a public institution.
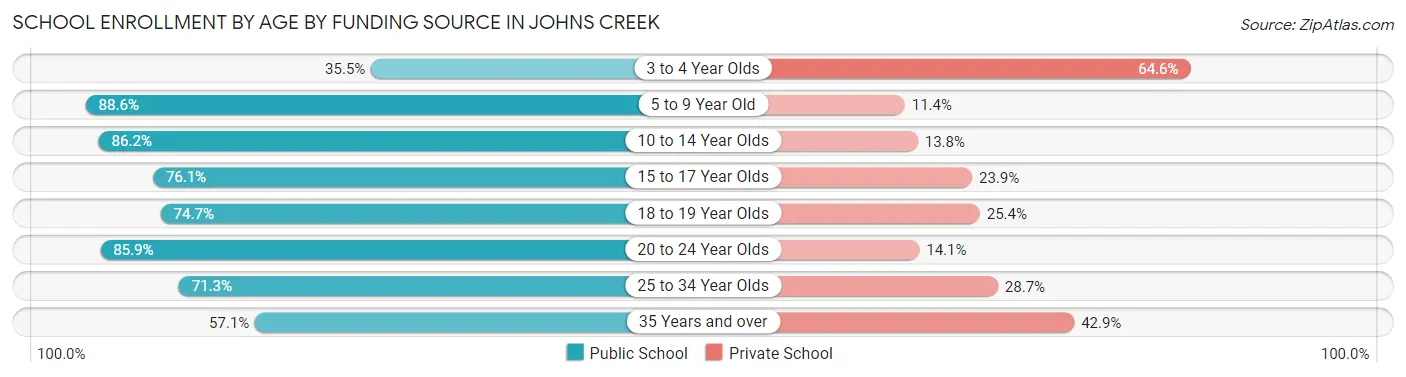
| Age Bracket | Public School | Private School |
| 3 to 4 Year Olds | 357 (35.4%) | 650 (64.5%) |
| 5 to 9 Year Old | 4,845 (88.6%) | 622 (11.4%) |
| 10 to 14 Year Olds | 5,897 (86.2%) | 944 (13.8%) |
| 15 to 17 Year Olds | 3,876 (76.1%) | 1,218 (23.9%) |
| 18 to 19 Year Olds | 1,640 (74.7%) | 557 (25.4%) |
| 20 to 24 Year Olds | 1,445 (85.9%) | 237 (14.1%) |
| 25 to 34 Year Olds | 526 (71.3%) | 212 (28.7%) |
| 35 Years and over | 622 (57.1%) | 468 (42.9%) |
| Total | 19,196 (79.6%) | 4,920 (20.4%) |
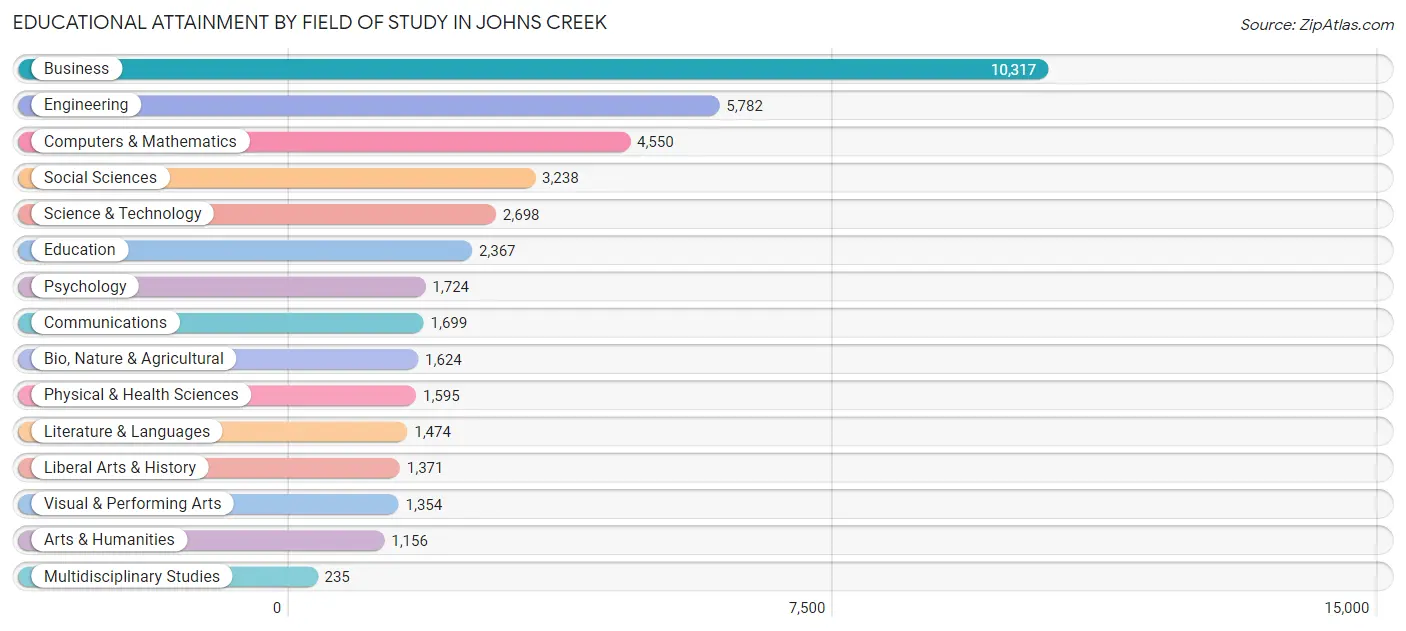
Educational Attainment by Field of Study in Johns Creek
Business (10,317 | 25.1%), engineering (5,782 | 14.0%), computers & mathematics (4,550 | 11.1%), social sciences (3,238 | 7.9%), and science & technology (2,698 | 6.6%) are the most common fields of study among 41,184 individuals in Johns Creek who have obtained a bachelor's degree or higher.
| Field of Study | # Graduates | % Graduates |
| Computers & Mathematics | 4,550 | 11.1% |
| Bio, Nature & Agricultural | 1,624 | 3.9% |
| Physical & Health Sciences | 1,595 | 3.9% |
| Psychology | 1,724 | 4.2% |
| Social Sciences | 3,238 | 7.9% |
| Engineering | 5,782 | 14.0% |
| Multidisciplinary Studies | 235 | 0.6% |
| Science & Technology | 2,698 | 6.6% |
| Business | 10,317 | 25.1% |
| Education | 2,367 | 5.8% |
| Literature & Languages | 1,474 | 3.6% |
| Liberal Arts & History | 1,371 | 3.3% |
| Visual & Performing Arts | 1,354 | 3.3% |
| Communications | 1,699 | 4.1% |
| Arts & Humanities | 1,156 | 2.8% |
| Total | 41,184 | 100.0% |
Transportation & Commute in Johns Creek
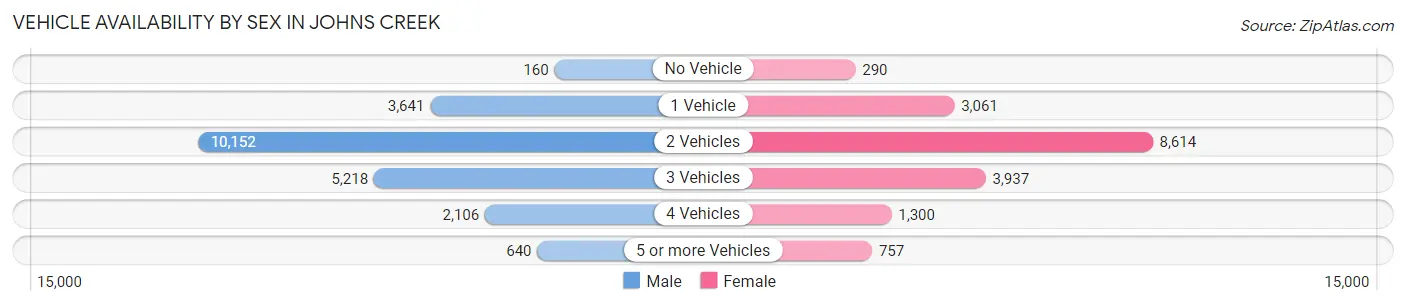
Vehicle Availability by Sex in Johns Creek
The most prevalent vehicle ownership categories in Johns Creek are males with 2 vehicles (10,152, accounting for 46.3%) and females with 2 vehicles (8,614, making up 56.5%).
| Vehicles Available | Male | Female |
| No Vehicle | 160 (0.7%) | 290 (1.6%) |
| 1 Vehicle | 3,641 (16.6%) | 3,061 (17.0%) |
| 2 Vehicles | 10,152 (46.3%) | 8,614 (48.0%) |
| 3 Vehicles | 5,218 (23.8%) | 3,937 (21.9%) |
| 4 Vehicles | 2,106 (9.6%) | 1,300 (7.2%) |
| 5 or more Vehicles | 640 (2.9%) | 757 (4.2%) |
| Total | 21,917 (100.0%) | 17,959 (100.0%) |
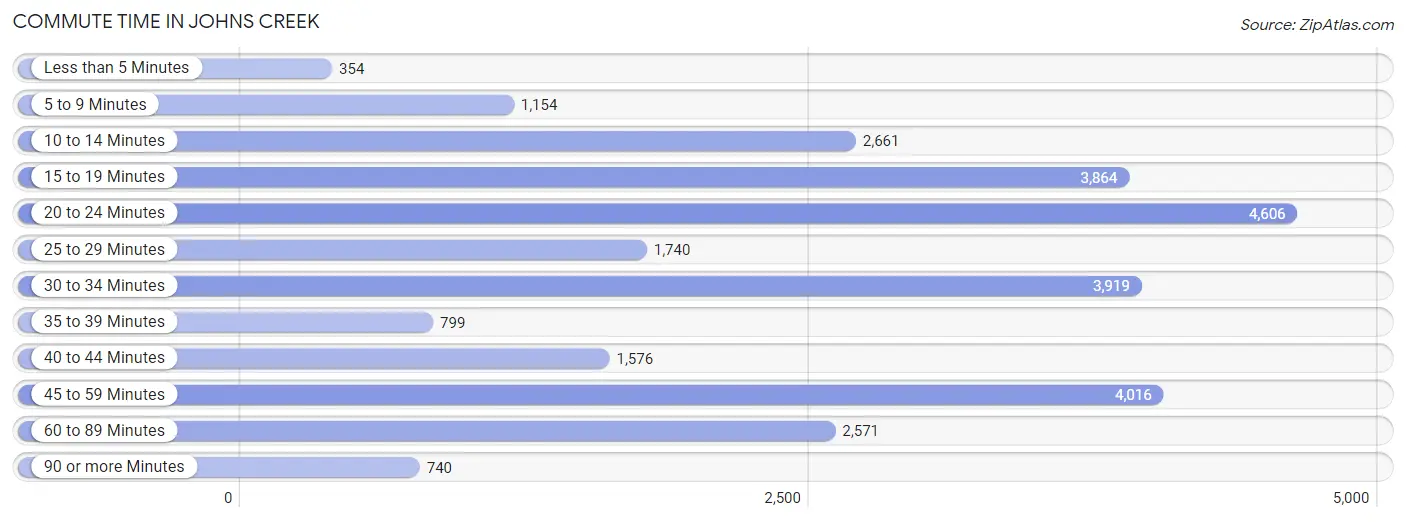
Commute Time in Johns Creek
The most frequently occuring commute durations in Johns Creek are 20 to 24 minutes (4,606 commuters, 16.5%), 45 to 59 minutes (4,016 commuters, 14.3%), and 30 to 34 minutes (3,919 commuters, 14.0%).
| Commute Time | # Commuters | % Commuters |
| Less than 5 Minutes | 354 | 1.3% |
| 5 to 9 Minutes | 1,154 | 4.1% |
| 10 to 14 Minutes | 2,661 | 9.5% |
| 15 to 19 Minutes | 3,864 | 13.8% |
| 20 to 24 Minutes | 4,606 | 16.5% |
| 25 to 29 Minutes | 1,740 | 6.2% |
| 30 to 34 Minutes | 3,919 | 14.0% |
| 35 to 39 Minutes | 799 | 2.9% |
| 40 to 44 Minutes | 1,576 | 5.6% |
| 45 to 59 Minutes | 4,016 | 14.3% |
| 60 to 89 Minutes | 2,571 | 9.2% |
| 90 or more Minutes | 740 | 2.6% |
Commute Time by Sex in Johns Creek
The most common commute times in Johns Creek are 20 to 24 minutes (2,758 commuters, 18.4%) for males and 15 to 19 minutes (2,088 commuters, 16.0%) for females.
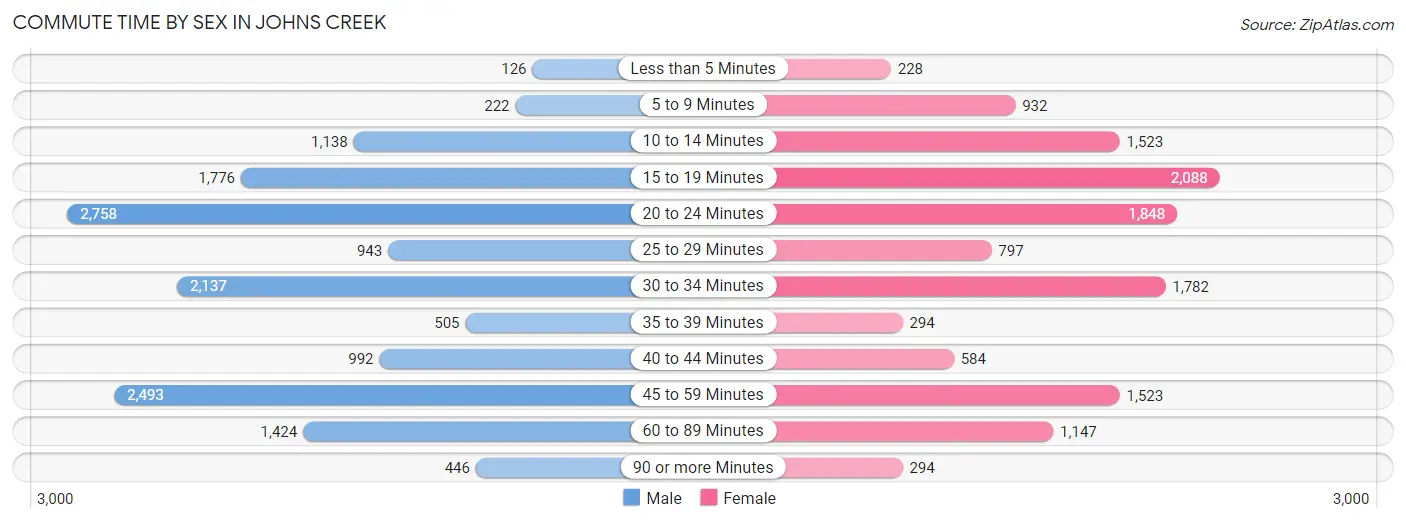
| Commute Time | Male | Female |
| Less than 5 Minutes | 126 (0.8%) | 228 (1.8%) |
| 5 to 9 Minutes | 222 (1.5%) | 932 (7.1%) |
| 10 to 14 Minutes | 1,138 (7.6%) | 1,523 (11.7%) |
| 15 to 19 Minutes | 1,776 (11.9%) | 2,088 (16.0%) |
| 20 to 24 Minutes | 2,758 (18.4%) | 1,848 (14.2%) |
| 25 to 29 Minutes | 943 (6.3%) | 797 (6.1%) |
| 30 to 34 Minutes | 2,137 (14.3%) | 1,782 (13.7%) |
| 35 to 39 Minutes | 505 (3.4%) | 294 (2.2%) |
| 40 to 44 Minutes | 992 (6.6%) | 584 (4.5%) |
| 45 to 59 Minutes | 2,493 (16.7%) | 1,523 (11.7%) |
| 60 to 89 Minutes | 1,424 (9.5%) | 1,147 (8.8%) |
| 90 or more Minutes | 446 (3.0%) | 294 (2.2%) |
Time of Departure to Work by Sex in Johns Creek
The most frequent times of departure to work in Johns Creek are 8:00 AM to 8:29 AM (2,602, 17.4%) for males and 7:00 AM to 7:29 AM (2,375, 18.2%) for females.
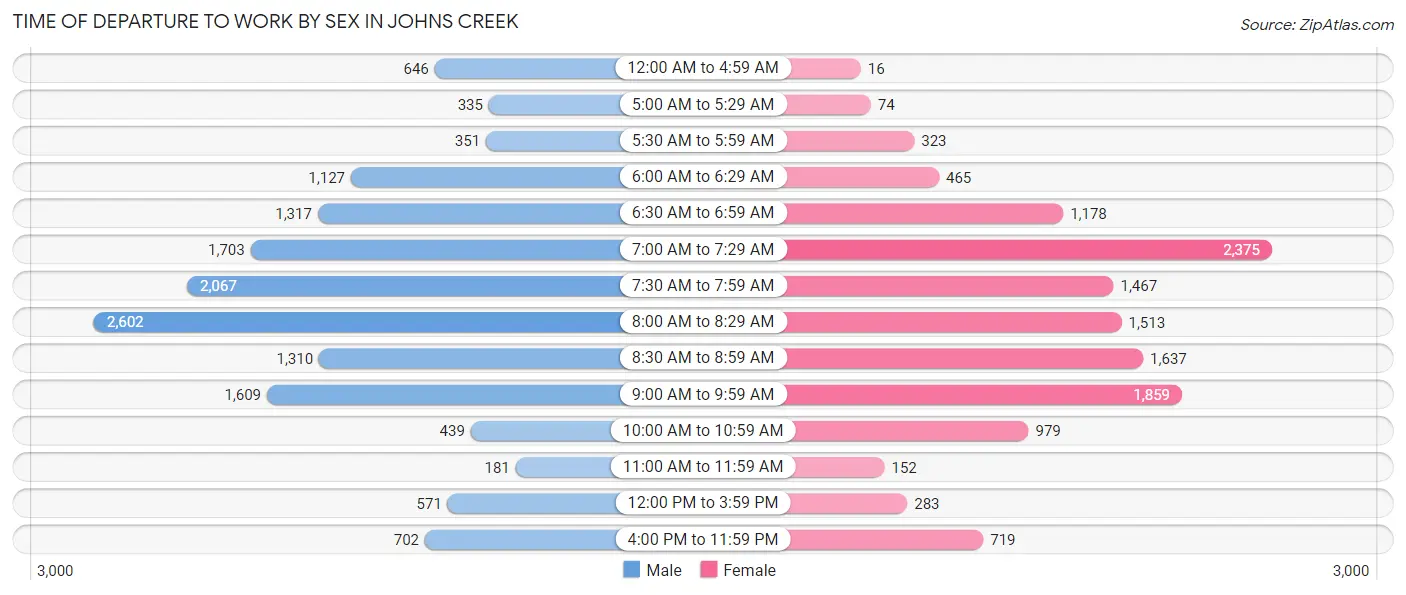
| Time of Departure | Male | Female |
| 12:00 AM to 4:59 AM | 646 (4.3%) | 16 (0.1%) |
| 5:00 AM to 5:29 AM | 335 (2.2%) | 74 (0.6%) |
| 5:30 AM to 5:59 AM | 351 (2.4%) | 323 (2.5%) |
| 6:00 AM to 6:29 AM | 1,127 (7.5%) | 465 (3.6%) |
| 6:30 AM to 6:59 AM | 1,317 (8.8%) | 1,178 (9.0%) |
| 7:00 AM to 7:29 AM | 1,703 (11.4%) | 2,375 (18.2%) |
| 7:30 AM to 7:59 AM | 2,067 (13.8%) | 1,467 (11.3%) |
| 8:00 AM to 8:29 AM | 2,602 (17.4%) | 1,513 (11.6%) |
| 8:30 AM to 8:59 AM | 1,310 (8.8%) | 1,637 (12.6%) |
| 9:00 AM to 9:59 AM | 1,609 (10.8%) | 1,859 (14.3%) |
| 10:00 AM to 10:59 AM | 439 (2.9%) | 979 (7.5%) |
| 11:00 AM to 11:59 AM | 181 (1.2%) | 152 (1.2%) |
| 12:00 PM to 3:59 PM | 571 (3.8%) | 283 (2.2%) |
| 4:00 PM to 11:59 PM | 702 (4.7%) | 719 (5.5%) |
| Total | 14,960 (100.0%) | 13,040 (100.0%) |
Housing Occupancy in Johns Creek
Occupancy by Ownership in Johns Creek
Of the total 28,439 dwellings in Johns Creek, owner-occupied units account for 22,423 (78.8%), while renter-occupied units make up 6,016 (21.1%).
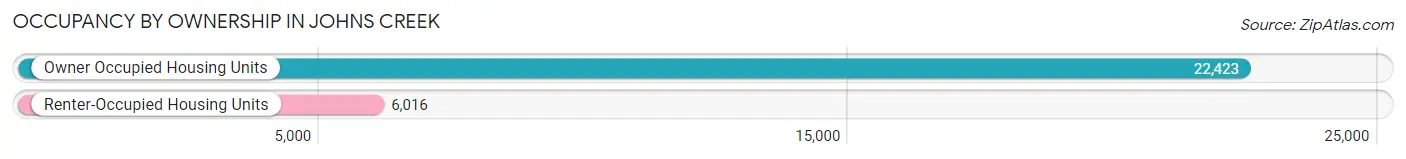
| Occupancy | # Housing Units | % Housing Units |
| Owner Occupied Housing Units | 22,423 | 78.8% |
| Renter-Occupied Housing Units | 6,016 | 21.1% |
| Total Occupied Housing Units | 28,439 | 100.0% |
Occupancy by Household Size in Johns Creek
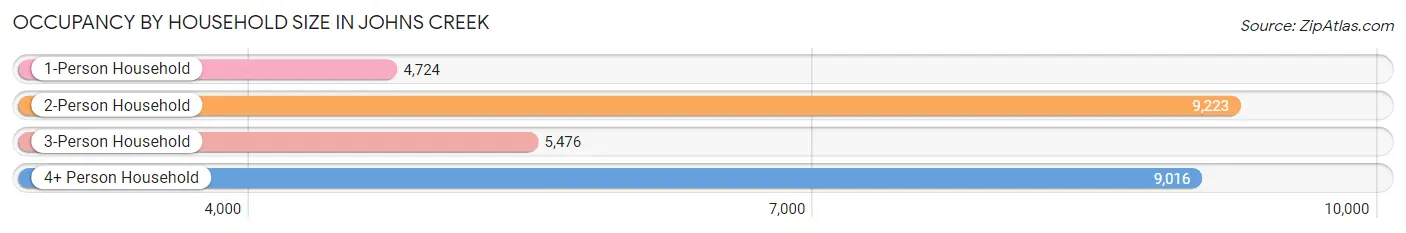
| Household Size | # Housing Units | % Housing Units |
| 1-Person Household | 4,724 | 16.6% |
| 2-Person Household | 9,223 | 32.4% |
| 3-Person Household | 5,476 | 19.3% |
| 4+ Person Household | 9,016 | 31.7% |
| Total Housing Units | 28,439 | 100.0% |
Occupancy by Ownership by Household Size in Johns Creek
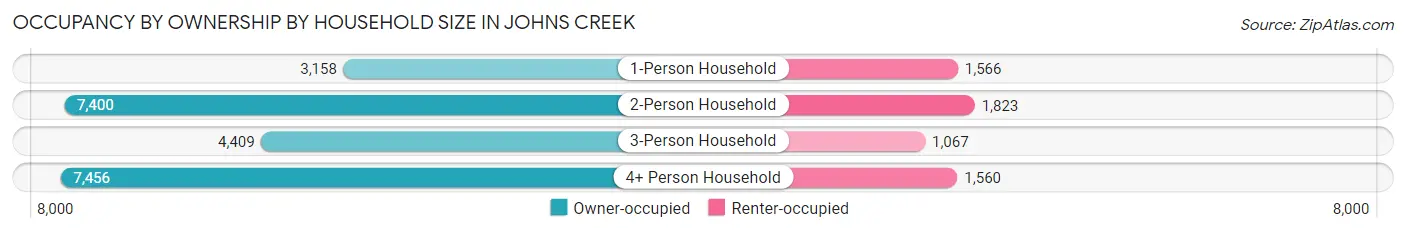
| Household Size | Owner-occupied | Renter-occupied |
| 1-Person Household | 3,158 (66.8%) | 1,566 (33.2%) |
| 2-Person Household | 7,400 (80.2%) | 1,823 (19.8%) |
| 3-Person Household | 4,409 (80.5%) | 1,067 (19.5%) |
| 4+ Person Household | 7,456 (82.7%) | 1,560 (17.3%) |
| Total Housing Units | 22,423 (78.8%) | 6,016 (21.1%) |
Occupancy by Educational Attainment in Johns Creek
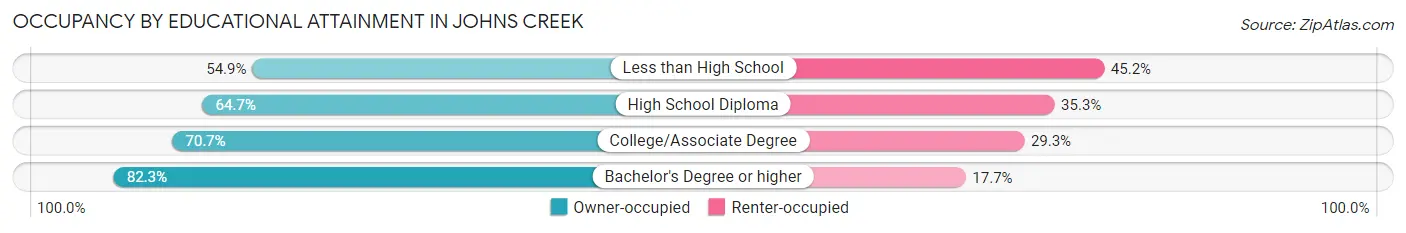
| Household Size | Owner-occupied | Renter-occupied |
| Less than High School | 339 (54.8%) | 279 (45.2%) |
| High School Diploma | 1,025 (64.7%) | 559 (35.3%) |
| College/Associate Degree | 3,269 (70.7%) | 1,355 (29.3%) |
| Bachelor's Degree or higher | 17,790 (82.3%) | 3,823 (17.7%) |
Occupancy by Age of Householder in Johns Creek
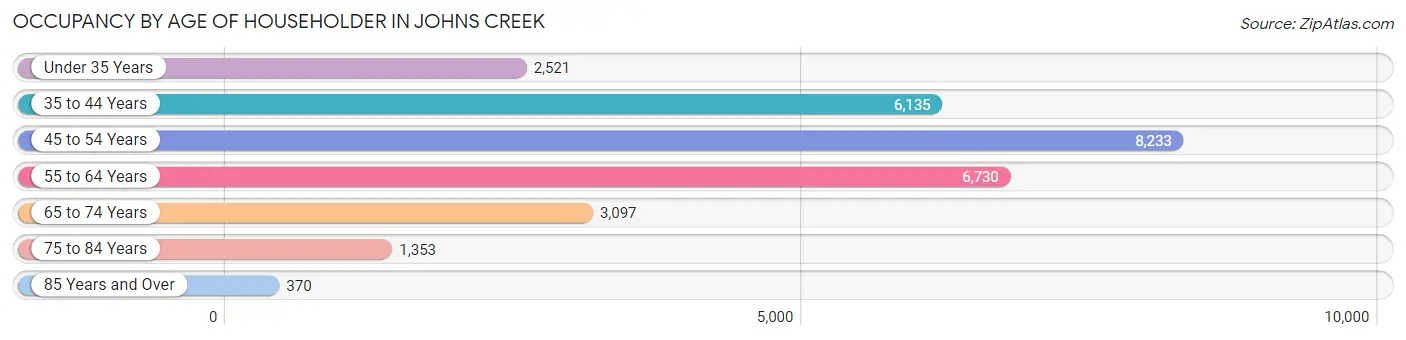
| Age Bracket | # Households | % Households |
| Under 35 Years | 2,521 | 8.9% |
| 35 to 44 Years | 6,135 | 21.6% |
| 45 to 54 Years | 8,233 | 28.9% |
| 55 to 64 Years | 6,730 | 23.7% |
| 65 to 74 Years | 3,097 | 10.9% |
| 75 to 84 Years | 1,353 | 4.8% |
| 85 Years and Over | 370 | 1.3% |
| Total | 28,439 | 100.0% |
Housing Finances in Johns Creek
Median Income by Occupancy in Johns Creek
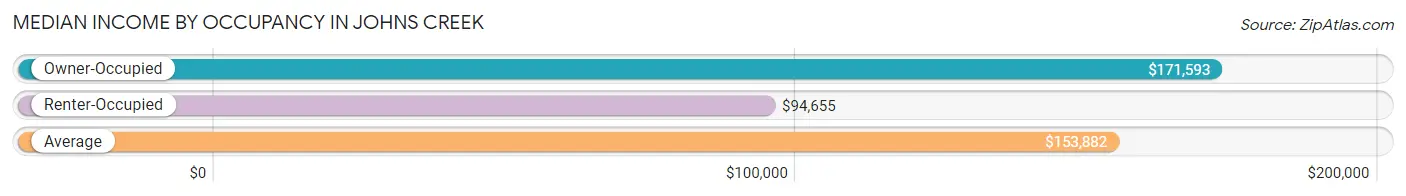
| Occupancy Type | # Households | Median Income |
| Owner-Occupied | 22,423 (78.8%) | $171,593 |
| Renter-Occupied | 6,016 (21.1%) | $94,655 |
| Average | 28,439 (100.0%) | $153,882 |
Occupancy by Householder Income Bracket in Johns Creek
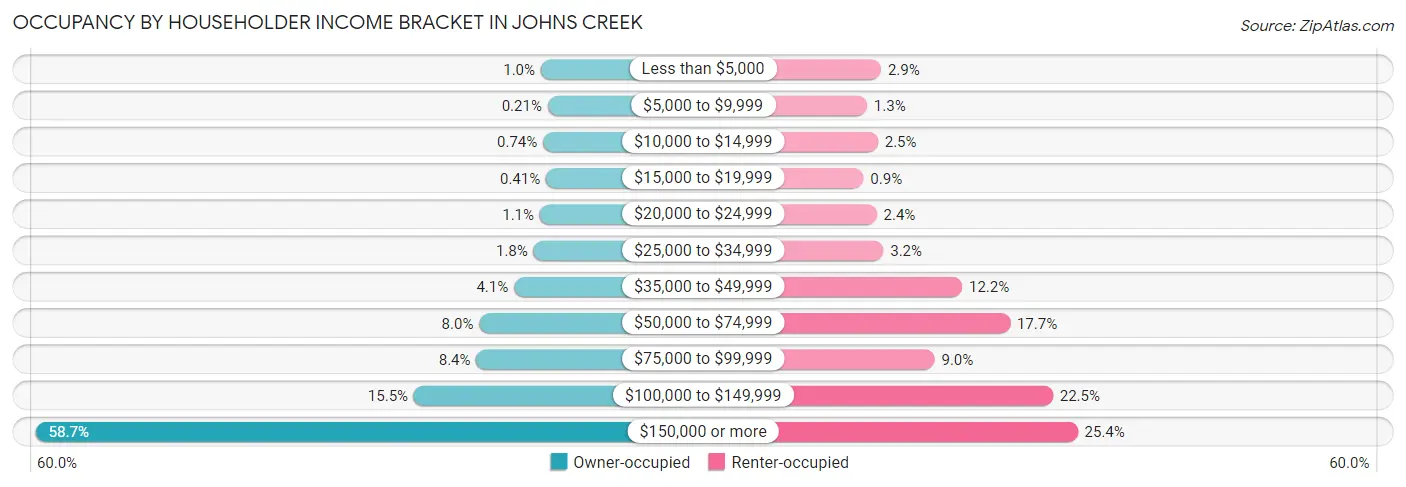
| Income Bracket | Owner-occupied | Renter-occupied |
| Less than $5,000 | 224 (1.0%) | 175 (2.9%) |
| $5,000 to $9,999 | 46 (0.2%) | 78 (1.3%) |
| $10,000 to $14,999 | 165 (0.7%) | 153 (2.5%) |
| $15,000 to $19,999 | 92 (0.4%) | 54 (0.9%) |
| $20,000 to $24,999 | 250 (1.1%) | 145 (2.4%) |
| $25,000 to $34,999 | 410 (1.8%) | 191 (3.2%) |
| $35,000 to $49,999 | 910 (4.1%) | 732 (12.2%) |
| $50,000 to $74,999 | 1,803 (8.0%) | 1,062 (17.6%) |
| $75,000 to $99,999 | 1,876 (8.4%) | 543 (9.0%) |
| $100,000 to $149,999 | 3,477 (15.5%) | 1,356 (22.5%) |
| $150,000 or more | 13,170 (58.7%) | 1,527 (25.4%) |
| Total | 22,423 (100.0%) | 6,016 (100.0%) |
Monthly Housing Cost Tiers in Johns Creek
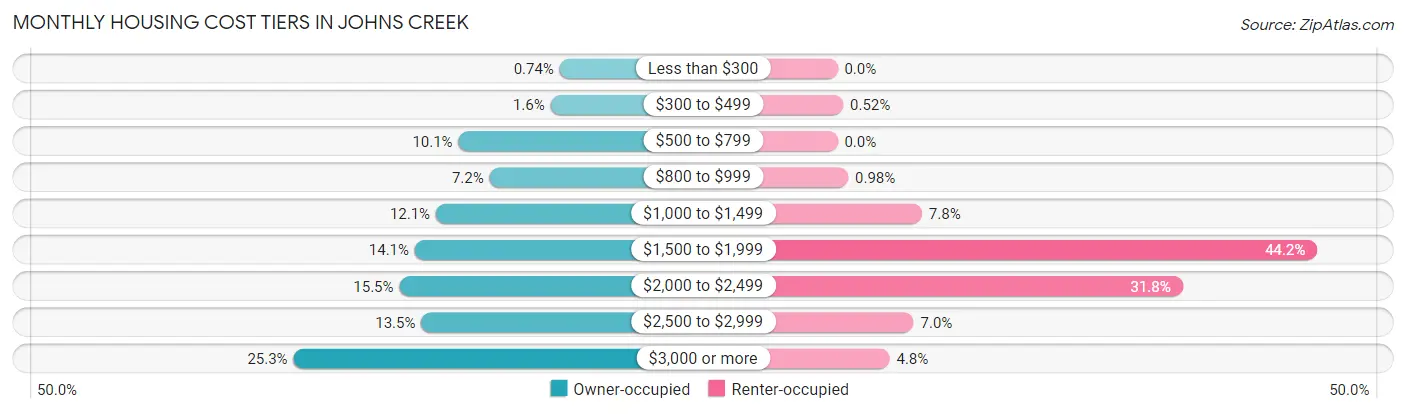
| Monthly Cost | Owner-occupied | Renter-occupied |
| Less than $300 | 166 (0.7%) | 0 (0.0%) |
| $300 to $499 | 354 (1.6%) | 31 (0.5%) |
| $500 to $799 | 2,255 (10.1%) | 0 (0.0%) |
| $800 to $999 | 1,614 (7.2%) | 59 (1.0%) |
| $1,000 to $1,499 | 2,719 (12.1%) | 468 (7.8%) |
| $1,500 to $1,999 | 3,156 (14.1%) | 2,657 (44.2%) |
| $2,000 to $2,499 | 3,475 (15.5%) | 1,911 (31.8%) |
| $2,500 to $2,999 | 3,022 (13.5%) | 422 (7.0%) |
| $3,000 or more | 5,662 (25.3%) | 289 (4.8%) |
| Total | 22,423 (100.0%) | 6,016 (100.0%) |
Physical Housing Characteristics in Johns Creek
Housing Structures in Johns Creek
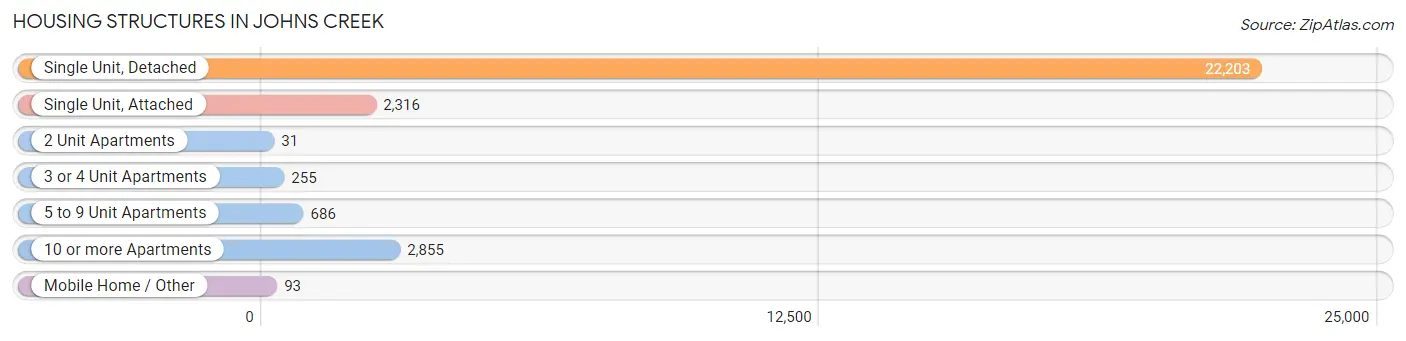
| Structure Type | # Housing Units | % Housing Units |
| Single Unit, Detached | 22,203 | 78.1% |
| Single Unit, Attached | 2,316 | 8.1% |
| 2 Unit Apartments | 31 | 0.1% |
| 3 or 4 Unit Apartments | 255 | 0.9% |
| 5 to 9 Unit Apartments | 686 | 2.4% |
| 10 or more Apartments | 2,855 | 10.0% |
| Mobile Home / Other | 93 | 0.3% |
| Total | 28,439 | 100.0% |
Housing Structures by Occupancy in Johns Creek
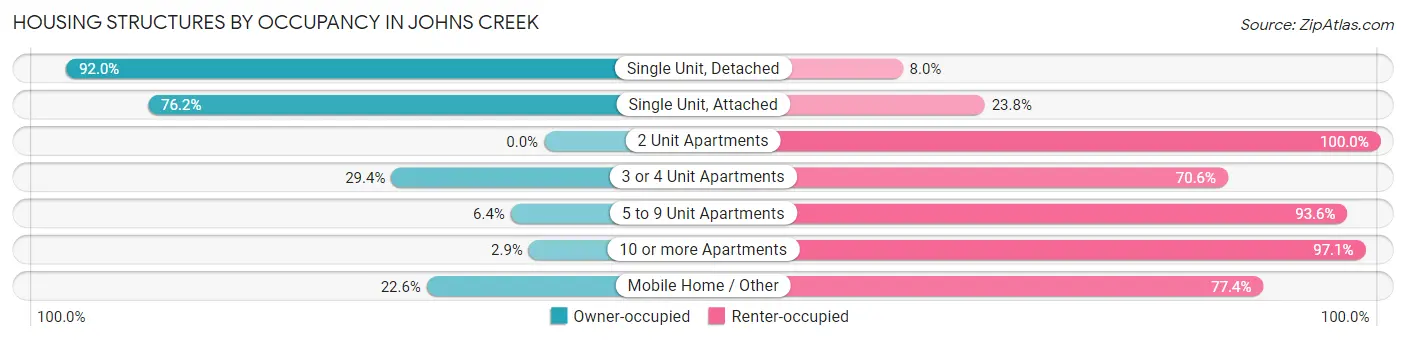
| Structure Type | Owner-occupied | Renter-occupied |
| Single Unit, Detached | 20,434 (92.0%) | 1,769 (8.0%) |
| Single Unit, Attached | 1,765 (76.2%) | 551 (23.8%) |
| 2 Unit Apartments | 0 (0.0%) | 31 (100.0%) |
| 3 or 4 Unit Apartments | 75 (29.4%) | 180 (70.6%) |
| 5 to 9 Unit Apartments | 44 (6.4%) | 642 (93.6%) |
| 10 or more Apartments | 84 (2.9%) | 2,771 (97.1%) |
| Mobile Home / Other | 21 (22.6%) | 72 (77.4%) |
| Total | 22,423 (78.8%) | 6,016 (21.1%) |
Housing Structures by Number of Rooms in Johns Creek
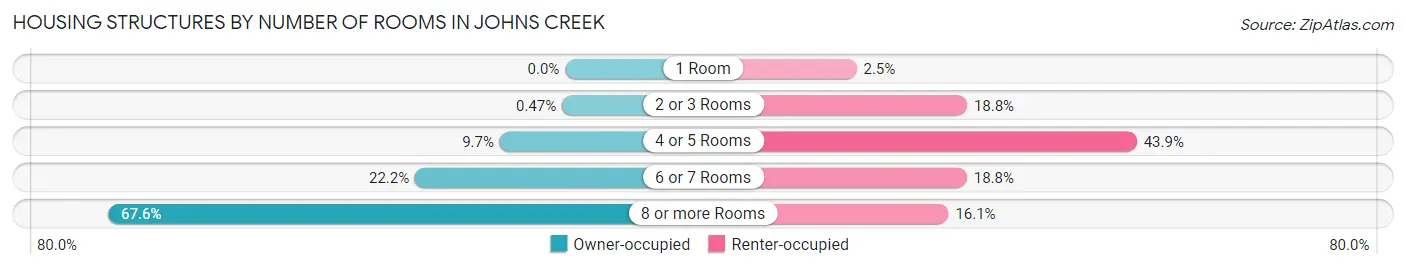
| Number of Rooms | Owner-occupied | Renter-occupied |
| 1 Room | 0 (0.0%) | 148 (2.5%) |
| 2 or 3 Rooms | 105 (0.5%) | 1,131 (18.8%) |
| 4 or 5 Rooms | 2,170 (9.7%) | 2,642 (43.9%) |
| 6 or 7 Rooms | 4,983 (22.2%) | 1,129 (18.8%) |
| 8 or more Rooms | 15,165 (67.6%) | 966 (16.1%) |
| Total | 22,423 (100.0%) | 6,016 (100.0%) |
Housing Structure by Heating Type in Johns Creek
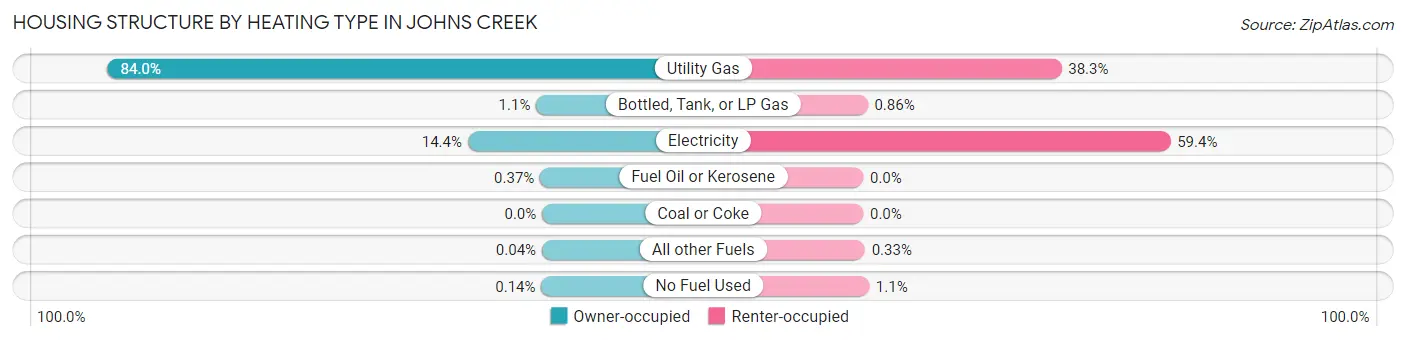
| Heating Type | Owner-occupied | Renter-occupied |
| Utility Gas | 18,824 (84.0%) | 2,305 (38.3%) |
| Bottled, Tank, or LP Gas | 254 (1.1%) | 52 (0.9%) |
| Electricity | 3,221 (14.4%) | 3,571 (59.4%) |
| Fuel Oil or Kerosene | 84 (0.4%) | 0 (0.0%) |
| Coal or Coke | 0 (0.0%) | 0 (0.0%) |
| All other Fuels | 9 (0.0%) | 20 (0.3%) |
| No Fuel Used | 31 (0.1%) | 68 (1.1%) |
| Total | 22,423 (100.0%) | 6,016 (100.0%) |
Household Vehicle Usage in Johns Creek
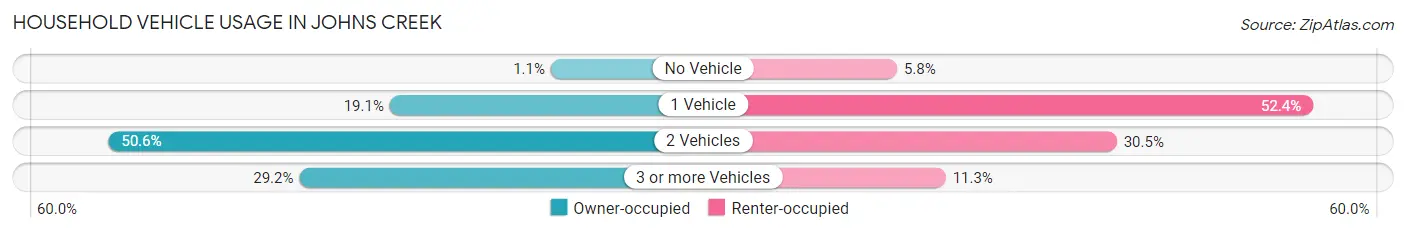
| Vehicles per Household | Owner-occupied | Renter-occupied |
| No Vehicle | 237 (1.1%) | 351 (5.8%) |
| 1 Vehicle | 4,282 (19.1%) | 3,154 (52.4%) |
| 2 Vehicles | 11,350 (50.6%) | 1,832 (30.4%) |
| 3 or more Vehicles | 6,554 (29.2%) | 679 (11.3%) |
| Total | 22,423 (100.0%) | 6,016 (100.0%) |
Real Estate & Mortgages in Johns Creek
Real Estate and Mortgage Overview in Johns Creek
| Characteristic | Without Mortgage | With Mortgage |
| Housing Units | 6,017 | 16,406 |
| Median Property Value | $537,200 | $520,800 |
| Median Household Income | $152,838 | $10,071 |
| Monthly Housing Costs | $911 | $5,649 |
| Real Estate Taxes | $5,042 | $94 |
Property Value by Mortgage Status in Johns Creek
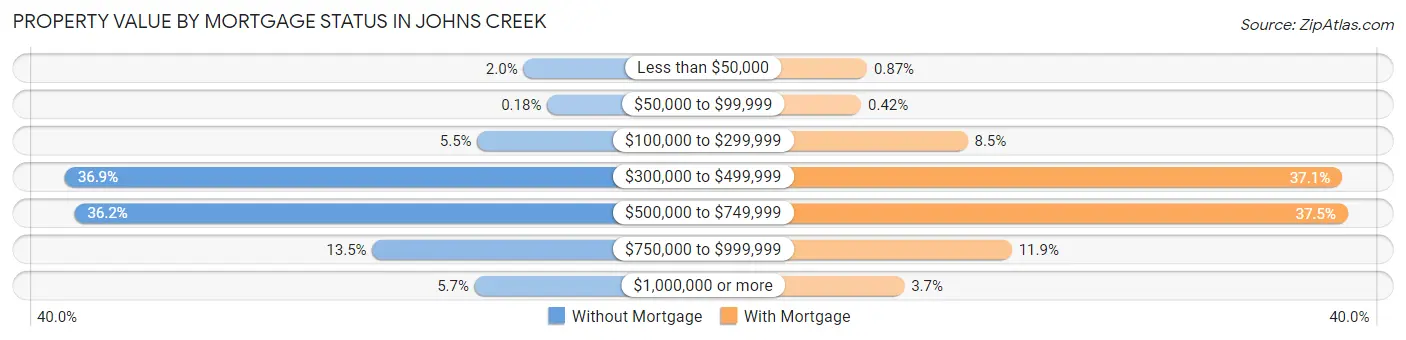
| Property Value | Without Mortgage | With Mortgage |
| Less than $50,000 | 120 (2.0%) | 143 (0.9%) |
| $50,000 to $99,999 | 11 (0.2%) | 69 (0.4%) |
| $100,000 to $299,999 | 331 (5.5%) | 1,400 (8.5%) |
| $300,000 to $499,999 | 2,222 (36.9%) | 6,080 (37.1%) |
| $500,000 to $749,999 | 2,178 (36.2%) | 6,153 (37.5%) |
| $750,000 to $999,999 | 812 (13.5%) | 1,952 (11.9%) |
| $1,000,000 or more | 343 (5.7%) | 609 (3.7%) |
| Total | 6,017 (100.0%) | 16,406 (100.0%) |
Household Income by Mortgage Status in Johns Creek
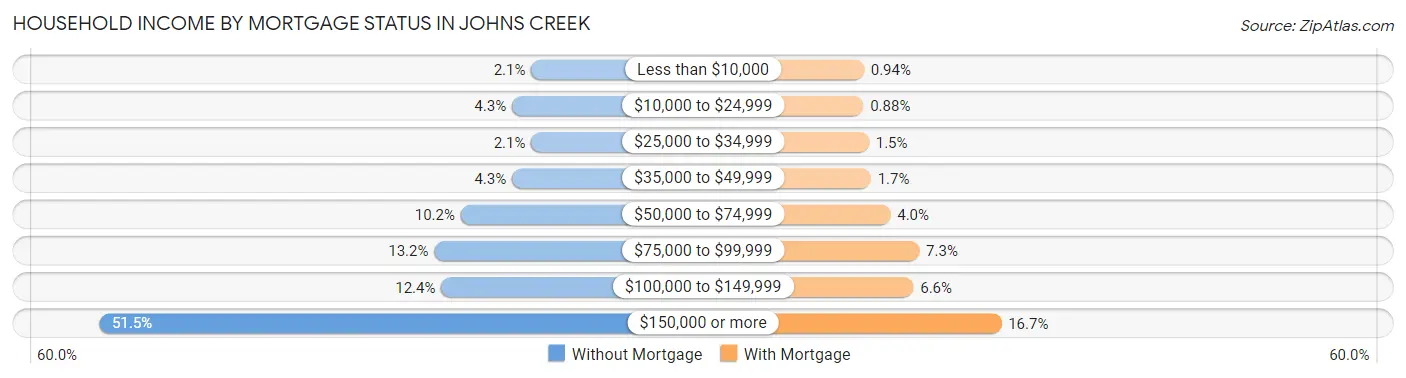
| Household Income | Without Mortgage | With Mortgage |
| Less than $10,000 | 126 (2.1%) | 155 (0.9%) |
| $10,000 to $24,999 | 259 (4.3%) | 144 (0.9%) |
| $25,000 to $34,999 | 126 (2.1%) | 248 (1.5%) |
| $35,000 to $49,999 | 258 (4.3%) | 284 (1.7%) |
| $50,000 to $74,999 | 611 (10.2%) | 652 (4.0%) |
| $75,000 to $99,999 | 793 (13.2%) | 1,192 (7.3%) |
| $100,000 to $149,999 | 745 (12.4%) | 1,083 (6.6%) |
| $150,000 or more | 3,099 (51.5%) | 2,732 (16.7%) |
| Total | 6,017 (100.0%) | 16,406 (100.0%) |
Property Value to Household Income Ratio in Johns Creek
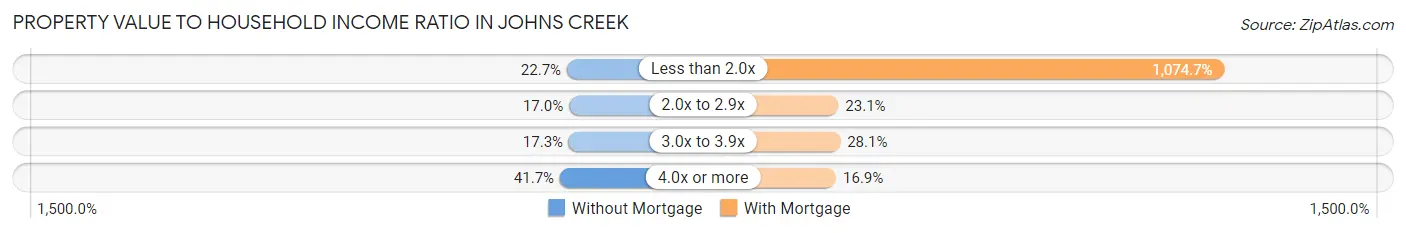
| Value-to-Income Ratio | Without Mortgage | With Mortgage |
| Less than 2.0x | 1,363 (22.7%) | 176,315 (1,074.7%) |
| 2.0x to 2.9x | 1,021 (17.0%) | 3,791 (23.1%) |
| 3.0x to 3.9x | 1,040 (17.3%) | 4,605 (28.1%) |
| 4.0x or more | 2,510 (41.7%) | 2,764 (16.9%) |
| Total | 6,017 (100.0%) | 16,406 (100.0%) |
Real Estate Taxes by Mortgage Status in Johns Creek
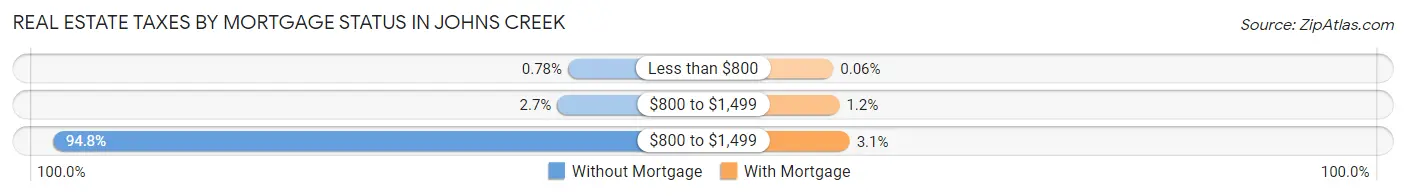
| Property Taxes | Without Mortgage | With Mortgage |
| Less than $800 | 47 (0.8%) | 10 (0.1%) |
| $800 to $1,499 | 164 (2.7%) | 192 (1.2%) |
| $800 to $1,499 | 5,706 (94.8%) | 501 (3.0%) |
| Total | 6,017 (100.0%) | 16,406 (100.0%) |
Health & Disability in Johns Creek
Health Insurance Coverage by Age in Johns Creek
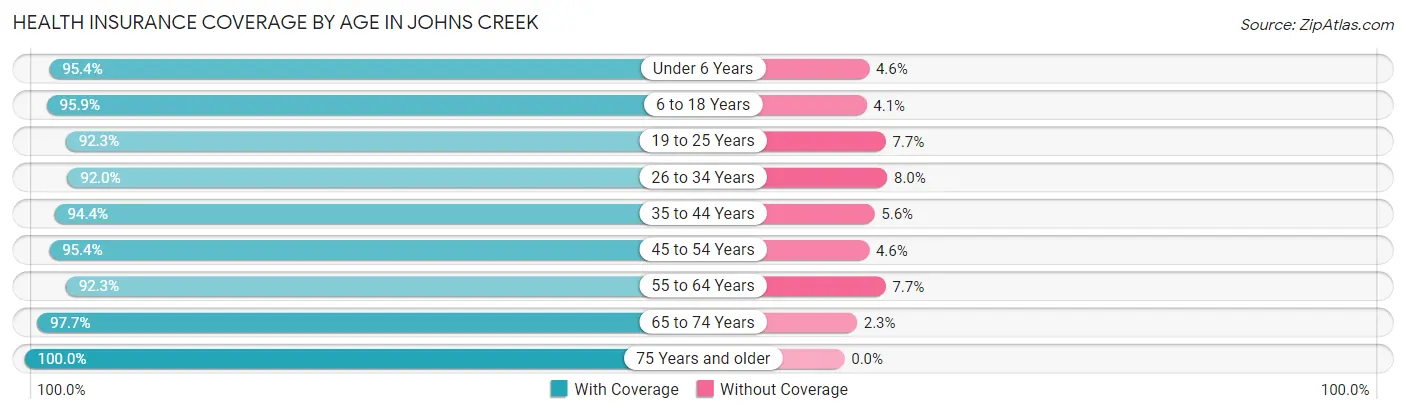
| Age Bracket | With Coverage | Without Coverage |
| Under 6 Years | 4,145 (95.4%) | 200 (4.6%) |
| 6 to 18 Years | 18,089 (95.9%) | 776 (4.1%) |
| 19 to 25 Years | 3,708 (92.3%) | 309 (7.7%) |
| 26 to 34 Years | 5,440 (92.0%) | 471 (8.0%) |
| 35 to 44 Years | 11,396 (94.4%) | 677 (5.6%) |
| 45 to 54 Years | 14,356 (95.4%) | 692 (4.6%) |
| 55 to 64 Years | 11,042 (92.3%) | 918 (7.7%) |
| 65 to 74 Years | 6,256 (97.7%) | 149 (2.3%) |
| 75 Years and older | 3,370 (100.0%) | 0 (0.0%) |
| Total | 77,802 (94.9%) | 4,192 (5.1%) |
Health Insurance Coverage by Citizenship Status in Johns Creek
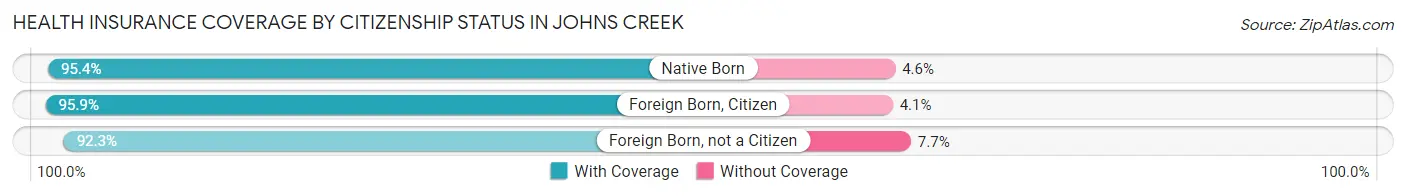
| Citizenship Status | With Coverage | Without Coverage |
| Native Born | 4,145 (95.4%) | 200 (4.6%) |
| Foreign Born, Citizen | 18,089 (95.9%) | 776 (4.1%) |
| Foreign Born, not a Citizen | 3,708 (92.3%) | 309 (7.7%) |
Health Insurance Coverage by Household Income in Johns Creek
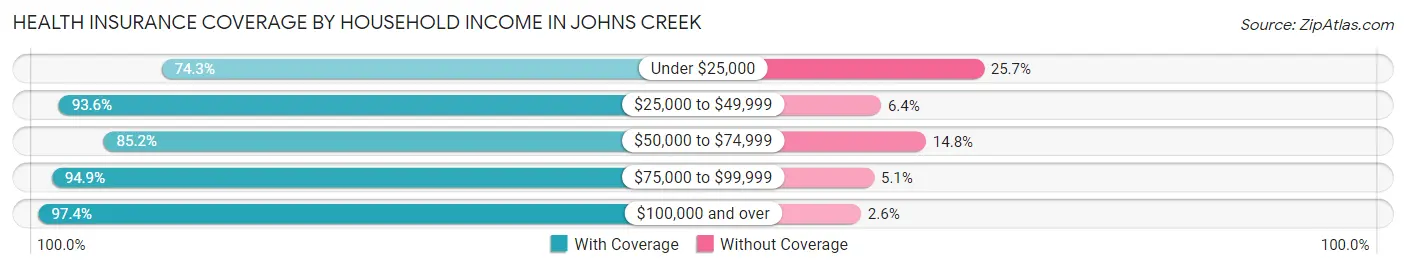
| Household Income | With Coverage | Without Coverage |
| Under $25,000 | 2,639 (74.3%) | 911 (25.7%) |
| $25,000 to $49,999 | 4,646 (93.6%) | 318 (6.4%) |
| $50,000 to $74,999 | 6,086 (85.2%) | 1,059 (14.8%) |
| $75,000 to $99,999 | 5,263 (94.9%) | 283 (5.1%) |
| $100,000 and over | 59,129 (97.4%) | 1,602 (2.6%) |
Public vs Private Health Insurance Coverage by Age in Johns Creek
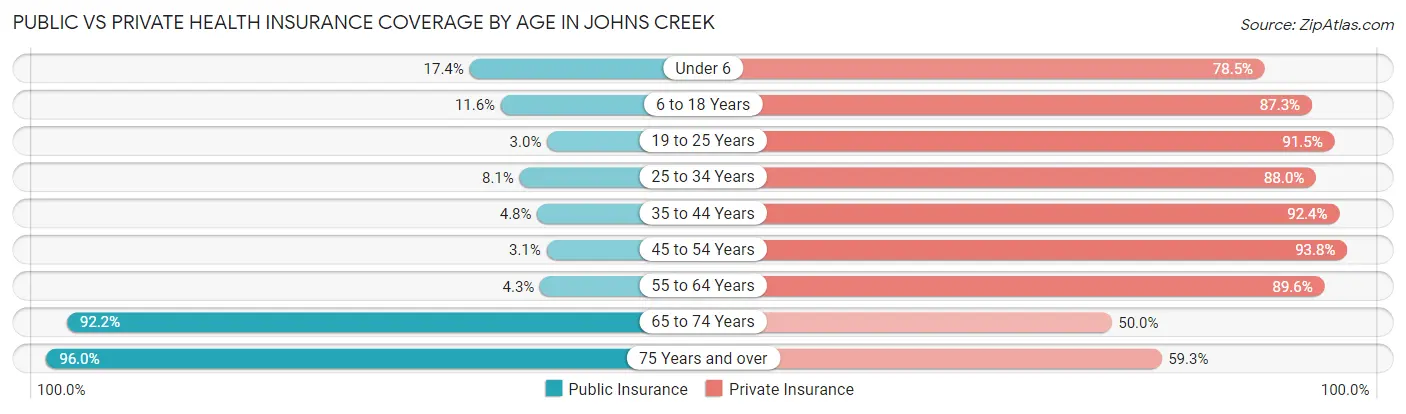
| Age Bracket | Public Insurance | Private Insurance |
| Under 6 | 756 (17.4%) | 3,412 (78.5%) |
| 6 to 18 Years | 2,184 (11.6%) | 16,460 (87.3%) |
| 19 to 25 Years | 120 (3.0%) | 3,674 (91.5%) |
| 25 to 34 Years | 480 (8.1%) | 5,204 (88.0%) |
| 35 to 44 Years | 582 (4.8%) | 11,150 (92.3%) |
| 45 to 54 Years | 468 (3.1%) | 14,116 (93.8%) |
| 55 to 64 Years | 514 (4.3%) | 10,716 (89.6%) |
| 65 to 74 Years | 5,902 (92.1%) | 3,204 (50.0%) |
| 75 Years and over | 3,234 (96.0%) | 1,998 (59.3%) |
| Total | 14,240 (17.4%) | 69,934 (85.3%) |
Disability Status by Sex by Age in Johns Creek
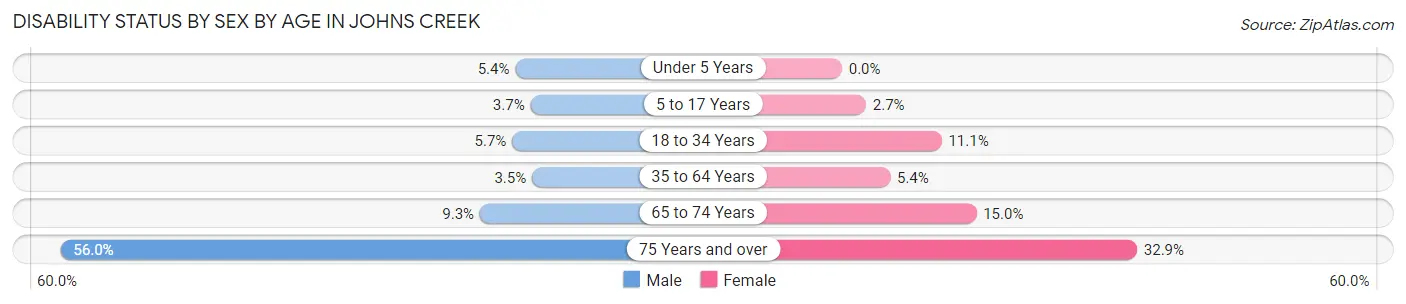
| Age Bracket | Male | Female |
| Under 5 Years | 92 (5.3%) | 0 (0.0%) |
| 5 to 17 Years | 352 (3.7%) | 221 (2.7%) |
| 18 to 34 Years | 332 (5.7%) | 648 (11.1%) |
| 35 to 64 Years | 667 (3.5%) | 1,073 (5.4%) |
| 65 to 74 Years | 265 (9.3%) | 532 (15.0%) |
| 75 Years and over | 783 (56.0%) | 648 (32.9%) |
Disability Class by Sex by Age in Johns Creek
Disability Class: Hearing Difficulty
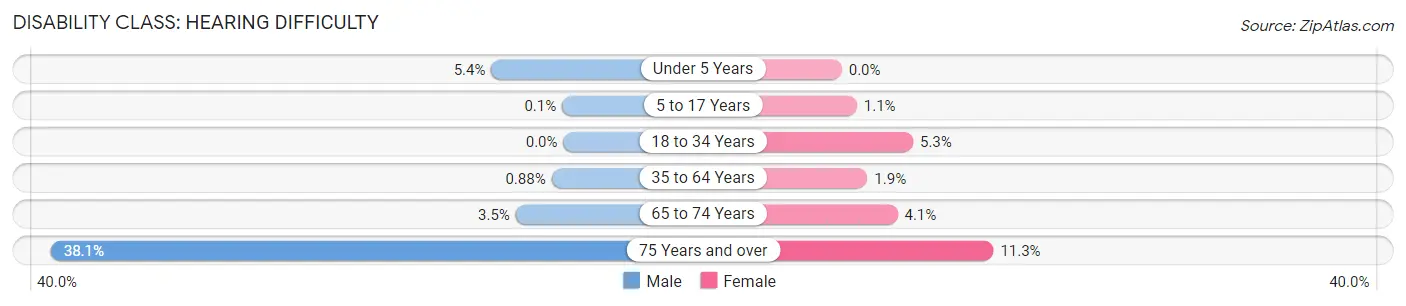
| Age Bracket | Male | Female |
| Under 5 Years | 92 (5.3%) | 0 (0.0%) |
| 5 to 17 Years | 10 (0.1%) | 92 (1.1%) |
| 18 to 34 Years | 0 (0.0%) | 309 (5.3%) |
| 35 to 64 Years | 168 (0.9%) | 379 (1.9%) |
| 65 to 74 Years | 101 (3.5%) | 147 (4.1%) |
| 75 Years and over | 532 (38.1%) | 222 (11.3%) |
Disability Class: Vision Difficulty
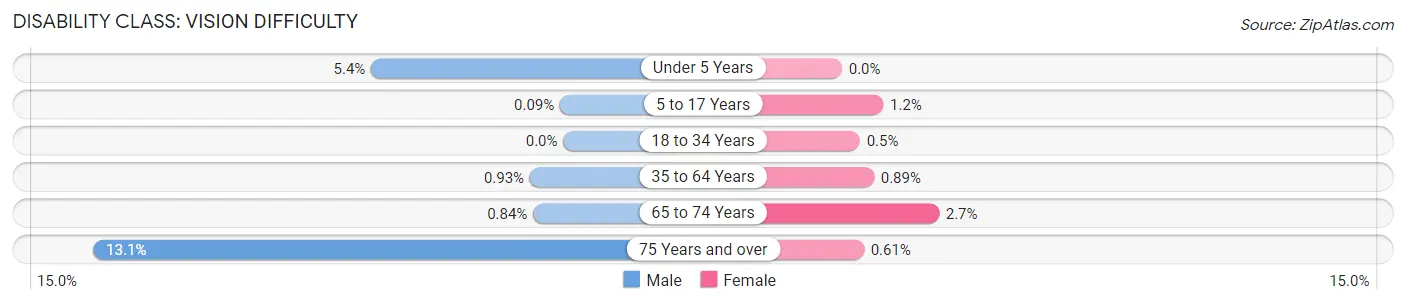
| Age Bracket | Male | Female |
| Under 5 Years | 92 (5.3%) | 0 (0.0%) |
| 5 to 17 Years | 9 (0.1%) | 95 (1.1%) |
| 18 to 34 Years | 0 (0.0%) | 29 (0.5%) |
| 35 to 64 Years | 178 (0.9%) | 177 (0.9%) |
| 65 to 74 Years | 24 (0.8%) | 96 (2.7%) |
| 75 Years and over | 183 (13.1%) | 12 (0.6%) |
Disability Class: Cognitive Difficulty
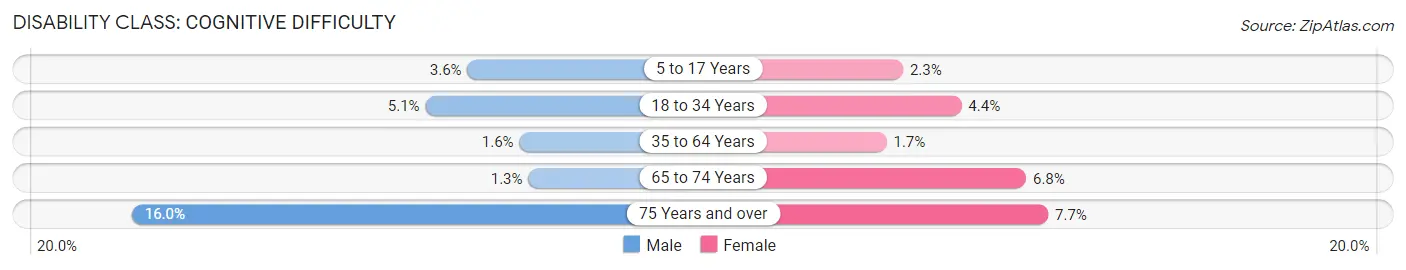
| Age Bracket | Male | Female |
| 5 to 17 Years | 342 (3.6%) | 187 (2.3%) |
| 18 to 34 Years | 298 (5.1%) | 259 (4.4%) |
| 35 to 64 Years | 312 (1.6%) | 332 (1.7%) |
| 65 to 74 Years | 37 (1.3%) | 243 (6.8%) |
| 75 Years and over | 224 (16.0%) | 151 (7.7%) |
Disability Class: Ambulatory Difficulty
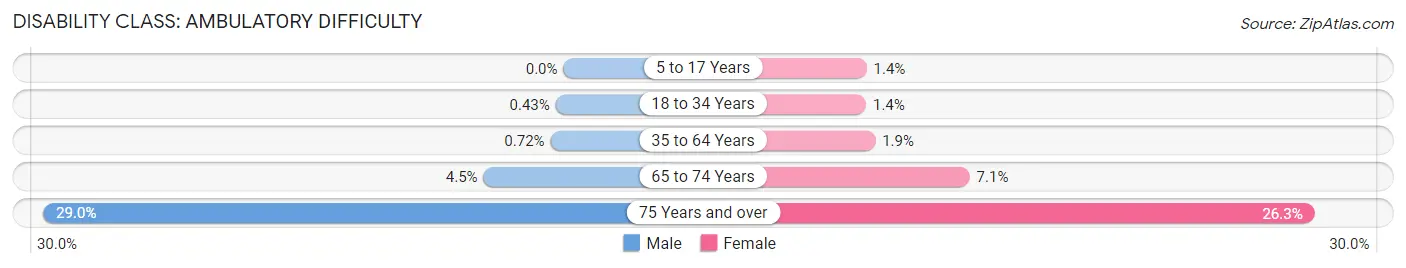
| Age Bracket | Male | Female |
| 5 to 17 Years | 0 (0.0%) | 114 (1.4%) |
| 18 to 34 Years | 25 (0.4%) | 79 (1.3%) |
| 35 to 64 Years | 137 (0.7%) | 372 (1.9%) |
| 65 to 74 Years | 127 (4.4%) | 253 (7.1%) |
| 75 Years and over | 405 (29.0%) | 519 (26.3%) |
Disability Class: Self-Care Difficulty
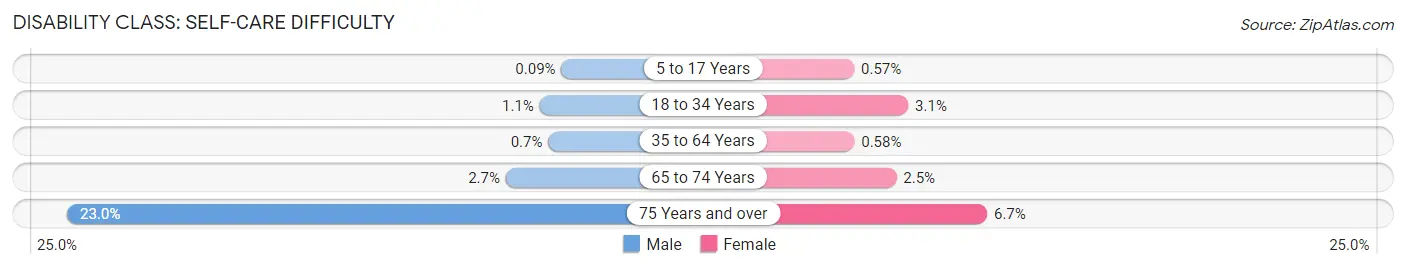
| Age Bracket | Male | Female |
| 5 to 17 Years | 9 (0.1%) | 47 (0.6%) |
| 18 to 34 Years | 64 (1.1%) | 180 (3.1%) |
| 35 to 64 Years | 134 (0.7%) | 116 (0.6%) |
| 65 to 74 Years | 76 (2.7%) | 90 (2.5%) |
| 75 Years and over | 322 (23.0%) | 133 (6.7%) |
Technology Access in Johns Creek
Computing Device Access in Johns Creek
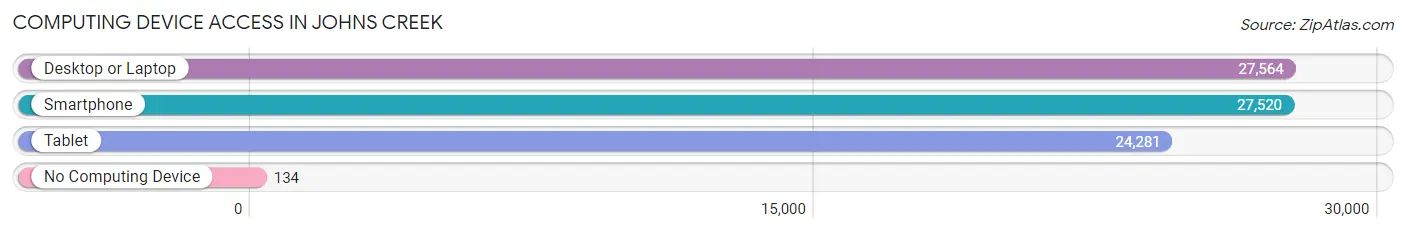
| Device Type | # Households | % Households |
| Desktop or Laptop | 27,564 | 96.9% |
| Smartphone | 27,520 | 96.8% |
| Tablet | 24,281 | 85.4% |
| No Computing Device | 134 | 0.5% |
| Total | 28,439 | 100.0% |
Internet Access in Johns Creek
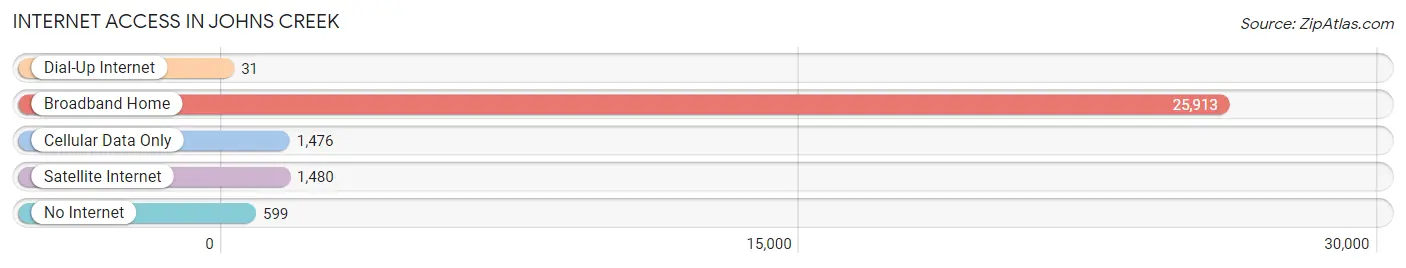
| Internet Type | # Households | % Households |
| Dial-Up Internet | 31 | 0.1% |
| Broadband Home | 25,913 | 91.1% |
| Cellular Data Only | 1,476 | 5.2% |
| Satellite Internet | 1,480 | 5.2% |
| No Internet | 599 | 2.1% |
| Total | 28,439 | 100.0% |
Johns Creek Summary
Johns Creek is a city located in Fulton County, Georgia, United States. It is a suburb of Atlanta and is located northeast of the city. The city was incorporated in 2006 and is the 10th largest city in the state. The city is named after John Rogers, who settled in the area in the early 1800s.
Geography
Johns Creek is located in the foothills of the Appalachian Mountains in the northern part of Fulton County. It is bordered by the cities of Alpharetta, Roswell, and Duluth. The city is situated along the Chattahoochee River and is home to several parks and nature preserves. The city has a total area of 31.3 square miles, of which 30.9 square miles is land and 0.4 square miles is water.
Climate
Johns Creek has a humid subtropical climate, with hot, humid summers and mild winters. The average annual temperature is 61°F, with an average high of 79°F in July and an average low of 43°F in January. The average annual precipitation is 50.2 inches, with an average of 4.3 inches of snowfall per year.
Demographics
As of the 2010 census, Johns Creek had a population of 76,728. The racial makeup of the city was 73.2% White, 11.3% Asian, 8.2% African American, 0.3% Native American, 0.1% Pacific Islander, 4.2% from other races, and 2.7% from two or more races. Hispanic or Latino of any race were 8.7% of the population.
Economy
Johns Creek is home to several major corporations, including State Farm Insurance, Siemens, and Verizon Wireless. The city is also home to several medical centers, including Northside Hospital-Forsyth and Emory Johns Creek Hospital. The city is also home to several shopping centers, including The Forum at Johns Creek and The Collection at Forsyth.
Education
Johns Creek is served by the Fulton County School System. The city is home to several public schools, including Johns Creek High School, Northview High School, and Chattahoochee High School. The city is also home to several private schools, including Mount Pisgah Christian School and The Weber School.
Johns Creek is also home to several higher education institutions, including Georgia State University-Perimeter College, Georgia Institute of Technology-Johns Creek, and Emory University-Johns Creek.
Conclusion
Johns Creek is a city located in Fulton County, Georgia, United States. It is a suburb of Atlanta and is located northeast of the city. The city was incorporated in 2006 and is the 10th largest city in the state. The city is named after John Rogers, who settled in the area in the early 1800s. Johns Creek has a humid subtropical climate, with hot, humid summers and mild winters. As of the 2010 census, Johns Creek had a population of 76,728. The city is home to several major corporations, including State Farm Insurance, Siemens, and Verizon Wireless. The city is also served by the Fulton County School System and is home to several higher education institutions. Johns Creek is a vibrant city with a rich history, diverse geography, and a strong economy.
Common Questions
What is Per Capita Income in Johns Creek?
Per Capita income in Johns Creek is $62,080.
What is the Median Family Income in Johns Creek?
Median Family Income in Johns Creek is $166,627.
What is the Median Household income in Johns Creek?
Median Household Income in Johns Creek is $153,882.
What is Income or Wage Gap in Johns Creek?
Income or Wage Gap in Johns Creek is 48.0%.
Women in Johns Creek earn 52.0 cents for every dollar earned by a man.
What is Inequality or Gini Index in Johns Creek?
Inequality or Gini Index in Johns Creek is 0.39.
What is the Total Population of Johns Creek?
Total Population of Johns Creek is 82,230.
What is the Total Male Population of Johns Creek?
Total Male Population of Johns Creek is 40,652.
What is the Total Female Population of Johns Creek?
Total Female Population of Johns Creek is 41,578.
What is the Ratio of Males per 100 Females in Johns Creek?
There are 97.77 Males per 100 Females in Johns Creek.
What is the Ratio of Females per 100 Males in Johns Creek?
There are 102.28 Females per 100 Males in Johns Creek.
What is the Median Population Age in Johns Creek?
Median Population Age in Johns Creek is 42.4 Years.
What is the Average Family Size in Johns Creek
Average Family Size in Johns Creek is 3.2 People.
What is the Average Household Size in Johns Creek
Average Household Size in Johns Creek is 2.9 People.
How Large is the Labor Force in Johns Creek?
There are 42,385 People in the Labor Forcein in Johns Creek.
What is the Percentage of People in the Labor Force in Johns Creek?
66.0% of People are in the Labor Force in Johns Creek.
What is the Unemployment Rate in Johns Creek?
Unemployment Rate in Johns Creek is 3.7%.