Kingman, KS Map & Demographics
Kingman Map
Kingman Overview
$27,581
PER CAPITA INCOME
$62,794
AVG FAMILY INCOME
$55,532
AVG HOUSEHOLD INCOME
15.0%
WAGE / INCOME GAP [ % ]
85.0¢/ $1
WAGE / INCOME GAP [ $ ]
0.33
INEQUALITY / GINI INDEX
3,051
TOTAL POPULATION
1,547
MALE POPULATION
1,504
FEMALE POPULATION
102.86
MALES / 100 FEMALES
97.22
FEMALES / 100 MALES
43.8
MEDIAN AGE
2.9
AVG FAMILY SIZE
2.1
AVG HOUSEHOLD SIZE
1,400
LABOR FORCE [ PEOPLE ]
55.9%
PERCENT IN LABOR FORCE
8.9%
UNEMPLOYMENT RATE
Kingman Zip Codes
Kingman Area Codes
Income in Kingman
Income Overview in Kingman
Per Capita Income in Kingman is $27,581, while median incomes of families and households are $62,794 and $55,532 respectively.
| Characteristic | Number | Measure |
| Per Capita Income | 3,051 | $27,581 |
| Median Family Income | 768 | $62,794 |
| Mean Family Income | 768 | $69,669 |
| Median Household Income | 1,382 | $55,532 |
| Mean Household Income | 1,382 | $59,738 |
| Income Deficit | 768 | $0 |
| Wage / Income Gap (%) | 3,051 | 14.98% |
| Wage / Income Gap ($) | 3,051 | 85.02¢ per $1 |
| Gini / Inequality Index | 3,051 | 0.33 |
Earnings by Sex in Kingman
Average Earnings in Kingman are $28,433, $29,523 for men and $25,099 for women, a difference of 15.0%.
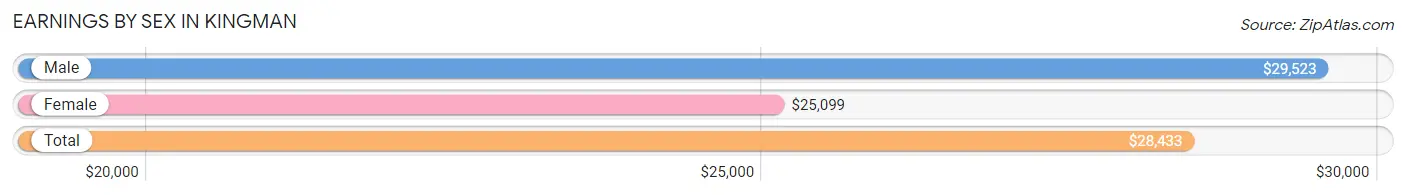
| Sex | Number | Average Earnings |
| Male | 885 (57.6%) | $29,523 |
| Female | 652 (42.4%) | $25,099 |
| Total | 1,537 (100.0%) | $28,433 |
Earnings by Sex by Income Bracket in Kingman
The most common earnings brackets in Kingman are $25,000 to $29,999 for men (181 | 20.4%) and $25,000 to $29,999 for women (92 | 14.1%).
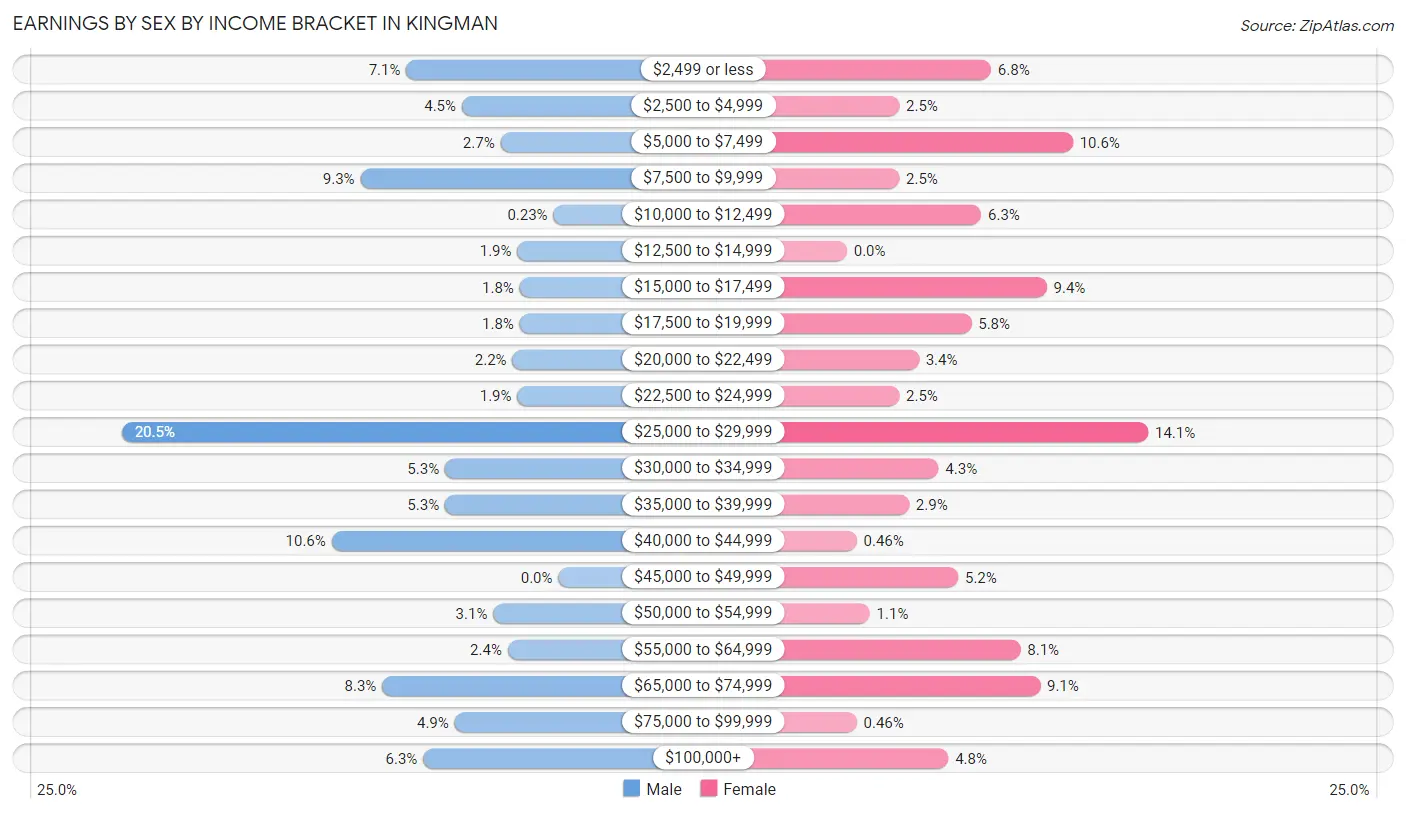
| Income | Male | Female |
| $2,499 or less | 63 (7.1%) | 44 (6.8%) |
| $2,500 to $4,999 | 40 (4.5%) | 16 (2.5%) |
| $5,000 to $7,499 | 24 (2.7%) | 69 (10.6%) |
| $7,500 to $9,999 | 82 (9.3%) | 16 (2.5%) |
| $10,000 to $12,499 | 2 (0.2%) | 41 (6.3%) |
| $12,500 to $14,999 | 17 (1.9%) | 0 (0.0%) |
| $15,000 to $17,499 | 16 (1.8%) | 61 (9.4%) |
| $17,500 to $19,999 | 16 (1.8%) | 38 (5.8%) |
| $20,000 to $22,499 | 19 (2.1%) | 22 (3.4%) |
| $22,500 to $24,999 | 17 (1.9%) | 16 (2.5%) |
| $25,000 to $29,999 | 181 (20.4%) | 92 (14.1%) |
| $30,000 to $34,999 | 47 (5.3%) | 28 (4.3%) |
| $35,000 to $39,999 | 47 (5.3%) | 19 (2.9%) |
| $40,000 to $44,999 | 94 (10.6%) | 3 (0.5%) |
| $45,000 to $49,999 | 0 (0.0%) | 34 (5.2%) |
| $50,000 to $54,999 | 27 (3.0%) | 7 (1.1%) |
| $55,000 to $64,999 | 21 (2.4%) | 53 (8.1%) |
| $65,000 to $74,999 | 73 (8.3%) | 59 (9.0%) |
| $75,000 to $99,999 | 43 (4.9%) | 3 (0.5%) |
| $100,000+ | 56 (6.3%) | 31 (4.8%) |
| Total | 885 (100.0%) | 652 (100.0%) |
Earnings by Sex by Educational Attainment in Kingman
Average earnings in Kingman are $34,389 for men and $26,513 for women, a difference of 22.9%. Men with an educational attainment of college or associate's degree enjoy the highest average annual earnings of $39,125, while those with high school diploma education earn the least with $29,329. Women with an educational attainment of graduate degree earn the most with the average annual earnings of $68,583, while those with less than high school education have the smallest earnings of $15,857.
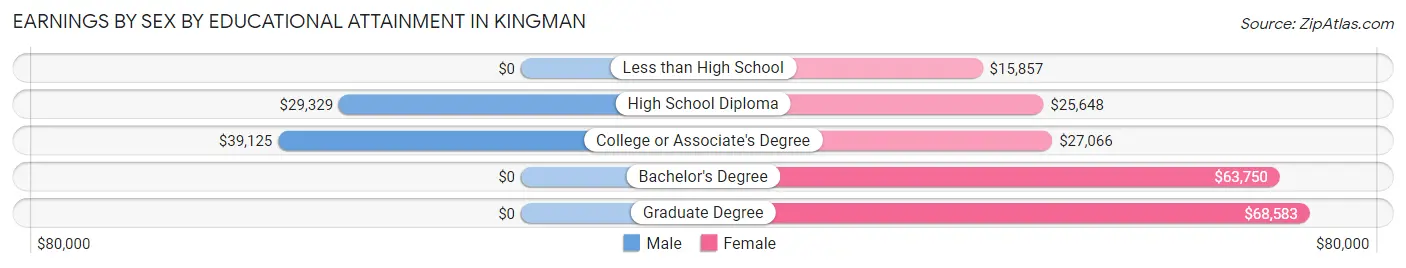
| Educational Attainment | Male Income | Female Income |
| Less than High School | - | - |
| High School Diploma | $29,329 | $25,648 |
| College or Associate's Degree | $39,125 | $27,066 |
| Bachelor's Degree | - | - |
| Graduate Degree | - | - |
| Total | $34,389 | $26,513 |
Family Income in Kingman
Family Income Brackets in Kingman
According to the Kingman family income data, there are 264 families falling into the $50,000 to $74,999 income range, which is the most common income bracket and makes up 34.4% of all families.
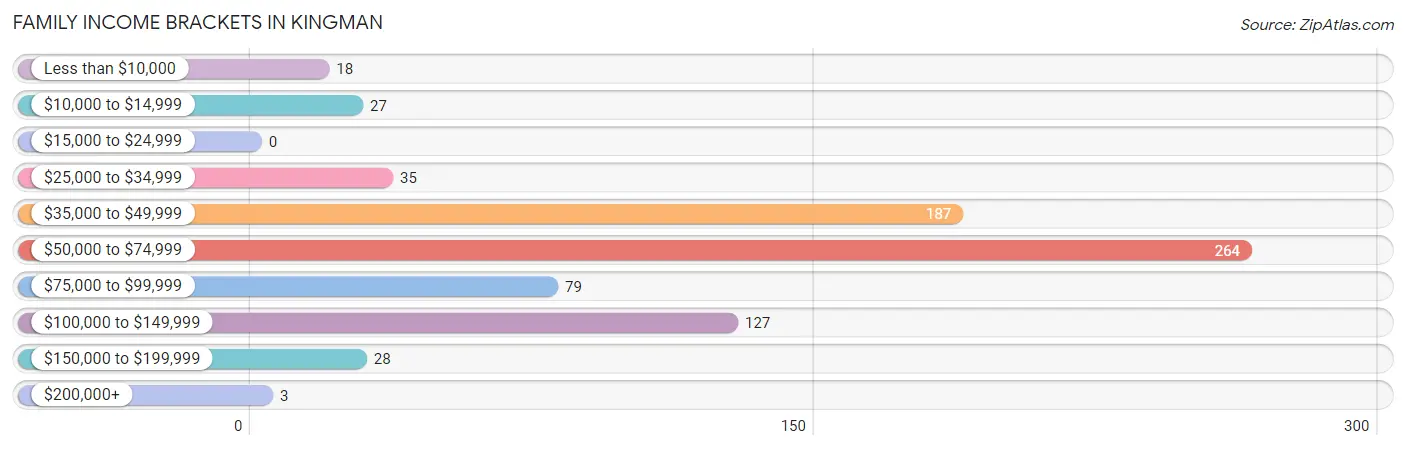
| Income Bracket | # Families | % Families |
| Less than $10,000 | 18 | 2.3% |
| $10,000 to $14,999 | 27 | 3.5% |
| $15,000 to $24,999 | 0 | 0.0% |
| $25,000 to $34,999 | 35 | 4.6% |
| $35,000 to $49,999 | 187 | 24.3% |
| $50,000 to $74,999 | 264 | 34.4% |
| $75,000 to $99,999 | 79 | 10.3% |
| $100,000 to $149,999 | 127 | 16.5% |
| $150,000 to $199,999 | 28 | 3.6% |
| $200,000+ | 3 | 0.4% |
Family Income by Famaliy Size in Kingman
4-person families (103 | 13.4%) account for the highest median family income in Kingman with $71,083 per family, while 2-person families (475 | 61.9%) have the highest median income of $29,797 per family member.
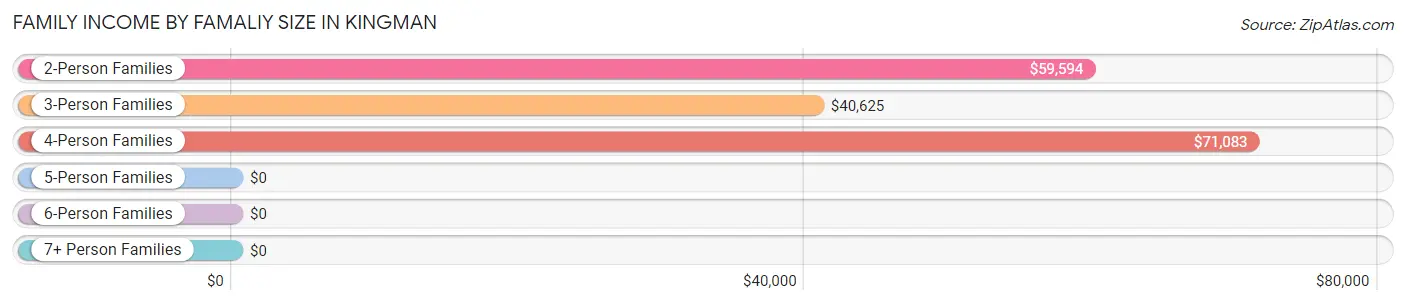
| Income Bracket | # Families | Median Income |
| 2-Person Families | 475 (61.9%) | $59,594 |
| 3-Person Families | 92 (12.0%) | $40,625 |
| 4-Person Families | 103 (13.4%) | $71,083 |
| 5-Person Families | 18 (2.3%) | $0 |
| 6-Person Families | 80 (10.4%) | $0 |
| 7+ Person Families | 0 (0.0%) | $0 |
| Total | 768 (100.0%) | $62,794 |
Family Income by Number of Earners in Kingman
The median family income in Kingman is $62,794, with families comprising 2 earners (295) having the highest median family income of $86,563, while families with no earners (170) have the lowest median family income of $38,667, accounting for 38.4% and 22.1% of families, respectively.
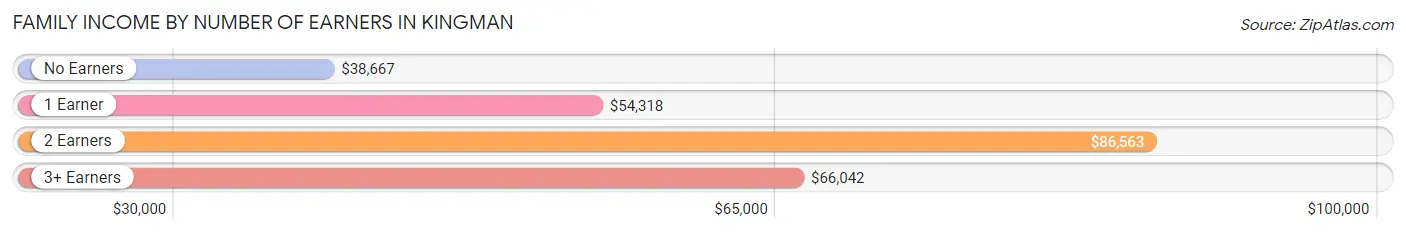
| Number of Earners | # Families | Median Income |
| No Earners | 170 (22.1%) | $38,667 |
| 1 Earner | 194 (25.3%) | $54,318 |
| 2 Earners | 295 (38.4%) | $86,563 |
| 3+ Earners | 109 (14.2%) | $66,042 |
| Total | 768 (100.0%) | $62,794 |
Household Income in Kingman
Household Income Brackets in Kingman
With 395 households falling in the category, the $50,000 to $74,999 income range is the most frequent in Kingman, accounting for 28.6% of all households. In contrast, only 3 households (0.2%) fall into the $200,000+ income bracket, making it the least populous group.
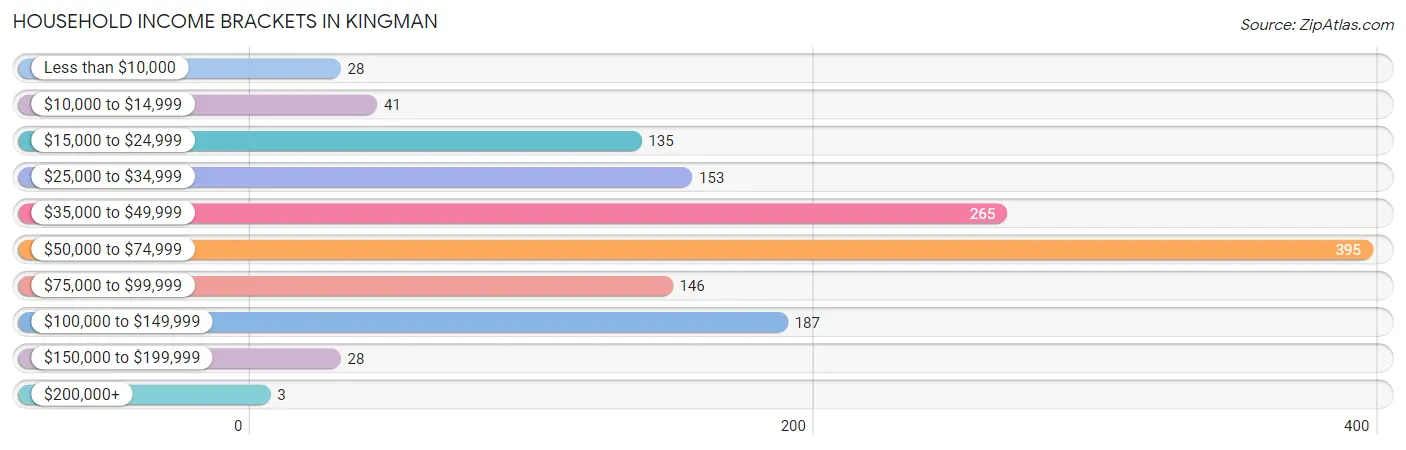
| Income Bracket | # Households | % Households |
| Less than $10,000 | 28 | 2.0% |
| $10,000 to $14,999 | 41 | 3.0% |
| $15,000 to $24,999 | 135 | 9.8% |
| $25,000 to $34,999 | 153 | 11.1% |
| $35,000 to $49,999 | 265 | 19.2% |
| $50,000 to $74,999 | 395 | 28.6% |
| $75,000 to $99,999 | 146 | 10.6% |
| $100,000 to $149,999 | 187 | 13.5% |
| $150,000 to $199,999 | 28 | 2.0% |
| $200,000+ | 3 | 0.2% |
Household Income by Householder Age in Kingman
The median household income in Kingman is $55,532, with the highest median household income of $65,000 found in the 45 to 64 years age bracket for the primary householder. A total of 528 households (38.2%) fall into this category. Meanwhile, the 15 to 24 years age bracket for the primary householder has the lowest median household income of $0, with 17 households (1.2%) in this group.
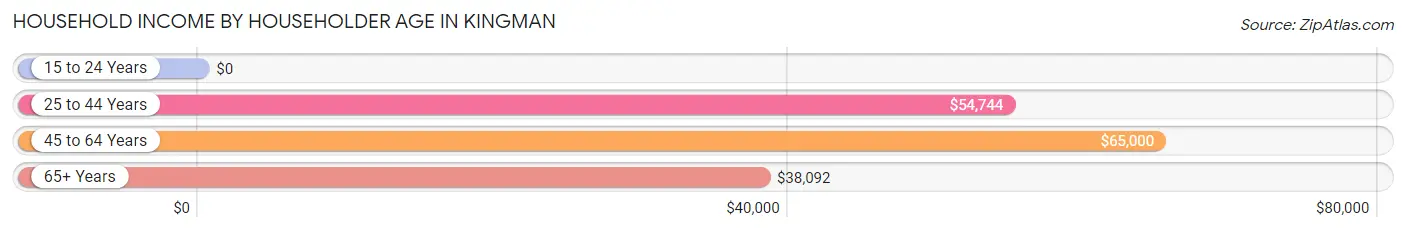
| Income Bracket | # Households | Median Income |
| 15 to 24 Years | 17 (1.2%) | $0 |
| 25 to 44 Years | 377 (27.3%) | $54,744 |
| 45 to 64 Years | 528 (38.2%) | $65,000 |
| 65+ Years | 460 (33.3%) | $38,092 |
| Total | 1,382 (100.0%) | $55,532 |
Poverty in Kingman
Income Below Poverty by Sex and Age in Kingman
With 11.7% poverty level for males and 10.6% for females among the residents of Kingman, 15 year old males and 16 and 17 year old females are the most vulnerable to poverty, with 39 males (100.0%) and 30 females (69.8%) in their respective age groups living below the poverty level.
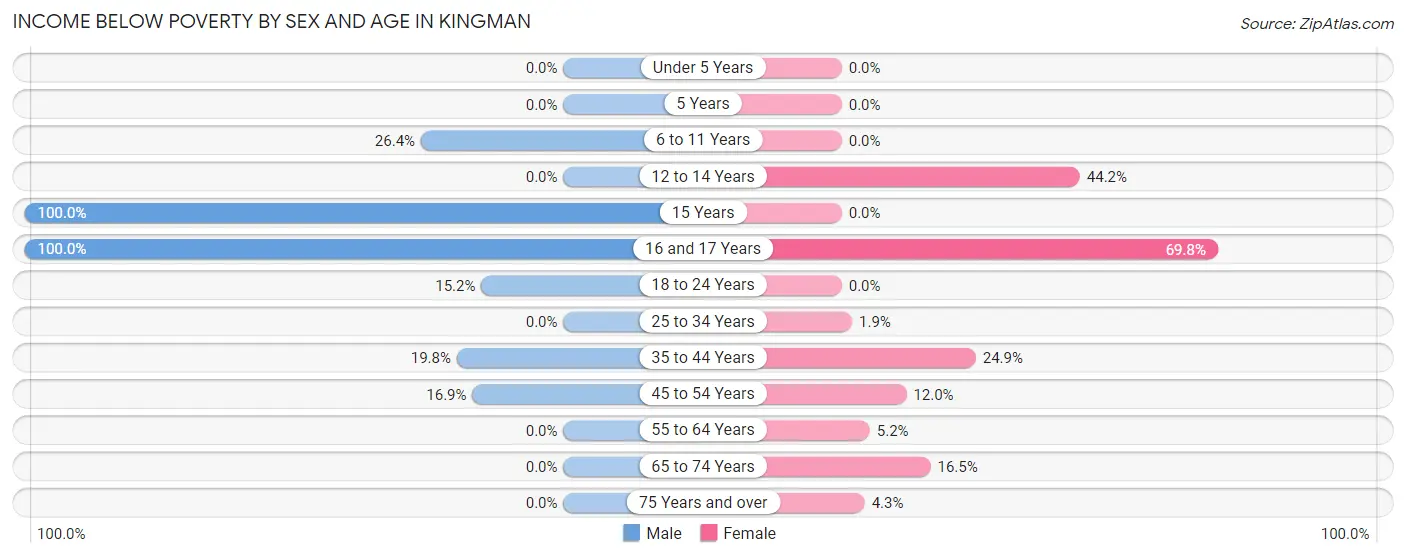
| Age Bracket | Male | Female |
| Under 5 Years | 0 (0.0%) | 0 (0.0%) |
| 5 Years | 0 (0.0%) | 0 (0.0%) |
| 6 to 11 Years | 23 (26.4%) | 0 (0.0%) |
| 12 to 14 Years | 0 (0.0%) | 19 (44.2%) |
| 15 Years | 39 (100.0%) | 0 (0.0%) |
| 16 and 17 Years | 18 (100.0%) | 30 (69.8%) |
| 18 to 24 Years | 23 (15.2%) | 0 (0.0%) |
| 25 to 34 Years | 0 (0.0%) | 3 (1.9%) |
| 35 to 44 Years | 36 (19.8%) | 49 (24.9%) |
| 45 to 54 Years | 38 (16.9%) | 15 (12.0%) |
| 55 to 64 Years | 0 (0.0%) | 13 (5.2%) |
| 65 to 74 Years | 0 (0.0%) | 14 (16.5%) |
| 75 Years and over | 0 (0.0%) | 9 (4.3%) |
| Total | 177 (11.7%) | 152 (10.6%) |
Income Above Poverty by Sex and Age in Kingman
According to the poverty statistics in Kingman, males aged under 5 years and females aged under 5 years are the age groups that are most secure financially, with 100.0% of males and 100.0% of females in these age groups living above the poverty line.
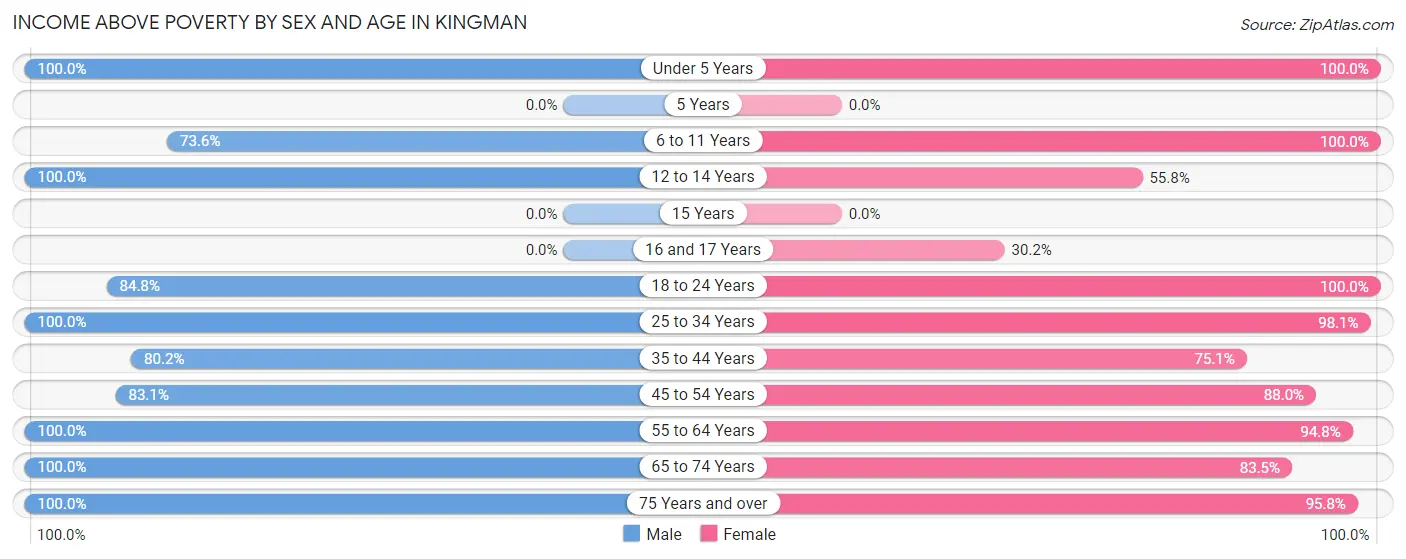
| Age Bracket | Male | Female |
| Under 5 Years | 91 (100.0%) | 106 (100.0%) |
| 5 Years | 0 (0.0%) | 0 (0.0%) |
| 6 to 11 Years | 64 (73.6%) | 120 (100.0%) |
| 12 to 14 Years | 56 (100.0%) | 24 (55.8%) |
| 15 Years | 0 (0.0%) | 0 (0.0%) |
| 16 and 17 Years | 0 (0.0%) | 13 (30.2%) |
| 18 to 24 Years | 128 (84.8%) | 97 (100.0%) |
| 25 to 34 Years | 159 (100.0%) | 154 (98.1%) |
| 35 to 44 Years | 146 (80.2%) | 148 (75.1%) |
| 45 to 54 Years | 187 (83.1%) | 110 (88.0%) |
| 55 to 64 Years | 227 (100.0%) | 237 (94.8%) |
| 65 to 74 Years | 196 (100.0%) | 71 (83.5%) |
| 75 Years and over | 85 (100.0%) | 203 (95.8%) |
| Total | 1,339 (88.3%) | 1,283 (89.4%) |
Income Below Poverty Among Married-Couple Families in Kingman
The poverty statistics for married-couple families in Kingman show that 6.6% or 41 of the total 618 families live below the poverty line. Families with 3 or 4 children have the highest poverty rate of 100.0%, comprising of 14 families. On the other hand, families with 1 or 2 children have the lowest poverty rate of 0.0%, which includes 0 families.
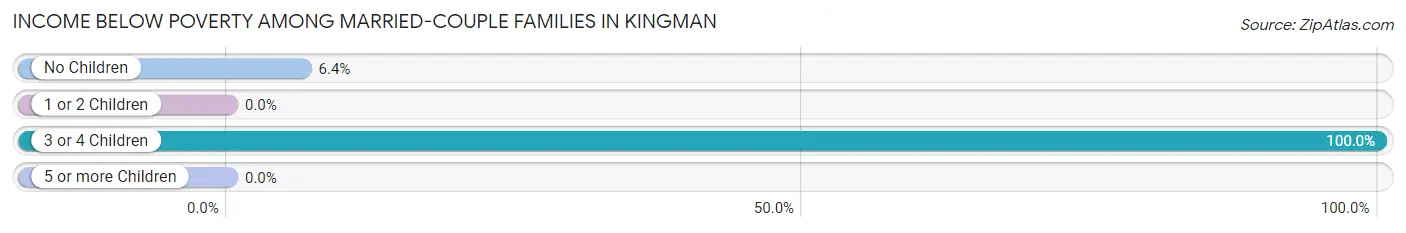
| Children | Above Poverty | Below Poverty |
| No Children | 395 (93.6%) | 27 (6.4%) |
| 1 or 2 Children | 182 (100.0%) | 0 (0.0%) |
| 3 or 4 Children | 0 (0.0%) | 14 (100.0%) |
| 5 or more Children | 0 (0.0%) | 0 (0.0%) |
| Total | 577 (93.4%) | 41 (6.6%) |
Income Below Poverty Among Single-Parent Households in Kingman
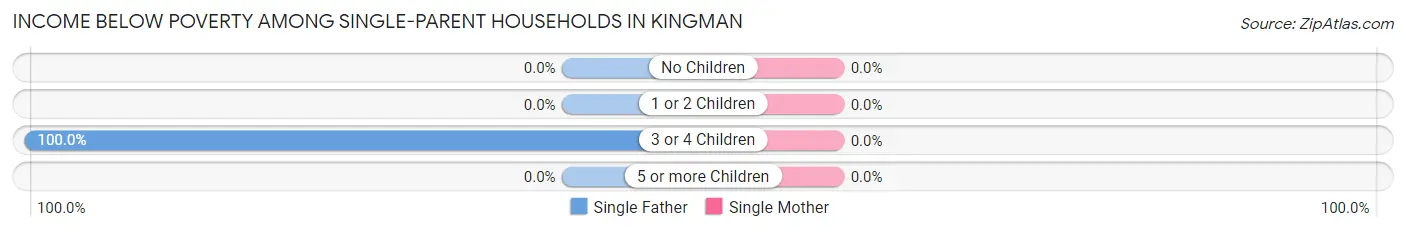
| Children | Single Father | Single Mother |
| No Children | 0 (0.0%) | 0 (0.0%) |
| 1 or 2 Children | 0 (0.0%) | 0 (0.0%) |
| 3 or 4 Children | 18 (100.0%) | 0 (0.0%) |
| 5 or more Children | 0 (0.0%) | 0 (0.0%) |
| Total | 18 (20.4%) | 0 (0.0%) |
Income Below Poverty Among Married-Couple vs Single-Parent Households in Kingman
The poverty data for Kingman shows that 41 of the married-couple family households (6.6%) and 18 of the single-parent households (12.0%) are living below the poverty level. Within the married-couple family households, those with 3 or 4 children have the highest poverty rate, with 14 households (100.0%) falling below the poverty line. Among the single-parent households, those with 3 or 4 children have the highest poverty rate, with 18 household (62.1%) living below poverty.
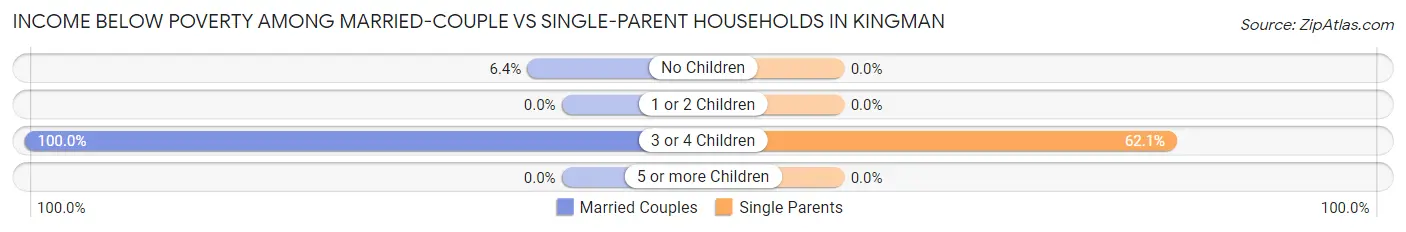
| Children | Married-Couple Families | Single-Parent Households |
| No Children | 27 (6.4%) | 0 (0.0%) |
| 1 or 2 Children | 0 (0.0%) | 0 (0.0%) |
| 3 or 4 Children | 14 (100.0%) | 18 (62.1%) |
| 5 or more Children | 0 (0.0%) | 0 (0.0%) |
| Total | 41 (6.6%) | 18 (12.0%) |
Race in Kingman
The most populous races in Kingman are White / Caucasian (2,852 | 93.5%), Some other Race (124 | 4.1%), and Two or more Races (55 | 1.8%).
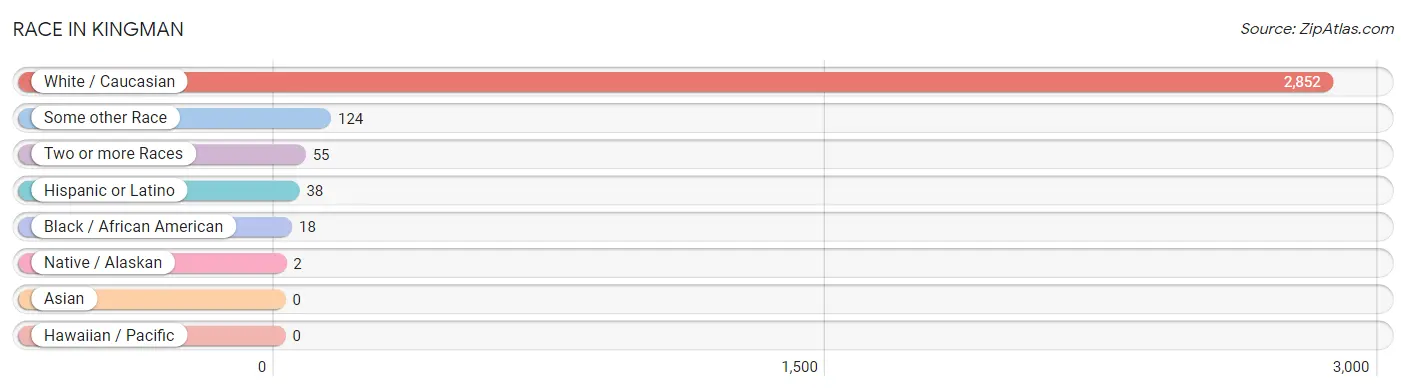
| Race | # Population | % Population |
| Asian | 0 | 0.0% |
| Black / African American | 18 | 0.6% |
| Hawaiian / Pacific | 0 | 0.0% |
| Hispanic or Latino | 38 | 1.3% |
| Native / Alaskan | 2 | 0.1% |
| White / Caucasian | 2,852 | 93.5% |
| Two or more Races | 55 | 1.8% |
| Some other Race | 124 | 4.1% |
| Total | 3,051 | 100.0% |
Ancestry in Kingman
The most populous ancestries reported in Kingman are German (884 | 29.0%), Irish (363 | 11.9%), English (299 | 9.8%), French (176 | 5.8%), and American (132 | 4.3%), together accounting for 60.8% of all Kingman residents.
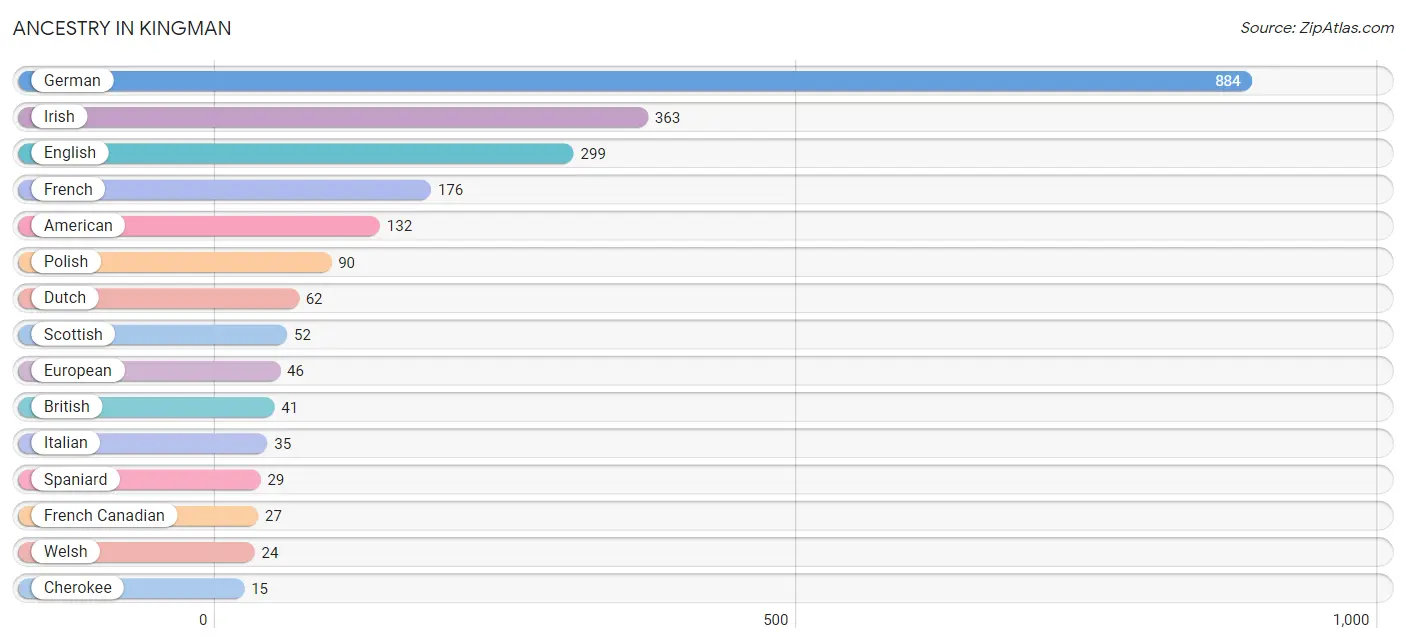
| Ancestry | # Population | % Population |
| African | 1 | 0.0% |
| American | 132 | 4.3% |
| Austrian | 14 | 0.5% |
| Bhutanese | 7 | 0.2% |
| Blackfeet | 1 | 0.0% |
| British | 41 | 1.3% |
| Cherokee | 15 | 0.5% |
| Czech | 1 | 0.0% |
| Dominican | 1 | 0.0% |
| Dutch | 62 | 2.0% |
| English | 299 | 9.8% |
| European | 46 | 1.5% |
| French | 176 | 5.8% |
| French Canadian | 27 | 0.9% |
| German | 884 | 29.0% |
| German Russian | 10 | 0.3% |
| Irish | 363 | 11.9% |
| Italian | 35 | 1.1% |
| Lithuanian | 7 | 0.2% |
| Mexican | 8 | 0.3% |
| Norwegian | 9 | 0.3% |
| Polish | 90 | 2.9% |
| Scotch-Irish | 9 | 0.3% |
| Scottish | 52 | 1.7% |
| Spaniard | 29 | 0.9% |
| Subsaharan African | 1 | 0.0% |
| Swiss | 10 | 0.3% |
| Welsh | 24 | 0.8% | View All 28 Rows |
Immigrants in Kingman
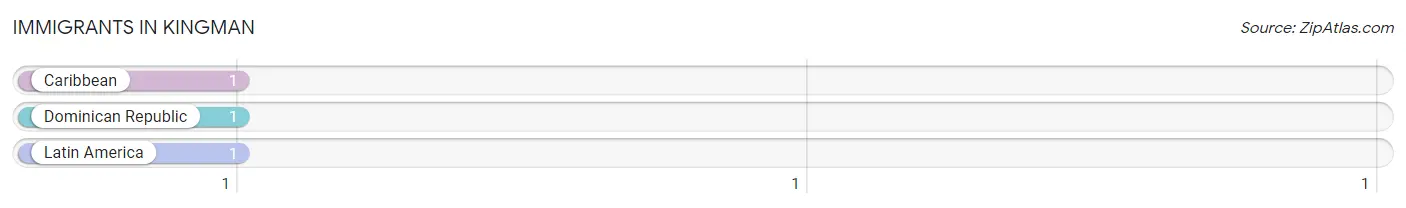
The most numerous immigrant groups reported in Kingman came from Caribbean (1 | 0.0%), Dominican Republic (1 | 0.0%), and Latin America (1 | 0.0%), together accounting for 0.1% of all Kingman residents.
| Immigration Origin | # Population | % Population |
| Caribbean | 1 | 0.0% |
| Dominican Republic | 1 | 0.0% |
| Latin America | 1 | 0.0% | View All 3 Rows |
Sex and Age in Kingman
Sex and Age in Kingman
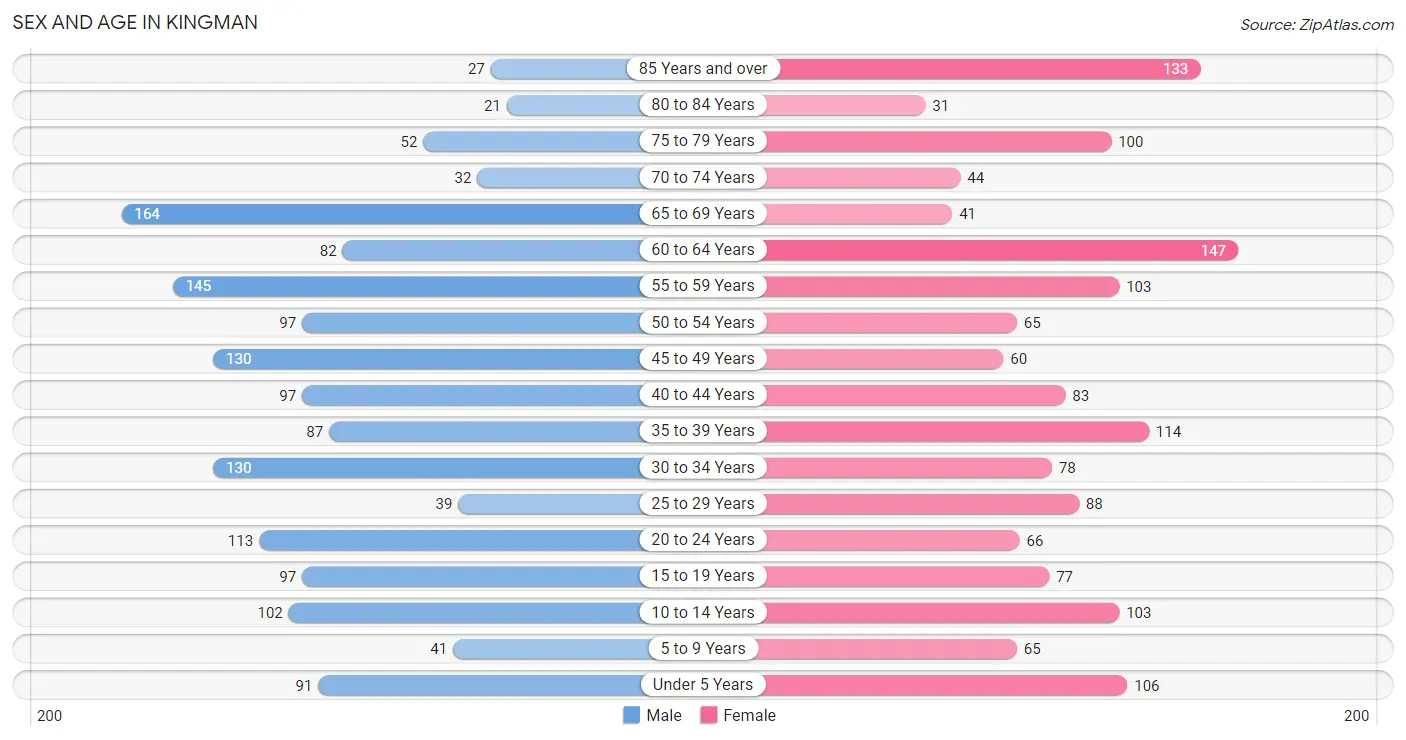
The most populous age groups in Kingman are 65 to 69 Years (164 | 10.6%) for men and 60 to 64 Years (147 | 9.8%) for women.
| Age Bracket | Male | Female |
| Under 5 Years | 91 (5.9%) | 106 (7.0%) |
| 5 to 9 Years | 41 (2.6%) | 65 (4.3%) |
| 10 to 14 Years | 102 (6.6%) | 103 (6.9%) |
| 15 to 19 Years | 97 (6.3%) | 77 (5.1%) |
| 20 to 24 Years | 113 (7.3%) | 66 (4.4%) |
| 25 to 29 Years | 39 (2.5%) | 88 (5.9%) |
| 30 to 34 Years | 130 (8.4%) | 78 (5.2%) |
| 35 to 39 Years | 87 (5.6%) | 114 (7.6%) |
| 40 to 44 Years | 97 (6.3%) | 83 (5.5%) |
| 45 to 49 Years | 130 (8.4%) | 60 (4.0%) |
| 50 to 54 Years | 97 (6.3%) | 65 (4.3%) |
| 55 to 59 Years | 145 (9.4%) | 103 (6.9%) |
| 60 to 64 Years | 82 (5.3%) | 147 (9.8%) |
| 65 to 69 Years | 164 (10.6%) | 41 (2.7%) |
| 70 to 74 Years | 32 (2.1%) | 44 (2.9%) |
| 75 to 79 Years | 52 (3.4%) | 100 (6.7%) |
| 80 to 84 Years | 21 (1.4%) | 31 (2.1%) |
| 85 Years and over | 27 (1.8%) | 133 (8.8%) |
| Total | 1,547 (100.0%) | 1,504 (100.0%) |
Families and Households in Kingman
Median Family Size in Kingman
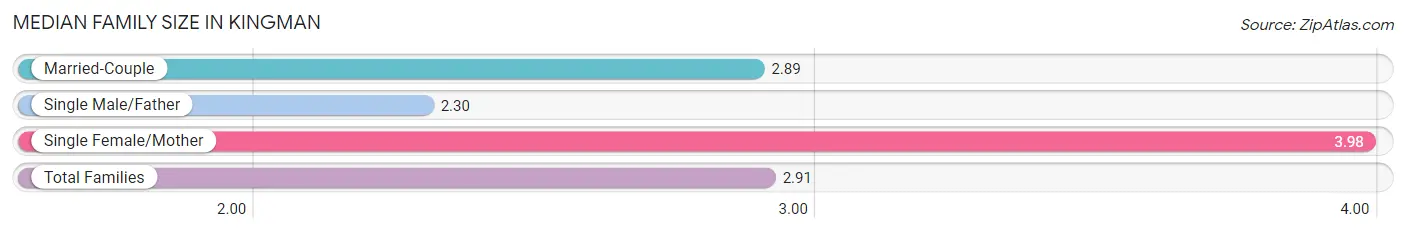
The median family size in Kingman is 2.91 persons per family, with single female/mother families (62 | 8.1%) accounting for the largest median family size of 3.98 persons per family. On the other hand, single male/father families (88 | 11.5%) represent the smallest median family size with 2.30 persons per family.
| Family Type | # Families | Family Size |
| Married-Couple | 618 (80.5%) | 2.89 |
| Single Male/Father | 88 (11.5%) | 2.30 |
| Single Female/Mother | 62 (8.1%) | 3.98 |
| Total Families | 768 (100.0%) | 2.91 |
Median Household Size in Kingman
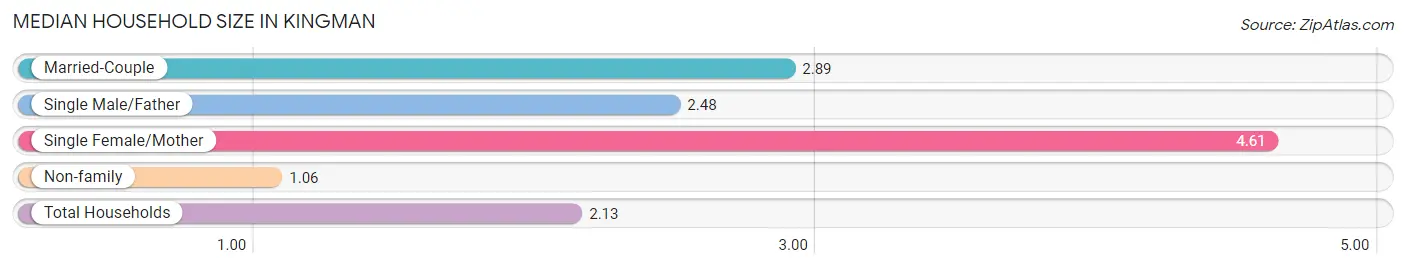
The median household size in Kingman is 2.13 persons per household, with single female/mother households (62 | 4.5%) accounting for the largest median household size of 4.61 persons per household. non-family households (614 | 44.4%) represent the smallest median household size with 1.06 persons per household.
| Household Type | # Households | Household Size |
| Married-Couple | 618 (44.7%) | 2.89 |
| Single Male/Father | 88 (6.4%) | 2.48 |
| Single Female/Mother | 62 (4.5%) | 4.61 |
| Non-family | 614 (44.4%) | 1.06 |
| Total Households | 1,382 (100.0%) | 2.13 |
Household Size by Marriage Status in Kingman
Out of a total of 1,382 households in Kingman, 768 (55.6%) are family households, while 614 (44.4%) are nonfamily households. The most numerous type of family households are 2-person households, comprising 475, and the most common type of nonfamily households are 1-person households, comprising 578.
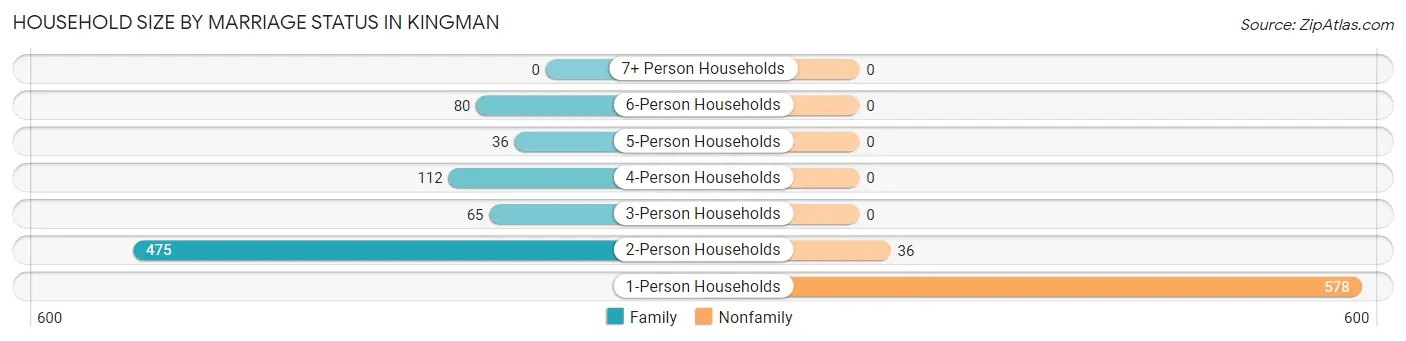
| Household Size | Family Households | Nonfamily Households |
| 1-Person Households | - | 578 (41.8%) |
| 2-Person Households | 475 (34.4%) | 36 (2.6%) |
| 3-Person Households | 65 (4.7%) | 0 (0.0%) |
| 4-Person Households | 112 (8.1%) | 0 (0.0%) |
| 5-Person Households | 36 (2.6%) | 0 (0.0%) |
| 6-Person Households | 80 (5.8%) | 0 (0.0%) |
| 7+ Person Households | 0 (0.0%) | 0 (0.0%) |
| Total | 768 (55.6%) | 614 (44.4%) |
Female Fertility in Kingman
Fertility by Age in Kingman
Average fertility rate in Kingman is 113.0 births per 1,000 women. Women in the age bracket of 20 to 34 years have the highest fertility rate with 276.0 births per 1,000 women. Women in the age bracket of 20 to 34 years acount for 100.0% of all women with births.
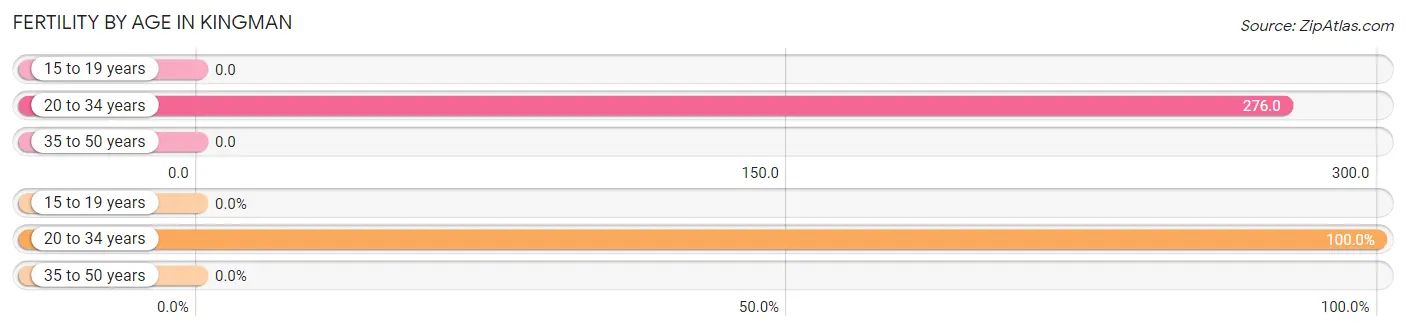
| Age Bracket | Women with Births | Births / 1,000 Women |
| 15 to 19 years | 0 (0.0%) | 0.0 |
| 20 to 34 years | 64 (100.0%) | 276.0 |
| 35 to 50 years | 0 (0.0%) | 0.0 |
| Total | 64 (100.0%) | 113.0 |
Fertility by Age by Marriage Status in Kingman
98.4% of women with births (64) in Kingman are married. The highest percentage of unmarried women with births falls into 20 to 34 years age bracket with 1.6% of them unmarried at the time of birth, while the lowest percentage of unmarried women with births belong to 20 to 34 years age bracket with 1.6% of them unmarried.
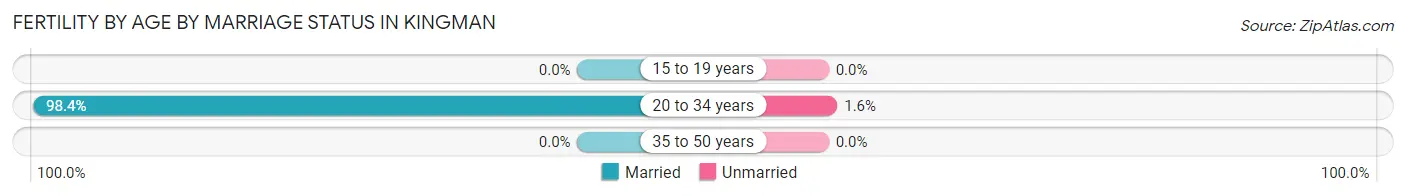
| Age Bracket | Married | Unmarried |
| 15 to 19 years | 0 (0.0%) | 0 (0.0%) |
| 20 to 34 years | 63 (98.4%) | 1 (1.6%) |
| 35 to 50 years | 0 (0.0%) | 0 (0.0%) |
| Total | 63 (98.4%) | 1 (1.6%) |
Fertility by Education in Kingman
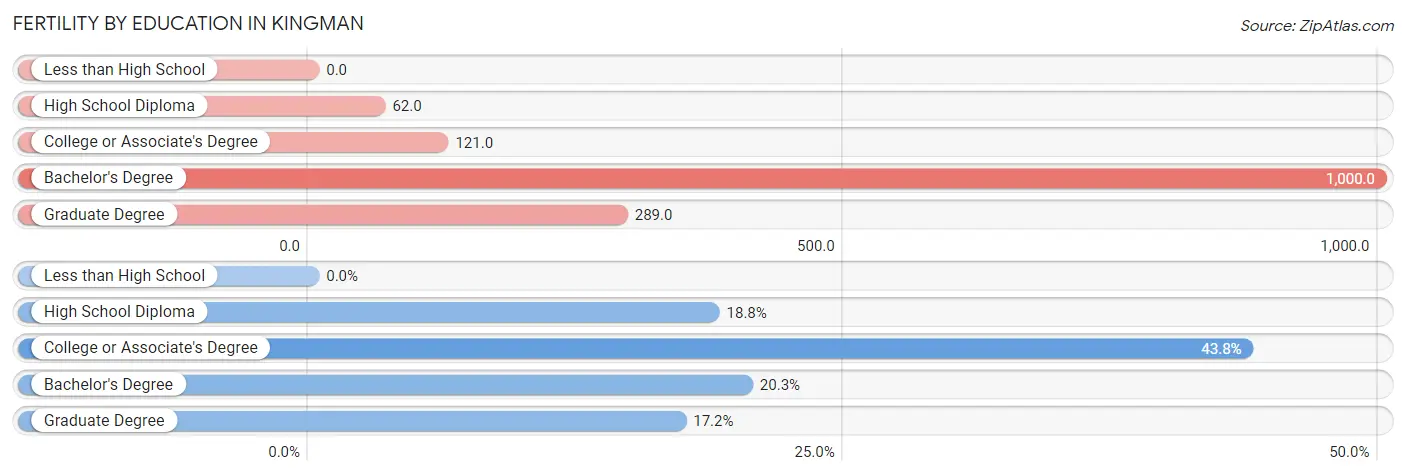
| Educational Attainment | Women with Births | Births / 1,000 Women |
| Less than High School | 0 (0.0%) | 0.0 |
| High School Diploma | 12 (18.8%) | 62.0 |
| College or Associate's Degree | 28 (43.8%) | 121.0 |
| Bachelor's Degree | 13 (20.3%) | 1,000.0 |
| Graduate Degree | 11 (17.2%) | 289.0 |
| Total | 64 (100.0%) | 113.0 |
Fertility by Education by Marriage Status in Kingman
1.6% of women with births in Kingman are unmarried. Women with the educational attainment of college or associate's degree are most likely to be married with 100.0% of them married at childbirth, while women with the educational attainment of high school diploma are least likely to be married with 8.3% of them unmarried at childbirth.
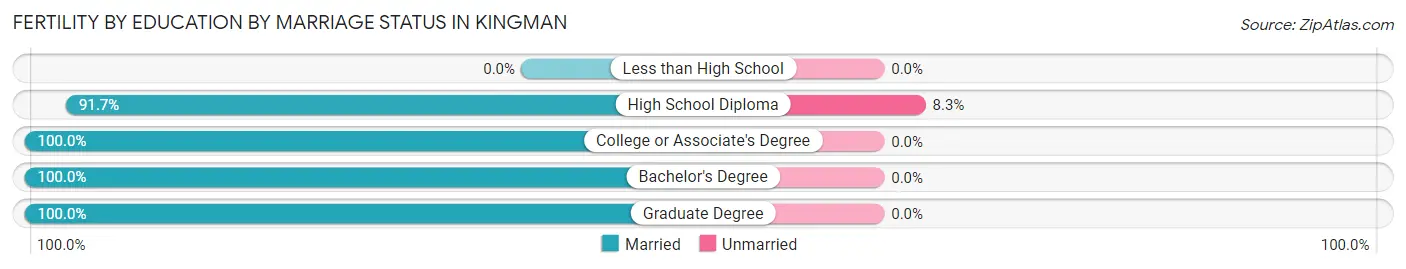
| Educational Attainment | Married | Unmarried |
| Less than High School | 0 (0.0%) | 0 (0.0%) |
| High School Diploma | 11 (91.7%) | 1 (8.3%) |
| College or Associate's Degree | 28 (100.0%) | 0 (0.0%) |
| Bachelor's Degree | 13 (100.0%) | 0 (0.0%) |
| Graduate Degree | 11 (100.0%) | 0 (0.0%) |
| Total | 63 (98.4%) | 1 (1.6%) |
Employment Characteristics in Kingman
Employment by Class of Employer in Kingman
Among the 1,263 employed individuals in Kingman, private company employees (778 | 61.6%), local government employees (214 | 16.9%), and not-for-profit organizations (106 | 8.4%) make up the most common classes of employment.
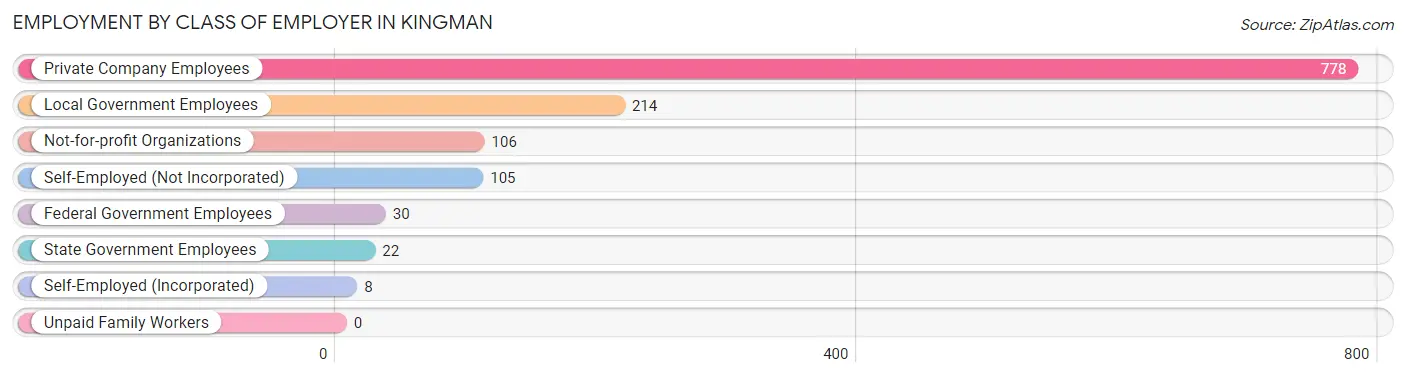
| Employer Class | # Employees | % Employees |
| Private Company Employees | 778 | 61.6% |
| Self-Employed (Incorporated) | 8 | 0.6% |
| Self-Employed (Not Incorporated) | 105 | 8.3% |
| Not-for-profit Organizations | 106 | 8.4% |
| Local Government Employees | 214 | 16.9% |
| State Government Employees | 22 | 1.7% |
| Federal Government Employees | 30 | 2.4% |
| Unpaid Family Workers | 0 | 0.0% |
| Total | 1,263 | 100.0% |
Employment Status by Age in Kingman
According to the labor force statistics for Kingman, out of the total population over 16 years of age (2,504), 55.9% or 1,400 individuals are in the labor force, with 8.9% or 125 of them unemployed. The age group with the highest labor force participation rate is 45 to 54 years, with 87.5% or 308 individuals in the labor force. Within the labor force, the 20 to 24 years age range has the highest percentage of unemployed individuals, with 68.2% or 88 of them being unemployed.
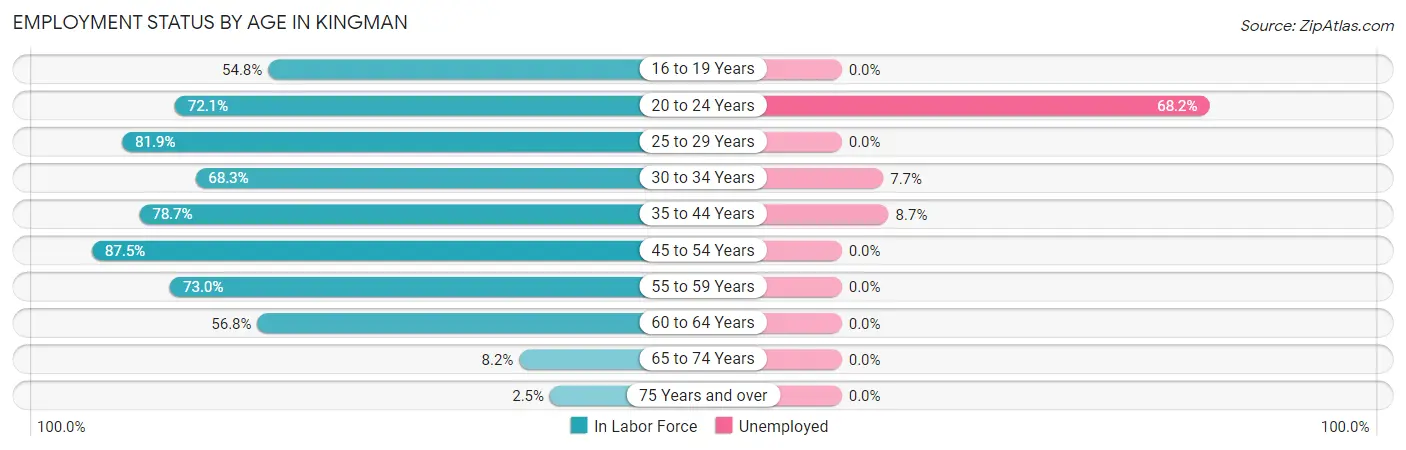
| Age Bracket | In Labor Force | Unemployed |
| 16 to 19 Years | 74 (54.8%) | 0 (0.0%) |
| 20 to 24 Years | 129 (72.1%) | 88 (68.2%) |
| 25 to 29 Years | 104 (81.9%) | 0 (0.0%) |
| 30 to 34 Years | 142 (68.3%) | 11 (7.7%) |
| 35 to 44 Years | 300 (78.7%) | 26 (8.7%) |
| 45 to 54 Years | 308 (87.5%) | 0 (0.0%) |
| 55 to 59 Years | 181 (73.0%) | 0 (0.0%) |
| 60 to 64 Years | 130 (56.8%) | 0 (0.0%) |
| 65 to 74 Years | 23 (8.2%) | 0 (0.0%) |
| 75 Years and over | 9 (2.5%) | 0 (0.0%) |
| Total | 1,400 (55.9%) | 125 (8.9%) |
Employment Status by Educational Attainment in Kingman
According to labor force statistics for Kingman, 75.4% of individuals (1,165) out of the total population between 25 and 64 years of age (1,545) are in the labor force, with 3.2% or 37 of them being unemployed. The group with the highest labor force participation rate are those with the educational attainment of bachelor's degree or higher, with 78.8% or 182 individuals in the labor force. Within the labor force, individuals with high school diploma education have the highest percentage of unemployment, with 6.9% or 29 of them being unemployed.
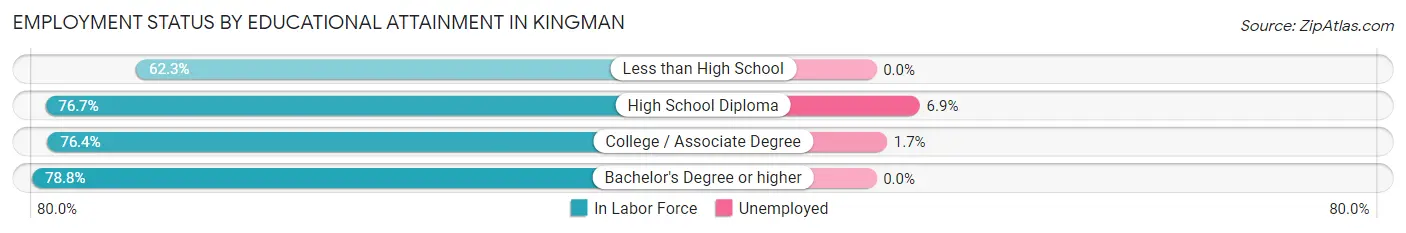
| Educational Attainment | In Labor Force | Unemployed |
| Less than High School | 101 (62.3%) | 0 (0.0%) |
| High School Diploma | 418 (76.7%) | 38 (6.9%) |
| College / Associate Degree | 464 (76.4%) | 10 (1.7%) |
| Bachelor's Degree or higher | 182 (78.8%) | 0 (0.0%) |
| Total | 1,165 (75.4%) | 49 (3.2%) |
Employment Occupations by Sex in Kingman
Management, Business, Science and Arts Occupations
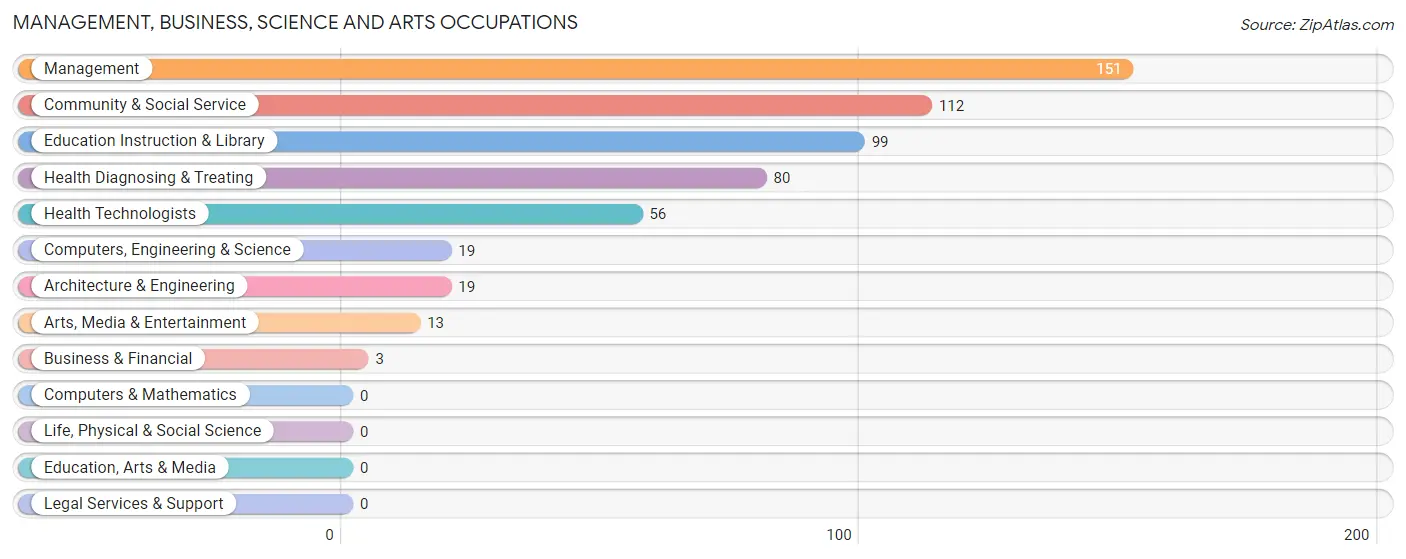
The most common Management, Business, Science and Arts occupations in Kingman are Management (151 | 11.8%), Community & Social Service (112 | 8.8%), Education Instruction & Library (99 | 7.8%), Health Diagnosing & Treating (80 | 6.3%), and Health Technologists (56 | 4.4%).
Management, Business, Science and Arts Occupations by Sex
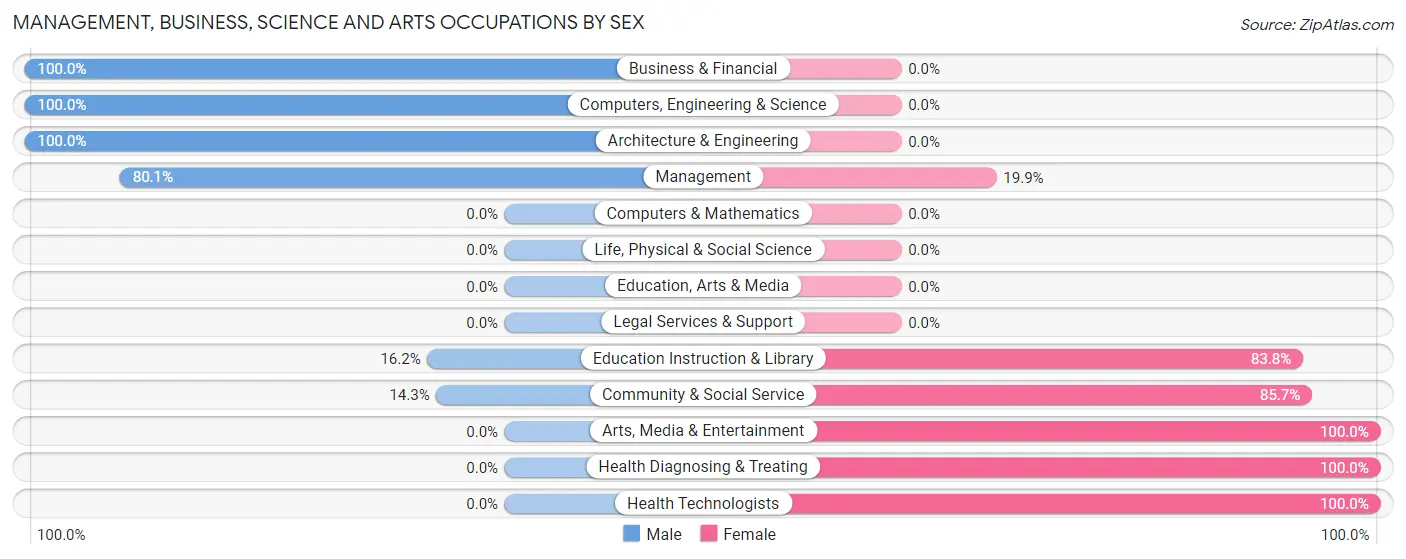
Within the Management, Business, Science and Arts occupations in Kingman, the most male-oriented occupations are Business & Financial (100.0%), Computers, Engineering & Science (100.0%), and Architecture & Engineering (100.0%), while the most female-oriented occupations are Arts, Media & Entertainment (100.0%), Health Diagnosing & Treating (100.0%), and Health Technologists (100.0%).
| Occupation | Male | Female |
| Management | 121 (80.1%) | 30 (19.9%) |
| Business & Financial | 3 (100.0%) | 0 (0.0%) |
| Computers, Engineering & Science | 19 (100.0%) | 0 (0.0%) |
| Computers & Mathematics | 0 (0.0%) | 0 (0.0%) |
| Architecture & Engineering | 19 (100.0%) | 0 (0.0%) |
| Life, Physical & Social Science | 0 (0.0%) | 0 (0.0%) |
| Community & Social Service | 16 (14.3%) | 96 (85.7%) |
| Education, Arts & Media | 0 (0.0%) | 0 (0.0%) |
| Legal Services & Support | 0 (0.0%) | 0 (0.0%) |
| Education Instruction & Library | 16 (16.2%) | 83 (83.8%) |
| Arts, Media & Entertainment | 0 (0.0%) | 13 (100.0%) |
| Health Diagnosing & Treating | 0 (0.0%) | 80 (100.0%) |
| Health Technologists | 0 (0.0%) | 56 (100.0%) |
| Total (Category) | 159 (43.6%) | 206 (56.4%) |
| Total (Overall) | 699 (54.8%) | 576 (45.2%) |
Services Occupations
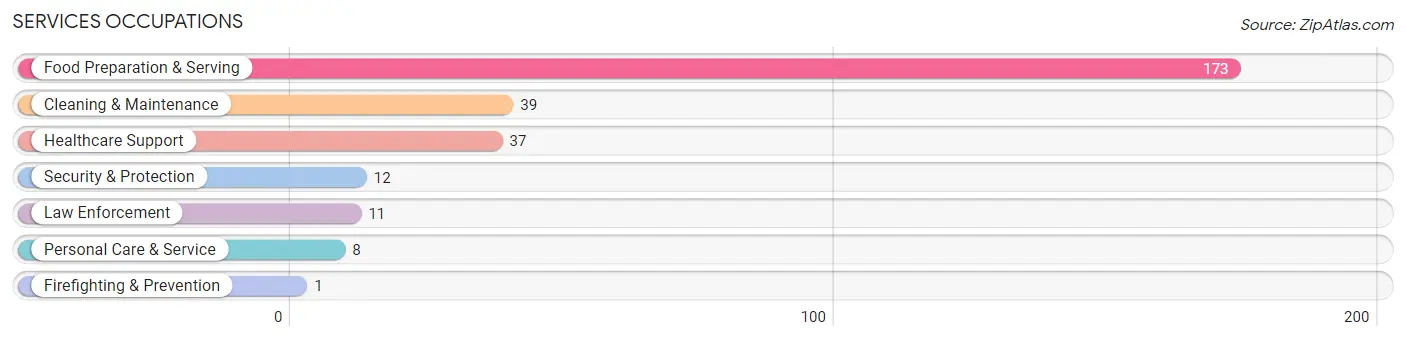
The most common Services occupations in Kingman are Food Preparation & Serving (173 | 13.6%), Cleaning & Maintenance (39 | 3.1%), Healthcare Support (37 | 2.9%), Security & Protection (12 | 0.9%), and Law Enforcement (11 | 0.9%).
Services Occupations by Sex
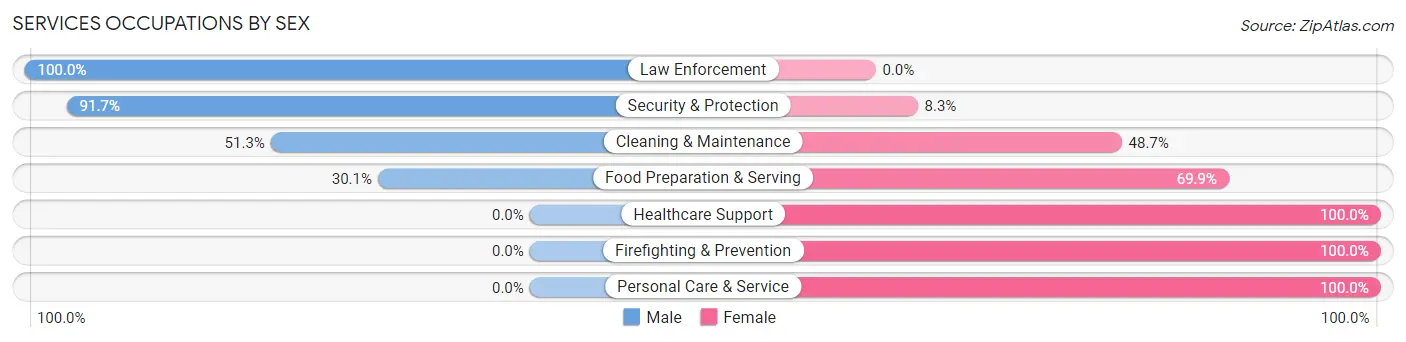
Within the Services occupations in Kingman, the most male-oriented occupations are Law Enforcement (100.0%), Security & Protection (91.7%), and Cleaning & Maintenance (51.3%), while the most female-oriented occupations are Healthcare Support (100.0%), Firefighting & Prevention (100.0%), and Personal Care & Service (100.0%).
| Occupation | Male | Female |
| Healthcare Support | 0 (0.0%) | 37 (100.0%) |
| Security & Protection | 11 (91.7%) | 1 (8.3%) |
| Firefighting & Prevention | 0 (0.0%) | 1 (100.0%) |
| Law Enforcement | 11 (100.0%) | 0 (0.0%) |
| Food Preparation & Serving | 52 (30.1%) | 121 (69.9%) |
| Cleaning & Maintenance | 20 (51.3%) | 19 (48.7%) |
| Personal Care & Service | 0 (0.0%) | 8 (100.0%) |
| Total (Category) | 83 (30.9%) | 186 (69.1%) |
| Total (Overall) | 699 (54.8%) | 576 (45.2%) |
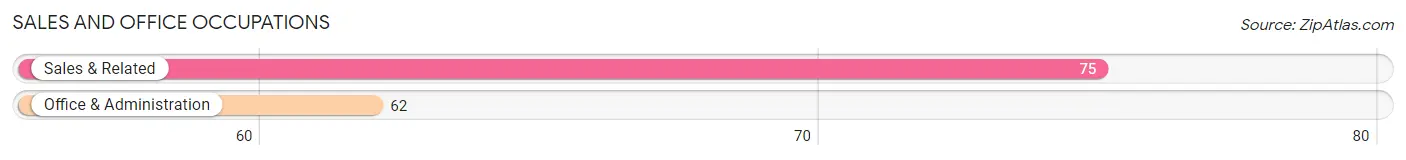
Sales and Office Occupations
The most common Sales and Office occupations in Kingman are Sales & Related (75 | 5.9%), and Office & Administration (62 | 4.9%).
Sales and Office Occupations by Sex
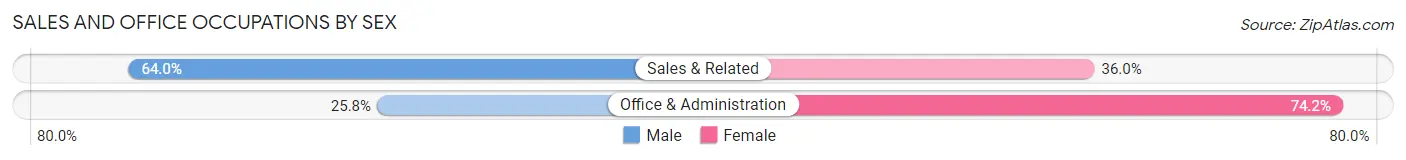
| Occupation | Male | Female |
| Sales & Related | 48 (64.0%) | 27 (36.0%) |
| Office & Administration | 16 (25.8%) | 46 (74.2%) |
| Total (Category) | 64 (46.7%) | 73 (53.3%) |
| Total (Overall) | 699 (54.8%) | 576 (45.2%) |
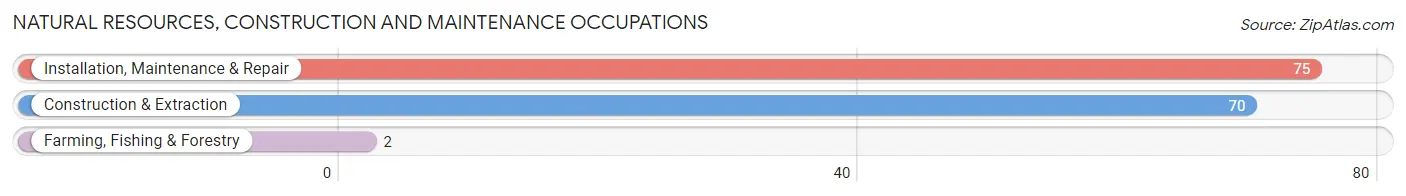
Natural Resources, Construction and Maintenance Occupations
The most common Natural Resources, Construction and Maintenance occupations in Kingman are Installation, Maintenance & Repair (75 | 5.9%), Construction & Extraction (70 | 5.5%), and Farming, Fishing & Forestry (2 | 0.2%).
Natural Resources, Construction and Maintenance Occupations by Sex
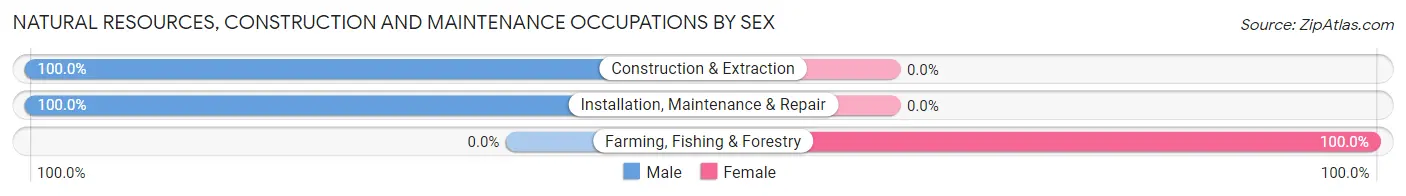
| Occupation | Male | Female |
| Farming, Fishing & Forestry | 0 (0.0%) | 2 (100.0%) |
| Construction & Extraction | 70 (100.0%) | 0 (0.0%) |
| Installation, Maintenance & Repair | 75 (100.0%) | 0 (0.0%) |
| Total (Category) | 145 (98.6%) | 2 (1.4%) |
| Total (Overall) | 699 (54.8%) | 576 (45.2%) |
Production, Transportation and Moving Occupations
The most common Production, Transportation and Moving occupations in Kingman are Production (255 | 20.0%), Transportation (71 | 5.6%), and Material Moving (31 | 2.4%).
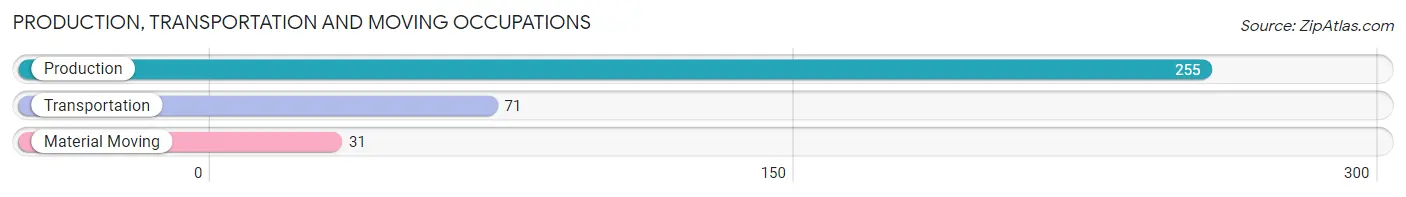
Production, Transportation and Moving Occupations by Sex
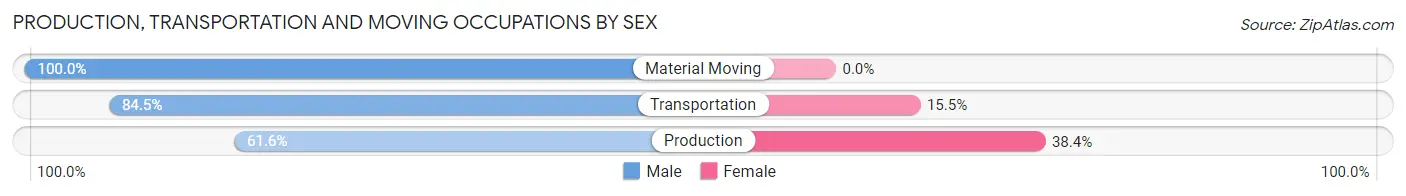
| Occupation | Male | Female |
| Production | 157 (61.6%) | 98 (38.4%) |
| Transportation | 60 (84.5%) | 11 (15.5%) |
| Material Moving | 31 (100.0%) | 0 (0.0%) |
| Total (Category) | 248 (69.5%) | 109 (30.5%) |
| Total (Overall) | 699 (54.8%) | 576 (45.2%) |
Employment Industries by Sex in Kingman
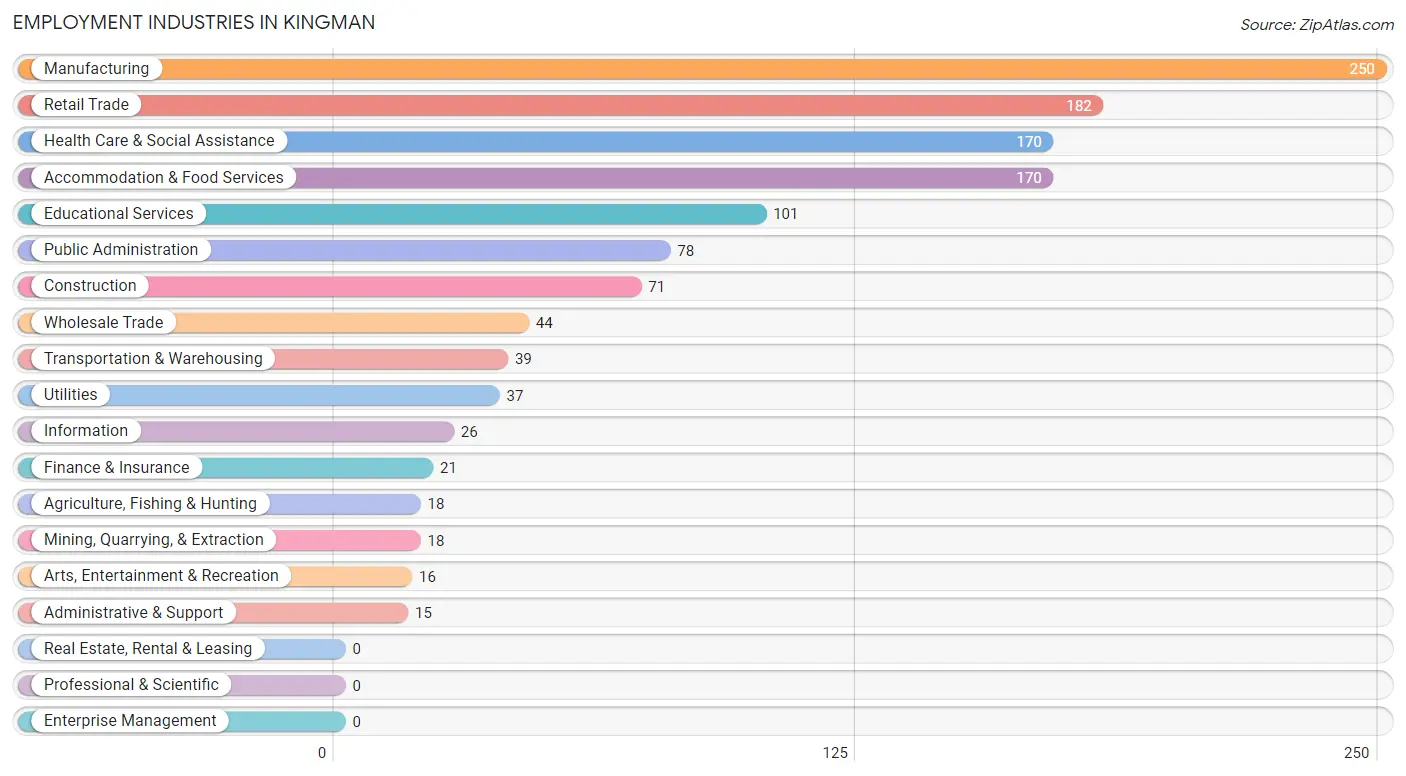
Employment Industries in Kingman
The major employment industries in Kingman include Manufacturing (250 | 19.6%), Retail Trade (182 | 14.3%), Health Care & Social Assistance (170 | 13.3%), Accommodation & Food Services (170 | 13.3%), and Educational Services (101 | 7.9%).
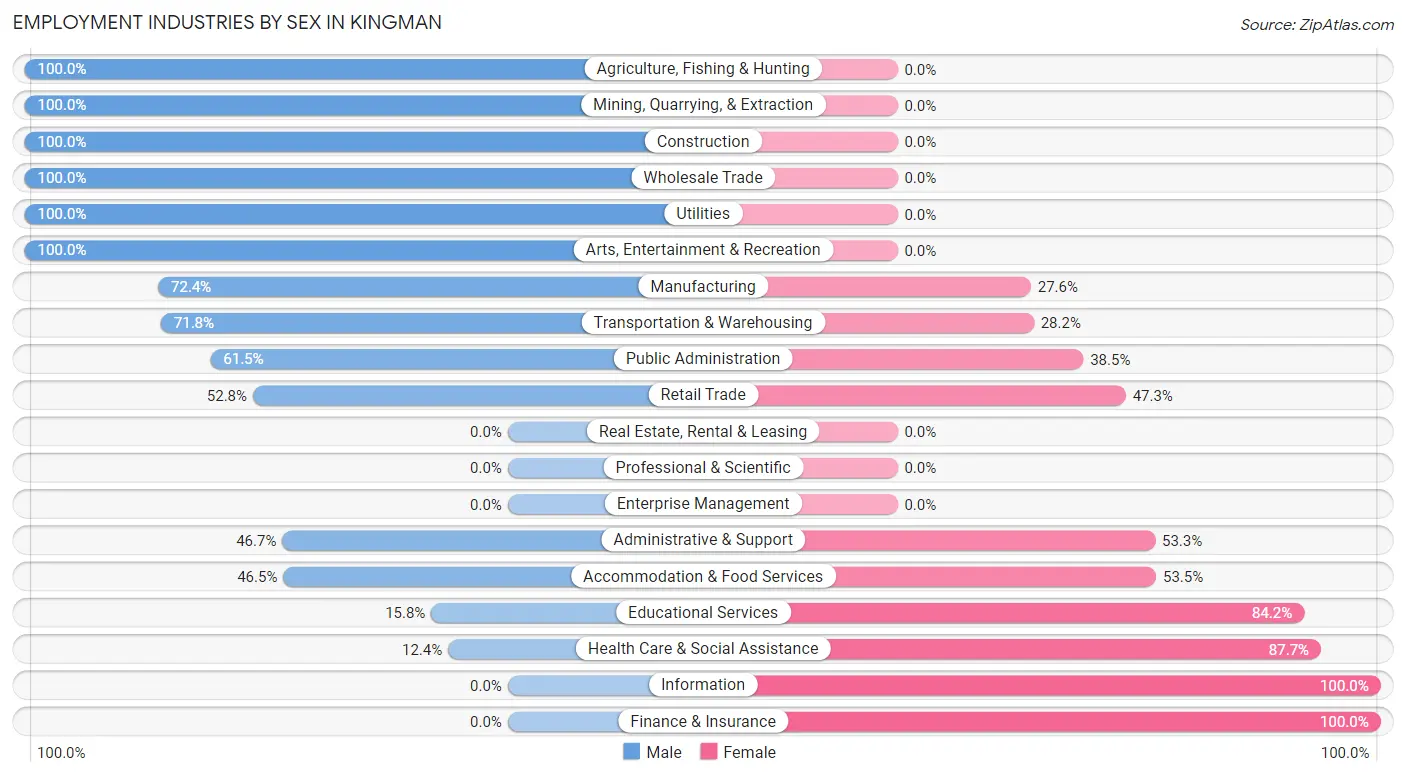
Employment Industries by Sex in Kingman
The Kingman industries that see more men than women are Agriculture, Fishing & Hunting (100.0%), Mining, Quarrying, & Extraction (100.0%), and Construction (100.0%), whereas the industries that tend to have a higher number of women are Information (100.0%), Finance & Insurance (100.0%), and Health Care & Social Assistance (87.6%).
| Industry | Male | Female |
| Agriculture, Fishing & Hunting | 18 (100.0%) | 0 (0.0%) |
| Mining, Quarrying, & Extraction | 18 (100.0%) | 0 (0.0%) |
| Construction | 71 (100.0%) | 0 (0.0%) |
| Manufacturing | 181 (72.4%) | 69 (27.6%) |
| Wholesale Trade | 44 (100.0%) | 0 (0.0%) |
| Retail Trade | 96 (52.7%) | 86 (47.2%) |
| Transportation & Warehousing | 28 (71.8%) | 11 (28.2%) |
| Utilities | 37 (100.0%) | 0 (0.0%) |
| Information | 0 (0.0%) | 26 (100.0%) |
| Finance & Insurance | 0 (0.0%) | 21 (100.0%) |
| Real Estate, Rental & Leasing | 0 (0.0%) | 0 (0.0%) |
| Professional & Scientific | 0 (0.0%) | 0 (0.0%) |
| Enterprise Management | 0 (0.0%) | 0 (0.0%) |
| Administrative & Support | 7 (46.7%) | 8 (53.3%) |
| Educational Services | 16 (15.8%) | 85 (84.2%) |
| Health Care & Social Assistance | 21 (12.3%) | 149 (87.6%) |
| Arts, Entertainment & Recreation | 16 (100.0%) | 0 (0.0%) |
| Accommodation & Food Services | 79 (46.5%) | 91 (53.5%) |
| Public Administration | 48 (61.5%) | 30 (38.5%) |
| Total | 699 (54.8%) | 576 (45.2%) |
Education in Kingman
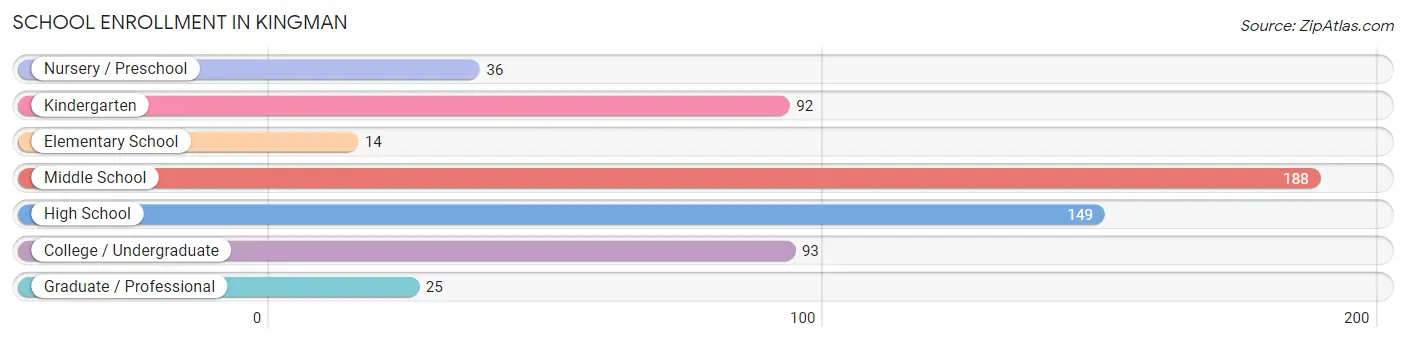
School Enrollment in Kingman
The most common levels of schooling among the 597 students in Kingman are middle school (188 | 31.5%), high school (149 | 25.0%), and college / undergraduate (93 | 15.6%).
| School Level | # Students | % Students |
| Nursery / Preschool | 36 | 6.0% |
| Kindergarten | 92 | 15.4% |
| Elementary School | 14 | 2.4% |
| Middle School | 188 | 31.5% |
| High School | 149 | 25.0% |
| College / Undergraduate | 93 | 15.6% |
| Graduate / Professional | 25 | 4.2% |
| Total | 597 | 100.0% |
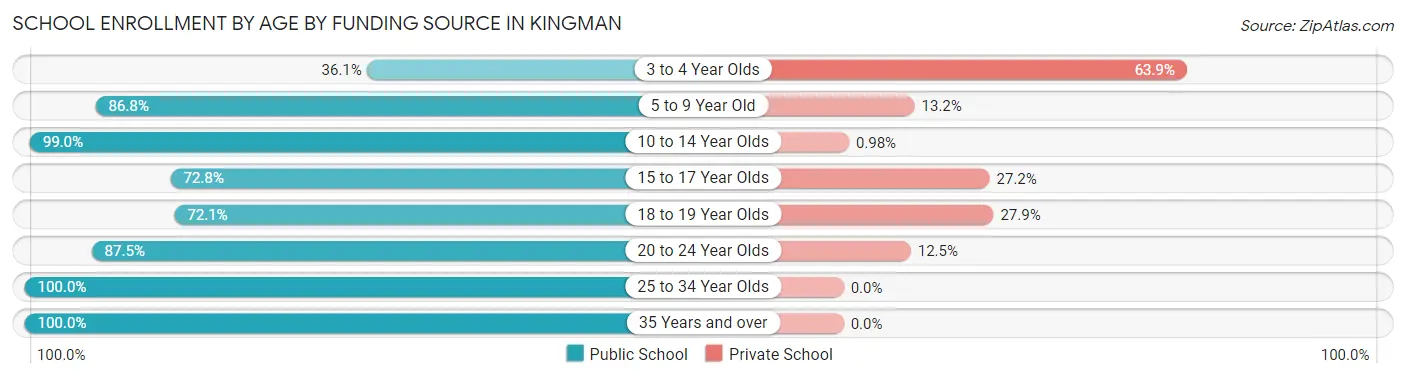
School Enrollment by Age by Funding Source in Kingman
Out of a total of 597 students who are enrolled in schools in Kingman, 83 (13.9%) attend a private institution, while the remaining 514 (86.1%) are enrolled in public schools. The age group of 3 to 4 year olds has the highest likelihood of being enrolled in private schools, with 23 (63.9% in the age bracket) enrolled. Conversely, the age group of 25 to 34 year olds has the lowest likelihood of being enrolled in a private school, with 41 (100.0% in the age bracket) attending a public institution.
| Age Bracket | Public School | Private School |
| 3 to 4 Year Olds | 13 (36.1%) | 23 (63.9%) |
| 5 to 9 Year Old | 92 (86.8%) | 14 (13.2%) |
| 10 to 14 Year Olds | 203 (99.0%) | 2 (1.0%) |
| 15 to 17 Year Olds | 75 (72.8%) | 28 (27.2%) |
| 18 to 19 Year Olds | 31 (72.1%) | 12 (27.9%) |
| 20 to 24 Year Olds | 28 (87.5%) | 4 (12.5%) |
| 25 to 34 Year Olds | 41 (100.0%) | 0 (0.0%) |
| 35 Years and over | 31 (100.0%) | 0 (0.0%) |
| Total | 514 (86.1%) | 83 (13.9%) |
Educational Attainment by Field of Study in Kingman
Business (99 | 27.4%), education (96 | 26.6%), science & technology (64 | 17.7%), engineering (39 | 10.8%), and literature & languages (20 | 5.5%) are the most common fields of study among 361 individuals in Kingman who have obtained a bachelor's degree or higher.
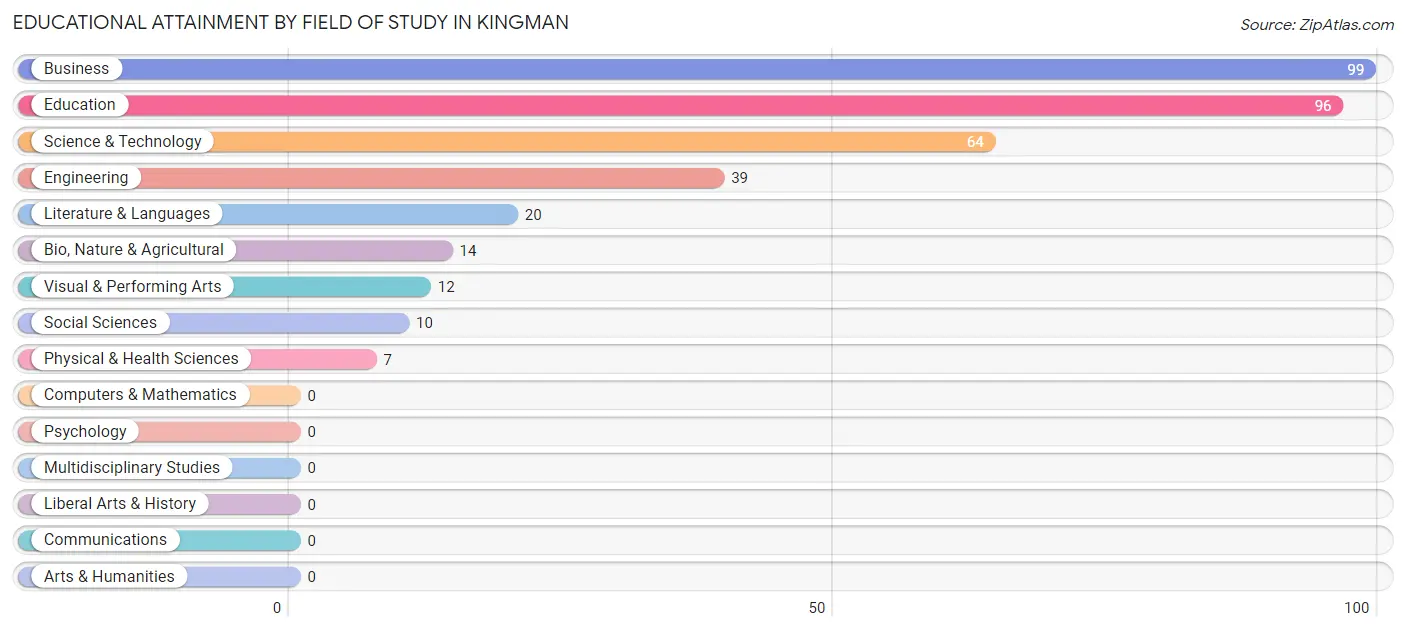
| Field of Study | # Graduates | % Graduates |
| Computers & Mathematics | 0 | 0.0% |
| Bio, Nature & Agricultural | 14 | 3.9% |
| Physical & Health Sciences | 7 | 1.9% |
| Psychology | 0 | 0.0% |
| Social Sciences | 10 | 2.8% |
| Engineering | 39 | 10.8% |
| Multidisciplinary Studies | 0 | 0.0% |
| Science & Technology | 64 | 17.7% |
| Business | 99 | 27.4% |
| Education | 96 | 26.6% |
| Literature & Languages | 20 | 5.5% |
| Liberal Arts & History | 0 | 0.0% |
| Visual & Performing Arts | 12 | 3.3% |
| Communications | 0 | 0.0% |
| Arts & Humanities | 0 | 0.0% |
| Total | 361 | 100.0% |
Transportation & Commute in Kingman
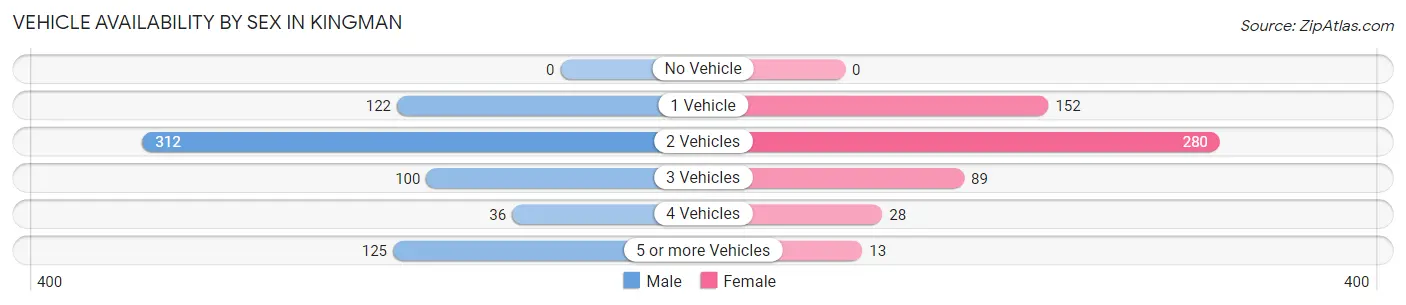
Vehicle Availability by Sex in Kingman
The most prevalent vehicle ownership categories in Kingman are males with 2 vehicles (312, accounting for 44.9%) and females with 2 vehicles (280, making up 55.5%).
| Vehicles Available | Male | Female |
| No Vehicle | 0 (0.0%) | 0 (0.0%) |
| 1 Vehicle | 122 (17.5%) | 152 (27.1%) |
| 2 Vehicles | 312 (44.9%) | 280 (49.8%) |
| 3 Vehicles | 100 (14.4%) | 89 (15.8%) |
| 4 Vehicles | 36 (5.2%) | 28 (5.0%) |
| 5 or more Vehicles | 125 (18.0%) | 13 (2.3%) |
| Total | 695 (100.0%) | 562 (100.0%) |
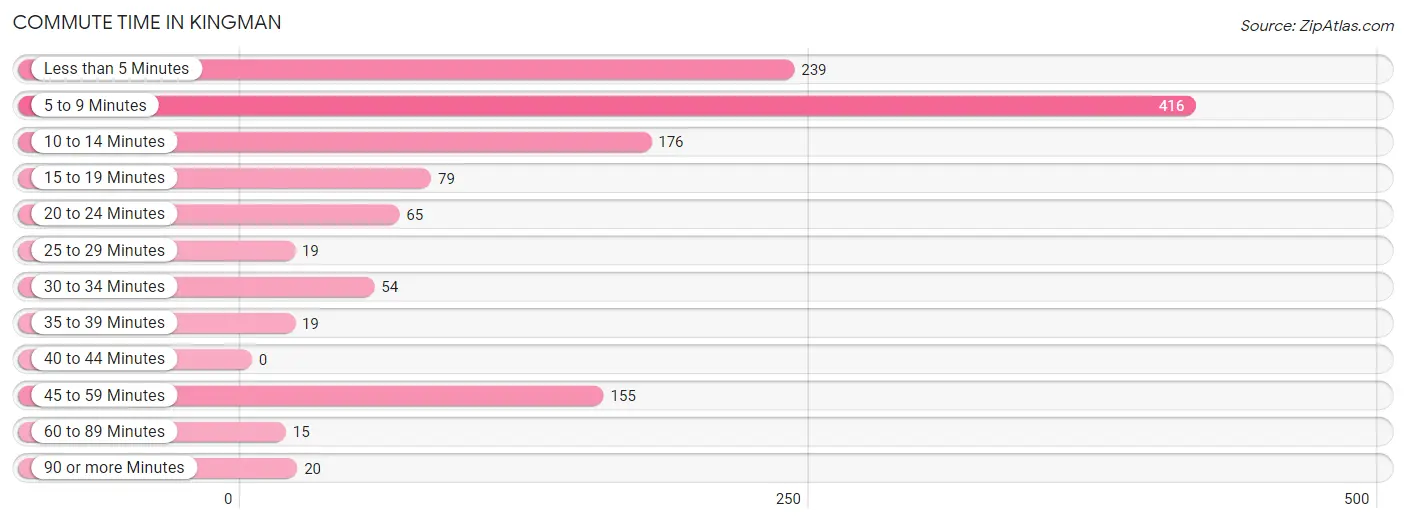
Commute Time in Kingman
The most frequently occuring commute durations in Kingman are 5 to 9 minutes (416 commuters, 33.1%), less than 5 minutes (239 commuters, 19.0%), and 10 to 14 minutes (176 commuters, 14.0%).
| Commute Time | # Commuters | % Commuters |
| Less than 5 Minutes | 239 | 19.0% |
| 5 to 9 Minutes | 416 | 33.1% |
| 10 to 14 Minutes | 176 | 14.0% |
| 15 to 19 Minutes | 79 | 6.3% |
| 20 to 24 Minutes | 65 | 5.2% |
| 25 to 29 Minutes | 19 | 1.5% |
| 30 to 34 Minutes | 54 | 4.3% |
| 35 to 39 Minutes | 19 | 1.5% |
| 40 to 44 Minutes | 0 | 0.0% |
| 45 to 59 Minutes | 155 | 12.3% |
| 60 to 89 Minutes | 15 | 1.2% |
| 90 or more Minutes | 20 | 1.6% |
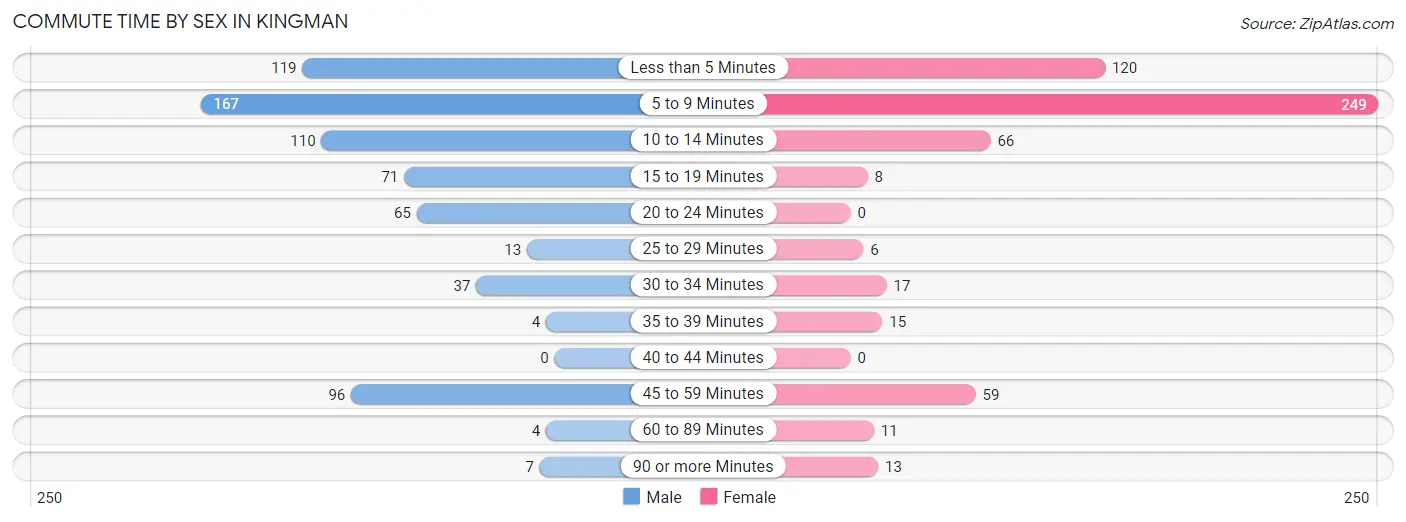
Commute Time by Sex in Kingman
The most common commute times in Kingman are 5 to 9 minutes (167 commuters, 24.1%) for males and 5 to 9 minutes (249 commuters, 44.2%) for females.
| Commute Time | Male | Female |
| Less than 5 Minutes | 119 (17.2%) | 120 (21.3%) |
| 5 to 9 Minutes | 167 (24.1%) | 249 (44.2%) |
| 10 to 14 Minutes | 110 (15.9%) | 66 (11.7%) |
| 15 to 19 Minutes | 71 (10.2%) | 8 (1.4%) |
| 20 to 24 Minutes | 65 (9.4%) | 0 (0.0%) |
| 25 to 29 Minutes | 13 (1.9%) | 6 (1.1%) |
| 30 to 34 Minutes | 37 (5.3%) | 17 (3.0%) |
| 35 to 39 Minutes | 4 (0.6%) | 15 (2.7%) |
| 40 to 44 Minutes | 0 (0.0%) | 0 (0.0%) |
| 45 to 59 Minutes | 96 (13.9%) | 59 (10.5%) |
| 60 to 89 Minutes | 4 (0.6%) | 11 (1.9%) |
| 90 or more Minutes | 7 (1.0%) | 13 (2.3%) |
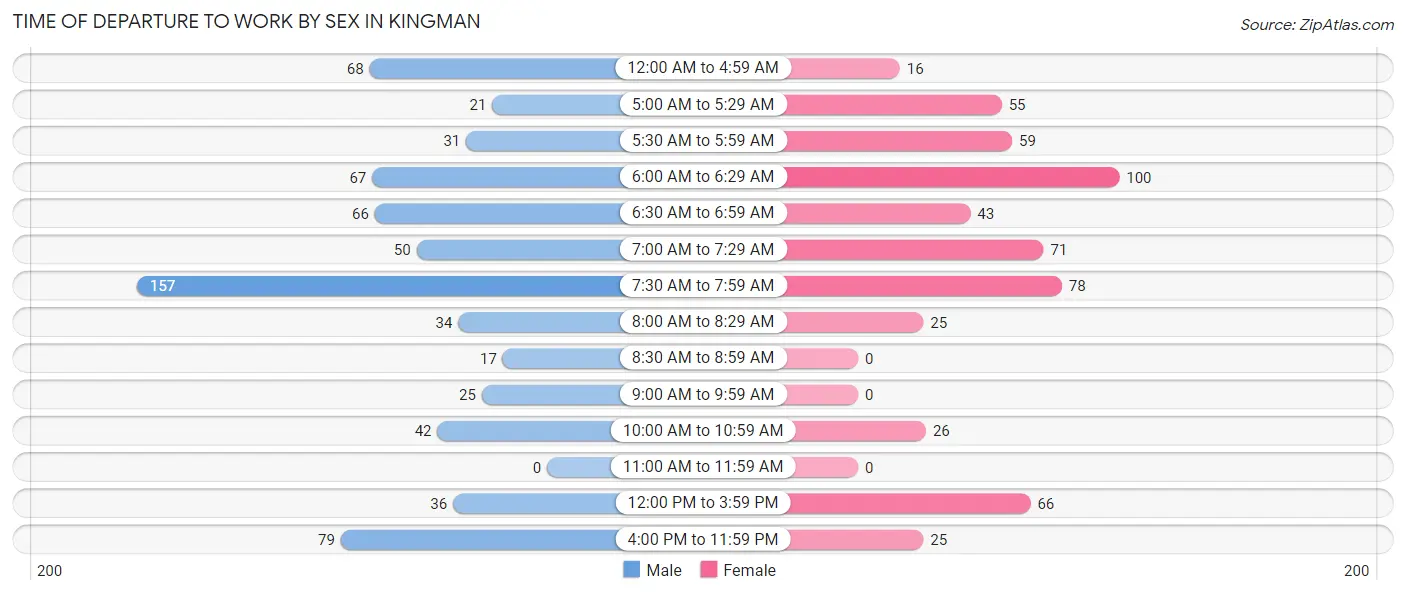
Time of Departure to Work by Sex in Kingman
The most frequent times of departure to work in Kingman are 7:30 AM to 7:59 AM (157, 22.7%) for males and 6:00 AM to 6:29 AM (100, 17.7%) for females.
| Time of Departure | Male | Female |
| 12:00 AM to 4:59 AM | 68 (9.8%) | 16 (2.8%) |
| 5:00 AM to 5:29 AM | 21 (3.0%) | 55 (9.8%) |
| 5:30 AM to 5:59 AM | 31 (4.5%) | 59 (10.5%) |
| 6:00 AM to 6:29 AM | 67 (9.7%) | 100 (17.7%) |
| 6:30 AM to 6:59 AM | 66 (9.5%) | 43 (7.6%) |
| 7:00 AM to 7:29 AM | 50 (7.2%) | 71 (12.6%) |
| 7:30 AM to 7:59 AM | 157 (22.7%) | 78 (13.8%) |
| 8:00 AM to 8:29 AM | 34 (4.9%) | 25 (4.4%) |
| 8:30 AM to 8:59 AM | 17 (2.5%) | 0 (0.0%) |
| 9:00 AM to 9:59 AM | 25 (3.6%) | 0 (0.0%) |
| 10:00 AM to 10:59 AM | 42 (6.1%) | 26 (4.6%) |
| 11:00 AM to 11:59 AM | 0 (0.0%) | 0 (0.0%) |
| 12:00 PM to 3:59 PM | 36 (5.2%) | 66 (11.7%) |
| 4:00 PM to 11:59 PM | 79 (11.4%) | 25 (4.4%) |
| Total | 693 (100.0%) | 564 (100.0%) |
Housing Occupancy in Kingman
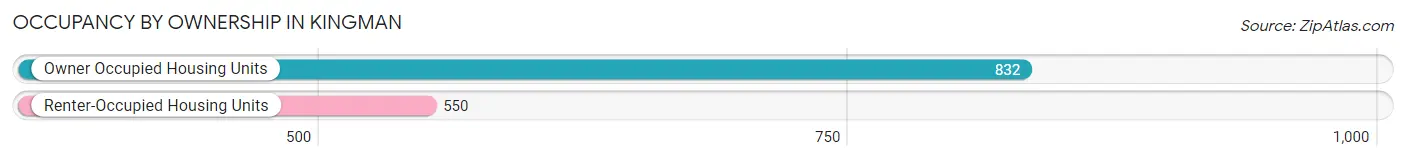
Occupancy by Ownership in Kingman
Of the total 1,382 dwellings in Kingman, owner-occupied units account for 832 (60.2%), while renter-occupied units make up 550 (39.8%).
| Occupancy | # Housing Units | % Housing Units |
| Owner Occupied Housing Units | 832 | 60.2% |
| Renter-Occupied Housing Units | 550 | 39.8% |
| Total Occupied Housing Units | 1,382 | 100.0% |
Occupancy by Household Size in Kingman
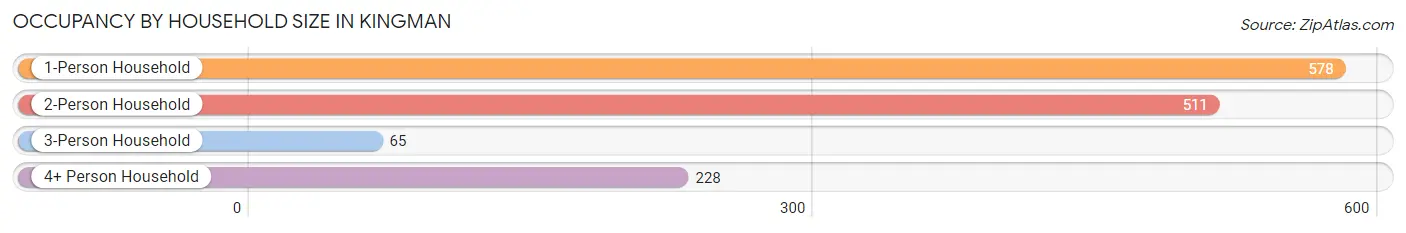
| Household Size | # Housing Units | % Housing Units |
| 1-Person Household | 578 | 41.8% |
| 2-Person Household | 511 | 37.0% |
| 3-Person Household | 65 | 4.7% |
| 4+ Person Household | 228 | 16.5% |
| Total Housing Units | 1,382 | 100.0% |
Occupancy by Ownership by Household Size in Kingman
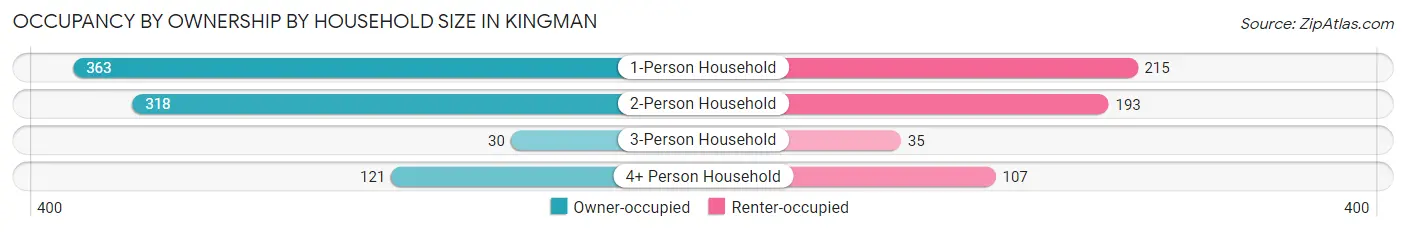
| Household Size | Owner-occupied | Renter-occupied |
| 1-Person Household | 363 (62.8%) | 215 (37.2%) |
| 2-Person Household | 318 (62.2%) | 193 (37.8%) |
| 3-Person Household | 30 (46.2%) | 35 (53.8%) |
| 4+ Person Household | 121 (53.1%) | 107 (46.9%) |
| Total Housing Units | 832 (60.2%) | 550 (39.8%) |
Occupancy by Educational Attainment in Kingman
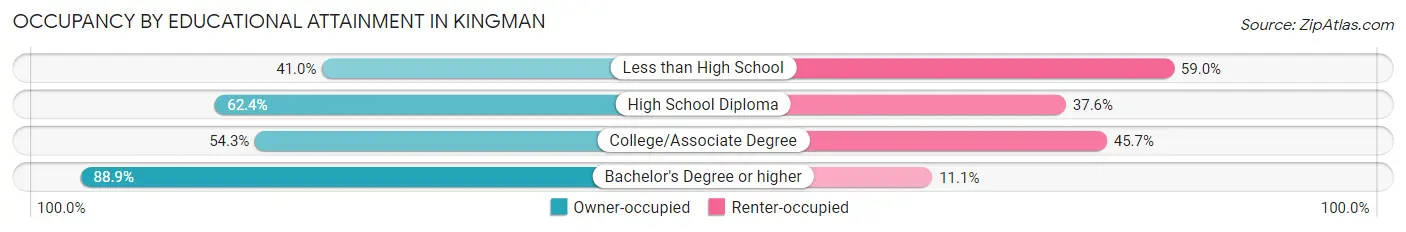
| Household Size | Owner-occupied | Renter-occupied |
| Less than High School | 93 (41.0%) | 134 (59.0%) |
| High School Diploma | 287 (62.4%) | 173 (37.6%) |
| College/Associate Degree | 260 (54.3%) | 219 (45.7%) |
| Bachelor's Degree or higher | 192 (88.9%) | 24 (11.1%) |
Occupancy by Age of Householder in Kingman
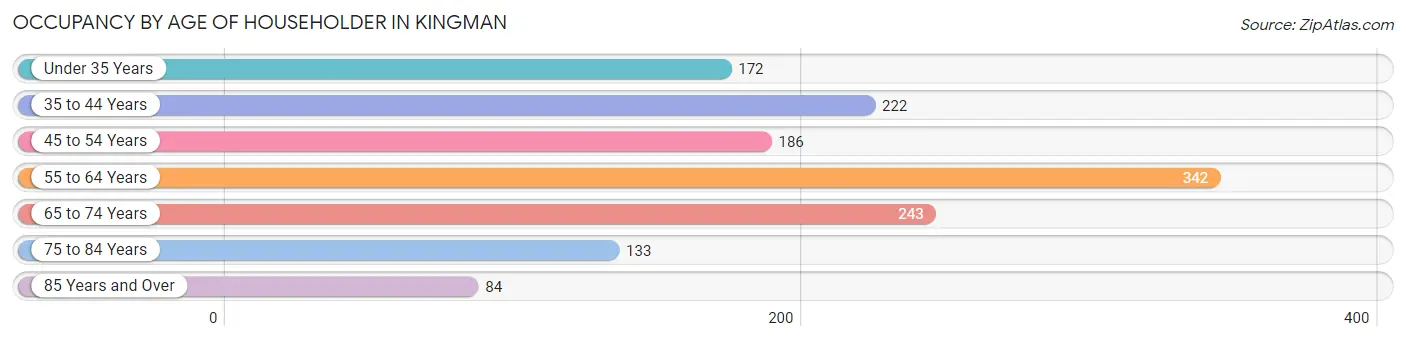
| Age Bracket | # Households | % Households |
| Under 35 Years | 172 | 12.4% |
| 35 to 44 Years | 222 | 16.1% |
| 45 to 54 Years | 186 | 13.5% |
| 55 to 64 Years | 342 | 24.7% |
| 65 to 74 Years | 243 | 17.6% |
| 75 to 84 Years | 133 | 9.6% |
| 85 Years and Over | 84 | 6.1% |
| Total | 1,382 | 100.0% |
Housing Finances in Kingman
Median Income by Occupancy in Kingman
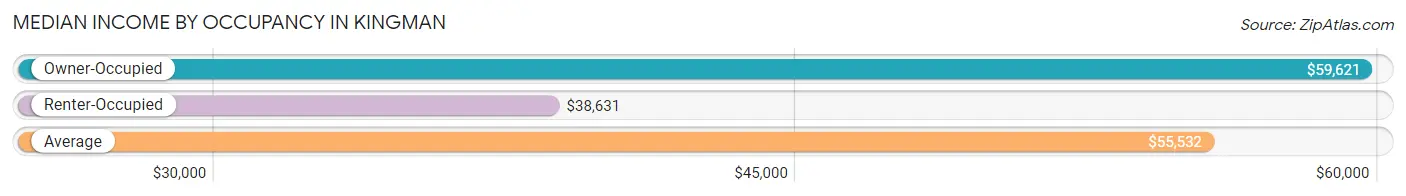
| Occupancy Type | # Households | Median Income |
| Owner-Occupied | 832 (60.2%) | $59,621 |
| Renter-Occupied | 550 (39.8%) | $38,631 |
| Average | 1,382 (100.0%) | $55,532 |
Occupancy by Householder Income Bracket in Kingman
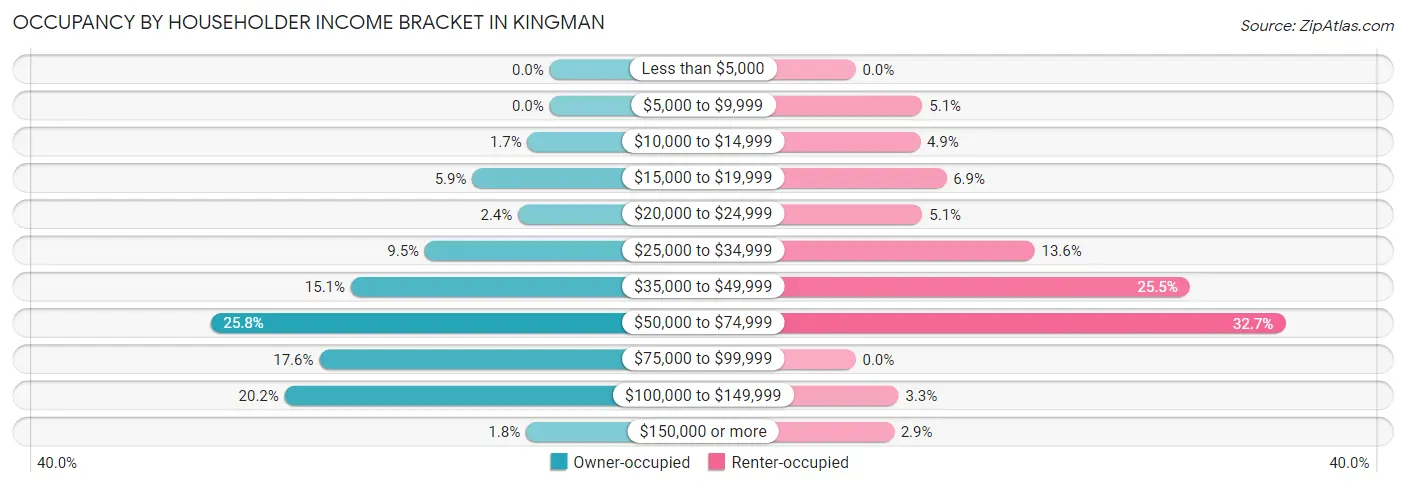
| Income Bracket | Owner-occupied | Renter-occupied |
| Less than $5,000 | 0 (0.0%) | 0 (0.0%) |
| $5,000 to $9,999 | 0 (0.0%) | 28 (5.1%) |
| $10,000 to $14,999 | 14 (1.7%) | 27 (4.9%) |
| $15,000 to $19,999 | 49 (5.9%) | 38 (6.9%) |
| $20,000 to $24,999 | 20 (2.4%) | 28 (5.1%) |
| $25,000 to $34,999 | 79 (9.5%) | 75 (13.6%) |
| $35,000 to $49,999 | 126 (15.1%) | 140 (25.5%) |
| $50,000 to $74,999 | 215 (25.8%) | 180 (32.7%) |
| $75,000 to $99,999 | 146 (17.5%) | 0 (0.0%) |
| $100,000 to $149,999 | 168 (20.2%) | 18 (3.3%) |
| $150,000 or more | 15 (1.8%) | 16 (2.9%) |
| Total | 832 (100.0%) | 550 (100.0%) |
Monthly Housing Cost Tiers in Kingman
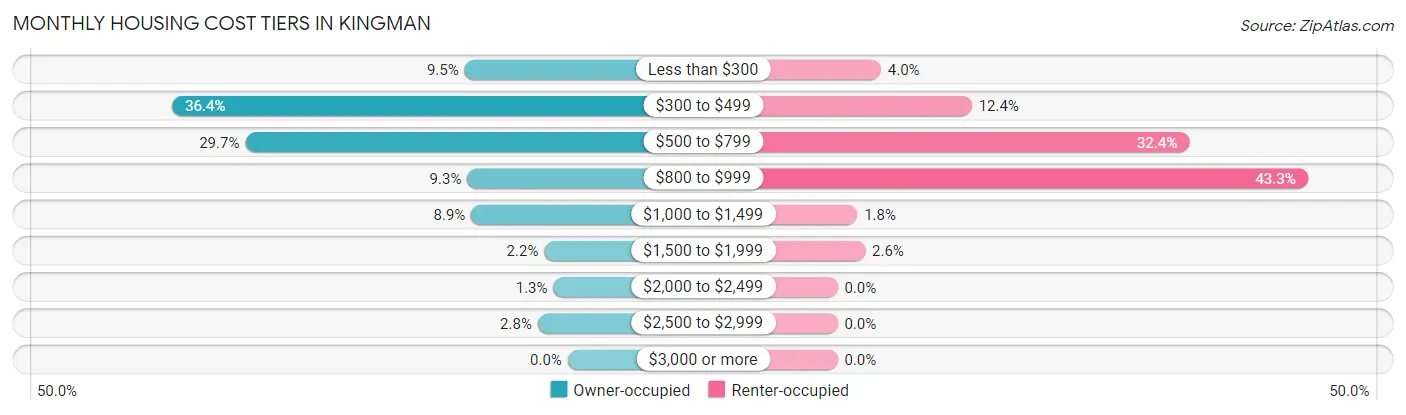
| Monthly Cost | Owner-occupied | Renter-occupied |
| Less than $300 | 79 (9.5%) | 22 (4.0%) |
| $300 to $499 | 303 (36.4%) | 68 (12.4%) |
| $500 to $799 | 247 (29.7%) | 178 (32.4%) |
| $800 to $999 | 77 (9.2%) | 238 (43.3%) |
| $1,000 to $1,499 | 74 (8.9%) | 10 (1.8%) |
| $1,500 to $1,999 | 18 (2.2%) | 14 (2.5%) |
| $2,000 to $2,499 | 11 (1.3%) | 0 (0.0%) |
| $2,500 to $2,999 | 23 (2.8%) | 0 (0.0%) |
| $3,000 or more | 0 (0.0%) | 0 (0.0%) |
| Total | 832 (100.0%) | 550 (100.0%) |
Physical Housing Characteristics in Kingman
Housing Structures in Kingman
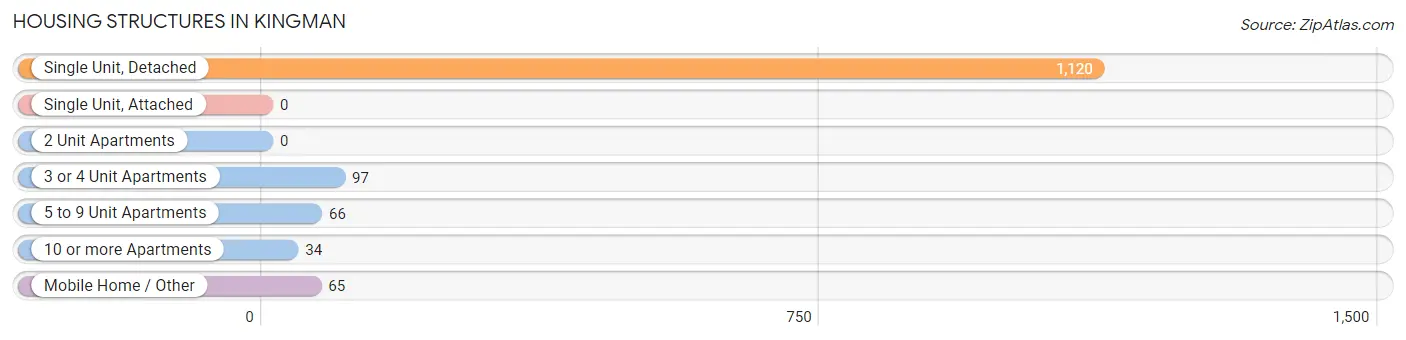
| Structure Type | # Housing Units | % Housing Units |
| Single Unit, Detached | 1,120 | 81.0% |
| Single Unit, Attached | 0 | 0.0% |
| 2 Unit Apartments | 0 | 0.0% |
| 3 or 4 Unit Apartments | 97 | 7.0% |
| 5 to 9 Unit Apartments | 66 | 4.8% |
| 10 or more Apartments | 34 | 2.5% |
| Mobile Home / Other | 65 | 4.7% |
| Total | 1,382 | 100.0% |
Housing Structures by Occupancy in Kingman
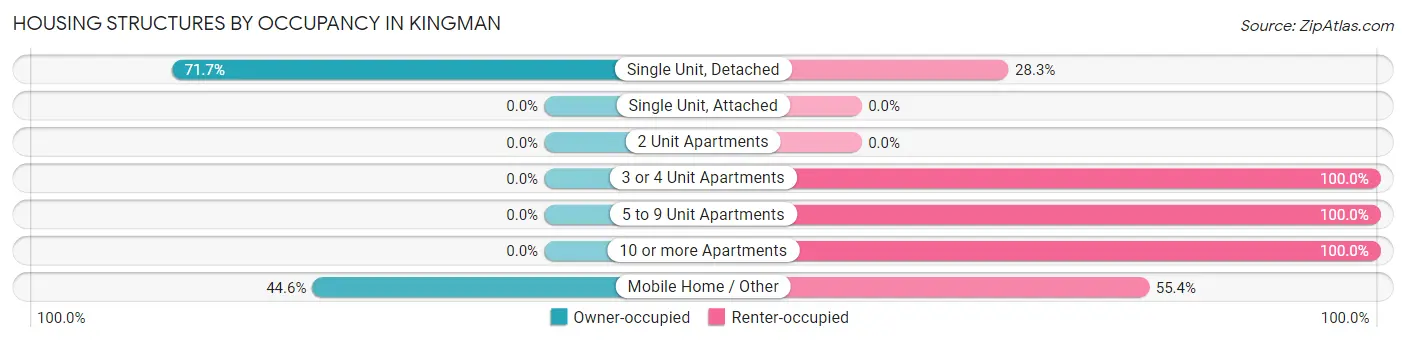
| Structure Type | Owner-occupied | Renter-occupied |
| Single Unit, Detached | 803 (71.7%) | 317 (28.3%) |
| Single Unit, Attached | 0 (0.0%) | 0 (0.0%) |
| 2 Unit Apartments | 0 (0.0%) | 0 (0.0%) |
| 3 or 4 Unit Apartments | 0 (0.0%) | 97 (100.0%) |
| 5 to 9 Unit Apartments | 0 (0.0%) | 66 (100.0%) |
| 10 or more Apartments | 0 (0.0%) | 34 (100.0%) |
| Mobile Home / Other | 29 (44.6%) | 36 (55.4%) |
| Total | 832 (60.2%) | 550 (39.8%) |
Housing Structures by Number of Rooms in Kingman
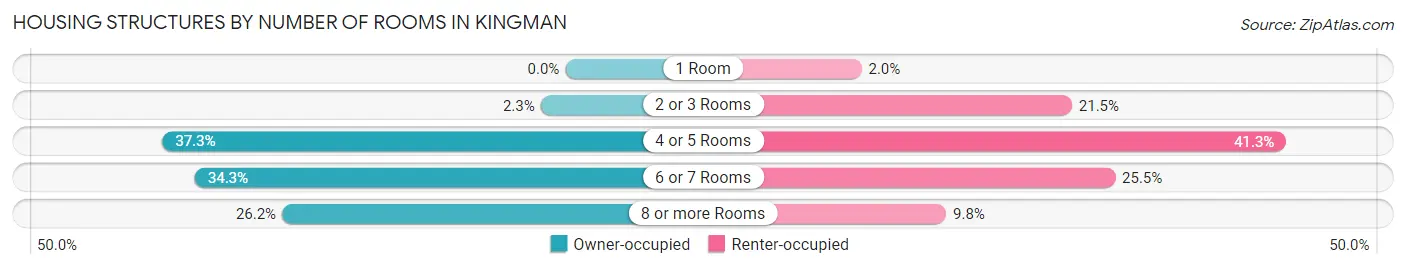
| Number of Rooms | Owner-occupied | Renter-occupied |
| 1 Room | 0 (0.0%) | 11 (2.0%) |
| 2 or 3 Rooms | 19 (2.3%) | 118 (21.4%) |
| 4 or 5 Rooms | 310 (37.3%) | 227 (41.3%) |
| 6 or 7 Rooms | 285 (34.3%) | 140 (25.5%) |
| 8 or more Rooms | 218 (26.2%) | 54 (9.8%) |
| Total | 832 (100.0%) | 550 (100.0%) |
Housing Structure by Heating Type in Kingman
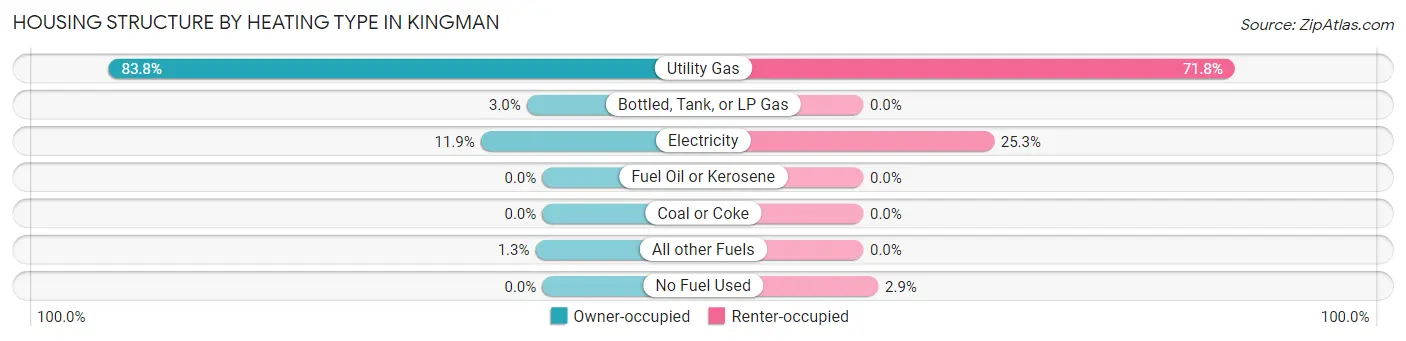
| Heating Type | Owner-occupied | Renter-occupied |
| Utility Gas | 697 (83.8%) | 395 (71.8%) |
| Bottled, Tank, or LP Gas | 25 (3.0%) | 0 (0.0%) |
| Electricity | 99 (11.9%) | 139 (25.3%) |
| Fuel Oil or Kerosene | 0 (0.0%) | 0 (0.0%) |
| Coal or Coke | 0 (0.0%) | 0 (0.0%) |
| All other Fuels | 11 (1.3%) | 0 (0.0%) |
| No Fuel Used | 0 (0.0%) | 16 (2.9%) |
| Total | 832 (100.0%) | 550 (100.0%) |
Household Vehicle Usage in Kingman
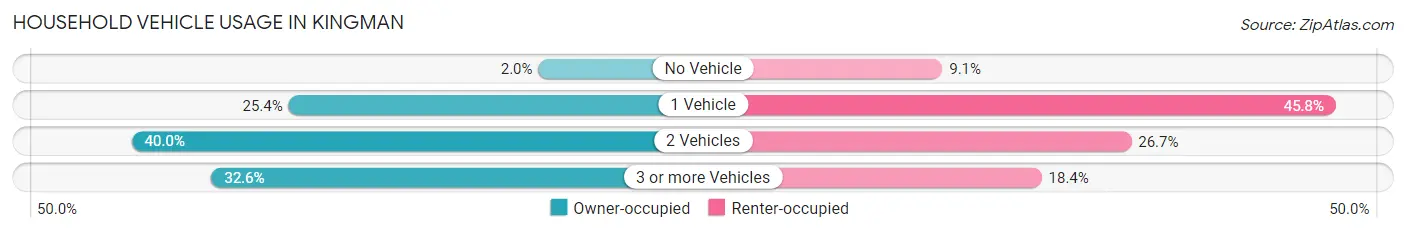
| Vehicles per Household | Owner-occupied | Renter-occupied |
| No Vehicle | 17 (2.0%) | 50 (9.1%) |
| 1 Vehicle | 211 (25.4%) | 252 (45.8%) |
| 2 Vehicles | 333 (40.0%) | 147 (26.7%) |
| 3 or more Vehicles | 271 (32.6%) | 101 (18.4%) |
| Total | 832 (100.0%) | 550 (100.0%) |
Real Estate & Mortgages in Kingman
Real Estate and Mortgage Overview in Kingman
| Characteristic | Without Mortgage | With Mortgage |
| Housing Units | 571 | 261 |
| Median Property Value | $57,500 | $66,900 |
| Median Household Income | $56,690 | $9 |
| Monthly Housing Costs | $445 | $0 |
| Real Estate Taxes | $1,537 | $27 |
Property Value by Mortgage Status in Kingman
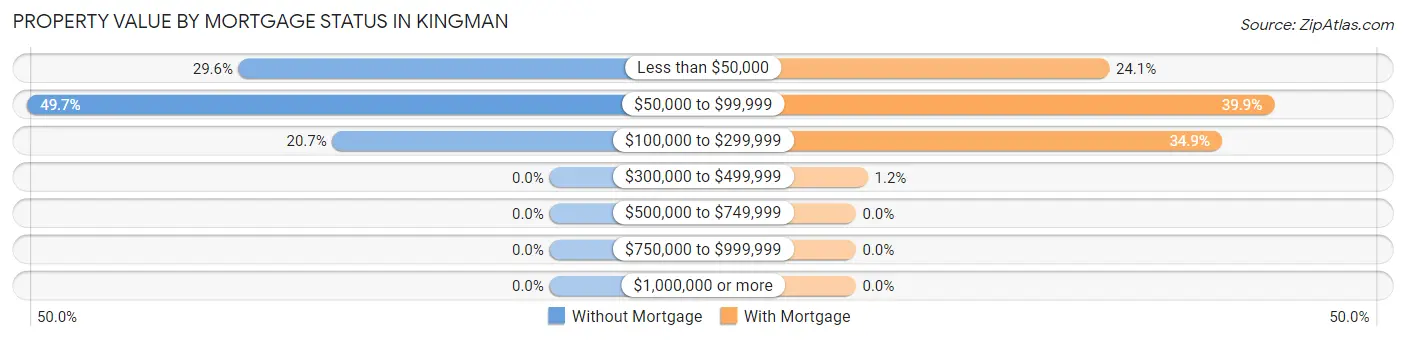
| Property Value | Without Mortgage | With Mortgage |
| Less than $50,000 | 169 (29.6%) | 63 (24.1%) |
| $50,000 to $99,999 | 284 (49.7%) | 104 (39.9%) |
| $100,000 to $299,999 | 118 (20.7%) | 91 (34.9%) |
| $300,000 to $499,999 | 0 (0.0%) | 3 (1.1%) |
| $500,000 to $749,999 | 0 (0.0%) | 0 (0.0%) |
| $750,000 to $999,999 | 0 (0.0%) | 0 (0.0%) |
| $1,000,000 or more | 0 (0.0%) | 0 (0.0%) |
| Total | 571 (100.0%) | 261 (100.0%) |
Household Income by Mortgage Status in Kingman
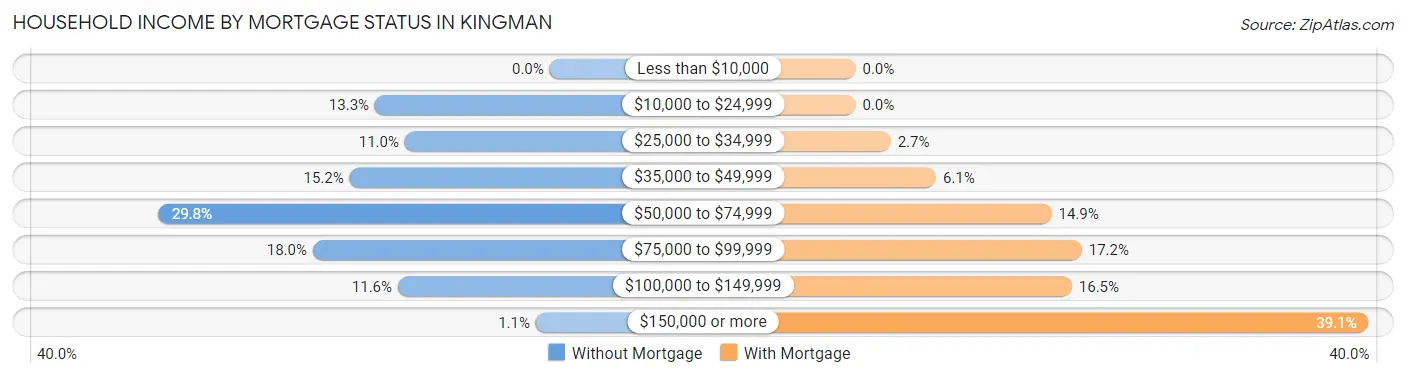
| Household Income | Without Mortgage | With Mortgage |
| Less than $10,000 | 0 (0.0%) | 0 (0.0%) |
| $10,000 to $24,999 | 76 (13.3%) | 0 (0.0%) |
| $25,000 to $34,999 | 63 (11.0%) | 7 (2.7%) |
| $35,000 to $49,999 | 87 (15.2%) | 16 (6.1%) |
| $50,000 to $74,999 | 170 (29.8%) | 39 (14.9%) |
| $75,000 to $99,999 | 103 (18.0%) | 45 (17.2%) |
| $100,000 to $149,999 | 66 (11.6%) | 43 (16.5%) |
| $150,000 or more | 6 (1.1%) | 102 (39.1%) |
| Total | 571 (100.0%) | 261 (100.0%) |
Property Value to Household Income Ratio in Kingman
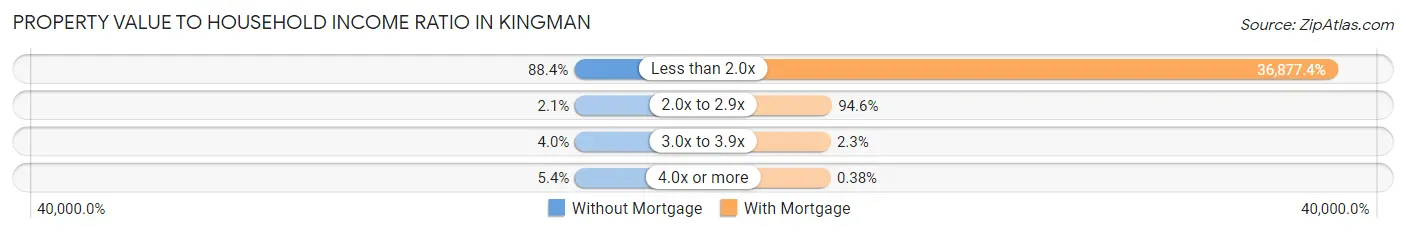
| Value-to-Income Ratio | Without Mortgage | With Mortgage |
| Less than 2.0x | 505 (88.4%) | 96,250 (36,877.4%) |
| 2.0x to 2.9x | 12 (2.1%) | 247 (94.6%) |
| 3.0x to 3.9x | 23 (4.0%) | 6 (2.3%) |
| 4.0x or more | 31 (5.4%) | 1 (0.4%) |
| Total | 571 (100.0%) | 261 (100.0%) |
Real Estate Taxes by Mortgage Status in Kingman
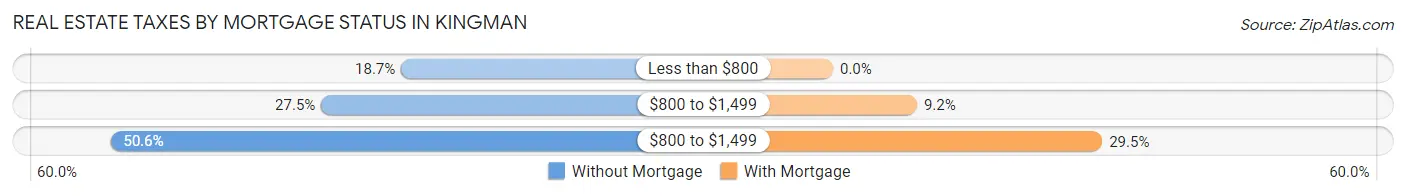
| Property Taxes | Without Mortgage | With Mortgage |
| Less than $800 | 107 (18.7%) | 0 (0.0%) |
| $800 to $1,499 | 157 (27.5%) | 24 (9.2%) |
| $800 to $1,499 | 289 (50.6%) | 77 (29.5%) |
| Total | 571 (100.0%) | 261 (100.0%) |
Health & Disability in Kingman
Health Insurance Coverage by Age in Kingman
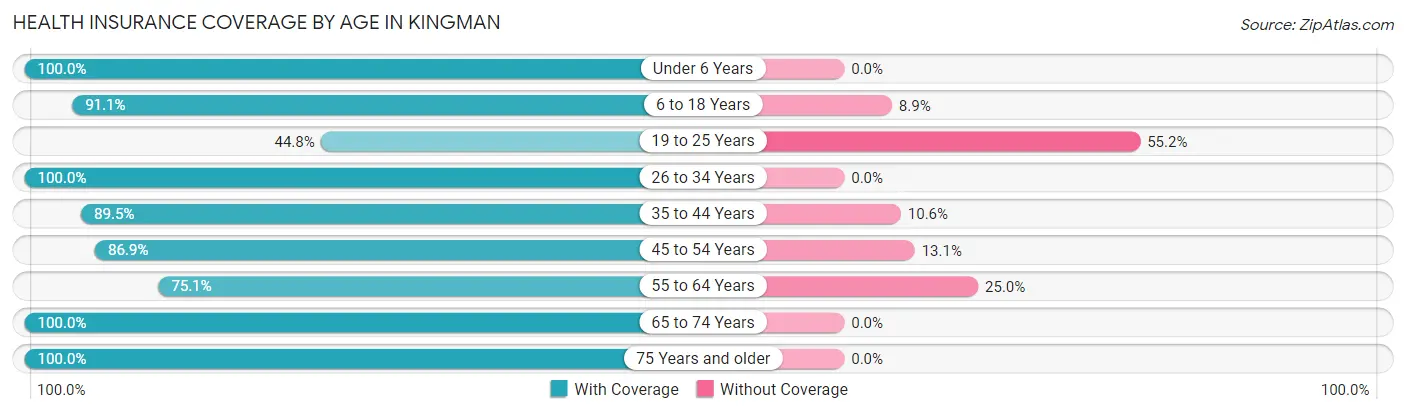
| Age Bracket | With Coverage | Without Coverage |
| Under 6 Years | 197 (100.0%) | 0 (0.0%) |
| 6 to 18 Years | 390 (91.1%) | 38 (8.9%) |
| 19 to 25 Years | 108 (44.8%) | 133 (55.2%) |
| 26 to 34 Years | 301 (100.0%) | 0 (0.0%) |
| 35 to 44 Years | 339 (89.4%) | 40 (10.5%) |
| 45 to 54 Years | 304 (86.9%) | 46 (13.1%) |
| 55 to 64 Years | 358 (75.0%) | 119 (24.9%) |
| 65 to 74 Years | 281 (100.0%) | 0 (0.0%) |
| 75 Years and older | 297 (100.0%) | 0 (0.0%) |
| Total | 2,575 (87.3%) | 376 (12.7%) |
Health Insurance Coverage by Citizenship Status in Kingman
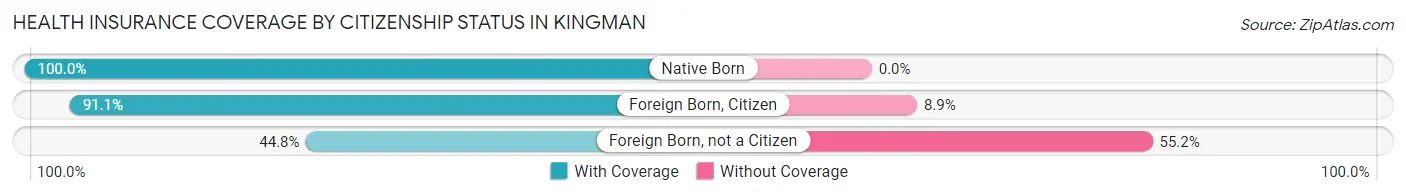
| Citizenship Status | With Coverage | Without Coverage |
| Native Born | 197 (100.0%) | 0 (0.0%) |
| Foreign Born, Citizen | 390 (91.1%) | 38 (8.9%) |
| Foreign Born, not a Citizen | 108 (44.8%) | 133 (55.2%) |
Health Insurance Coverage by Household Income in Kingman
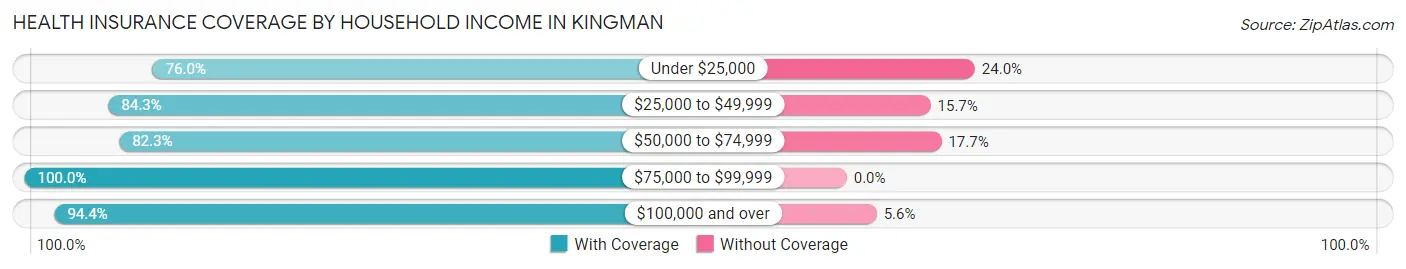
| Household Income | With Coverage | Without Coverage |
| Under $25,000 | 190 (76.0%) | 60 (24.0%) |
| $25,000 to $49,999 | 773 (84.3%) | 144 (15.7%) |
| $50,000 to $74,999 | 649 (82.3%) | 140 (17.7%) |
| $75,000 to $99,999 | 410 (100.0%) | 0 (0.0%) |
| $100,000 and over | 539 (94.4%) | 32 (5.6%) |
Public vs Private Health Insurance Coverage by Age in Kingman
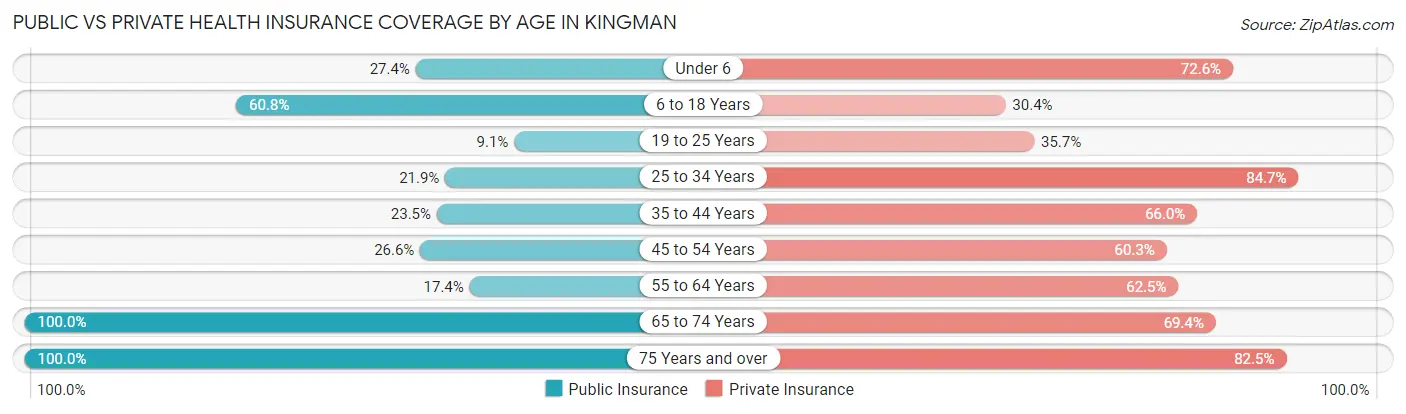
| Age Bracket | Public Insurance | Private Insurance |
| Under 6 | 54 (27.4%) | 143 (72.6%) |
| 6 to 18 Years | 260 (60.8%) | 130 (30.4%) |
| 19 to 25 Years | 22 (9.1%) | 86 (35.7%) |
| 25 to 34 Years | 66 (21.9%) | 255 (84.7%) |
| 35 to 44 Years | 89 (23.5%) | 250 (66.0%) |
| 45 to 54 Years | 93 (26.6%) | 211 (60.3%) |
| 55 to 64 Years | 83 (17.4%) | 298 (62.5%) |
| 65 to 74 Years | 281 (100.0%) | 195 (69.4%) |
| 75 Years and over | 297 (100.0%) | 245 (82.5%) |
| Total | 1,245 (42.2%) | 1,813 (61.4%) |
Disability Status by Sex by Age in Kingman
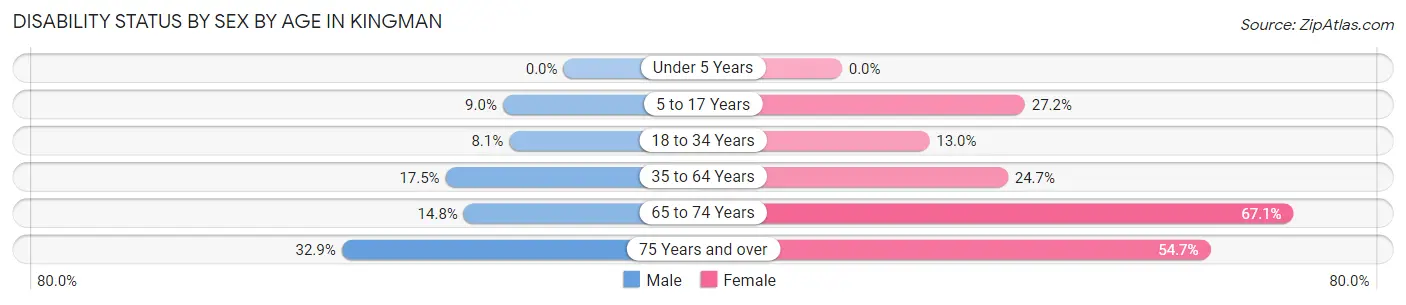
| Age Bracket | Male | Female |
| Under 5 Years | 0 (0.0%) | 0 (0.0%) |
| 5 to 17 Years | 18 (9.0%) | 56 (27.2%) |
| 18 to 34 Years | 25 (8.1%) | 33 (13.0%) |
| 35 to 64 Years | 111 (17.5%) | 141 (24.6%) |
| 65 to 74 Years | 29 (14.8%) | 57 (67.1%) |
| 75 Years and over | 28 (32.9%) | 116 (54.7%) |
Disability Class by Sex by Age in Kingman
Disability Class: Hearing Difficulty
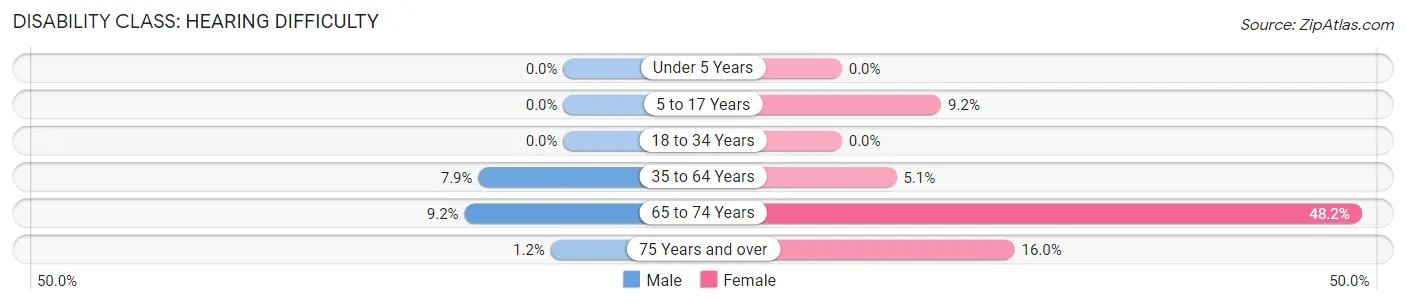
| Age Bracket | Male | Female |
| Under 5 Years | 0 (0.0%) | 0 (0.0%) |
| 5 to 17 Years | 0 (0.0%) | 19 (9.2%) |
| 18 to 34 Years | 0 (0.0%) | 0 (0.0%) |
| 35 to 64 Years | 50 (7.9%) | 29 (5.1%) |
| 65 to 74 Years | 18 (9.2%) | 41 (48.2%) |
| 75 Years and over | 1 (1.2%) | 34 (16.0%) |
Disability Class: Vision Difficulty
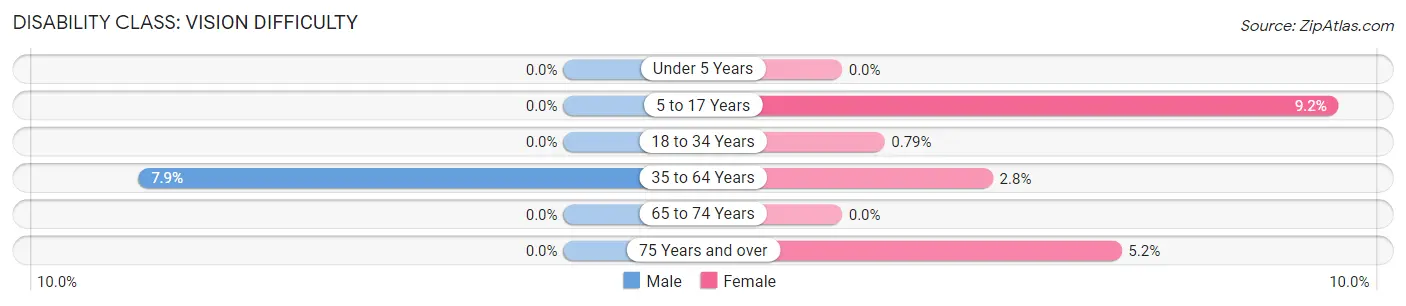
| Age Bracket | Male | Female |
| Under 5 Years | 0 (0.0%) | 0 (0.0%) |
| 5 to 17 Years | 0 (0.0%) | 19 (9.2%) |
| 18 to 34 Years | 0 (0.0%) | 2 (0.8%) |
| 35 to 64 Years | 50 (7.9%) | 16 (2.8%) |
| 65 to 74 Years | 0 (0.0%) | 0 (0.0%) |
| 75 Years and over | 0 (0.0%) | 11 (5.2%) |
Disability Class: Cognitive Difficulty
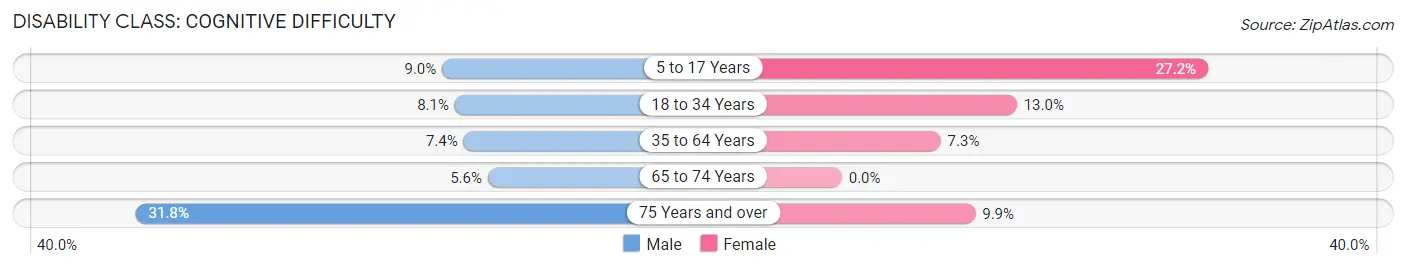
| Age Bracket | Male | Female |
| 5 to 17 Years | 18 (9.0%) | 56 (27.2%) |
| 18 to 34 Years | 25 (8.1%) | 33 (13.0%) |
| 35 to 64 Years | 47 (7.4%) | 42 (7.3%) |
| 65 to 74 Years | 11 (5.6%) | 0 (0.0%) |
| 75 Years and over | 27 (31.8%) | 21 (9.9%) |
Disability Class: Ambulatory Difficulty
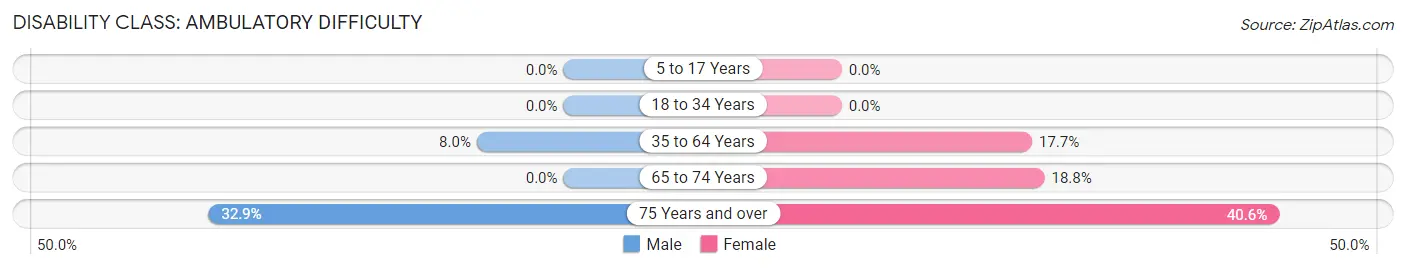
| Age Bracket | Male | Female |
| 5 to 17 Years | 0 (0.0%) | 0 (0.0%) |
| 18 to 34 Years | 0 (0.0%) | 0 (0.0%) |
| 35 to 64 Years | 51 (8.0%) | 101 (17.7%) |
| 65 to 74 Years | 0 (0.0%) | 16 (18.8%) |
| 75 Years and over | 28 (32.9%) | 86 (40.6%) |
Disability Class: Self-Care Difficulty
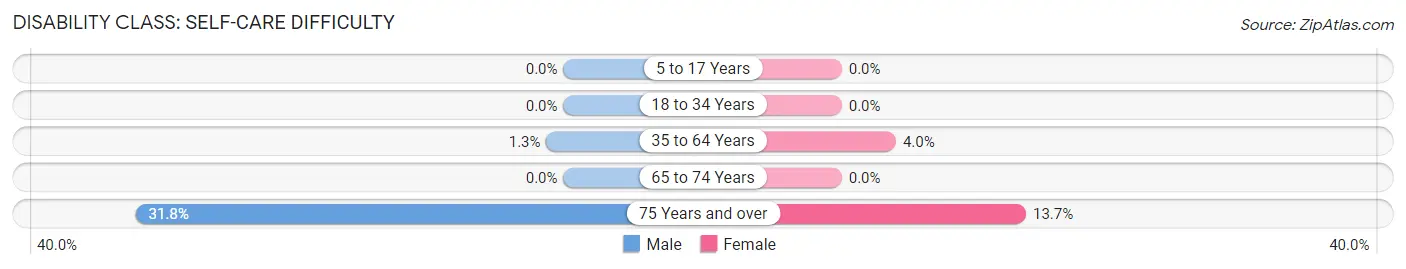
| Age Bracket | Male | Female |
| 5 to 17 Years | 0 (0.0%) | 0 (0.0%) |
| 18 to 34 Years | 0 (0.0%) | 0 (0.0%) |
| 35 to 64 Years | 8 (1.3%) | 23 (4.0%) |
| 65 to 74 Years | 0 (0.0%) | 0 (0.0%) |
| 75 Years and over | 27 (31.8%) | 29 (13.7%) |
Technology Access in Kingman
Computing Device Access in Kingman
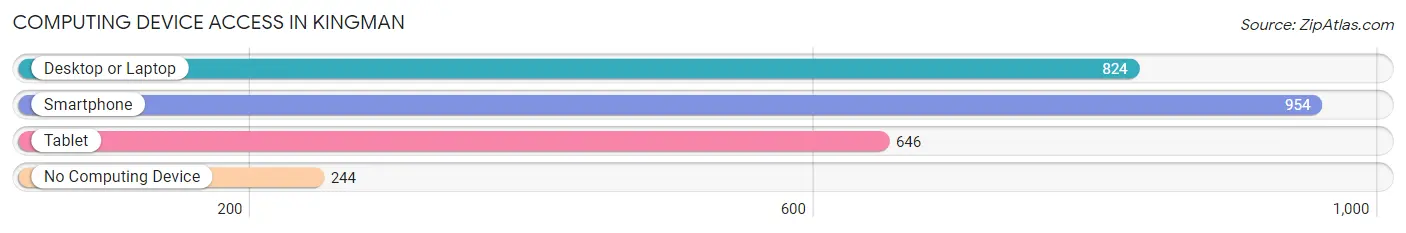
| Device Type | # Households | % Households |
| Desktop or Laptop | 824 | 59.6% |
| Smartphone | 954 | 69.0% |
| Tablet | 646 | 46.7% |
| No Computing Device | 244 | 17.7% |
| Total | 1,382 | 100.0% |
Internet Access in Kingman
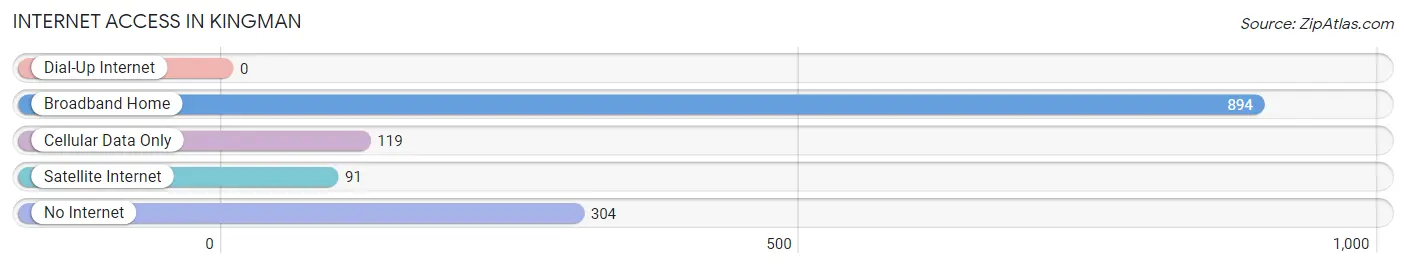
| Internet Type | # Households | % Households |
| Dial-Up Internet | 0 | 0.0% |
| Broadband Home | 894 | 64.7% |
| Cellular Data Only | 119 | 8.6% |
| Satellite Internet | 91 | 6.6% |
| No Internet | 304 | 22.0% |
| Total | 1,382 | 100.0% |
Kingman Summary
Kingman, Kansas is a small city located in the south-central part of the state. It is the county seat of Kingman County and is situated along the Arkansas River. The city has a population of approximately 3,000 people and is part of the Wichita metropolitan area.
History
Kingman was founded in 1872 by a group of settlers from Indiana. The city was named after the Kingman family, who were among the first settlers. The city was incorporated in 1887 and has since grown to become the county seat of Kingman County.
The city was an important stop on the Santa Fe Trail, which was used by settlers and traders to travel between Missouri and New Mexico. The city was also a major stop on the Chisholm Trail, which was used by cattle drovers to transport cattle from Texas to Kansas.
Geography
Kingman is located in south-central Kansas, approximately 50 miles south of Wichita. The city is situated along the Arkansas River and is surrounded by rolling hills and prairies. The city has a total area of 2.2 square miles, all of which is land.
The climate in Kingman is characterized by hot, humid summers and cold, dry winters. The average annual temperature is around 54 degrees Fahrenheit, with an average high of around 87 degrees in the summer and an average low of around 28 degrees in the winter.
Economy
The economy of Kingman is largely based on agriculture and manufacturing. The city is home to several large agricultural operations, including grain elevators, feed mills, and livestock operations. The city is also home to several manufacturing companies, including a plastics manufacturer and a metal fabrication company.
The city is also home to several retail stores, restaurants, and other businesses. The city is served by the Kingman County Airport, which provides air service to the surrounding area.
Demographics
As of the 2010 census, the population of Kingman was 3,037. The racial makeup of the city was 95.3% White, 0.7% African American, 0.3% Native American, 0.3% Asian, 0.1% Pacific Islander, 1.2% from other races, and 2.3% from two or more races. Hispanic or Latino of any race were 3.2% of the population.
The median income for a household in Kingman was $41,250, and the median income for a family was $50,000. The per capita income for the city was $20,845. About 11.2% of families and 14.2% of the population were below the poverty line, including 18.2% of those under age 18 and 8.3% of those age 65 or over.
Kingman is a small city with a rich history and a diverse economy. The city is home to a variety of businesses and industries, and is a great place to live and work. The city is also home to a variety of cultural and recreational activities, making it a great place to visit and explore.
Common Questions
What is Per Capita Income in Kingman?
Per Capita income in Kingman is $27,581.
What is the Median Family Income in Kingman?
Median Family Income in Kingman is $62,794.
What is the Median Household income in Kingman?
Median Household Income in Kingman is $55,532.
What is Income or Wage Gap in Kingman?
Income or Wage Gap in Kingman is 15.0%.
Women in Kingman earn 85.0 cents for every dollar earned by a man.
What is Inequality or Gini Index in Kingman?
Inequality or Gini Index in Kingman is 0.33.
What is the Total Population of Kingman?
Total Population of Kingman is 3,051.
What is the Total Male Population of Kingman?
Total Male Population of Kingman is 1,547.
What is the Total Female Population of Kingman?
Total Female Population of Kingman is 1,504.
What is the Ratio of Males per 100 Females in Kingman?
There are 102.86 Males per 100 Females in Kingman.
What is the Ratio of Females per 100 Males in Kingman?
There are 97.22 Females per 100 Males in Kingman.
What is the Median Population Age in Kingman?
Median Population Age in Kingman is 43.8 Years.
What is the Average Family Size in Kingman
Average Family Size in Kingman is 2.9 People.
What is the Average Household Size in Kingman
Average Household Size in Kingman is 2.1 People.
How Large is the Labor Force in Kingman?
There are 1,400 People in the Labor Forcein in Kingman.
What is the Percentage of People in the Labor Force in Kingman?
55.9% of People are in the Labor Force in Kingman.
What is the Unemployment Rate in Kingman?
Unemployment Rate in Kingman is 8.9%.