Cold Springs, NV Map & Demographics
Cold Springs Map
Cold Springs Overview
$30,275
PER CAPITA INCOME
$89,171
AVG FAMILY INCOME
$85,851
AVG HOUSEHOLD INCOME
44.3%
WAGE / INCOME GAP [ % ]
55.7¢/ $1
WAGE / INCOME GAP [ $ ]
$10,946
FAMILY INCOME DEFICIT
0.29
INEQUALITY / GINI INDEX
11,029
TOTAL POPULATION
5,692
MALE POPULATION
5,337
FEMALE POPULATION
106.65
MALES / 100 FEMALES
93.76
FEMALES / 100 MALES
33.5
MEDIAN AGE
3.6
AVG FAMILY SIZE
3.2
AVG HOUSEHOLD SIZE
5,163
LABOR FORCE [ PEOPLE ]
65.4%
PERCENT IN LABOR FORCE
3.3%
UNEMPLOYMENT RATE
Income in Cold Springs
Income Overview in Cold Springs
Per Capita Income in Cold Springs is $30,275, while median incomes of families and households are $89,171 and $85,851 respectively.
| Characteristic | Number | Measure |
| Per Capita Income | 11,029 | $30,275 |
| Median Family Income | 2,575 | $89,171 |
| Mean Family Income | 2,575 | $100,148 |
| Median Household Income | 3,459 | $85,851 |
| Mean Household Income | 3,459 | $95,797 |
| Income Deficit | 2,575 | $10,946 |
| Wage / Income Gap (%) | 11,029 | 44.28% |
| Wage / Income Gap ($) | 11,029 | 55.72¢ per $1 |
| Gini / Inequality Index | 11,029 | 0.29 |
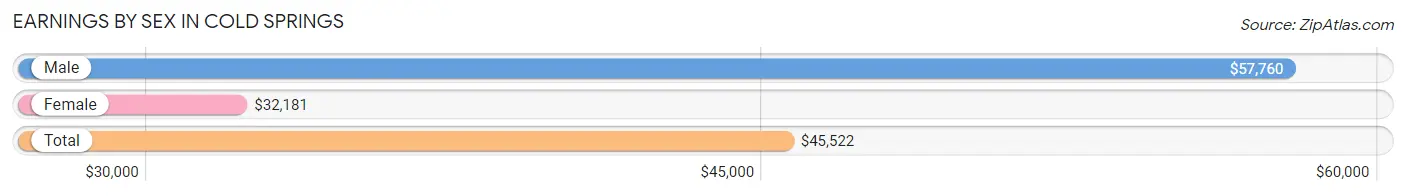
Earnings by Sex in Cold Springs
Average Earnings in Cold Springs are $45,522, $57,760 for men and $32,181 for women, a difference of 44.3%.
| Sex | Number | Average Earnings |
| Male | 2,773 (50.5%) | $57,760 |
| Female | 2,714 (49.5%) | $32,181 |
| Total | 5,487 (100.0%) | $45,522 |
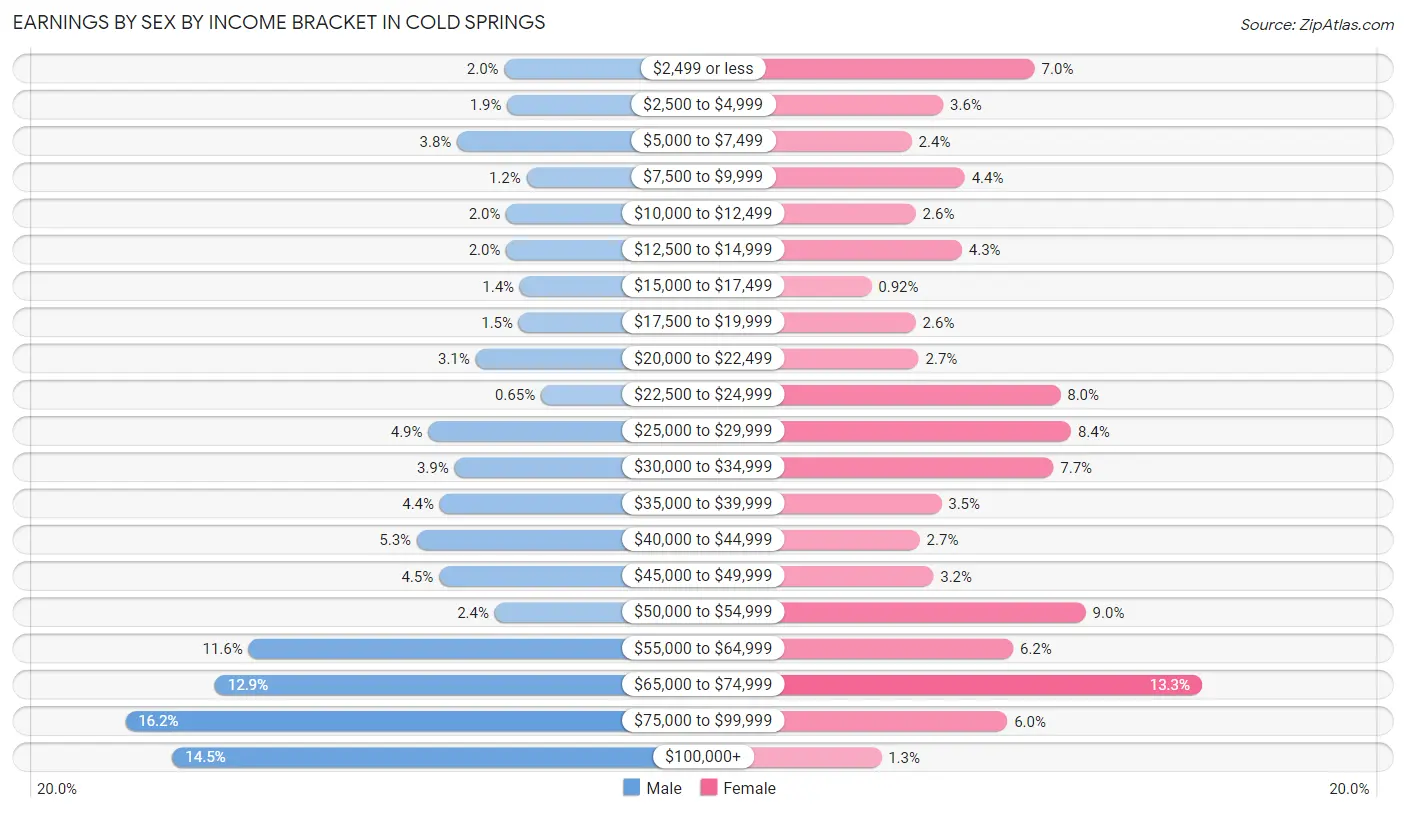
Earnings by Sex by Income Bracket in Cold Springs
The most common earnings brackets in Cold Springs are $75,000 to $99,999 for men (450 | 16.2%) and $65,000 to $74,999 for women (361 | 13.3%).
| Income | Male | Female |
| $2,499 or less | 56 (2.0%) | 191 (7.0%) |
| $2,500 to $4,999 | 53 (1.9%) | 98 (3.6%) |
| $5,000 to $7,499 | 105 (3.8%) | 66 (2.4%) |
| $7,500 to $9,999 | 33 (1.2%) | 120 (4.4%) |
| $10,000 to $12,499 | 54 (1.9%) | 70 (2.6%) |
| $12,500 to $14,999 | 54 (1.9%) | 117 (4.3%) |
| $15,000 to $17,499 | 40 (1.4%) | 25 (0.9%) |
| $17,500 to $19,999 | 41 (1.5%) | 70 (2.6%) |
| $20,000 to $22,499 | 86 (3.1%) | 73 (2.7%) |
| $22,500 to $24,999 | 18 (0.6%) | 217 (8.0%) |
| $25,000 to $29,999 | 135 (4.9%) | 228 (8.4%) |
| $30,000 to $34,999 | 108 (3.9%) | 210 (7.7%) |
| $35,000 to $39,999 | 123 (4.4%) | 96 (3.5%) |
| $40,000 to $44,999 | 147 (5.3%) | 74 (2.7%) |
| $45,000 to $49,999 | 124 (4.5%) | 88 (3.2%) |
| $50,000 to $54,999 | 66 (2.4%) | 243 (8.9%) |
| $55,000 to $64,999 | 322 (11.6%) | 169 (6.2%) |
| $65,000 to $74,999 | 357 (12.9%) | 361 (13.3%) |
| $75,000 to $99,999 | 450 (16.2%) | 163 (6.0%) |
| $100,000+ | 401 (14.5%) | 35 (1.3%) |
| Total | 2,773 (100.0%) | 2,714 (100.0%) |
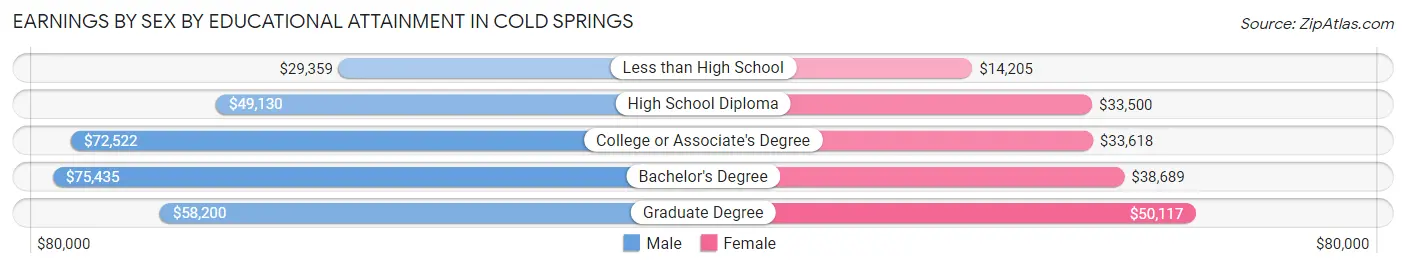
Earnings by Sex by Educational Attainment in Cold Springs
Average earnings in Cold Springs are $59,245 for men and $34,655 for women, a difference of 41.5%. Men with an educational attainment of bachelor's degree enjoy the highest average annual earnings of $75,435, while those with less than high school education earn the least with $29,359. Women with an educational attainment of graduate degree earn the most with the average annual earnings of $50,117, while those with less than high school education have the smallest earnings of $14,205.
| Educational Attainment | Male Income | Female Income |
| Less than High School | $29,359 | $14,205 |
| High School Diploma | $49,130 | $33,500 |
| College or Associate's Degree | $72,522 | $33,618 |
| Bachelor's Degree | $75,435 | $38,689 |
| Graduate Degree | $58,200 | $50,117 |
| Total | $59,245 | $34,655 |
Family Income in Cold Springs
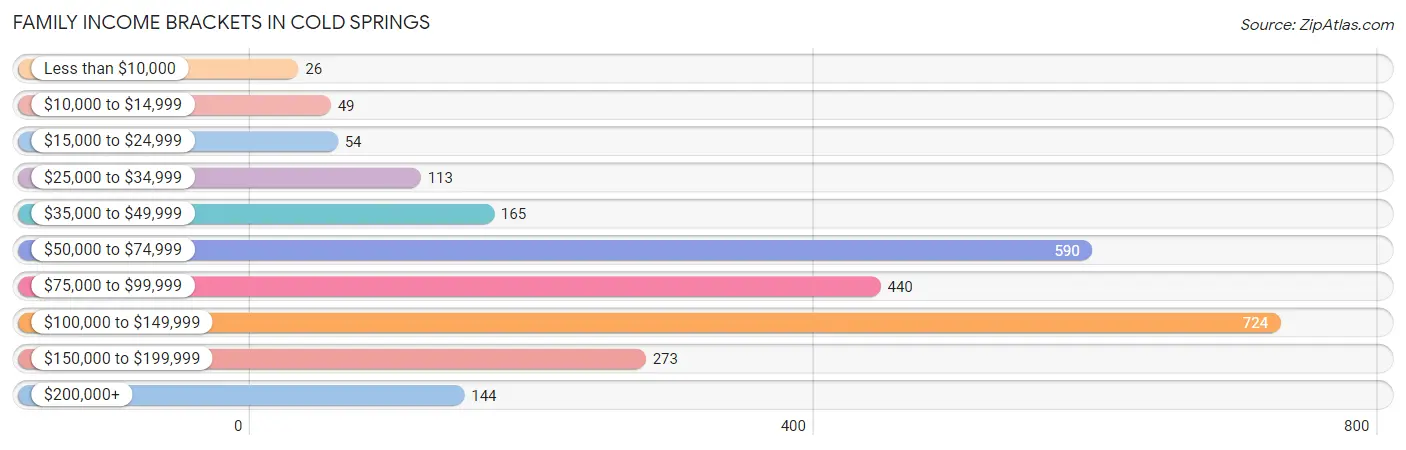
Family Income Brackets in Cold Springs
According to the Cold Springs family income data, there are 724 families falling into the $100,000 to $149,999 income range, which is the most common income bracket and makes up 28.1% of all families. Conversely, the less than $10,000 income bracket is the least frequent group with only 26 families (1.0%) belonging to this category.
| Income Bracket | # Families | % Families |
| Less than $10,000 | 26 | 1.0% |
| $10,000 to $14,999 | 49 | 1.9% |
| $15,000 to $24,999 | 54 | 2.1% |
| $25,000 to $34,999 | 113 | 4.4% |
| $35,000 to $49,999 | 165 | 6.4% |
| $50,000 to $74,999 | 590 | 22.9% |
| $75,000 to $99,999 | 440 | 17.1% |
| $100,000 to $149,999 | 724 | 28.1% |
| $150,000 to $199,999 | 273 | 10.6% |
| $200,000+ | 144 | 5.6% |
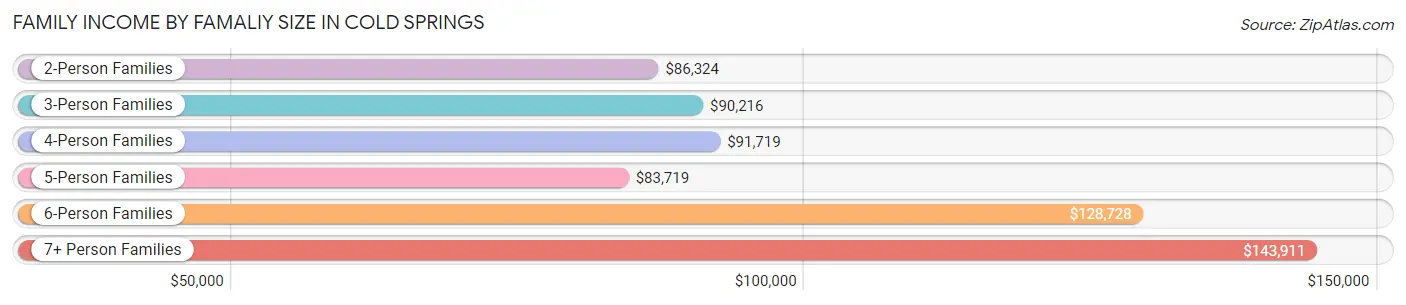
Family Income by Famaliy Size in Cold Springs
7+ person families (81 | 3.2%) account for the highest median family income in Cold Springs with $143,911 per family, while 2-person families (842 | 32.7%) have the highest median income of $43,162 per family member.
| Income Bracket | # Families | Median Income |
| 2-Person Families | 842 (32.7%) | $86,324 |
| 3-Person Families | 435 (16.9%) | $90,216 |
| 4-Person Families | 591 (23.0%) | $91,719 |
| 5-Person Families | 465 (18.1%) | $83,719 |
| 6-Person Families | 161 (6.2%) | $128,728 |
| 7+ Person Families | 81 (3.2%) | $143,911 |
| Total | 2,575 (100.0%) | $89,171 |
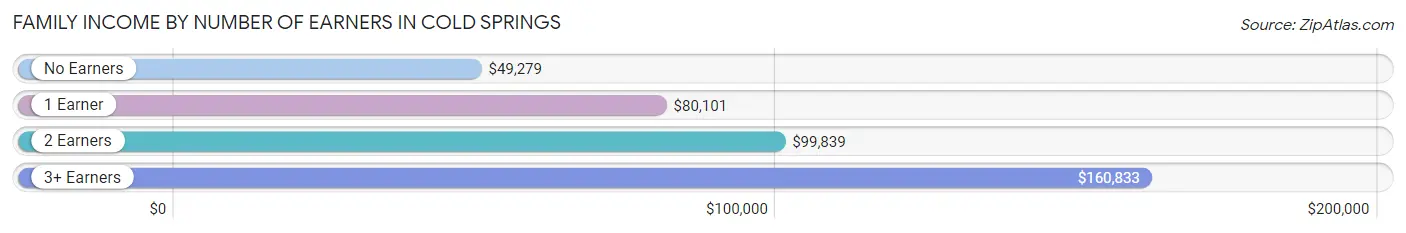
Family Income by Number of Earners in Cold Springs
The median family income in Cold Springs is $89,171, with families comprising 3+ earners (368) having the highest median family income of $160,833, while families with no earners (306) have the lowest median family income of $49,279, accounting for 14.3% and 11.9% of families, respectively.
| Number of Earners | # Families | Median Income |
| No Earners | 306 (11.9%) | $49,279 |
| 1 Earner | 739 (28.7%) | $80,101 |
| 2 Earners | 1,162 (45.1%) | $99,839 |
| 3+ Earners | 368 (14.3%) | $160,833 |
| Total | 2,575 (100.0%) | $89,171 |
Household Income in Cold Springs
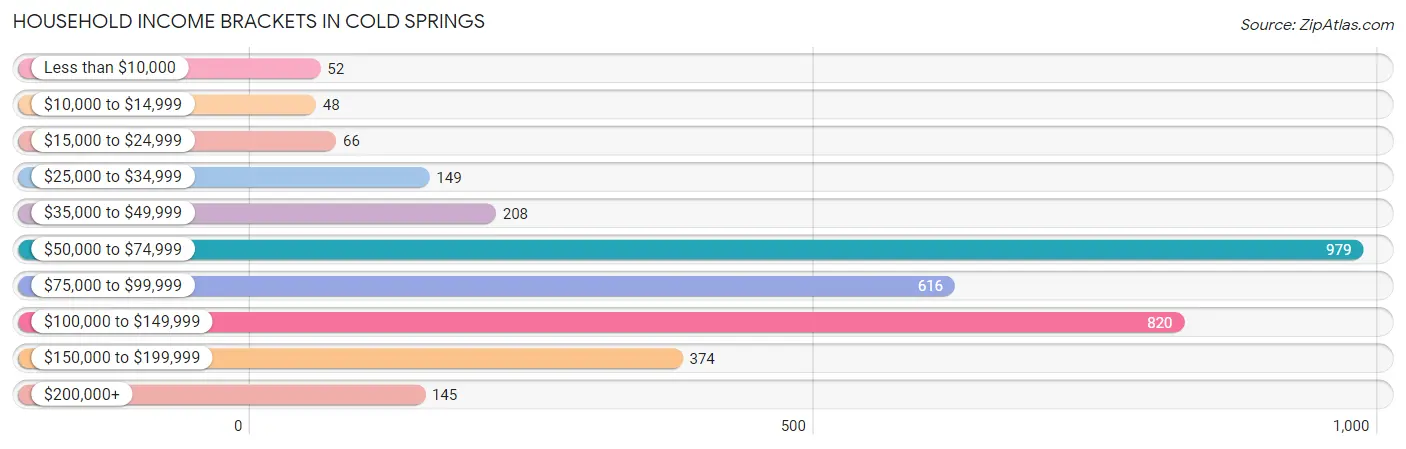
Household Income Brackets in Cold Springs
With 979 households falling in the category, the $50,000 to $74,999 income range is the most frequent in Cold Springs, accounting for 28.3% of all households. In contrast, only 48 households (1.4%) fall into the $10,000 to $14,999 income bracket, making it the least populous group.
| Income Bracket | # Households | % Households |
| Less than $10,000 | 52 | 1.5% |
| $10,000 to $14,999 | 48 | 1.4% |
| $15,000 to $24,999 | 66 | 1.9% |
| $25,000 to $34,999 | 149 | 4.3% |
| $35,000 to $49,999 | 208 | 6.0% |
| $50,000 to $74,999 | 979 | 28.3% |
| $75,000 to $99,999 | 616 | 17.8% |
| $100,000 to $149,999 | 820 | 23.7% |
| $150,000 to $199,999 | 374 | 10.8% |
| $200,000+ | 145 | 4.2% |
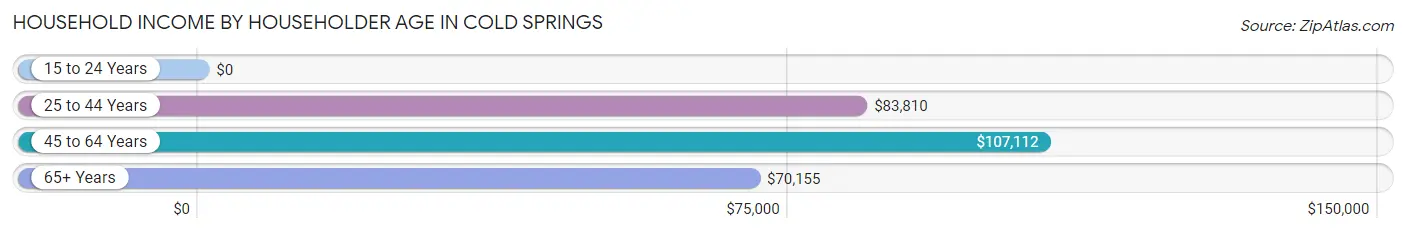
Household Income by Householder Age in Cold Springs
The median household income in Cold Springs is $85,851, with the highest median household income of $107,112 found in the 45 to 64 years age bracket for the primary householder. A total of 1,411 households (40.8%) fall into this category. Meanwhile, the 15 to 24 years age bracket for the primary householder has the lowest median household income of $0, with 43 households (1.2%) in this group.
| Income Bracket | # Households | Median Income |
| 15 to 24 Years | 43 (1.2%) | $0 |
| 25 to 44 Years | 1,396 (40.4%) | $83,810 |
| 45 to 64 Years | 1,411 (40.8%) | $107,112 |
| 65+ Years | 609 (17.6%) | $70,155 |
| Total | 3,459 (100.0%) | $85,851 |
Poverty in Cold Springs
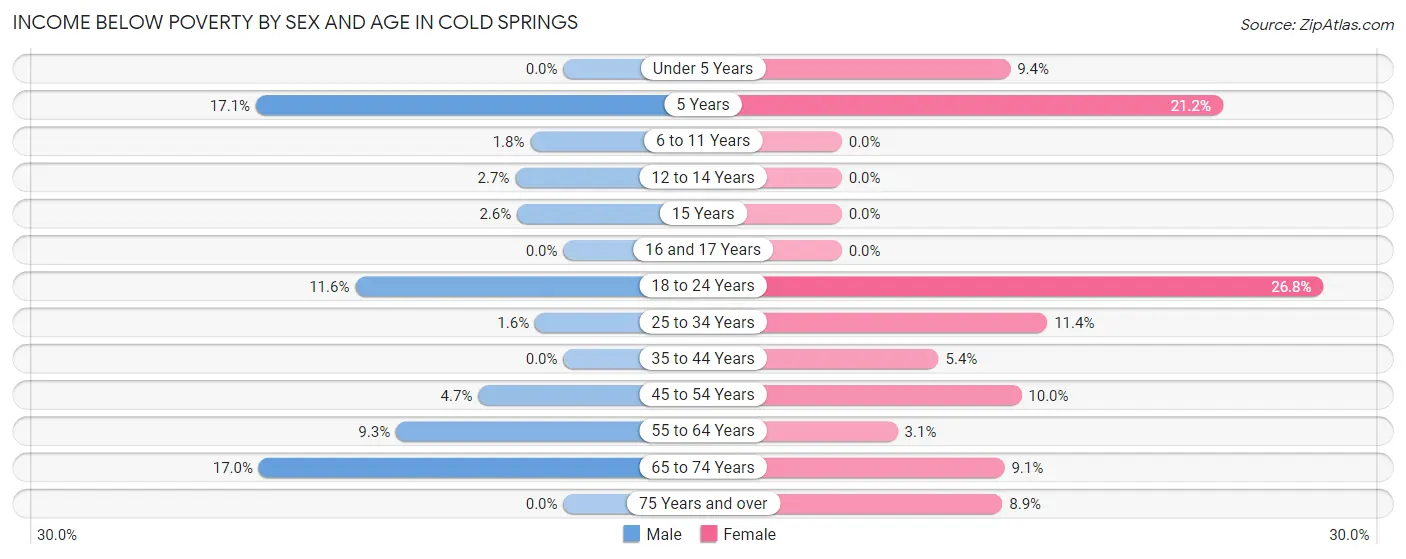
Income Below Poverty by Sex and Age in Cold Springs
With 4.8% poverty level for males and 7.7% for females among the residents of Cold Springs, 5 year old males and 18 to 24 year old females are the most vulnerable to poverty, with 19 males (17.1%) and 74 females (26.8%) in their respective age groups living below the poverty level.
| Age Bracket | Male | Female |
| Under 5 Years | 0 (0.0%) | 53 (9.4%) |
| 5 Years | 19 (17.1%) | 7 (21.2%) |
| 6 to 11 Years | 9 (1.8%) | 0 (0.0%) |
| 12 to 14 Years | 7 (2.7%) | 0 (0.0%) |
| 15 Years | 7 (2.6%) | 0 (0.0%) |
| 16 and 17 Years | 0 (0.0%) | 0 (0.0%) |
| 18 to 24 Years | 24 (11.6%) | 74 (26.8%) |
| 25 to 34 Years | 13 (1.6%) | 115 (11.4%) |
| 35 to 44 Years | 0 (0.0%) | 41 (5.4%) |
| 45 to 54 Years | 34 (4.7%) | 49 (10.0%) |
| 55 to 64 Years | 79 (9.3%) | 25 (3.1%) |
| 65 to 74 Years | 67 (17.0%) | 31 (9.1%) |
| 75 Years and over | 0 (0.0%) | 16 (8.9%) |
| Total | 259 (4.8%) | 411 (7.7%) |
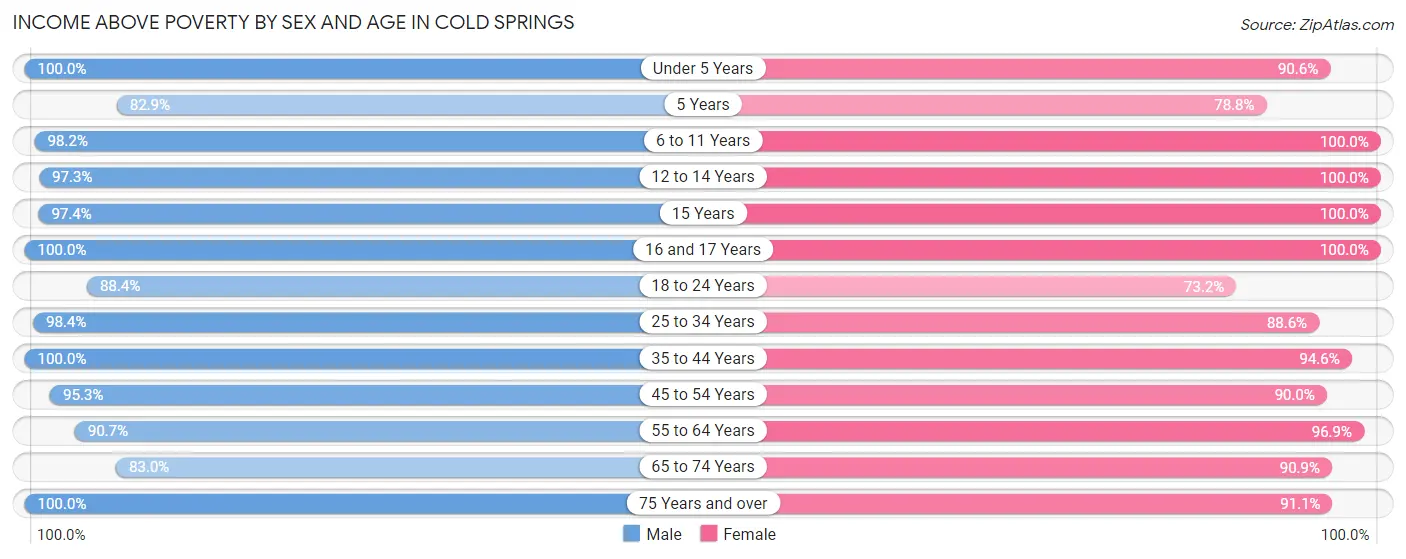
Income Above Poverty by Sex and Age in Cold Springs
According to the poverty statistics in Cold Springs, males aged under 5 years and females aged 6 to 11 years are the age groups that are most secure financially, with 100.0% of males and 100.0% of females in these age groups living above the poverty line.
| Age Bracket | Male | Female |
| Under 5 Years | 366 (100.0%) | 512 (90.6%) |
| 5 Years | 92 (82.9%) | 26 (78.8%) |
| 6 to 11 Years | 479 (98.2%) | 487 (100.0%) |
| 12 to 14 Years | 254 (97.3%) | 161 (100.0%) |
| 15 Years | 264 (97.4%) | 100 (100.0%) |
| 16 and 17 Years | 204 (100.0%) | 133 (100.0%) |
| 18 to 24 Years | 183 (88.4%) | 202 (73.2%) |
| 25 to 34 Years | 811 (98.4%) | 890 (88.6%) |
| 35 to 44 Years | 562 (100.0%) | 720 (94.6%) |
| 45 to 54 Years | 684 (95.3%) | 441 (90.0%) |
| 55 to 64 Years | 769 (90.7%) | 780 (96.9%) |
| 65 to 74 Years | 328 (83.0%) | 311 (90.9%) |
| 75 Years and over | 146 (100.0%) | 163 (91.1%) |
| Total | 5,142 (95.2%) | 4,926 (92.3%) |
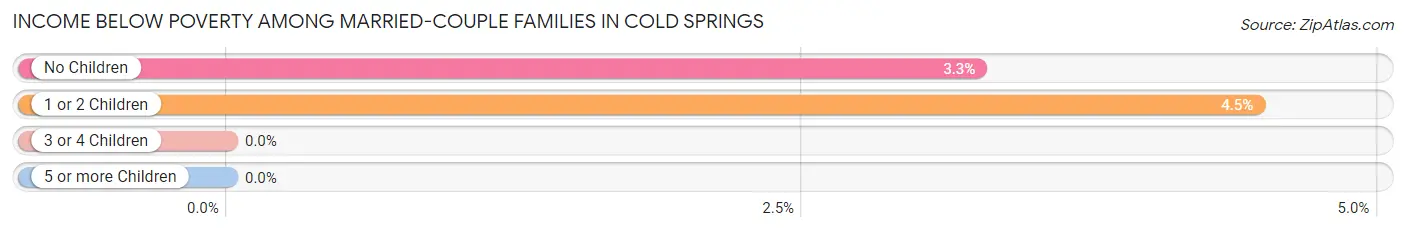
Income Below Poverty Among Married-Couple Families in Cold Springs
The poverty statistics for married-couple families in Cold Springs show that 3.0% or 64 of the total 2,118 families live below the poverty line. Families with 1 or 2 children have the highest poverty rate of 4.5%, comprising of 34 families. On the other hand, families with 3 or 4 children have the lowest poverty rate of 0.0%, which includes 0 families.
| Children | Above Poverty | Below Poverty |
| No Children | 891 (96.7%) | 30 (3.3%) |
| 1 or 2 Children | 727 (95.5%) | 34 (4.5%) |
| 3 or 4 Children | 405 (100.0%) | 0 (0.0%) |
| 5 or more Children | 31 (100.0%) | 0 (0.0%) |
| Total | 2,054 (97.0%) | 64 (3.0%) |
Income Below Poverty Among Single-Parent Households in Cold Springs
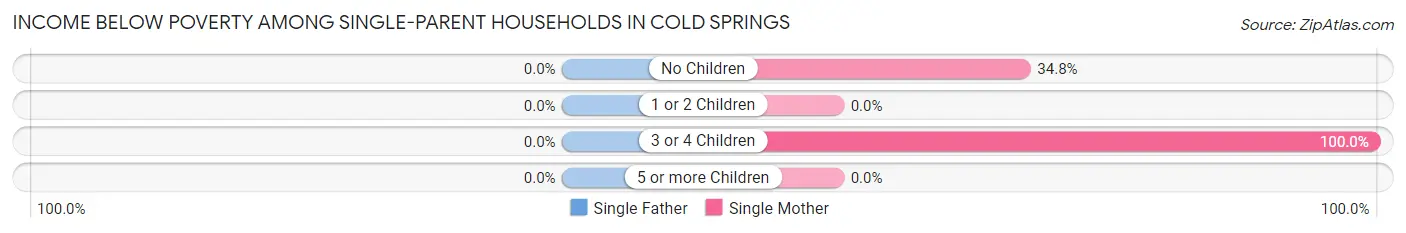
| Children | Single Father | Single Mother |
| No Children | 0 (0.0%) | 16 (34.8%) |
| 1 or 2 Children | 0 (0.0%) | 0 (0.0%) |
| 3 or 4 Children | 0 (0.0%) | 18 (100.0%) |
| 5 or more Children | 0 (0.0%) | 0 (0.0%) |
| Total | 0 (0.0%) | 34 (13.3%) |
Income Below Poverty Among Married-Couple vs Single-Parent Households in Cold Springs
The poverty data for Cold Springs shows that 64 of the married-couple family households (3.0%) and 34 of the single-parent households (7.4%) are living below the poverty level. Within the married-couple family households, those with 1 or 2 children have the highest poverty rate, with 34 households (4.5%) falling below the poverty line. Among the single-parent households, those with 3 or 4 children have the highest poverty rate, with 18 household (69.2%) living below poverty.
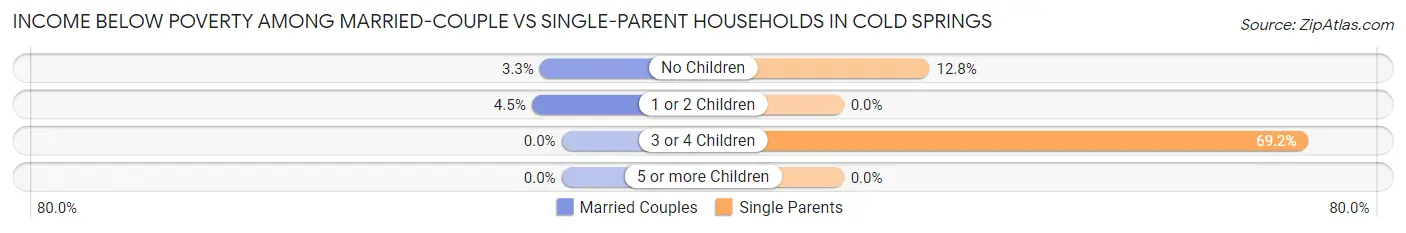
| Children | Married-Couple Families | Single-Parent Households |
| No Children | 30 (3.3%) | 16 (12.8%) |
| 1 or 2 Children | 34 (4.5%) | 0 (0.0%) |
| 3 or 4 Children | 0 (0.0%) | 18 (69.2%) |
| 5 or more Children | 0 (0.0%) | 0 (0.0%) |
| Total | 64 (3.0%) | 34 (7.4%) |
Race in Cold Springs
The most populous races in Cold Springs are White / Caucasian (7,747 | 70.2%), Hispanic or Latino (2,662 | 24.1%), and Some other Race (1,546 | 14.0%).
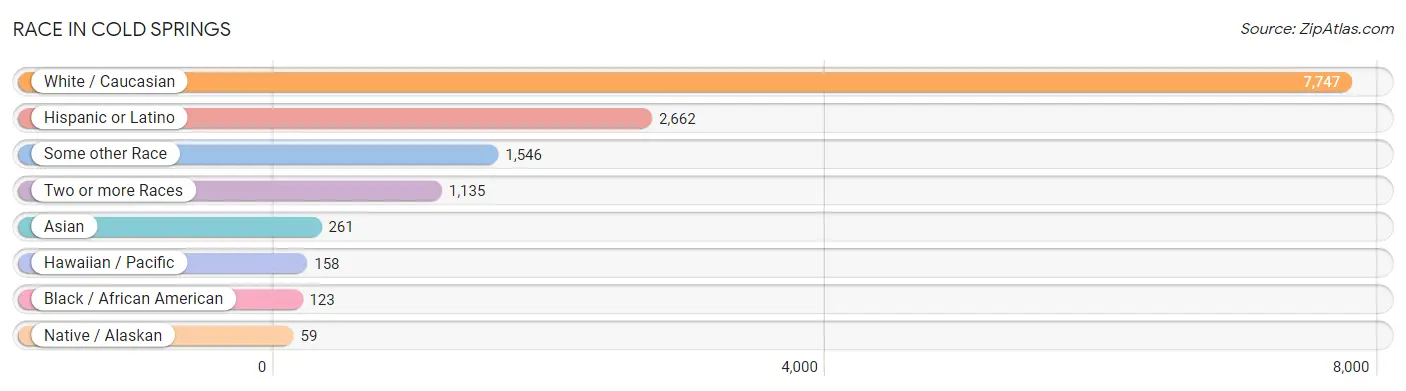
| Race | # Population | % Population |
| Asian | 261 | 2.4% |
| Black / African American | 123 | 1.1% |
| Hawaiian / Pacific | 158 | 1.4% |
| Hispanic or Latino | 2,662 | 24.1% |
| Native / Alaskan | 59 | 0.5% |
| White / Caucasian | 7,747 | 70.2% |
| Two or more Races | 1,135 | 10.3% |
| Some other Race | 1,546 | 14.0% |
| Total | 11,029 | 100.0% |
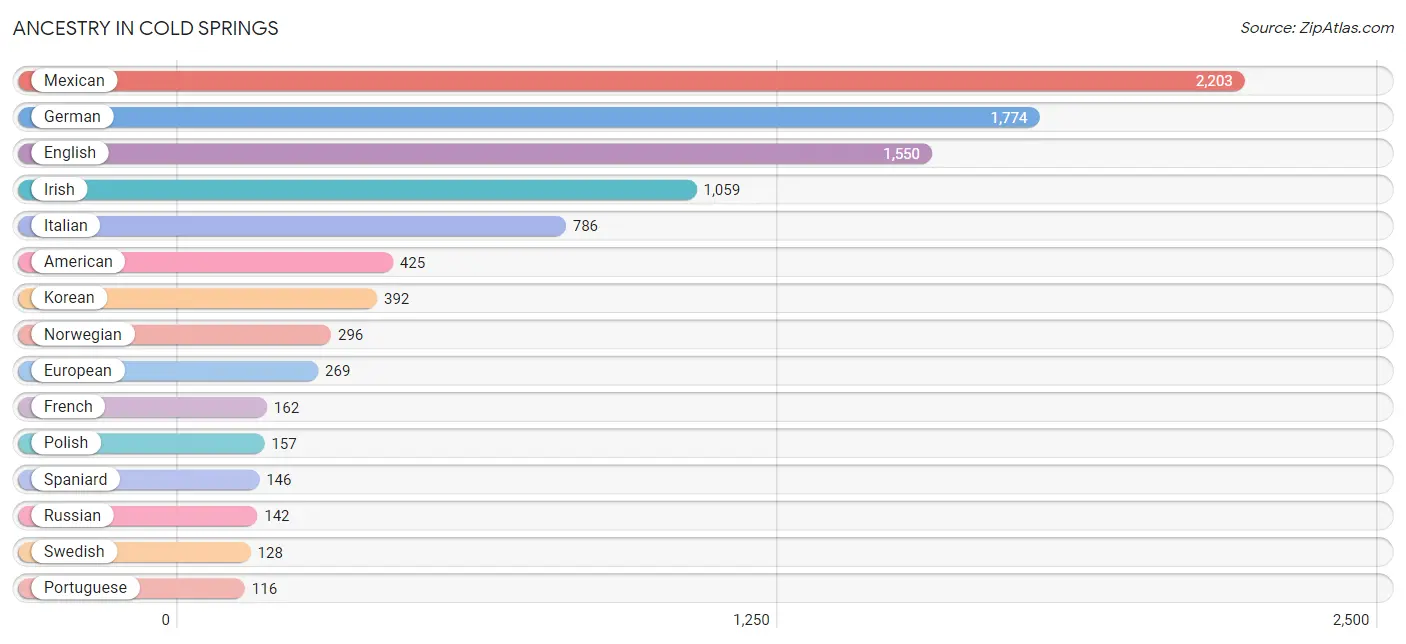
Ancestry in Cold Springs
The most populous ancestries reported in Cold Springs are Mexican (2,203 | 20.0%), German (1,774 | 16.1%), English (1,550 | 14.1%), Irish (1,059 | 9.6%), and Italian (786 | 7.1%), together accounting for 66.8% of all Cold Springs residents.
| Ancestry | # Population | % Population |
| African | 8 | 0.1% |
| American | 425 | 3.8% |
| Apache | 8 | 0.1% |
| Austrian | 28 | 0.3% |
| Belgian | 7 | 0.1% |
| Belizean | 9 | 0.1% |
| Bhutanese | 115 | 1.0% |
| British | 38 | 0.3% |
| Burmese | 18 | 0.2% |
| Canadian | 23 | 0.2% |
| Central American | 49 | 0.4% |
| Central American Indian | 9 | 0.1% |
| Cherokee | 83 | 0.7% |
| Chickasaw | 16 | 0.2% |
| Chippewa | 6 | 0.1% |
| Choctaw | 7 | 0.1% |
| Costa Rican | 35 | 0.3% |
| Croatian | 8 | 0.1% |
| Czech | 46 | 0.4% |
| Danish | 47 | 0.4% |
| Dutch | 60 | 0.5% |
| Eastern European | 13 | 0.1% |
| Ecuadorian | 21 | 0.2% |
| English | 1,550 | 14.1% |
| European | 269 | 2.4% |
| Finnish | 65 | 0.6% |
| French | 162 | 1.5% |
| French American Indian | 8 | 0.1% |
| French Canadian | 39 | 0.4% |
| German | 1,774 | 16.1% |
| Greek | 7 | 0.1% |
| Hungarian | 36 | 0.3% |
| Icelander | 12 | 0.1% |
| Indian (Asian) | 14 | 0.1% |
| Irish | 1,059 | 9.6% |
| Italian | 786 | 7.1% |
| Korean | 392 | 3.5% |
| Mexican | 2,203 | 20.0% |
| Native Hawaiian | 41 | 0.4% |
| Northern European | 41 | 0.4% |
| Norwegian | 296 | 2.7% |
| Paiute | 3 | 0.0% |
| Peruvian | 85 | 0.8% |
| Polish | 157 | 1.4% |
| Portuguese | 116 | 1.1% |
| Puerto Rican | 48 | 0.4% |
| Russian | 142 | 1.3% |
| Salvadoran | 14 | 0.1% |
| Scotch-Irish | 76 | 0.7% |
| Scottish | 40 | 0.4% |
| Serbian | 52 | 0.5% |
| Slovene | 54 | 0.5% |
| South American | 106 | 1.0% |
| Spaniard | 146 | 1.3% |
| Spanish | 66 | 0.6% |
| Sri Lankan | 14 | 0.1% |
| Subsaharan African | 8 | 0.1% |
| Swedish | 128 | 1.2% |
| Swiss | 15 | 0.1% |
| Turkish | 16 | 0.2% |
| Ukrainian | 7 | 0.1% |
| Welsh | 111 | 1.0% |
| Yaqui | 8 | 0.1% |
| Yugoslavian | 24 | 0.2% | View All 64 Rows |
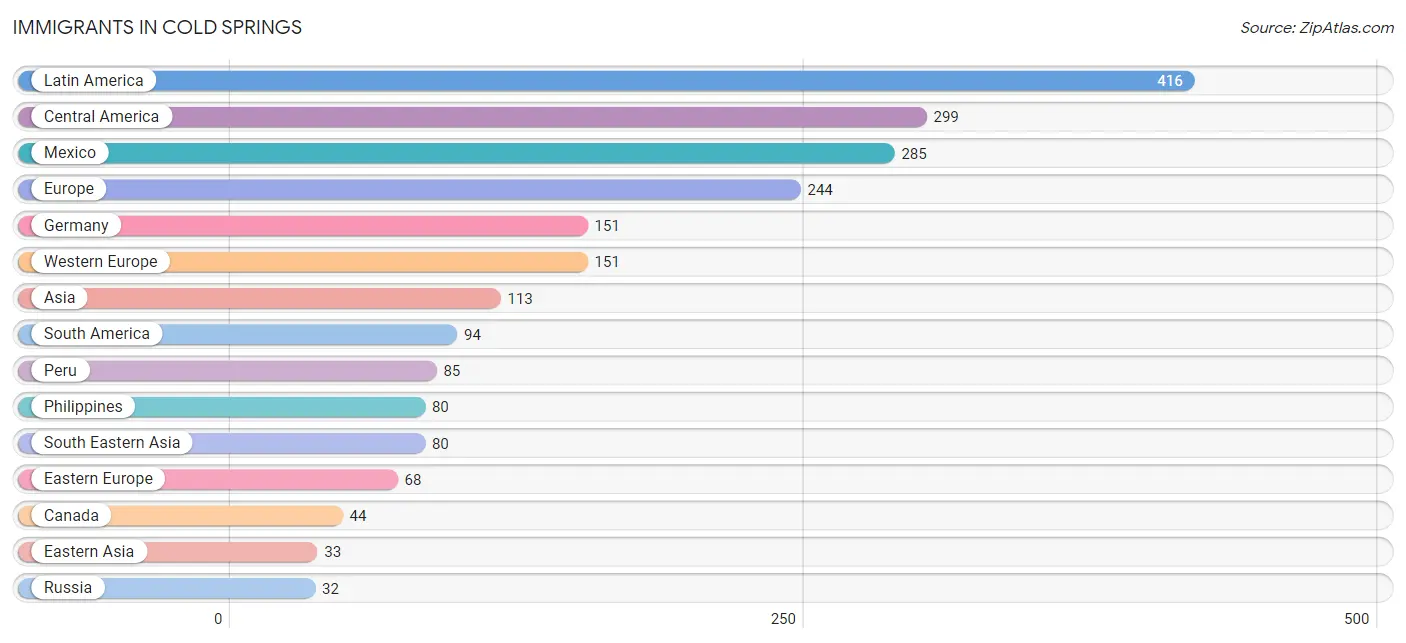
Immigrants in Cold Springs
The most numerous immigrant groups reported in Cold Springs came from Latin America (416 | 3.8%), Central America (299 | 2.7%), Mexico (285 | 2.6%), Europe (244 | 2.2%), and Germany (151 | 1.4%), together accounting for 12.6% of all Cold Springs residents.
| Immigration Origin | # Population | % Population |
| Asia | 113 | 1.0% |
| Canada | 44 | 0.4% |
| Caribbean | 23 | 0.2% |
| Central America | 299 | 2.7% |
| Croatia | 16 | 0.2% |
| Denmark | 13 | 0.1% |
| Eastern Asia | 33 | 0.3% |
| Eastern Europe | 68 | 0.6% |
| Ecuador | 9 | 0.1% |
| El Salvador | 14 | 0.1% |
| Europe | 244 | 2.2% |
| Germany | 151 | 1.4% |
| Japan | 18 | 0.2% |
| Korea | 15 | 0.1% |
| Latin America | 416 | 3.8% |
| Mexico | 285 | 2.6% |
| Northern Europe | 25 | 0.2% |
| Peru | 85 | 0.8% |
| Philippines | 80 | 0.7% |
| Poland | 13 | 0.1% |
| Russia | 32 | 0.3% |
| South America | 94 | 0.9% |
| South Eastern Asia | 80 | 0.7% |
| Trinidad and Tobago | 23 | 0.2% |
| Ukraine | 7 | 0.1% |
| Western Europe | 151 | 1.4% | View All 26 Rows |
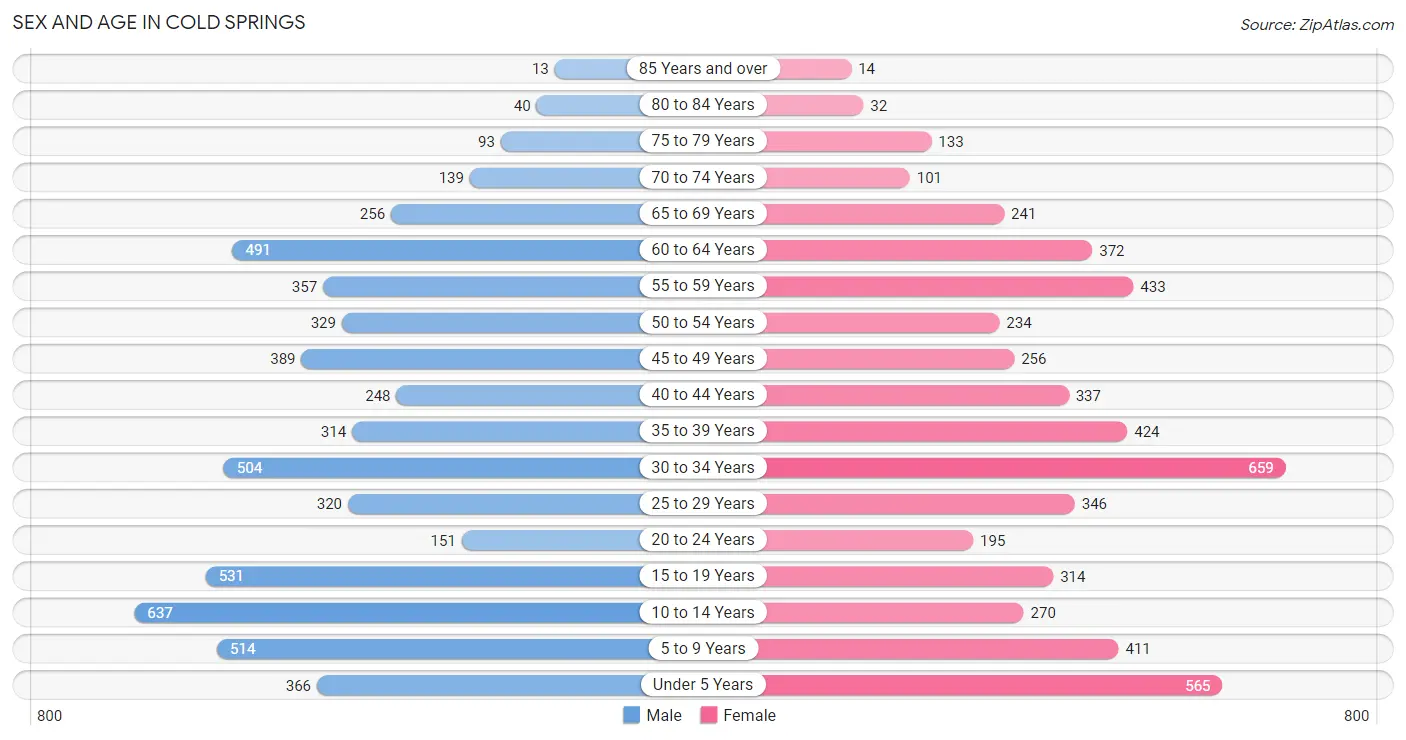
Sex and Age in Cold Springs
Sex and Age in Cold Springs
The most populous age groups in Cold Springs are 10 to 14 Years (637 | 11.2%) for men and 30 to 34 Years (659 | 12.3%) for women.
| Age Bracket | Male | Female |
| Under 5 Years | 366 (6.4%) | 565 (10.6%) |
| 5 to 9 Years | 514 (9.0%) | 411 (7.7%) |
| 10 to 14 Years | 637 (11.2%) | 270 (5.1%) |
| 15 to 19 Years | 531 (9.3%) | 314 (5.9%) |
| 20 to 24 Years | 151 (2.6%) | 195 (3.6%) |
| 25 to 29 Years | 320 (5.6%) | 346 (6.5%) |
| 30 to 34 Years | 504 (8.8%) | 659 (12.3%) |
| 35 to 39 Years | 314 (5.5%) | 424 (7.9%) |
| 40 to 44 Years | 248 (4.4%) | 337 (6.3%) |
| 45 to 49 Years | 389 (6.8%) | 256 (4.8%) |
| 50 to 54 Years | 329 (5.8%) | 234 (4.4%) |
| 55 to 59 Years | 357 (6.3%) | 433 (8.1%) |
| 60 to 64 Years | 491 (8.6%) | 372 (7.0%) |
| 65 to 69 Years | 256 (4.5%) | 241 (4.5%) |
| 70 to 74 Years | 139 (2.4%) | 101 (1.9%) |
| 75 to 79 Years | 93 (1.6%) | 133 (2.5%) |
| 80 to 84 Years | 40 (0.7%) | 32 (0.6%) |
| 85 Years and over | 13 (0.2%) | 14 (0.3%) |
| Total | 5,692 (100.0%) | 5,337 (100.0%) |
Families and Households in Cold Springs
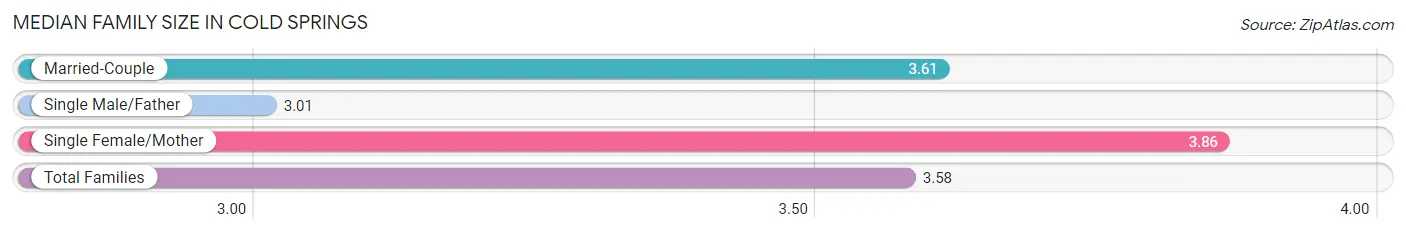
Median Family Size in Cold Springs
The median family size in Cold Springs is 3.58 persons per family, with single female/mother families (255 | 9.9%) accounting for the largest median family size of 3.86 persons per family. On the other hand, single male/father families (202 | 7.8%) represent the smallest median family size with 3.01 persons per family.
| Family Type | # Families | Family Size |
| Married-Couple | 2,118 (82.3%) | 3.61 |
| Single Male/Father | 202 (7.8%) | 3.01 |
| Single Female/Mother | 255 (9.9%) | 3.86 |
| Total Families | 2,575 (100.0%) | 3.58 |
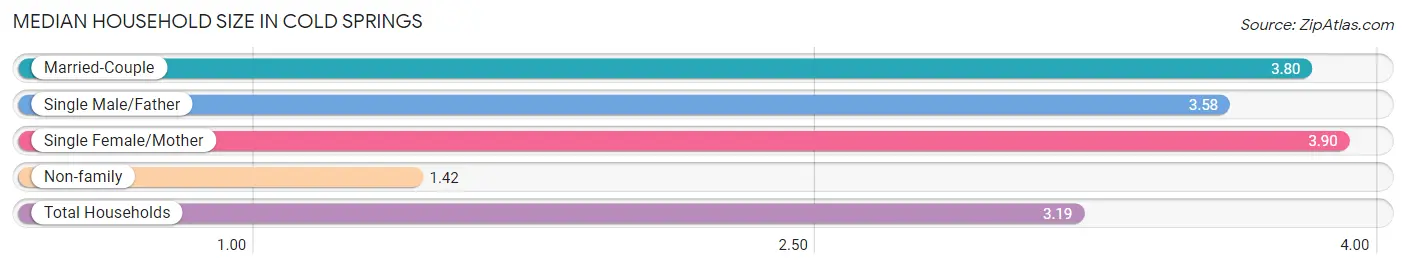
Median Household Size in Cold Springs
The median household size in Cold Springs is 3.19 persons per household, with single female/mother households (255 | 7.4%) accounting for the largest median household size of 3.9 persons per household. non-family households (884 | 25.6%) represent the smallest median household size with 1.42 persons per household.
| Household Type | # Households | Household Size |
| Married-Couple | 2,118 (61.2%) | 3.80 |
| Single Male/Father | 202 (5.8%) | 3.58 |
| Single Female/Mother | 255 (7.4%) | 3.90 |
| Non-family | 884 (25.6%) | 1.42 |
| Total Households | 3,459 (100.0%) | 3.19 |
Household Size by Marriage Status in Cold Springs
Out of a total of 3,459 households in Cold Springs, 2,575 (74.4%) are family households, while 884 (25.6%) are nonfamily households. The most numerous type of family households are 2-person households, comprising 743, and the most common type of nonfamily households are 1-person households, comprising 593.
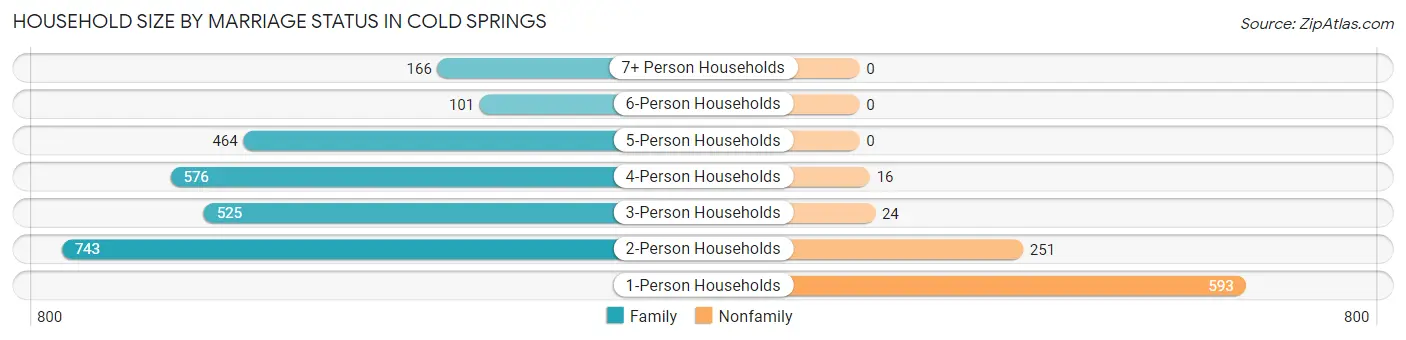
| Household Size | Family Households | Nonfamily Households |
| 1-Person Households | - | 593 (17.1%) |
| 2-Person Households | 743 (21.5%) | 251 (7.3%) |
| 3-Person Households | 525 (15.2%) | 24 (0.7%) |
| 4-Person Households | 576 (16.7%) | 16 (0.5%) |
| 5-Person Households | 464 (13.4%) | 0 (0.0%) |
| 6-Person Households | 101 (2.9%) | 0 (0.0%) |
| 7+ Person Households | 166 (4.8%) | 0 (0.0%) |
| Total | 2,575 (74.4%) | 884 (25.6%) |
Female Fertility in Cold Springs
Fertility by Age in Cold Springs
Average fertility rate in Cold Springs is 69.0 births per 1,000 women. Women in the age bracket of 20 to 34 years have the highest fertility rate with 93.0 births per 1,000 women. Women in the age bracket of 20 to 34 years acount for 63.8% of all women with births.
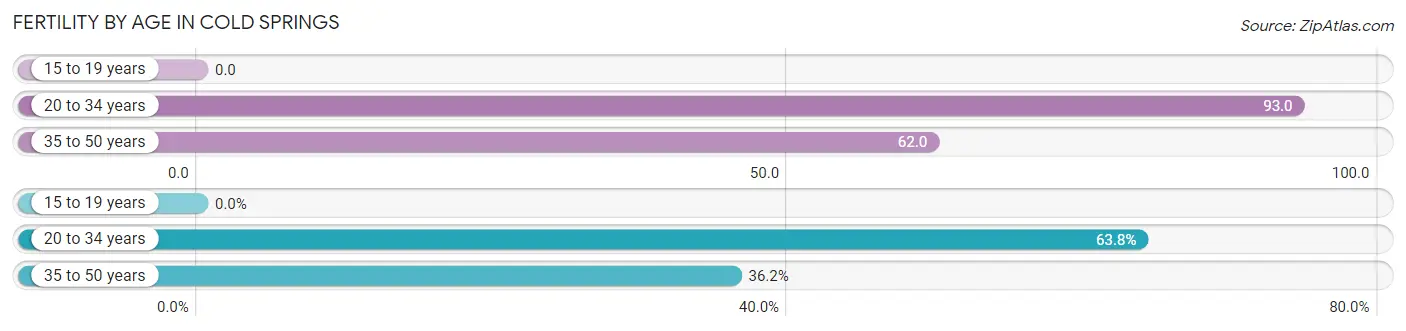
| Age Bracket | Women with Births | Births / 1,000 Women |
| 15 to 19 years | 0 (0.0%) | 0.0 |
| 20 to 34 years | 111 (63.8%) | 93.0 |
| 35 to 50 years | 63 (36.2%) | 62.0 |
| Total | 174 (100.0%) | 69.0 |
Fertility by Age by Marriage Status in Cold Springs
97.7% of women with births (174) in Cold Springs are married. The highest percentage of unmarried women with births falls into 20 to 34 years age bracket with 3.6% of them unmarried at the time of birth, while the lowest percentage of unmarried women with births belong to 35 to 50 years age bracket with 0.0% of them unmarried.
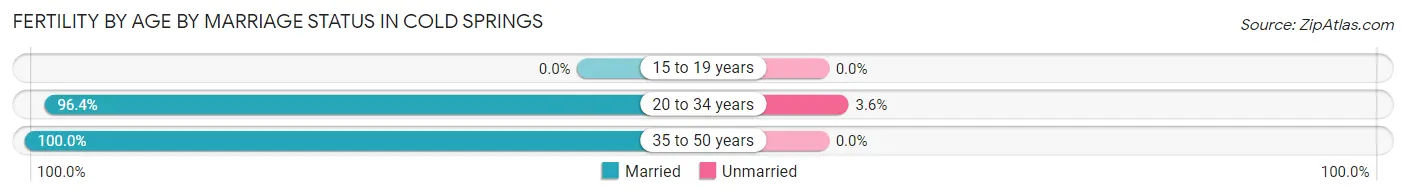
| Age Bracket | Married | Unmarried |
| 15 to 19 years | 0 (0.0%) | 0 (0.0%) |
| 20 to 34 years | 107 (96.4%) | 4 (3.6%) |
| 35 to 50 years | 63 (100.0%) | 0 (0.0%) |
| Total | 170 (97.7%) | 4 (2.3%) |
Fertility by Education in Cold Springs
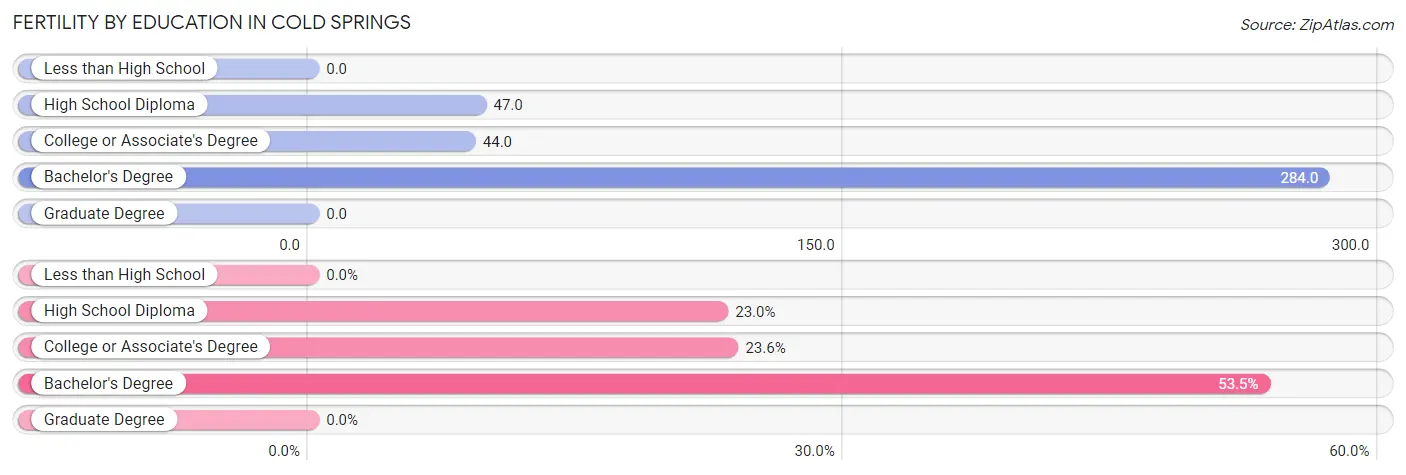
| Educational Attainment | Women with Births | Births / 1,000 Women |
| Less than High School | 0 (0.0%) | 0.0 |
| High School Diploma | 40 (23.0%) | 47.0 |
| College or Associate's Degree | 41 (23.6%) | 44.0 |
| Bachelor's Degree | 93 (53.4%) | 284.0 |
| Graduate Degree | 0 (0.0%) | 0.0 |
| Total | 174 (100.0%) | 69.0 |
Fertility by Education by Marriage Status in Cold Springs
2.3% of women with births in Cold Springs are unmarried. Women with the educational attainment of college or associate's degree are most likely to be married with 100.0% of them married at childbirth, while women with the educational attainment of high school diploma are least likely to be married with 10.0% of them unmarried at childbirth.
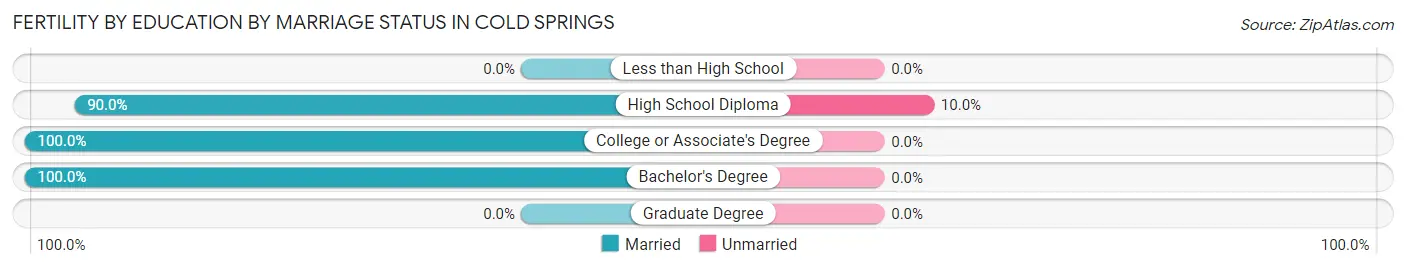
| Educational Attainment | Married | Unmarried |
| Less than High School | 0 (0.0%) | 0 (0.0%) |
| High School Diploma | 36 (90.0%) | 4 (10.0%) |
| College or Associate's Degree | 41 (100.0%) | 0 (0.0%) |
| Bachelor's Degree | 93 (100.0%) | 0 (0.0%) |
| Graduate Degree | 0 (0.0%) | 0 (0.0%) |
| Total | 170 (97.7%) | 4 (2.3%) |
Employment Characteristics in Cold Springs
Employment by Class of Employer in Cold Springs
Among the 4,916 employed individuals in Cold Springs, private company employees (3,594 | 73.1%), local government employees (415 | 8.4%), and federal government employees (307 | 6.2%) make up the most common classes of employment.
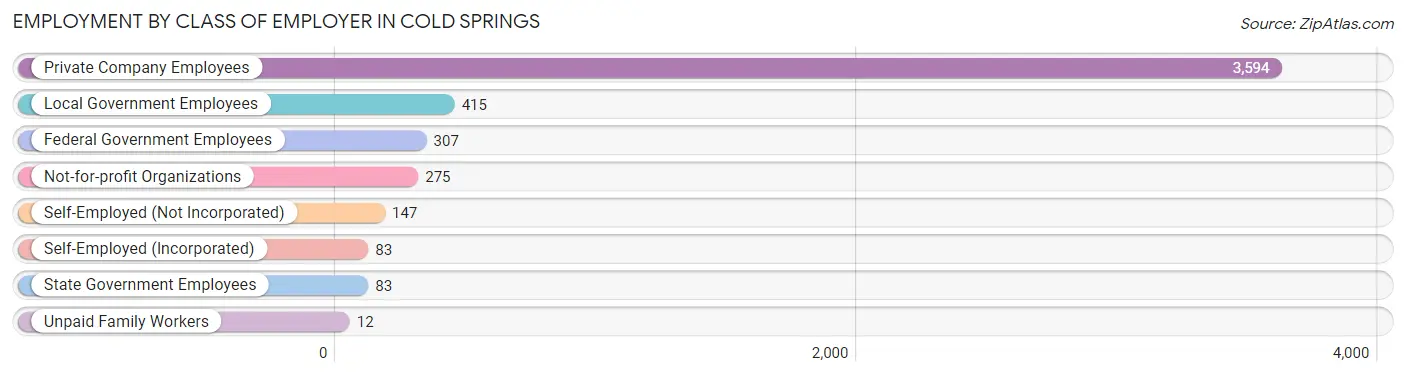
| Employer Class | # Employees | % Employees |
| Private Company Employees | 3,594 | 73.1% |
| Self-Employed (Incorporated) | 83 | 1.7% |
| Self-Employed (Not Incorporated) | 147 | 3.0% |
| Not-for-profit Organizations | 275 | 5.6% |
| Local Government Employees | 415 | 8.4% |
| State Government Employees | 83 | 1.7% |
| Federal Government Employees | 307 | 6.2% |
| Unpaid Family Workers | 12 | 0.2% |
| Total | 4,916 | 100.0% |
Employment Status by Age in Cold Springs
According to the labor force statistics for Cold Springs, out of the total population over 16 years of age (7,895), 65.4% or 5,163 individuals are in the labor force, with 3.3% or 170 of them unemployed. The age group with the highest labor force participation rate is 30 to 34 years, with 87.4% or 1,016 individuals in the labor force. Within the labor force, the 65 to 74 years age range has the highest percentage of unemployed individuals, with 8.4% or 14 of them being unemployed.
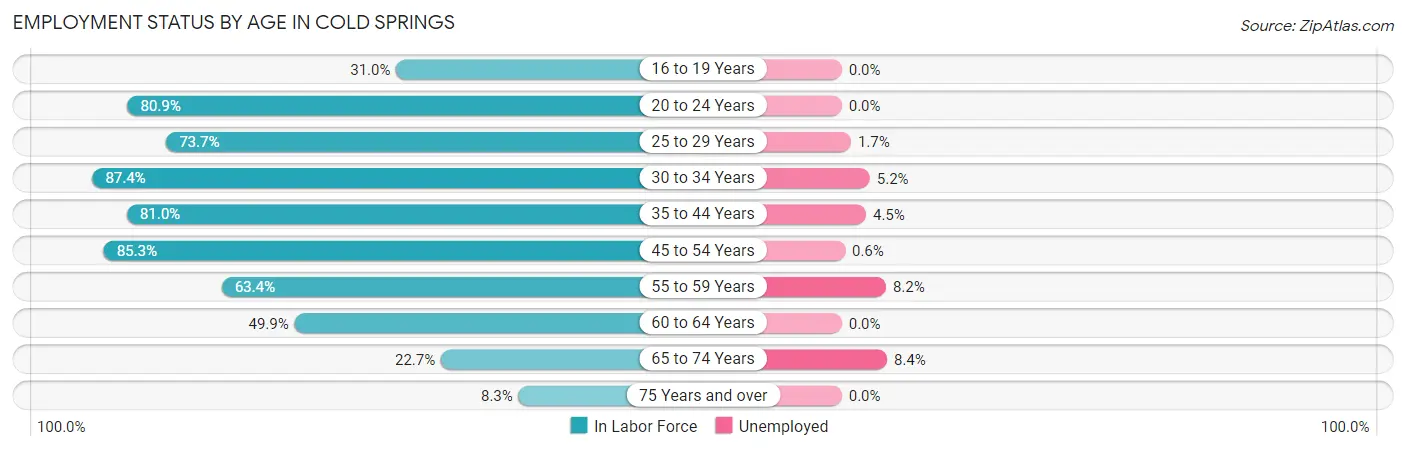
| Age Bracket | In Labor Force | Unemployed |
| 16 to 19 Years | 147 (31.0%) | 0 (0.0%) |
| 20 to 24 Years | 280 (80.9%) | 0 (0.0%) |
| 25 to 29 Years | 491 (73.7%) | 8 (1.7%) |
| 30 to 34 Years | 1,016 (87.4%) | 53 (5.2%) |
| 35 to 44 Years | 1,072 (81.0%) | 48 (4.5%) |
| 45 to 54 Years | 1,030 (85.3%) | 6 (0.6%) |
| 55 to 59 Years | 501 (63.4%) | 41 (8.2%) |
| 60 to 64 Years | 431 (49.9%) | 0 (0.0%) |
| 65 to 74 Years | 167 (22.7%) | 14 (8.4%) |
| 75 Years and over | 27 (8.3%) | 0 (0.0%) |
| Total | 5,163 (65.4%) | 170 (3.3%) |
Employment Status by Educational Attainment in Cold Springs
According to labor force statistics for Cold Springs, 75.5% of individuals (4,540) out of the total population between 25 and 64 years of age (6,013) are in the labor force, with 3.5% or 159 of them being unemployed. The group with the highest labor force participation rate are those with the educational attainment of bachelor's degree or higher, with 85.7% or 923 individuals in the labor force. Within the labor force, individuals with bachelor's degree or higher education have the highest percentage of unemployment, with 5.3% or 49 of them being unemployed.
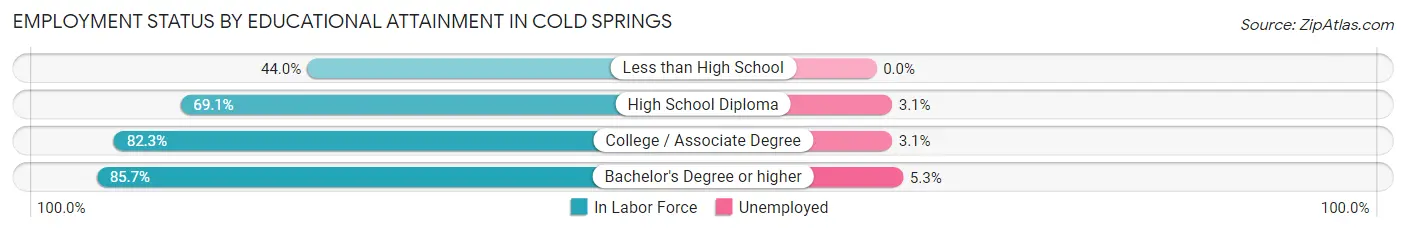
| Educational Attainment | In Labor Force | Unemployed |
| Less than High School | 155 (44.0%) | 0 (0.0%) |
| High School Diploma | 1,619 (69.1%) | 73 (3.1%) |
| College / Associate Degree | 1,844 (82.3%) | 69 (3.1%) |
| Bachelor's Degree or higher | 923 (85.7%) | 57 (5.3%) |
| Total | 4,540 (75.5%) | 210 (3.5%) |
Employment Occupations by Sex in Cold Springs
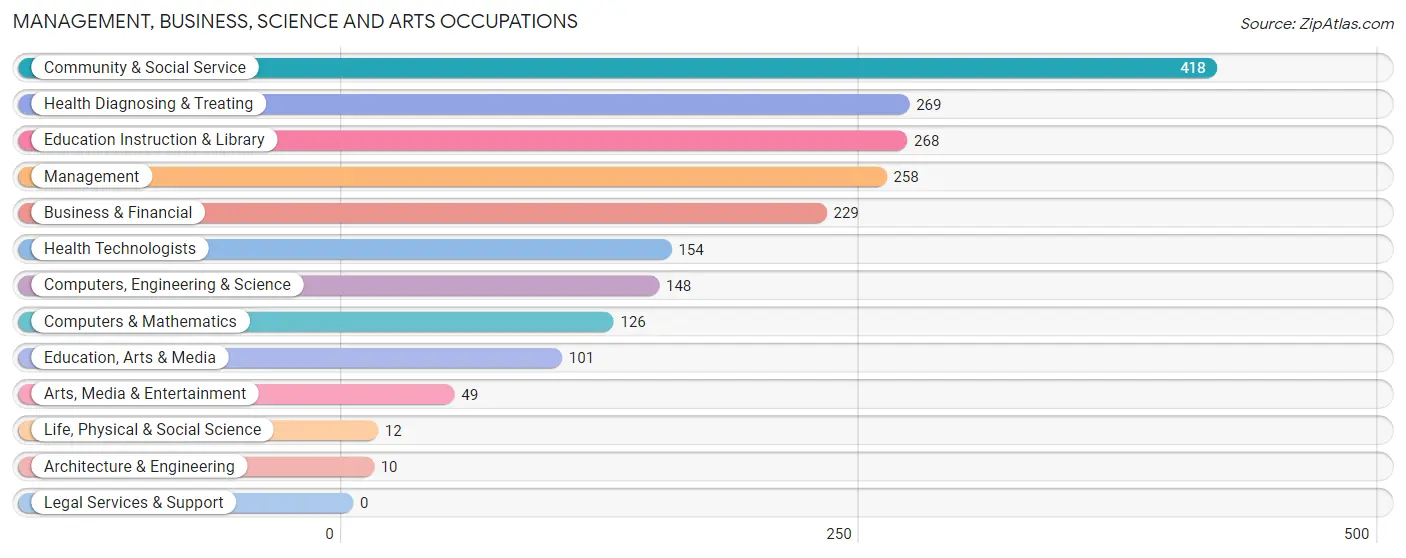
Management, Business, Science and Arts Occupations
The most common Management, Business, Science and Arts occupations in Cold Springs are Community & Social Service (418 | 8.4%), Health Diagnosing & Treating (269 | 5.4%), Education Instruction & Library (268 | 5.4%), Management (258 | 5.2%), and Business & Financial (229 | 4.6%).
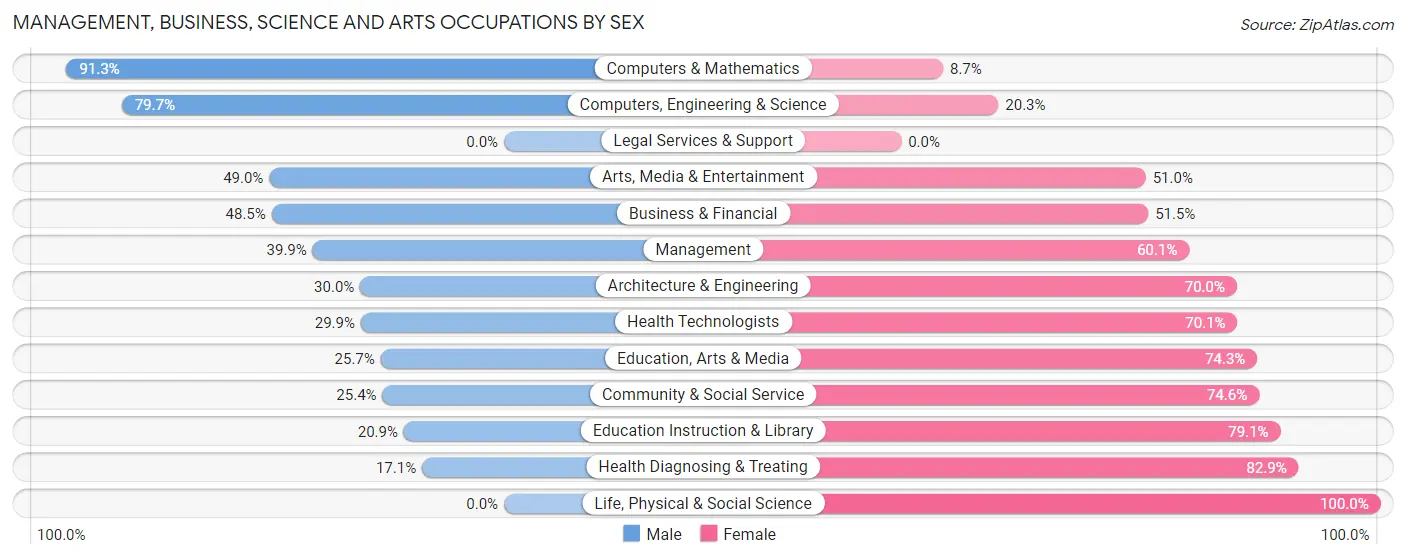
Management, Business, Science and Arts Occupations by Sex
Within the Management, Business, Science and Arts occupations in Cold Springs, the most male-oriented occupations are Computers & Mathematics (91.3%), Computers, Engineering & Science (79.7%), and Arts, Media & Entertainment (49.0%), while the most female-oriented occupations are Life, Physical & Social Science (100.0%), Health Diagnosing & Treating (82.9%), and Education Instruction & Library (79.1%).
| Occupation | Male | Female |
| Management | 103 (39.9%) | 155 (60.1%) |
| Business & Financial | 111 (48.5%) | 118 (51.5%) |
| Computers, Engineering & Science | 118 (79.7%) | 30 (20.3%) |
| Computers & Mathematics | 115 (91.3%) | 11 (8.7%) |
| Architecture & Engineering | 3 (30.0%) | 7 (70.0%) |
| Life, Physical & Social Science | 0 (0.0%) | 12 (100.0%) |
| Community & Social Service | 106 (25.4%) | 312 (74.6%) |
| Education, Arts & Media | 26 (25.7%) | 75 (74.3%) |
| Legal Services & Support | 0 (0.0%) | 0 (0.0%) |
| Education Instruction & Library | 56 (20.9%) | 212 (79.1%) |
| Arts, Media & Entertainment | 24 (49.0%) | 25 (51.0%) |
| Health Diagnosing & Treating | 46 (17.1%) | 223 (82.9%) |
| Health Technologists | 46 (29.9%) | 108 (70.1%) |
| Total (Category) | 484 (36.6%) | 838 (63.4%) |
| Total (Overall) | 2,638 (53.2%) | 2,321 (46.8%) |
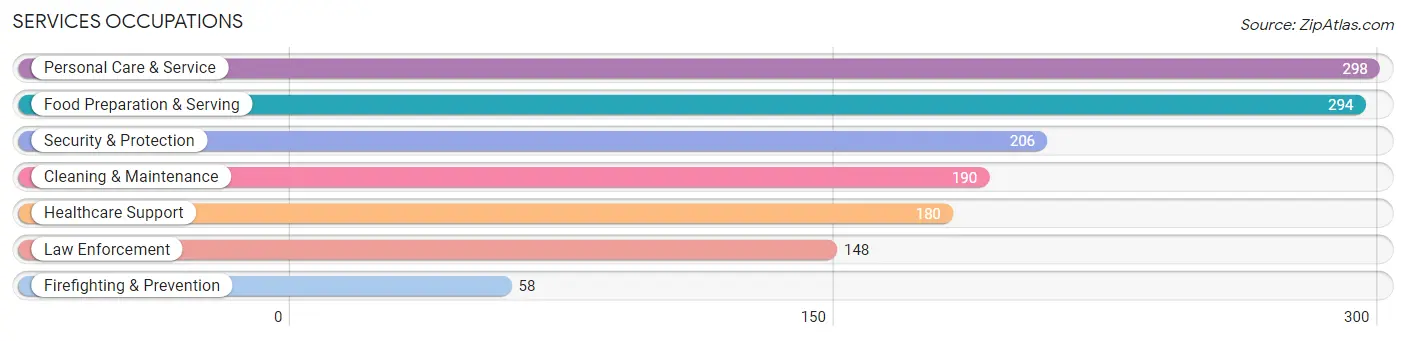
Services Occupations
The most common Services occupations in Cold Springs are Personal Care & Service (298 | 6.0%), Food Preparation & Serving (294 | 5.9%), Security & Protection (206 | 4.2%), Cleaning & Maintenance (190 | 3.8%), and Healthcare Support (180 | 3.6%).
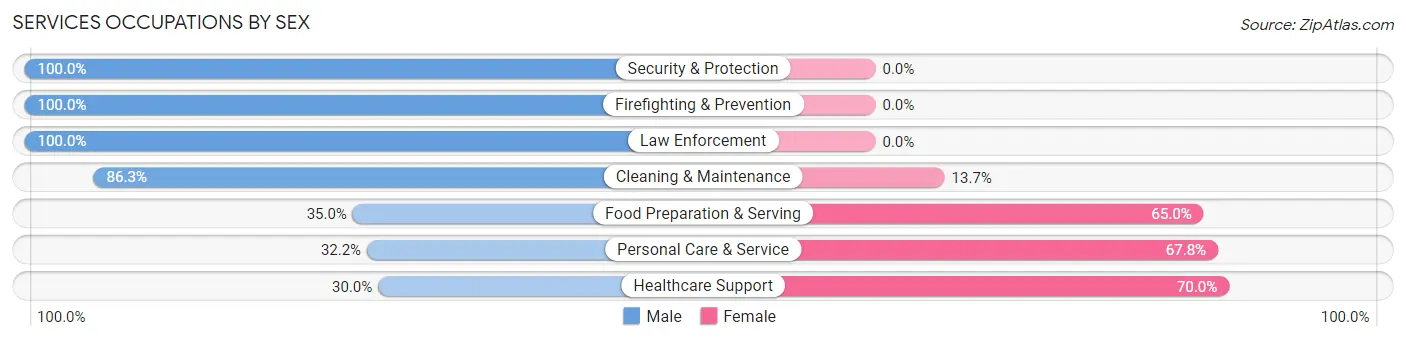
Services Occupations by Sex
Within the Services occupations in Cold Springs, the most male-oriented occupations are Security & Protection (100.0%), Firefighting & Prevention (100.0%), and Law Enforcement (100.0%), while the most female-oriented occupations are Healthcare Support (70.0%), Personal Care & Service (67.8%), and Food Preparation & Serving (65.0%).
| Occupation | Male | Female |
| Healthcare Support | 54 (30.0%) | 126 (70.0%) |
| Security & Protection | 206 (100.0%) | 0 (0.0%) |
| Firefighting & Prevention | 58 (100.0%) | 0 (0.0%) |
| Law Enforcement | 148 (100.0%) | 0 (0.0%) |
| Food Preparation & Serving | 103 (35.0%) | 191 (65.0%) |
| Cleaning & Maintenance | 164 (86.3%) | 26 (13.7%) |
| Personal Care & Service | 96 (32.2%) | 202 (67.8%) |
| Total (Category) | 623 (53.3%) | 545 (46.7%) |
| Total (Overall) | 2,638 (53.2%) | 2,321 (46.8%) |
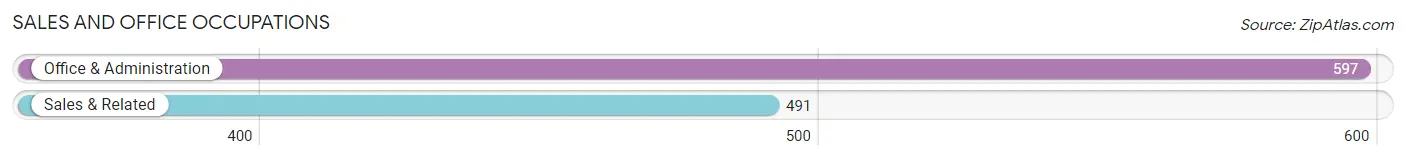
Sales and Office Occupations
The most common Sales and Office occupations in Cold Springs are Office & Administration (597 | 12.0%), and Sales & Related (491 | 9.9%).
Sales and Office Occupations by Sex
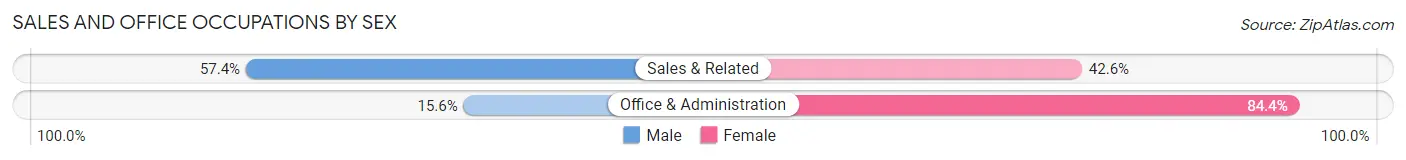
| Occupation | Male | Female |
| Sales & Related | 282 (57.4%) | 209 (42.6%) |
| Office & Administration | 93 (15.6%) | 504 (84.4%) |
| Total (Category) | 375 (34.5%) | 713 (65.5%) |
| Total (Overall) | 2,638 (53.2%) | 2,321 (46.8%) |
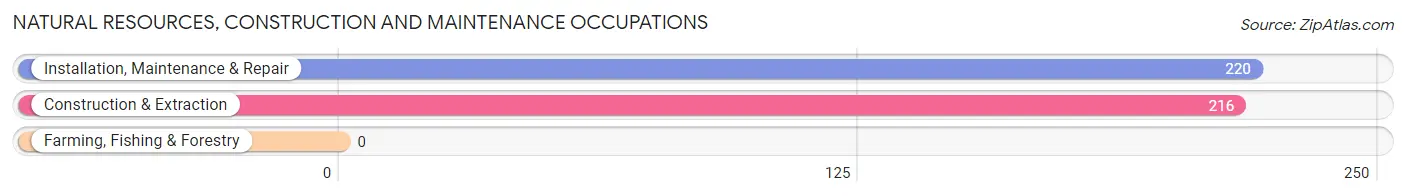
Natural Resources, Construction and Maintenance Occupations
The most common Natural Resources, Construction and Maintenance occupations in Cold Springs are Installation, Maintenance & Repair (220 | 4.4%), and Construction & Extraction (216 | 4.4%).
Natural Resources, Construction and Maintenance Occupations by Sex
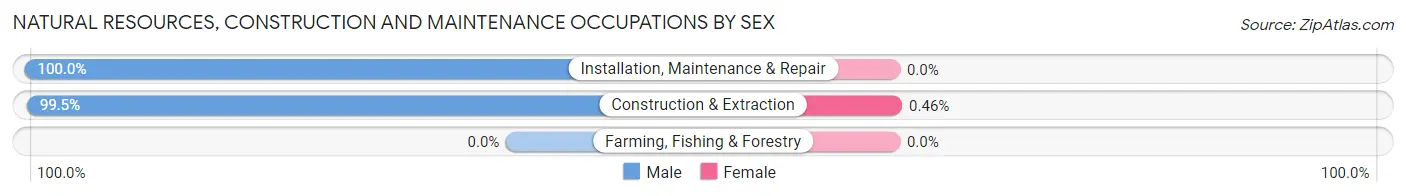
| Occupation | Male | Female |
| Farming, Fishing & Forestry | 0 (0.0%) | 0 (0.0%) |
| Construction & Extraction | 215 (99.5%) | 1 (0.5%) |
| Installation, Maintenance & Repair | 220 (100.0%) | 0 (0.0%) |
| Total (Category) | 435 (99.8%) | 1 (0.2%) |
| Total (Overall) | 2,638 (53.2%) | 2,321 (46.8%) |
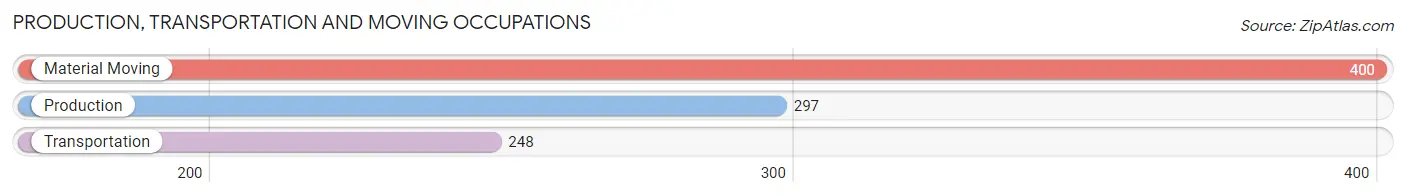
Production, Transportation and Moving Occupations
The most common Production, Transportation and Moving occupations in Cold Springs are Material Moving (400 | 8.1%), Production (297 | 6.0%), and Transportation (248 | 5.0%).
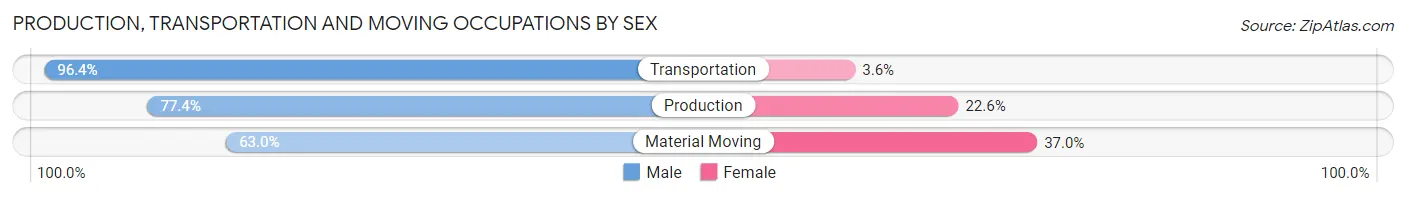
Production, Transportation and Moving Occupations by Sex
| Occupation | Male | Female |
| Production | 230 (77.4%) | 67 (22.6%) |
| Transportation | 239 (96.4%) | 9 (3.6%) |
| Material Moving | 252 (63.0%) | 148 (37.0%) |
| Total (Category) | 721 (76.3%) | 224 (23.7%) |
| Total (Overall) | 2,638 (53.2%) | 2,321 (46.8%) |
Employment Industries by Sex in Cold Springs
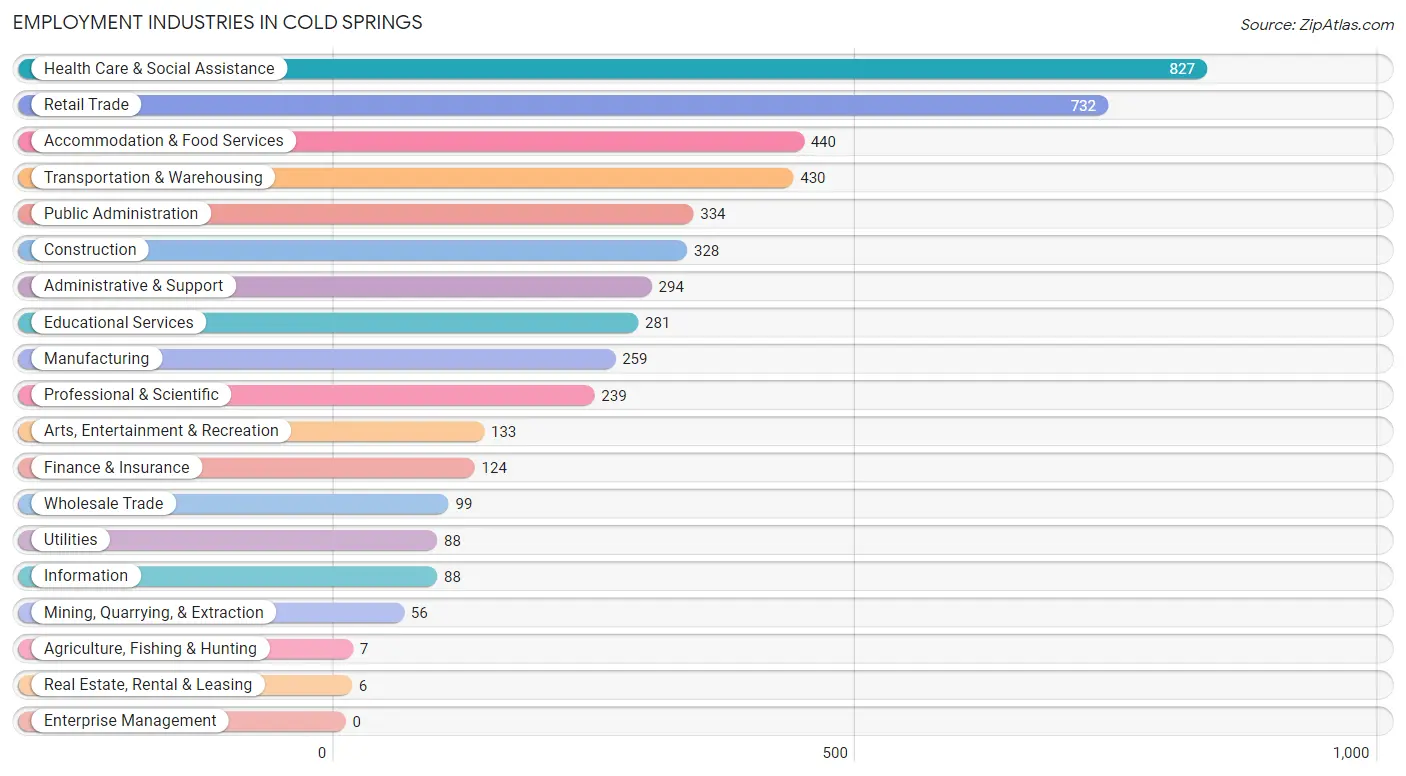
Employment Industries in Cold Springs
The major employment industries in Cold Springs include Health Care & Social Assistance (827 | 16.7%), Retail Trade (732 | 14.8%), Accommodation & Food Services (440 | 8.9%), Transportation & Warehousing (430 | 8.7%), and Public Administration (334 | 6.7%).
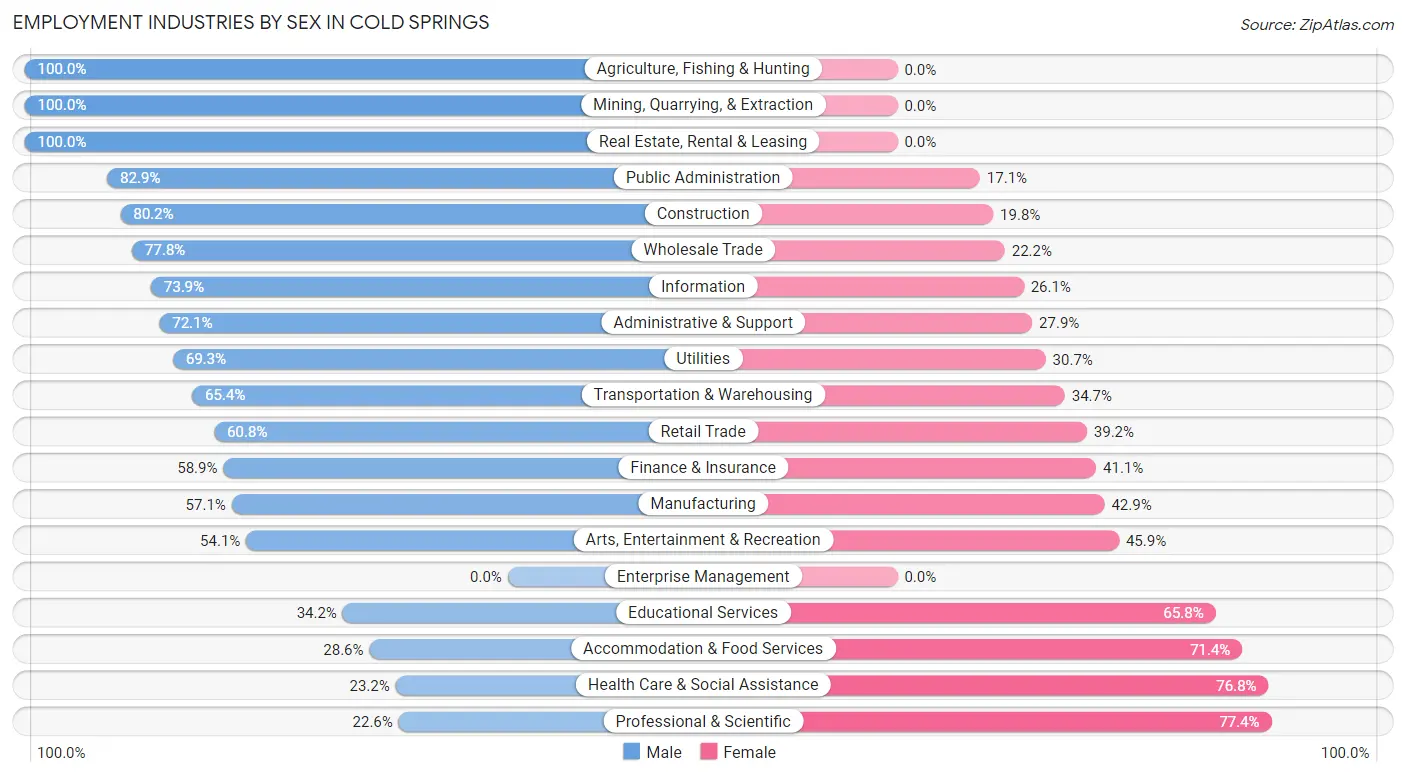
Employment Industries by Sex in Cold Springs
The Cold Springs industries that see more men than women are Agriculture, Fishing & Hunting (100.0%), Mining, Quarrying, & Extraction (100.0%), and Real Estate, Rental & Leasing (100.0%), whereas the industries that tend to have a higher number of women are Professional & Scientific (77.4%), Health Care & Social Assistance (76.8%), and Accommodation & Food Services (71.4%).
| Industry | Male | Female |
| Agriculture, Fishing & Hunting | 7 (100.0%) | 0 (0.0%) |
| Mining, Quarrying, & Extraction | 56 (100.0%) | 0 (0.0%) |
| Construction | 263 (80.2%) | 65 (19.8%) |
| Manufacturing | 148 (57.1%) | 111 (42.9%) |
| Wholesale Trade | 77 (77.8%) | 22 (22.2%) |
| Retail Trade | 445 (60.8%) | 287 (39.2%) |
| Transportation & Warehousing | 281 (65.3%) | 149 (34.6%) |
| Utilities | 61 (69.3%) | 27 (30.7%) |
| Information | 65 (73.9%) | 23 (26.1%) |
| Finance & Insurance | 73 (58.9%) | 51 (41.1%) |
| Real Estate, Rental & Leasing | 6 (100.0%) | 0 (0.0%) |
| Professional & Scientific | 54 (22.6%) | 185 (77.4%) |
| Enterprise Management | 0 (0.0%) | 0 (0.0%) |
| Administrative & Support | 212 (72.1%) | 82 (27.9%) |
| Educational Services | 96 (34.2%) | 185 (65.8%) |
| Health Care & Social Assistance | 192 (23.2%) | 635 (76.8%) |
| Arts, Entertainment & Recreation | 72 (54.1%) | 61 (45.9%) |
| Accommodation & Food Services | 126 (28.6%) | 314 (71.4%) |
| Public Administration | 277 (82.9%) | 57 (17.1%) |
| Total | 2,638 (53.2%) | 2,321 (46.8%) |
Education in Cold Springs
School Enrollment in Cold Springs
The most common levels of schooling among the 3,105 students in Cold Springs are high school (806 | 26.0%), elementary school (789 | 25.4%), and middle school (784 | 25.3%).
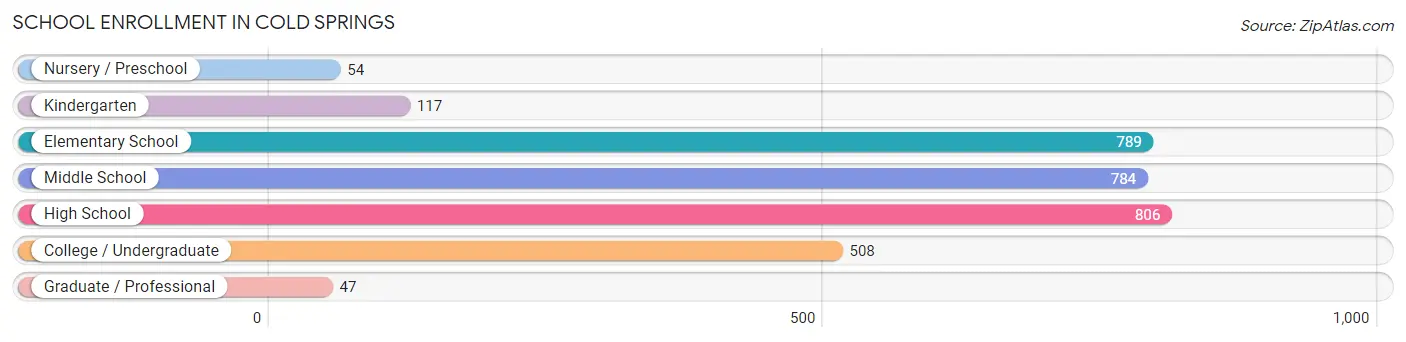
| School Level | # Students | % Students |
| Nursery / Preschool | 54 | 1.7% |
| Kindergarten | 117 | 3.8% |
| Elementary School | 789 | 25.4% |
| Middle School | 784 | 25.3% |
| High School | 806 | 26.0% |
| College / Undergraduate | 508 | 16.4% |
| Graduate / Professional | 47 | 1.5% |
| Total | 3,105 | 100.0% |
School Enrollment by Age by Funding Source in Cold Springs
Out of a total of 3,105 students who are enrolled in schools in Cold Springs, 509 (16.4%) attend a private institution, while the remaining 2,596 (83.6%) are enrolled in public schools. The age group of 35 years and over has the highest likelihood of being enrolled in private schools, with 104 (67.1% in the age bracket) enrolled. Conversely, the age group of 18 to 19 year olds has the lowest likelihood of being enrolled in a private school, with 83 (100.0% in the age bracket) attending a public institution.
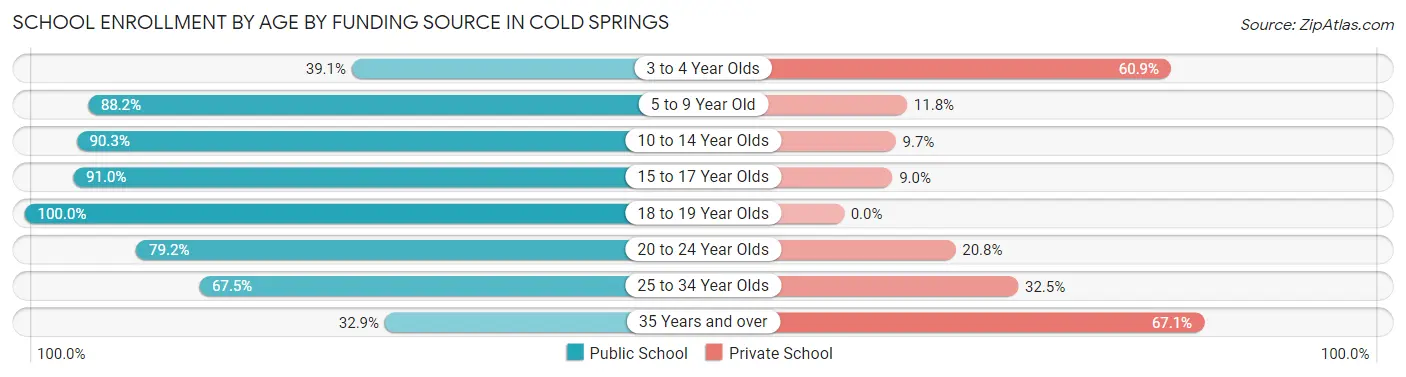
| Age Bracket | Public School | Private School |
| 3 to 4 Year Olds | 25 (39.1%) | 39 (60.9%) |
| 5 to 9 Year Old | 734 (88.2%) | 98 (11.8%) |
| 10 to 14 Year Olds | 766 (90.3%) | 82 (9.7%) |
| 15 to 17 Year Olds | 644 (91.0%) | 64 (9.0%) |
| 18 to 19 Year Olds | 83 (100.0%) | 0 (0.0%) |
| 20 to 24 Year Olds | 80 (79.2%) | 21 (20.8%) |
| 25 to 34 Year Olds | 212 (67.5%) | 102 (32.5%) |
| 35 Years and over | 51 (32.9%) | 104 (67.1%) |
| Total | 2,596 (83.6%) | 509 (16.4%) |
Educational Attainment by Field of Study in Cold Springs
Business (238 | 17.7%), education (159 | 11.8%), arts & humanities (137 | 10.2%), science & technology (122 | 9.1%), and psychology (111 | 8.3%) are the most common fields of study among 1,344 individuals in Cold Springs who have obtained a bachelor's degree or higher.
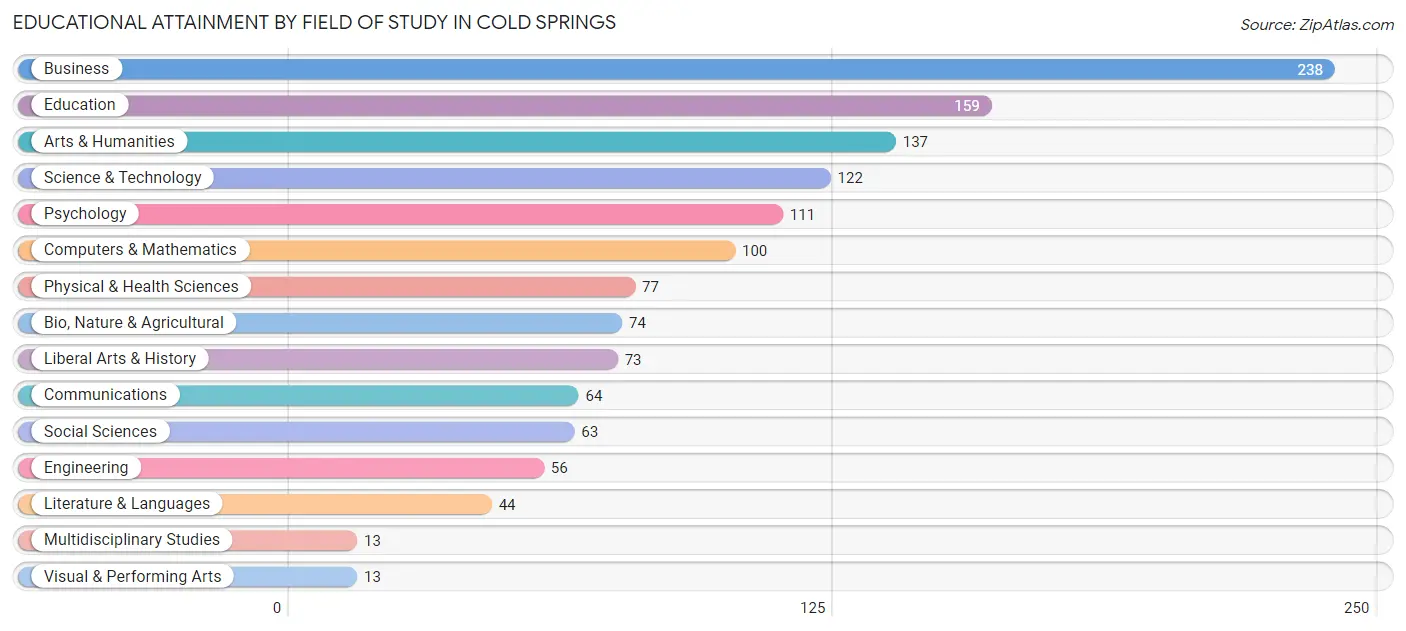
| Field of Study | # Graduates | % Graduates |
| Computers & Mathematics | 100 | 7.4% |
| Bio, Nature & Agricultural | 74 | 5.5% |
| Physical & Health Sciences | 77 | 5.7% |
| Psychology | 111 | 8.3% |
| Social Sciences | 63 | 4.7% |
| Engineering | 56 | 4.2% |
| Multidisciplinary Studies | 13 | 1.0% |
| Science & Technology | 122 | 9.1% |
| Business | 238 | 17.7% |
| Education | 159 | 11.8% |
| Literature & Languages | 44 | 3.3% |
| Liberal Arts & History | 73 | 5.4% |
| Visual & Performing Arts | 13 | 1.0% |
| Communications | 64 | 4.8% |
| Arts & Humanities | 137 | 10.2% |
| Total | 1,344 | 100.0% |
Transportation & Commute in Cold Springs
Vehicle Availability by Sex in Cold Springs
The most prevalent vehicle ownership categories in Cold Springs are males with 2 vehicles (1,050, accounting for 40.1%) and females with 2 vehicles (540, making up 45.7%).
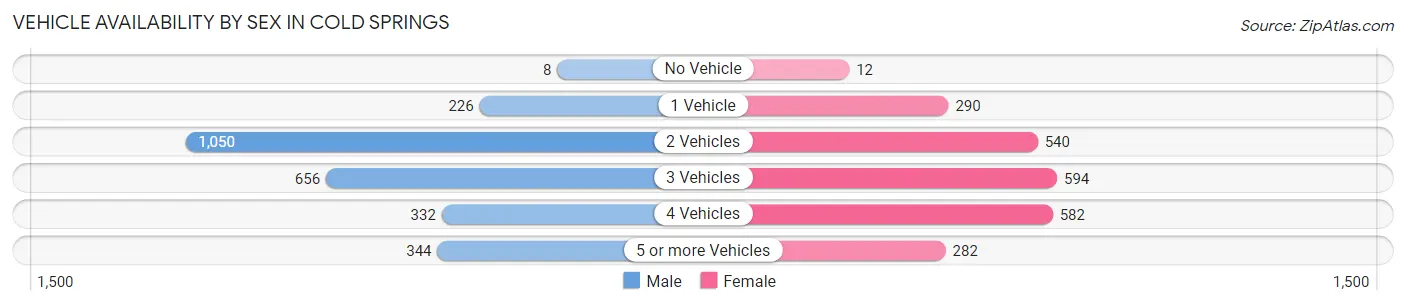
| Vehicles Available | Male | Female |
| No Vehicle | 8 (0.3%) | 12 (0.5%) |
| 1 Vehicle | 226 (8.6%) | 290 (12.6%) |
| 2 Vehicles | 1,050 (40.1%) | 540 (23.5%) |
| 3 Vehicles | 656 (25.1%) | 594 (25.8%) |
| 4 Vehicles | 332 (12.7%) | 582 (25.3%) |
| 5 or more Vehicles | 344 (13.2%) | 282 (12.3%) |
| Total | 2,616 (100.0%) | 2,300 (100.0%) |
Commute Time in Cold Springs
The most frequently occuring commute durations in Cold Springs are 30 to 34 minutes (1,235 commuters, 26.7%), 15 to 19 minutes (544 commuters, 11.8%), and 45 to 59 minutes (505 commuters, 10.9%).
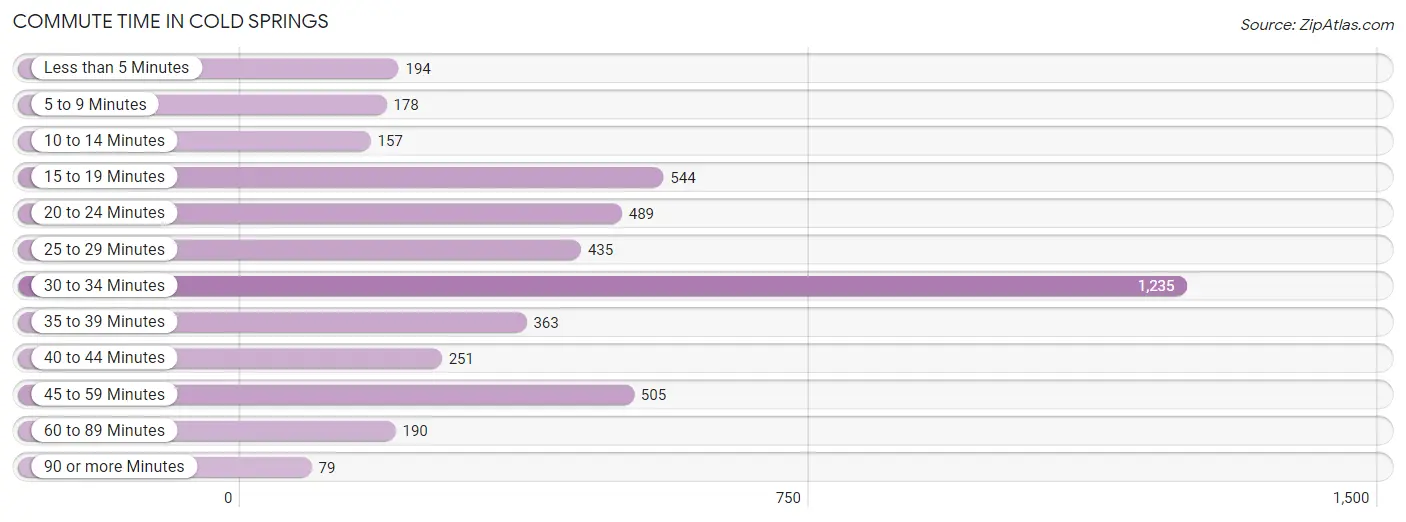
| Commute Time | # Commuters | % Commuters |
| Less than 5 Minutes | 194 | 4.2% |
| 5 to 9 Minutes | 178 | 3.8% |
| 10 to 14 Minutes | 157 | 3.4% |
| 15 to 19 Minutes | 544 | 11.8% |
| 20 to 24 Minutes | 489 | 10.6% |
| 25 to 29 Minutes | 435 | 9.4% |
| 30 to 34 Minutes | 1,235 | 26.7% |
| 35 to 39 Minutes | 363 | 7.9% |
| 40 to 44 Minutes | 251 | 5.4% |
| 45 to 59 Minutes | 505 | 10.9% |
| 60 to 89 Minutes | 190 | 4.1% |
| 90 or more Minutes | 79 | 1.7% |
Commute Time by Sex in Cold Springs
The most common commute times in Cold Springs are 30 to 34 minutes (704 commuters, 28.7%) for males and 30 to 34 minutes (531 commuters, 24.5%) for females.
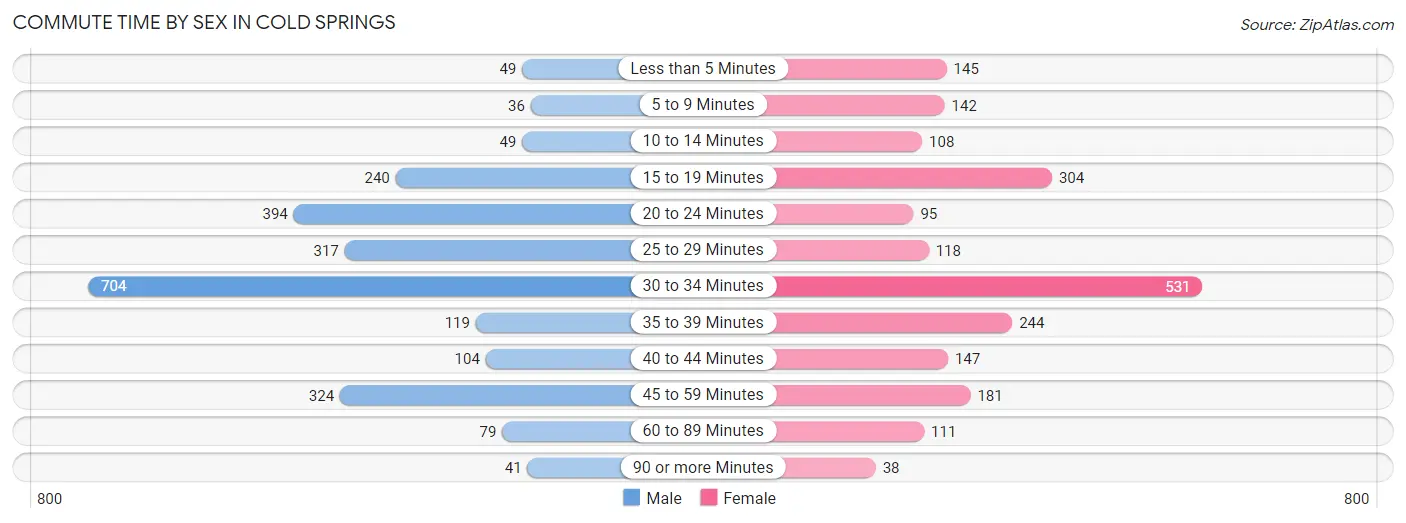
| Commute Time | Male | Female |
| Less than 5 Minutes | 49 (2.0%) | 145 (6.7%) |
| 5 to 9 Minutes | 36 (1.5%) | 142 (6.6%) |
| 10 to 14 Minutes | 49 (2.0%) | 108 (5.0%) |
| 15 to 19 Minutes | 240 (9.8%) | 304 (14.1%) |
| 20 to 24 Minutes | 394 (16.0%) | 95 (4.4%) |
| 25 to 29 Minutes | 317 (12.9%) | 118 (5.4%) |
| 30 to 34 Minutes | 704 (28.7%) | 531 (24.5%) |
| 35 to 39 Minutes | 119 (4.9%) | 244 (11.3%) |
| 40 to 44 Minutes | 104 (4.2%) | 147 (6.8%) |
| 45 to 59 Minutes | 324 (13.2%) | 181 (8.4%) |
| 60 to 89 Minutes | 79 (3.2%) | 111 (5.1%) |
| 90 or more Minutes | 41 (1.7%) | 38 (1.8%) |
Time of Departure to Work by Sex in Cold Springs
The most frequent times of departure to work in Cold Springs are 6:30 AM to 6:59 AM (378, 15.4%) for males and 6:30 AM to 6:59 AM (394, 18.2%) for females.
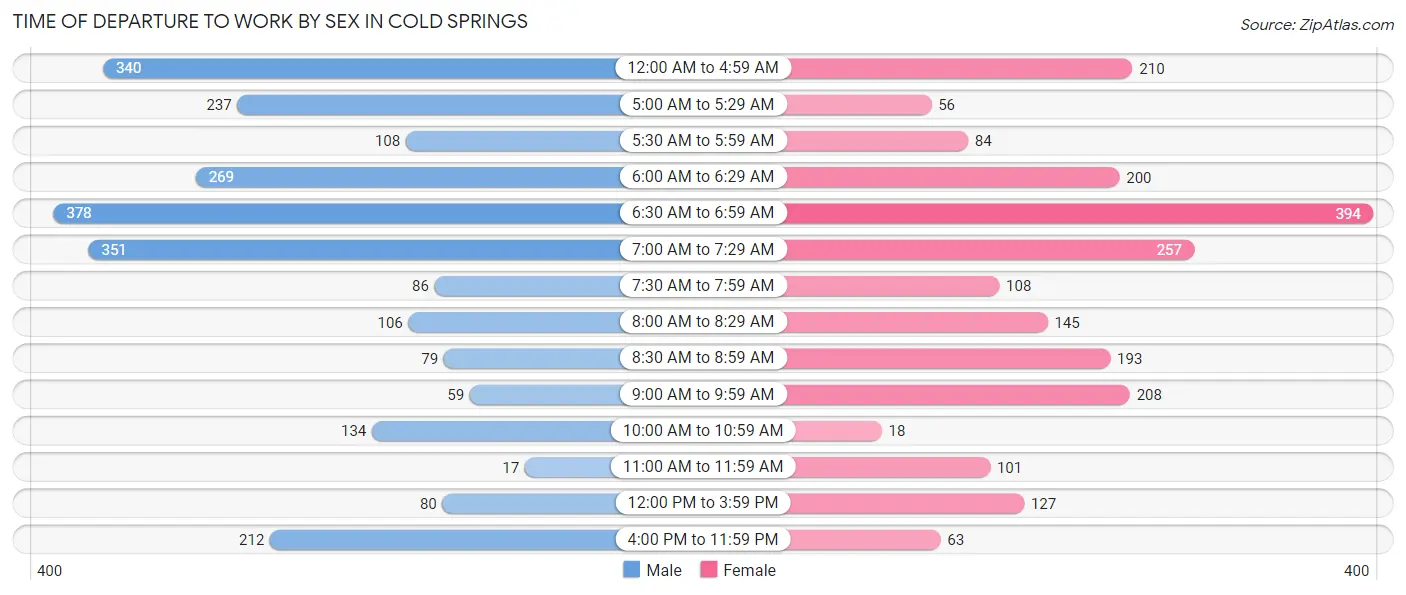
| Time of Departure | Male | Female |
| 12:00 AM to 4:59 AM | 340 (13.8%) | 210 (9.7%) |
| 5:00 AM to 5:29 AM | 237 (9.7%) | 56 (2.6%) |
| 5:30 AM to 5:59 AM | 108 (4.4%) | 84 (3.9%) |
| 6:00 AM to 6:29 AM | 269 (11.0%) | 200 (9.2%) |
| 6:30 AM to 6:59 AM | 378 (15.4%) | 394 (18.2%) |
| 7:00 AM to 7:29 AM | 351 (14.3%) | 257 (11.9%) |
| 7:30 AM to 7:59 AM | 86 (3.5%) | 108 (5.0%) |
| 8:00 AM to 8:29 AM | 106 (4.3%) | 145 (6.7%) |
| 8:30 AM to 8:59 AM | 79 (3.2%) | 193 (8.9%) |
| 9:00 AM to 9:59 AM | 59 (2.4%) | 208 (9.6%) |
| 10:00 AM to 10:59 AM | 134 (5.5%) | 18 (0.8%) |
| 11:00 AM to 11:59 AM | 17 (0.7%) | 101 (4.7%) |
| 12:00 PM to 3:59 PM | 80 (3.3%) | 127 (5.9%) |
| 4:00 PM to 11:59 PM | 212 (8.6%) | 63 (2.9%) |
| Total | 2,456 (100.0%) | 2,164 (100.0%) |
Housing Occupancy in Cold Springs
Occupancy by Ownership in Cold Springs
Of the total 3,459 dwellings in Cold Springs, owner-occupied units account for 3,124 (90.3%), while renter-occupied units make up 335 (9.7%).
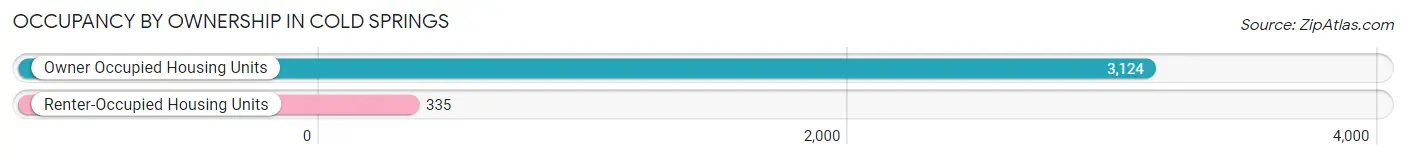
| Occupancy | # Housing Units | % Housing Units |
| Owner Occupied Housing Units | 3,124 | 90.3% |
| Renter-Occupied Housing Units | 335 | 9.7% |
| Total Occupied Housing Units | 3,459 | 100.0% |
Occupancy by Household Size in Cold Springs
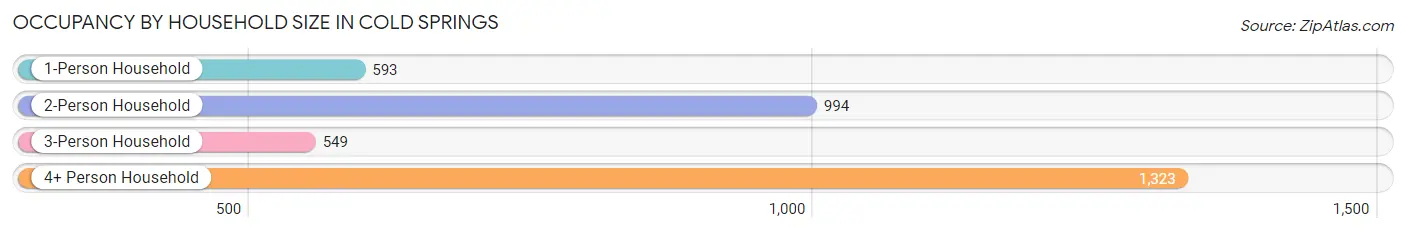
| Household Size | # Housing Units | % Housing Units |
| 1-Person Household | 593 | 17.1% |
| 2-Person Household | 994 | 28.7% |
| 3-Person Household | 549 | 15.9% |
| 4+ Person Household | 1,323 | 38.3% |
| Total Housing Units | 3,459 | 100.0% |
Occupancy by Ownership by Household Size in Cold Springs
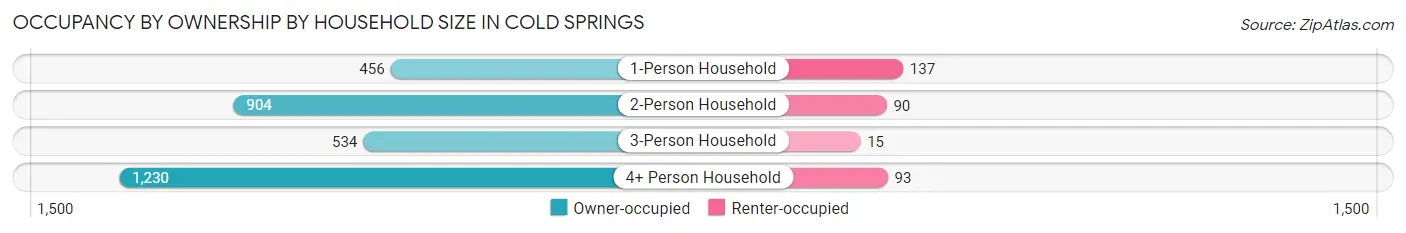
| Household Size | Owner-occupied | Renter-occupied |
| 1-Person Household | 456 (76.9%) | 137 (23.1%) |
| 2-Person Household | 904 (90.9%) | 90 (9.0%) |
| 3-Person Household | 534 (97.3%) | 15 (2.7%) |
| 4+ Person Household | 1,230 (93.0%) | 93 (7.0%) |
| Total Housing Units | 3,124 (90.3%) | 335 (9.7%) |
Occupancy by Educational Attainment in Cold Springs
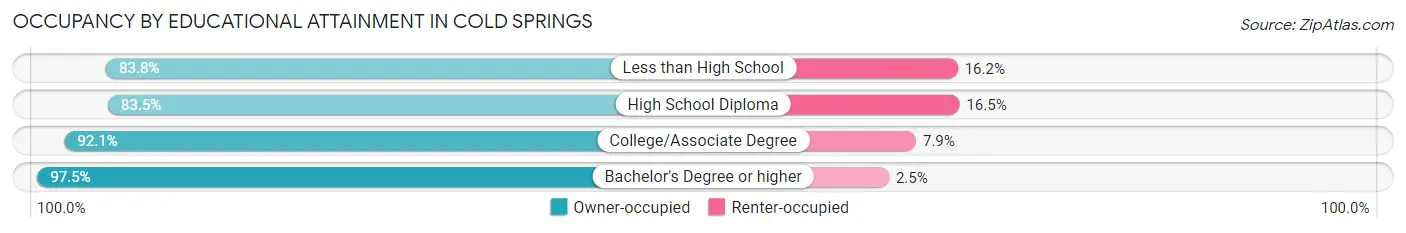
| Household Size | Owner-occupied | Renter-occupied |
| Less than High School | 140 (83.8%) | 27 (16.2%) |
| High School Diploma | 834 (83.5%) | 165 (16.5%) |
| College/Associate Degree | 1,457 (92.1%) | 125 (7.9%) |
| Bachelor's Degree or higher | 693 (97.5%) | 18 (2.5%) |
Occupancy by Age of Householder in Cold Springs
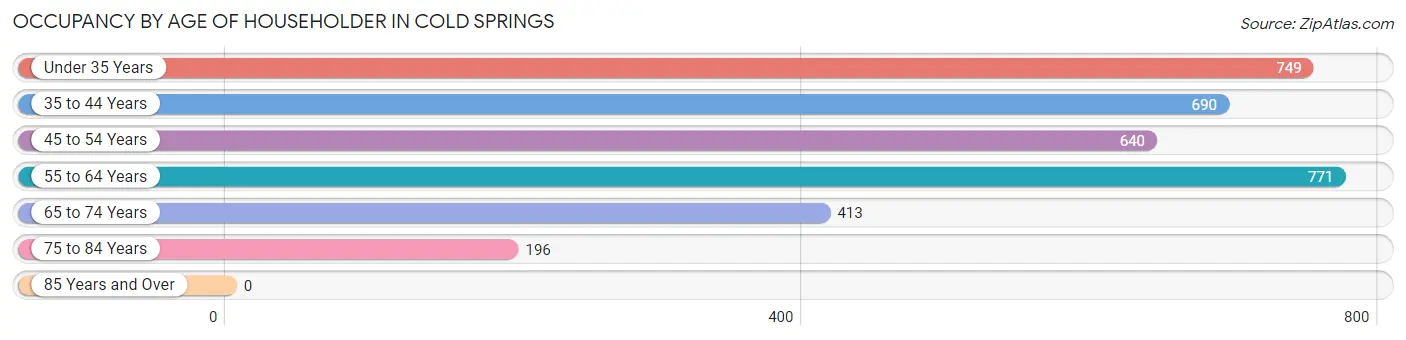
| Age Bracket | # Households | % Households |
| Under 35 Years | 749 | 21.6% |
| 35 to 44 Years | 690 | 20.0% |
| 45 to 54 Years | 640 | 18.5% |
| 55 to 64 Years | 771 | 22.3% |
| 65 to 74 Years | 413 | 11.9% |
| 75 to 84 Years | 196 | 5.7% |
| 85 Years and Over | 0 | 0.0% |
| Total | 3,459 | 100.0% |
Housing Finances in Cold Springs
Median Income by Occupancy in Cold Springs
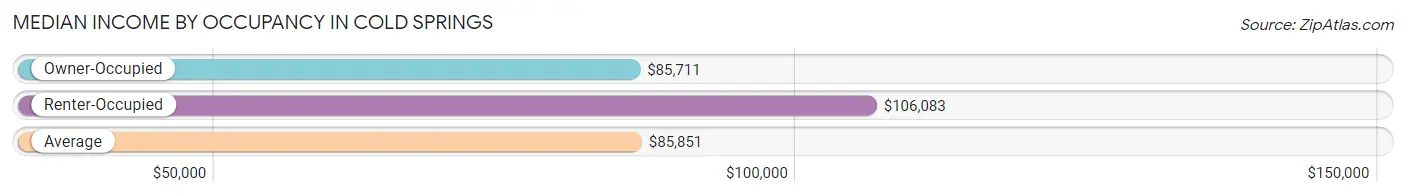
| Occupancy Type | # Households | Median Income |
| Owner-Occupied | 3,124 (90.3%) | $85,711 |
| Renter-Occupied | 335 (9.7%) | $106,083 |
| Average | 3,459 (100.0%) | $85,851 |
Occupancy by Householder Income Bracket in Cold Springs
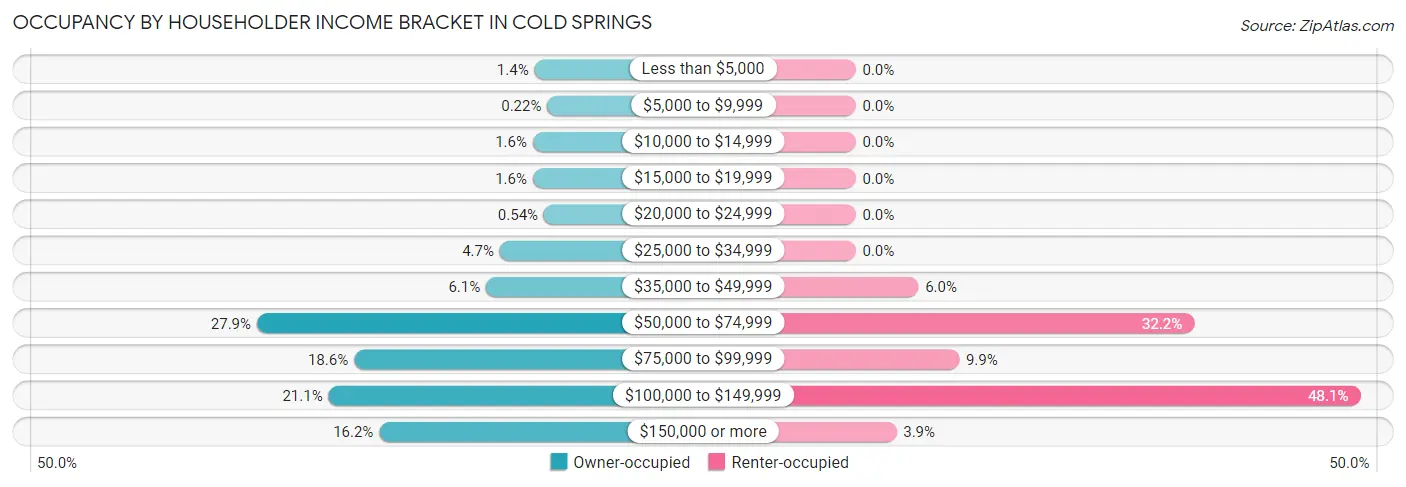
| Income Bracket | Owner-occupied | Renter-occupied |
| Less than $5,000 | 45 (1.4%) | 0 (0.0%) |
| $5,000 to $9,999 | 7 (0.2%) | 0 (0.0%) |
| $10,000 to $14,999 | 50 (1.6%) | 0 (0.0%) |
| $15,000 to $19,999 | 50 (1.6%) | 0 (0.0%) |
| $20,000 to $24,999 | 17 (0.5%) | 0 (0.0%) |
| $25,000 to $34,999 | 148 (4.7%) | 0 (0.0%) |
| $35,000 to $49,999 | 189 (6.0%) | 20 (6.0%) |
| $50,000 to $74,999 | 871 (27.9%) | 108 (32.2%) |
| $75,000 to $99,999 | 582 (18.6%) | 33 (9.9%) |
| $100,000 to $149,999 | 658 (21.1%) | 161 (48.1%) |
| $150,000 or more | 507 (16.2%) | 13 (3.9%) |
| Total | 3,124 (100.0%) | 335 (100.0%) |
Monthly Housing Cost Tiers in Cold Springs
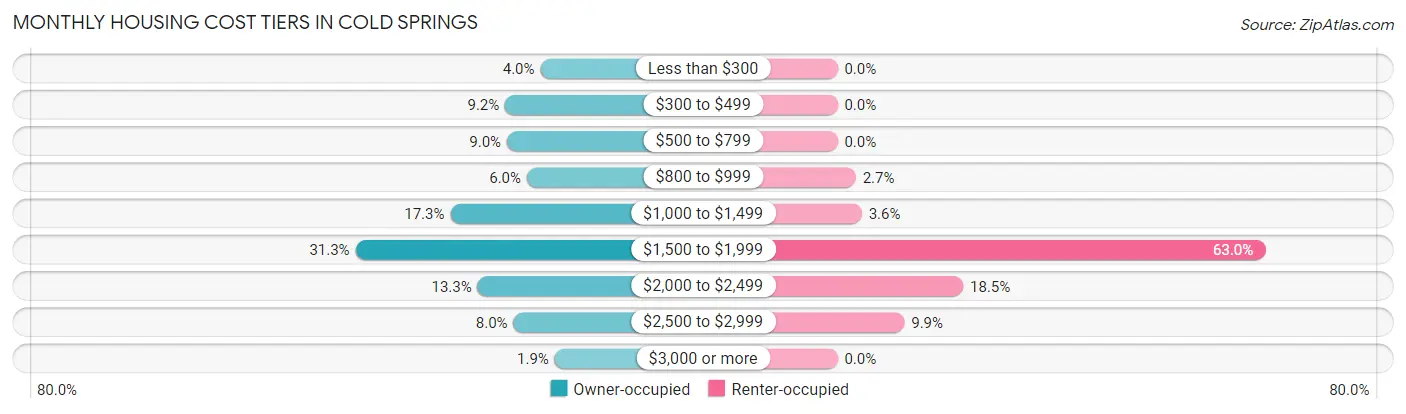
| Monthly Cost | Owner-occupied | Renter-occupied |
| Less than $300 | 126 (4.0%) | 0 (0.0%) |
| $300 to $499 | 288 (9.2%) | 0 (0.0%) |
| $500 to $799 | 280 (9.0%) | 0 (0.0%) |
| $800 to $999 | 188 (6.0%) | 9 (2.7%) |
| $1,000 to $1,499 | 540 (17.3%) | 12 (3.6%) |
| $1,500 to $1,999 | 977 (31.3%) | 211 (63.0%) |
| $2,000 to $2,499 | 415 (13.3%) | 62 (18.5%) |
| $2,500 to $2,999 | 250 (8.0%) | 33 (9.9%) |
| $3,000 or more | 60 (1.9%) | 0 (0.0%) |
| Total | 3,124 (100.0%) | 335 (100.0%) |
Physical Housing Characteristics in Cold Springs
Housing Structures in Cold Springs
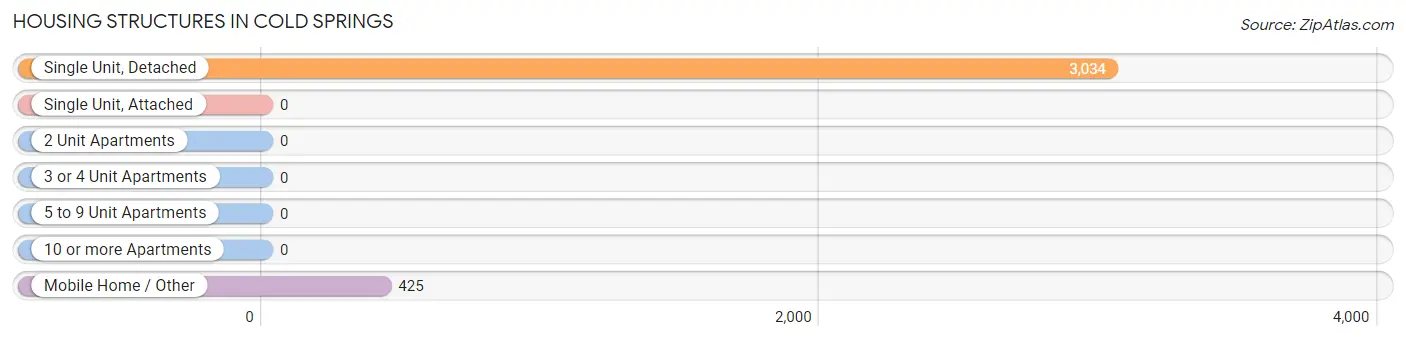
| Structure Type | # Housing Units | % Housing Units |
| Single Unit, Detached | 3,034 | 87.7% |
| Single Unit, Attached | 0 | 0.0% |
| 2 Unit Apartments | 0 | 0.0% |
| 3 or 4 Unit Apartments | 0 | 0.0% |
| 5 to 9 Unit Apartments | 0 | 0.0% |
| 10 or more Apartments | 0 | 0.0% |
| Mobile Home / Other | 425 | 12.3% |
| Total | 3,459 | 100.0% |
Housing Structures by Occupancy in Cold Springs
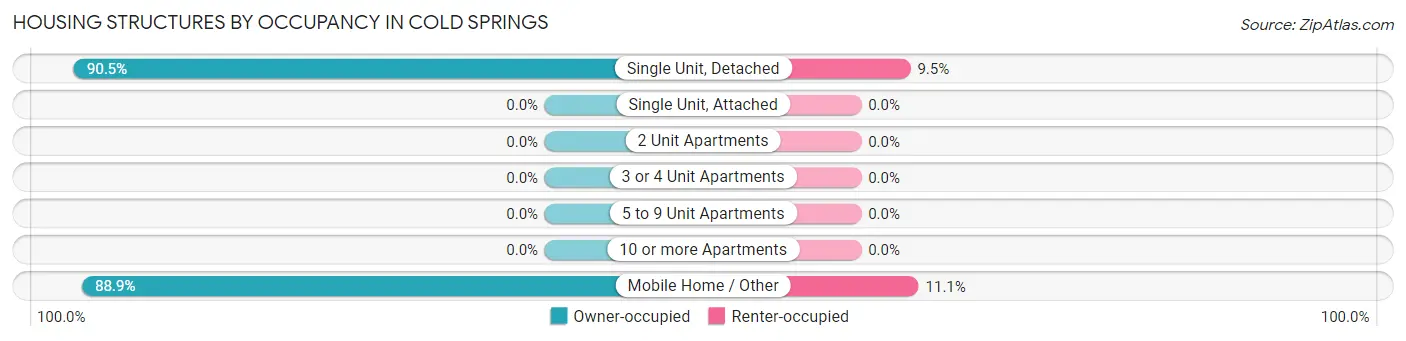
| Structure Type | Owner-occupied | Renter-occupied |
| Single Unit, Detached | 2,746 (90.5%) | 288 (9.5%) |
| Single Unit, Attached | 0 (0.0%) | 0 (0.0%) |
| 2 Unit Apartments | 0 (0.0%) | 0 (0.0%) |
| 3 or 4 Unit Apartments | 0 (0.0%) | 0 (0.0%) |
| 5 to 9 Unit Apartments | 0 (0.0%) | 0 (0.0%) |
| 10 or more Apartments | 0 (0.0%) | 0 (0.0%) |
| Mobile Home / Other | 378 (88.9%) | 47 (11.1%) |
| Total | 3,124 (90.3%) | 335 (9.7%) |
Housing Structures by Number of Rooms in Cold Springs
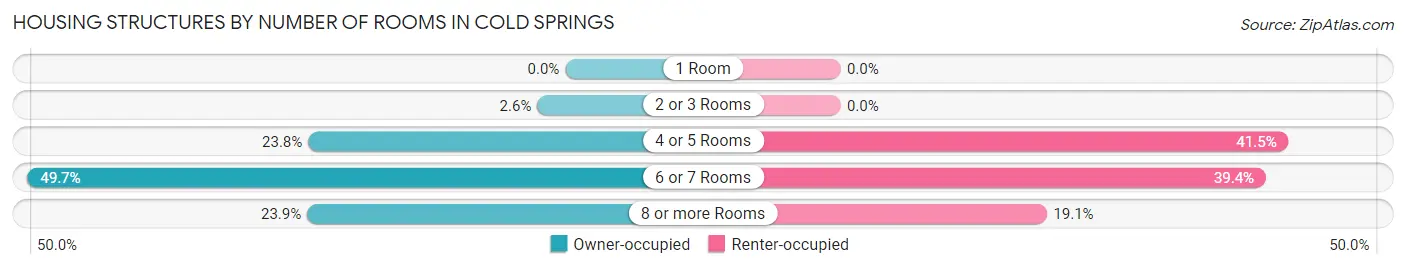
| Number of Rooms | Owner-occupied | Renter-occupied |
| 1 Room | 0 (0.0%) | 0 (0.0%) |
| 2 or 3 Rooms | 81 (2.6%) | 0 (0.0%) |
| 4 or 5 Rooms | 743 (23.8%) | 139 (41.5%) |
| 6 or 7 Rooms | 1,554 (49.7%) | 132 (39.4%) |
| 8 or more Rooms | 746 (23.9%) | 64 (19.1%) |
| Total | 3,124 (100.0%) | 335 (100.0%) |
Housing Structure by Heating Type in Cold Springs
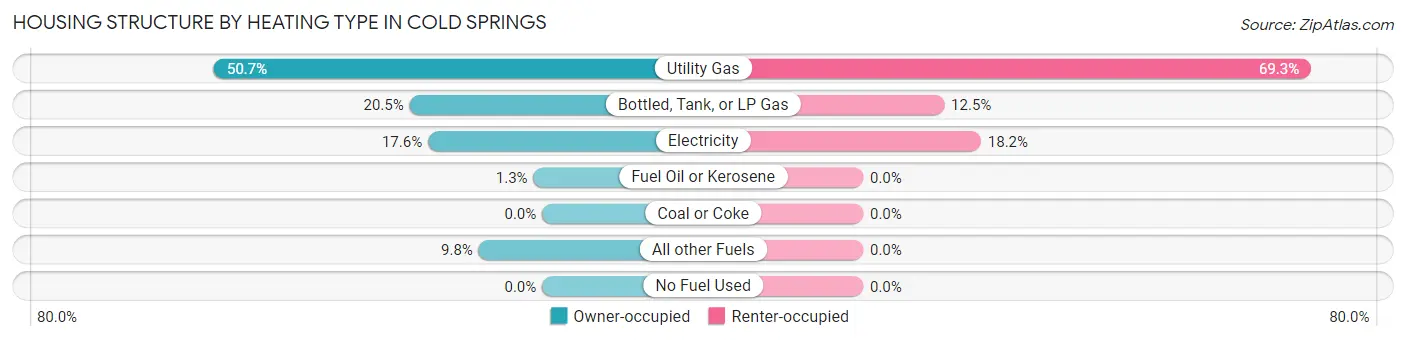
| Heating Type | Owner-occupied | Renter-occupied |
| Utility Gas | 1,585 (50.7%) | 232 (69.3%) |
| Bottled, Tank, or LP Gas | 640 (20.5%) | 42 (12.5%) |
| Electricity | 551 (17.6%) | 61 (18.2%) |
| Fuel Oil or Kerosene | 42 (1.3%) | 0 (0.0%) |
| Coal or Coke | 0 (0.0%) | 0 (0.0%) |
| All other Fuels | 306 (9.8%) | 0 (0.0%) |
| No Fuel Used | 0 (0.0%) | 0 (0.0%) |
| Total | 3,124 (100.0%) | 335 (100.0%) |
Household Vehicle Usage in Cold Springs
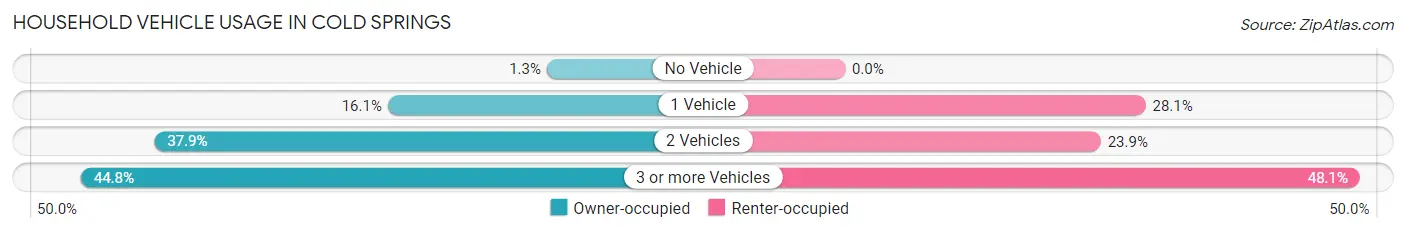
| Vehicles per Household | Owner-occupied | Renter-occupied |
| No Vehicle | 39 (1.3%) | 0 (0.0%) |
| 1 Vehicle | 503 (16.1%) | 94 (28.1%) |
| 2 Vehicles | 1,184 (37.9%) | 80 (23.9%) |
| 3 or more Vehicles | 1,398 (44.8%) | 161 (48.1%) |
| Total | 3,124 (100.0%) | 335 (100.0%) |
Real Estate & Mortgages in Cold Springs
Real Estate and Mortgage Overview in Cold Springs
| Characteristic | Without Mortgage | With Mortgage |
| Housing Units | 628 | 2,496 |
| Median Property Value | $331,800 | $382,100 |
| Median Household Income | $85,648 | $404 |
| Monthly Housing Costs | $475 | $60 |
| Real Estate Taxes | $1,646 | $82 |
Property Value by Mortgage Status in Cold Springs
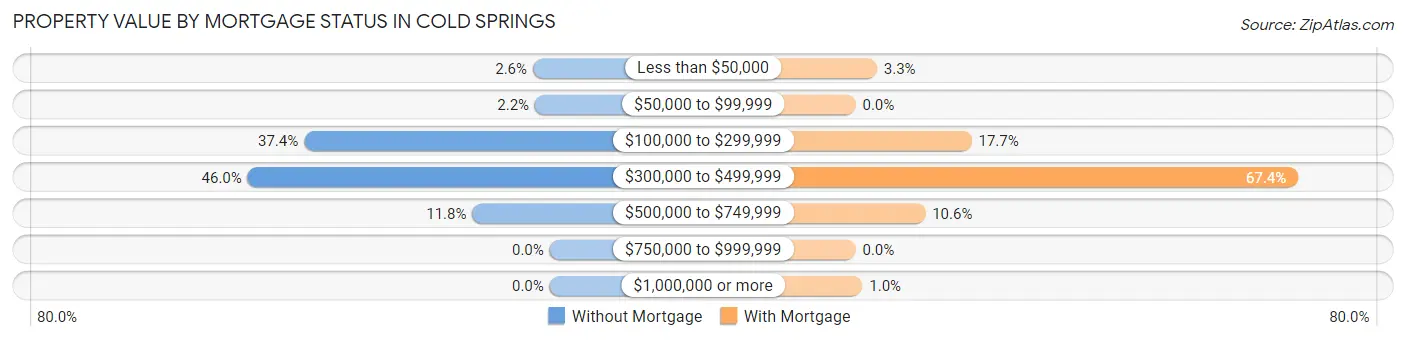
| Property Value | Without Mortgage | With Mortgage |
| Less than $50,000 | 16 (2.5%) | 81 (3.3%) |
| $50,000 to $99,999 | 14 (2.2%) | 0 (0.0%) |
| $100,000 to $299,999 | 235 (37.4%) | 441 (17.7%) |
| $300,000 to $499,999 | 289 (46.0%) | 1,683 (67.4%) |
| $500,000 to $749,999 | 74 (11.8%) | 265 (10.6%) |
| $750,000 to $999,999 | 0 (0.0%) | 0 (0.0%) |
| $1,000,000 or more | 0 (0.0%) | 26 (1.0%) |
| Total | 628 (100.0%) | 2,496 (100.0%) |
Household Income by Mortgage Status in Cold Springs
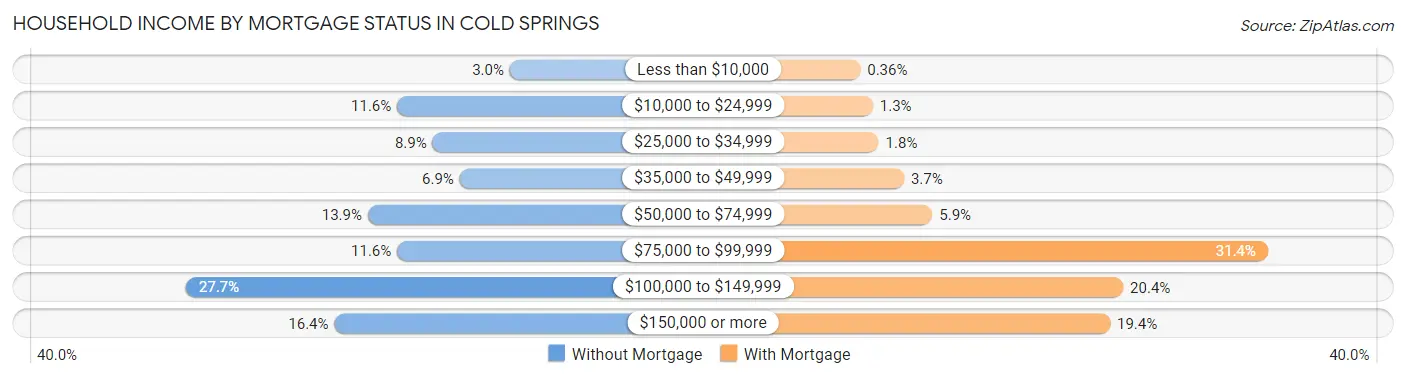
| Household Income | Without Mortgage | With Mortgage |
| Less than $10,000 | 19 (3.0%) | 9 (0.4%) |
| $10,000 to $24,999 | 73 (11.6%) | 33 (1.3%) |
| $25,000 to $34,999 | 56 (8.9%) | 44 (1.8%) |
| $35,000 to $49,999 | 43 (6.9%) | 92 (3.7%) |
| $50,000 to $74,999 | 87 (13.9%) | 146 (5.9%) |
| $75,000 to $99,999 | 73 (11.6%) | 784 (31.4%) |
| $100,000 to $149,999 | 174 (27.7%) | 509 (20.4%) |
| $150,000 or more | 103 (16.4%) | 484 (19.4%) |
| Total | 628 (100.0%) | 2,496 (100.0%) |
Property Value to Household Income Ratio in Cold Springs
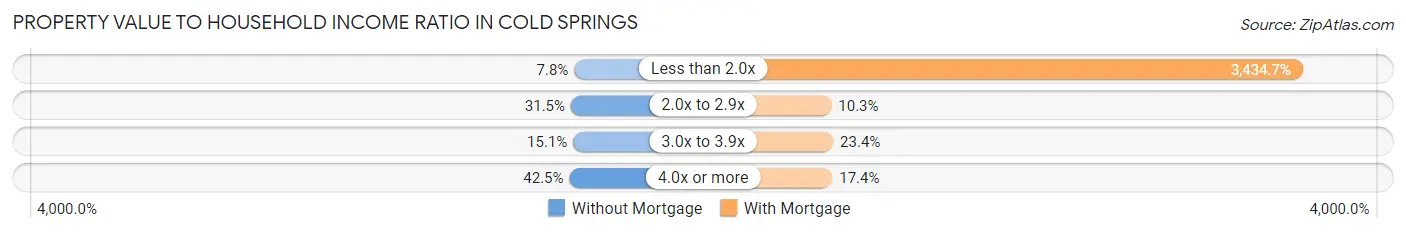
| Value-to-Income Ratio | Without Mortgage | With Mortgage |
| Less than 2.0x | 49 (7.8%) | 85,730 (3,434.7%) |
| 2.0x to 2.9x | 198 (31.5%) | 256 (10.3%) |
| 3.0x to 3.9x | 95 (15.1%) | 585 (23.4%) |
| 4.0x or more | 267 (42.5%) | 434 (17.4%) |
| Total | 628 (100.0%) | 2,496 (100.0%) |
Real Estate Taxes by Mortgage Status in Cold Springs
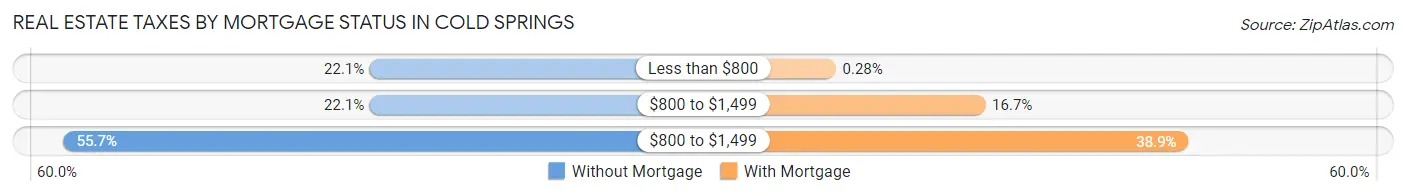
| Property Taxes | Without Mortgage | With Mortgage |
| Less than $800 | 139 (22.1%) | 7 (0.3%) |
| $800 to $1,499 | 139 (22.1%) | 416 (16.7%) |
| $800 to $1,499 | 350 (55.7%) | 972 (38.9%) |
| Total | 628 (100.0%) | 2,496 (100.0%) |
Health & Disability in Cold Springs
Health Insurance Coverage by Age in Cold Springs
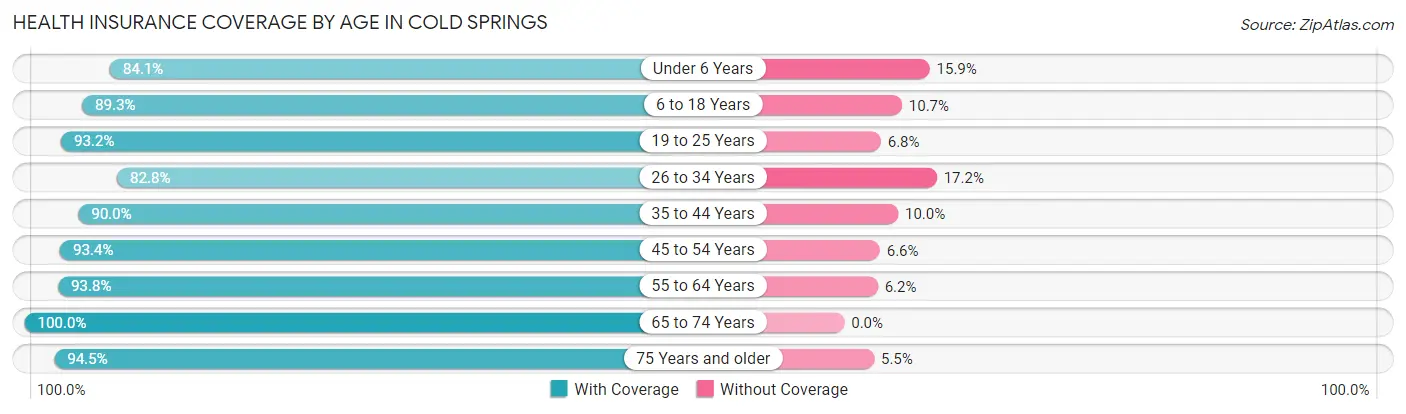
| Age Bracket | With Coverage | Without Coverage |
| Under 6 Years | 904 (84.1%) | 171 (15.9%) |
| 6 to 18 Years | 2,252 (89.3%) | 271 (10.7%) |
| 19 to 25 Years | 397 (93.2%) | 29 (6.8%) |
| 26 to 34 Years | 1,440 (82.8%) | 300 (17.2%) |
| 35 to 44 Years | 1,177 (90.0%) | 131 (10.0%) |
| 45 to 54 Years | 1,128 (93.4%) | 80 (6.6%) |
| 55 to 64 Years | 1,550 (93.8%) | 103 (6.2%) |
| 65 to 74 Years | 737 (100.0%) | 0 (0.0%) |
| 75 Years and older | 307 (94.5%) | 18 (5.5%) |
| Total | 9,892 (90.0%) | 1,103 (10.0%) |
Health Insurance Coverage by Citizenship Status in Cold Springs
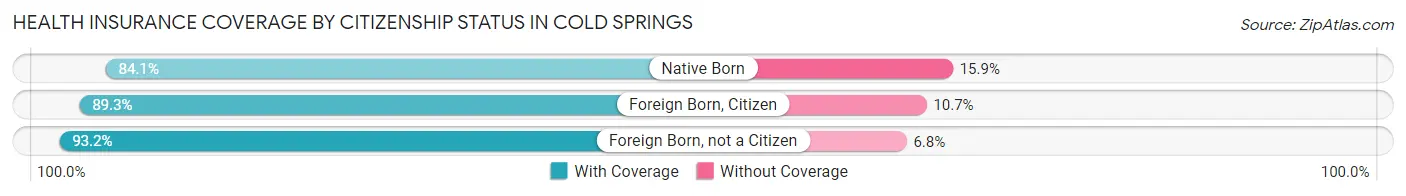
| Citizenship Status | With Coverage | Without Coverage |
| Native Born | 904 (84.1%) | 171 (15.9%) |
| Foreign Born, Citizen | 2,252 (89.3%) | 271 (10.7%) |
| Foreign Born, not a Citizen | 397 (93.2%) | 29 (6.8%) |
Health Insurance Coverage by Household Income in Cold Springs
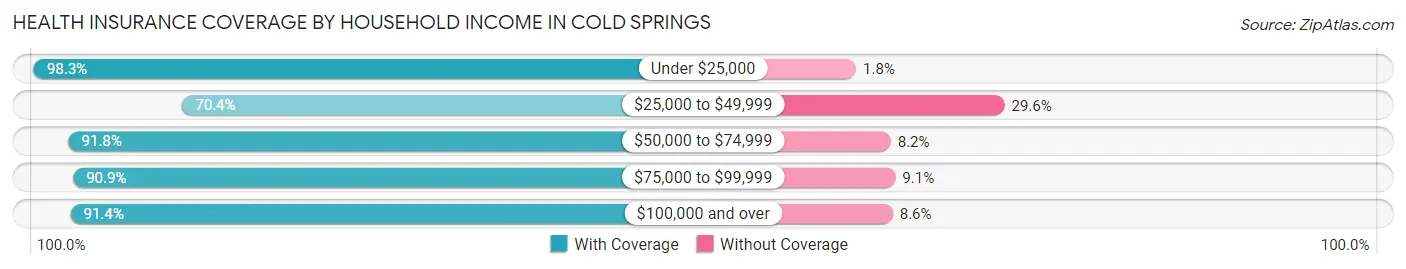
| Household Income | With Coverage | Without Coverage |
| Under $25,000 | 337 (98.3%) | 6 (1.8%) |
| $25,000 to $49,999 | 603 (70.4%) | 253 (29.6%) |
| $50,000 to $74,999 | 2,371 (91.8%) | 213 (8.2%) |
| $75,000 to $99,999 | 1,735 (90.9%) | 174 (9.1%) |
| $100,000 and over | 4,846 (91.4%) | 457 (8.6%) |
Public vs Private Health Insurance Coverage by Age in Cold Springs
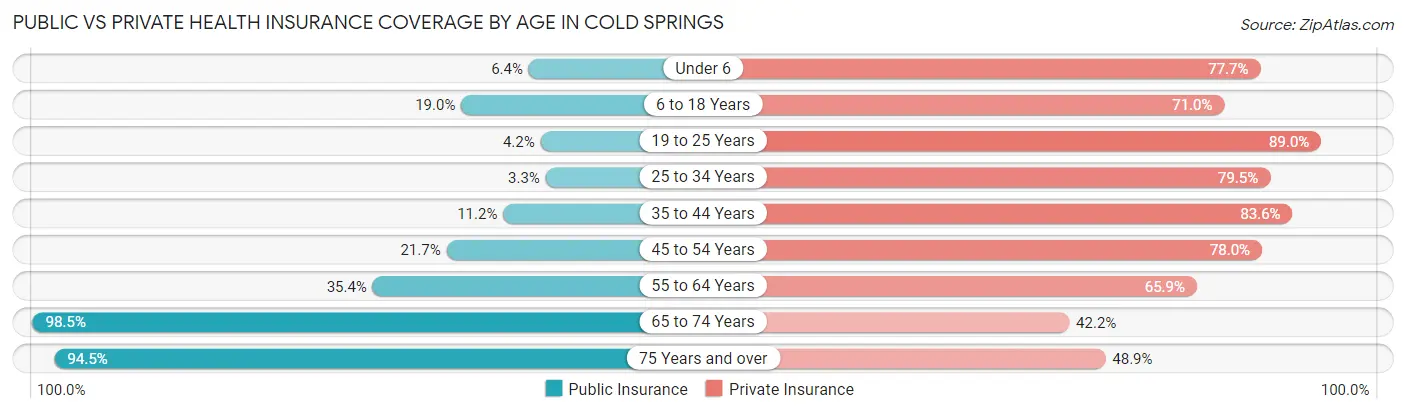
| Age Bracket | Public Insurance | Private Insurance |
| Under 6 | 69 (6.4%) | 835 (77.7%) |
| 6 to 18 Years | 478 (19.0%) | 1,791 (71.0%) |
| 19 to 25 Years | 18 (4.2%) | 379 (89.0%) |
| 25 to 34 Years | 57 (3.3%) | 1,383 (79.5%) |
| 35 to 44 Years | 146 (11.2%) | 1,094 (83.6%) |
| 45 to 54 Years | 262 (21.7%) | 942 (78.0%) |
| 55 to 64 Years | 585 (35.4%) | 1,089 (65.9%) |
| 65 to 74 Years | 726 (98.5%) | 311 (42.2%) |
| 75 Years and over | 307 (94.5%) | 159 (48.9%) |
| Total | 2,648 (24.1%) | 7,983 (72.6%) |
Disability Status by Sex by Age in Cold Springs
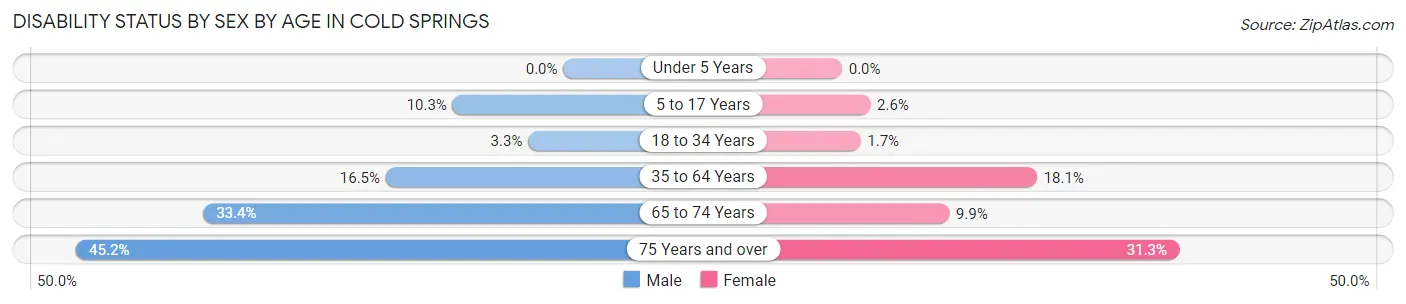
| Age Bracket | Male | Female |
| Under 5 Years | 0 (0.0%) | 0 (0.0%) |
| 5 to 17 Years | 167 (10.3%) | 24 (2.6%) |
| 18 to 34 Years | 33 (3.3%) | 22 (1.7%) |
| 35 to 64 Years | 348 (16.5%) | 372 (18.1%) |
| 65 to 74 Years | 132 (33.4%) | 34 (9.9%) |
| 75 Years and over | 66 (45.2%) | 56 (31.3%) |
Disability Class by Sex by Age in Cold Springs
Disability Class: Hearing Difficulty
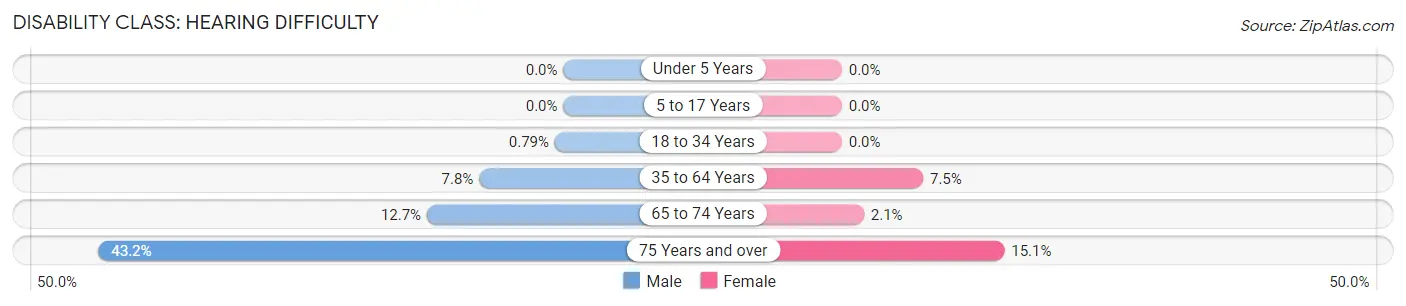
| Age Bracket | Male | Female |
| Under 5 Years | 0 (0.0%) | 0 (0.0%) |
| 5 to 17 Years | 0 (0.0%) | 0 (0.0%) |
| 18 to 34 Years | 8 (0.8%) | 0 (0.0%) |
| 35 to 64 Years | 165 (7.8%) | 155 (7.5%) |
| 65 to 74 Years | 50 (12.7%) | 7 (2.1%) |
| 75 Years and over | 63 (43.1%) | 27 (15.1%) |
Disability Class: Vision Difficulty
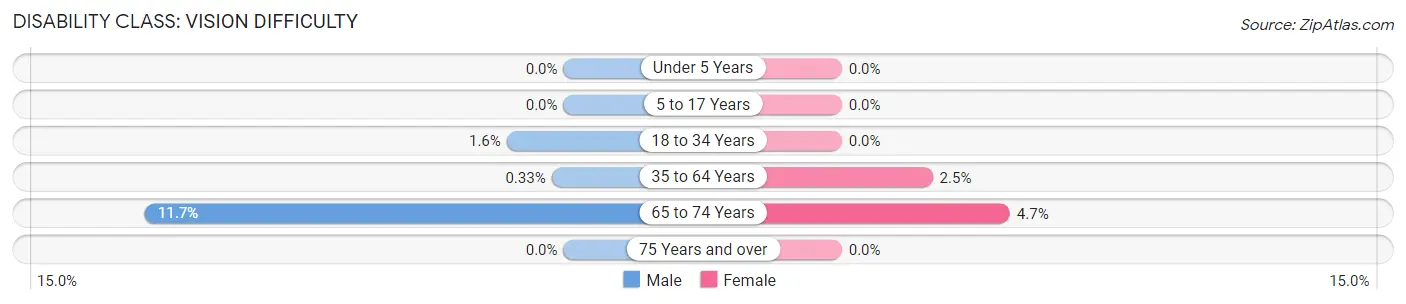
| Age Bracket | Male | Female |
| Under 5 Years | 0 (0.0%) | 0 (0.0%) |
| 5 to 17 Years | 0 (0.0%) | 0 (0.0%) |
| 18 to 34 Years | 16 (1.6%) | 0 (0.0%) |
| 35 to 64 Years | 7 (0.3%) | 52 (2.5%) |
| 65 to 74 Years | 46 (11.7%) | 16 (4.7%) |
| 75 Years and over | 0 (0.0%) | 0 (0.0%) |
Disability Class: Cognitive Difficulty
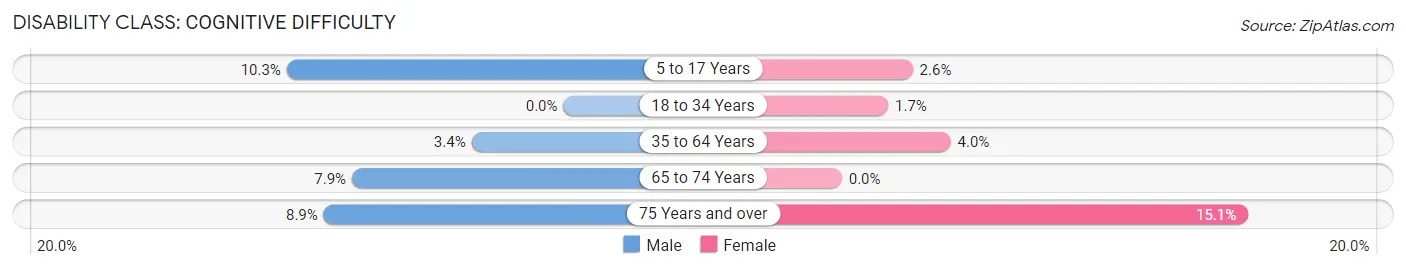
| Age Bracket | Male | Female |
| 5 to 17 Years | 167 (10.3%) | 24 (2.6%) |
| 18 to 34 Years | 0 (0.0%) | 22 (1.7%) |
| 35 to 64 Years | 72 (3.4%) | 83 (4.0%) |
| 65 to 74 Years | 31 (7.9%) | 0 (0.0%) |
| 75 Years and over | 13 (8.9%) | 27 (15.1%) |
Disability Class: Ambulatory Difficulty
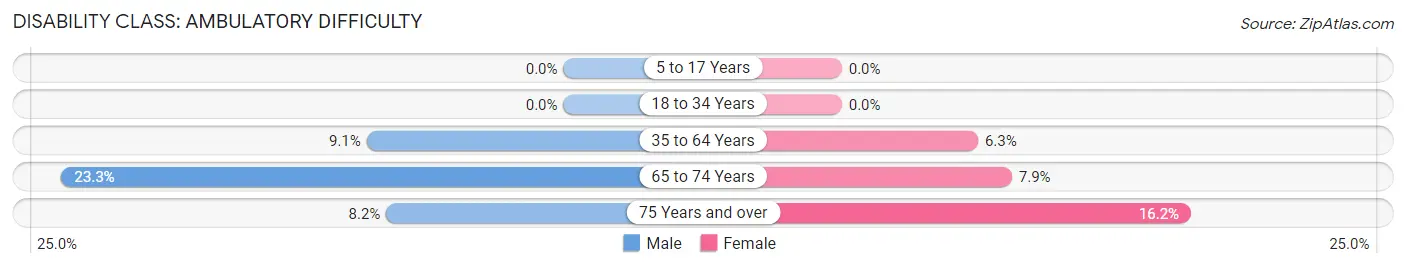
| Age Bracket | Male | Female |
| 5 to 17 Years | 0 (0.0%) | 0 (0.0%) |
| 18 to 34 Years | 0 (0.0%) | 0 (0.0%) |
| 35 to 64 Years | 193 (9.1%) | 130 (6.3%) |
| 65 to 74 Years | 92 (23.3%) | 27 (7.9%) |
| 75 Years and over | 12 (8.2%) | 29 (16.2%) |
Disability Class: Self-Care Difficulty
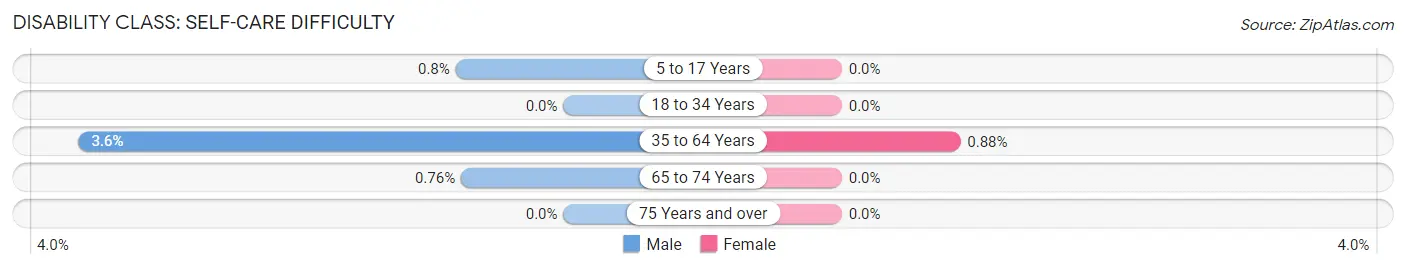
| Age Bracket | Male | Female |
| 5 to 17 Years | 13 (0.8%) | 0 (0.0%) |
| 18 to 34 Years | 0 (0.0%) | 0 (0.0%) |
| 35 to 64 Years | 76 (3.6%) | 18 (0.9%) |
| 65 to 74 Years | 3 (0.8%) | 0 (0.0%) |
| 75 Years and over | 0 (0.0%) | 0 (0.0%) |
Technology Access in Cold Springs
Computing Device Access in Cold Springs
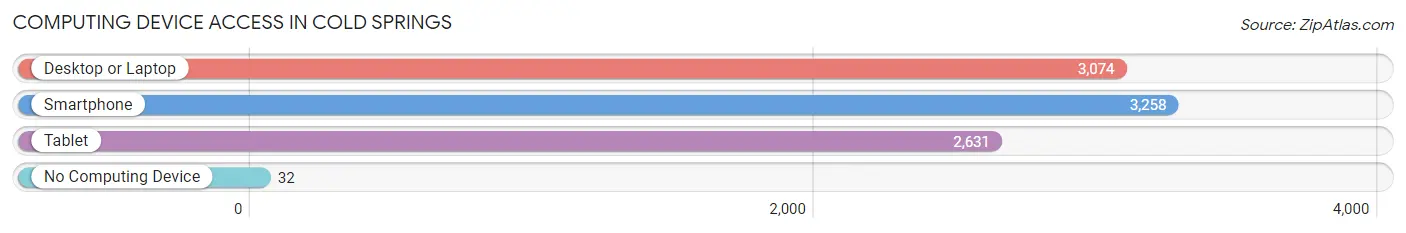
| Device Type | # Households | % Households |
| Desktop or Laptop | 3,074 | 88.9% |
| Smartphone | 3,258 | 94.2% |
| Tablet | 2,631 | 76.1% |
| No Computing Device | 32 | 0.9% |
| Total | 3,459 | 100.0% |
Internet Access in Cold Springs
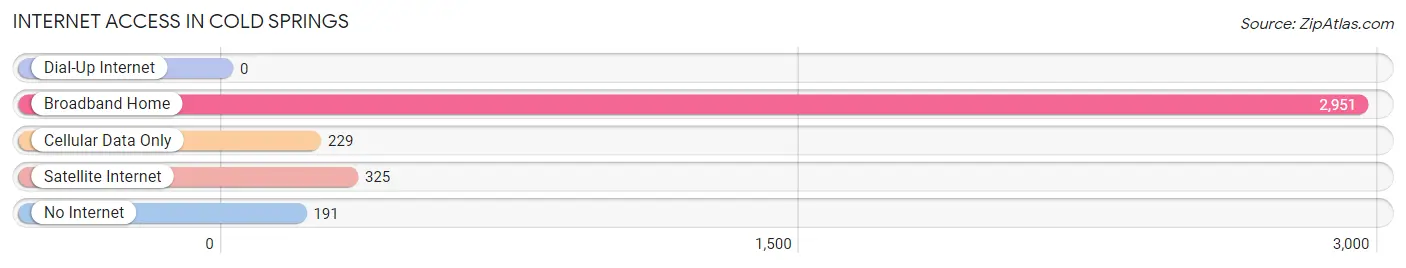
| Internet Type | # Households | % Households |
| Dial-Up Internet | 0 | 0.0% |
| Broadband Home | 2,951 | 85.3% |
| Cellular Data Only | 229 | 6.6% |
| Satellite Internet | 325 | 9.4% |
| No Internet | 191 | 5.5% |
| Total | 3,459 | 100.0% |
Cold Springs Summary
Introduction
Cold Springs is a small unincorporated community located in the state of Nevada, United States. It is situated in the northern part of the state, in Washoe County, and is part of the Reno-Sparks metropolitan area. The community is located in a rural area, surrounded by mountains and desert. It is a small, quiet community with a population of just over 1,000 people.
History
The area that is now Cold Springs was first settled in the late 1800s by ranchers and farmers. The first post office was established in 1887, and the town was officially incorporated in 1906. The town was named after the cold springs that were located nearby.
In the early 1900s, the town was a popular stop for travelers on the Lincoln Highway, which ran through the area. The town also had a few businesses, including a general store, a hotel, and a saloon.
In the 1950s, the town began to decline as the highway was rerouted and the businesses closed. The population dropped to just over 100 people by the 1970s.
In the 1980s, the town began to experience a resurgence as people began to move to the area for its rural lifestyle and proximity to Reno. The population has grown steadily since then, and the town now has a population of over 1,000 people.
Geography
Cold Springs is located in the northern part of Nevada, in Washoe County. It is situated in a rural area, surrounded by mountains and desert. The town is located at an elevation of 4,890 feet, and the climate is semi-arid.
The town is located near the Truckee River, which is a major source of water for the area. The river is also a popular destination for fishing and other recreational activities.
Economy
The economy of Cold Springs is largely based on agriculture and tourism. The town is home to several farms and ranches, which produce a variety of crops and livestock. The town is also a popular destination for tourists, who come to enjoy the rural lifestyle and outdoor activities.
The town also has a few small businesses, including a general store, a restaurant, and a few other shops.
Demographics
As of the 2010 census, the population of Cold Springs was 1,072. The racial makeup of the town was 94.3% White, 0.7% African American, 0.7% Native American, 0.7% Asian, 0.3% Pacific Islander, and 2.7% from other races. The median household income was $45,000, and the median age was 44.
Conclusion
Cold Springs is a small, rural community located in the northern part of Nevada. It is a quiet, peaceful town with a population of just over 1,000 people. The economy of the town is largely based on agriculture and tourism, and the town is a popular destination for tourists who come to enjoy the rural lifestyle and outdoor activities. The town has a diverse population, with a median household income of $45,000 and a median age of 44.
Common Questions
What is Per Capita Income in Cold Springs?
Per Capita income in Cold Springs is $30,275.
What is the Median Family Income in Cold Springs?
Median Family Income in Cold Springs is $89,171.
What is the Median Household income in Cold Springs?
Median Household Income in Cold Springs is $85,851.
What is Income or Wage Gap in Cold Springs?
Income or Wage Gap in Cold Springs is 44.3%.
Women in Cold Springs earn 55.7 cents for every dollar earned by a man.
What is Family Income Deficit in Cold Springs?
Family Income Deficit in Cold Springs is $10,946.
Families that are below poverty line in Cold Springs earn $10,946 less on average than the poverty threshold level.
What is Inequality or Gini Index in Cold Springs?
Inequality or Gini Index in Cold Springs is 0.29.
What is the Total Population of Cold Springs?
Total Population of Cold Springs is 11,029.
What is the Total Male Population of Cold Springs?
Total Male Population of Cold Springs is 5,692.
What is the Total Female Population of Cold Springs?
Total Female Population of Cold Springs is 5,337.
What is the Ratio of Males per 100 Females in Cold Springs?
There are 106.65 Males per 100 Females in Cold Springs.
What is the Ratio of Females per 100 Males in Cold Springs?
There are 93.76 Females per 100 Males in Cold Springs.
What is the Median Population Age in Cold Springs?
Median Population Age in Cold Springs is 33.5 Years.
What is the Average Family Size in Cold Springs
Average Family Size in Cold Springs is 3.6 People.
What is the Average Household Size in Cold Springs
Average Household Size in Cold Springs is 3.2 People.
How Large is the Labor Force in Cold Springs?
There are 5,163 People in the Labor Forcein in Cold Springs.
What is the Percentage of People in the Labor Force in Cold Springs?
65.4% of People are in the Labor Force in Cold Springs.
What is the Unemployment Rate in Cold Springs?
Unemployment Rate in Cold Springs is 3.3%.