Ranlo, NC Map & Demographics
Ranlo Map
Ranlo Overview
$31,288
PER CAPITA INCOME
$82,500
AVG FAMILY INCOME
$78,533
AVG HOUSEHOLD INCOME
51.2%
WAGE / INCOME GAP [ % ]
48.8¢/ $1
WAGE / INCOME GAP [ $ ]
0.41
INEQUALITY / GINI INDEX
4,487
TOTAL POPULATION
2,065
MALE POPULATION
2,422
FEMALE POPULATION
85.26
MALES / 100 FEMALES
117.29
FEMALES / 100 MALES
33.7
MEDIAN AGE
3.2
AVG FAMILY SIZE
2.8
AVG HOUSEHOLD SIZE
2,137
LABOR FORCE [ PEOPLE ]
65.2%
PERCENT IN LABOR FORCE
7.3%
UNEMPLOYMENT RATE
Income in Ranlo
Income Overview in Ranlo
Per Capita Income in Ranlo is $31,288, while median incomes of families and households are $82,500 and $78,533 respectively.
| Characteristic | Number | Measure |
| Per Capita Income | 4,487 | $31,288 |
| Median Family Income | 1,270 | $82,500 |
| Mean Family Income | 1,270 | $98,379 |
| Median Household Income | 1,591 | $78,533 |
| Mean Household Income | 1,591 | $88,994 |
| Income Deficit | 1,270 | $0 |
| Wage / Income Gap (%) | 4,487 | 51.24% |
| Wage / Income Gap ($) | 4,487 | 48.76¢ per $1 |
| Gini / Inequality Index | 4,487 | 0.41 |
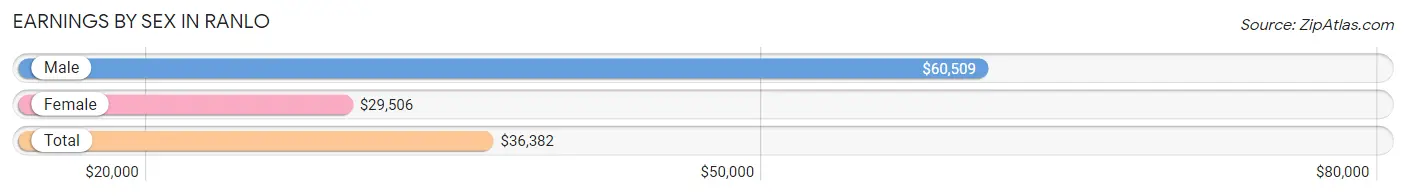
Earnings by Sex in Ranlo
Average Earnings in Ranlo are $36,382, $60,509 for men and $29,506 for women, a difference of 51.2%.
| Sex | Number | Average Earnings |
| Male | 1,126 (52.5%) | $60,509 |
| Female | 1,017 (47.5%) | $29,506 |
| Total | 2,143 (100.0%) | $36,382 |
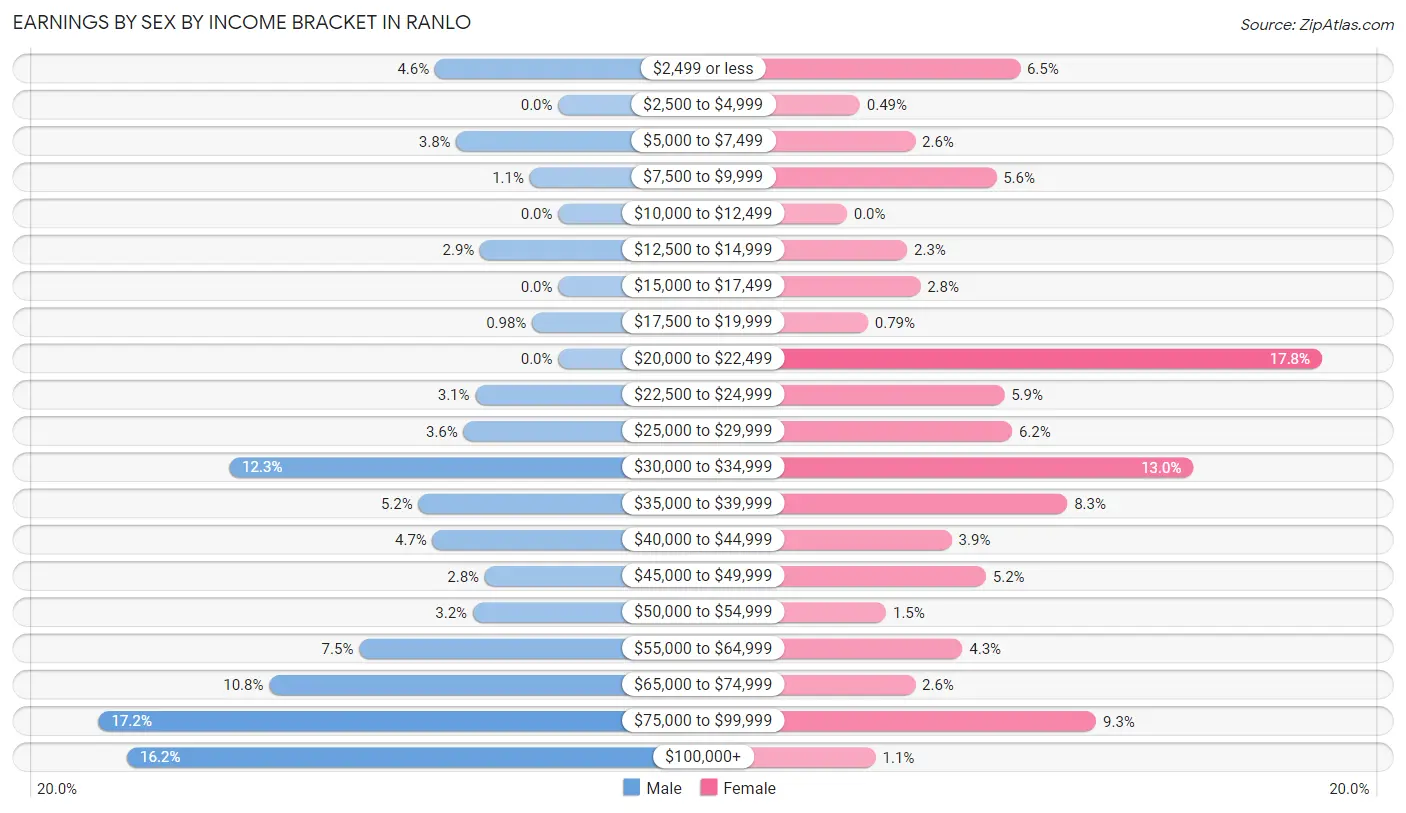
Earnings by Sex by Income Bracket in Ranlo
The most common earnings brackets in Ranlo are $75,000 to $99,999 for men (194 | 17.2%) and $20,000 to $22,499 for women (181 | 17.8%).
| Income | Male | Female |
| $2,499 or less | 52 (4.6%) | 66 (6.5%) |
| $2,500 to $4,999 | 0 (0.0%) | 5 (0.5%) |
| $5,000 to $7,499 | 43 (3.8%) | 26 (2.6%) |
| $7,500 to $9,999 | 12 (1.1%) | 57 (5.6%) |
| $10,000 to $12,499 | 0 (0.0%) | 0 (0.0%) |
| $12,500 to $14,999 | 33 (2.9%) | 23 (2.3%) |
| $15,000 to $17,499 | 0 (0.0%) | 28 (2.8%) |
| $17,500 to $19,999 | 11 (1.0%) | 8 (0.8%) |
| $20,000 to $22,499 | 0 (0.0%) | 181 (17.8%) |
| $22,500 to $24,999 | 35 (3.1%) | 60 (5.9%) |
| $25,000 to $29,999 | 40 (3.5%) | 63 (6.2%) |
| $30,000 to $34,999 | 139 (12.3%) | 132 (13.0%) |
| $35,000 to $39,999 | 59 (5.2%) | 84 (8.3%) |
| $40,000 to $44,999 | 53 (4.7%) | 40 (3.9%) |
| $45,000 to $49,999 | 31 (2.8%) | 53 (5.2%) |
| $50,000 to $54,999 | 36 (3.2%) | 15 (1.5%) |
| $55,000 to $64,999 | 84 (7.5%) | 44 (4.3%) |
| $65,000 to $74,999 | 122 (10.8%) | 26 (2.6%) |
| $75,000 to $99,999 | 194 (17.2%) | 95 (9.3%) |
| $100,000+ | 182 (16.2%) | 11 (1.1%) |
| Total | 1,126 (100.0%) | 1,017 (100.0%) |
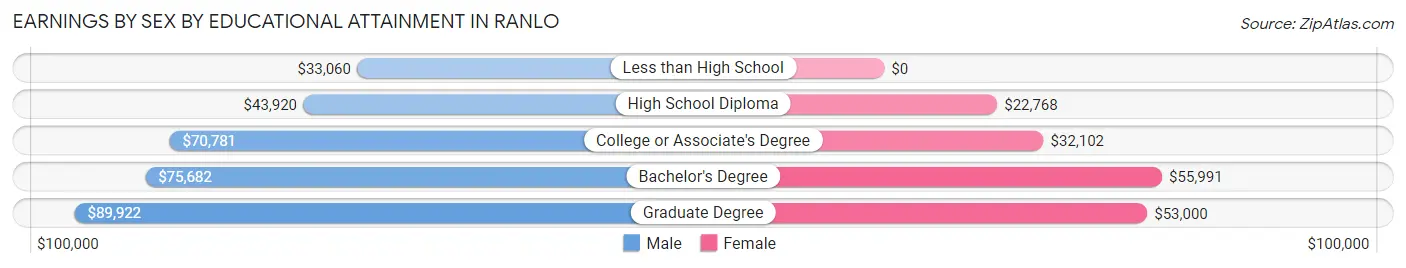
Earnings by Sex by Educational Attainment in Ranlo
Average earnings in Ranlo are $62,500 for men and $32,873 for women, a difference of 47.4%. Men with an educational attainment of graduate degree enjoy the highest average annual earnings of $89,922, while those with less than high school education earn the least with $33,060. Women with an educational attainment of bachelor's degree earn the most with the average annual earnings of $55,991, while those with high school diploma education have the smallest earnings of $22,768.
| Educational Attainment | Male Income | Female Income |
| Less than High School | $33,060 | $0 |
| High School Diploma | $43,920 | $22,768 |
| College or Associate's Degree | $70,781 | $32,102 |
| Bachelor's Degree | $75,682 | $55,991 |
| Graduate Degree | $89,922 | $53,000 |
| Total | $62,500 | $32,873 |
Family Income in Ranlo
Family Income Brackets in Ranlo
According to the Ranlo family income data, there are 359 families falling into the $75,000 to $99,999 income range, which is the most common income bracket and makes up 28.3% of all families.
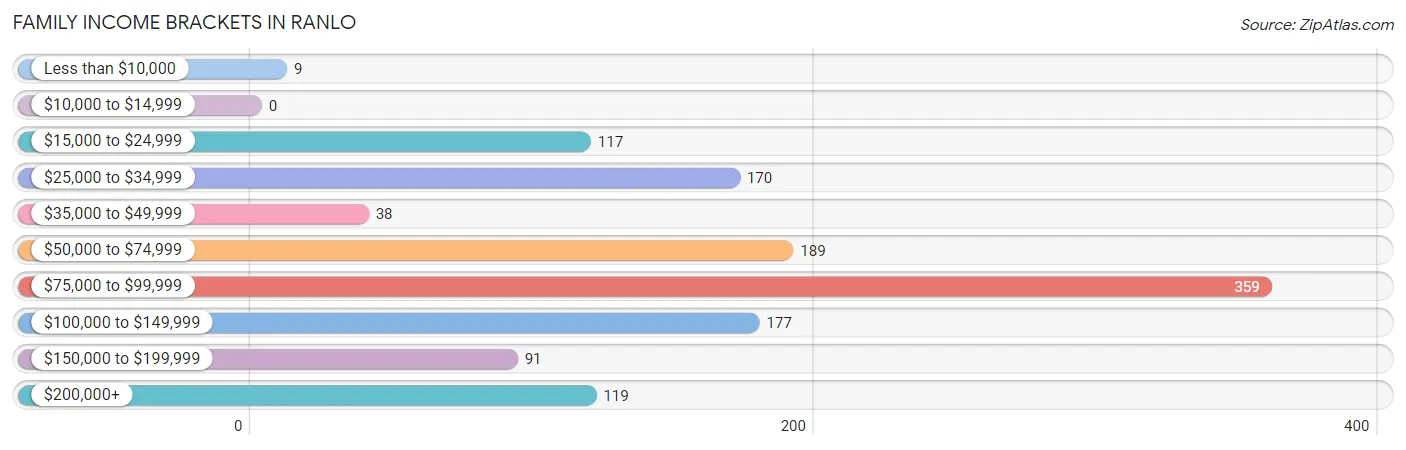
| Income Bracket | # Families | % Families |
| Less than $10,000 | 9 | 0.7% |
| $10,000 to $14,999 | 0 | 0.0% |
| $15,000 to $24,999 | 117 | 9.2% |
| $25,000 to $34,999 | 170 | 13.4% |
| $35,000 to $49,999 | 38 | 3.0% |
| $50,000 to $74,999 | 189 | 14.9% |
| $75,000 to $99,999 | 359 | 28.3% |
| $100,000 to $149,999 | 177 | 13.9% |
| $150,000 to $199,999 | 91 | 7.2% |
| $200,000+ | 119 | 9.4% |
Family Income by Famaliy Size in Ranlo
5-person families (230 | 18.1%) account for the highest median family income in Ranlo with $95,246 per family, while 2-person families (673 | 53.0%) have the highest median income of $38,688 per family member.
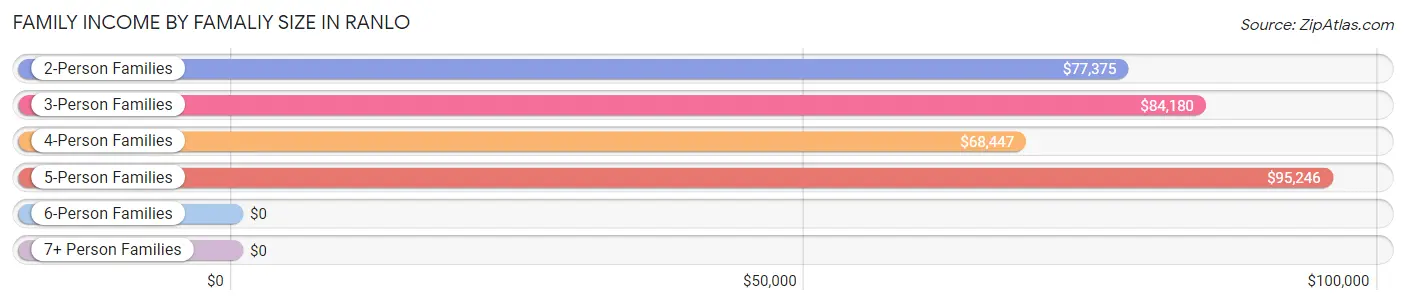
| Income Bracket | # Families | Median Income |
| 2-Person Families | 673 (53.0%) | $77,375 |
| 3-Person Families | 147 (11.6%) | $84,180 |
| 4-Person Families | 201 (15.8%) | $68,447 |
| 5-Person Families | 230 (18.1%) | $95,246 |
| 6-Person Families | 19 (1.5%) | $0 |
| 7+ Person Families | 0 (0.0%) | $0 |
| Total | 1,270 (100.0%) | $82,500 |
Family Income by Number of Earners in Ranlo
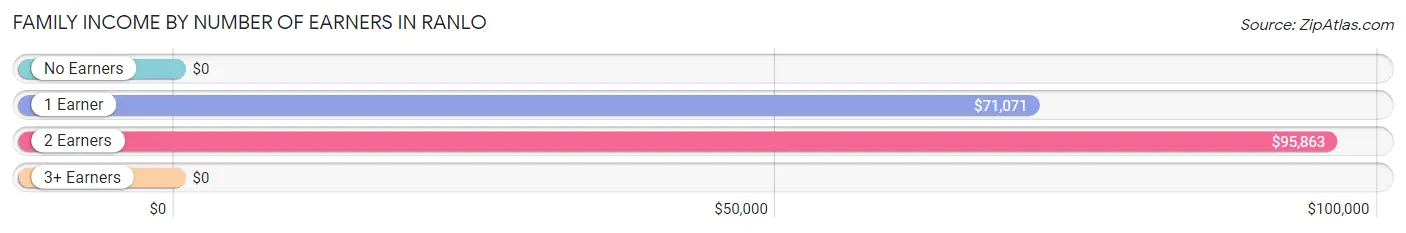
| Number of Earners | # Families | Median Income |
| No Earners | 141 (11.1%) | $0 |
| 1 Earner | 550 (43.3%) | $71,071 |
| 2 Earners | 557 (43.9%) | $95,863 |
| 3+ Earners | 22 (1.7%) | $0 |
| Total | 1,270 (100.0%) | $82,500 |
Household Income in Ranlo
Household Income Brackets in Ranlo
With 391 households falling in the category, the $75,000 to $99,999 income range is the most frequent in Ranlo, accounting for 24.6% of all households. In contrast, only 10 households (0.6%) fall into the less than $10,000 income bracket, making it the least populous group.
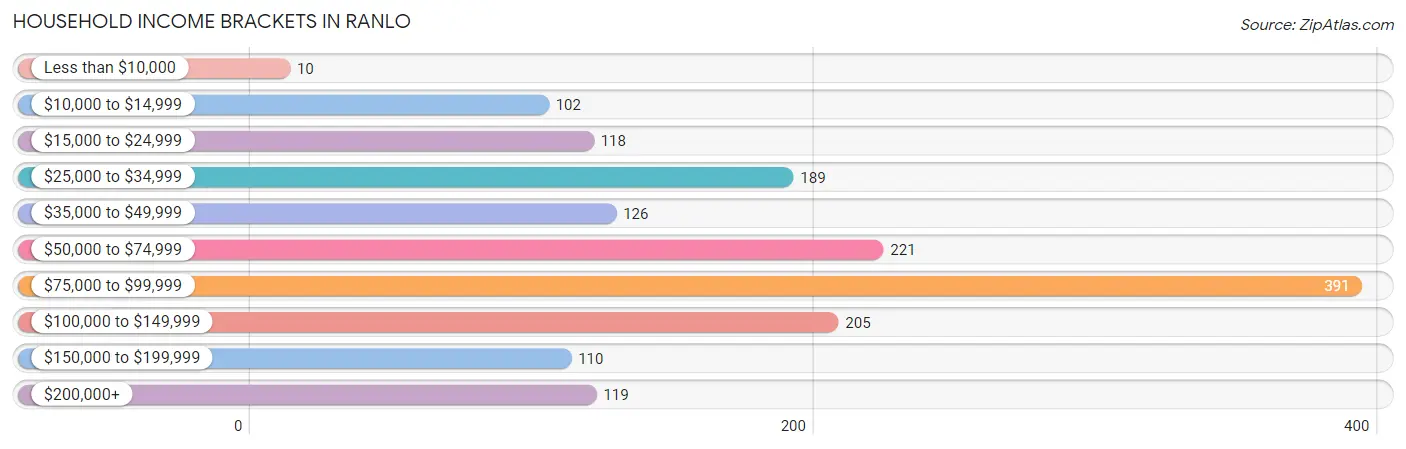
| Income Bracket | # Households | % Households |
| Less than $10,000 | 10 | 0.6% |
| $10,000 to $14,999 | 102 | 6.4% |
| $15,000 to $24,999 | 118 | 7.4% |
| $25,000 to $34,999 | 189 | 11.9% |
| $35,000 to $49,999 | 126 | 7.9% |
| $50,000 to $74,999 | 221 | 13.9% |
| $75,000 to $99,999 | 391 | 24.6% |
| $100,000 to $149,999 | 205 | 12.9% |
| $150,000 to $199,999 | 110 | 6.9% |
| $200,000+ | 119 | 7.5% |
Household Income by Householder Age in Ranlo
The median household income in Ranlo is $78,533, with the highest median household income of $95,769 found in the 25 to 44 years age bracket for the primary householder. A total of 680 households (42.7%) fall into this category. Meanwhile, the 15 to 24 years age bracket for the primary householder has the lowest median household income of $0, with 78 households (4.9%) in this group.
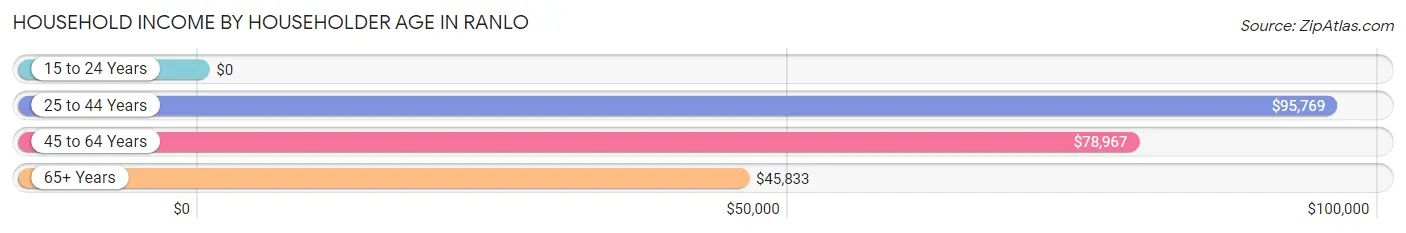
| Income Bracket | # Households | Median Income |
| 15 to 24 Years | 78 (4.9%) | $0 |
| 25 to 44 Years | 680 (42.7%) | $95,769 |
| 45 to 64 Years | 473 (29.7%) | $78,967 |
| 65+ Years | 360 (22.6%) | $45,833 |
| Total | 1,591 (100.0%) | $78,533 |
Poverty in Ranlo
Income Below Poverty by Sex and Age in Ranlo
With 3.3% poverty level for males and 5.0% for females among the residents of Ranlo, 75 year old and over males and 55 to 64 year old females are the most vulnerable to poverty, with 19 males (25.7%) and 45 females (23.3%) in their respective age groups living below the poverty level.
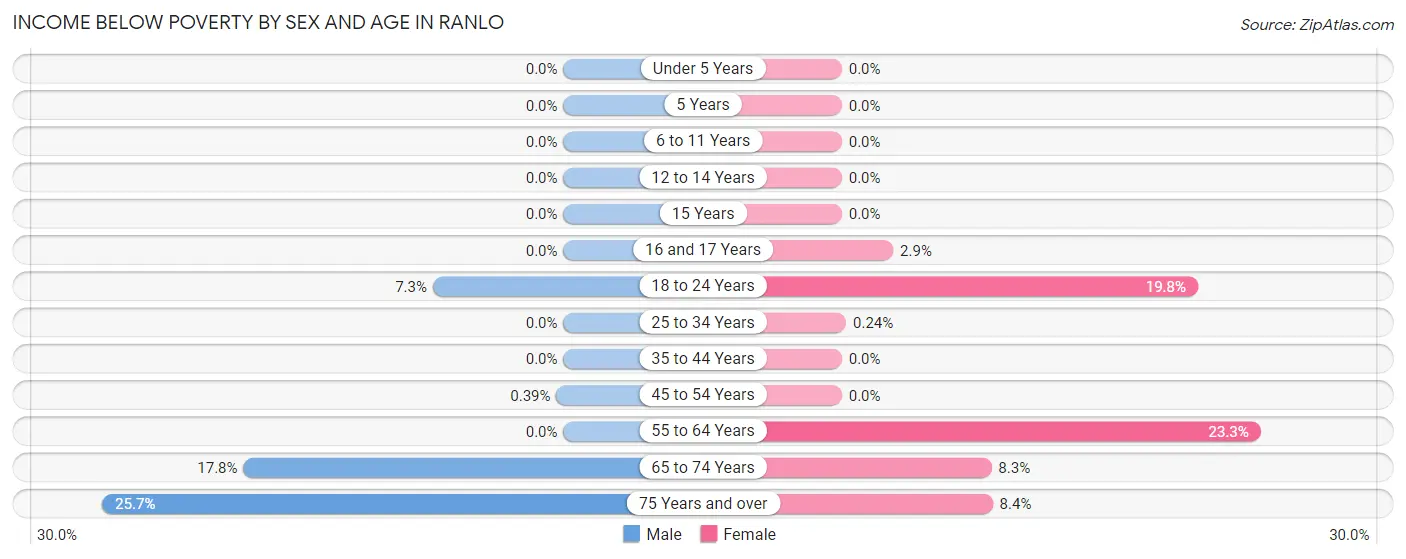
| Age Bracket | Male | Female |
| Under 5 Years | 0 (0.0%) | 0 (0.0%) |
| 5 Years | 0 (0.0%) | 0 (0.0%) |
| 6 to 11 Years | 0 (0.0%) | 0 (0.0%) |
| 12 to 14 Years | 0 (0.0%) | 0 (0.0%) |
| 15 Years | 0 (0.0%) | 0 (0.0%) |
| 16 and 17 Years | 0 (0.0%) | 3 (2.9%) |
| 18 to 24 Years | 12 (7.3%) | 43 (19.8%) |
| 25 to 34 Years | 0 (0.0%) | 1 (0.2%) |
| 35 to 44 Years | 0 (0.0%) | 0 (0.0%) |
| 45 to 54 Years | 1 (0.4%) | 0 (0.0%) |
| 55 to 64 Years | 0 (0.0%) | 45 (23.3%) |
| 65 to 74 Years | 36 (17.8%) | 18 (8.3%) |
| 75 Years and over | 19 (25.7%) | 11 (8.4%) |
| Total | 68 (3.3%) | 121 (5.0%) |
Income Above Poverty by Sex and Age in Ranlo
According to the poverty statistics in Ranlo, males aged under 5 years and females aged under 5 years are the age groups that are most secure financially, with 100.0% of males and 100.0% of females in these age groups living above the poverty line.
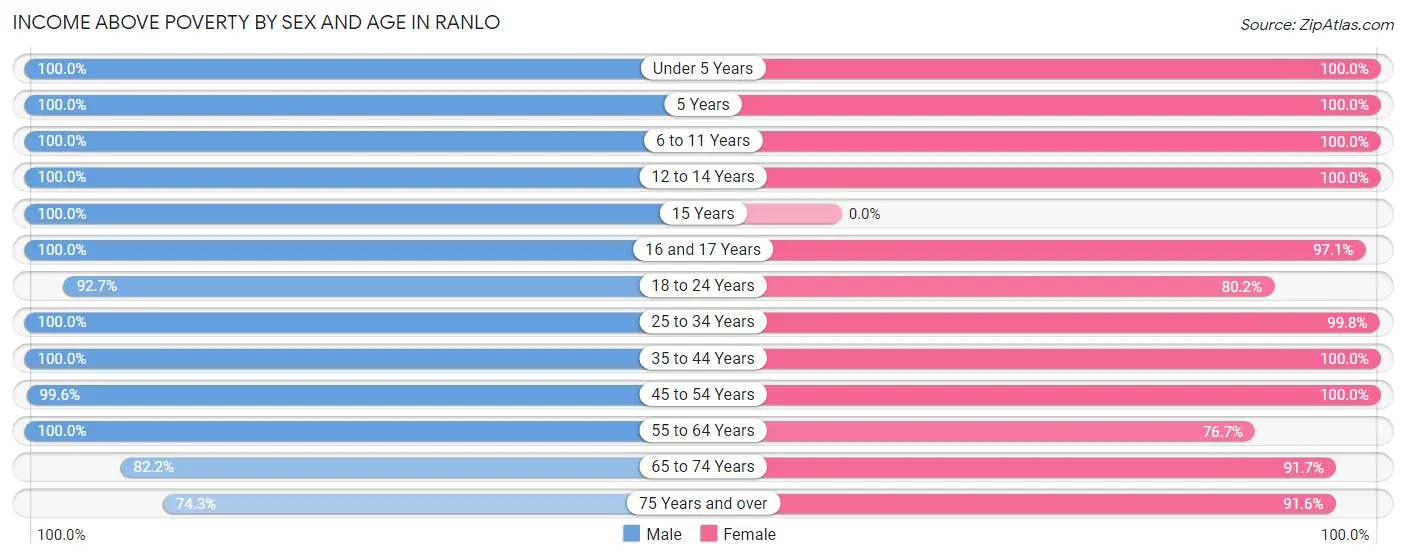
| Age Bracket | Male | Female |
| Under 5 Years | 194 (100.0%) | 94 (100.0%) |
| 5 Years | 124 (100.0%) | 23 (100.0%) |
| 6 to 11 Years | 144 (100.0%) | 367 (100.0%) |
| 12 to 14 Years | 99 (100.0%) | 148 (100.0%) |
| 15 Years | 17 (100.0%) | 0 (0.0%) |
| 16 and 17 Years | 15 (100.0%) | 102 (97.1%) |
| 18 to 24 Years | 153 (92.7%) | 174 (80.2%) |
| 25 to 34 Years | 265 (100.0%) | 411 (99.8%) |
| 35 to 44 Years | 438 (100.0%) | 234 (100.0%) |
| 45 to 54 Years | 258 (99.6%) | 282 (100.0%) |
| 55 to 64 Years | 69 (100.0%) | 148 (76.7%) |
| 65 to 74 Years | 166 (82.2%) | 198 (91.7%) |
| 75 Years and over | 55 (74.3%) | 120 (91.6%) |
| Total | 1,997 (96.7%) | 2,301 (95.0%) |
Income Below Poverty Among Married-Couple Families in Ranlo
The poverty statistics for married-couple families in Ranlo show that 1.0% or 9 of the total 905 families live below the poverty line. Families with no children have the highest poverty rate of 1.7%, comprising of 9 families. On the other hand, families with 1 or 2 children have the lowest poverty rate of 0.0%, which includes 0 families.
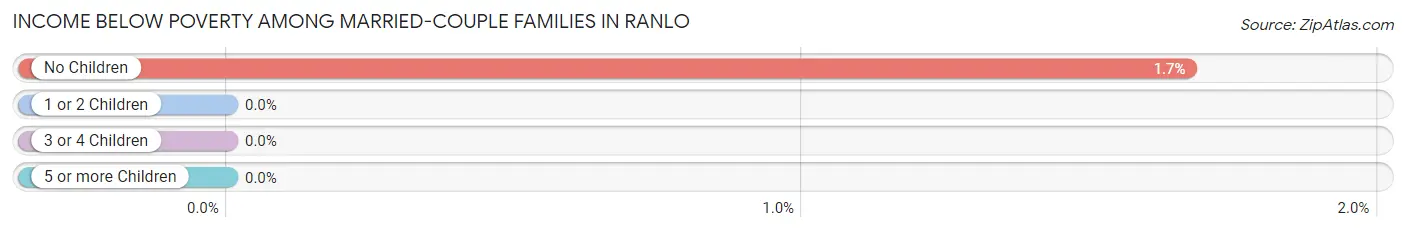
| Children | Above Poverty | Below Poverty |
| No Children | 531 (98.3%) | 9 (1.7%) |
| 1 or 2 Children | 206 (100.0%) | 0 (0.0%) |
| 3 or 4 Children | 159 (100.0%) | 0 (0.0%) |
| 5 or more Children | 0 (0.0%) | 0 (0.0%) |
| Total | 896 (99.0%) | 9 (1.0%) |
Income Below Poverty Among Single-Parent Households in Ranlo
| Children | Single Father | Single Mother |
| No Children | 0 (0.0%) | 0 (0.0%) |
| 1 or 2 Children | 0 (0.0%) | 0 (0.0%) |
| 3 or 4 Children | 0 (0.0%) | 0 (0.0%) |
| 5 or more Children | 0 (0.0%) | 0 (0.0%) |
| Total | 0 (0.0%) | 0 (0.0%) |
Income Below Poverty Among Married-Couple vs Single-Parent Households in Ranlo
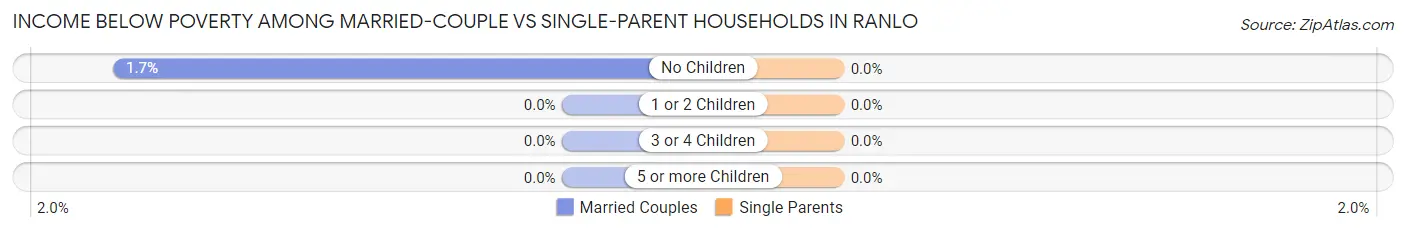
| Children | Married-Couple Families | Single-Parent Households |
| No Children | 9 (1.7%) | 0 (0.0%) |
| 1 or 2 Children | 0 (0.0%) | 0 (0.0%) |
| 3 or 4 Children | 0 (0.0%) | 0 (0.0%) |
| 5 or more Children | 0 (0.0%) | 0 (0.0%) |
| Total | 9 (1.0%) | 0 (0.0%) |
Race in Ranlo
The most populous races in Ranlo are White / Caucasian (2,502 | 55.8%), Black / African American (1,563 | 34.8%), and Hispanic or Latino (433 | 9.7%).
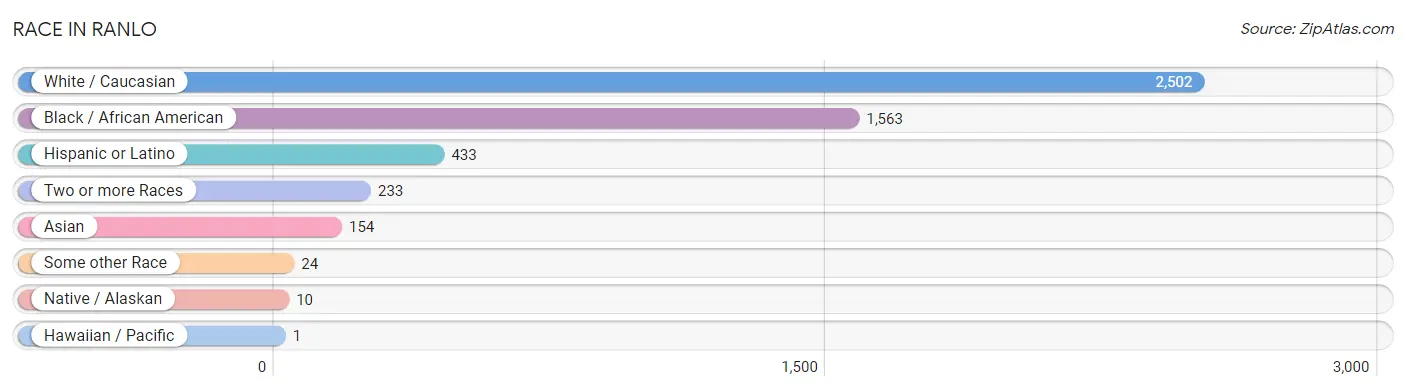
| Race | # Population | % Population |
| Asian | 154 | 3.4% |
| Black / African American | 1,563 | 34.8% |
| Hawaiian / Pacific | 1 | 0.0% |
| Hispanic or Latino | 433 | 9.7% |
| Native / Alaskan | 10 | 0.2% |
| White / Caucasian | 2,502 | 55.8% |
| Two or more Races | 233 | 5.2% |
| Some other Race | 24 | 0.5% |
| Total | 4,487 | 100.0% |
Ancestry in Ranlo
The most populous ancestries reported in Ranlo are American (1,141 | 25.4%), German (344 | 7.7%), Irish (272 | 6.1%), English (156 | 3.5%), and Sri Lankan (139 | 3.1%), together accounting for 45.7% of all Ranlo residents.
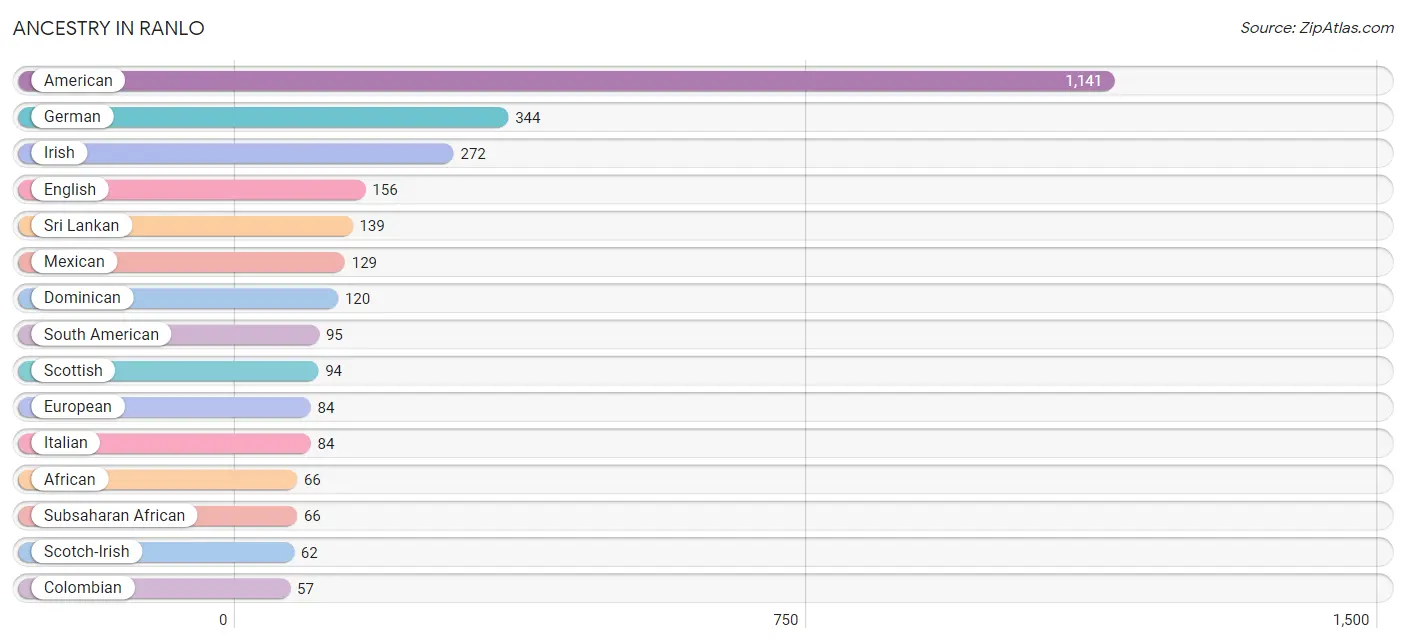
| Ancestry | # Population | % Population |
| African | 66 | 1.5% |
| American | 1,141 | 25.4% |
| Bhutanese | 48 | 1.1% |
| Blackfeet | 10 | 0.2% |
| Burmese | 6 | 0.1% |
| Central American | 44 | 1.0% |
| Cherokee | 1 | 0.0% |
| Colombian | 57 | 1.3% |
| Czech | 11 | 0.3% |
| Danish | 14 | 0.3% |
| Dominican | 120 | 2.7% |
| Dutch | 24 | 0.5% |
| Ecuadorian | 38 | 0.9% |
| English | 156 | 3.5% |
| European | 84 | 1.9% |
| Finnish | 4 | 0.1% |
| French | 14 | 0.3% |
| German | 344 | 7.7% |
| Honduran | 44 | 1.0% |
| Irish | 272 | 6.1% |
| Italian | 84 | 1.9% |
| Mexican | 129 | 2.9% |
| Norwegian | 7 | 0.2% |
| Polish | 16 | 0.4% |
| Puerto Rican | 10 | 0.2% |
| Russian | 11 | 0.3% |
| Samoan | 1 | 0.0% |
| Scandinavian | 10 | 0.2% |
| Scotch-Irish | 62 | 1.4% |
| Scottish | 94 | 2.1% |
| South American | 95 | 2.1% |
| Sri Lankan | 139 | 3.1% |
| Subsaharan African | 66 | 1.5% | View All 33 Rows |
Immigrants in Ranlo
The most numerous immigrant groups reported in Ranlo came from Latin America (144 | 3.2%), Asia (123 | 2.7%), South Eastern Asia (108 | 2.4%), Vietnam (108 | 2.4%), and Central America (71 | 1.6%), together accounting for 12.3% of all Ranlo residents.
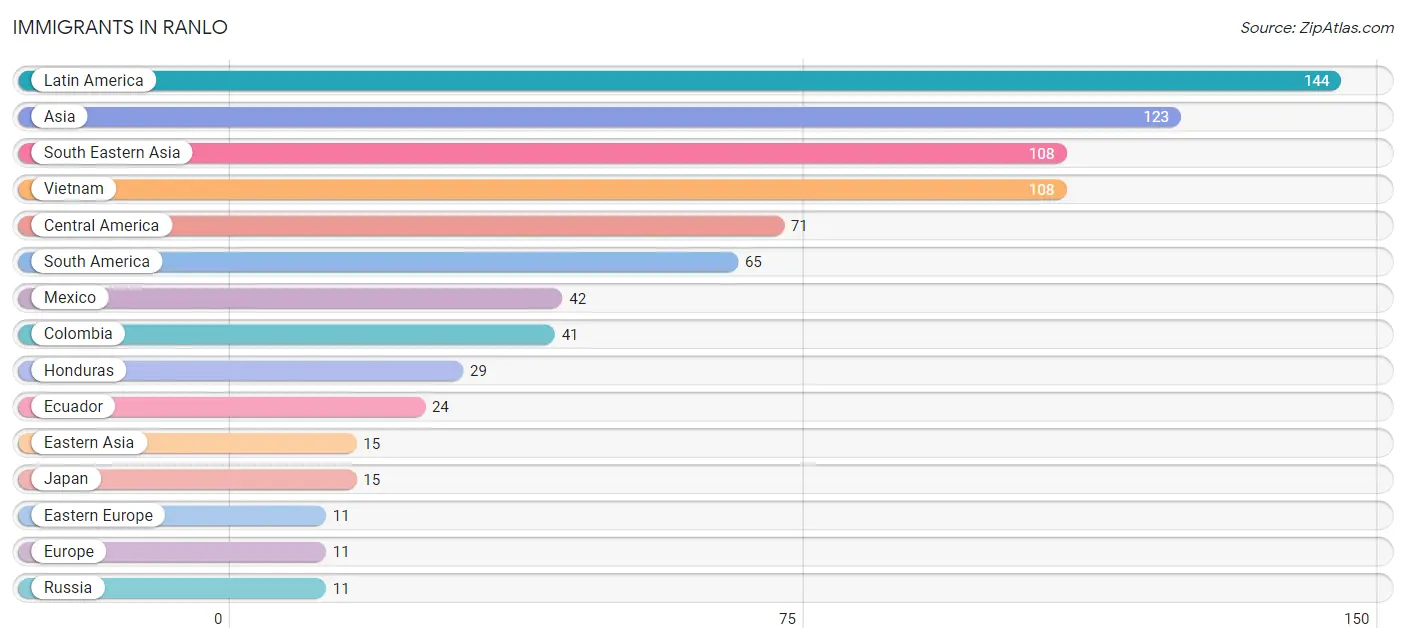
| Immigration Origin | # Population | % Population |
| Asia | 123 | 2.7% |
| Caribbean | 8 | 0.2% |
| Central America | 71 | 1.6% |
| Colombia | 41 | 0.9% |
| Eastern Asia | 15 | 0.3% |
| Eastern Europe | 11 | 0.3% |
| Ecuador | 24 | 0.5% |
| Europe | 11 | 0.3% |
| Honduras | 29 | 0.6% |
| Jamaica | 8 | 0.2% |
| Japan | 15 | 0.3% |
| Latin America | 144 | 3.2% |
| Mexico | 42 | 0.9% |
| Russia | 11 | 0.3% |
| South America | 65 | 1.5% |
| South Eastern Asia | 108 | 2.4% |
| Vietnam | 108 | 2.4% | View All 17 Rows |
Sex and Age in Ranlo
Sex and Age in Ranlo
The most populous age groups in Ranlo are 35 to 39 Years (236 | 11.4%) for men and 10 to 14 Years (345 | 14.2%) for women.
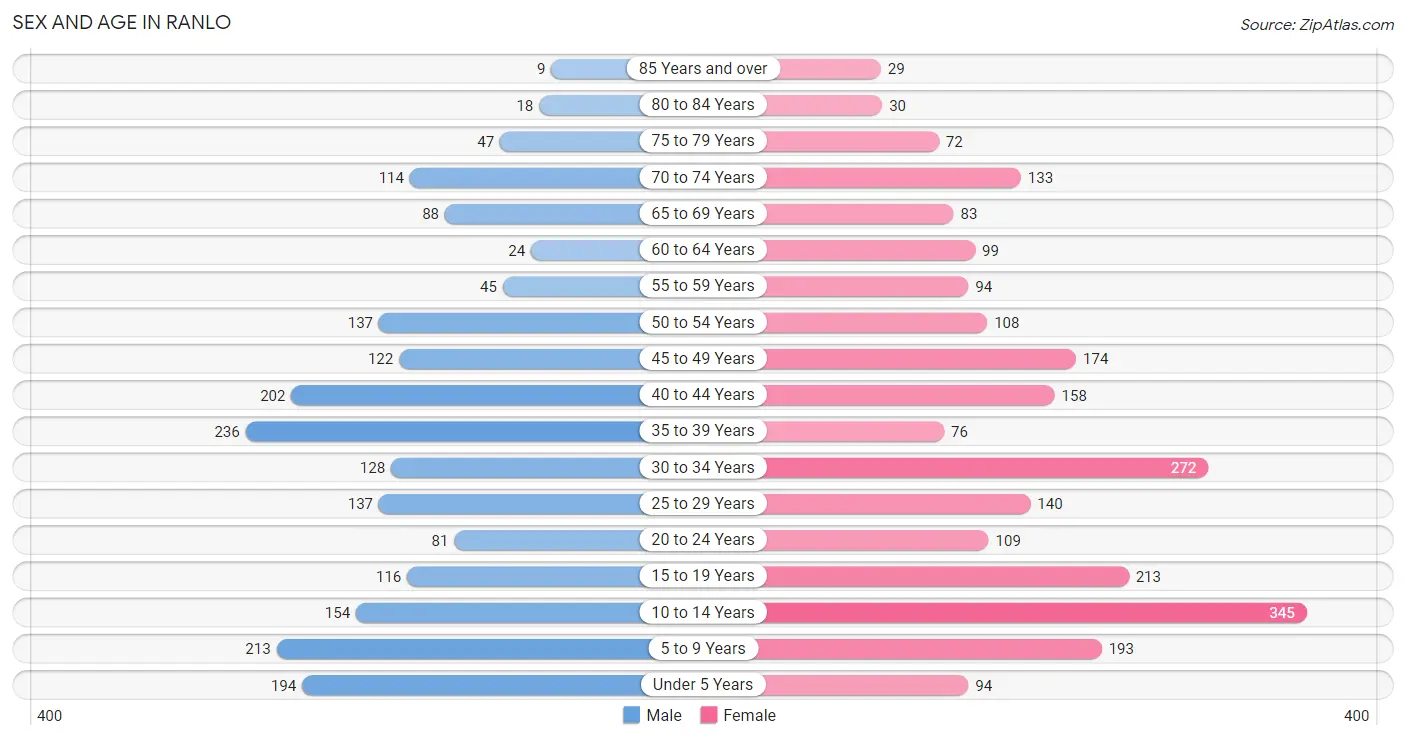
| Age Bracket | Male | Female |
| Under 5 Years | 194 (9.4%) | 94 (3.9%) |
| 5 to 9 Years | 213 (10.3%) | 193 (8.0%) |
| 10 to 14 Years | 154 (7.5%) | 345 (14.2%) |
| 15 to 19 Years | 116 (5.6%) | 213 (8.8%) |
| 20 to 24 Years | 81 (3.9%) | 109 (4.5%) |
| 25 to 29 Years | 137 (6.6%) | 140 (5.8%) |
| 30 to 34 Years | 128 (6.2%) | 272 (11.2%) |
| 35 to 39 Years | 236 (11.4%) | 76 (3.1%) |
| 40 to 44 Years | 202 (9.8%) | 158 (6.5%) |
| 45 to 49 Years | 122 (5.9%) | 174 (7.2%) |
| 50 to 54 Years | 137 (6.6%) | 108 (4.5%) |
| 55 to 59 Years | 45 (2.2%) | 94 (3.9%) |
| 60 to 64 Years | 24 (1.2%) | 99 (4.1%) |
| 65 to 69 Years | 88 (4.3%) | 83 (3.4%) |
| 70 to 74 Years | 114 (5.5%) | 133 (5.5%) |
| 75 to 79 Years | 47 (2.3%) | 72 (3.0%) |
| 80 to 84 Years | 18 (0.9%) | 30 (1.2%) |
| 85 Years and over | 9 (0.4%) | 29 (1.2%) |
| Total | 2,065 (100.0%) | 2,422 (100.0%) |
Families and Households in Ranlo
Median Family Size in Ranlo
The median family size in Ranlo is 3.17 persons per family, with single male/father families (42 | 3.3%) accounting for the largest median family size of 4.24 persons per family. On the other hand, single female/mother families (323 | 25.4%) represent the smallest median family size with 2.89 persons per family.
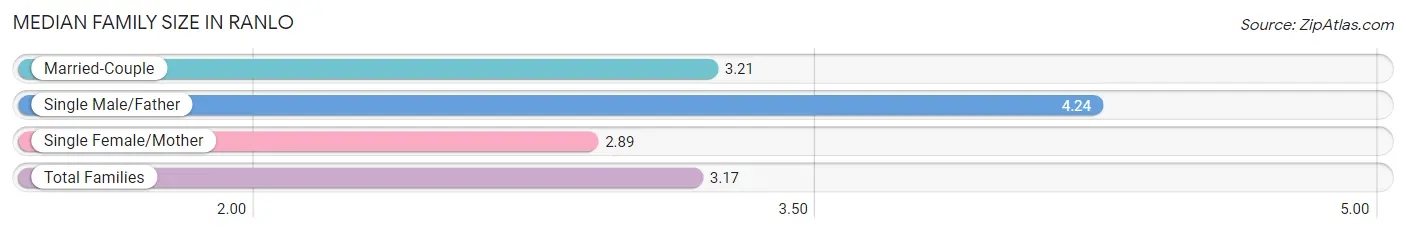
| Family Type | # Families | Family Size |
| Married-Couple | 905 (71.3%) | 3.21 |
| Single Male/Father | 42 (3.3%) | 4.24 |
| Single Female/Mother | 323 (25.4%) | 2.89 |
| Total Families | 1,270 (100.0%) | 3.17 |
Median Household Size in Ranlo
The median household size in Ranlo is 2.81 persons per household, with single male/father households (42 | 2.6%) accounting for the largest median household size of 4.24 persons per household. non-family households (321 | 20.2%) represent the smallest median household size with 1.16 persons per household.
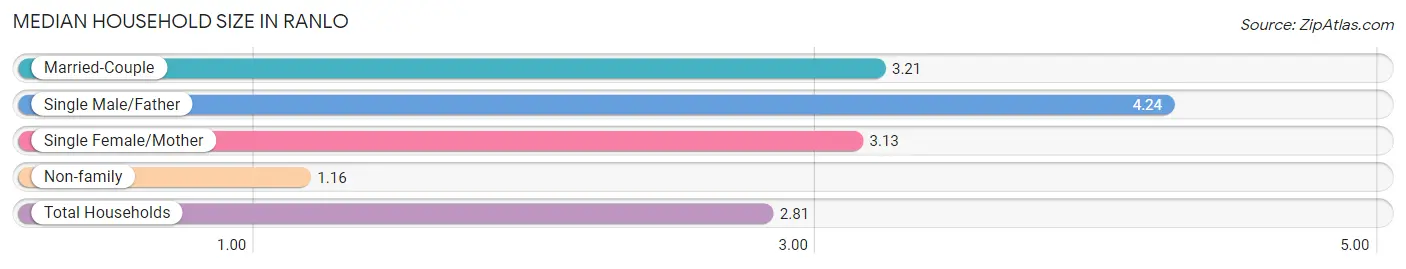
| Household Type | # Households | Household Size |
| Married-Couple | 905 (56.9%) | 3.21 |
| Single Male/Father | 42 (2.6%) | 4.24 |
| Single Female/Mother | 323 (20.3%) | 3.13 |
| Non-family | 321 (20.2%) | 1.16 |
| Total Households | 1,591 (100.0%) | 2.81 |
Household Size by Marriage Status in Ranlo
Out of a total of 1,591 households in Ranlo, 1,270 (79.8%) are family households, while 321 (20.2%) are nonfamily households. The most numerous type of family households are 2-person households, comprising 642, and the most common type of nonfamily households are 1-person households, comprising 286.
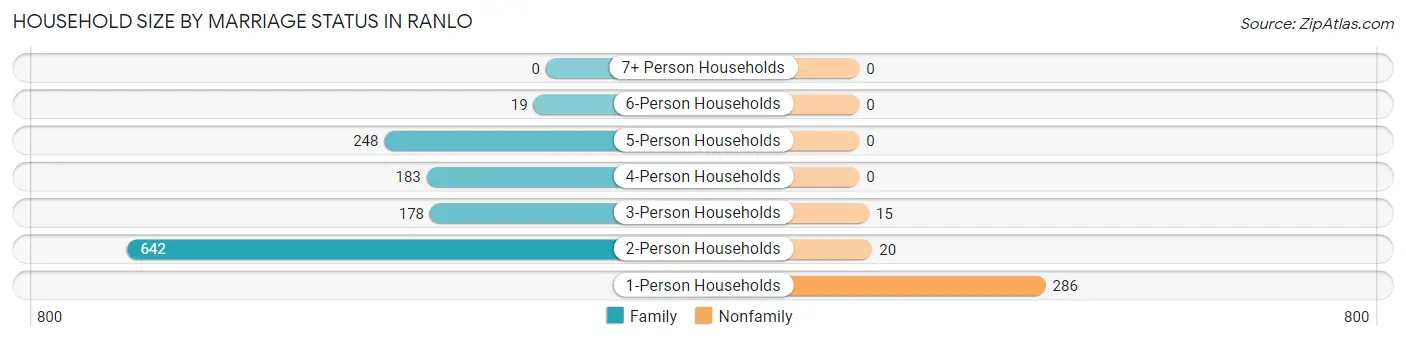
| Household Size | Family Households | Nonfamily Households |
| 1-Person Households | - | 286 (18.0%) |
| 2-Person Households | 642 (40.4%) | 20 (1.3%) |
| 3-Person Households | 178 (11.2%) | 15 (0.9%) |
| 4-Person Households | 183 (11.5%) | 0 (0.0%) |
| 5-Person Households | 248 (15.6%) | 0 (0.0%) |
| 6-Person Households | 19 (1.2%) | 0 (0.0%) |
| 7+ Person Households | 0 (0.0%) | 0 (0.0%) |
| Total | 1,270 (79.8%) | 321 (20.2%) |
Female Fertility in Ranlo
Fertility by Age in Ranlo
Average fertility rate in Ranlo is 48.0 births per 1,000 women. Women in the age bracket of 20 to 34 years have the highest fertility rate with 106.0 births per 1,000 women. Women in the age bracket of 20 to 34 years acount for 98.2% of all women with births.
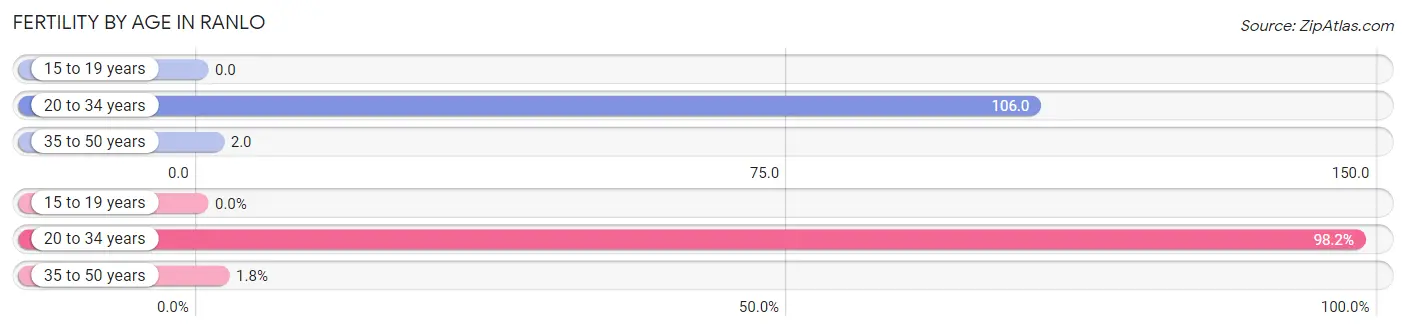
| Age Bracket | Women with Births | Births / 1,000 Women |
| 15 to 19 years | 0 (0.0%) | 0.0 |
| 20 to 34 years | 55 (98.2%) | 106.0 |
| 35 to 50 years | 1 (1.8%) | 2.0 |
| Total | 56 (100.0%) | 48.0 |
Fertility by Age by Marriage Status in Ranlo
98.2% of women with births (56) in Ranlo are married. The highest percentage of unmarried women with births falls into 35 to 50 years age bracket with 100.0% of them unmarried at the time of birth, while the lowest percentage of unmarried women with births belong to 20 to 34 years age bracket with 0.0% of them unmarried.
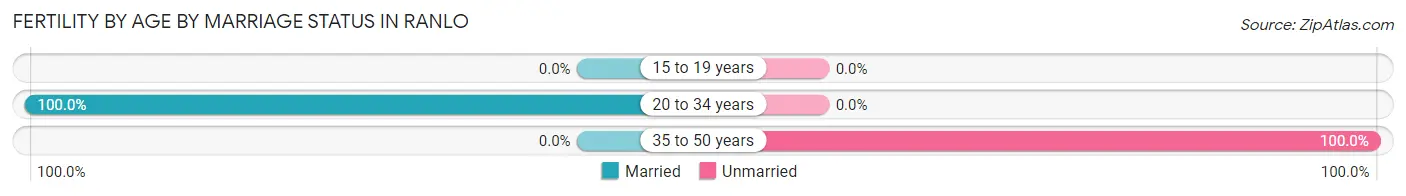
| Age Bracket | Married | Unmarried |
| 15 to 19 years | 0 (0.0%) | 0 (0.0%) |
| 20 to 34 years | 55 (100.0%) | 0 (0.0%) |
| 35 to 50 years | 0 (0.0%) | 1 (100.0%) |
| Total | 55 (98.2%) | 1 (1.8%) |
Fertility by Education in Ranlo
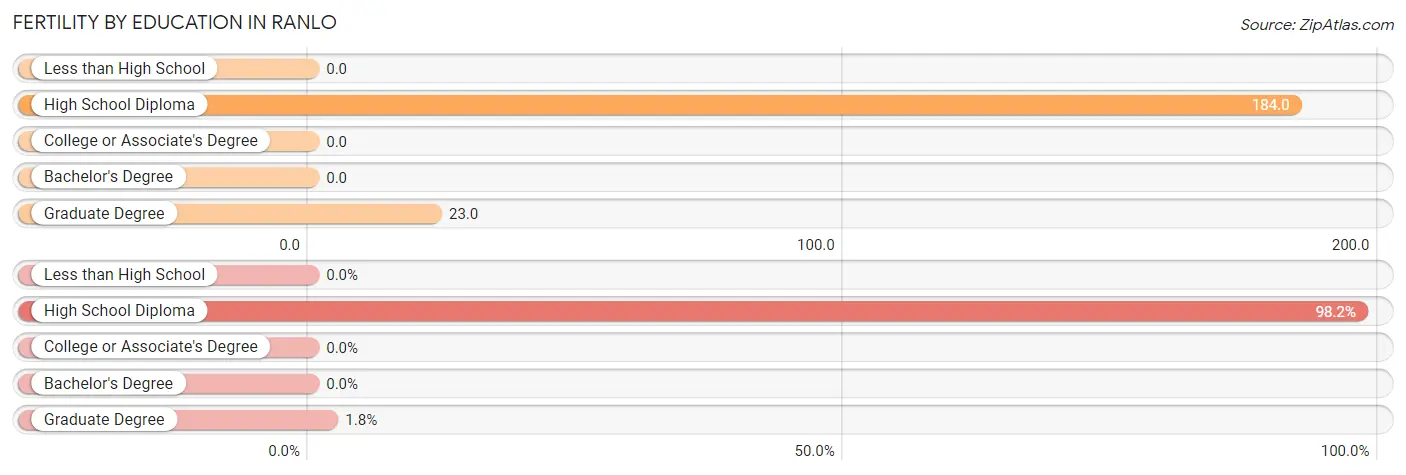
| Educational Attainment | Women with Births | Births / 1,000 Women |
| Less than High School | 0 (0.0%) | 0.0 |
| High School Diploma | 55 (98.2%) | 184.0 |
| College or Associate's Degree | 0 (0.0%) | 0.0 |
| Bachelor's Degree | 0 (0.0%) | 0.0 |
| Graduate Degree | 1 (1.8%) | 23.0 |
| Total | 56 (100.0%) | 48.0 |
Fertility by Education by Marriage Status in Ranlo
1.8% of women with births in Ranlo are unmarried. Women with the educational attainment of high school diploma are most likely to be married with 100.0% of them married at childbirth, while women with the educational attainment of graduate degree are least likely to be married with 100.0% of them unmarried at childbirth.
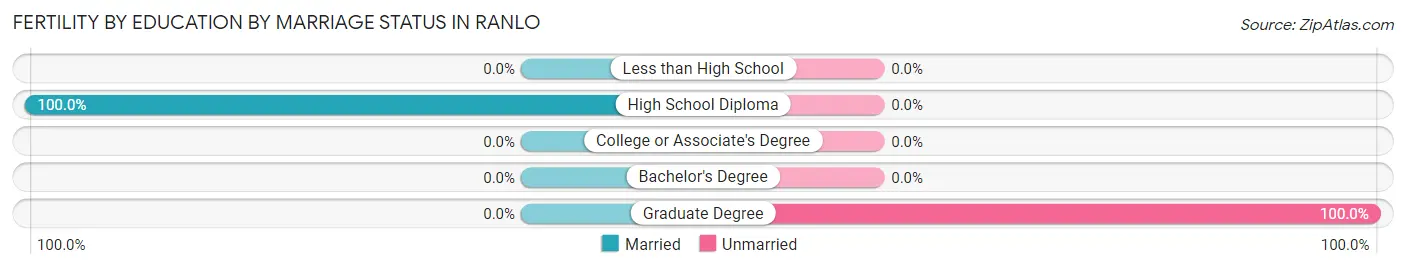
| Educational Attainment | Married | Unmarried |
| Less than High School | 0 (0.0%) | 0 (0.0%) |
| High School Diploma | 55 (100.0%) | 0 (0.0%) |
| College or Associate's Degree | 0 (0.0%) | 0 (0.0%) |
| Bachelor's Degree | 0 (0.0%) | 0 (0.0%) |
| Graduate Degree | 0 (0.0%) | 1 (100.0%) |
| Total | 55 (98.2%) | 1 (1.8%) |
Employment Characteristics in Ranlo
Employment by Class of Employer in Ranlo
Among the 1,963 employed individuals in Ranlo, private company employees (1,529 | 77.9%), local government employees (201 | 10.2%), and not-for-profit organizations (130 | 6.6%) make up the most common classes of employment.
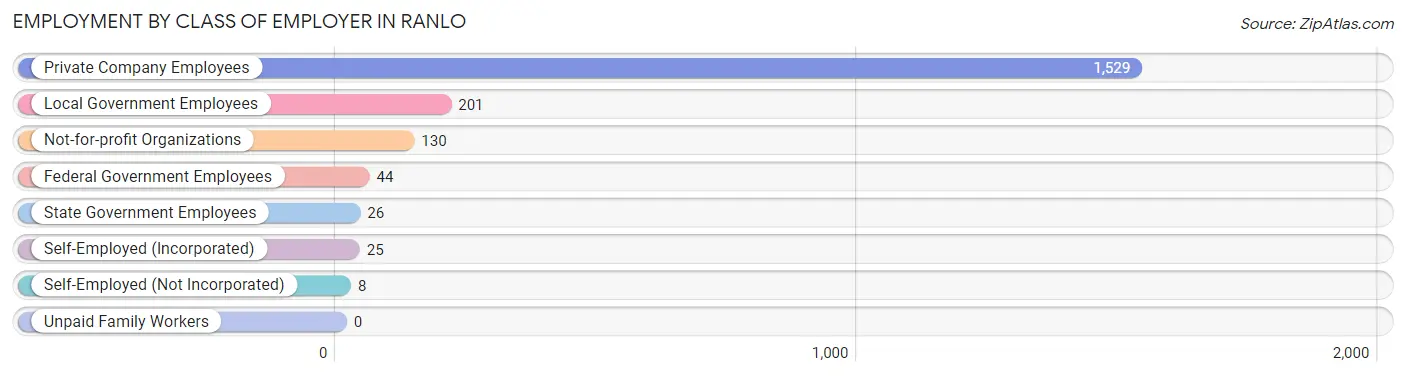
| Employer Class | # Employees | % Employees |
| Private Company Employees | 1,529 | 77.9% |
| Self-Employed (Incorporated) | 25 | 1.3% |
| Self-Employed (Not Incorporated) | 8 | 0.4% |
| Not-for-profit Organizations | 130 | 6.6% |
| Local Government Employees | 201 | 10.2% |
| State Government Employees | 26 | 1.3% |
| Federal Government Employees | 44 | 2.2% |
| Unpaid Family Workers | 0 | 0.0% |
| Total | 1,963 | 100.0% |
Employment Status by Age in Ranlo
According to the labor force statistics for Ranlo, out of the total population over 16 years of age (3,277), 65.2% or 2,137 individuals are in the labor force, with 7.3% or 156 of them unemployed. The age group with the highest labor force participation rate is 30 to 34 years, with 96.3% or 385 individuals in the labor force. Within the labor force, the 20 to 24 years age range has the highest percentage of unemployed individuals, with 44.0% or 74 of them being unemployed.
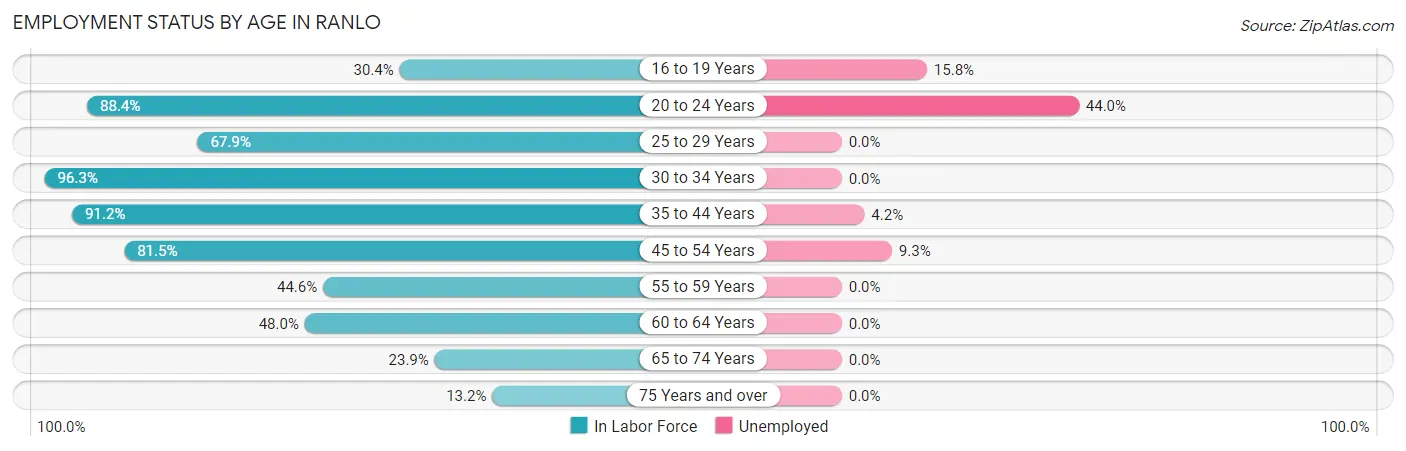
| Age Bracket | In Labor Force | Unemployed |
| 16 to 19 Years | 95 (30.4%) | 15 (15.8%) |
| 20 to 24 Years | 168 (88.4%) | 74 (44.0%) |
| 25 to 29 Years | 188 (67.9%) | 0 (0.0%) |
| 30 to 34 Years | 385 (96.3%) | 0 (0.0%) |
| 35 to 44 Years | 613 (91.2%) | 26 (4.2%) |
| 45 to 54 Years | 441 (81.5%) | 41 (9.3%) |
| 55 to 59 Years | 62 (44.6%) | 0 (0.0%) |
| 60 to 64 Years | 59 (48.0%) | 0 (0.0%) |
| 65 to 74 Years | 100 (23.9%) | 0 (0.0%) |
| 75 Years and over | 27 (13.2%) | 0 (0.0%) |
| Total | 2,137 (65.2%) | 156 (7.3%) |
Employment Status by Educational Attainment in Ranlo
According to labor force statistics for Ranlo, 81.2% of individuals (1,747) out of the total population between 25 and 64 years of age (2,152) are in the labor force, with 3.8% or 66 of them being unemployed. The group with the highest labor force participation rate are those with the educational attainment of bachelor's degree or higher, with 93.3% or 406 individuals in the labor force. Within the labor force, individuals with less than high school education have the highest percentage of unemployment, with 25.5% or 24 of them being unemployed.
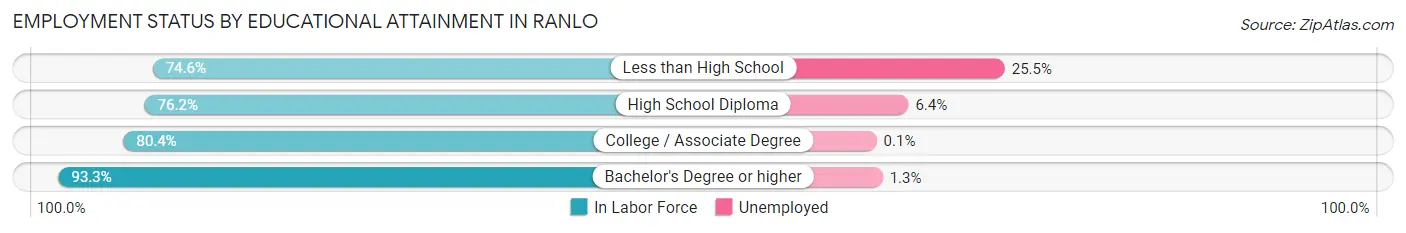
| Educational Attainment | In Labor Force | Unemployed |
| Less than High School | 94 (74.6%) | 32 (25.5%) |
| High School Diploma | 563 (76.2%) | 47 (6.4%) |
| College / Associate Degree | 685 (80.4%) | 1 (0.1%) |
| Bachelor's Degree or higher | 406 (93.3%) | 6 (1.3%) |
| Total | 1,747 (81.2%) | 82 (3.8%) |
Employment Occupations by Sex in Ranlo
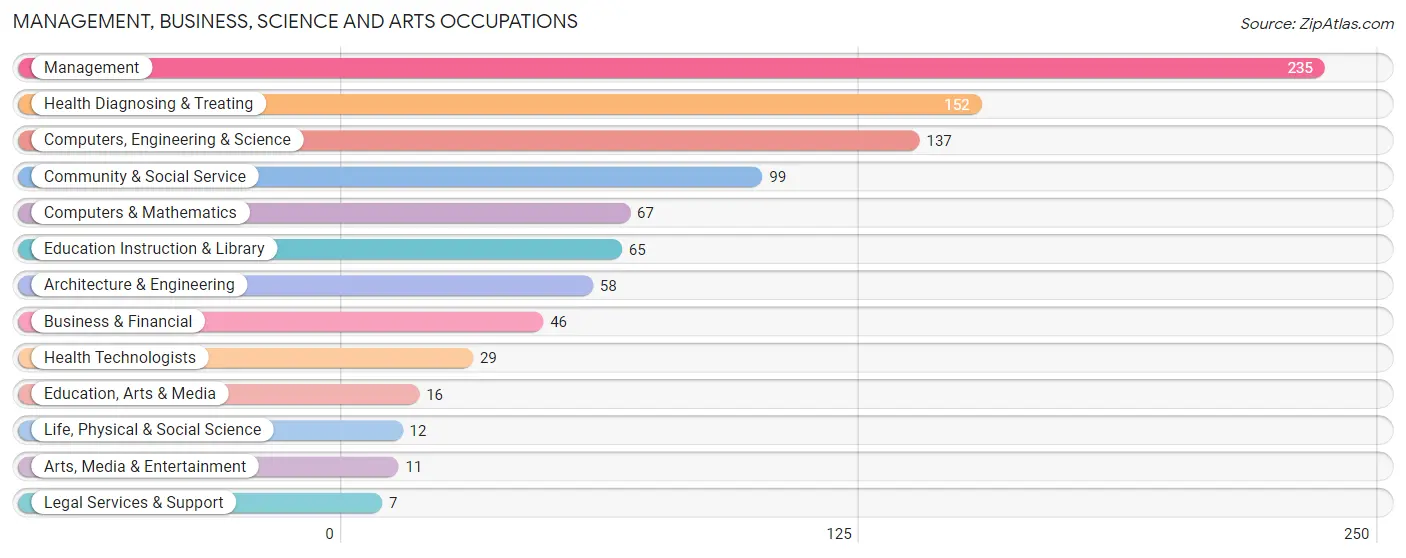
Management, Business, Science and Arts Occupations
The most common Management, Business, Science and Arts occupations in Ranlo are Management (235 | 11.9%), Health Diagnosing & Treating (152 | 7.7%), Computers, Engineering & Science (137 | 7.0%), Community & Social Service (99 | 5.0%), and Computers & Mathematics (67 | 3.4%).
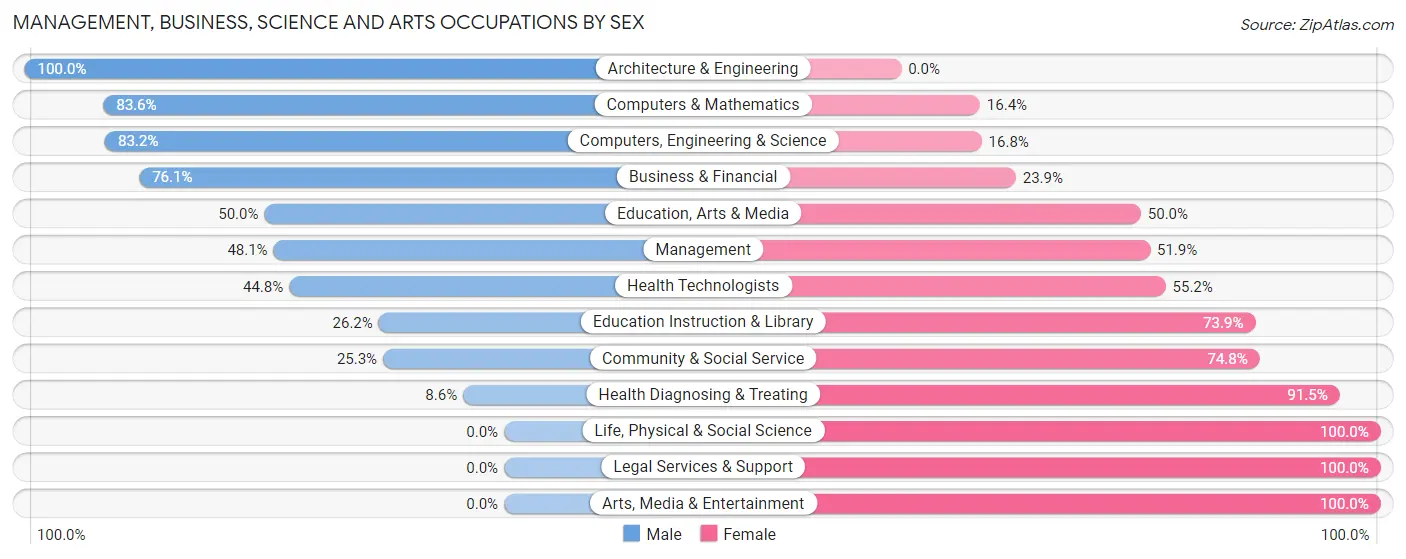
Management, Business, Science and Arts Occupations by Sex
Within the Management, Business, Science and Arts occupations in Ranlo, the most male-oriented occupations are Architecture & Engineering (100.0%), Computers & Mathematics (83.6%), and Computers, Engineering & Science (83.2%), while the most female-oriented occupations are Life, Physical & Social Science (100.0%), Legal Services & Support (100.0%), and Arts, Media & Entertainment (100.0%).
| Occupation | Male | Female |
| Management | 113 (48.1%) | 122 (51.9%) |
| Business & Financial | 35 (76.1%) | 11 (23.9%) |
| Computers, Engineering & Science | 114 (83.2%) | 23 (16.8%) |
| Computers & Mathematics | 56 (83.6%) | 11 (16.4%) |
| Architecture & Engineering | 58 (100.0%) | 0 (0.0%) |
| Life, Physical & Social Science | 0 (0.0%) | 12 (100.0%) |
| Community & Social Service | 25 (25.3%) | 74 (74.8%) |
| Education, Arts & Media | 8 (50.0%) | 8 (50.0%) |
| Legal Services & Support | 0 (0.0%) | 7 (100.0%) |
| Education Instruction & Library | 17 (26.2%) | 48 (73.9%) |
| Arts, Media & Entertainment | 0 (0.0%) | 11 (100.0%) |
| Health Diagnosing & Treating | 13 (8.6%) | 139 (91.4%) |
| Health Technologists | 13 (44.8%) | 16 (55.2%) |
| Total (Category) | 300 (44.8%) | 369 (55.2%) |
| Total (Overall) | 1,073 (54.5%) | 894 (45.5%) |
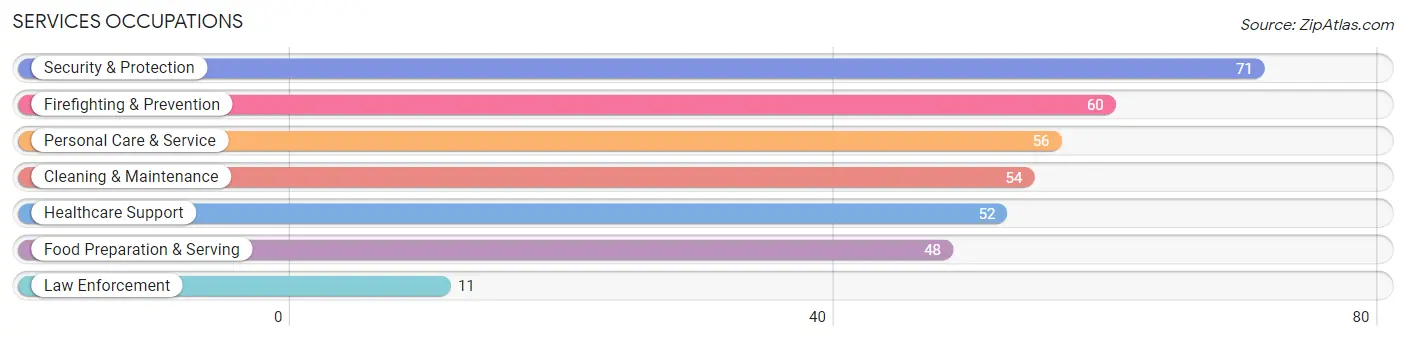
Services Occupations
The most common Services occupations in Ranlo are Security & Protection (71 | 3.6%), Firefighting & Prevention (60 | 3.0%), Personal Care & Service (56 | 2.9%), Cleaning & Maintenance (54 | 2.8%), and Healthcare Support (52 | 2.6%).
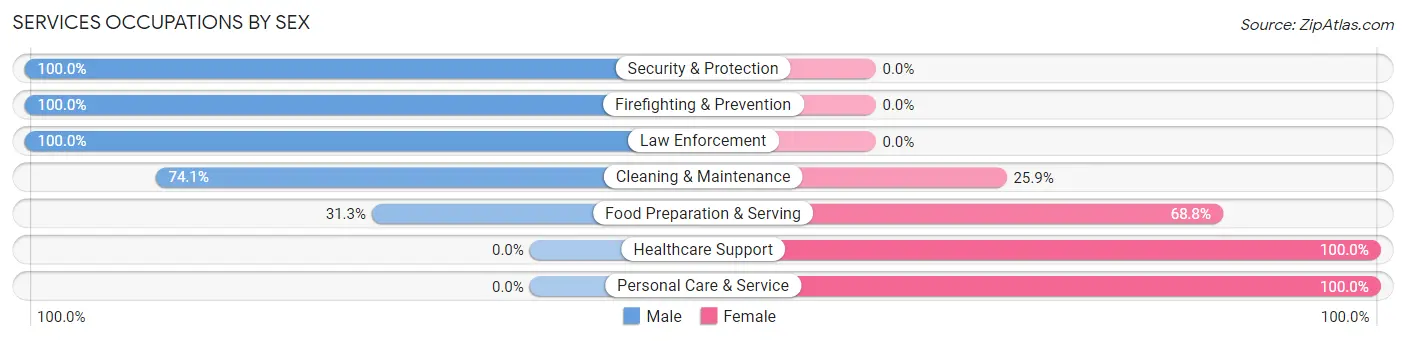
Services Occupations by Sex
Within the Services occupations in Ranlo, the most male-oriented occupations are Security & Protection (100.0%), Firefighting & Prevention (100.0%), and Law Enforcement (100.0%), while the most female-oriented occupations are Healthcare Support (100.0%), Personal Care & Service (100.0%), and Food Preparation & Serving (68.8%).
| Occupation | Male | Female |
| Healthcare Support | 0 (0.0%) | 52 (100.0%) |
| Security & Protection | 71 (100.0%) | 0 (0.0%) |
| Firefighting & Prevention | 60 (100.0%) | 0 (0.0%) |
| Law Enforcement | 11 (100.0%) | 0 (0.0%) |
| Food Preparation & Serving | 15 (31.2%) | 33 (68.8%) |
| Cleaning & Maintenance | 40 (74.1%) | 14 (25.9%) |
| Personal Care & Service | 0 (0.0%) | 56 (100.0%) |
| Total (Category) | 126 (44.8%) | 155 (55.2%) |
| Total (Overall) | 1,073 (54.5%) | 894 (45.5%) |
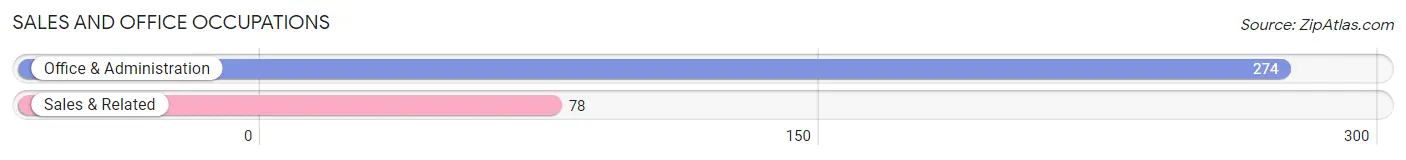
Sales and Office Occupations
The most common Sales and Office occupations in Ranlo are Office & Administration (274 | 13.9%), and Sales & Related (78 | 4.0%).
Sales and Office Occupations by Sex
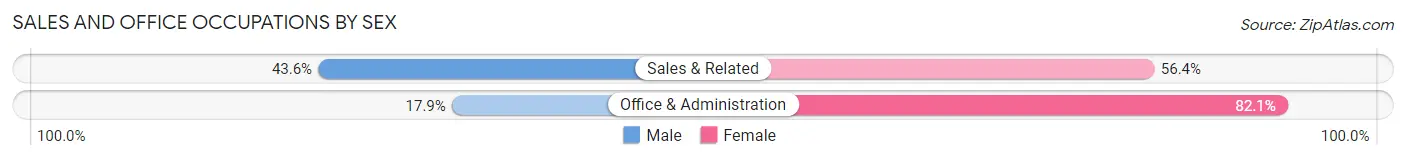
| Occupation | Male | Female |
| Sales & Related | 34 (43.6%) | 44 (56.4%) |
| Office & Administration | 49 (17.9%) | 225 (82.1%) |
| Total (Category) | 83 (23.6%) | 269 (76.4%) |
| Total (Overall) | 1,073 (54.5%) | 894 (45.5%) |
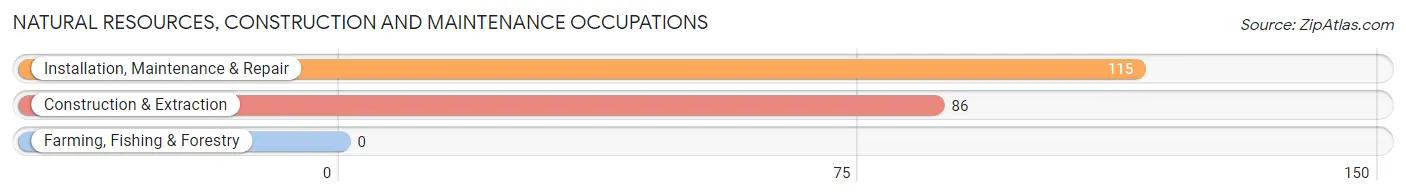
Natural Resources, Construction and Maintenance Occupations
The most common Natural Resources, Construction and Maintenance occupations in Ranlo are Installation, Maintenance & Repair (115 | 5.9%), and Construction & Extraction (86 | 4.4%).
Natural Resources, Construction and Maintenance Occupations by Sex
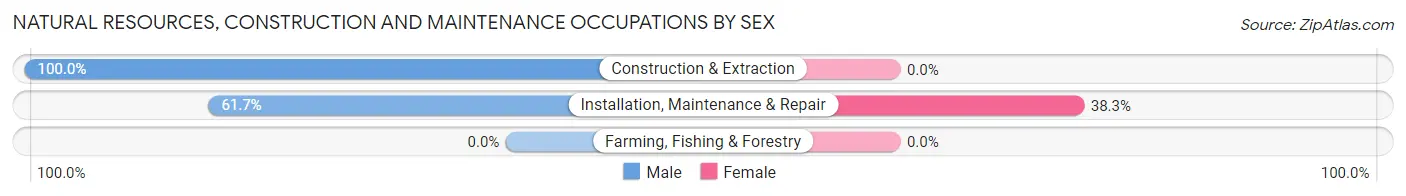
| Occupation | Male | Female |
| Farming, Fishing & Forestry | 0 (0.0%) | 0 (0.0%) |
| Construction & Extraction | 86 (100.0%) | 0 (0.0%) |
| Installation, Maintenance & Repair | 71 (61.7%) | 44 (38.3%) |
| Total (Category) | 157 (78.1%) | 44 (21.9%) |
| Total (Overall) | 1,073 (54.5%) | 894 (45.5%) |
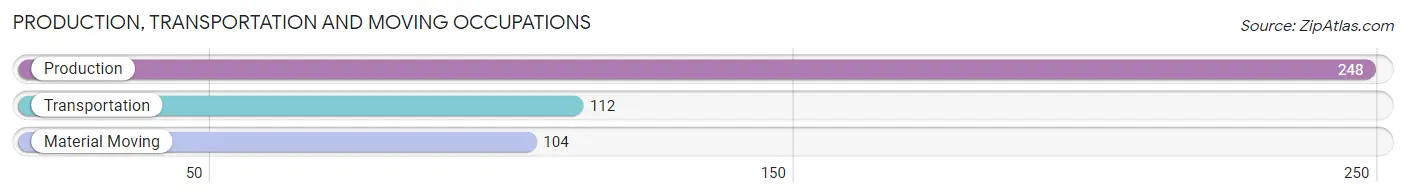
Production, Transportation and Moving Occupations
The most common Production, Transportation and Moving occupations in Ranlo are Production (248 | 12.6%), Transportation (112 | 5.7%), and Material Moving (104 | 5.3%).
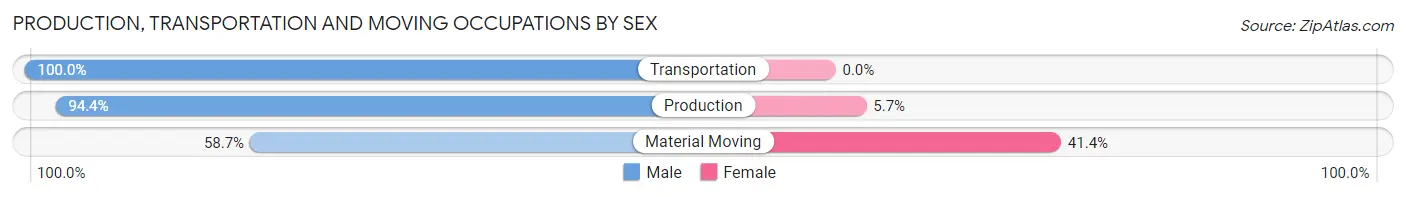
Production, Transportation and Moving Occupations by Sex
| Occupation | Male | Female |
| Production | 234 (94.4%) | 14 (5.7%) |
| Transportation | 112 (100.0%) | 0 (0.0%) |
| Material Moving | 61 (58.7%) | 43 (41.3%) |
| Total (Category) | 407 (87.7%) | 57 (12.3%) |
| Total (Overall) | 1,073 (54.5%) | 894 (45.5%) |
Employment Industries by Sex in Ranlo
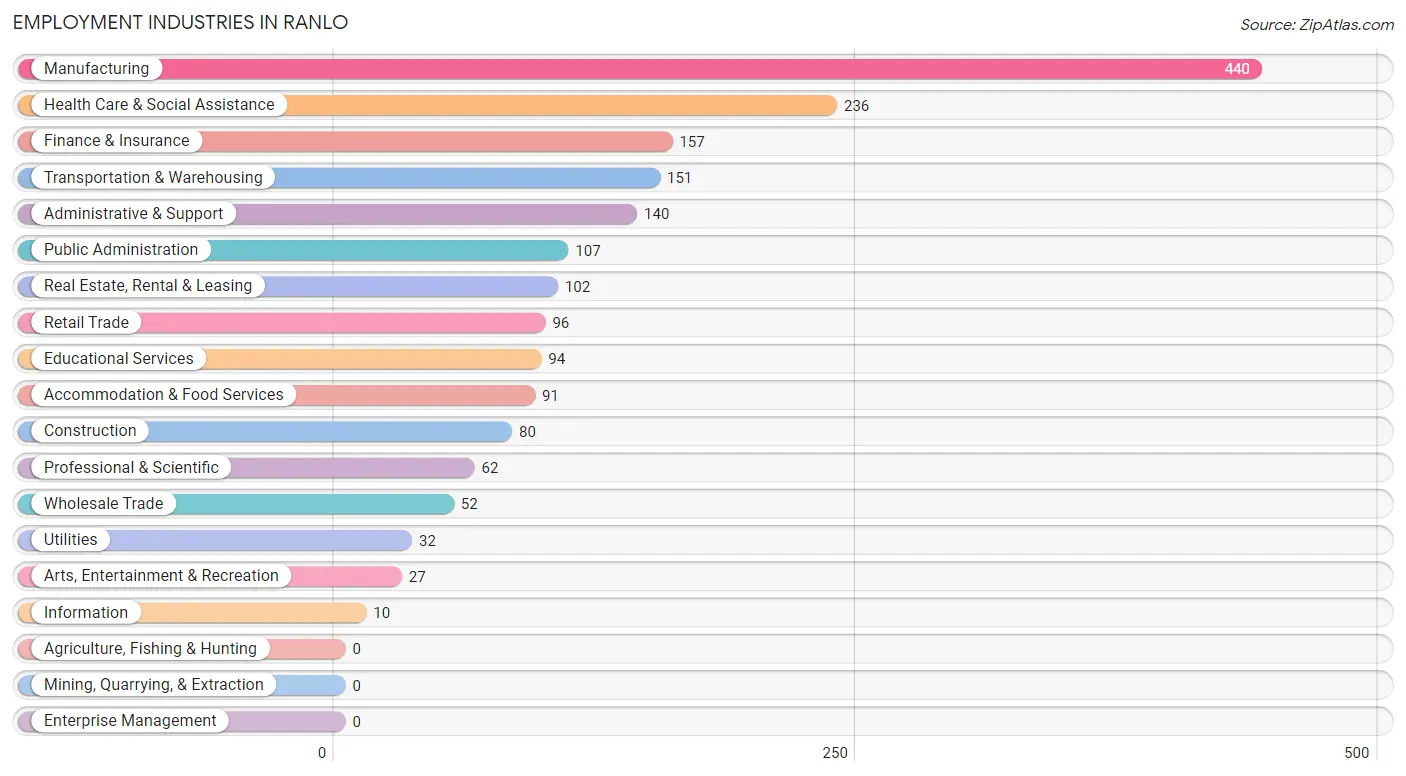
Employment Industries in Ranlo
The major employment industries in Ranlo include Manufacturing (440 | 22.4%), Health Care & Social Assistance (236 | 12.0%), Finance & Insurance (157 | 8.0%), Transportation & Warehousing (151 | 7.7%), and Administrative & Support (140 | 7.1%).
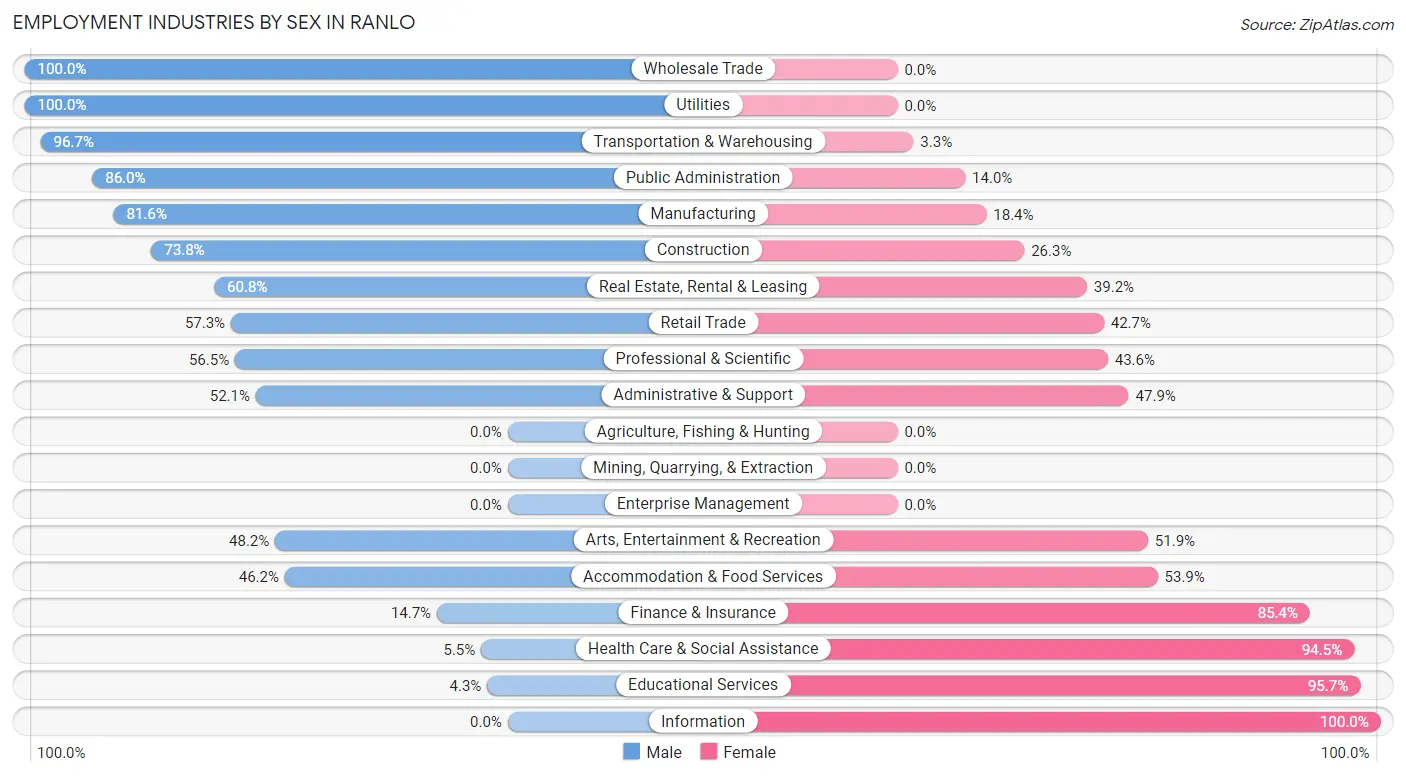
Employment Industries by Sex in Ranlo
The Ranlo industries that see more men than women are Wholesale Trade (100.0%), Utilities (100.0%), and Transportation & Warehousing (96.7%), whereas the industries that tend to have a higher number of women are Information (100.0%), Educational Services (95.7%), and Health Care & Social Assistance (94.5%).
| Industry | Male | Female |
| Agriculture, Fishing & Hunting | 0 (0.0%) | 0 (0.0%) |
| Mining, Quarrying, & Extraction | 0 (0.0%) | 0 (0.0%) |
| Construction | 59 (73.8%) | 21 (26.3%) |
| Manufacturing | 359 (81.6%) | 81 (18.4%) |
| Wholesale Trade | 52 (100.0%) | 0 (0.0%) |
| Retail Trade | 55 (57.3%) | 41 (42.7%) |
| Transportation & Warehousing | 146 (96.7%) | 5 (3.3%) |
| Utilities | 32 (100.0%) | 0 (0.0%) |
| Information | 0 (0.0%) | 10 (100.0%) |
| Finance & Insurance | 23 (14.6%) | 134 (85.4%) |
| Real Estate, Rental & Leasing | 62 (60.8%) | 40 (39.2%) |
| Professional & Scientific | 35 (56.5%) | 27 (43.5%) |
| Enterprise Management | 0 (0.0%) | 0 (0.0%) |
| Administrative & Support | 73 (52.1%) | 67 (47.9%) |
| Educational Services | 4 (4.3%) | 90 (95.7%) |
| Health Care & Social Assistance | 13 (5.5%) | 223 (94.5%) |
| Arts, Entertainment & Recreation | 13 (48.1%) | 14 (51.8%) |
| Accommodation & Food Services | 42 (46.2%) | 49 (53.8%) |
| Public Administration | 92 (86.0%) | 15 (14.0%) |
| Total | 1,073 (54.5%) | 894 (45.5%) |
Education in Ranlo
School Enrollment in Ranlo
The most common levels of schooling among the 1,192 students in Ranlo are middle school (415 | 34.8%), elementary school (278 | 23.3%), and high school (257 | 21.6%).
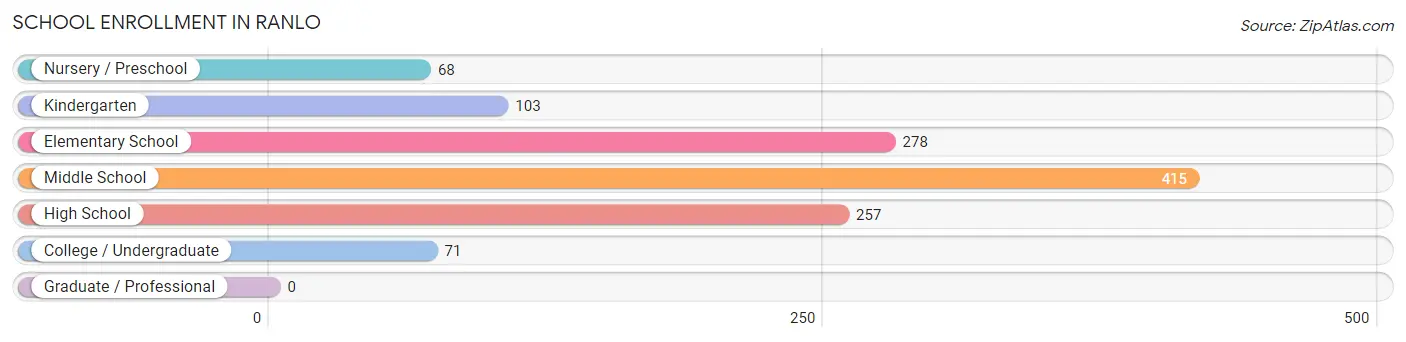
| School Level | # Students | % Students |
| Nursery / Preschool | 68 | 5.7% |
| Kindergarten | 103 | 8.6% |
| Elementary School | 278 | 23.3% |
| Middle School | 415 | 34.8% |
| High School | 257 | 21.6% |
| College / Undergraduate | 71 | 6.0% |
| Graduate / Professional | 0 | 0.0% |
| Total | 1,192 | 100.0% |
School Enrollment by Age by Funding Source in Ranlo
Out of a total of 1,192 students who are enrolled in schools in Ranlo, 212 (17.8%) attend a private institution, while the remaining 980 (82.2%) are enrolled in public schools. The age group of 35 years and over has the highest likelihood of being enrolled in private schools, with 26 (65.0% in the age bracket) enrolled. Conversely, the age group of 3 to 4 year olds has the lowest likelihood of being enrolled in a private school, with 14 (100.0% in the age bracket) attending a public institution.
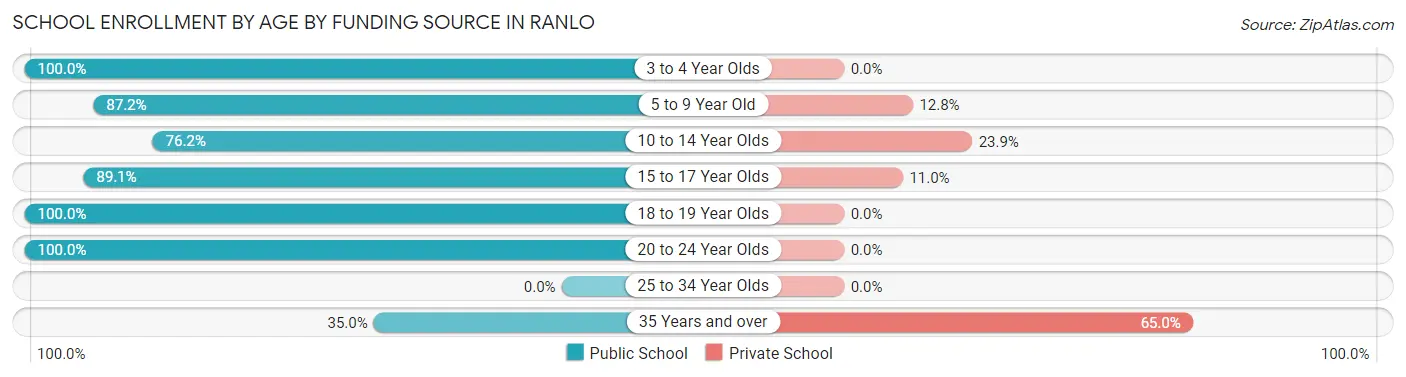
| Age Bracket | Public School | Private School |
| 3 to 4 Year Olds | 14 (100.0%) | 0 (0.0%) |
| 5 to 9 Year Old | 354 (87.2%) | 52 (12.8%) |
| 10 to 14 Year Olds | 380 (76.1%) | 119 (23.8%) |
| 15 to 17 Year Olds | 122 (89.0%) | 15 (11.0%) |
| 18 to 19 Year Olds | 79 (100.0%) | 0 (0.0%) |
| 20 to 24 Year Olds | 17 (100.0%) | 0 (0.0%) |
| 25 to 34 Year Olds | 0 (0.0%) | 0 (0.0%) |
| 35 Years and over | 14 (35.0%) | 26 (65.0%) |
| Total | 980 (82.2%) | 212 (17.8%) |
Educational Attainment by Field of Study in Ranlo
Business (160 | 30.7%), education (115 | 22.1%), psychology (53 | 10.2%), arts & humanities (42 | 8.1%), and literature & languages (36 | 6.9%) are the most common fields of study among 521 individuals in Ranlo who have obtained a bachelor's degree or higher.
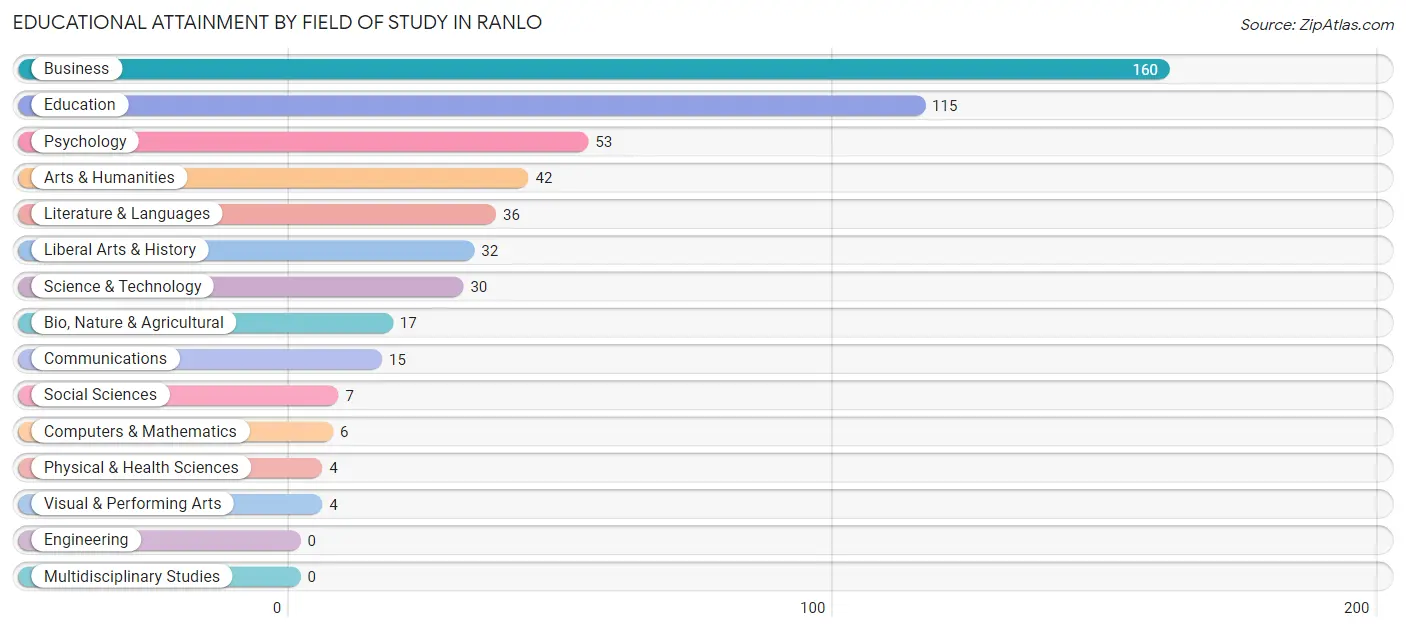
| Field of Study | # Graduates | % Graduates |
| Computers & Mathematics | 6 | 1.1% |
| Bio, Nature & Agricultural | 17 | 3.3% |
| Physical & Health Sciences | 4 | 0.8% |
| Psychology | 53 | 10.2% |
| Social Sciences | 7 | 1.3% |
| Engineering | 0 | 0.0% |
| Multidisciplinary Studies | 0 | 0.0% |
| Science & Technology | 30 | 5.8% |
| Business | 160 | 30.7% |
| Education | 115 | 22.1% |
| Literature & Languages | 36 | 6.9% |
| Liberal Arts & History | 32 | 6.1% |
| Visual & Performing Arts | 4 | 0.8% |
| Communications | 15 | 2.9% |
| Arts & Humanities | 42 | 8.1% |
| Total | 521 | 100.0% |
Transportation & Commute in Ranlo
Vehicle Availability by Sex in Ranlo
The most prevalent vehicle ownership categories in Ranlo are males with 2 vehicles (687, accounting for 63.7%) and females with 2 vehicles (535, making up 77.7%).
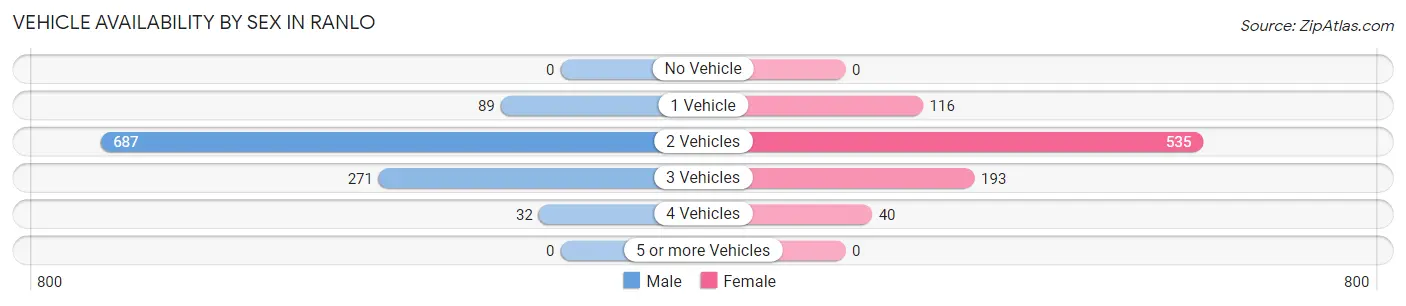
| Vehicles Available | Male | Female |
| No Vehicle | 0 (0.0%) | 0 (0.0%) |
| 1 Vehicle | 89 (8.3%) | 116 (13.1%) |
| 2 Vehicles | 687 (63.7%) | 535 (60.5%) |
| 3 Vehicles | 271 (25.1%) | 193 (21.8%) |
| 4 Vehicles | 32 (3.0%) | 40 (4.5%) |
| 5 or more Vehicles | 0 (0.0%) | 0 (0.0%) |
| Total | 1,079 (100.0%) | 884 (100.0%) |
Commute Time in Ranlo
The most frequently occuring commute durations in Ranlo are 15 to 19 minutes (426 commuters, 23.5%), 10 to 14 minutes (240 commuters, 13.2%), and 30 to 34 minutes (238 commuters, 13.1%).
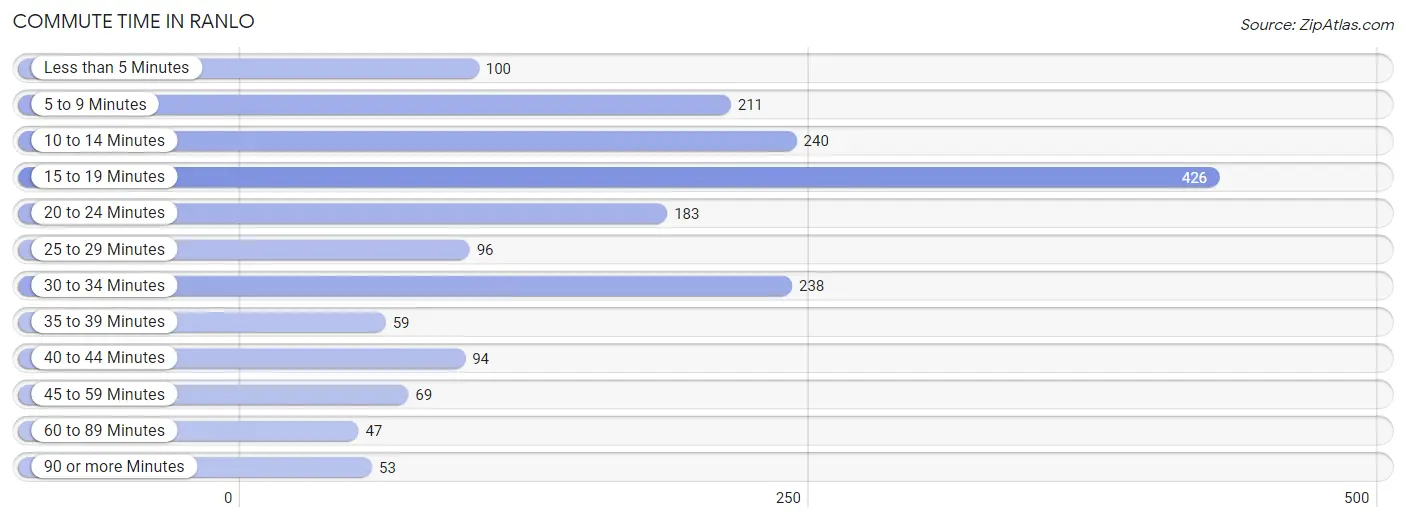
| Commute Time | # Commuters | % Commuters |
| Less than 5 Minutes | 100 | 5.5% |
| 5 to 9 Minutes | 211 | 11.6% |
| 10 to 14 Minutes | 240 | 13.2% |
| 15 to 19 Minutes | 426 | 23.5% |
| 20 to 24 Minutes | 183 | 10.1% |
| 25 to 29 Minutes | 96 | 5.3% |
| 30 to 34 Minutes | 238 | 13.1% |
| 35 to 39 Minutes | 59 | 3.3% |
| 40 to 44 Minutes | 94 | 5.2% |
| 45 to 59 Minutes | 69 | 3.8% |
| 60 to 89 Minutes | 47 | 2.6% |
| 90 or more Minutes | 53 | 2.9% |
Commute Time by Sex in Ranlo
The most common commute times in Ranlo are 15 to 19 minutes (209 commuters, 20.7%) for males and 15 to 19 minutes (217 commuters, 26.8%) for females.
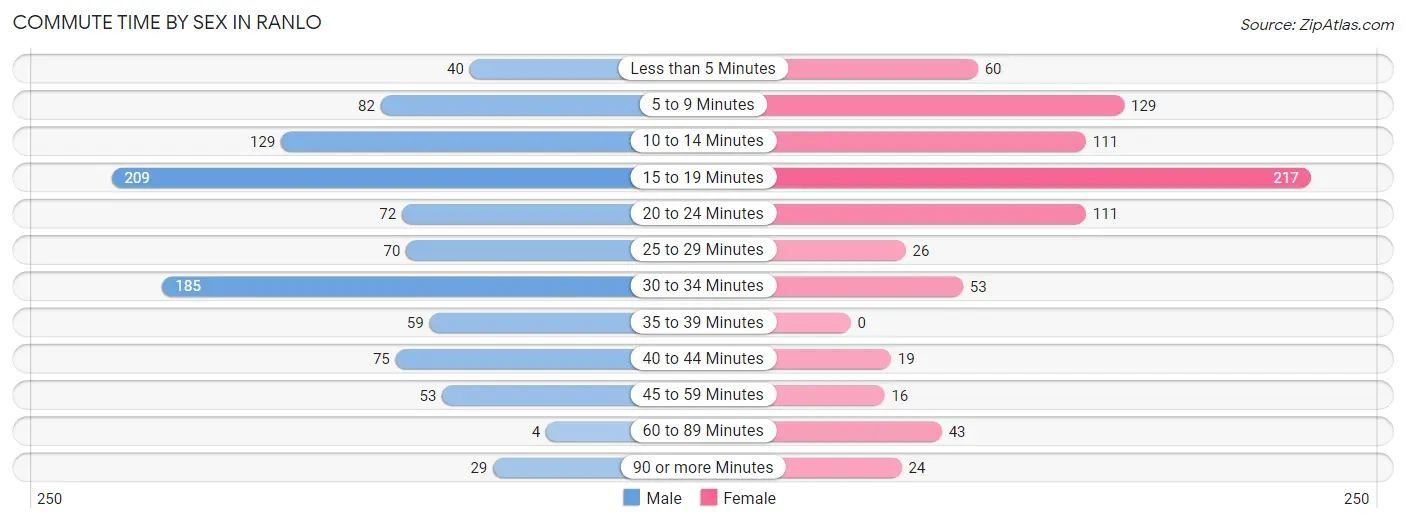
| Commute Time | Male | Female |
| Less than 5 Minutes | 40 (4.0%) | 60 (7.4%) |
| 5 to 9 Minutes | 82 (8.1%) | 129 (16.0%) |
| 10 to 14 Minutes | 129 (12.8%) | 111 (13.7%) |
| 15 to 19 Minutes | 209 (20.7%) | 217 (26.8%) |
| 20 to 24 Minutes | 72 (7.1%) | 111 (13.7%) |
| 25 to 29 Minutes | 70 (7.0%) | 26 (3.2%) |
| 30 to 34 Minutes | 185 (18.4%) | 53 (6.6%) |
| 35 to 39 Minutes | 59 (5.9%) | 0 (0.0%) |
| 40 to 44 Minutes | 75 (7.4%) | 19 (2.4%) |
| 45 to 59 Minutes | 53 (5.3%) | 16 (2.0%) |
| 60 to 89 Minutes | 4 (0.4%) | 43 (5.3%) |
| 90 or more Minutes | 29 (2.9%) | 24 (3.0%) |
Time of Departure to Work by Sex in Ranlo
The most frequent times of departure to work in Ranlo are 6:00 AM to 6:29 AM (209, 20.7%) for males and 7:30 AM to 7:59 AM (204, 25.2%) for females.
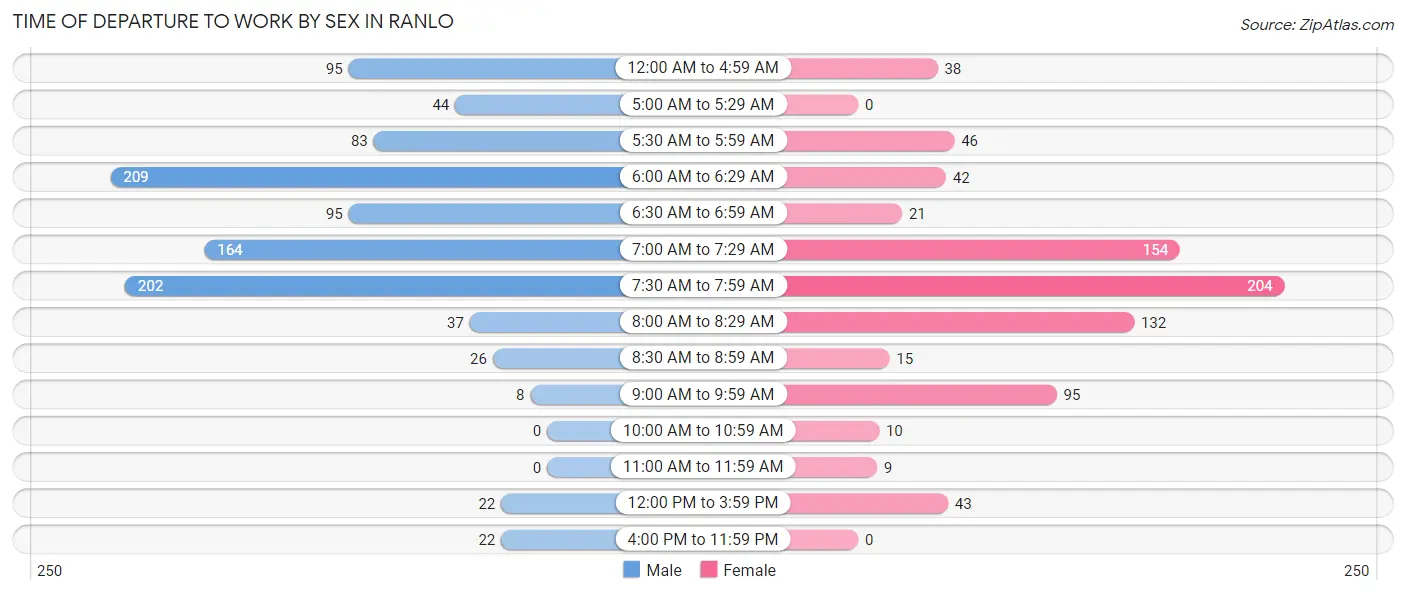
| Time of Departure | Male | Female |
| 12:00 AM to 4:59 AM | 95 (9.4%) | 38 (4.7%) |
| 5:00 AM to 5:29 AM | 44 (4.4%) | 0 (0.0%) |
| 5:30 AM to 5:59 AM | 83 (8.2%) | 46 (5.7%) |
| 6:00 AM to 6:29 AM | 209 (20.7%) | 42 (5.2%) |
| 6:30 AM to 6:59 AM | 95 (9.4%) | 21 (2.6%) |
| 7:00 AM to 7:29 AM | 164 (16.3%) | 154 (19.0%) |
| 7:30 AM to 7:59 AM | 202 (20.1%) | 204 (25.2%) |
| 8:00 AM to 8:29 AM | 37 (3.7%) | 132 (16.3%) |
| 8:30 AM to 8:59 AM | 26 (2.6%) | 15 (1.8%) |
| 9:00 AM to 9:59 AM | 8 (0.8%) | 95 (11.7%) |
| 10:00 AM to 10:59 AM | 0 (0.0%) | 10 (1.2%) |
| 11:00 AM to 11:59 AM | 0 (0.0%) | 9 (1.1%) |
| 12:00 PM to 3:59 PM | 22 (2.2%) | 43 (5.3%) |
| 4:00 PM to 11:59 PM | 22 (2.2%) | 0 (0.0%) |
| Total | 1,007 (100.0%) | 809 (100.0%) |
Housing Occupancy in Ranlo
Occupancy by Ownership in Ranlo
Of the total 1,591 dwellings in Ranlo, owner-occupied units account for 1,107 (69.6%), while renter-occupied units make up 484 (30.4%).
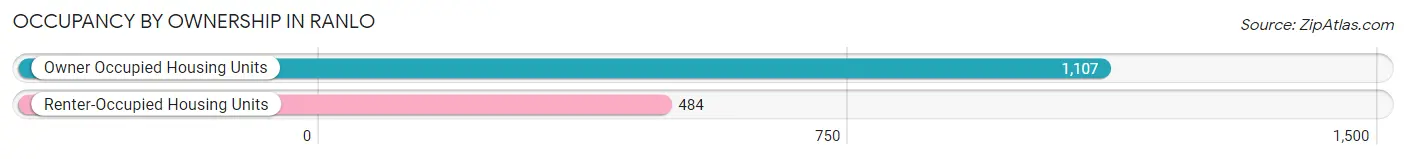
| Occupancy | # Housing Units | % Housing Units |
| Owner Occupied Housing Units | 1,107 | 69.6% |
| Renter-Occupied Housing Units | 484 | 30.4% |
| Total Occupied Housing Units | 1,591 | 100.0% |
Occupancy by Household Size in Ranlo
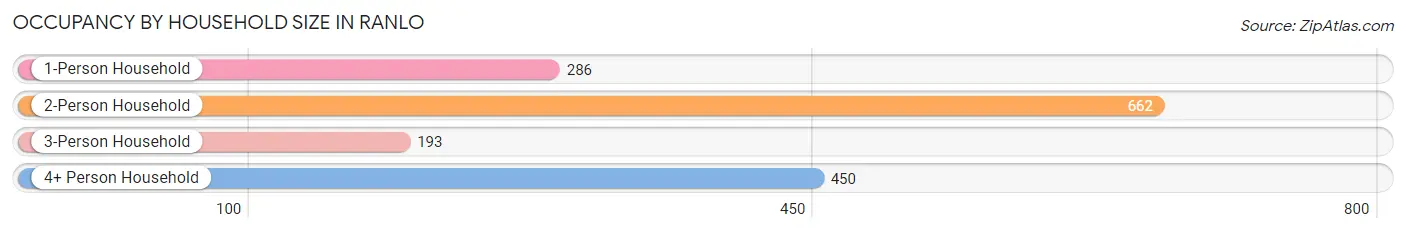
| Household Size | # Housing Units | % Housing Units |
| 1-Person Household | 286 | 18.0% |
| 2-Person Household | 662 | 41.6% |
| 3-Person Household | 193 | 12.1% |
| 4+ Person Household | 450 | 28.3% |
| Total Housing Units | 1,591 | 100.0% |
Occupancy by Ownership by Household Size in Ranlo
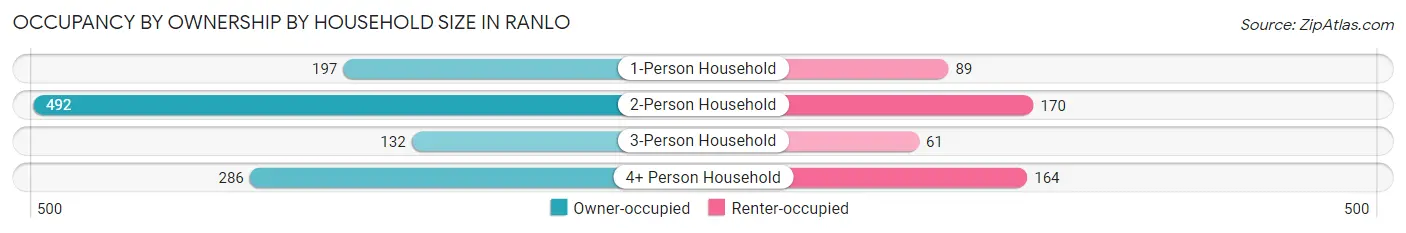
| Household Size | Owner-occupied | Renter-occupied |
| 1-Person Household | 197 (68.9%) | 89 (31.1%) |
| 2-Person Household | 492 (74.3%) | 170 (25.7%) |
| 3-Person Household | 132 (68.4%) | 61 (31.6%) |
| 4+ Person Household | 286 (63.6%) | 164 (36.4%) |
| Total Housing Units | 1,107 (69.6%) | 484 (30.4%) |
Occupancy by Educational Attainment in Ranlo
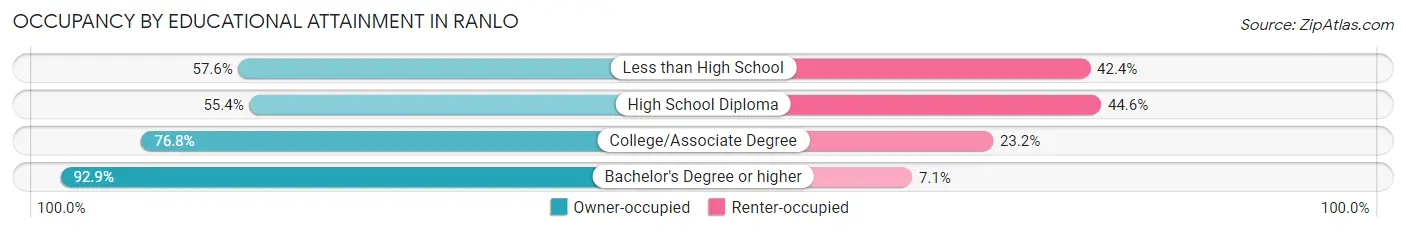
| Household Size | Owner-occupied | Renter-occupied |
| Less than High School | 95 (57.6%) | 70 (42.4%) |
| High School Diploma | 333 (55.4%) | 268 (44.6%) |
| College/Associate Degree | 418 (76.8%) | 126 (23.2%) |
| Bachelor's Degree or higher | 261 (92.9%) | 20 (7.1%) |
Occupancy by Age of Householder in Ranlo
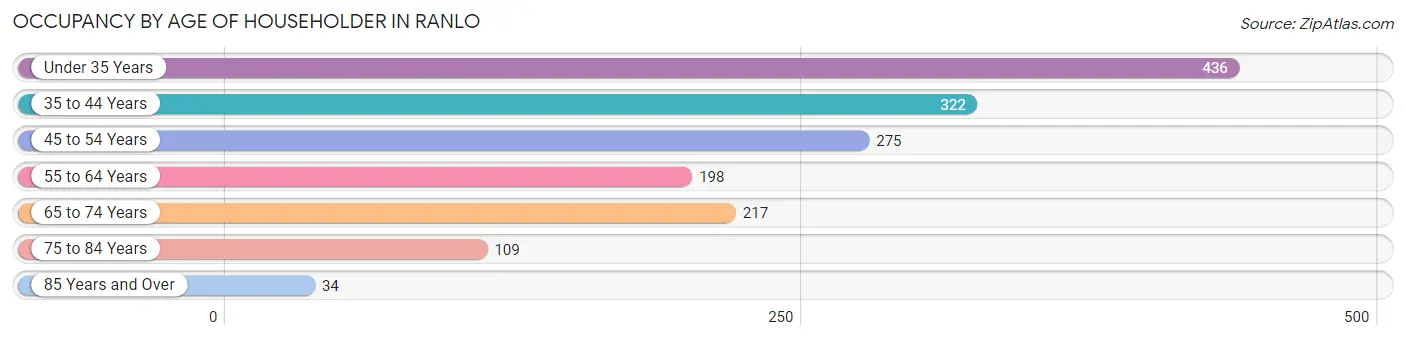
| Age Bracket | # Households | % Households |
| Under 35 Years | 436 | 27.4% |
| 35 to 44 Years | 322 | 20.2% |
| 45 to 54 Years | 275 | 17.3% |
| 55 to 64 Years | 198 | 12.4% |
| 65 to 74 Years | 217 | 13.6% |
| 75 to 84 Years | 109 | 6.9% |
| 85 Years and Over | 34 | 2.1% |
| Total | 1,591 | 100.0% |
Housing Finances in Ranlo
Median Income by Occupancy in Ranlo
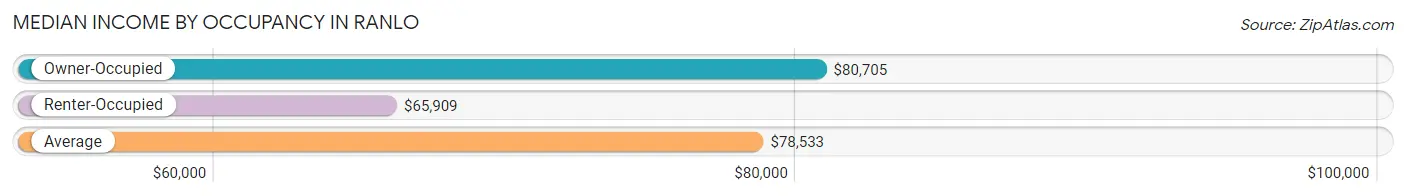
| Occupancy Type | # Households | Median Income |
| Owner-Occupied | 1,107 (69.6%) | $80,705 |
| Renter-Occupied | 484 (30.4%) | $65,909 |
| Average | 1,591 (100.0%) | $78,533 |
Occupancy by Householder Income Bracket in Ranlo
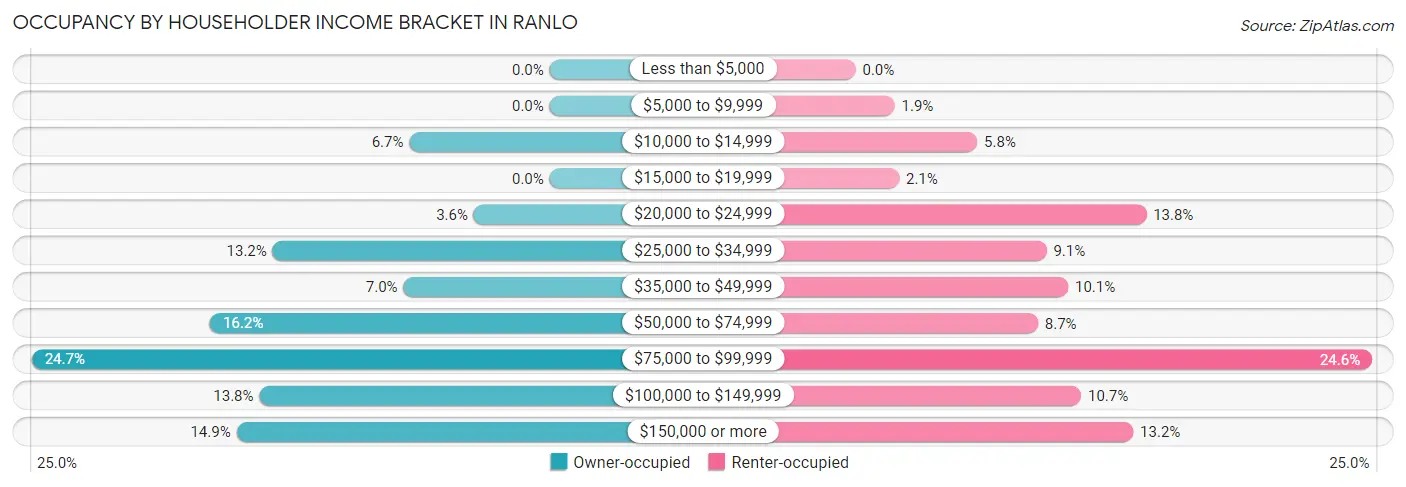
| Income Bracket | Owner-occupied | Renter-occupied |
| Less than $5,000 | 0 (0.0%) | 0 (0.0%) |
| $5,000 to $9,999 | 0 (0.0%) | 9 (1.9%) |
| $10,000 to $14,999 | 74 (6.7%) | 28 (5.8%) |
| $15,000 to $19,999 | 0 (0.0%) | 10 (2.1%) |
| $20,000 to $24,999 | 40 (3.6%) | 67 (13.8%) |
| $25,000 to $34,999 | 146 (13.2%) | 44 (9.1%) |
| $35,000 to $49,999 | 77 (7.0%) | 49 (10.1%) |
| $50,000 to $74,999 | 179 (16.2%) | 42 (8.7%) |
| $75,000 to $99,999 | 273 (24.7%) | 119 (24.6%) |
| $100,000 to $149,999 | 153 (13.8%) | 52 (10.7%) |
| $150,000 or more | 165 (14.9%) | 64 (13.2%) |
| Total | 1,107 (100.0%) | 484 (100.0%) |
Monthly Housing Cost Tiers in Ranlo
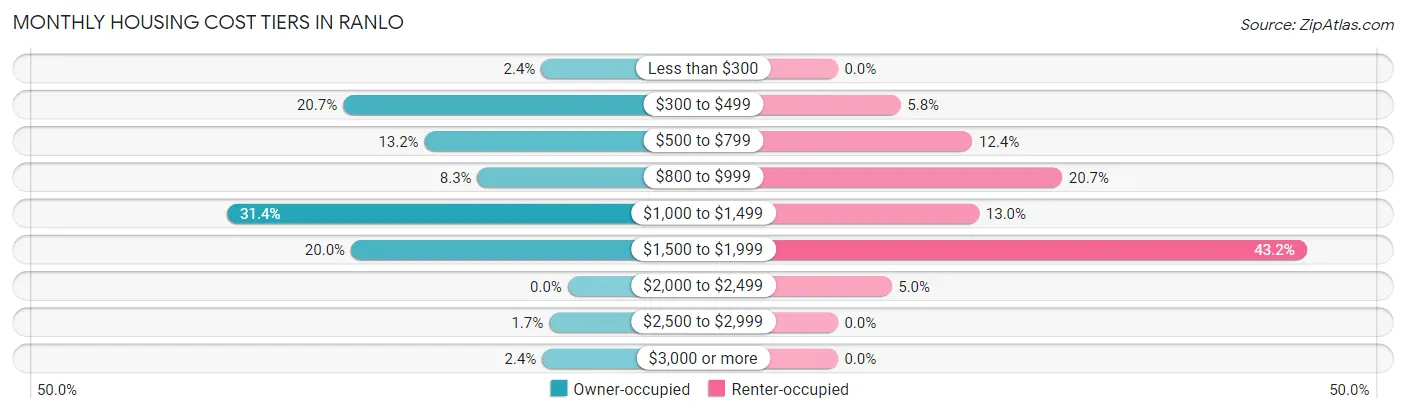
| Monthly Cost | Owner-occupied | Renter-occupied |
| Less than $300 | 27 (2.4%) | 0 (0.0%) |
| $300 to $499 | 229 (20.7%) | 28 (5.8%) |
| $500 to $799 | 146 (13.2%) | 60 (12.4%) |
| $800 to $999 | 92 (8.3%) | 100 (20.7%) |
| $1,000 to $1,499 | 347 (31.4%) | 63 (13.0%) |
| $1,500 to $1,999 | 221 (20.0%) | 209 (43.2%) |
| $2,000 to $2,499 | 0 (0.0%) | 24 (5.0%) |
| $2,500 to $2,999 | 19 (1.7%) | 0 (0.0%) |
| $3,000 or more | 26 (2.4%) | 0 (0.0%) |
| Total | 1,107 (100.0%) | 484 (100.0%) |
Physical Housing Characteristics in Ranlo
Housing Structures in Ranlo
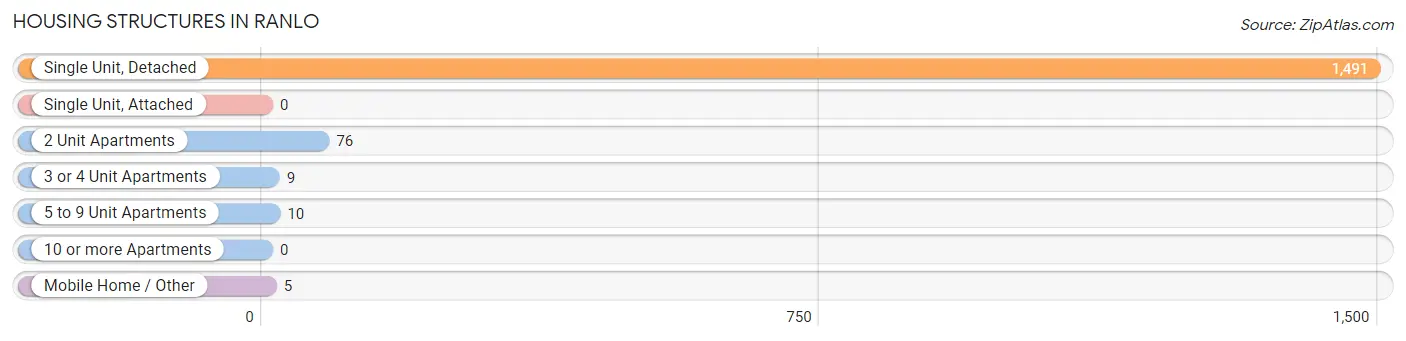
| Structure Type | # Housing Units | % Housing Units |
| Single Unit, Detached | 1,491 | 93.7% |
| Single Unit, Attached | 0 | 0.0% |
| 2 Unit Apartments | 76 | 4.8% |
| 3 or 4 Unit Apartments | 9 | 0.6% |
| 5 to 9 Unit Apartments | 10 | 0.6% |
| 10 or more Apartments | 0 | 0.0% |
| Mobile Home / Other | 5 | 0.3% |
| Total | 1,591 | 100.0% |
Housing Structures by Occupancy in Ranlo
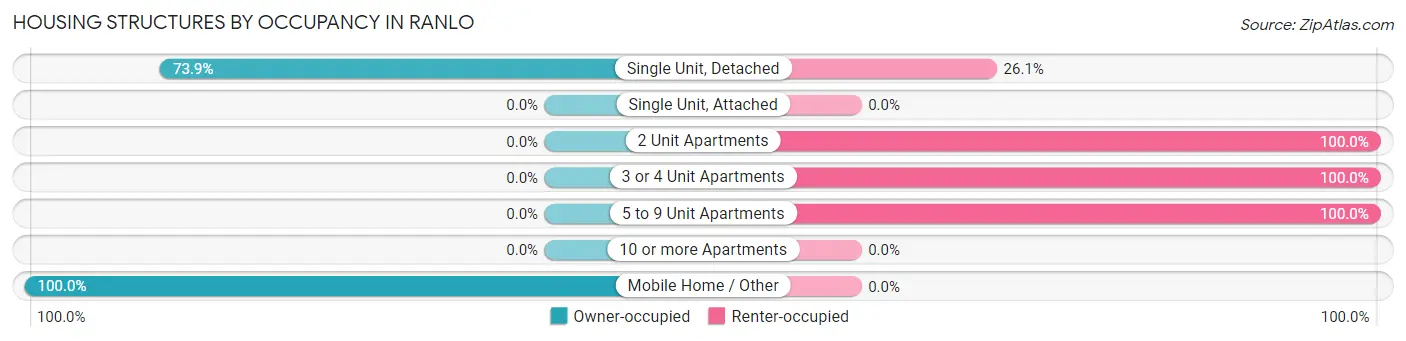
| Structure Type | Owner-occupied | Renter-occupied |
| Single Unit, Detached | 1,102 (73.9%) | 389 (26.1%) |
| Single Unit, Attached | 0 (0.0%) | 0 (0.0%) |
| 2 Unit Apartments | 0 (0.0%) | 76 (100.0%) |
| 3 or 4 Unit Apartments | 0 (0.0%) | 9 (100.0%) |
| 5 to 9 Unit Apartments | 0 (0.0%) | 10 (100.0%) |
| 10 or more Apartments | 0 (0.0%) | 0 (0.0%) |
| Mobile Home / Other | 5 (100.0%) | 0 (0.0%) |
| Total | 1,107 (69.6%) | 484 (30.4%) |
Housing Structures by Number of Rooms in Ranlo
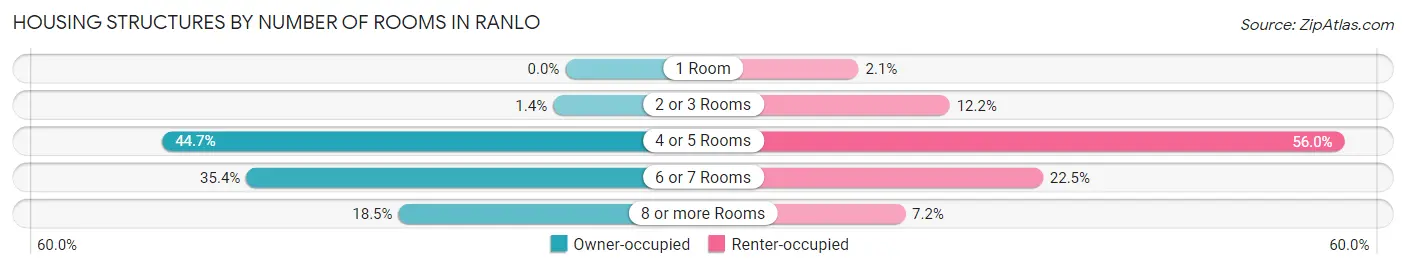
| Number of Rooms | Owner-occupied | Renter-occupied |
| 1 Room | 0 (0.0%) | 10 (2.1%) |
| 2 or 3 Rooms | 15 (1.4%) | 59 (12.2%) |
| 4 or 5 Rooms | 495 (44.7%) | 271 (56.0%) |
| 6 or 7 Rooms | 392 (35.4%) | 109 (22.5%) |
| 8 or more Rooms | 205 (18.5%) | 35 (7.2%) |
| Total | 1,107 (100.0%) | 484 (100.0%) |
Housing Structure by Heating Type in Ranlo
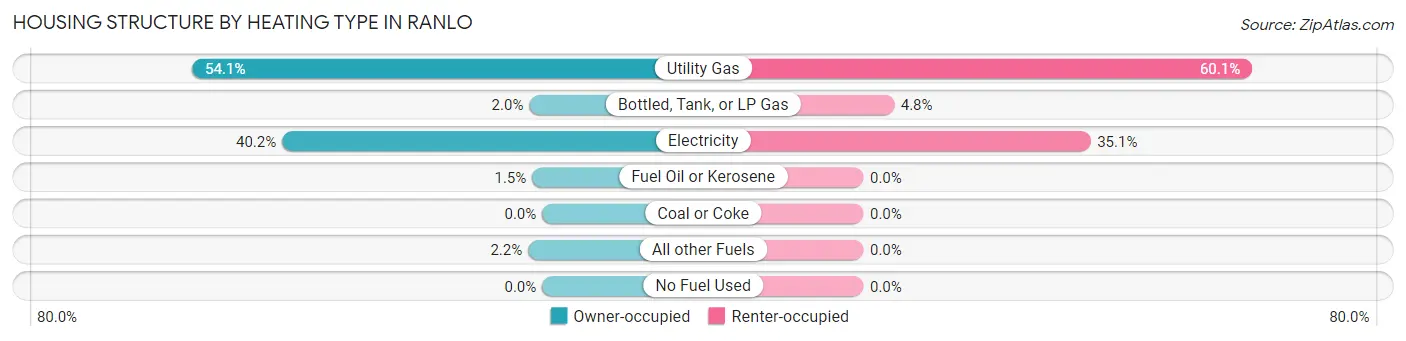
| Heating Type | Owner-occupied | Renter-occupied |
| Utility Gas | 599 (54.1%) | 291 (60.1%) |
| Bottled, Tank, or LP Gas | 22 (2.0%) | 23 (4.8%) |
| Electricity | 445 (40.2%) | 170 (35.1%) |
| Fuel Oil or Kerosene | 17 (1.5%) | 0 (0.0%) |
| Coal or Coke | 0 (0.0%) | 0 (0.0%) |
| All other Fuels | 24 (2.2%) | 0 (0.0%) |
| No Fuel Used | 0 (0.0%) | 0 (0.0%) |
| Total | 1,107 (100.0%) | 484 (100.0%) |
Household Vehicle Usage in Ranlo
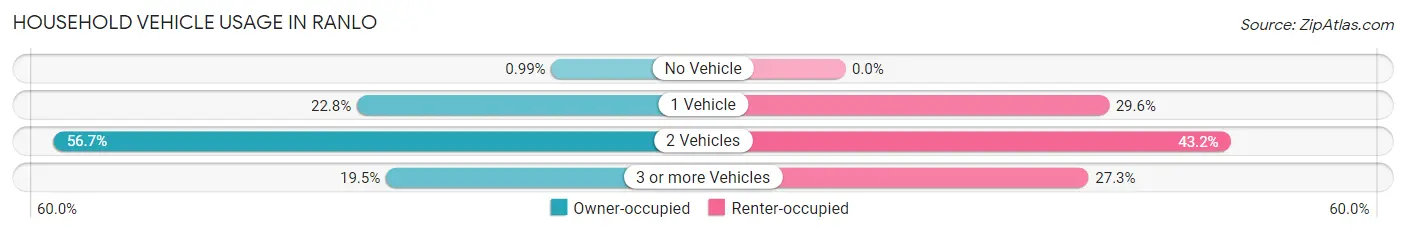
| Vehicles per Household | Owner-occupied | Renter-occupied |
| No Vehicle | 11 (1.0%) | 0 (0.0%) |
| 1 Vehicle | 252 (22.8%) | 143 (29.5%) |
| 2 Vehicles | 628 (56.7%) | 209 (43.2%) |
| 3 or more Vehicles | 216 (19.5%) | 132 (27.3%) |
| Total | 1,107 (100.0%) | 484 (100.0%) |
Real Estate & Mortgages in Ranlo
Real Estate and Mortgage Overview in Ranlo
| Characteristic | Without Mortgage | With Mortgage |
| Housing Units | 337 | 770 |
| Median Property Value | $143,600 | $197,500 |
| Median Household Income | $30,912 | $127 |
| Monthly Housing Costs | $421 | $26 |
| Real Estate Taxes | $1,486 | $0 |
Property Value by Mortgage Status in Ranlo
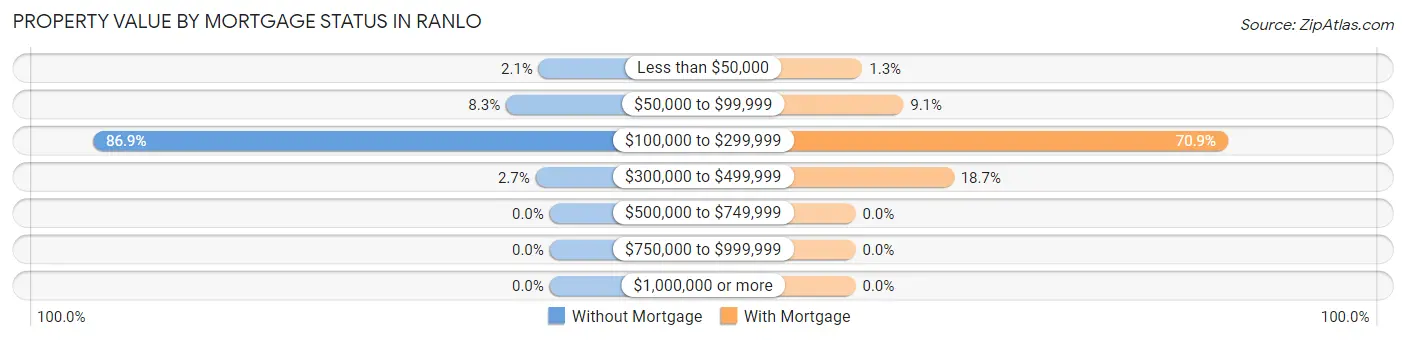
| Property Value | Without Mortgage | With Mortgage |
| Less than $50,000 | 7 (2.1%) | 10 (1.3%) |
| $50,000 to $99,999 | 28 (8.3%) | 70 (9.1%) |
| $100,000 to $299,999 | 293 (86.9%) | 546 (70.9%) |
| $300,000 to $499,999 | 9 (2.7%) | 144 (18.7%) |
| $500,000 to $749,999 | 0 (0.0%) | 0 (0.0%) |
| $750,000 to $999,999 | 0 (0.0%) | 0 (0.0%) |
| $1,000,000 or more | 0 (0.0%) | 0 (0.0%) |
| Total | 337 (100.0%) | 770 (100.0%) |
Household Income by Mortgage Status in Ranlo
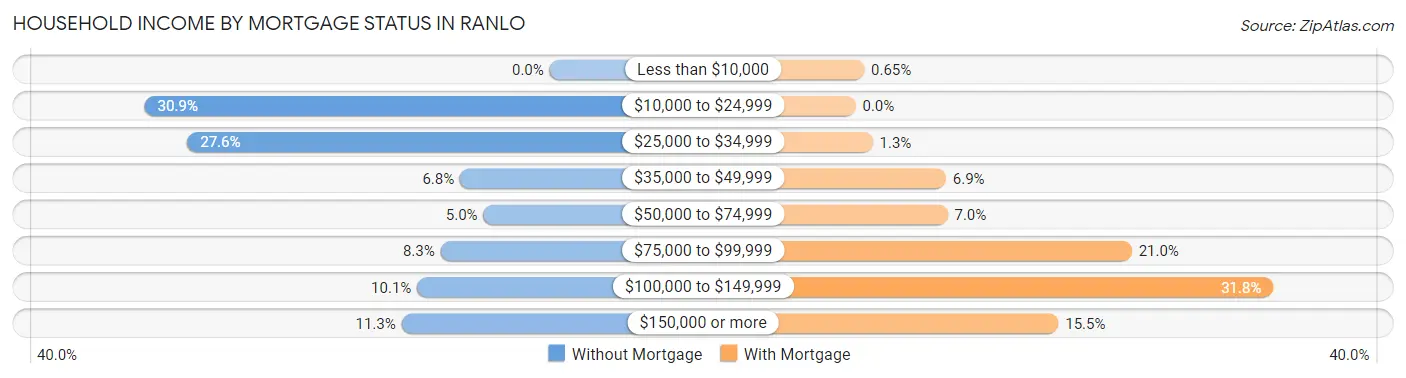
| Household Income | Without Mortgage | With Mortgage |
| Less than $10,000 | 0 (0.0%) | 5 (0.6%) |
| $10,000 to $24,999 | 104 (30.9%) | 0 (0.0%) |
| $25,000 to $34,999 | 93 (27.6%) | 10 (1.3%) |
| $35,000 to $49,999 | 23 (6.8%) | 53 (6.9%) |
| $50,000 to $74,999 | 17 (5.0%) | 54 (7.0%) |
| $75,000 to $99,999 | 28 (8.3%) | 162 (21.0%) |
| $100,000 to $149,999 | 34 (10.1%) | 245 (31.8%) |
| $150,000 or more | 38 (11.3%) | 119 (15.4%) |
| Total | 337 (100.0%) | 770 (100.0%) |
Property Value to Household Income Ratio in Ranlo
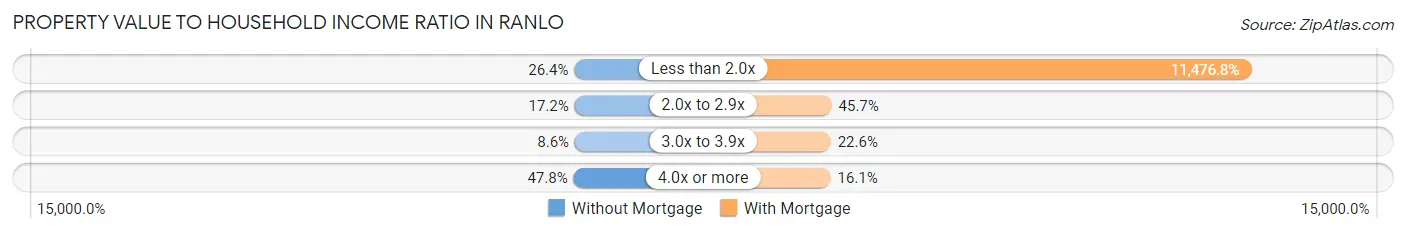
| Value-to-Income Ratio | Without Mortgage | With Mortgage |
| Less than 2.0x | 89 (26.4%) | 88,371 (11,476.7%) |
| 2.0x to 2.9x | 58 (17.2%) | 352 (45.7%) |
| 3.0x to 3.9x | 29 (8.6%) | 174 (22.6%) |
| 4.0x or more | 161 (47.8%) | 124 (16.1%) |
| Total | 337 (100.0%) | 770 (100.0%) |
Real Estate Taxes by Mortgage Status in Ranlo
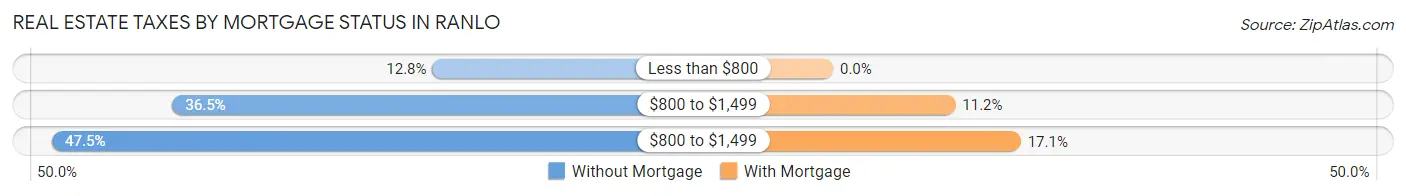
| Property Taxes | Without Mortgage | With Mortgage |
| Less than $800 | 43 (12.8%) | 0 (0.0%) |
| $800 to $1,499 | 123 (36.5%) | 86 (11.2%) |
| $800 to $1,499 | 160 (47.5%) | 132 (17.1%) |
| Total | 337 (100.0%) | 770 (100.0%) |
Health & Disability in Ranlo
Health Insurance Coverage by Age in Ranlo
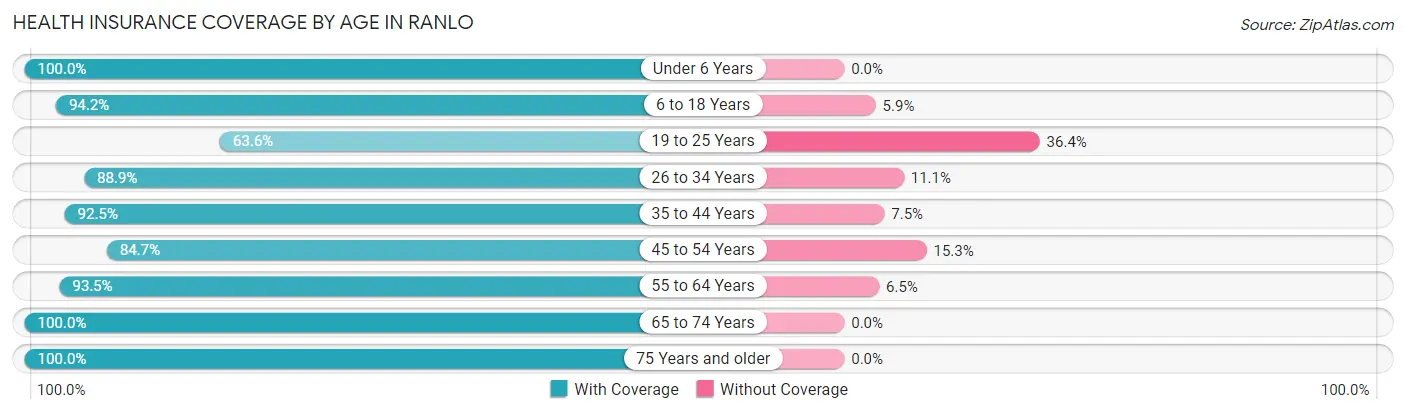
| Age Bracket | With Coverage | Without Coverage |
| Under 6 Years | 435 (100.0%) | 0 (0.0%) |
| 6 to 18 Years | 965 (94.2%) | 60 (5.9%) |
| 19 to 25 Years | 178 (63.6%) | 102 (36.4%) |
| 26 to 34 Years | 577 (88.9%) | 72 (11.1%) |
| 35 to 44 Years | 607 (92.5%) | 49 (7.5%) |
| 45 to 54 Years | 458 (84.7%) | 83 (15.3%) |
| 55 to 64 Years | 245 (93.5%) | 17 (6.5%) |
| 65 to 74 Years | 418 (100.0%) | 0 (0.0%) |
| 75 Years and older | 205 (100.0%) | 0 (0.0%) |
| Total | 4,088 (91.4%) | 383 (8.6%) |
Health Insurance Coverage by Citizenship Status in Ranlo
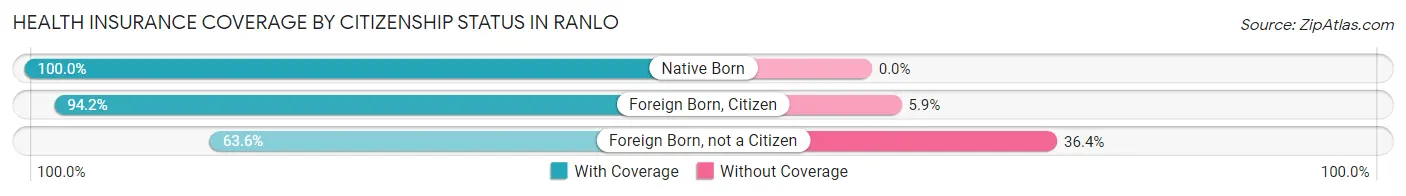
| Citizenship Status | With Coverage | Without Coverage |
| Native Born | 435 (100.0%) | 0 (0.0%) |
| Foreign Born, Citizen | 965 (94.2%) | 60 (5.9%) |
| Foreign Born, not a Citizen | 178 (63.6%) | 102 (36.4%) |
Health Insurance Coverage by Household Income in Ranlo
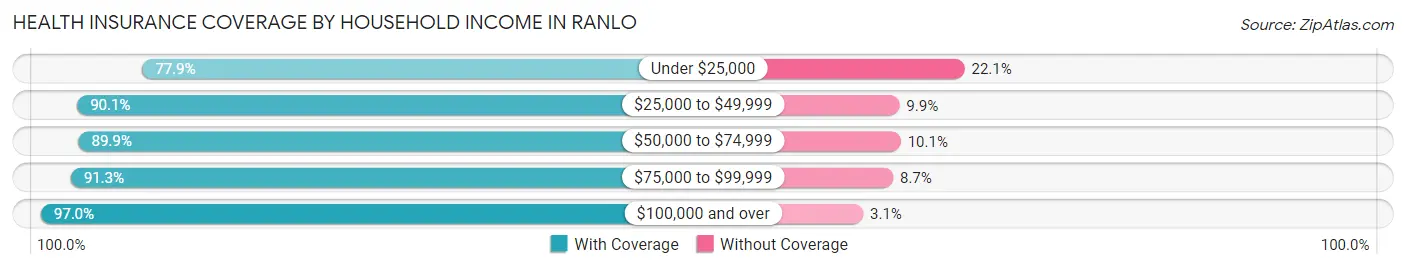
| Household Income | With Coverage | Without Coverage |
| Under $25,000 | 272 (77.9%) | 77 (22.1%) |
| $25,000 to $49,999 | 686 (90.1%) | 75 (9.9%) |
| $50,000 to $74,999 | 640 (89.9%) | 72 (10.1%) |
| $75,000 to $99,999 | 1,266 (91.3%) | 120 (8.7%) |
| $100,000 and over | 1,209 (97.0%) | 38 (3.0%) |
Public vs Private Health Insurance Coverage by Age in Ranlo
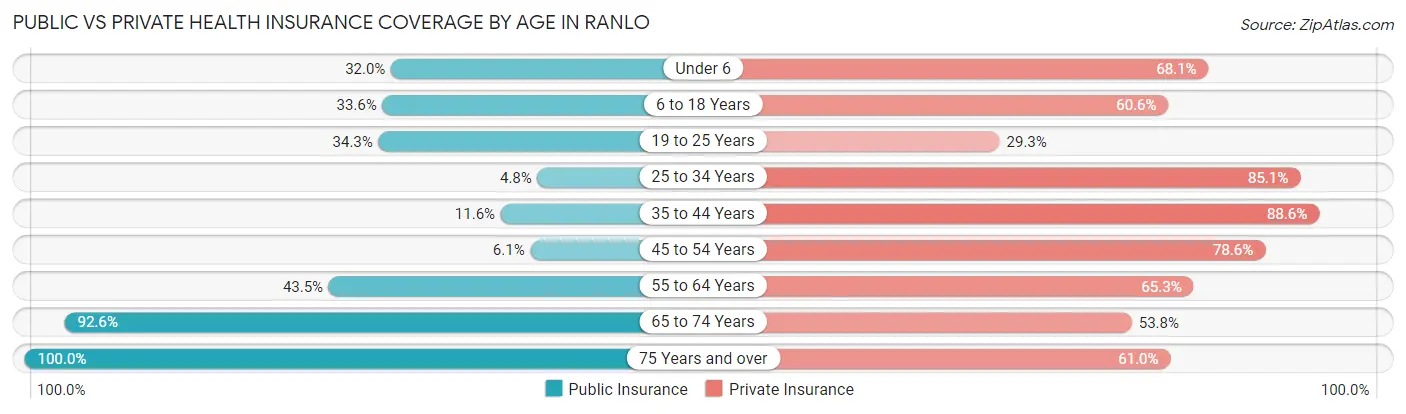
| Age Bracket | Public Insurance | Private Insurance |
| Under 6 | 139 (32.0%) | 296 (68.0%) |
| 6 to 18 Years | 344 (33.6%) | 621 (60.6%) |
| 19 to 25 Years | 96 (34.3%) | 82 (29.3%) |
| 25 to 34 Years | 31 (4.8%) | 552 (85.1%) |
| 35 to 44 Years | 76 (11.6%) | 581 (88.6%) |
| 45 to 54 Years | 33 (6.1%) | 425 (78.6%) |
| 55 to 64 Years | 114 (43.5%) | 171 (65.3%) |
| 65 to 74 Years | 387 (92.6%) | 225 (53.8%) |
| 75 Years and over | 205 (100.0%) | 125 (61.0%) |
| Total | 1,425 (31.9%) | 3,078 (68.8%) |
Disability Status by Sex by Age in Ranlo
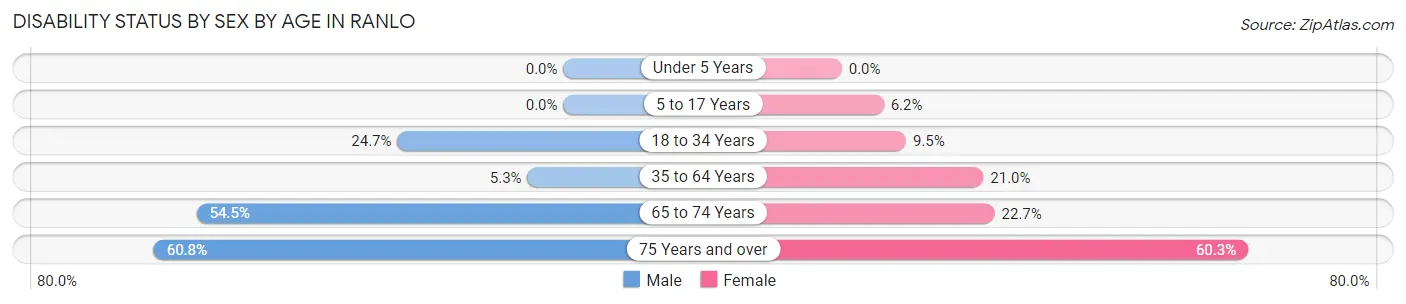
| Age Bracket | Male | Female |
| Under 5 Years | 0 (0.0%) | 0 (0.0%) |
| 5 to 17 Years | 0 (0.0%) | 40 (6.2%) |
| 18 to 34 Years | 106 (24.6%) | 60 (9.5%) |
| 35 to 64 Years | 40 (5.3%) | 149 (21.0%) |
| 65 to 74 Years | 110 (54.5%) | 49 (22.7%) |
| 75 Years and over | 45 (60.8%) | 79 (60.3%) |
Disability Class by Sex by Age in Ranlo
Disability Class: Hearing Difficulty
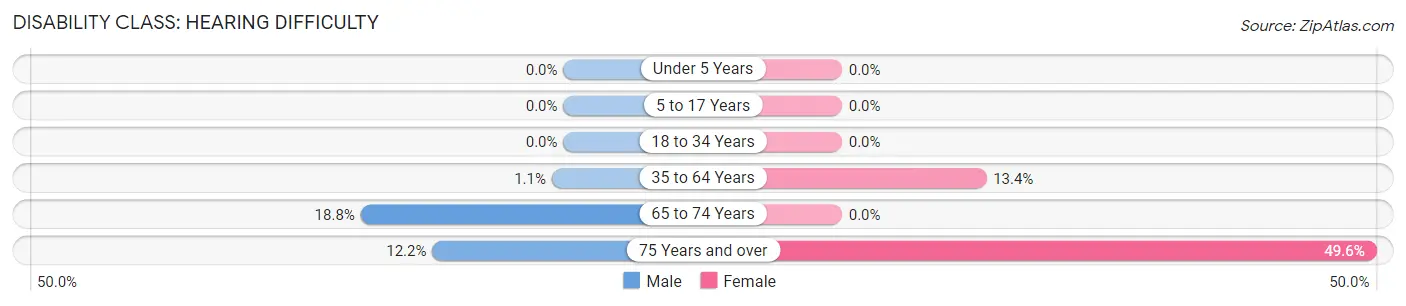
| Age Bracket | Male | Female |
| Under 5 Years | 0 (0.0%) | 0 (0.0%) |
| 5 to 17 Years | 0 (0.0%) | 0 (0.0%) |
| 18 to 34 Years | 0 (0.0%) | 0 (0.0%) |
| 35 to 64 Years | 8 (1.1%) | 95 (13.4%) |
| 65 to 74 Years | 38 (18.8%) | 0 (0.0%) |
| 75 Years and over | 9 (12.2%) | 65 (49.6%) |
Disability Class: Vision Difficulty
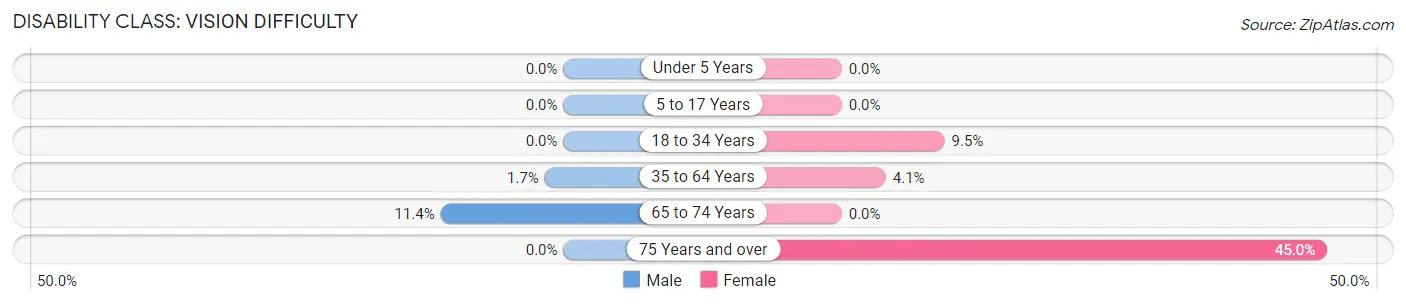
| Age Bracket | Male | Female |
| Under 5 Years | 0 (0.0%) | 0 (0.0%) |
| 5 to 17 Years | 0 (0.0%) | 0 (0.0%) |
| 18 to 34 Years | 0 (0.0%) | 60 (9.5%) |
| 35 to 64 Years | 13 (1.7%) | 29 (4.1%) |
| 65 to 74 Years | 23 (11.4%) | 0 (0.0%) |
| 75 Years and over | 0 (0.0%) | 59 (45.0%) |
Disability Class: Cognitive Difficulty
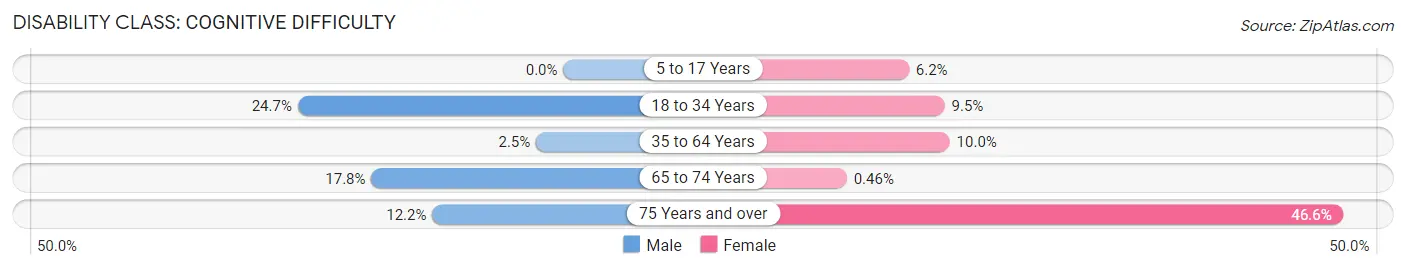
| Age Bracket | Male | Female |
| 5 to 17 Years | 0 (0.0%) | 40 (6.2%) |
| 18 to 34 Years | 106 (24.6%) | 60 (9.5%) |
| 35 to 64 Years | 19 (2.5%) | 71 (10.0%) |
| 65 to 74 Years | 36 (17.8%) | 1 (0.5%) |
| 75 Years and over | 9 (12.2%) | 61 (46.6%) |
Disability Class: Ambulatory Difficulty
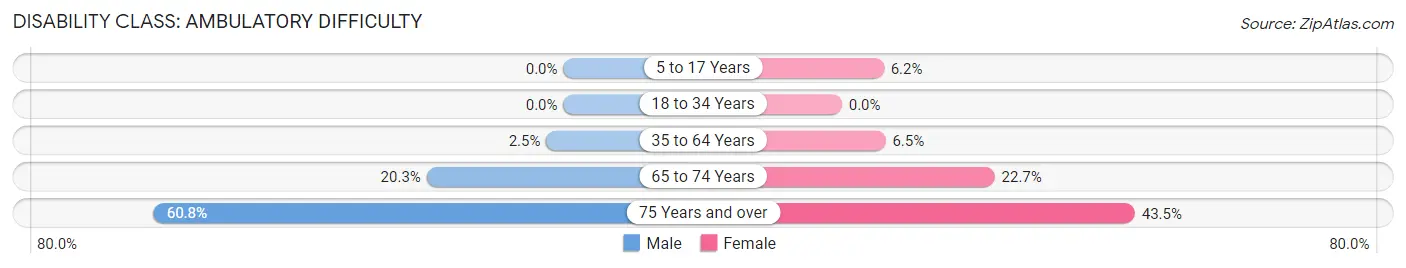
| Age Bracket | Male | Female |
| 5 to 17 Years | 0 (0.0%) | 40 (6.2%) |
| 18 to 34 Years | 0 (0.0%) | 0 (0.0%) |
| 35 to 64 Years | 19 (2.5%) | 46 (6.5%) |
| 65 to 74 Years | 41 (20.3%) | 49 (22.7%) |
| 75 Years and over | 45 (60.8%) | 57 (43.5%) |
Disability Class: Self-Care Difficulty
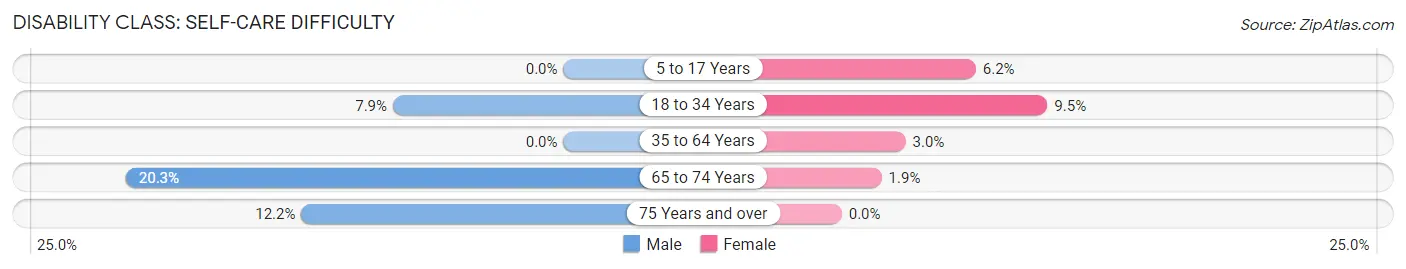
| Age Bracket | Male | Female |
| 5 to 17 Years | 0 (0.0%) | 40 (6.2%) |
| 18 to 34 Years | 34 (7.9%) | 60 (9.5%) |
| 35 to 64 Years | 0 (0.0%) | 21 (3.0%) |
| 65 to 74 Years | 41 (20.3%) | 4 (1.8%) |
| 75 Years and over | 9 (12.2%) | 0 (0.0%) |
Technology Access in Ranlo
Computing Device Access in Ranlo
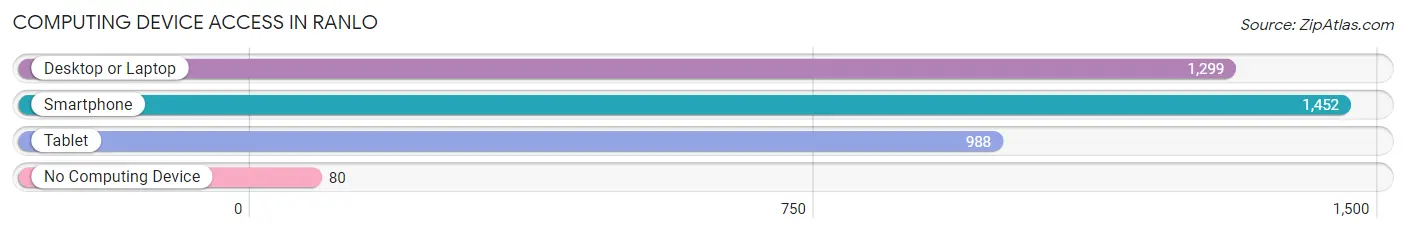
| Device Type | # Households | % Households |
| Desktop or Laptop | 1,299 | 81.7% |
| Smartphone | 1,452 | 91.3% |
| Tablet | 988 | 62.1% |
| No Computing Device | 80 | 5.0% |
| Total | 1,591 | 100.0% |
Internet Access in Ranlo
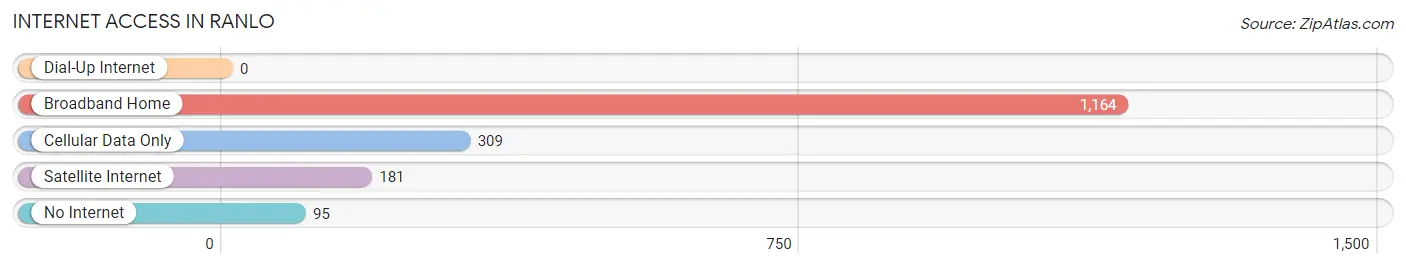
| Internet Type | # Households | % Households |
| Dial-Up Internet | 0 | 0.0% |
| Broadband Home | 1,164 | 73.2% |
| Cellular Data Only | 309 | 19.4% |
| Satellite Internet | 181 | 11.4% |
| No Internet | 95 | 6.0% |
| Total | 1,591 | 100.0% |
Ranlo Summary
Ranlo is a small town located in Gaston County, North Carolina. It is situated along the South Fork Catawba River, approximately 15 miles west of Charlotte. The town was founded in the early 1900s and has a population of approximately 3,000 people.
Geography
Ranlo is located in the foothills of the Blue Ridge Mountains, and is surrounded by rolling hills and forests. The town is situated along the South Fork Catawba River, which provides a scenic backdrop for the town. The town is also located near the South Fork Catawba River State Park, which offers a variety of outdoor activities such as fishing, camping, and hiking.
Economy
Ranlo’s economy is largely based on manufacturing and agriculture. The town is home to several manufacturing plants, including a paper mill, a furniture factory, and a textile mill. The town also has a number of small businesses, including restaurants, retail stores, and service providers.
Demographics
Ranlo is a predominantly white town, with a population that is approximately 90% white. The town also has a small African American population, which makes up about 5% of the population. The town also has a small Hispanic population, which makes up about 2% of the population.
The median household income in Ranlo is approximately $45,000, which is slightly lower than the national average. The town also has a higher than average poverty rate, with approximately 15% of the population living below the poverty line.
History
Ranlo was founded in the early 1900s by a group of settlers from the nearby town of Gastonia. The town was named after the Ranlo Manufacturing Company, which was one of the first businesses to be established in the area. The town grew rapidly in the early 20th century, and by the 1950s it had become a thriving community.
In the late 20th century, Ranlo experienced a period of decline as many of the town’s manufacturing plants closed down. However, the town has since experienced a resurgence, and is now home to a number of small businesses and manufacturing plants.
Conclusion
Ranlo is a small town located in Gaston County, North Carolina. It is situated along the South Fork Catawba River, and is surrounded by rolling hills and forests. The town’s economy is largely based on manufacturing and agriculture, and it has a population that is approximately 90% white. The town has experienced a period of decline in the late 20th century, but has since experienced a resurgence and is now home to a number of small businesses and manufacturing plants.
Common Questions
What is Per Capita Income in Ranlo?
Per Capita income in Ranlo is $31,288.
What is the Median Family Income in Ranlo?
Median Family Income in Ranlo is $82,500.
What is the Median Household income in Ranlo?
Median Household Income in Ranlo is $78,533.
What is Income or Wage Gap in Ranlo?
Income or Wage Gap in Ranlo is 51.2%.
Women in Ranlo earn 48.8 cents for every dollar earned by a man.
What is Inequality or Gini Index in Ranlo?
Inequality or Gini Index in Ranlo is 0.41.
What is the Total Population of Ranlo?
Total Population of Ranlo is 4,487.
What is the Total Male Population of Ranlo?
Total Male Population of Ranlo is 2,065.
What is the Total Female Population of Ranlo?
Total Female Population of Ranlo is 2,422.
What is the Ratio of Males per 100 Females in Ranlo?
There are 85.26 Males per 100 Females in Ranlo.
What is the Ratio of Females per 100 Males in Ranlo?
There are 117.29 Females per 100 Males in Ranlo.
What is the Median Population Age in Ranlo?
Median Population Age in Ranlo is 33.7 Years.
What is the Average Family Size in Ranlo
Average Family Size in Ranlo is 3.2 People.
What is the Average Household Size in Ranlo
Average Household Size in Ranlo is 2.8 People.
How Large is the Labor Force in Ranlo?
There are 2,137 People in the Labor Forcein in Ranlo.
What is the Percentage of People in the Labor Force in Ranlo?
65.2% of People are in the Labor Force in Ranlo.
What is the Unemployment Rate in Ranlo?
Unemployment Rate in Ranlo is 7.3%.