Chadron, NE Map & Demographics
Chadron Map
Chadron Overview
$26,587
PER CAPITA INCOME
$76,033
AVG FAMILY INCOME
$53,728
AVG HOUSEHOLD INCOME
21.6%
WAGE / INCOME GAP [ % ]
78.4¢/ $1
WAGE / INCOME GAP [ $ ]
0.35
INEQUALITY / GINI INDEX
5,255
TOTAL POPULATION
2,497
MALE POPULATION
2,758
FEMALE POPULATION
90.54
MALES / 100 FEMALES
110.45
FEMALES / 100 MALES
28.6
MEDIAN AGE
2.8
AVG FAMILY SIZE
2.1
AVG HOUSEHOLD SIZE
3,001
LABOR FORCE [ PEOPLE ]
68.2%
PERCENT IN LABOR FORCE
1.8%
UNEMPLOYMENT RATE
Chadron Zip Codes
Chadron Area Codes
Income in Chadron
Income Overview in Chadron
Per Capita Income in Chadron is $26,587, while median incomes of families and households are $76,033 and $53,728 respectively.
| Characteristic | Number | Measure |
| Per Capita Income | 5,255 | $26,587 |
| Median Family Income | 1,136 | $76,033 |
| Mean Family Income | 1,136 | $83,003 |
| Median Household Income | 2,162 | $53,728 |
| Mean Household Income | 2,162 | $63,167 |
| Income Deficit | 1,136 | $0 |
| Wage / Income Gap (%) | 5,255 | 21.59% |
| Wage / Income Gap ($) | 5,255 | 78.41¢ per $1 |
| Gini / Inequality Index | 5,255 | 0.35 |
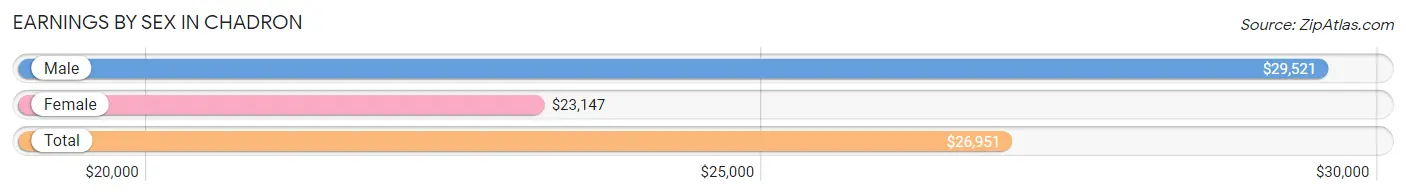
Earnings by Sex in Chadron
Average Earnings in Chadron are $26,951, $29,521 for men and $23,147 for women, a difference of 21.6%.
| Sex | Number | Average Earnings |
| Male | 1,772 (51.5%) | $29,521 |
| Female | 1,671 (48.5%) | $23,147 |
| Total | 3,443 (100.0%) | $26,951 |
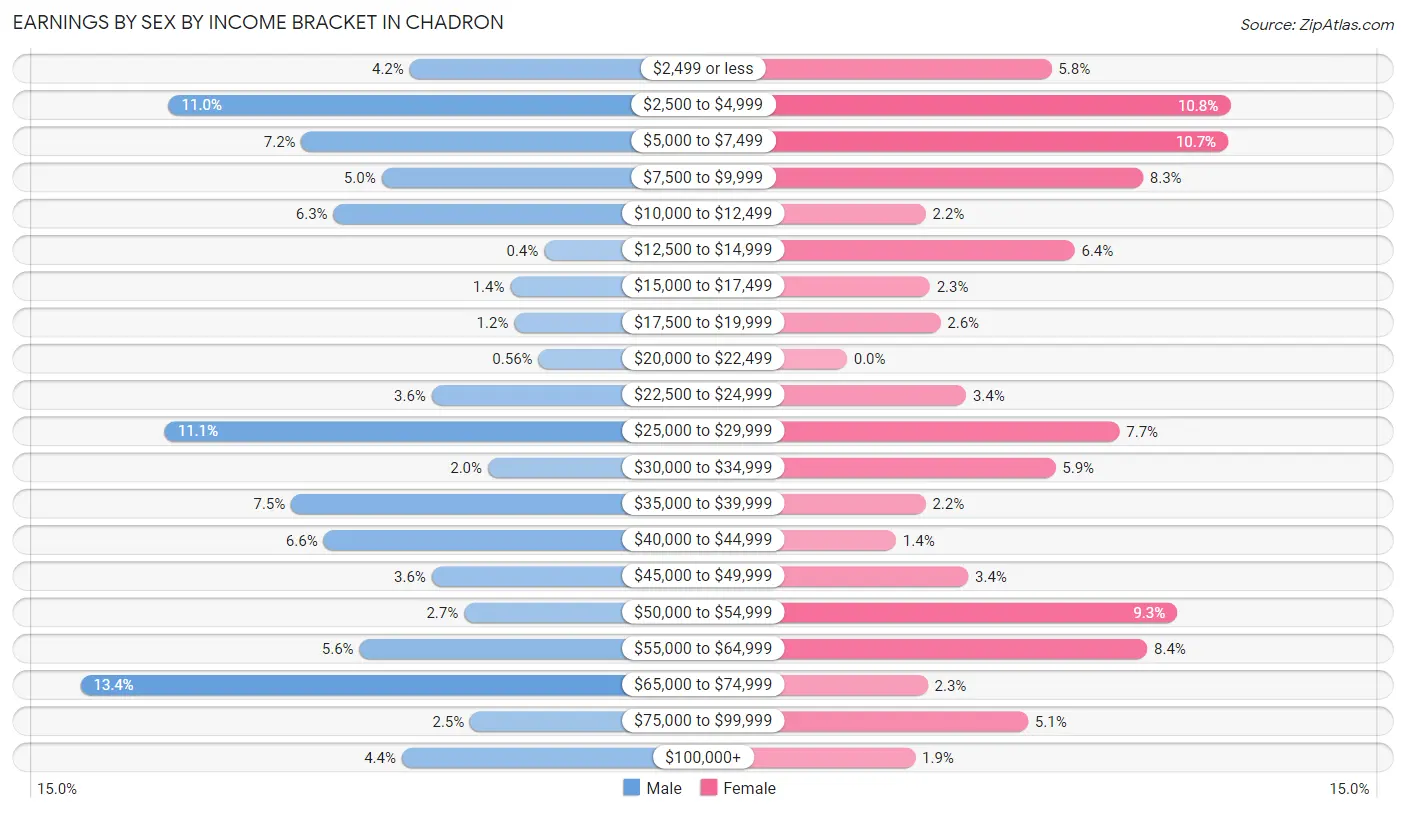
Earnings by Sex by Income Bracket in Chadron
The most common earnings brackets in Chadron are $65,000 to $74,999 for men (238 | 13.4%) and $2,500 to $4,999 for women (180 | 10.8%).
| Income | Male | Female |
| $2,499 or less | 74 (4.2%) | 96 (5.8%) |
| $2,500 to $4,999 | 194 (11.0%) | 180 (10.8%) |
| $5,000 to $7,499 | 128 (7.2%) | 179 (10.7%) |
| $7,500 to $9,999 | 88 (5.0%) | 139 (8.3%) |
| $10,000 to $12,499 | 112 (6.3%) | 37 (2.2%) |
| $12,500 to $14,999 | 7 (0.4%) | 107 (6.4%) |
| $15,000 to $17,499 | 24 (1.3%) | 39 (2.3%) |
| $17,500 to $19,999 | 22 (1.2%) | 44 (2.6%) |
| $20,000 to $22,499 | 10 (0.6%) | 0 (0.0%) |
| $22,500 to $24,999 | 63 (3.6%) | 56 (3.4%) |
| $25,000 to $29,999 | 196 (11.1%) | 128 (7.7%) |
| $30,000 to $34,999 | 35 (2.0%) | 98 (5.9%) |
| $35,000 to $39,999 | 133 (7.5%) | 37 (2.2%) |
| $40,000 to $44,999 | 117 (6.6%) | 23 (1.4%) |
| $45,000 to $49,999 | 63 (3.6%) | 57 (3.4%) |
| $50,000 to $54,999 | 47 (2.6%) | 155 (9.3%) |
| $55,000 to $64,999 | 99 (5.6%) | 141 (8.4%) |
| $65,000 to $74,999 | 238 (13.4%) | 38 (2.3%) |
| $75,000 to $99,999 | 44 (2.5%) | 85 (5.1%) |
| $100,000+ | 78 (4.4%) | 32 (1.9%) |
| Total | 1,772 (100.0%) | 1,671 (100.0%) |
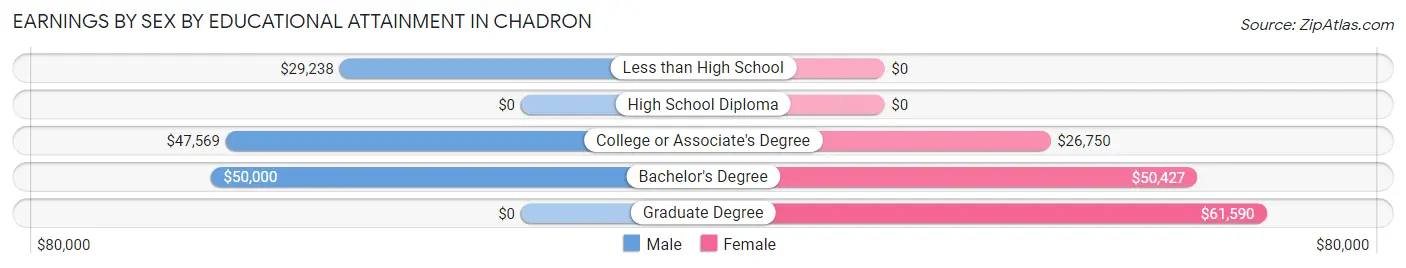
Earnings by Sex by Educational Attainment in Chadron
Average earnings in Chadron are $42,267 for men and $47,941 for women, a difference of 11.8%. Men with an educational attainment of bachelor's degree enjoy the highest average annual earnings of $50,000, while those with less than high school education earn the least with $29,238. Women with an educational attainment of graduate degree earn the most with the average annual earnings of $61,590, while those with college or associate's degree education have the smallest earnings of $26,750.
| Educational Attainment | Male Income | Female Income |
| Less than High School | $29,238 | $0 |
| High School Diploma | - | - |
| College or Associate's Degree | $47,569 | $26,750 |
| Bachelor's Degree | $50,000 | $50,427 |
| Graduate Degree | - | - |
| Total | $42,267 | $47,941 |
Family Income in Chadron
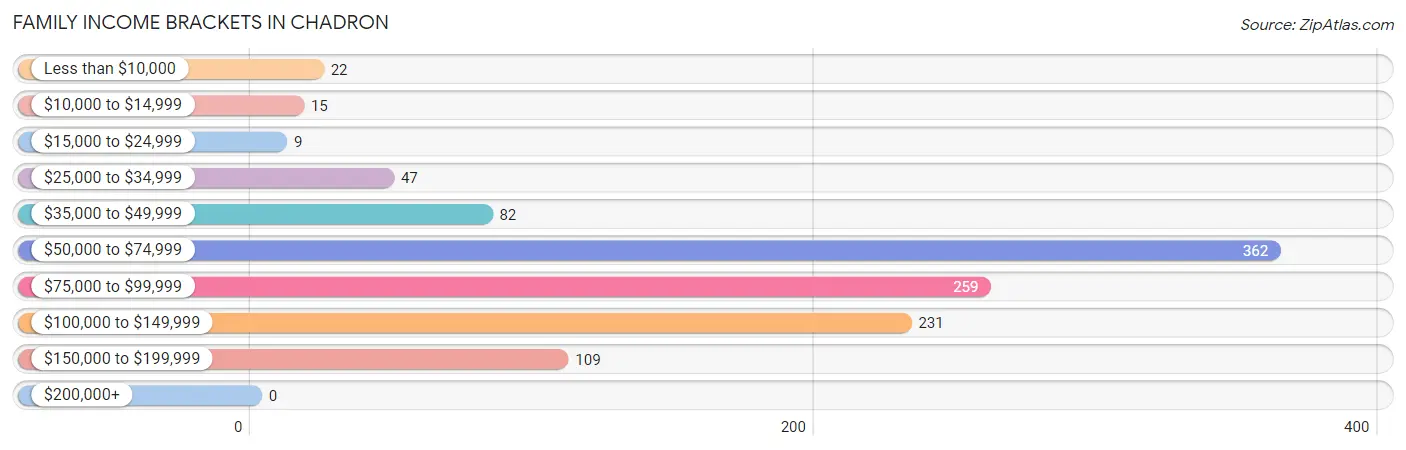
Family Income Brackets in Chadron
According to the Chadron family income data, there are 362 families falling into the $50,000 to $74,999 income range, which is the most common income bracket and makes up 31.9% of all families.
| Income Bracket | # Families | % Families |
| Less than $10,000 | 22 | 1.9% |
| $10,000 to $14,999 | 15 | 1.3% |
| $15,000 to $24,999 | 9 | 0.8% |
| $25,000 to $34,999 | 47 | 4.1% |
| $35,000 to $49,999 | 82 | 7.2% |
| $50,000 to $74,999 | 362 | 31.9% |
| $75,000 to $99,999 | 259 | 22.8% |
| $100,000 to $149,999 | 231 | 20.3% |
| $150,000 to $199,999 | 109 | 9.6% |
| $200,000+ | 0 | 0.0% |
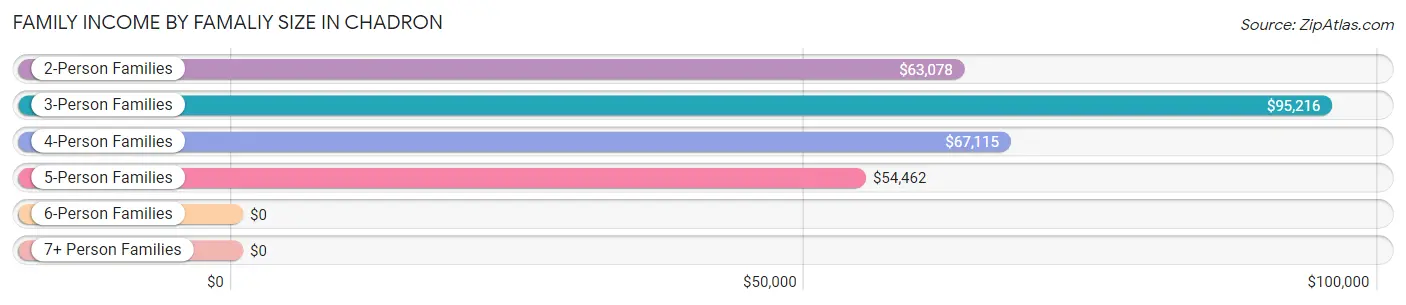
Family Income by Famaliy Size in Chadron
3-person families (259 | 22.8%) account for the highest median family income in Chadron with $95,216 per family, while 3-person families (259 | 22.8%) have the highest median income of $31,739 per family member.
| Income Bracket | # Families | Median Income |
| 2-Person Families | 587 (51.7%) | $63,078 |
| 3-Person Families | 259 (22.8%) | $95,216 |
| 4-Person Families | 144 (12.7%) | $67,115 |
| 5-Person Families | 113 (10.0%) | $54,462 |
| 6-Person Families | 15 (1.3%) | $0 |
| 7+ Person Families | 18 (1.6%) | $0 |
| Total | 1,136 (100.0%) | $76,033 |
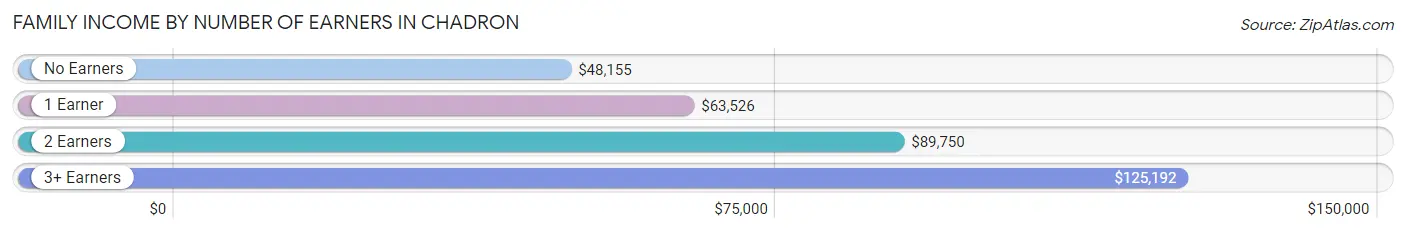
Family Income by Number of Earners in Chadron
The median family income in Chadron is $76,033, with families comprising 3+ earners (76) having the highest median family income of $125,192, while families with no earners (167) have the lowest median family income of $48,155, accounting for 6.7% and 14.7% of families, respectively.
| Number of Earners | # Families | Median Income |
| No Earners | 167 (14.7%) | $48,155 |
| 1 Earner | 249 (21.9%) | $63,526 |
| 2 Earners | 644 (56.7%) | $89,750 |
| 3+ Earners | 76 (6.7%) | $125,192 |
| Total | 1,136 (100.0%) | $76,033 |
Household Income in Chadron
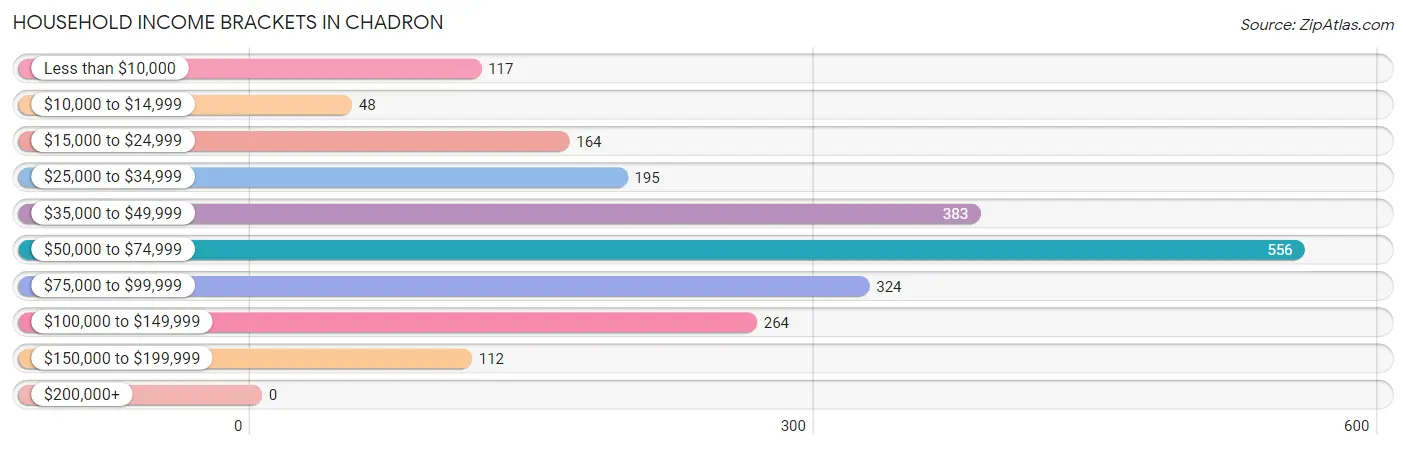
Household Income Brackets in Chadron
With 556 households falling in the category, the $50,000 to $74,999 income range is the most frequent in Chadron, accounting for 25.7% of all households.
| Income Bracket | # Households | % Households |
| Less than $10,000 | 117 | 5.4% |
| $10,000 to $14,999 | 48 | 2.2% |
| $15,000 to $24,999 | 164 | 7.6% |
| $25,000 to $34,999 | 195 | 9.0% |
| $35,000 to $49,999 | 383 | 17.7% |
| $50,000 to $74,999 | 556 | 25.7% |
| $75,000 to $99,999 | 324 | 15.0% |
| $100,000 to $149,999 | 264 | 12.2% |
| $150,000 to $199,999 | 112 | 5.2% |
| $200,000+ | 0 | 0.0% |
Household Income by Householder Age in Chadron
The median household income in Chadron is $53,728, with the highest median household income of $71,328 found in the 25 to 44 years age bracket for the primary householder. A total of 710 households (32.8%) fall into this category. Meanwhile, the 15 to 24 years age bracket for the primary householder has the lowest median household income of $18,349, with 313 households (14.5%) in this group.
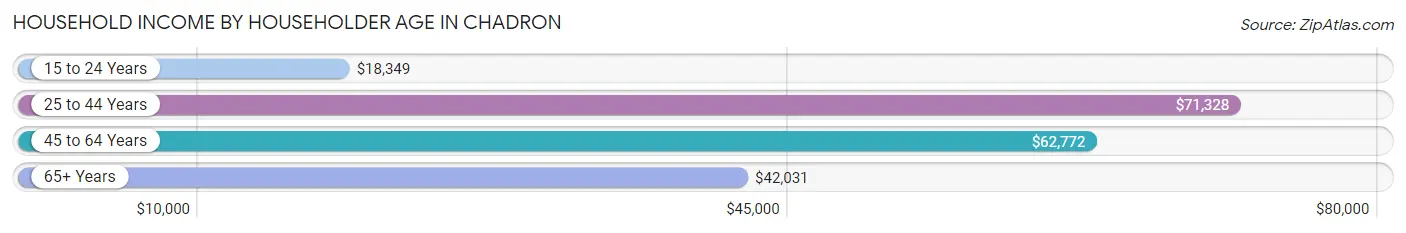
| Income Bracket | # Households | Median Income |
| 15 to 24 Years | 313 (14.5%) | $18,349 |
| 25 to 44 Years | 710 (32.8%) | $71,328 |
| 45 to 64 Years | 721 (33.4%) | $62,772 |
| 65+ Years | 418 (19.3%) | $42,031 |
| Total | 2,162 (100.0%) | $53,728 |
Poverty in Chadron
Income Below Poverty by Sex and Age in Chadron
With 9.7% poverty level for males and 12.9% for females among the residents of Chadron, 18 to 24 year old males and 18 to 24 year old females are the most vulnerable to poverty, with 139 males (51.5%) and 288 females (73.5%) in their respective age groups living below the poverty level.
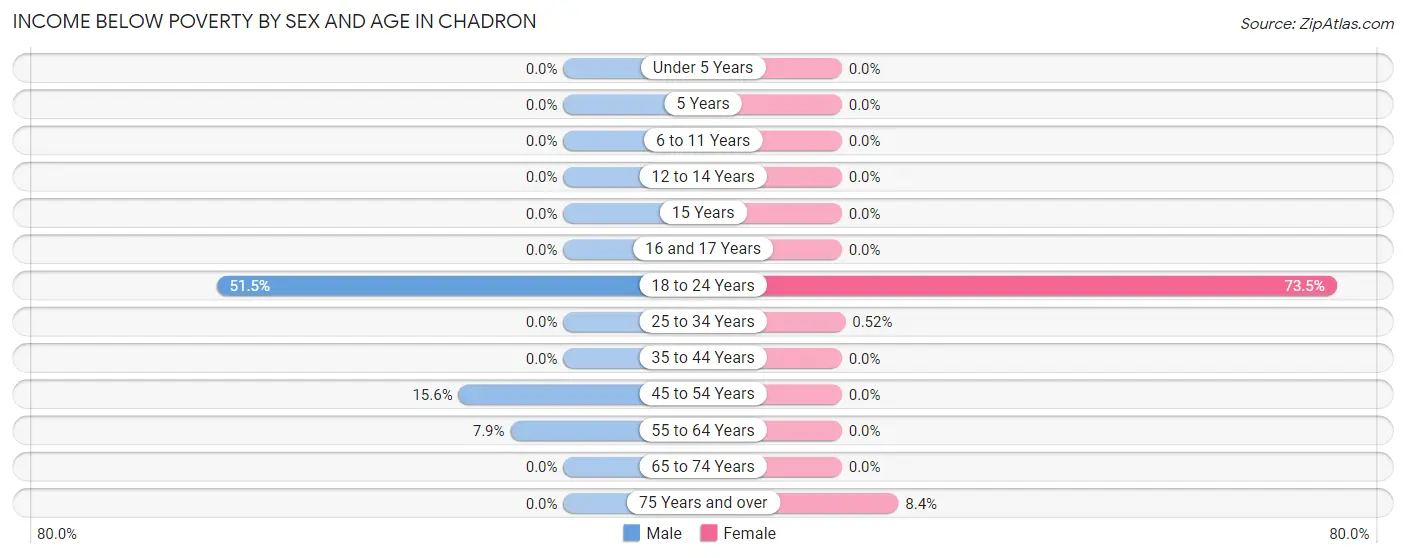
| Age Bracket | Male | Female |
| Under 5 Years | 0 (0.0%) | 0 (0.0%) |
| 5 Years | 0 (0.0%) | 0 (0.0%) |
| 6 to 11 Years | 0 (0.0%) | 0 (0.0%) |
| 12 to 14 Years | 0 (0.0%) | 0 (0.0%) |
| 15 Years | 0 (0.0%) | 0 (0.0%) |
| 16 and 17 Years | 0 (0.0%) | 0 (0.0%) |
| 18 to 24 Years | 139 (51.5%) | 288 (73.5%) |
| 25 to 34 Years | 0 (0.0%) | 2 (0.5%) |
| 35 to 44 Years | 0 (0.0%) | 0 (0.0%) |
| 45 to 54 Years | 38 (15.6%) | 0 (0.0%) |
| 55 to 64 Years | 28 (7.9%) | 0 (0.0%) |
| 65 to 74 Years | 0 (0.0%) | 0 (0.0%) |
| 75 Years and over | 0 (0.0%) | 22 (8.4%) |
| Total | 205 (9.7%) | 312 (12.9%) |
Income Above Poverty by Sex and Age in Chadron
According to the poverty statistics in Chadron, males aged under 5 years and females aged under 5 years are the age groups that are most secure financially, with 100.0% of males and 100.0% of females in these age groups living above the poverty line.
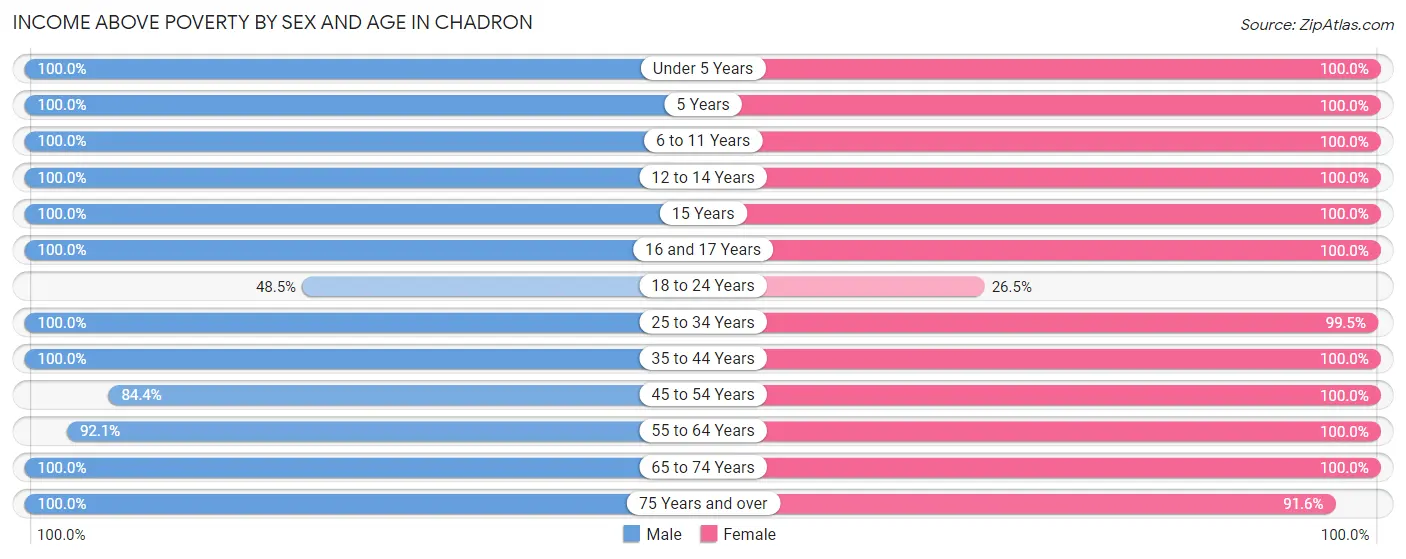
| Age Bracket | Male | Female |
| Under 5 Years | 142 (100.0%) | 154 (100.0%) |
| 5 Years | 28 (100.0%) | 49 (100.0%) |
| 6 to 11 Years | 112 (100.0%) | 188 (100.0%) |
| 12 to 14 Years | 74 (100.0%) | 79 (100.0%) |
| 15 Years | 21 (100.0%) | 8 (100.0%) |
| 16 and 17 Years | 71 (100.0%) | 44 (100.0%) |
| 18 to 24 Years | 131 (48.5%) | 104 (26.5%) |
| 25 to 34 Years | 274 (100.0%) | 380 (99.5%) |
| 35 to 44 Years | 294 (100.0%) | 248 (100.0%) |
| 45 to 54 Years | 206 (84.4%) | 164 (100.0%) |
| 55 to 64 Years | 328 (92.1%) | 256 (100.0%) |
| 65 to 74 Years | 112 (100.0%) | 195 (100.0%) |
| 75 Years and over | 126 (100.0%) | 240 (91.6%) |
| Total | 1,919 (90.3%) | 2,109 (87.1%) |
Income Below Poverty Among Married-Couple Families in Chadron
The poverty statistics for married-couple families in Chadron show that 1.6% or 15 of the total 917 families live below the poverty line. Families with no children have the highest poverty rate of 3.2%, comprising of 15 families. On the other hand, families with 1 or 2 children have the lowest poverty rate of 0.0%, which includes 0 families.
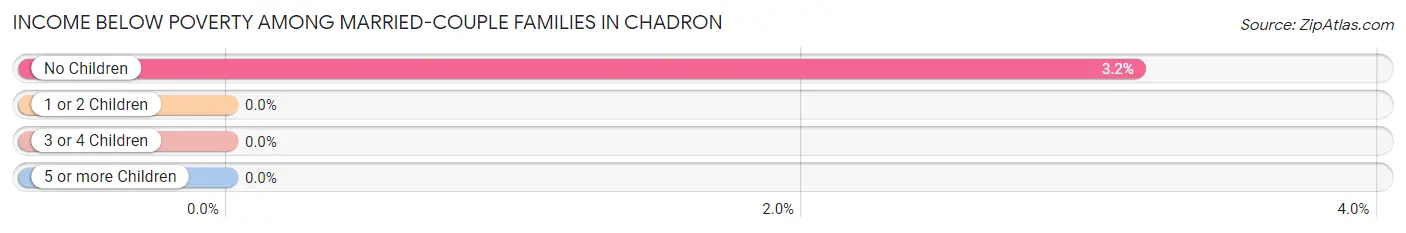
| Children | Above Poverty | Below Poverty |
| No Children | 459 (96.8%) | 15 (3.2%) |
| 1 or 2 Children | 379 (100.0%) | 0 (0.0%) |
| 3 or 4 Children | 46 (100.0%) | 0 (0.0%) |
| 5 or more Children | 18 (100.0%) | 0 (0.0%) |
| Total | 902 (98.4%) | 15 (1.6%) |
Income Below Poverty Among Single-Parent Households in Chadron
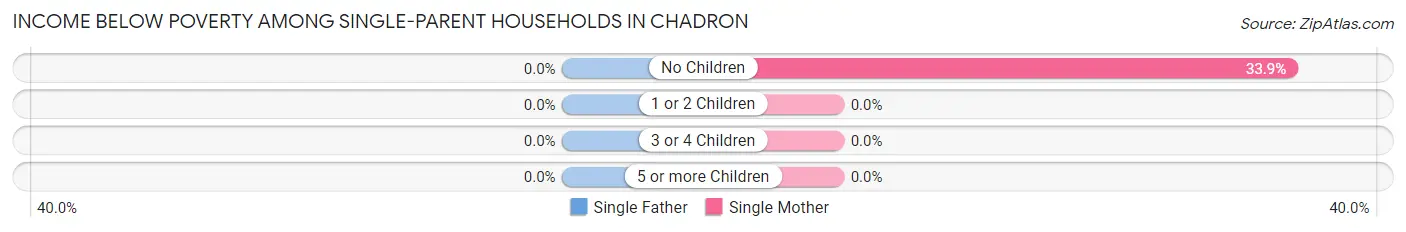
| Children | Single Father | Single Mother |
| No Children | 0 (0.0%) | 22 (33.9%) |
| 1 or 2 Children | 0 (0.0%) | 0 (0.0%) |
| 3 or 4 Children | 0 (0.0%) | 0 (0.0%) |
| 5 or more Children | 0 (0.0%) | 0 (0.0%) |
| Total | 0 (0.0%) | 22 (21.6%) |
Income Below Poverty Among Married-Couple vs Single-Parent Households in Chadron
The poverty data for Chadron shows that 15 of the married-couple family households (1.6%) and 22 of the single-parent households (10.1%) are living below the poverty level. Within the married-couple family households, those with no children have the highest poverty rate, with 15 households (3.2%) falling below the poverty line. Among the single-parent households, those with no children have the highest poverty rate, with 22 household (26.8%) living below poverty.
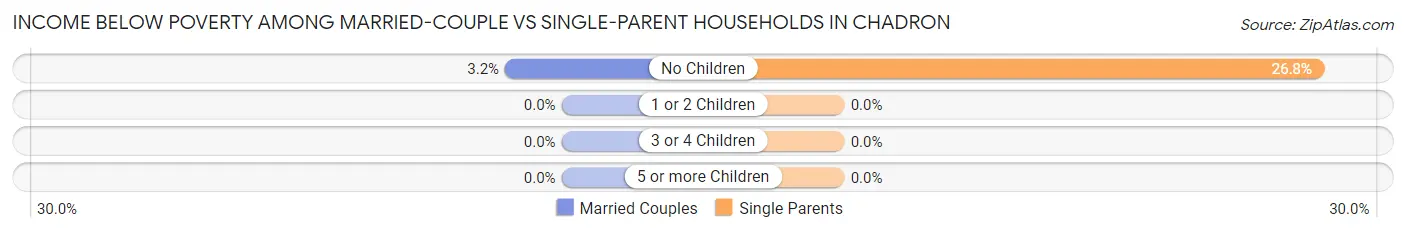
| Children | Married-Couple Families | Single-Parent Households |
| No Children | 15 (3.2%) | 22 (26.8%) |
| 1 or 2 Children | 0 (0.0%) | 0 (0.0%) |
| 3 or 4 Children | 0 (0.0%) | 0 (0.0%) |
| 5 or more Children | 0 (0.0%) | 0 (0.0%) |
| Total | 15 (1.6%) | 22 (10.1%) |
Race in Chadron
The most populous races in Chadron are White / Caucasian (4,634 | 88.2%), Two or more Races (269 | 5.1%), and Black / African American (194 | 3.7%).
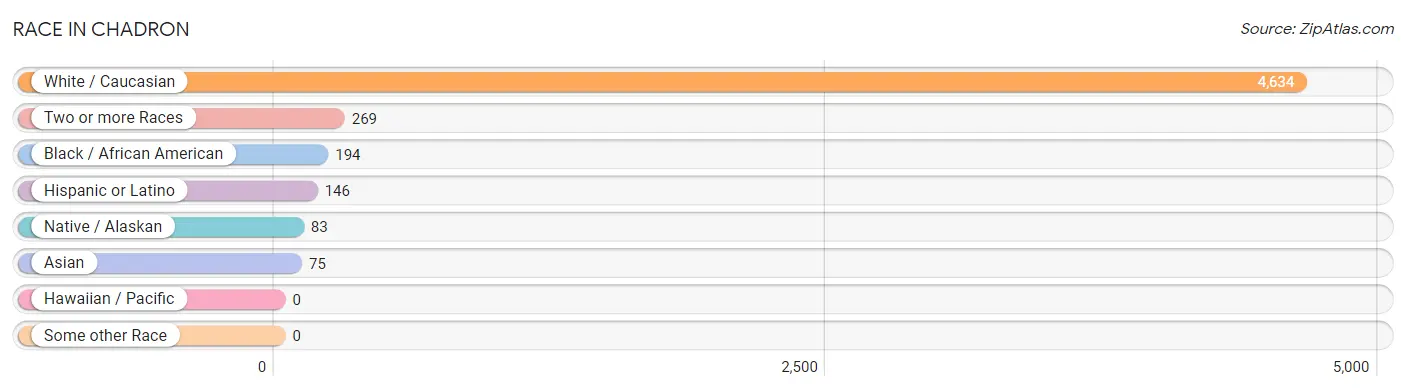
| Race | # Population | % Population |
| Asian | 75 | 1.4% |
| Black / African American | 194 | 3.7% |
| Hawaiian / Pacific | 0 | 0.0% |
| Hispanic or Latino | 146 | 2.8% |
| Native / Alaskan | 83 | 1.6% |
| White / Caucasian | 4,634 | 88.2% |
| Two or more Races | 269 | 5.1% |
| Some other Race | 0 | 0.0% |
| Total | 5,255 | 100.0% |
Ancestry in Chadron
The most populous ancestries reported in Chadron are German (1,656 | 31.5%), English (715 | 13.6%), Irish (589 | 11.2%), Czech (302 | 5.8%), and Danish (224 | 4.3%), together accounting for 66.3% of all Chadron residents.
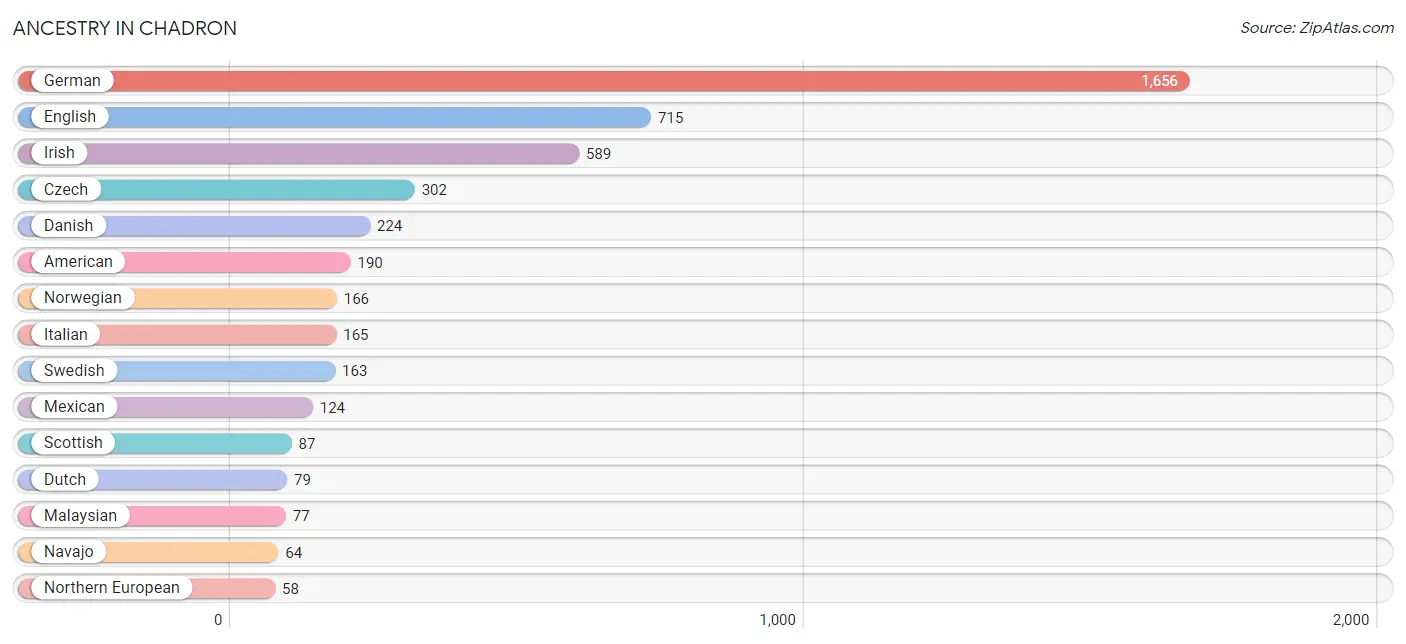
| Ancestry | # Population | % Population |
| African | 5 | 0.1% |
| American | 190 | 3.6% |
| Apache | 8 | 0.2% |
| Arab | 2 | 0.0% |
| Bhutanese | 13 | 0.3% |
| Canadian | 5 | 0.1% |
| Cherokee | 17 | 0.3% |
| Czech | 302 | 5.8% |
| Czechoslovakian | 30 | 0.6% |
| Danish | 224 | 4.3% |
| Dutch | 79 | 1.5% |
| English | 715 | 13.6% |
| European | 39 | 0.7% |
| Filipino | 54 | 1.0% |
| Finnish | 23 | 0.4% |
| French | 49 | 0.9% |
| German | 1,656 | 31.5% |
| Hungarian | 22 | 0.4% |
| Indian (Asian) | 3 | 0.1% |
| Irish | 589 | 11.2% |
| Italian | 165 | 3.1% |
| Korean | 4 | 0.1% |
| Lebanese | 2 | 0.0% |
| Malaysian | 77 | 1.5% |
| Mexican | 124 | 2.4% |
| Native Hawaiian | 1 | 0.0% |
| Navajo | 64 | 1.2% |
| Nigerian | 5 | 0.1% |
| Northern European | 58 | 1.1% |
| Norwegian | 166 | 3.2% |
| Pennsylvania German | 19 | 0.4% |
| Polish | 30 | 0.6% |
| Puerto Rican | 14 | 0.3% |
| Russian | 3 | 0.1% |
| Scotch-Irish | 46 | 0.9% |
| Scottish | 87 | 1.7% |
| Sioux | 49 | 0.9% |
| Spaniard | 8 | 0.2% |
| Subsaharan African | 10 | 0.2% |
| Swedish | 163 | 3.1% |
| Swiss | 50 | 0.9% |
| Syrian | 2 | 0.0% |
| Thai | 4 | 0.1% |
| Ukrainian | 15 | 0.3% |
| Welsh | 32 | 0.6% |
| Yugoslavian | 22 | 0.4% | View All 46 Rows |
Immigrants in Chadron
The most numerous immigrant groups reported in Chadron came from Asia (22 | 0.4%), China (22 | 0.4%), Eastern Asia (22 | 0.4%), Taiwan (19 | 0.4%), and Central America (12 | 0.2%), together accounting for 1.8% of all Chadron residents.
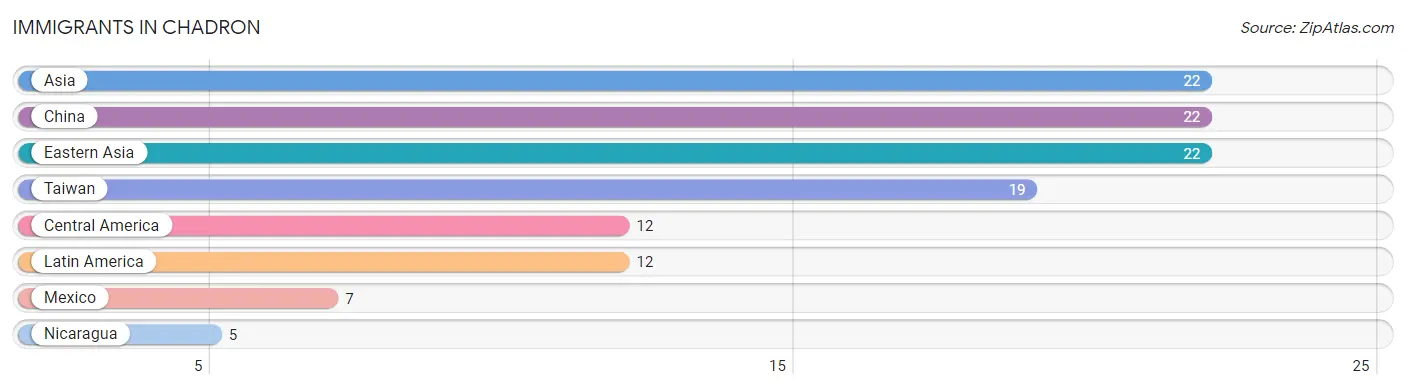
| Immigration Origin | # Population | % Population |
| Asia | 22 | 0.4% |
| Central America | 12 | 0.2% |
| China | 22 | 0.4% |
| Eastern Asia | 22 | 0.4% |
| Latin America | 12 | 0.2% |
| Mexico | 7 | 0.1% |
| Nicaragua | 5 | 0.1% |
| Taiwan | 19 | 0.4% | View All 8 Rows |
Sex and Age in Chadron
Sex and Age in Chadron
The most populous age groups in Chadron are 15 to 19 Years (368 | 14.7%) for men and 15 to 19 Years (392 | 14.2%) for women.
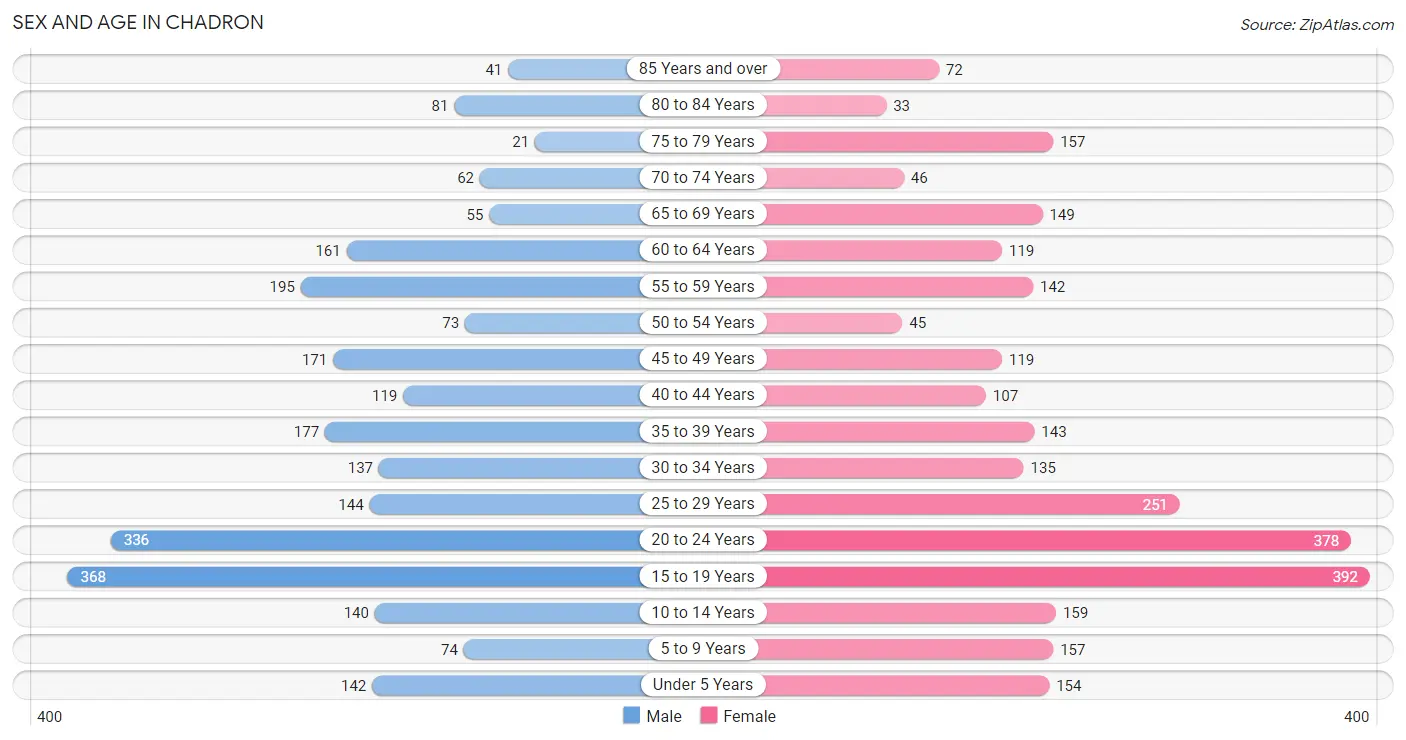
| Age Bracket | Male | Female |
| Under 5 Years | 142 (5.7%) | 154 (5.6%) |
| 5 to 9 Years | 74 (3.0%) | 157 (5.7%) |
| 10 to 14 Years | 140 (5.6%) | 159 (5.8%) |
| 15 to 19 Years | 368 (14.7%) | 392 (14.2%) |
| 20 to 24 Years | 336 (13.5%) | 378 (13.7%) |
| 25 to 29 Years | 144 (5.8%) | 251 (9.1%) |
| 30 to 34 Years | 137 (5.5%) | 135 (4.9%) |
| 35 to 39 Years | 177 (7.1%) | 143 (5.2%) |
| 40 to 44 Years | 119 (4.8%) | 107 (3.9%) |
| 45 to 49 Years | 171 (6.9%) | 119 (4.3%) |
| 50 to 54 Years | 73 (2.9%) | 45 (1.6%) |
| 55 to 59 Years | 195 (7.8%) | 142 (5.1%) |
| 60 to 64 Years | 161 (6.5%) | 119 (4.3%) |
| 65 to 69 Years | 55 (2.2%) | 149 (5.4%) |
| 70 to 74 Years | 62 (2.5%) | 46 (1.7%) |
| 75 to 79 Years | 21 (0.8%) | 157 (5.7%) |
| 80 to 84 Years | 81 (3.2%) | 33 (1.2%) |
| 85 Years and over | 41 (1.6%) | 72 (2.6%) |
| Total | 2,497 (100.0%) | 2,758 (100.0%) |
Families and Households in Chadron
Median Family Size in Chadron
The median family size in Chadron is 2.80 persons per family, with single male/father families (117 | 10.3%) accounting for the largest median family size of 2.92 persons per family. On the other hand, single female/mother families (102 | 9.0%) represent the smallest median family size with 2.35 persons per family.
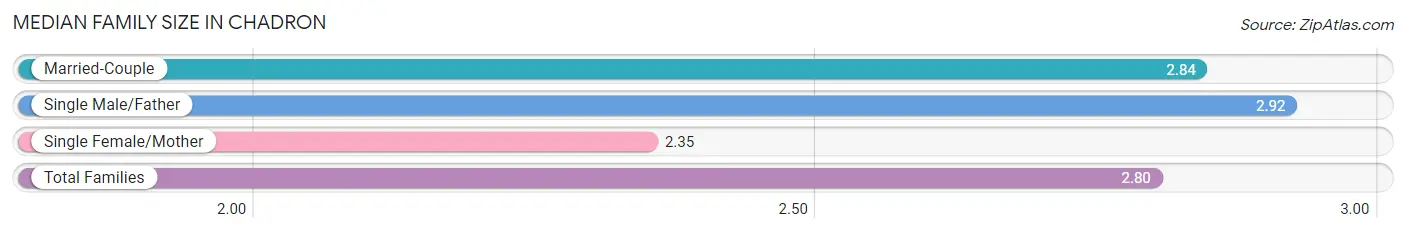
| Family Type | # Families | Family Size |
| Married-Couple | 917 (80.7%) | 2.84 |
| Single Male/Father | 117 (10.3%) | 2.92 |
| Single Female/Mother | 102 (9.0%) | 2.35 |
| Total Families | 1,136 (100.0%) | 2.80 |
Median Household Size in Chadron
The median household size in Chadron is 2.09 persons per household, with single male/father households (117 | 5.4%) accounting for the largest median household size of 3.44 persons per household. non-family households (1,026 | 47.5%) represent the smallest median household size with 1.24 persons per household.
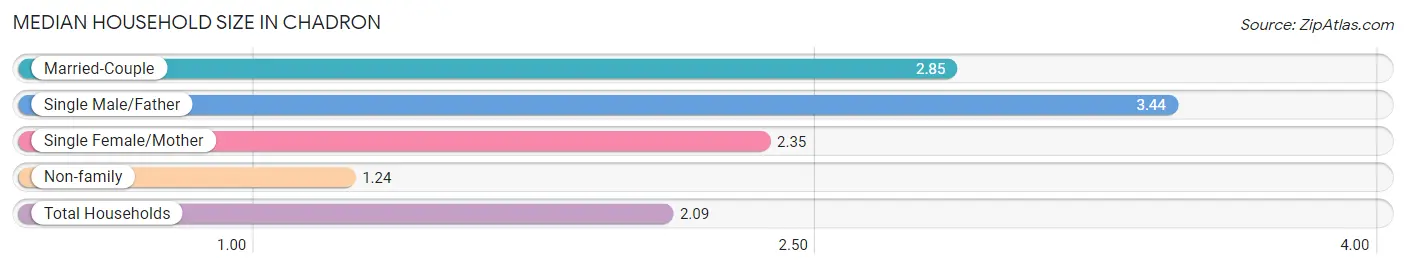
| Household Type | # Households | Household Size |
| Married-Couple | 917 (42.4%) | 2.85 |
| Single Male/Father | 117 (5.4%) | 3.44 |
| Single Female/Mother | 102 (4.7%) | 2.35 |
| Non-family | 1,026 (47.5%) | 1.24 |
| Total Households | 2,162 (100.0%) | 2.09 |
Household Size by Marriage Status in Chadron
Out of a total of 2,162 households in Chadron, 1,136 (52.5%) are family households, while 1,026 (47.5%) are nonfamily households. The most numerous type of family households are 2-person households, comprising 568, and the most common type of nonfamily households are 1-person households, comprising 844.
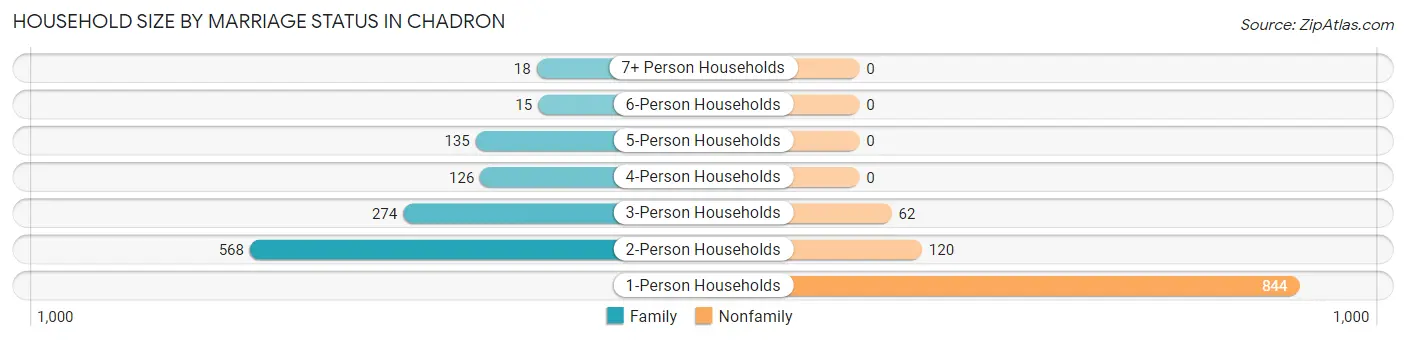
| Household Size | Family Households | Nonfamily Households |
| 1-Person Households | - | 844 (39.0%) |
| 2-Person Households | 568 (26.3%) | 120 (5.6%) |
| 3-Person Households | 274 (12.7%) | 62 (2.9%) |
| 4-Person Households | 126 (5.8%) | 0 (0.0%) |
| 5-Person Households | 135 (6.2%) | 0 (0.0%) |
| 6-Person Households | 15 (0.7%) | 0 (0.0%) |
| 7+ Person Households | 18 (0.8%) | 0 (0.0%) |
| Total | 1,136 (52.5%) | 1,026 (47.5%) |
Female Fertility in Chadron
Fertility by Age in Chadron
Average fertility rate in Chadron is 62.0 births per 1,000 women. Women in the age bracket of 20 to 34 years have the highest fertility rate with 107.0 births per 1,000 women. Women in the age bracket of 20 to 34 years acount for 84.5% of all women with births.
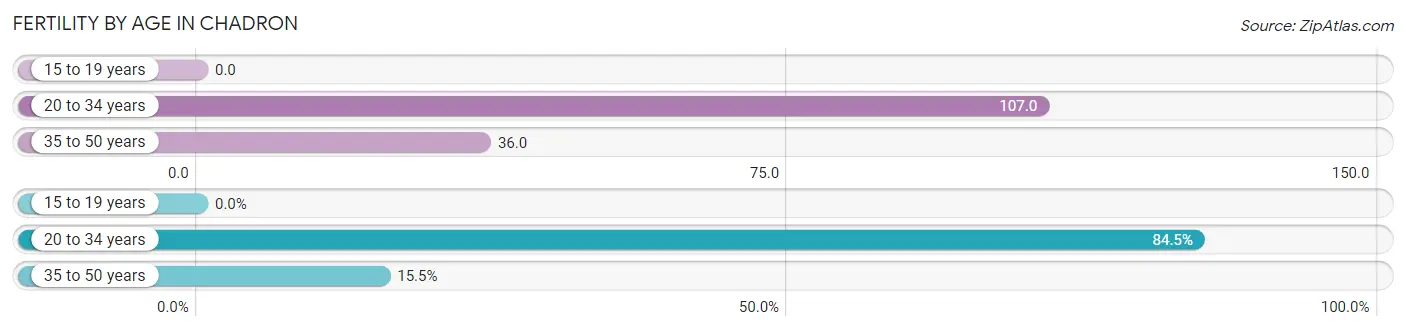
| Age Bracket | Women with Births | Births / 1,000 Women |
| 15 to 19 years | 0 (0.0%) | 0.0 |
| 20 to 34 years | 82 (84.5%) | 107.0 |
| 35 to 50 years | 15 (15.5%) | 36.0 |
| Total | 97 (100.0%) | 62.0 |
Fertility by Age by Marriage Status in Chadron
99.0% of women with births (97) in Chadron are married. The highest percentage of unmarried women with births falls into 20 to 34 years age bracket with 1.2% of them unmarried at the time of birth, while the lowest percentage of unmarried women with births belong to 35 to 50 years age bracket with 0.0% of them unmarried.
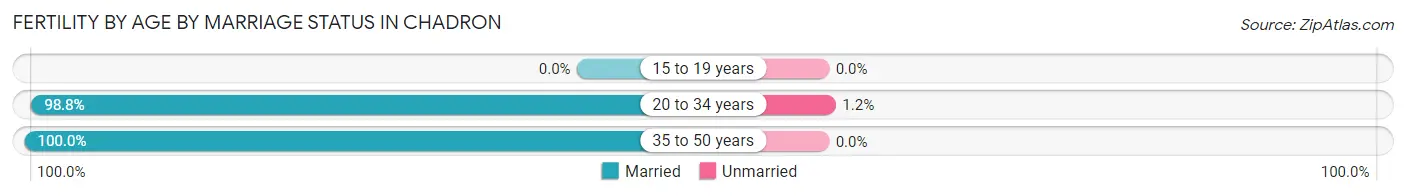
| Age Bracket | Married | Unmarried |
| 15 to 19 years | 0 (0.0%) | 0 (0.0%) |
| 20 to 34 years | 81 (98.8%) | 1 (1.2%) |
| 35 to 50 years | 15 (100.0%) | 0 (0.0%) |
| Total | 96 (99.0%) | 1 (1.0%) |
Fertility by Education in Chadron
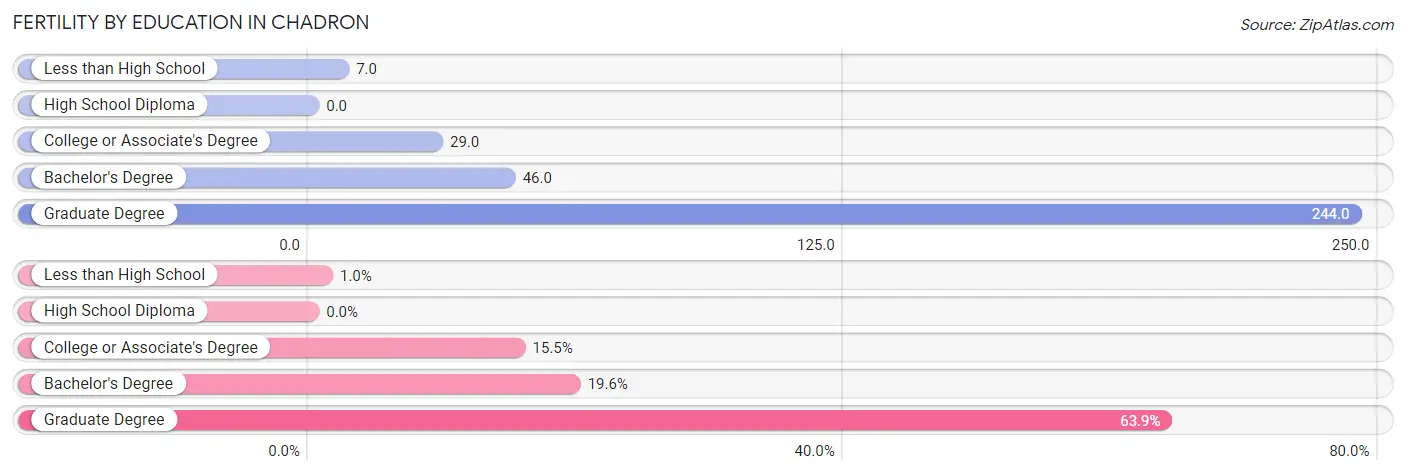
| Educational Attainment | Women with Births | Births / 1,000 Women |
| Less than High School | 1 (1.0%) | 7.0 |
| High School Diploma | 0 (0.0%) | 0.0 |
| College or Associate's Degree | 15 (15.5%) | 29.0 |
| Bachelor's Degree | 19 (19.6%) | 46.0 |
| Graduate Degree | 62 (63.9%) | 244.0 |
| Total | 97 (100.0%) | 62.0 |
Fertility by Education by Marriage Status in Chadron
1.0% of women with births in Chadron are unmarried. Women with the educational attainment of college or associate's degree are most likely to be married with 100.0% of them married at childbirth, while women with the educational attainment of less than high school are least likely to be married with 100.0% of them unmarried at childbirth.
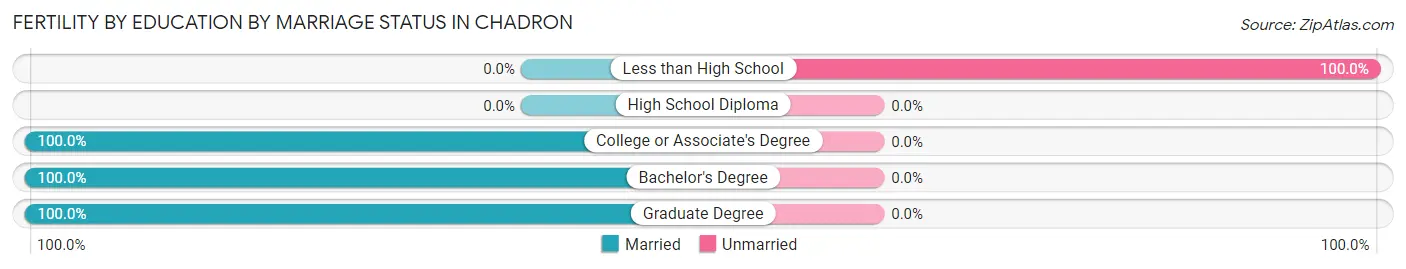
| Educational Attainment | Married | Unmarried |
| Less than High School | 0 (0.0%) | 1 (100.0%) |
| High School Diploma | 0 (0.0%) | 0 (0.0%) |
| College or Associate's Degree | 15 (100.0%) | 0 (0.0%) |
| Bachelor's Degree | 19 (100.0%) | 0 (0.0%) |
| Graduate Degree | 62 (100.0%) | 0 (0.0%) |
| Total | 96 (99.0%) | 1 (1.0%) |
Employment Characteristics in Chadron
Employment by Class of Employer in Chadron
Among the 2,907 employed individuals in Chadron, private company employees (1,140 | 39.2%), state government employees (937 | 32.2%), and local government employees (423 | 14.5%) make up the most common classes of employment.
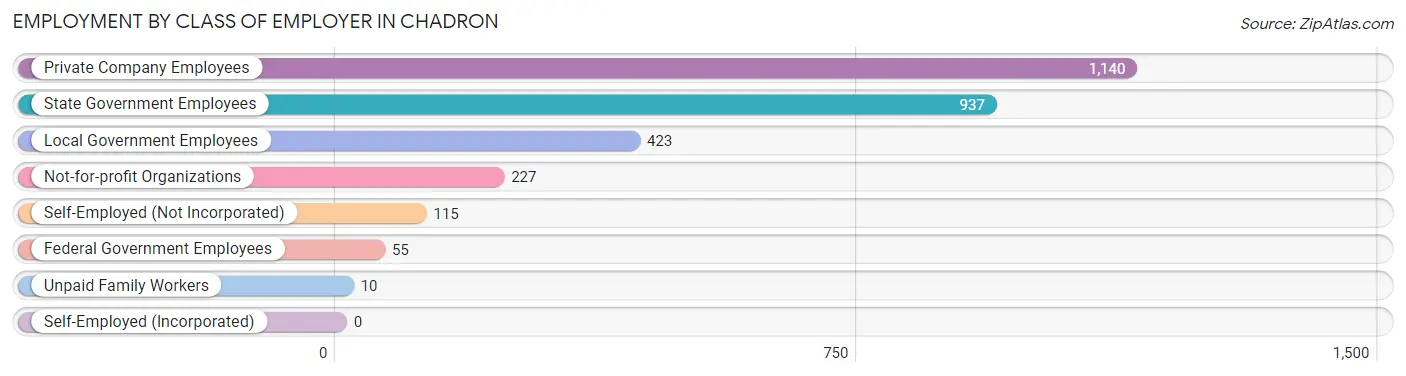
| Employer Class | # Employees | % Employees |
| Private Company Employees | 1,140 | 39.2% |
| Self-Employed (Incorporated) | 0 | 0.0% |
| Self-Employed (Not Incorporated) | 115 | 4.0% |
| Not-for-profit Organizations | 227 | 7.8% |
| Local Government Employees | 423 | 14.5% |
| State Government Employees | 937 | 32.2% |
| Federal Government Employees | 55 | 1.9% |
| Unpaid Family Workers | 10 | 0.3% |
| Total | 2,907 | 100.0% |
Employment Status by Age in Chadron
According to the labor force statistics for Chadron, out of the total population over 16 years of age (4,400), 68.2% or 3,001 individuals are in the labor force, with 1.8% or 54 of them unemployed. The age group with the highest labor force participation rate is 35 to 44 years, with 99.3% or 542 individuals in the labor force. Within the labor force, the 60 to 64 years age range has the highest percentage of unemployed individuals, with 15.3% or 20 of them being unemployed.
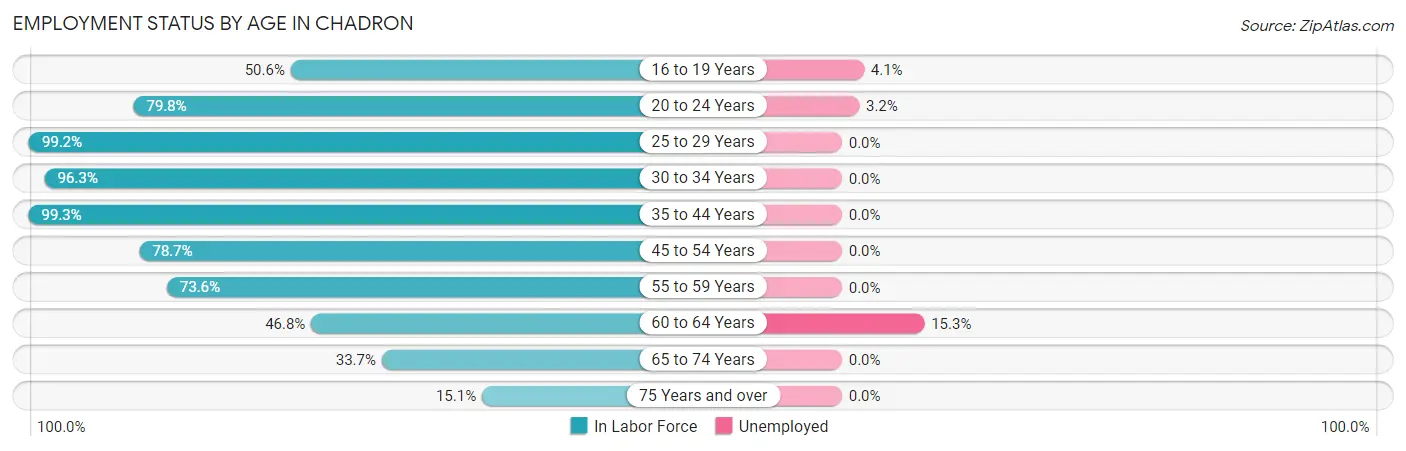
| Age Bracket | In Labor Force | Unemployed |
| 16 to 19 Years | 370 (50.6%) | 15 (4.1%) |
| 20 to 24 Years | 570 (79.8%) | 18 (3.2%) |
| 25 to 29 Years | 392 (99.2%) | 0 (0.0%) |
| 30 to 34 Years | 262 (96.3%) | 0 (0.0%) |
| 35 to 44 Years | 542 (99.3%) | 0 (0.0%) |
| 45 to 54 Years | 321 (78.7%) | 0 (0.0%) |
| 55 to 59 Years | 248 (73.6%) | 0 (0.0%) |
| 60 to 64 Years | 131 (46.8%) | 20 (15.3%) |
| 65 to 74 Years | 105 (33.7%) | 0 (0.0%) |
| 75 Years and over | 61 (15.1%) | 0 (0.0%) |
| Total | 3,001 (68.2%) | 54 (1.8%) |
Employment Status by Educational Attainment in Chadron
According to labor force statistics for Chadron, 84.7% of individuals (1,896) out of the total population between 25 and 64 years of age (2,238) are in the labor force, with 1.1% or 21 of them being unemployed. The group with the highest labor force participation rate are those with the educational attainment of less than high school, with 94.3% or 150 individuals in the labor force. Within the labor force, individuals with bachelor's degree or higher education have the highest percentage of unemployment, with 2.0% or 20 of them being unemployed.
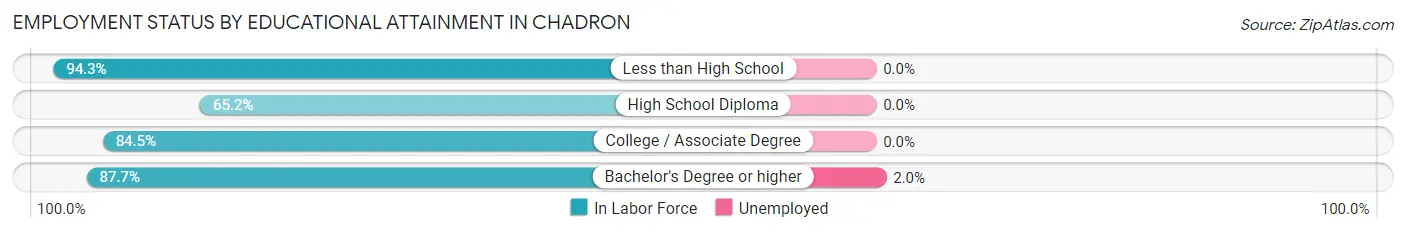
| Educational Attainment | In Labor Force | Unemployed |
| Less than High School | 150 (94.3%) | 0 (0.0%) |
| High School Diploma | 159 (65.2%) | 0 (0.0%) |
| College / Associate Degree | 599 (84.5%) | 0 (0.0%) |
| Bachelor's Degree or higher | 988 (87.7%) | 23 (2.0%) |
| Total | 1,896 (84.7%) | 25 (1.1%) |
Employment Occupations by Sex in Chadron
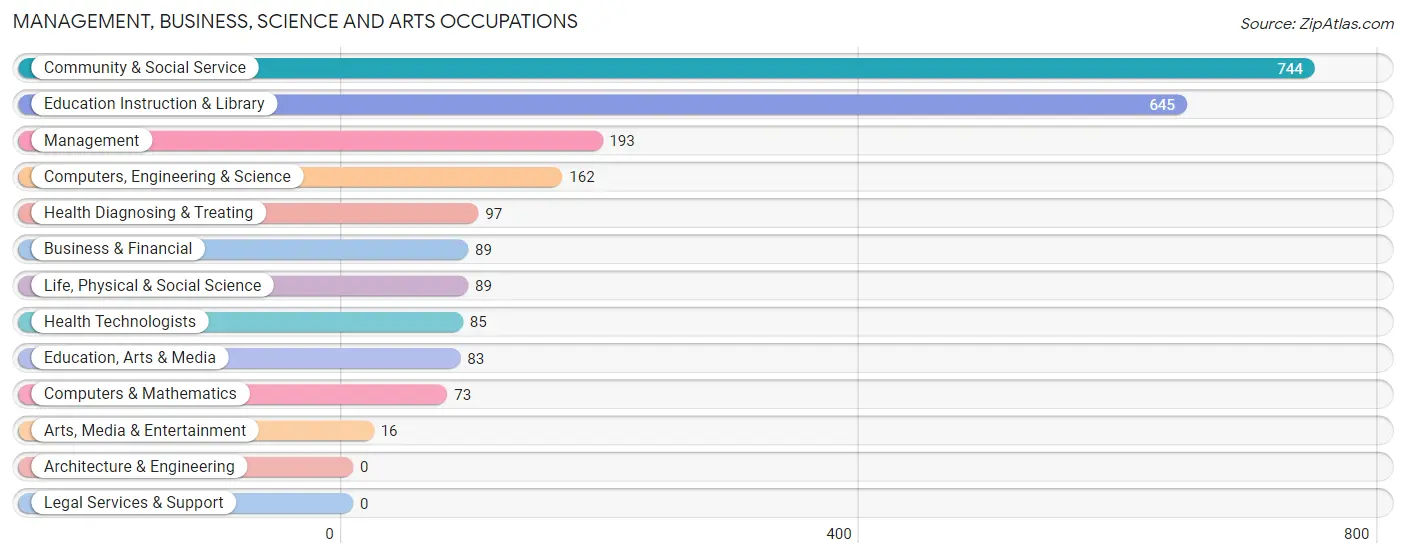
Management, Business, Science and Arts Occupations
The most common Management, Business, Science and Arts occupations in Chadron are Community & Social Service (744 | 25.2%), Education Instruction & Library (645 | 21.9%), Management (193 | 6.5%), Computers, Engineering & Science (162 | 5.5%), and Health Diagnosing & Treating (97 | 3.3%).
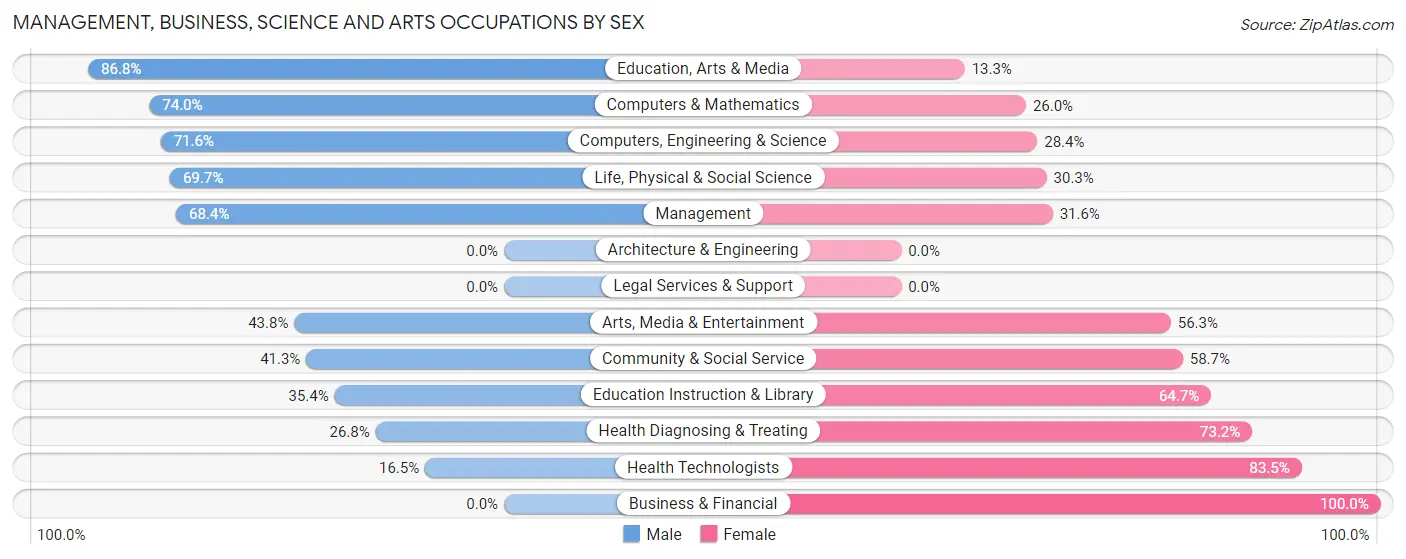
Management, Business, Science and Arts Occupations by Sex
Within the Management, Business, Science and Arts occupations in Chadron, the most male-oriented occupations are Education, Arts & Media (86.8%), Computers & Mathematics (74.0%), and Computers, Engineering & Science (71.6%), while the most female-oriented occupations are Business & Financial (100.0%), Health Technologists (83.5%), and Health Diagnosing & Treating (73.2%).
| Occupation | Male | Female |
| Management | 132 (68.4%) | 61 (31.6%) |
| Business & Financial | 0 (0.0%) | 89 (100.0%) |
| Computers, Engineering & Science | 116 (71.6%) | 46 (28.4%) |
| Computers & Mathematics | 54 (74.0%) | 19 (26.0%) |
| Architecture & Engineering | 0 (0.0%) | 0 (0.0%) |
| Life, Physical & Social Science | 62 (69.7%) | 27 (30.3%) |
| Community & Social Service | 307 (41.3%) | 437 (58.7%) |
| Education, Arts & Media | 72 (86.8%) | 11 (13.3%) |
| Legal Services & Support | 0 (0.0%) | 0 (0.0%) |
| Education Instruction & Library | 228 (35.3%) | 417 (64.6%) |
| Arts, Media & Entertainment | 7 (43.8%) | 9 (56.2%) |
| Health Diagnosing & Treating | 26 (26.8%) | 71 (73.2%) |
| Health Technologists | 14 (16.5%) | 71 (83.5%) |
| Total (Category) | 581 (45.2%) | 704 (54.8%) |
| Total (Overall) | 1,453 (49.3%) | 1,496 (50.7%) |
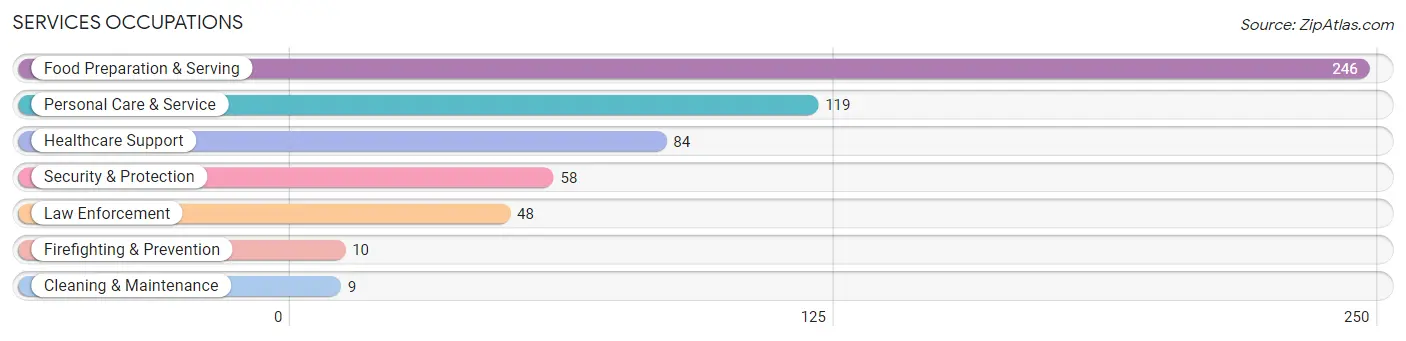
Services Occupations
The most common Services occupations in Chadron are Food Preparation & Serving (246 | 8.3%), Personal Care & Service (119 | 4.0%), Healthcare Support (84 | 2.9%), Security & Protection (58 | 2.0%), and Law Enforcement (48 | 1.6%).
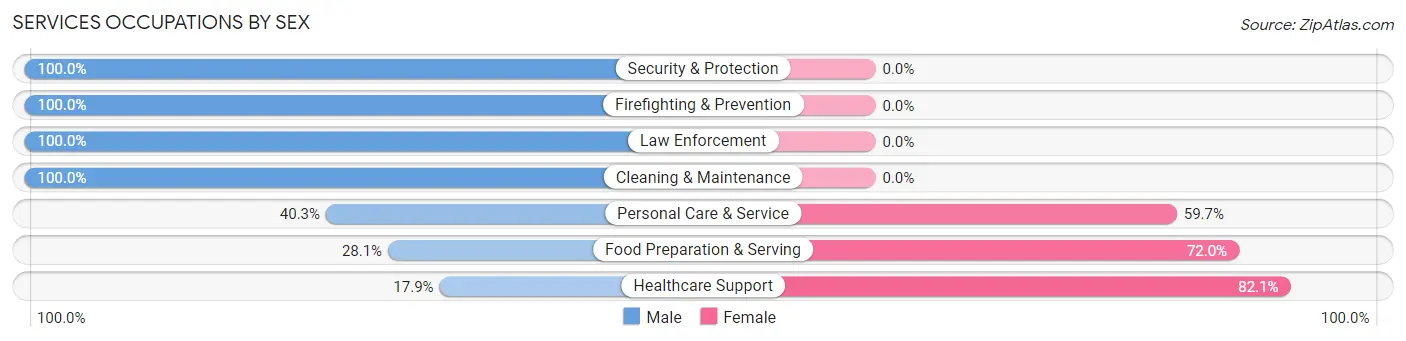
Services Occupations by Sex
Within the Services occupations in Chadron, the most male-oriented occupations are Security & Protection (100.0%), Firefighting & Prevention (100.0%), and Law Enforcement (100.0%), while the most female-oriented occupations are Healthcare Support (82.1%), Food Preparation & Serving (72.0%), and Personal Care & Service (59.7%).
| Occupation | Male | Female |
| Healthcare Support | 15 (17.9%) | 69 (82.1%) |
| Security & Protection | 58 (100.0%) | 0 (0.0%) |
| Firefighting & Prevention | 10 (100.0%) | 0 (0.0%) |
| Law Enforcement | 48 (100.0%) | 0 (0.0%) |
| Food Preparation & Serving | 69 (28.1%) | 177 (72.0%) |
| Cleaning & Maintenance | 9 (100.0%) | 0 (0.0%) |
| Personal Care & Service | 48 (40.3%) | 71 (59.7%) |
| Total (Category) | 199 (38.6%) | 317 (61.4%) |
| Total (Overall) | 1,453 (49.3%) | 1,496 (50.7%) |
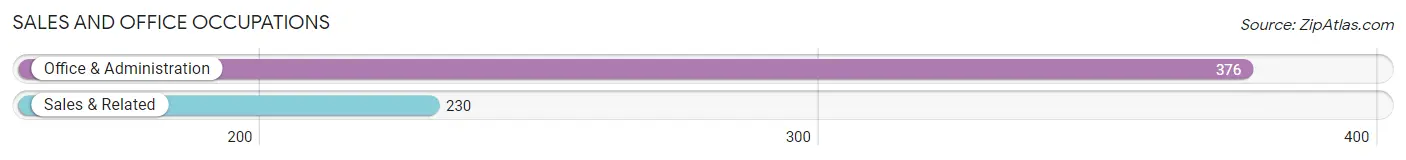
Sales and Office Occupations
The most common Sales and Office occupations in Chadron are Office & Administration (376 | 12.8%), and Sales & Related (230 | 7.8%).
Sales and Office Occupations by Sex
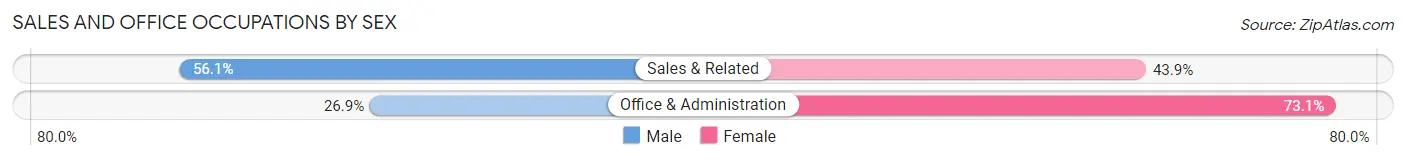
| Occupation | Male | Female |
| Sales & Related | 129 (56.1%) | 101 (43.9%) |
| Office & Administration | 101 (26.9%) | 275 (73.1%) |
| Total (Category) | 230 (38.0%) | 376 (62.1%) |
| Total (Overall) | 1,453 (49.3%) | 1,496 (50.7%) |
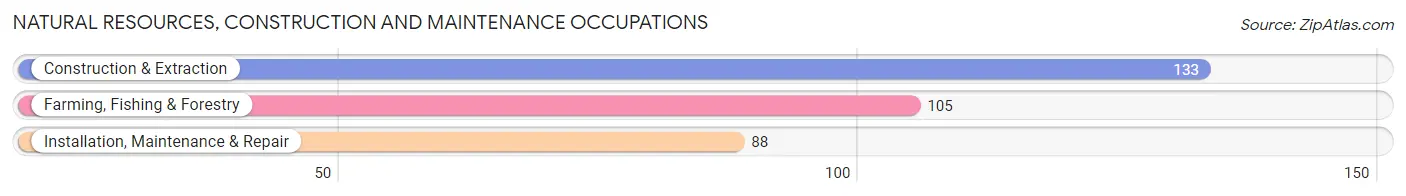
Natural Resources, Construction and Maintenance Occupations
The most common Natural Resources, Construction and Maintenance occupations in Chadron are Construction & Extraction (133 | 4.5%), Farming, Fishing & Forestry (105 | 3.6%), and Installation, Maintenance & Repair (88 | 3.0%).
Natural Resources, Construction and Maintenance Occupations by Sex
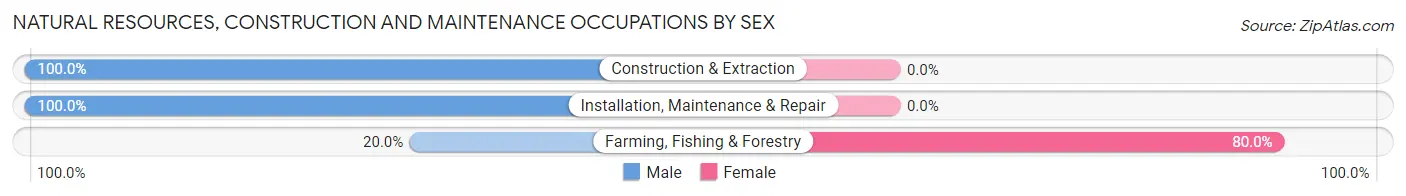
| Occupation | Male | Female |
| Farming, Fishing & Forestry | 21 (20.0%) | 84 (80.0%) |
| Construction & Extraction | 133 (100.0%) | 0 (0.0%) |
| Installation, Maintenance & Repair | 88 (100.0%) | 0 (0.0%) |
| Total (Category) | 242 (74.2%) | 84 (25.8%) |
| Total (Overall) | 1,453 (49.3%) | 1,496 (50.7%) |
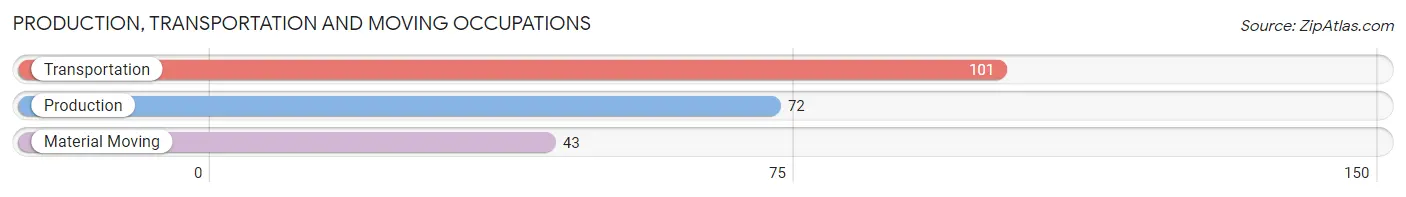
Production, Transportation and Moving Occupations
The most common Production, Transportation and Moving occupations in Chadron are Transportation (101 | 3.4%), Production (72 | 2.4%), and Material Moving (43 | 1.5%).
Production, Transportation and Moving Occupations by Sex
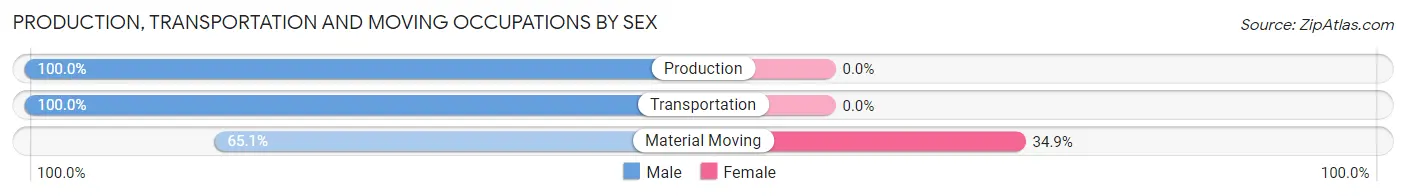
| Occupation | Male | Female |
| Production | 72 (100.0%) | 0 (0.0%) |
| Transportation | 101 (100.0%) | 0 (0.0%) |
| Material Moving | 28 (65.1%) | 15 (34.9%) |
| Total (Category) | 201 (93.1%) | 15 (6.9%) |
| Total (Overall) | 1,453 (49.3%) | 1,496 (50.7%) |
Employment Industries by Sex in Chadron
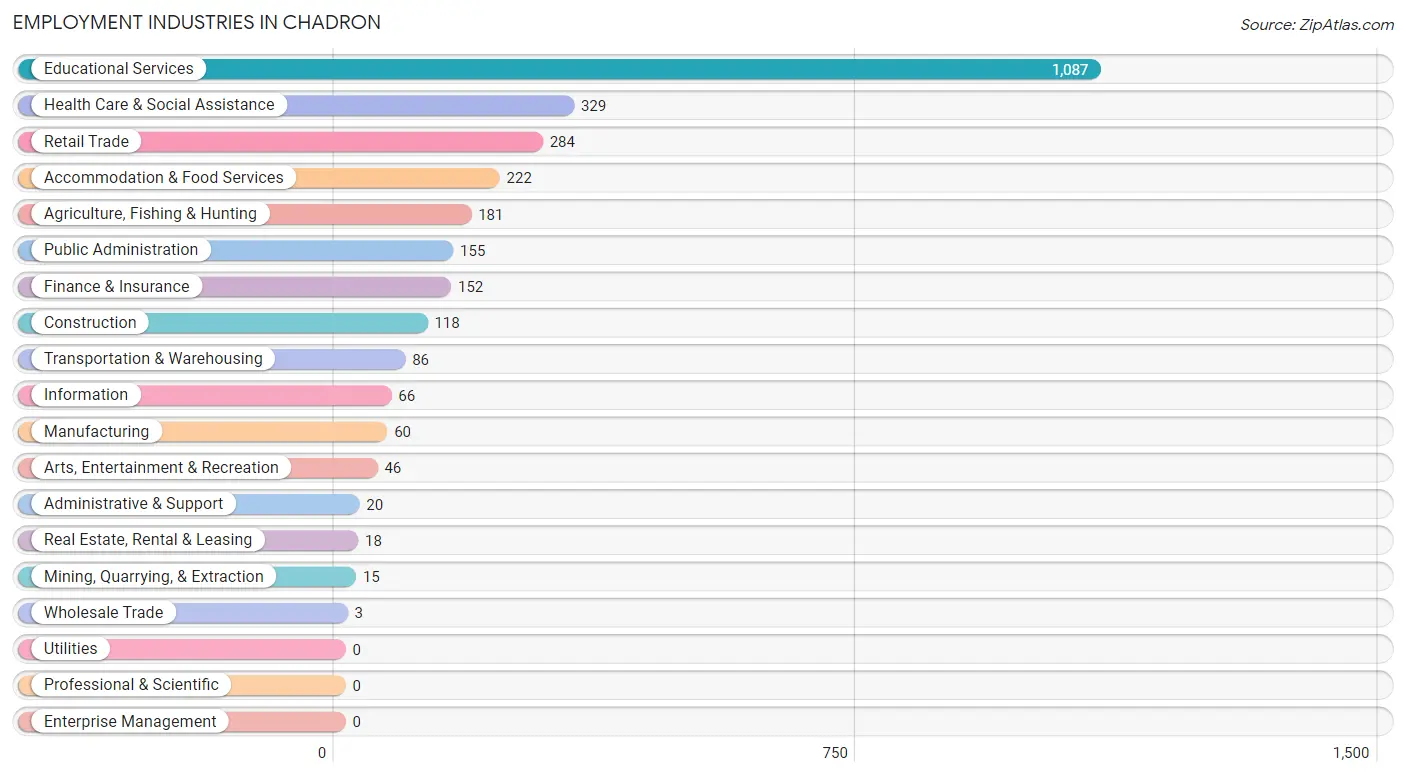
Employment Industries in Chadron
The major employment industries in Chadron include Educational Services (1,087 | 36.9%), Health Care & Social Assistance (329 | 11.2%), Retail Trade (284 | 9.6%), Accommodation & Food Services (222 | 7.5%), and Agriculture, Fishing & Hunting (181 | 6.1%).
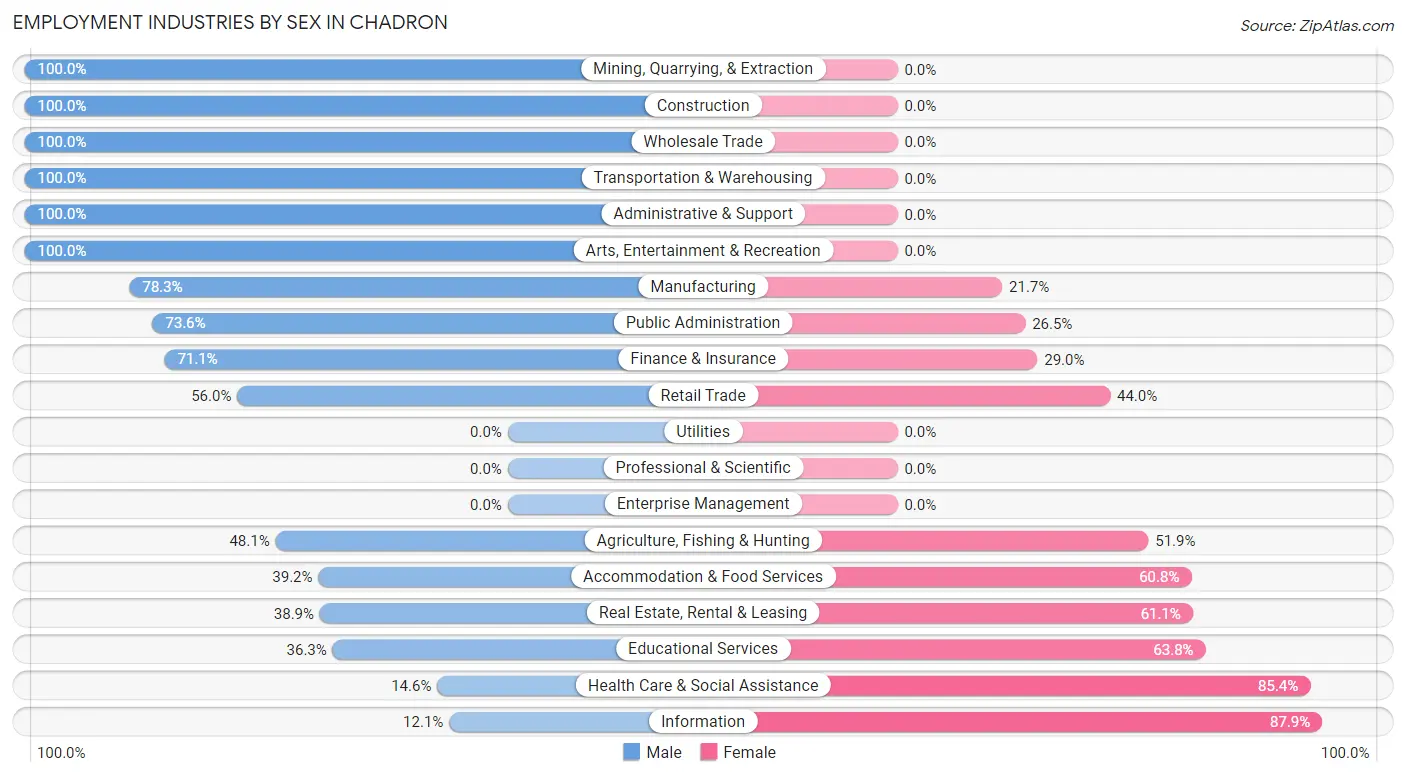
Employment Industries by Sex in Chadron
The Chadron industries that see more men than women are Mining, Quarrying, & Extraction (100.0%), Construction (100.0%), and Wholesale Trade (100.0%), whereas the industries that tend to have a higher number of women are Information (87.9%), Health Care & Social Assistance (85.4%), and Educational Services (63.7%).
| Industry | Male | Female |
| Agriculture, Fishing & Hunting | 87 (48.1%) | 94 (51.9%) |
| Mining, Quarrying, & Extraction | 15 (100.0%) | 0 (0.0%) |
| Construction | 118 (100.0%) | 0 (0.0%) |
| Manufacturing | 47 (78.3%) | 13 (21.7%) |
| Wholesale Trade | 3 (100.0%) | 0 (0.0%) |
| Retail Trade | 159 (56.0%) | 125 (44.0%) |
| Transportation & Warehousing | 86 (100.0%) | 0 (0.0%) |
| Utilities | 0 (0.0%) | 0 (0.0%) |
| Information | 8 (12.1%) | 58 (87.9%) |
| Finance & Insurance | 108 (71.1%) | 44 (28.9%) |
| Real Estate, Rental & Leasing | 7 (38.9%) | 11 (61.1%) |
| Professional & Scientific | 0 (0.0%) | 0 (0.0%) |
| Enterprise Management | 0 (0.0%) | 0 (0.0%) |
| Administrative & Support | 20 (100.0%) | 0 (0.0%) |
| Educational Services | 394 (36.2%) | 693 (63.7%) |
| Health Care & Social Assistance | 48 (14.6%) | 281 (85.4%) |
| Arts, Entertainment & Recreation | 46 (100.0%) | 0 (0.0%) |
| Accommodation & Food Services | 87 (39.2%) | 135 (60.8%) |
| Public Administration | 114 (73.6%) | 41 (26.5%) |
| Total | 1,453 (49.3%) | 1,496 (50.7%) |
Education in Chadron
School Enrollment in Chadron
The most common levels of schooling among the 1,858 students in Chadron are college / undergraduate (1,081 | 58.2%), elementary school (227 | 12.2%), and high school (191 | 10.3%).
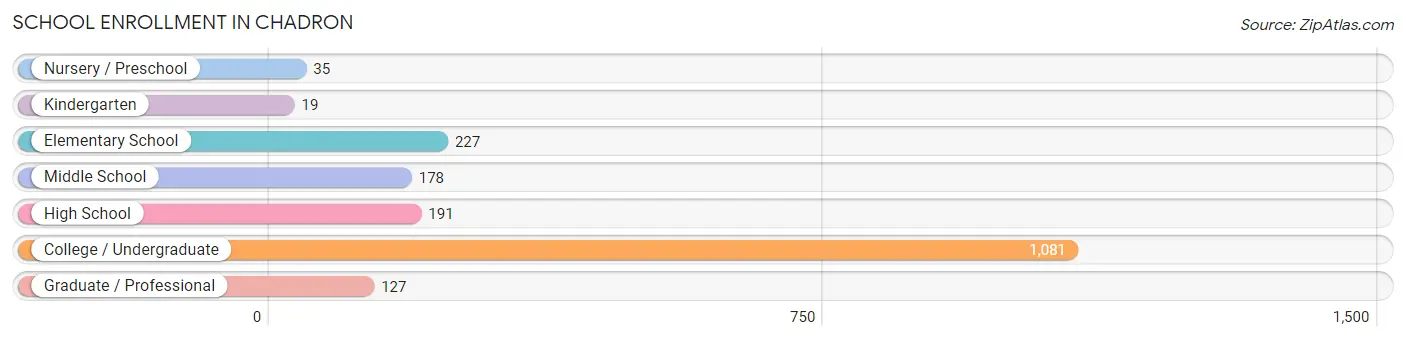
| School Level | # Students | % Students |
| Nursery / Preschool | 35 | 1.9% |
| Kindergarten | 19 | 1.0% |
| Elementary School | 227 | 12.2% |
| Middle School | 178 | 9.6% |
| High School | 191 | 10.3% |
| College / Undergraduate | 1,081 | 58.2% |
| Graduate / Professional | 127 | 6.8% |
| Total | 1,858 | 100.0% |
School Enrollment by Age by Funding Source in Chadron
Out of a total of 1,858 students who are enrolled in schools in Chadron, 175 (9.4%) attend a private institution, while the remaining 1,683 (90.6%) are enrolled in public schools. The age group of 3 to 4 year olds has the highest likelihood of being enrolled in private schools, with 26 (100.0% in the age bracket) enrolled. Conversely, the age group of 20 to 24 year olds has the lowest likelihood of being enrolled in a private school, with 566 (97.4% in the age bracket) attending a public institution.
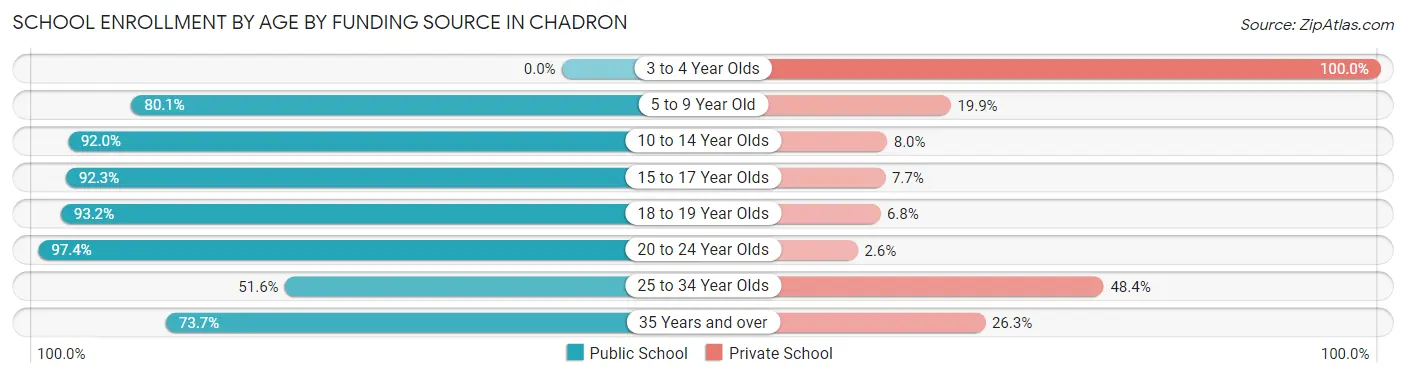
| Age Bracket | Public School | Private School |
| 3 to 4 Year Olds | 0 (0.0%) | 26 (100.0%) |
| 5 to 9 Year Old | 141 (80.1%) | 35 (19.9%) |
| 10 to 14 Year Olds | 275 (92.0%) | 24 (8.0%) |
| 15 to 17 Year Olds | 120 (92.3%) | 10 (7.7%) |
| 18 to 19 Year Olds | 538 (93.2%) | 39 (6.8%) |
| 20 to 24 Year Olds | 566 (97.4%) | 15 (2.6%) |
| 25 to 34 Year Olds | 16 (51.6%) | 15 (48.4%) |
| 35 Years and over | 28 (73.7%) | 10 (26.3%) |
| Total | 1,683 (90.6%) | 175 (9.4%) |
Educational Attainment by Field of Study in Chadron
Education (459 | 26.3%), business (249 | 14.3%), physical & health sciences (174 | 10.0%), science & technology (159 | 9.1%), and liberal arts & history (136 | 7.8%) are the most common fields of study among 1,744 individuals in Chadron who have obtained a bachelor's degree or higher.
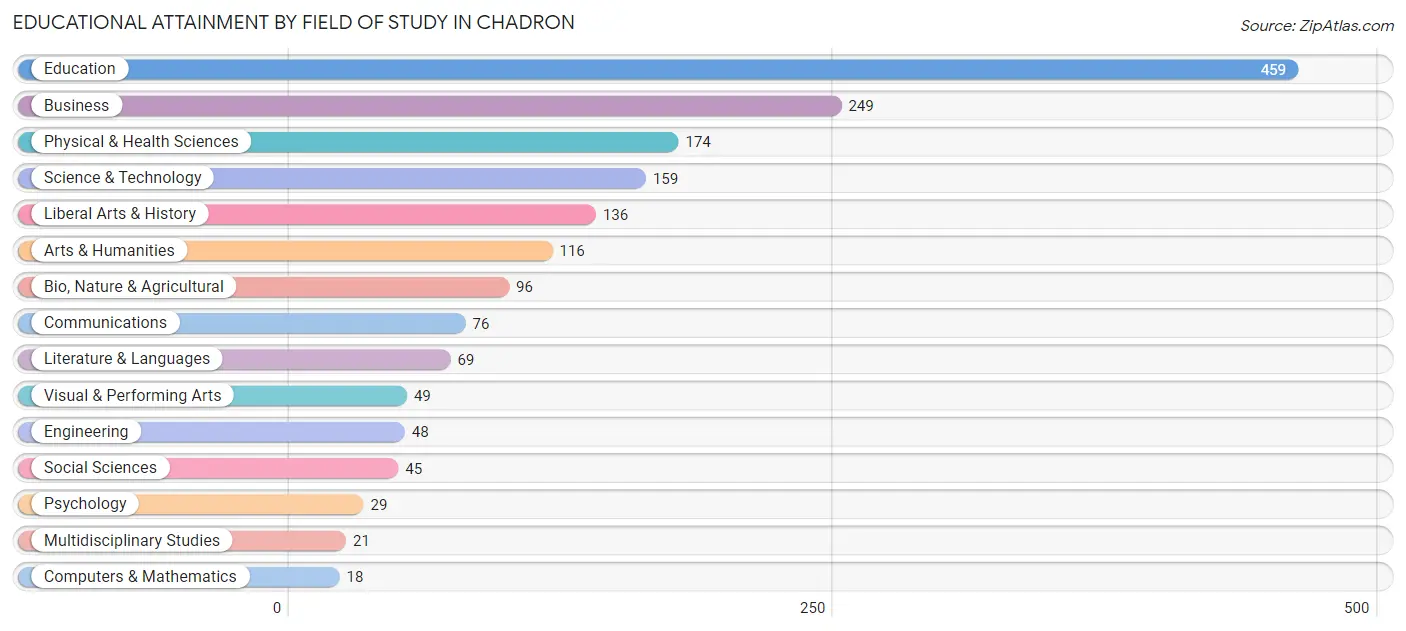
| Field of Study | # Graduates | % Graduates |
| Computers & Mathematics | 18 | 1.0% |
| Bio, Nature & Agricultural | 96 | 5.5% |
| Physical & Health Sciences | 174 | 10.0% |
| Psychology | 29 | 1.7% |
| Social Sciences | 45 | 2.6% |
| Engineering | 48 | 2.8% |
| Multidisciplinary Studies | 21 | 1.2% |
| Science & Technology | 159 | 9.1% |
| Business | 249 | 14.3% |
| Education | 459 | 26.3% |
| Literature & Languages | 69 | 4.0% |
| Liberal Arts & History | 136 | 7.8% |
| Visual & Performing Arts | 49 | 2.8% |
| Communications | 76 | 4.4% |
| Arts & Humanities | 116 | 6.7% |
| Total | 1,744 | 100.0% |
Transportation & Commute in Chadron
Vehicle Availability by Sex in Chadron
The most prevalent vehicle ownership categories in Chadron are males with 2 vehicles (631, accounting for 47.5%) and females with 2 vehicles (631, making up 49.2%).
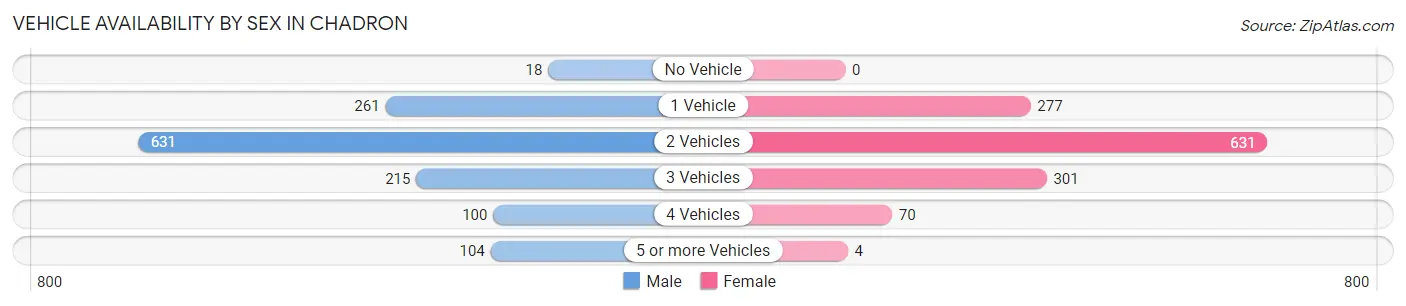
| Vehicles Available | Male | Female |
| No Vehicle | 18 (1.3%) | 0 (0.0%) |
| 1 Vehicle | 261 (19.6%) | 277 (21.6%) |
| 2 Vehicles | 631 (47.5%) | 631 (49.2%) |
| 3 Vehicles | 215 (16.2%) | 301 (23.5%) |
| 4 Vehicles | 100 (7.5%) | 70 (5.5%) |
| 5 or more Vehicles | 104 (7.8%) | 4 (0.3%) |
| Total | 1,329 (100.0%) | 1,283 (100.0%) |
Commute Time in Chadron
The most frequently occuring commute durations in Chadron are 5 to 9 minutes (1,118 commuters, 38.8%), less than 5 minutes (964 commuters, 33.5%), and 10 to 14 minutes (318 commuters, 11.0%).
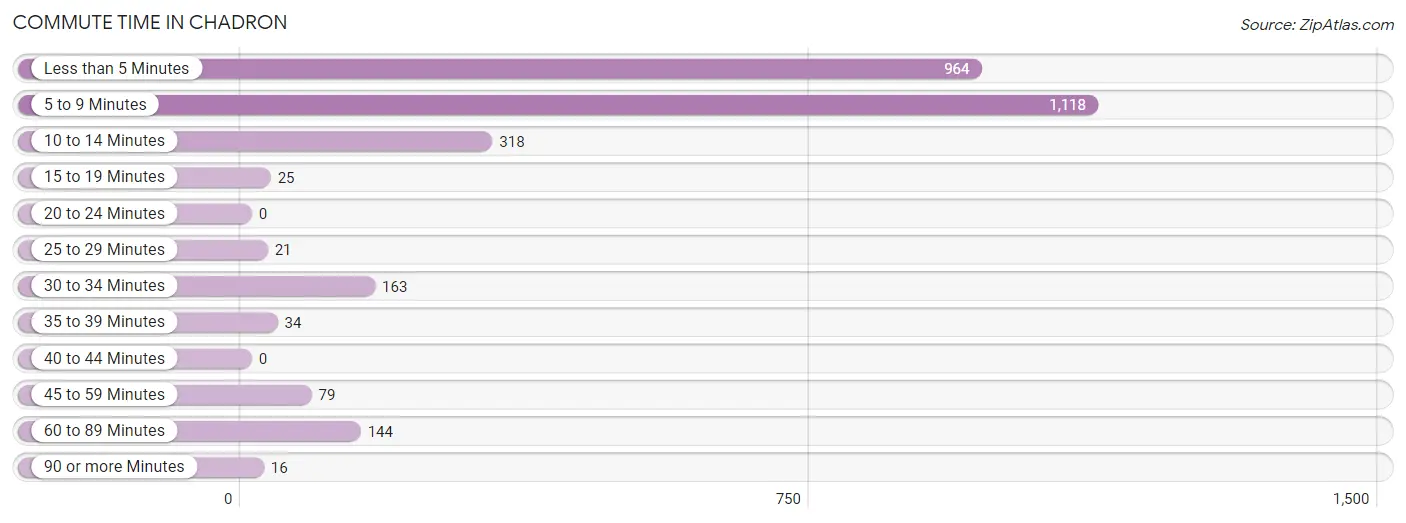
| Commute Time | # Commuters | % Commuters |
| Less than 5 Minutes | 964 | 33.5% |
| 5 to 9 Minutes | 1,118 | 38.8% |
| 10 to 14 Minutes | 318 | 11.0% |
| 15 to 19 Minutes | 25 | 0.9% |
| 20 to 24 Minutes | 0 | 0.0% |
| 25 to 29 Minutes | 21 | 0.7% |
| 30 to 34 Minutes | 163 | 5.7% |
| 35 to 39 Minutes | 34 | 1.2% |
| 40 to 44 Minutes | 0 | 0.0% |
| 45 to 59 Minutes | 79 | 2.7% |
| 60 to 89 Minutes | 144 | 5.0% |
| 90 or more Minutes | 16 | 0.6% |
Commute Time by Sex in Chadron
The most common commute times in Chadron are 5 to 9 minutes (579 commuters, 40.5%) for males and 5 to 9 minutes (539 commuters, 37.1%) for females.
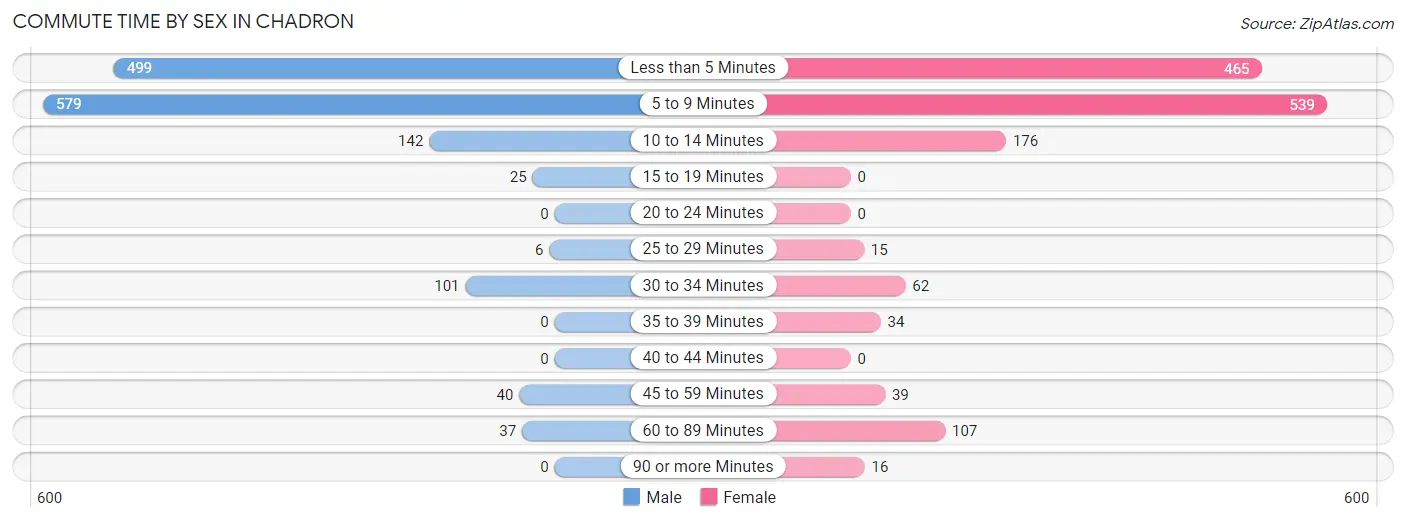
| Commute Time | Male | Female |
| Less than 5 Minutes | 499 (34.9%) | 465 (32.0%) |
| 5 to 9 Minutes | 579 (40.5%) | 539 (37.1%) |
| 10 to 14 Minutes | 142 (9.9%) | 176 (12.1%) |
| 15 to 19 Minutes | 25 (1.8%) | 0 (0.0%) |
| 20 to 24 Minutes | 0 (0.0%) | 0 (0.0%) |
| 25 to 29 Minutes | 6 (0.4%) | 15 (1.0%) |
| 30 to 34 Minutes | 101 (7.1%) | 62 (4.3%) |
| 35 to 39 Minutes | 0 (0.0%) | 34 (2.3%) |
| 40 to 44 Minutes | 0 (0.0%) | 0 (0.0%) |
| 45 to 59 Minutes | 40 (2.8%) | 39 (2.7%) |
| 60 to 89 Minutes | 37 (2.6%) | 107 (7.4%) |
| 90 or more Minutes | 0 (0.0%) | 16 (1.1%) |
Time of Departure to Work by Sex in Chadron
The most frequent times of departure to work in Chadron are 8:00 AM to 8:29 AM (276, 19.3%) for males and 7:30 AM to 7:59 AM (318, 21.9%) for females.
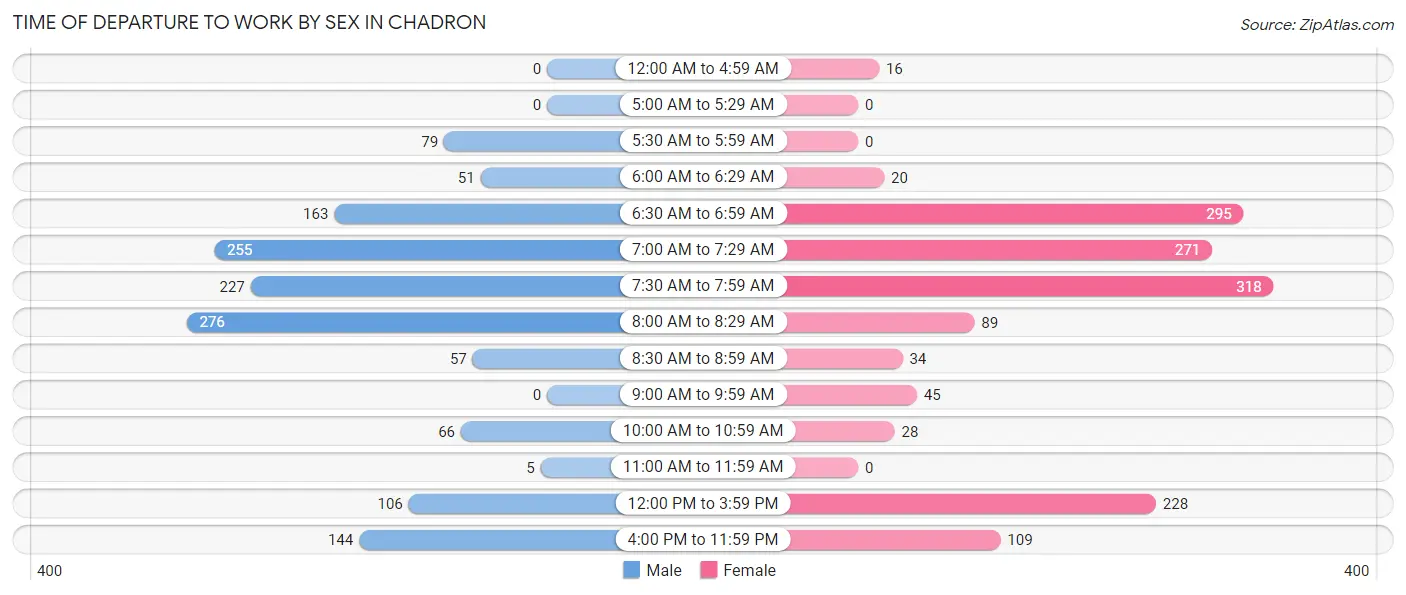
| Time of Departure | Male | Female |
| 12:00 AM to 4:59 AM | 0 (0.0%) | 16 (1.1%) |
| 5:00 AM to 5:29 AM | 0 (0.0%) | 0 (0.0%) |
| 5:30 AM to 5:59 AM | 79 (5.5%) | 0 (0.0%) |
| 6:00 AM to 6:29 AM | 51 (3.6%) | 20 (1.4%) |
| 6:30 AM to 6:59 AM | 163 (11.4%) | 295 (20.3%) |
| 7:00 AM to 7:29 AM | 255 (17.8%) | 271 (18.6%) |
| 7:30 AM to 7:59 AM | 227 (15.9%) | 318 (21.9%) |
| 8:00 AM to 8:29 AM | 276 (19.3%) | 89 (6.1%) |
| 8:30 AM to 8:59 AM | 57 (4.0%) | 34 (2.3%) |
| 9:00 AM to 9:59 AM | 0 (0.0%) | 45 (3.1%) |
| 10:00 AM to 10:59 AM | 66 (4.6%) | 28 (1.9%) |
| 11:00 AM to 11:59 AM | 5 (0.4%) | 0 (0.0%) |
| 12:00 PM to 3:59 PM | 106 (7.4%) | 228 (15.7%) |
| 4:00 PM to 11:59 PM | 144 (10.1%) | 109 (7.5%) |
| Total | 1,429 (100.0%) | 1,453 (100.0%) |
Housing Occupancy in Chadron
Occupancy by Ownership in Chadron
Of the total 2,162 dwellings in Chadron, owner-occupied units account for 1,291 (59.7%), while renter-occupied units make up 871 (40.3%).
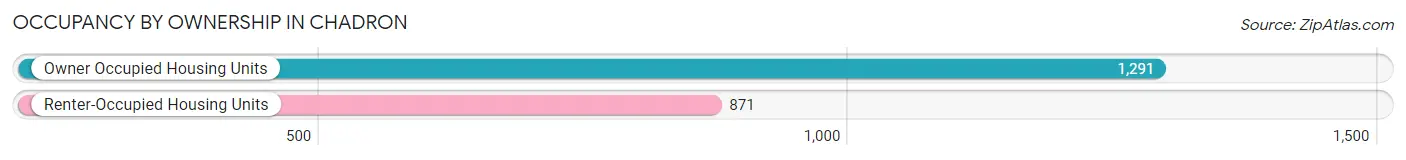
| Occupancy | # Housing Units | % Housing Units |
| Owner Occupied Housing Units | 1,291 | 59.7% |
| Renter-Occupied Housing Units | 871 | 40.3% |
| Total Occupied Housing Units | 2,162 | 100.0% |
Occupancy by Household Size in Chadron
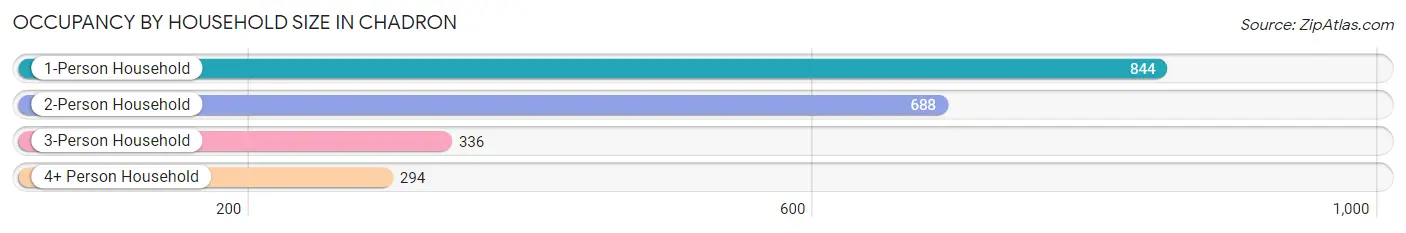
| Household Size | # Housing Units | % Housing Units |
| 1-Person Household | 844 | 39.0% |
| 2-Person Household | 688 | 31.8% |
| 3-Person Household | 336 | 15.5% |
| 4+ Person Household | 294 | 13.6% |
| Total Housing Units | 2,162 | 100.0% |
Occupancy by Ownership by Household Size in Chadron
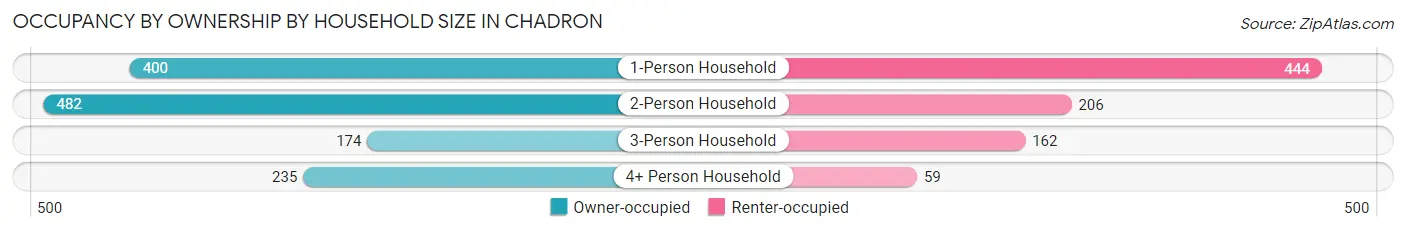
| Household Size | Owner-occupied | Renter-occupied |
| 1-Person Household | 400 (47.4%) | 444 (52.6%) |
| 2-Person Household | 482 (70.1%) | 206 (29.9%) |
| 3-Person Household | 174 (51.8%) | 162 (48.2%) |
| 4+ Person Household | 235 (79.9%) | 59 (20.1%) |
| Total Housing Units | 1,291 (59.7%) | 871 (40.3%) |
Occupancy by Educational Attainment in Chadron
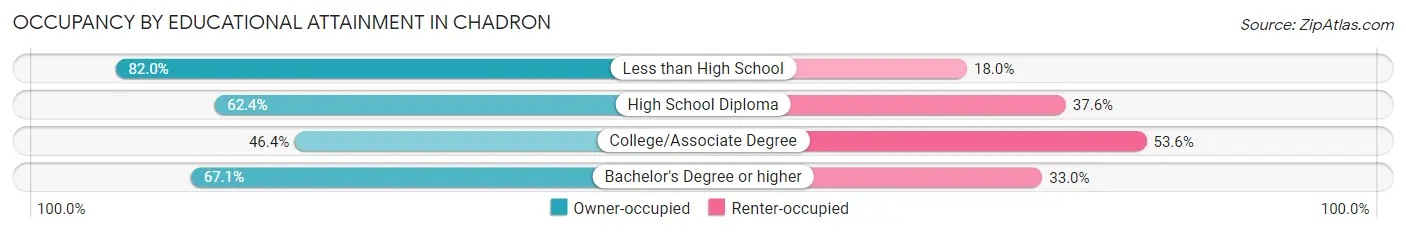
| Household Size | Owner-occupied | Renter-occupied |
| Less than High School | 91 (82.0%) | 20 (18.0%) |
| High School Diploma | 199 (62.4%) | 120 (37.6%) |
| College/Associate Degree | 360 (46.4%) | 416 (53.6%) |
| Bachelor's Degree or higher | 641 (67.0%) | 315 (33.0%) |
Occupancy by Age of Householder in Chadron
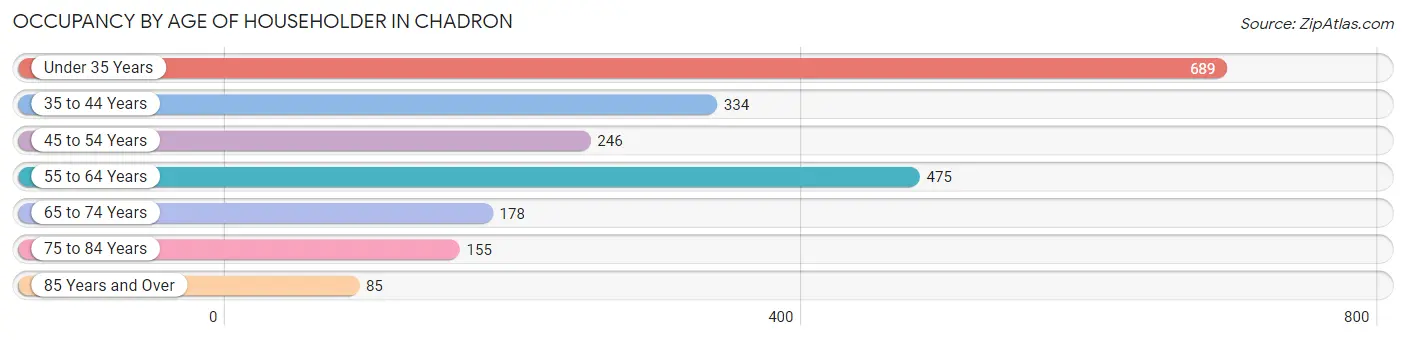
| Age Bracket | # Households | % Households |
| Under 35 Years | 689 | 31.9% |
| 35 to 44 Years | 334 | 15.4% |
| 45 to 54 Years | 246 | 11.4% |
| 55 to 64 Years | 475 | 22.0% |
| 65 to 74 Years | 178 | 8.2% |
| 75 to 84 Years | 155 | 7.2% |
| 85 Years and Over | 85 | 3.9% |
| Total | 2,162 | 100.0% |
Housing Finances in Chadron
Median Income by Occupancy in Chadron
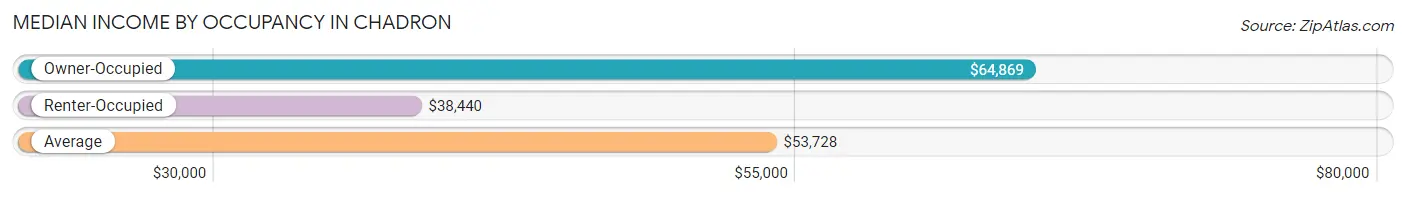
| Occupancy Type | # Households | Median Income |
| Owner-Occupied | 1,291 (59.7%) | $64,869 |
| Renter-Occupied | 871 (40.3%) | $38,440 |
| Average | 2,162 (100.0%) | $53,728 |
Occupancy by Householder Income Bracket in Chadron
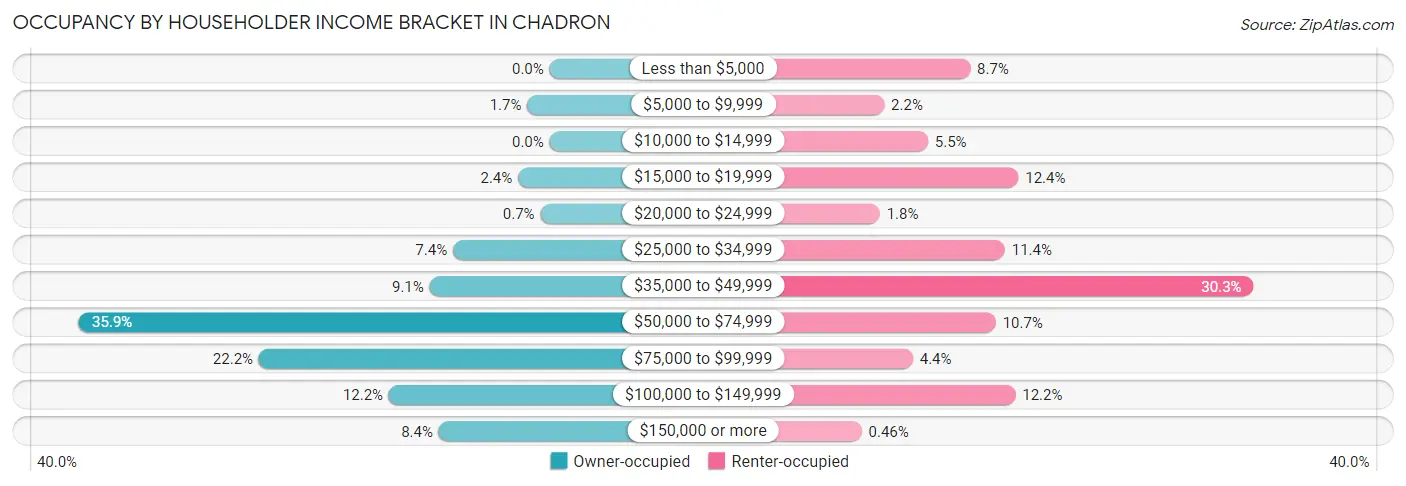
| Income Bracket | Owner-occupied | Renter-occupied |
| Less than $5,000 | 0 (0.0%) | 76 (8.7%) |
| $5,000 to $9,999 | 22 (1.7%) | 19 (2.2%) |
| $10,000 to $14,999 | 0 (0.0%) | 48 (5.5%) |
| $15,000 to $19,999 | 31 (2.4%) | 108 (12.4%) |
| $20,000 to $24,999 | 9 (0.7%) | 16 (1.8%) |
| $25,000 to $34,999 | 95 (7.4%) | 99 (11.4%) |
| $35,000 to $49,999 | 118 (9.1%) | 264 (30.3%) |
| $50,000 to $74,999 | 463 (35.9%) | 93 (10.7%) |
| $75,000 to $99,999 | 286 (22.2%) | 38 (4.4%) |
| $100,000 to $149,999 | 158 (12.2%) | 106 (12.2%) |
| $150,000 or more | 109 (8.4%) | 4 (0.5%) |
| Total | 1,291 (100.0%) | 871 (100.0%) |
Monthly Housing Cost Tiers in Chadron
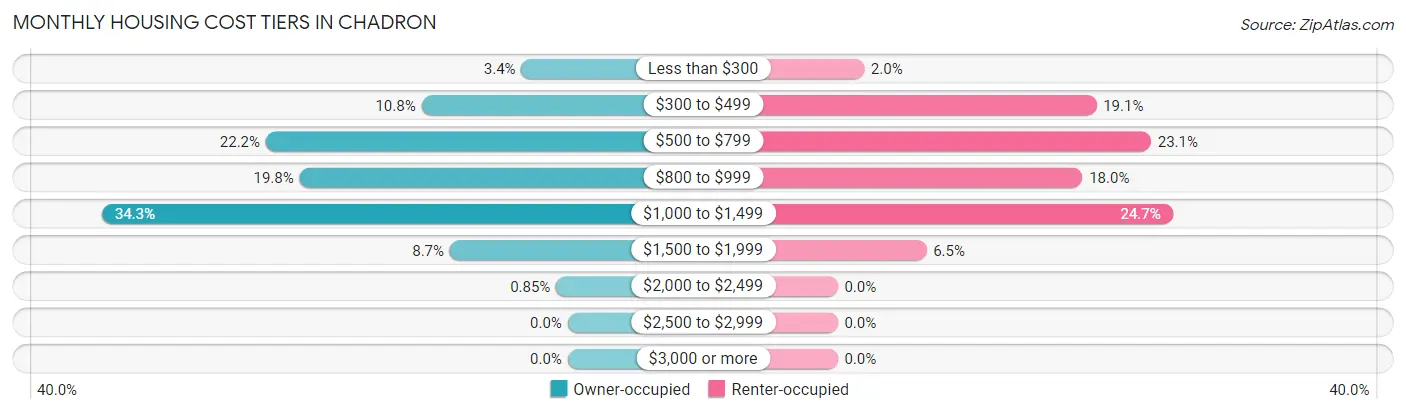
| Monthly Cost | Owner-occupied | Renter-occupied |
| Less than $300 | 44 (3.4%) | 17 (1.9%) |
| $300 to $499 | 139 (10.8%) | 166 (19.1%) |
| $500 to $799 | 287 (22.2%) | 201 (23.1%) |
| $800 to $999 | 255 (19.8%) | 157 (18.0%) |
| $1,000 to $1,499 | 443 (34.3%) | 215 (24.7%) |
| $1,500 to $1,999 | 112 (8.7%) | 57 (6.5%) |
| $2,000 to $2,499 | 11 (0.9%) | 0 (0.0%) |
| $2,500 to $2,999 | 0 (0.0%) | 0 (0.0%) |
| $3,000 or more | 0 (0.0%) | 0 (0.0%) |
| Total | 1,291 (100.0%) | 871 (100.0%) |
Physical Housing Characteristics in Chadron
Housing Structures in Chadron
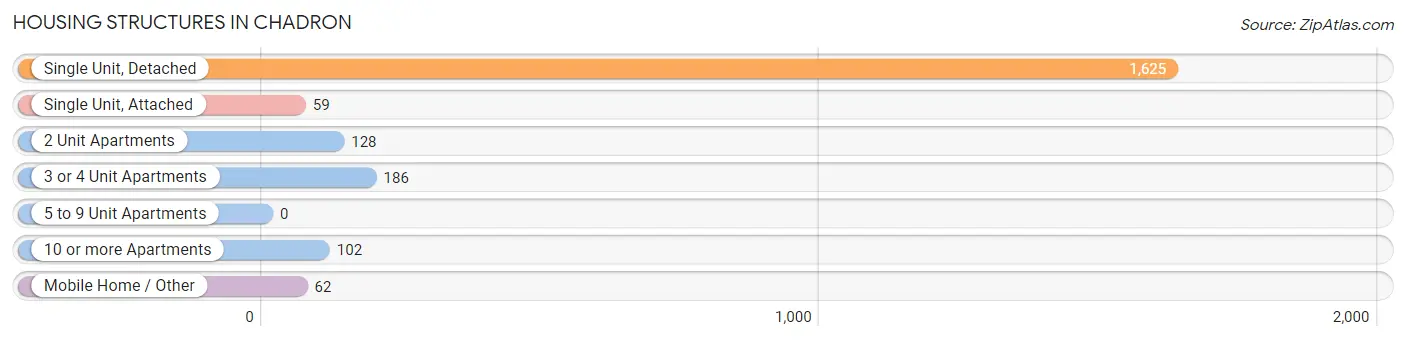
| Structure Type | # Housing Units | % Housing Units |
| Single Unit, Detached | 1,625 | 75.2% |
| Single Unit, Attached | 59 | 2.7% |
| 2 Unit Apartments | 128 | 5.9% |
| 3 or 4 Unit Apartments | 186 | 8.6% |
| 5 to 9 Unit Apartments | 0 | 0.0% |
| 10 or more Apartments | 102 | 4.7% |
| Mobile Home / Other | 62 | 2.9% |
| Total | 2,162 | 100.0% |
Housing Structures by Occupancy in Chadron
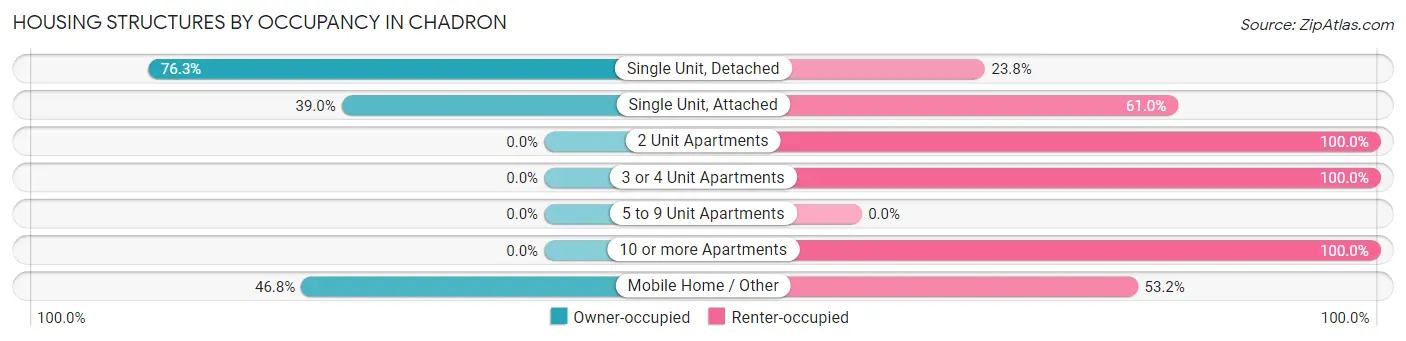
| Structure Type | Owner-occupied | Renter-occupied |
| Single Unit, Detached | 1,239 (76.2%) | 386 (23.7%) |
| Single Unit, Attached | 23 (39.0%) | 36 (61.0%) |
| 2 Unit Apartments | 0 (0.0%) | 128 (100.0%) |
| 3 or 4 Unit Apartments | 0 (0.0%) | 186 (100.0%) |
| 5 to 9 Unit Apartments | 0 (0.0%) | 0 (0.0%) |
| 10 or more Apartments | 0 (0.0%) | 102 (100.0%) |
| Mobile Home / Other | 29 (46.8%) | 33 (53.2%) |
| Total | 1,291 (59.7%) | 871 (40.3%) |
Housing Structures by Number of Rooms in Chadron
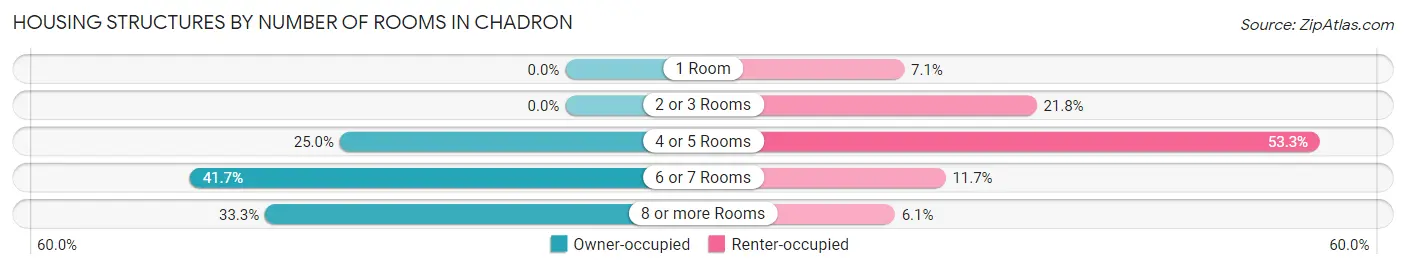
| Number of Rooms | Owner-occupied | Renter-occupied |
| 1 Room | 0 (0.0%) | 62 (7.1%) |
| 2 or 3 Rooms | 0 (0.0%) | 190 (21.8%) |
| 4 or 5 Rooms | 323 (25.0%) | 464 (53.3%) |
| 6 or 7 Rooms | 538 (41.7%) | 102 (11.7%) |
| 8 or more Rooms | 430 (33.3%) | 53 (6.1%) |
| Total | 1,291 (100.0%) | 871 (100.0%) |
Housing Structure by Heating Type in Chadron
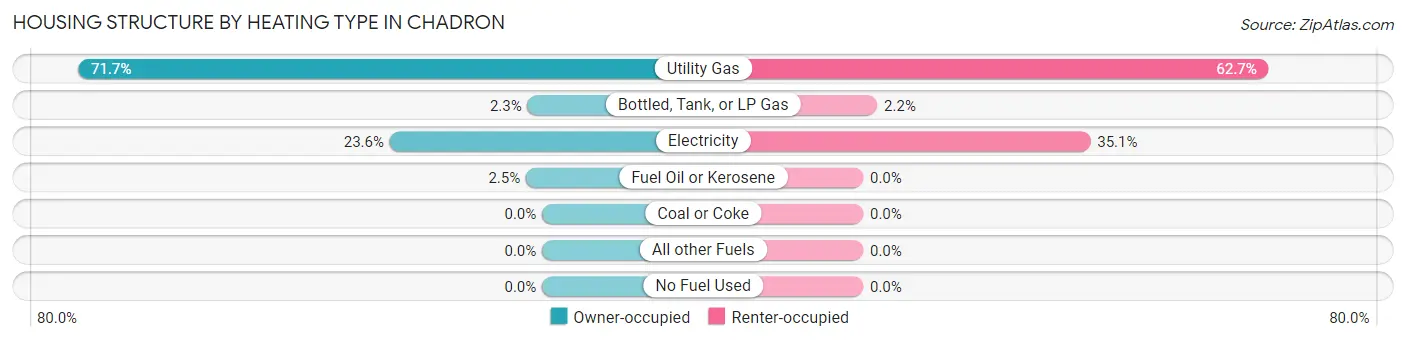
| Heating Type | Owner-occupied | Renter-occupied |
| Utility Gas | 926 (71.7%) | 546 (62.7%) |
| Bottled, Tank, or LP Gas | 29 (2.2%) | 19 (2.2%) |
| Electricity | 304 (23.5%) | 306 (35.1%) |
| Fuel Oil or Kerosene | 32 (2.5%) | 0 (0.0%) |
| Coal or Coke | 0 (0.0%) | 0 (0.0%) |
| All other Fuels | 0 (0.0%) | 0 (0.0%) |
| No Fuel Used | 0 (0.0%) | 0 (0.0%) |
| Total | 1,291 (100.0%) | 871 (100.0%) |
Household Vehicle Usage in Chadron
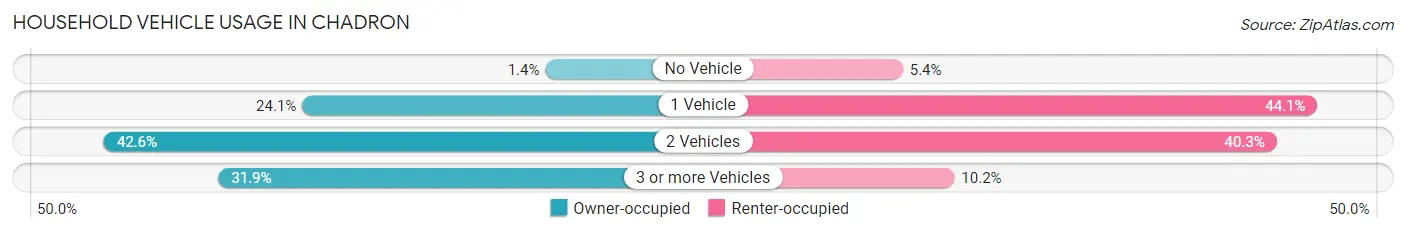
| Vehicles per Household | Owner-occupied | Renter-occupied |
| No Vehicle | 18 (1.4%) | 47 (5.4%) |
| 1 Vehicle | 311 (24.1%) | 384 (44.1%) |
| 2 Vehicles | 550 (42.6%) | 351 (40.3%) |
| 3 or more Vehicles | 412 (31.9%) | 89 (10.2%) |
| Total | 1,291 (100.0%) | 871 (100.0%) |
Real Estate & Mortgages in Chadron
Real Estate and Mortgage Overview in Chadron
| Characteristic | Without Mortgage | With Mortgage |
| Housing Units | 513 | 778 |
| Median Property Value | $144,900 | $144,100 |
| Median Household Income | $62,556 | $86 |
| Monthly Housing Costs | $575 | $0 |
| Real Estate Taxes | $2,160 | $10 |
Property Value by Mortgage Status in Chadron
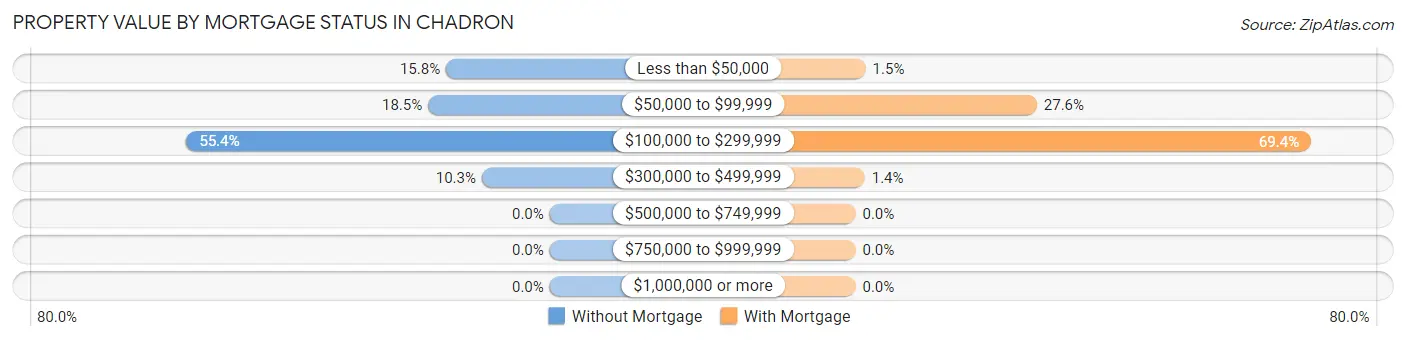
| Property Value | Without Mortgage | With Mortgage |
| Less than $50,000 | 81 (15.8%) | 12 (1.5%) |
| $50,000 to $99,999 | 95 (18.5%) | 215 (27.6%) |
| $100,000 to $299,999 | 284 (55.4%) | 540 (69.4%) |
| $300,000 to $499,999 | 53 (10.3%) | 11 (1.4%) |
| $500,000 to $749,999 | 0 (0.0%) | 0 (0.0%) |
| $750,000 to $999,999 | 0 (0.0%) | 0 (0.0%) |
| $1,000,000 or more | 0 (0.0%) | 0 (0.0%) |
| Total | 513 (100.0%) | 778 (100.0%) |
Household Income by Mortgage Status in Chadron
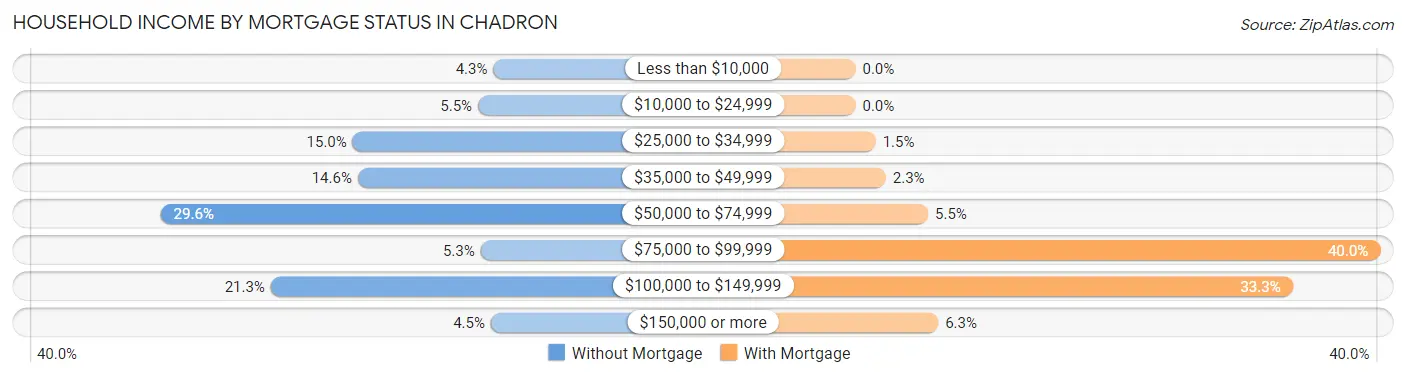
| Household Income | Without Mortgage | With Mortgage |
| Less than $10,000 | 22 (4.3%) | 0 (0.0%) |
| $10,000 to $24,999 | 28 (5.5%) | 0 (0.0%) |
| $25,000 to $34,999 | 77 (15.0%) | 12 (1.5%) |
| $35,000 to $49,999 | 75 (14.6%) | 18 (2.3%) |
| $50,000 to $74,999 | 152 (29.6%) | 43 (5.5%) |
| $75,000 to $99,999 | 27 (5.3%) | 311 (40.0%) |
| $100,000 to $149,999 | 109 (21.2%) | 259 (33.3%) |
| $150,000 or more | 23 (4.5%) | 49 (6.3%) |
| Total | 513 (100.0%) | 778 (100.0%) |
Property Value to Household Income Ratio in Chadron
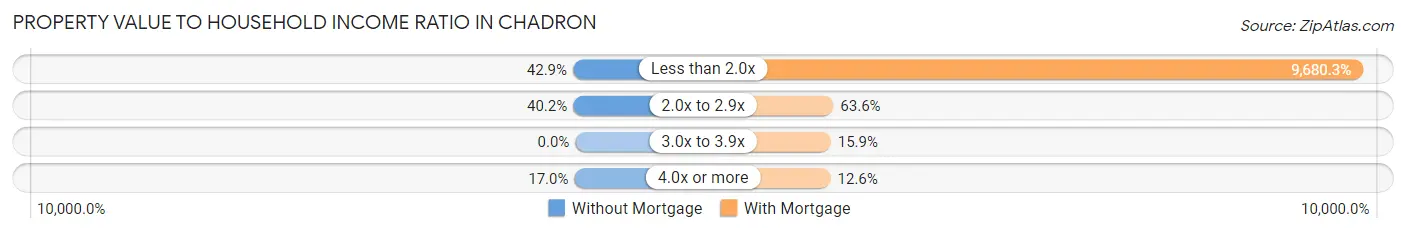
| Value-to-Income Ratio | Without Mortgage | With Mortgage |
| Less than 2.0x | 220 (42.9%) | 75,313 (9,680.3%) |
| 2.0x to 2.9x | 206 (40.2%) | 495 (63.6%) |
| 3.0x to 3.9x | 0 (0.0%) | 124 (15.9%) |
| 4.0x or more | 87 (17.0%) | 98 (12.6%) |
| Total | 513 (100.0%) | 778 (100.0%) |
Real Estate Taxes by Mortgage Status in Chadron
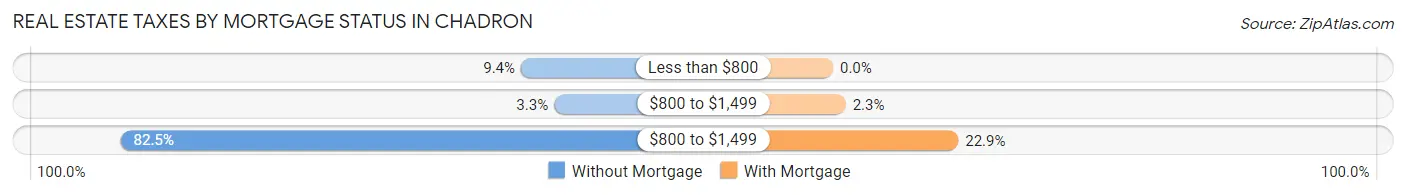
| Property Taxes | Without Mortgage | With Mortgage |
| Less than $800 | 48 (9.4%) | 0 (0.0%) |
| $800 to $1,499 | 17 (3.3%) | 18 (2.3%) |
| $800 to $1,499 | 423 (82.5%) | 178 (22.9%) |
| Total | 513 (100.0%) | 778 (100.0%) |
Health & Disability in Chadron
Health Insurance Coverage by Age in Chadron
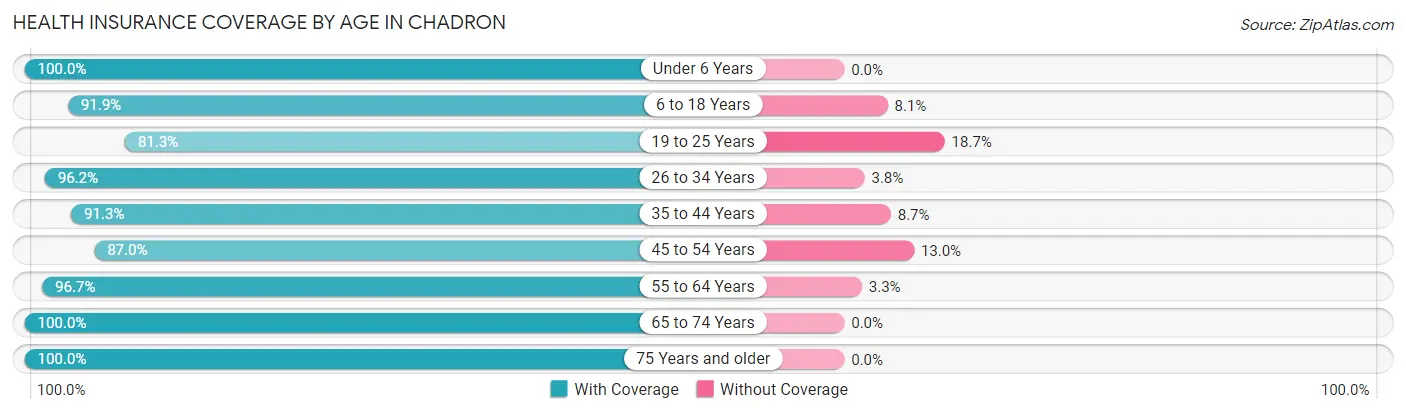
| Age Bracket | With Coverage | Without Coverage |
| Under 6 Years | 373 (100.0%) | 0 (0.0%) |
| 6 to 18 Years | 717 (91.9%) | 63 (8.1%) |
| 19 to 25 Years | 947 (81.3%) | 218 (18.7%) |
| 26 to 34 Years | 613 (96.2%) | 24 (3.8%) |
| 35 to 44 Years | 495 (91.3%) | 47 (8.7%) |
| 45 to 54 Years | 355 (87.0%) | 53 (13.0%) |
| 55 to 64 Years | 592 (96.7%) | 20 (3.3%) |
| 65 to 74 Years | 307 (100.0%) | 0 (0.0%) |
| 75 Years and older | 388 (100.0%) | 0 (0.0%) |
| Total | 4,787 (91.8%) | 425 (8.2%) |
Health Insurance Coverage by Citizenship Status in Chadron
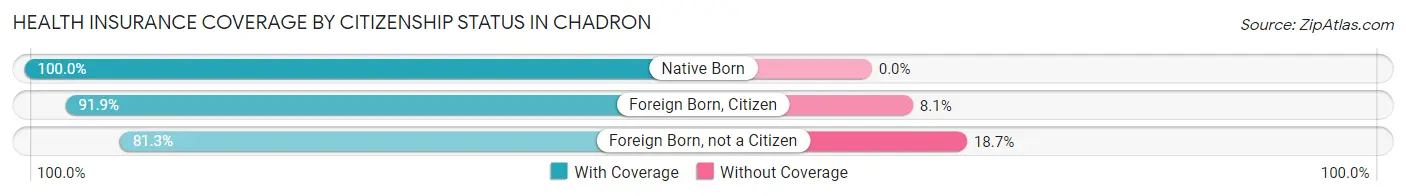
| Citizenship Status | With Coverage | Without Coverage |
| Native Born | 373 (100.0%) | 0 (0.0%) |
| Foreign Born, Citizen | 717 (91.9%) | 63 (8.1%) |
| Foreign Born, not a Citizen | 947 (81.3%) | 218 (18.7%) |
Health Insurance Coverage by Household Income in Chadron
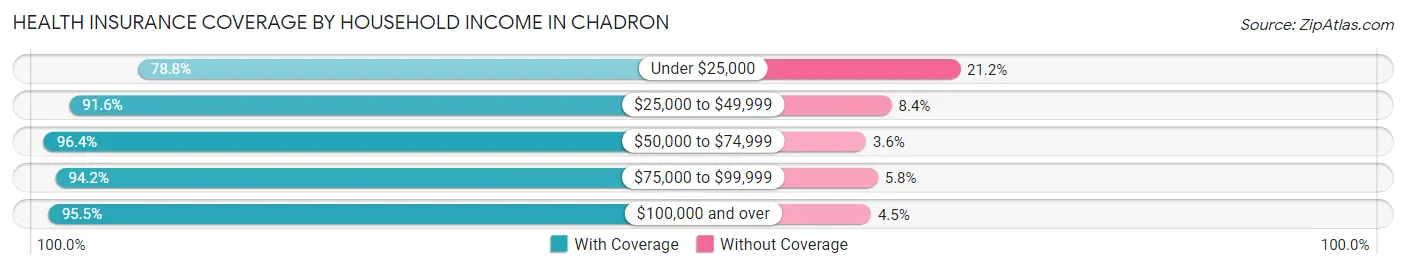
| Household Income | With Coverage | Without Coverage |
| Under $25,000 | 375 (78.8%) | 101 (21.2%) |
| $25,000 to $49,999 | 807 (91.6%) | 74 (8.4%) |
| $50,000 to $74,999 | 1,226 (96.4%) | 46 (3.6%) |
| $75,000 to $99,999 | 763 (94.2%) | 47 (5.8%) |
| $100,000 and over | 1,033 (95.5%) | 49 (4.5%) |
Public vs Private Health Insurance Coverage by Age in Chadron
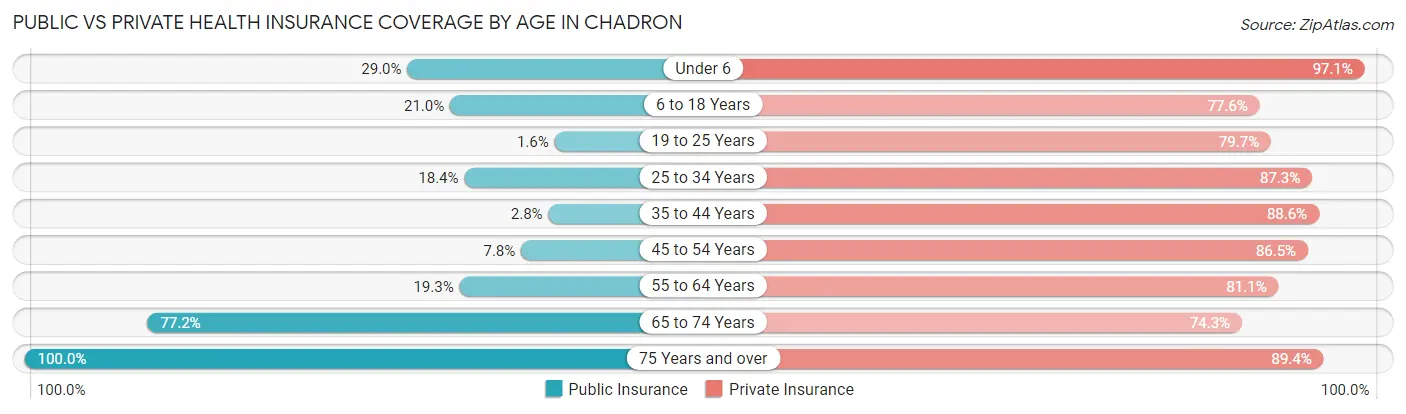
| Age Bracket | Public Insurance | Private Insurance |
| Under 6 | 108 (28.9%) | 362 (97.1%) |
| 6 to 18 Years | 164 (21.0%) | 605 (77.6%) |
| 19 to 25 Years | 19 (1.6%) | 928 (79.7%) |
| 25 to 34 Years | 117 (18.4%) | 556 (87.3%) |
| 35 to 44 Years | 15 (2.8%) | 480 (88.6%) |
| 45 to 54 Years | 32 (7.8%) | 353 (86.5%) |
| 55 to 64 Years | 118 (19.3%) | 496 (81.0%) |
| 65 to 74 Years | 237 (77.2%) | 228 (74.3%) |
| 75 Years and over | 388 (100.0%) | 347 (89.4%) |
| Total | 1,198 (23.0%) | 4,355 (83.6%) |
Disability Status by Sex by Age in Chadron
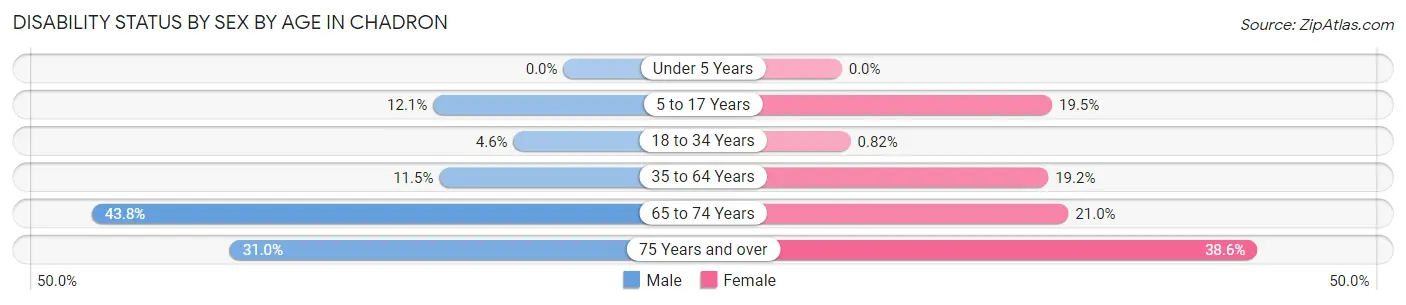
| Age Bracket | Male | Female |
| Under 5 Years | 0 (0.0%) | 0 (0.0%) |
| 5 to 17 Years | 37 (12.1%) | 73 (19.5%) |
| 18 to 34 Years | 41 (4.6%) | 9 (0.8%) |
| 35 to 64 Years | 103 (11.5%) | 128 (19.2%) |
| 65 to 74 Years | 49 (43.8%) | 41 (21.0%) |
| 75 Years and over | 39 (30.9%) | 101 (38.6%) |
Disability Class by Sex by Age in Chadron
Disability Class: Hearing Difficulty
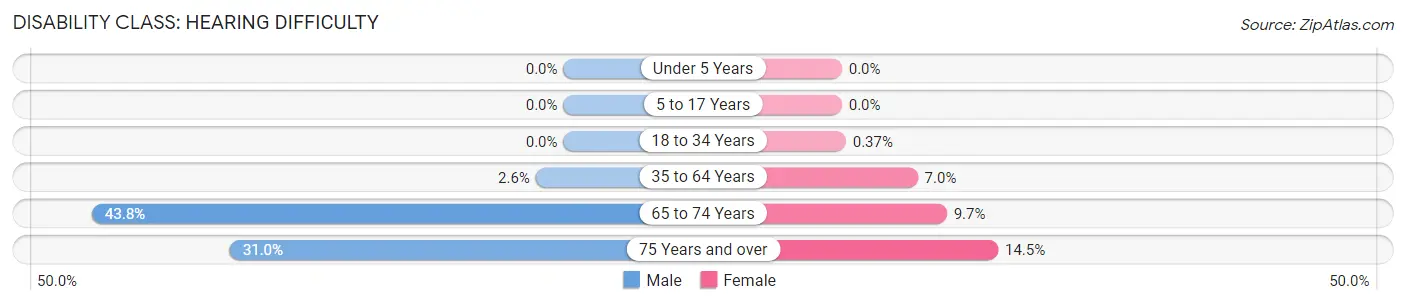
| Age Bracket | Male | Female |
| Under 5 Years | 0 (0.0%) | 0 (0.0%) |
| 5 to 17 Years | 0 (0.0%) | 0 (0.0%) |
| 18 to 34 Years | 0 (0.0%) | 4 (0.4%) |
| 35 to 64 Years | 23 (2.6%) | 47 (7.0%) |
| 65 to 74 Years | 49 (43.8%) | 19 (9.7%) |
| 75 Years and over | 39 (30.9%) | 38 (14.5%) |
Disability Class: Vision Difficulty
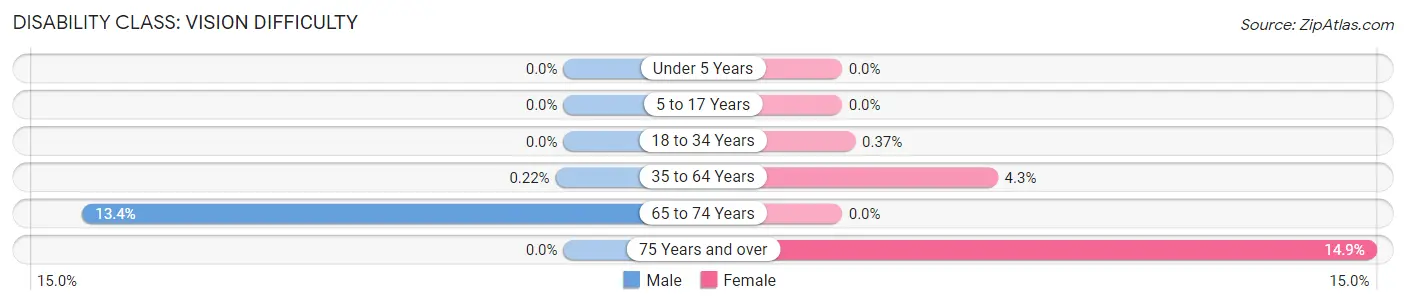
| Age Bracket | Male | Female |
| Under 5 Years | 0 (0.0%) | 0 (0.0%) |
| 5 to 17 Years | 0 (0.0%) | 0 (0.0%) |
| 18 to 34 Years | 0 (0.0%) | 4 (0.4%) |
| 35 to 64 Years | 2 (0.2%) | 29 (4.3%) |
| 65 to 74 Years | 15 (13.4%) | 0 (0.0%) |
| 75 Years and over | 0 (0.0%) | 39 (14.9%) |
Disability Class: Cognitive Difficulty
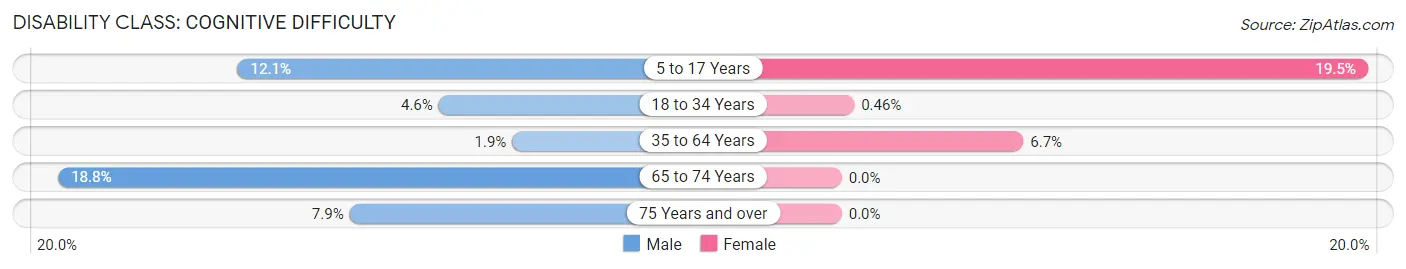
| Age Bracket | Male | Female |
| 5 to 17 Years | 37 (12.1%) | 73 (19.5%) |
| 18 to 34 Years | 41 (4.6%) | 5 (0.5%) |
| 35 to 64 Years | 17 (1.9%) | 45 (6.7%) |
| 65 to 74 Years | 21 (18.8%) | 0 (0.0%) |
| 75 Years and over | 10 (7.9%) | 0 (0.0%) |
Disability Class: Ambulatory Difficulty
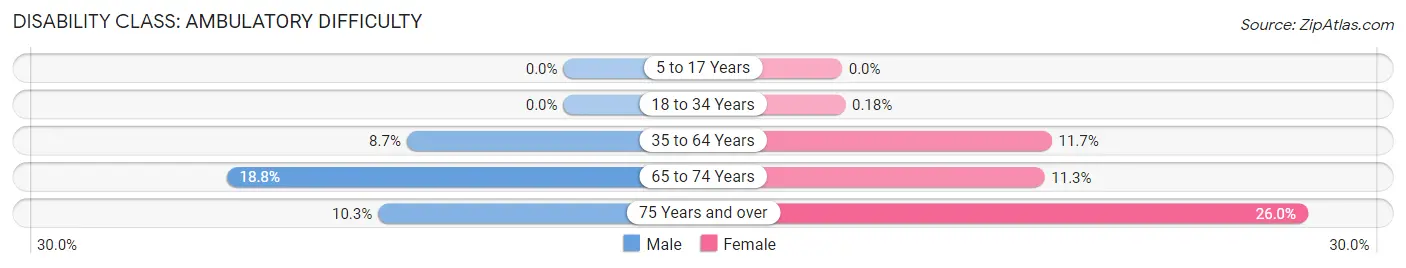
| Age Bracket | Male | Female |
| 5 to 17 Years | 0 (0.0%) | 0 (0.0%) |
| 18 to 34 Years | 0 (0.0%) | 2 (0.2%) |
| 35 to 64 Years | 78 (8.7%) | 78 (11.7%) |
| 65 to 74 Years | 21 (18.8%) | 22 (11.3%) |
| 75 Years and over | 13 (10.3%) | 68 (26.0%) |
Disability Class: Self-Care Difficulty
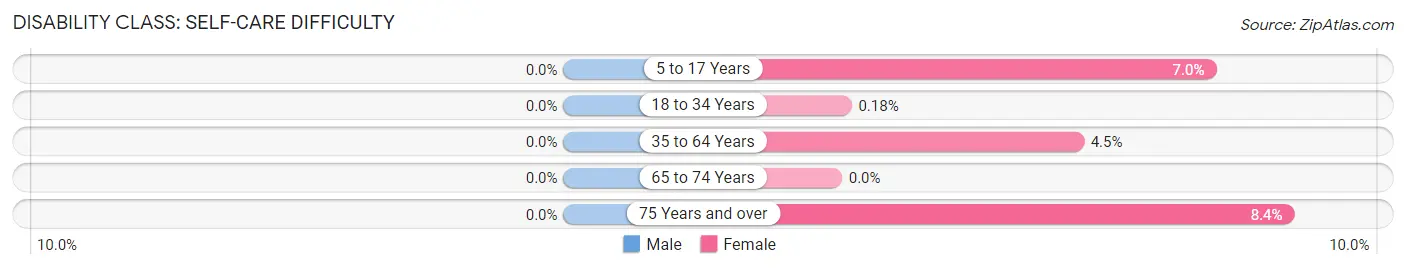
| Age Bracket | Male | Female |
| 5 to 17 Years | 0 (0.0%) | 26 (7.0%) |
| 18 to 34 Years | 0 (0.0%) | 2 (0.2%) |
| 35 to 64 Years | 0 (0.0%) | 30 (4.5%) |
| 65 to 74 Years | 0 (0.0%) | 0 (0.0%) |
| 75 Years and over | 0 (0.0%) | 22 (8.4%) |
Technology Access in Chadron
Computing Device Access in Chadron
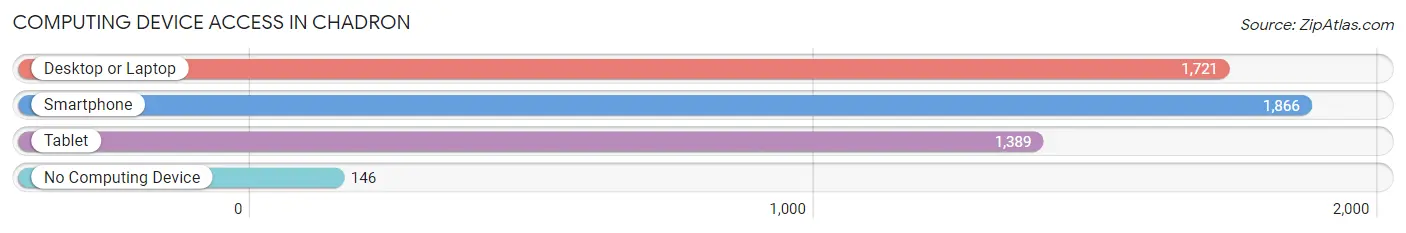
| Device Type | # Households | % Households |
| Desktop or Laptop | 1,721 | 79.6% |
| Smartphone | 1,866 | 86.3% |
| Tablet | 1,389 | 64.2% |
| No Computing Device | 146 | 6.8% |
| Total | 2,162 | 100.0% |
Internet Access in Chadron
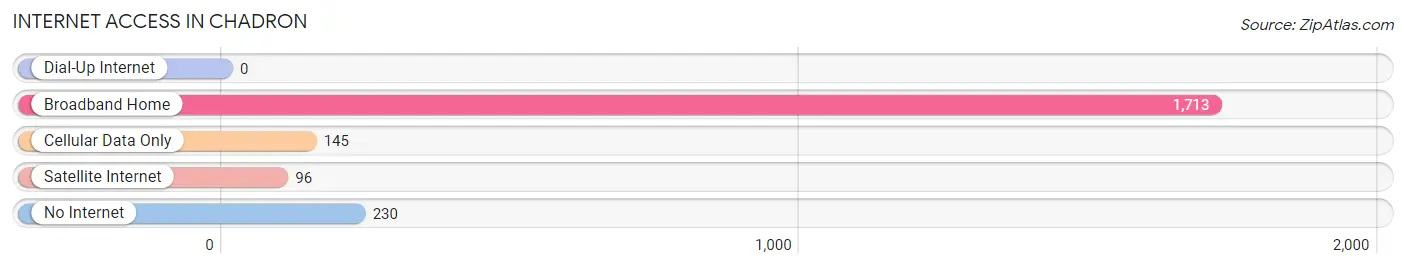
| Internet Type | # Households | % Households |
| Dial-Up Internet | 0 | 0.0% |
| Broadband Home | 1,713 | 79.2% |
| Cellular Data Only | 145 | 6.7% |
| Satellite Internet | 96 | 4.4% |
| No Internet | 230 | 10.6% |
| Total | 2,162 | 100.0% |
Chadron Summary
Chadron, Nebraska is a small city located in the northwest corner of the state. It is the county seat of Dawes County and is the largest city in the county. The city is located in the Pine Ridge region of the state, which is known for its rolling hills and wide open spaces. The city is home to a population of approximately 5,000 people and is the economic hub of the region.
Geography
Chadron is located in the northwest corner of Nebraska, in the Pine Ridge region. The city is situated at an elevation of 4,717 feet above sea level and is surrounded by rolling hills and wide open spaces. The city is located in the Nebraska Panhandle, which is bordered by South Dakota to the north and Wyoming to the west. The city is located approximately 75 miles from Rapid City, South Dakota and approximately 200 miles from Denver, Colorado.
The city is located in the Nebraska Sandhills, which is a region of grass-covered sand dunes that stretch across the state. The area is known for its wide open spaces and is home to a variety of wildlife, including antelope, deer, and wild turkeys. The area is also home to a variety of birds, including bald eagles, hawks, and owls.
Economy
Chadron is the economic hub of the region and is home to a variety of businesses and industries. The city is home to a variety of retail stores, restaurants, and other businesses. The city is also home to a variety of manufacturing and industrial businesses, including a meat packing plant, a lumber mill, and a grain elevator.
The city is also home to a variety of agricultural businesses, including cattle ranches, dairy farms, and crop farms. The city is also home to a variety of tourist attractions, including the Chadron State Park, the Museum of the Fur Trade, and the Chadron State College.
Demographics
As of the 2010 census, the population of Chadron was 5,000. The population is predominantly white, with approximately 90% of the population identifying as white. The city is also home to a small Hispanic population, with approximately 5% of the population identifying as Hispanic or Latino. The city is also home to a small Native American population, with approximately 2% of the population identifying as Native American.
The median household income in Chadron is approximately $40,000, which is slightly lower than the national average. The median home value in Chadron is approximately $90,000, which is slightly lower than the national average. The city has a poverty rate of approximately 15%, which is slightly higher than the national average.
Conclusion
Chadron, Nebraska is a small city located in the northwest corner of the state. It is the county seat of Dawes County and is the largest city in the county. The city is located in the Pine Ridge region of the state, which is known for its rolling hills and wide open spaces. The city is home to a population of approximately 5,000 people and is the economic hub of the region. The city is home to a variety of businesses and industries, including retail stores, restaurants, manufacturing and industrial businesses, and agricultural businesses. The city is also home to a variety of tourist attractions, including the Chadron State Park, the Museum of the Fur Trade, and the Chadron State College. The population of Chadron is predominantly white, with approximately 90% of the population identifying as white. The median household income in Chadron is approximately $40,000, which is slightly lower than the national average. The median home value in Chadron is approximately $90,000, which is slightly lower than the national average. The city has a poverty rate of approximately 15%, which is slightly higher than the national average.
Common Questions
What is Per Capita Income in Chadron?
Per Capita income in Chadron is $26,587.
What is the Median Family Income in Chadron?
Median Family Income in Chadron is $76,033.
What is the Median Household income in Chadron?
Median Household Income in Chadron is $53,728.
What is Income or Wage Gap in Chadron?
Income or Wage Gap in Chadron is 21.6%.
Women in Chadron earn 78.4 cents for every dollar earned by a man.
What is Inequality or Gini Index in Chadron?
Inequality or Gini Index in Chadron is 0.35.
What is the Total Population of Chadron?
Total Population of Chadron is 5,255.
What is the Total Male Population of Chadron?
Total Male Population of Chadron is 2,497.
What is the Total Female Population of Chadron?
Total Female Population of Chadron is 2,758.
What is the Ratio of Males per 100 Females in Chadron?
There are 90.54 Males per 100 Females in Chadron.
What is the Ratio of Females per 100 Males in Chadron?
There are 110.45 Females per 100 Males in Chadron.
What is the Median Population Age in Chadron?
Median Population Age in Chadron is 28.6 Years.
What is the Average Family Size in Chadron
Average Family Size in Chadron is 2.8 People.
What is the Average Household Size in Chadron
Average Household Size in Chadron is 2.1 People.
How Large is the Labor Force in Chadron?
There are 3,001 People in the Labor Forcein in Chadron.
What is the Percentage of People in the Labor Force in Chadron?
68.2% of People are in the Labor Force in Chadron.
What is the Unemployment Rate in Chadron?
Unemployment Rate in Chadron is 1.8%.