Wyoming, MN Map & Demographics
Wyoming Map
Wyoming Overview
$40,240
PER CAPITA INCOME
$101,633
AVG FAMILY INCOME
$99,821
AVG HOUSEHOLD INCOME
28.2%
WAGE / INCOME GAP [ % ]
71.8¢/ $1
WAGE / INCOME GAP [ $ ]
0.33
INEQUALITY / GINI INDEX
8,037
TOTAL POPULATION
4,158
MALE POPULATION
3,879
FEMALE POPULATION
107.19
MALES / 100 FEMALES
93.29
FEMALES / 100 MALES
40.4
MEDIAN AGE
3.0
AVG FAMILY SIZE
2.8
AVG HOUSEHOLD SIZE
4,446
LABOR FORCE [ PEOPLE ]
69.2%
PERCENT IN LABOR FORCE
2.9%
UNEMPLOYMENT RATE
Wyoming Zip Codes
Wyoming Area Codes
Income in Wyoming
Income Overview in Wyoming
Per Capita Income in Wyoming is $40,240, while median incomes of families and households are $101,633 and $99,821 respectively.
| Characteristic | Number | Measure |
| Per Capita Income | 8,037 | $40,240 |
| Median Family Income | 2,464 | $101,633 |
| Mean Family Income | 2,464 | $115,649 |
| Median Household Income | 2,879 | $99,821 |
| Mean Household Income | 2,879 | $109,581 |
| Income Deficit | 2,464 | $0 |
| Wage / Income Gap (%) | 8,037 | 28.20% |
| Wage / Income Gap ($) | 8,037 | 71.80¢ per $1 |
| Gini / Inequality Index | 8,037 | 0.33 |
Earnings by Sex in Wyoming
Average Earnings in Wyoming are $49,391, $60,593 for men and $43,505 for women, a difference of 28.2%.
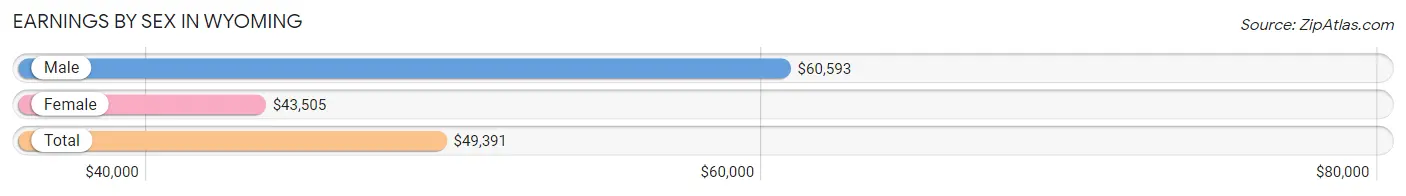
| Sex | Number | Average Earnings |
| Male | 2,401 (52.6%) | $60,593 |
| Female | 2,162 (47.4%) | $43,505 |
| Total | 4,563 (100.0%) | $49,391 |
Earnings by Sex by Income Bracket in Wyoming
The most common earnings brackets in Wyoming are $75,000 to $99,999 for men (608 | 25.3%) and $75,000 to $99,999 for women (250 | 11.6%).
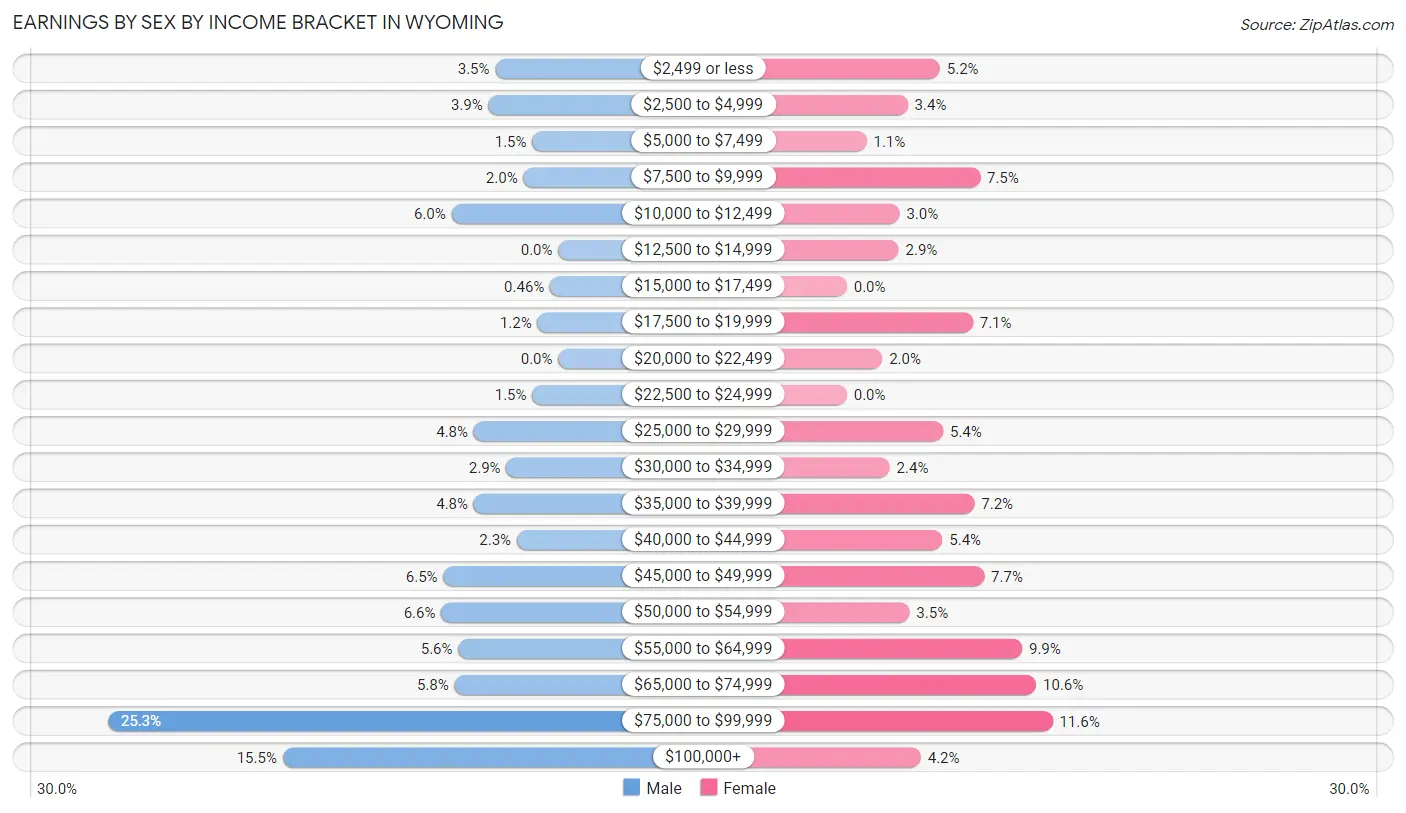
| Income | Male | Female |
| $2,499 or less | 85 (3.5%) | 113 (5.2%) |
| $2,500 to $4,999 | 94 (3.9%) | 74 (3.4%) |
| $5,000 to $7,499 | 35 (1.5%) | 24 (1.1%) |
| $7,500 to $9,999 | 47 (2.0%) | 162 (7.5%) |
| $10,000 to $12,499 | 144 (6.0%) | 64 (3.0%) |
| $12,500 to $14,999 | 0 (0.0%) | 63 (2.9%) |
| $15,000 to $17,499 | 11 (0.5%) | 0 (0.0%) |
| $17,500 to $19,999 | 28 (1.2%) | 153 (7.1%) |
| $20,000 to $22,499 | 0 (0.0%) | 43 (2.0%) |
| $22,500 to $24,999 | 35 (1.5%) | 0 (0.0%) |
| $25,000 to $29,999 | 114 (4.8%) | 117 (5.4%) |
| $30,000 to $34,999 | 70 (2.9%) | 52 (2.4%) |
| $35,000 to $39,999 | 114 (4.8%) | 155 (7.2%) |
| $40,000 to $44,999 | 56 (2.3%) | 116 (5.4%) |
| $45,000 to $49,999 | 155 (6.5%) | 167 (7.7%) |
| $50,000 to $54,999 | 158 (6.6%) | 76 (3.5%) |
| $55,000 to $64,999 | 135 (5.6%) | 213 (9.9%) |
| $65,000 to $74,999 | 140 (5.8%) | 230 (10.6%) |
| $75,000 to $99,999 | 608 (25.3%) | 250 (11.6%) |
| $100,000+ | 372 (15.5%) | 90 (4.2%) |
| Total | 2,401 (100.0%) | 2,162 (100.0%) |
Earnings by Sex by Educational Attainment in Wyoming
Average earnings in Wyoming are $72,429 for men and $47,250 for women, a difference of 34.8%. Men with an educational attainment of bachelor's degree enjoy the highest average annual earnings of $96,174, while those with high school diploma education earn the least with $47,100. Women with an educational attainment of graduate degree earn the most with the average annual earnings of $77,422, while those with less than high school education have the smallest earnings of $23,750.
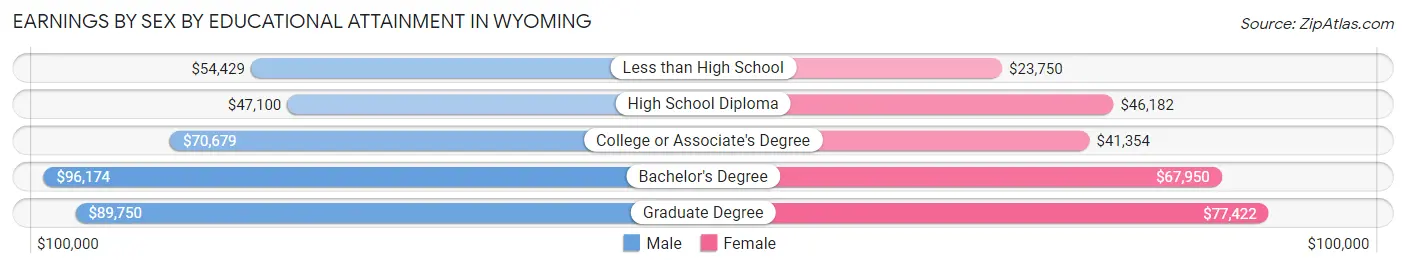
| Educational Attainment | Male Income | Female Income |
| Less than High School | $54,429 | $23,750 |
| High School Diploma | $47,100 | $46,182 |
| College or Associate's Degree | $70,679 | $41,354 |
| Bachelor's Degree | $96,174 | $67,950 |
| Graduate Degree | $89,750 | $77,422 |
| Total | $72,429 | $47,250 |
Family Income in Wyoming
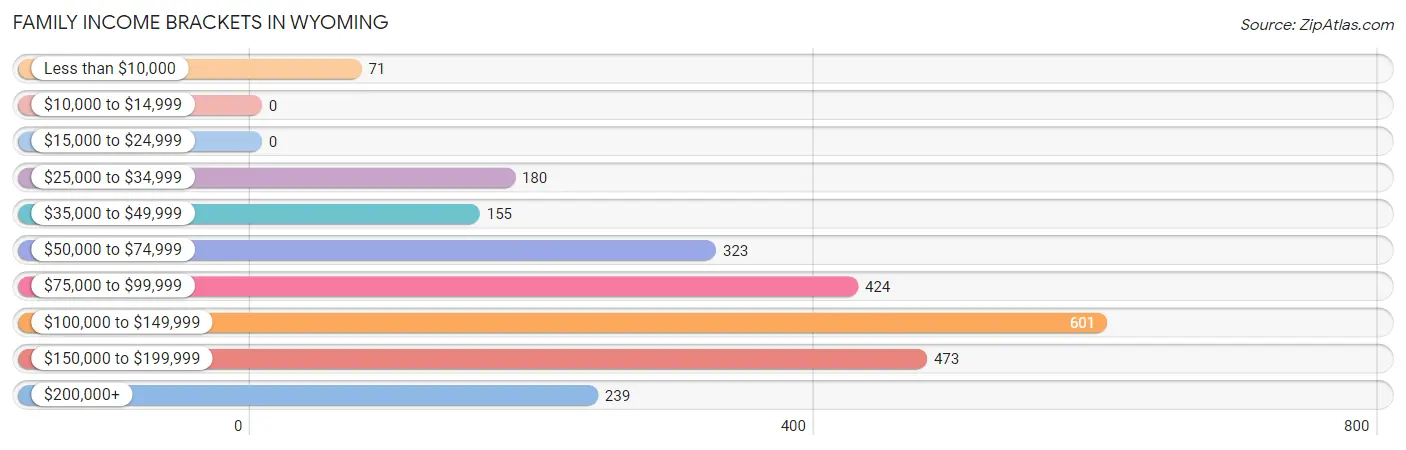
Family Income Brackets in Wyoming
According to the Wyoming family income data, there are 601 families falling into the $100,000 to $149,999 income range, which is the most common income bracket and makes up 24.4% of all families.
| Income Bracket | # Families | % Families |
| Less than $10,000 | 71 | 2.9% |
| $10,000 to $14,999 | 0 | 0.0% |
| $15,000 to $24,999 | 0 | 0.0% |
| $25,000 to $34,999 | 180 | 7.3% |
| $35,000 to $49,999 | 155 | 6.3% |
| $50,000 to $74,999 | 323 | 13.1% |
| $75,000 to $99,999 | 424 | 17.2% |
| $100,000 to $149,999 | 601 | 24.4% |
| $150,000 to $199,999 | 473 | 19.2% |
| $200,000+ | 239 | 9.7% |
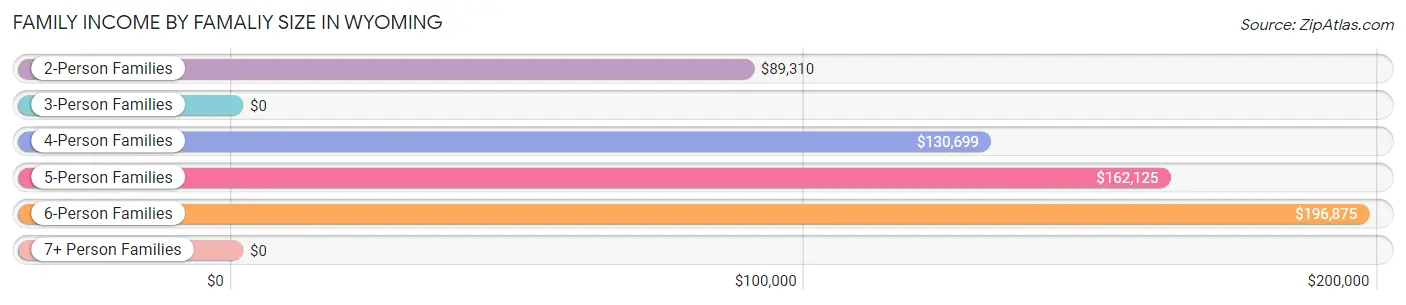
Family Income by Famaliy Size in Wyoming
6-person families (41 | 1.7%) account for the highest median family income in Wyoming with $196,875 per family, while 2-person families (1,230 | 49.9%) have the highest median income of $44,655 per family member.
| Income Bracket | # Families | Median Income |
| 2-Person Families | 1,230 (49.9%) | $89,310 |
| 3-Person Families | 422 (17.1%) | $0 |
| 4-Person Families | 635 (25.8%) | $130,699 |
| 5-Person Families | 115 (4.7%) | $162,125 |
| 6-Person Families | 41 (1.7%) | $196,875 |
| 7+ Person Families | 21 (0.9%) | $0 |
| Total | 2,464 (100.0%) | $101,633 |
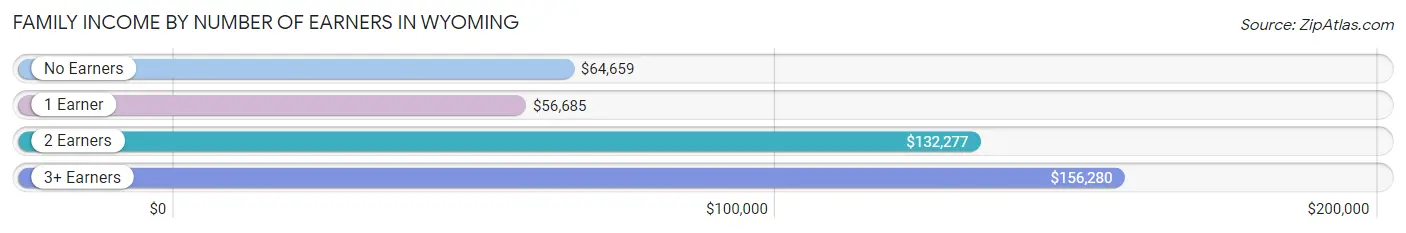
Family Income by Number of Earners in Wyoming
The median family income in Wyoming is $101,633, with families comprising 3+ earners (343) having the highest median family income of $156,280, while families with 1 earner (554) have the lowest median family income of $56,685, accounting for 13.9% and 22.5% of families, respectively.
| Number of Earners | # Families | Median Income |
| No Earners | 459 (18.6%) | $64,659 |
| 1 Earner | 554 (22.5%) | $56,685 |
| 2 Earners | 1,108 (45.0%) | $132,277 |
| 3+ Earners | 343 (13.9%) | $156,280 |
| Total | 2,464 (100.0%) | $101,633 |
Household Income in Wyoming
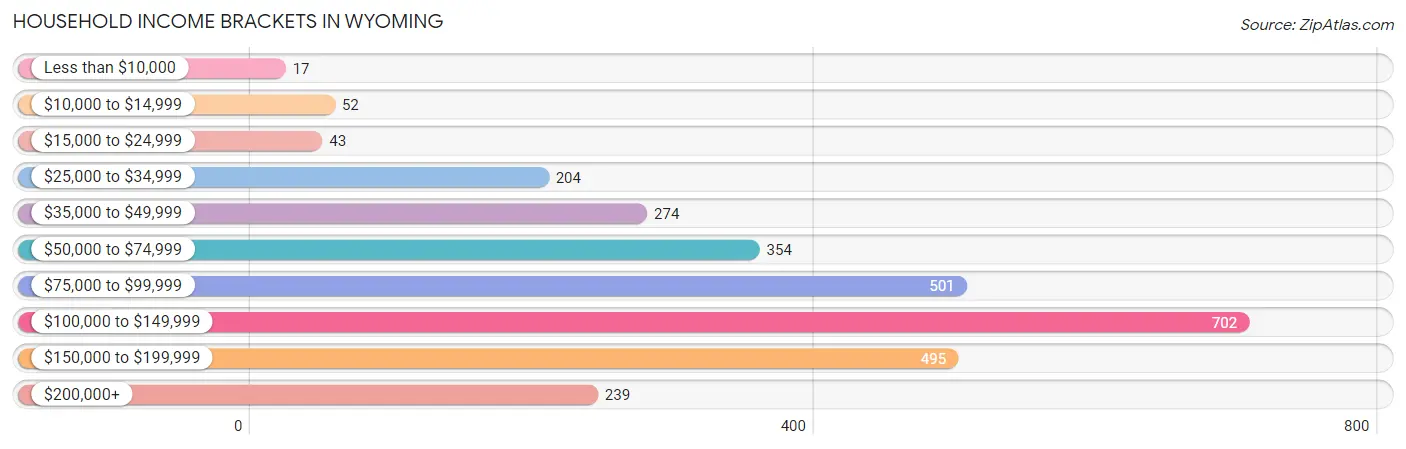
Household Income Brackets in Wyoming
With 702 households falling in the category, the $100,000 to $149,999 income range is the most frequent in Wyoming, accounting for 24.4% of all households. In contrast, only 17 households (0.6%) fall into the less than $10,000 income bracket, making it the least populous group.
| Income Bracket | # Households | % Households |
| Less than $10,000 | 17 | 0.6% |
| $10,000 to $14,999 | 52 | 1.8% |
| $15,000 to $24,999 | 43 | 1.5% |
| $25,000 to $34,999 | 204 | 7.1% |
| $35,000 to $49,999 | 274 | 9.5% |
| $50,000 to $74,999 | 354 | 12.3% |
| $75,000 to $99,999 | 501 | 17.4% |
| $100,000 to $149,999 | 702 | 24.4% |
| $150,000 to $199,999 | 495 | 17.2% |
| $200,000+ | 239 | 8.3% |
Household Income by Householder Age in Wyoming
The median household income in Wyoming is $99,821, with the highest median household income of $133,381 found in the 45 to 64 years age bracket for the primary householder. A total of 1,257 households (43.7%) fall into this category. Meanwhile, the 15 to 24 years age bracket for the primary householder has the lowest median household income of $0, with 79 households (2.7%) in this group.
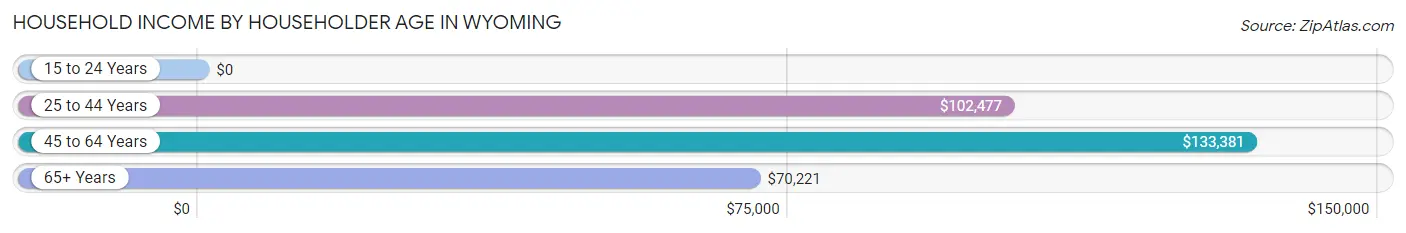
| Income Bracket | # Households | Median Income |
| 15 to 24 Years | 79 (2.7%) | $0 |
| 25 to 44 Years | 826 (28.7%) | $102,477 |
| 45 to 64 Years | 1,257 (43.7%) | $133,381 |
| 65+ Years | 717 (24.9%) | $70,221 |
| Total | 2,879 (100.0%) | $99,821 |
Poverty in Wyoming
Income Below Poverty by Sex and Age in Wyoming
With 3.1% poverty level for males and 4.0% for females among the residents of Wyoming, under 5 year old males and 18 to 24 year old females are the most vulnerable to poverty, with 62 males (18.6%) and 79 females (29.0%) in their respective age groups living below the poverty level.
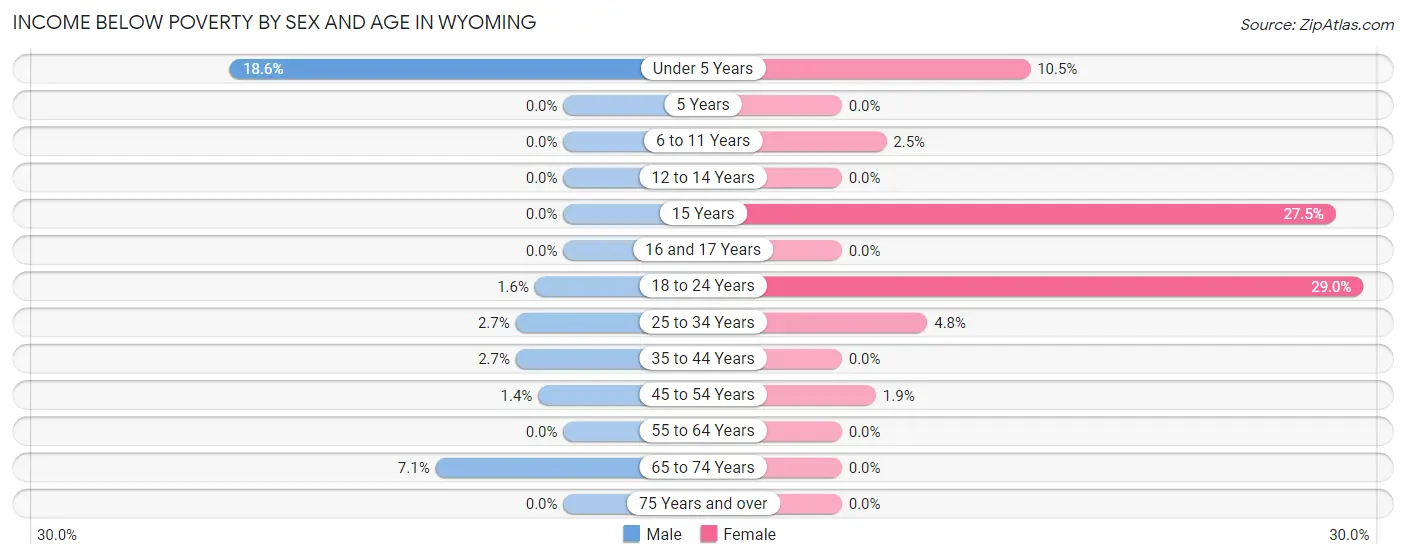
| Age Bracket | Male | Female |
| Under 5 Years | 62 (18.6%) | 30 (10.5%) |
| 5 Years | 0 (0.0%) | 0 (0.0%) |
| 6 to 11 Years | 0 (0.0%) | 10 (2.5%) |
| 12 to 14 Years | 0 (0.0%) | 0 (0.0%) |
| 15 Years | 0 (0.0%) | 11 (27.5%) |
| 16 and 17 Years | 0 (0.0%) | 0 (0.0%) |
| 18 to 24 Years | 8 (1.6%) | 79 (29.0%) |
| 25 to 34 Years | 12 (2.7%) | 16 (4.8%) |
| 35 to 44 Years | 12 (2.6%) | 0 (0.0%) |
| 45 to 54 Years | 7 (1.4%) | 9 (1.9%) |
| 55 to 64 Years | 0 (0.0%) | 0 (0.0%) |
| 65 to 74 Years | 28 (7.1%) | 0 (0.0%) |
| 75 Years and over | 0 (0.0%) | 0 (0.0%) |
| Total | 129 (3.1%) | 155 (4.0%) |
Income Above Poverty by Sex and Age in Wyoming
According to the poverty statistics in Wyoming, males aged 5 years and females aged 5 years are the age groups that are most secure financially, with 100.0% of males and 100.0% of females in these age groups living above the poverty line.
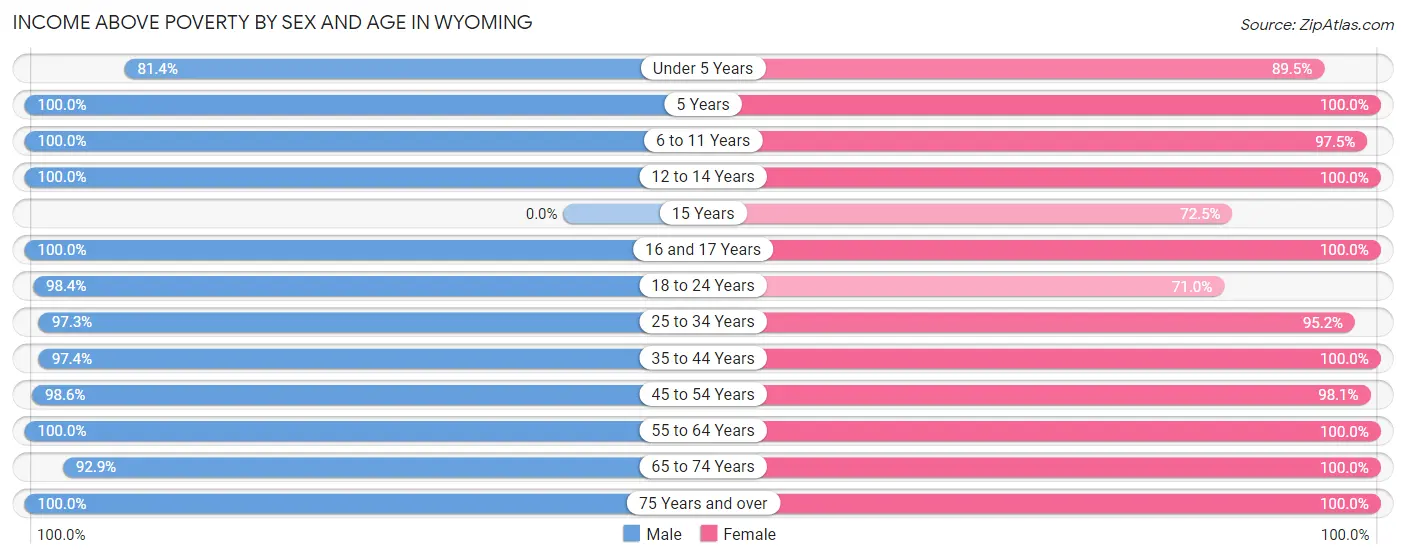
| Age Bracket | Male | Female |
| Under 5 Years | 272 (81.4%) | 256 (89.5%) |
| 5 Years | 76 (100.0%) | 13 (100.0%) |
| 6 to 11 Years | 168 (100.0%) | 394 (97.5%) |
| 12 to 14 Years | 187 (100.0%) | 104 (100.0%) |
| 15 Years | 0 (0.0%) | 29 (72.5%) |
| 16 and 17 Years | 125 (100.0%) | 206 (100.0%) |
| 18 to 24 Years | 494 (98.4%) | 193 (71.0%) |
| 25 to 34 Years | 439 (97.3%) | 320 (95.2%) |
| 35 to 44 Years | 440 (97.4%) | 445 (100.0%) |
| 45 to 54 Years | 494 (98.6%) | 465 (98.1%) |
| 55 to 64 Years | 738 (100.0%) | 695 (100.0%) |
| 65 to 74 Years | 365 (92.9%) | 422 (100.0%) |
| 75 Years and over | 231 (100.0%) | 182 (100.0%) |
| Total | 4,029 (96.9%) | 3,724 (96.0%) |
Income Below Poverty Among Married-Couple Families in Wyoming
The poverty statistics for married-couple families in Wyoming show that 0.8% or 16 of the total 2,069 families live below the poverty line. Families with 1 or 2 children have the highest poverty rate of 2.4%, comprising of 16 families. On the other hand, families with no children have the lowest poverty rate of 0.0%, which includes 0 families.
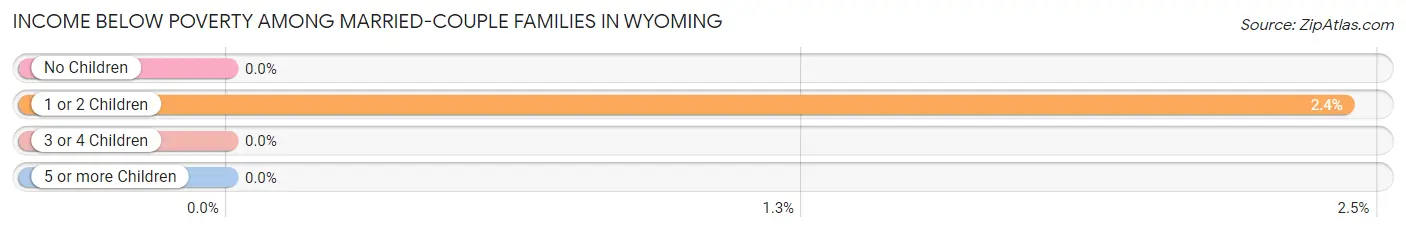
| Children | Above Poverty | Below Poverty |
| No Children | 1,295 (100.0%) | 0 (0.0%) |
| 1 or 2 Children | 642 (97.6%) | 16 (2.4%) |
| 3 or 4 Children | 96 (100.0%) | 0 (0.0%) |
| 5 or more Children | 20 (100.0%) | 0 (0.0%) |
| Total | 2,053 (99.2%) | 16 (0.8%) |
Income Below Poverty Among Single-Parent Households in Wyoming
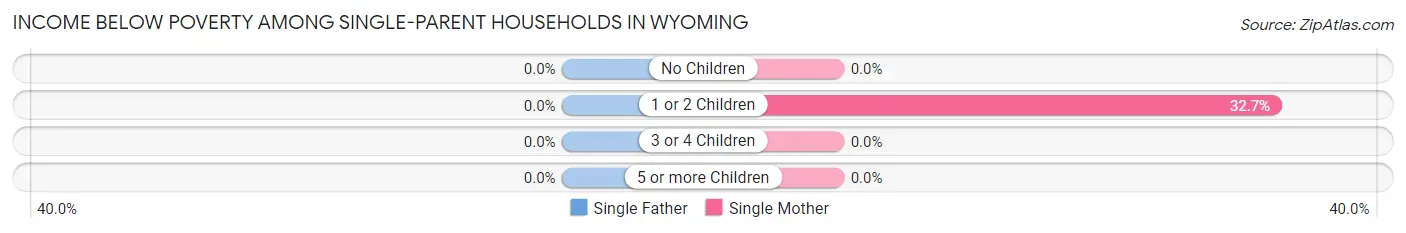
| Children | Single Father | Single Mother |
| No Children | 0 (0.0%) | 0 (0.0%) |
| 1 or 2 Children | 0 (0.0%) | 64 (32.7%) |
| 3 or 4 Children | 0 (0.0%) | 0 (0.0%) |
| 5 or more Children | 0 (0.0%) | 0 (0.0%) |
| Total | 0 (0.0%) | 64 (24.0%) |
Income Below Poverty Among Married-Couple vs Single-Parent Households in Wyoming
The poverty data for Wyoming shows that 16 of the married-couple family households (0.8%) and 64 of the single-parent households (16.2%) are living below the poverty level. Within the married-couple family households, those with 1 or 2 children have the highest poverty rate, with 16 households (2.4%) falling below the poverty line. Among the single-parent households, those with 1 or 2 children have the highest poverty rate, with 64 household (21.6%) living below poverty.
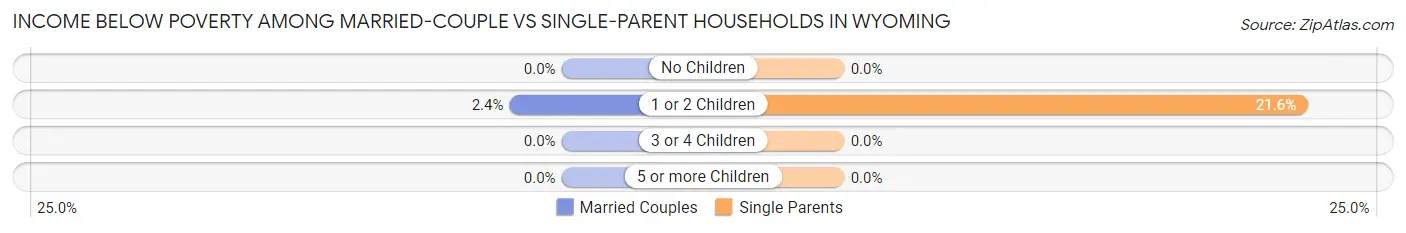
| Children | Married-Couple Families | Single-Parent Households |
| No Children | 0 (0.0%) | 0 (0.0%) |
| 1 or 2 Children | 16 (2.4%) | 64 (21.6%) |
| 3 or 4 Children | 0 (0.0%) | 0 (0.0%) |
| 5 or more Children | 0 (0.0%) | 0 (0.0%) |
| Total | 16 (0.8%) | 64 (16.2%) |
Race in Wyoming
The most populous races in Wyoming are White / Caucasian (7,909 | 98.4%), Hispanic or Latino (103 | 1.3%), and Two or more Races (91 | 1.1%).
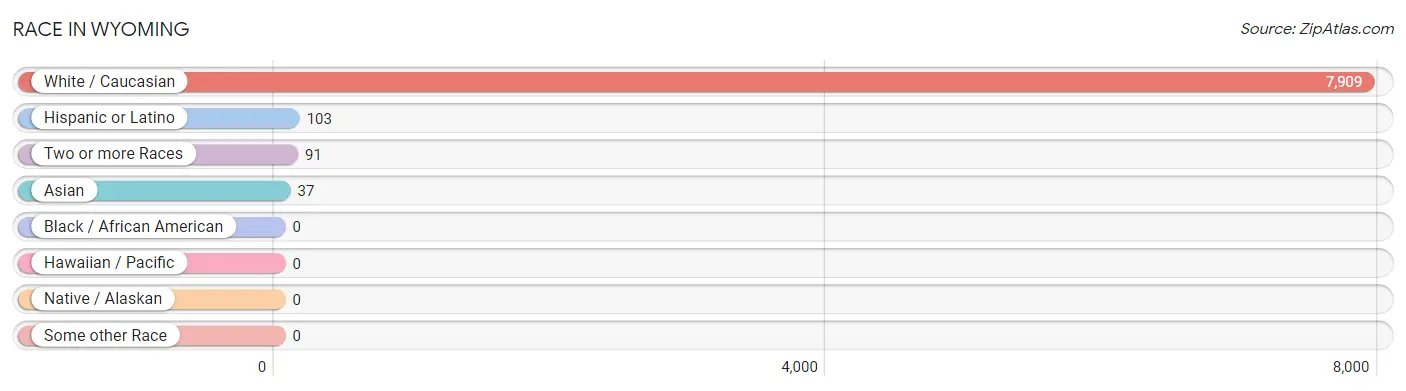
| Race | # Population | % Population |
| Asian | 37 | 0.5% |
| Black / African American | 0 | 0.0% |
| Hawaiian / Pacific | 0 | 0.0% |
| Hispanic or Latino | 103 | 1.3% |
| Native / Alaskan | 0 | 0.0% |
| White / Caucasian | 7,909 | 98.4% |
| Two or more Races | 91 | 1.1% |
| Some other Race | 0 | 0.0% |
| Total | 8,037 | 100.0% |
Ancestry in Wyoming
The most populous ancestries reported in Wyoming are German (2,812 | 35.0%), Norwegian (1,151 | 14.3%), Irish (984 | 12.2%), American (801 | 10.0%), and Swedish (793 | 9.9%), together accounting for 81.4% of all Wyoming residents.
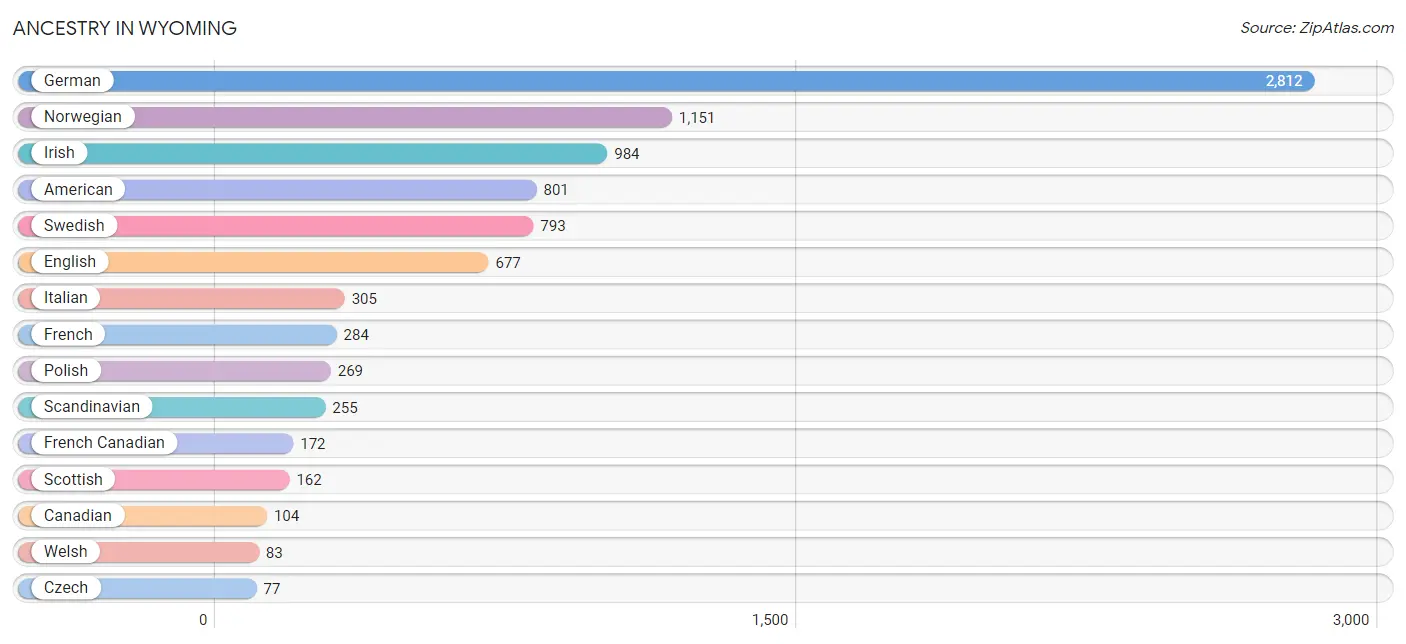
| Ancestry | # Population | % Population |
| American | 801 | 10.0% |
| Austrian | 12 | 0.2% |
| Bangladeshi | 37 | 0.5% |
| Belgian | 20 | 0.3% |
| British | 14 | 0.2% |
| Canadian | 104 | 1.3% |
| Chippewa | 10 | 0.1% |
| Colombian | 3 | 0.0% |
| Croatian | 51 | 0.6% |
| Czech | 77 | 1.0% |
| Czechoslovakian | 10 | 0.1% |
| Danish | 45 | 0.6% |
| Dutch | 9 | 0.1% |
| English | 677 | 8.4% |
| European | 75 | 0.9% |
| Finnish | 41 | 0.5% |
| French | 284 | 3.5% |
| French Canadian | 172 | 2.1% |
| German | 2,812 | 35.0% |
| Hungarian | 20 | 0.3% |
| Irish | 984 | 12.2% |
| Italian | 305 | 3.8% |
| Mexican | 41 | 0.5% |
| Norwegian | 1,151 | 14.3% |
| Polish | 269 | 3.4% |
| Puerto Rican | 59 | 0.7% |
| Romanian | 18 | 0.2% |
| Russian | 24 | 0.3% |
| Scandinavian | 255 | 3.2% |
| Scotch-Irish | 31 | 0.4% |
| Scottish | 162 | 2.0% |
| Slovene | 3 | 0.0% |
| South American | 3 | 0.0% |
| Swedish | 793 | 9.9% |
| Ukrainian | 12 | 0.2% |
| Welsh | 83 | 1.0% | View All 36 Rows |
Immigrants in Wyoming
The most numerous immigrant groups reported in Wyoming came from Canada (118 | 1.5%), Asia (8 | 0.1%), Laos (8 | 0.1%), South Eastern Asia (8 | 0.1%), and Colombia (3 | 0.0%), together accounting for 1.8% of all Wyoming residents.
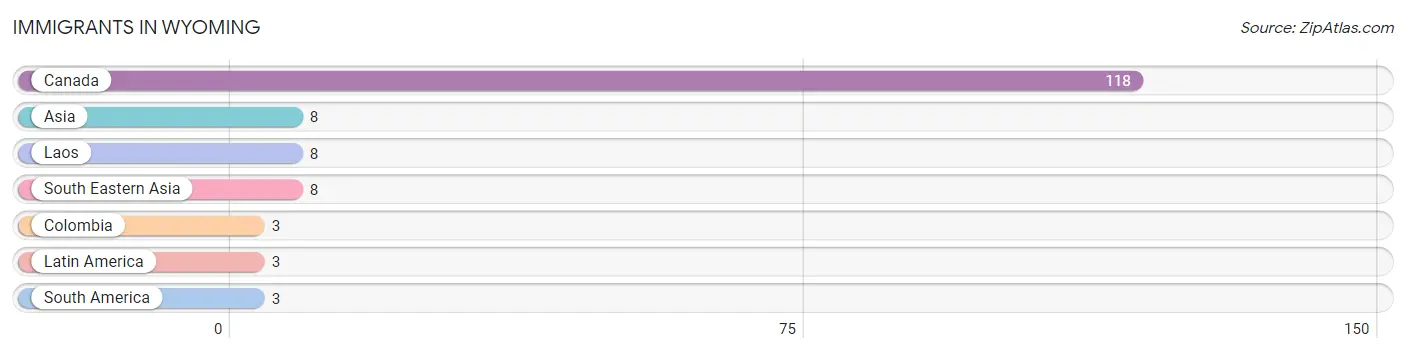
| Immigration Origin | # Population | % Population |
| Asia | 8 | 0.1% |
| Canada | 118 | 1.5% |
| Colombia | 3 | 0.0% |
| Laos | 8 | 0.1% |
| Latin America | 3 | 0.0% |
| South America | 3 | 0.0% |
| South Eastern Asia | 8 | 0.1% | View All 7 Rows |
Sex and Age in Wyoming
Sex and Age in Wyoming
The most populous age groups in Wyoming are 60 to 64 Years (430 | 10.3%) for men and 60 to 64 Years (374 | 9.6%) for women.
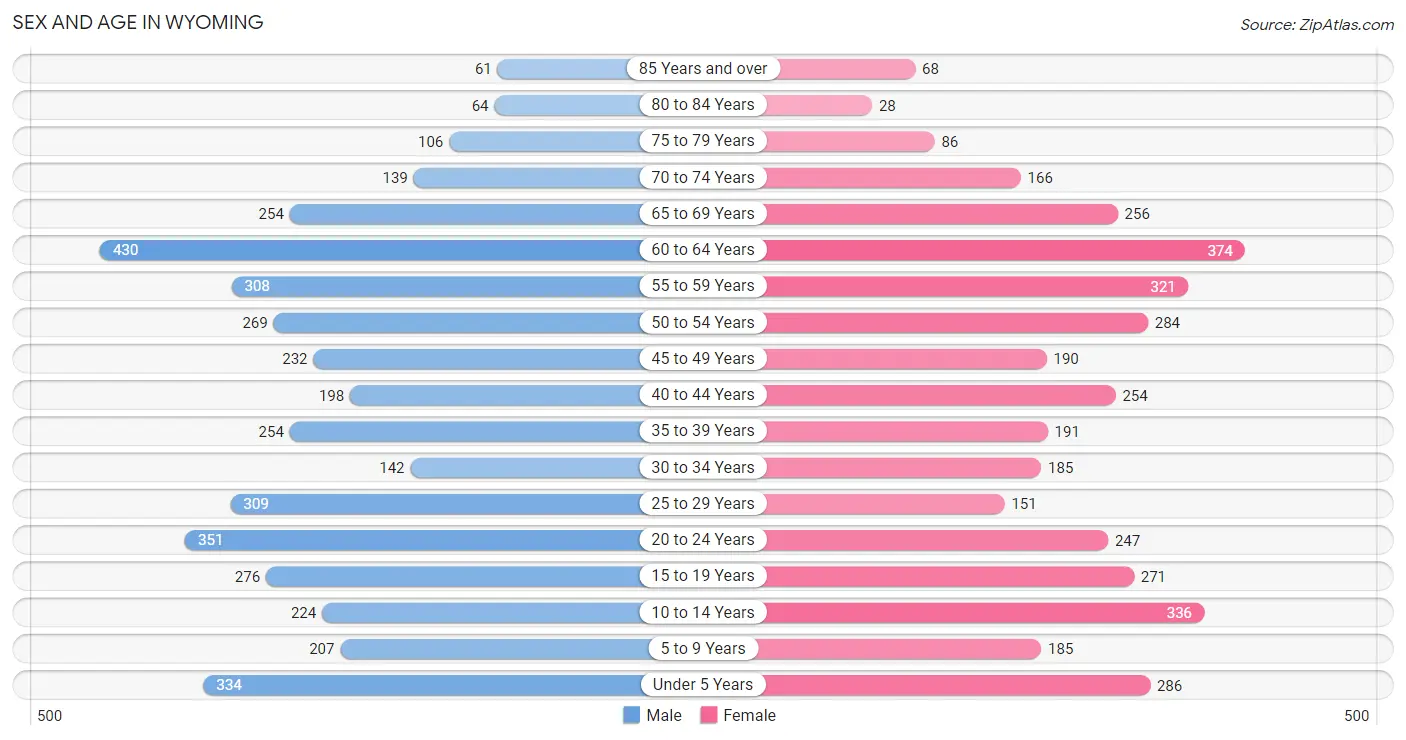
| Age Bracket | Male | Female |
| Under 5 Years | 334 (8.0%) | 286 (7.4%) |
| 5 to 9 Years | 207 (5.0%) | 185 (4.8%) |
| 10 to 14 Years | 224 (5.4%) | 336 (8.7%) |
| 15 to 19 Years | 276 (6.6%) | 271 (7.0%) |
| 20 to 24 Years | 351 (8.4%) | 247 (6.4%) |
| 25 to 29 Years | 309 (7.4%) | 151 (3.9%) |
| 30 to 34 Years | 142 (3.4%) | 185 (4.8%) |
| 35 to 39 Years | 254 (6.1%) | 191 (4.9%) |
| 40 to 44 Years | 198 (4.8%) | 254 (6.6%) |
| 45 to 49 Years | 232 (5.6%) | 190 (4.9%) |
| 50 to 54 Years | 269 (6.5%) | 284 (7.3%) |
| 55 to 59 Years | 308 (7.4%) | 321 (8.3%) |
| 60 to 64 Years | 430 (10.3%) | 374 (9.6%) |
| 65 to 69 Years | 254 (6.1%) | 256 (6.6%) |
| 70 to 74 Years | 139 (3.3%) | 166 (4.3%) |
| 75 to 79 Years | 106 (2.5%) | 86 (2.2%) |
| 80 to 84 Years | 64 (1.5%) | 28 (0.7%) |
| 85 Years and over | 61 (1.5%) | 68 (1.8%) |
| Total | 4,158 (100.0%) | 3,879 (100.0%) |
Families and Households in Wyoming
Median Family Size in Wyoming
The median family size in Wyoming is 3.00 persons per family, with single male/father families (128 | 5.2%) accounting for the largest median family size of 3.17 persons per family. On the other hand, single female/mother families (267 | 10.8%) represent the smallest median family size with 2.96 persons per family.
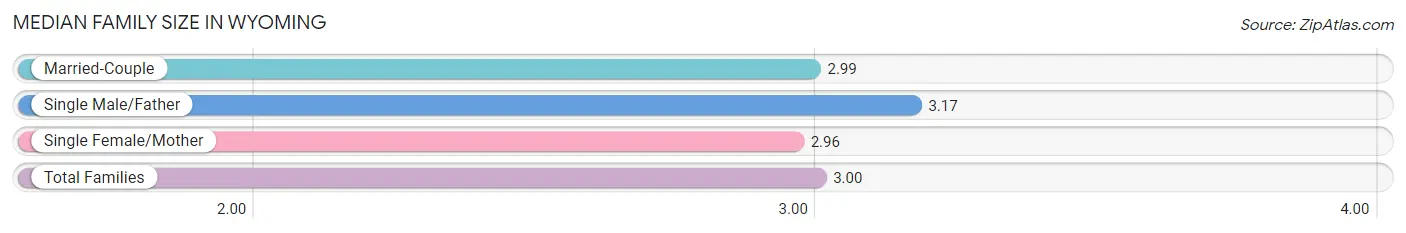
| Family Type | # Families | Family Size |
| Married-Couple | 2,069 (84.0%) | 2.99 |
| Single Male/Father | 128 (5.2%) | 3.17 |
| Single Female/Mother | 267 (10.8%) | 2.96 |
| Total Families | 2,464 (100.0%) | 3.00 |
Median Household Size in Wyoming
The median household size in Wyoming is 2.78 persons per household, with single female/mother households (267 | 9.3%) accounting for the largest median household size of 3.44 persons per household. non-family households (415 | 14.4%) represent the smallest median household size with 1.15 persons per household.
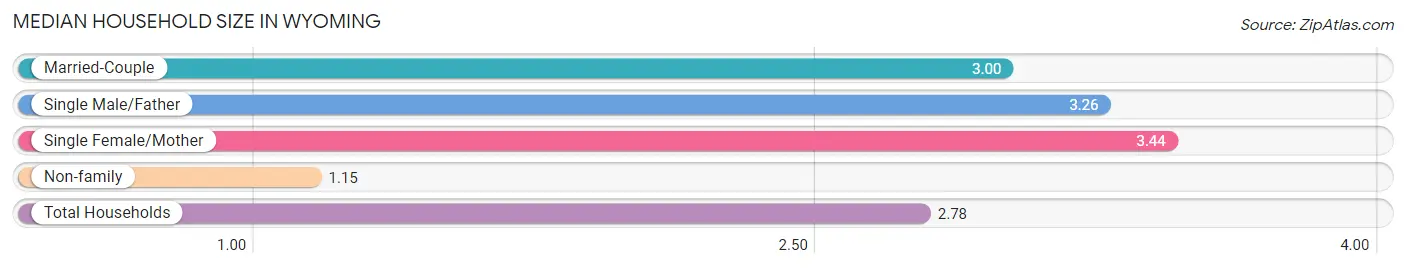
| Household Type | # Households | Household Size |
| Married-Couple | 2,069 (71.9%) | 3.00 |
| Single Male/Father | 128 (4.4%) | 3.26 |
| Single Female/Mother | 267 (9.3%) | 3.44 |
| Non-family | 415 (14.4%) | 1.15 |
| Total Households | 2,879 (100.0%) | 2.78 |
Household Size by Marriage Status in Wyoming
Out of a total of 2,879 households in Wyoming, 2,464 (85.6%) are family households, while 415 (14.4%) are nonfamily households. The most numerous type of family households are 2-person households, comprising 1,175, and the most common type of nonfamily households are 1-person households, comprising 367.
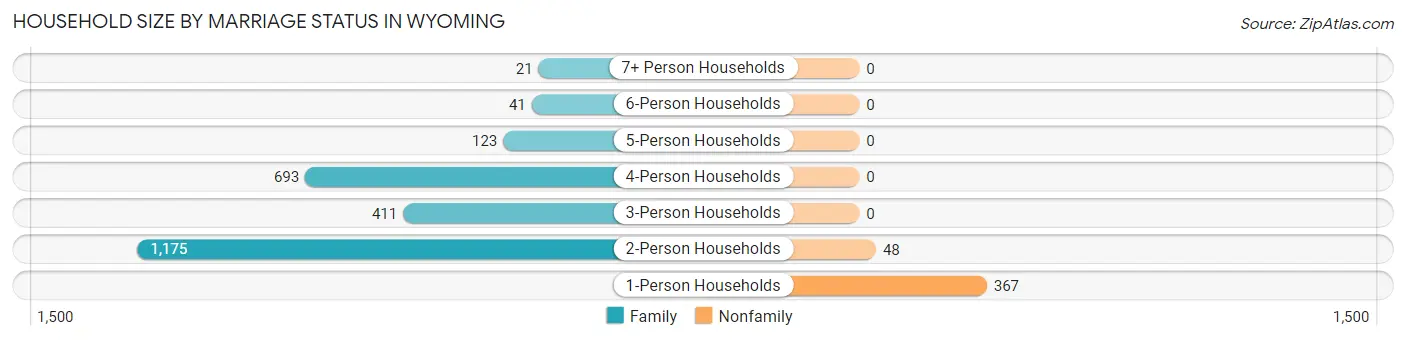
| Household Size | Family Households | Nonfamily Households |
| 1-Person Households | - | 367 (12.8%) |
| 2-Person Households | 1,175 (40.8%) | 48 (1.7%) |
| 3-Person Households | 411 (14.3%) | 0 (0.0%) |
| 4-Person Households | 693 (24.1%) | 0 (0.0%) |
| 5-Person Households | 123 (4.3%) | 0 (0.0%) |
| 6-Person Households | 41 (1.4%) | 0 (0.0%) |
| 7+ Person Households | 21 (0.7%) | 0 (0.0%) |
| Total | 2,464 (85.6%) | 415 (14.4%) |
Female Fertility in Wyoming
Fertility by Age in Wyoming
Average fertility rate in Wyoming is 101.0 births per 1,000 women. Women in the age bracket of 20 to 34 years have the highest fertility rate with 228.0 births per 1,000 women. Women in the age bracket of 20 to 34 years acount for 85.3% of all women with births.
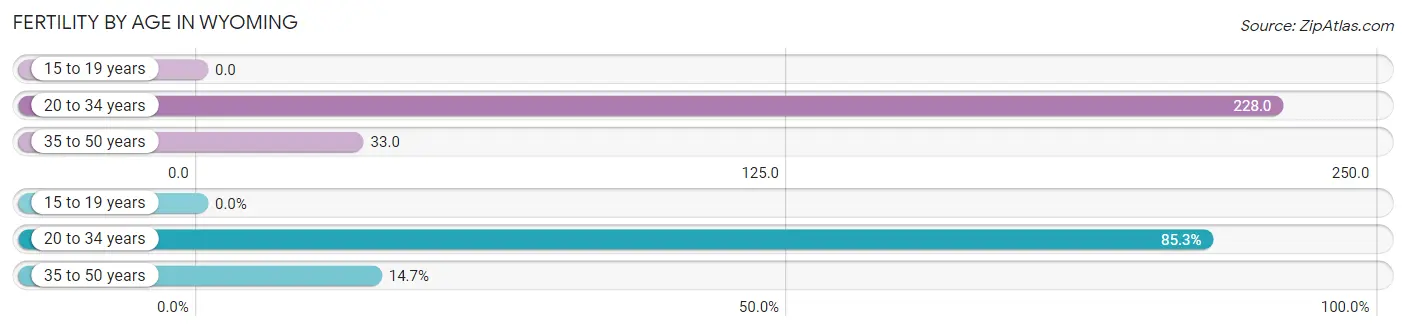
| Age Bracket | Women with Births | Births / 1,000 Women |
| 15 to 19 years | 0 (0.0%) | 0.0 |
| 20 to 34 years | 133 (85.3%) | 228.0 |
| 35 to 50 years | 23 (14.7%) | 33.0 |
| Total | 156 (100.0%) | 101.0 |
Fertility by Age by Marriage Status in Wyoming
97.4% of women with births (156) in Wyoming are married. The highest percentage of unmarried women with births falls into 20 to 34 years age bracket with 3.0% of them unmarried at the time of birth, while the lowest percentage of unmarried women with births belong to 35 to 50 years age bracket with 0.0% of them unmarried.
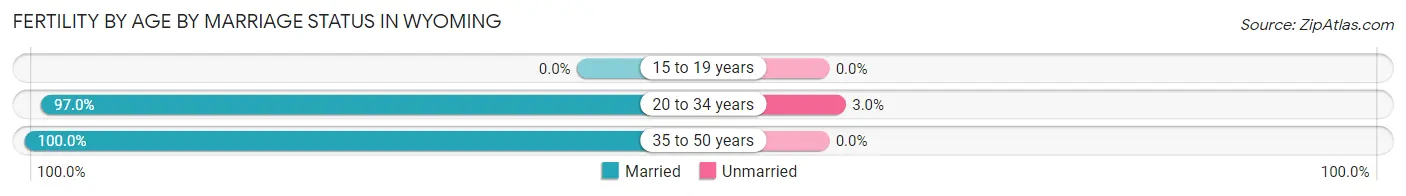
| Age Bracket | Married | Unmarried |
| 15 to 19 years | 0 (0.0%) | 0 (0.0%) |
| 20 to 34 years | 129 (97.0%) | 4 (3.0%) |
| 35 to 50 years | 23 (100.0%) | 0 (0.0%) |
| Total | 152 (97.4%) | 4 (2.6%) |
Fertility by Education in Wyoming
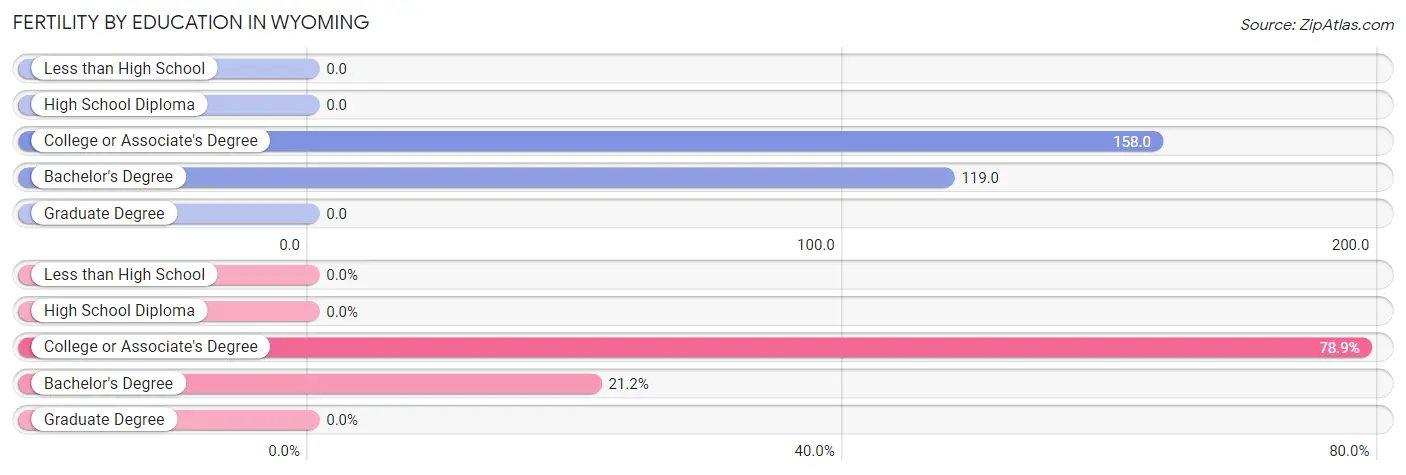
| Educational Attainment | Women with Births | Births / 1,000 Women |
| Less than High School | 0 (0.0%) | 0.0 |
| High School Diploma | 0 (0.0%) | 0.0 |
| College or Associate's Degree | 123 (78.8%) | 158.0 |
| Bachelor's Degree | 33 (21.1%) | 119.0 |
| Graduate Degree | 0 (0.0%) | 0.0 |
| Total | 156 (100.0%) | 101.0 |
Fertility by Education by Marriage Status in Wyoming
2.6% of women with births in Wyoming are unmarried. Women with the educational attainment of bachelor's degree are most likely to be married with 100.0% of them married at childbirth, while women with the educational attainment of college or associate's degree are least likely to be married with 3.3% of them unmarried at childbirth.
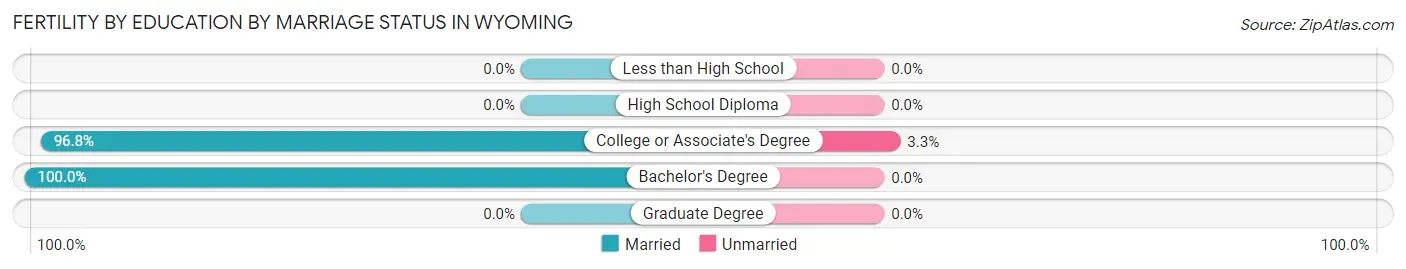
| Educational Attainment | Married | Unmarried |
| Less than High School | 0 (0.0%) | 0 (0.0%) |
| High School Diploma | 0 (0.0%) | 0 (0.0%) |
| College or Associate's Degree | 119 (96.8%) | 4 (3.3%) |
| Bachelor's Degree | 33 (100.0%) | 0 (0.0%) |
| Graduate Degree | 0 (0.0%) | 0 (0.0%) |
| Total | 152 (97.4%) | 4 (2.6%) |
Employment Characteristics in Wyoming
Employment by Class of Employer in Wyoming
Among the 4,253 employed individuals in Wyoming, private company employees (2,943 | 69.2%), local government employees (419 | 9.9%), and not-for-profit organizations (331 | 7.8%) make up the most common classes of employment.
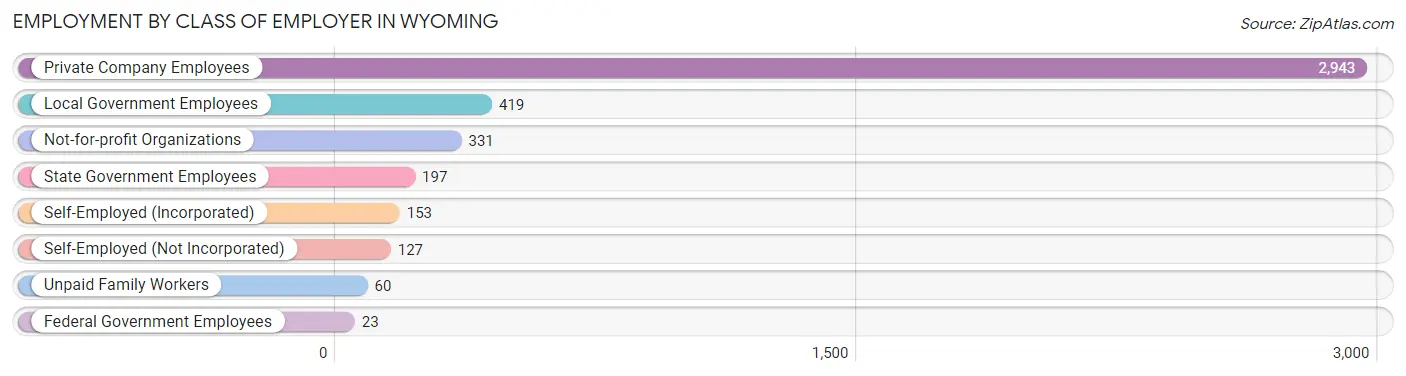
| Employer Class | # Employees | % Employees |
| Private Company Employees | 2,943 | 69.2% |
| Self-Employed (Incorporated) | 153 | 3.6% |
| Self-Employed (Not Incorporated) | 127 | 3.0% |
| Not-for-profit Organizations | 331 | 7.8% |
| Local Government Employees | 419 | 9.9% |
| State Government Employees | 197 | 4.6% |
| Federal Government Employees | 23 | 0.5% |
| Unpaid Family Workers | 60 | 1.4% |
| Total | 4,253 | 100.0% |
Employment Status by Age in Wyoming
According to the labor force statistics for Wyoming, out of the total population over 16 years of age (6,425), 69.2% or 4,446 individuals are in the labor force, with 2.9% or 129 of them unemployed. The age group with the highest labor force participation rate is 25 to 29 years, with 100.0% or 460 individuals in the labor force. Within the labor force, the 30 to 34 years age range has the highest percentage of unemployed individuals, with 8.3% or 21 of them being unemployed.
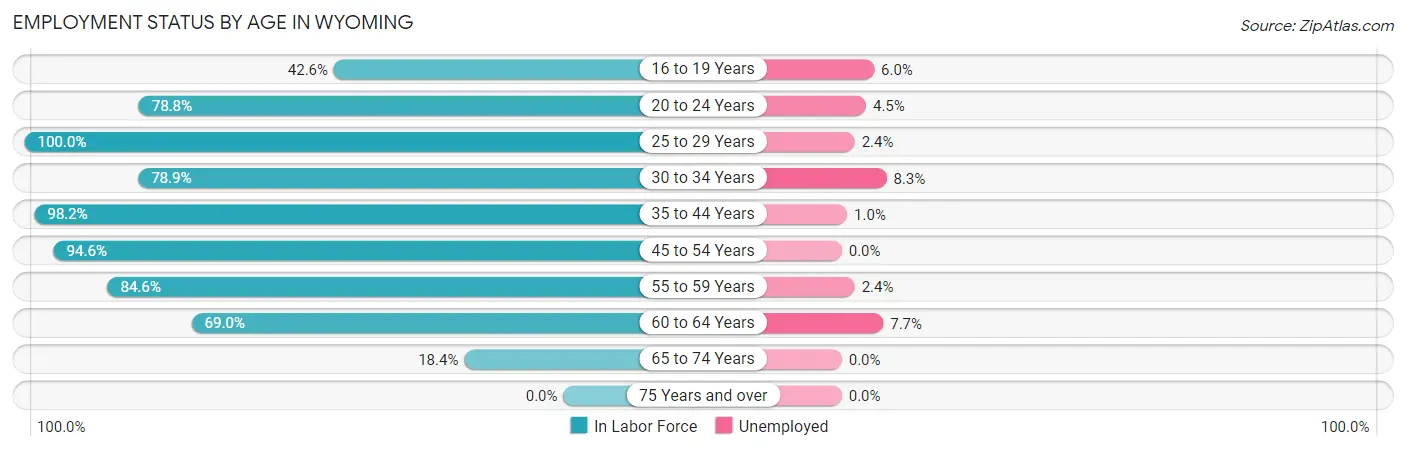
| Age Bracket | In Labor Force | Unemployed |
| 16 to 19 Years | 216 (42.6%) | 13 (6.0%) |
| 20 to 24 Years | 471 (78.8%) | 21 (4.5%) |
| 25 to 29 Years | 460 (100.0%) | 11 (2.4%) |
| 30 to 34 Years | 258 (78.9%) | 21 (8.3%) |
| 35 to 44 Years | 881 (98.2%) | 9 (1.0%) |
| 45 to 54 Years | 922 (94.6%) | 0 (0.0%) |
| 55 to 59 Years | 532 (84.6%) | 13 (2.4%) |
| 60 to 64 Years | 555 (69.0%) | 43 (7.7%) |
| 65 to 74 Years | 150 (18.4%) | 0 (0.0%) |
| 75 Years and over | 0 (0.0%) | 0 (0.0%) |
| Total | 4,446 (69.2%) | 129 (2.9%) |
Employment Status by Educational Attainment in Wyoming
According to labor force statistics for Wyoming, 88.2% of individuals (3,609) out of the total population between 25 and 64 years of age (4,092) are in the labor force, with 2.7% or 97 of them being unemployed. The group with the highest labor force participation rate are those with the educational attainment of college / associate degree, with 91.7% or 1,739 individuals in the labor force. Within the labor force, individuals with high school diploma education have the highest percentage of unemployment, with 5.5% or 33 of them being unemployed.
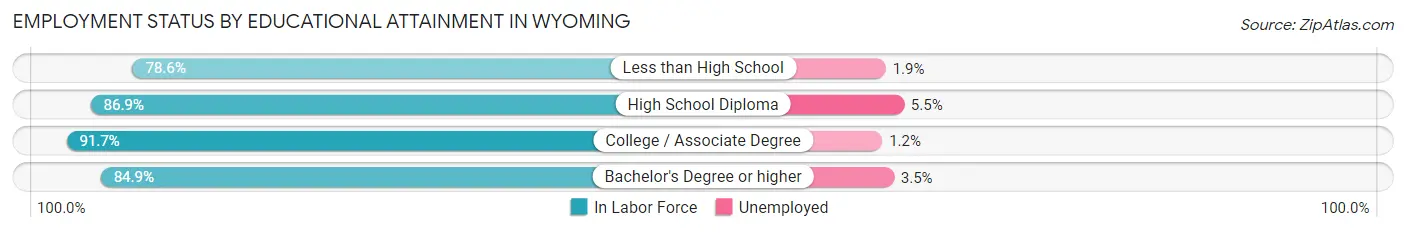
| Educational Attainment | In Labor Force | Unemployed |
| Less than High School | 103 (78.6%) | 2 (1.9%) |
| High School Diploma | 605 (86.9%) | 38 (5.5%) |
| College / Associate Degree | 1,739 (91.7%) | 23 (1.2%) |
| Bachelor's Degree or higher | 1,162 (84.9%) | 48 (3.5%) |
| Total | 3,609 (88.2%) | 110 (2.7%) |
Employment Occupations by Sex in Wyoming
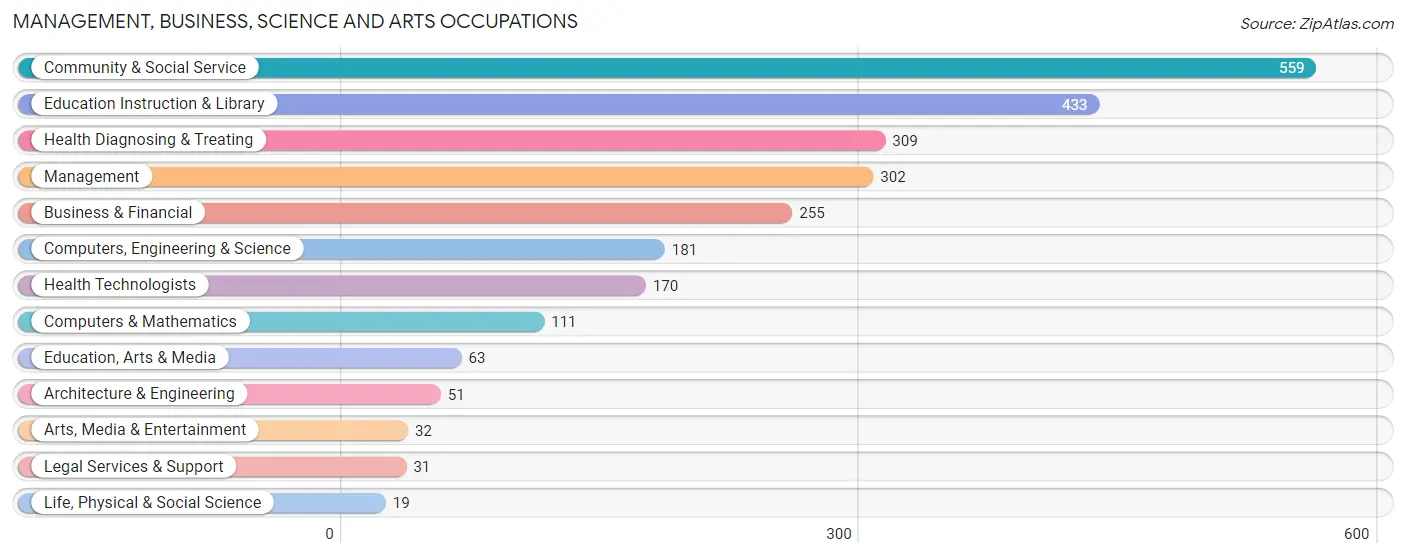
Management, Business, Science and Arts Occupations
The most common Management, Business, Science and Arts occupations in Wyoming are Community & Social Service (559 | 13.0%), Education Instruction & Library (433 | 10.1%), Health Diagnosing & Treating (309 | 7.2%), Management (302 | 7.0%), and Business & Financial (255 | 5.9%).
Management, Business, Science and Arts Occupations by Sex
Within the Management, Business, Science and Arts occupations in Wyoming, the most male-oriented occupations are Architecture & Engineering (100.0%), Life, Physical & Social Science (100.0%), and Computers, Engineering & Science (91.7%), while the most female-oriented occupations are Legal Services & Support (100.0%), Health Diagnosing & Treating (83.5%), and Community & Social Service (77.1%).
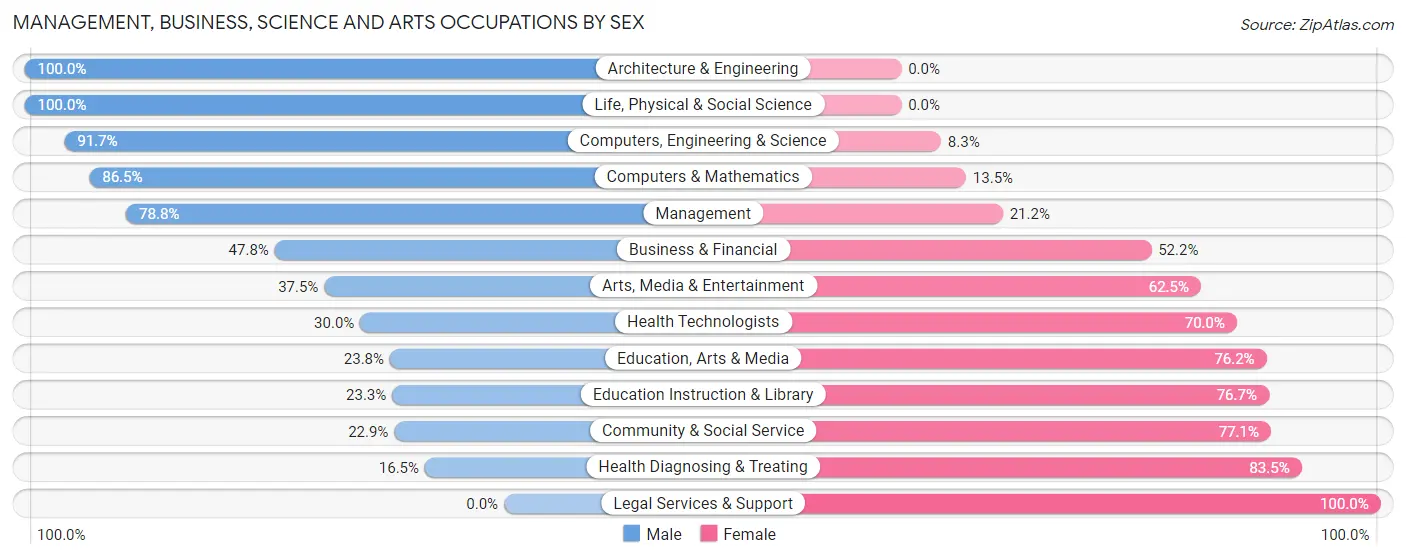
| Occupation | Male | Female |
| Management | 238 (78.8%) | 64 (21.2%) |
| Business & Financial | 122 (47.8%) | 133 (52.2%) |
| Computers, Engineering & Science | 166 (91.7%) | 15 (8.3%) |
| Computers & Mathematics | 96 (86.5%) | 15 (13.5%) |
| Architecture & Engineering | 51 (100.0%) | 0 (0.0%) |
| Life, Physical & Social Science | 19 (100.0%) | 0 (0.0%) |
| Community & Social Service | 128 (22.9%) | 431 (77.1%) |
| Education, Arts & Media | 15 (23.8%) | 48 (76.2%) |
| Legal Services & Support | 0 (0.0%) | 31 (100.0%) |
| Education Instruction & Library | 101 (23.3%) | 332 (76.7%) |
| Arts, Media & Entertainment | 12 (37.5%) | 20 (62.5%) |
| Health Diagnosing & Treating | 51 (16.5%) | 258 (83.5%) |
| Health Technologists | 51 (30.0%) | 119 (70.0%) |
| Total (Category) | 705 (43.9%) | 901 (56.1%) |
| Total (Overall) | 2,285 (53.0%) | 2,025 (47.0%) |
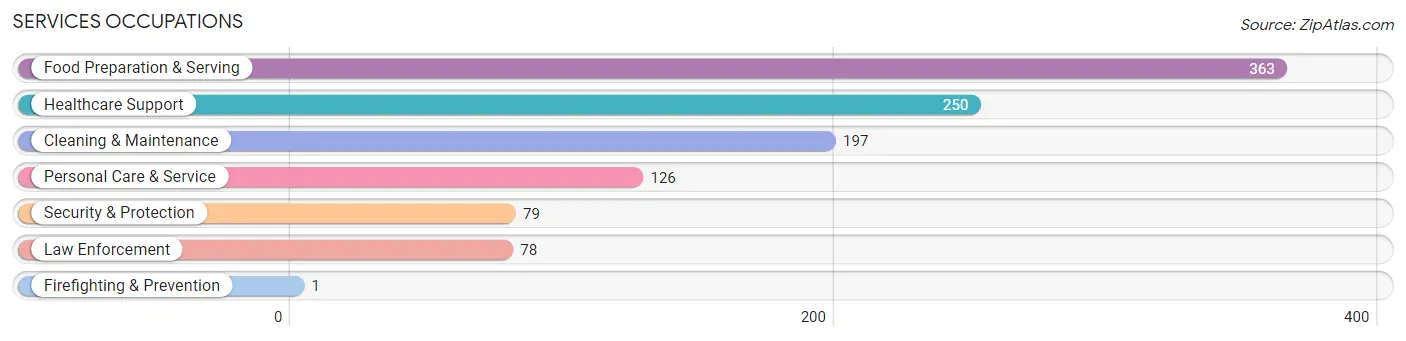
Services Occupations
The most common Services occupations in Wyoming are Food Preparation & Serving (363 | 8.4%), Healthcare Support (250 | 5.8%), Cleaning & Maintenance (197 | 4.6%), Personal Care & Service (126 | 2.9%), and Security & Protection (79 | 1.8%).
Services Occupations by Sex
Within the Services occupations in Wyoming, the most male-oriented occupations are Security & Protection (100.0%), Firefighting & Prevention (100.0%), and Law Enforcement (100.0%), while the most female-oriented occupations are Personal Care & Service (100.0%), Healthcare Support (80.0%), and Food Preparation & Serving (57.9%).
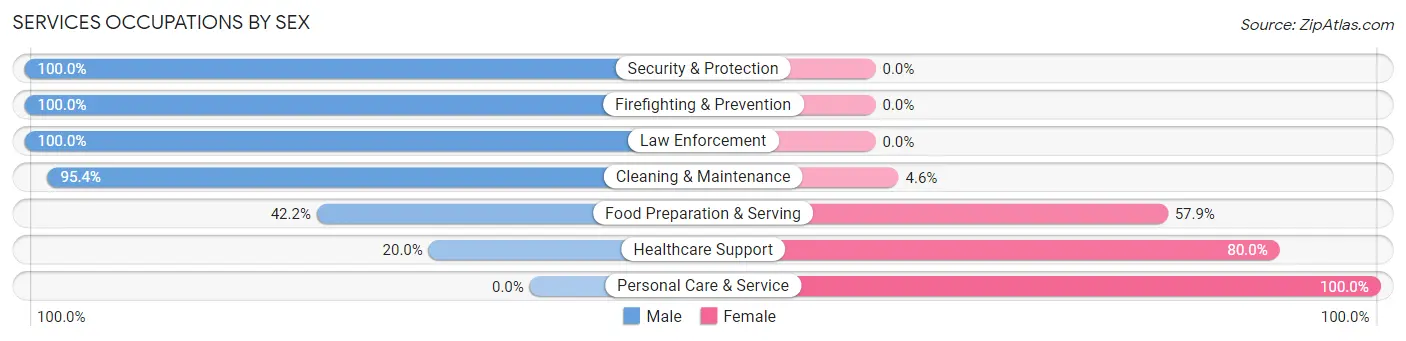
| Occupation | Male | Female |
| Healthcare Support | 50 (20.0%) | 200 (80.0%) |
| Security & Protection | 79 (100.0%) | 0 (0.0%) |
| Firefighting & Prevention | 1 (100.0%) | 0 (0.0%) |
| Law Enforcement | 78 (100.0%) | 0 (0.0%) |
| Food Preparation & Serving | 153 (42.1%) | 210 (57.9%) |
| Cleaning & Maintenance | 188 (95.4%) | 9 (4.6%) |
| Personal Care & Service | 0 (0.0%) | 126 (100.0%) |
| Total (Category) | 470 (46.3%) | 545 (53.7%) |
| Total (Overall) | 2,285 (53.0%) | 2,025 (47.0%) |
Sales and Office Occupations
The most common Sales and Office occupations in Wyoming are Office & Administration (352 | 8.2%), and Sales & Related (259 | 6.0%).

Sales and Office Occupations by Sex

| Occupation | Male | Female |
| Sales & Related | 138 (53.3%) | 121 (46.7%) |
| Office & Administration | 55 (15.6%) | 297 (84.4%) |
| Total (Category) | 193 (31.6%) | 418 (68.4%) |
| Total (Overall) | 2,285 (53.0%) | 2,025 (47.0%) |
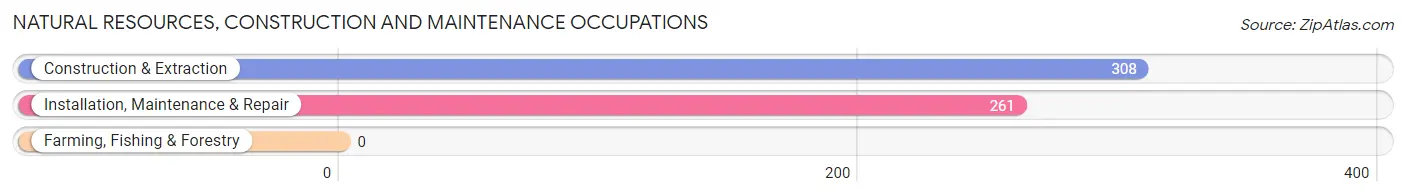
Natural Resources, Construction and Maintenance Occupations
The most common Natural Resources, Construction and Maintenance occupations in Wyoming are Construction & Extraction (308 | 7.1%), and Installation, Maintenance & Repair (261 | 6.1%).
Natural Resources, Construction and Maintenance Occupations by Sex
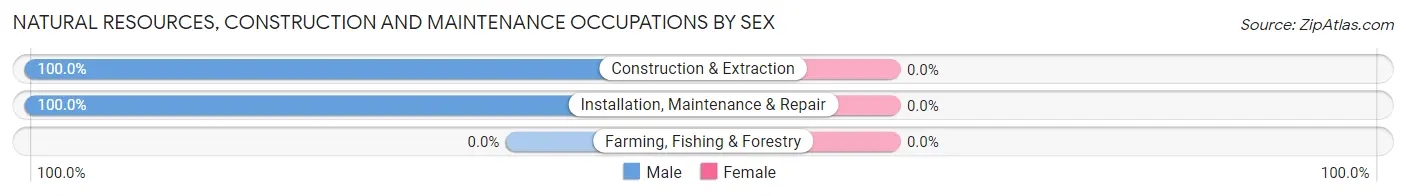
| Occupation | Male | Female |
| Farming, Fishing & Forestry | 0 (0.0%) | 0 (0.0%) |
| Construction & Extraction | 308 (100.0%) | 0 (0.0%) |
| Installation, Maintenance & Repair | 261 (100.0%) | 0 (0.0%) |
| Total (Category) | 569 (100.0%) | 0 (0.0%) |
| Total (Overall) | 2,285 (53.0%) | 2,025 (47.0%) |
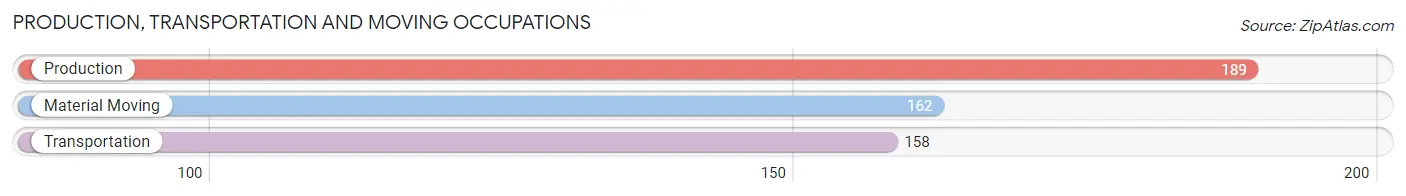
Production, Transportation and Moving Occupations
The most common Production, Transportation and Moving occupations in Wyoming are Production (189 | 4.4%), Material Moving (162 | 3.8%), and Transportation (158 | 3.7%).
Production, Transportation and Moving Occupations by Sex
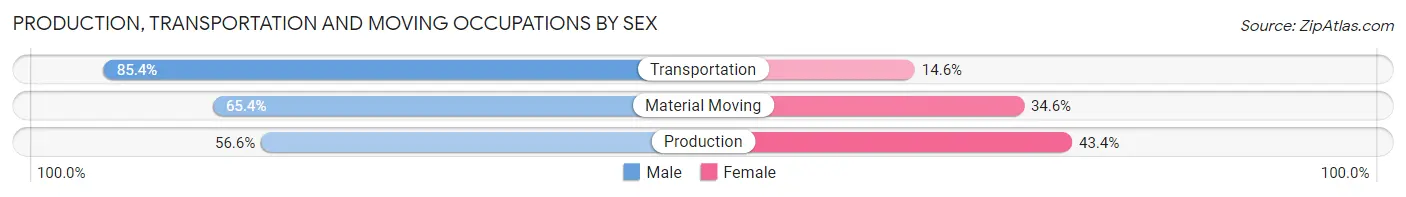
| Occupation | Male | Female |
| Production | 107 (56.6%) | 82 (43.4%) |
| Transportation | 135 (85.4%) | 23 (14.6%) |
| Material Moving | 106 (65.4%) | 56 (34.6%) |
| Total (Category) | 348 (68.4%) | 161 (31.6%) |
| Total (Overall) | 2,285 (53.0%) | 2,025 (47.0%) |
Employment Industries by Sex in Wyoming
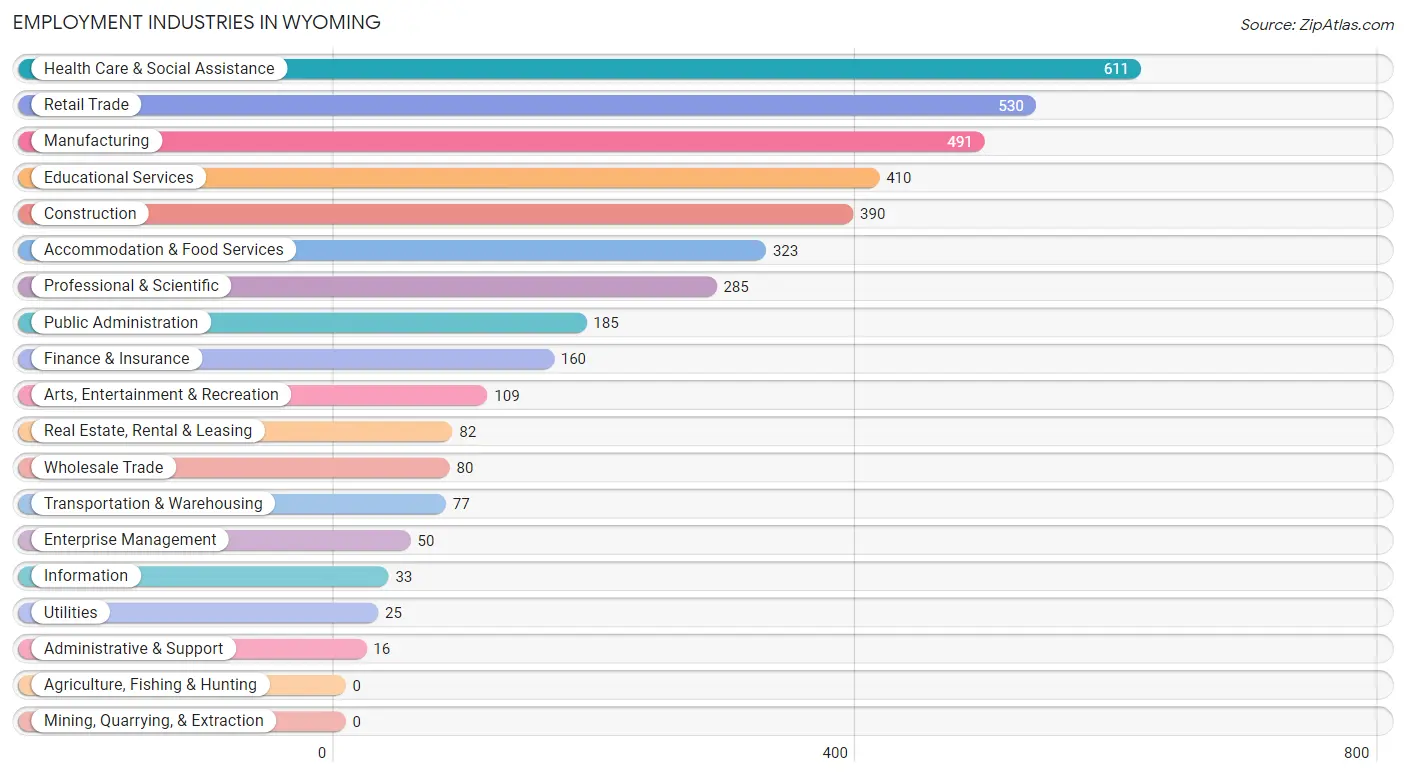
Employment Industries in Wyoming
The major employment industries in Wyoming include Health Care & Social Assistance (611 | 14.2%), Retail Trade (530 | 12.3%), Manufacturing (491 | 11.4%), Educational Services (410 | 9.5%), and Construction (390 | 9.0%).
Employment Industries by Sex in Wyoming
The Wyoming industries that see more men than women are Utilities (100.0%), Administrative & Support (100.0%), and Construction (85.4%), whereas the industries that tend to have a higher number of women are Educational Services (82.2%), Enterprise Management (72.0%), and Health Care & Social Assistance (68.6%).
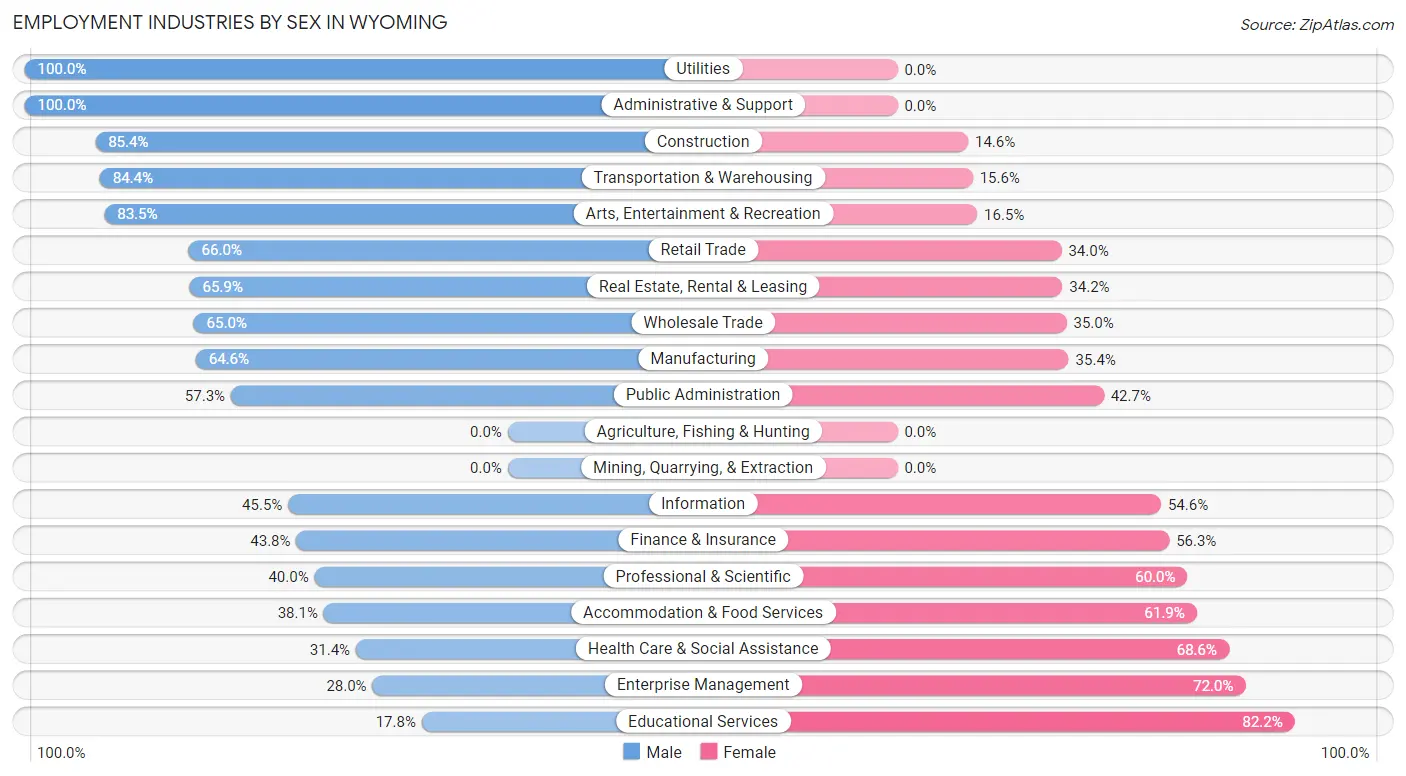
| Industry | Male | Female |
| Agriculture, Fishing & Hunting | 0 (0.0%) | 0 (0.0%) |
| Mining, Quarrying, & Extraction | 0 (0.0%) | 0 (0.0%) |
| Construction | 333 (85.4%) | 57 (14.6%) |
| Manufacturing | 317 (64.6%) | 174 (35.4%) |
| Wholesale Trade | 52 (65.0%) | 28 (35.0%) |
| Retail Trade | 350 (66.0%) | 180 (34.0%) |
| Transportation & Warehousing | 65 (84.4%) | 12 (15.6%) |
| Utilities | 25 (100.0%) | 0 (0.0%) |
| Information | 15 (45.5%) | 18 (54.5%) |
| Finance & Insurance | 70 (43.8%) | 90 (56.2%) |
| Real Estate, Rental & Leasing | 54 (65.8%) | 28 (34.2%) |
| Professional & Scientific | 114 (40.0%) | 171 (60.0%) |
| Enterprise Management | 14 (28.0%) | 36 (72.0%) |
| Administrative & Support | 16 (100.0%) | 0 (0.0%) |
| Educational Services | 73 (17.8%) | 337 (82.2%) |
| Health Care & Social Assistance | 192 (31.4%) | 419 (68.6%) |
| Arts, Entertainment & Recreation | 91 (83.5%) | 18 (16.5%) |
| Accommodation & Food Services | 123 (38.1%) | 200 (61.9%) |
| Public Administration | 106 (57.3%) | 79 (42.7%) |
| Total | 2,285 (53.0%) | 2,025 (47.0%) |
Education in Wyoming
School Enrollment in Wyoming
The most common levels of schooling among the 1,793 students in Wyoming are high school (562 | 31.3%), middle school (441 | 24.6%), and elementary school (328 | 18.3%).
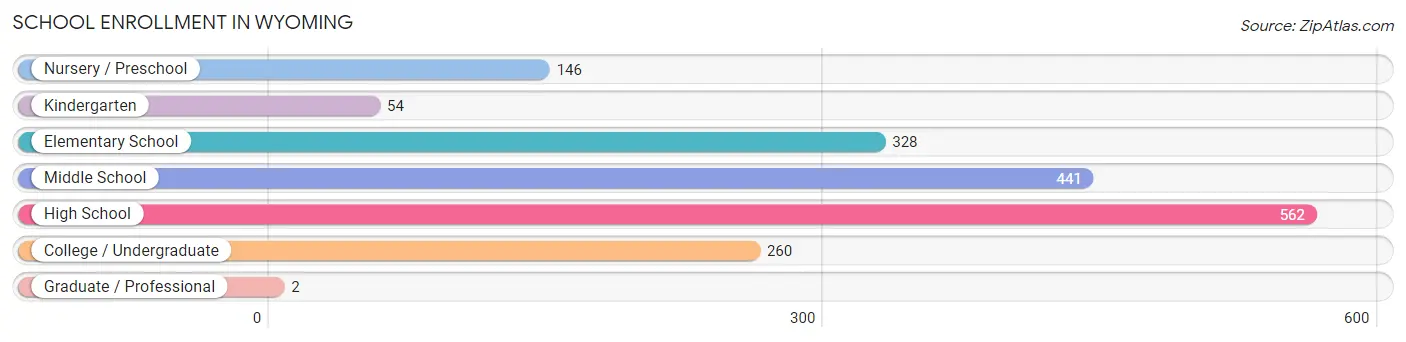
| School Level | # Students | % Students |
| Nursery / Preschool | 146 | 8.1% |
| Kindergarten | 54 | 3.0% |
| Elementary School | 328 | 18.3% |
| Middle School | 441 | 24.6% |
| High School | 562 | 31.3% |
| College / Undergraduate | 260 | 14.5% |
| Graduate / Professional | 2 | 0.1% |
| Total | 1,793 | 100.0% |
School Enrollment by Age by Funding Source in Wyoming
Out of a total of 1,793 students who are enrolled in schools in Wyoming, 362 (20.2%) attend a private institution, while the remaining 1,431 (79.8%) are enrolled in public schools. The age group of 3 to 4 year olds has the highest likelihood of being enrolled in private schools, with 66 (70.2% in the age bracket) enrolled. Conversely, the age group of 20 to 24 year olds has the lowest likelihood of being enrolled in a private school, with 203 (100.0% in the age bracket) attending a public institution.
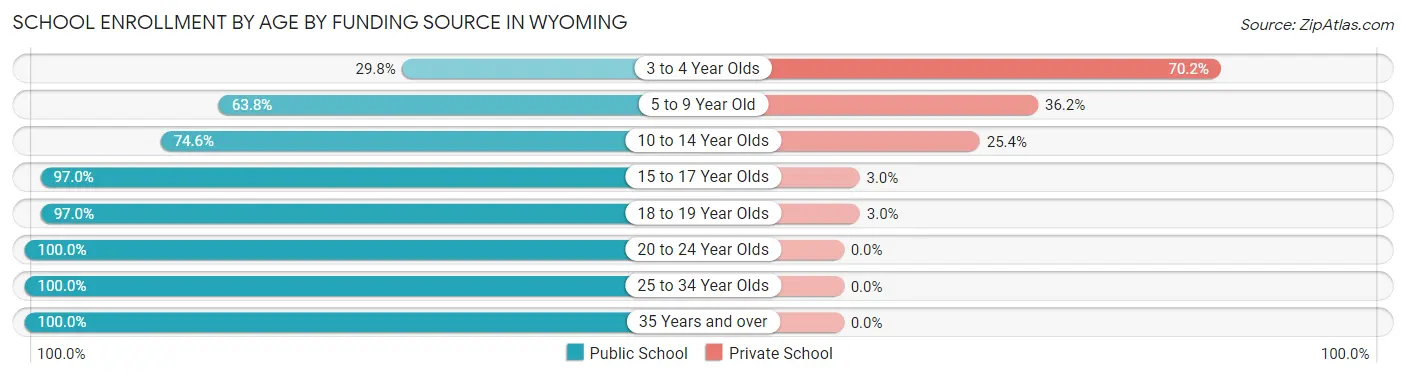
| Age Bracket | Public School | Private School |
| 3 to 4 Year Olds | 28 (29.8%) | 66 (70.2%) |
| 5 to 9 Year Old | 245 (63.8%) | 139 (36.2%) |
| 10 to 14 Year Olds | 418 (74.6%) | 142 (25.4%) |
| 15 to 17 Year Olds | 360 (97.0%) | 11 (3.0%) |
| 18 to 19 Year Olds | 161 (97.0%) | 5 (3.0%) |
| 20 to 24 Year Olds | 203 (100.0%) | 0 (0.0%) |
| 25 to 34 Year Olds | 2 (100.0%) | 0 (0.0%) |
| 35 Years and over | 13 (100.0%) | 0 (0.0%) |
| Total | 1,431 (79.8%) | 362 (20.2%) |
Educational Attainment by Field of Study in Wyoming
Education (350 | 19.4%), business (254 | 14.1%), science & technology (209 | 11.6%), arts & humanities (183 | 10.2%), and computers & mathematics (172 | 9.5%) are the most common fields of study among 1,802 individuals in Wyoming who have obtained a bachelor's degree or higher.
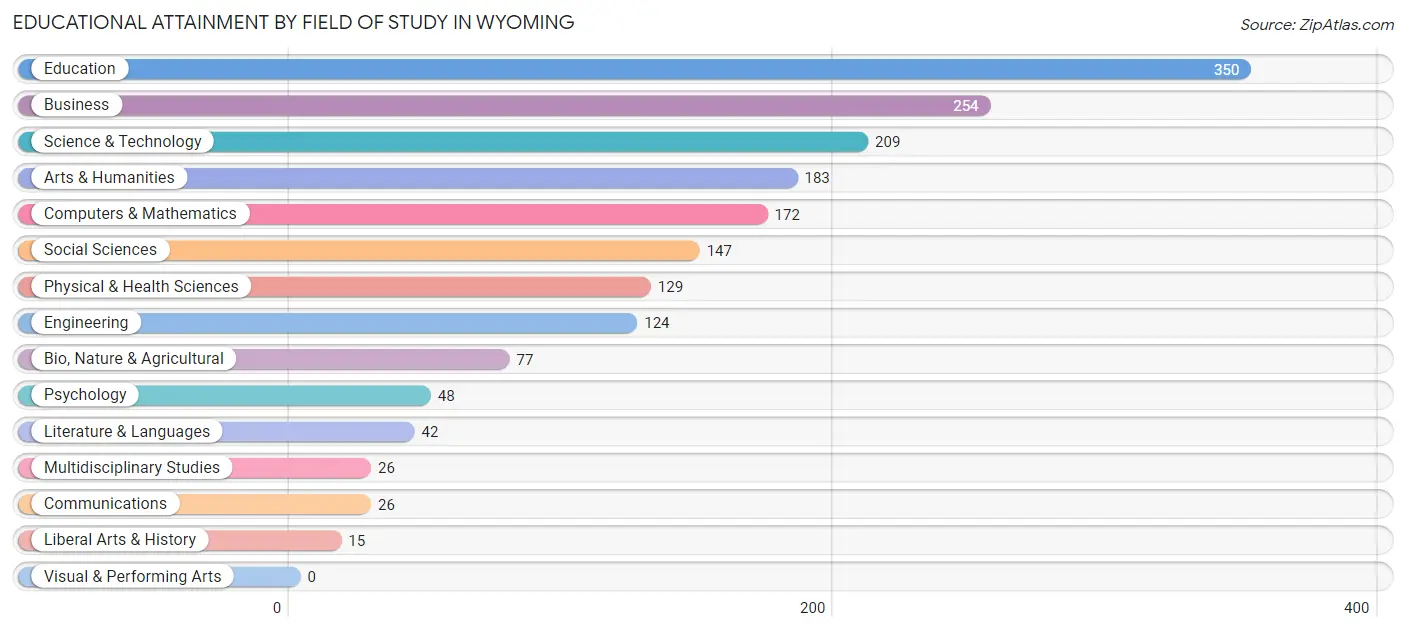
| Field of Study | # Graduates | % Graduates |
| Computers & Mathematics | 172 | 9.5% |
| Bio, Nature & Agricultural | 77 | 4.3% |
| Physical & Health Sciences | 129 | 7.2% |
| Psychology | 48 | 2.7% |
| Social Sciences | 147 | 8.2% |
| Engineering | 124 | 6.9% |
| Multidisciplinary Studies | 26 | 1.4% |
| Science & Technology | 209 | 11.6% |
| Business | 254 | 14.1% |
| Education | 350 | 19.4% |
| Literature & Languages | 42 | 2.3% |
| Liberal Arts & History | 15 | 0.8% |
| Visual & Performing Arts | 0 | 0.0% |
| Communications | 26 | 1.4% |
| Arts & Humanities | 183 | 10.2% |
| Total | 1,802 | 100.0% |
Transportation & Commute in Wyoming
Vehicle Availability by Sex in Wyoming
The most prevalent vehicle ownership categories in Wyoming are males with 2 vehicles (839, accounting for 37.5%) and females with 2 vehicles (673, making up 41.9%).
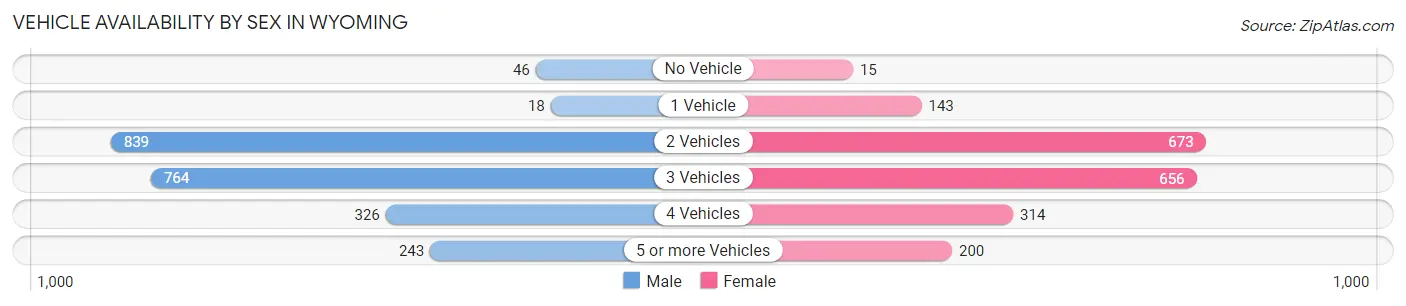
| Vehicles Available | Male | Female |
| No Vehicle | 46 (2.1%) | 15 (0.7%) |
| 1 Vehicle | 18 (0.8%) | 143 (7.1%) |
| 2 Vehicles | 839 (37.5%) | 673 (33.6%) |
| 3 Vehicles | 764 (34.2%) | 656 (32.8%) |
| 4 Vehicles | 326 (14.6%) | 314 (15.7%) |
| 5 or more Vehicles | 243 (10.9%) | 200 (10.0%) |
| Total | 2,236 (100.0%) | 2,001 (100.0%) |
Commute Time in Wyoming
The most frequently occuring commute durations in Wyoming are 45 to 59 minutes (625 commuters, 16.8%), 30 to 34 minutes (623 commuters, 16.7%), and 20 to 24 minutes (499 commuters, 13.4%).
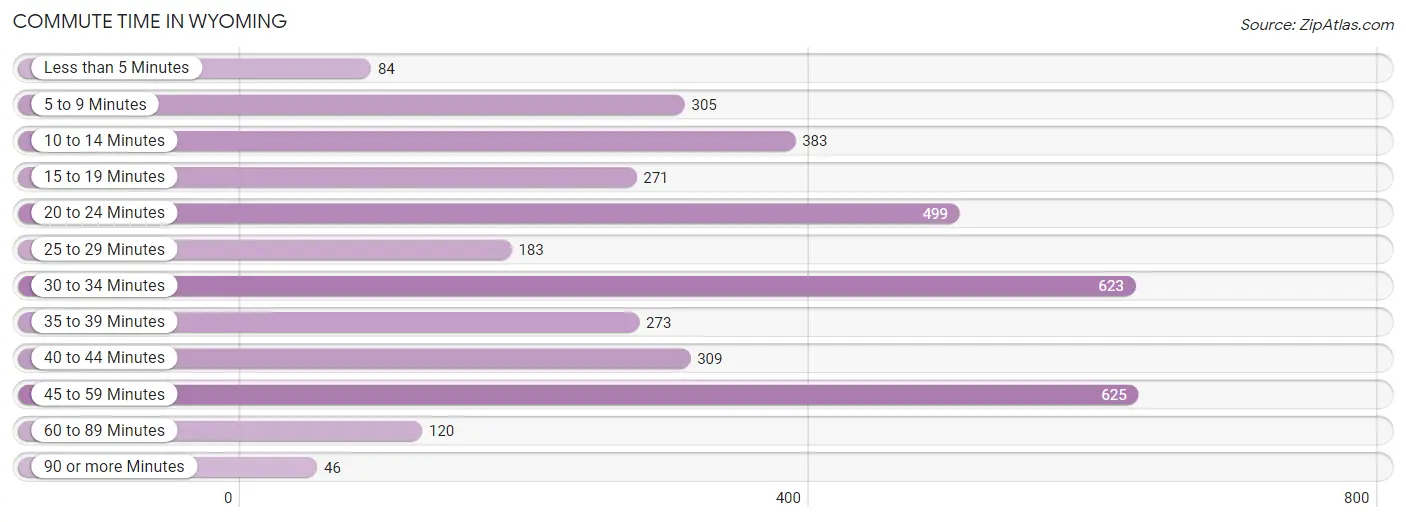
| Commute Time | # Commuters | % Commuters |
| Less than 5 Minutes | 84 | 2.3% |
| 5 to 9 Minutes | 305 | 8.2% |
| 10 to 14 Minutes | 383 | 10.3% |
| 15 to 19 Minutes | 271 | 7.3% |
| 20 to 24 Minutes | 499 | 13.4% |
| 25 to 29 Minutes | 183 | 4.9% |
| 30 to 34 Minutes | 623 | 16.7% |
| 35 to 39 Minutes | 273 | 7.3% |
| 40 to 44 Minutes | 309 | 8.3% |
| 45 to 59 Minutes | 625 | 16.8% |
| 60 to 89 Minutes | 120 | 3.2% |
| 90 or more Minutes | 46 | 1.2% |
Commute Time by Sex in Wyoming
The most common commute times in Wyoming are 30 to 34 minutes (389 commuters, 18.9%) for males and 20 to 24 minutes (299 commuters, 17.9%) for females.
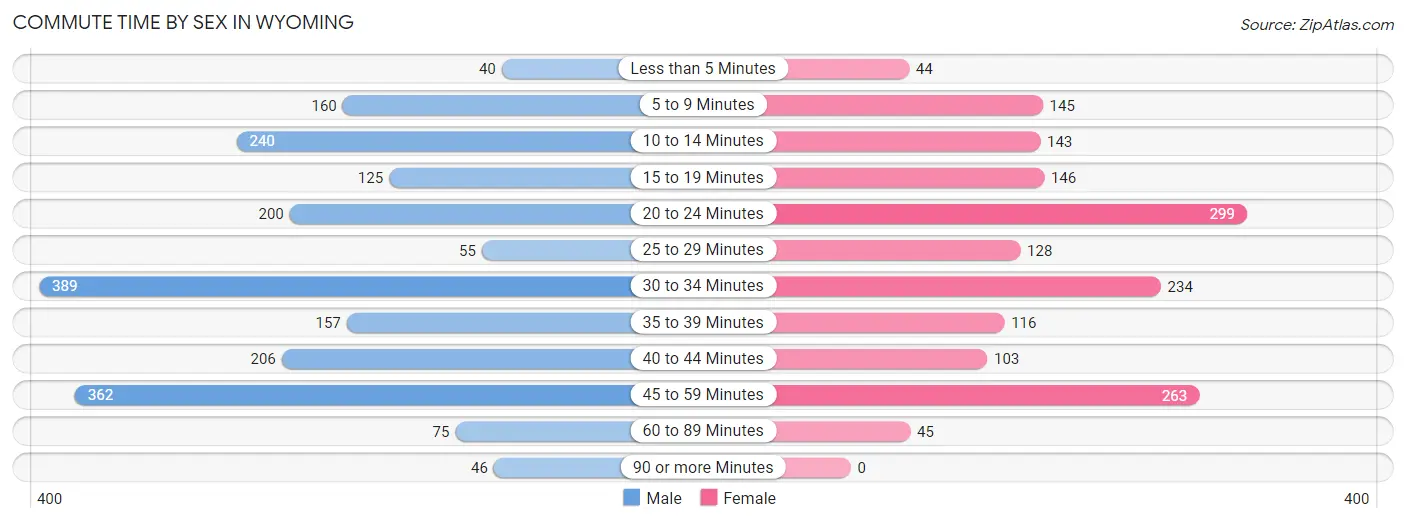
| Commute Time | Male | Female |
| Less than 5 Minutes | 40 (1.9%) | 44 (2.6%) |
| 5 to 9 Minutes | 160 (7.8%) | 145 (8.7%) |
| 10 to 14 Minutes | 240 (11.7%) | 143 (8.6%) |
| 15 to 19 Minutes | 125 (6.1%) | 146 (8.8%) |
| 20 to 24 Minutes | 200 (9.7%) | 299 (17.9%) |
| 25 to 29 Minutes | 55 (2.7%) | 128 (7.7%) |
| 30 to 34 Minutes | 389 (18.9%) | 234 (14.1%) |
| 35 to 39 Minutes | 157 (7.6%) | 116 (7.0%) |
| 40 to 44 Minutes | 206 (10.0%) | 103 (6.2%) |
| 45 to 59 Minutes | 362 (17.6%) | 263 (15.8%) |
| 60 to 89 Minutes | 75 (3.6%) | 45 (2.7%) |
| 90 or more Minutes | 46 (2.2%) | 0 (0.0%) |
Time of Departure to Work by Sex in Wyoming
The most frequent times of departure to work in Wyoming are 7:00 AM to 7:29 AM (357, 17.4%) for males and 6:00 AM to 6:29 AM (396, 23.8%) for females.
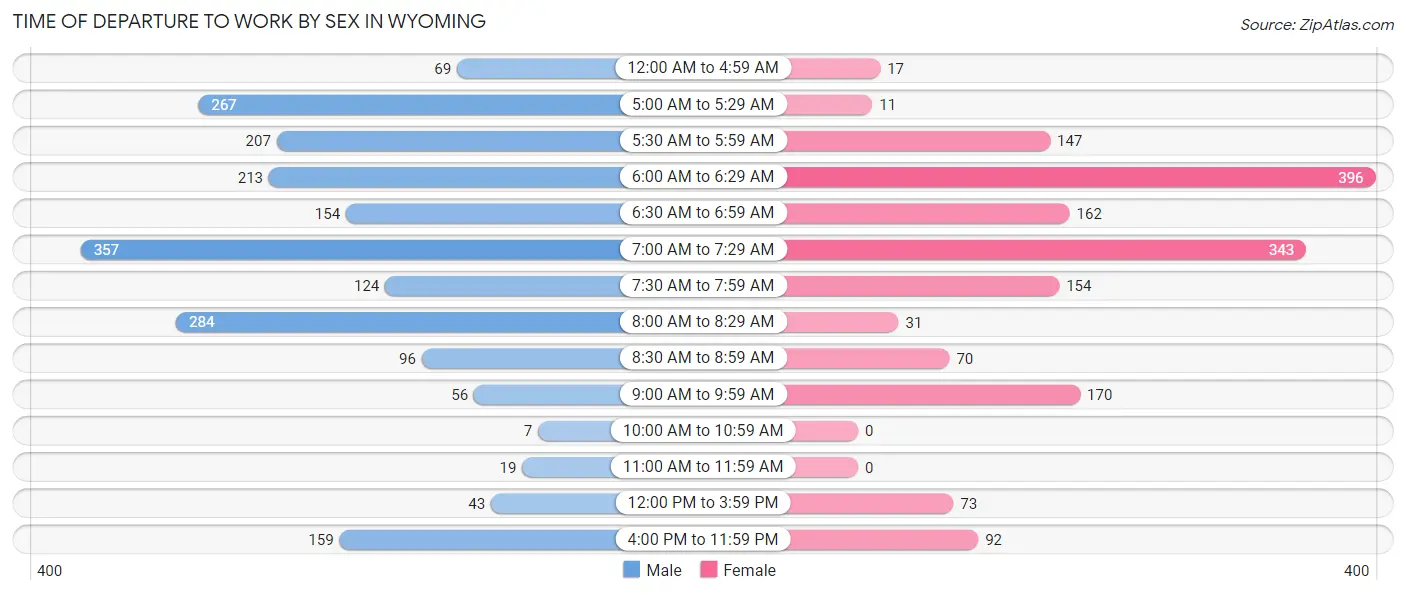
| Time of Departure | Male | Female |
| 12:00 AM to 4:59 AM | 69 (3.4%) | 17 (1.0%) |
| 5:00 AM to 5:29 AM | 267 (13.0%) | 11 (0.7%) |
| 5:30 AM to 5:59 AM | 207 (10.1%) | 147 (8.8%) |
| 6:00 AM to 6:29 AM | 213 (10.4%) | 396 (23.8%) |
| 6:30 AM to 6:59 AM | 154 (7.5%) | 162 (9.7%) |
| 7:00 AM to 7:29 AM | 357 (17.4%) | 343 (20.6%) |
| 7:30 AM to 7:59 AM | 124 (6.0%) | 154 (9.2%) |
| 8:00 AM to 8:29 AM | 284 (13.8%) | 31 (1.9%) |
| 8:30 AM to 8:59 AM | 96 (4.7%) | 70 (4.2%) |
| 9:00 AM to 9:59 AM | 56 (2.7%) | 170 (10.2%) |
| 10:00 AM to 10:59 AM | 7 (0.3%) | 0 (0.0%) |
| 11:00 AM to 11:59 AM | 19 (0.9%) | 0 (0.0%) |
| 12:00 PM to 3:59 PM | 43 (2.1%) | 73 (4.4%) |
| 4:00 PM to 11:59 PM | 159 (7.7%) | 92 (5.5%) |
| Total | 2,055 (100.0%) | 1,666 (100.0%) |
Housing Occupancy in Wyoming
Occupancy by Ownership in Wyoming
Of the total 2,879 dwellings in Wyoming, owner-occupied units account for 2,531 (87.9%), while renter-occupied units make up 348 (12.1%).
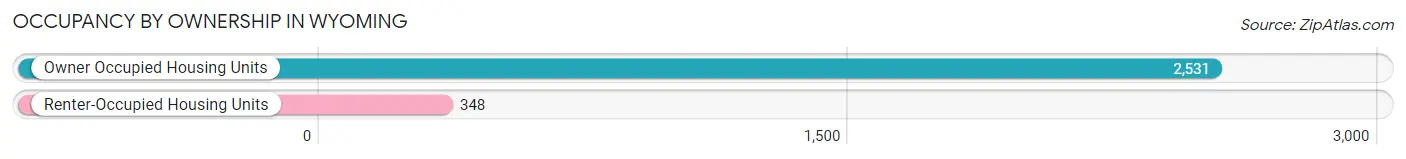
| Occupancy | # Housing Units | % Housing Units |
| Owner Occupied Housing Units | 2,531 | 87.9% |
| Renter-Occupied Housing Units | 348 | 12.1% |
| Total Occupied Housing Units | 2,879 | 100.0% |
Occupancy by Household Size in Wyoming
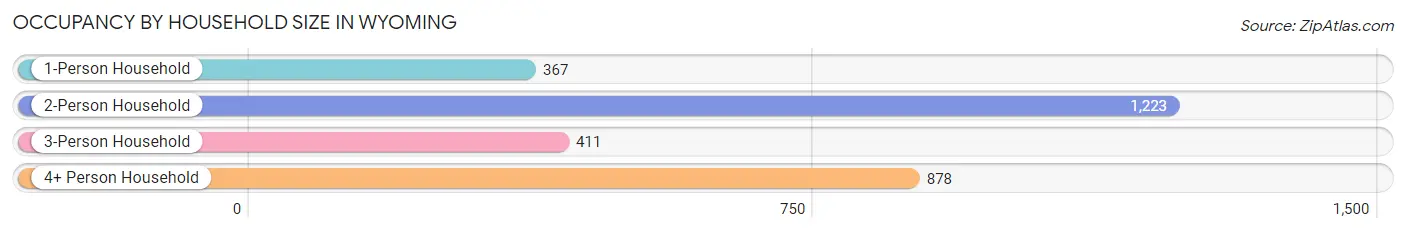
| Household Size | # Housing Units | % Housing Units |
| 1-Person Household | 367 | 12.8% |
| 2-Person Household | 1,223 | 42.5% |
| 3-Person Household | 411 | 14.3% |
| 4+ Person Household | 878 | 30.5% |
| Total Housing Units | 2,879 | 100.0% |
Occupancy by Ownership by Household Size in Wyoming
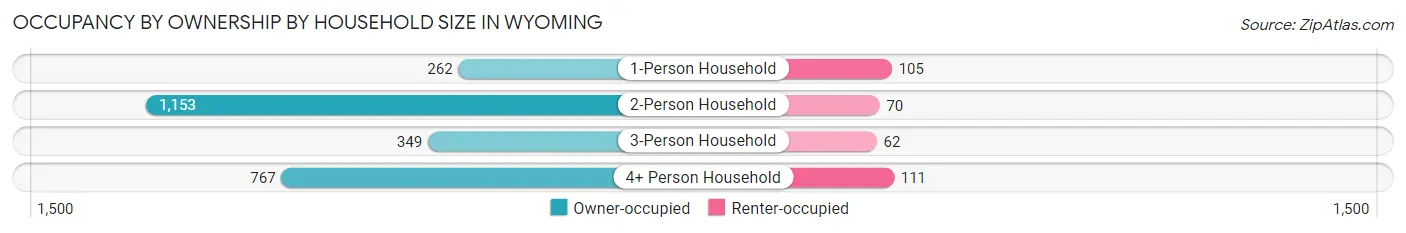
| Household Size | Owner-occupied | Renter-occupied |
| 1-Person Household | 262 (71.4%) | 105 (28.6%) |
| 2-Person Household | 1,153 (94.3%) | 70 (5.7%) |
| 3-Person Household | 349 (84.9%) | 62 (15.1%) |
| 4+ Person Household | 767 (87.4%) | 111 (12.6%) |
| Total Housing Units | 2,531 (87.9%) | 348 (12.1%) |
Occupancy by Educational Attainment in Wyoming
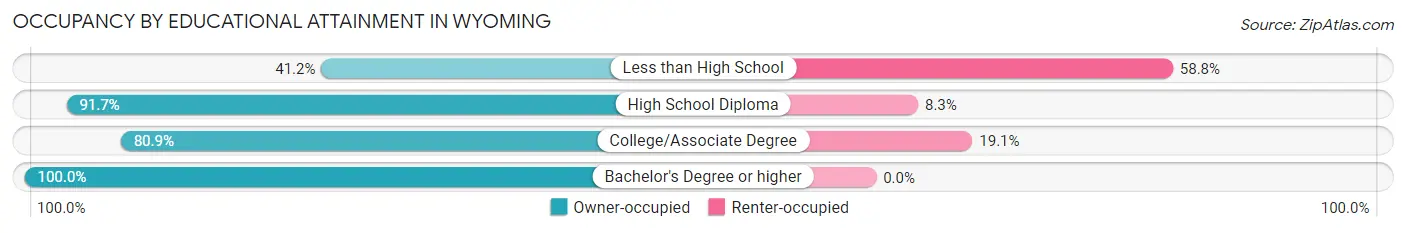
| Household Size | Owner-occupied | Renter-occupied |
| Less than High School | 21 (41.2%) | 30 (58.8%) |
| High School Diploma | 431 (91.7%) | 39 (8.3%) |
| College/Associate Degree | 1,184 (80.9%) | 279 (19.1%) |
| Bachelor's Degree or higher | 895 (100.0%) | 0 (0.0%) |
Occupancy by Age of Householder in Wyoming
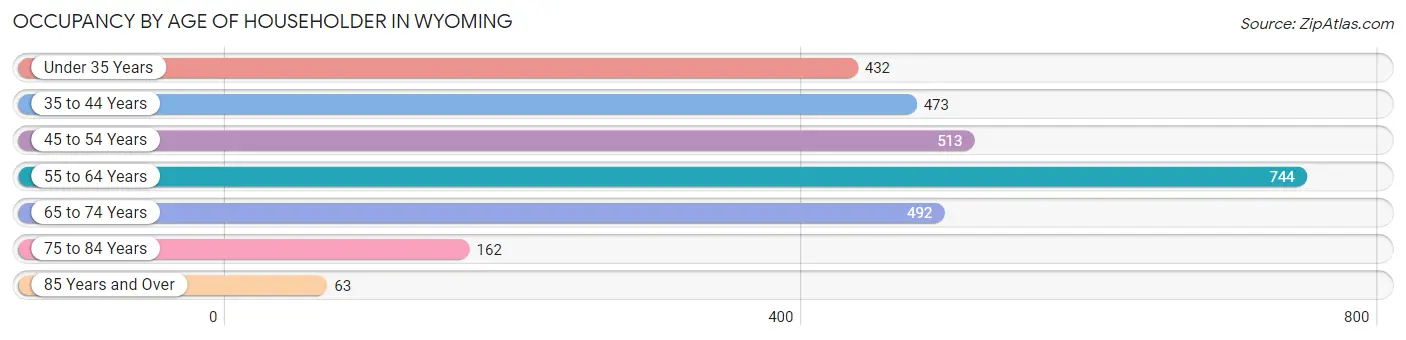
| Age Bracket | # Households | % Households |
| Under 35 Years | 432 | 15.0% |
| 35 to 44 Years | 473 | 16.4% |
| 45 to 54 Years | 513 | 17.8% |
| 55 to 64 Years | 744 | 25.8% |
| 65 to 74 Years | 492 | 17.1% |
| 75 to 84 Years | 162 | 5.6% |
| 85 Years and Over | 63 | 2.2% |
| Total | 2,879 | 100.0% |
Housing Finances in Wyoming
Median Income by Occupancy in Wyoming
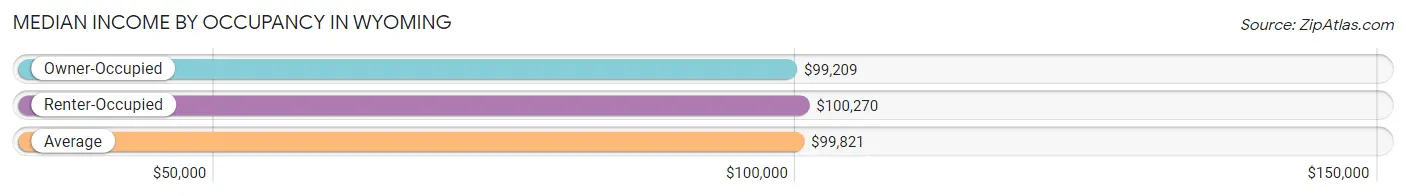
| Occupancy Type | # Households | Median Income |
| Owner-Occupied | 2,531 (87.9%) | $99,209 |
| Renter-Occupied | 348 (12.1%) | $100,270 |
| Average | 2,879 (100.0%) | $99,821 |
Occupancy by Householder Income Bracket in Wyoming
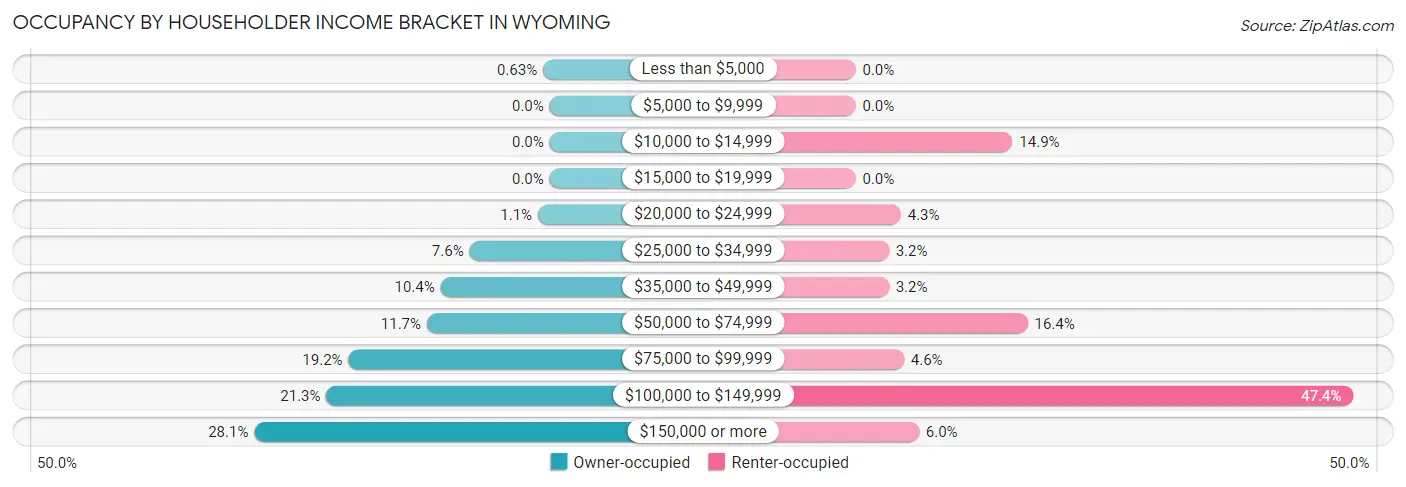
| Income Bracket | Owner-occupied | Renter-occupied |
| Less than $5,000 | 16 (0.6%) | 0 (0.0%) |
| $5,000 to $9,999 | 0 (0.0%) | 0 (0.0%) |
| $10,000 to $14,999 | 0 (0.0%) | 52 (14.9%) |
| $15,000 to $19,999 | 0 (0.0%) | 0 (0.0%) |
| $20,000 to $24,999 | 28 (1.1%) | 15 (4.3%) |
| $25,000 to $34,999 | 193 (7.6%) | 11 (3.2%) |
| $35,000 to $49,999 | 263 (10.4%) | 11 (3.2%) |
| $50,000 to $74,999 | 296 (11.7%) | 57 (16.4%) |
| $75,000 to $99,999 | 485 (19.2%) | 16 (4.6%) |
| $100,000 to $149,999 | 538 (21.3%) | 165 (47.4%) |
| $150,000 or more | 712 (28.1%) | 21 (6.0%) |
| Total | 2,531 (100.0%) | 348 (100.0%) |
Monthly Housing Cost Tiers in Wyoming
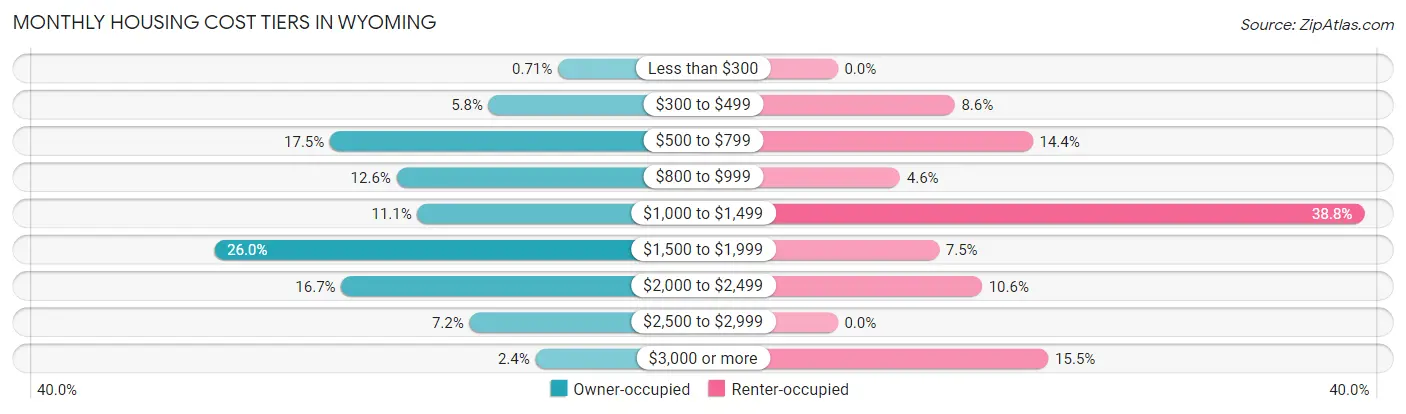
| Monthly Cost | Owner-occupied | Renter-occupied |
| Less than $300 | 18 (0.7%) | 0 (0.0%) |
| $300 to $499 | 147 (5.8%) | 30 (8.6%) |
| $500 to $799 | 443 (17.5%) | 50 (14.4%) |
| $800 to $999 | 319 (12.6%) | 16 (4.6%) |
| $1,000 to $1,499 | 280 (11.1%) | 135 (38.8%) |
| $1,500 to $1,999 | 659 (26.0%) | 26 (7.5%) |
| $2,000 to $2,499 | 422 (16.7%) | 37 (10.6%) |
| $2,500 to $2,999 | 183 (7.2%) | 0 (0.0%) |
| $3,000 or more | 60 (2.4%) | 54 (15.5%) |
| Total | 2,531 (100.0%) | 348 (100.0%) |
Physical Housing Characteristics in Wyoming
Housing Structures in Wyoming
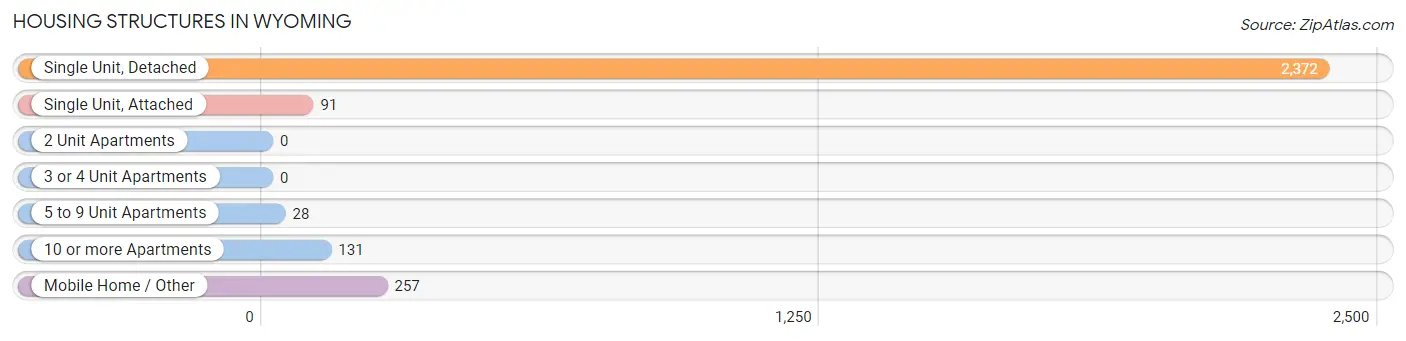
| Structure Type | # Housing Units | % Housing Units |
| Single Unit, Detached | 2,372 | 82.4% |
| Single Unit, Attached | 91 | 3.2% |
| 2 Unit Apartments | 0 | 0.0% |
| 3 or 4 Unit Apartments | 0 | 0.0% |
| 5 to 9 Unit Apartments | 28 | 1.0% |
| 10 or more Apartments | 131 | 4.5% |
| Mobile Home / Other | 257 | 8.9% |
| Total | 2,879 | 100.0% |
Housing Structures by Occupancy in Wyoming
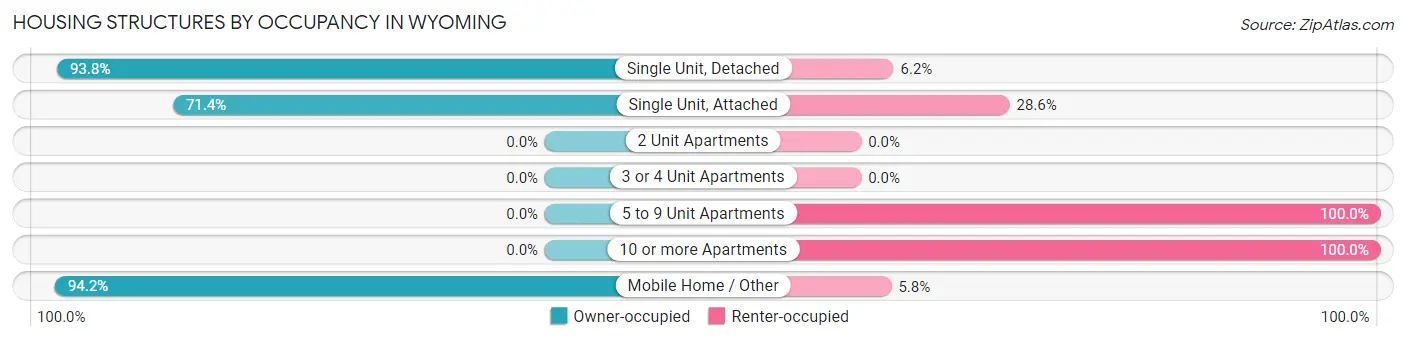
| Structure Type | Owner-occupied | Renter-occupied |
| Single Unit, Detached | 2,224 (93.8%) | 148 (6.2%) |
| Single Unit, Attached | 65 (71.4%) | 26 (28.6%) |
| 2 Unit Apartments | 0 (0.0%) | 0 (0.0%) |
| 3 or 4 Unit Apartments | 0 (0.0%) | 0 (0.0%) |
| 5 to 9 Unit Apartments | 0 (0.0%) | 28 (100.0%) |
| 10 or more Apartments | 0 (0.0%) | 131 (100.0%) |
| Mobile Home / Other | 242 (94.2%) | 15 (5.8%) |
| Total | 2,531 (87.9%) | 348 (12.1%) |
Housing Structures by Number of Rooms in Wyoming
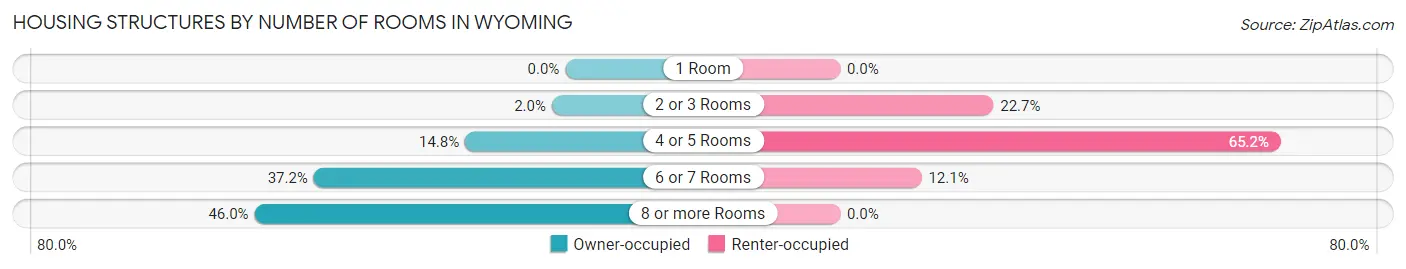
| Number of Rooms | Owner-occupied | Renter-occupied |
| 1 Room | 0 (0.0%) | 0 (0.0%) |
| 2 or 3 Rooms | 50 (2.0%) | 79 (22.7%) |
| 4 or 5 Rooms | 375 (14.8%) | 227 (65.2%) |
| 6 or 7 Rooms | 942 (37.2%) | 42 (12.1%) |
| 8 or more Rooms | 1,164 (46.0%) | 0 (0.0%) |
| Total | 2,531 (100.0%) | 348 (100.0%) |
Housing Structure by Heating Type in Wyoming
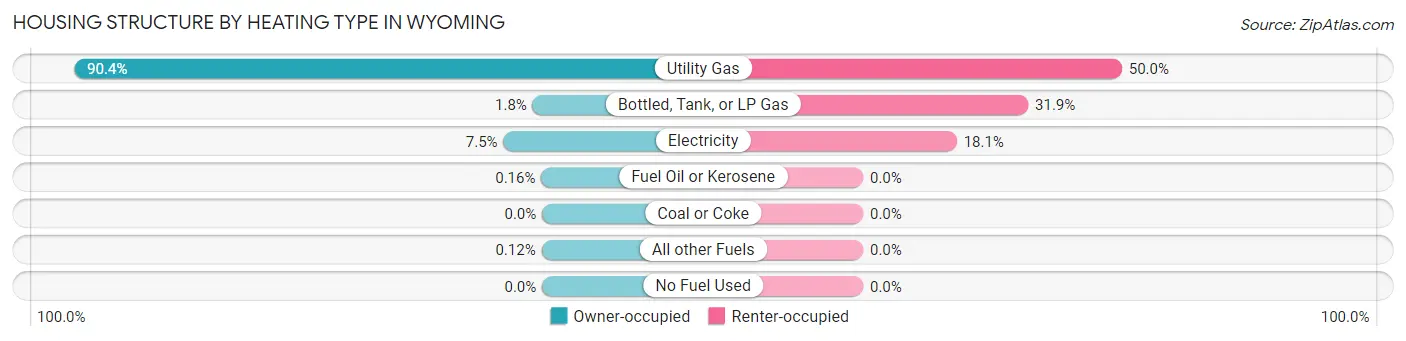
| Heating Type | Owner-occupied | Renter-occupied |
| Utility Gas | 2,289 (90.4%) | 174 (50.0%) |
| Bottled, Tank, or LP Gas | 46 (1.8%) | 111 (31.9%) |
| Electricity | 189 (7.5%) | 63 (18.1%) |
| Fuel Oil or Kerosene | 4 (0.2%) | 0 (0.0%) |
| Coal or Coke | 0 (0.0%) | 0 (0.0%) |
| All other Fuels | 3 (0.1%) | 0 (0.0%) |
| No Fuel Used | 0 (0.0%) | 0 (0.0%) |
| Total | 2,531 (100.0%) | 348 (100.0%) |
Household Vehicle Usage in Wyoming
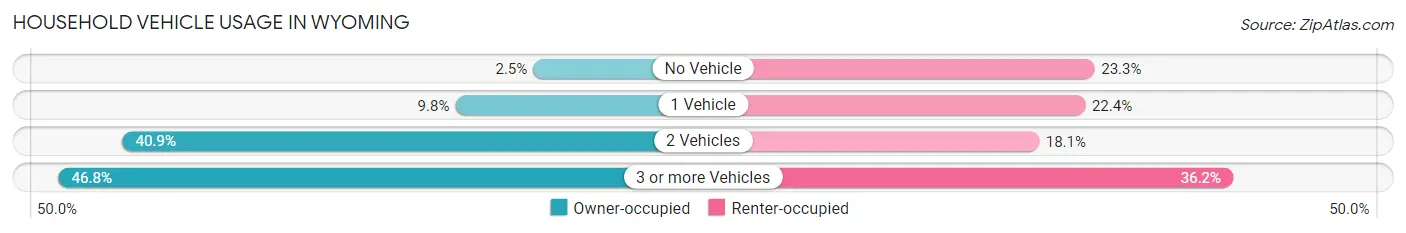
| Vehicles per Household | Owner-occupied | Renter-occupied |
| No Vehicle | 64 (2.5%) | 81 (23.3%) |
| 1 Vehicle | 248 (9.8%) | 78 (22.4%) |
| 2 Vehicles | 1,034 (40.8%) | 63 (18.1%) |
| 3 or more Vehicles | 1,185 (46.8%) | 126 (36.2%) |
| Total | 2,531 (100.0%) | 348 (100.0%) |
Real Estate & Mortgages in Wyoming
Real Estate and Mortgage Overview in Wyoming
| Characteristic | Without Mortgage | With Mortgage |
| Housing Units | 904 | 1,627 |
| Median Property Value | $296,500 | $305,300 |
| Median Household Income | $75,139 | $582 |
| Monthly Housing Costs | $690 | $60 |
| Real Estate Taxes | $3,495 | $21 |
Property Value by Mortgage Status in Wyoming
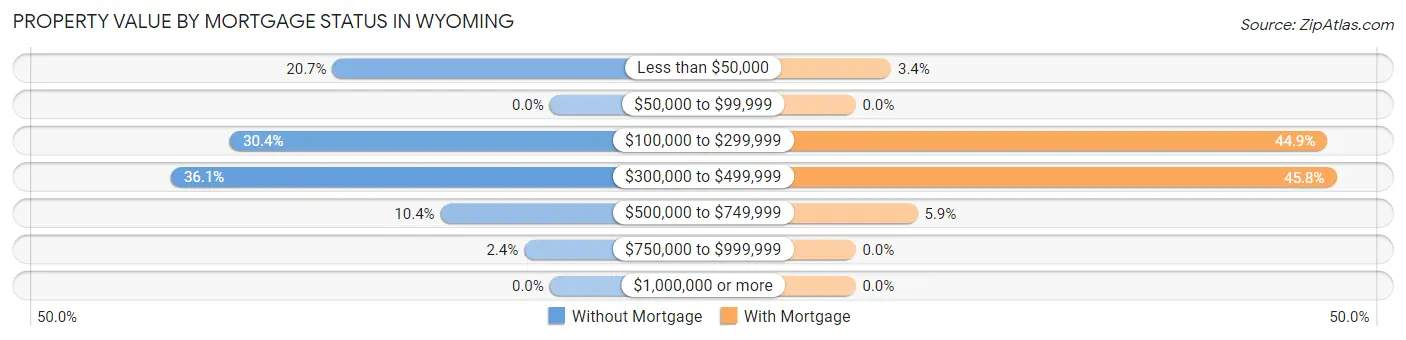
| Property Value | Without Mortgage | With Mortgage |
| Less than $50,000 | 187 (20.7%) | 55 (3.4%) |
| $50,000 to $99,999 | 0 (0.0%) | 0 (0.0%) |
| $100,000 to $299,999 | 275 (30.4%) | 731 (44.9%) |
| $300,000 to $499,999 | 326 (36.1%) | 745 (45.8%) |
| $500,000 to $749,999 | 94 (10.4%) | 96 (5.9%) |
| $750,000 to $999,999 | 22 (2.4%) | 0 (0.0%) |
| $1,000,000 or more | 0 (0.0%) | 0 (0.0%) |
| Total | 904 (100.0%) | 1,627 (100.0%) |
Household Income by Mortgage Status in Wyoming
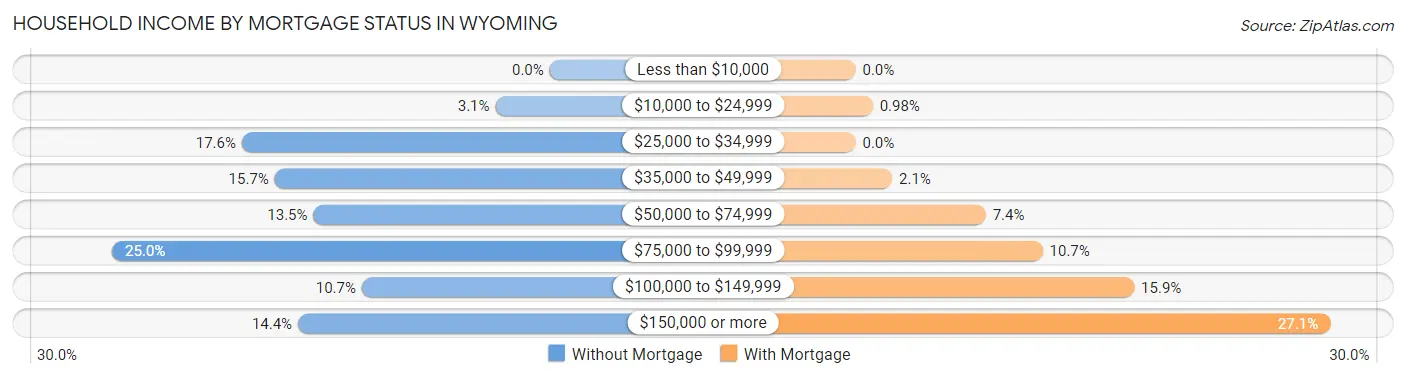
| Household Income | Without Mortgage | With Mortgage |
| Less than $10,000 | 0 (0.0%) | 0 (0.0%) |
| $10,000 to $24,999 | 28 (3.1%) | 16 (1.0%) |
| $25,000 to $34,999 | 159 (17.6%) | 0 (0.0%) |
| $35,000 to $49,999 | 142 (15.7%) | 34 (2.1%) |
| $50,000 to $74,999 | 122 (13.5%) | 121 (7.4%) |
| $75,000 to $99,999 | 226 (25.0%) | 174 (10.7%) |
| $100,000 to $149,999 | 97 (10.7%) | 259 (15.9%) |
| $150,000 or more | 130 (14.4%) | 441 (27.1%) |
| Total | 904 (100.0%) | 1,627 (100.0%) |
Property Value to Household Income Ratio in Wyoming
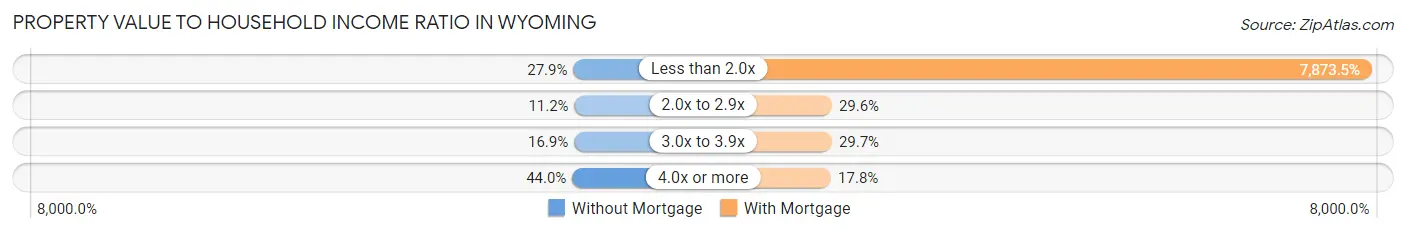
| Value-to-Income Ratio | Without Mortgage | With Mortgage |
| Less than 2.0x | 252 (27.9%) | 128,102 (7,873.5%) |
| 2.0x to 2.9x | 101 (11.2%) | 481 (29.6%) |
| 3.0x to 3.9x | 153 (16.9%) | 483 (29.7%) |
| 4.0x or more | 398 (44.0%) | 289 (17.8%) |
| Total | 904 (100.0%) | 1,627 (100.0%) |
Real Estate Taxes by Mortgage Status in Wyoming
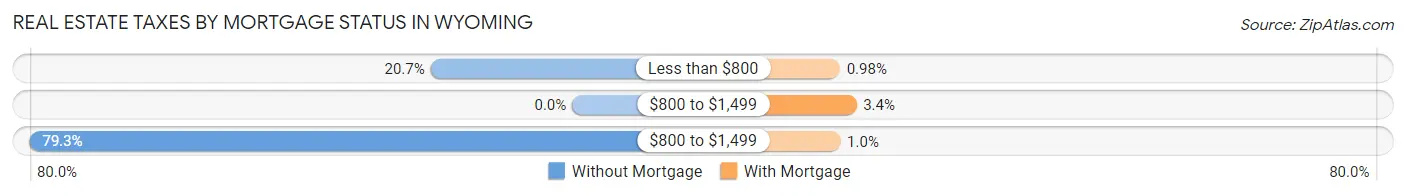
| Property Taxes | Without Mortgage | With Mortgage |
| Less than $800 | 187 (20.7%) | 16 (1.0%) |
| $800 to $1,499 | 0 (0.0%) | 55 (3.4%) |
| $800 to $1,499 | 717 (79.3%) | 17 (1.0%) |
| Total | 904 (100.0%) | 1,627 (100.0%) |
Health & Disability in Wyoming
Health Insurance Coverage by Age in Wyoming
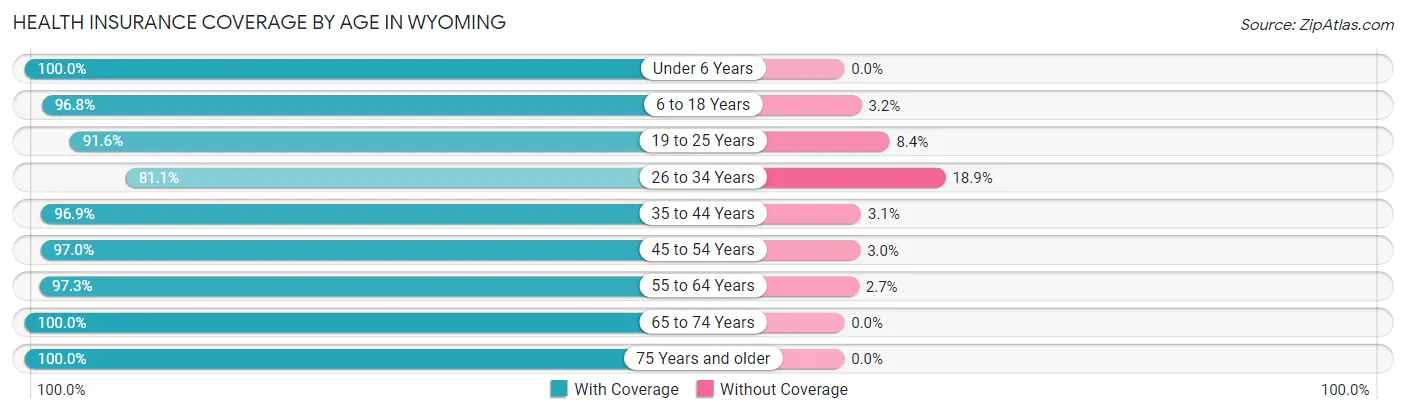
| Age Bracket | With Coverage | Without Coverage |
| Under 6 Years | 709 (100.0%) | 0 (0.0%) |
| 6 to 18 Years | 1,302 (96.8%) | 43 (3.2%) |
| 19 to 25 Years | 630 (91.6%) | 58 (8.4%) |
| 26 to 34 Years | 615 (81.1%) | 143 (18.9%) |
| 35 to 44 Years | 869 (96.9%) | 28 (3.1%) |
| 45 to 54 Years | 946 (97.0%) | 29 (3.0%) |
| 55 to 64 Years | 1,394 (97.3%) | 39 (2.7%) |
| 65 to 74 Years | 815 (100.0%) | 0 (0.0%) |
| 75 Years and older | 413 (100.0%) | 0 (0.0%) |
| Total | 7,693 (95.8%) | 340 (4.2%) |
Health Insurance Coverage by Citizenship Status in Wyoming
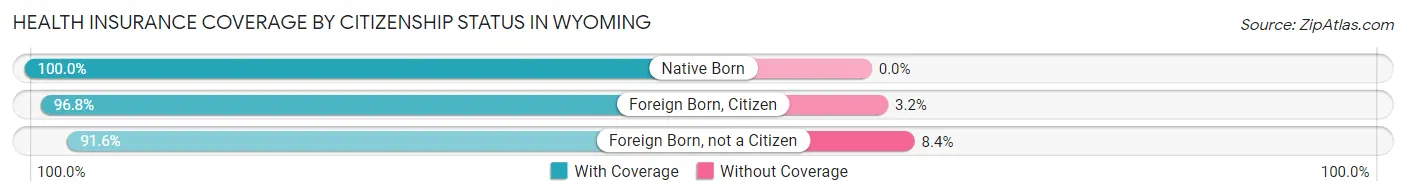
| Citizenship Status | With Coverage | Without Coverage |
| Native Born | 709 (100.0%) | 0 (0.0%) |
| Foreign Born, Citizen | 1,302 (96.8%) | 43 (3.2%) |
| Foreign Born, not a Citizen | 630 (91.6%) | 58 (8.4%) |
Health Insurance Coverage by Household Income in Wyoming
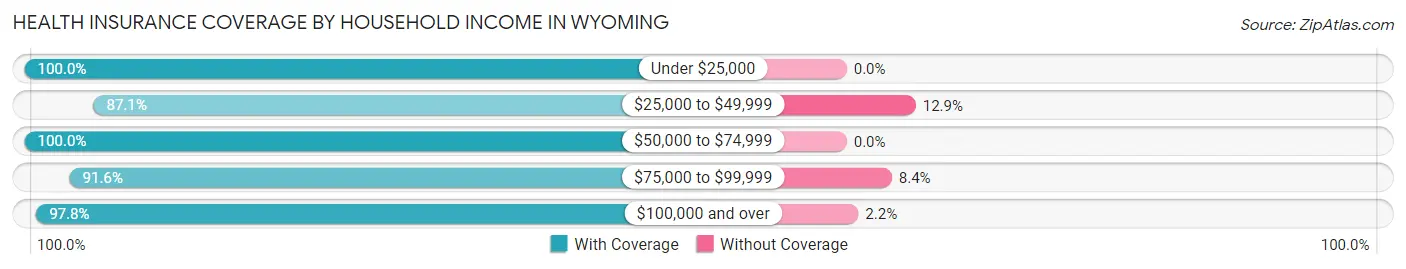
| Household Income | With Coverage | Without Coverage |
| Under $25,000 | 141 (100.0%) | 0 (0.0%) |
| $25,000 to $49,999 | 936 (87.1%) | 139 (12.9%) |
| $50,000 to $74,999 | 940 (100.0%) | 0 (0.0%) |
| $75,000 to $99,999 | 1,074 (91.6%) | 99 (8.4%) |
| $100,000 and over | 4,581 (97.8%) | 102 (2.2%) |
Public vs Private Health Insurance Coverage by Age in Wyoming
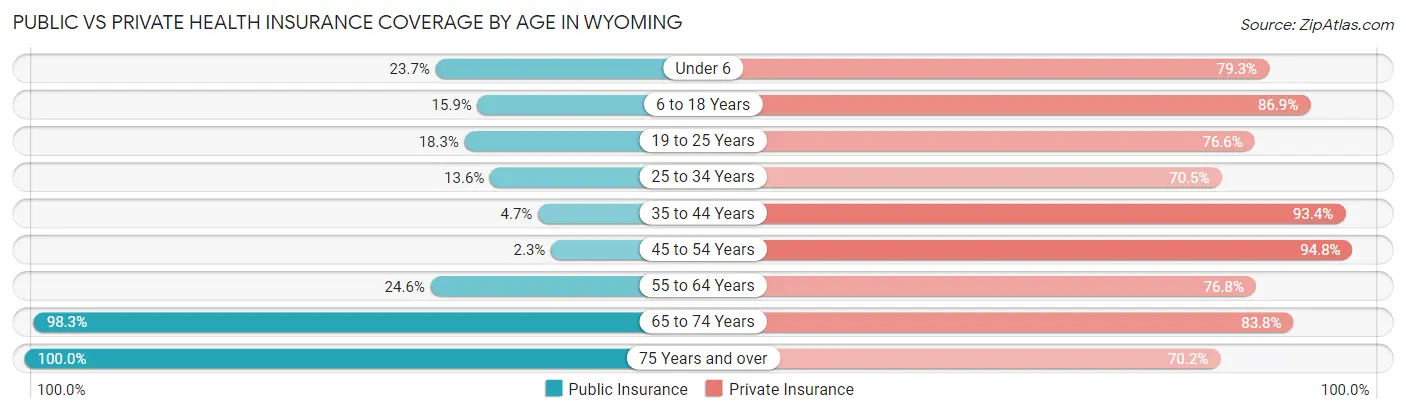
| Age Bracket | Public Insurance | Private Insurance |
| Under 6 | 168 (23.7%) | 562 (79.3%) |
| 6 to 18 Years | 214 (15.9%) | 1,169 (86.9%) |
| 19 to 25 Years | 126 (18.3%) | 527 (76.6%) |
| 25 to 34 Years | 103 (13.6%) | 534 (70.5%) |
| 35 to 44 Years | 42 (4.7%) | 838 (93.4%) |
| 45 to 54 Years | 22 (2.3%) | 924 (94.8%) |
| 55 to 64 Years | 353 (24.6%) | 1,101 (76.8%) |
| 65 to 74 Years | 801 (98.3%) | 683 (83.8%) |
| 75 Years and over | 413 (100.0%) | 290 (70.2%) |
| Total | 2,242 (27.9%) | 6,628 (82.5%) |
Disability Status by Sex by Age in Wyoming
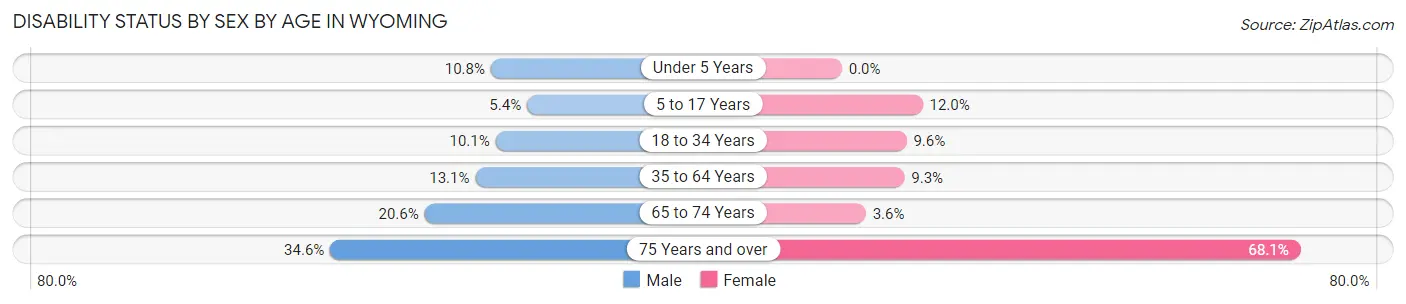
| Age Bracket | Male | Female |
| Under 5 Years | 36 (10.8%) | 0 (0.0%) |
| 5 to 17 Years | 30 (5.4%) | 92 (12.0%) |
| 18 to 34 Years | 96 (10.1%) | 58 (9.6%) |
| 35 to 64 Years | 221 (13.1%) | 150 (9.3%) |
| 65 to 74 Years | 81 (20.6%) | 15 (3.5%) |
| 75 Years and over | 80 (34.6%) | 124 (68.1%) |
Disability Class by Sex by Age in Wyoming
Disability Class: Hearing Difficulty
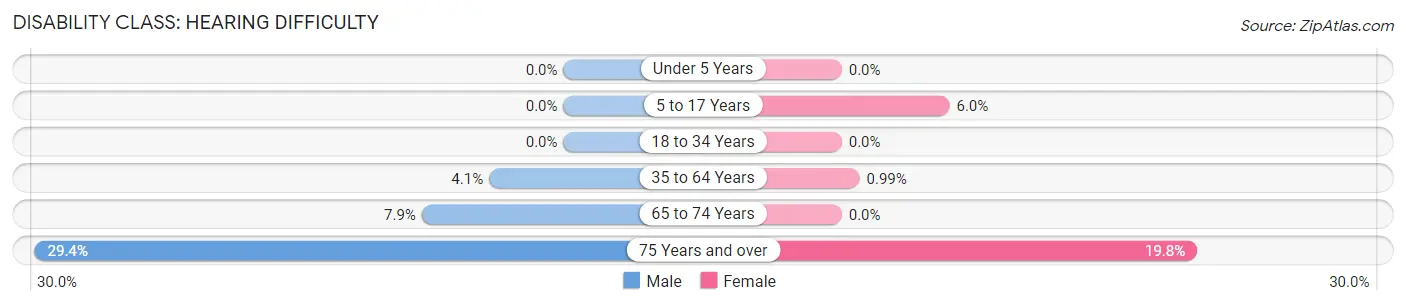
| Age Bracket | Male | Female |
| Under 5 Years | 0 (0.0%) | 0 (0.0%) |
| 5 to 17 Years | 0 (0.0%) | 46 (6.0%) |
| 18 to 34 Years | 0 (0.0%) | 0 (0.0%) |
| 35 to 64 Years | 70 (4.1%) | 16 (1.0%) |
| 65 to 74 Years | 31 (7.9%) | 0 (0.0%) |
| 75 Years and over | 68 (29.4%) | 36 (19.8%) |
Disability Class: Vision Difficulty
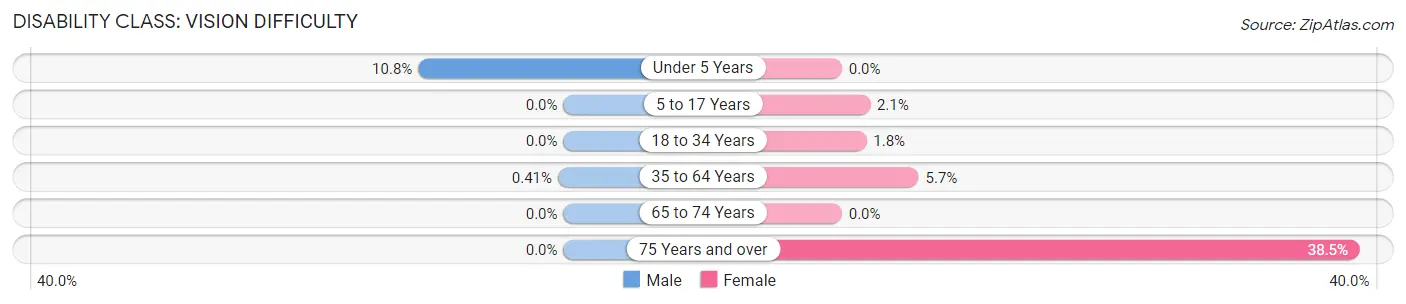
| Age Bracket | Male | Female |
| Under 5 Years | 36 (10.8%) | 0 (0.0%) |
| 5 to 17 Years | 0 (0.0%) | 16 (2.1%) |
| 18 to 34 Years | 0 (0.0%) | 11 (1.8%) |
| 35 to 64 Years | 7 (0.4%) | 92 (5.7%) |
| 65 to 74 Years | 0 (0.0%) | 0 (0.0%) |
| 75 Years and over | 0 (0.0%) | 70 (38.5%) |
Disability Class: Cognitive Difficulty
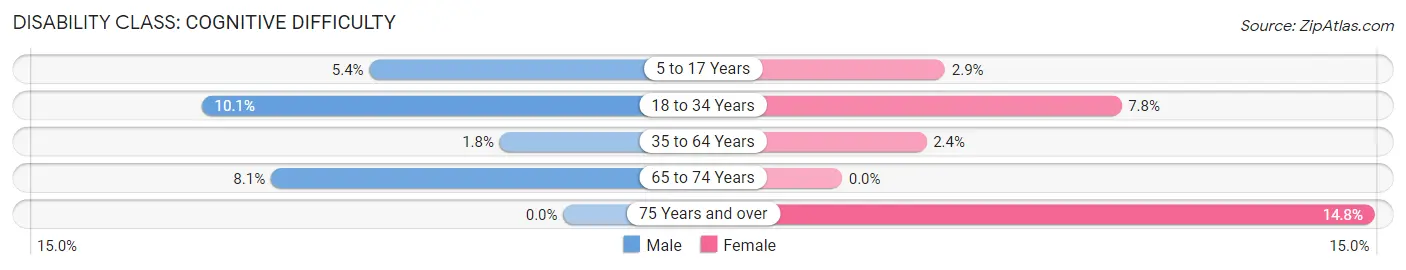
| Age Bracket | Male | Female |
| 5 to 17 Years | 30 (5.4%) | 22 (2.9%) |
| 18 to 34 Years | 96 (10.1%) | 47 (7.8%) |
| 35 to 64 Years | 30 (1.8%) | 38 (2.4%) |
| 65 to 74 Years | 32 (8.1%) | 0 (0.0%) |
| 75 Years and over | 0 (0.0%) | 27 (14.8%) |
Disability Class: Ambulatory Difficulty
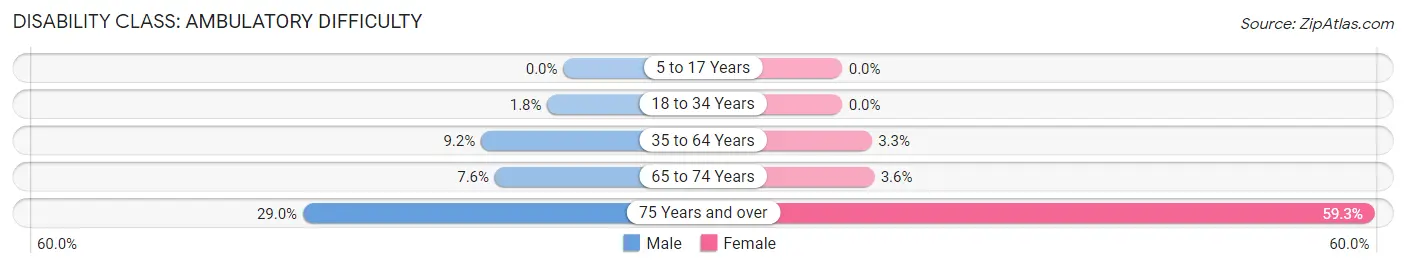
| Age Bracket | Male | Female |
| 5 to 17 Years | 0 (0.0%) | 0 (0.0%) |
| 18 to 34 Years | 17 (1.8%) | 0 (0.0%) |
| 35 to 64 Years | 155 (9.2%) | 53 (3.3%) |
| 65 to 74 Years | 30 (7.6%) | 15 (3.5%) |
| 75 Years and over | 67 (29.0%) | 108 (59.3%) |
Disability Class: Self-Care Difficulty
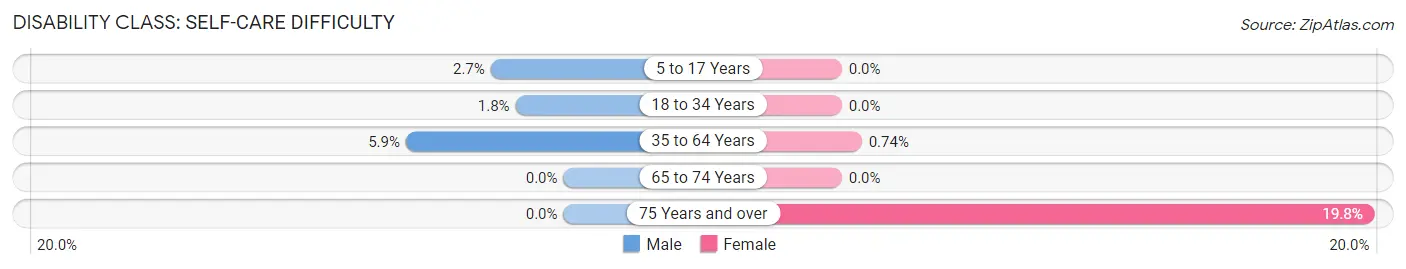
| Age Bracket | Male | Female |
| 5 to 17 Years | 15 (2.7%) | 0 (0.0%) |
| 18 to 34 Years | 17 (1.8%) | 0 (0.0%) |
| 35 to 64 Years | 99 (5.9%) | 12 (0.7%) |
| 65 to 74 Years | 0 (0.0%) | 0 (0.0%) |
| 75 Years and over | 0 (0.0%) | 36 (19.8%) |
Technology Access in Wyoming
Computing Device Access in Wyoming
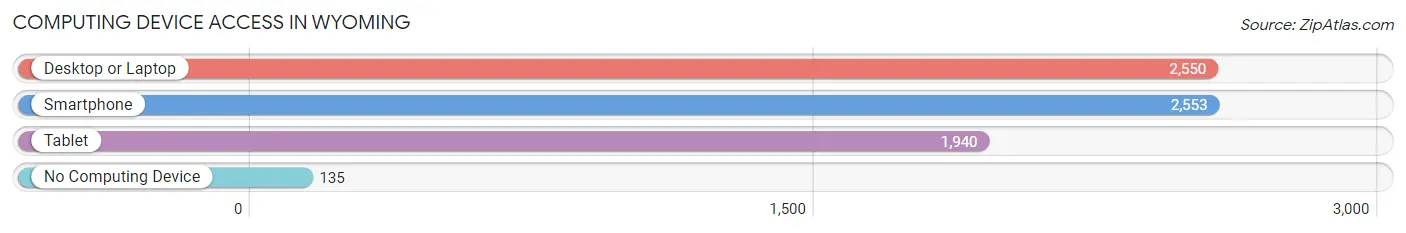
| Device Type | # Households | % Households |
| Desktop or Laptop | 2,550 | 88.6% |
| Smartphone | 2,553 | 88.7% |
| Tablet | 1,940 | 67.4% |
| No Computing Device | 135 | 4.7% |
| Total | 2,879 | 100.0% |
Internet Access in Wyoming
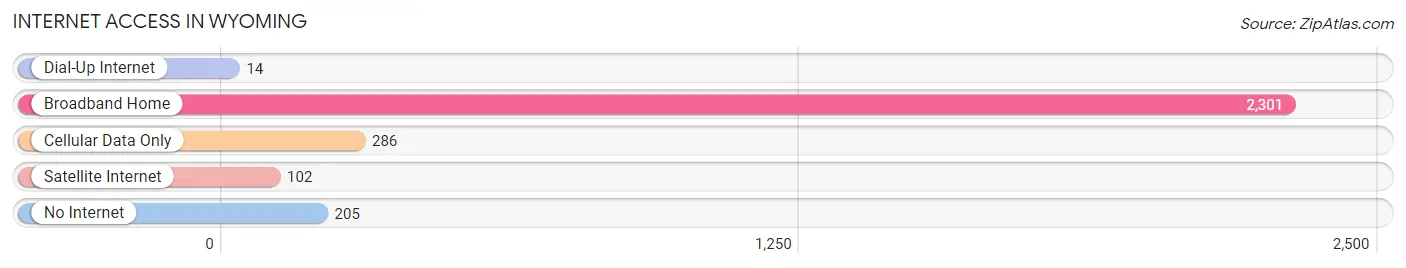
| Internet Type | # Households | % Households |
| Dial-Up Internet | 14 | 0.5% |
| Broadband Home | 2,301 | 79.9% |
| Cellular Data Only | 286 | 9.9% |
| Satellite Internet | 102 | 3.5% |
| No Internet | 205 | 7.1% |
| Total | 2,879 | 100.0% |
Wyoming Summary
Wyoming, Minnesota is a small city located in Chisago County, Minnesota. It is situated on the north shore of Chisago Lake, about 30 miles northeast of Minneapolis. The city has a population of about 7,000 people and is part of the Twin Cities metropolitan area.
History
The area that is now Wyoming was first settled in the mid-1800s by Swedish immigrants. The city was officially incorporated in 1887 and was named after Wyoming County, New York, which was the home of many of the early settlers.
The city grew slowly but steadily over the years, and by the early 1900s, it had become a popular summer resort destination. The city was home to several resorts, including the Chisago Lake Hotel, which was built in the late 1800s and was a popular destination for wealthy Minnesotans.
In the 1950s, the city began to experience a population boom as people moved to the area from the Twin Cities. This growth continued into the 1960s and 1970s, and by the 1980s, the city had become a bedroom community for the Twin Cities.
Geography
Wyoming is located in Chisago County, Minnesota, about 30 miles northeast of Minneapolis. The city is situated on the north shore of Chisago Lake, which is a popular recreational destination. The city is surrounded by rolling hills and forests, and is home to several parks and nature preserves.
The city has a total area of 4.2 square miles, of which 4.1 square miles is land and 0.1 square miles is water. The city is located at an elevation of 890 feet above sea level.
Economy
Wyoming’s economy is largely based on tourism and retail. The city is home to several resorts and hotels, as well as a variety of shops and restaurants. The city is also home to several manufacturing companies, including a paper mill and a plastics factory.
The city is also home to several small businesses, including a variety of professional services, such as accounting and legal services. The city is also home to several medical facilities, including a hospital and several clinics.
Demographics
As of the 2010 census, the population of Wyoming was 7,004. The racial makeup of the city was 94.3% White, 1.2% African American, 0.3% Native American, 0.7% Asian, 0.1% Pacific Islander, 1.7% from other races, and 1.9% from two or more races. Hispanic or Latino of any race were 4.2% of the population.
The median household income in Wyoming was $60,938, and the median family income was $71,944. The per capita income for the city was $27,945. About 4.3% of families and 5.7% of the population were below the poverty line, including 7.2% of those under age 18 and 4.2% of those age 65 or over.
Conclusion
Wyoming, Minnesota is a small city located in Chisago County, Minnesota. It is situated on the north shore of Chisago Lake, about 30 miles northeast of Minneapolis. The city has a population of about 7,000 people and is part of the Twin Cities metropolitan area. The city has a long history, dating back to the mid-1800s, and has grown steadily over the years. The city’s economy is largely based on tourism and retail, and it is home to several resorts, hotels, shops, restaurants, and manufacturing companies. The city has a diverse population, with a median household income of $60,938 and a median family income of $71,944.
Common Questions
What is Per Capita Income in Wyoming?
Per Capita income in Wyoming is $40,240.
What is the Median Family Income in Wyoming?
Median Family Income in Wyoming is $101,633.
What is the Median Household income in Wyoming?
Median Household Income in Wyoming is $99,821.
What is Income or Wage Gap in Wyoming?
Income or Wage Gap in Wyoming is 28.2%.
Women in Wyoming earn 71.8 cents for every dollar earned by a man.
What is Inequality or Gini Index in Wyoming?
Inequality or Gini Index in Wyoming is 0.33.
What is the Total Population of Wyoming?
Total Population of Wyoming is 8,037.
What is the Total Male Population of Wyoming?
Total Male Population of Wyoming is 4,158.
What is the Total Female Population of Wyoming?
Total Female Population of Wyoming is 3,879.
What is the Ratio of Males per 100 Females in Wyoming?
There are 107.19 Males per 100 Females in Wyoming.
What is the Ratio of Females per 100 Males in Wyoming?
There are 93.29 Females per 100 Males in Wyoming.
What is the Median Population Age in Wyoming?
Median Population Age in Wyoming is 40.4 Years.
What is the Average Family Size in Wyoming
Average Family Size in Wyoming is 3.0 People.
What is the Average Household Size in Wyoming
Average Household Size in Wyoming is 2.8 People.
How Large is the Labor Force in Wyoming?
There are 4,446 People in the Labor Forcein in Wyoming.
What is the Percentage of People in the Labor Force in Wyoming?
69.2% of People are in the Labor Force in Wyoming.
What is the Unemployment Rate in Wyoming?
Unemployment Rate in Wyoming is 2.9%.