Oakville, MO Map & Demographics
Oakville Map
Oakville Overview
$49,649
PER CAPITA INCOME
$120,124
AVG FAMILY INCOME
$100,558
AVG HOUSEHOLD INCOME
28.7%
WAGE / INCOME GAP [ % ]
71.3¢/ $1
WAGE / INCOME GAP [ $ ]
$8,579
FAMILY INCOME DEFICIT
0.41
INEQUALITY / GINI INDEX
35,412
TOTAL POPULATION
17,331
MALE POPULATION
18,081
FEMALE POPULATION
95.85
MALES / 100 FEMALES
104.33
FEMALES / 100 MALES
45.9
MEDIAN AGE
2.9
AVG FAMILY SIZE
2.5
AVG HOUSEHOLD SIZE
19,064
LABOR FORCE [ PEOPLE ]
65.3%
PERCENT IN LABOR FORCE
3.9%
UNEMPLOYMENT RATE
Oakville Area Codes
Income in Oakville
Income Overview in Oakville
Per Capita Income in Oakville is $49,649, while median incomes of families and households are $120,124 and $100,558 respectively.
| Characteristic | Number | Measure |
| Per Capita Income | 35,412 | $49,649 |
| Median Family Income | 10,359 | $120,124 |
| Mean Family Income | 10,359 | $144,110 |
| Median Household Income | 13,870 | $100,558 |
| Mean Household Income | 13,870 | $125,423 |
| Income Deficit | 10,359 | $8,579 |
| Wage / Income Gap (%) | 35,412 | 28.68% |
| Wage / Income Gap ($) | 35,412 | 71.32¢ per $1 |
| Gini / Inequality Index | 35,412 | 0.41 |
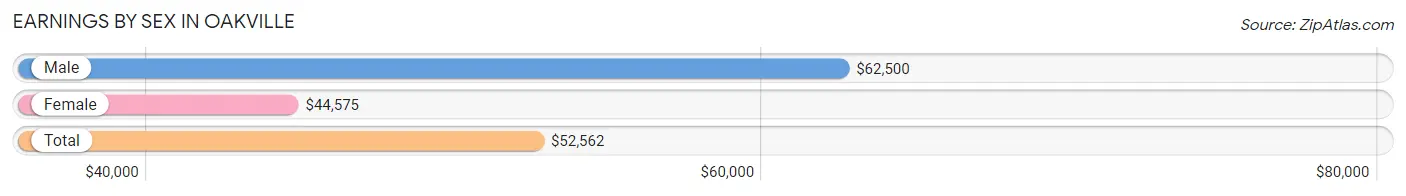
Earnings by Sex in Oakville
Average Earnings in Oakville are $52,562, $62,500 for men and $44,575 for women, a difference of 28.7%.
| Sex | Number | Average Earnings |
| Male | 10,218 (51.2%) | $62,500 |
| Female | 9,733 (48.8%) | $44,575 |
| Total | 19,951 (100.0%) | $52,562 |
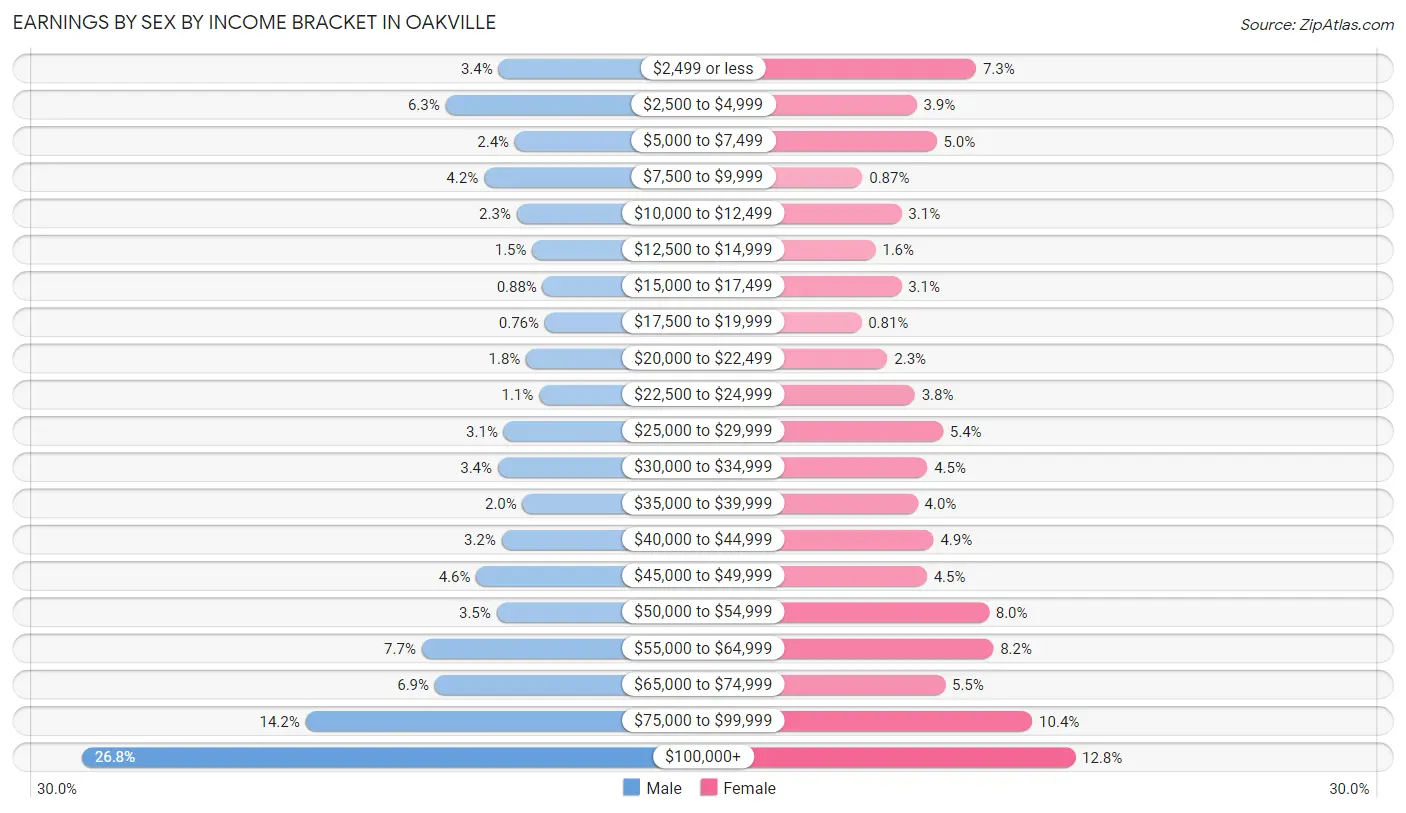
Earnings by Sex by Income Bracket in Oakville
The most common earnings brackets in Oakville are $100,000+ for men (2,736 | 26.8%) and $100,000+ for women (1,249 | 12.8%).
| Income | Male | Female |
| $2,499 or less | 343 (3.4%) | 707 (7.3%) |
| $2,500 to $4,999 | 648 (6.3%) | 382 (3.9%) |
| $5,000 to $7,499 | 249 (2.4%) | 491 (5.0%) |
| $7,500 to $9,999 | 427 (4.2%) | 85 (0.9%) |
| $10,000 to $12,499 | 239 (2.3%) | 299 (3.1%) |
| $12,500 to $14,999 | 149 (1.5%) | 156 (1.6%) |
| $15,000 to $17,499 | 90 (0.9%) | 298 (3.1%) |
| $17,500 to $19,999 | 78 (0.8%) | 79 (0.8%) |
| $20,000 to $22,499 | 185 (1.8%) | 222 (2.3%) |
| $22,500 to $24,999 | 110 (1.1%) | 372 (3.8%) |
| $25,000 to $29,999 | 314 (3.1%) | 526 (5.4%) |
| $30,000 to $34,999 | 347 (3.4%) | 440 (4.5%) |
| $35,000 to $39,999 | 205 (2.0%) | 387 (4.0%) |
| $40,000 to $44,999 | 326 (3.2%) | 474 (4.9%) |
| $45,000 to $49,999 | 471 (4.6%) | 437 (4.5%) |
| $50,000 to $54,999 | 355 (3.5%) | 777 (8.0%) |
| $55,000 to $64,999 | 785 (7.7%) | 801 (8.2%) |
| $65,000 to $74,999 | 709 (6.9%) | 537 (5.5%) |
| $75,000 to $99,999 | 1,452 (14.2%) | 1,014 (10.4%) |
| $100,000+ | 2,736 (26.8%) | 1,249 (12.8%) |
| Total | 10,218 (100.0%) | 9,733 (100.0%) |
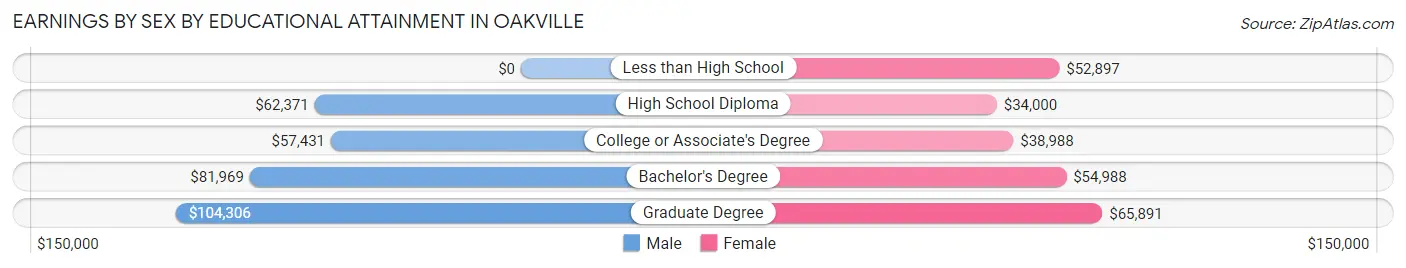
Earnings by Sex by Educational Attainment in Oakville
Average earnings in Oakville are $72,016 for men and $51,107 for women, a difference of 29.0%. Men with an educational attainment of graduate degree enjoy the highest average annual earnings of $104,306, while those with college or associate's degree education earn the least with $57,431. Women with an educational attainment of graduate degree earn the most with the average annual earnings of $65,891, while those with high school diploma education have the smallest earnings of $34,000.
| Educational Attainment | Male Income | Female Income |
| Less than High School | - | - |
| High School Diploma | $62,371 | $34,000 |
| College or Associate's Degree | $57,431 | $38,988 |
| Bachelor's Degree | $81,969 | $54,988 |
| Graduate Degree | $104,306 | $65,891 |
| Total | $72,016 | $51,107 |
Family Income in Oakville
Family Income Brackets in Oakville
According to the Oakville family income data, there are 2,673 families falling into the $100,000 to $149,999 income range, which is the most common income bracket and makes up 25.8% of all families. Conversely, the less than $10,000 income bracket is the least frequent group with only 52 families (0.5%) belonging to this category.
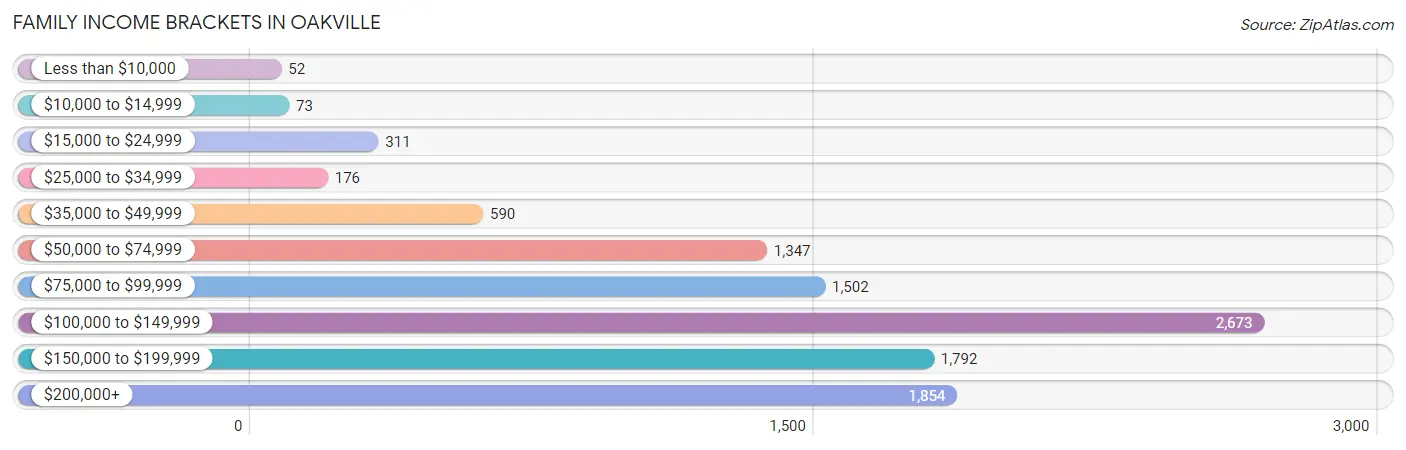
| Income Bracket | # Families | % Families |
| Less than $10,000 | 52 | 0.5% |
| $10,000 to $14,999 | 73 | 0.7% |
| $15,000 to $24,999 | 311 | 3.0% |
| $25,000 to $34,999 | 176 | 1.7% |
| $35,000 to $49,999 | 590 | 5.7% |
| $50,000 to $74,999 | 1,347 | 13.0% |
| $75,000 to $99,999 | 1,502 | 14.5% |
| $100,000 to $149,999 | 2,673 | 25.8% |
| $150,000 to $199,999 | 1,792 | 17.3% |
| $200,000+ | 1,854 | 17.9% |
Family Income by Famaliy Size in Oakville
3-person families (2,004 | 19.4%) account for the highest median family income in Oakville with $142,292 per family, while 2-person families (5,440 | 52.5%) have the highest median income of $52,330 per family member.
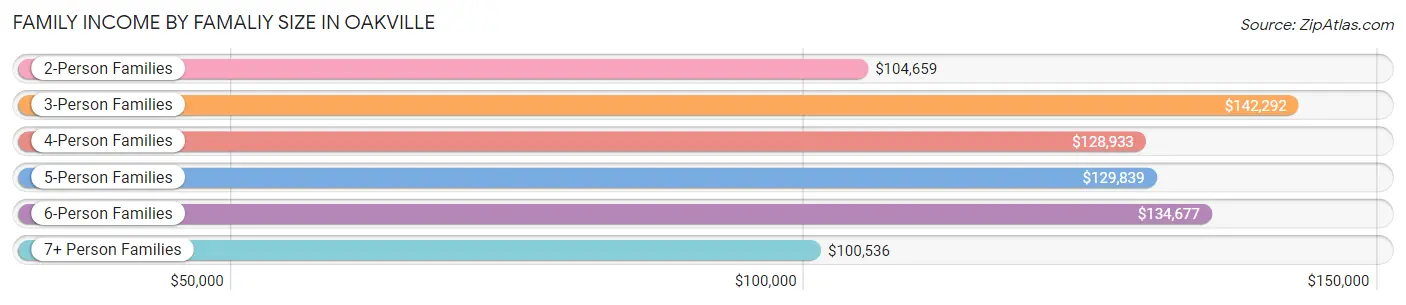
| Income Bracket | # Families | Median Income |
| 2-Person Families | 5,440 (52.5%) | $104,659 |
| 3-Person Families | 2,004 (19.4%) | $142,292 |
| 4-Person Families | 2,129 (20.5%) | $128,933 |
| 5-Person Families | 468 (4.5%) | $129,839 |
| 6-Person Families | 236 (2.3%) | $134,677 |
| 7+ Person Families | 82 (0.8%) | $100,536 |
| Total | 10,359 (100.0%) | $120,124 |
Family Income by Number of Earners in Oakville
The median family income in Oakville is $120,124, with families comprising 3+ earners (1,379) having the highest median family income of $177,034, while families with no earners (1,830) have the lowest median family income of $74,896, accounting for 13.3% and 17.7% of families, respectively.
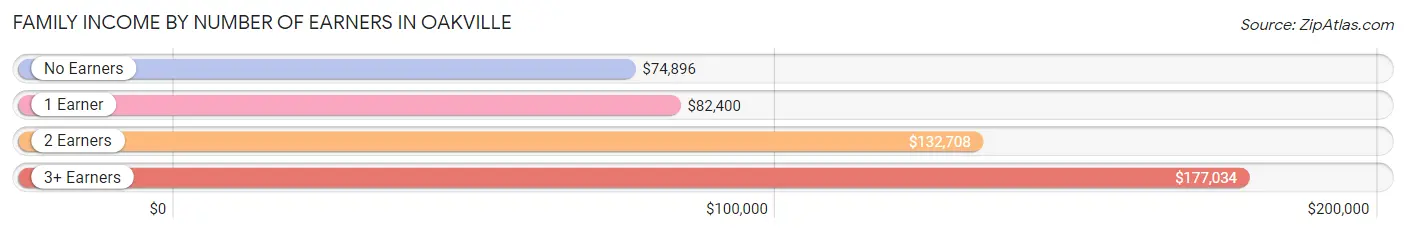
| Number of Earners | # Families | Median Income |
| No Earners | 1,830 (17.7%) | $74,896 |
| 1 Earner | 2,500 (24.1%) | $82,400 |
| 2 Earners | 4,650 (44.9%) | $132,708 |
| 3+ Earners | 1,379 (13.3%) | $177,034 |
| Total | 10,359 (100.0%) | $120,124 |
Household Income in Oakville
Household Income Brackets in Oakville
With 3,065 households falling in the category, the $100,000 to $149,999 income range is the most frequent in Oakville, accounting for 22.1% of all households. In contrast, only 166 households (1.2%) fall into the $10,000 to $14,999 income bracket, making it the least populous group.
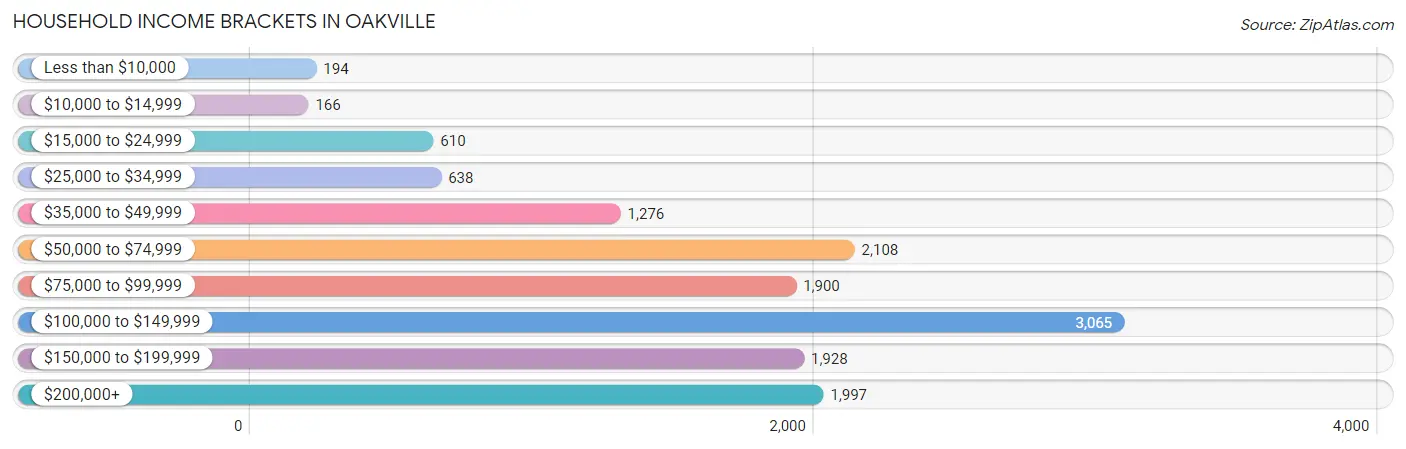
| Income Bracket | # Households | % Households |
| Less than $10,000 | 194 | 1.4% |
| $10,000 to $14,999 | 166 | 1.2% |
| $15,000 to $24,999 | 610 | 4.4% |
| $25,000 to $34,999 | 638 | 4.6% |
| $35,000 to $49,999 | 1,276 | 9.2% |
| $50,000 to $74,999 | 2,108 | 15.2% |
| $75,000 to $99,999 | 1,900 | 13.7% |
| $100,000 to $149,999 | 3,065 | 22.1% |
| $150,000 to $199,999 | 1,928 | 13.9% |
| $200,000+ | 1,997 | 14.4% |
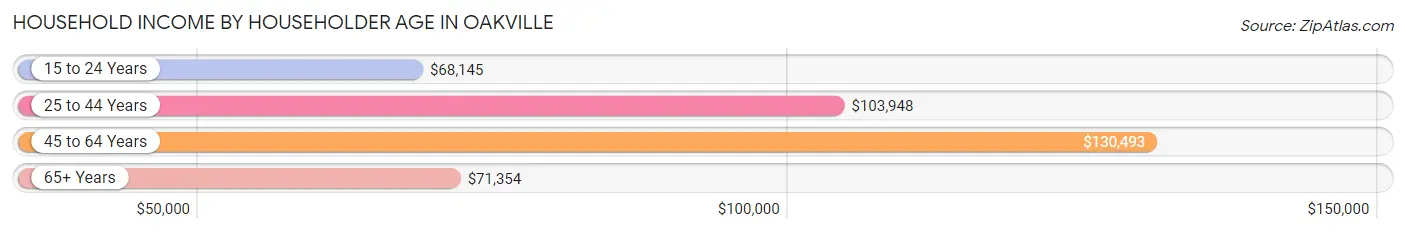
Household Income by Householder Age in Oakville
The median household income in Oakville is $100,558, with the highest median household income of $130,493 found in the 45 to 64 years age bracket for the primary householder. A total of 5,824 households (42.0%) fall into this category. Meanwhile, the 15 to 24 years age bracket for the primary householder has the lowest median household income of $68,145, with 247 households (1.8%) in this group.
| Income Bracket | # Households | Median Income |
| 15 to 24 Years | 247 (1.8%) | $68,145 |
| 25 to 44 Years | 3,295 (23.8%) | $103,948 |
| 45 to 64 Years | 5,824 (42.0%) | $130,493 |
| 65+ Years | 4,504 (32.5%) | $71,354 |
| Total | 13,870 (100.0%) | $100,558 |
Poverty in Oakville
Income Below Poverty by Sex and Age in Oakville
With 7.8% poverty level for males and 3.4% for females among the residents of Oakville, 18 to 24 year old males and 35 to 44 year old females are the most vulnerable to poverty, with 451 males (24.9%) and 125 females (6.3%) in their respective age groups living below the poverty level.
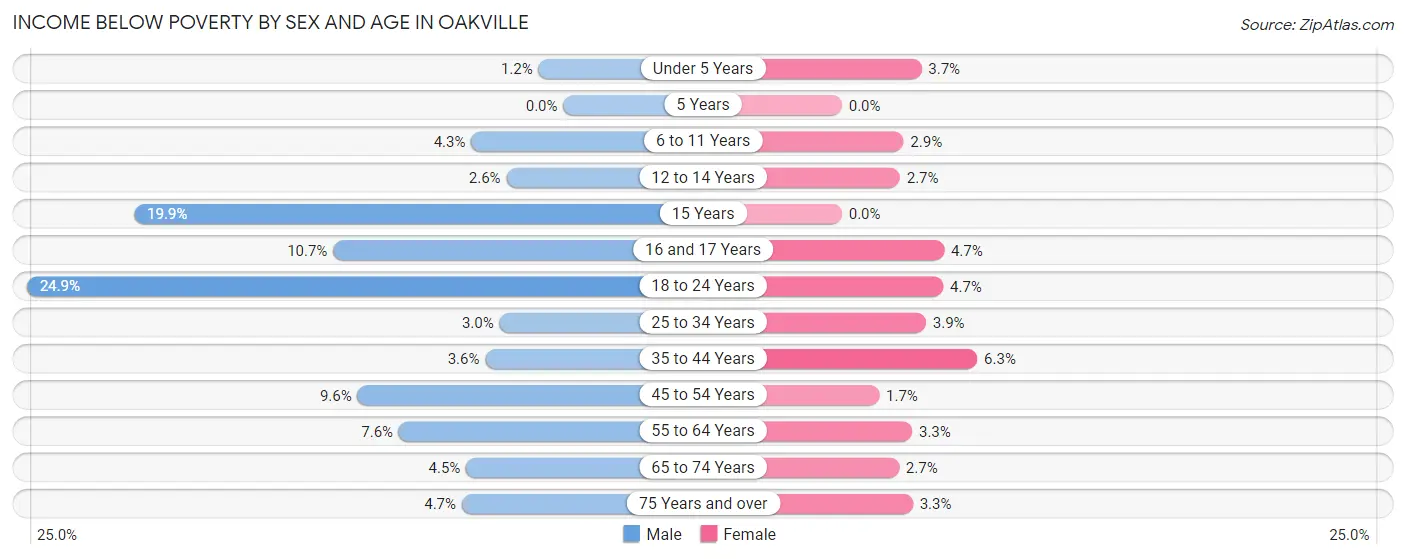
| Age Bracket | Male | Female |
| Under 5 Years | 10 (1.1%) | 27 (3.7%) |
| 5 Years | 0 (0.0%) | 0 (0.0%) |
| 6 to 11 Years | 51 (4.3%) | 36 (2.9%) |
| 12 to 14 Years | 15 (2.6%) | 17 (2.7%) |
| 15 Years | 98 (19.9%) | 0 (0.0%) |
| 16 and 17 Years | 30 (10.7%) | 19 (4.7%) |
| 18 to 24 Years | 451 (24.9%) | 69 (4.7%) |
| 25 to 34 Years | 50 (3.0%) | 62 (3.9%) |
| 35 to 44 Years | 66 (3.6%) | 125 (6.3%) |
| 45 to 54 Years | 226 (9.6%) | 44 (1.7%) |
| 55 to 64 Years | 199 (7.6%) | 100 (3.3%) |
| 65 to 74 Years | 98 (4.5%) | 59 (2.6%) |
| 75 Years and over | 62 (4.7%) | 56 (3.3%) |
| Total | 1,356 (7.8%) | 614 (3.4%) |
Income Above Poverty by Sex and Age in Oakville
According to the poverty statistics in Oakville, males aged 5 years and females aged 5 years are the age groups that are most secure financially, with 100.0% of males and 100.0% of females in these age groups living above the poverty line.
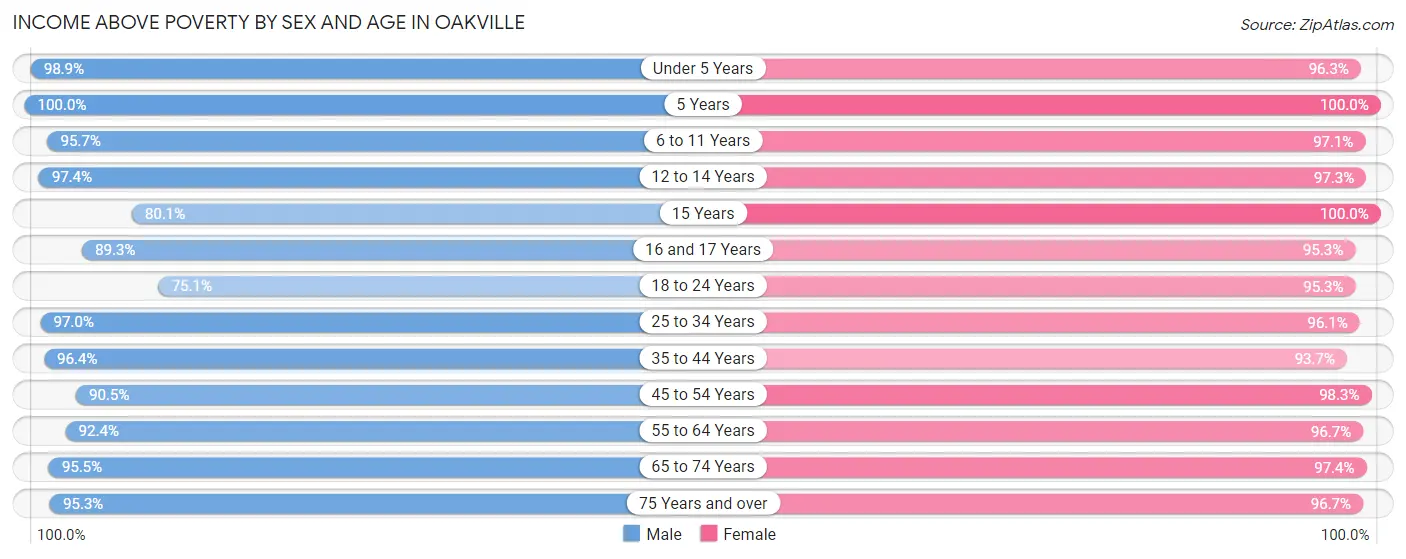
| Age Bracket | Male | Female |
| Under 5 Years | 860 (98.9%) | 704 (96.3%) |
| 5 Years | 99 (100.0%) | 133 (100.0%) |
| 6 to 11 Years | 1,142 (95.7%) | 1,224 (97.1%) |
| 12 to 14 Years | 553 (97.4%) | 615 (97.3%) |
| 15 Years | 394 (80.1%) | 221 (100.0%) |
| 16 and 17 Years | 251 (89.3%) | 382 (95.3%) |
| 18 to 24 Years | 1,360 (75.1%) | 1,400 (95.3%) |
| 25 to 34 Years | 1,642 (97.0%) | 1,527 (96.1%) |
| 35 to 44 Years | 1,758 (96.4%) | 1,865 (93.7%) |
| 45 to 54 Years | 2,141 (90.4%) | 2,502 (98.3%) |
| 55 to 64 Years | 2,409 (92.4%) | 2,972 (96.7%) |
| 65 to 74 Years | 2,075 (95.5%) | 2,170 (97.4%) |
| 75 Years and over | 1,255 (95.3%) | 1,648 (96.7%) |
| Total | 15,939 (92.2%) | 17,363 (96.6%) |
Income Below Poverty Among Married-Couple Families in Oakville
The poverty statistics for married-couple families in Oakville show that 1.6% or 143 of the total 8,726 families live below the poverty line. Families with 3 or 4 children have the highest poverty rate of 3.4%, comprising of 18 families. On the other hand, families with 5 or more children have the lowest poverty rate of 0.0%, which includes 0 families.
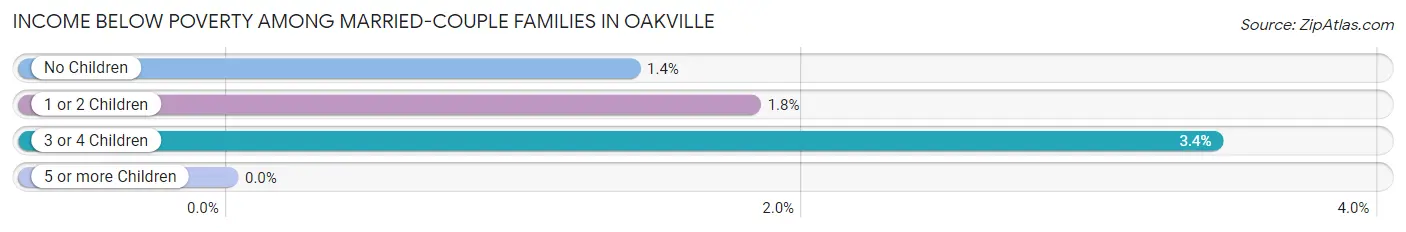
| Children | Above Poverty | Below Poverty |
| No Children | 5,570 (98.6%) | 79 (1.4%) |
| 1 or 2 Children | 2,487 (98.2%) | 46 (1.8%) |
| 3 or 4 Children | 507 (96.6%) | 18 (3.4%) |
| 5 or more Children | 19 (100.0%) | 0 (0.0%) |
| Total | 8,583 (98.4%) | 143 (1.6%) |
Income Below Poverty Among Single-Parent Households in Oakville
According to the poverty data in Oakville, 6.6% or 30 single-father households and 10.3% or 121 single-mother households are living below the poverty line. Among single-father households, those with 1 or 2 children have the highest poverty rate, with 19 households (10.3%) experiencing poverty. Likewise, among single-mother households, those with 1 or 2 children have the highest poverty rate, with 88 households (12.4%) falling below the poverty line.
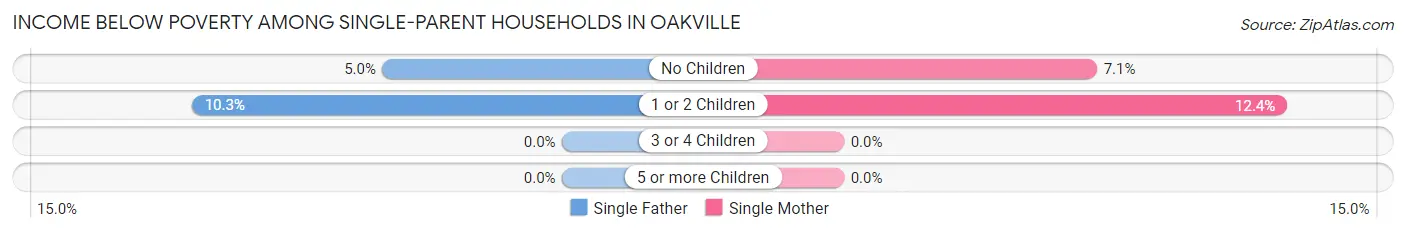
| Children | Single Father | Single Mother |
| No Children | 11 (5.0%) | 33 (7.1%) |
| 1 or 2 Children | 19 (10.3%) | 88 (12.4%) |
| 3 or 4 Children | 0 (0.0%) | 0 (0.0%) |
| 5 or more Children | 0 (0.0%) | 0 (0.0%) |
| Total | 30 (6.6%) | 121 (10.3%) |
Income Below Poverty Among Married-Couple vs Single-Parent Households in Oakville
The poverty data for Oakville shows that 143 of the married-couple family households (1.6%) and 151 of the single-parent households (9.2%) are living below the poverty level. Within the married-couple family households, those with 3 or 4 children have the highest poverty rate, with 18 households (3.4%) falling below the poverty line. Among the single-parent households, those with 1 or 2 children have the highest poverty rate, with 107 household (12.0%) living below poverty.
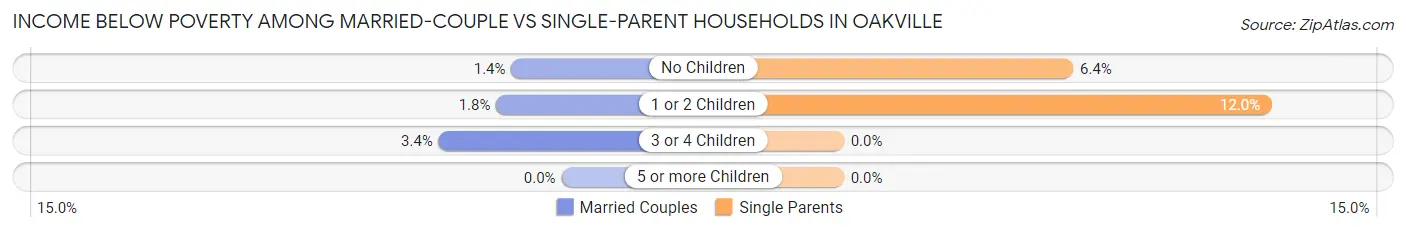
| Children | Married-Couple Families | Single-Parent Households |
| No Children | 79 (1.4%) | 44 (6.4%) |
| 1 or 2 Children | 46 (1.8%) | 107 (12.0%) |
| 3 or 4 Children | 18 (3.4%) | 0 (0.0%) |
| 5 or more Children | 0 (0.0%) | 0 (0.0%) |
| Total | 143 (1.6%) | 151 (9.2%) |
Race in Oakville
The most populous races in Oakville are White / Caucasian (32,303 | 91.2%), Two or more Races (1,630 | 4.6%), and Hispanic or Latino (927 | 2.6%).
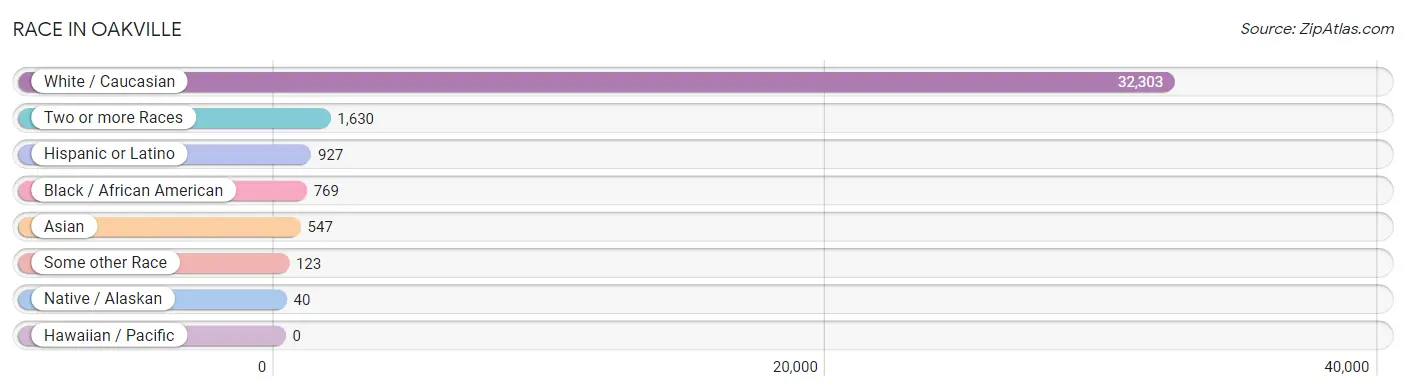
| Race | # Population | % Population |
| Asian | 547 | 1.5% |
| Black / African American | 769 | 2.2% |
| Hawaiian / Pacific | 0 | 0.0% |
| Hispanic or Latino | 927 | 2.6% |
| Native / Alaskan | 40 | 0.1% |
| White / Caucasian | 32,303 | 91.2% |
| Two or more Races | 1,630 | 4.6% |
| Some other Race | 123 | 0.4% |
| Total | 35,412 | 100.0% |
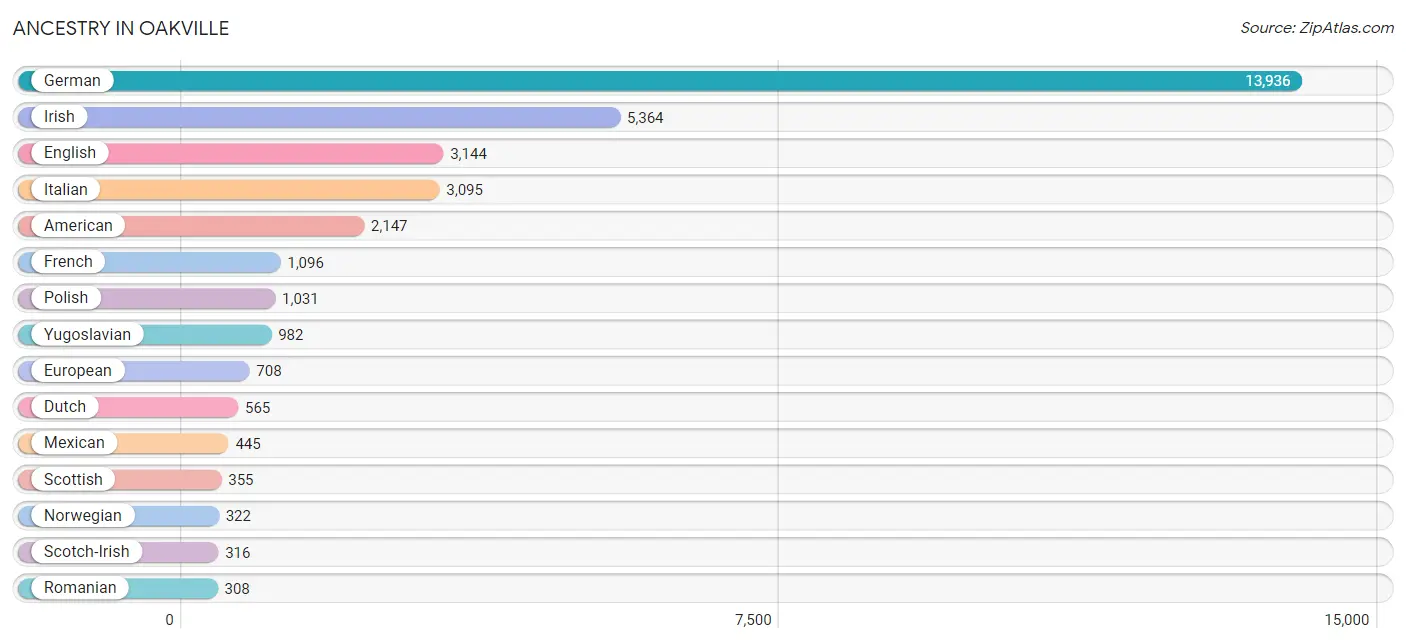
Ancestry in Oakville
The most populous ancestries reported in Oakville are German (13,936 | 39.4%), Irish (5,364 | 15.1%), English (3,144 | 8.9%), Italian (3,095 | 8.7%), and American (2,147 | 6.1%), together accounting for 78.2% of all Oakville residents.
| Ancestry | # Population | % Population |
| African | 86 | 0.2% |
| American | 2,147 | 6.1% |
| Arab | 182 | 0.5% |
| Austrian | 100 | 0.3% |
| Belgian | 34 | 0.1% |
| Bhutanese | 10 | 0.0% |
| Brazilian | 14 | 0.0% |
| British | 231 | 0.6% |
| Burmese | 15 | 0.0% |
| Cajun | 9 | 0.0% |
| Canadian | 38 | 0.1% |
| Central American | 145 | 0.4% |
| Central American Indian | 61 | 0.2% |
| Cherokee | 66 | 0.2% |
| Choctaw | 44 | 0.1% |
| Colombian | 7 | 0.0% |
| Croatian | 272 | 0.8% |
| Cuban | 11 | 0.0% |
| Czech | 305 | 0.9% |
| Czechoslovakian | 50 | 0.1% |
| Danish | 34 | 0.1% |
| Dominican | 20 | 0.1% |
| Dutch | 565 | 1.6% |
| Eastern European | 19 | 0.1% |
| English | 3,144 | 8.9% |
| Ethiopian | 9 | 0.0% |
| European | 708 | 2.0% |
| Finnish | 18 | 0.1% |
| French | 1,096 | 3.1% |
| French Canadian | 46 | 0.1% |
| German | 13,936 | 39.4% |
| Ghanaian | 4 | 0.0% |
| Greek | 230 | 0.6% |
| Guamanian / Chamorro | 31 | 0.1% |
| Guatemalan | 12 | 0.0% |
| Honduran | 72 | 0.2% |
| Hungarian | 301 | 0.9% |
| Indian (Asian) | 194 | 0.5% |
| Irish | 5,364 | 15.1% |
| Italian | 3,095 | 8.7% |
| Jamaican | 16 | 0.1% |
| Jordanian | 31 | 0.1% |
| Korean | 114 | 0.3% |
| Lebanese | 21 | 0.1% |
| Lithuanian | 85 | 0.2% |
| Mexican | 445 | 1.3% |
| Mexican American Indian | 36 | 0.1% |
| Moroccan | 61 | 0.2% |
| Native Hawaiian | 42 | 0.1% |
| Nigerian | 4 | 0.0% |
| Northern European | 24 | 0.1% |
| Norwegian | 322 | 0.9% |
| Pakistani | 108 | 0.3% |
| Palestinian | 61 | 0.2% |
| Polish | 1,031 | 2.9% |
| Puerto Rican | 21 | 0.1% |
| Romanian | 308 | 0.9% |
| Russian | 38 | 0.1% |
| Salvadoran | 61 | 0.2% |
| Scandinavian | 44 | 0.1% |
| Scotch-Irish | 316 | 0.9% |
| Scottish | 355 | 1.0% |
| Seminole | 14 | 0.0% |
| Slavic | 19 | 0.1% |
| Slovak | 120 | 0.3% |
| Slovene | 18 | 0.1% |
| South American | 24 | 0.1% |
| Spaniard | 68 | 0.2% |
| Spanish | 136 | 0.4% |
| Sri Lankan | 92 | 0.3% |
| Subsaharan African | 99 | 0.3% |
| Swedish | 219 | 0.6% |
| Swiss | 136 | 0.4% |
| Thai | 155 | 0.4% |
| Tlingit-Haida | 2 | 0.0% |
| Turkish | 83 | 0.2% |
| Ukrainian | 68 | 0.2% |
| Uruguayan | 17 | 0.1% |
| Welsh | 256 | 0.7% |
| Yugoslavian | 982 | 2.8% | View All 80 Rows |
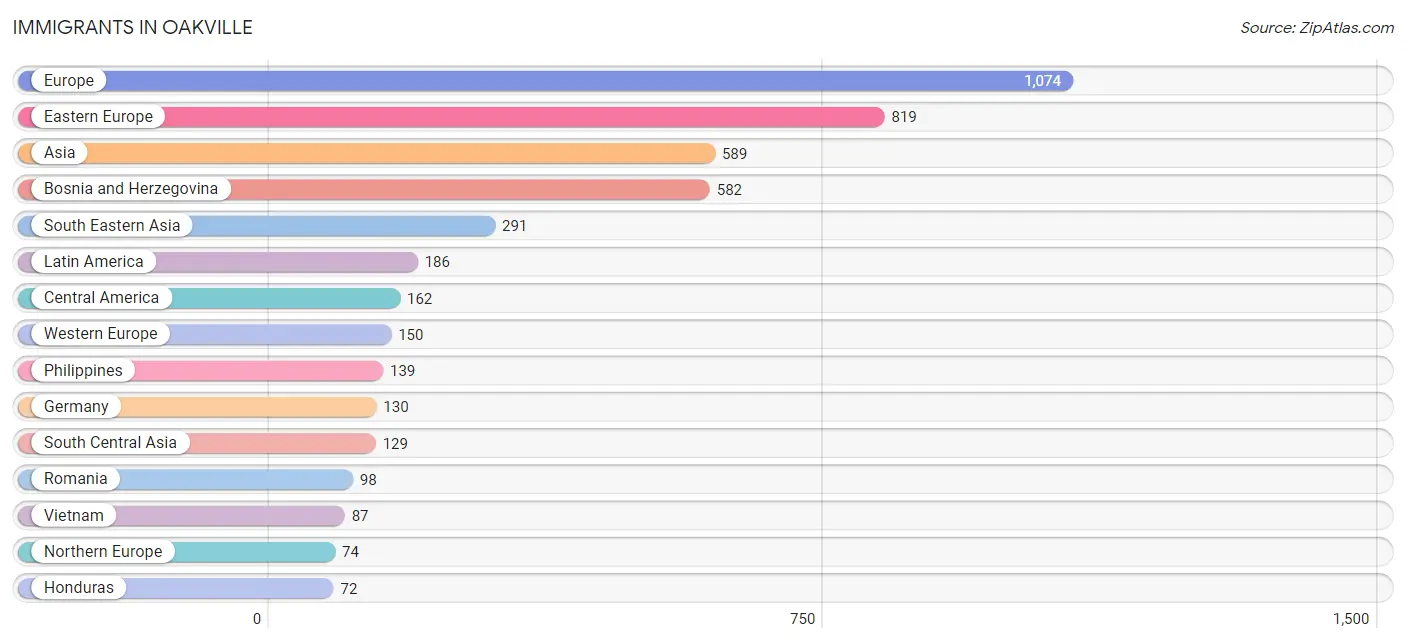
Immigrants in Oakville
The most numerous immigrant groups reported in Oakville came from Europe (1,074 | 3.0%), Eastern Europe (819 | 2.3%), Asia (589 | 1.7%), Bosnia and Herzegovina (582 | 1.6%), and South Eastern Asia (291 | 0.8%), together accounting for 9.5% of all Oakville residents.
| Immigration Origin | # Population | % Population |
| Afghanistan | 24 | 0.1% |
| Africa | 10 | 0.0% |
| Asia | 589 | 1.7% |
| Austria | 13 | 0.0% |
| Bosnia and Herzegovina | 582 | 1.6% |
| Canada | 29 | 0.1% |
| Central America | 162 | 0.5% |
| China | 50 | 0.1% |
| Colombia | 7 | 0.0% |
| Croatia | 32 | 0.1% |
| Eastern Africa | 9 | 0.0% |
| Eastern Asia | 69 | 0.2% |
| Eastern Europe | 819 | 2.3% |
| El Salvador | 61 | 0.2% |
| England | 52 | 0.2% |
| Ethiopia | 9 | 0.0% |
| Europe | 1,074 | 3.0% |
| Germany | 130 | 0.4% |
| Guatemala | 12 | 0.0% |
| Honduras | 72 | 0.2% |
| Hungary | 28 | 0.1% |
| India | 63 | 0.2% |
| Ireland | 14 | 0.0% |
| Italy | 31 | 0.1% |
| Japan | 10 | 0.0% |
| Jordan | 31 | 0.1% |
| Korea | 9 | 0.0% |
| Latin America | 186 | 0.5% |
| Mexico | 17 | 0.1% |
| Northern Africa | 1 | 0.0% |
| Northern Europe | 74 | 0.2% |
| Philippines | 139 | 0.4% |
| Poland | 37 | 0.1% |
| Romania | 98 | 0.3% |
| Serbia | 36 | 0.1% |
| South America | 24 | 0.1% |
| South Central Asia | 129 | 0.4% |
| South Eastern Asia | 291 | 0.8% |
| Southern Europe | 31 | 0.1% |
| Sudan | 1 | 0.0% |
| Switzerland | 7 | 0.0% |
| Taiwan | 7 | 0.0% |
| Thailand | 65 | 0.2% |
| Uruguay | 17 | 0.1% |
| Uzbekistan | 42 | 0.1% |
| Vietnam | 87 | 0.3% |
| Western Asia | 31 | 0.1% |
| Western Europe | 150 | 0.4% | View All 48 Rows |
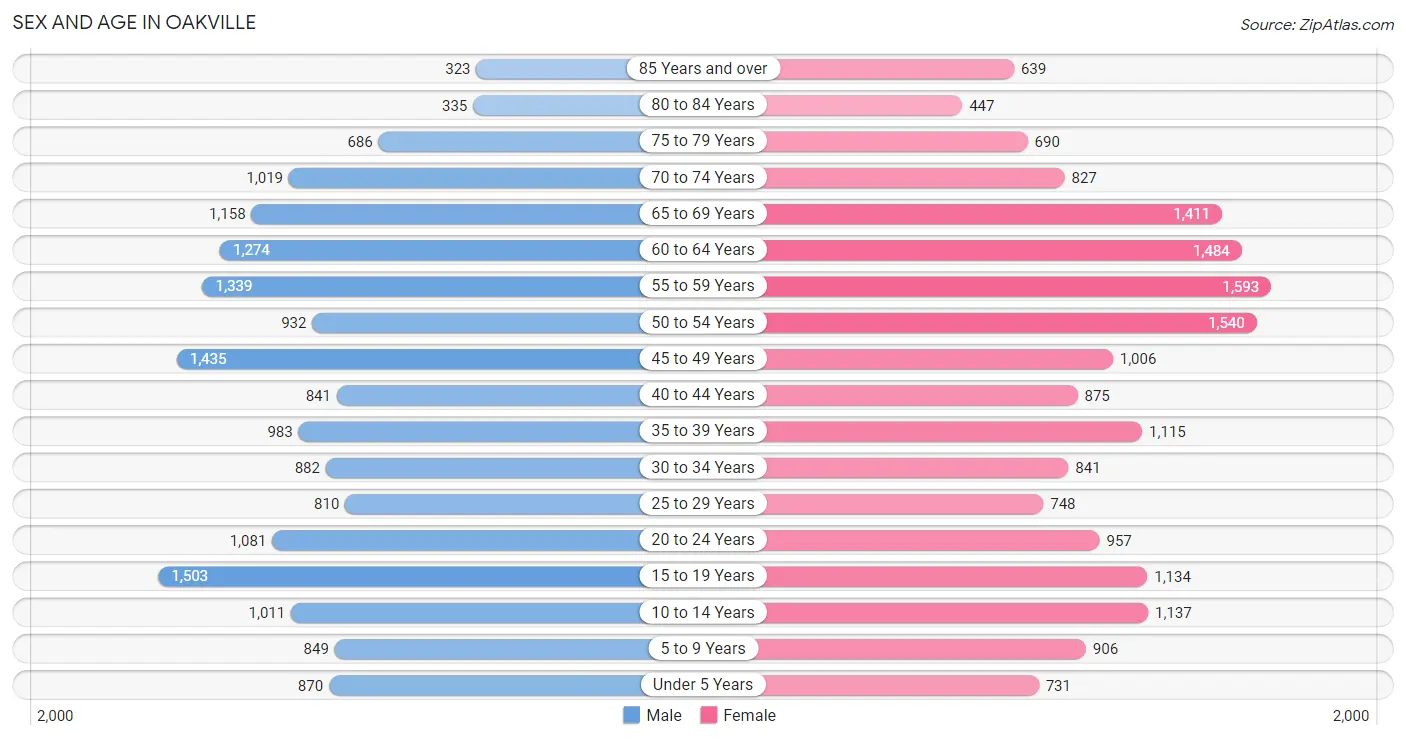
Sex and Age in Oakville
Sex and Age in Oakville
The most populous age groups in Oakville are 15 to 19 Years (1,503 | 8.7%) for men and 55 to 59 Years (1,593 | 8.8%) for women.
| Age Bracket | Male | Female |
| Under 5 Years | 870 (5.0%) | 731 (4.0%) |
| 5 to 9 Years | 849 (4.9%) | 906 (5.0%) |
| 10 to 14 Years | 1,011 (5.8%) | 1,137 (6.3%) |
| 15 to 19 Years | 1,503 (8.7%) | 1,134 (6.3%) |
| 20 to 24 Years | 1,081 (6.2%) | 957 (5.3%) |
| 25 to 29 Years | 810 (4.7%) | 748 (4.1%) |
| 30 to 34 Years | 882 (5.1%) | 841 (4.6%) |
| 35 to 39 Years | 983 (5.7%) | 1,115 (6.2%) |
| 40 to 44 Years | 841 (4.9%) | 875 (4.8%) |
| 45 to 49 Years | 1,435 (8.3%) | 1,006 (5.6%) |
| 50 to 54 Years | 932 (5.4%) | 1,540 (8.5%) |
| 55 to 59 Years | 1,339 (7.7%) | 1,593 (8.8%) |
| 60 to 64 Years | 1,274 (7.3%) | 1,484 (8.2%) |
| 65 to 69 Years | 1,158 (6.7%) | 1,411 (7.8%) |
| 70 to 74 Years | 1,019 (5.9%) | 827 (4.6%) |
| 75 to 79 Years | 686 (4.0%) | 690 (3.8%) |
| 80 to 84 Years | 335 (1.9%) | 447 (2.5%) |
| 85 Years and over | 323 (1.9%) | 639 (3.5%) |
| Total | 17,331 (100.0%) | 18,081 (100.0%) |
Families and Households in Oakville
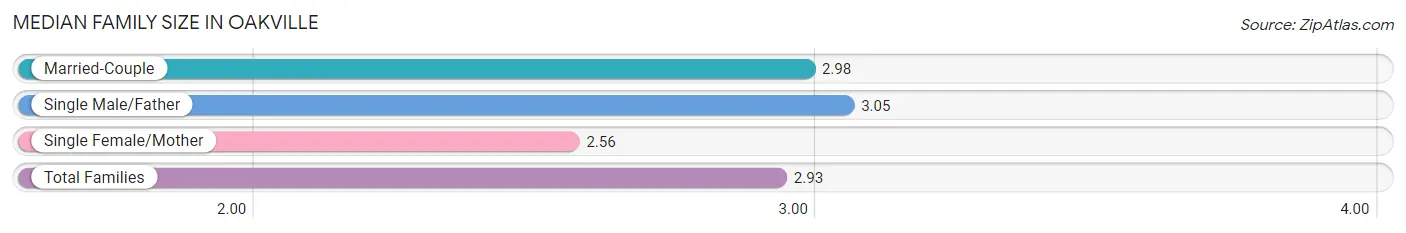
Median Family Size in Oakville
The median family size in Oakville is 2.93 persons per family, with single male/father families (456 | 4.4%) accounting for the largest median family size of 3.05 persons per family. On the other hand, single female/mother families (1,177 | 11.4%) represent the smallest median family size with 2.56 persons per family.
| Family Type | # Families | Family Size |
| Married-Couple | 8,726 (84.2%) | 2.98 |
| Single Male/Father | 456 (4.4%) | 3.05 |
| Single Female/Mother | 1,177 (11.4%) | 2.56 |
| Total Families | 10,359 (100.0%) | 2.93 |
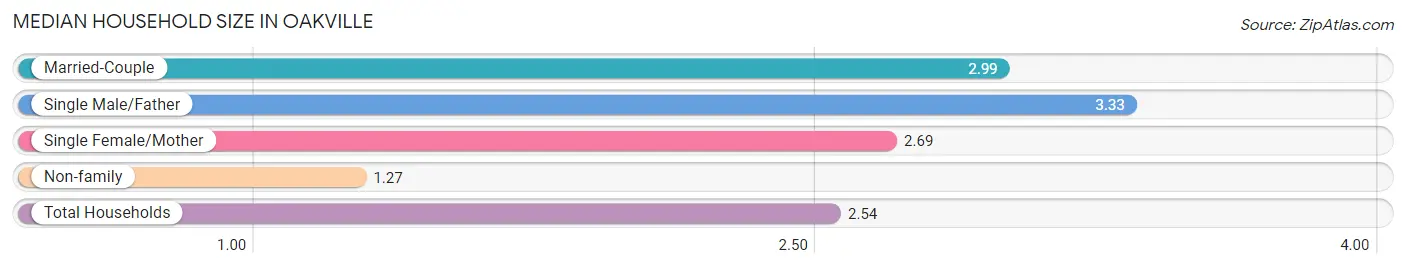
Median Household Size in Oakville
The median household size in Oakville is 2.54 persons per household, with single male/father households (456 | 3.3%) accounting for the largest median household size of 3.33 persons per household. non-family households (3,511 | 25.3%) represent the smallest median household size with 1.27 persons per household.
| Household Type | # Households | Household Size |
| Married-Couple | 8,726 (62.9%) | 2.99 |
| Single Male/Father | 456 (3.3%) | 3.33 |
| Single Female/Mother | 1,177 (8.5%) | 2.69 |
| Non-family | 3,511 (25.3%) | 1.27 |
| Total Households | 13,870 (100.0%) | 2.54 |
Household Size by Marriage Status in Oakville
Out of a total of 13,870 households in Oakville, 10,359 (74.7%) are family households, while 3,511 (25.3%) are nonfamily households. The most numerous type of family households are 2-person households, comprising 5,236, and the most common type of nonfamily households are 1-person households, comprising 2,900.
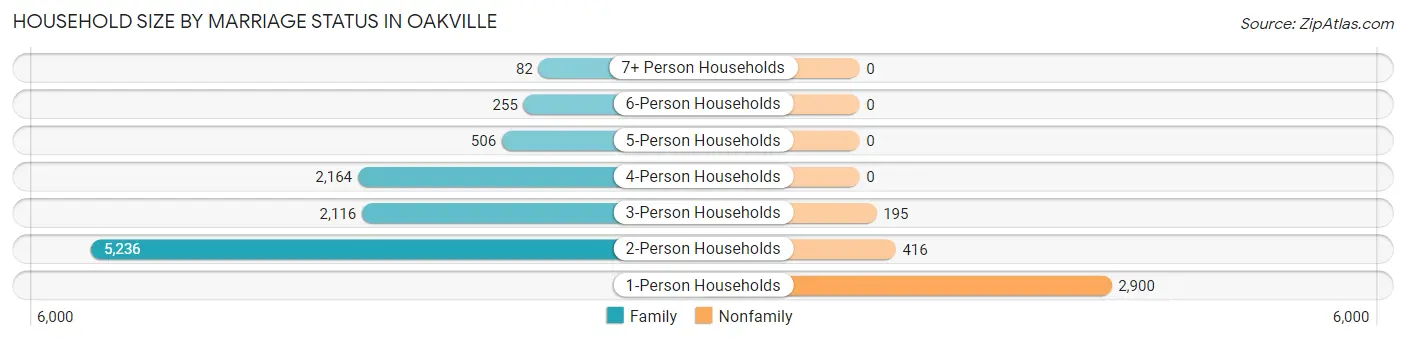
| Household Size | Family Households | Nonfamily Households |
| 1-Person Households | - | 2,900 (20.9%) |
| 2-Person Households | 5,236 (37.8%) | 416 (3.0%) |
| 3-Person Households | 2,116 (15.3%) | 195 (1.4%) |
| 4-Person Households | 2,164 (15.6%) | 0 (0.0%) |
| 5-Person Households | 506 (3.6%) | 0 (0.0%) |
| 6-Person Households | 255 (1.8%) | 0 (0.0%) |
| 7+ Person Households | 82 (0.6%) | 0 (0.0%) |
| Total | 10,359 (74.7%) | 3,511 (25.3%) |
Female Fertility in Oakville
Fertility by Age in Oakville
Average fertility rate in Oakville is 57.0 births per 1,000 women. Women in the age bracket of 20 to 34 years have the highest fertility rate with 128.0 births per 1,000 women. Women in the age bracket of 20 to 34 years acount for 82.7% of all women with births.
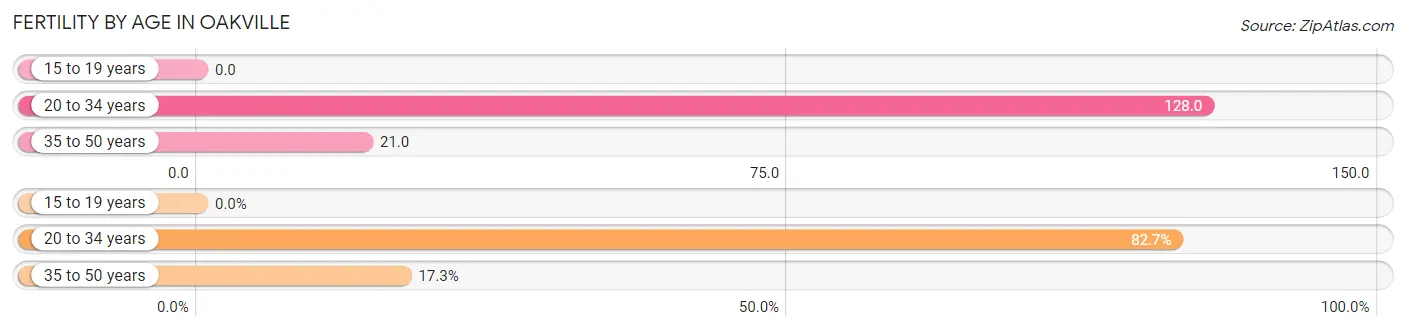
| Age Bracket | Women with Births | Births / 1,000 Women |
| 15 to 19 years | 0 (0.0%) | 0.0 |
| 20 to 34 years | 326 (82.7%) | 128.0 |
| 35 to 50 years | 68 (17.3%) | 21.0 |
| Total | 394 (100.0%) | 57.0 |
Fertility by Age by Marriage Status in Oakville
97.5% of women with births (394) in Oakville are married. The highest percentage of unmarried women with births falls into 35 to 50 years age bracket with 14.7% of them unmarried at the time of birth, while the lowest percentage of unmarried women with births belong to 20 to 34 years age bracket with 0.0% of them unmarried.
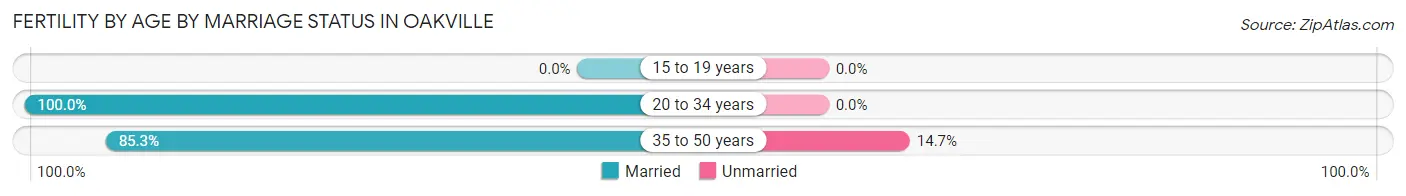
| Age Bracket | Married | Unmarried |
| 15 to 19 years | 0 (0.0%) | 0 (0.0%) |
| 20 to 34 years | 326 (100.0%) | 0 (0.0%) |
| 35 to 50 years | 58 (85.3%) | 10 (14.7%) |
| Total | 384 (97.5%) | 10 (2.5%) |
Fertility by Education in Oakville
Average fertility rate in Oakville is 57.0 births per 1,000 women. Women with the education attainment of college or associate's degree have the highest fertility rate of 94.0 births per 1,000 women, while women with the education attainment of less than high school have the lowest fertility at 9.0 births per 1,000 women. Women with the education attainment of college or associate's degree represent 50.8% of all women with births.
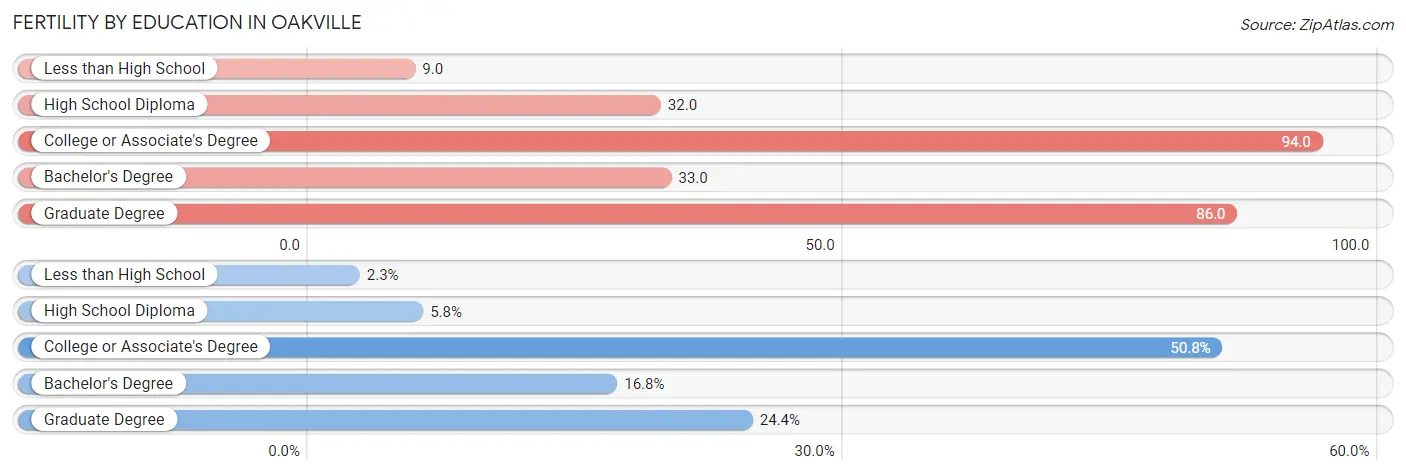
| Educational Attainment | Women with Births | Births / 1,000 Women |
| Less than High School | 9 (2.3%) | 9.0 |
| High School Diploma | 23 (5.8%) | 32.0 |
| College or Associate's Degree | 200 (50.8%) | 94.0 |
| Bachelor's Degree | 66 (16.8%) | 33.0 |
| Graduate Degree | 96 (24.4%) | 86.0 |
| Total | 394 (100.0%) | 57.0 |
Fertility by Education by Marriage Status in Oakville
2.5% of women with births in Oakville are unmarried. Women with the educational attainment of less than high school are most likely to be married with 100.0% of them married at childbirth, while women with the educational attainment of graduate degree are least likely to be married with 10.4% of them unmarried at childbirth.
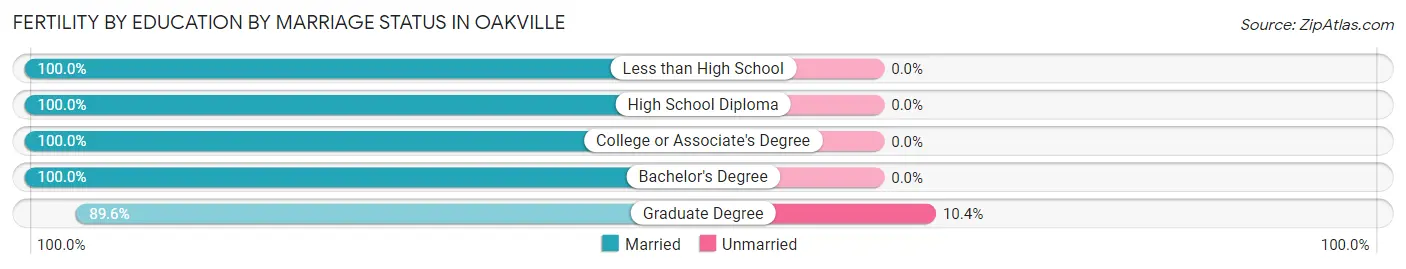
| Educational Attainment | Married | Unmarried |
| Less than High School | 9 (100.0%) | 0 (0.0%) |
| High School Diploma | 23 (100.0%) | 0 (0.0%) |
| College or Associate's Degree | 200 (100.0%) | 0 (0.0%) |
| Bachelor's Degree | 66 (100.0%) | 0 (0.0%) |
| Graduate Degree | 86 (89.6%) | 10 (10.4%) |
| Total | 384 (97.5%) | 10 (2.5%) |
Employment Characteristics in Oakville
Employment by Class of Employer in Oakville
Among the 18,166 employed individuals in Oakville, private company employees (12,042 | 66.3%), not-for-profit organizations (2,813 | 15.5%), and self-employed (not incorporated) (1,082 | 6.0%) make up the most common classes of employment.
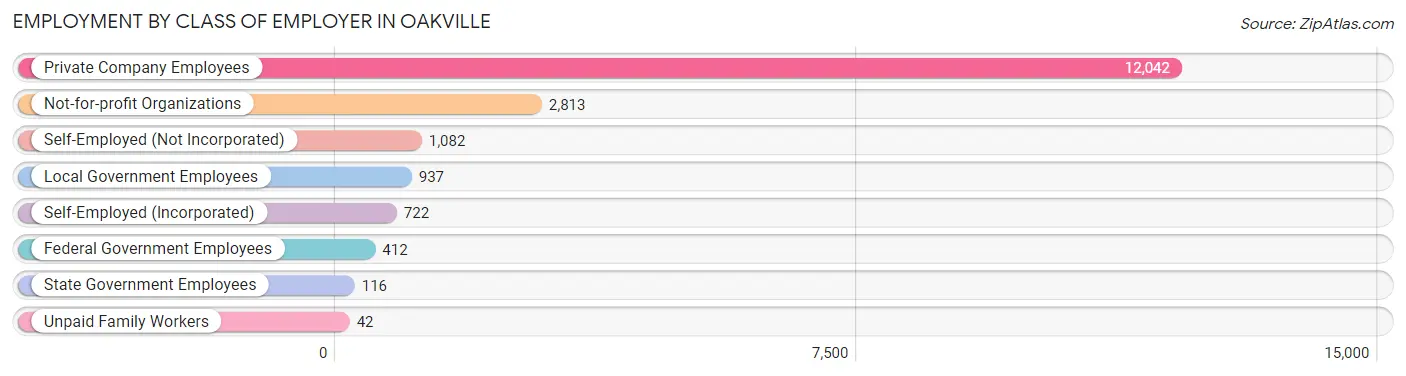
| Employer Class | # Employees | % Employees |
| Private Company Employees | 12,042 | 66.3% |
| Self-Employed (Incorporated) | 722 | 4.0% |
| Self-Employed (Not Incorporated) | 1,082 | 6.0% |
| Not-for-profit Organizations | 2,813 | 15.5% |
| Local Government Employees | 937 | 5.2% |
| State Government Employees | 116 | 0.6% |
| Federal Government Employees | 412 | 2.3% |
| Unpaid Family Workers | 42 | 0.2% |
| Total | 18,166 | 100.0% |
Employment Status by Age in Oakville
According to the labor force statistics for Oakville, out of the total population over 16 years of age (29,195), 65.3% or 19,064 individuals are in the labor force, with 3.9% or 743 of them unemployed. The age group with the highest labor force participation rate is 35 to 44 years, with 90.9% or 3,467 individuals in the labor force. Within the labor force, the 75 years and over age range has the highest percentage of unemployed individuals, with 8.6% or 19 of them being unemployed.
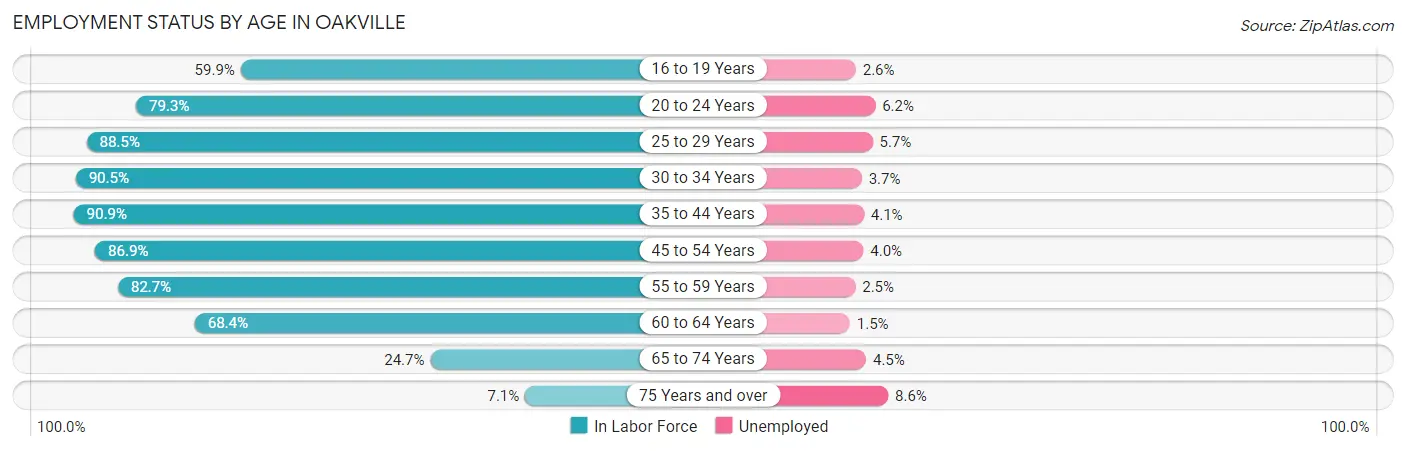
| Age Bracket | In Labor Force | Unemployed |
| 16 to 19 Years | 1,152 (59.9%) | 30 (2.6%) |
| 20 to 24 Years | 1,616 (79.3%) | 100 (6.2%) |
| 25 to 29 Years | 1,379 (88.5%) | 79 (5.7%) |
| 30 to 34 Years | 1,559 (90.5%) | 58 (3.7%) |
| 35 to 44 Years | 3,467 (90.9%) | 142 (4.1%) |
| 45 to 54 Years | 4,269 (86.9%) | 171 (4.0%) |
| 55 to 59 Years | 2,425 (82.7%) | 61 (2.5%) |
| 60 to 64 Years | 1,886 (68.4%) | 28 (1.5%) |
| 65 to 74 Years | 1,091 (24.7%) | 49 (4.5%) |
| 75 Years and over | 222 (7.1%) | 19 (8.6%) |
| Total | 19,064 (65.3%) | 743 (3.9%) |
Employment Status by Educational Attainment in Oakville
According to labor force statistics for Oakville, 84.7% of individuals (14,990) out of the total population between 25 and 64 years of age (17,698) are in the labor force, with 3.6% or 540 of them being unemployed. The group with the highest labor force participation rate are those with the educational attainment of bachelor's degree or higher, with 88.8% or 7,581 individuals in the labor force. Within the labor force, individuals with high school diploma education have the highest percentage of unemployment, with 6.0% or 149 of them being unemployed.
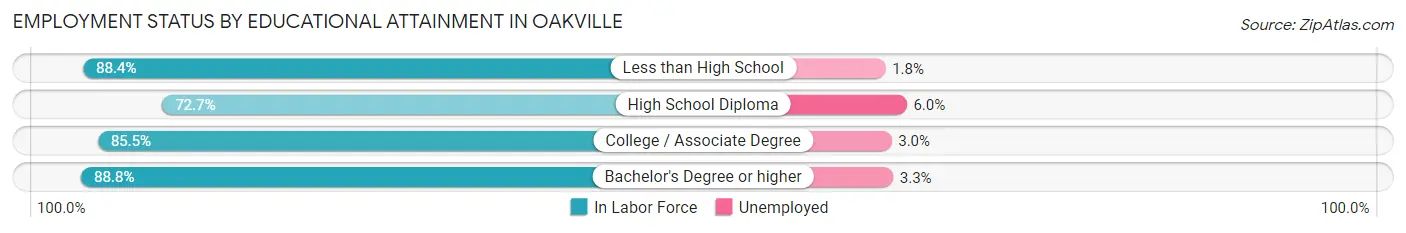
| Educational Attainment | In Labor Force | Unemployed |
| Less than High School | 503 (88.4%) | 10 (1.8%) |
| High School Diploma | 2,483 (72.7%) | 205 (6.0%) |
| College / Associate Degree | 4,426 (85.5%) | 155 (3.0%) |
| Bachelor's Degree or higher | 7,581 (88.8%) | 282 (3.3%) |
| Total | 14,990 (84.7%) | 637 (3.6%) |
Employment Occupations by Sex in Oakville
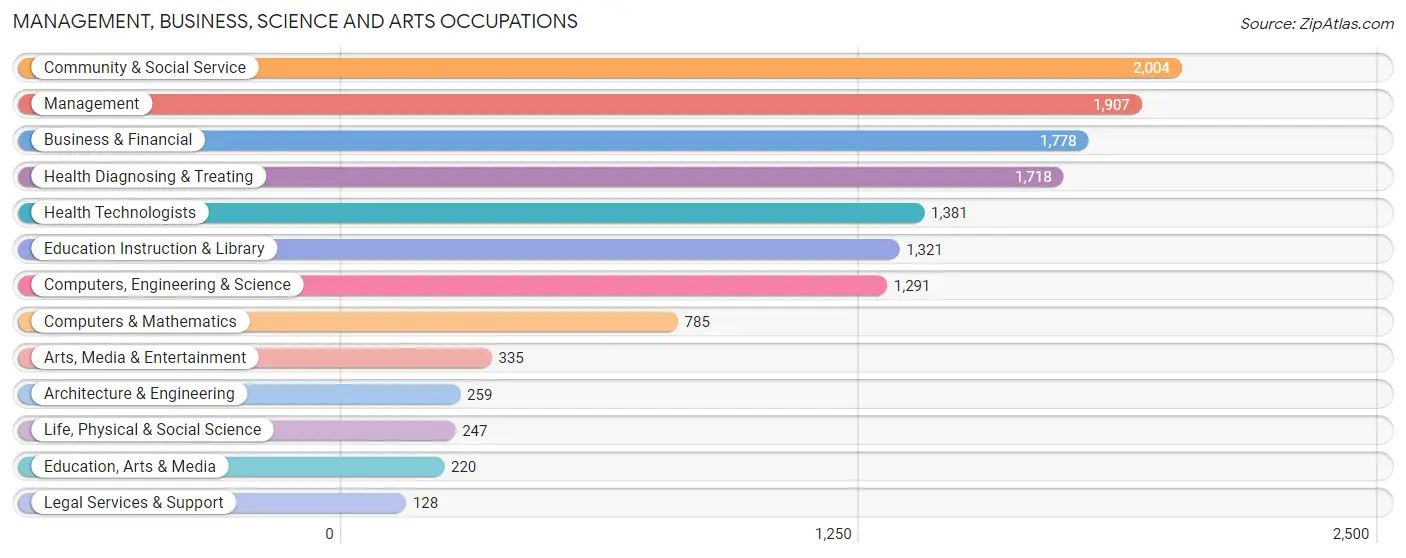
Management, Business, Science and Arts Occupations
The most common Management, Business, Science and Arts occupations in Oakville are Community & Social Service (2,004 | 10.9%), Management (1,907 | 10.4%), Business & Financial (1,778 | 9.7%), Health Diagnosing & Treating (1,718 | 9.4%), and Health Technologists (1,381 | 7.5%).
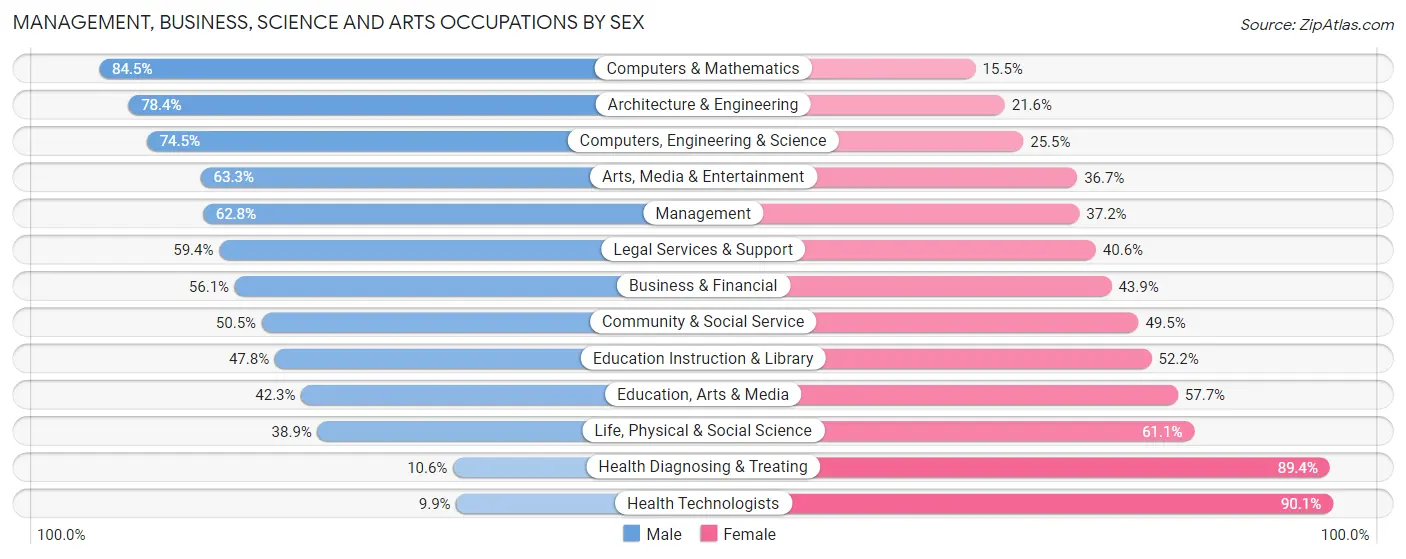
Management, Business, Science and Arts Occupations by Sex
Within the Management, Business, Science and Arts occupations in Oakville, the most male-oriented occupations are Computers & Mathematics (84.5%), Architecture & Engineering (78.4%), and Computers, Engineering & Science (74.5%), while the most female-oriented occupations are Health Technologists (90.1%), Health Diagnosing & Treating (89.4%), and Life, Physical & Social Science (61.1%).
| Occupation | Male | Female |
| Management | 1,198 (62.8%) | 709 (37.2%) |
| Business & Financial | 998 (56.1%) | 780 (43.9%) |
| Computers, Engineering & Science | 962 (74.5%) | 329 (25.5%) |
| Computers & Mathematics | 663 (84.5%) | 122 (15.5%) |
| Architecture & Engineering | 203 (78.4%) | 56 (21.6%) |
| Life, Physical & Social Science | 96 (38.9%) | 151 (61.1%) |
| Community & Social Service | 1,012 (50.5%) | 992 (49.5%) |
| Education, Arts & Media | 93 (42.3%) | 127 (57.7%) |
| Legal Services & Support | 76 (59.4%) | 52 (40.6%) |
| Education Instruction & Library | 631 (47.8%) | 690 (52.2%) |
| Arts, Media & Entertainment | 212 (63.3%) | 123 (36.7%) |
| Health Diagnosing & Treating | 182 (10.6%) | 1,536 (89.4%) |
| Health Technologists | 137 (9.9%) | 1,244 (90.1%) |
| Total (Category) | 4,352 (50.0%) | 4,346 (50.0%) |
| Total (Overall) | 9,384 (51.2%) | 8,933 (48.8%) |
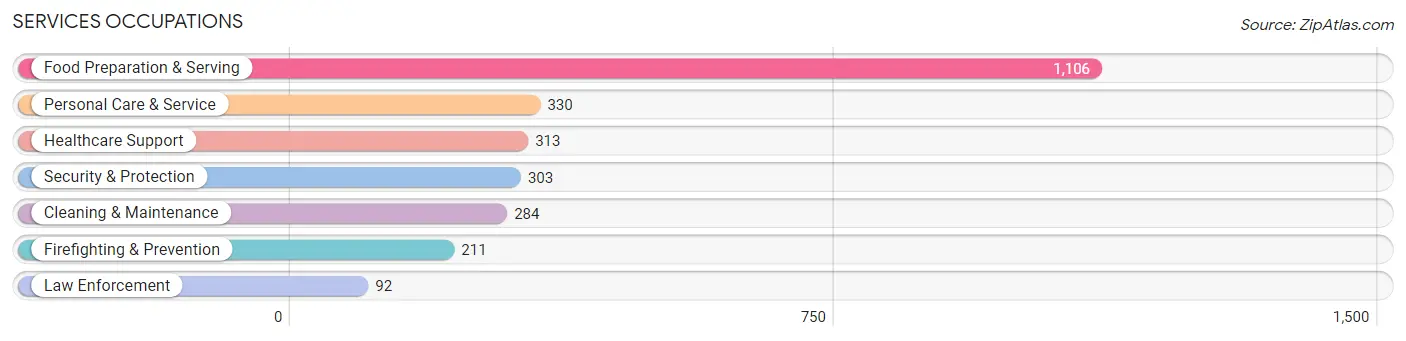
Services Occupations
The most common Services occupations in Oakville are Food Preparation & Serving (1,106 | 6.0%), Personal Care & Service (330 | 1.8%), Healthcare Support (313 | 1.7%), Security & Protection (303 | 1.7%), and Cleaning & Maintenance (284 | 1.5%).
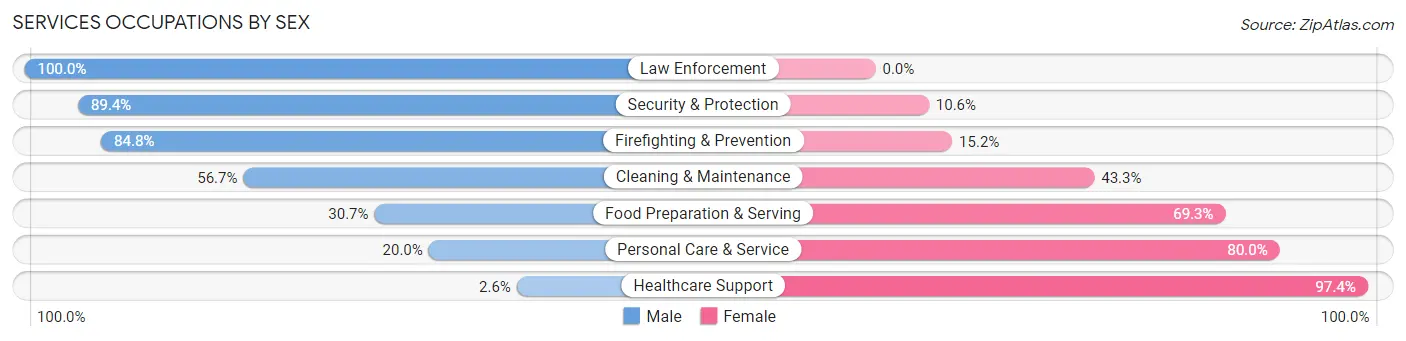
Services Occupations by Sex
Within the Services occupations in Oakville, the most male-oriented occupations are Law Enforcement (100.0%), Security & Protection (89.4%), and Firefighting & Prevention (84.8%), while the most female-oriented occupations are Healthcare Support (97.4%), Personal Care & Service (80.0%), and Food Preparation & Serving (69.3%).
| Occupation | Male | Female |
| Healthcare Support | 8 (2.6%) | 305 (97.4%) |
| Security & Protection | 271 (89.4%) | 32 (10.6%) |
| Firefighting & Prevention | 179 (84.8%) | 32 (15.2%) |
| Law Enforcement | 92 (100.0%) | 0 (0.0%) |
| Food Preparation & Serving | 340 (30.7%) | 766 (69.3%) |
| Cleaning & Maintenance | 161 (56.7%) | 123 (43.3%) |
| Personal Care & Service | 66 (20.0%) | 264 (80.0%) |
| Total (Category) | 846 (36.2%) | 1,490 (63.8%) |
| Total (Overall) | 9,384 (51.2%) | 8,933 (48.8%) |
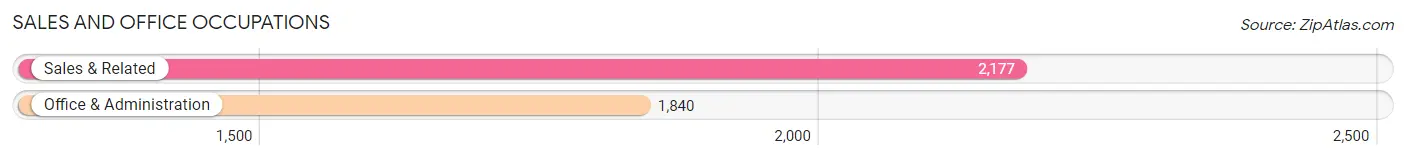
Sales and Office Occupations
The most common Sales and Office occupations in Oakville are Sales & Related (2,177 | 11.9%), and Office & Administration (1,840 | 10.1%).
Sales and Office Occupations by Sex

| Occupation | Male | Female |
| Sales & Related | 871 (40.0%) | 1,306 (60.0%) |
| Office & Administration | 322 (17.5%) | 1,518 (82.5%) |
| Total (Category) | 1,193 (29.7%) | 2,824 (70.3%) |
| Total (Overall) | 9,384 (51.2%) | 8,933 (48.8%) |
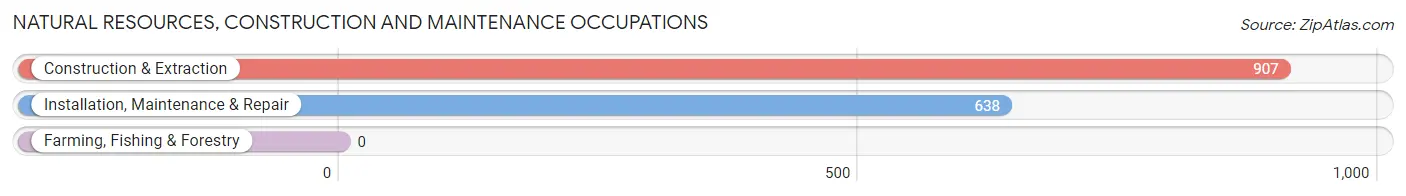
Natural Resources, Construction and Maintenance Occupations
The most common Natural Resources, Construction and Maintenance occupations in Oakville are Construction & Extraction (907 | 5.0%), and Installation, Maintenance & Repair (638 | 3.5%).
Natural Resources, Construction and Maintenance Occupations by Sex
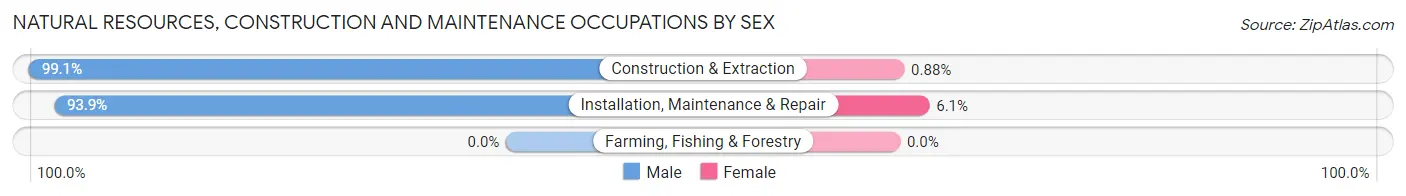
| Occupation | Male | Female |
| Farming, Fishing & Forestry | 0 (0.0%) | 0 (0.0%) |
| Construction & Extraction | 899 (99.1%) | 8 (0.9%) |
| Installation, Maintenance & Repair | 599 (93.9%) | 39 (6.1%) |
| Total (Category) | 1,498 (97.0%) | 47 (3.0%) |
| Total (Overall) | 9,384 (51.2%) | 8,933 (48.8%) |
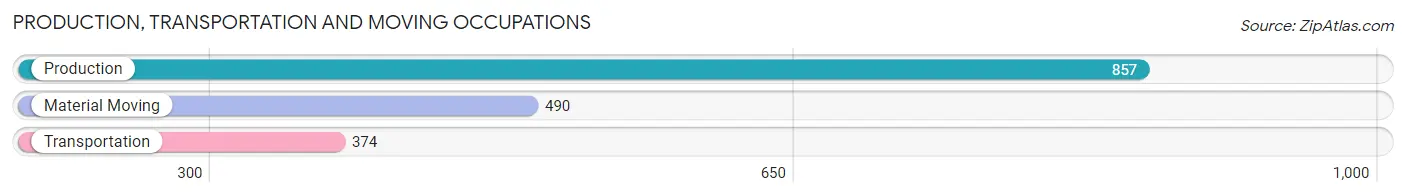
Production, Transportation and Moving Occupations
The most common Production, Transportation and Moving occupations in Oakville are Production (857 | 4.7%), Material Moving (490 | 2.7%), and Transportation (374 | 2.0%).
Production, Transportation and Moving Occupations by Sex
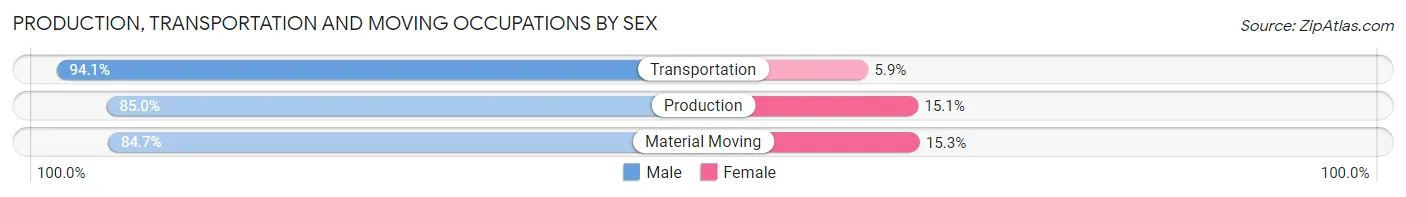
| Occupation | Male | Female |
| Production | 728 (85.0%) | 129 (15.0%) |
| Transportation | 352 (94.1%) | 22 (5.9%) |
| Material Moving | 415 (84.7%) | 75 (15.3%) |
| Total (Category) | 1,495 (86.9%) | 226 (13.1%) |
| Total (Overall) | 9,384 (51.2%) | 8,933 (48.8%) |
Employment Industries by Sex in Oakville
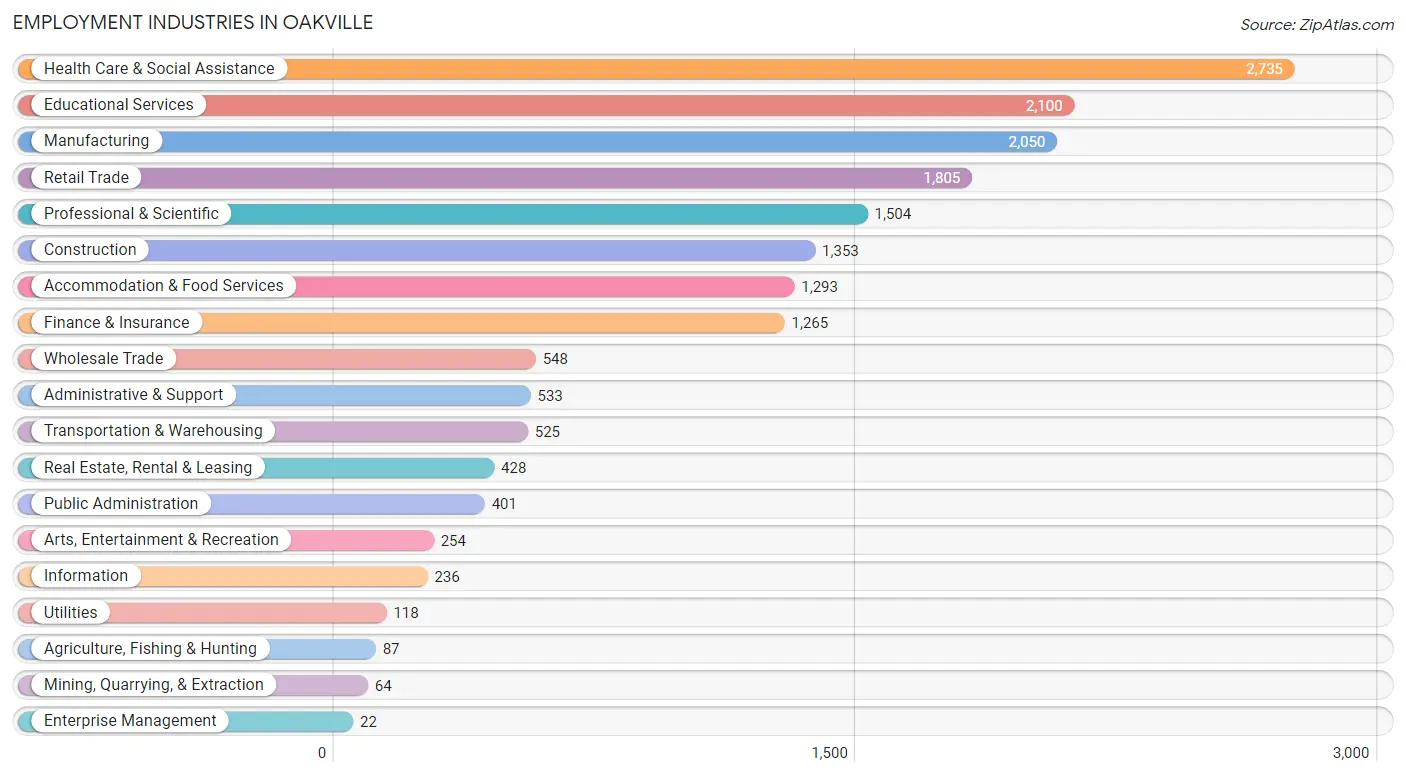
Employment Industries in Oakville
The major employment industries in Oakville include Health Care & Social Assistance (2,735 | 14.9%), Educational Services (2,100 | 11.5%), Manufacturing (2,050 | 11.2%), Retail Trade (1,805 | 9.9%), and Professional & Scientific (1,504 | 8.2%).
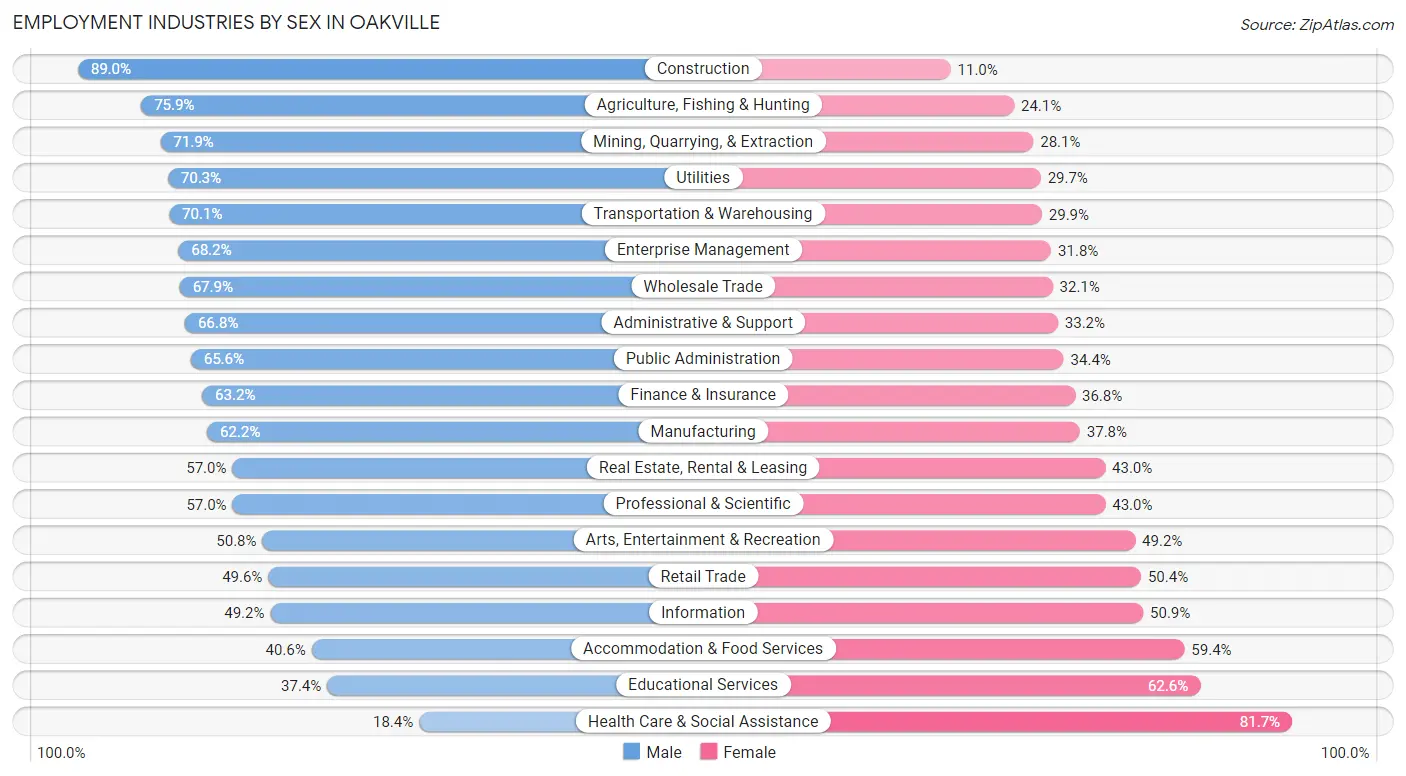
Employment Industries by Sex in Oakville
The Oakville industries that see more men than women are Construction (89.0%), Agriculture, Fishing & Hunting (75.9%), and Mining, Quarrying, & Extraction (71.9%), whereas the industries that tend to have a higher number of women are Health Care & Social Assistance (81.7%), Educational Services (62.6%), and Accommodation & Food Services (59.4%).
| Industry | Male | Female |
| Agriculture, Fishing & Hunting | 66 (75.9%) | 21 (24.1%) |
| Mining, Quarrying, & Extraction | 46 (71.9%) | 18 (28.1%) |
| Construction | 1,204 (89.0%) | 149 (11.0%) |
| Manufacturing | 1,276 (62.2%) | 774 (37.8%) |
| Wholesale Trade | 372 (67.9%) | 176 (32.1%) |
| Retail Trade | 895 (49.6%) | 910 (50.4%) |
| Transportation & Warehousing | 368 (70.1%) | 157 (29.9%) |
| Utilities | 83 (70.3%) | 35 (29.7%) |
| Information | 116 (49.1%) | 120 (50.8%) |
| Finance & Insurance | 800 (63.2%) | 465 (36.8%) |
| Real Estate, Rental & Leasing | 244 (57.0%) | 184 (43.0%) |
| Professional & Scientific | 857 (57.0%) | 647 (43.0%) |
| Enterprise Management | 15 (68.2%) | 7 (31.8%) |
| Administrative & Support | 356 (66.8%) | 177 (33.2%) |
| Educational Services | 785 (37.4%) | 1,315 (62.6%) |
| Health Care & Social Assistance | 502 (18.3%) | 2,233 (81.7%) |
| Arts, Entertainment & Recreation | 129 (50.8%) | 125 (49.2%) |
| Accommodation & Food Services | 525 (40.6%) | 768 (59.4%) |
| Public Administration | 263 (65.6%) | 138 (34.4%) |
| Total | 9,384 (51.2%) | 8,933 (48.8%) |
Education in Oakville
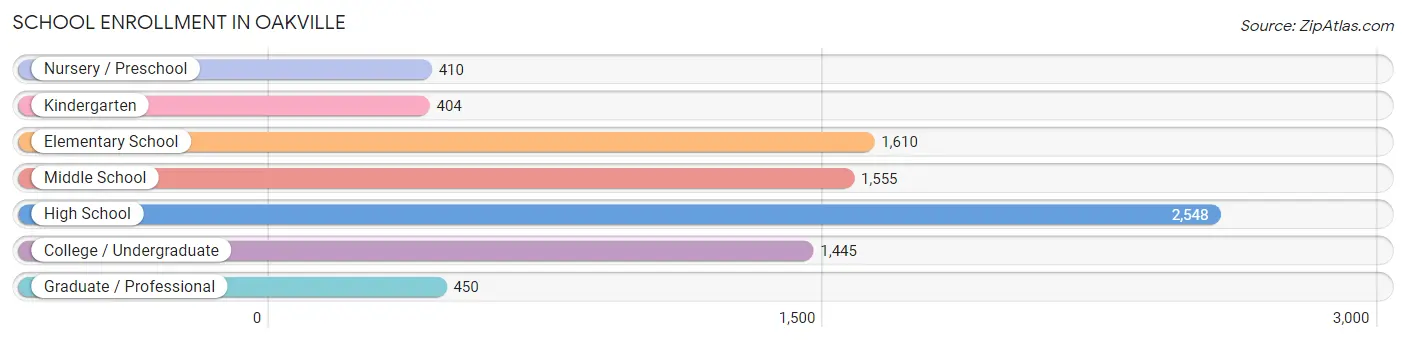
School Enrollment in Oakville
The most common levels of schooling among the 8,422 students in Oakville are high school (2,548 | 30.2%), elementary school (1,610 | 19.1%), and middle school (1,555 | 18.5%).
| School Level | # Students | % Students |
| Nursery / Preschool | 410 | 4.9% |
| Kindergarten | 404 | 4.8% |
| Elementary School | 1,610 | 19.1% |
| Middle School | 1,555 | 18.5% |
| High School | 2,548 | 30.2% |
| College / Undergraduate | 1,445 | 17.2% |
| Graduate / Professional | 450 | 5.3% |
| Total | 8,422 | 100.0% |
School Enrollment by Age by Funding Source in Oakville
Out of a total of 8,422 students who are enrolled in schools in Oakville, 2,122 (25.2%) attend a private institution, while the remaining 6,300 (74.8%) are enrolled in public schools. The age group of 25 to 34 year olds has the highest likelihood of being enrolled in private schools, with 189 (52.6% in the age bracket) enrolled. Conversely, the age group of 18 to 19 year olds has the lowest likelihood of being enrolled in a private school, with 1,080 (88.5% in the age bracket) attending a public institution.
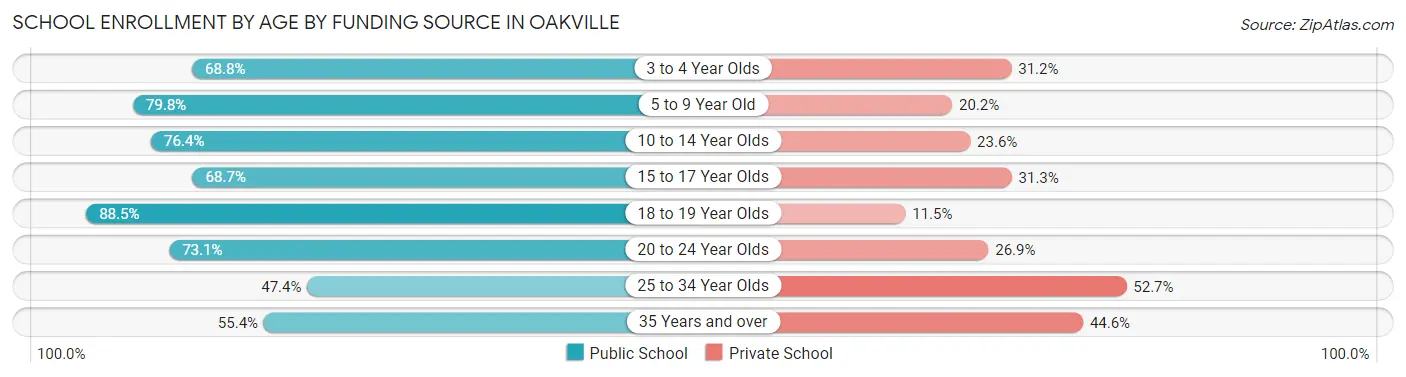
| Age Bracket | Public School | Private School |
| 3 to 4 Year Olds | 260 (68.8%) | 118 (31.2%) |
| 5 to 9 Year Old | 1,353 (79.8%) | 342 (20.2%) |
| 10 to 14 Year Olds | 1,642 (76.4%) | 506 (23.6%) |
| 15 to 17 Year Olds | 947 (68.7%) | 431 (31.3%) |
| 18 to 19 Year Olds | 1,080 (88.5%) | 140 (11.5%) |
| 20 to 24 Year Olds | 640 (73.1%) | 236 (26.9%) |
| 25 to 34 Year Olds | 170 (47.3%) | 189 (52.6%) |
| 35 Years and over | 204 (55.4%) | 164 (44.6%) |
| Total | 6,300 (74.8%) | 2,122 (25.2%) |
Educational Attainment by Field of Study in Oakville
Business (3,236 | 27.8%), education (1,400 | 12.0%), science & technology (1,303 | 11.2%), bio, nature & agricultural (733 | 6.3%), and arts & humanities (689 | 5.9%) are the most common fields of study among 11,630 individuals in Oakville who have obtained a bachelor's degree or higher.
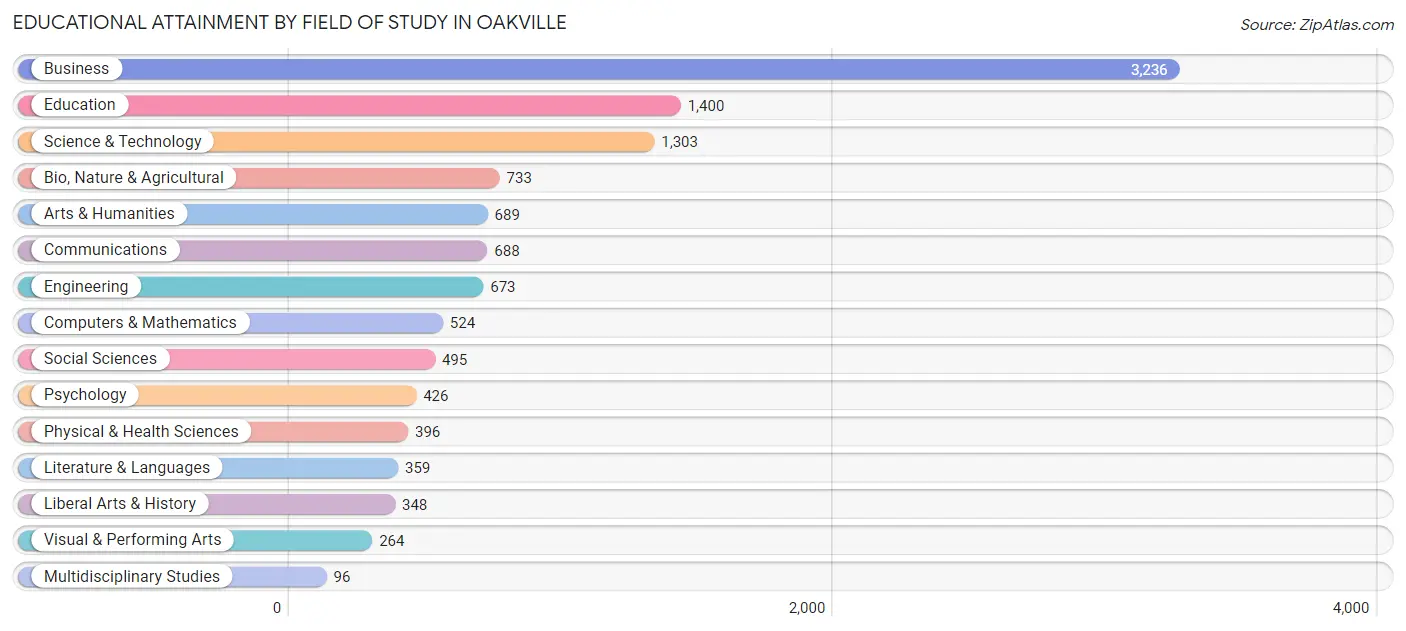
| Field of Study | # Graduates | % Graduates |
| Computers & Mathematics | 524 | 4.5% |
| Bio, Nature & Agricultural | 733 | 6.3% |
| Physical & Health Sciences | 396 | 3.4% |
| Psychology | 426 | 3.7% |
| Social Sciences | 495 | 4.3% |
| Engineering | 673 | 5.8% |
| Multidisciplinary Studies | 96 | 0.8% |
| Science & Technology | 1,303 | 11.2% |
| Business | 3,236 | 27.8% |
| Education | 1,400 | 12.0% |
| Literature & Languages | 359 | 3.1% |
| Liberal Arts & History | 348 | 3.0% |
| Visual & Performing Arts | 264 | 2.3% |
| Communications | 688 | 5.9% |
| Arts & Humanities | 689 | 5.9% |
| Total | 11,630 | 100.0% |
Transportation & Commute in Oakville
Vehicle Availability by Sex in Oakville
The most prevalent vehicle ownership categories in Oakville are males with 2 vehicles (3,962, accounting for 42.3%) and females with 2 vehicles (4,040, making up 45.0%).
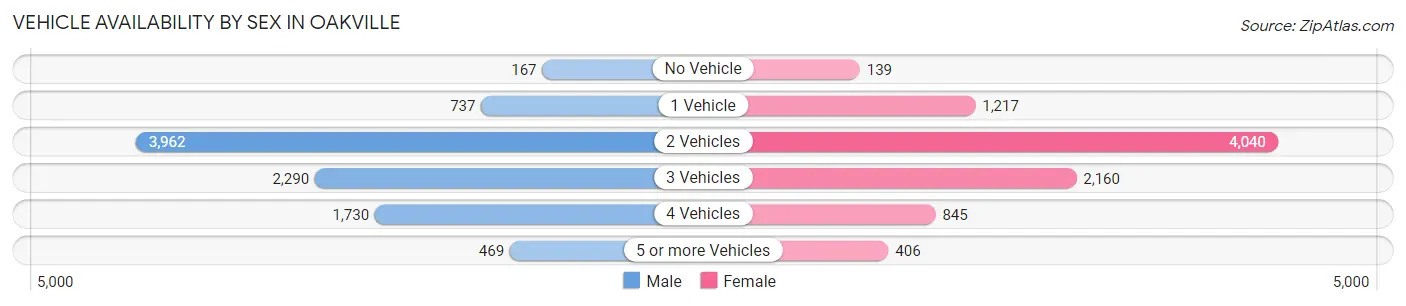
| Vehicles Available | Male | Female |
| No Vehicle | 167 (1.8%) | 139 (1.6%) |
| 1 Vehicle | 737 (7.9%) | 1,217 (13.8%) |
| 2 Vehicles | 3,962 (42.3%) | 4,040 (45.9%) |
| 3 Vehicles | 2,290 (24.5%) | 2,160 (24.5%) |
| 4 Vehicles | 1,730 (18.5%) | 845 (9.6%) |
| 5 or more Vehicles | 469 (5.0%) | 406 (4.6%) |
| Total | 9,355 (100.0%) | 8,807 (100.0%) |
Commute Time in Oakville
The most frequently occuring commute durations in Oakville are 30 to 34 minutes (3,959 commuters, 25.7%), 20 to 24 minutes (2,151 commuters, 14.0%), and 45 to 59 minutes (1,748 commuters, 11.3%).
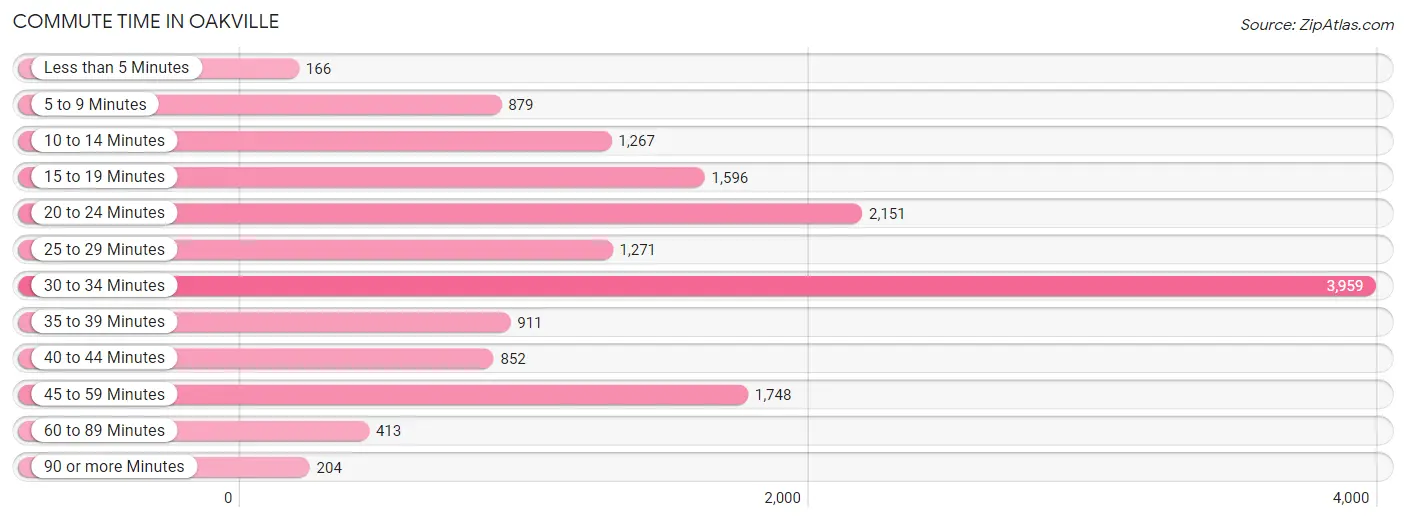
| Commute Time | # Commuters | % Commuters |
| Less than 5 Minutes | 166 | 1.1% |
| 5 to 9 Minutes | 879 | 5.7% |
| 10 to 14 Minutes | 1,267 | 8.2% |
| 15 to 19 Minutes | 1,596 | 10.3% |
| 20 to 24 Minutes | 2,151 | 14.0% |
| 25 to 29 Minutes | 1,271 | 8.2% |
| 30 to 34 Minutes | 3,959 | 25.7% |
| 35 to 39 Minutes | 911 | 5.9% |
| 40 to 44 Minutes | 852 | 5.5% |
| 45 to 59 Minutes | 1,748 | 11.3% |
| 60 to 89 Minutes | 413 | 2.7% |
| 90 or more Minutes | 204 | 1.3% |
Commute Time by Sex in Oakville
The most common commute times in Oakville are 30 to 34 minutes (2,076 commuters, 26.2%) for males and 30 to 34 minutes (1,883 commuters, 25.1%) for females.
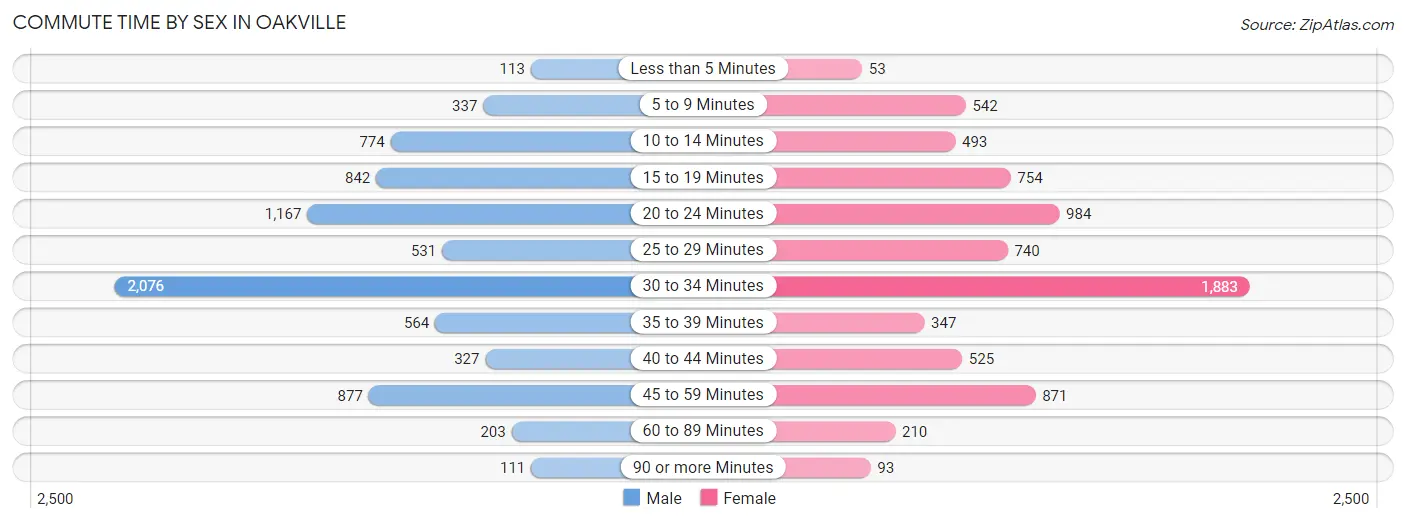
| Commute Time | Male | Female |
| Less than 5 Minutes | 113 (1.4%) | 53 (0.7%) |
| 5 to 9 Minutes | 337 (4.3%) | 542 (7.2%) |
| 10 to 14 Minutes | 774 (9.8%) | 493 (6.6%) |
| 15 to 19 Minutes | 842 (10.6%) | 754 (10.1%) |
| 20 to 24 Minutes | 1,167 (14.7%) | 984 (13.1%) |
| 25 to 29 Minutes | 531 (6.7%) | 740 (9.9%) |
| 30 to 34 Minutes | 2,076 (26.2%) | 1,883 (25.1%) |
| 35 to 39 Minutes | 564 (7.1%) | 347 (4.6%) |
| 40 to 44 Minutes | 327 (4.1%) | 525 (7.0%) |
| 45 to 59 Minutes | 877 (11.1%) | 871 (11.6%) |
| 60 to 89 Minutes | 203 (2.6%) | 210 (2.8%) |
| 90 or more Minutes | 111 (1.4%) | 93 (1.2%) |
Time of Departure to Work by Sex in Oakville
The most frequent times of departure to work in Oakville are 6:00 AM to 6:29 AM (1,160, 14.6%) for males and 7:00 AM to 7:29 AM (1,145, 15.3%) for females.
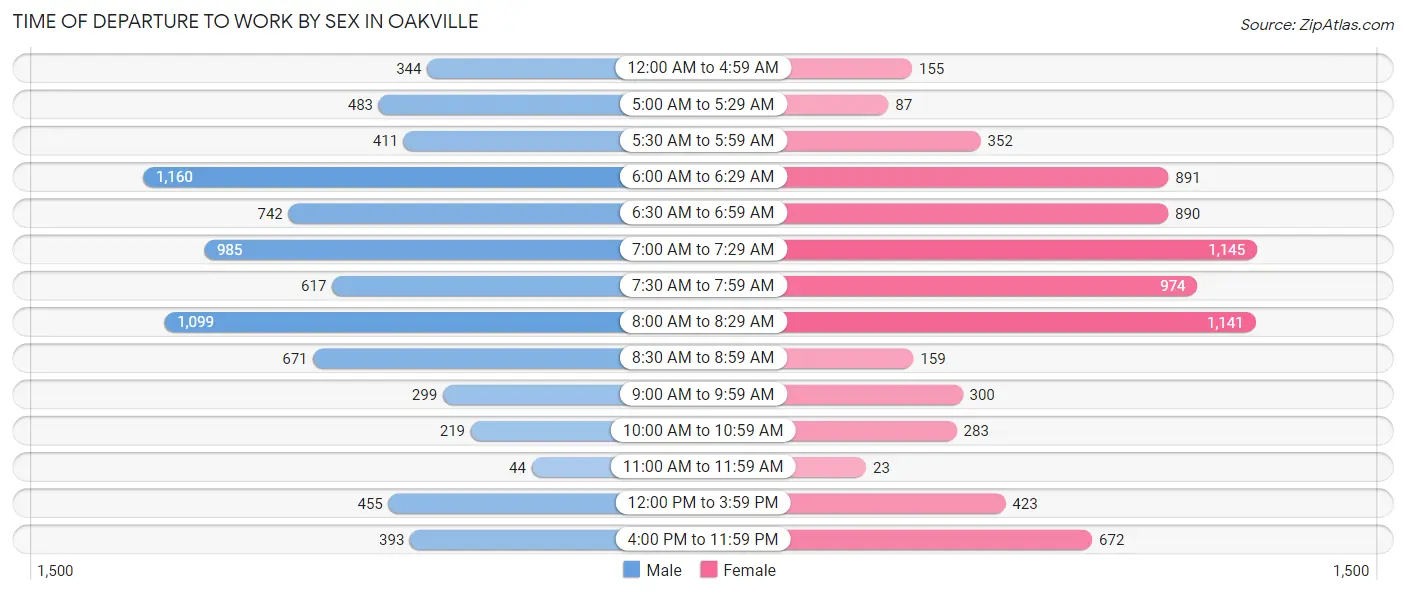
| Time of Departure | Male | Female |
| 12:00 AM to 4:59 AM | 344 (4.3%) | 155 (2.1%) |
| 5:00 AM to 5:29 AM | 483 (6.1%) | 87 (1.2%) |
| 5:30 AM to 5:59 AM | 411 (5.2%) | 352 (4.7%) |
| 6:00 AM to 6:29 AM | 1,160 (14.6%) | 891 (11.9%) |
| 6:30 AM to 6:59 AM | 742 (9.4%) | 890 (11.9%) |
| 7:00 AM to 7:29 AM | 985 (12.4%) | 1,145 (15.3%) |
| 7:30 AM to 7:59 AM | 617 (7.8%) | 974 (13.0%) |
| 8:00 AM to 8:29 AM | 1,099 (13.9%) | 1,141 (15.2%) |
| 8:30 AM to 8:59 AM | 671 (8.5%) | 159 (2.1%) |
| 9:00 AM to 9:59 AM | 299 (3.8%) | 300 (4.0%) |
| 10:00 AM to 10:59 AM | 219 (2.8%) | 283 (3.8%) |
| 11:00 AM to 11:59 AM | 44 (0.6%) | 23 (0.3%) |
| 12:00 PM to 3:59 PM | 455 (5.7%) | 423 (5.6%) |
| 4:00 PM to 11:59 PM | 393 (5.0%) | 672 (9.0%) |
| Total | 7,922 (100.0%) | 7,495 (100.0%) |
Housing Occupancy in Oakville
Occupancy by Ownership in Oakville
Of the total 13,870 dwellings in Oakville, owner-occupied units account for 12,025 (86.7%), while renter-occupied units make up 1,845 (13.3%).
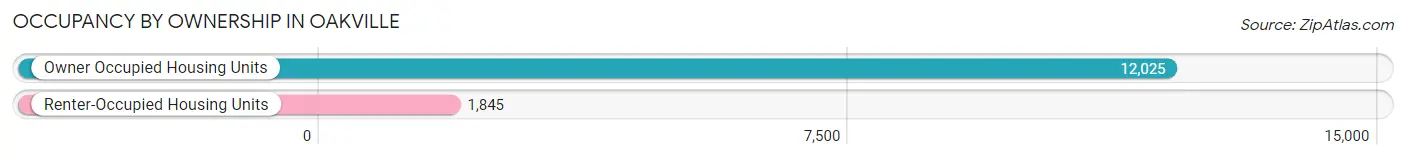
| Occupancy | # Housing Units | % Housing Units |
| Owner Occupied Housing Units | 12,025 | 86.7% |
| Renter-Occupied Housing Units | 1,845 | 13.3% |
| Total Occupied Housing Units | 13,870 | 100.0% |
Occupancy by Household Size in Oakville
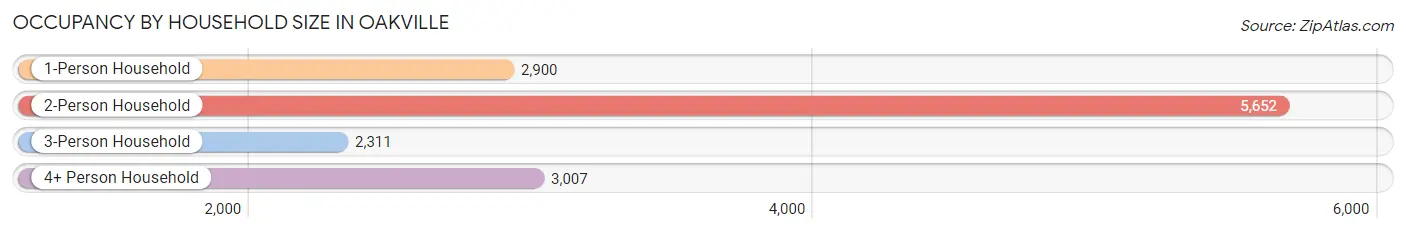
| Household Size | # Housing Units | % Housing Units |
| 1-Person Household | 2,900 | 20.9% |
| 2-Person Household | 5,652 | 40.7% |
| 3-Person Household | 2,311 | 16.7% |
| 4+ Person Household | 3,007 | 21.7% |
| Total Housing Units | 13,870 | 100.0% |
Occupancy by Ownership by Household Size in Oakville
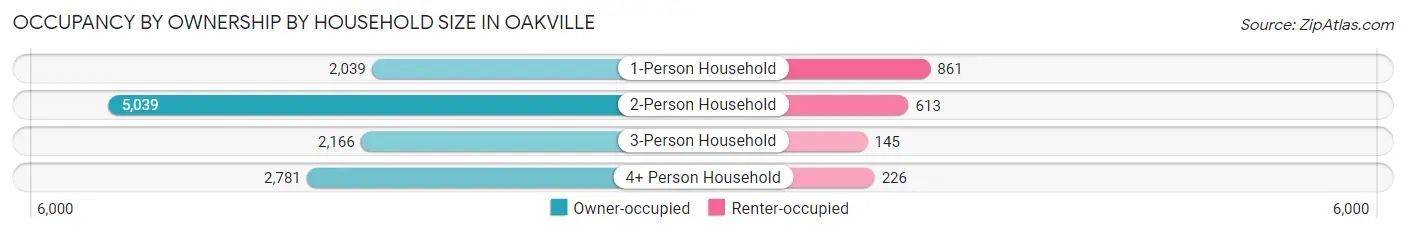
| Household Size | Owner-occupied | Renter-occupied |
| 1-Person Household | 2,039 (70.3%) | 861 (29.7%) |
| 2-Person Household | 5,039 (89.1%) | 613 (10.8%) |
| 3-Person Household | 2,166 (93.7%) | 145 (6.3%) |
| 4+ Person Household | 2,781 (92.5%) | 226 (7.5%) |
| Total Housing Units | 12,025 (86.7%) | 1,845 (13.3%) |
Occupancy by Educational Attainment in Oakville
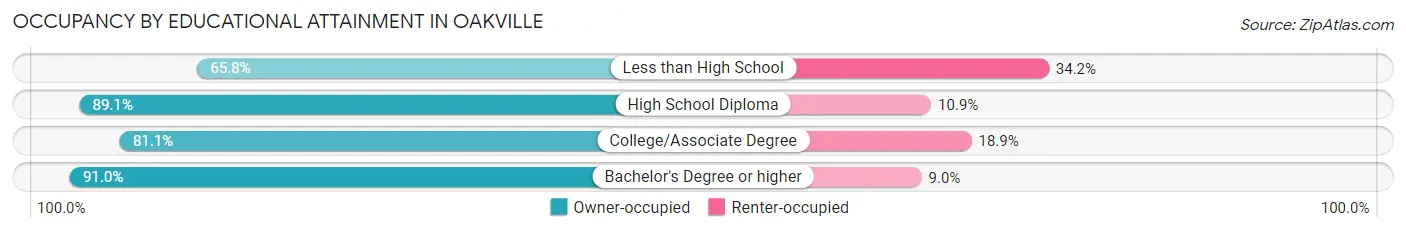
| Household Size | Owner-occupied | Renter-occupied |
| Less than High School | 361 (65.8%) | 188 (34.2%) |
| High School Diploma | 2,543 (89.1%) | 311 (10.9%) |
| College/Associate Degree | 3,302 (81.1%) | 770 (18.9%) |
| Bachelor's Degree or higher | 5,819 (91.0%) | 576 (9.0%) |
Occupancy by Age of Householder in Oakville
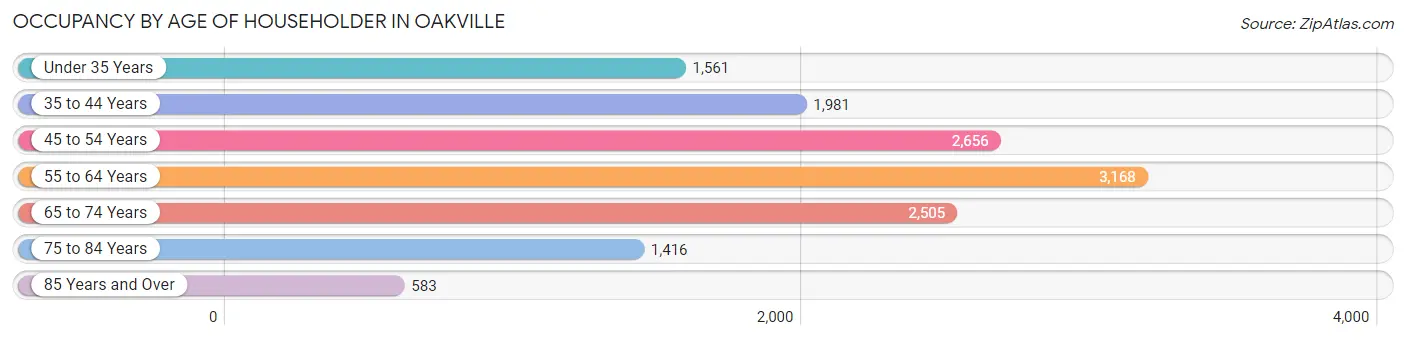
| Age Bracket | # Households | % Households |
| Under 35 Years | 1,561 | 11.3% |
| 35 to 44 Years | 1,981 | 14.3% |
| 45 to 54 Years | 2,656 | 19.2% |
| 55 to 64 Years | 3,168 | 22.8% |
| 65 to 74 Years | 2,505 | 18.1% |
| 75 to 84 Years | 1,416 | 10.2% |
| 85 Years and Over | 583 | 4.2% |
| Total | 13,870 | 100.0% |
Housing Finances in Oakville
Median Income by Occupancy in Oakville
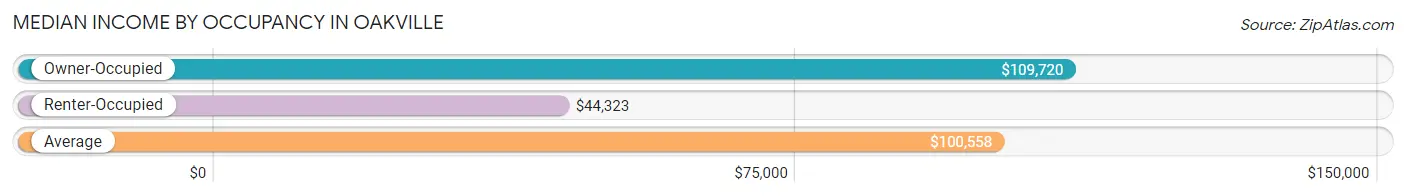
| Occupancy Type | # Households | Median Income |
| Owner-Occupied | 12,025 (86.7%) | $109,720 |
| Renter-Occupied | 1,845 (13.3%) | $44,323 |
| Average | 13,870 (100.0%) | $100,558 |
Occupancy by Householder Income Bracket in Oakville
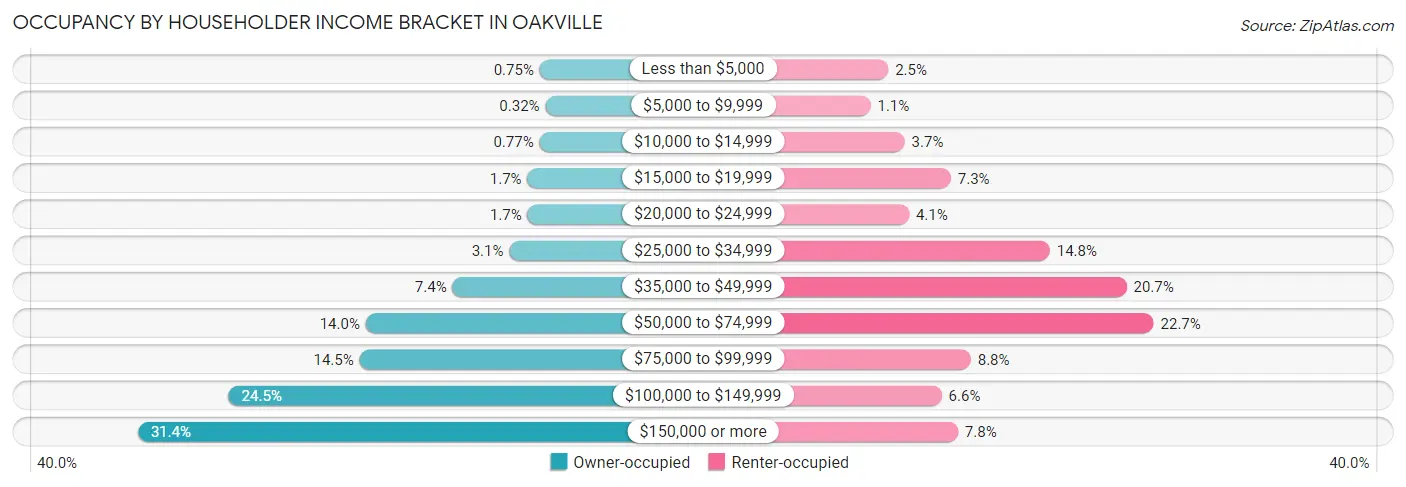
| Income Bracket | Owner-occupied | Renter-occupied |
| Less than $5,000 | 90 (0.7%) | 46 (2.5%) |
| $5,000 to $9,999 | 39 (0.3%) | 21 (1.1%) |
| $10,000 to $14,999 | 92 (0.8%) | 69 (3.7%) |
| $15,000 to $19,999 | 203 (1.7%) | 134 (7.3%) |
| $20,000 to $24,999 | 202 (1.7%) | 75 (4.1%) |
| $25,000 to $34,999 | 369 (3.1%) | 273 (14.8%) |
| $35,000 to $49,999 | 890 (7.4%) | 381 (20.6%) |
| $50,000 to $74,999 | 1,685 (14.0%) | 419 (22.7%) |
| $75,000 to $99,999 | 1,741 (14.5%) | 162 (8.8%) |
| $100,000 to $149,999 | 2,940 (24.4%) | 121 (6.6%) |
| $150,000 or more | 3,774 (31.4%) | 144 (7.8%) |
| Total | 12,025 (100.0%) | 1,845 (100.0%) |
Monthly Housing Cost Tiers in Oakville
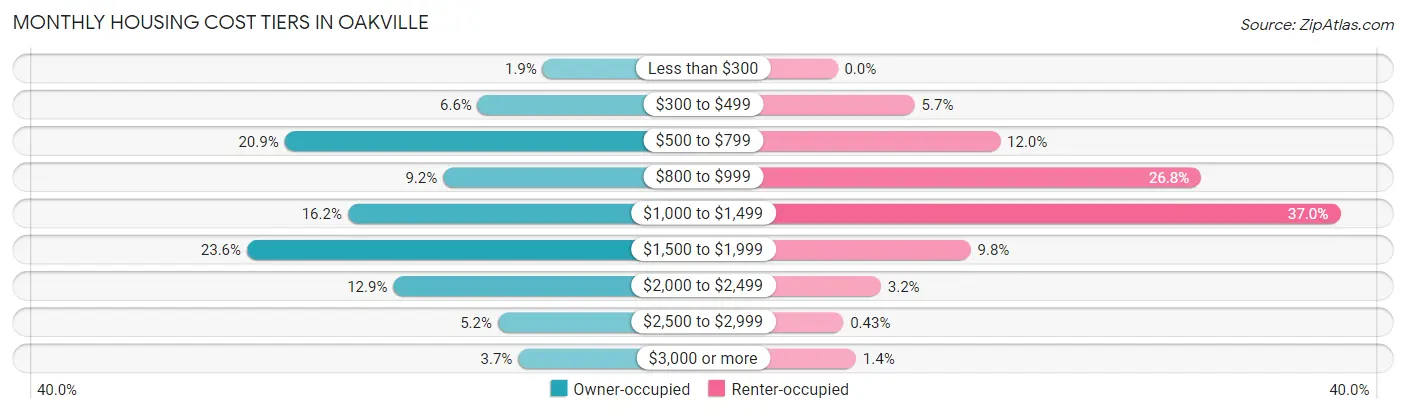
| Monthly Cost | Owner-occupied | Renter-occupied |
| Less than $300 | 222 (1.8%) | 0 (0.0%) |
| $300 to $499 | 797 (6.6%) | 105 (5.7%) |
| $500 to $799 | 2,509 (20.9%) | 221 (12.0%) |
| $800 to $999 | 1,104 (9.2%) | 494 (26.8%) |
| $1,000 to $1,499 | 1,948 (16.2%) | 683 (37.0%) |
| $1,500 to $1,999 | 2,842 (23.6%) | 181 (9.8%) |
| $2,000 to $2,499 | 1,545 (12.9%) | 59 (3.2%) |
| $2,500 to $2,999 | 619 (5.1%) | 8 (0.4%) |
| $3,000 or more | 439 (3.6%) | 25 (1.4%) |
| Total | 12,025 (100.0%) | 1,845 (100.0%) |
Physical Housing Characteristics in Oakville
Housing Structures in Oakville
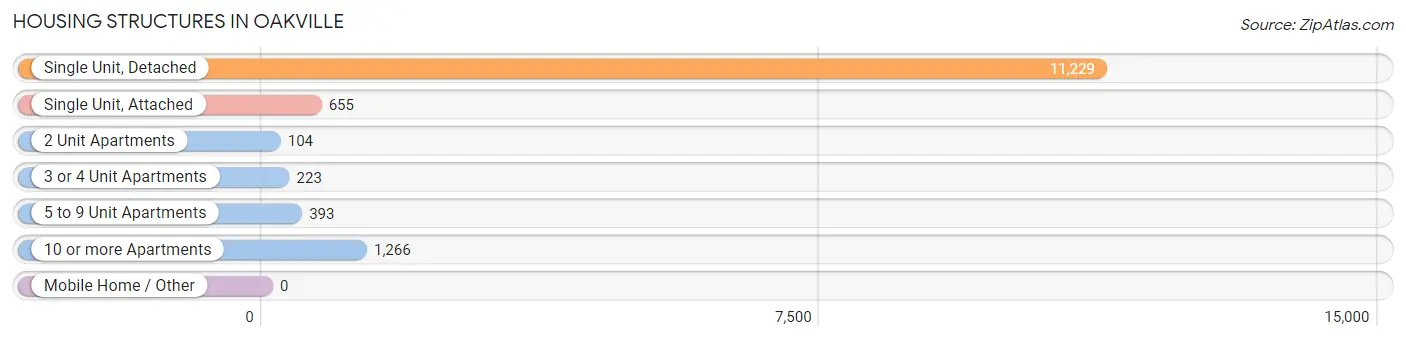
| Structure Type | # Housing Units | % Housing Units |
| Single Unit, Detached | 11,229 | 81.0% |
| Single Unit, Attached | 655 | 4.7% |
| 2 Unit Apartments | 104 | 0.7% |
| 3 or 4 Unit Apartments | 223 | 1.6% |
| 5 to 9 Unit Apartments | 393 | 2.8% |
| 10 or more Apartments | 1,266 | 9.1% |
| Mobile Home / Other | 0 | 0.0% |
| Total | 13,870 | 100.0% |
Housing Structures by Occupancy in Oakville
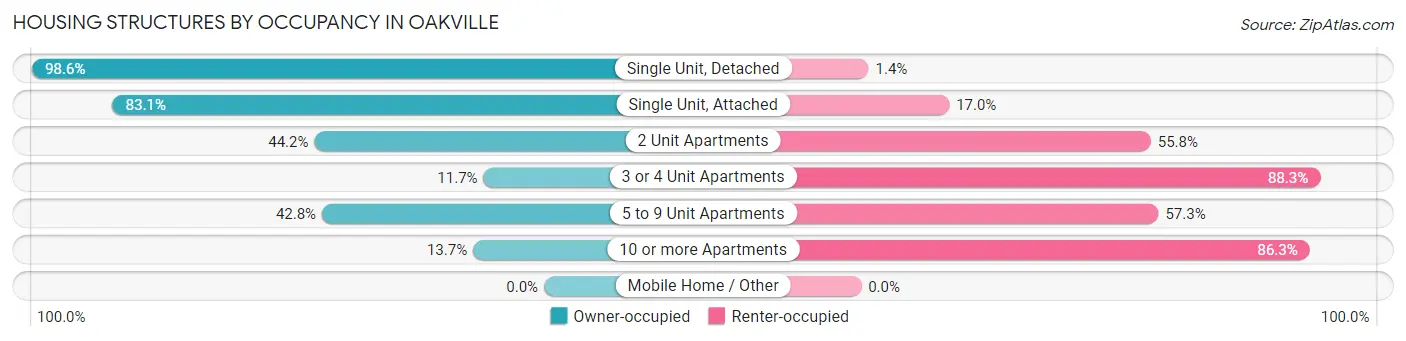
| Structure Type | Owner-occupied | Renter-occupied |
| Single Unit, Detached | 11,068 (98.6%) | 161 (1.4%) |
| Single Unit, Attached | 544 (83.1%) | 111 (17.0%) |
| 2 Unit Apartments | 46 (44.2%) | 58 (55.8%) |
| 3 or 4 Unit Apartments | 26 (11.7%) | 197 (88.3%) |
| 5 to 9 Unit Apartments | 168 (42.7%) | 225 (57.3%) |
| 10 or more Apartments | 173 (13.7%) | 1,093 (86.3%) |
| Mobile Home / Other | 0 (0.0%) | 0 (0.0%) |
| Total | 12,025 (86.7%) | 1,845 (13.3%) |
Housing Structures by Number of Rooms in Oakville
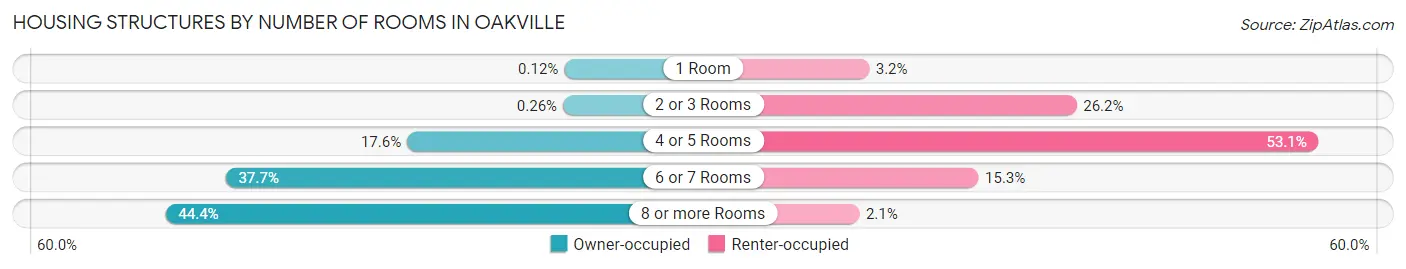
| Number of Rooms | Owner-occupied | Renter-occupied |
| 1 Room | 14 (0.1%) | 59 (3.2%) |
| 2 or 3 Rooms | 31 (0.3%) | 484 (26.2%) |
| 4 or 5 Rooms | 2,111 (17.6%) | 980 (53.1%) |
| 6 or 7 Rooms | 4,534 (37.7%) | 283 (15.3%) |
| 8 or more Rooms | 5,335 (44.4%) | 39 (2.1%) |
| Total | 12,025 (100.0%) | 1,845 (100.0%) |
Housing Structure by Heating Type in Oakville
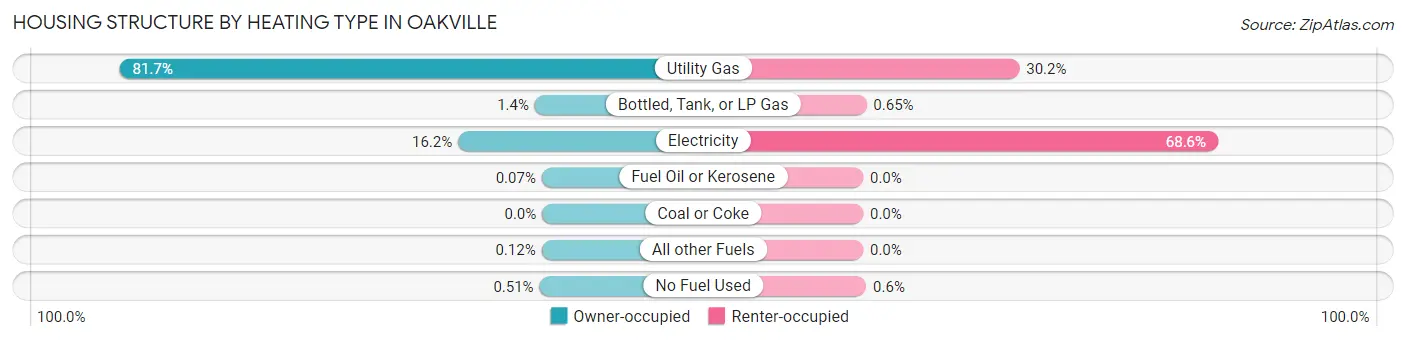
| Heating Type | Owner-occupied | Renter-occupied |
| Utility Gas | 9,818 (81.7%) | 557 (30.2%) |
| Bottled, Tank, or LP Gas | 170 (1.4%) | 12 (0.6%) |
| Electricity | 1,953 (16.2%) | 1,265 (68.6%) |
| Fuel Oil or Kerosene | 9 (0.1%) | 0 (0.0%) |
| Coal or Coke | 0 (0.0%) | 0 (0.0%) |
| All other Fuels | 14 (0.1%) | 0 (0.0%) |
| No Fuel Used | 61 (0.5%) | 11 (0.6%) |
| Total | 12,025 (100.0%) | 1,845 (100.0%) |
Household Vehicle Usage in Oakville
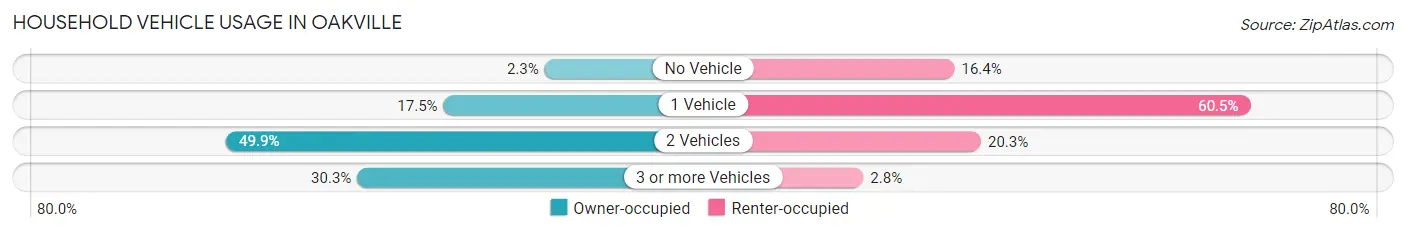
| Vehicles per Household | Owner-occupied | Renter-occupied |
| No Vehicle | 281 (2.3%) | 302 (16.4%) |
| 1 Vehicle | 2,098 (17.4%) | 1,117 (60.5%) |
| 2 Vehicles | 5,999 (49.9%) | 375 (20.3%) |
| 3 or more Vehicles | 3,647 (30.3%) | 51 (2.8%) |
| Total | 12,025 (100.0%) | 1,845 (100.0%) |
Real Estate & Mortgages in Oakville
Real Estate and Mortgage Overview in Oakville
| Characteristic | Without Mortgage | With Mortgage |
| Housing Units | 4,643 | 7,382 |
| Median Property Value | $282,300 | $276,400 |
| Median Household Income | $93,968 | $2,550 |
| Monthly Housing Costs | $663 | $425 |
| Real Estate Taxes | $3,226 | $104 |
Property Value by Mortgage Status in Oakville
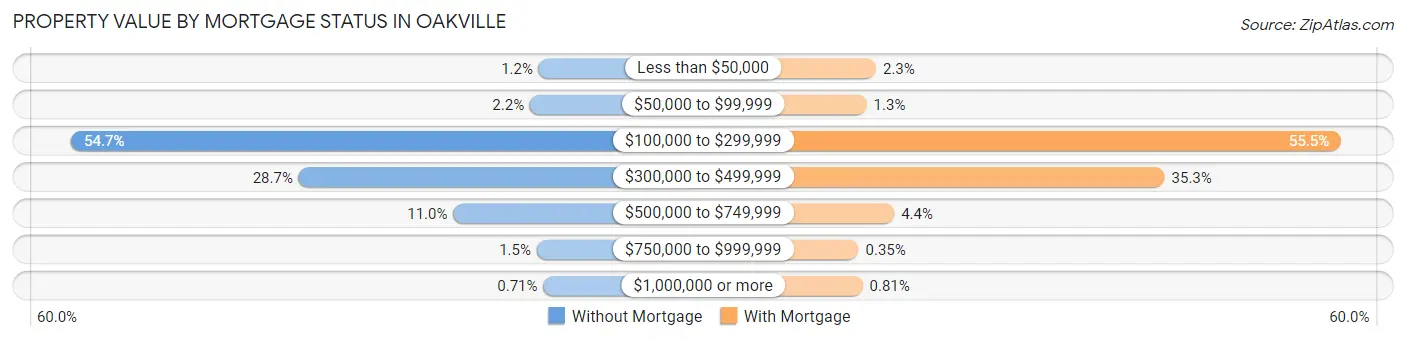
| Property Value | Without Mortgage | With Mortgage |
| Less than $50,000 | 57 (1.2%) | 173 (2.3%) |
| $50,000 to $99,999 | 104 (2.2%) | 94 (1.3%) |
| $100,000 to $299,999 | 2,539 (54.7%) | 4,096 (55.5%) |
| $300,000 to $499,999 | 1,331 (28.7%) | 2,607 (35.3%) |
| $500,000 to $749,999 | 511 (11.0%) | 326 (4.4%) |
| $750,000 to $999,999 | 68 (1.5%) | 26 (0.4%) |
| $1,000,000 or more | 33 (0.7%) | 60 (0.8%) |
| Total | 4,643 (100.0%) | 7,382 (100.0%) |
Household Income by Mortgage Status in Oakville
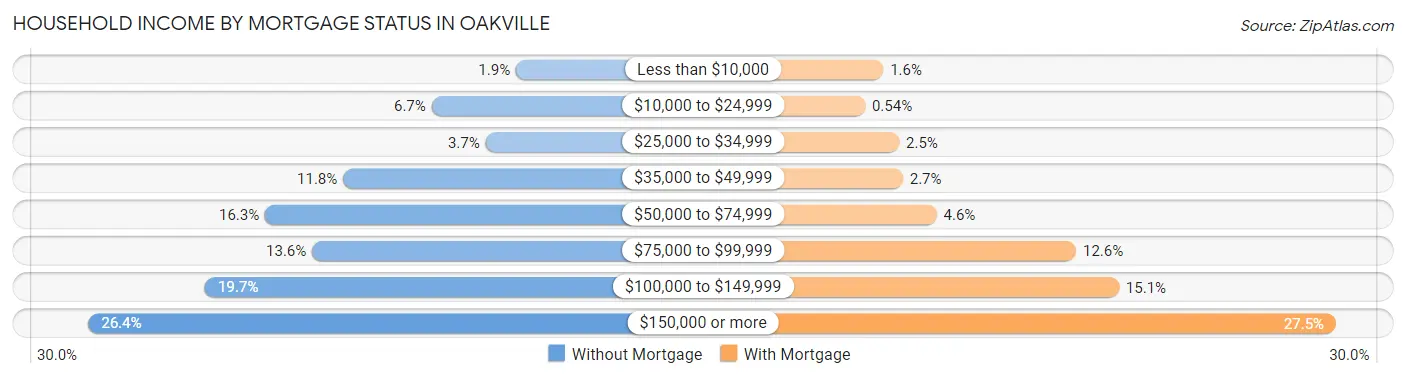
| Household Income | Without Mortgage | With Mortgage |
| Less than $10,000 | 89 (1.9%) | 117 (1.6%) |
| $10,000 to $24,999 | 313 (6.7%) | 40 (0.5%) |
| $25,000 to $34,999 | 170 (3.7%) | 184 (2.5%) |
| $35,000 to $49,999 | 548 (11.8%) | 199 (2.7%) |
| $50,000 to $74,999 | 755 (16.3%) | 342 (4.6%) |
| $75,000 to $99,999 | 630 (13.6%) | 930 (12.6%) |
| $100,000 to $149,999 | 914 (19.7%) | 1,111 (15.0%) |
| $150,000 or more | 1,224 (26.4%) | 2,026 (27.5%) |
| Total | 4,643 (100.0%) | 7,382 (100.0%) |
Property Value to Household Income Ratio in Oakville
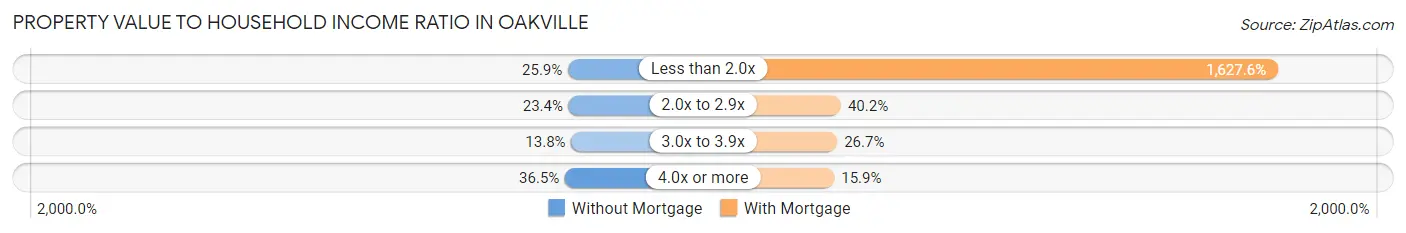
| Value-to-Income Ratio | Without Mortgage | With Mortgage |
| Less than 2.0x | 1,202 (25.9%) | 120,147 (1,627.6%) |
| 2.0x to 2.9x | 1,085 (23.4%) | 2,964 (40.2%) |
| 3.0x to 3.9x | 642 (13.8%) | 1,968 (26.7%) |
| 4.0x or more | 1,695 (36.5%) | 1,174 (15.9%) |
| Total | 4,643 (100.0%) | 7,382 (100.0%) |
Real Estate Taxes by Mortgage Status in Oakville
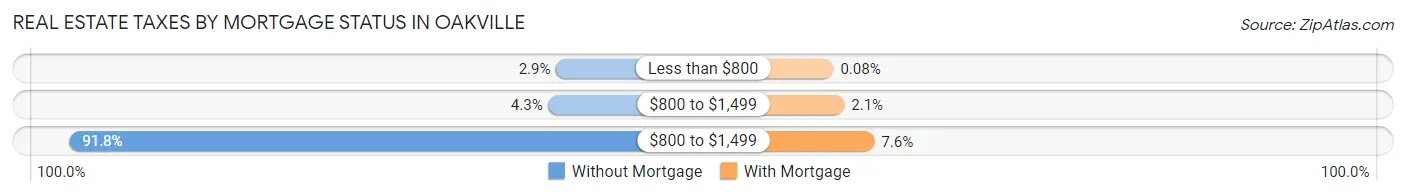
| Property Taxes | Without Mortgage | With Mortgage |
| Less than $800 | 134 (2.9%) | 6 (0.1%) |
| $800 to $1,499 | 200 (4.3%) | 153 (2.1%) |
| $800 to $1,499 | 4,263 (91.8%) | 558 (7.6%) |
| Total | 4,643 (100.0%) | 7,382 (100.0%) |
Health & Disability in Oakville
Health Insurance Coverage by Age in Oakville
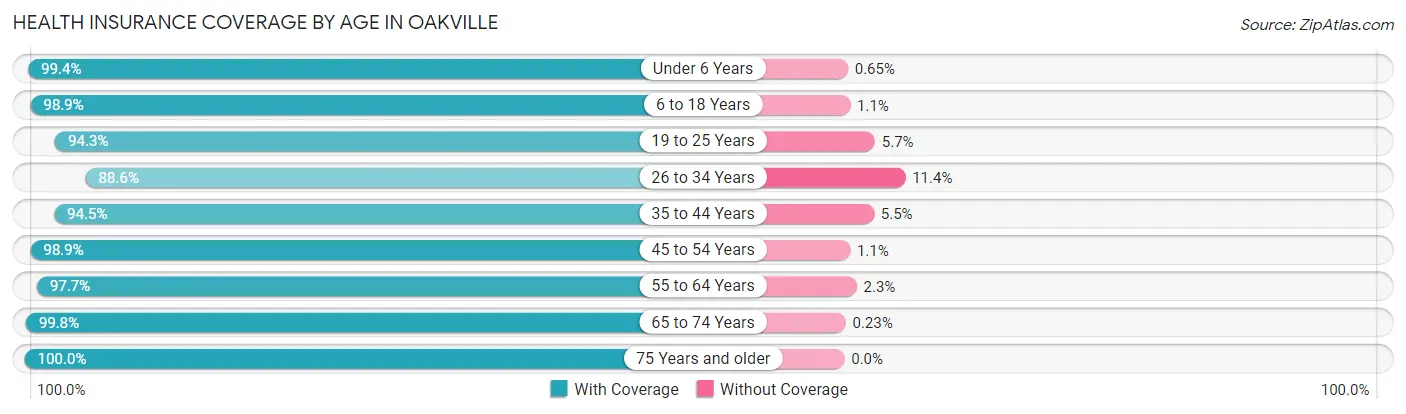
| Age Bracket | With Coverage | Without Coverage |
| Under 6 Years | 1,821 (99.4%) | 12 (0.6%) |
| 6 to 18 Years | 6,031 (98.9%) | 66 (1.1%) |
| 19 to 25 Years | 2,516 (94.3%) | 152 (5.7%) |
| 26 to 34 Years | 2,537 (88.6%) | 325 (11.4%) |
| 35 to 44 Years | 3,604 (94.5%) | 210 (5.5%) |
| 45 to 54 Years | 4,842 (98.9%) | 52 (1.1%) |
| 55 to 64 Years | 5,550 (97.7%) | 130 (2.3%) |
| 65 to 74 Years | 4,392 (99.8%) | 10 (0.2%) |
| 75 Years and older | 3,021 (100.0%) | 0 (0.0%) |
| Total | 34,314 (97.3%) | 957 (2.7%) |
Health Insurance Coverage by Citizenship Status in Oakville
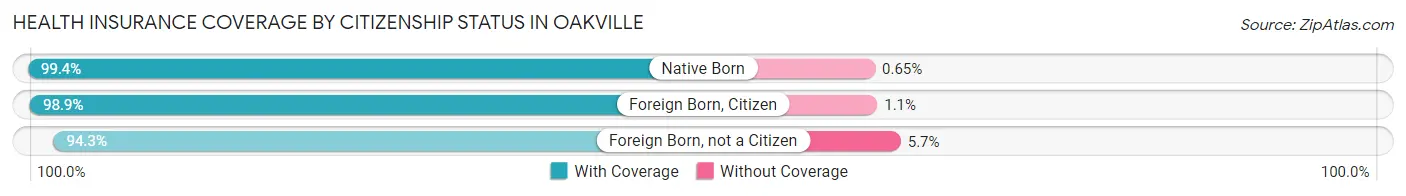
| Citizenship Status | With Coverage | Without Coverage |
| Native Born | 1,821 (99.4%) | 12 (0.6%) |
| Foreign Born, Citizen | 6,031 (98.9%) | 66 (1.1%) |
| Foreign Born, not a Citizen | 2,516 (94.3%) | 152 (5.7%) |
Health Insurance Coverage by Household Income in Oakville
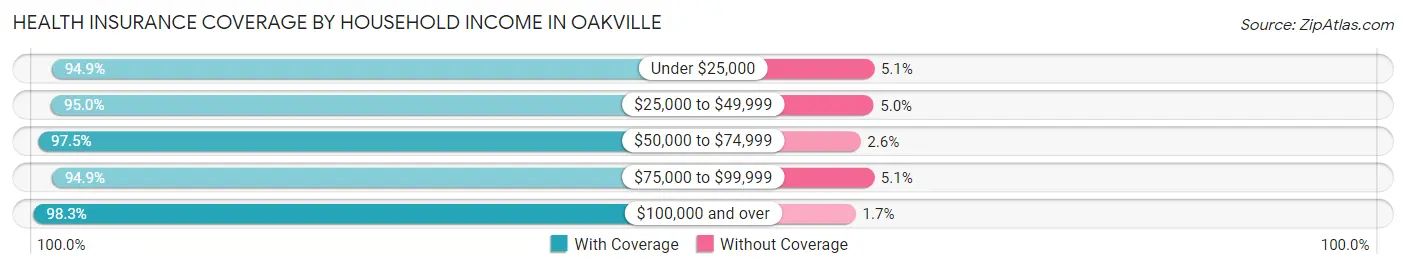
| Household Income | With Coverage | Without Coverage |
| Under $25,000 | 1,547 (94.9%) | 83 (5.1%) |
| $25,000 to $49,999 | 2,869 (95.0%) | 150 (5.0%) |
| $50,000 to $74,999 | 4,669 (97.5%) | 122 (2.5%) |
| $75,000 to $99,999 | 4,592 (94.9%) | 246 (5.1%) |
| $100,000 and over | 20,625 (98.3%) | 348 (1.7%) |
Public vs Private Health Insurance Coverage by Age in Oakville
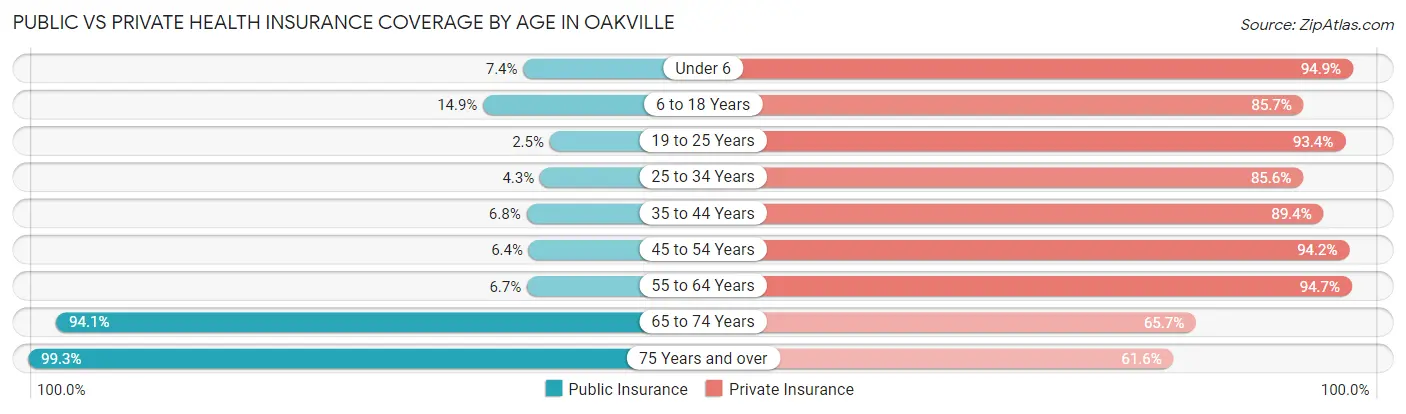
| Age Bracket | Public Insurance | Private Insurance |
| Under 6 | 136 (7.4%) | 1,739 (94.9%) |
| 6 to 18 Years | 907 (14.9%) | 5,226 (85.7%) |
| 19 to 25 Years | 67 (2.5%) | 2,492 (93.4%) |
| 25 to 34 Years | 124 (4.3%) | 2,450 (85.6%) |
| 35 to 44 Years | 261 (6.8%) | 3,410 (89.4%) |
| 45 to 54 Years | 314 (6.4%) | 4,609 (94.2%) |
| 55 to 64 Years | 383 (6.7%) | 5,376 (94.7%) |
| 65 to 74 Years | 4,144 (94.1%) | 2,894 (65.7%) |
| 75 Years and over | 3,001 (99.3%) | 1,860 (61.6%) |
| Total | 9,337 (26.5%) | 30,056 (85.2%) |
Disability Status by Sex by Age in Oakville
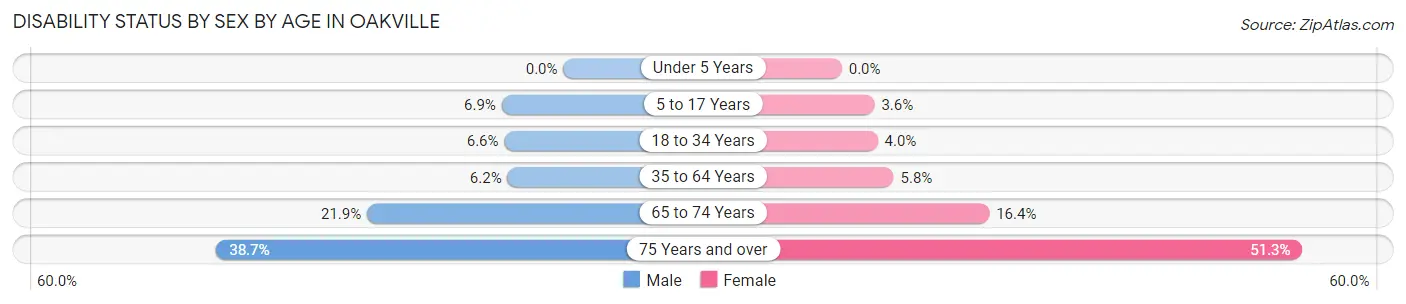
| Age Bracket | Male | Female |
| Under 5 Years | 0 (0.0%) | 0 (0.0%) |
| 5 to 17 Years | 181 (6.9%) | 97 (3.6%) |
| 18 to 34 Years | 230 (6.6%) | 122 (4.0%) |
| 35 to 64 Years | 422 (6.2%) | 439 (5.8%) |
| 65 to 74 Years | 475 (21.9%) | 366 (16.4%) |
| 75 Years and over | 509 (38.7%) | 874 (51.3%) |
Disability Class by Sex by Age in Oakville
Disability Class: Hearing Difficulty
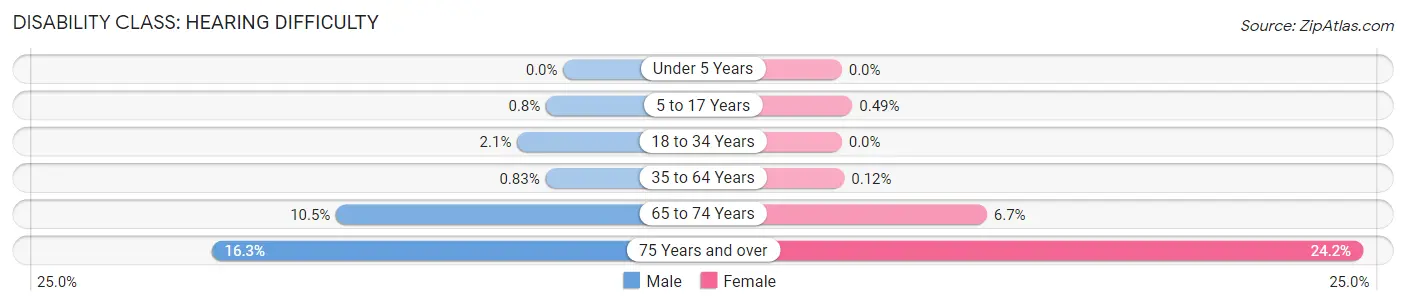
| Age Bracket | Male | Female |
| Under 5 Years | 0 (0.0%) | 0 (0.0%) |
| 5 to 17 Years | 21 (0.8%) | 13 (0.5%) |
| 18 to 34 Years | 75 (2.1%) | 0 (0.0%) |
| 35 to 64 Years | 56 (0.8%) | 9 (0.1%) |
| 65 to 74 Years | 229 (10.5%) | 150 (6.7%) |
| 75 Years and over | 215 (16.3%) | 412 (24.2%) |
Disability Class: Vision Difficulty
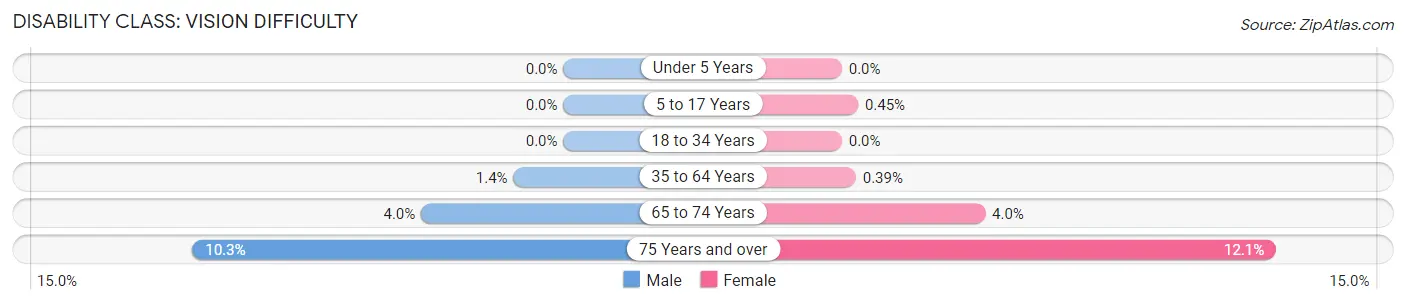
| Age Bracket | Male | Female |
| Under 5 Years | 0 (0.0%) | 0 (0.0%) |
| 5 to 17 Years | 0 (0.0%) | 12 (0.4%) |
| 18 to 34 Years | 0 (0.0%) | 0 (0.0%) |
| 35 to 64 Years | 94 (1.4%) | 30 (0.4%) |
| 65 to 74 Years | 86 (4.0%) | 89 (4.0%) |
| 75 Years and over | 136 (10.3%) | 206 (12.1%) |
Disability Class: Cognitive Difficulty
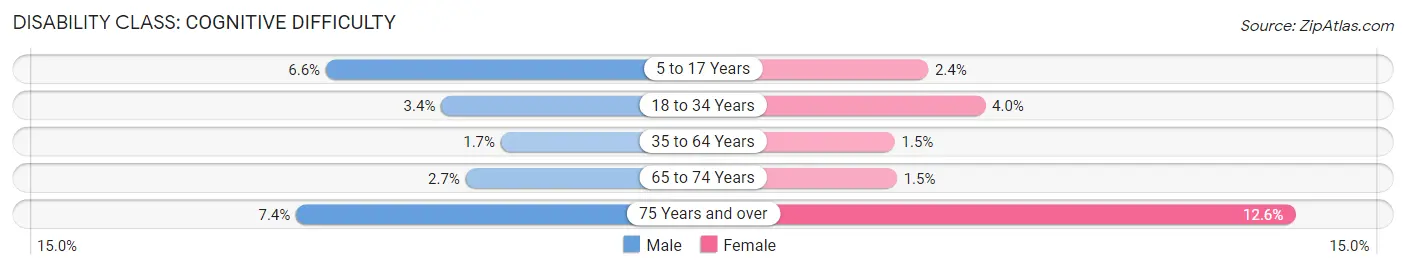
| Age Bracket | Male | Female |
| 5 to 17 Years | 174 (6.6%) | 64 (2.4%) |
| 18 to 34 Years | 119 (3.4%) | 122 (4.0%) |
| 35 to 64 Years | 118 (1.7%) | 112 (1.5%) |
| 65 to 74 Years | 59 (2.7%) | 34 (1.5%) |
| 75 Years and over | 98 (7.4%) | 215 (12.6%) |
Disability Class: Ambulatory Difficulty
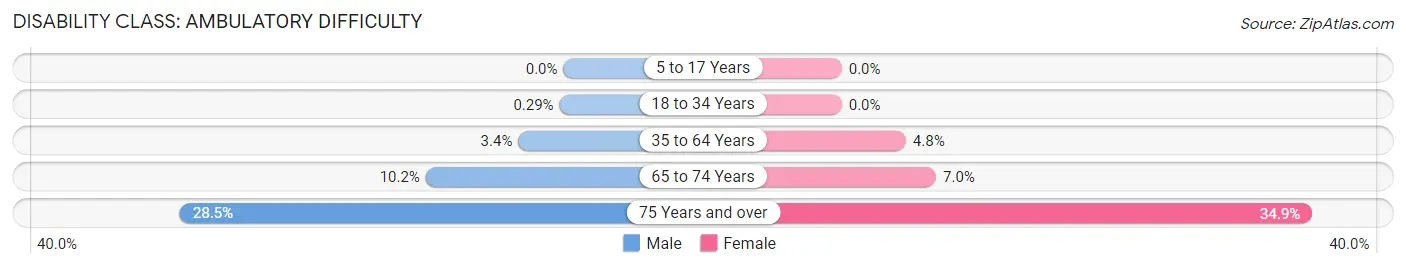
| Age Bracket | Male | Female |
| 5 to 17 Years | 0 (0.0%) | 0 (0.0%) |
| 18 to 34 Years | 10 (0.3%) | 0 (0.0%) |
| 35 to 64 Years | 227 (3.4%) | 362 (4.8%) |
| 65 to 74 Years | 222 (10.2%) | 156 (7.0%) |
| 75 Years and over | 375 (28.5%) | 595 (34.9%) |
Disability Class: Self-Care Difficulty
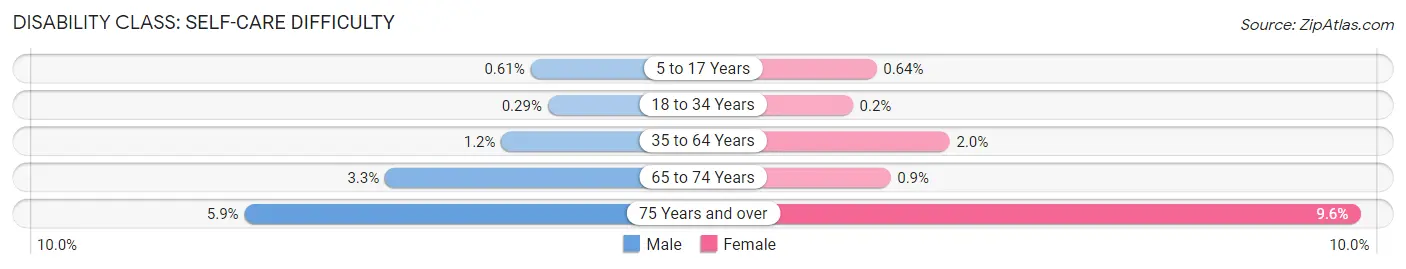
| Age Bracket | Male | Female |
| 5 to 17 Years | 16 (0.6%) | 17 (0.6%) |
| 18 to 34 Years | 10 (0.3%) | 6 (0.2%) |
| 35 to 64 Years | 78 (1.1%) | 152 (2.0%) |
| 65 to 74 Years | 72 (3.3%) | 20 (0.9%) |
| 75 Years and over | 78 (5.9%) | 164 (9.6%) |
Technology Access in Oakville
Computing Device Access in Oakville
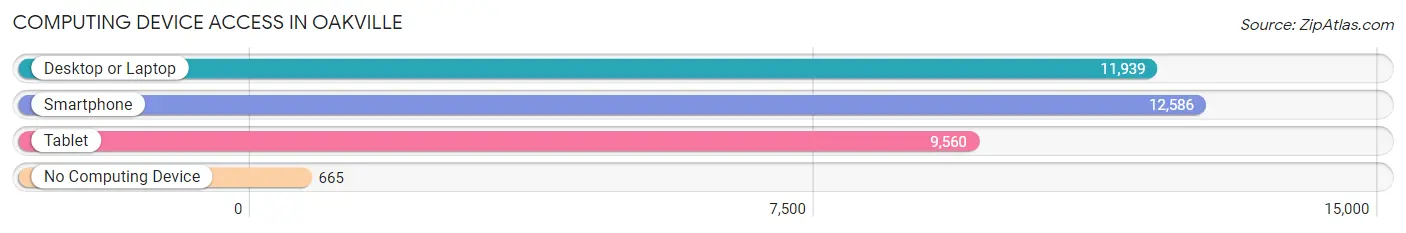
| Device Type | # Households | % Households |
| Desktop or Laptop | 11,939 | 86.1% |
| Smartphone | 12,586 | 90.7% |
| Tablet | 9,560 | 68.9% |
| No Computing Device | 665 | 4.8% |
| Total | 13,870 | 100.0% |
Internet Access in Oakville
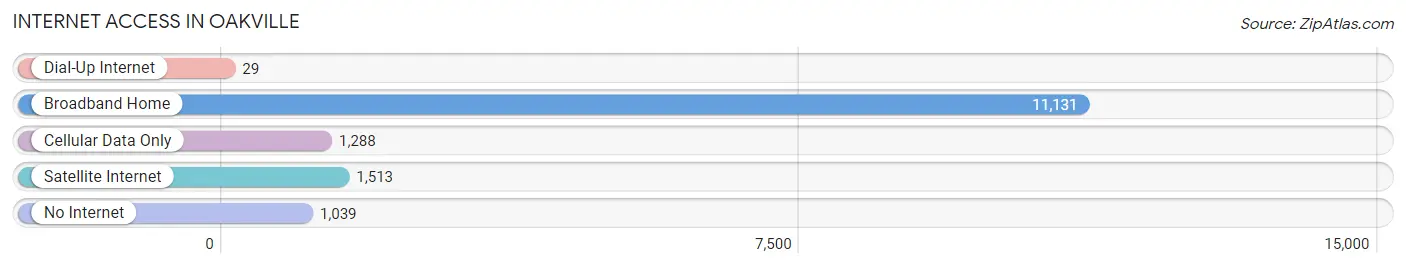
| Internet Type | # Households | % Households |
| Dial-Up Internet | 29 | 0.2% |
| Broadband Home | 11,131 | 80.2% |
| Cellular Data Only | 1,288 | 9.3% |
| Satellite Internet | 1,513 | 10.9% |
| No Internet | 1,039 | 7.5% |
| Total | 13,870 | 100.0% |
Oakville Summary
Oakville is a small city located in St. Louis County, Missouri, United States. It is situated on the banks of the Mississippi River, approximately 20 miles south of downtown St. Louis. The city has a population of approximately 8,000 people and is part of the Greater St. Louis metropolitan area.
History
Oakville was first settled in 1819 by a group of German immigrants led by John B. Weber. The settlement was originally known as Weber’s Settlement, but was later renamed Oakville in 1837. The name was chosen to honor the many oak trees that grew in the area.
In the late 19th century, Oakville was a thriving agricultural community. The town was home to several large farms, as well as a number of small businesses. The town also had a railroad station, which allowed for easy transportation of goods and people.
In the early 20th century, Oakville began to experience a period of growth and development. The town was incorporated in 1911 and the population began to grow rapidly. By the mid-20th century, Oakville had become a thriving suburban community.
Geography
Oakville is located in St. Louis County, Missouri, approximately 20 miles south of downtown St. Louis. The city is situated on the banks of the Mississippi River and is bordered by the cities of Mehlville and Lemay.
The city has a total area of 4.2 square miles, of which 4.1 square miles is land and 0.1 square miles is water. The terrain is mostly flat, with some rolling hills in the northern part of the city.
Economy
Oakville’s economy is largely based on the service industry. The city is home to a number of retail stores, restaurants, and other businesses. The city also has a number of manufacturing and industrial businesses, including a large automotive parts plant.
The city is also home to a number of corporate headquarters, including the headquarters of the St. Louis-based company, Emerson Electric.
Demographics
As of the 2010 census, Oakville had a population of 8,039 people. The racial makeup of the city was 87.3% White, 8.2% African American, 0.4% Native American, 1.2% Asian, 0.1% Pacific Islander, 0.7% from other races, and 2.1% from two or more races. Hispanic or Latino of any race were 2.7% of the population.
The median income for a household in the city was $50,945, and the median income for a family was $60,945. The per capita income for the city was $25,945. About 5.2% of families and 6.7% of the population were below the poverty line, including 8.2% of those under age 18 and 4.2% of those age 65 or over.
Oakville is a small city with a rich history and a diverse population. The city has a strong economy and is home to a number of businesses and corporate headquarters. The city is also home to a number of parks and recreational facilities, making it a great place to live and work.
Common Questions
What is Per Capita Income in Oakville?
Per Capita income in Oakville is $49,649.
What is the Median Family Income in Oakville?
Median Family Income in Oakville is $120,124.
What is the Median Household income in Oakville?
Median Household Income in Oakville is $100,558.
What is Income or Wage Gap in Oakville?
Income or Wage Gap in Oakville is 28.7%.
Women in Oakville earn 71.3 cents for every dollar earned by a man.
What is Family Income Deficit in Oakville?
Family Income Deficit in Oakville is $8,579.
Families that are below poverty line in Oakville earn $8,579 less on average than the poverty threshold level.
What is Inequality or Gini Index in Oakville?
Inequality or Gini Index in Oakville is 0.41.
What is the Total Population of Oakville?
Total Population of Oakville is 35,412.
What is the Total Male Population of Oakville?
Total Male Population of Oakville is 17,331.
What is the Total Female Population of Oakville?
Total Female Population of Oakville is 18,081.
What is the Ratio of Males per 100 Females in Oakville?
There are 95.85 Males per 100 Females in Oakville.
What is the Ratio of Females per 100 Males in Oakville?
There are 104.33 Females per 100 Males in Oakville.
What is the Median Population Age in Oakville?
Median Population Age in Oakville is 45.9 Years.
What is the Average Family Size in Oakville
Average Family Size in Oakville is 2.9 People.
What is the Average Household Size in Oakville
Average Household Size in Oakville is 2.5 People.
How Large is the Labor Force in Oakville?
There are 19,064 People in the Labor Forcein in Oakville.
What is the Percentage of People in the Labor Force in Oakville?
65.3% of People are in the Labor Force in Oakville.
What is the Unemployment Rate in Oakville?
Unemployment Rate in Oakville is 3.9%.