Fort Campbell North, KY Map & Demographics
Fort Campbell North Map
Fort Campbell North Overview
$21,210
PER CAPITA INCOME
$53,513
AVG FAMILY INCOME
$52,677
AVG HOUSEHOLD INCOME
27.5%
WAGE / INCOME GAP [ % ]
72.5¢/ $1
WAGE / INCOME GAP [ $ ]
$11,267
FAMILY INCOME DEFICIT
0.26
INEQUALITY / GINI INDEX
12,014
TOTAL POPULATION
7,523
MALE POPULATION
4,491
FEMALE POPULATION
167.51
MALES / 100 FEMALES
59.70
FEMALES / 100 MALES
22.0
MEDIAN AGE
3.4
AVG FAMILY SIZE
3.3
AVG HOUSEHOLD SIZE
7,066
LABOR FORCE [ PEOPLE ]
82.0%
PERCENT IN LABOR FORCE
16.8%
UNEMPLOYMENT RATE
Income in Fort Campbell North
Income Overview in Fort Campbell North
Per Capita Income in Fort Campbell North is $21,210, while median incomes of families and households are $53,513 and $52,677 respectively.
| Characteristic | Number | Measure |
| Per Capita Income | 12,014 | $21,210 |
| Median Family Income | 2,358 | $53,513 |
| Mean Family Income | 2,358 | $55,621 |
| Median Household Income | 2,525 | $52,677 |
| Mean Household Income | 2,525 | $54,773 |
| Income Deficit | 2,358 | $11,267 |
| Wage / Income Gap (%) | 12,014 | 27.48% |
| Wage / Income Gap ($) | 12,014 | 72.52¢ per $1 |
| Gini / Inequality Index | 12,014 | 0.26 |
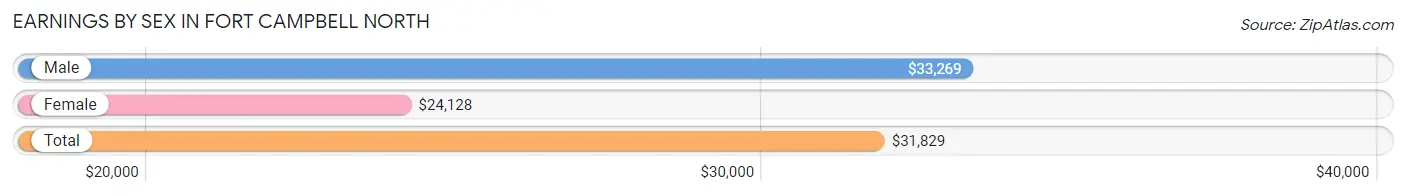
Earnings by Sex in Fort Campbell North
Average Earnings in Fort Campbell North are $31,829, $33,269 for men and $24,128 for women, a difference of 27.5%.
| Sex | Number | Average Earnings |
| Male | 5,796 (81.0%) | $33,269 |
| Female | 1,357 (19.0%) | $24,128 |
| Total | 7,153 (100.0%) | $31,829 |
Earnings by Sex by Income Bracket in Fort Campbell North
The most common earnings brackets in Fort Campbell North are $25,000 to $29,999 for men (1,546 | 26.7%) and $2,500 to $4,999 for women (213 | 15.7%).
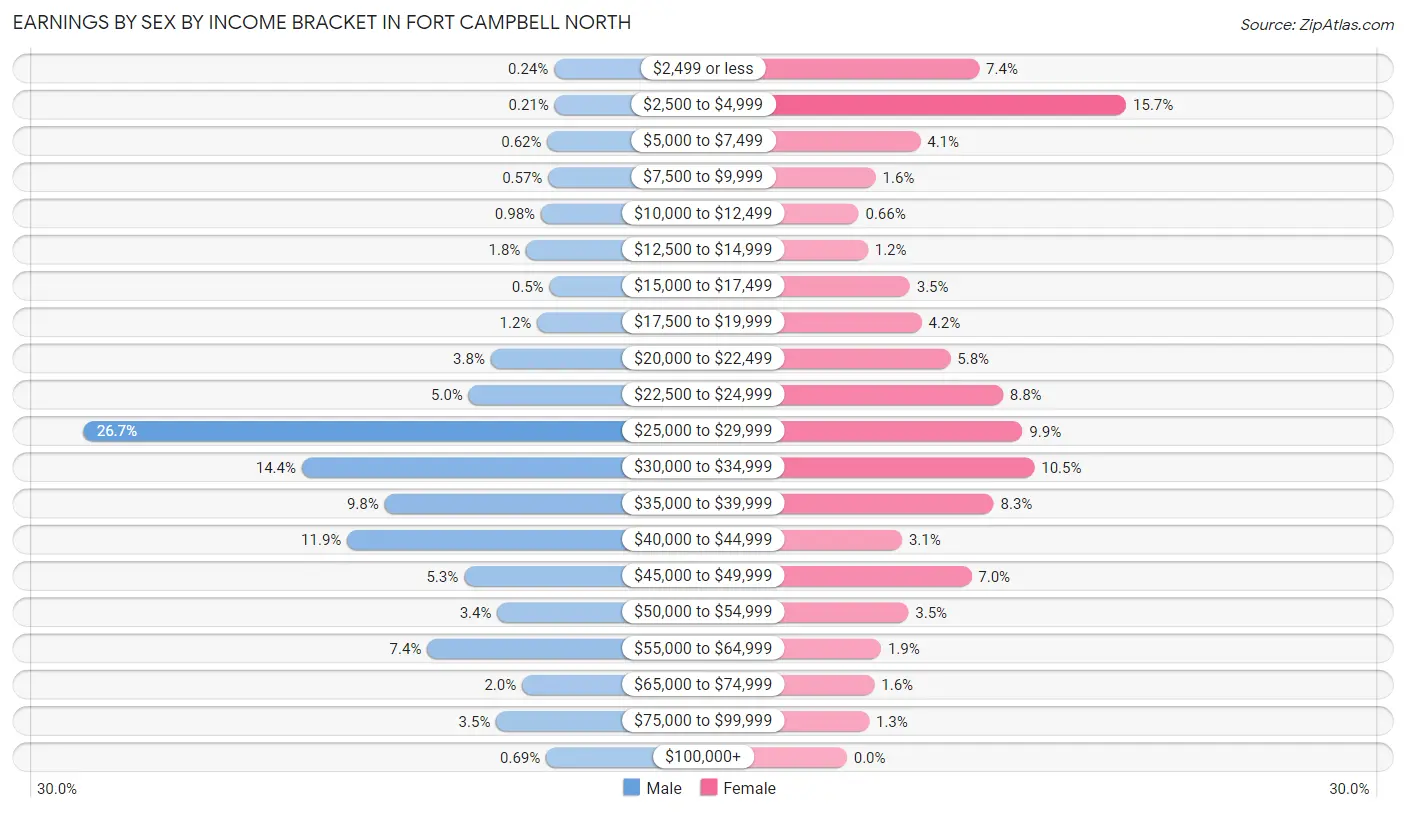
| Income | Male | Female |
| $2,499 or less | 14 (0.2%) | 101 (7.4%) |
| $2,500 to $4,999 | 12 (0.2%) | 213 (15.7%) |
| $5,000 to $7,499 | 36 (0.6%) | 56 (4.1%) |
| $7,500 to $9,999 | 33 (0.6%) | 22 (1.6%) |
| $10,000 to $12,499 | 57 (1.0%) | 9 (0.7%) |
| $12,500 to $14,999 | 105 (1.8%) | 16 (1.2%) |
| $15,000 to $17,499 | 29 (0.5%) | 48 (3.5%) |
| $17,500 to $19,999 | 69 (1.2%) | 57 (4.2%) |
| $20,000 to $22,499 | 220 (3.8%) | 79 (5.8%) |
| $22,500 to $24,999 | 292 (5.0%) | 119 (8.8%) |
| $25,000 to $29,999 | 1,546 (26.7%) | 134 (9.9%) |
| $30,000 to $34,999 | 836 (14.4%) | 143 (10.5%) |
| $35,000 to $39,999 | 566 (9.8%) | 112 (8.3%) |
| $40,000 to $44,999 | 688 (11.9%) | 42 (3.1%) |
| $45,000 to $49,999 | 307 (5.3%) | 95 (7.0%) |
| $50,000 to $54,999 | 199 (3.4%) | 47 (3.5%) |
| $55,000 to $64,999 | 427 (7.4%) | 26 (1.9%) |
| $65,000 to $74,999 | 118 (2.0%) | 21 (1.5%) |
| $75,000 to $99,999 | 202 (3.5%) | 17 (1.3%) |
| $100,000+ | 40 (0.7%) | 0 (0.0%) |
| Total | 5,796 (100.0%) | 1,357 (100.0%) |
Earnings by Sex by Educational Attainment in Fort Campbell North
Average earnings in Fort Campbell North are $41,847 for men and $27,917 for women, a difference of 33.3%. Men with an educational attainment of graduate degree enjoy the highest average annual earnings of $57,031, while those with college or associate's degree education earn the least with $40,843. Women with an educational attainment of bachelor's degree earn the most with the average annual earnings of $45,604, while those with college or associate's degree education have the smallest earnings of $21,228.
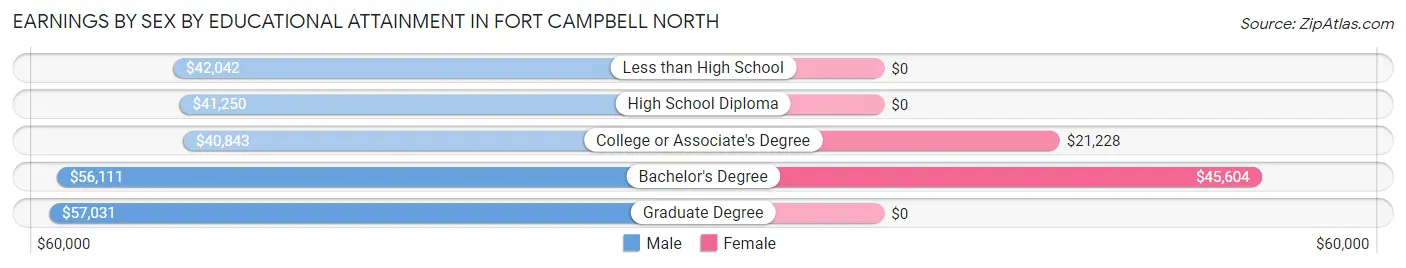
| Educational Attainment | Male Income | Female Income |
| Less than High School | $42,042 | $0 |
| High School Diploma | $41,250 | $0 |
| College or Associate's Degree | $40,843 | $21,228 |
| Bachelor's Degree | $56,111 | $45,604 |
| Graduate Degree | $57,031 | $0 |
| Total | $41,847 | $27,917 |
Family Income in Fort Campbell North
Family Income Brackets in Fort Campbell North
According to the Fort Campbell North family income data, there are 601 families falling into the $35,000 to $49,999 income range, which is the most common income bracket and makes up 25.5% of all families.
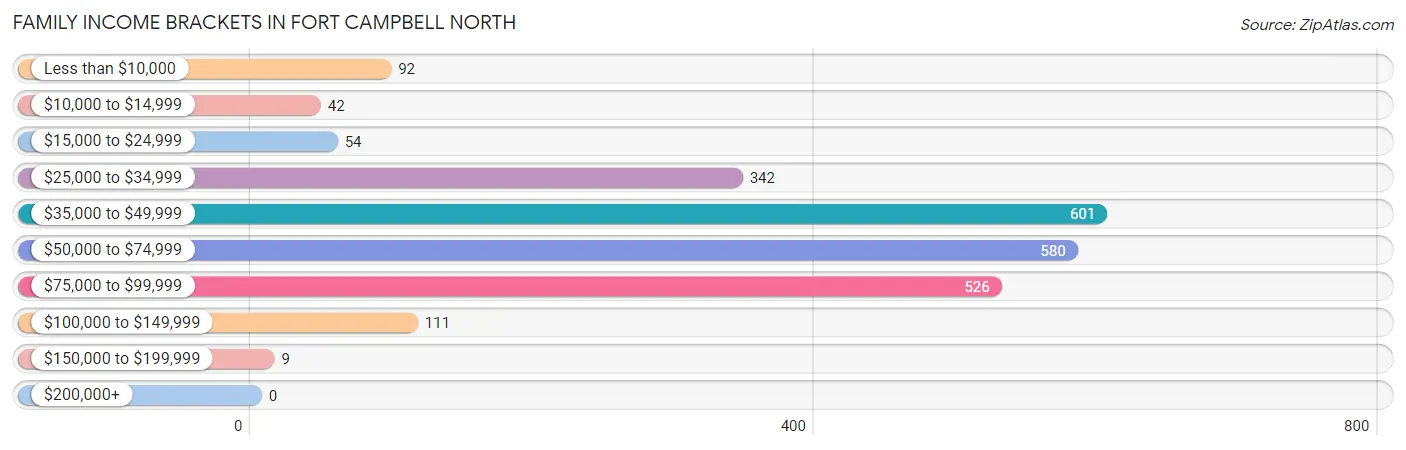
| Income Bracket | # Families | % Families |
| Less than $10,000 | 92 | 3.9% |
| $10,000 to $14,999 | 42 | 1.8% |
| $15,000 to $24,999 | 54 | 2.3% |
| $25,000 to $34,999 | 342 | 14.5% |
| $35,000 to $49,999 | 601 | 25.5% |
| $50,000 to $74,999 | 580 | 24.6% |
| $75,000 to $99,999 | 526 | 22.3% |
| $100,000 to $149,999 | 111 | 4.7% |
| $150,000 to $199,999 | 9 | 0.4% |
| $200,000+ | 0 | 0.0% |
Family Income by Famaliy Size in Fort Campbell North
5-person families (346 | 14.7%) account for the highest median family income in Fort Campbell North with $70,833 per family, while 2-person families (540 | 22.9%) have the highest median income of $21,938 per family member.
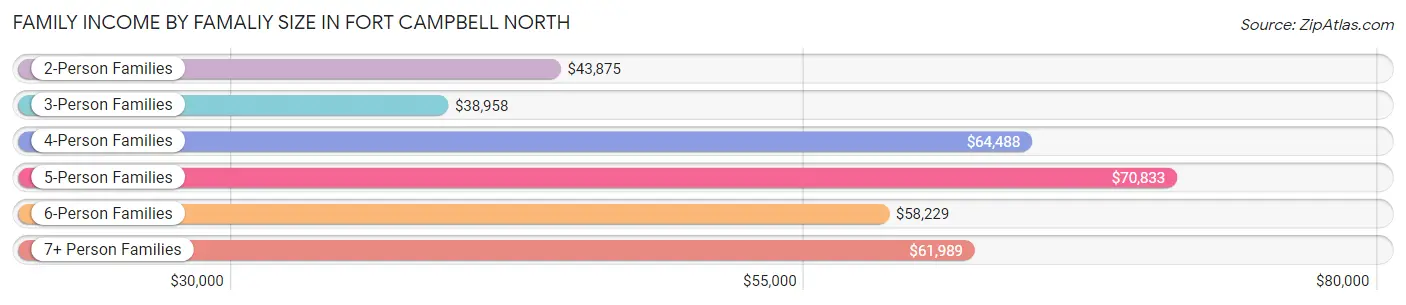
| Income Bracket | # Families | Median Income |
| 2-Person Families | 540 (22.9%) | $43,875 |
| 3-Person Families | 624 (26.5%) | $38,958 |
| 4-Person Families | 647 (27.4%) | $64,488 |
| 5-Person Families | 346 (14.7%) | $70,833 |
| 6-Person Families | 166 (7.0%) | $58,229 |
| 7+ Person Families | 35 (1.5%) | $61,989 |
| Total | 2,358 (100.0%) | $53,513 |
Family Income by Number of Earners in Fort Campbell North
The median family income in Fort Campbell North is $53,513, with families comprising 3+ earners (28) having the highest median family income of $77,750, while families with no earners (91) have the lowest median family income of $2,499, accounting for 1.2% and 3.9% of families, respectively.
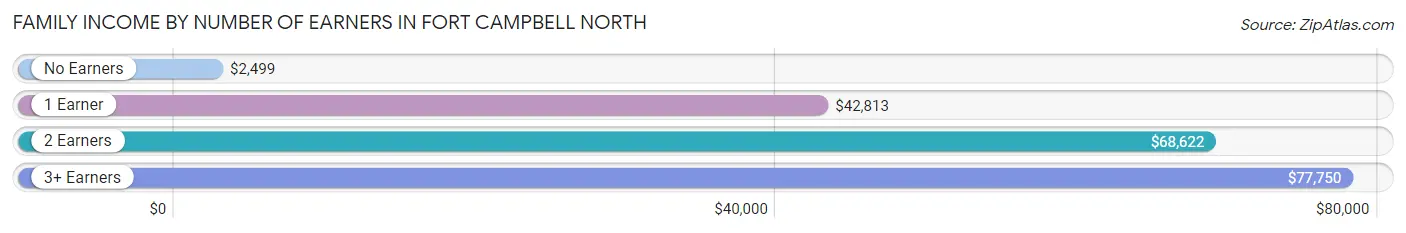
| Number of Earners | # Families | Median Income |
| No Earners | 91 (3.9%) | $2,499 |
| 1 Earner | 1,340 (56.8%) | $42,813 |
| 2 Earners | 899 (38.1%) | $68,622 |
| 3+ Earners | 28 (1.2%) | $77,750 |
| Total | 2,358 (100.0%) | $53,513 |
Household Income in Fort Campbell North
Household Income Brackets in Fort Campbell North
With 672 households falling in the category, the $50,000 to $74,999 income range is the most frequent in Fort Campbell North, accounting for 26.6% of all households.
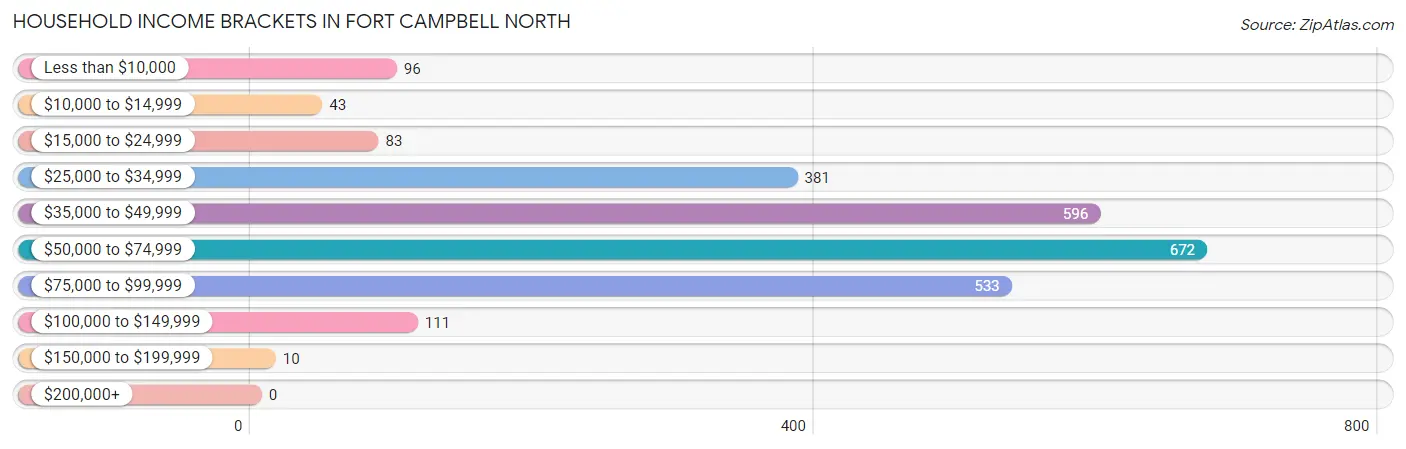
| Income Bracket | # Households | % Households |
| Less than $10,000 | 96 | 3.8% |
| $10,000 to $14,999 | 43 | 1.7% |
| $15,000 to $24,999 | 83 | 3.3% |
| $25,000 to $34,999 | 381 | 15.1% |
| $35,000 to $49,999 | 596 | 23.6% |
| $50,000 to $74,999 | 672 | 26.6% |
| $75,000 to $99,999 | 533 | 21.1% |
| $100,000 to $149,999 | 111 | 4.4% |
| $150,000 to $199,999 | 10 | 0.4% |
| $200,000+ | 0 | 0.0% |
Household Income by Householder Age in Fort Campbell North
The median household income in Fort Campbell North is $52,677, with the highest median household income of $57,734 found in the 25 to 44 years age bracket for the primary householder. A total of 1,730 households (68.5%) fall into this category.
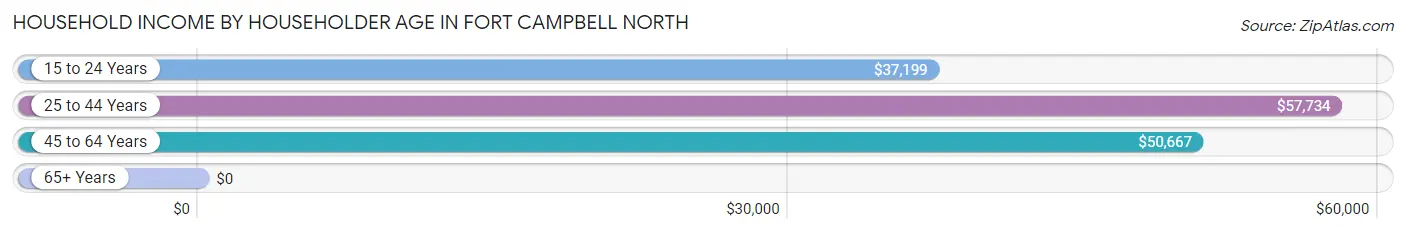
| Income Bracket | # Households | Median Income |
| 15 to 24 Years | 671 (26.6%) | $37,199 |
| 25 to 44 Years | 1,730 (68.5%) | $57,734 |
| 45 to 64 Years | 124 (4.9%) | $50,667 |
| 65+ Years | 0 (0.0%) | $0 |
| Total | 2,525 (100.0%) | $52,677 |
Poverty in Fort Campbell North
Income Below Poverty by Sex and Age in Fort Campbell North
With 7.6% poverty level for males and 8.7% for females among the residents of Fort Campbell North, 15 year old males and 5 year old females are the most vulnerable to poverty, with 14 males (24.6%) and 15 females (14.4%) in their respective age groups living below the poverty level.
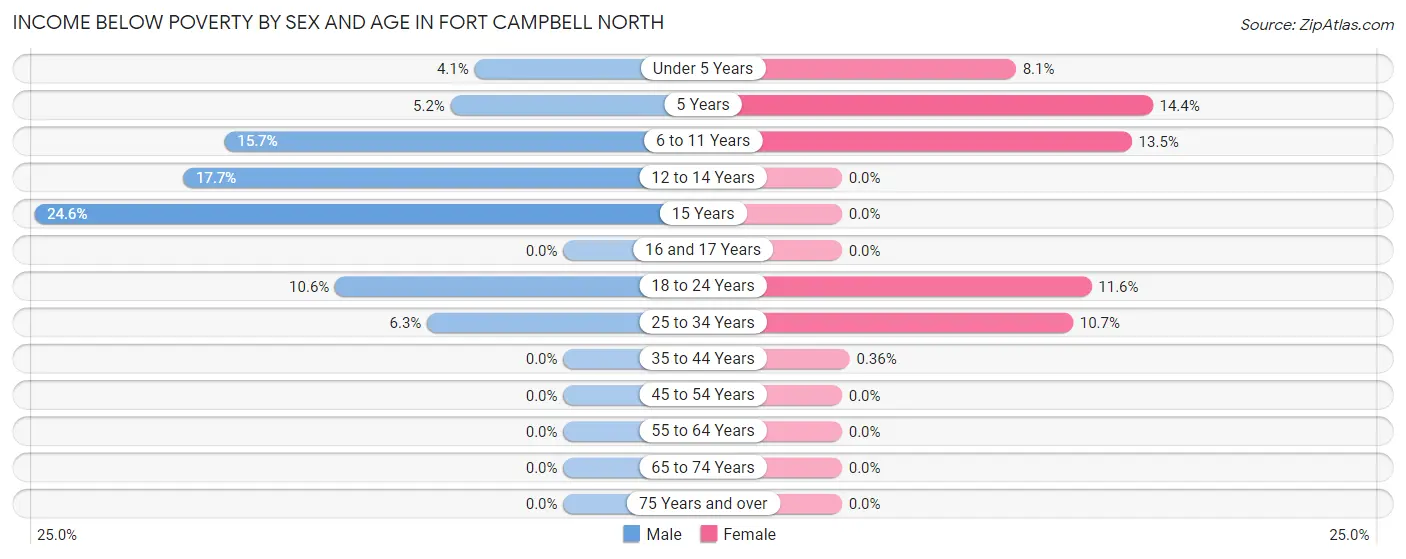
| Age Bracket | Male | Female |
| Under 5 Years | 32 (4.1%) | 85 (8.1%) |
| 5 Years | 8 (5.2%) | 15 (14.4%) |
| 6 to 11 Years | 59 (15.7%) | 69 (13.5%) |
| 12 to 14 Years | 30 (17.6%) | 0 (0.0%) |
| 15 Years | 14 (24.6%) | 0 (0.0%) |
| 16 and 17 Years | 0 (0.0%) | 0 (0.0%) |
| 18 to 24 Years | 77 (10.6%) | 90 (11.6%) |
| 25 to 34 Years | 83 (6.3%) | 111 (10.7%) |
| 35 to 44 Years | 0 (0.0%) | 1 (0.4%) |
| 45 to 54 Years | 0 (0.0%) | 0 (0.0%) |
| 55 to 64 Years | 0 (0.0%) | 0 (0.0%) |
| 65 to 74 Years | 0 (0.0%) | 0 (0.0%) |
| 75 Years and over | 0 (0.0%) | 0 (0.0%) |
| Total | 303 (7.6%) | 371 (8.7%) |
Income Above Poverty by Sex and Age in Fort Campbell North
According to the poverty statistics in Fort Campbell North, males aged 16 and 17 years and females aged 12 to 14 years are the age groups that are most secure financially, with 100.0% of males and 100.0% of females in these age groups living above the poverty line.
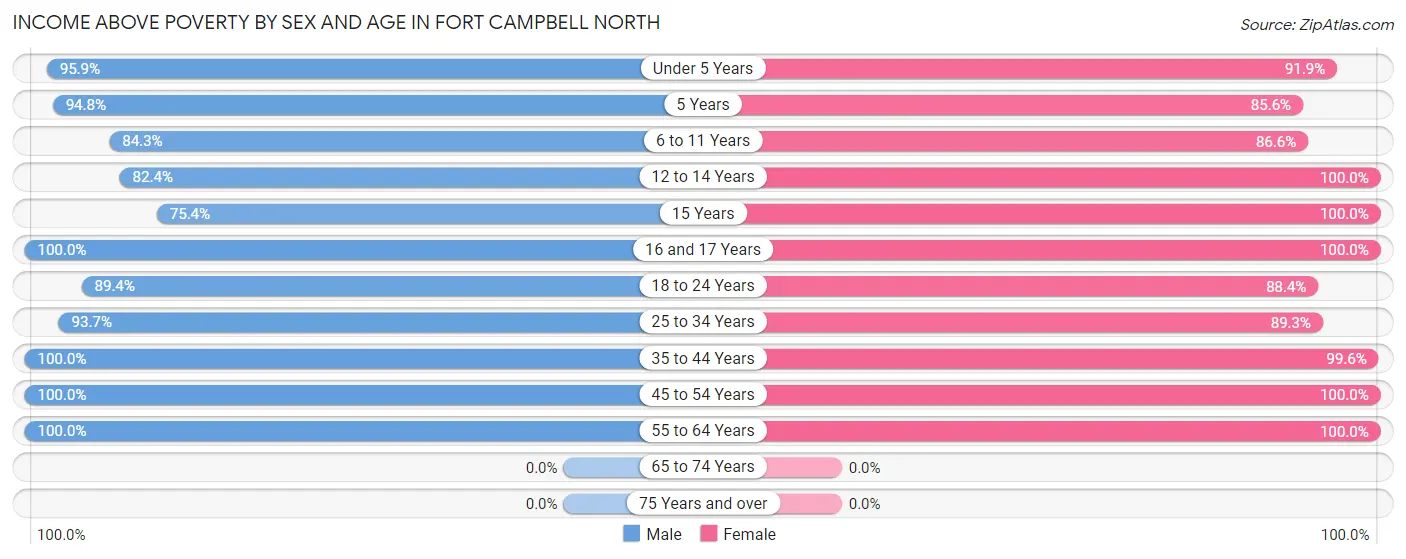
| Age Bracket | Male | Female |
| Under 5 Years | 744 (95.9%) | 968 (91.9%) |
| 5 Years | 145 (94.8%) | 89 (85.6%) |
| 6 to 11 Years | 316 (84.3%) | 444 (86.6%) |
| 12 to 14 Years | 140 (82.4%) | 133 (100.0%) |
| 15 Years | 43 (75.4%) | 63 (100.0%) |
| 16 and 17 Years | 96 (100.0%) | 118 (100.0%) |
| 18 to 24 Years | 650 (89.4%) | 687 (88.4%) |
| 25 to 34 Years | 1,231 (93.7%) | 924 (89.3%) |
| 35 to 44 Years | 234 (100.0%) | 279 (99.6%) |
| 45 to 54 Years | 83 (100.0%) | 139 (100.0%) |
| 55 to 64 Years | 1 (100.0%) | 65 (100.0%) |
| 65 to 74 Years | 0 (0.0%) | 0 (0.0%) |
| 75 Years and over | 0 (0.0%) | 0 (0.0%) |
| Total | 3,683 (92.4%) | 3,909 (91.3%) |
Income Below Poverty Among Married-Couple Families in Fort Campbell North
The poverty statistics for married-couple families in Fort Campbell North show that 7.2% or 146 of the total 2,016 families live below the poverty line. Families with 3 or 4 children have the highest poverty rate of 11.7%, comprising of 46 families. On the other hand, families with 5 or more children have the lowest poverty rate of 0.0%, which includes 0 families.
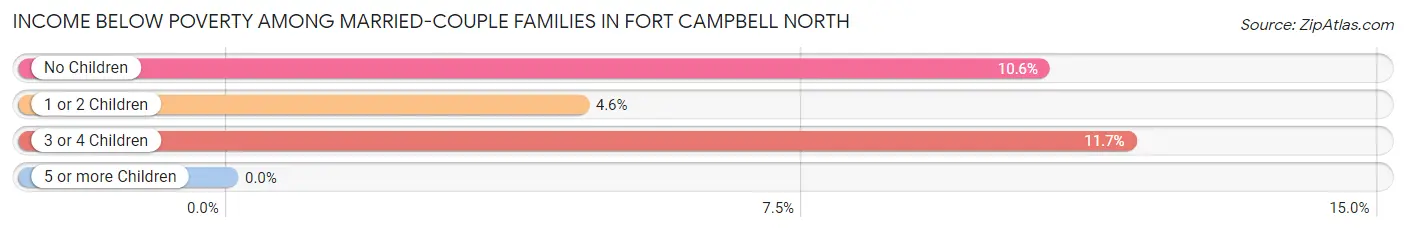
| Children | Above Poverty | Below Poverty |
| No Children | 405 (89.4%) | 48 (10.6%) |
| 1 or 2 Children | 1,084 (95.4%) | 52 (4.6%) |
| 3 or 4 Children | 346 (88.3%) | 46 (11.7%) |
| 5 or more Children | 35 (100.0%) | 0 (0.0%) |
| Total | 1,870 (92.8%) | 146 (7.2%) |
Income Below Poverty Among Single-Parent Households in Fort Campbell North
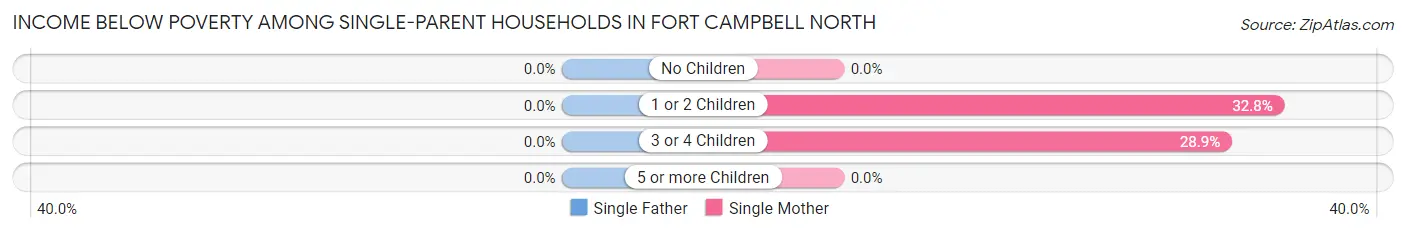
| Children | Single Father | Single Mother |
| No Children | 0 (0.0%) | 0 (0.0%) |
| 1 or 2 Children | 0 (0.0%) | 22 (32.8%) |
| 3 or 4 Children | 0 (0.0%) | 35 (28.9%) |
| 5 or more Children | 0 (0.0%) | 0 (0.0%) |
| Total | 0 (0.0%) | 57 (27.7%) |
Income Below Poverty Among Married-Couple vs Single-Parent Households in Fort Campbell North
The poverty data for Fort Campbell North shows that 146 of the married-couple family households (7.2%) and 57 of the single-parent households (16.7%) are living below the poverty level. Within the married-couple family households, those with 3 or 4 children have the highest poverty rate, with 46 households (11.7%) falling below the poverty line. Among the single-parent households, those with 3 or 4 children have the highest poverty rate, with 35 household (28.9%) living below poverty.
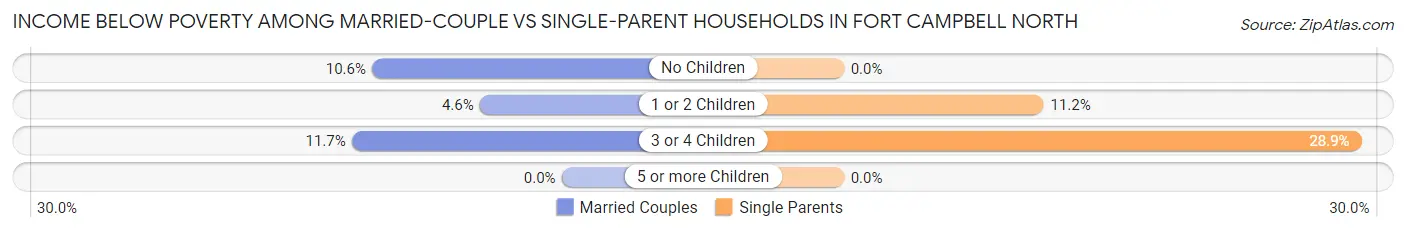
| Children | Married-Couple Families | Single-Parent Households |
| No Children | 48 (10.6%) | 0 (0.0%) |
| 1 or 2 Children | 52 (4.6%) | 22 (11.2%) |
| 3 or 4 Children | 46 (11.7%) | 35 (28.9%) |
| 5 or more Children | 0 (0.0%) | 0 (0.0%) |
| Total | 146 (7.2%) | 57 (16.7%) |
Race in Fort Campbell North
The most populous races in Fort Campbell North are White / Caucasian (7,591 | 63.2%), Hispanic or Latino (2,991 | 24.9%), and Black / African American (2,001 | 16.7%).
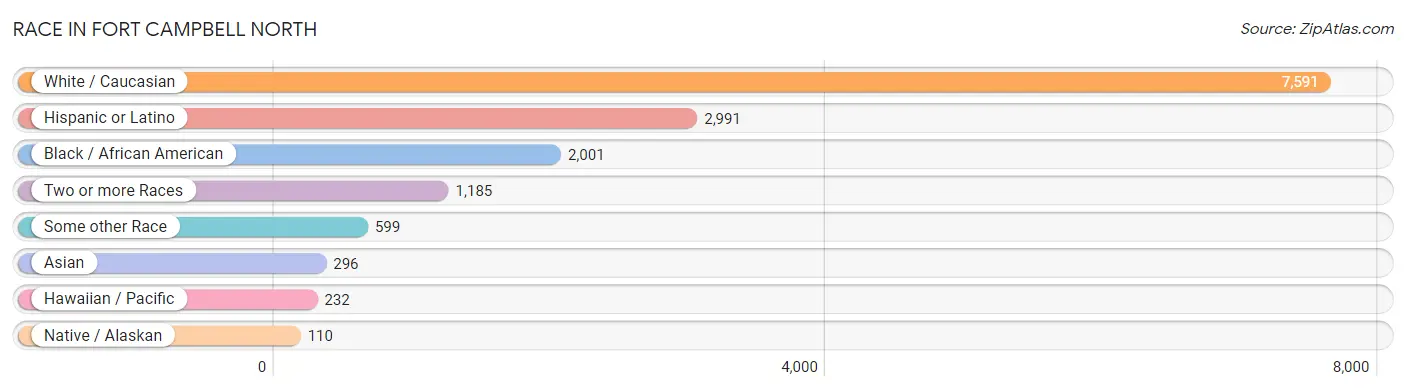
| Race | # Population | % Population |
| Asian | 296 | 2.5% |
| Black / African American | 2,001 | 16.7% |
| Hawaiian / Pacific | 232 | 1.9% |
| Hispanic or Latino | 2,991 | 24.9% |
| Native / Alaskan | 110 | 0.9% |
| White / Caucasian | 7,591 | 63.2% |
| Two or more Races | 1,185 | 9.9% |
| Some other Race | 599 | 5.0% |
| Total | 12,014 | 100.0% |
Ancestry in Fort Campbell North
The most populous ancestries reported in Fort Campbell North are Mexican (1,776 | 14.8%), German (1,518 | 12.6%), European (1,081 | 9.0%), Puerto Rican (749 | 6.2%), and Subsaharan African (627 | 5.2%), together accounting for 47.9% of all Fort Campbell North residents.
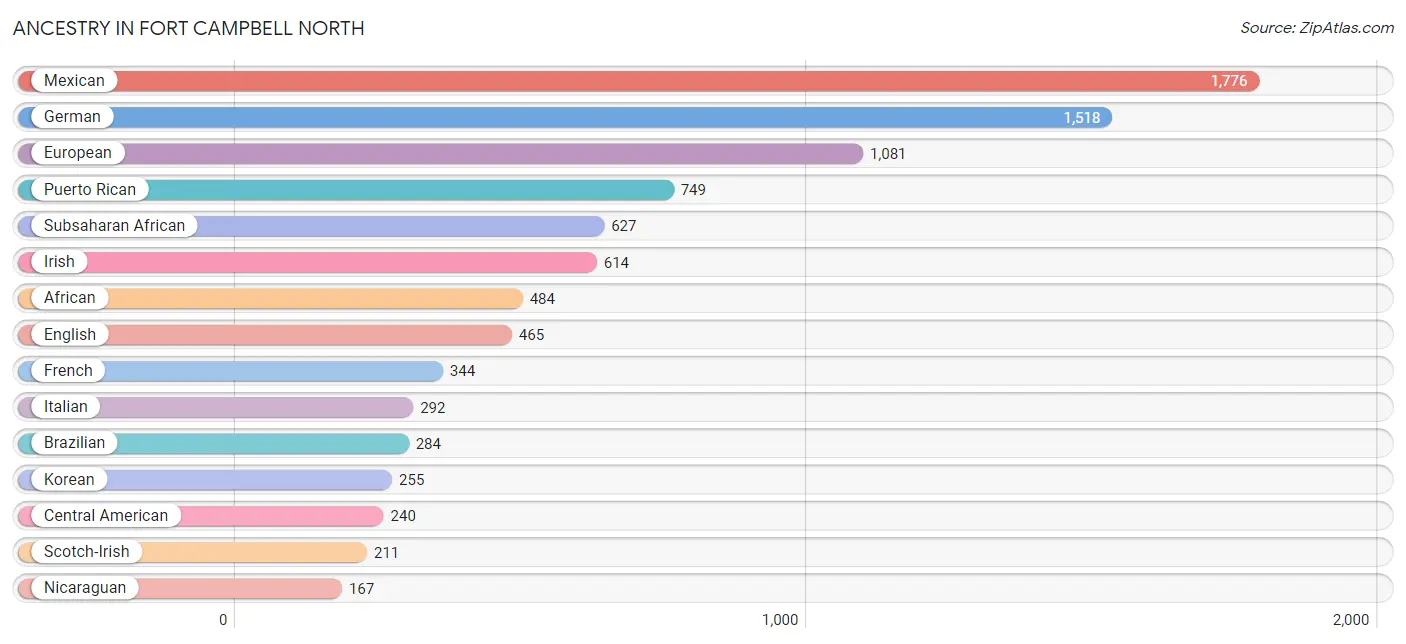
| Ancestry | # Population | % Population |
| African | 484 | 4.0% |
| Albanian | 10 | 0.1% |
| American | 134 | 1.1% |
| Arab | 12 | 0.1% |
| Austrian | 25 | 0.2% |
| Bahamian | 16 | 0.1% |
| Belgian | 15 | 0.1% |
| Bhutanese | 31 | 0.3% |
| Bolivian | 14 | 0.1% |
| Brazilian | 284 | 2.4% |
| British | 43 | 0.4% |
| British West Indian | 21 | 0.2% |
| Burmese | 88 | 0.7% |
| Canadian | 46 | 0.4% |
| Central American | 240 | 2.0% |
| Central American Indian | 23 | 0.2% |
| Cherokee | 58 | 0.5% |
| Chippewa | 5 | 0.0% |
| Choctaw | 12 | 0.1% |
| Colombian | 8 | 0.1% |
| Creek | 18 | 0.2% |
| Cuban | 8 | 0.1% |
| Czech | 42 | 0.4% |
| Dominican | 73 | 0.6% |
| Dutch | 73 | 0.6% |
| Eastern European | 16 | 0.1% |
| English | 465 | 3.9% |
| European | 1,081 | 9.0% |
| French | 344 | 2.9% |
| German | 1,518 | 12.6% |
| Ghanaian | 57 | 0.5% |
| Greek | 118 | 1.0% |
| Guamanian / Chamorro | 122 | 1.0% |
| Guatemalan | 8 | 0.1% |
| Haitian | 13 | 0.1% |
| Honduran | 40 | 0.3% |
| Hungarian | 22 | 0.2% |
| Indian (Asian) | 73 | 0.6% |
| Indonesian | 56 | 0.5% |
| Irish | 614 | 5.1% |
| Italian | 292 | 2.4% |
| Jamaican | 21 | 0.2% |
| Kenyan | 39 | 0.3% |
| Korean | 255 | 2.1% |
| Liberian | 19 | 0.2% |
| Mexican | 1,776 | 14.8% |
| Mexican American Indian | 62 | 0.5% |
| Native Hawaiian | 25 | 0.2% |
| Navajo | 13 | 0.1% |
| Nicaraguan | 167 | 1.4% |
| Nigerian | 14 | 0.1% |
| Norwegian | 80 | 0.7% |
| Pakistani | 37 | 0.3% |
| Panamanian | 3 | 0.0% |
| Peruvian | 1 | 0.0% |
| Polish | 141 | 1.2% |
| Portuguese | 12 | 0.1% |
| Pueblo | 2 | 0.0% |
| Puerto Rican | 749 | 6.2% |
| Romanian | 31 | 0.3% |
| Russian | 57 | 0.5% |
| Salvadoran | 22 | 0.2% |
| Samoan | 45 | 0.4% |
| Scandinavian | 52 | 0.4% |
| Scotch-Irish | 211 | 1.8% |
| Scottish | 166 | 1.4% |
| South American | 23 | 0.2% |
| Spaniard | 29 | 0.2% |
| Spanish | 22 | 0.2% |
| Sri Lankan | 1 | 0.0% |
| Subsaharan African | 627 | 5.2% |
| Swedish | 105 | 0.9% |
| Thai | 13 | 0.1% |
| Tohono O'Odham | 1 | 0.0% |
| Welsh | 35 | 0.3% |
| West Indian | 27 | 0.2% | View All 76 Rows |
Immigrants in Fort Campbell North
The most numerous immigrant groups reported in Fort Campbell North came from Asia (227 | 1.9%), Latin America (122 | 1.0%), Africa (120 | 1.0%), South Eastern Asia (116 | 1.0%), and Western Africa (103 | 0.9%), together accounting for 5.7% of all Fort Campbell North residents.
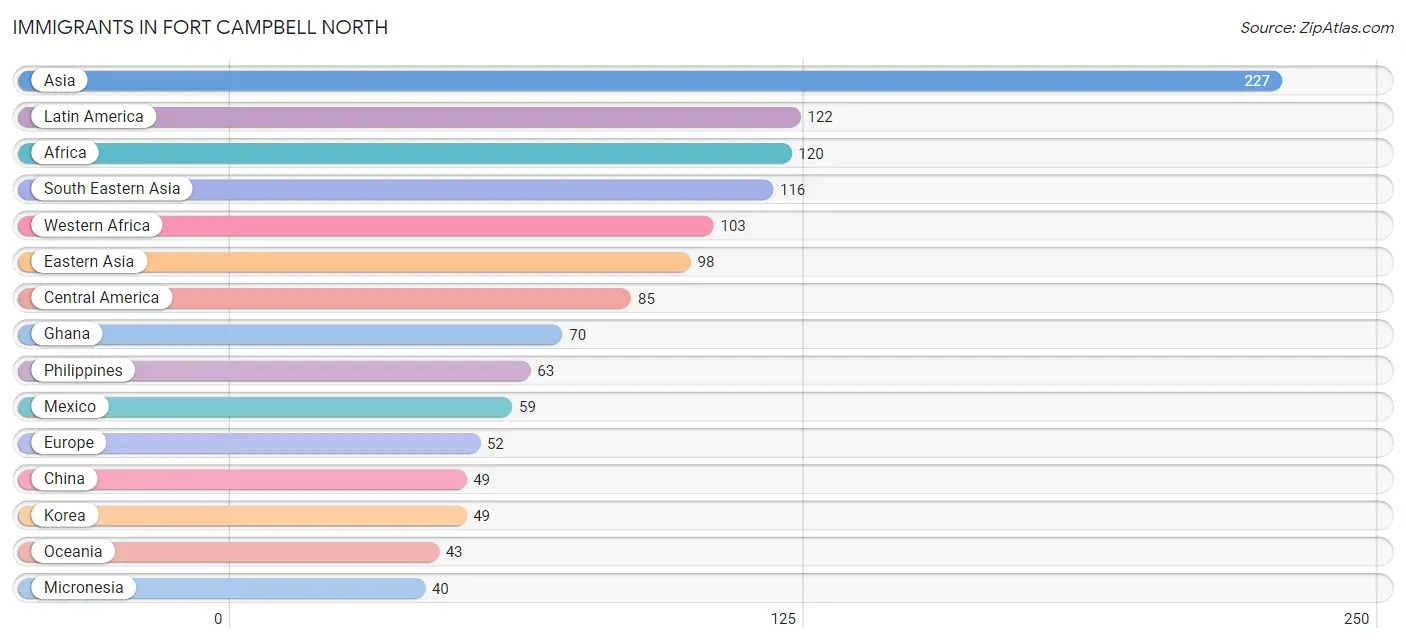
| Immigration Origin | # Population | % Population |
| Africa | 120 | 1.0% |
| Asia | 227 | 1.9% |
| Canada | 11 | 0.1% |
| Caribbean | 36 | 0.3% |
| Central America | 85 | 0.7% |
| China | 49 | 0.4% |
| Eastern Africa | 17 | 0.1% |
| Eastern Asia | 98 | 0.8% |
| Eastern Europe | 34 | 0.3% |
| El Salvador | 9 | 0.1% |
| England | 8 | 0.1% |
| Europe | 52 | 0.4% |
| Germany | 9 | 0.1% |
| Ghana | 70 | 0.6% |
| Honduras | 17 | 0.1% |
| India | 13 | 0.1% |
| Ireland | 1 | 0.0% |
| Jamaica | 17 | 0.1% |
| Kenya | 17 | 0.1% |
| Korea | 49 | 0.4% |
| Latin America | 122 | 1.0% |
| Liberia | 19 | 0.2% |
| Mexico | 59 | 0.5% |
| Micronesia | 40 | 0.3% |
| Northern Europe | 9 | 0.1% |
| Oceania | 43 | 0.4% |
| Peru | 1 | 0.0% |
| Philippines | 63 | 0.5% |
| Russia | 26 | 0.2% |
| South America | 1 | 0.0% |
| South Central Asia | 13 | 0.1% |
| South Eastern Asia | 116 | 1.0% |
| St. Vincent and the Grenadines | 5 | 0.0% |
| Thailand | 19 | 0.2% |
| Ukraine | 8 | 0.1% |
| Western Africa | 103 | 0.9% |
| Western Europe | 9 | 0.1% | View All 37 Rows |
Sex and Age in Fort Campbell North
Sex and Age in Fort Campbell North
The most populous age groups in Fort Campbell North are 20 to 24 Years (2,741 | 36.4%) for men and Under 5 Years (1,053 | 23.4%) for women.
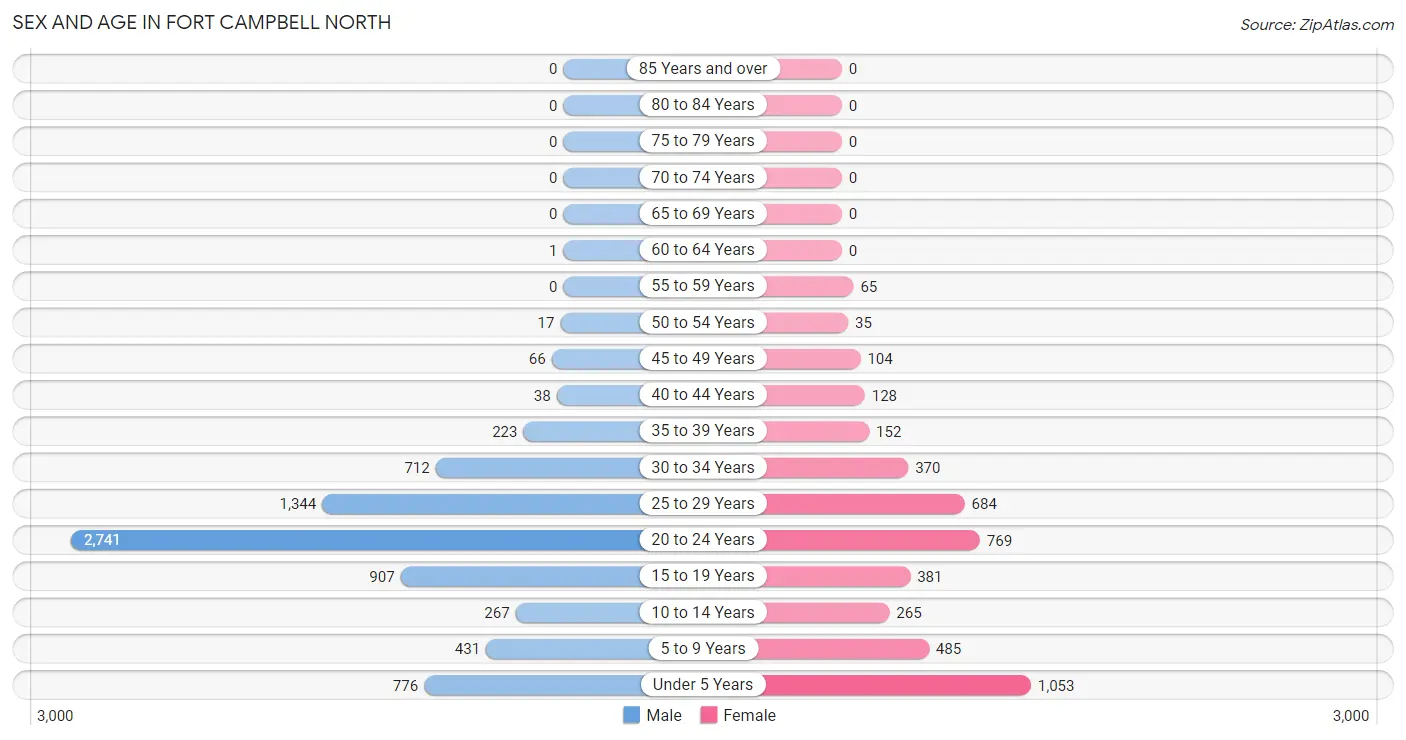
| Age Bracket | Male | Female |
| Under 5 Years | 776 (10.3%) | 1,053 (23.4%) |
| 5 to 9 Years | 431 (5.7%) | 485 (10.8%) |
| 10 to 14 Years | 267 (3.5%) | 265 (5.9%) |
| 15 to 19 Years | 907 (12.1%) | 381 (8.5%) |
| 20 to 24 Years | 2,741 (36.4%) | 769 (17.1%) |
| 25 to 29 Years | 1,344 (17.9%) | 684 (15.2%) |
| 30 to 34 Years | 712 (9.5%) | 370 (8.2%) |
| 35 to 39 Years | 223 (3.0%) | 152 (3.4%) |
| 40 to 44 Years | 38 (0.5%) | 128 (2.9%) |
| 45 to 49 Years | 66 (0.9%) | 104 (2.3%) |
| 50 to 54 Years | 17 (0.2%) | 35 (0.8%) |
| 55 to 59 Years | 0 (0.0%) | 65 (1.5%) |
| 60 to 64 Years | 1 (0.0%) | 0 (0.0%) |
| 65 to 69 Years | 0 (0.0%) | 0 (0.0%) |
| 70 to 74 Years | 0 (0.0%) | 0 (0.0%) |
| 75 to 79 Years | 0 (0.0%) | 0 (0.0%) |
| 80 to 84 Years | 0 (0.0%) | 0 (0.0%) |
| 85 Years and over | 0 (0.0%) | 0 (0.0%) |
| Total | 7,523 (100.0%) | 4,491 (100.0%) |
Families and Households in Fort Campbell North
Median Family Size in Fort Campbell North
The median family size in Fort Campbell North is 3.41 persons per family, with single female/mother families (206 | 8.7%) accounting for the largest median family size of 4.42 persons per family. On the other hand, single male/father families (136 | 5.8%) represent the smallest median family size with 3.02 persons per family.
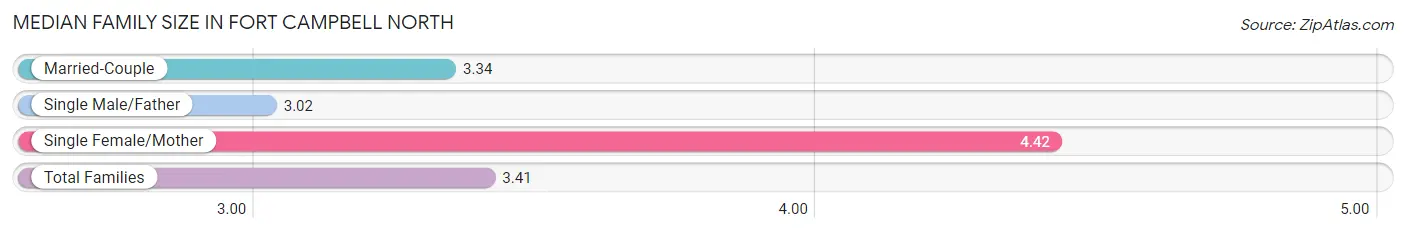
| Family Type | # Families | Family Size |
| Married-Couple | 2,016 (85.5%) | 3.34 |
| Single Male/Father | 136 (5.8%) | 3.02 |
| Single Female/Mother | 206 (8.7%) | 4.42 |
| Total Families | 2,358 (100.0%) | 3.41 |
Median Household Size in Fort Campbell North
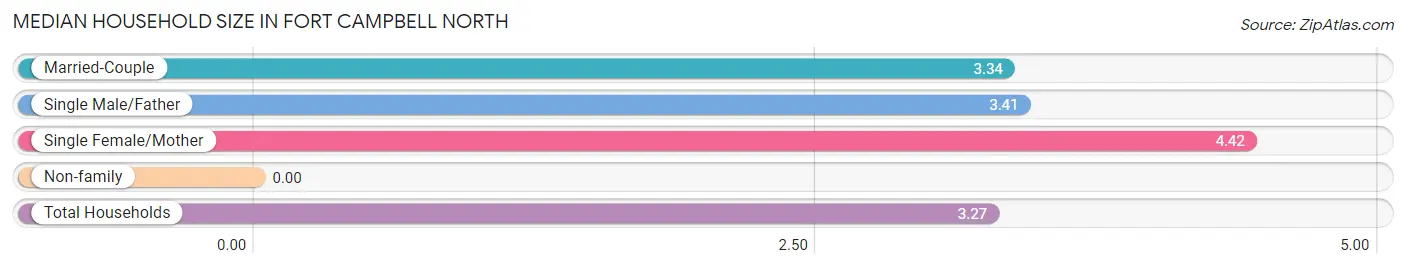
| Household Type | # Households | Household Size |
| Married-Couple | 2,016 (79.8%) | 3.34 |
| Single Male/Father | 136 (5.4%) | 3.41 |
| Single Female/Mother | 206 (8.2%) | 4.42 |
| Non-family | 167 (6.6%) | - |
| Total Households | 2,525 (100.0%) | 3.27 |
Household Size by Marriage Status in Fort Campbell North
Out of a total of 2,525 households in Fort Campbell North, 2,358 (93.4%) are family households, while 167 (6.6%) are nonfamily households. The most numerous type of family households are 4-person households, comprising 700, and the most common type of nonfamily households are 1-person households, comprising 167.
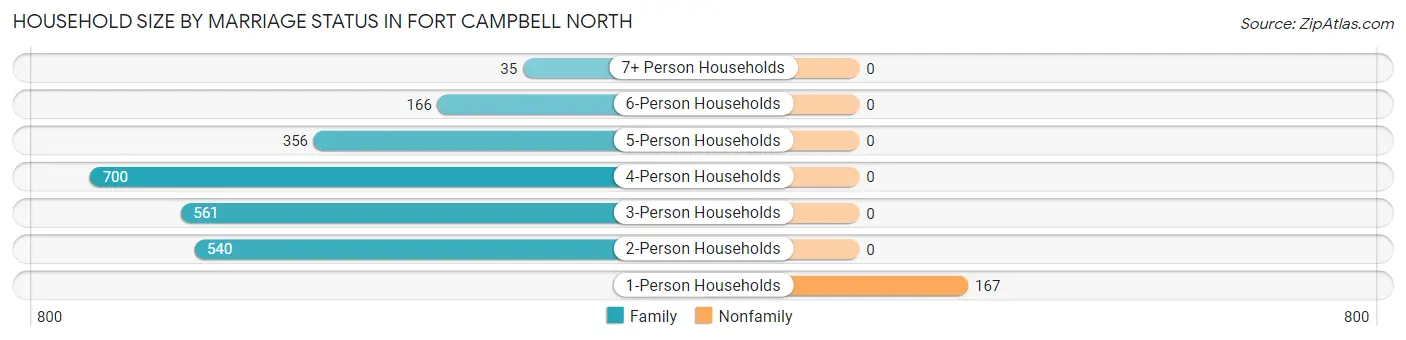
| Household Size | Family Households | Nonfamily Households |
| 1-Person Households | - | 167 (6.6%) |
| 2-Person Households | 540 (21.4%) | 0 (0.0%) |
| 3-Person Households | 561 (22.2%) | 0 (0.0%) |
| 4-Person Households | 700 (27.7%) | 0 (0.0%) |
| 5-Person Households | 356 (14.1%) | 0 (0.0%) |
| 6-Person Households | 166 (6.6%) | 0 (0.0%) |
| 7+ Person Households | 35 (1.4%) | 0 (0.0%) |
| Total | 2,358 (93.4%) | 167 (6.6%) |
Female Fertility in Fort Campbell North
Fertility by Age in Fort Campbell North
Average fertility rate in Fort Campbell North is 134.0 births per 1,000 women. Women in the age bracket of 20 to 34 years have the highest fertility rate with 184.0 births per 1,000 women. Women in the age bracket of 20 to 34 years acount for 96.8% of all women with births.
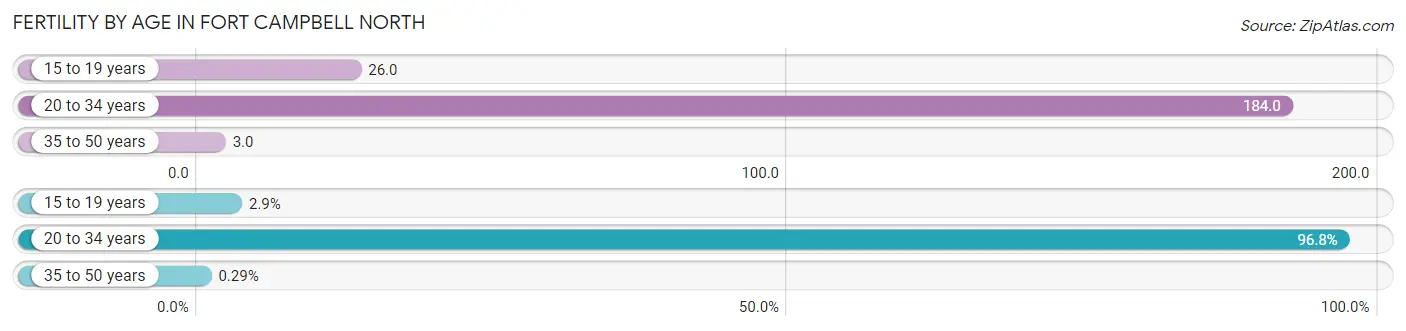
| Age Bracket | Women with Births | Births / 1,000 Women |
| 15 to 19 years | 10 (2.9%) | 26.0 |
| 20 to 34 years | 336 (96.8%) | 184.0 |
| 35 to 50 years | 1 (0.3%) | 3.0 |
| Total | 347 (100.0%) | 134.0 |
Fertility by Age by Marriage Status in Fort Campbell North
98.6% of women with births (347) in Fort Campbell North are married. The highest percentage of unmarried women with births falls into 20 to 34 years age bracket with 1.5% of them unmarried at the time of birth, while the lowest percentage of unmarried women with births belong to 15 to 19 years age bracket with 0.0% of them unmarried.
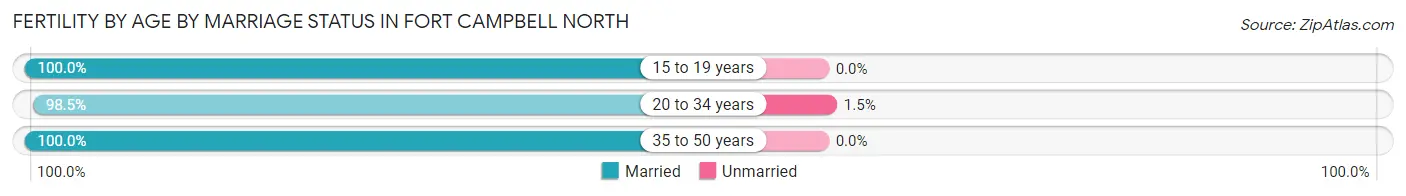
| Age Bracket | Married | Unmarried |
| 15 to 19 years | 10 (100.0%) | 0 (0.0%) |
| 20 to 34 years | 331 (98.5%) | 5 (1.5%) |
| 35 to 50 years | 1 (100.0%) | 0 (0.0%) |
| Total | 342 (98.6%) | 5 (1.4%) |
Fertility by Education in Fort Campbell North
Average fertility rate in Fort Campbell North is 134.0 births per 1,000 women. Women with the education attainment of college or associate's degree have the highest fertility rate of 165.0 births per 1,000 women, while women with the education attainment of less than high school have the lowest fertility at 59.0 births per 1,000 women. Women with the education attainment of college or associate's degree represent 54.2% of all women with births.
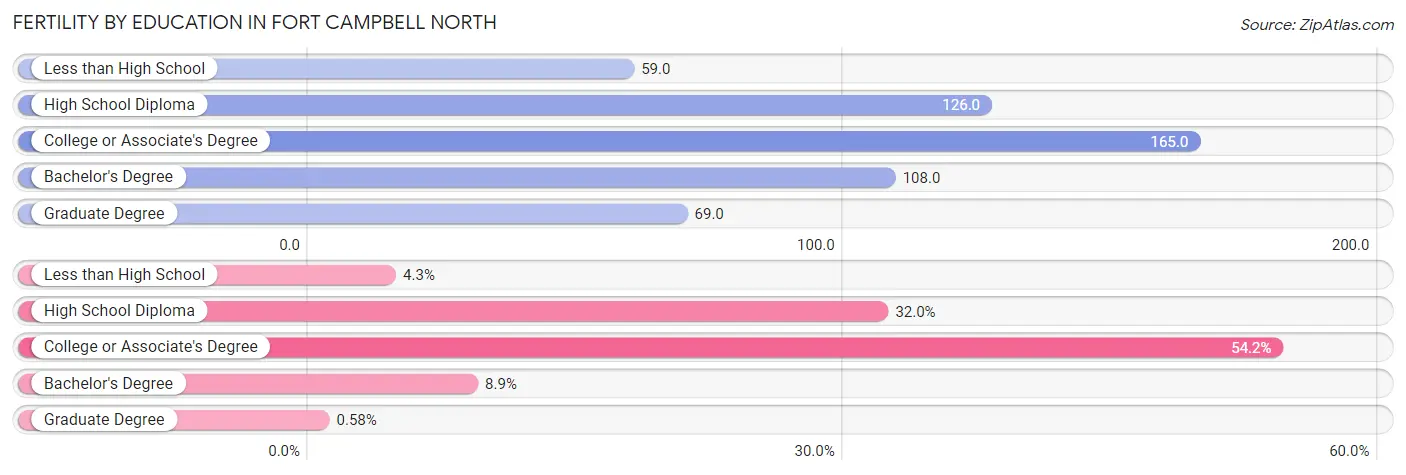
| Educational Attainment | Women with Births | Births / 1,000 Women |
| Less than High School | 15 (4.3%) | 59.0 |
| High School Diploma | 111 (32.0%) | 126.0 |
| College or Associate's Degree | 188 (54.2%) | 165.0 |
| Bachelor's Degree | 31 (8.9%) | 108.0 |
| Graduate Degree | 2 (0.6%) | 69.0 |
| Total | 347 (100.0%) | 134.0 |
Fertility by Education by Marriage Status in Fort Campbell North
1.4% of women with births in Fort Campbell North are unmarried. Women with the educational attainment of less than high school are most likely to be married with 100.0% of them married at childbirth, while women with the educational attainment of college or associate's degree are least likely to be married with 2.7% of them unmarried at childbirth.
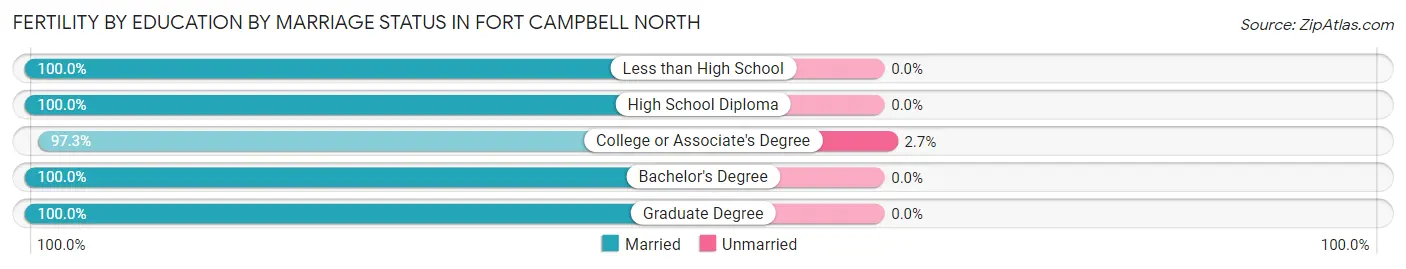
| Educational Attainment | Married | Unmarried |
| Less than High School | 15 (100.0%) | 0 (0.0%) |
| High School Diploma | 111 (100.0%) | 0 (0.0%) |
| College or Associate's Degree | 183 (97.3%) | 5 (2.7%) |
| Bachelor's Degree | 31 (100.0%) | 0 (0.0%) |
| Graduate Degree | 2 (100.0%) | 0 (0.0%) |
| Total | 342 (98.6%) | 5 (1.4%) |
Employment Characteristics in Fort Campbell North
Employment by Class of Employer in Fort Campbell North
Among the 6,741 employed individuals in Fort Campbell North, federal government employees (6,003 | 89.0%), private company employees (570 | 8.5%), and self-employed (not incorporated) (68 | 1.0%) make up the most common classes of employment.
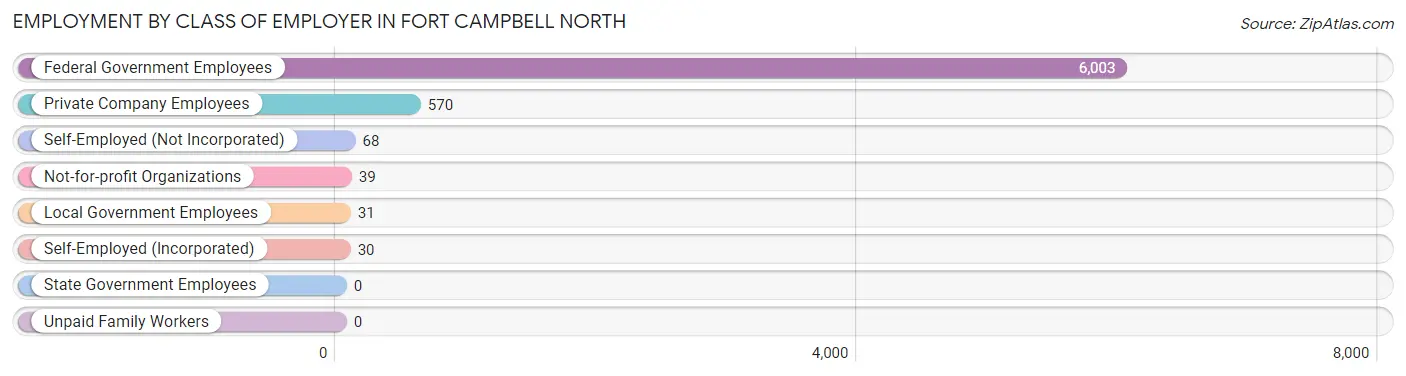
| Employer Class | # Employees | % Employees |
| Private Company Employees | 570 | 8.5% |
| Self-Employed (Incorporated) | 30 | 0.4% |
| Self-Employed (Not Incorporated) | 68 | 1.0% |
| Not-for-profit Organizations | 39 | 0.6% |
| Local Government Employees | 31 | 0.5% |
| State Government Employees | 0 | 0.0% |
| Federal Government Employees | 6,003 | 89.0% |
| Unpaid Family Workers | 0 | 0.0% |
| Total | 6,741 | 100.0% |
Employment Status by Age in Fort Campbell North
According to the labor force statistics for Fort Campbell North, out of the total population over 16 years of age (8,617), 82.0% or 7,066 individuals are in the labor force, with 16.8% or 1,187 of them unemployed. The age group with the highest labor force participation rate is 45 to 54 years, with 100.0% or 222 individuals in the labor force. Within the labor force, the 45 to 54 years age range has the highest percentage of unemployed individuals, with 53.9% or 120 of them being unemployed.
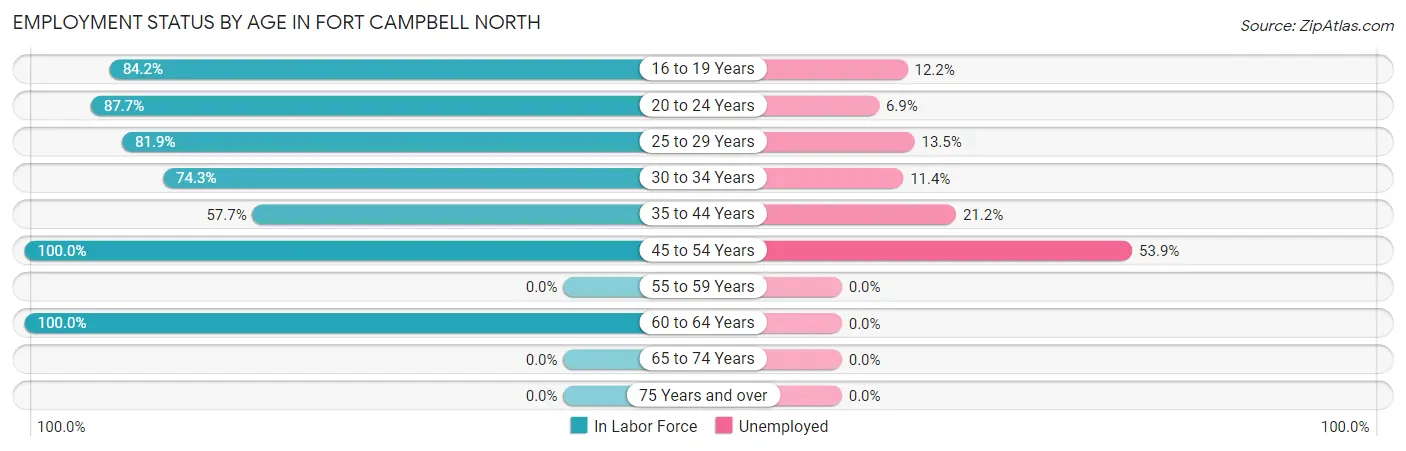
| Age Bracket | In Labor Force | Unemployed |
| 16 to 19 Years | 983 (84.2%) | 120 (12.2%) |
| 20 to 24 Years | 3,078 (87.7%) | 212 (6.9%) |
| 25 to 29 Years | 1,661 (81.9%) | 224 (13.5%) |
| 30 to 34 Years | 804 (74.3%) | 92 (11.4%) |
| 35 to 44 Years | 312 (57.7%) | 66 (21.2%) |
| 45 to 54 Years | 222 (100.0%) | 120 (53.9%) |
| 55 to 59 Years | 0 (0.0%) | 0 (0.0%) |
| 60 to 64 Years | 1 (100.0%) | 0 (0.0%) |
| 65 to 74 Years | 0 (0.0%) | 0 (0.0%) |
| 75 Years and over | 0 (0.0%) | 0 (0.0%) |
| Total | 7,066 (82.0%) | 1,187 (16.8%) |
Employment Status by Educational Attainment in Fort Campbell North
According to labor force statistics for Fort Campbell North, 76.2% of individuals (3,002) out of the total population between 25 and 64 years of age (3,939) are in the labor force, with 21.8% or 654 of them being unemployed. The group with the highest labor force participation rate are those with the educational attainment of bachelor's degree or higher, with 87.9% or 659 individuals in the labor force. Within the labor force, individuals with bachelor's degree or higher education have the highest percentage of unemployment, with 38.2% or 252 of them being unemployed.
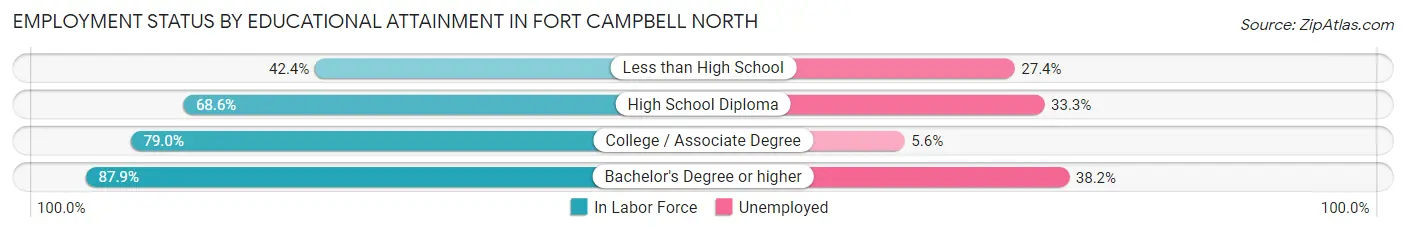
| Educational Attainment | In Labor Force | Unemployed |
| Less than High School | 73 (42.4%) | 47 (27.4%) |
| High School Diploma | 762 (68.6%) | 370 (33.3%) |
| College / Associate Degree | 1,506 (79.0%) | 107 (5.6%) |
| Bachelor's Degree or higher | 659 (87.9%) | 287 (38.2%) |
| Total | 3,002 (76.2%) | 859 (21.8%) |
Employment Occupations by Sex in Fort Campbell North
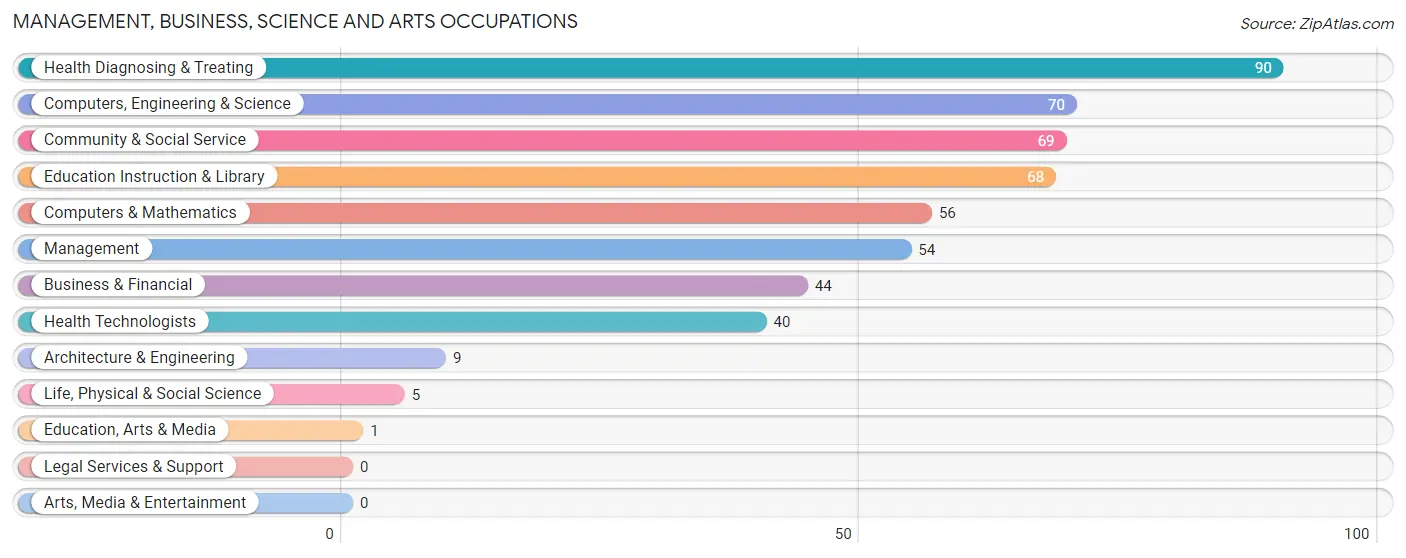
Management, Business, Science and Arts Occupations
The most common Management, Business, Science and Arts occupations in Fort Campbell North are Health Diagnosing & Treating (90 | 7.8%), Computers, Engineering & Science (70 | 6.1%), Community & Social Service (69 | 6.0%), Education Instruction & Library (68 | 5.9%), and Computers & Mathematics (56 | 4.9%).
Management, Business, Science and Arts Occupations by Sex
Within the Management, Business, Science and Arts occupations in Fort Campbell North, the most male-oriented occupations are Computers & Mathematics (100.0%), Architecture & Engineering (100.0%), and Computers, Engineering & Science (92.9%), while the most female-oriented occupations are Life, Physical & Social Science (100.0%), Community & Social Service (100.0%), and Education, Arts & Media (100.0%).
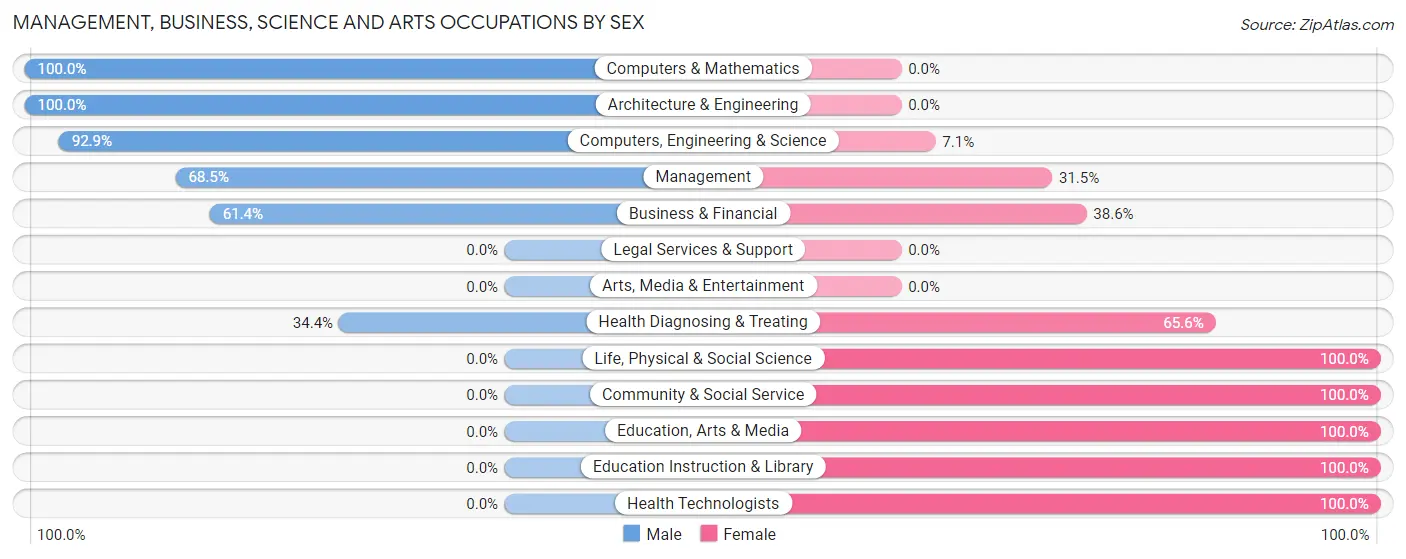
| Occupation | Male | Female |
| Management | 37 (68.5%) | 17 (31.5%) |
| Business & Financial | 27 (61.4%) | 17 (38.6%) |
| Computers, Engineering & Science | 65 (92.9%) | 5 (7.1%) |
| Computers & Mathematics | 56 (100.0%) | 0 (0.0%) |
| Architecture & Engineering | 9 (100.0%) | 0 (0.0%) |
| Life, Physical & Social Science | 0 (0.0%) | 5 (100.0%) |
| Community & Social Service | 0 (0.0%) | 69 (100.0%) |
| Education, Arts & Media | 0 (0.0%) | 1 (100.0%) |
| Legal Services & Support | 0 (0.0%) | 0 (0.0%) |
| Education Instruction & Library | 0 (0.0%) | 68 (100.0%) |
| Arts, Media & Entertainment | 0 (0.0%) | 0 (0.0%) |
| Health Diagnosing & Treating | 31 (34.4%) | 59 (65.6%) |
| Health Technologists | 0 (0.0%) | 40 (100.0%) |
| Total (Category) | 160 (48.9%) | 167 (51.1%) |
| Total (Overall) | 399 (34.6%) | 753 (65.4%) |
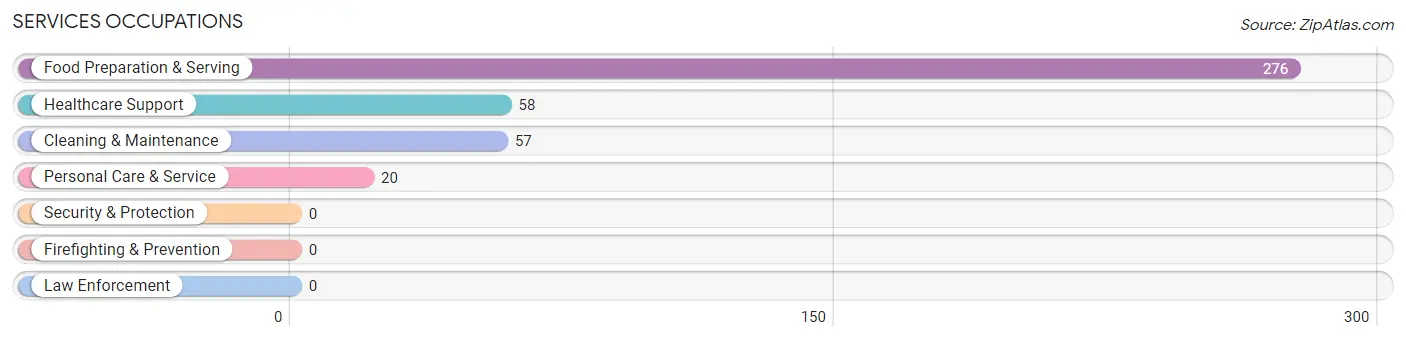
Services Occupations
The most common Services occupations in Fort Campbell North are Food Preparation & Serving (276 | 24.0%), Healthcare Support (58 | 5.0%), Cleaning & Maintenance (57 | 5.0%), and Personal Care & Service (20 | 1.7%).
Services Occupations by Sex
Within the Services occupations in Fort Campbell North, the most male-oriented occupations are Cleaning & Maintenance (52.6%), and Food Preparation & Serving (33.0%), while the most female-oriented occupations are Healthcare Support (100.0%), Personal Care & Service (100.0%), and Food Preparation & Serving (67.0%).
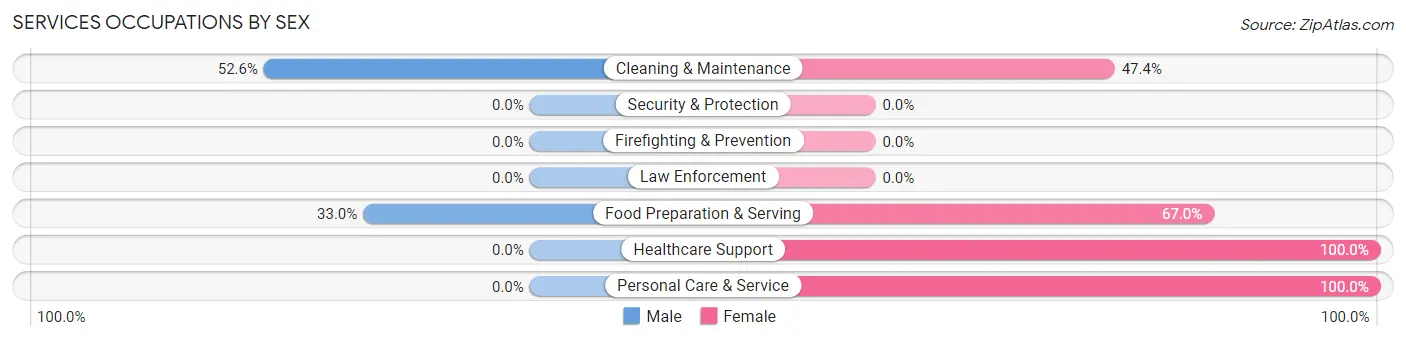
| Occupation | Male | Female |
| Healthcare Support | 0 (0.0%) | 58 (100.0%) |
| Security & Protection | 0 (0.0%) | 0 (0.0%) |
| Firefighting & Prevention | 0 (0.0%) | 0 (0.0%) |
| Law Enforcement | 0 (0.0%) | 0 (0.0%) |
| Food Preparation & Serving | 91 (33.0%) | 185 (67.0%) |
| Cleaning & Maintenance | 30 (52.6%) | 27 (47.4%) |
| Personal Care & Service | 0 (0.0%) | 20 (100.0%) |
| Total (Category) | 121 (29.4%) | 290 (70.6%) |
| Total (Overall) | 399 (34.6%) | 753 (65.4%) |
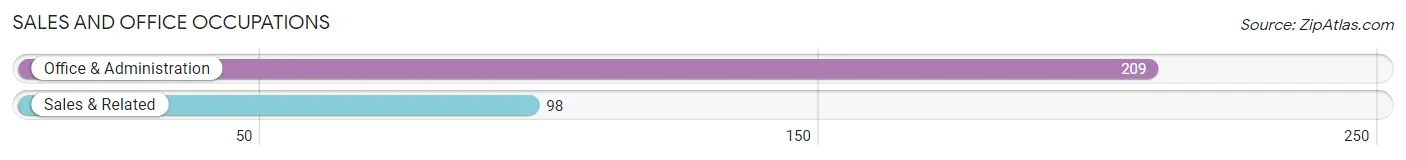
Sales and Office Occupations
The most common Sales and Office occupations in Fort Campbell North are Office & Administration (209 | 18.1%), and Sales & Related (98 | 8.5%).
Sales and Office Occupations by Sex
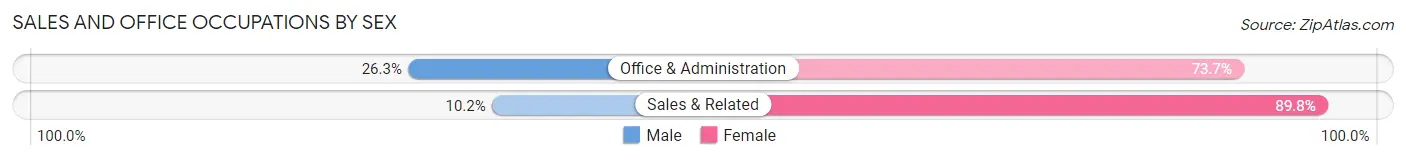
| Occupation | Male | Female |
| Sales & Related | 10 (10.2%) | 88 (89.8%) |
| Office & Administration | 55 (26.3%) | 154 (73.7%) |
| Total (Category) | 65 (21.2%) | 242 (78.8%) |
| Total (Overall) | 399 (34.6%) | 753 (65.4%) |
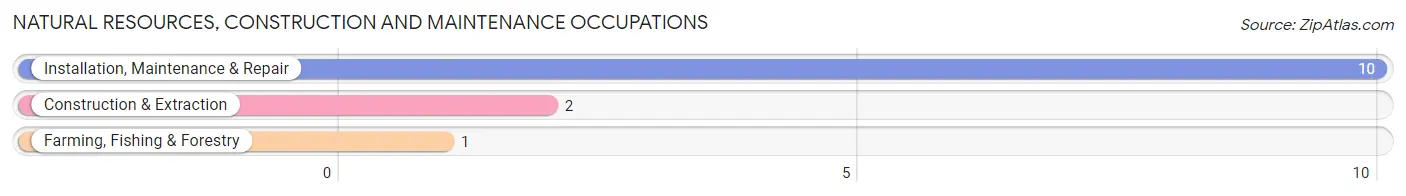
Natural Resources, Construction and Maintenance Occupations
The most common Natural Resources, Construction and Maintenance occupations in Fort Campbell North are Installation, Maintenance & Repair (10 | 0.9%), Construction & Extraction (2 | 0.2%), and Farming, Fishing & Forestry (1 | 0.1%).
Natural Resources, Construction and Maintenance Occupations by Sex
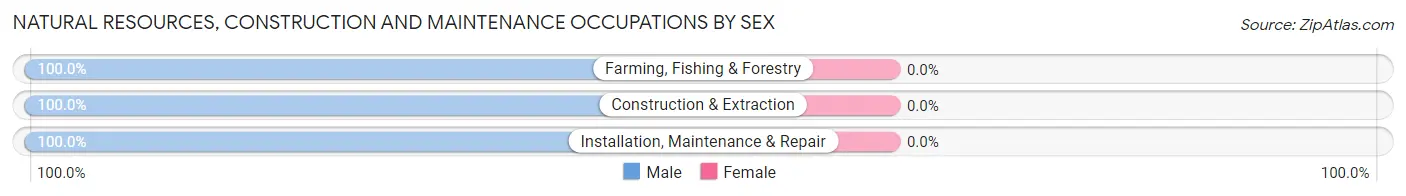
| Occupation | Male | Female |
| Farming, Fishing & Forestry | 1 (100.0%) | 0 (0.0%) |
| Construction & Extraction | 2 (100.0%) | 0 (0.0%) |
| Installation, Maintenance & Repair | 10 (100.0%) | 0 (0.0%) |
| Total (Category) | 13 (100.0%) | 0 (0.0%) |
| Total (Overall) | 399 (34.6%) | 753 (65.4%) |
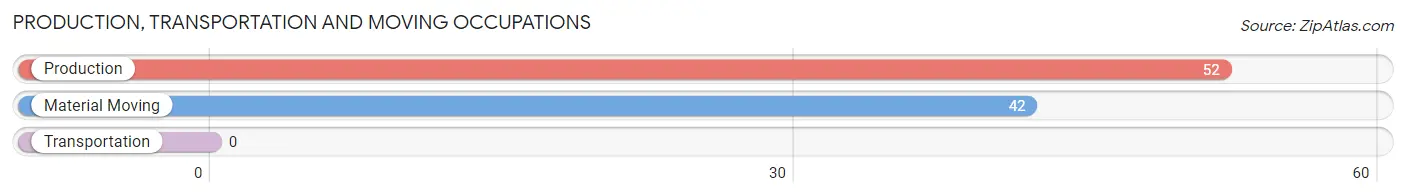
Production, Transportation and Moving Occupations
The most common Production, Transportation and Moving occupations in Fort Campbell North are Production (52 | 4.5%), and Material Moving (42 | 3.6%).
Production, Transportation and Moving Occupations by Sex
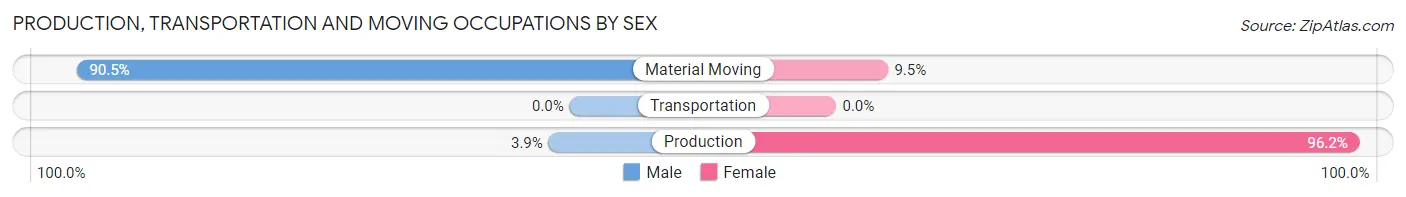
| Occupation | Male | Female |
| Production | 2 (3.8%) | 50 (96.2%) |
| Transportation | 0 (0.0%) | 0 (0.0%) |
| Material Moving | 38 (90.5%) | 4 (9.5%) |
| Total (Category) | 40 (42.5%) | 54 (57.5%) |
| Total (Overall) | 399 (34.6%) | 753 (65.4%) |
Employment Industries by Sex in Fort Campbell North
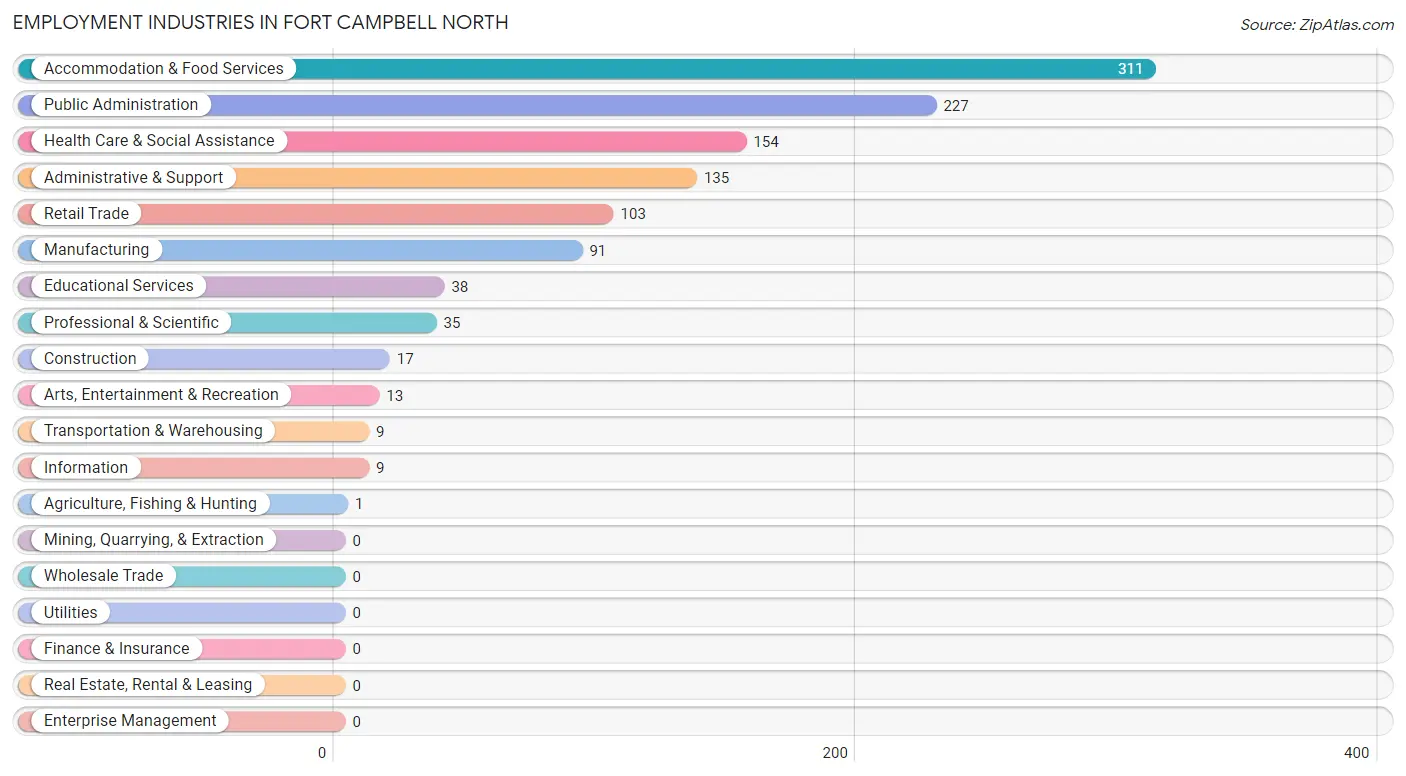
Employment Industries in Fort Campbell North
The major employment industries in Fort Campbell North include Accommodation & Food Services (311 | 27.0%), Public Administration (227 | 19.7%), Health Care & Social Assistance (154 | 13.4%), Administrative & Support (135 | 11.7%), and Retail Trade (103 | 8.9%).
Employment Industries by Sex in Fort Campbell North
The Fort Campbell North industries that see more men than women are Agriculture, Fishing & Hunting (100.0%), Construction (100.0%), and Information (100.0%), whereas the industries that tend to have a higher number of women are Transportation & Warehousing (100.0%), Professional & Scientific (100.0%), and Educational Services (100.0%).
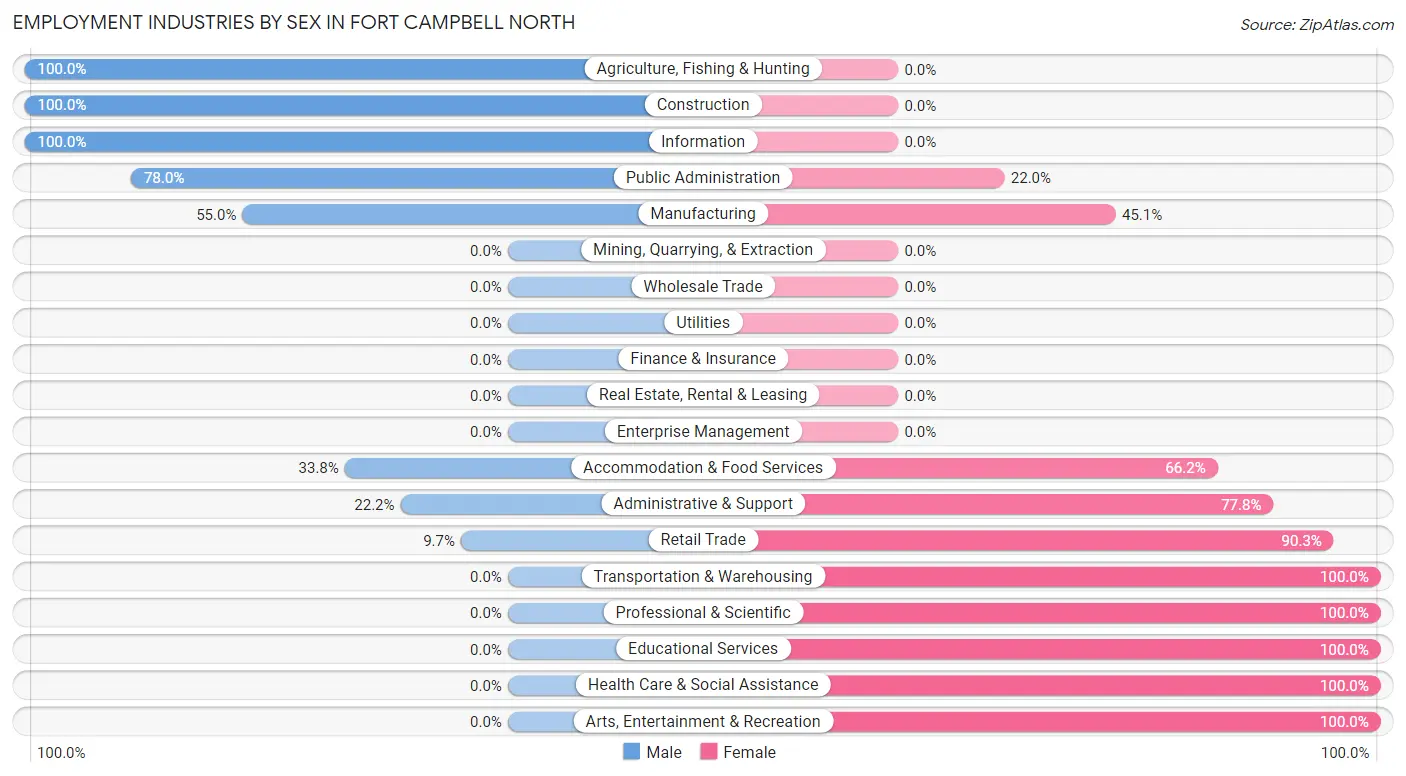
| Industry | Male | Female |
| Agriculture, Fishing & Hunting | 1 (100.0%) | 0 (0.0%) |
| Mining, Quarrying, & Extraction | 0 (0.0%) | 0 (0.0%) |
| Construction | 17 (100.0%) | 0 (0.0%) |
| Manufacturing | 50 (54.9%) | 41 (45.1%) |
| Wholesale Trade | 0 (0.0%) | 0 (0.0%) |
| Retail Trade | 10 (9.7%) | 93 (90.3%) |
| Transportation & Warehousing | 0 (0.0%) | 9 (100.0%) |
| Utilities | 0 (0.0%) | 0 (0.0%) |
| Information | 9 (100.0%) | 0 (0.0%) |
| Finance & Insurance | 0 (0.0%) | 0 (0.0%) |
| Real Estate, Rental & Leasing | 0 (0.0%) | 0 (0.0%) |
| Professional & Scientific | 0 (0.0%) | 35 (100.0%) |
| Enterprise Management | 0 (0.0%) | 0 (0.0%) |
| Administrative & Support | 30 (22.2%) | 105 (77.8%) |
| Educational Services | 0 (0.0%) | 38 (100.0%) |
| Health Care & Social Assistance | 0 (0.0%) | 154 (100.0%) |
| Arts, Entertainment & Recreation | 0 (0.0%) | 13 (100.0%) |
| Accommodation & Food Services | 105 (33.8%) | 206 (66.2%) |
| Public Administration | 177 (78.0%) | 50 (22.0%) |
| Total | 399 (34.6%) | 753 (65.4%) |
Education in Fort Campbell North
School Enrollment in Fort Campbell North
The most common levels of schooling among the 2,780 students in Fort Campbell North are college / undergraduate (755 | 27.2%), elementary school (550 | 19.8%), and middle school (466 | 16.8%).
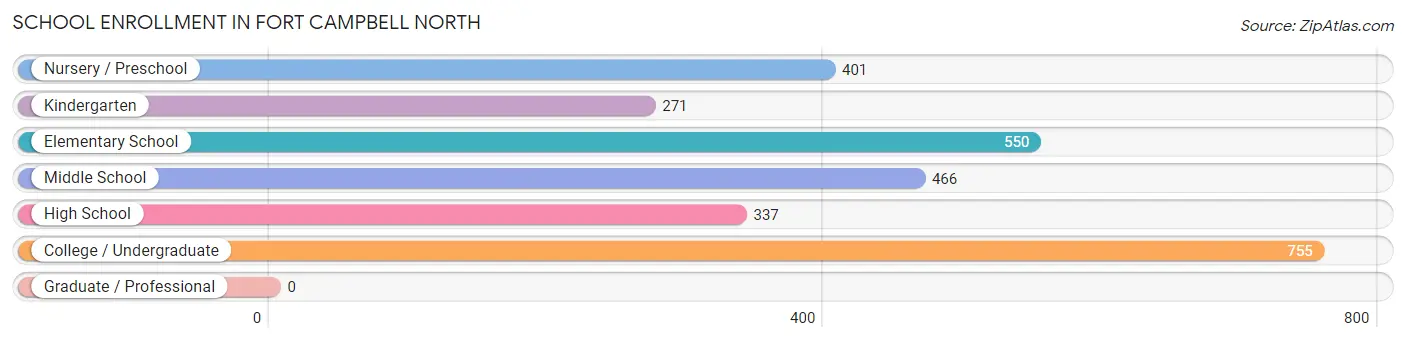
| School Level | # Students | % Students |
| Nursery / Preschool | 401 | 14.4% |
| Kindergarten | 271 | 9.8% |
| Elementary School | 550 | 19.8% |
| Middle School | 466 | 16.8% |
| High School | 337 | 12.1% |
| College / Undergraduate | 755 | 27.2% |
| Graduate / Professional | 0 | 0.0% |
| Total | 2,780 | 100.0% |
School Enrollment by Age by Funding Source in Fort Campbell North
Out of a total of 2,780 students who are enrolled in schools in Fort Campbell North, 186 (6.7%) attend a private institution, while the remaining 2,594 (93.3%) are enrolled in public schools. The age group of 25 to 34 year olds has the highest likelihood of being enrolled in private schools, with 40 (10.9% in the age bracket) enrolled. Conversely, the age group of 15 to 17 year olds has the lowest likelihood of being enrolled in a private school, with 291 (100.0% in the age bracket) attending a public institution.
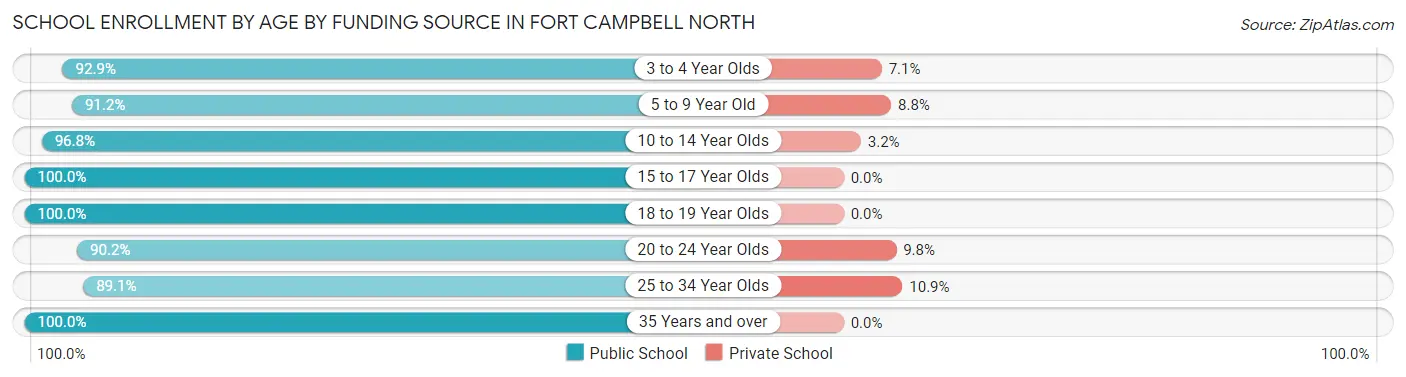
| Age Bracket | Public School | Private School |
| 3 to 4 Year Olds | 275 (92.9%) | 21 (7.1%) |
| 5 to 9 Year Old | 795 (91.2%) | 77 (8.8%) |
| 10 to 14 Year Olds | 515 (96.8%) | 17 (3.2%) |
| 15 to 17 Year Olds | 291 (100.0%) | 0 (0.0%) |
| 18 to 19 Year Olds | 67 (100.0%) | 0 (0.0%) |
| 20 to 24 Year Olds | 295 (90.2%) | 32 (9.8%) |
| 25 to 34 Year Olds | 326 (89.1%) | 40 (10.9%) |
| 35 Years and over | 29 (100.0%) | 0 (0.0%) |
| Total | 2,594 (93.3%) | 186 (6.7%) |
Educational Attainment by Field of Study in Fort Campbell North
Arts & humanities (258 | 31.9%), science & technology (149 | 18.4%), business (132 | 16.3%), education (69 | 8.5%), and psychology (41 | 5.1%) are the most common fields of study among 810 individuals in Fort Campbell North who have obtained a bachelor's degree or higher.
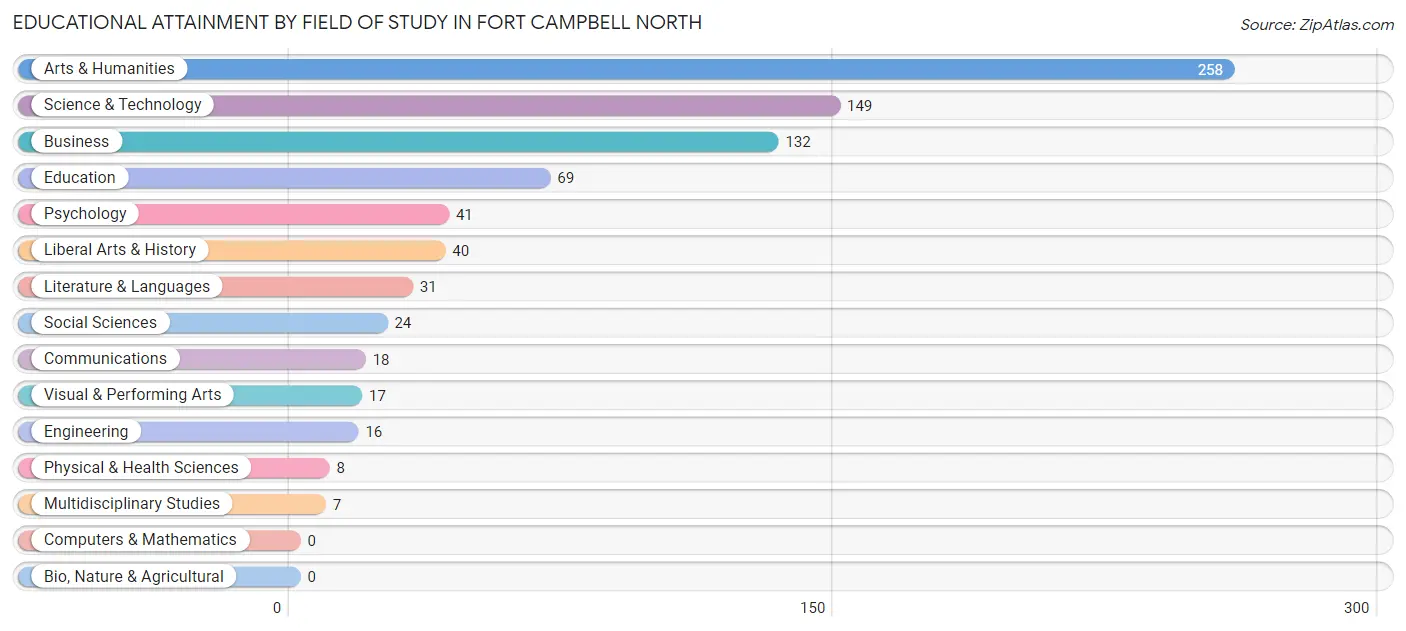
| Field of Study | # Graduates | % Graduates |
| Computers & Mathematics | 0 | 0.0% |
| Bio, Nature & Agricultural | 0 | 0.0% |
| Physical & Health Sciences | 8 | 1.0% |
| Psychology | 41 | 5.1% |
| Social Sciences | 24 | 3.0% |
| Engineering | 16 | 2.0% |
| Multidisciplinary Studies | 7 | 0.9% |
| Science & Technology | 149 | 18.4% |
| Business | 132 | 16.3% |
| Education | 69 | 8.5% |
| Literature & Languages | 31 | 3.8% |
| Liberal Arts & History | 40 | 4.9% |
| Visual & Performing Arts | 17 | 2.1% |
| Communications | 18 | 2.2% |
| Arts & Humanities | 258 | 31.9% |
| Total | 810 | 100.0% |
Transportation & Commute in Fort Campbell North
Vehicle Availability by Sex in Fort Campbell North
The most prevalent vehicle ownership categories in Fort Campbell North are males with 2 vehicles (1,433, accounting for 64.5%) and females with 2 vehicles (402, making up 185.6%).
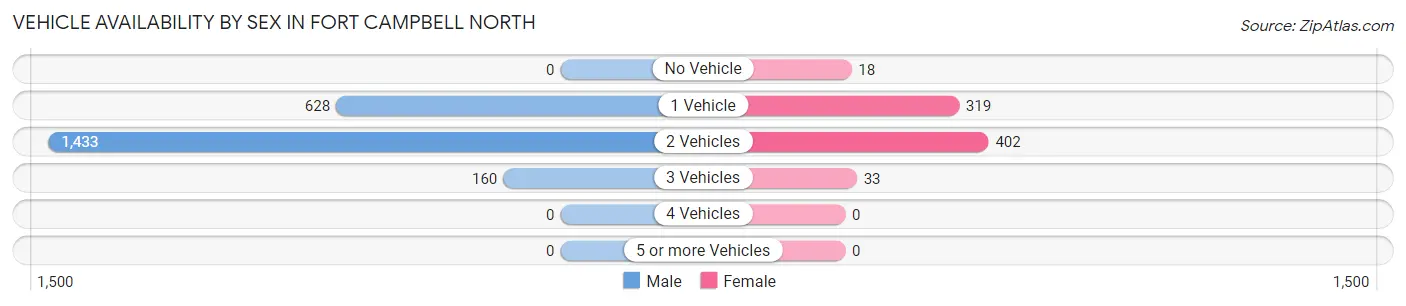
| Vehicles Available | Male | Female |
| No Vehicle | 0 (0.0%) | 18 (2.3%) |
| 1 Vehicle | 628 (28.3%) | 319 (41.3%) |
| 2 Vehicles | 1,433 (64.5%) | 402 (52.1%) |
| 3 Vehicles | 160 (7.2%) | 33 (4.3%) |
| 4 Vehicles | 0 (0.0%) | 0 (0.0%) |
| 5 or more Vehicles | 0 (0.0%) | 0 (0.0%) |
| Total | 2,221 (100.0%) | 772 (100.0%) |
Commute Time in Fort Campbell North
The most frequently occuring commute durations in Fort Campbell North are 5 to 9 minutes (2,535 commuters, 38.2%), less than 5 minutes (1,672 commuters, 25.2%), and 10 to 14 minutes (907 commuters, 13.7%).
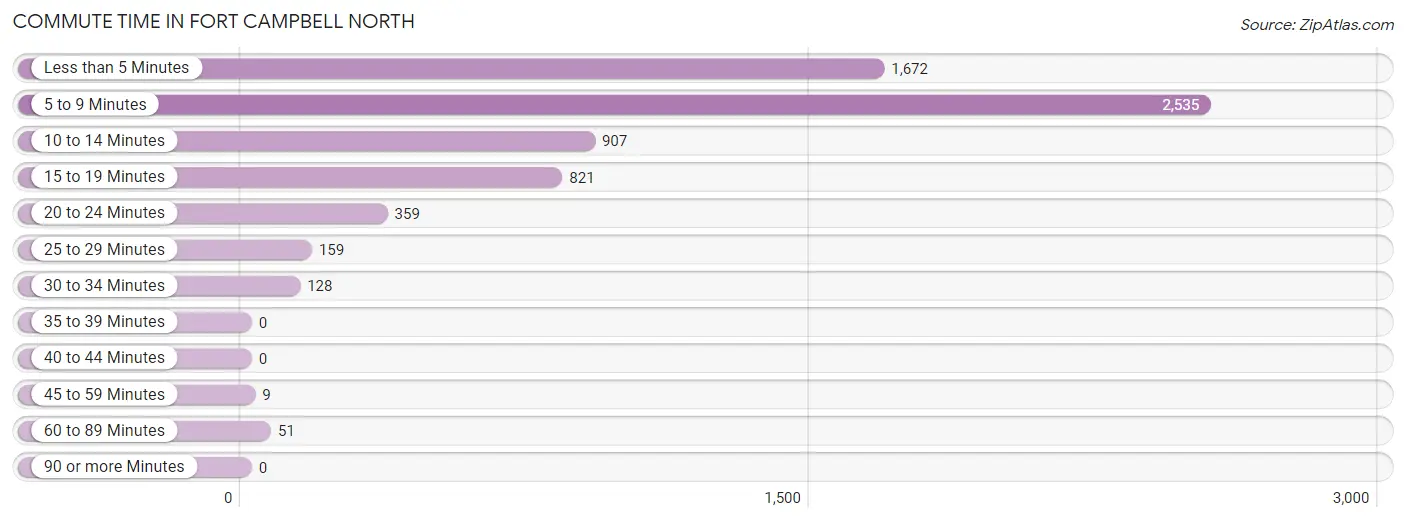
| Commute Time | # Commuters | % Commuters |
| Less than 5 Minutes | 1,672 | 25.2% |
| 5 to 9 Minutes | 2,535 | 38.2% |
| 10 to 14 Minutes | 907 | 13.7% |
| 15 to 19 Minutes | 821 | 12.4% |
| 20 to 24 Minutes | 359 | 5.4% |
| 25 to 29 Minutes | 159 | 2.4% |
| 30 to 34 Minutes | 128 | 1.9% |
| 35 to 39 Minutes | 0 | 0.0% |
| 40 to 44 Minutes | 0 | 0.0% |
| 45 to 59 Minutes | 9 | 0.1% |
| 60 to 89 Minutes | 51 | 0.8% |
| 90 or more Minutes | 0 | 0.0% |
Commute Time by Sex in Fort Campbell North
The most common commute times in Fort Campbell North are 5 to 9 minutes (2,319 commuters, 40.4%) for males and 10 to 14 minutes (283 commuters, 31.2%) for females.
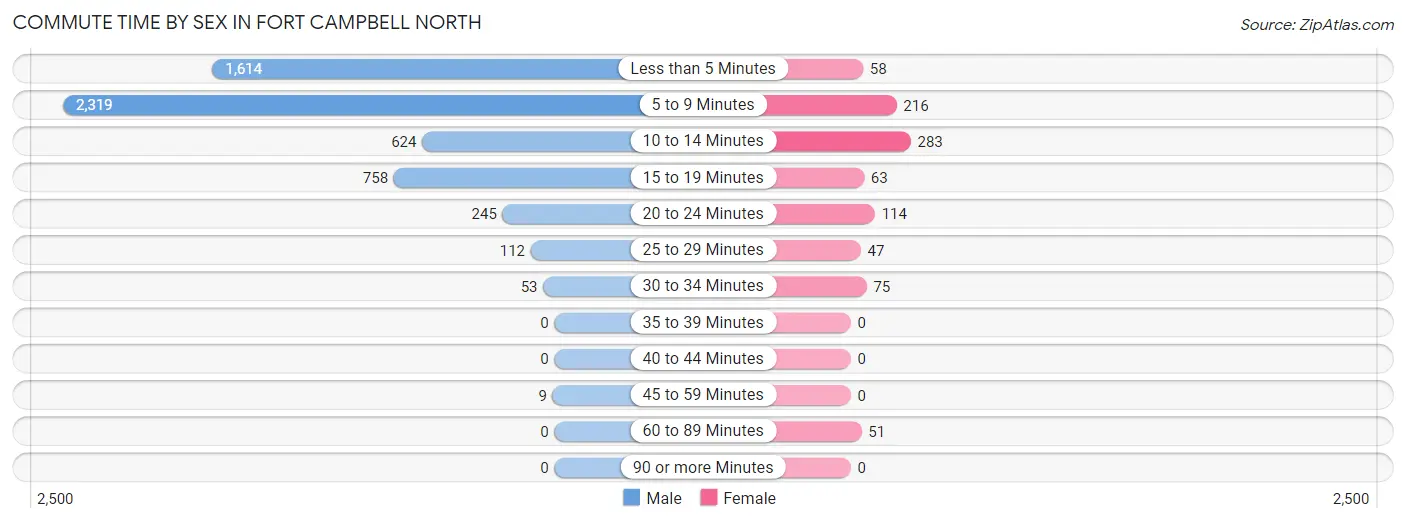
| Commute Time | Male | Female |
| Less than 5 Minutes | 1,614 (28.1%) | 58 (6.4%) |
| 5 to 9 Minutes | 2,319 (40.4%) | 216 (23.8%) |
| 10 to 14 Minutes | 624 (10.9%) | 283 (31.2%) |
| 15 to 19 Minutes | 758 (13.2%) | 63 (7.0%) |
| 20 to 24 Minutes | 245 (4.3%) | 114 (12.6%) |
| 25 to 29 Minutes | 112 (1.9%) | 47 (5.2%) |
| 30 to 34 Minutes | 53 (0.9%) | 75 (8.3%) |
| 35 to 39 Minutes | 0 (0.0%) | 0 (0.0%) |
| 40 to 44 Minutes | 0 (0.0%) | 0 (0.0%) |
| 45 to 59 Minutes | 9 (0.2%) | 0 (0.0%) |
| 60 to 89 Minutes | 0 (0.0%) | 51 (5.6%) |
| 90 or more Minutes | 0 (0.0%) | 0 (0.0%) |
Time of Departure to Work by Sex in Fort Campbell North
The most frequent times of departure to work in Fort Campbell North are 5:30 AM to 5:59 AM (2,425, 42.3%) for males and 6:00 AM to 6:29 AM (140, 15.4%) for females.
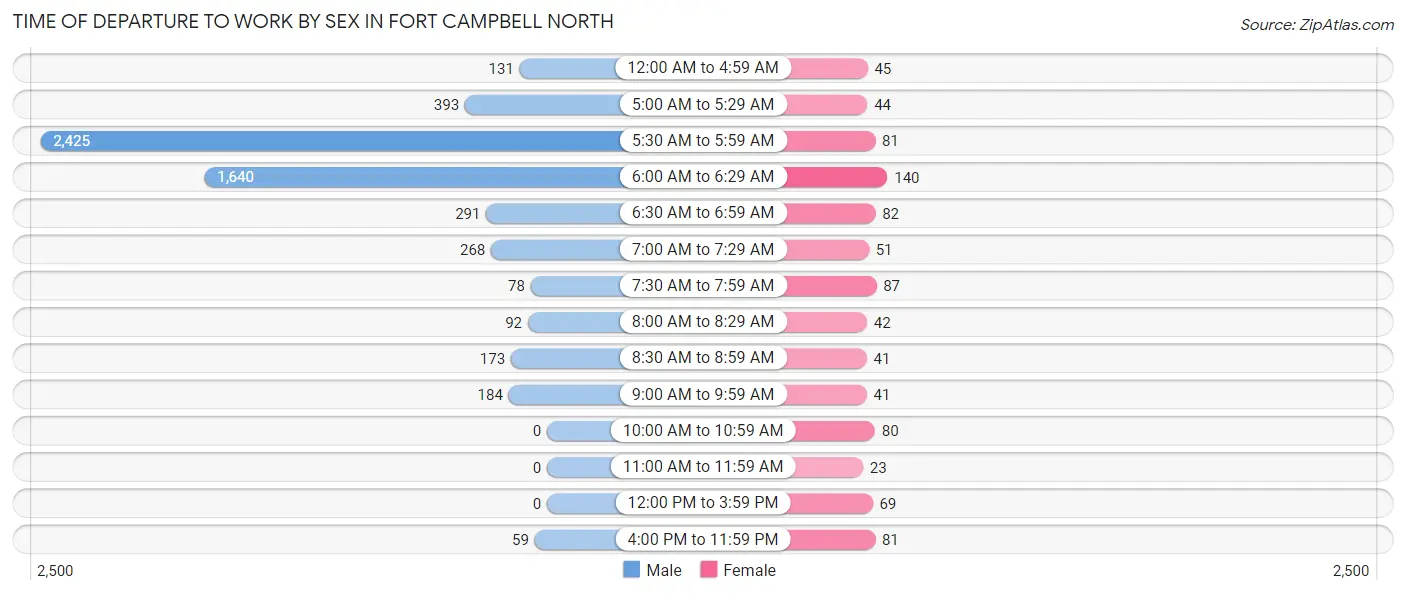
| Time of Departure | Male | Female |
| 12:00 AM to 4:59 AM | 131 (2.3%) | 45 (5.0%) |
| 5:00 AM to 5:29 AM | 393 (6.9%) | 44 (4.9%) |
| 5:30 AM to 5:59 AM | 2,425 (42.3%) | 81 (8.9%) |
| 6:00 AM to 6:29 AM | 1,640 (28.6%) | 140 (15.4%) |
| 6:30 AM to 6:59 AM | 291 (5.1%) | 82 (9.0%) |
| 7:00 AM to 7:29 AM | 268 (4.7%) | 51 (5.6%) |
| 7:30 AM to 7:59 AM | 78 (1.4%) | 87 (9.6%) |
| 8:00 AM to 8:29 AM | 92 (1.6%) | 42 (4.6%) |
| 8:30 AM to 8:59 AM | 173 (3.0%) | 41 (4.5%) |
| 9:00 AM to 9:59 AM | 184 (3.2%) | 41 (4.5%) |
| 10:00 AM to 10:59 AM | 0 (0.0%) | 80 (8.8%) |
| 11:00 AM to 11:59 AM | 0 (0.0%) | 23 (2.5%) |
| 12:00 PM to 3:59 PM | 0 (0.0%) | 69 (7.6%) |
| 4:00 PM to 11:59 PM | 59 (1.0%) | 81 (8.9%) |
| Total | 5,734 (100.0%) | 907 (100.0%) |
Housing Occupancy in Fort Campbell North
Occupancy by Ownership in Fort Campbell North
Of the total 2,525 dwellings in Fort Campbell North, owner-occupied units account for 20 (0.8%), while renter-occupied units make up 2,505 (99.2%).
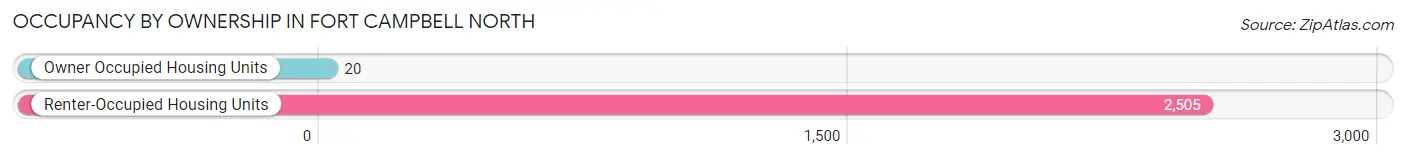
| Occupancy | # Housing Units | % Housing Units |
| Owner Occupied Housing Units | 20 | 0.8% |
| Renter-Occupied Housing Units | 2,505 | 99.2% |
| Total Occupied Housing Units | 2,525 | 100.0% |
Occupancy by Household Size in Fort Campbell North
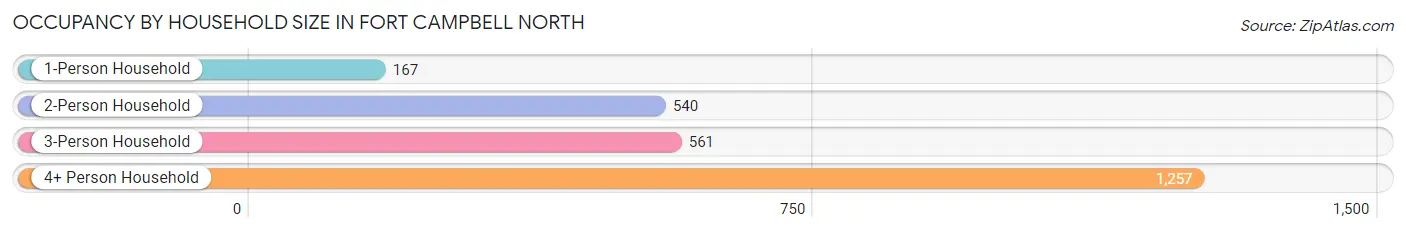
| Household Size | # Housing Units | % Housing Units |
| 1-Person Household | 167 | 6.6% |
| 2-Person Household | 540 | 21.4% |
| 3-Person Household | 561 | 22.2% |
| 4+ Person Household | 1,257 | 49.8% |
| Total Housing Units | 2,525 | 100.0% |
Occupancy by Ownership by Household Size in Fort Campbell North
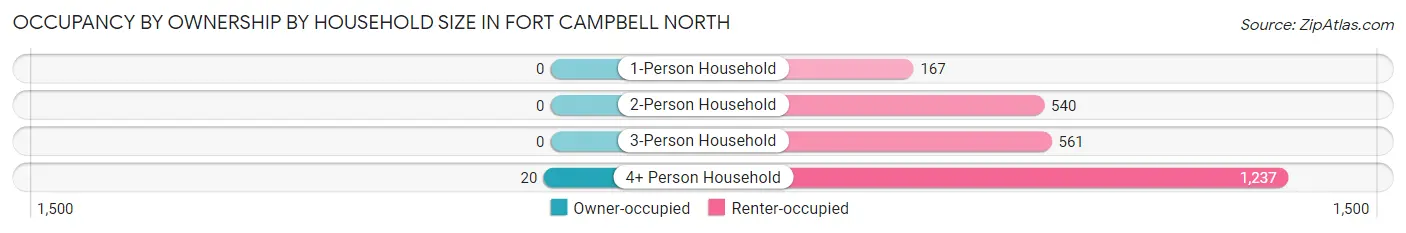
| Household Size | Owner-occupied | Renter-occupied |
| 1-Person Household | 0 (0.0%) | 167 (100.0%) |
| 2-Person Household | 0 (0.0%) | 540 (100.0%) |
| 3-Person Household | 0 (0.0%) | 561 (100.0%) |
| 4+ Person Household | 20 (1.6%) | 1,237 (98.4%) |
| Total Housing Units | 20 (0.8%) | 2,505 (99.2%) |
Occupancy by Educational Attainment in Fort Campbell North
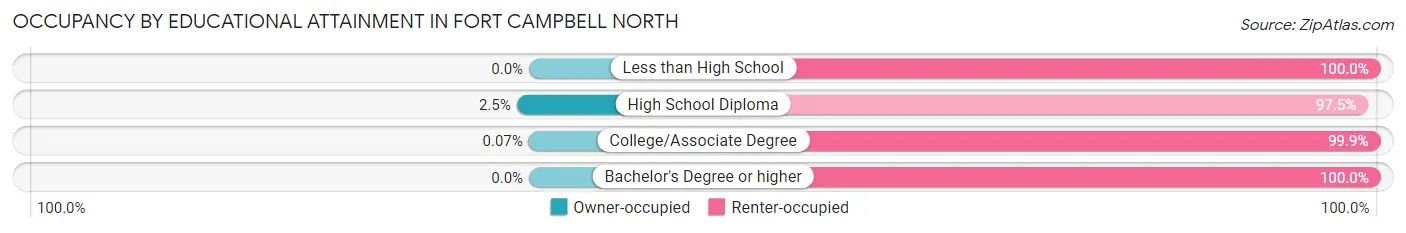
| Household Size | Owner-occupied | Renter-occupied |
| Less than High School | 0 (0.0%) | 112 (100.0%) |
| High School Diploma | 19 (2.5%) | 751 (97.5%) |
| College/Associate Degree | 1 (0.1%) | 1,342 (99.9%) |
| Bachelor's Degree or higher | 0 (0.0%) | 300 (100.0%) |
Occupancy by Age of Householder in Fort Campbell North
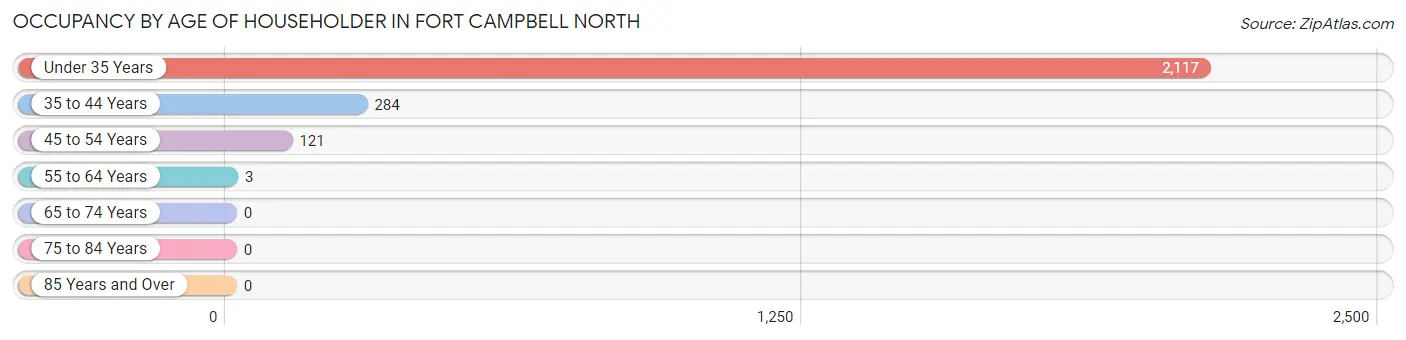
| Age Bracket | # Households | % Households |
| Under 35 Years | 2,117 | 83.8% |
| 35 to 44 Years | 284 | 11.3% |
| 45 to 54 Years | 121 | 4.8% |
| 55 to 64 Years | 3 | 0.1% |
| 65 to 74 Years | 0 | 0.0% |
| 75 to 84 Years | 0 | 0.0% |
| 85 Years and Over | 0 | 0.0% |
| Total | 2,525 | 100.0% |
Housing Finances in Fort Campbell North
Median Income by Occupancy in Fort Campbell North
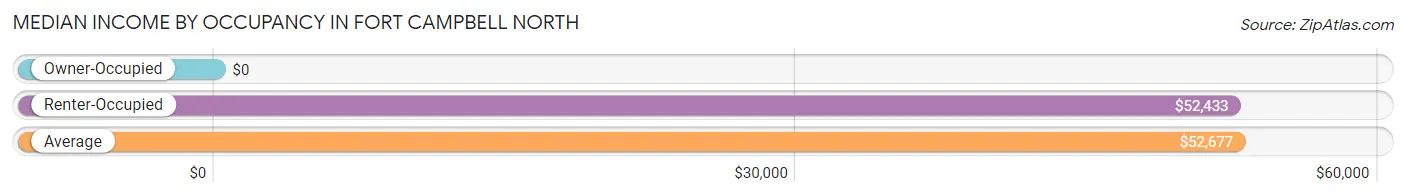
| Occupancy Type | # Households | Median Income |
| Owner-Occupied | 20 (0.8%) | $0 |
| Renter-Occupied | 2,505 (99.2%) | $52,433 |
| Average | 2,525 (100.0%) | $52,677 |
Occupancy by Householder Income Bracket in Fort Campbell North
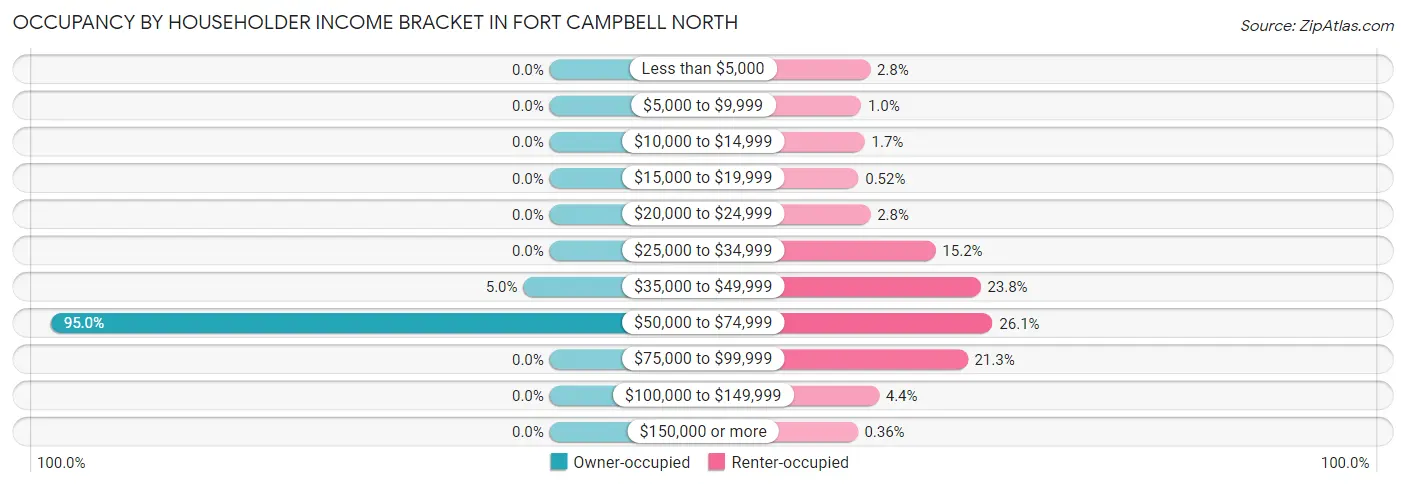
| Income Bracket | Owner-occupied | Renter-occupied |
| Less than $5,000 | 0 (0.0%) | 69 (2.8%) |
| $5,000 to $9,999 | 0 (0.0%) | 26 (1.0%) |
| $10,000 to $14,999 | 0 (0.0%) | 43 (1.7%) |
| $15,000 to $19,999 | 0 (0.0%) | 13 (0.5%) |
| $20,000 to $24,999 | 0 (0.0%) | 70 (2.8%) |
| $25,000 to $34,999 | 0 (0.0%) | 381 (15.2%) |
| $35,000 to $49,999 | 1 (5.0%) | 596 (23.8%) |
| $50,000 to $74,999 | 19 (95.0%) | 653 (26.1%) |
| $75,000 to $99,999 | 0 (0.0%) | 534 (21.3%) |
| $100,000 to $149,999 | 0 (0.0%) | 111 (4.4%) |
| $150,000 or more | 0 (0.0%) | 9 (0.4%) |
| Total | 20 (100.0%) | 2,505 (100.0%) |
Monthly Housing Cost Tiers in Fort Campbell North
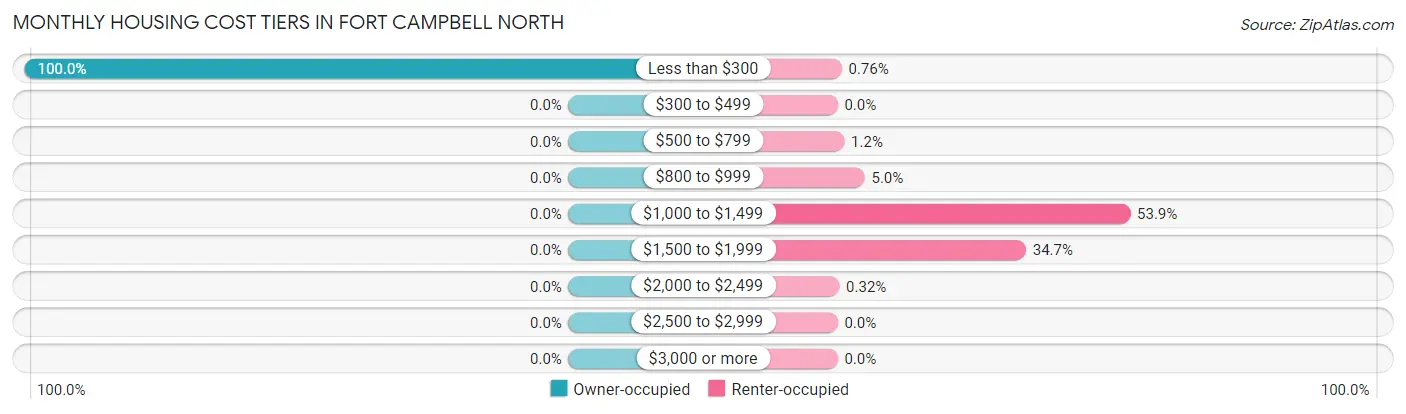
| Monthly Cost | Owner-occupied | Renter-occupied |
| Less than $300 | 20 (100.0%) | 19 (0.8%) |
| $300 to $499 | 0 (0.0%) | 0 (0.0%) |
| $500 to $799 | 0 (0.0%) | 31 (1.2%) |
| $800 to $999 | 0 (0.0%) | 125 (5.0%) |
| $1,000 to $1,499 | 0 (0.0%) | 1,350 (53.9%) |
| $1,500 to $1,999 | 0 (0.0%) | 869 (34.7%) |
| $2,000 to $2,499 | 0 (0.0%) | 8 (0.3%) |
| $2,500 to $2,999 | 0 (0.0%) | 0 (0.0%) |
| $3,000 or more | 0 (0.0%) | 0 (0.0%) |
| Total | 20 (100.0%) | 2,505 (100.0%) |
Physical Housing Characteristics in Fort Campbell North
Housing Structures in Fort Campbell North
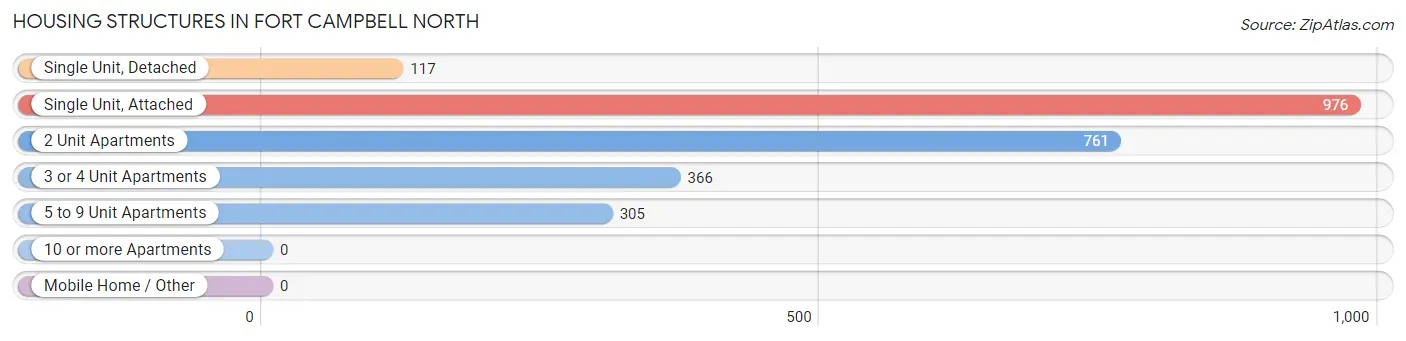
| Structure Type | # Housing Units | % Housing Units |
| Single Unit, Detached | 117 | 4.6% |
| Single Unit, Attached | 976 | 38.7% |
| 2 Unit Apartments | 761 | 30.1% |
| 3 or 4 Unit Apartments | 366 | 14.5% |
| 5 to 9 Unit Apartments | 305 | 12.1% |
| 10 or more Apartments | 0 | 0.0% |
| Mobile Home / Other | 0 | 0.0% |
| Total | 2,525 | 100.0% |
Housing Structures by Occupancy in Fort Campbell North
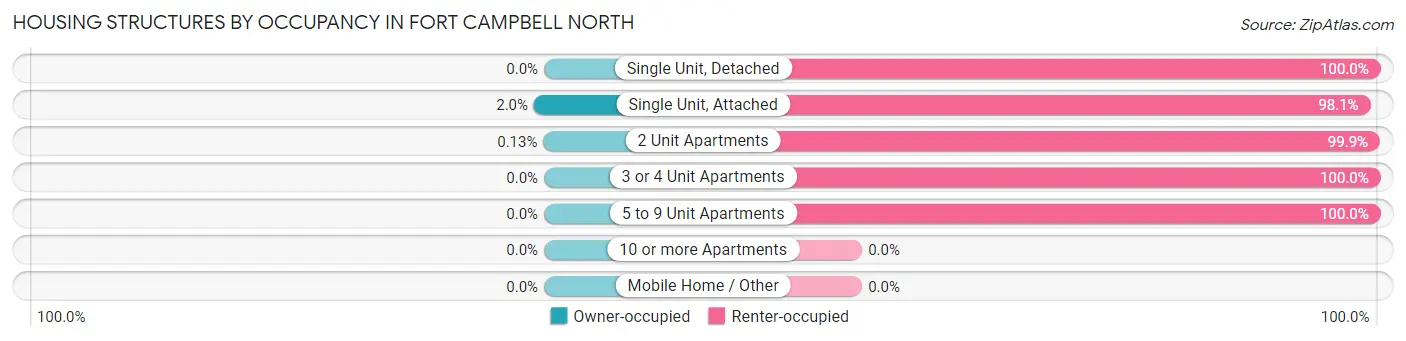
| Structure Type | Owner-occupied | Renter-occupied |
| Single Unit, Detached | 0 (0.0%) | 117 (100.0%) |
| Single Unit, Attached | 19 (1.9%) | 957 (98.1%) |
| 2 Unit Apartments | 1 (0.1%) | 760 (99.9%) |
| 3 or 4 Unit Apartments | 0 (0.0%) | 366 (100.0%) |
| 5 to 9 Unit Apartments | 0 (0.0%) | 305 (100.0%) |
| 10 or more Apartments | 0 (0.0%) | 0 (0.0%) |
| Mobile Home / Other | 0 (0.0%) | 0 (0.0%) |
| Total | 20 (0.8%) | 2,505 (99.2%) |
Housing Structures by Number of Rooms in Fort Campbell North
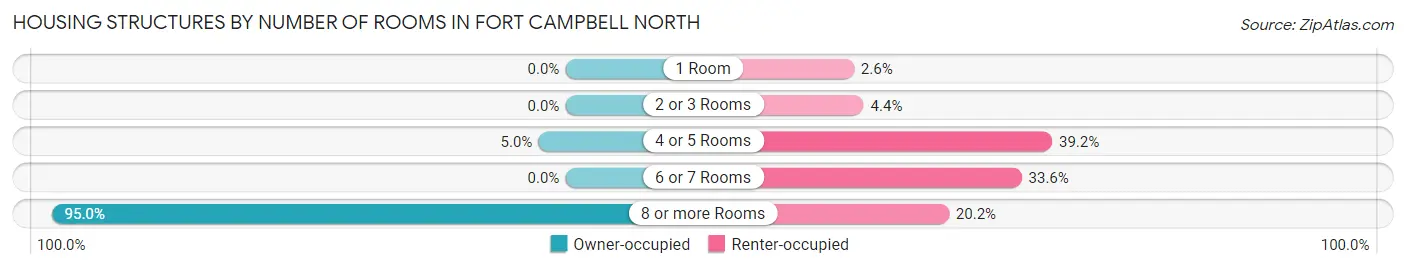
| Number of Rooms | Owner-occupied | Renter-occupied |
| 1 Room | 0 (0.0%) | 65 (2.6%) |
| 2 or 3 Rooms | 0 (0.0%) | 110 (4.4%) |
| 4 or 5 Rooms | 1 (5.0%) | 983 (39.2%) |
| 6 or 7 Rooms | 0 (0.0%) | 842 (33.6%) |
| 8 or more Rooms | 19 (95.0%) | 505 (20.2%) |
| Total | 20 (100.0%) | 2,505 (100.0%) |
Housing Structure by Heating Type in Fort Campbell North
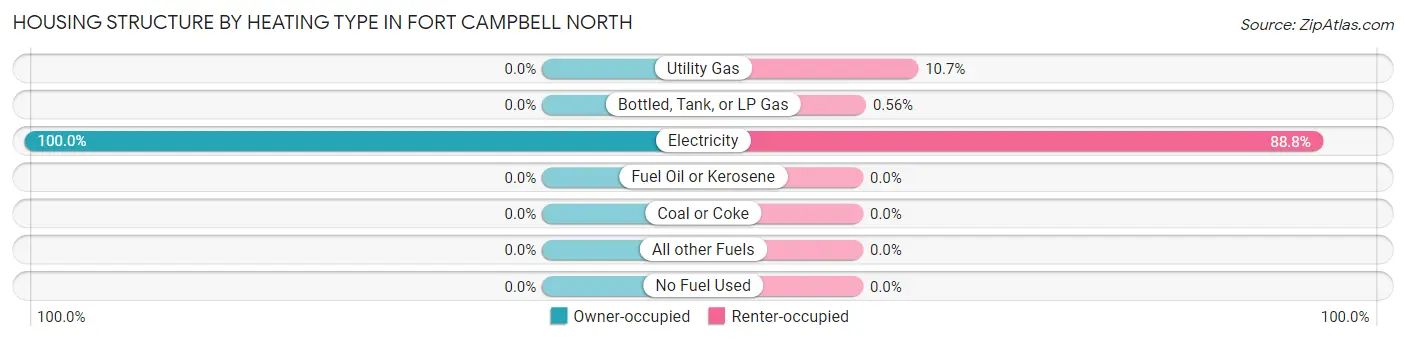
| Heating Type | Owner-occupied | Renter-occupied |
| Utility Gas | 0 (0.0%) | 267 (10.7%) |
| Bottled, Tank, or LP Gas | 0 (0.0%) | 14 (0.6%) |
| Electricity | 20 (100.0%) | 2,224 (88.8%) |
| Fuel Oil or Kerosene | 0 (0.0%) | 0 (0.0%) |
| Coal or Coke | 0 (0.0%) | 0 (0.0%) |
| All other Fuels | 0 (0.0%) | 0 (0.0%) |
| No Fuel Used | 0 (0.0%) | 0 (0.0%) |
| Total | 20 (100.0%) | 2,505 (100.0%) |
Household Vehicle Usage in Fort Campbell North
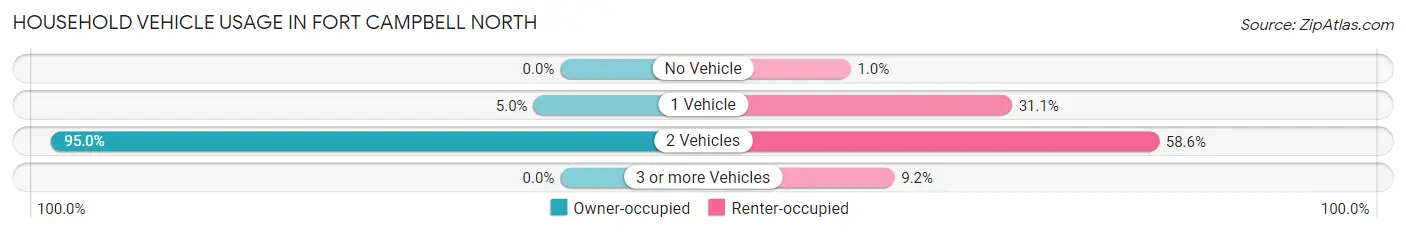
| Vehicles per Household | Owner-occupied | Renter-occupied |
| No Vehicle | 0 (0.0%) | 26 (1.0%) |
| 1 Vehicle | 1 (5.0%) | 780 (31.1%) |
| 2 Vehicles | 19 (95.0%) | 1,468 (58.6%) |
| 3 or more Vehicles | 0 (0.0%) | 231 (9.2%) |
| Total | 20 (100.0%) | 2,505 (100.0%) |
Real Estate & Mortgages in Fort Campbell North
Real Estate and Mortgage Overview in Fort Campbell North
| Characteristic | Without Mortgage | With Mortgage |
| Housing Units | 20 | 0 |
| Median Property Value | - | - |
| Median Household Income | - | - |
| Monthly Housing Costs | - | - |
| Real Estate Taxes | - | - |
Property Value by Mortgage Status in Fort Campbell North
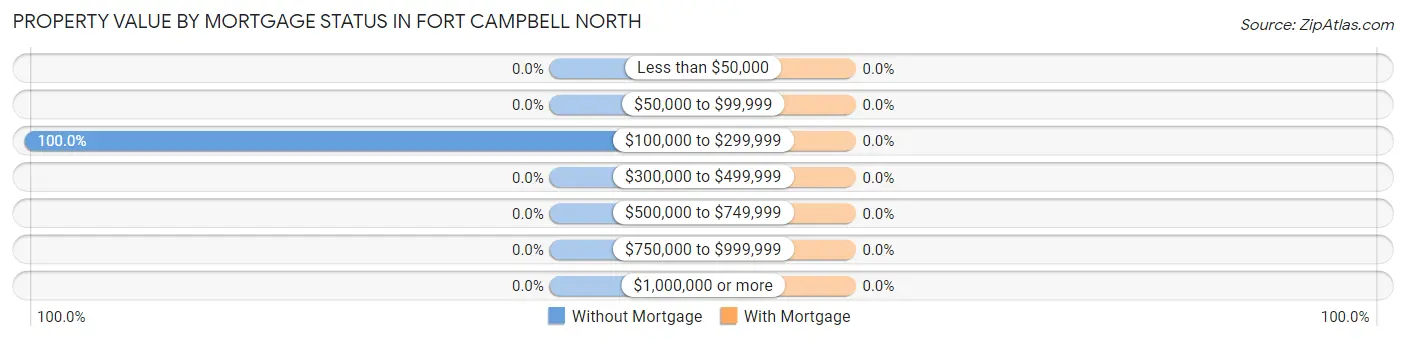
| Property Value | Without Mortgage | With Mortgage |
| Less than $50,000 | 0 (0.0%) | 0 (0.0%) |
| $50,000 to $99,999 | 0 (0.0%) | 0 (0.0%) |
| $100,000 to $299,999 | 20 (100.0%) | 0 (0.0%) |
| $300,000 to $499,999 | 0 (0.0%) | 0 (0.0%) |
| $500,000 to $749,999 | 0 (0.0%) | 0 (0.0%) |
| $750,000 to $999,999 | 0 (0.0%) | 0 (0.0%) |
| $1,000,000 or more | 0 (0.0%) | 0 (0.0%) |
| Total | 20 (100.0%) | 0 (0.0%) |
Household Income by Mortgage Status in Fort Campbell North
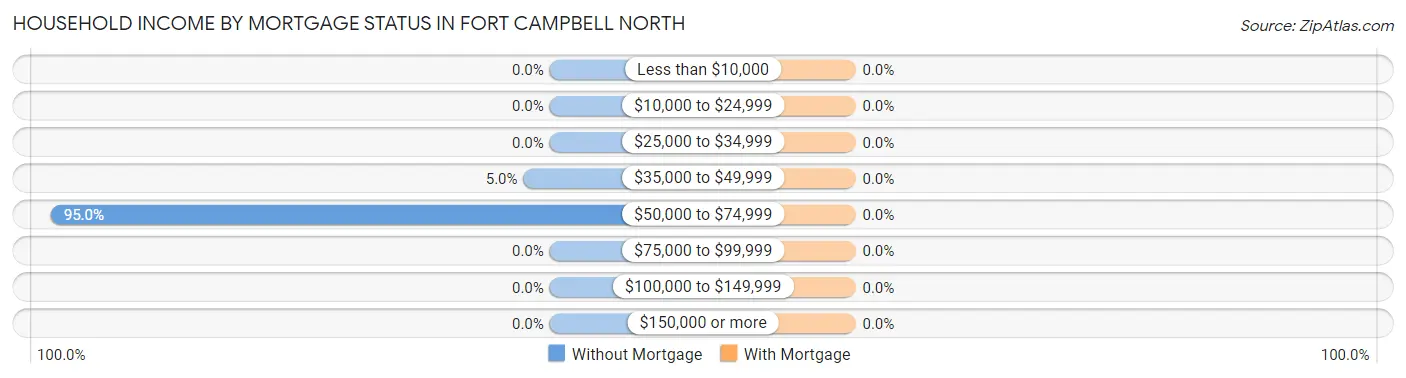
| Household Income | Without Mortgage | With Mortgage |
| Less than $10,000 | 0 (0.0%) | 0 (0.0%) |
| $10,000 to $24,999 | 0 (0.0%) | 0 (0.0%) |
| $25,000 to $34,999 | 0 (0.0%) | 0 (0.0%) |
| $35,000 to $49,999 | 1 (5.0%) | 0 (0.0%) |
| $50,000 to $74,999 | 19 (95.0%) | 0 (0.0%) |
| $75,000 to $99,999 | 0 (0.0%) | 0 (0.0%) |
| $100,000 to $149,999 | 0 (0.0%) | 0 (0.0%) |
| $150,000 or more | 0 (0.0%) | 0 (0.0%) |
| Total | 20 (100.0%) | 0 (0.0%) |
Property Value to Household Income Ratio in Fort Campbell North
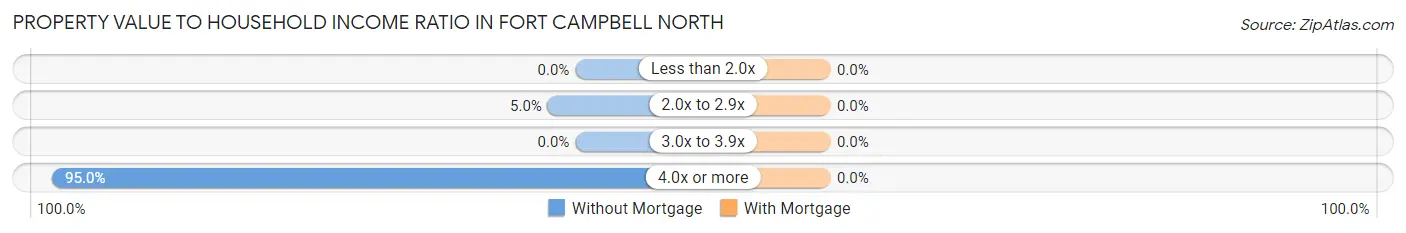
| Value-to-Income Ratio | Without Mortgage | With Mortgage |
| Less than 2.0x | 0 (0.0%) | 0 (0.0%) |
| 2.0x to 2.9x | 1 (5.0%) | 0 (0.0%) |
| 3.0x to 3.9x | 0 (0.0%) | 0 (0.0%) |
| 4.0x or more | 19 (95.0%) | 0 (0.0%) |
| Total | 20 (100.0%) | 0 (0.0%) |
Real Estate Taxes by Mortgage Status in Fort Campbell North
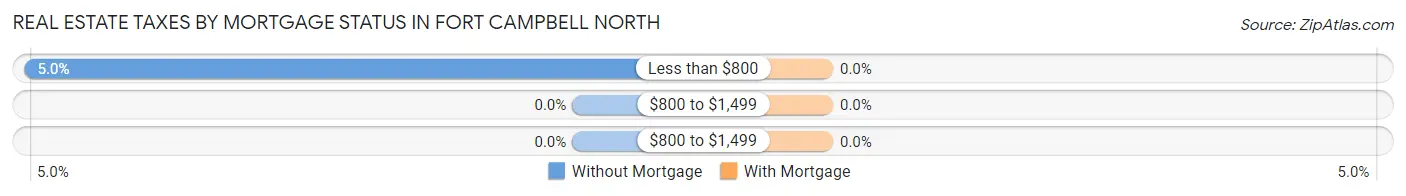
| Property Taxes | Without Mortgage | With Mortgage |
| Less than $800 | 1 (5.0%) | 0 (0.0%) |
| $800 to $1,499 | 0 (0.0%) | 0 (0.0%) |
| $800 to $1,499 | 0 (0.0%) | 0 (0.0%) |
| Total | 20 (100.0%) | 0 (0.0%) |
Health & Disability in Fort Campbell North
Health Insurance Coverage by Age in Fort Campbell North
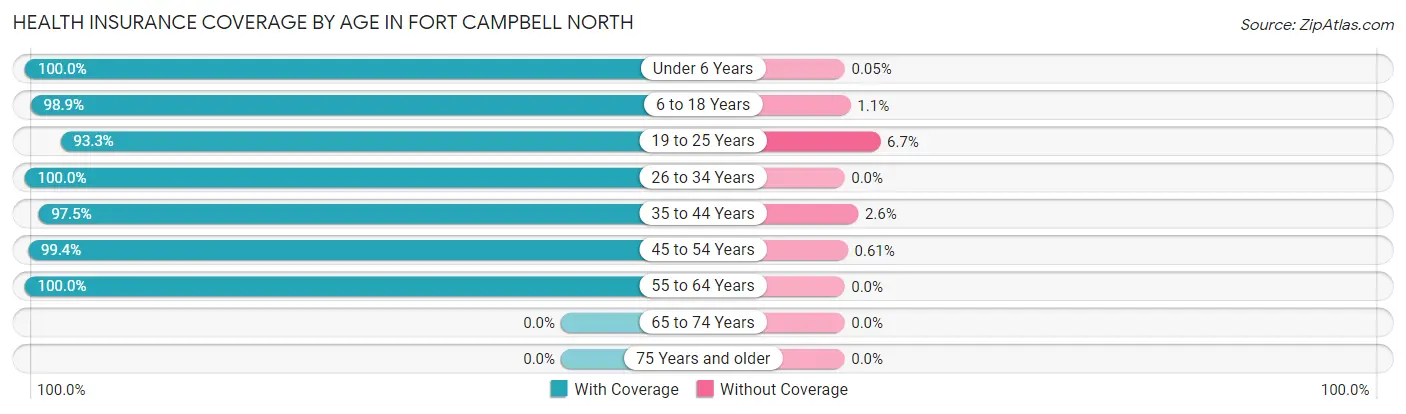
| Age Bracket | With Coverage | Without Coverage |
| Under 6 Years | 2,085 (100.0%) | 1 (0.1%) |
| 6 to 18 Years | 1,653 (98.9%) | 19 (1.1%) |
| 19 to 25 Years | 950 (93.3%) | 68 (6.7%) |
| 26 to 34 Years | 1,011 (100.0%) | 0 (0.0%) |
| 35 to 44 Years | 306 (97.5%) | 8 (2.5%) |
| 45 to 54 Years | 164 (99.4%) | 1 (0.6%) |
| 55 to 64 Years | 66 (100.0%) | 0 (0.0%) |
| 65 to 74 Years | 0 (0.0%) | 0 (0.0%) |
| 75 Years and older | 0 (0.0%) | 0 (0.0%) |
| Total | 6,235 (98.5%) | 97 (1.5%) |
Health Insurance Coverage by Citizenship Status in Fort Campbell North
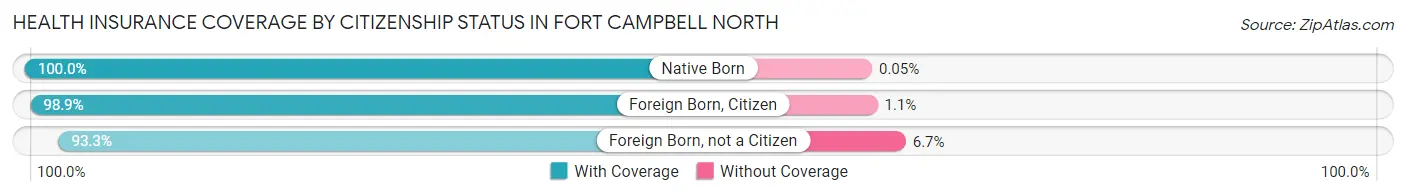
| Citizenship Status | With Coverage | Without Coverage |
| Native Born | 2,085 (100.0%) | 1 (0.1%) |
| Foreign Born, Citizen | 1,653 (98.9%) | 19 (1.1%) |
| Foreign Born, not a Citizen | 950 (93.3%) | 68 (6.7%) |
Health Insurance Coverage by Household Income in Fort Campbell North
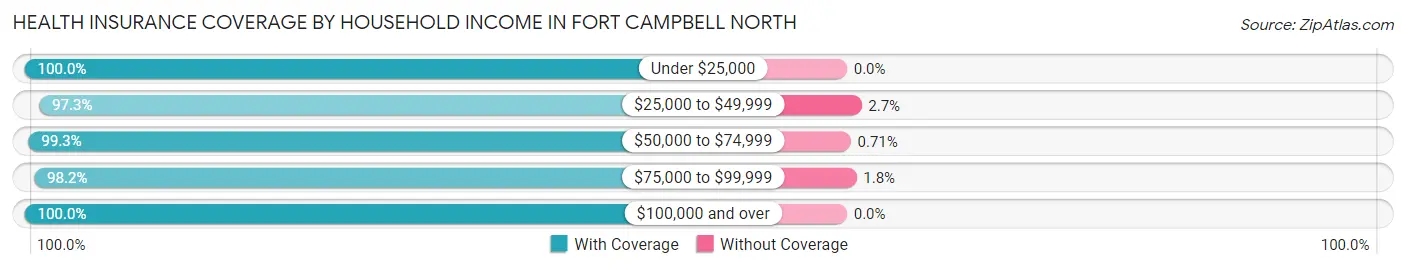
| Household Income | With Coverage | Without Coverage |
| Under $25,000 | 342 (100.0%) | 0 (0.0%) |
| $25,000 to $49,999 | 2,078 (97.3%) | 58 (2.7%) |
| $50,000 to $74,999 | 2,222 (99.3%) | 16 (0.7%) |
| $75,000 to $99,999 | 1,263 (98.2%) | 23 (1.8%) |
| $100,000 and over | 330 (100.0%) | 0 (0.0%) |
Public vs Private Health Insurance Coverage by Age in Fort Campbell North
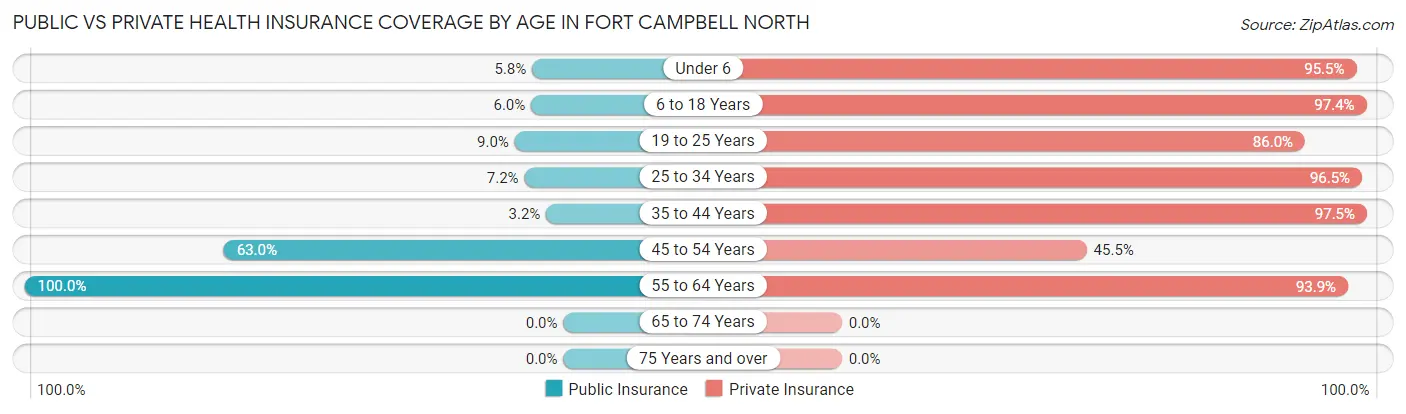
| Age Bracket | Public Insurance | Private Insurance |
| Under 6 | 121 (5.8%) | 1,992 (95.5%) |
| 6 to 18 Years | 100 (6.0%) | 1,628 (97.4%) |
| 19 to 25 Years | 92 (9.0%) | 875 (86.0%) |
| 25 to 34 Years | 73 (7.2%) | 976 (96.5%) |
| 35 to 44 Years | 10 (3.2%) | 306 (97.5%) |
| 45 to 54 Years | 104 (63.0%) | 75 (45.5%) |
| 55 to 64 Years | 66 (100.0%) | 62 (93.9%) |
| 65 to 74 Years | 0 (0.0%) | 0 (0.0%) |
| 75 Years and over | 0 (0.0%) | 0 (0.0%) |
| Total | 566 (8.9%) | 5,914 (93.4%) |
Disability Status by Sex by Age in Fort Campbell North
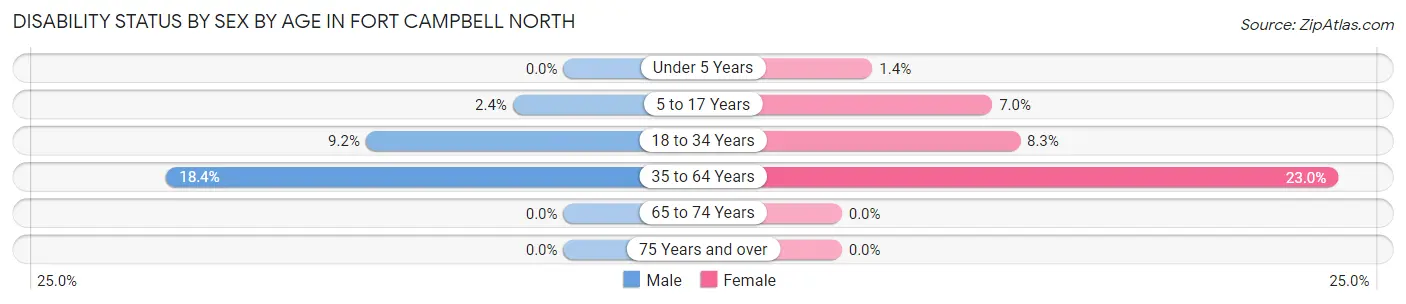
| Age Bracket | Male | Female |
| Under 5 Years | 0 (0.0%) | 15 (1.4%) |
| 5 to 17 Years | 20 (2.4%) | 65 (7.0%) |
| 18 to 34 Years | 42 (9.2%) | 142 (8.3%) |
| 35 to 64 Years | 14 (18.4%) | 108 (23.0%) |
| 65 to 74 Years | 0 (0.0%) | 0 (0.0%) |
| 75 Years and over | 0 (0.0%) | 0 (0.0%) |
Disability Class by Sex by Age in Fort Campbell North
Disability Class: Hearing Difficulty
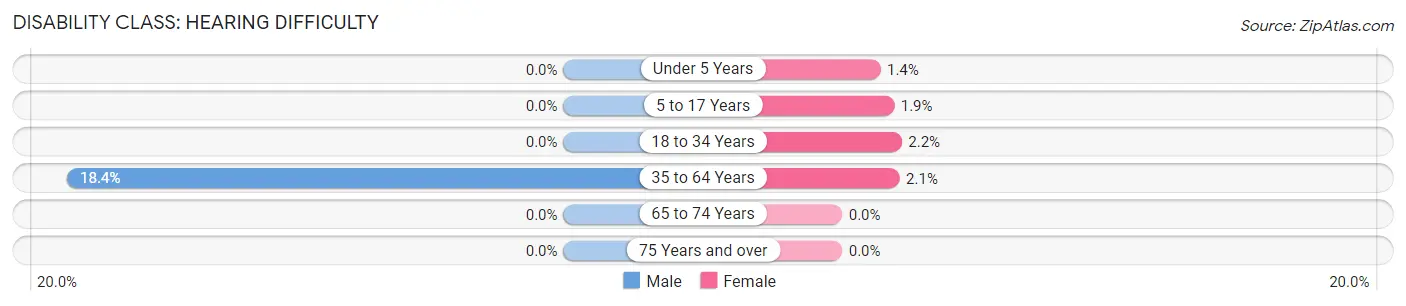
| Age Bracket | Male | Female |
| Under 5 Years | 0 (0.0%) | 15 (1.4%) |
| 5 to 17 Years | 0 (0.0%) | 18 (1.9%) |
| 18 to 34 Years | 0 (0.0%) | 38 (2.2%) |
| 35 to 64 Years | 14 (18.4%) | 10 (2.1%) |
| 65 to 74 Years | 0 (0.0%) | 0 (0.0%) |
| 75 Years and over | 0 (0.0%) | 0 (0.0%) |
Disability Class: Vision Difficulty
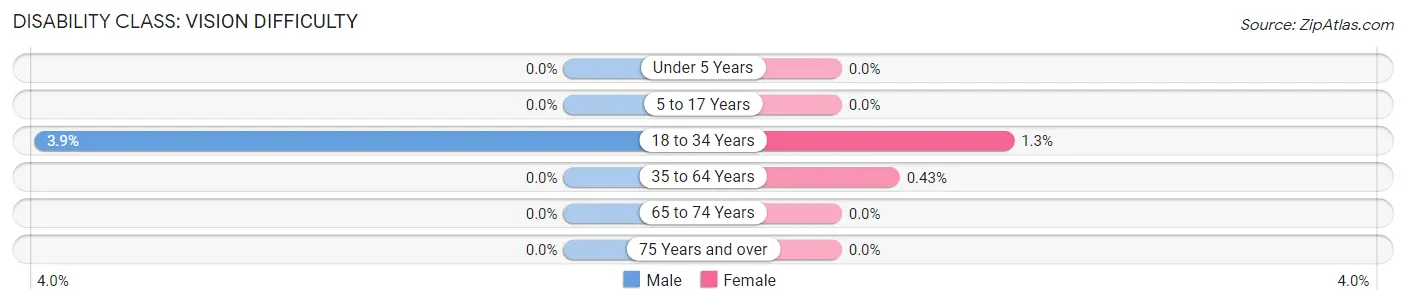
| Age Bracket | Male | Female |
| Under 5 Years | 0 (0.0%) | 0 (0.0%) |
| 5 to 17 Years | 0 (0.0%) | 0 (0.0%) |
| 18 to 34 Years | 18 (3.9%) | 22 (1.3%) |
| 35 to 64 Years | 0 (0.0%) | 2 (0.4%) |
| 65 to 74 Years | 0 (0.0%) | 0 (0.0%) |
| 75 Years and over | 0 (0.0%) | 0 (0.0%) |
Disability Class: Cognitive Difficulty
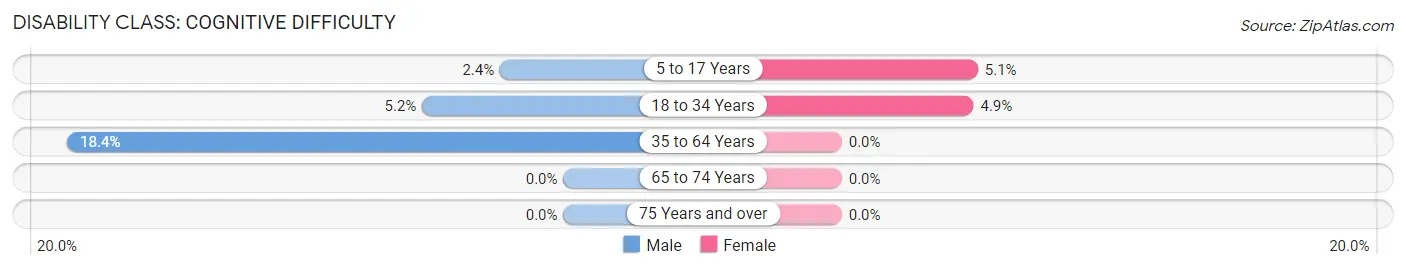
| Age Bracket | Male | Female |
| 5 to 17 Years | 20 (2.4%) | 47 (5.1%) |
| 18 to 34 Years | 24 (5.2%) | 84 (4.9%) |
| 35 to 64 Years | 14 (18.4%) | 0 (0.0%) |
| 65 to 74 Years | 0 (0.0%) | 0 (0.0%) |
| 75 Years and over | 0 (0.0%) | 0 (0.0%) |
Disability Class: Ambulatory Difficulty
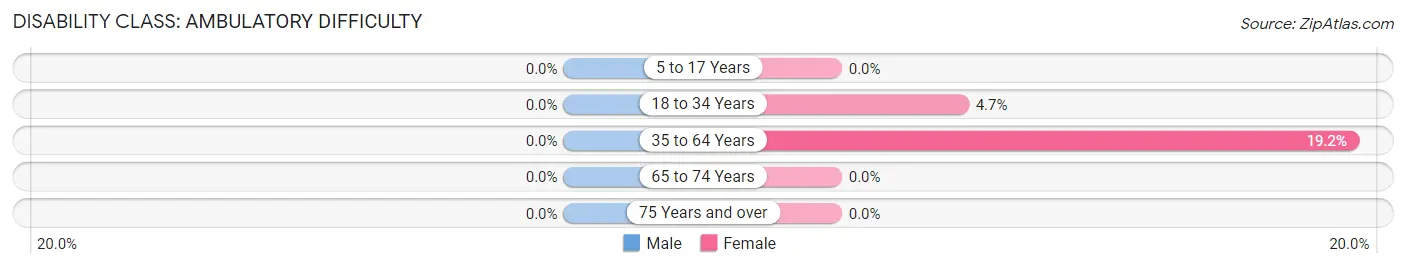
| Age Bracket | Male | Female |
| 5 to 17 Years | 0 (0.0%) | 0 (0.0%) |
| 18 to 34 Years | 0 (0.0%) | 81 (4.7%) |
| 35 to 64 Years | 0 (0.0%) | 90 (19.2%) |
| 65 to 74 Years | 0 (0.0%) | 0 (0.0%) |
| 75 Years and over | 0 (0.0%) | 0 (0.0%) |
Disability Class: Self-Care Difficulty
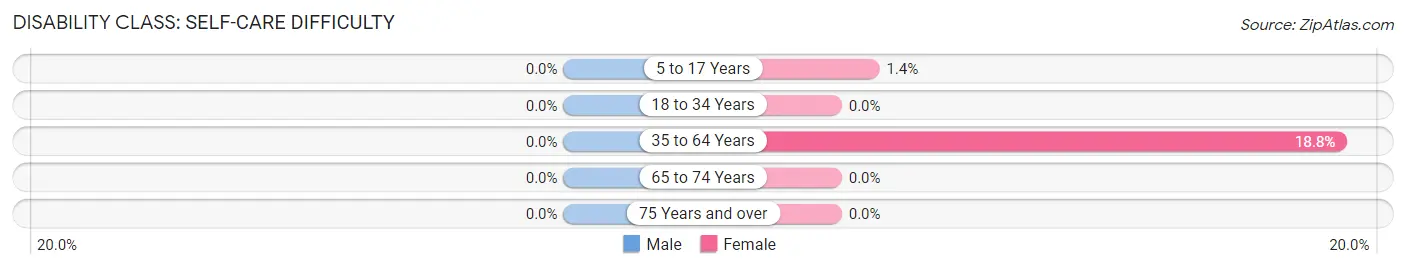
| Age Bracket | Male | Female |
| 5 to 17 Years | 0 (0.0%) | 13 (1.4%) |
| 18 to 34 Years | 0 (0.0%) | 0 (0.0%) |
| 35 to 64 Years | 0 (0.0%) | 88 (18.8%) |
| 65 to 74 Years | 0 (0.0%) | 0 (0.0%) |
| 75 Years and over | 0 (0.0%) | 0 (0.0%) |
Technology Access in Fort Campbell North
Computing Device Access in Fort Campbell North
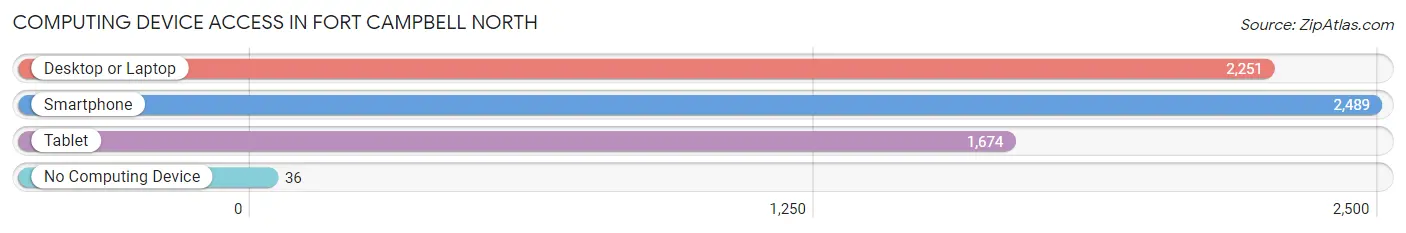
| Device Type | # Households | % Households |
| Desktop or Laptop | 2,251 | 89.1% |
| Smartphone | 2,489 | 98.6% |
| Tablet | 1,674 | 66.3% |
| No Computing Device | 36 | 1.4% |
| Total | 2,525 | 100.0% |
Internet Access in Fort Campbell North
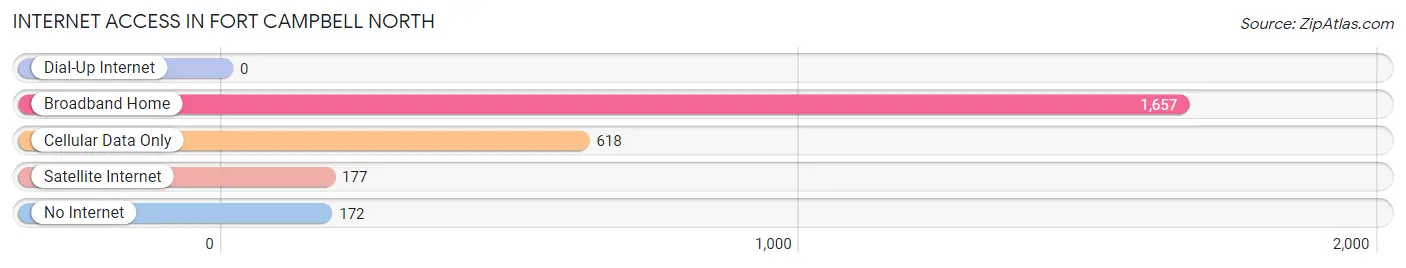
| Internet Type | # Households | % Households |
| Dial-Up Internet | 0 | 0.0% |
| Broadband Home | 1,657 | 65.6% |
| Cellular Data Only | 618 | 24.5% |
| Satellite Internet | 177 | 7.0% |
| No Internet | 172 | 6.8% |
| Total | 2,525 | 100.0% |
Fort Campbell North Summary
Campbell North, Kentucky is a small city located in Christian County, Kentucky. It is part of the Clarksville-Hopkinsville Metropolitan Statistical Area and is home to the United States Army’s Fort Campbell. The city is located on the Tennessee-Kentucky border and is approximately 30 miles northwest of Nashville, Tennessee.
History
The area that is now Fort Campbell North was originally inhabited by Native Americans, including the Cherokee, Chickasaw, and Shawnee tribes. The first European settlers arrived in the area in the late 1700s and early 1800s. The area was part of the Jackson Purchase, a large tract of land purchased from the Chickasaw Nation in 1818.
In 1942, the United States Army purchased the land that is now Fort Campbell North and established a military base. The base was named after Union Army Brigadier General William Bowen Campbell, who fought in the Mexican-American War and the Civil War. The base was initially used as a training facility for the 101st Airborne Division during World War II. After the war, the base was used as a training facility for the Army’s Special Forces.
In 1950, the base was renamed Fort Campbell and became the home of the 101st Airborne Division. The base has since been used for a variety of military operations, including the Vietnam War, the Gulf War, and the War in Afghanistan.
Geography
Fort Campbell North is located in Christian County, Kentucky. It is situated on the Tennessee-Kentucky border, approximately 30 miles northwest of Nashville, Tennessee. The city has a total area of 4.2 square miles, all of which is land. The city is located in a hilly region of the state and is surrounded by forests and farmland.
The climate in Fort Campbell North is classified as humid subtropical. Summers are hot and humid, with temperatures reaching into the 90s. Winters are mild, with temperatures rarely dropping below freezing. The city receives an average of 48 inches of precipitation per year.
Economy
The economy of Fort Campbell North is largely driven by the presence of the United States Army’s Fort Campbell. The base is home to more than 30,000 military personnel and their families, and provides a significant economic boost to the city. The base also provides a variety of services to the local community, including medical care, education, and recreation.
In addition to the military base, Fort Campbell North is home to a variety of businesses and industries. The city is home to several manufacturing plants, including a paper mill and a furniture factory. The city is also home to a variety of retail stores, restaurants, and other businesses.
Demographics
As of the 2010 census, the population of Fort Campbell North was 8,845. The population is predominantly white (86.3%), with smaller percentages of African Americans (7.2%), Hispanics (3.2%), and Asians (1.3%). The median household income is $45,845, and the median home value is $133,400.
Fort Campbell North is served by the Christian County Public Schools system. The city is home to two elementary schools, one middle school, and one high school. The city is also home to a variety of private schools, including a Catholic school and a Montessori school.
Common Questions
What is Per Capita Income in Fort Campbell North?
Per Capita income in Fort Campbell North is $21,210.
What is the Median Family Income in Fort Campbell North?
Median Family Income in Fort Campbell North is $53,513.
What is the Median Household income in Fort Campbell North?
Median Household Income in Fort Campbell North is $52,677.
What is Income or Wage Gap in Fort Campbell North?
Income or Wage Gap in Fort Campbell North is 27.5%.
Women in Fort Campbell North earn 72.5 cents for every dollar earned by a man.
What is Family Income Deficit in Fort Campbell North?
Family Income Deficit in Fort Campbell North is $11,267.
Families that are below poverty line in Fort Campbell North earn $11,267 less on average than the poverty threshold level.
What is Inequality or Gini Index in Fort Campbell North?
Inequality or Gini Index in Fort Campbell North is 0.26.
What is the Total Population of Fort Campbell North?
Total Population of Fort Campbell North is 12,014.
What is the Total Male Population of Fort Campbell North?
Total Male Population of Fort Campbell North is 7,523.
What is the Total Female Population of Fort Campbell North?
Total Female Population of Fort Campbell North is 4,491.
What is the Ratio of Males per 100 Females in Fort Campbell North?
There are 167.51 Males per 100 Females in Fort Campbell North.
What is the Ratio of Females per 100 Males in Fort Campbell North?
There are 59.70 Females per 100 Males in Fort Campbell North.
What is the Median Population Age in Fort Campbell North?
Median Population Age in Fort Campbell North is 22.0 Years.
What is the Average Family Size in Fort Campbell North
Average Family Size in Fort Campbell North is 3.4 People.
What is the Average Household Size in Fort Campbell North
Average Household Size in Fort Campbell North is 3.3 People.
How Large is the Labor Force in Fort Campbell North?
There are 7,066 People in the Labor Forcein in Fort Campbell North.
What is the Percentage of People in the Labor Force in Fort Campbell North?
82.0% of People are in the Labor Force in Fort Campbell North.
What is the Unemployment Rate in Fort Campbell North?
Unemployment Rate in Fort Campbell North is 16.8%.