Orange City, IA Map & Demographics
Orange City Map
Orange City Overview
$33,074
PER CAPITA INCOME
$93,268
AVG FAMILY INCOME
$77,500
AVG HOUSEHOLD INCOME
70.5%
WAGE / INCOME GAP [ % ]
29.5¢/ $1
WAGE / INCOME GAP [ $ ]
0.37
INEQUALITY / GINI INDEX
6,278
TOTAL POPULATION
3,077
MALE POPULATION
3,201
FEMALE POPULATION
96.13
MALES / 100 FEMALES
104.03
FEMALES / 100 MALES
33.9
MEDIAN AGE
3.1
AVG FAMILY SIZE
2.5
AVG HOUSEHOLD SIZE
3,527
LABOR FORCE [ PEOPLE ]
69.2%
PERCENT IN LABOR FORCE
5.4%
UNEMPLOYMENT RATE
Orange City Zip Codes
Orange City Area Codes
Income in Orange City
Income Overview in Orange City
Per Capita Income in Orange City is $33,074, while median incomes of families and households are $93,268 and $77,500 respectively.
| Characteristic | Number | Measure |
| Per Capita Income | 6,278 | $33,074 |
| Median Family Income | 1,415 | $93,268 |
| Mean Family Income | 1,415 | $108,399 |
| Median Household Income | 2,228 | $77,500 |
| Mean Household Income | 2,228 | $88,563 |
| Income Deficit | 1,415 | $0 |
| Wage / Income Gap (%) | 6,278 | 70.48% |
| Wage / Income Gap ($) | 6,278 | 29.52¢ per $1 |
| Gini / Inequality Index | 6,278 | 0.37 |
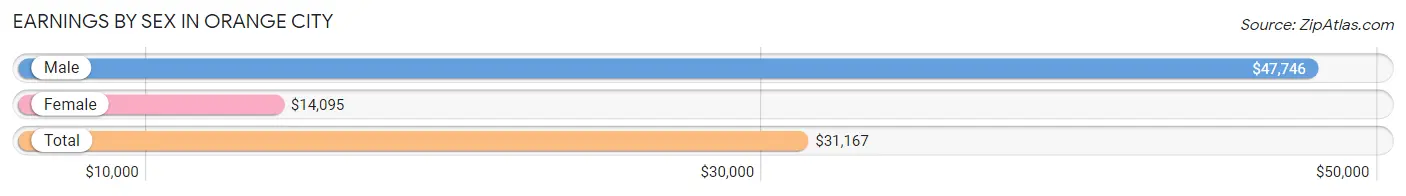
Earnings by Sex in Orange City
Average Earnings in Orange City are $31,167, $47,746 for men and $14,095 for women, a difference of 70.5%.
| Sex | Number | Average Earnings |
| Male | 2,124 (54.0%) | $47,746 |
| Female | 1,808 (46.0%) | $14,095 |
| Total | 3,932 (100.0%) | $31,167 |
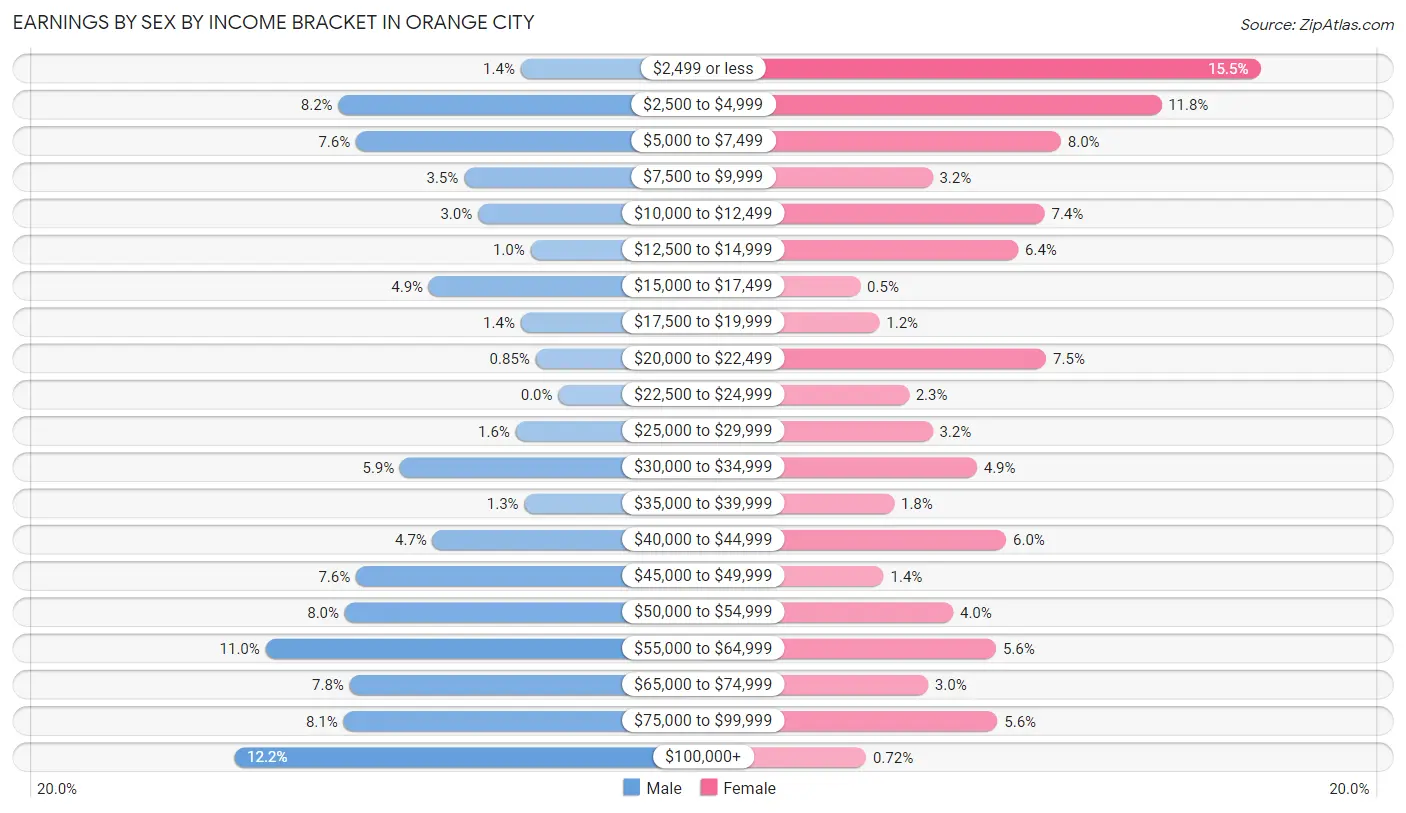
Earnings by Sex by Income Bracket in Orange City
The most common earnings brackets in Orange City are $100,000+ for men (258 | 12.1%) and $2,499 or less for women (280 | 15.5%).
| Income | Male | Female |
| $2,499 or less | 30 (1.4%) | 280 (15.5%) |
| $2,500 to $4,999 | 175 (8.2%) | 213 (11.8%) |
| $5,000 to $7,499 | 161 (7.6%) | 145 (8.0%) |
| $7,500 to $9,999 | 75 (3.5%) | 58 (3.2%) |
| $10,000 to $12,499 | 64 (3.0%) | 134 (7.4%) |
| $12,500 to $14,999 | 22 (1.0%) | 116 (6.4%) |
| $15,000 to $17,499 | 103 (4.9%) | 9 (0.5%) |
| $17,500 to $19,999 | 30 (1.4%) | 22 (1.2%) |
| $20,000 to $22,499 | 18 (0.9%) | 135 (7.5%) |
| $22,500 to $24,999 | 0 (0.0%) | 42 (2.3%) |
| $25,000 to $29,999 | 34 (1.6%) | 58 (3.2%) |
| $30,000 to $34,999 | 126 (5.9%) | 88 (4.9%) |
| $35,000 to $39,999 | 27 (1.3%) | 32 (1.8%) |
| $40,000 to $44,999 | 100 (4.7%) | 108 (6.0%) |
| $45,000 to $49,999 | 161 (7.6%) | 25 (1.4%) |
| $50,000 to $54,999 | 170 (8.0%) | 72 (4.0%) |
| $55,000 to $64,999 | 233 (11.0%) | 101 (5.6%) |
| $65,000 to $74,999 | 166 (7.8%) | 55 (3.0%) |
| $75,000 to $99,999 | 171 (8.1%) | 102 (5.6%) |
| $100,000+ | 258 (12.1%) | 13 (0.7%) |
| Total | 2,124 (100.0%) | 1,808 (100.0%) |
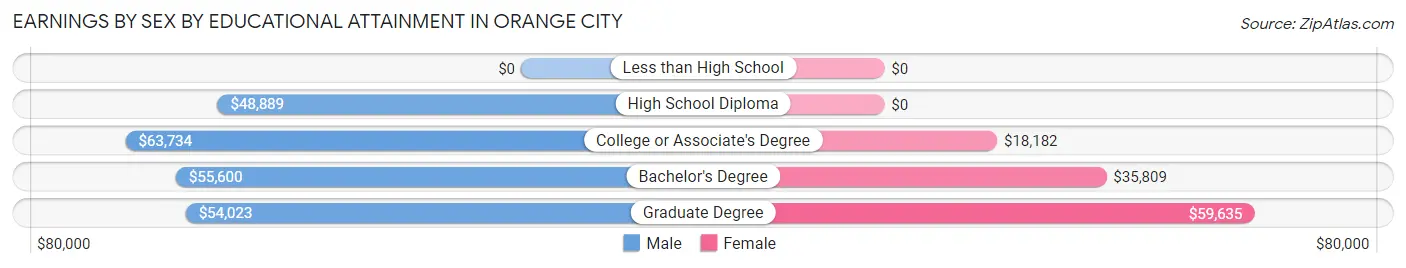
Earnings by Sex by Educational Attainment in Orange City
Average earnings in Orange City are $57,615 for men and $33,906 for women, a difference of 41.1%. Men with an educational attainment of college or associate's degree enjoy the highest average annual earnings of $63,734, while those with high school diploma education earn the least with $48,889. Women with an educational attainment of graduate degree earn the most with the average annual earnings of $59,635, while those with college or associate's degree education have the smallest earnings of $18,182.
| Educational Attainment | Male Income | Female Income |
| Less than High School | - | - |
| High School Diploma | $48,889 | $0 |
| College or Associate's Degree | $63,734 | $18,182 |
| Bachelor's Degree | $55,600 | $35,809 |
| Graduate Degree | $54,023 | $59,635 |
| Total | $57,615 | $33,906 |
Family Income in Orange City
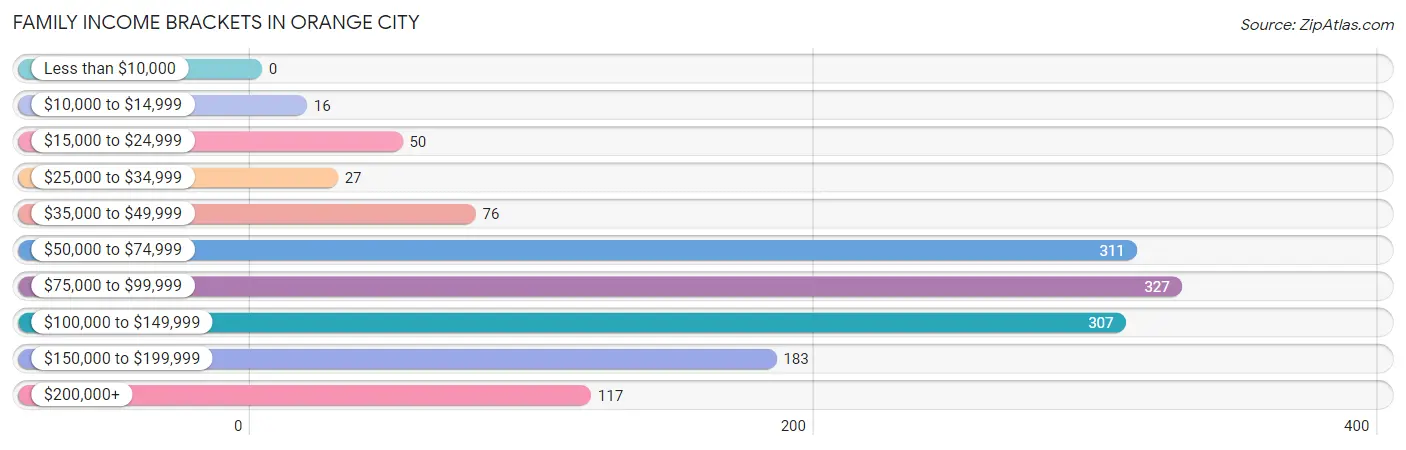
Family Income Brackets in Orange City
According to the Orange City family income data, there are 327 families falling into the $75,000 to $99,999 income range, which is the most common income bracket and makes up 23.1% of all families.
| Income Bracket | # Families | % Families |
| Less than $10,000 | 0 | 0.0% |
| $10,000 to $14,999 | 16 | 1.1% |
| $15,000 to $24,999 | 50 | 3.5% |
| $25,000 to $34,999 | 27 | 1.9% |
| $35,000 to $49,999 | 76 | 5.4% |
| $50,000 to $74,999 | 311 | 22.0% |
| $75,000 to $99,999 | 327 | 23.1% |
| $100,000 to $149,999 | 307 | 21.7% |
| $150,000 to $199,999 | 183 | 12.9% |
| $200,000+ | 117 | 8.3% |
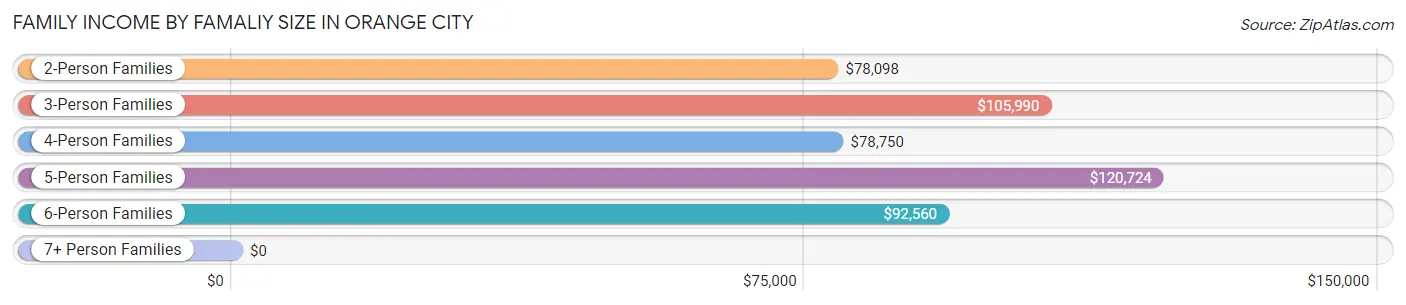
Family Income by Famaliy Size in Orange City
5-person families (135 | 9.5%) account for the highest median family income in Orange City with $120,724 per family, while 2-person families (661 | 46.7%) have the highest median income of $39,049 per family member.
| Income Bracket | # Families | Median Income |
| 2-Person Families | 661 (46.7%) | $78,098 |
| 3-Person Families | 317 (22.4%) | $105,990 |
| 4-Person Families | 261 (18.4%) | $78,750 |
| 5-Person Families | 135 (9.5%) | $120,724 |
| 6-Person Families | 41 (2.9%) | $92,560 |
| 7+ Person Families | 0 (0.0%) | $0 |
| Total | 1,415 (100.0%) | $93,268 |
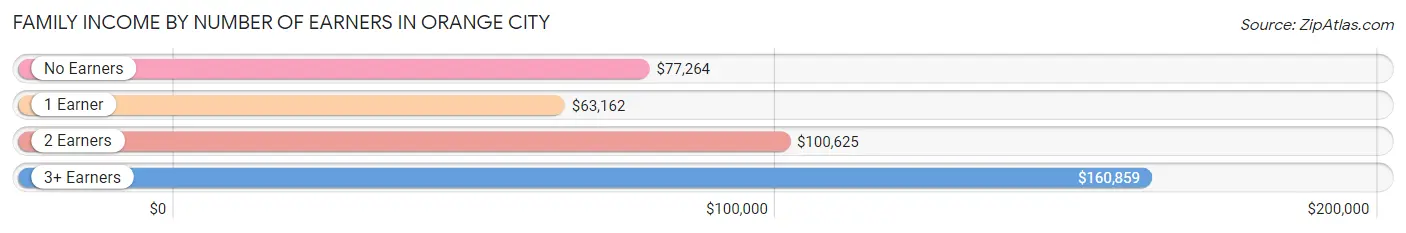
Family Income by Number of Earners in Orange City
The median family income in Orange City is $93,268, with families comprising 3+ earners (215) having the highest median family income of $160,859, while families with 1 earner (235) have the lowest median family income of $63,162, accounting for 15.2% and 16.6% of families, respectively.
| Number of Earners | # Families | Median Income |
| No Earners | 215 (15.2%) | $77,264 |
| 1 Earner | 235 (16.6%) | $63,162 |
| 2 Earners | 750 (53.0%) | $100,625 |
| 3+ Earners | 215 (15.2%) | $160,859 |
| Total | 1,415 (100.0%) | $93,268 |
Household Income in Orange City
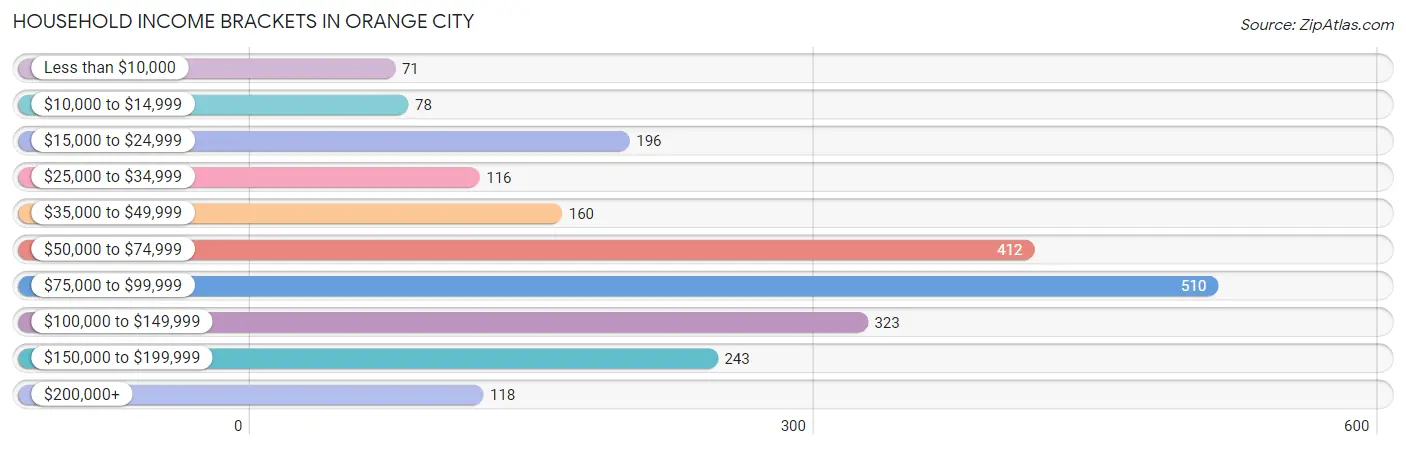
Household Income Brackets in Orange City
With 510 households falling in the category, the $75,000 to $99,999 income range is the most frequent in Orange City, accounting for 22.9% of all households. In contrast, only 71 households (3.2%) fall into the less than $10,000 income bracket, making it the least populous group.
| Income Bracket | # Households | % Households |
| Less than $10,000 | 71 | 3.2% |
| $10,000 to $14,999 | 78 | 3.5% |
| $15,000 to $24,999 | 196 | 8.8% |
| $25,000 to $34,999 | 116 | 5.2% |
| $35,000 to $49,999 | 160 | 7.2% |
| $50,000 to $74,999 | 412 | 18.5% |
| $75,000 to $99,999 | 510 | 22.9% |
| $100,000 to $149,999 | 323 | 14.5% |
| $150,000 to $199,999 | 243 | 10.9% |
| $200,000+ | 118 | 5.3% |
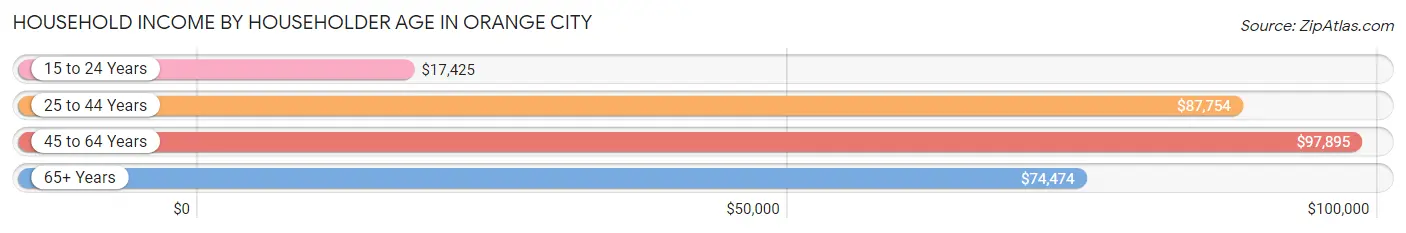
Household Income by Householder Age in Orange City
The median household income in Orange City is $77,500, with the highest median household income of $97,895 found in the 45 to 64 years age bracket for the primary householder. A total of 730 households (32.8%) fall into this category. Meanwhile, the 15 to 24 years age bracket for the primary householder has the lowest median household income of $17,425, with 232 households (10.4%) in this group.
| Income Bracket | # Households | Median Income |
| 15 to 24 Years | 232 (10.4%) | $17,425 |
| 25 to 44 Years | 586 (26.3%) | $87,754 |
| 45 to 64 Years | 730 (32.8%) | $97,895 |
| 65+ Years | 680 (30.5%) | $74,474 |
| Total | 2,228 (100.0%) | $77,500 |
Poverty in Orange City
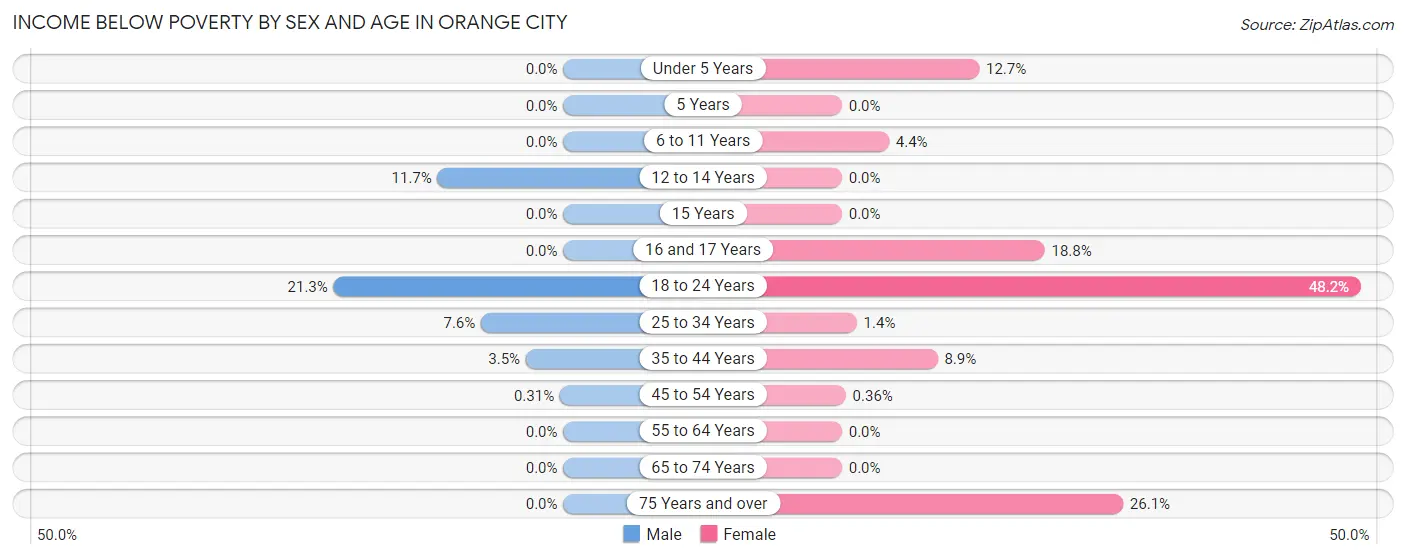
Income Below Poverty by Sex and Age in Orange City
With 4.7% poverty level for males and 10.3% for females among the residents of Orange City, 18 to 24 year old males and 18 to 24 year old females are the most vulnerable to poverty, with 71 males (21.3%) and 106 females (48.2%) in their respective age groups living below the poverty level.
| Age Bracket | Male | Female |
| Under 5 Years | 0 (0.0%) | 27 (12.7%) |
| 5 Years | 0 (0.0%) | 0 (0.0%) |
| 6 to 11 Years | 0 (0.0%) | 15 (4.4%) |
| 12 to 14 Years | 14 (11.7%) | 0 (0.0%) |
| 15 Years | 0 (0.0%) | 0 (0.0%) |
| 16 and 17 Years | 0 (0.0%) | 16 (18.8%) |
| 18 to 24 Years | 71 (21.3%) | 106 (48.2%) |
| 25 to 34 Years | 29 (7.6%) | 3 (1.4%) |
| 35 to 44 Years | 14 (3.5%) | 30 (8.9%) |
| 45 to 54 Years | 1 (0.3%) | 1 (0.4%) |
| 55 to 64 Years | 0 (0.0%) | 0 (0.0%) |
| 65 to 74 Years | 0 (0.0%) | 0 (0.0%) |
| 75 Years and over | 0 (0.0%) | 84 (26.1%) |
| Total | 129 (4.7%) | 282 (10.3%) |
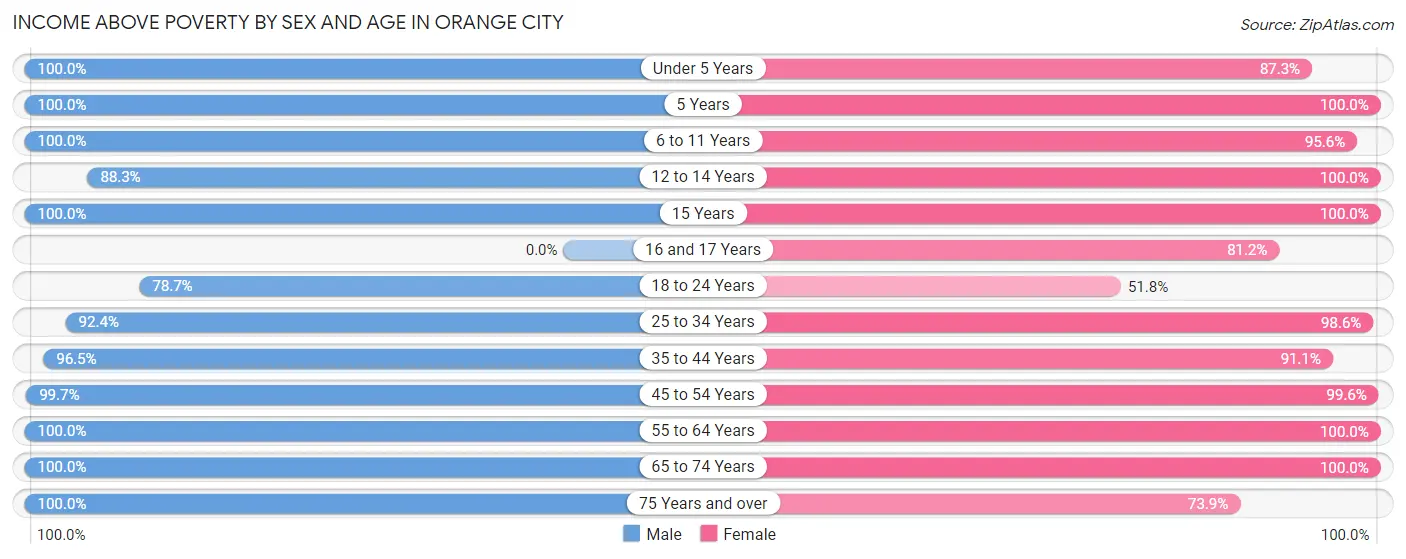
Income Above Poverty by Sex and Age in Orange City
According to the poverty statistics in Orange City, males aged under 5 years and females aged 5 years are the age groups that are most secure financially, with 100.0% of males and 100.0% of females in these age groups living above the poverty line.
| Age Bracket | Male | Female |
| Under 5 Years | 179 (100.0%) | 185 (87.3%) |
| 5 Years | 33 (100.0%) | 18 (100.0%) |
| 6 to 11 Years | 111 (100.0%) | 328 (95.6%) |
| 12 to 14 Years | 106 (88.3%) | 99 (100.0%) |
| 15 Years | 45 (100.0%) | 13 (100.0%) |
| 16 and 17 Years | 0 (0.0%) | 69 (81.2%) |
| 18 to 24 Years | 262 (78.7%) | 114 (51.8%) |
| 25 to 34 Years | 351 (92.4%) | 215 (98.6%) |
| 35 to 44 Years | 389 (96.5%) | 308 (91.1%) |
| 45 to 54 Years | 323 (99.7%) | 274 (99.6%) |
| 55 to 64 Years | 352 (100.0%) | 293 (100.0%) |
| 65 to 74 Years | 266 (100.0%) | 305 (100.0%) |
| 75 Years and over | 195 (100.0%) | 238 (73.9%) |
| Total | 2,612 (95.3%) | 2,459 (89.7%) |
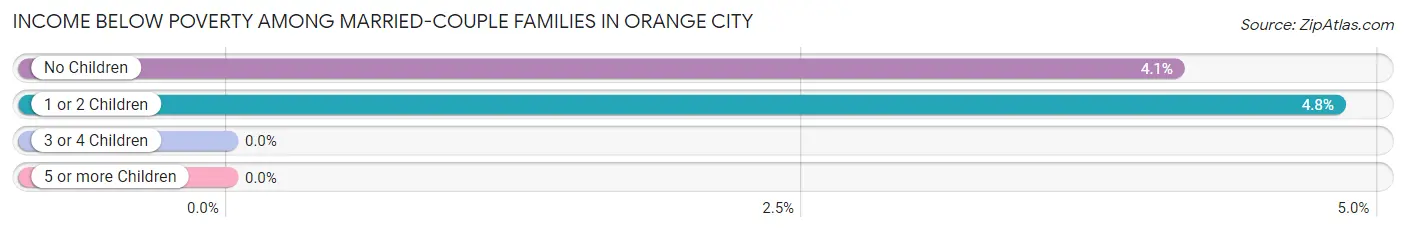
Income Below Poverty Among Married-Couple Families in Orange City
The poverty statistics for married-couple families in Orange City show that 3.9% or 53 of the total 1,373 families live below the poverty line. Families with 1 or 2 children have the highest poverty rate of 4.8%, comprising of 20 families. On the other hand, families with 3 or 4 children have the lowest poverty rate of 0.0%, which includes 0 families.
| Children | Above Poverty | Below Poverty |
| No Children | 767 (95.9%) | 33 (4.1%) |
| 1 or 2 Children | 395 (95.2%) | 20 (4.8%) |
| 3 or 4 Children | 158 (100.0%) | 0 (0.0%) |
| 5 or more Children | 0 (0.0%) | 0 (0.0%) |
| Total | 1,320 (96.1%) | 53 (3.9%) |
Income Below Poverty Among Single-Parent Households in Orange City
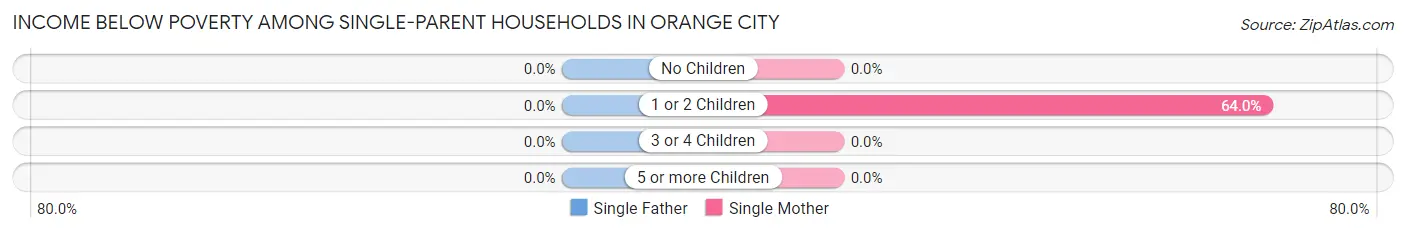
| Children | Single Father | Single Mother |
| No Children | 0 (0.0%) | 0 (0.0%) |
| 1 or 2 Children | 0 (0.0%) | 16 (64.0%) |
| 3 or 4 Children | 0 (0.0%) | 0 (0.0%) |
| 5 or more Children | 0 (0.0%) | 0 (0.0%) |
| Total | 0 (0.0%) | 16 (38.1%) |
Income Below Poverty Among Married-Couple vs Single-Parent Households in Orange City
The poverty data for Orange City shows that 53 of the married-couple family households (3.9%) and 16 of the single-parent households (38.1%) are living below the poverty level. Within the married-couple family households, those with 1 or 2 children have the highest poverty rate, with 20 households (4.8%) falling below the poverty line. Among the single-parent households, those with 1 or 2 children have the highest poverty rate, with 16 household (64.0%) living below poverty.
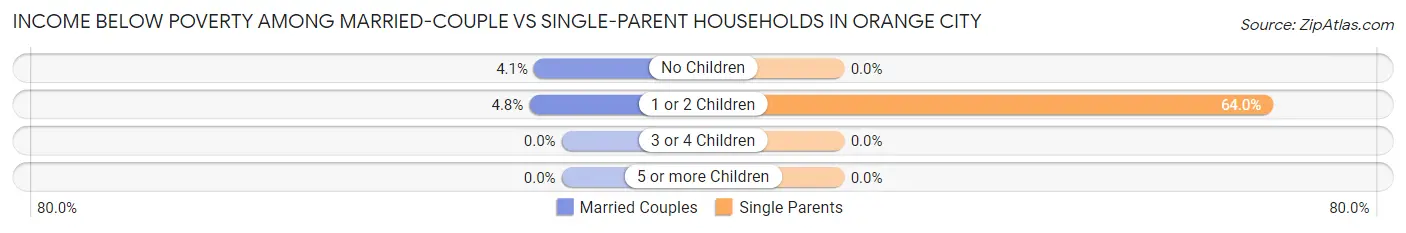
| Children | Married-Couple Families | Single-Parent Households |
| No Children | 33 (4.1%) | 0 (0.0%) |
| 1 or 2 Children | 20 (4.8%) | 16 (64.0%) |
| 3 or 4 Children | 0 (0.0%) | 0 (0.0%) |
| 5 or more Children | 0 (0.0%) | 0 (0.0%) |
| Total | 53 (3.9%) | 16 (38.1%) |
Race in Orange City
The most populous races in Orange City are White / Caucasian (5,897 | 93.9%), Two or more Races (203 | 3.2%), and Hispanic or Latino (146 | 2.3%).
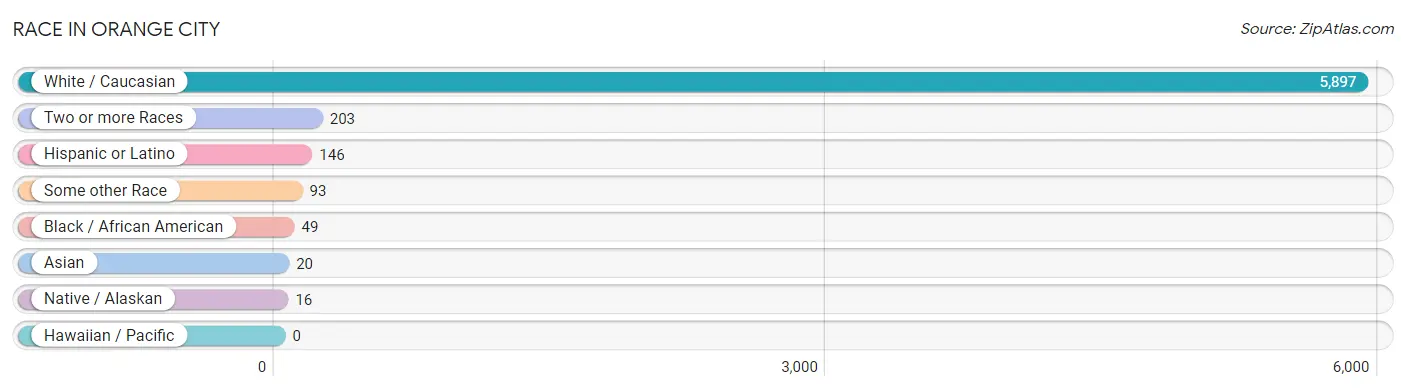
| Race | # Population | % Population |
| Asian | 20 | 0.3% |
| Black / African American | 49 | 0.8% |
| Hawaiian / Pacific | 0 | 0.0% |
| Hispanic or Latino | 146 | 2.3% |
| Native / Alaskan | 16 | 0.3% |
| White / Caucasian | 5,897 | 93.9% |
| Two or more Races | 203 | 3.2% |
| Some other Race | 93 | 1.5% |
| Total | 6,278 | 100.0% |
Ancestry in Orange City
The most populous ancestries reported in Orange City are Dutch (3,054 | 48.6%), German (1,815 | 28.9%), Irish (432 | 6.9%), English (296 | 4.7%), and Norwegian (256 | 4.1%), together accounting for 93.2% of all Orange City residents.
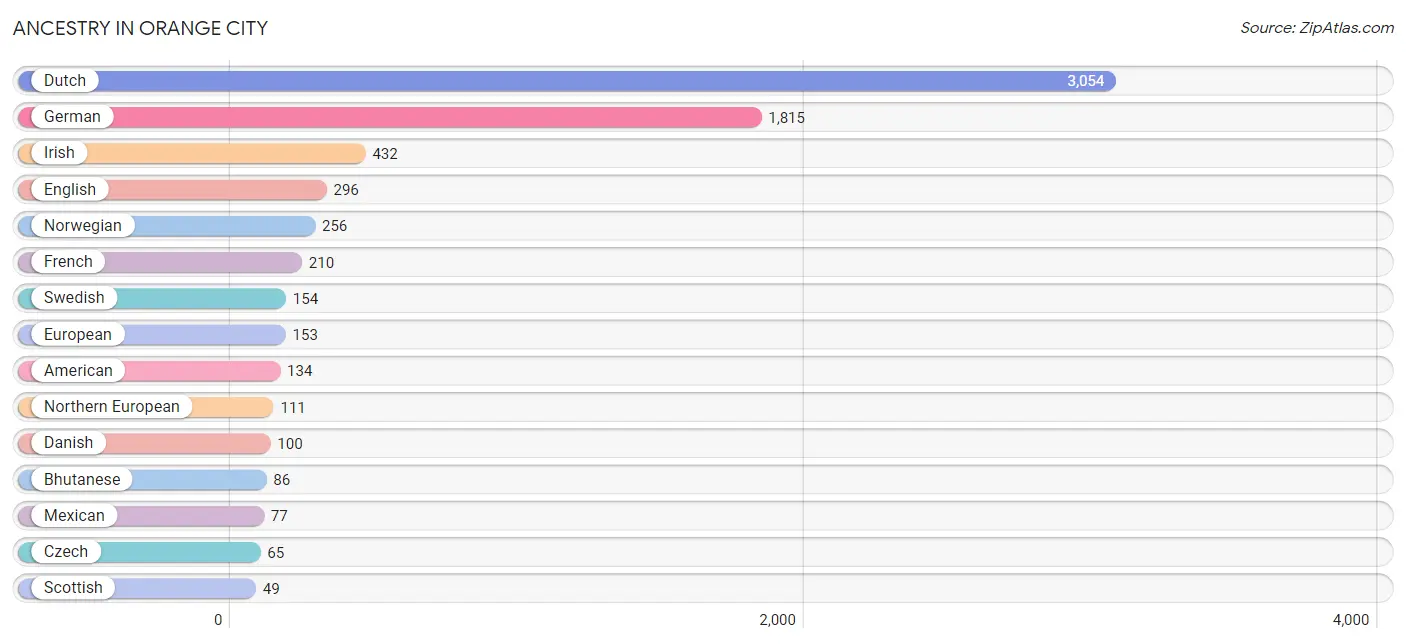
| Ancestry | # Population | % Population |
| Albanian | 3 | 0.1% |
| American | 134 | 2.1% |
| Australian | 15 | 0.2% |
| Austrian | 21 | 0.3% |
| Bhutanese | 86 | 1.4% |
| British | 34 | 0.5% |
| Bulgarian | 26 | 0.4% |
| Cherokee | 9 | 0.1% |
| Chippewa | 1 | 0.0% |
| Comanche | 7 | 0.1% |
| Czech | 65 | 1.0% |
| Danish | 100 | 1.6% |
| Dutch | 3,054 | 48.6% |
| Eastern European | 1 | 0.0% |
| English | 296 | 4.7% |
| European | 153 | 2.4% |
| French | 210 | 3.4% |
| German | 1,815 | 28.9% |
| Irish | 432 | 6.9% |
| Italian | 23 | 0.4% |
| Korean | 2 | 0.0% |
| Lithuanian | 6 | 0.1% |
| Luxembourger | 2 | 0.0% |
| Mexican | 77 | 1.2% |
| Northern European | 111 | 1.8% |
| Norwegian | 256 | 4.1% |
| Polish | 25 | 0.4% |
| Puerto Rican | 5 | 0.1% |
| Scandinavian | 16 | 0.3% |
| Scotch-Irish | 23 | 0.4% |
| Scottish | 49 | 0.8% |
| Spanish | 21 | 0.3% |
| Sri Lankan | 18 | 0.3% |
| Swedish | 154 | 2.5% |
| Swiss | 14 | 0.2% | View All 35 Rows |
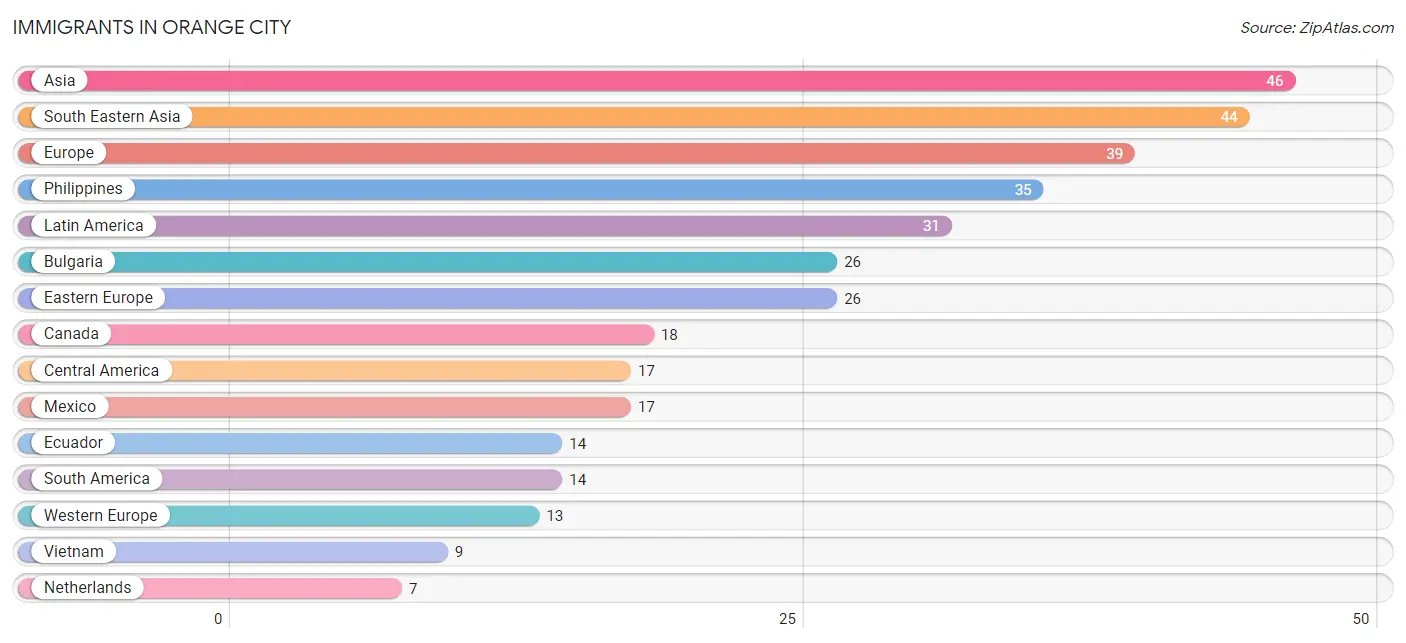
Immigrants in Orange City
The most numerous immigrant groups reported in Orange City came from Asia (46 | 0.7%), South Eastern Asia (44 | 0.7%), Europe (39 | 0.6%), Philippines (35 | 0.6%), and Latin America (31 | 0.5%), together accounting for 3.1% of all Orange City residents.
| Immigration Origin | # Population | % Population |
| Asia | 46 | 0.7% |
| Austria | 6 | 0.1% |
| Bulgaria | 26 | 0.4% |
| Canada | 18 | 0.3% |
| Central America | 17 | 0.3% |
| Eastern Asia | 2 | 0.0% |
| Eastern Europe | 26 | 0.4% |
| Ecuador | 14 | 0.2% |
| Europe | 39 | 0.6% |
| Japan | 2 | 0.0% |
| Latin America | 31 | 0.5% |
| Mexico | 17 | 0.3% |
| Netherlands | 7 | 0.1% |
| Philippines | 35 | 0.6% |
| South America | 14 | 0.2% |
| South Eastern Asia | 44 | 0.7% |
| Vietnam | 9 | 0.1% |
| Western Europe | 13 | 0.2% | View All 18 Rows |
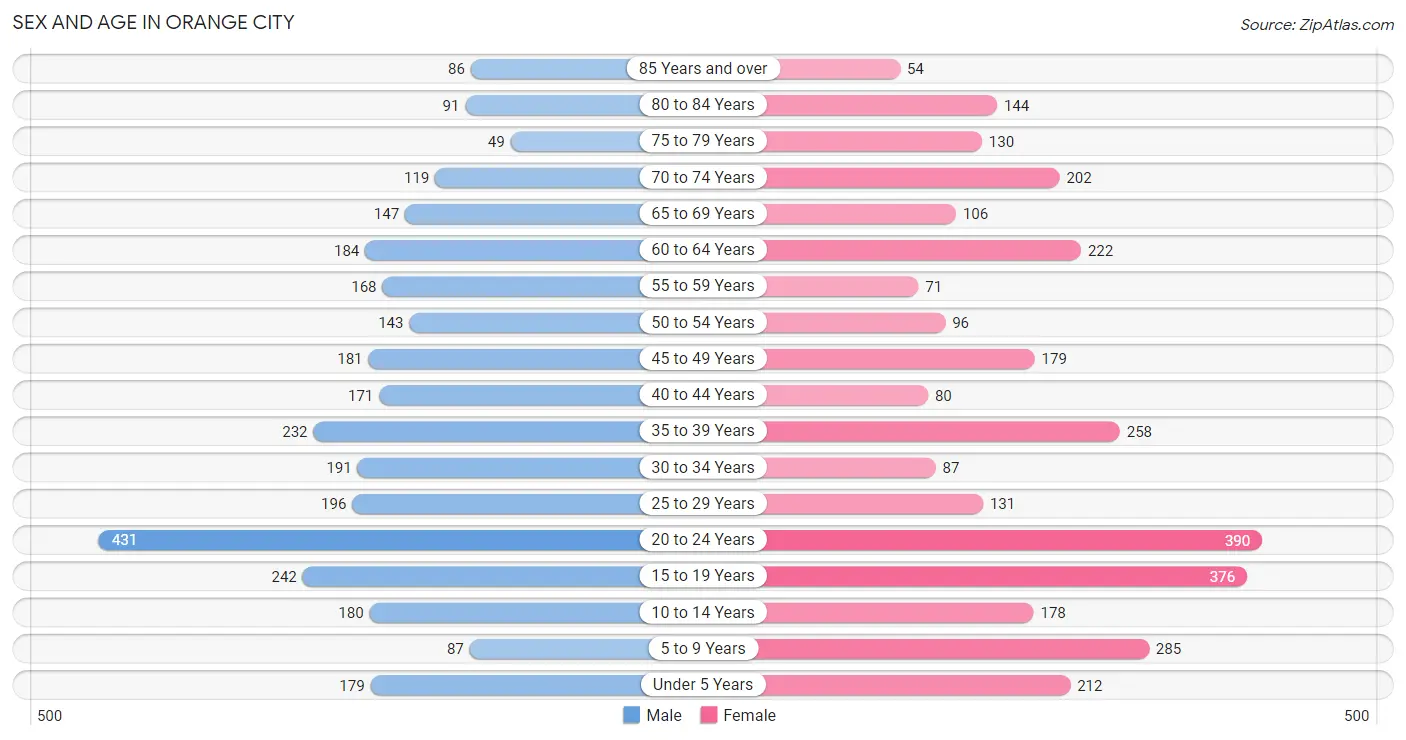
Sex and Age in Orange City
Sex and Age in Orange City
The most populous age groups in Orange City are 20 to 24 Years (431 | 14.0%) for men and 20 to 24 Years (390 | 12.2%) for women.
| Age Bracket | Male | Female |
| Under 5 Years | 179 (5.8%) | 212 (6.6%) |
| 5 to 9 Years | 87 (2.8%) | 285 (8.9%) |
| 10 to 14 Years | 180 (5.9%) | 178 (5.6%) |
| 15 to 19 Years | 242 (7.9%) | 376 (11.7%) |
| 20 to 24 Years | 431 (14.0%) | 390 (12.2%) |
| 25 to 29 Years | 196 (6.4%) | 131 (4.1%) |
| 30 to 34 Years | 191 (6.2%) | 87 (2.7%) |
| 35 to 39 Years | 232 (7.5%) | 258 (8.1%) |
| 40 to 44 Years | 171 (5.6%) | 80 (2.5%) |
| 45 to 49 Years | 181 (5.9%) | 179 (5.6%) |
| 50 to 54 Years | 143 (4.6%) | 96 (3.0%) |
| 55 to 59 Years | 168 (5.5%) | 71 (2.2%) |
| 60 to 64 Years | 184 (6.0%) | 222 (6.9%) |
| 65 to 69 Years | 147 (4.8%) | 106 (3.3%) |
| 70 to 74 Years | 119 (3.9%) | 202 (6.3%) |
| 75 to 79 Years | 49 (1.6%) | 130 (4.1%) |
| 80 to 84 Years | 91 (3.0%) | 144 (4.5%) |
| 85 Years and over | 86 (2.8%) | 54 (1.7%) |
| Total | 3,077 (100.0%) | 3,201 (100.0%) |
Families and Households in Orange City
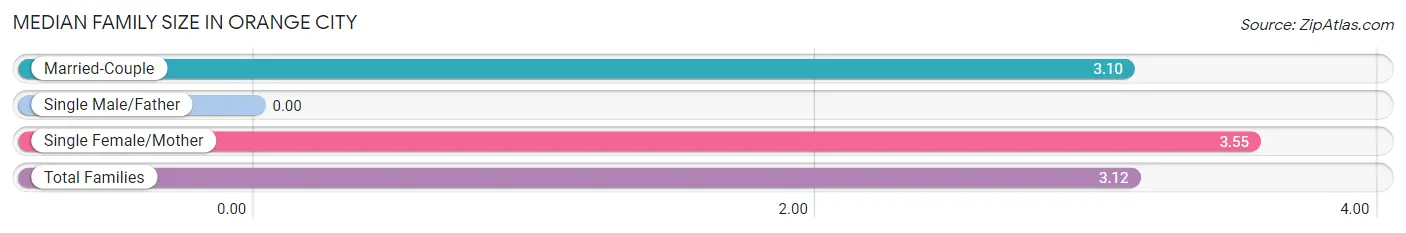
Median Family Size in Orange City
| Family Type | # Families | Family Size |
| Married-Couple | 1,373 (97.0%) | 3.10 |
| Single Male/Father | 0 (0.0%) | - |
| Single Female/Mother | 42 (3.0%) | 3.55 |
| Total Families | 1,415 (100.0%) | 3.12 |
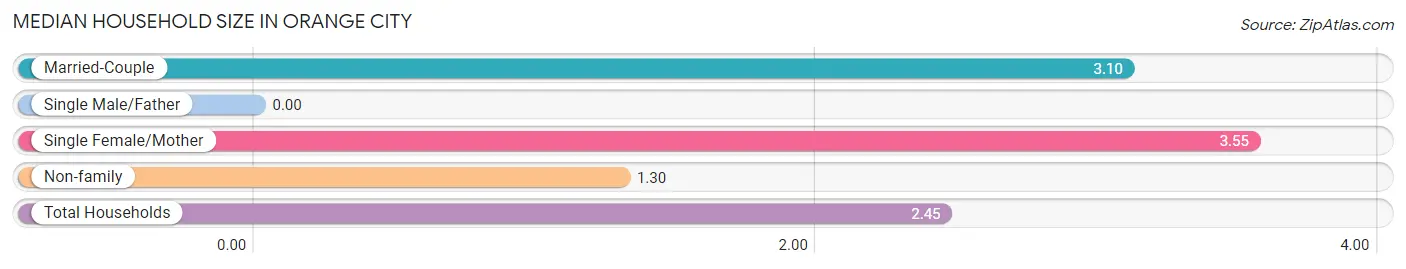
Median Household Size in Orange City
| Household Type | # Households | Household Size |
| Married-Couple | 1,373 (61.6%) | 3.10 |
| Single Male/Father | 0 (0.0%) | - |
| Single Female/Mother | 42 (1.9%) | 3.55 |
| Non-family | 813 (36.5%) | 1.30 |
| Total Households | 2,228 (100.0%) | 2.45 |
Household Size by Marriage Status in Orange City
Out of a total of 2,228 households in Orange City, 1,415 (63.5%) are family households, while 813 (36.5%) are nonfamily households. The most numerous type of family households are 2-person households, comprising 661, and the most common type of nonfamily households are 1-person households, comprising 676.
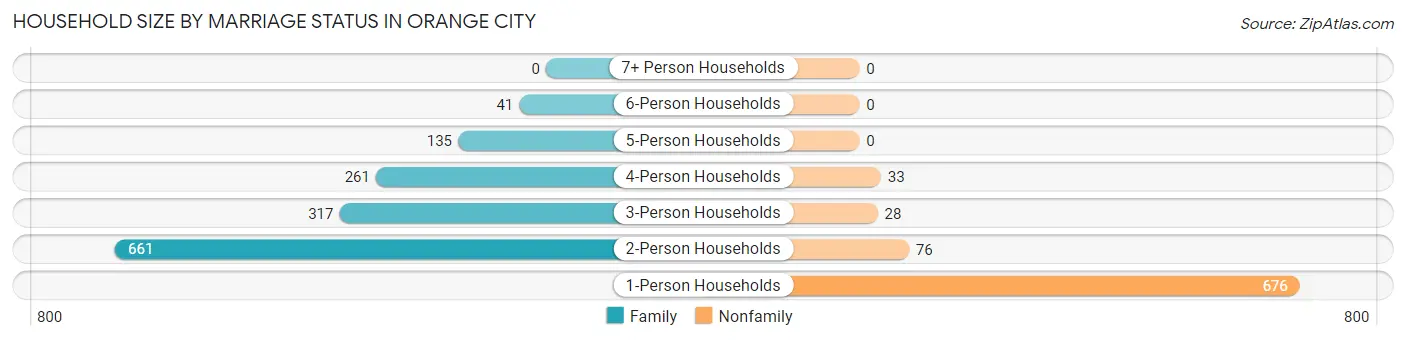
| Household Size | Family Households | Nonfamily Households |
| 1-Person Households | - | 676 (30.3%) |
| 2-Person Households | 661 (29.7%) | 76 (3.4%) |
| 3-Person Households | 317 (14.2%) | 28 (1.3%) |
| 4-Person Households | 261 (11.7%) | 33 (1.5%) |
| 5-Person Households | 135 (6.1%) | 0 (0.0%) |
| 6-Person Households | 41 (1.8%) | 0 (0.0%) |
| 7+ Person Households | 0 (0.0%) | 0 (0.0%) |
| Total | 1,415 (63.5%) | 813 (36.5%) |
Female Fertility in Orange City
Fertility by Age in Orange City
Average fertility rate in Orange City is 71.0 births per 1,000 women. Women in the age bracket of 35 to 50 years have the highest fertility rate with 124.0 births per 1,000 women. Women in the age bracket of 35 to 50 years acount for 59.8% of all women with births.
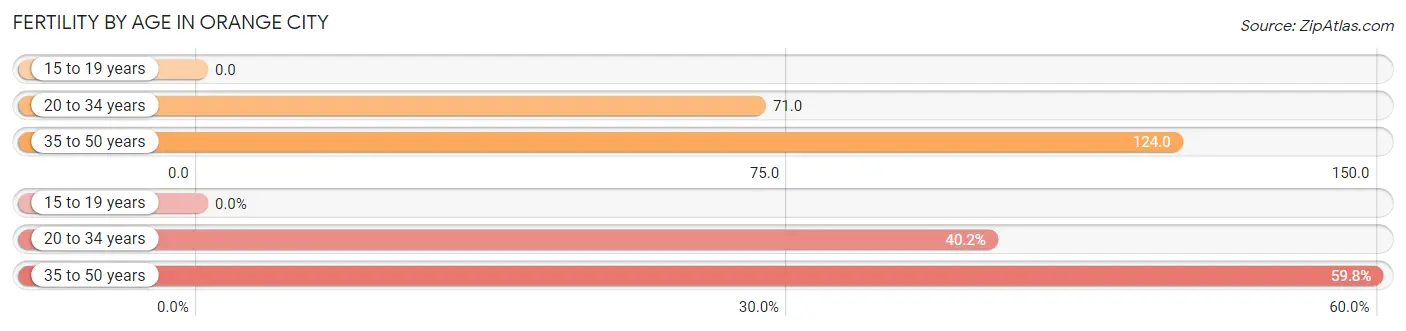
| Age Bracket | Women with Births | Births / 1,000 Women |
| 15 to 19 years | 0 (0.0%) | 0.0 |
| 20 to 34 years | 43 (40.2%) | 71.0 |
| 35 to 50 years | 64 (59.8%) | 124.0 |
| Total | 107 (100.0%) | 71.0 |
Fertility by Age by Marriage Status in Orange City
99.1% of women with births (107) in Orange City are married. The highest percentage of unmarried women with births falls into 20 to 34 years age bracket with 2.3% of them unmarried at the time of birth, while the lowest percentage of unmarried women with births belong to 35 to 50 years age bracket with 0.0% of them unmarried.
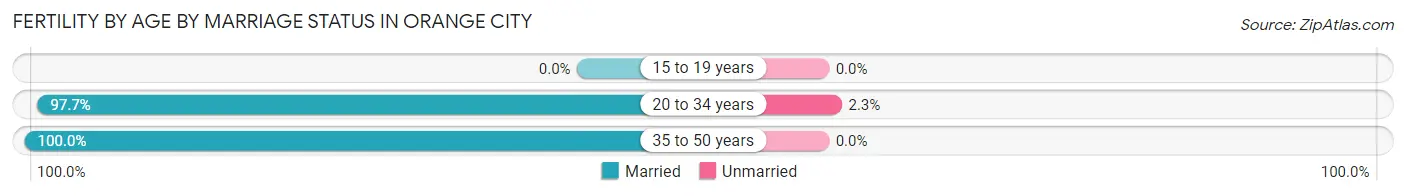
| Age Bracket | Married | Unmarried |
| 15 to 19 years | 0 (0.0%) | 0 (0.0%) |
| 20 to 34 years | 42 (97.7%) | 1 (2.3%) |
| 35 to 50 years | 64 (100.0%) | 0 (0.0%) |
| Total | 106 (99.1%) | 1 (0.9%) |
Fertility by Education in Orange City
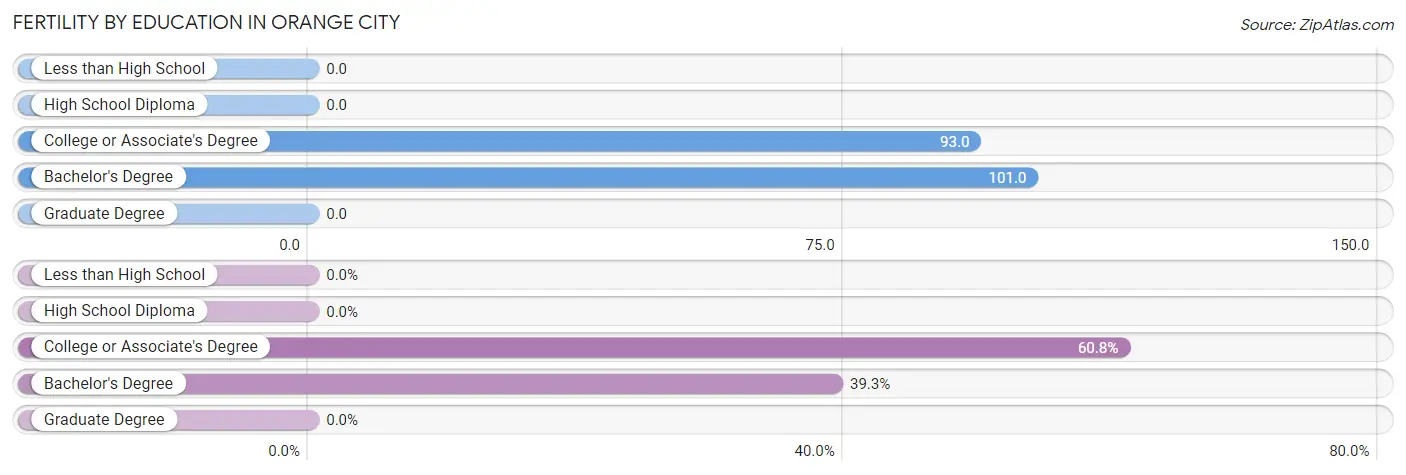
| Educational Attainment | Women with Births | Births / 1,000 Women |
| Less than High School | 0 (0.0%) | 0.0 |
| High School Diploma | 0 (0.0%) | 0.0 |
| College or Associate's Degree | 65 (60.8%) | 93.0 |
| Bachelor's Degree | 42 (39.3%) | 101.0 |
| Graduate Degree | 0 (0.0%) | 0.0 |
| Total | 107 (100.0%) | 71.0 |
Fertility by Education by Marriage Status in Orange City
0.9% of women with births in Orange City are unmarried. Women with the educational attainment of bachelor's degree are most likely to be married with 100.0% of them married at childbirth, while women with the educational attainment of college or associate's degree are least likely to be married with 1.5% of them unmarried at childbirth.
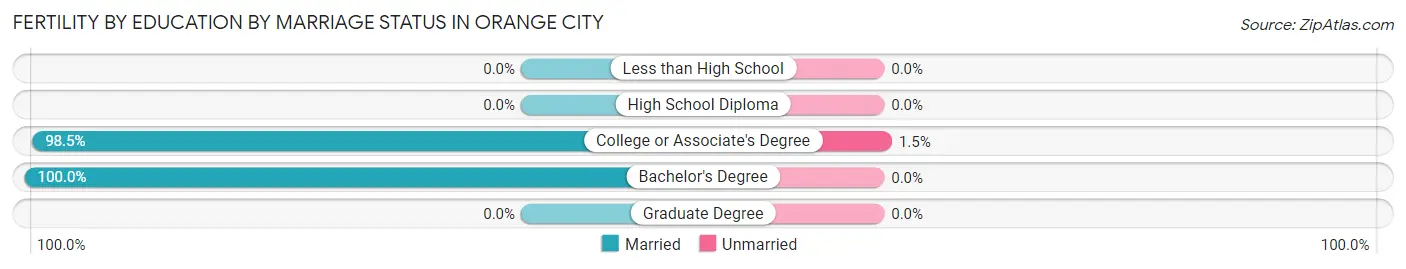
| Educational Attainment | Married | Unmarried |
| Less than High School | 0 (0.0%) | 0 (0.0%) |
| High School Diploma | 0 (0.0%) | 0 (0.0%) |
| College or Associate's Degree | 64 (98.5%) | 1 (1.5%) |
| Bachelor's Degree | 42 (100.0%) | 0 (0.0%) |
| Graduate Degree | 0 (0.0%) | 0 (0.0%) |
| Total | 106 (99.1%) | 1 (0.9%) |
Employment Characteristics in Orange City
Employment by Class of Employer in Orange City
Among the 3,251 employed individuals in Orange City, private company employees (2,210 | 68.0%), self-employed (not incorporated) (307 | 9.4%), and not-for-profit organizations (295 | 9.1%) make up the most common classes of employment.
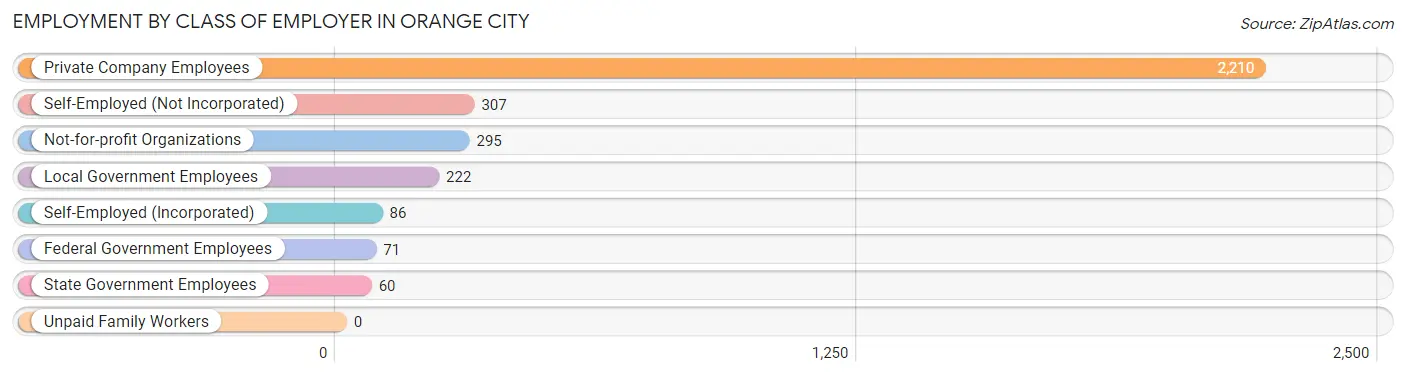
| Employer Class | # Employees | % Employees |
| Private Company Employees | 2,210 | 68.0% |
| Self-Employed (Incorporated) | 86 | 2.6% |
| Self-Employed (Not Incorporated) | 307 | 9.4% |
| Not-for-profit Organizations | 295 | 9.1% |
| Local Government Employees | 222 | 6.8% |
| State Government Employees | 60 | 1.8% |
| Federal Government Employees | 71 | 2.2% |
| Unpaid Family Workers | 0 | 0.0% |
| Total | 3,251 | 100.0% |
Employment Status by Age in Orange City
According to the labor force statistics for Orange City, out of the total population over 16 years of age (5,097), 69.2% or 3,527 individuals are in the labor force, with 5.4% or 190 of them unemployed. The age group with the highest labor force participation rate is 45 to 54 years, with 99.7% or 597 individuals in the labor force. Within the labor force, the 16 to 19 years age range has the highest percentage of unemployed individuals, with 23.9% or 95 of them being unemployed.
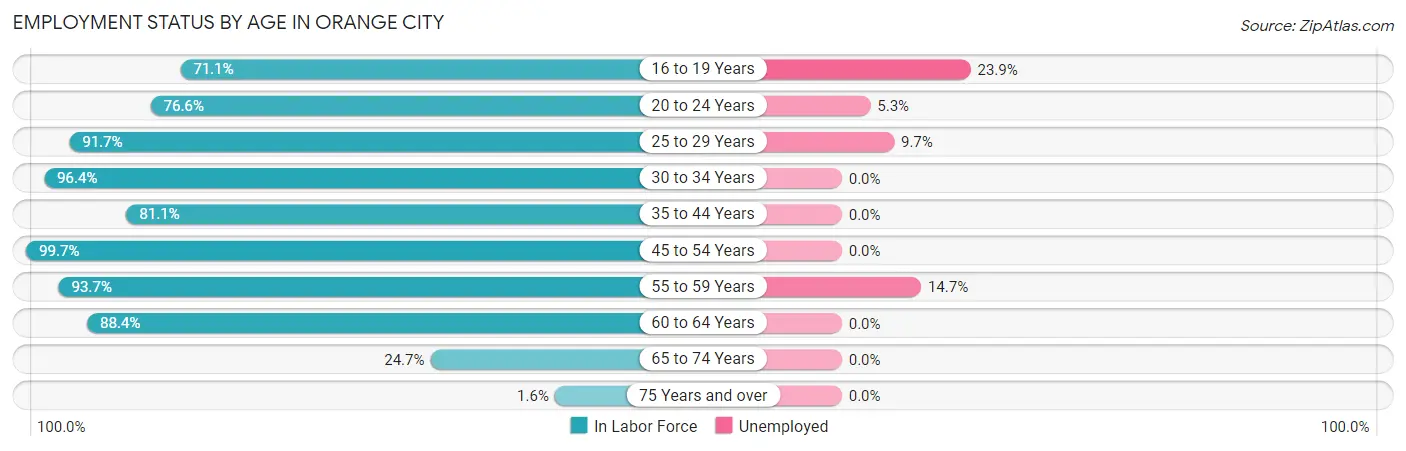
| Age Bracket | In Labor Force | Unemployed |
| 16 to 19 Years | 397 (71.1%) | 95 (23.9%) |
| 20 to 24 Years | 629 (76.6%) | 33 (5.3%) |
| 25 to 29 Years | 300 (91.7%) | 29 (9.7%) |
| 30 to 34 Years | 268 (96.4%) | 0 (0.0%) |
| 35 to 44 Years | 601 (81.1%) | 0 (0.0%) |
| 45 to 54 Years | 597 (99.7%) | 0 (0.0%) |
| 55 to 59 Years | 224 (93.7%) | 33 (14.7%) |
| 60 to 64 Years | 359 (88.4%) | 0 (0.0%) |
| 65 to 74 Years | 142 (24.7%) | 0 (0.0%) |
| 75 Years and over | 9 (1.6%) | 0 (0.0%) |
| Total | 3,527 (69.2%) | 190 (5.4%) |
Employment Status by Educational Attainment in Orange City
According to labor force statistics for Orange City, 90.7% of individuals (2,349) out of the total population between 25 and 64 years of age (2,590) are in the labor force, with 2.6% or 61 of them being unemployed. The group with the highest labor force participation rate are those with the educational attainment of less than high school, with 98.6% or 68 individuals in the labor force. Within the labor force, individuals with college / associate degree education have the highest percentage of unemployment, with 8.4% or 62 of them being unemployed.
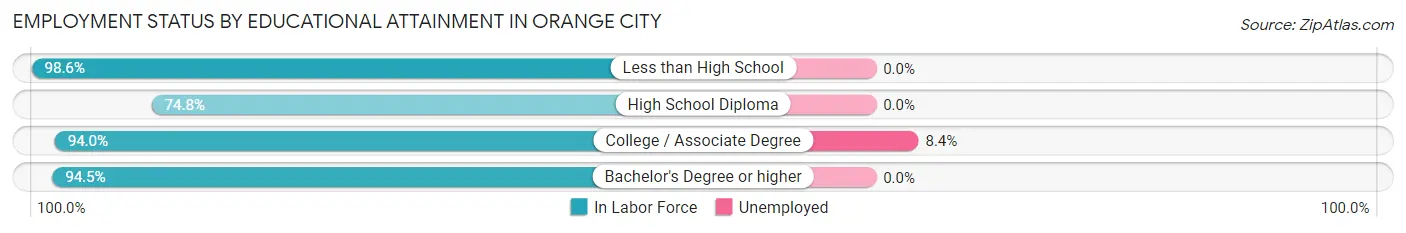
| Educational Attainment | In Labor Force | Unemployed |
| Less than High School | 68 (98.6%) | 0 (0.0%) |
| High School Diploma | 368 (74.8%) | 0 (0.0%) |
| College / Associate Degree | 735 (94.0%) | 66 (8.4%) |
| Bachelor's Degree or higher | 1,178 (94.5%) | 0 (0.0%) |
| Total | 2,349 (90.7%) | 67 (2.6%) |
Employment Occupations by Sex in Orange City
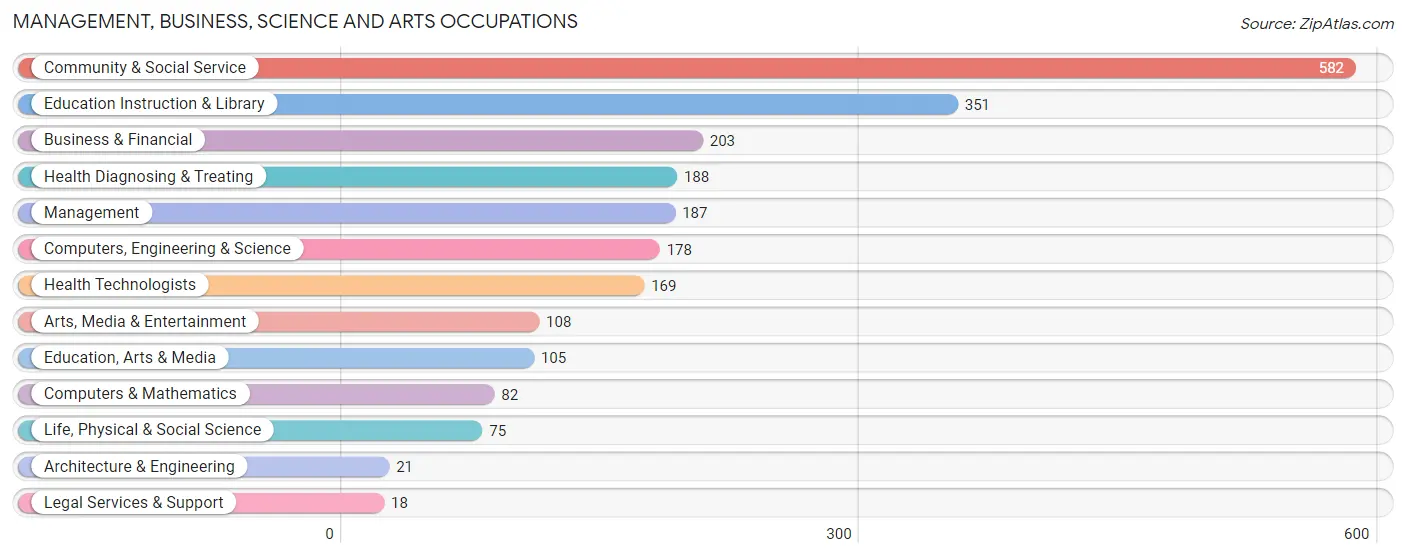
Management, Business, Science and Arts Occupations
The most common Management, Business, Science and Arts occupations in Orange City are Community & Social Service (582 | 17.6%), Education Instruction & Library (351 | 10.6%), Business & Financial (203 | 6.1%), Health Diagnosing & Treating (188 | 5.7%), and Management (187 | 5.7%).
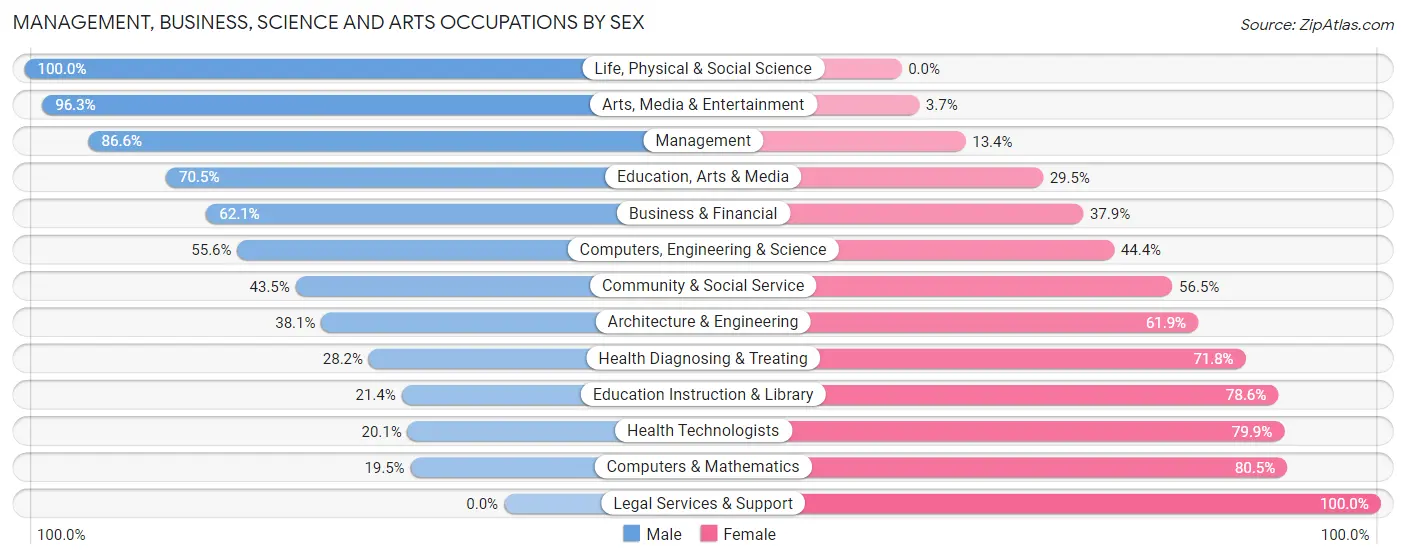
Management, Business, Science and Arts Occupations by Sex
Within the Management, Business, Science and Arts occupations in Orange City, the most male-oriented occupations are Life, Physical & Social Science (100.0%), Arts, Media & Entertainment (96.3%), and Management (86.6%), while the most female-oriented occupations are Legal Services & Support (100.0%), Computers & Mathematics (80.5%), and Health Technologists (79.9%).
| Occupation | Male | Female |
| Management | 162 (86.6%) | 25 (13.4%) |
| Business & Financial | 126 (62.1%) | 77 (37.9%) |
| Computers, Engineering & Science | 99 (55.6%) | 79 (44.4%) |
| Computers & Mathematics | 16 (19.5%) | 66 (80.5%) |
| Architecture & Engineering | 8 (38.1%) | 13 (61.9%) |
| Life, Physical & Social Science | 75 (100.0%) | 0 (0.0%) |
| Community & Social Service | 253 (43.5%) | 329 (56.5%) |
| Education, Arts & Media | 74 (70.5%) | 31 (29.5%) |
| Legal Services & Support | 0 (0.0%) | 18 (100.0%) |
| Education Instruction & Library | 75 (21.4%) | 276 (78.6%) |
| Arts, Media & Entertainment | 104 (96.3%) | 4 (3.7%) |
| Health Diagnosing & Treating | 53 (28.2%) | 135 (71.8%) |
| Health Technologists | 34 (20.1%) | 135 (79.9%) |
| Total (Category) | 693 (51.8%) | 645 (48.2%) |
| Total (Overall) | 1,723 (52.1%) | 1,584 (47.9%) |
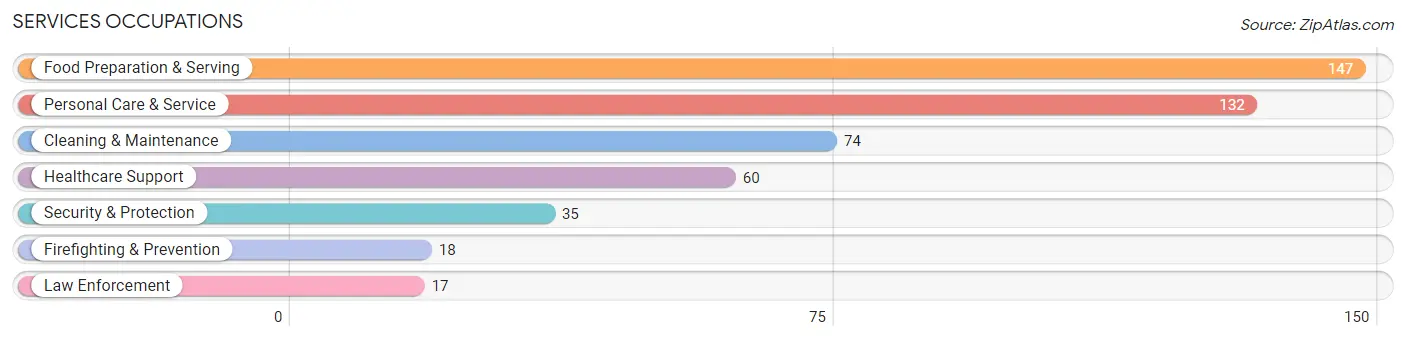
Services Occupations
The most common Services occupations in Orange City are Food Preparation & Serving (147 | 4.4%), Personal Care & Service (132 | 4.0%), Cleaning & Maintenance (74 | 2.2%), Healthcare Support (60 | 1.8%), and Security & Protection (35 | 1.1%).
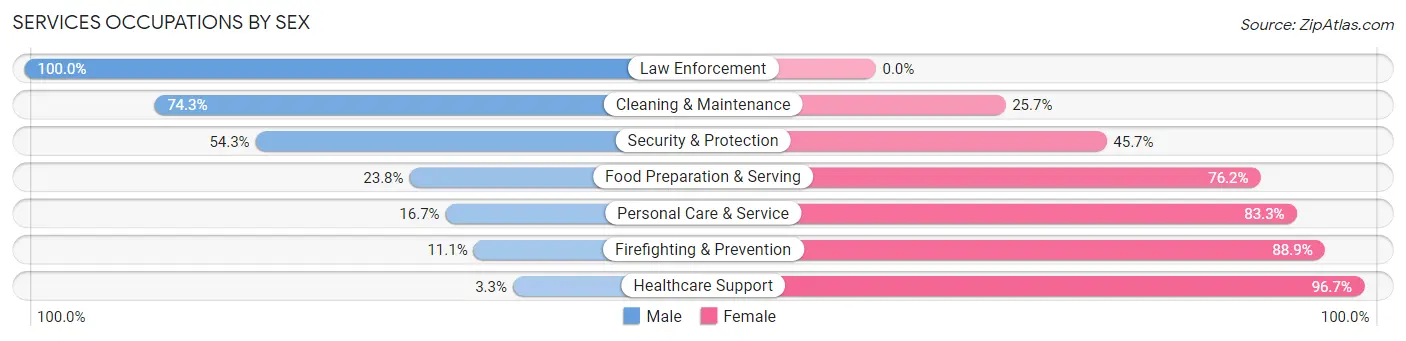
Services Occupations by Sex
Within the Services occupations in Orange City, the most male-oriented occupations are Law Enforcement (100.0%), Cleaning & Maintenance (74.3%), and Security & Protection (54.3%), while the most female-oriented occupations are Healthcare Support (96.7%), Firefighting & Prevention (88.9%), and Personal Care & Service (83.3%).
| Occupation | Male | Female |
| Healthcare Support | 2 (3.3%) | 58 (96.7%) |
| Security & Protection | 19 (54.3%) | 16 (45.7%) |
| Firefighting & Prevention | 2 (11.1%) | 16 (88.9%) |
| Law Enforcement | 17 (100.0%) | 0 (0.0%) |
| Food Preparation & Serving | 35 (23.8%) | 112 (76.2%) |
| Cleaning & Maintenance | 55 (74.3%) | 19 (25.7%) |
| Personal Care & Service | 22 (16.7%) | 110 (83.3%) |
| Total (Category) | 133 (29.7%) | 315 (70.3%) |
| Total (Overall) | 1,723 (52.1%) | 1,584 (47.9%) |
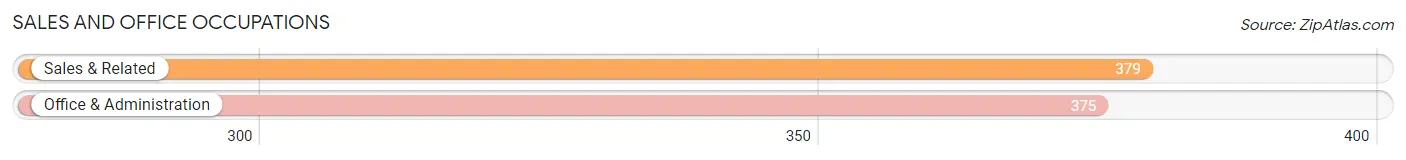
Sales and Office Occupations
The most common Sales and Office occupations in Orange City are Sales & Related (379 | 11.5%), and Office & Administration (375 | 11.3%).
Sales and Office Occupations by Sex
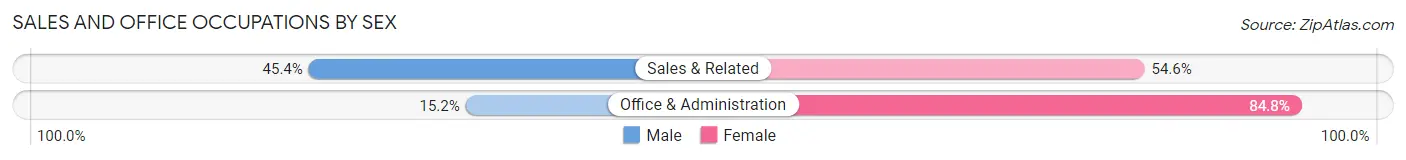
| Occupation | Male | Female |
| Sales & Related | 172 (45.4%) | 207 (54.6%) |
| Office & Administration | 57 (15.2%) | 318 (84.8%) |
| Total (Category) | 229 (30.4%) | 525 (69.6%) |
| Total (Overall) | 1,723 (52.1%) | 1,584 (47.9%) |
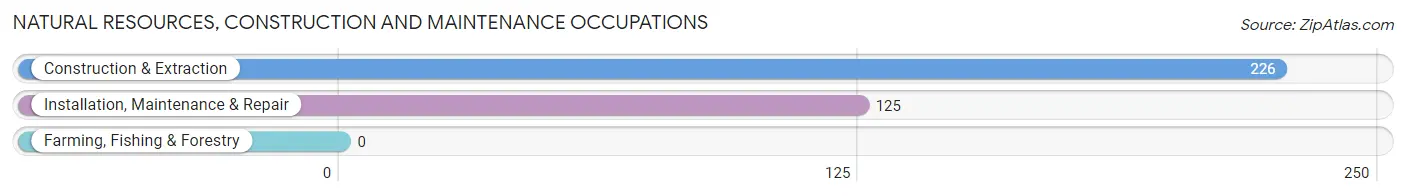
Natural Resources, Construction and Maintenance Occupations
The most common Natural Resources, Construction and Maintenance occupations in Orange City are Construction & Extraction (226 | 6.8%), and Installation, Maintenance & Repair (125 | 3.8%).
Natural Resources, Construction and Maintenance Occupations by Sex
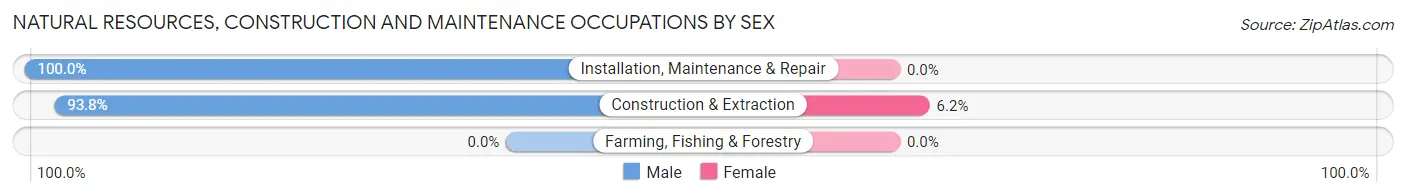
| Occupation | Male | Female |
| Farming, Fishing & Forestry | 0 (0.0%) | 0 (0.0%) |
| Construction & Extraction | 212 (93.8%) | 14 (6.2%) |
| Installation, Maintenance & Repair | 125 (100.0%) | 0 (0.0%) |
| Total (Category) | 337 (96.0%) | 14 (4.0%) |
| Total (Overall) | 1,723 (52.1%) | 1,584 (47.9%) |
Production, Transportation and Moving Occupations
The most common Production, Transportation and Moving occupations in Orange City are Production (290 | 8.8%), Material Moving (70 | 2.1%), and Transportation (56 | 1.7%).
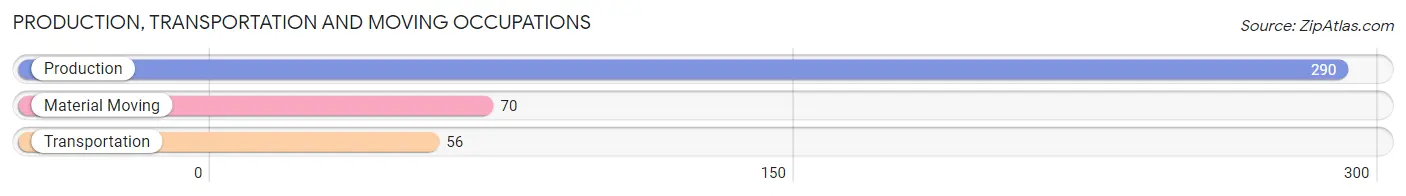
Production, Transportation and Moving Occupations by Sex
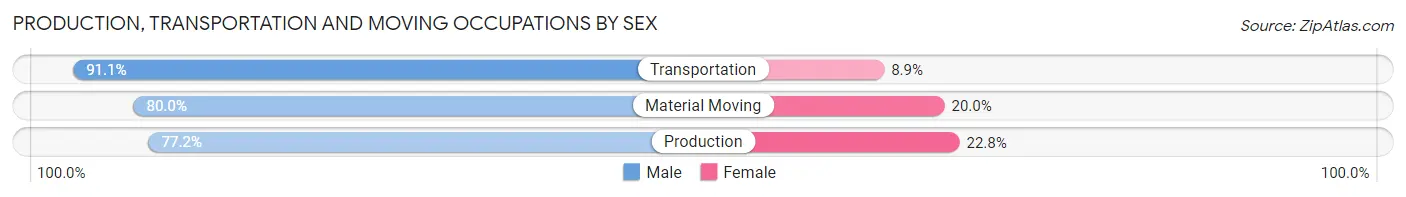
| Occupation | Male | Female |
| Production | 224 (77.2%) | 66 (22.8%) |
| Transportation | 51 (91.1%) | 5 (8.9%) |
| Material Moving | 56 (80.0%) | 14 (20.0%) |
| Total (Category) | 331 (79.6%) | 85 (20.4%) |
| Total (Overall) | 1,723 (52.1%) | 1,584 (47.9%) |
Employment Industries by Sex in Orange City
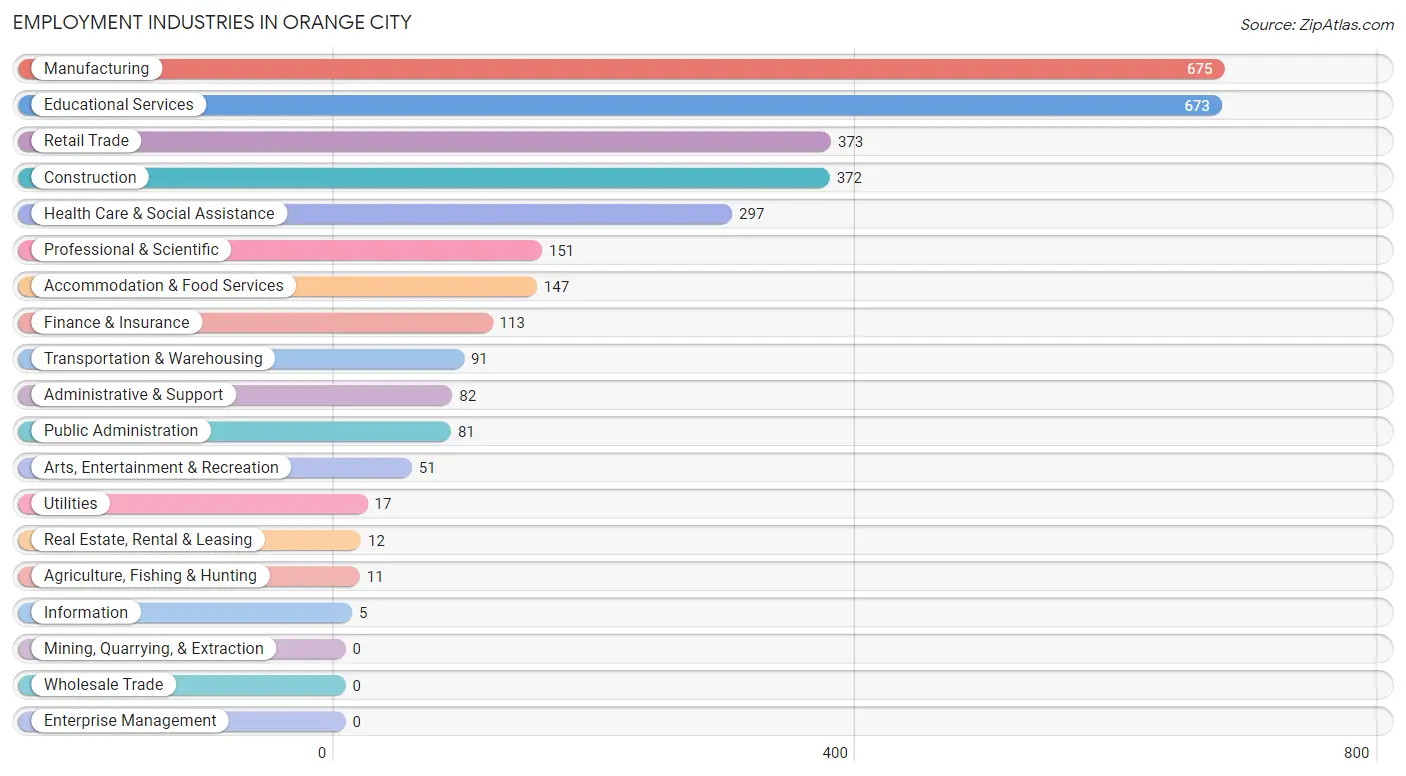
Employment Industries in Orange City
The major employment industries in Orange City include Manufacturing (675 | 20.4%), Educational Services (673 | 20.3%), Retail Trade (373 | 11.3%), Construction (372 | 11.3%), and Health Care & Social Assistance (297 | 9.0%).
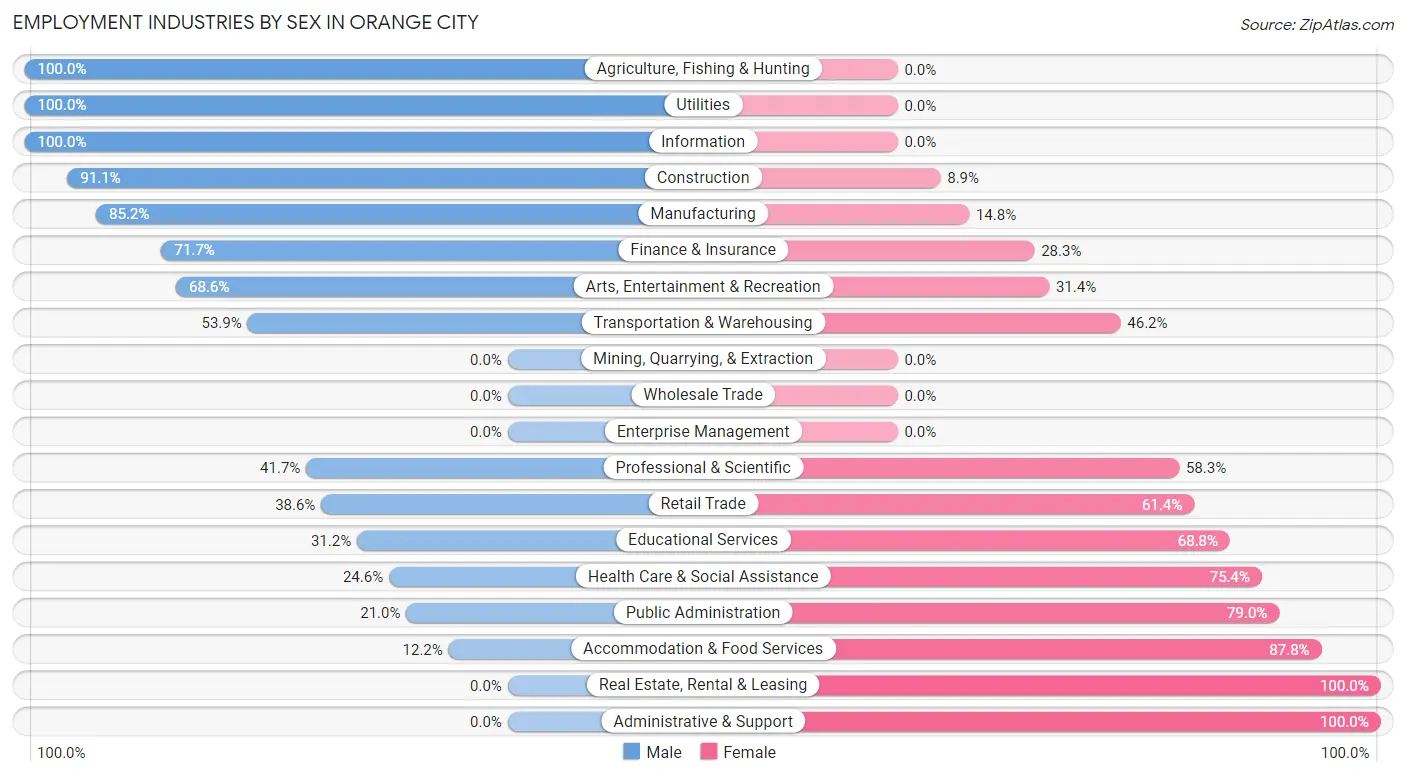
Employment Industries by Sex in Orange City
The Orange City industries that see more men than women are Agriculture, Fishing & Hunting (100.0%), Utilities (100.0%), and Information (100.0%), whereas the industries that tend to have a higher number of women are Real Estate, Rental & Leasing (100.0%), Administrative & Support (100.0%), and Accommodation & Food Services (87.8%).
| Industry | Male | Female |
| Agriculture, Fishing & Hunting | 11 (100.0%) | 0 (0.0%) |
| Mining, Quarrying, & Extraction | 0 (0.0%) | 0 (0.0%) |
| Construction | 339 (91.1%) | 33 (8.9%) |
| Manufacturing | 575 (85.2%) | 100 (14.8%) |
| Wholesale Trade | 0 (0.0%) | 0 (0.0%) |
| Retail Trade | 144 (38.6%) | 229 (61.4%) |
| Transportation & Warehousing | 49 (53.8%) | 42 (46.2%) |
| Utilities | 17 (100.0%) | 0 (0.0%) |
| Information | 5 (100.0%) | 0 (0.0%) |
| Finance & Insurance | 81 (71.7%) | 32 (28.3%) |
| Real Estate, Rental & Leasing | 0 (0.0%) | 12 (100.0%) |
| Professional & Scientific | 63 (41.7%) | 88 (58.3%) |
| Enterprise Management | 0 (0.0%) | 0 (0.0%) |
| Administrative & Support | 0 (0.0%) | 82 (100.0%) |
| Educational Services | 210 (31.2%) | 463 (68.8%) |
| Health Care & Social Assistance | 73 (24.6%) | 224 (75.4%) |
| Arts, Entertainment & Recreation | 35 (68.6%) | 16 (31.4%) |
| Accommodation & Food Services | 18 (12.2%) | 129 (87.8%) |
| Public Administration | 17 (21.0%) | 64 (79.0%) |
| Total | 1,723 (52.1%) | 1,584 (47.9%) |
Education in Orange City
School Enrollment in Orange City
The most common levels of schooling among the 1,945 students in Orange City are college / undergraduate (986 | 50.7%), elementary school (368 | 18.9%), and middle school (257 | 13.2%).
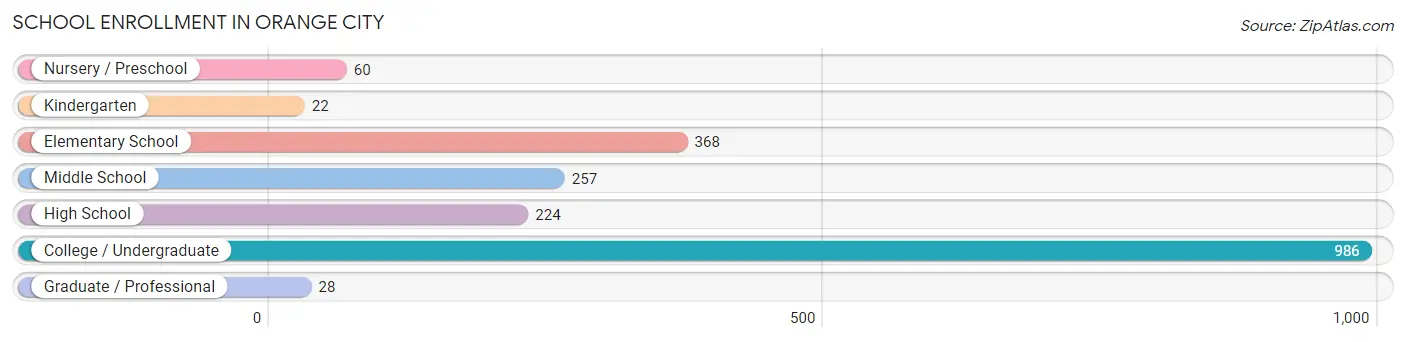
| School Level | # Students | % Students |
| Nursery / Preschool | 60 | 3.1% |
| Kindergarten | 22 | 1.1% |
| Elementary School | 368 | 18.9% |
| Middle School | 257 | 13.2% |
| High School | 224 | 11.5% |
| College / Undergraduate | 986 | 50.7% |
| Graduate / Professional | 28 | 1.4% |
| Total | 1,945 | 100.0% |
School Enrollment by Age by Funding Source in Orange City
Out of a total of 1,945 students who are enrolled in schools in Orange City, 1,039 (53.4%) attend a private institution, while the remaining 906 (46.6%) are enrolled in public schools. The age group of 20 to 24 year olds has the highest likelihood of being enrolled in private schools, with 540 (100.0% in the age bracket) enrolled. Conversely, the age group of 15 to 17 year olds has the lowest likelihood of being enrolled in a private school, with 136 (100.0% in the age bracket) attending a public institution.
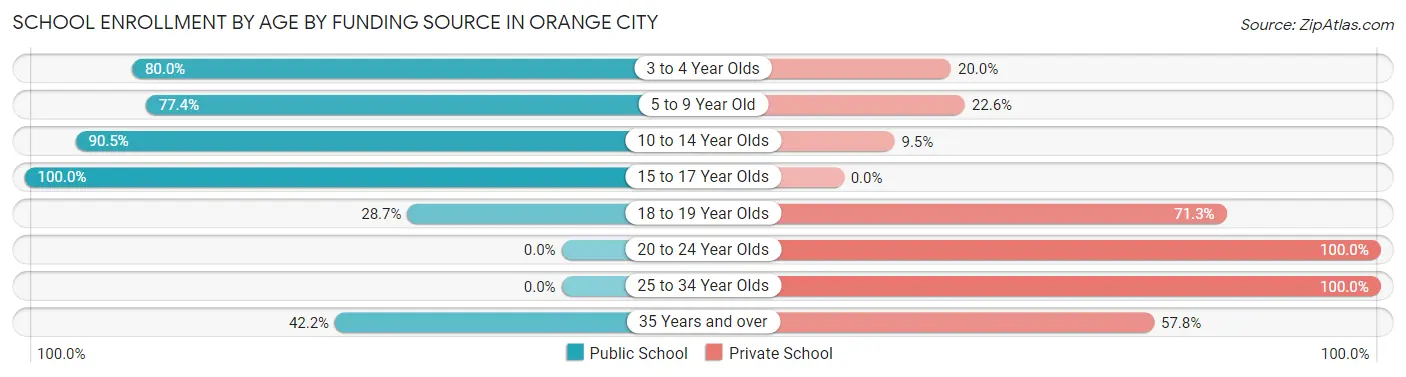
| Age Bracket | Public School | Private School |
| 3 to 4 Year Olds | 48 (80.0%) | 12 (20.0%) |
| 5 to 9 Year Old | 264 (77.4%) | 77 (22.6%) |
| 10 to 14 Year Olds | 296 (90.5%) | 31 (9.5%) |
| 15 to 17 Year Olds | 136 (100.0%) | 0 (0.0%) |
| 18 to 19 Year Olds | 135 (28.7%) | 335 (71.3%) |
| 20 to 24 Year Olds | 0 (0.0%) | 540 (100.0%) |
| 25 to 34 Year Olds | 0 (0.0%) | 7 (100.0%) |
| 35 Years and over | 27 (42.2%) | 37 (57.8%) |
| Total | 906 (46.6%) | 1,039 (53.4%) |
Educational Attainment by Field of Study in Orange City
Business (449 | 25.2%), education (418 | 23.4%), science & technology (188 | 10.5%), literature & languages (172 | 9.7%), and bio, nature & agricultural (151 | 8.5%) are the most common fields of study among 1,783 individuals in Orange City who have obtained a bachelor's degree or higher.
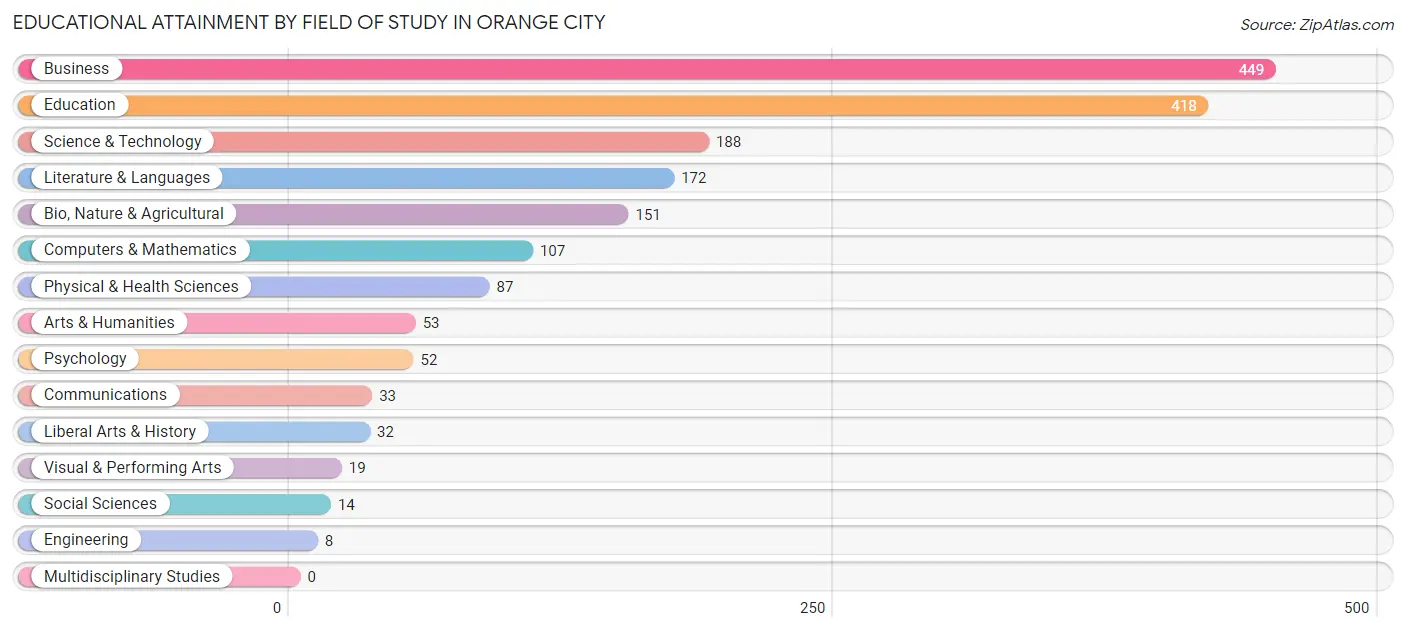
| Field of Study | # Graduates | % Graduates |
| Computers & Mathematics | 107 | 6.0% |
| Bio, Nature & Agricultural | 151 | 8.5% |
| Physical & Health Sciences | 87 | 4.9% |
| Psychology | 52 | 2.9% |
| Social Sciences | 14 | 0.8% |
| Engineering | 8 | 0.4% |
| Multidisciplinary Studies | 0 | 0.0% |
| Science & Technology | 188 | 10.5% |
| Business | 449 | 25.2% |
| Education | 418 | 23.4% |
| Literature & Languages | 172 | 9.7% |
| Liberal Arts & History | 32 | 1.8% |
| Visual & Performing Arts | 19 | 1.1% |
| Communications | 33 | 1.8% |
| Arts & Humanities | 53 | 3.0% |
| Total | 1,783 | 100.0% |
Transportation & Commute in Orange City
Vehicle Availability by Sex in Orange City
The most prevalent vehicle ownership categories in Orange City are males with 2 vehicles (672, accounting for 42.8%) and females with 2 vehicles (661, making up 53.2%).
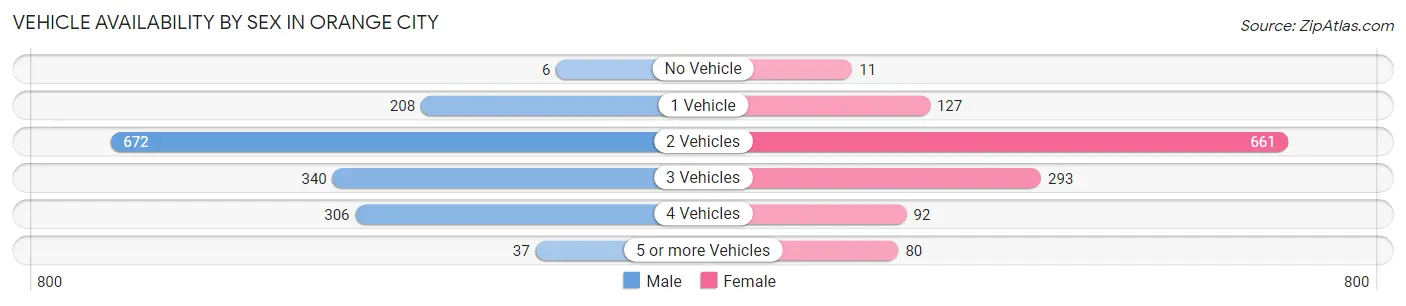
| Vehicles Available | Male | Female |
| No Vehicle | 6 (0.4%) | 11 (0.9%) |
| 1 Vehicle | 208 (13.3%) | 127 (10.1%) |
| 2 Vehicles | 672 (42.8%) | 661 (52.3%) |
| 3 Vehicles | 340 (21.7%) | 293 (23.2%) |
| 4 Vehicles | 306 (19.5%) | 92 (7.3%) |
| 5 or more Vehicles | 37 (2.4%) | 80 (6.3%) |
| Total | 1,569 (100.0%) | 1,264 (100.0%) |
Commute Time in Orange City
The most frequently occuring commute durations in Orange City are 5 to 9 minutes (1,075 commuters, 39.8%), less than 5 minutes (686 commuters, 25.4%), and 10 to 14 minutes (264 commuters, 9.8%).
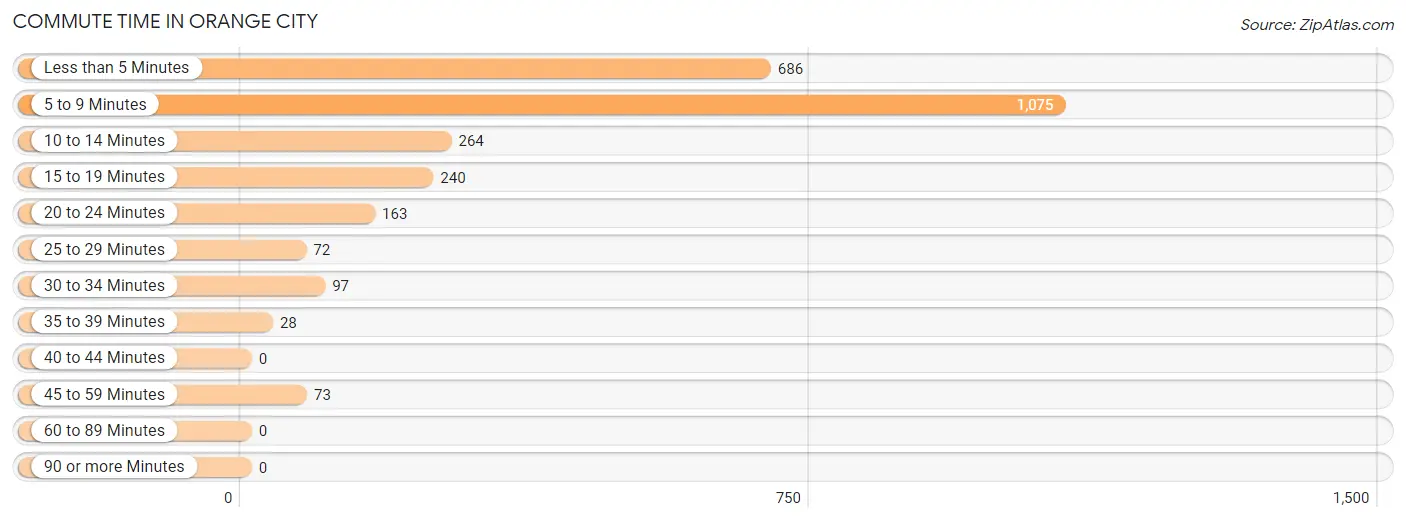
| Commute Time | # Commuters | % Commuters |
| Less than 5 Minutes | 686 | 25.4% |
| 5 to 9 Minutes | 1,075 | 39.8% |
| 10 to 14 Minutes | 264 | 9.8% |
| 15 to 19 Minutes | 240 | 8.9% |
| 20 to 24 Minutes | 163 | 6.0% |
| 25 to 29 Minutes | 72 | 2.7% |
| 30 to 34 Minutes | 97 | 3.6% |
| 35 to 39 Minutes | 28 | 1.0% |
| 40 to 44 Minutes | 0 | 0.0% |
| 45 to 59 Minutes | 73 | 2.7% |
| 60 to 89 Minutes | 0 | 0.0% |
| 90 or more Minutes | 0 | 0.0% |
Commute Time by Sex in Orange City
The most common commute times in Orange City are 5 to 9 minutes (457 commuters, 31.6%) for males and 5 to 9 minutes (618 commuters, 49.4%) for females.
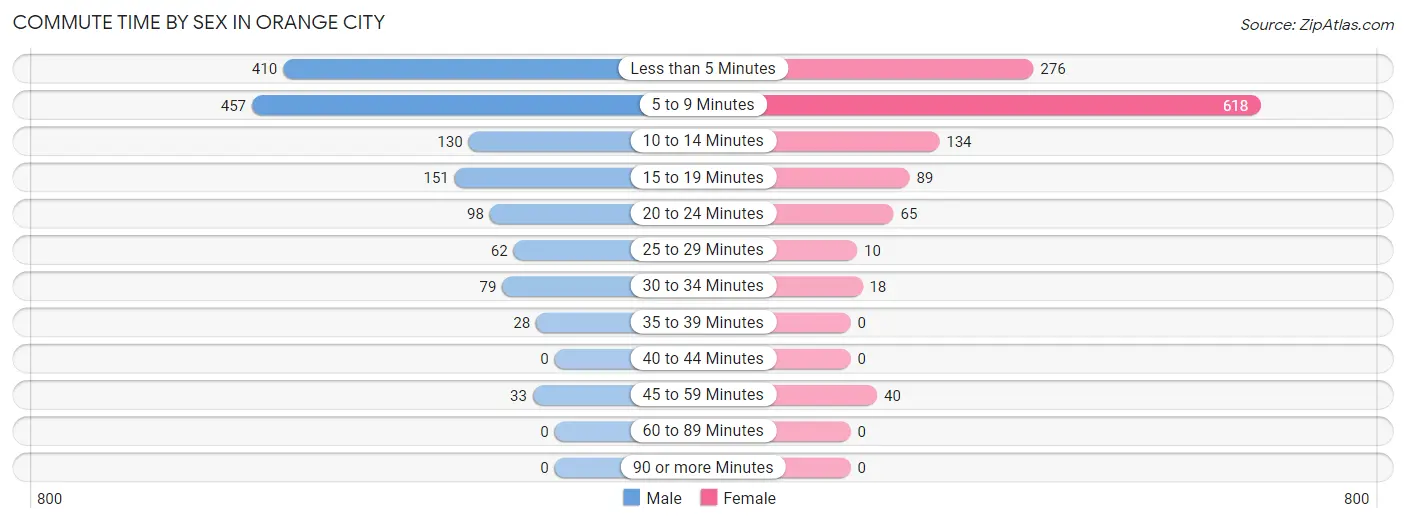
| Commute Time | Male | Female |
| Less than 5 Minutes | 410 (28.3%) | 276 (22.1%) |
| 5 to 9 Minutes | 457 (31.6%) | 618 (49.4%) |
| 10 to 14 Minutes | 130 (9.0%) | 134 (10.7%) |
| 15 to 19 Minutes | 151 (10.4%) | 89 (7.1%) |
| 20 to 24 Minutes | 98 (6.8%) | 65 (5.2%) |
| 25 to 29 Minutes | 62 (4.3%) | 10 (0.8%) |
| 30 to 34 Minutes | 79 (5.5%) | 18 (1.4%) |
| 35 to 39 Minutes | 28 (1.9%) | 0 (0.0%) |
| 40 to 44 Minutes | 0 (0.0%) | 0 (0.0%) |
| 45 to 59 Minutes | 33 (2.3%) | 40 (3.2%) |
| 60 to 89 Minutes | 0 (0.0%) | 0 (0.0%) |
| 90 or more Minutes | 0 (0.0%) | 0 (0.0%) |
Time of Departure to Work by Sex in Orange City
The most frequent times of departure to work in Orange City are 7:30 AM to 7:59 AM (313, 21.6%) for males and 8:00 AM to 8:29 AM (233, 18.6%) for females.
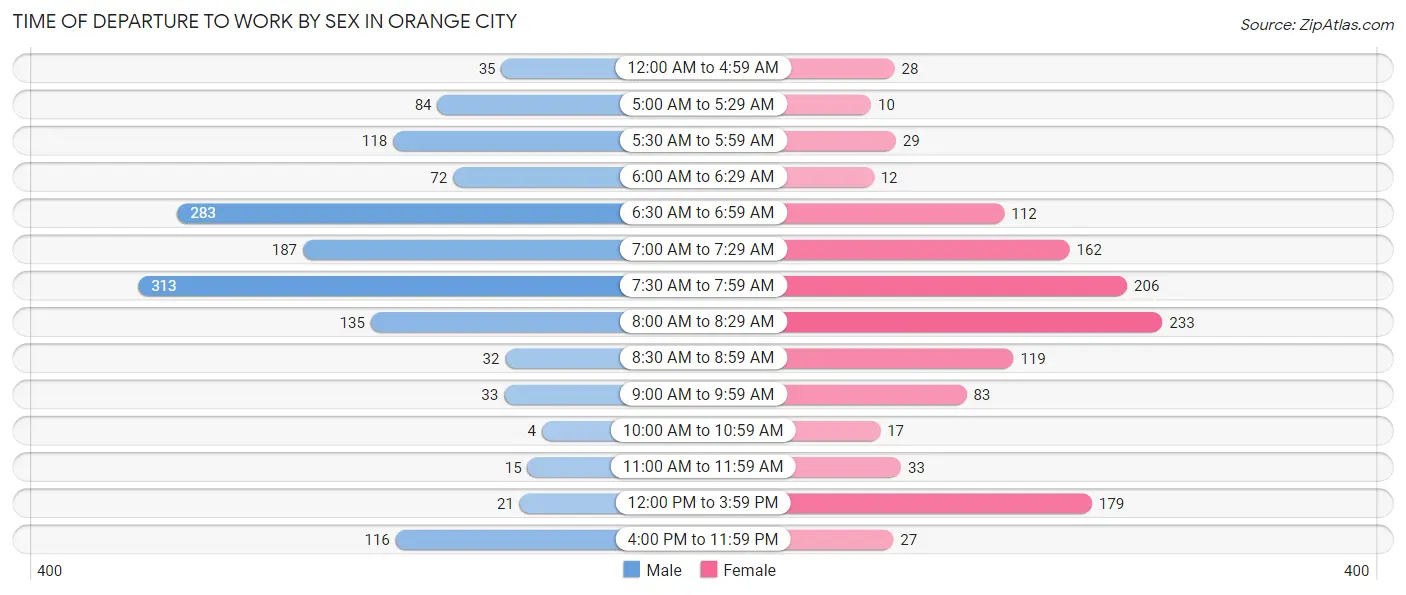
| Time of Departure | Male | Female |
| 12:00 AM to 4:59 AM | 35 (2.4%) | 28 (2.2%) |
| 5:00 AM to 5:29 AM | 84 (5.8%) | 10 (0.8%) |
| 5:30 AM to 5:59 AM | 118 (8.2%) | 29 (2.3%) |
| 6:00 AM to 6:29 AM | 72 (5.0%) | 12 (1.0%) |
| 6:30 AM to 6:59 AM | 283 (19.5%) | 112 (9.0%) |
| 7:00 AM to 7:29 AM | 187 (12.9%) | 162 (13.0%) |
| 7:30 AM to 7:59 AM | 313 (21.6%) | 206 (16.5%) |
| 8:00 AM to 8:29 AM | 135 (9.3%) | 233 (18.6%) |
| 8:30 AM to 8:59 AM | 32 (2.2%) | 119 (9.5%) |
| 9:00 AM to 9:59 AM | 33 (2.3%) | 83 (6.6%) |
| 10:00 AM to 10:59 AM | 4 (0.3%) | 17 (1.4%) |
| 11:00 AM to 11:59 AM | 15 (1.0%) | 33 (2.6%) |
| 12:00 PM to 3:59 PM | 21 (1.5%) | 179 (14.3%) |
| 4:00 PM to 11:59 PM | 116 (8.0%) | 27 (2.2%) |
| Total | 1,448 (100.0%) | 1,250 (100.0%) |
Housing Occupancy in Orange City
Occupancy by Ownership in Orange City
Of the total 2,228 dwellings in Orange City, owner-occupied units account for 1,643 (73.7%), while renter-occupied units make up 585 (26.3%).
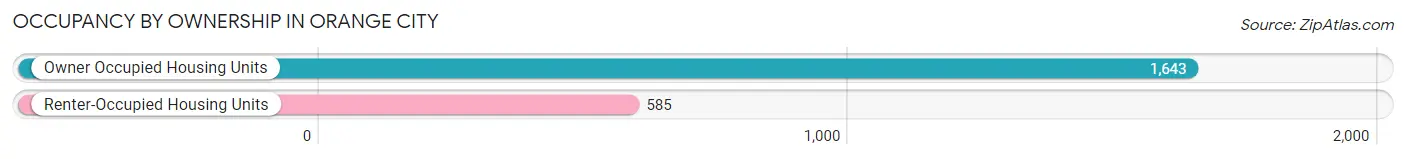
| Occupancy | # Housing Units | % Housing Units |
| Owner Occupied Housing Units | 1,643 | 73.7% |
| Renter-Occupied Housing Units | 585 | 26.3% |
| Total Occupied Housing Units | 2,228 | 100.0% |
Occupancy by Household Size in Orange City
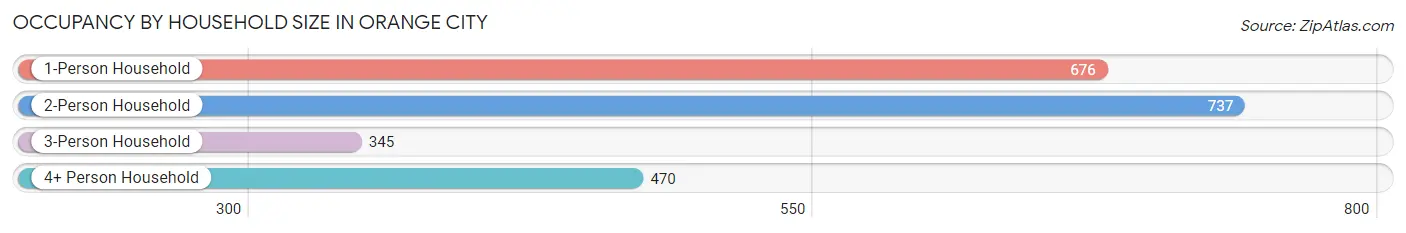
| Household Size | # Housing Units | % Housing Units |
| 1-Person Household | 676 | 30.3% |
| 2-Person Household | 737 | 33.1% |
| 3-Person Household | 345 | 15.5% |
| 4+ Person Household | 470 | 21.1% |
| Total Housing Units | 2,228 | 100.0% |
Occupancy by Ownership by Household Size in Orange City
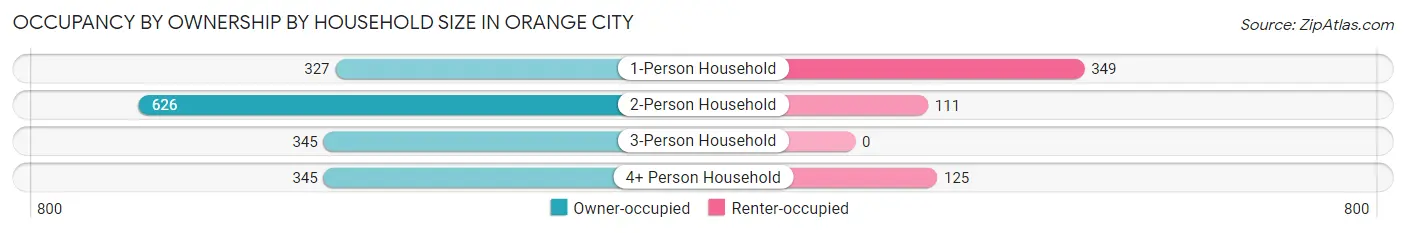
| Household Size | Owner-occupied | Renter-occupied |
| 1-Person Household | 327 (48.4%) | 349 (51.6%) |
| 2-Person Household | 626 (84.9%) | 111 (15.1%) |
| 3-Person Household | 345 (100.0%) | 0 (0.0%) |
| 4+ Person Household | 345 (73.4%) | 125 (26.6%) |
| Total Housing Units | 1,643 (73.7%) | 585 (26.3%) |
Occupancy by Educational Attainment in Orange City
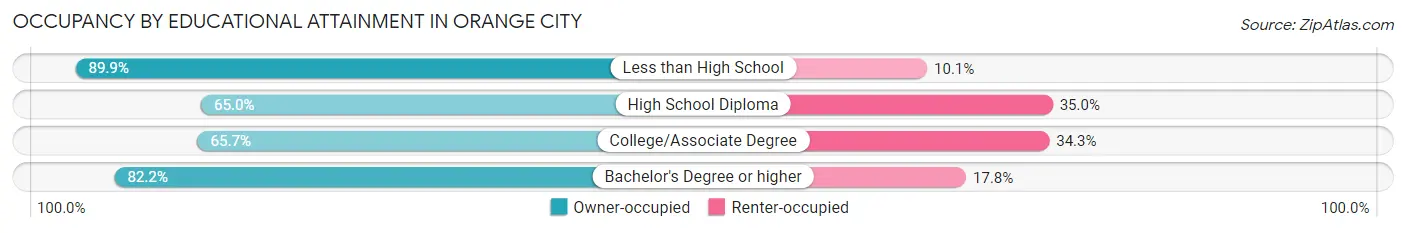
| Household Size | Owner-occupied | Renter-occupied |
| Less than High School | 89 (89.9%) | 10 (10.1%) |
| High School Diploma | 232 (65.0%) | 125 (35.0%) |
| College/Associate Degree | 534 (65.7%) | 279 (34.3%) |
| Bachelor's Degree or higher | 788 (82.2%) | 171 (17.8%) |
Occupancy by Age of Householder in Orange City
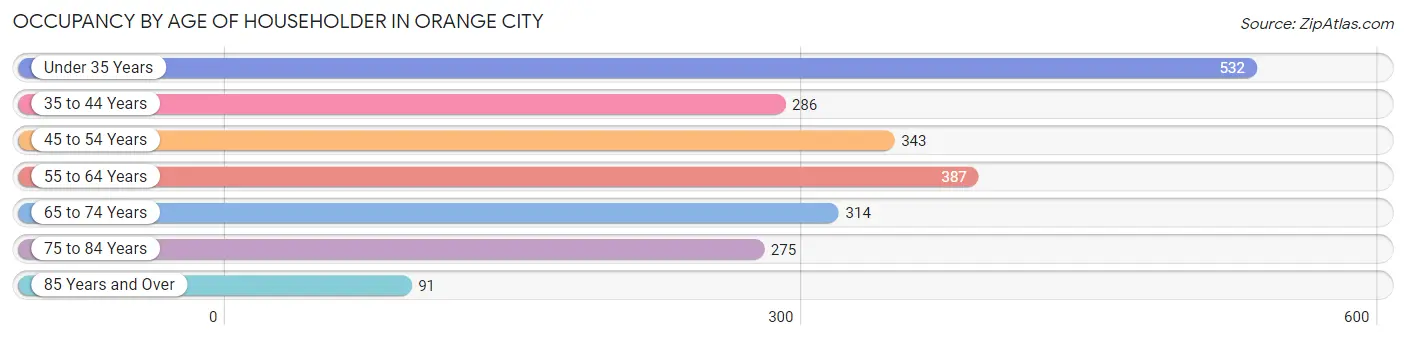
| Age Bracket | # Households | % Households |
| Under 35 Years | 532 | 23.9% |
| 35 to 44 Years | 286 | 12.8% |
| 45 to 54 Years | 343 | 15.4% |
| 55 to 64 Years | 387 | 17.4% |
| 65 to 74 Years | 314 | 14.1% |
| 75 to 84 Years | 275 | 12.3% |
| 85 Years and Over | 91 | 4.1% |
| Total | 2,228 | 100.0% |
Housing Finances in Orange City
Median Income by Occupancy in Orange City
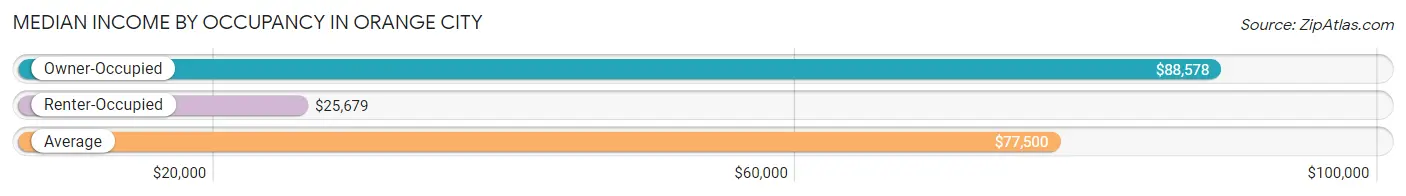
| Occupancy Type | # Households | Median Income |
| Owner-Occupied | 1,643 (73.7%) | $88,578 |
| Renter-Occupied | 585 (26.3%) | $25,679 |
| Average | 2,228 (100.0%) | $77,500 |
Occupancy by Householder Income Bracket in Orange City
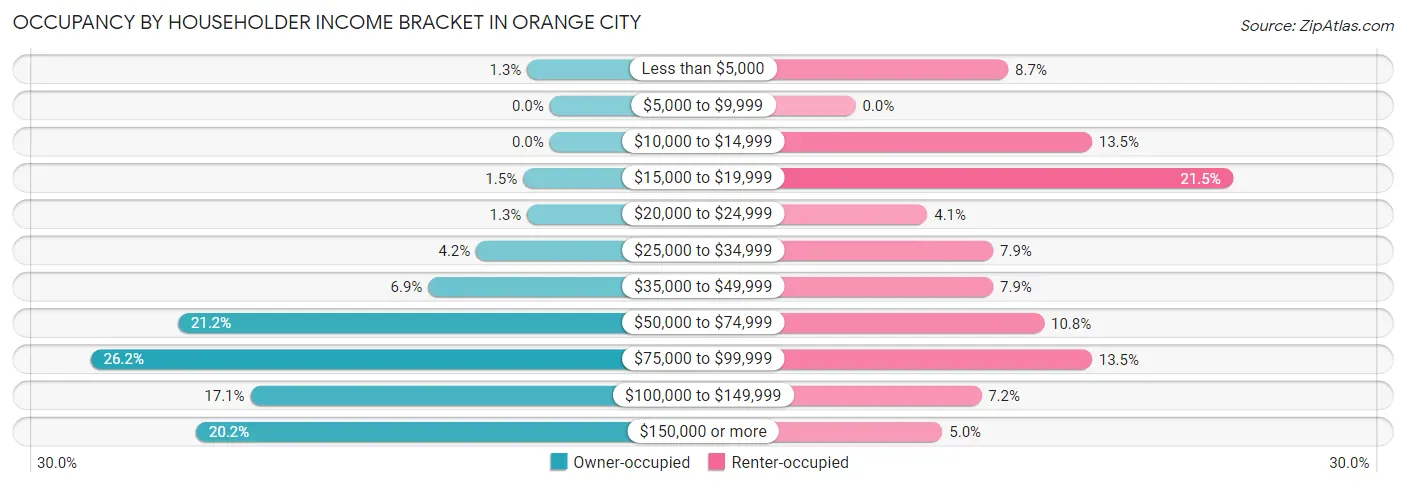
| Income Bracket | Owner-occupied | Renter-occupied |
| Less than $5,000 | 21 (1.3%) | 51 (8.7%) |
| $5,000 to $9,999 | 0 (0.0%) | 0 (0.0%) |
| $10,000 to $14,999 | 0 (0.0%) | 79 (13.5%) |
| $15,000 to $19,999 | 25 (1.5%) | 126 (21.5%) |
| $20,000 to $24,999 | 21 (1.3%) | 24 (4.1%) |
| $25,000 to $34,999 | 69 (4.2%) | 46 (7.9%) |
| $35,000 to $49,999 | 114 (6.9%) | 46 (7.9%) |
| $50,000 to $74,999 | 349 (21.2%) | 63 (10.8%) |
| $75,000 to $99,999 | 431 (26.2%) | 79 (13.5%) |
| $100,000 to $149,999 | 281 (17.1%) | 42 (7.2%) |
| $150,000 or more | 332 (20.2%) | 29 (5.0%) |
| Total | 1,643 (100.0%) | 585 (100.0%) |
Monthly Housing Cost Tiers in Orange City
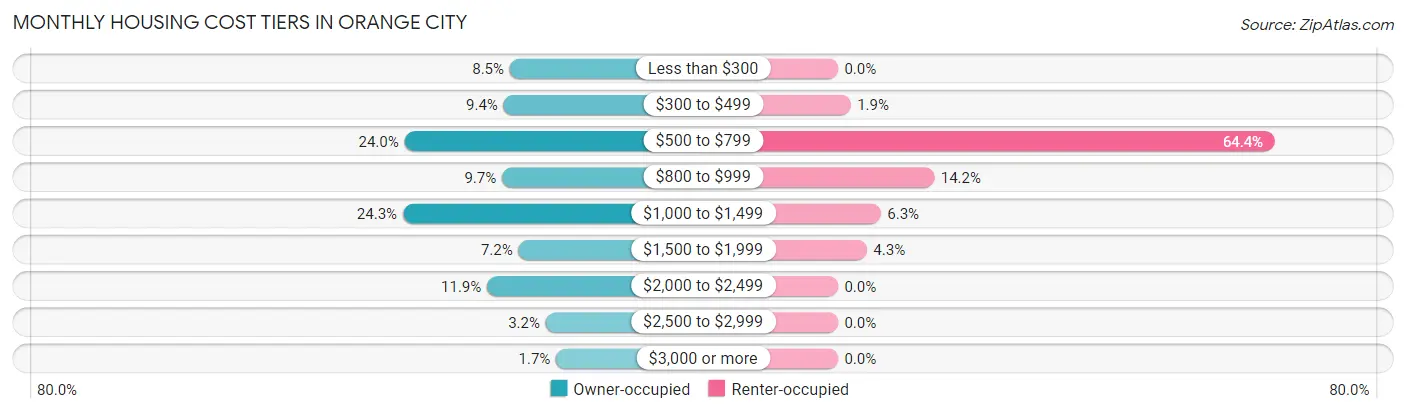
| Monthly Cost | Owner-occupied | Renter-occupied |
| Less than $300 | 140 (8.5%) | 0 (0.0%) |
| $300 to $499 | 155 (9.4%) | 11 (1.9%) |
| $500 to $799 | 395 (24.0%) | 377 (64.4%) |
| $800 to $999 | 159 (9.7%) | 83 (14.2%) |
| $1,000 to $1,499 | 399 (24.3%) | 37 (6.3%) |
| $1,500 to $1,999 | 119 (7.2%) | 25 (4.3%) |
| $2,000 to $2,499 | 195 (11.9%) | 0 (0.0%) |
| $2,500 to $2,999 | 53 (3.2%) | 0 (0.0%) |
| $3,000 or more | 28 (1.7%) | 0 (0.0%) |
| Total | 1,643 (100.0%) | 585 (100.0%) |
Physical Housing Characteristics in Orange City
Housing Structures in Orange City
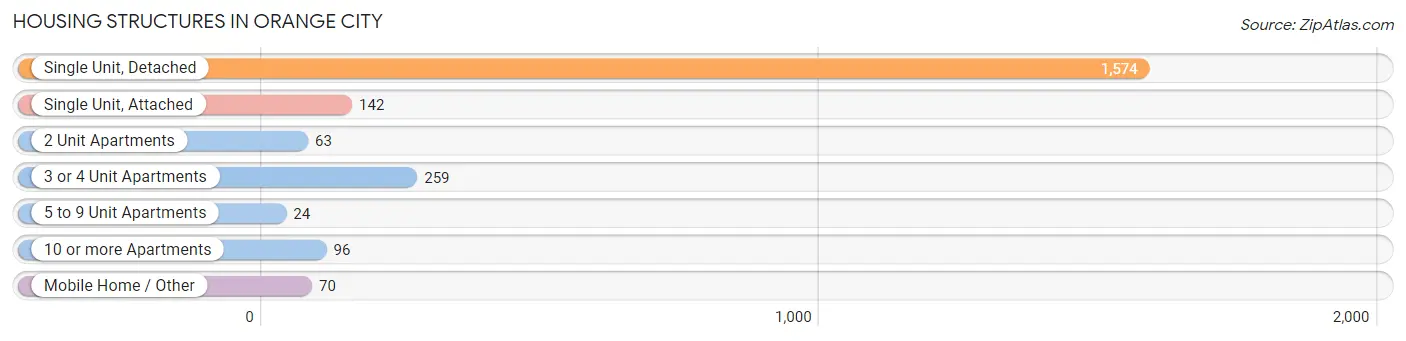
| Structure Type | # Housing Units | % Housing Units |
| Single Unit, Detached | 1,574 | 70.7% |
| Single Unit, Attached | 142 | 6.4% |
| 2 Unit Apartments | 63 | 2.8% |
| 3 or 4 Unit Apartments | 259 | 11.6% |
| 5 to 9 Unit Apartments | 24 | 1.1% |
| 10 or more Apartments | 96 | 4.3% |
| Mobile Home / Other | 70 | 3.1% |
| Total | 2,228 | 100.0% |
Housing Structures by Occupancy in Orange City
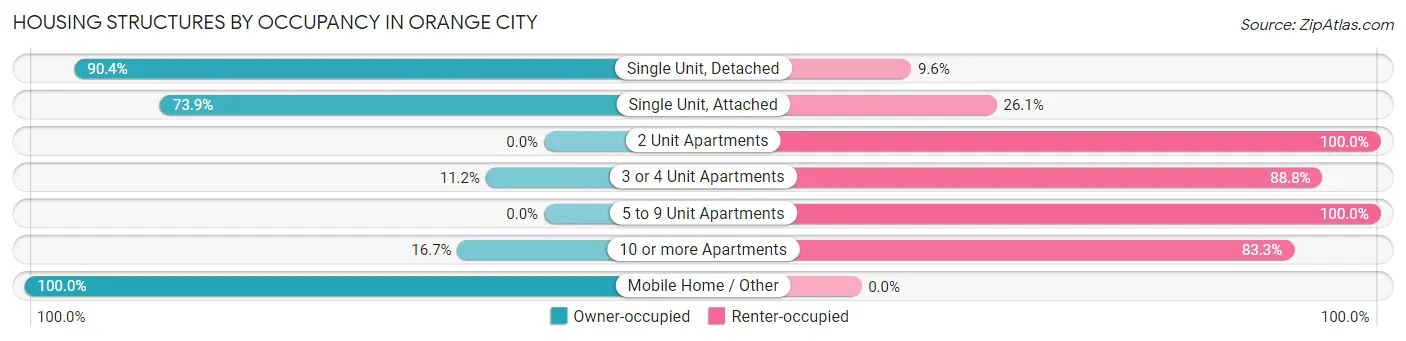
| Structure Type | Owner-occupied | Renter-occupied |
| Single Unit, Detached | 1,423 (90.4%) | 151 (9.6%) |
| Single Unit, Attached | 105 (73.9%) | 37 (26.1%) |
| 2 Unit Apartments | 0 (0.0%) | 63 (100.0%) |
| 3 or 4 Unit Apartments | 29 (11.2%) | 230 (88.8%) |
| 5 to 9 Unit Apartments | 0 (0.0%) | 24 (100.0%) |
| 10 or more Apartments | 16 (16.7%) | 80 (83.3%) |
| Mobile Home / Other | 70 (100.0%) | 0 (0.0%) |
| Total | 1,643 (73.7%) | 585 (26.3%) |
Housing Structures by Number of Rooms in Orange City
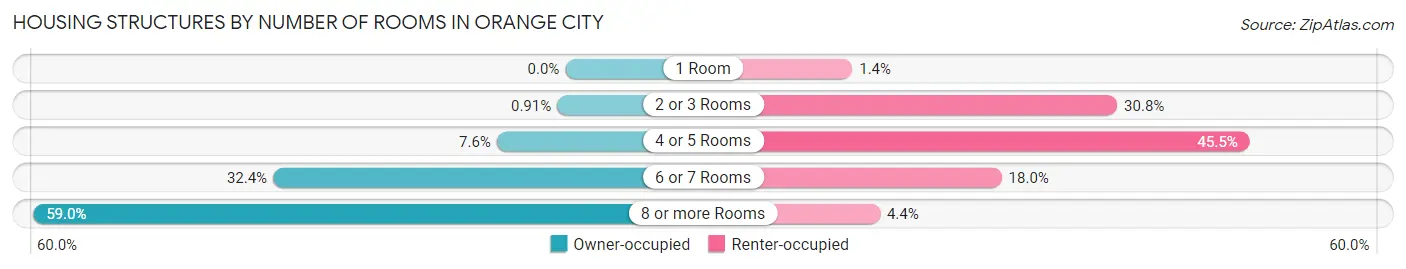
| Number of Rooms | Owner-occupied | Renter-occupied |
| 1 Room | 0 (0.0%) | 8 (1.4%) |
| 2 or 3 Rooms | 15 (0.9%) | 180 (30.8%) |
| 4 or 5 Rooms | 125 (7.6%) | 266 (45.5%) |
| 6 or 7 Rooms | 533 (32.4%) | 105 (17.9%) |
| 8 or more Rooms | 970 (59.0%) | 26 (4.4%) |
| Total | 1,643 (100.0%) | 585 (100.0%) |
Housing Structure by Heating Type in Orange City
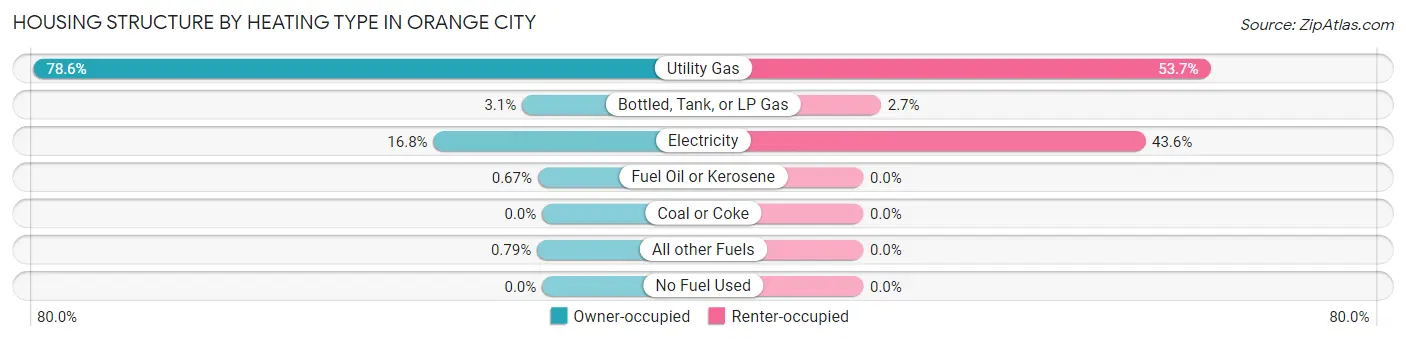
| Heating Type | Owner-occupied | Renter-occupied |
| Utility Gas | 1,292 (78.6%) | 314 (53.7%) |
| Bottled, Tank, or LP Gas | 51 (3.1%) | 16 (2.7%) |
| Electricity | 276 (16.8%) | 255 (43.6%) |
| Fuel Oil or Kerosene | 11 (0.7%) | 0 (0.0%) |
| Coal or Coke | 0 (0.0%) | 0 (0.0%) |
| All other Fuels | 13 (0.8%) | 0 (0.0%) |
| No Fuel Used | 0 (0.0%) | 0 (0.0%) |
| Total | 1,643 (100.0%) | 585 (100.0%) |
Household Vehicle Usage in Orange City
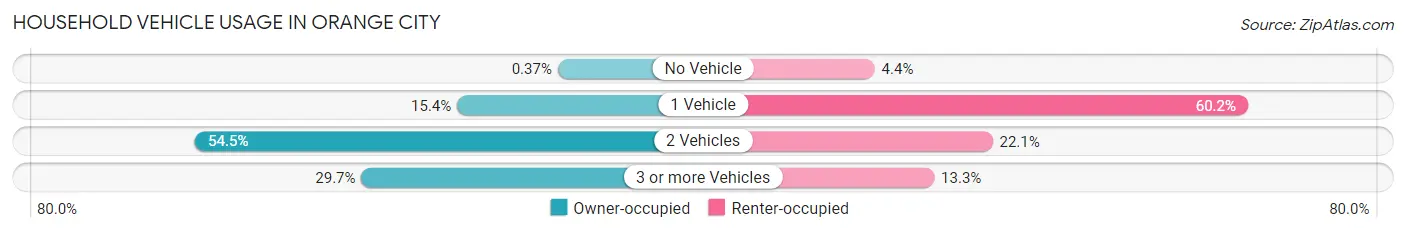
| Vehicles per Household | Owner-occupied | Renter-occupied |
| No Vehicle | 6 (0.4%) | 26 (4.4%) |
| 1 Vehicle | 253 (15.4%) | 352 (60.2%) |
| 2 Vehicles | 896 (54.5%) | 129 (22.1%) |
| 3 or more Vehicles | 488 (29.7%) | 78 (13.3%) |
| Total | 1,643 (100.0%) | 585 (100.0%) |
Real Estate & Mortgages in Orange City
Real Estate and Mortgage Overview in Orange City
| Characteristic | Without Mortgage | With Mortgage |
| Housing Units | 754 | 889 |
| Median Property Value | $229,500 | $225,600 |
| Median Household Income | $77,609 | $277 |
| Monthly Housing Costs | $561 | $28 |
| Real Estate Taxes | $2,762 | $0 |
Property Value by Mortgage Status in Orange City
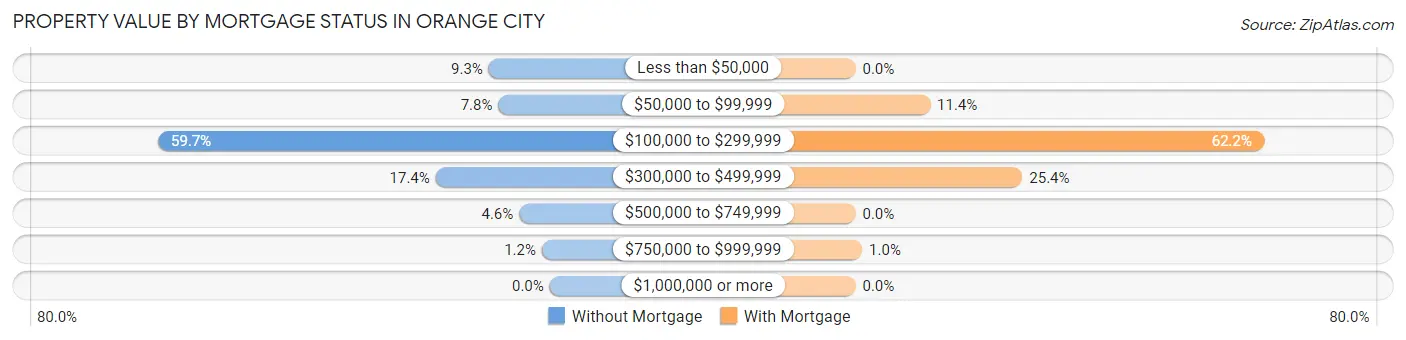
| Property Value | Without Mortgage | With Mortgage |
| Less than $50,000 | 70 (9.3%) | 0 (0.0%) |
| $50,000 to $99,999 | 59 (7.8%) | 101 (11.4%) |
| $100,000 to $299,999 | 450 (59.7%) | 553 (62.2%) |
| $300,000 to $499,999 | 131 (17.4%) | 226 (25.4%) |
| $500,000 to $749,999 | 35 (4.6%) | 0 (0.0%) |
| $750,000 to $999,999 | 9 (1.2%) | 9 (1.0%) |
| $1,000,000 or more | 0 (0.0%) | 0 (0.0%) |
| Total | 754 (100.0%) | 889 (100.0%) |
Household Income by Mortgage Status in Orange City
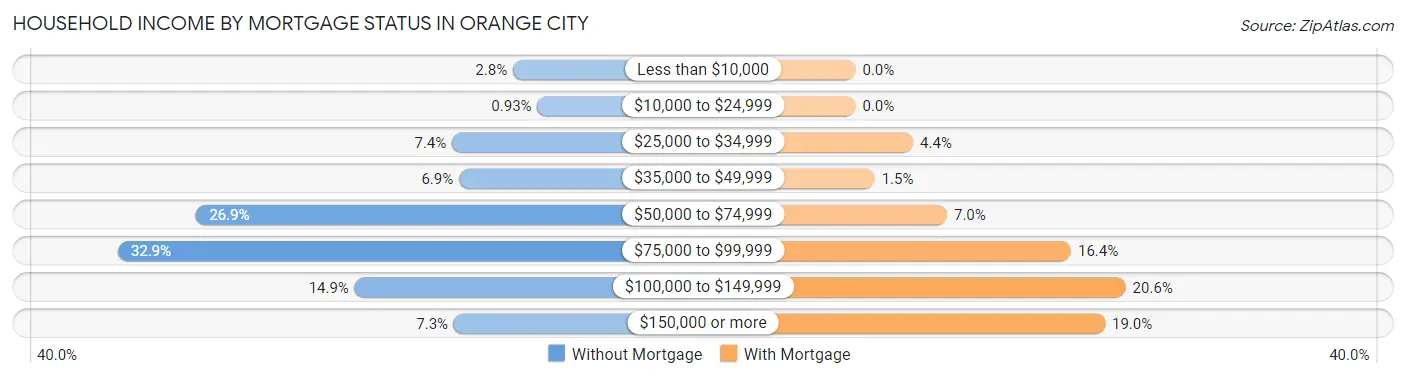
| Household Income | Without Mortgage | With Mortgage |
| Less than $10,000 | 21 (2.8%) | 0 (0.0%) |
| $10,000 to $24,999 | 7 (0.9%) | 0 (0.0%) |
| $25,000 to $34,999 | 56 (7.4%) | 39 (4.4%) |
| $35,000 to $49,999 | 52 (6.9%) | 13 (1.5%) |
| $50,000 to $74,999 | 203 (26.9%) | 62 (7.0%) |
| $75,000 to $99,999 | 248 (32.9%) | 146 (16.4%) |
| $100,000 to $149,999 | 112 (14.8%) | 183 (20.6%) |
| $150,000 or more | 55 (7.3%) | 169 (19.0%) |
| Total | 754 (100.0%) | 889 (100.0%) |
Property Value to Household Income Ratio in Orange City
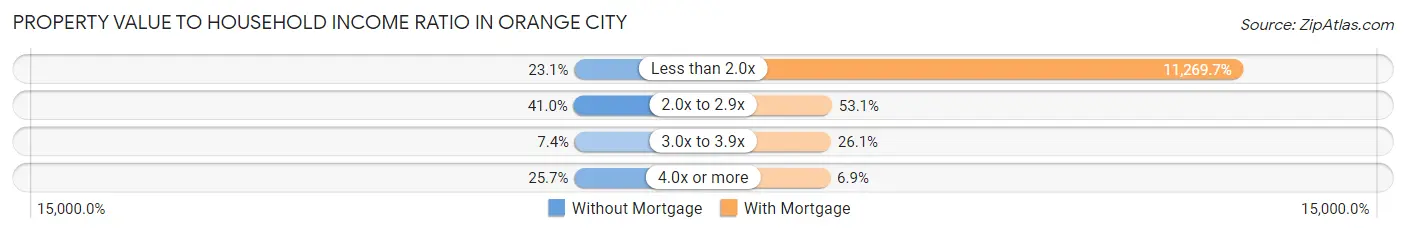
| Value-to-Income Ratio | Without Mortgage | With Mortgage |
| Less than 2.0x | 174 (23.1%) | 100,188 (11,269.7%) |
| 2.0x to 2.9x | 309 (41.0%) | 472 (53.1%) |
| 3.0x to 3.9x | 56 (7.4%) | 232 (26.1%) |
| 4.0x or more | 194 (25.7%) | 61 (6.9%) |
| Total | 754 (100.0%) | 889 (100.0%) |
Real Estate Taxes by Mortgage Status in Orange City
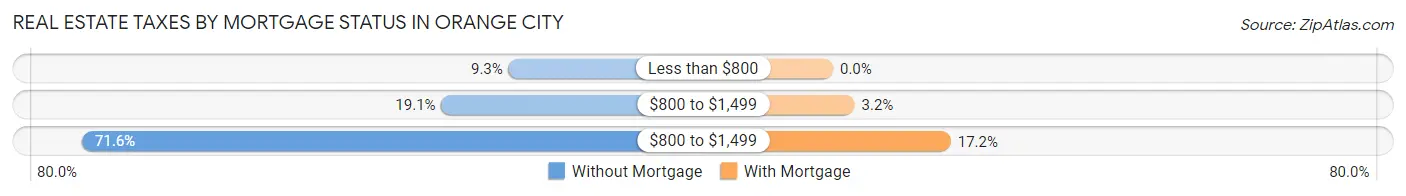
| Property Taxes | Without Mortgage | With Mortgage |
| Less than $800 | 70 (9.3%) | 0 (0.0%) |
| $800 to $1,499 | 144 (19.1%) | 28 (3.2%) |
| $800 to $1,499 | 540 (71.6%) | 153 (17.2%) |
| Total | 754 (100.0%) | 889 (100.0%) |
Health & Disability in Orange City
Health Insurance Coverage by Age in Orange City
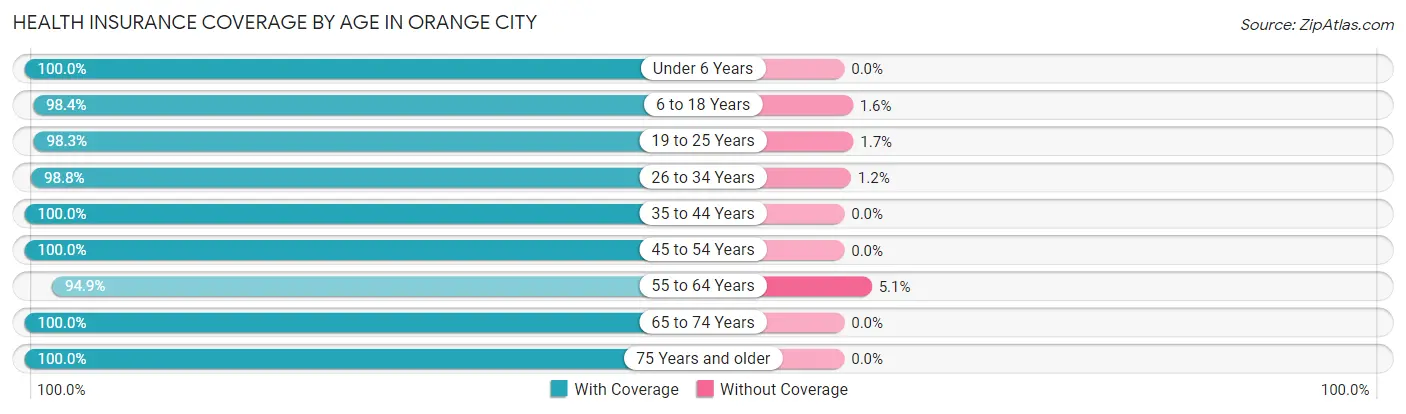
| Age Bracket | With Coverage | Without Coverage |
| Under 6 Years | 442 (100.0%) | 0 (0.0%) |
| 6 to 18 Years | 996 (98.4%) | 16 (1.6%) |
| 19 to 25 Years | 1,162 (98.3%) | 20 (1.7%) |
| 26 to 34 Years | 480 (98.8%) | 6 (1.2%) |
| 35 to 44 Years | 741 (100.0%) | 0 (0.0%) |
| 45 to 54 Years | 599 (100.0%) | 0 (0.0%) |
| 55 to 64 Years | 612 (94.9%) | 33 (5.1%) |
| 65 to 74 Years | 571 (100.0%) | 0 (0.0%) |
| 75 Years and older | 517 (100.0%) | 0 (0.0%) |
| Total | 6,120 (98.8%) | 75 (1.2%) |
Health Insurance Coverage by Citizenship Status in Orange City
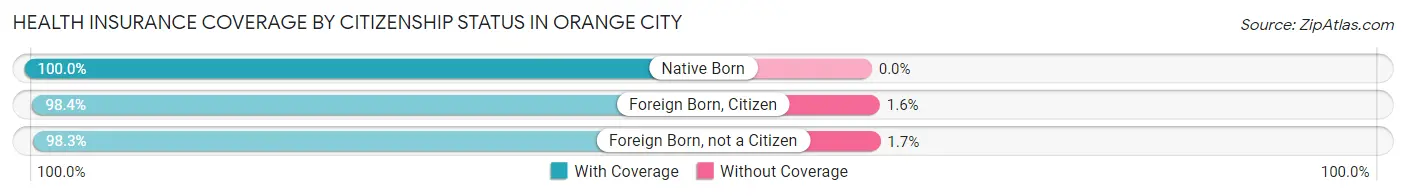
| Citizenship Status | With Coverage | Without Coverage |
| Native Born | 442 (100.0%) | 0 (0.0%) |
| Foreign Born, Citizen | 996 (98.4%) | 16 (1.6%) |
| Foreign Born, not a Citizen | 1,162 (98.3%) | 20 (1.7%) |
Health Insurance Coverage by Household Income in Orange City
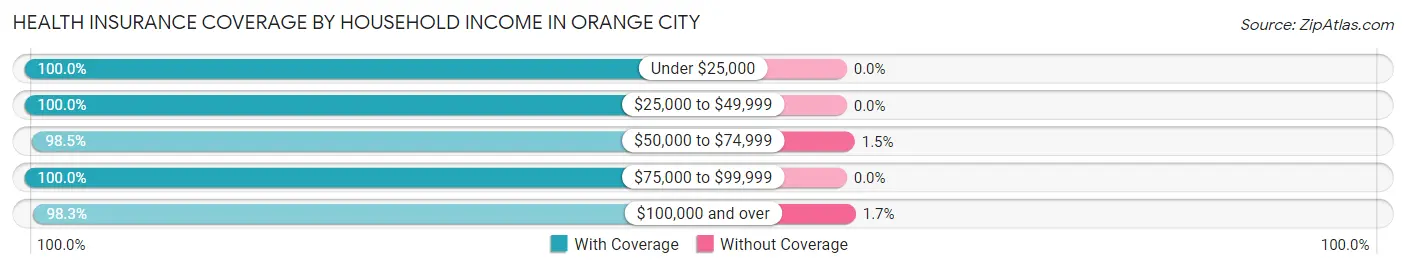
| Household Income | With Coverage | Without Coverage |
| Under $25,000 | 485 (100.0%) | 0 (0.0%) |
| $25,000 to $49,999 | 499 (100.0%) | 0 (0.0%) |
| $50,000 to $74,999 | 1,048 (98.5%) | 16 (1.5%) |
| $75,000 to $99,999 | 1,134 (100.0%) | 0 (0.0%) |
| $100,000 and over | 2,213 (98.3%) | 38 (1.7%) |
Public vs Private Health Insurance Coverage by Age in Orange City
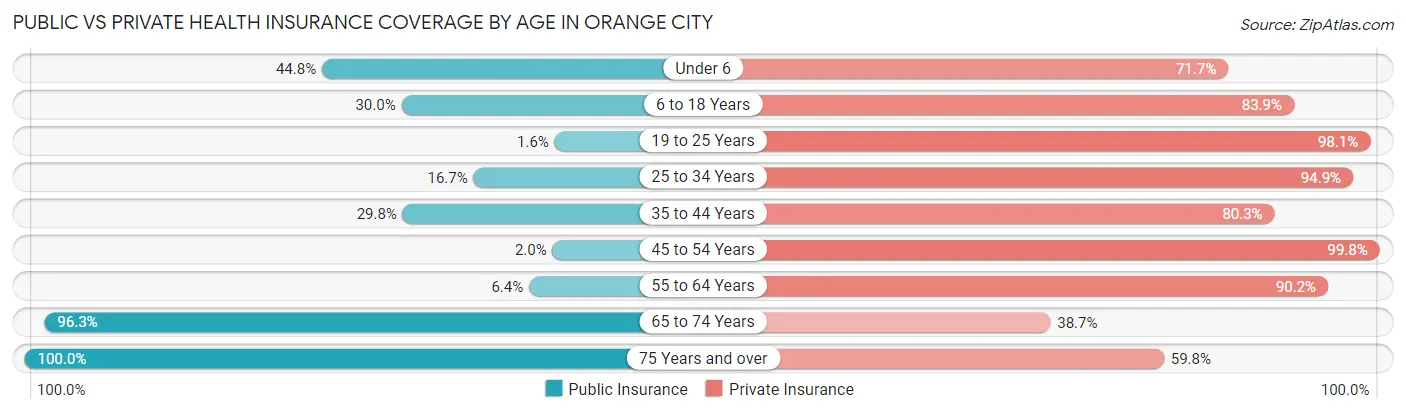
| Age Bracket | Public Insurance | Private Insurance |
| Under 6 | 198 (44.8%) | 317 (71.7%) |
| 6 to 18 Years | 304 (30.0%) | 849 (83.9%) |
| 19 to 25 Years | 19 (1.6%) | 1,159 (98.1%) |
| 25 to 34 Years | 81 (16.7%) | 461 (94.9%) |
| 35 to 44 Years | 221 (29.8%) | 595 (80.3%) |
| 45 to 54 Years | 12 (2.0%) | 598 (99.8%) |
| 55 to 64 Years | 41 (6.4%) | 582 (90.2%) |
| 65 to 74 Years | 550 (96.3%) | 221 (38.7%) |
| 75 Years and over | 517 (100.0%) | 309 (59.8%) |
| Total | 1,943 (31.4%) | 5,091 (82.2%) |
Disability Status by Sex by Age in Orange City
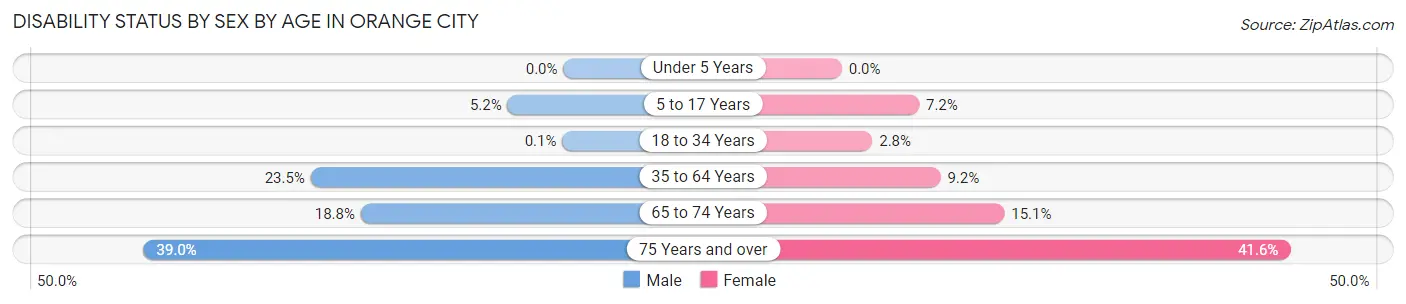
| Age Bracket | Male | Female |
| Under 5 Years | 0 (0.0%) | 0 (0.0%) |
| 5 to 17 Years | 16 (5.2%) | 40 (7.2%) |
| 18 to 34 Years | 1 (0.1%) | 25 (2.8%) |
| 35 to 64 Years | 253 (23.4%) | 83 (9.2%) |
| 65 to 74 Years | 50 (18.8%) | 46 (15.1%) |
| 75 Years and over | 76 (39.0%) | 134 (41.6%) |
Disability Class by Sex by Age in Orange City
Disability Class: Hearing Difficulty
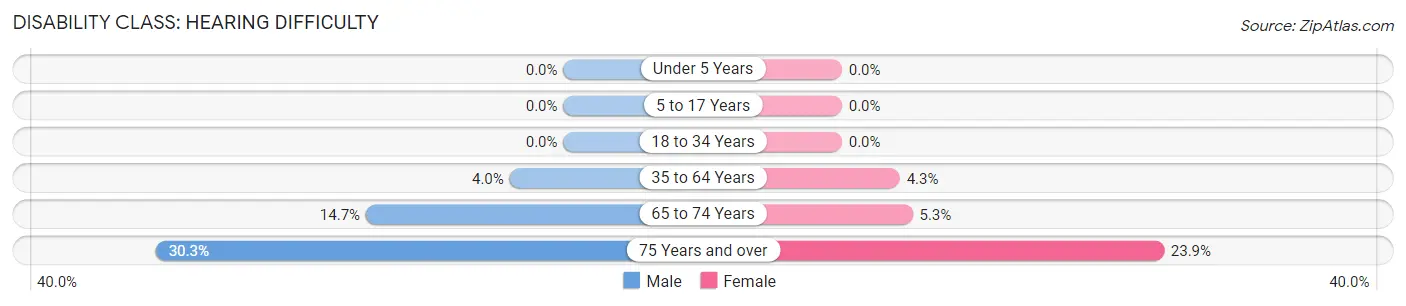
| Age Bracket | Male | Female |
| Under 5 Years | 0 (0.0%) | 0 (0.0%) |
| 5 to 17 Years | 0 (0.0%) | 0 (0.0%) |
| 18 to 34 Years | 0 (0.0%) | 0 (0.0%) |
| 35 to 64 Years | 43 (4.0%) | 39 (4.3%) |
| 65 to 74 Years | 39 (14.7%) | 16 (5.2%) |
| 75 Years and over | 59 (30.3%) | 77 (23.9%) |
Disability Class: Vision Difficulty
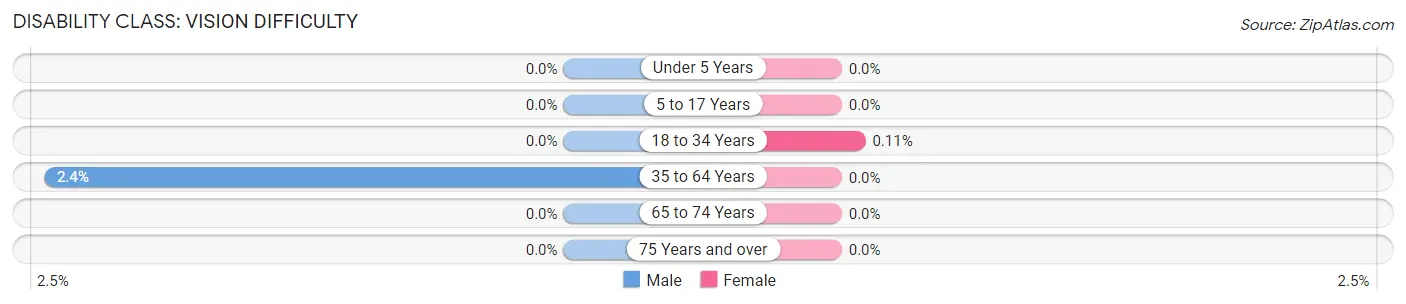
| Age Bracket | Male | Female |
| Under 5 Years | 0 (0.0%) | 0 (0.0%) |
| 5 to 17 Years | 0 (0.0%) | 0 (0.0%) |
| 18 to 34 Years | 0 (0.0%) | 1 (0.1%) |
| 35 to 64 Years | 26 (2.4%) | 0 (0.0%) |
| 65 to 74 Years | 0 (0.0%) | 0 (0.0%) |
| 75 Years and over | 0 (0.0%) | 0 (0.0%) |
Disability Class: Cognitive Difficulty
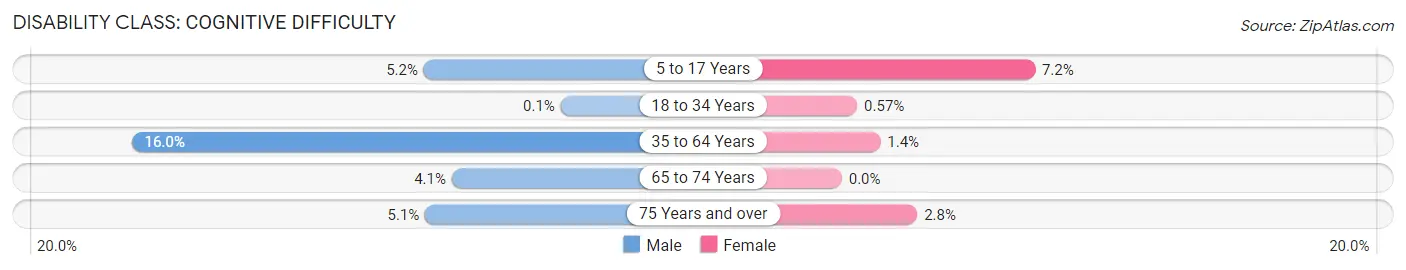
| Age Bracket | Male | Female |
| 5 to 17 Years | 16 (5.2%) | 40 (7.2%) |
| 18 to 34 Years | 1 (0.1%) | 5 (0.6%) |
| 35 to 64 Years | 173 (16.0%) | 13 (1.4%) |
| 65 to 74 Years | 11 (4.1%) | 0 (0.0%) |
| 75 Years and over | 10 (5.1%) | 9 (2.8%) |
Disability Class: Ambulatory Difficulty
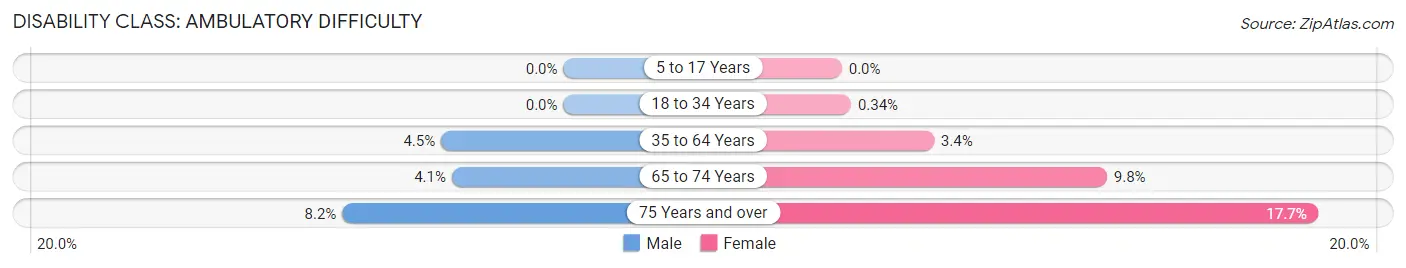
| Age Bracket | Male | Female |
| 5 to 17 Years | 0 (0.0%) | 0 (0.0%) |
| 18 to 34 Years | 0 (0.0%) | 3 (0.3%) |
| 35 to 64 Years | 49 (4.5%) | 31 (3.4%) |
| 65 to 74 Years | 11 (4.1%) | 30 (9.8%) |
| 75 Years and over | 16 (8.2%) | 57 (17.7%) |
Disability Class: Self-Care Difficulty
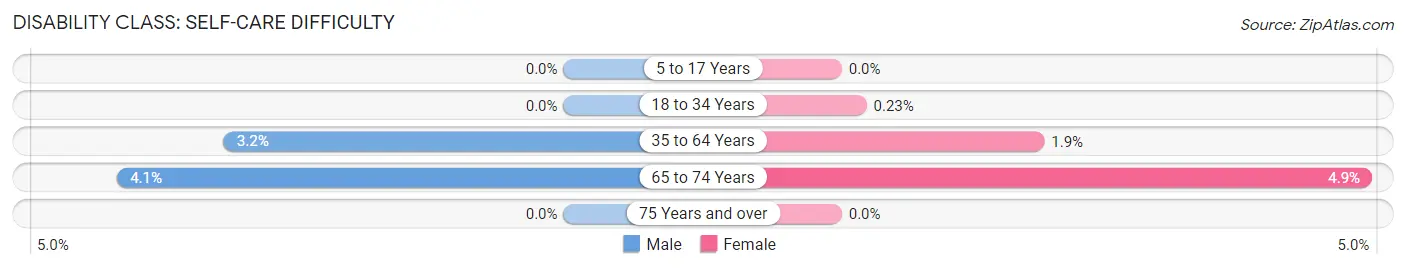
| Age Bracket | Male | Female |
| 5 to 17 Years | 0 (0.0%) | 0 (0.0%) |
| 18 to 34 Years | 0 (0.0%) | 2 (0.2%) |
| 35 to 64 Years | 34 (3.2%) | 17 (1.9%) |
| 65 to 74 Years | 11 (4.1%) | 15 (4.9%) |
| 75 Years and over | 0 (0.0%) | 0 (0.0%) |
Technology Access in Orange City
Computing Device Access in Orange City
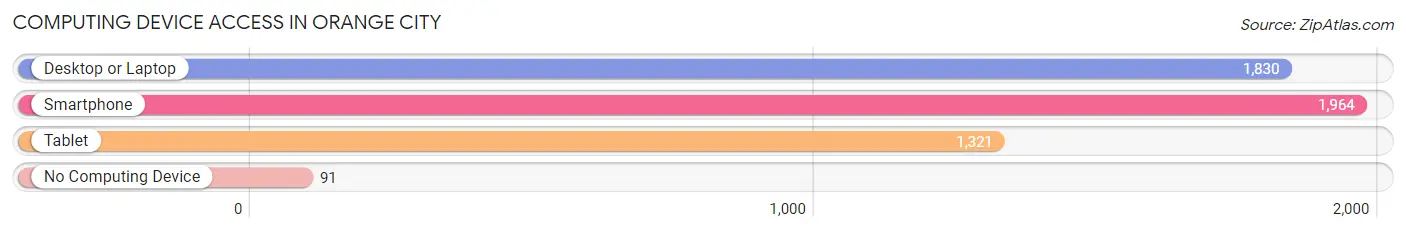
| Device Type | # Households | % Households |
| Desktop or Laptop | 1,830 | 82.1% |
| Smartphone | 1,964 | 88.1% |
| Tablet | 1,321 | 59.3% |
| No Computing Device | 91 | 4.1% |
| Total | 2,228 | 100.0% |
Internet Access in Orange City
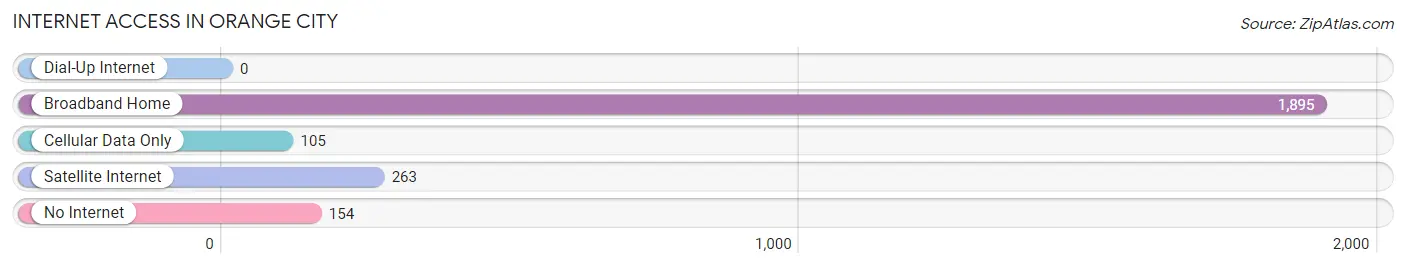
| Internet Type | # Households | % Households |
| Dial-Up Internet | 0 | 0.0% |
| Broadband Home | 1,895 | 85.1% |
| Cellular Data Only | 105 | 4.7% |
| Satellite Internet | 263 | 11.8% |
| No Internet | 154 | 6.9% |
| Total | 2,228 | 100.0% |
Orange City Summary
Orange City is a city located in Sioux County, Iowa, United States. It is the county seat of Sioux County. The population was 6,004 at the 2010 census. It is the home of Northwestern College, a Christian liberal arts college affiliated with the Reformed Church in America.
History
Orange City was founded in 1870 by Dutch settlers who had emigrated from the Netherlands. The city was named after the Dutch city of Oranje, which is the Dutch word for orange. The settlers were attracted to the area by the promise of rich soil and a mild climate.
The first settlers arrived in the area in 1869 and began to build homes and businesses. The first post office was established in 1870 and the first school was built in 1871. The city was officially incorporated in 1872.
In 1873, the first newspaper, the Orange City Times, was established. The first bank was established in 1875 and the first church was built in 1876.
In 1877, the first railroad line was built, connecting Orange City to Sioux City. This allowed for the growth of the city and the development of the local economy.
In 1883, the first telephone line was established in Orange City. This allowed for the growth of communication and commerce in the area.
In 1884, the first hospital was built in Orange City. This allowed for the growth of medical care in the area.
In 1885, the first electric lights were installed in Orange City. This allowed for the growth of industry and commerce in the area.
In 1887, the first public library was established in Orange City. This allowed for the growth of education and knowledge in the area.
In 1889, the first fire department was established in Orange City. This allowed for the growth of safety and security in the area.
In 1895, the first waterworks was established in Orange City. This allowed for the growth of sanitation and hygiene in the area.
Geography
Orange City is located at 42°59′N 96°7′W (42.983, -96.117). According to the United States Census Bureau, the city has a total area of 4.45 square miles (11.52 km2), all of it land.
Orange City is located in the northwest corner of Iowa, near the border with South Dakota and Minnesota. It is situated on the banks of the Floyd River, which flows through the city.
Economy
Orange City's economy is largely based on agriculture and manufacturing. The city is home to several large agricultural companies, including Siouxland Ethanol, Siouxland Energy, and Siouxland Feeds.
The city is also home to several manufacturing companies, including Siouxland Manufacturing, Siouxland Plastics, and Siouxland Steel.
Demographics
As of the census of 2010, there were 6,004 people, 2,093 households, and 1,521 families residing in the city. The population density was 1,346.2 people per square mile (519.7/km2). There were 2,269 housing units at an average density of 510.7 per square mile (197.2/km2). The racial makeup of the city was 94.2% White, 0.7% African American, 0.3% Native American, 0.7% Asian, 2.7% from other races, and 1.4% from two or more races. Hispanic or Latino of any race were 5.2% of the population.
There were 2,093 households, out of which 33.2% had children under the age of 18 living with them, 57.2% were married couples living together, 8.7% had a female householder with no husband present, and 30.7% were non-families. 25.7% of all households were made up of individuals, and 12.2% had someone living alone who was 65 years of age or older. The average household size was 2.60 and the average family size was 3.14.
In the city, the population was spread out, with 25.7% under the age of 18, 14.2% from 18 to 24, 22.7% from 25 to 44, 21.3% from 45 to 64, and 16.1% who were 65 years of age or older. The median age was 35 years. For every 100 females, there were 92.2 males. For every 100 females age 18 and over, there were 88.3 males.
The median income for a household in the city was $41,944, and the median income for a family was $50,938. Males had a median income of $35,938 versus $25,938 for females. The per capita income for the city was $19,945. About 5.2% of families and 8.2% of the population were below the poverty line, including 9.3% of those under age 18 and 8.2% of those age 65 or over.
Common Questions
What is Per Capita Income in Orange City?
Per Capita income in Orange City is $33,074.
What is the Median Family Income in Orange City?
Median Family Income in Orange City is $93,268.
What is the Median Household income in Orange City?
Median Household Income in Orange City is $77,500.
What is Income or Wage Gap in Orange City?
Income or Wage Gap in Orange City is 70.5%.
Women in Orange City earn 29.5 cents for every dollar earned by a man.
What is Inequality or Gini Index in Orange City?
Inequality or Gini Index in Orange City is 0.37.
What is the Total Population of Orange City?
Total Population of Orange City is 6,278.
What is the Total Male Population of Orange City?
Total Male Population of Orange City is 3,077.
What is the Total Female Population of Orange City?
Total Female Population of Orange City is 3,201.
What is the Ratio of Males per 100 Females in Orange City?
There are 96.13 Males per 100 Females in Orange City.
What is the Ratio of Females per 100 Males in Orange City?
There are 104.03 Females per 100 Males in Orange City.
What is the Median Population Age in Orange City?
Median Population Age in Orange City is 33.9 Years.
What is the Average Family Size in Orange City
Average Family Size in Orange City is 3.1 People.
What is the Average Household Size in Orange City
Average Household Size in Orange City is 2.5 People.
How Large is the Labor Force in Orange City?
There are 3,527 People in the Labor Forcein in Orange City.
What is the Percentage of People in the Labor Force in Orange City?
69.2% of People are in the Labor Force in Orange City.
What is the Unemployment Rate in Orange City?
Unemployment Rate in Orange City is 5.4%.