Royse City, TX Map & Demographics
Royse City Map
Royse City Overview
$40,668
PER CAPITA INCOME
$113,375
AVG FAMILY INCOME
$114,917
AVG HOUSEHOLD INCOME
27.1%
WAGE / INCOME GAP [ % ]
72.9¢/ $1
WAGE / INCOME GAP [ $ ]
0.29
INEQUALITY / GINI INDEX
15,051
TOTAL POPULATION
7,070
MALE POPULATION
7,981
FEMALE POPULATION
88.59
MALES / 100 FEMALES
112.89
FEMALES / 100 MALES
33.6
MEDIAN AGE
3.2
AVG FAMILY SIZE
2.9
AVG HOUSEHOLD SIZE
8,540
LABOR FORCE [ PEOPLE ]
75.7%
PERCENT IN LABOR FORCE
1.0%
UNEMPLOYMENT RATE
Royse City Zip Codes
Income in Royse City
Income Overview in Royse City
Per Capita Income in Royse City is $40,668, while median incomes of families and households are $113,375 and $114,917 respectively.
| Characteristic | Number | Measure |
| Per Capita Income | 15,051 | $40,668 |
| Median Family Income | 4,067 | $113,375 |
| Mean Family Income | 4,067 | $121,754 |
| Median Household Income | 5,208 | $114,917 |
| Mean Household Income | 5,208 | $116,316 |
| Income Deficit | 4,067 | $0 |
| Wage / Income Gap (%) | 15,051 | 27.08% |
| Wage / Income Gap ($) | 15,051 | 72.92¢ per $1 |
| Gini / Inequality Index | 15,051 | 0.29 |
Earnings by Sex in Royse City
Average Earnings in Royse City are $57,948, $63,321 for men and $46,176 for women, a difference of 27.1%.
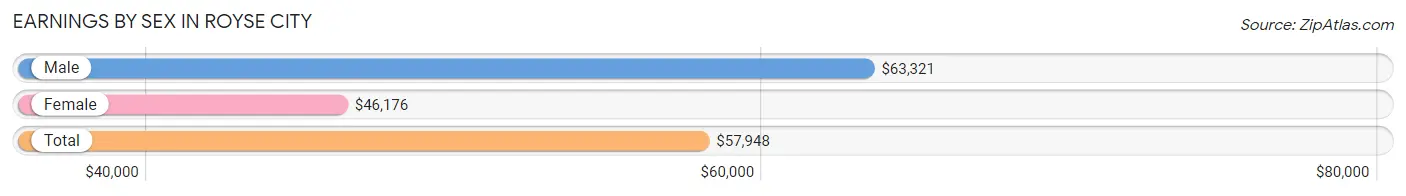
| Sex | Number | Average Earnings |
| Male | 4,417 (49.7%) | $63,321 |
| Female | 4,470 (50.3%) | $46,176 |
| Total | 8,887 (100.0%) | $57,948 |
Earnings by Sex by Income Bracket in Royse City
The most common earnings brackets in Royse City are $75,000 to $99,999 for men (1,015 | 23.0%) and $65,000 to $74,999 for women (544 | 12.2%).
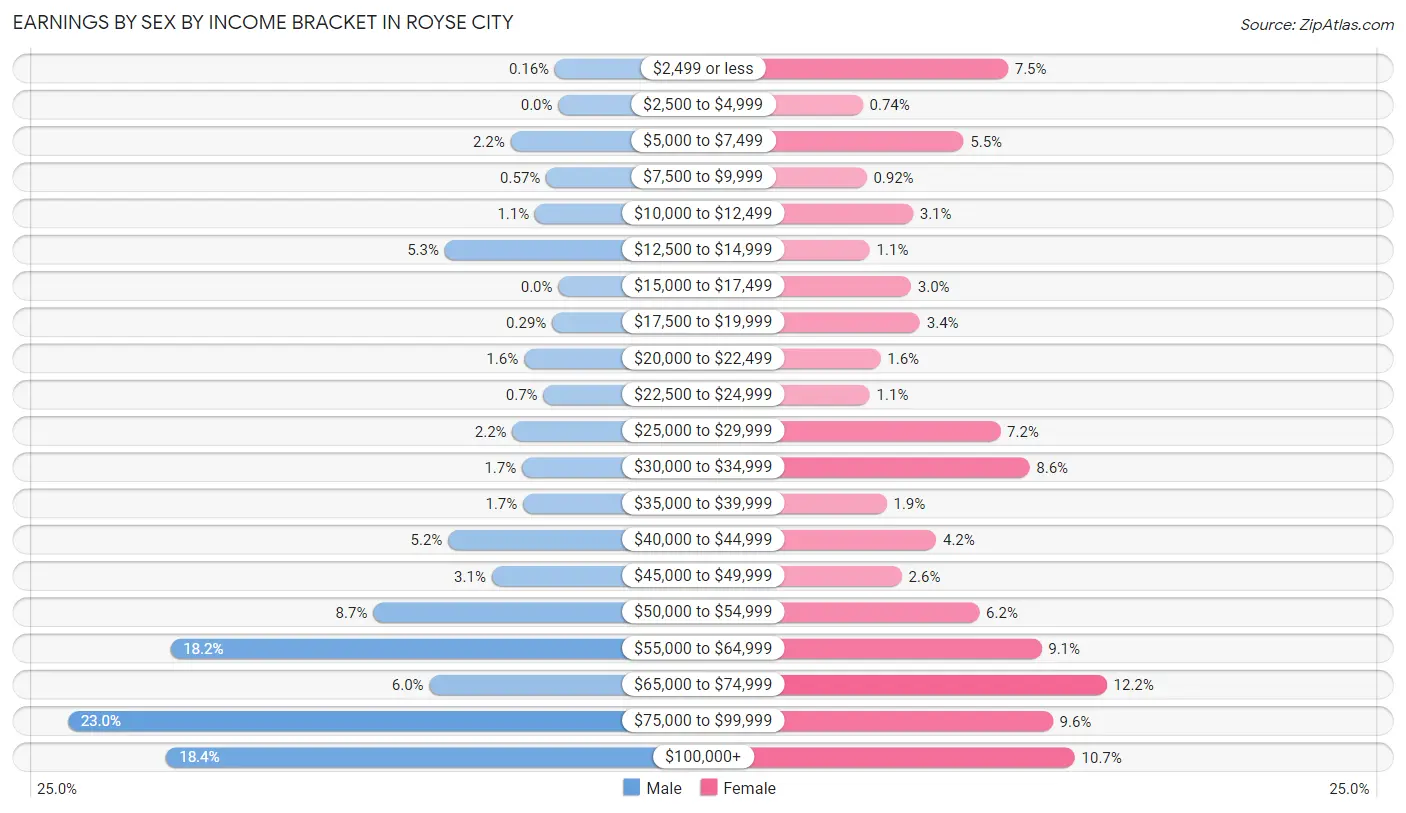
| Income | Male | Female |
| $2,499 or less | 7 (0.2%) | 337 (7.5%) |
| $2,500 to $4,999 | 0 (0.0%) | 33 (0.7%) |
| $5,000 to $7,499 | 99 (2.2%) | 244 (5.5%) |
| $7,500 to $9,999 | 25 (0.6%) | 41 (0.9%) |
| $10,000 to $12,499 | 48 (1.1%) | 138 (3.1%) |
| $12,500 to $14,999 | 235 (5.3%) | 48 (1.1%) |
| $15,000 to $17,499 | 0 (0.0%) | 134 (3.0%) |
| $17,500 to $19,999 | 13 (0.3%) | 153 (3.4%) |
| $20,000 to $22,499 | 71 (1.6%) | 70 (1.6%) |
| $22,500 to $24,999 | 31 (0.7%) | 48 (1.1%) |
| $25,000 to $29,999 | 95 (2.1%) | 321 (7.2%) |
| $30,000 to $34,999 | 75 (1.7%) | 382 (8.6%) |
| $35,000 to $39,999 | 73 (1.7%) | 83 (1.9%) |
| $40,000 to $44,999 | 228 (5.2%) | 187 (4.2%) |
| $45,000 to $49,999 | 138 (3.1%) | 115 (2.6%) |
| $50,000 to $54,999 | 383 (8.7%) | 277 (6.2%) |
| $55,000 to $64,999 | 803 (18.2%) | 407 (9.1%) |
| $65,000 to $74,999 | 267 (6.0%) | 544 (12.2%) |
| $75,000 to $99,999 | 1,015 (23.0%) | 431 (9.6%) |
| $100,000+ | 811 (18.4%) | 477 (10.7%) |
| Total | 4,417 (100.0%) | 4,470 (100.0%) |
Earnings by Sex by Educational Attainment in Royse City
Average earnings in Royse City are $65,125 for men and $57,725 for women, a difference of 11.4%. Men with an educational attainment of graduate degree enjoy the highest average annual earnings of $87,518, while those with high school diploma education earn the least with $56,356. Women with an educational attainment of graduate degree earn the most with the average annual earnings of $78,750, while those with college or associate's degree education have the smallest earnings of $40,965.
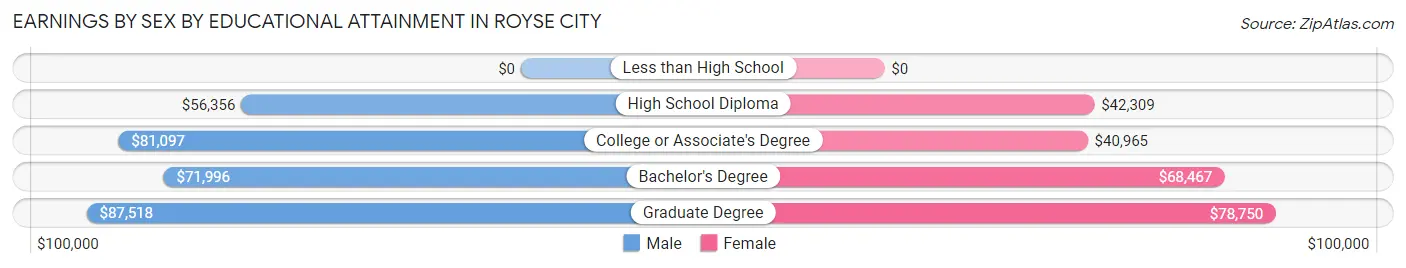
| Educational Attainment | Male Income | Female Income |
| Less than High School | - | - |
| High School Diploma | $56,356 | $42,309 |
| College or Associate's Degree | $81,097 | $40,965 |
| Bachelor's Degree | $71,996 | $68,467 |
| Graduate Degree | $87,518 | $78,750 |
| Total | $65,125 | $57,725 |
Family Income in Royse City
Family Income Brackets in Royse City
According to the Royse City family income data, there are 1,334 families falling into the $100,000 to $149,999 income range, which is the most common income bracket and makes up 32.8% of all families. Conversely, the $15,000 to $24,999 income bracket is the least frequent group with only 12 families (0.3%) belonging to this category.
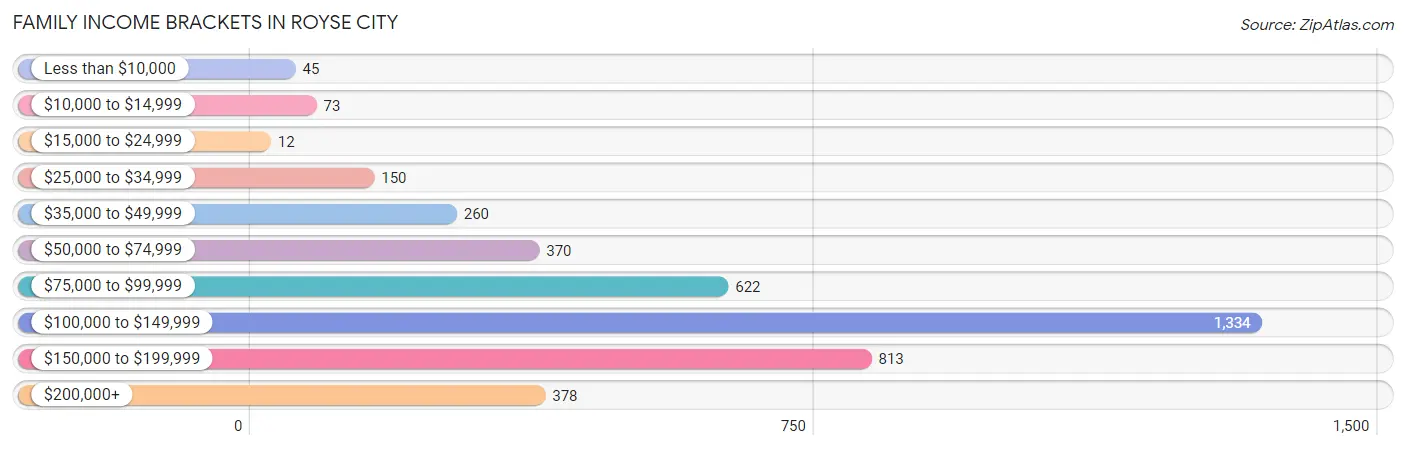
| Income Bracket | # Families | % Families |
| Less than $10,000 | 45 | 1.1% |
| $10,000 to $14,999 | 73 | 1.8% |
| $15,000 to $24,999 | 12 | 0.3% |
| $25,000 to $34,999 | 150 | 3.7% |
| $35,000 to $49,999 | 260 | 6.4% |
| $50,000 to $74,999 | 370 | 9.1% |
| $75,000 to $99,999 | 622 | 15.3% |
| $100,000 to $149,999 | 1,334 | 32.8% |
| $150,000 to $199,999 | 813 | 20.0% |
| $200,000+ | 378 | 9.3% |
Family Income by Famaliy Size in Royse City
5-person families (628 | 15.4%) account for the highest median family income in Royse City with $175,692 per family, while 2-person families (1,765 | 43.4%) have the highest median income of $42,863 per family member.
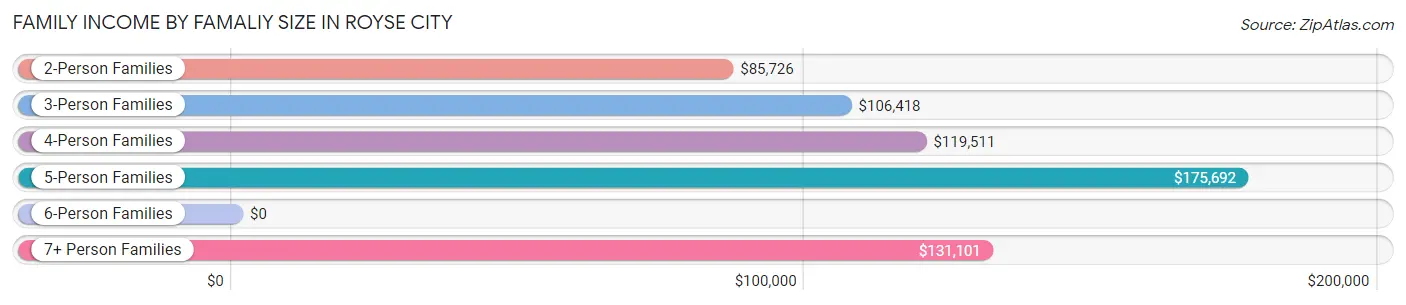
| Income Bracket | # Families | Median Income |
| 2-Person Families | 1,765 (43.4%) | $85,726 |
| 3-Person Families | 668 (16.4%) | $106,418 |
| 4-Person Families | 857 (21.1%) | $119,511 |
| 5-Person Families | 628 (15.4%) | $175,692 |
| 6-Person Families | 46 (1.1%) | $0 |
| 7+ Person Families | 103 (2.5%) | $131,101 |
| Total | 4,067 (100.0%) | $113,375 |
Family Income by Number of Earners in Royse City
The median family income in Royse City is $113,375, with families comprising 2 earners (2,340) having the highest median family income of $132,006, while families with no earners (312) have the lowest median family income of $57,826, accounting for 57.5% and 7.7% of families, respectively.
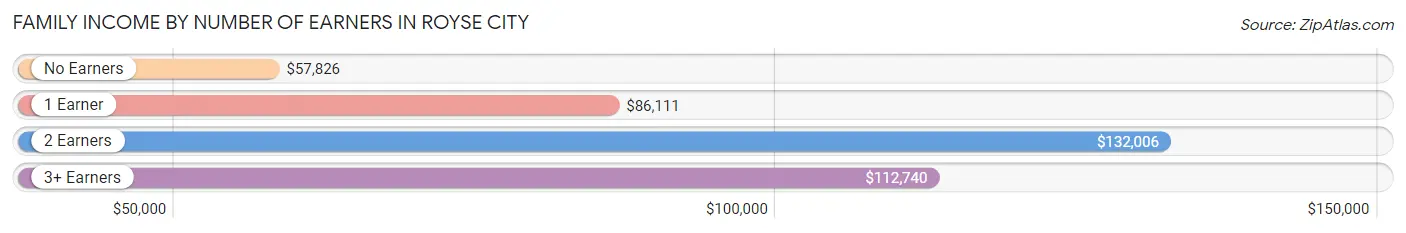
| Number of Earners | # Families | Median Income |
| No Earners | 312 (7.7%) | $57,826 |
| 1 Earner | 932 (22.9%) | $86,111 |
| 2 Earners | 2,340 (57.5%) | $132,006 |
| 3+ Earners | 483 (11.9%) | $112,740 |
| Total | 4,067 (100.0%) | $113,375 |
Household Income in Royse City
Household Income Brackets in Royse City
With 1,833 households falling in the category, the $100,000 to $149,999 income range is the most frequent in Royse City, accounting for 35.2% of all households. In contrast, only 73 households (1.4%) fall into the $10,000 to $14,999 income bracket, making it the least populous group.
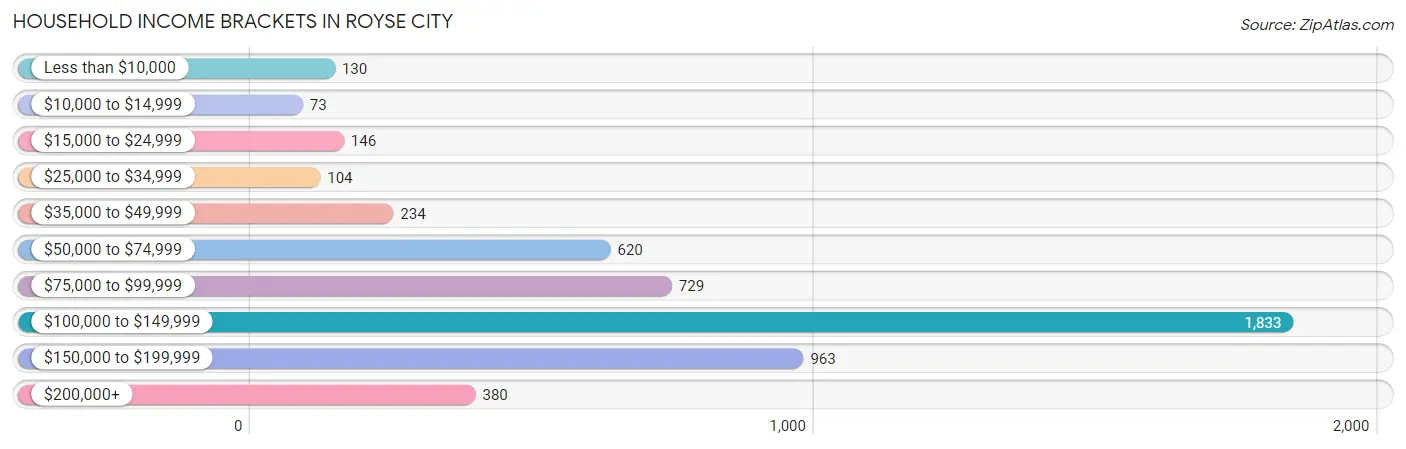
| Income Bracket | # Households | % Households |
| Less than $10,000 | 130 | 2.5% |
| $10,000 to $14,999 | 73 | 1.4% |
| $15,000 to $24,999 | 146 | 2.8% |
| $25,000 to $34,999 | 104 | 2.0% |
| $35,000 to $49,999 | 234 | 4.5% |
| $50,000 to $74,999 | 620 | 11.9% |
| $75,000 to $99,999 | 729 | 14.0% |
| $100,000 to $149,999 | 1,833 | 35.2% |
| $150,000 to $199,999 | 963 | 18.5% |
| $200,000+ | 380 | 7.3% |
Household Income by Householder Age in Royse City
The median household income in Royse City is $114,917, with the highest median household income of $125,804 found in the 45 to 64 years age bracket for the primary householder. A total of 1,873 households (36.0%) fall into this category. Meanwhile, the 15 to 24 years age bracket for the primary householder has the lowest median household income of $0, with 77 households (1.5%) in this group.
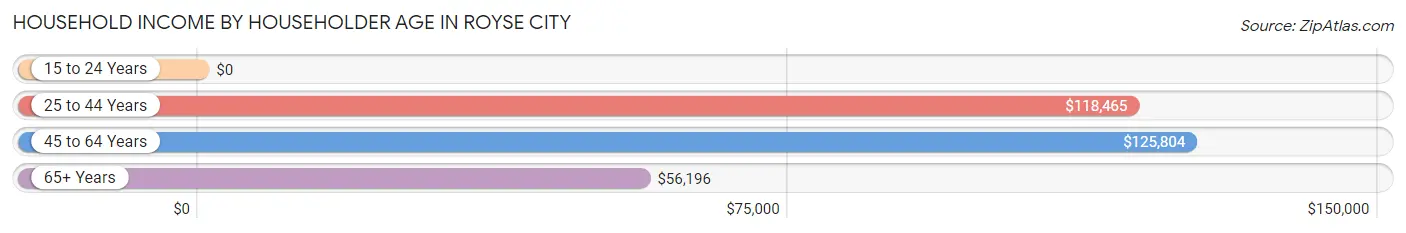
| Income Bracket | # Households | Median Income |
| 15 to 24 Years | 77 (1.5%) | $0 |
| 25 to 44 Years | 2,606 (50.0%) | $118,465 |
| 45 to 64 Years | 1,873 (36.0%) | $125,804 |
| 65+ Years | 652 (12.5%) | $56,196 |
| Total | 5,208 (100.0%) | $114,917 |
Poverty in Royse City
Income Below Poverty by Sex and Age in Royse City
With 3.5% poverty level for males and 6.5% for females among the residents of Royse City, 55 to 64 year old males and under 5 year old females are the most vulnerable to poverty, with 75 males (11.2%) and 159 females (30.3%) in their respective age groups living below the poverty level.
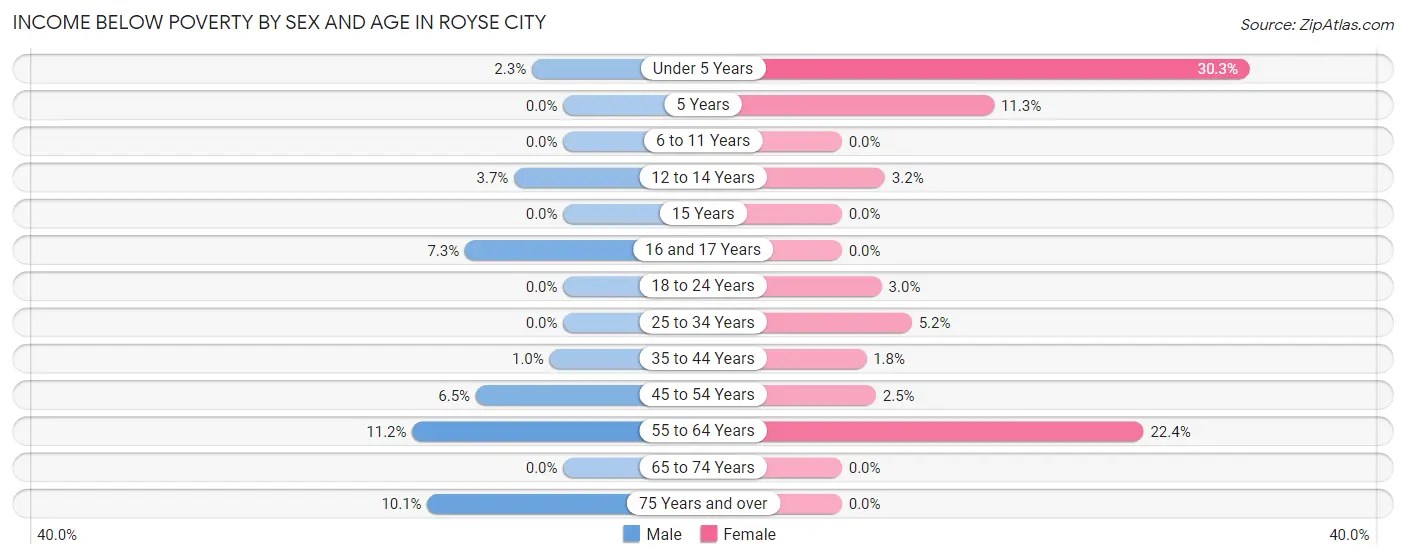
| Age Bracket | Male | Female |
| Under 5 Years | 14 (2.3%) | 159 (30.3%) |
| 5 Years | 0 (0.0%) | 27 (11.3%) |
| 6 to 11 Years | 0 (0.0%) | 0 (0.0%) |
| 12 to 14 Years | 14 (3.6%) | 17 (3.2%) |
| 15 Years | 0 (0.0%) | 0 (0.0%) |
| 16 and 17 Years | 13 (7.3%) | 0 (0.0%) |
| 18 to 24 Years | 0 (0.0%) | 28 (3.0%) |
| 25 to 34 Years | 0 (0.0%) | 73 (5.2%) |
| 35 to 44 Years | 13 (1.0%) | 21 (1.8%) |
| 45 to 54 Years | 93 (6.5%) | 22 (2.5%) |
| 55 to 64 Years | 75 (11.2%) | 172 (22.4%) |
| 65 to 74 Years | 0 (0.0%) | 0 (0.0%) |
| 75 Years and over | 22 (10.1%) | 0 (0.0%) |
| Total | 244 (3.5%) | 519 (6.5%) |
Income Above Poverty by Sex and Age in Royse City
According to the poverty statistics in Royse City, males aged 5 years and females aged 6 to 11 years are the age groups that are most secure financially, with 100.0% of males and 100.0% of females in these age groups living above the poverty line.
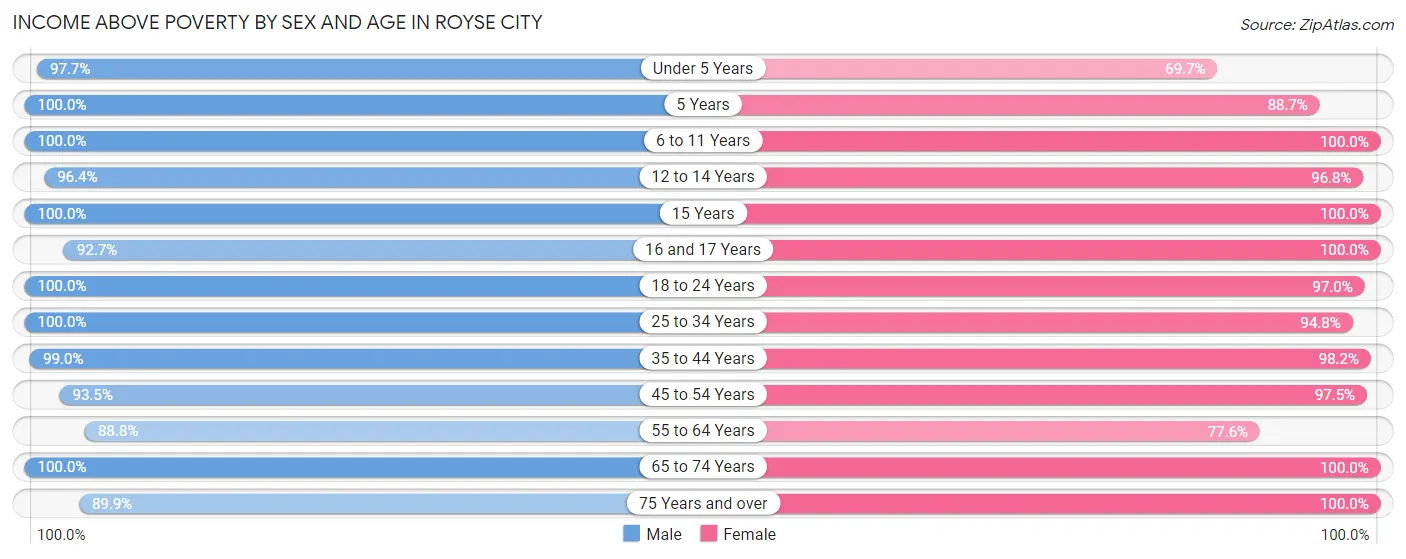
| Age Bracket | Male | Female |
| Under 5 Years | 586 (97.7%) | 366 (69.7%) |
| 5 Years | 63 (100.0%) | 212 (88.7%) |
| 6 to 11 Years | 462 (100.0%) | 717 (100.0%) |
| 12 to 14 Years | 370 (96.4%) | 515 (96.8%) |
| 15 Years | 46 (100.0%) | 201 (100.0%) |
| 16 and 17 Years | 165 (92.7%) | 36 (100.0%) |
| 18 to 24 Years | 379 (100.0%) | 918 (97.0%) |
| 25 to 34 Years | 1,079 (100.0%) | 1,334 (94.8%) |
| 35 to 44 Years | 1,261 (99.0%) | 1,138 (98.2%) |
| 45 to 54 Years | 1,339 (93.5%) | 847 (97.5%) |
| 55 to 64 Years | 594 (88.8%) | 596 (77.6%) |
| 65 to 74 Years | 276 (100.0%) | 396 (100.0%) |
| 75 Years and over | 196 (89.9%) | 175 (100.0%) |
| Total | 6,816 (96.5%) | 7,451 (93.5%) |
Income Below Poverty Among Married-Couple Families in Royse City
The poverty statistics for married-couple families in Royse City show that 1.3% or 43 of the total 3,312 families live below the poverty line. Families with 1 or 2 children have the highest poverty rate of 1.9%, comprising of 21 families. On the other hand, families with 3 or 4 children have the lowest poverty rate of 0.0%, which includes 0 families.
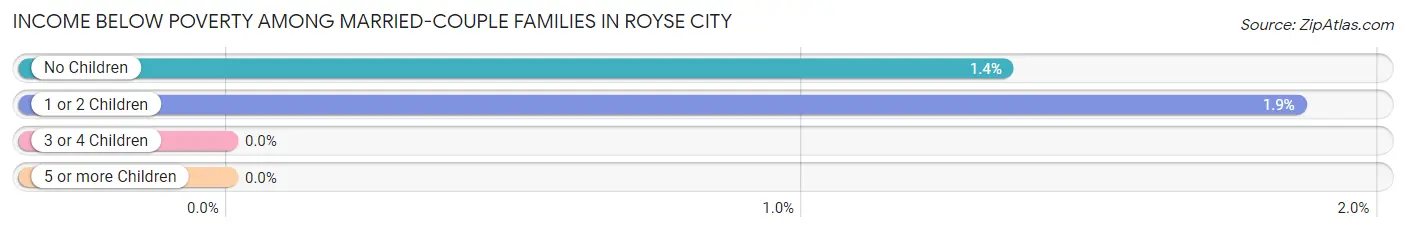
| Children | Above Poverty | Below Poverty |
| No Children | 1,611 (98.7%) | 22 (1.3%) |
| 1 or 2 Children | 1,106 (98.1%) | 21 (1.9%) |
| 3 or 4 Children | 455 (100.0%) | 0 (0.0%) |
| 5 or more Children | 97 (100.0%) | 0 (0.0%) |
| Total | 3,269 (98.7%) | 43 (1.3%) |
Income Below Poverty Among Single-Parent Households in Royse City
According to the poverty data in Royse City, 14.8% or 13 single-father households and 16.6% or 111 single-mother households are living below the poverty line. Among single-father households, those with 3 or 4 children have the highest poverty rate, with 13 households (100.0%) experiencing poverty. Likewise, among single-mother households, those with no children have the highest poverty rate, with 67 households (20.7%) falling below the poverty line.
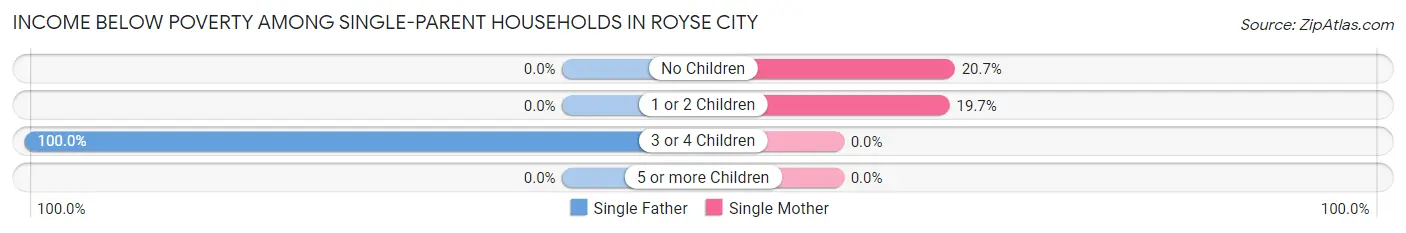
| Children | Single Father | Single Mother |
| No Children | 0 (0.0%) | 67 (20.7%) |
| 1 or 2 Children | 0 (0.0%) | 44 (19.7%) |
| 3 or 4 Children | 13 (100.0%) | 0 (0.0%) |
| 5 or more Children | 0 (0.0%) | 0 (0.0%) |
| Total | 13 (14.8%) | 111 (16.6%) |
Income Below Poverty Among Married-Couple vs Single-Parent Households in Royse City
The poverty data for Royse City shows that 43 of the married-couple family households (1.3%) and 124 of the single-parent households (16.4%) are living below the poverty level. Within the married-couple family households, those with 1 or 2 children have the highest poverty rate, with 21 households (1.9%) falling below the poverty line. Among the single-parent households, those with no children have the highest poverty rate, with 67 household (20.0%) living below poverty.
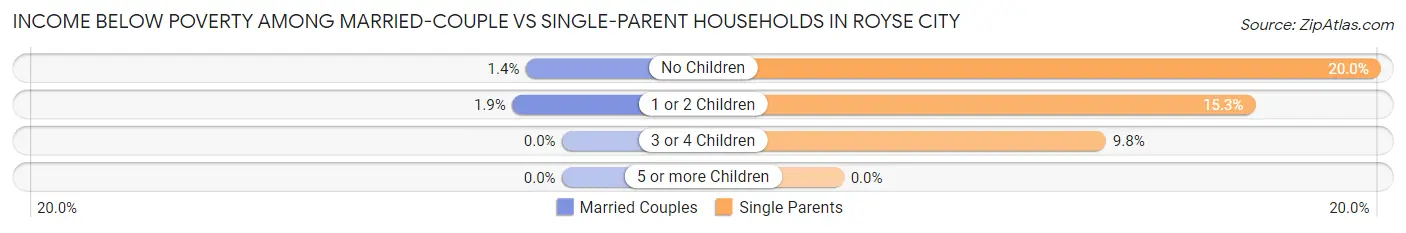
| Children | Married-Couple Families | Single-Parent Households |
| No Children | 22 (1.3%) | 67 (20.0%) |
| 1 or 2 Children | 21 (1.9%) | 44 (15.3%) |
| 3 or 4 Children | 0 (0.0%) | 13 (9.8%) |
| 5 or more Children | 0 (0.0%) | 0 (0.0%) |
| Total | 43 (1.3%) | 124 (16.4%) |
Race in Royse City
The most populous races in Royse City are White / Caucasian (10,713 | 71.2%), Hispanic or Latino (4,026 | 26.8%), and Black / African American (1,654 | 11.0%).
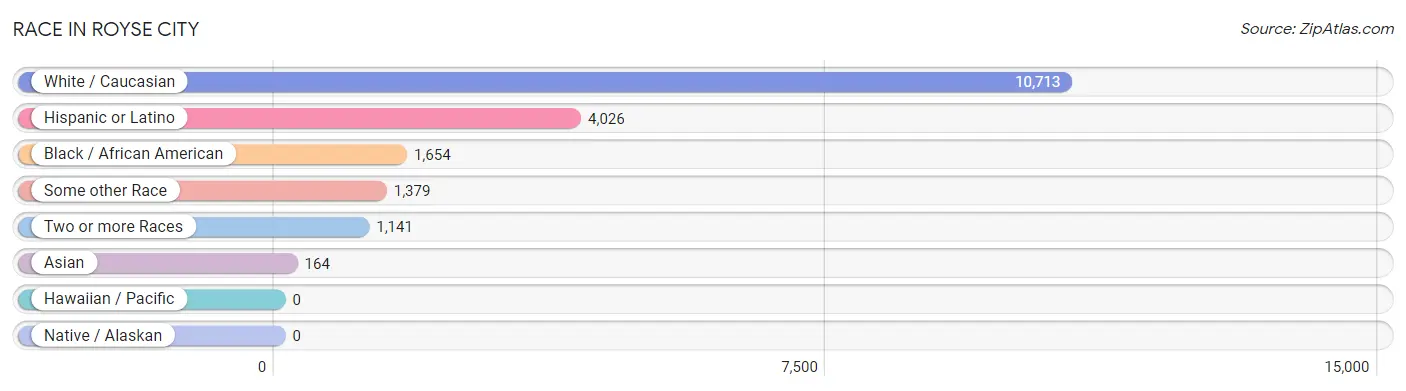
| Race | # Population | % Population |
| Asian | 164 | 1.1% |
| Black / African American | 1,654 | 11.0% |
| Hawaiian / Pacific | 0 | 0.0% |
| Hispanic or Latino | 4,026 | 26.8% |
| Native / Alaskan | 0 | 0.0% |
| White / Caucasian | 10,713 | 71.2% |
| Two or more Races | 1,141 | 7.6% |
| Some other Race | 1,379 | 9.2% |
| Total | 15,051 | 100.0% |
Ancestry in Royse City
The most populous ancestries reported in Royse City are Mexican (3,217 | 21.4%), Irish (1,438 | 9.6%), English (1,379 | 9.2%), German (1,129 | 7.5%), and American (667 | 4.4%), together accounting for 52.0% of all Royse City residents.
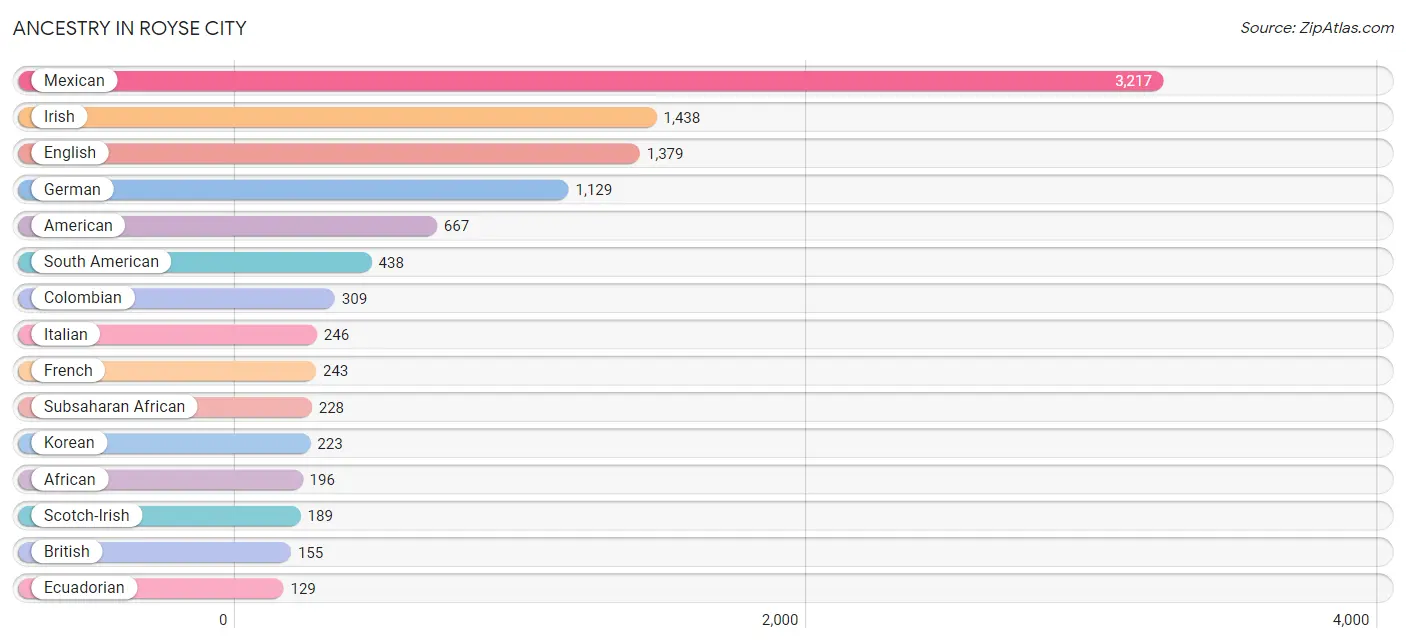
| Ancestry | # Population | % Population |
| African | 196 | 1.3% |
| American | 667 | 4.4% |
| Austrian | 51 | 0.3% |
| Bhutanese | 33 | 0.2% |
| British | 155 | 1.0% |
| Central American | 55 | 0.4% |
| Colombian | 309 | 2.1% |
| Croatian | 11 | 0.1% |
| Czech | 11 | 0.1% |
| Danish | 11 | 0.1% |
| Dutch | 28 | 0.2% |
| Dutch West Indian | 41 | 0.3% |
| Ecuadorian | 129 | 0.9% |
| English | 1,379 | 9.2% |
| European | 87 | 0.6% |
| French | 243 | 1.6% |
| German | 1,129 | 7.5% |
| Greek | 12 | 0.1% |
| Guatemalan | 55 | 0.4% |
| Hungarian | 98 | 0.6% |
| Indian (Asian) | 3 | 0.0% |
| Irish | 1,438 | 9.6% |
| Italian | 246 | 1.6% |
| Korean | 223 | 1.5% |
| Maltese | 39 | 0.3% |
| Mexican | 3,217 | 21.4% |
| Norwegian | 17 | 0.1% |
| Pakistani | 108 | 0.7% |
| Polish | 120 | 0.8% |
| Portuguese | 21 | 0.1% |
| Puerto Rican | 76 | 0.5% |
| Russian | 56 | 0.4% |
| Scotch-Irish | 189 | 1.3% |
| Scottish | 88 | 0.6% |
| Sierra Leonean | 32 | 0.2% |
| Slovene | 11 | 0.1% |
| South American | 438 | 2.9% |
| Spaniard | 64 | 0.4% |
| Spanish | 9 | 0.1% |
| Sri Lankan | 85 | 0.6% |
| Subsaharan African | 228 | 1.5% |
| Thai | 51 | 0.3% |
| Welsh | 60 | 0.4% | View All 43 Rows |
Immigrants in Royse City
The most numerous immigrant groups reported in Royse City came from Latin America (933 | 6.2%), Central America (652 | 4.3%), Mexico (652 | 4.3%), South America (281 | 1.9%), and Colombia (202 | 1.3%), together accounting for 18.1% of all Royse City residents.
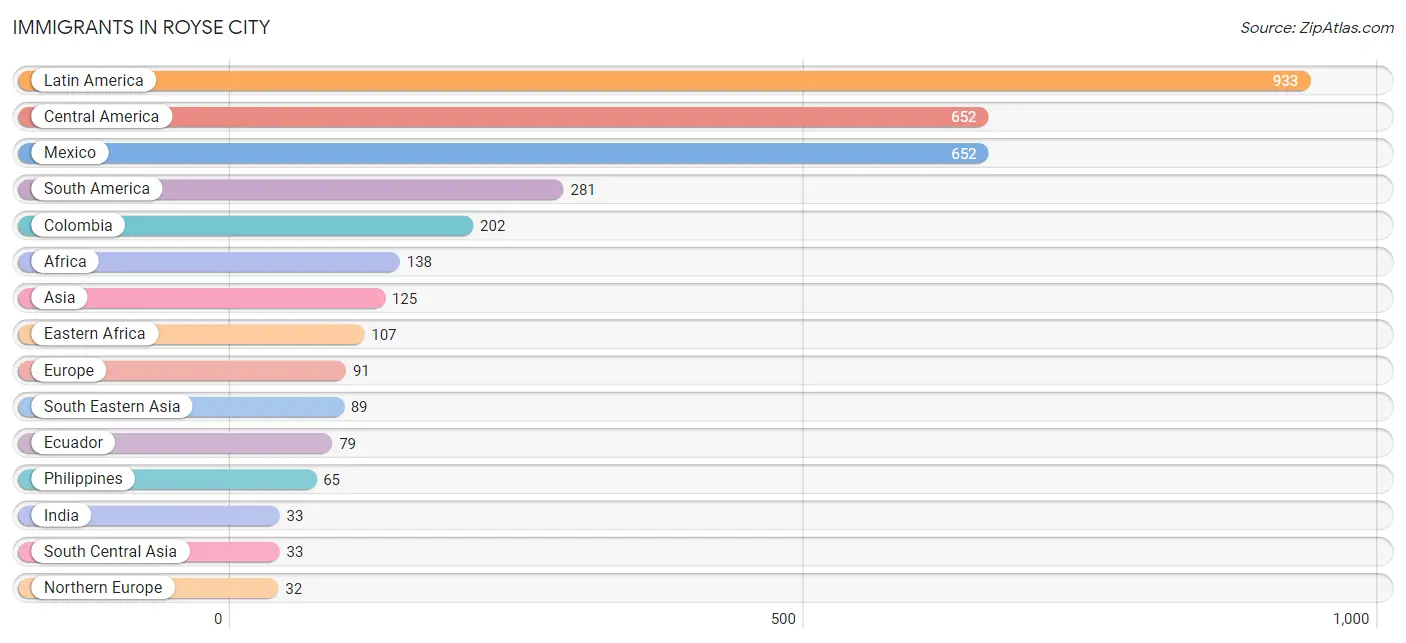
| Immigration Origin | # Population | % Population |
| Africa | 138 | 0.9% |
| Asia | 125 | 0.8% |
| Central America | 652 | 4.3% |
| China | 3 | 0.0% |
| Colombia | 202 | 1.3% |
| Eastern Africa | 107 | 0.7% |
| Eastern Asia | 3 | 0.0% |
| Eastern Europe | 31 | 0.2% |
| Ecuador | 79 | 0.5% |
| Europe | 91 | 0.6% |
| India | 33 | 0.2% |
| Latin America | 933 | 6.2% |
| Mexico | 652 | 4.3% |
| Northern Africa | 31 | 0.2% |
| Northern Europe | 32 | 0.2% |
| Philippines | 65 | 0.4% |
| South America | 281 | 1.9% |
| South Central Asia | 33 | 0.2% |
| South Eastern Asia | 89 | 0.6% |
| Southern Europe | 28 | 0.2% |
| Spain | 28 | 0.2% |
| Sudan | 31 | 0.2% |
| Thailand | 24 | 0.2% | View All 23 Rows |
Sex and Age in Royse City
Sex and Age in Royse City
The most populous age groups in Royse City are 50 to 54 Years (850 | 12.0%) for men and 25 to 29 Years (956 | 12.0%) for women.
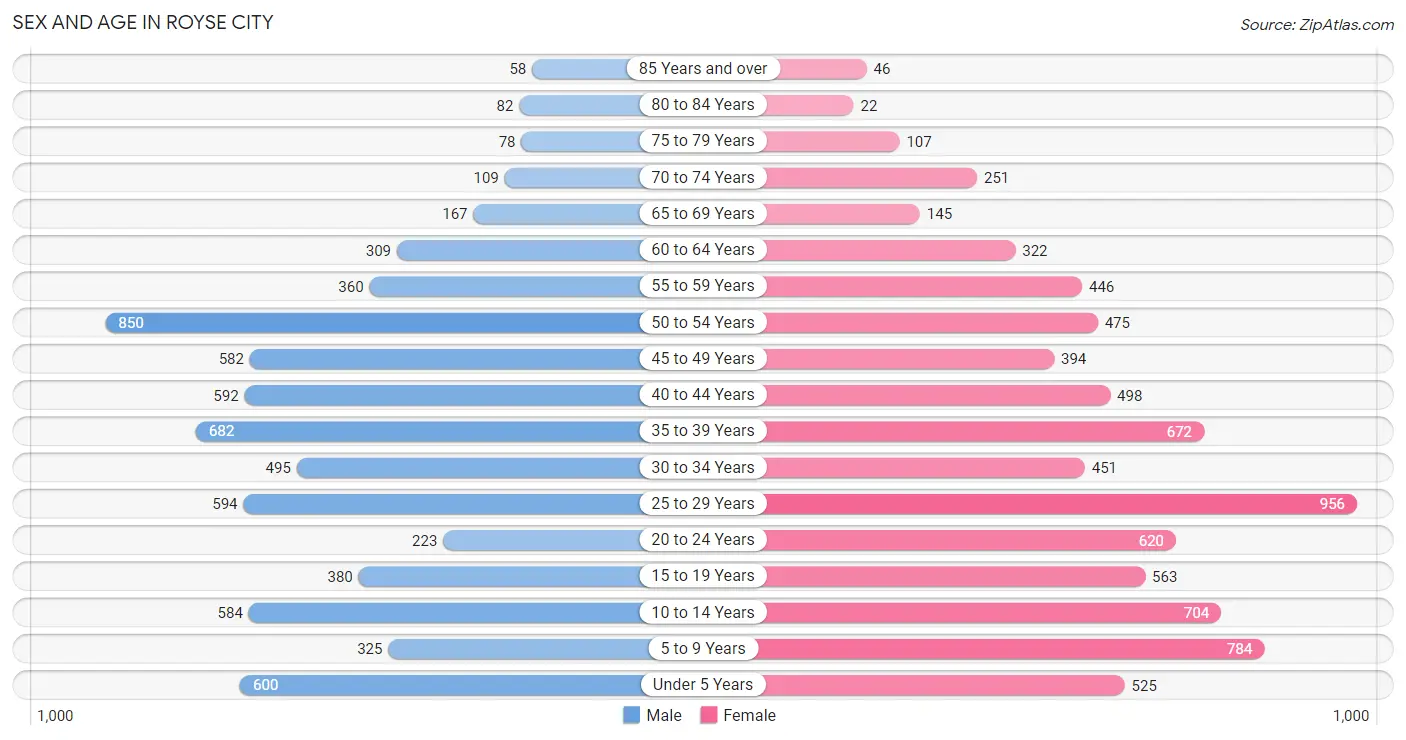
| Age Bracket | Male | Female |
| Under 5 Years | 600 (8.5%) | 525 (6.6%) |
| 5 to 9 Years | 325 (4.6%) | 784 (9.8%) |
| 10 to 14 Years | 584 (8.3%) | 704 (8.8%) |
| 15 to 19 Years | 380 (5.4%) | 563 (7.0%) |
| 20 to 24 Years | 223 (3.2%) | 620 (7.8%) |
| 25 to 29 Years | 594 (8.4%) | 956 (12.0%) |
| 30 to 34 Years | 495 (7.0%) | 451 (5.7%) |
| 35 to 39 Years | 682 (9.7%) | 672 (8.4%) |
| 40 to 44 Years | 592 (8.4%) | 498 (6.2%) |
| 45 to 49 Years | 582 (8.2%) | 394 (4.9%) |
| 50 to 54 Years | 850 (12.0%) | 475 (5.9%) |
| 55 to 59 Years | 360 (5.1%) | 446 (5.6%) |
| 60 to 64 Years | 309 (4.4%) | 322 (4.0%) |
| 65 to 69 Years | 167 (2.4%) | 145 (1.8%) |
| 70 to 74 Years | 109 (1.5%) | 251 (3.1%) |
| 75 to 79 Years | 78 (1.1%) | 107 (1.3%) |
| 80 to 84 Years | 82 (1.2%) | 22 (0.3%) |
| 85 Years and over | 58 (0.8%) | 46 (0.6%) |
| Total | 7,070 (100.0%) | 7,981 (100.0%) |
Families and Households in Royse City
Median Family Size in Royse City
The median family size in Royse City is 3.23 persons per family, with married-couple families (3,312 | 81.4%) accounting for the largest median family size of 3.25 persons per family. On the other hand, single male/father families (88 | 2.2%) represent the smallest median family size with 2.56 persons per family.
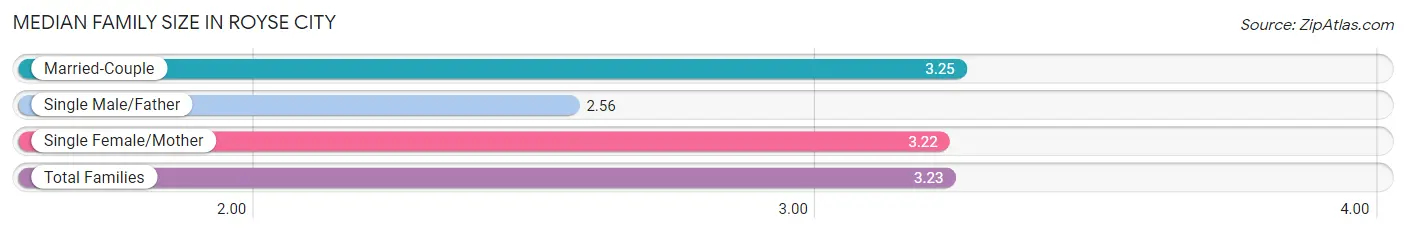
| Family Type | # Families | Family Size |
| Married-Couple | 3,312 (81.4%) | 3.25 |
| Single Male/Father | 88 (2.2%) | 2.56 |
| Single Female/Mother | 667 (16.4%) | 3.22 |
| Total Families | 4,067 (100.0%) | 3.23 |
Median Household Size in Royse City
The median household size in Royse City is 2.89 persons per household, with single female/mother households (667 | 12.8%) accounting for the largest median household size of 3.52 persons per household. non-family households (1,141 | 21.9%) represent the smallest median household size with 1.41 persons per household.
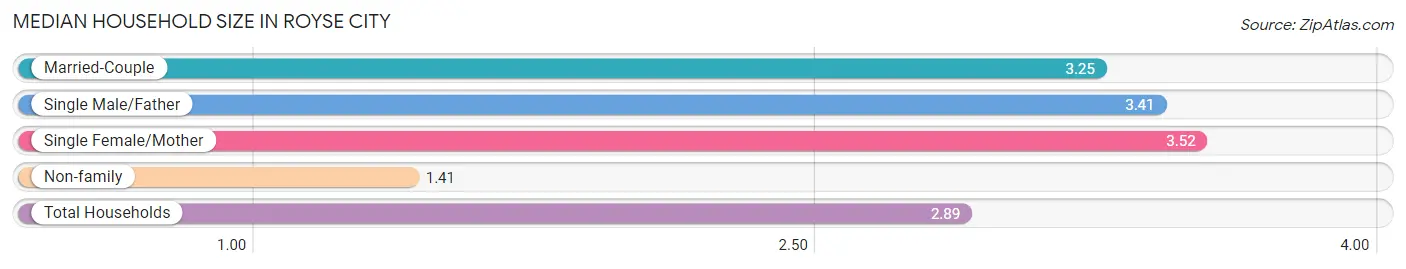
| Household Type | # Households | Household Size |
| Married-Couple | 3,312 (63.6%) | 3.25 |
| Single Male/Father | 88 (1.7%) | 3.41 |
| Single Female/Mother | 667 (12.8%) | 3.52 |
| Non-family | 1,141 (21.9%) | 1.41 |
| Total Households | 5,208 (100.0%) | 2.89 |
Household Size by Marriage Status in Royse City
Out of a total of 5,208 households in Royse City, 4,067 (78.1%) are family households, while 1,141 (21.9%) are nonfamily households. The most numerous type of family households are 2-person households, comprising 1,647, and the most common type of nonfamily households are 1-person households, comprising 673.
| Household Size | Family Households | Nonfamily Households |
| 1-Person Households | - | 673 (12.9%) |
| 2-Person Households | 1,647 (31.6%) | 468 (9.0%) |
| 3-Person Households | 749 (14.4%) | 0 (0.0%) |
| 4-Person Households | 837 (16.1%) | 0 (0.0%) |
| 5-Person Households | 685 (13.2%) | 0 (0.0%) |
| 6-Person Households | 46 (0.9%) | 0 (0.0%) |
| 7+ Person Households | 103 (2.0%) | 0 (0.0%) |
| Total | 4,067 (78.1%) | 1,141 (21.9%) |
Female Fertility in Royse City
Fertility by Age in Royse City
Average fertility rate in Royse City is 83.0 births per 1,000 women. Women in the age bracket of 20 to 34 years have the highest fertility rate with 115.0 births per 1,000 women. Women in the age bracket of 20 to 34 years acount for 64.7% of all women with births.
| Age Bracket | Women with Births | Births / 1,000 Women |
| 15 to 19 years | 8 (2.2%) | 14.0 |
| 20 to 34 years | 233 (64.7%) | 115.0 |
| 35 to 50 years | 119 (33.1%) | 67.0 |
| Total | 360 (100.0%) | 83.0 |
Fertility by Age by Marriage Status in Royse City
97.8% of women with births (360) in Royse City are married. The highest percentage of unmarried women with births falls into 15 to 19 years age bracket with 100.0% of them unmarried at the time of birth, while the lowest percentage of unmarried women with births belong to 20 to 34 years age bracket with 0.0% of them unmarried.
| Age Bracket | Married | Unmarried |
| 15 to 19 years | 0 (0.0%) | 8 (100.0%) |
| 20 to 34 years | 233 (100.0%) | 0 (0.0%) |
| 35 to 50 years | 119 (100.0%) | 0 (0.0%) |
| Total | 352 (97.8%) | 8 (2.2%) |
Fertility by Education in Royse City
| Educational Attainment | Women with Births | Births / 1,000 Women |
| Less than High School | 107 (29.7%) | 150.0 |
| High School Diploma | 8 (2.2%) | 9.0 |
| College or Associate's Degree | 0 (0.0%) | 0.0 |
| Bachelor's Degree | 143 (39.7%) | 146.0 |
| Graduate Degree | 102 (28.3%) | 274.0 |
| Total | 360 (100.0%) | 83.0 |
Fertility by Education by Marriage Status in Royse City
2.2% of women with births in Royse City are unmarried. Women with the educational attainment of less than high school are most likely to be married with 100.0% of them married at childbirth, while women with the educational attainment of high school diploma are least likely to be married with 100.0% of them unmarried at childbirth.
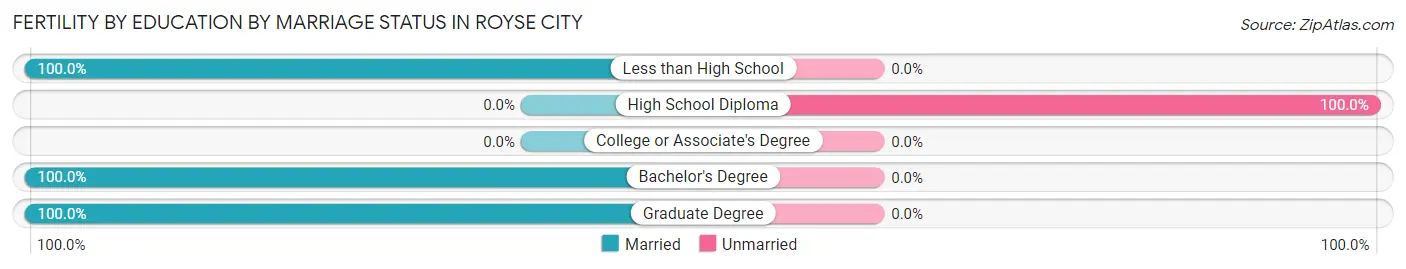
| Educational Attainment | Married | Unmarried |
| Less than High School | 107 (100.0%) | 0 (0.0%) |
| High School Diploma | 0 (0.0%) | 8 (100.0%) |
| College or Associate's Degree | 0 (0.0%) | 0 (0.0%) |
| Bachelor's Degree | 143 (100.0%) | 0 (0.0%) |
| Graduate Degree | 102 (100.0%) | 0 (0.0%) |
| Total | 352 (97.8%) | 8 (2.2%) |
Employment Characteristics in Royse City
Employment by Class of Employer in Royse City
Among the 8,367 employed individuals in Royse City, private company employees (6,367 | 76.1%), not-for-profit organizations (730 | 8.7%), and local government employees (628 | 7.5%) make up the most common classes of employment.
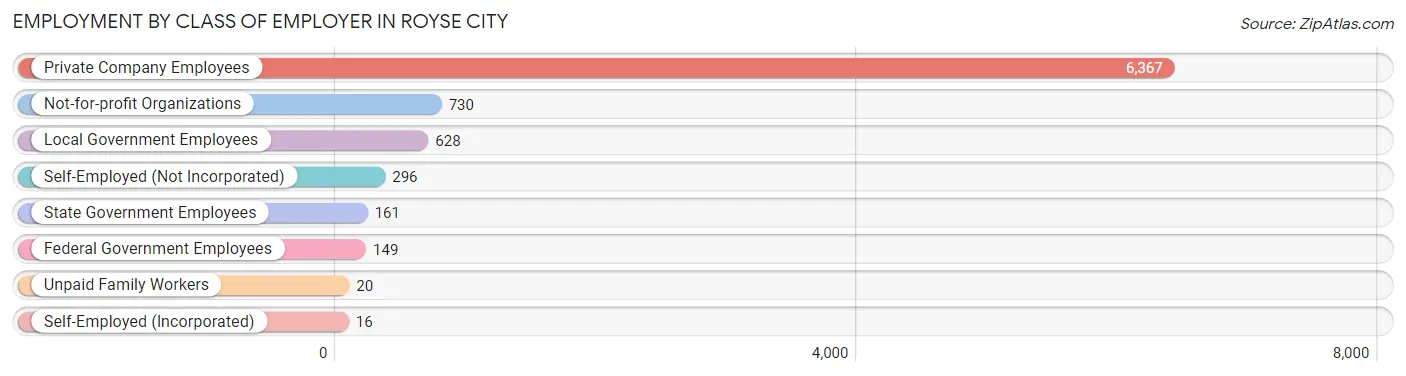
| Employer Class | # Employees | % Employees |
| Private Company Employees | 6,367 | 76.1% |
| Self-Employed (Incorporated) | 16 | 0.2% |
| Self-Employed (Not Incorporated) | 296 | 3.5% |
| Not-for-profit Organizations | 730 | 8.7% |
| Local Government Employees | 628 | 7.5% |
| State Government Employees | 161 | 1.9% |
| Federal Government Employees | 149 | 1.8% |
| Unpaid Family Workers | 20 | 0.2% |
| Total | 8,367 | 100.0% |
Employment Status by Age in Royse City
According to the labor force statistics for Royse City, out of the total population over 16 years of age (11,282), 75.7% or 8,540 individuals are in the labor force, with 1.0% or 85 of them unemployed. The age group with the highest labor force participation rate is 30 to 34 years, with 93.2% or 882 individuals in the labor force. Within the labor force, the 60 to 64 years age range has the highest percentage of unemployed individuals, with 3.5% or 17 of them being unemployed.
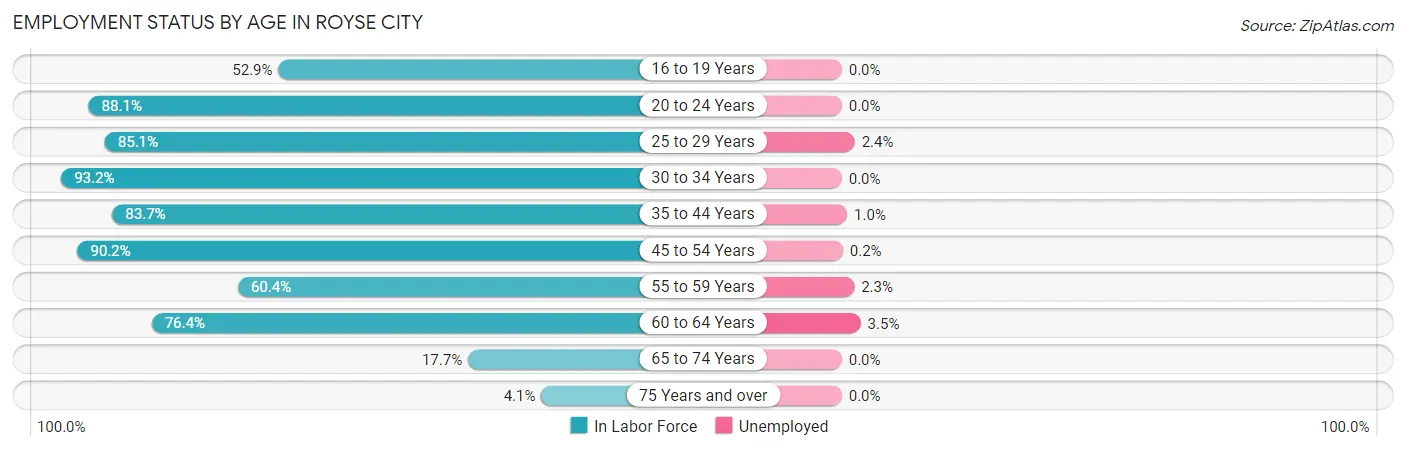
| Age Bracket | In Labor Force | Unemployed |
| 16 to 19 Years | 368 (52.9%) | 0 (0.0%) |
| 20 to 24 Years | 743 (88.1%) | 0 (0.0%) |
| 25 to 29 Years | 1,319 (85.1%) | 32 (2.4%) |
| 30 to 34 Years | 882 (93.2%) | 0 (0.0%) |
| 35 to 44 Years | 2,046 (83.7%) | 20 (1.0%) |
| 45 to 54 Years | 2,076 (90.2%) | 4 (0.2%) |
| 55 to 59 Years | 487 (60.4%) | 11 (2.3%) |
| 60 to 64 Years | 482 (76.4%) | 17 (3.5%) |
| 65 to 74 Years | 119 (17.7%) | 0 (0.0%) |
| 75 Years and over | 16 (4.1%) | 0 (0.0%) |
| Total | 8,540 (75.7%) | 85 (1.0%) |
Employment Status by Educational Attainment in Royse City
According to labor force statistics for Royse City, 84.0% of individuals (7,290) out of the total population between 25 and 64 years of age (8,678) are in the labor force, with 1.2% or 87 of them being unemployed. The group with the highest labor force participation rate are those with the educational attainment of college / associate degree, with 87.9% or 2,785 individuals in the labor force. Within the labor force, individuals with college / associate degree education have the highest percentage of unemployment, with 1.8% or 50 of them being unemployed.
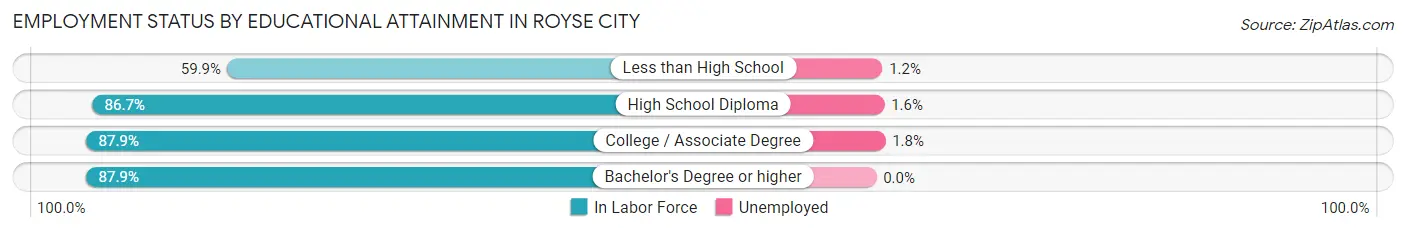
| Educational Attainment | In Labor Force | Unemployed |
| Less than High School | 663 (59.9%) | 13 (1.2%) |
| High School Diploma | 1,760 (86.7%) | 32 (1.6%) |
| College / Associate Degree | 2,785 (87.9%) | 57 (1.8%) |
| Bachelor's Degree or higher | 2,086 (87.9%) | 0 (0.0%) |
| Total | 7,290 (84.0%) | 104 (1.2%) |
Employment Occupations by Sex in Royse City
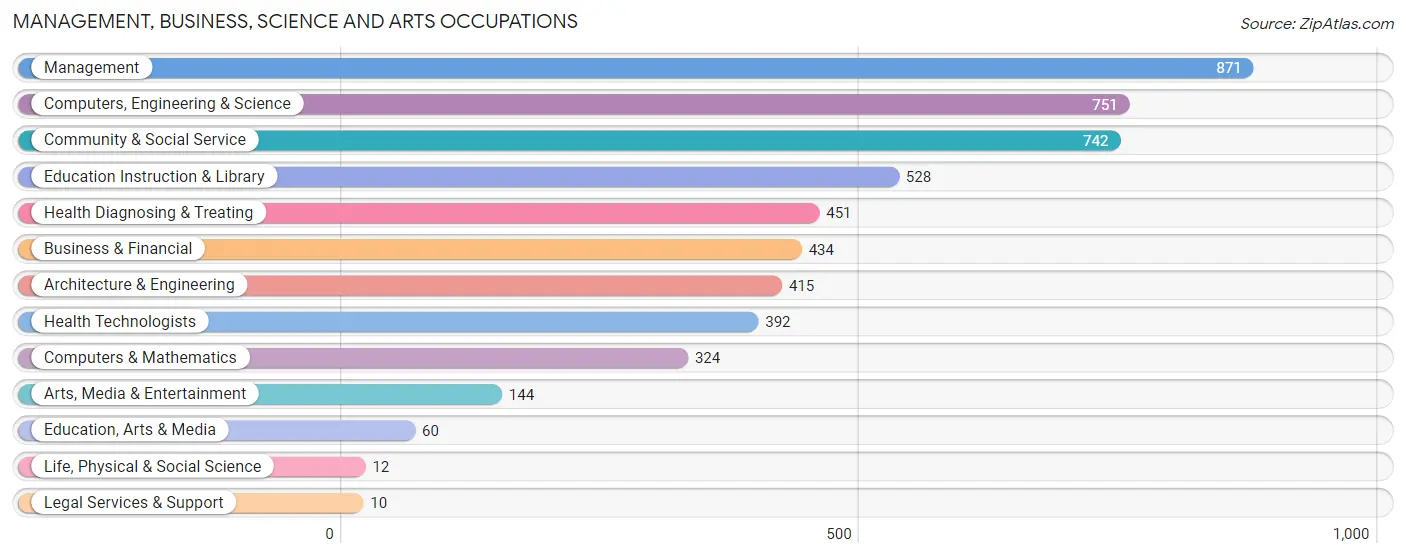
Management, Business, Science and Arts Occupations
The most common Management, Business, Science and Arts occupations in Royse City are Management (871 | 10.3%), Computers, Engineering & Science (751 | 8.9%), Community & Social Service (742 | 8.8%), Education Instruction & Library (528 | 6.2%), and Health Diagnosing & Treating (451 | 5.3%).
Management, Business, Science and Arts Occupations by Sex
Within the Management, Business, Science and Arts occupations in Royse City, the most male-oriented occupations are Life, Physical & Social Science (100.0%), Legal Services & Support (100.0%), and Architecture & Engineering (50.4%), while the most female-oriented occupations are Health Diagnosing & Treating (93.6%), Health Technologists (92.6%), and Business & Financial (71.4%).
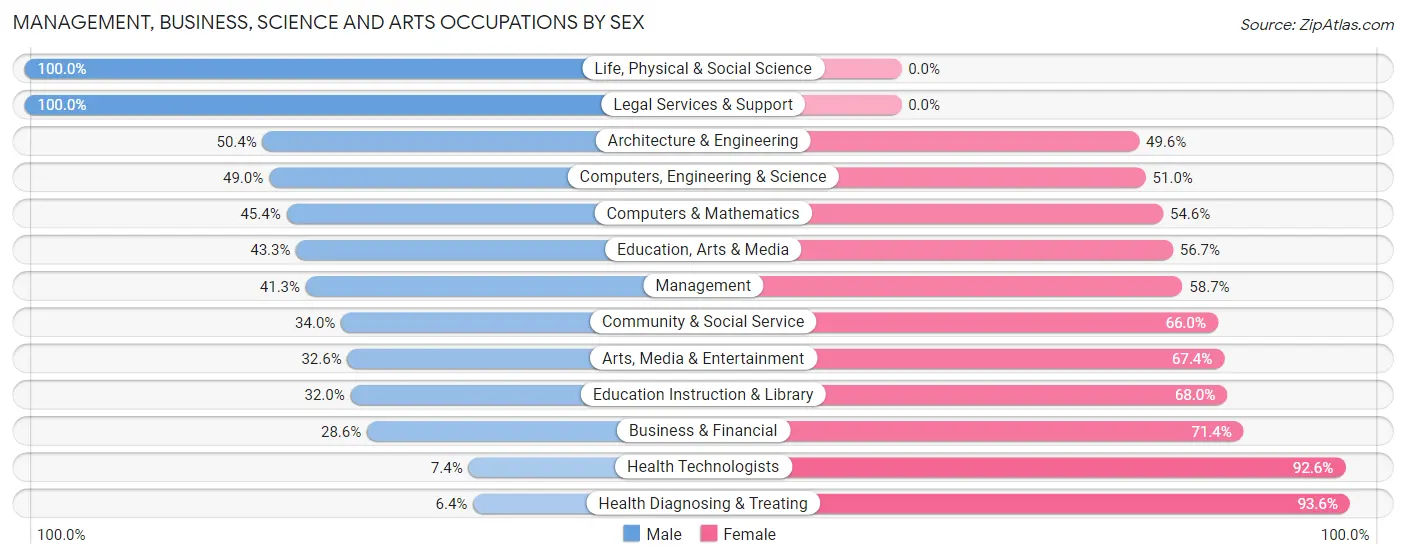
| Occupation | Male | Female |
| Management | 360 (41.3%) | 511 (58.7%) |
| Business & Financial | 124 (28.6%) | 310 (71.4%) |
| Computers, Engineering & Science | 368 (49.0%) | 383 (51.0%) |
| Computers & Mathematics | 147 (45.4%) | 177 (54.6%) |
| Architecture & Engineering | 209 (50.4%) | 206 (49.6%) |
| Life, Physical & Social Science | 12 (100.0%) | 0 (0.0%) |
| Community & Social Service | 252 (34.0%) | 490 (66.0%) |
| Education, Arts & Media | 26 (43.3%) | 34 (56.7%) |
| Legal Services & Support | 10 (100.0%) | 0 (0.0%) |
| Education Instruction & Library | 169 (32.0%) | 359 (68.0%) |
| Arts, Media & Entertainment | 47 (32.6%) | 97 (67.4%) |
| Health Diagnosing & Treating | 29 (6.4%) | 422 (93.6%) |
| Health Technologists | 29 (7.4%) | 363 (92.6%) |
| Total (Category) | 1,133 (34.9%) | 2,116 (65.1%) |
| Total (Overall) | 4,279 (50.6%) | 4,172 (49.4%) |
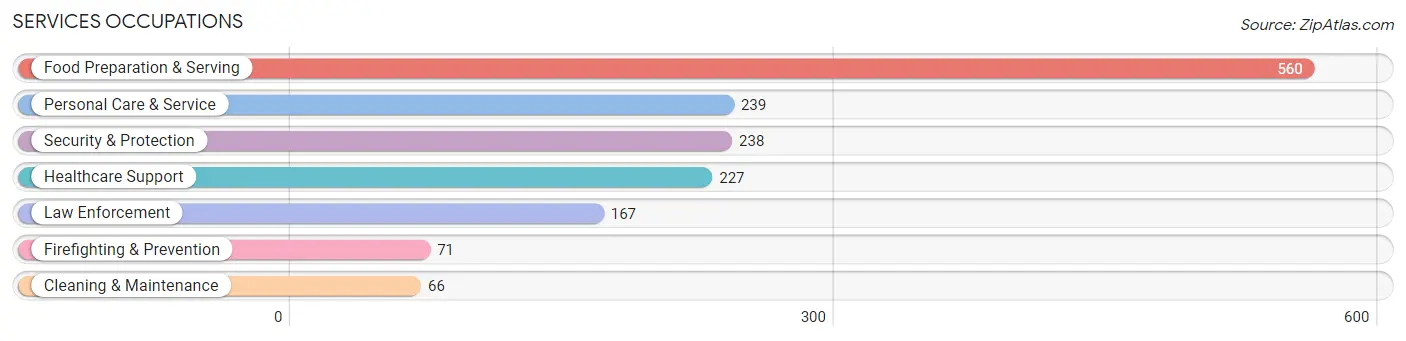
Services Occupations
The most common Services occupations in Royse City are Food Preparation & Serving (560 | 6.6%), Personal Care & Service (239 | 2.8%), Security & Protection (238 | 2.8%), Healthcare Support (227 | 2.7%), and Law Enforcement (167 | 2.0%).
Services Occupations by Sex
Within the Services occupations in Royse City, the most male-oriented occupations are Firefighting & Prevention (100.0%), Security & Protection (96.6%), and Law Enforcement (95.2%), while the most female-oriented occupations are Personal Care & Service (100.0%), Healthcare Support (90.3%), and Food Preparation & Serving (88.0%).
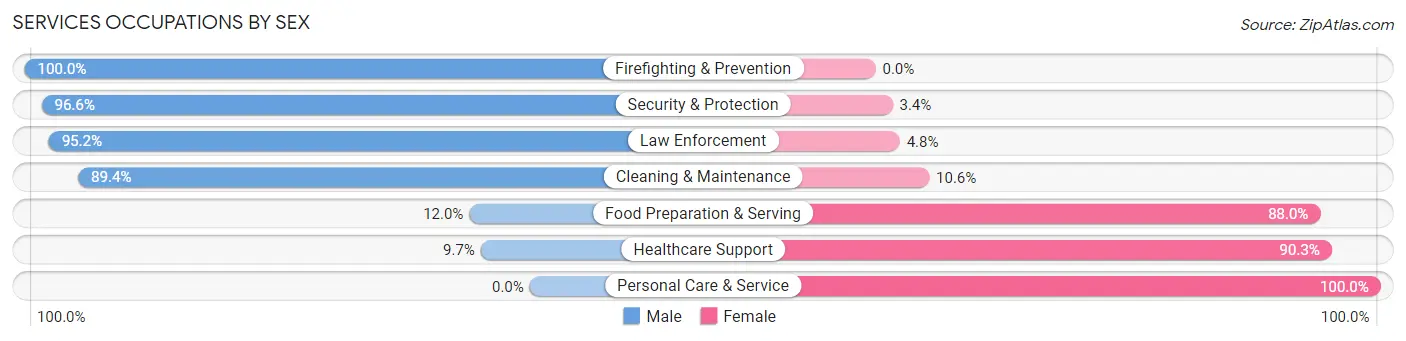
| Occupation | Male | Female |
| Healthcare Support | 22 (9.7%) | 205 (90.3%) |
| Security & Protection | 230 (96.6%) | 8 (3.4%) |
| Firefighting & Prevention | 71 (100.0%) | 0 (0.0%) |
| Law Enforcement | 159 (95.2%) | 8 (4.8%) |
| Food Preparation & Serving | 67 (12.0%) | 493 (88.0%) |
| Cleaning & Maintenance | 59 (89.4%) | 7 (10.6%) |
| Personal Care & Service | 0 (0.0%) | 239 (100.0%) |
| Total (Category) | 378 (28.4%) | 952 (71.6%) |
| Total (Overall) | 4,279 (50.6%) | 4,172 (49.4%) |
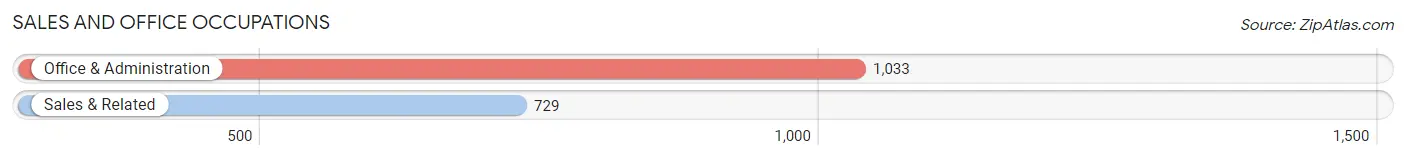
Sales and Office Occupations
The most common Sales and Office occupations in Royse City are Office & Administration (1,033 | 12.2%), and Sales & Related (729 | 8.6%).
Sales and Office Occupations by Sex
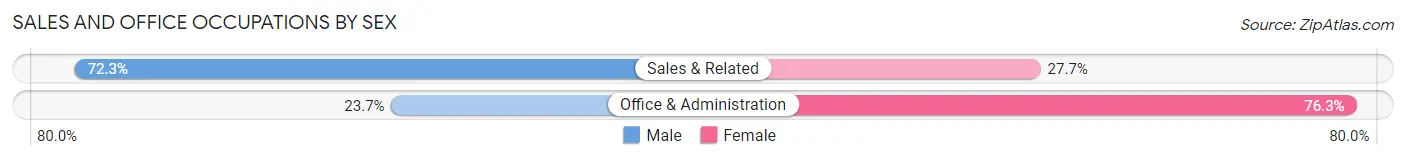
| Occupation | Male | Female |
| Sales & Related | 527 (72.3%) | 202 (27.7%) |
| Office & Administration | 245 (23.7%) | 788 (76.3%) |
| Total (Category) | 772 (43.8%) | 990 (56.2%) |
| Total (Overall) | 4,279 (50.6%) | 4,172 (49.4%) |
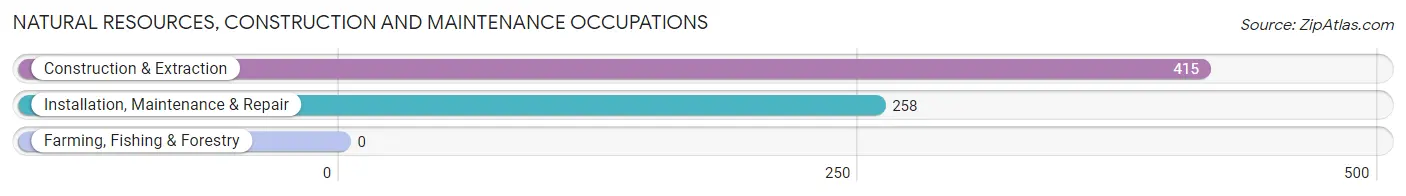
Natural Resources, Construction and Maintenance Occupations
The most common Natural Resources, Construction and Maintenance occupations in Royse City are Construction & Extraction (415 | 4.9%), and Installation, Maintenance & Repair (258 | 3.0%).
Natural Resources, Construction and Maintenance Occupations by Sex
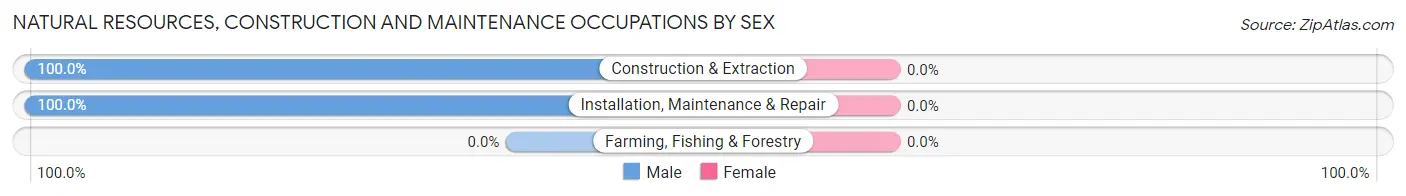
| Occupation | Male | Female |
| Farming, Fishing & Forestry | 0 (0.0%) | 0 (0.0%) |
| Construction & Extraction | 415 (100.0%) | 0 (0.0%) |
| Installation, Maintenance & Repair | 258 (100.0%) | 0 (0.0%) |
| Total (Category) | 673 (100.0%) | 0 (0.0%) |
| Total (Overall) | 4,279 (50.6%) | 4,172 (49.4%) |
Production, Transportation and Moving Occupations
The most common Production, Transportation and Moving occupations in Royse City are Production (652 | 7.7%), Transportation (494 | 5.9%), and Material Moving (291 | 3.4%).
Production, Transportation and Moving Occupations by Sex
| Occupation | Male | Female |
| Production | 571 (87.6%) | 81 (12.4%) |
| Transportation | 494 (100.0%) | 0 (0.0%) |
| Material Moving | 258 (88.7%) | 33 (11.3%) |
| Total (Category) | 1,323 (92.1%) | 114 (7.9%) |
| Total (Overall) | 4,279 (50.6%) | 4,172 (49.4%) |
Employment Industries by Sex in Royse City
Employment Industries in Royse City
The major employment industries in Royse City include Health Care & Social Assistance (1,355 | 16.0%), Manufacturing (981 | 11.6%), Professional & Scientific (853 | 10.1%), Construction (852 | 10.1%), and Educational Services (754 | 8.9%).
Employment Industries by Sex in Royse City
The Royse City industries that see more men than women are Wholesale Trade (100.0%), Utilities (100.0%), and Construction (99.3%), whereas the industries that tend to have a higher number of women are Enterprise Management (100.0%), Health Care & Social Assistance (88.1%), and Accommodation & Food Services (87.8%).
| Industry | Male | Female |
| Agriculture, Fishing & Hunting | 0 (0.0%) | 0 (0.0%) |
| Mining, Quarrying, & Extraction | 0 (0.0%) | 0 (0.0%) |
| Construction | 846 (99.3%) | 6 (0.7%) |
| Manufacturing | 775 (79.0%) | 206 (21.0%) |
| Wholesale Trade | 188 (100.0%) | 0 (0.0%) |
| Retail Trade | 532 (70.9%) | 218 (29.1%) |
| Transportation & Warehousing | 570 (89.8%) | 65 (10.2%) |
| Utilities | 36 (100.0%) | 0 (0.0%) |
| Information | 20 (13.8%) | 125 (86.2%) |
| Finance & Insurance | 188 (48.3%) | 201 (51.7%) |
| Real Estate, Rental & Leasing | 36 (19.1%) | 153 (80.9%) |
| Professional & Scientific | 219 (25.7%) | 634 (74.3%) |
| Enterprise Management | 0 (0.0%) | 85 (100.0%) |
| Administrative & Support | 134 (79.8%) | 34 (20.2%) |
| Educational Services | 213 (28.2%) | 541 (71.8%) |
| Health Care & Social Assistance | 161 (11.9%) | 1,194 (88.1%) |
| Arts, Entertainment & Recreation | 39 (58.2%) | 28 (41.8%) |
| Accommodation & Food Services | 60 (12.2%) | 430 (87.8%) |
| Public Administration | 178 (80.9%) | 42 (19.1%) |
| Total | 4,279 (50.6%) | 4,172 (49.4%) |
Education in Royse City
School Enrollment in Royse City
The most common levels of schooling among the 3,995 students in Royse City are middle school (1,004 | 25.1%), high school (892 | 22.3%), and elementary school (748 | 18.7%).
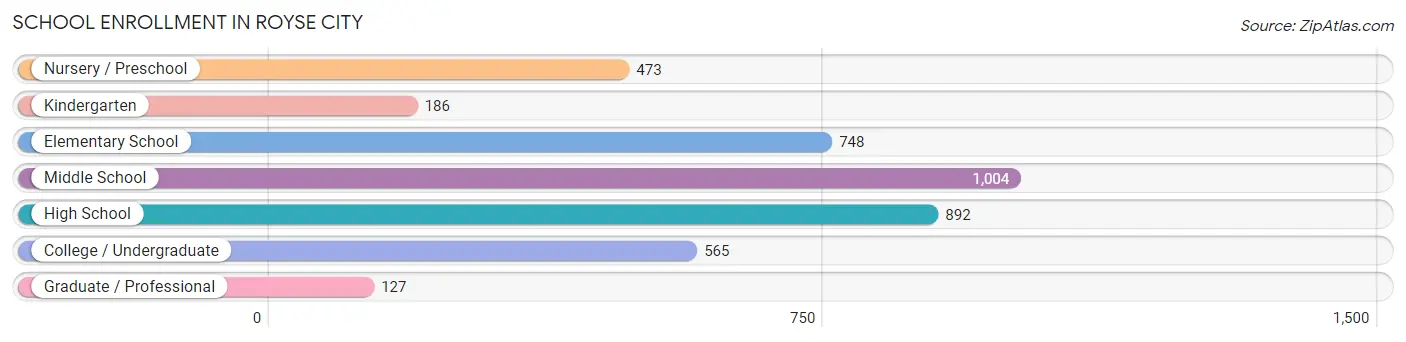
| School Level | # Students | % Students |
| Nursery / Preschool | 473 | 11.8% |
| Kindergarten | 186 | 4.7% |
| Elementary School | 748 | 18.7% |
| Middle School | 1,004 | 25.1% |
| High School | 892 | 22.3% |
| College / Undergraduate | 565 | 14.1% |
| Graduate / Professional | 127 | 3.2% |
| Total | 3,995 | 100.0% |
School Enrollment by Age by Funding Source in Royse City
Out of a total of 3,995 students who are enrolled in schools in Royse City, 280 (7.0%) attend a private institution, while the remaining 3,715 (93.0%) are enrolled in public schools. The age group of 3 to 4 year olds has the highest likelihood of being enrolled in private schools, with 104 (35.6% in the age bracket) enrolled. Conversely, the age group of 15 to 17 year olds has the lowest likelihood of being enrolled in a private school, with 461 (100.0% in the age bracket) attending a public institution.
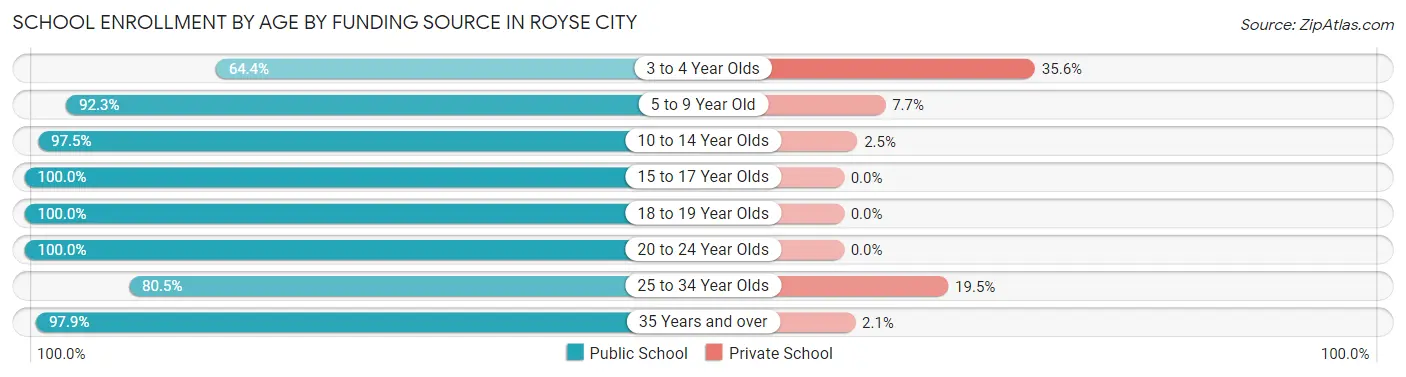
| Age Bracket | Public School | Private School |
| 3 to 4 Year Olds | 188 (64.4%) | 104 (35.6%) |
| 5 to 9 Year Old | 989 (92.3%) | 83 (7.7%) |
| 10 to 14 Year Olds | 1,239 (97.5%) | 32 (2.5%) |
| 15 to 17 Year Olds | 461 (100.0%) | 0 (0.0%) |
| 18 to 19 Year Olds | 338 (100.0%) | 0 (0.0%) |
| 20 to 24 Year Olds | 122 (100.0%) | 0 (0.0%) |
| 25 to 34 Year Olds | 240 (80.5%) | 58 (19.5%) |
| 35 Years and over | 138 (97.9%) | 3 (2.1%) |
| Total | 3,715 (93.0%) | 280 (7.0%) |
Educational Attainment by Field of Study in Royse City
Business (639 | 23.2%), science & technology (505 | 18.3%), education (329 | 11.9%), liberal arts & history (318 | 11.5%), and bio, nature & agricultural (193 | 7.0%) are the most common fields of study among 2,757 individuals in Royse City who have obtained a bachelor's degree or higher.
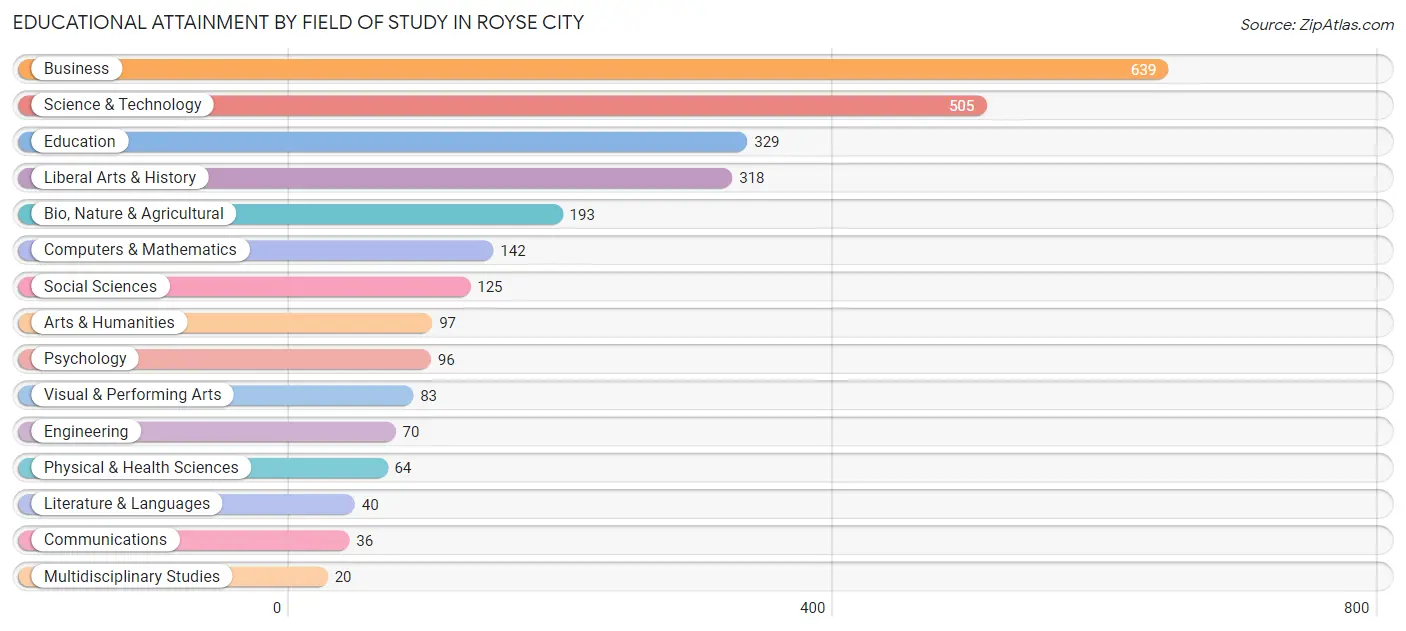
| Field of Study | # Graduates | % Graduates |
| Computers & Mathematics | 142 | 5.1% |
| Bio, Nature & Agricultural | 193 | 7.0% |
| Physical & Health Sciences | 64 | 2.3% |
| Psychology | 96 | 3.5% |
| Social Sciences | 125 | 4.5% |
| Engineering | 70 | 2.5% |
| Multidisciplinary Studies | 20 | 0.7% |
| Science & Technology | 505 | 18.3% |
| Business | 639 | 23.2% |
| Education | 329 | 11.9% |
| Literature & Languages | 40 | 1.5% |
| Liberal Arts & History | 318 | 11.5% |
| Visual & Performing Arts | 83 | 3.0% |
| Communications | 36 | 1.3% |
| Arts & Humanities | 97 | 3.5% |
| Total | 2,757 | 100.0% |
Transportation & Commute in Royse City
Vehicle Availability by Sex in Royse City
The most prevalent vehicle ownership categories in Royse City are males with 2 vehicles (2,416, accounting for 56.9%) and females with 2 vehicles (2,328, making up 58.7%).
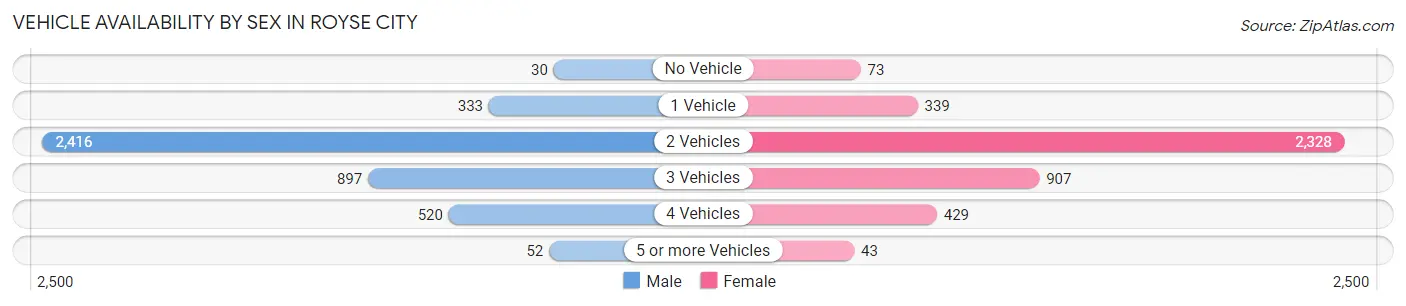
| Vehicles Available | Male | Female |
| No Vehicle | 30 (0.7%) | 73 (1.8%) |
| 1 Vehicle | 333 (7.8%) | 339 (8.2%) |
| 2 Vehicles | 2,416 (56.9%) | 2,328 (56.5%) |
| 3 Vehicles | 897 (21.1%) | 907 (22.0%) |
| 4 Vehicles | 520 (12.2%) | 429 (10.4%) |
| 5 or more Vehicles | 52 (1.2%) | 43 (1.0%) |
| Total | 4,248 (100.0%) | 4,119 (100.0%) |
Commute Time in Royse City
The most frequently occuring commute durations in Royse City are 45 to 59 minutes (1,146 commuters, 15.8%), 30 to 34 minutes (1,017 commuters, 14.0%), and 60 to 89 minutes (992 commuters, 13.7%).
| Commute Time | # Commuters | % Commuters |
| Less than 5 Minutes | 174 | 2.4% |
| 5 to 9 Minutes | 673 | 9.3% |
| 10 to 14 Minutes | 587 | 8.1% |
| 15 to 19 Minutes | 767 | 10.6% |
| 20 to 24 Minutes | 697 | 9.6% |
| 25 to 29 Minutes | 252 | 3.5% |
| 30 to 34 Minutes | 1,017 | 14.0% |
| 35 to 39 Minutes | 234 | 3.2% |
| 40 to 44 Minutes | 394 | 5.4% |
| 45 to 59 Minutes | 1,146 | 15.8% |
| 60 to 89 Minutes | 992 | 13.7% |
| 90 or more Minutes | 314 | 4.3% |
Commute Time by Sex in Royse City
The most common commute times in Royse City are 45 to 59 minutes (757 commuters, 19.5%) for males and 10 to 14 minutes (511 commuters, 15.2%) for females.
| Commute Time | Male | Female |
| Less than 5 Minutes | 61 (1.6%) | 113 (3.4%) |
| 5 to 9 Minutes | 311 (8.0%) | 362 (10.8%) |
| 10 to 14 Minutes | 76 (2.0%) | 511 (15.2%) |
| 15 to 19 Minutes | 307 (7.9%) | 460 (13.7%) |
| 20 to 24 Minutes | 339 (8.7%) | 358 (10.6%) |
| 25 to 29 Minutes | 150 (3.9%) | 102 (3.0%) |
| 30 to 34 Minutes | 737 (19.0%) | 280 (8.3%) |
| 35 to 39 Minutes | 91 (2.3%) | 143 (4.3%) |
| 40 to 44 Minutes | 251 (6.5%) | 143 (4.3%) |
| 45 to 59 Minutes | 757 (19.5%) | 389 (11.6%) |
| 60 to 89 Minutes | 553 (14.2%) | 439 (13.1%) |
| 90 or more Minutes | 253 (6.5%) | 61 (1.8%) |
Time of Departure to Work by Sex in Royse City
The most frequent times of departure to work in Royse City are 12:00 AM to 4:59 AM (769, 19.8%) for males and 7:00 AM to 7:29 AM (779, 23.2%) for females.
| Time of Departure | Male | Female |
| 12:00 AM to 4:59 AM | 769 (19.8%) | 41 (1.2%) |
| 5:00 AM to 5:29 AM | 271 (7.0%) | 73 (2.2%) |
| 5:30 AM to 5:59 AM | 324 (8.3%) | 190 (5.7%) |
| 6:00 AM to 6:29 AM | 637 (16.4%) | 163 (4.9%) |
| 6:30 AM to 6:59 AM | 218 (5.6%) | 367 (10.9%) |
| 7:00 AM to 7:29 AM | 261 (6.7%) | 779 (23.2%) |
| 7:30 AM to 7:59 AM | 255 (6.6%) | 295 (8.8%) |
| 8:00 AM to 8:29 AM | 305 (7.9%) | 482 (14.3%) |
| 8:30 AM to 8:59 AM | 8 (0.2%) | 54 (1.6%) |
| 9:00 AM to 9:59 AM | 173 (4.4%) | 121 (3.6%) |
| 10:00 AM to 10:59 AM | 7 (0.2%) | 96 (2.9%) |
| 11:00 AM to 11:59 AM | 49 (1.3%) | 0 (0.0%) |
| 12:00 PM to 3:59 PM | 147 (3.8%) | 535 (15.9%) |
| 4:00 PM to 11:59 PM | 462 (11.9%) | 165 (4.9%) |
| Total | 3,886 (100.0%) | 3,361 (100.0%) |
Housing Occupancy in Royse City
Occupancy by Ownership in Royse City
Of the total 5,208 dwellings in Royse City, owner-occupied units account for 4,536 (87.1%), while renter-occupied units make up 672 (12.9%).
| Occupancy | # Housing Units | % Housing Units |
| Owner Occupied Housing Units | 4,536 | 87.1% |
| Renter-Occupied Housing Units | 672 | 12.9% |
| Total Occupied Housing Units | 5,208 | 100.0% |
Occupancy by Household Size in Royse City
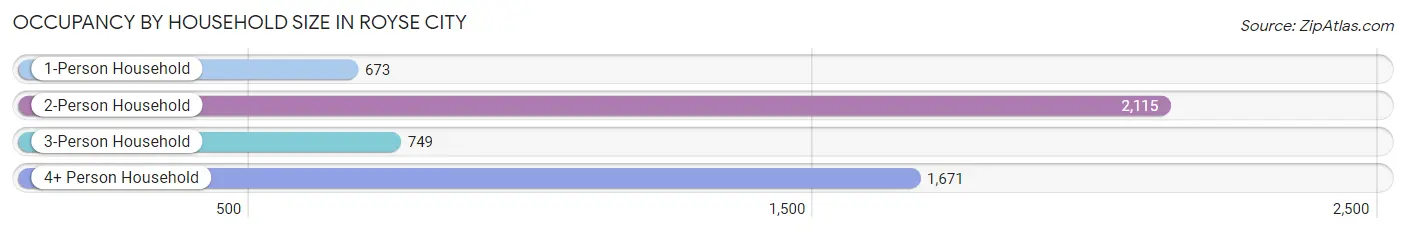
| Household Size | # Housing Units | % Housing Units |
| 1-Person Household | 673 | 12.9% |
| 2-Person Household | 2,115 | 40.6% |
| 3-Person Household | 749 | 14.4% |
| 4+ Person Household | 1,671 | 32.1% |
| Total Housing Units | 5,208 | 100.0% |
Occupancy by Ownership by Household Size in Royse City
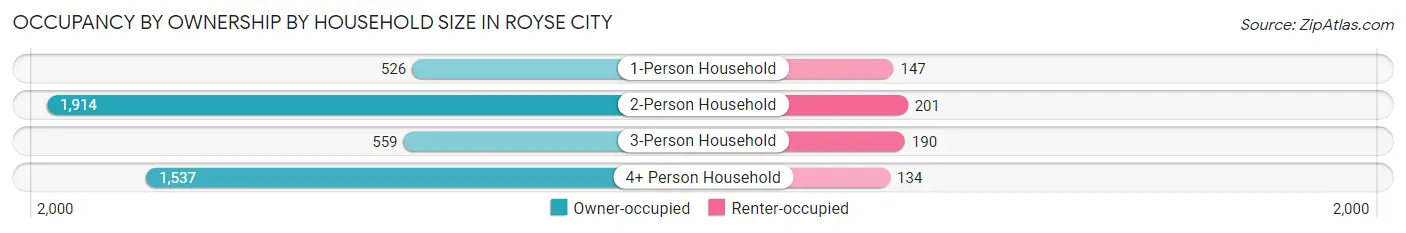
| Household Size | Owner-occupied | Renter-occupied |
| 1-Person Household | 526 (78.2%) | 147 (21.8%) |
| 2-Person Household | 1,914 (90.5%) | 201 (9.5%) |
| 3-Person Household | 559 (74.6%) | 190 (25.4%) |
| 4+ Person Household | 1,537 (92.0%) | 134 (8.0%) |
| Total Housing Units | 4,536 (87.1%) | 672 (12.9%) |
Occupancy by Educational Attainment in Royse City
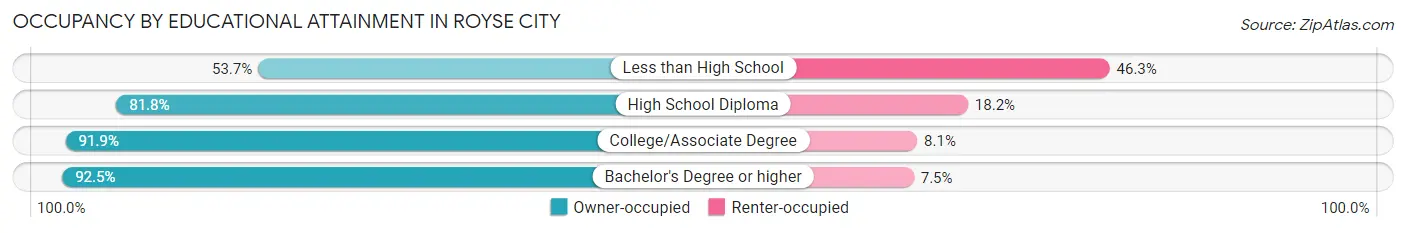
| Household Size | Owner-occupied | Renter-occupied |
| Less than High School | 231 (53.7%) | 199 (46.3%) |
| High School Diploma | 787 (81.8%) | 175 (18.2%) |
| College/Associate Degree | 1,843 (91.9%) | 163 (8.1%) |
| Bachelor's Degree or higher | 1,675 (92.5%) | 135 (7.5%) |
Occupancy by Age of Householder in Royse City
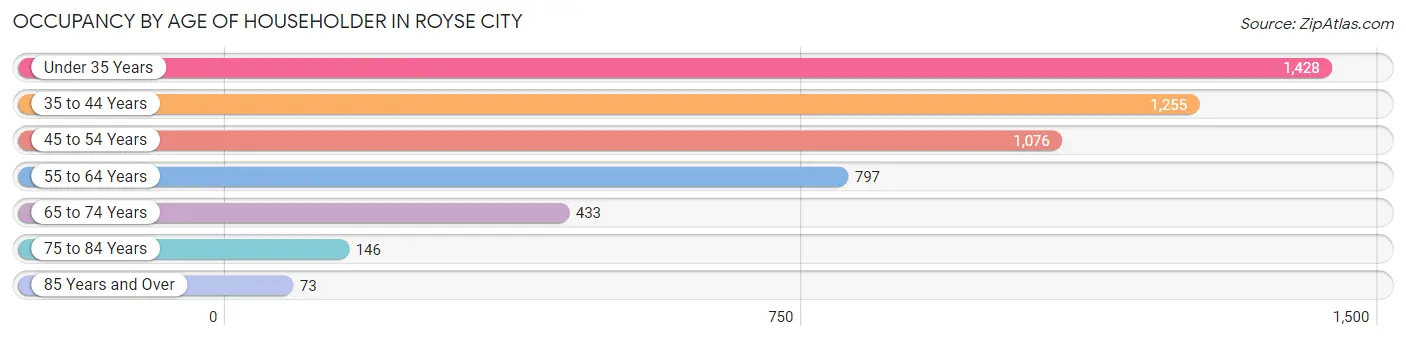
| Age Bracket | # Households | % Households |
| Under 35 Years | 1,428 | 27.4% |
| 35 to 44 Years | 1,255 | 24.1% |
| 45 to 54 Years | 1,076 | 20.7% |
| 55 to 64 Years | 797 | 15.3% |
| 65 to 74 Years | 433 | 8.3% |
| 75 to 84 Years | 146 | 2.8% |
| 85 Years and Over | 73 | 1.4% |
| Total | 5,208 | 100.0% |
Housing Finances in Royse City
Median Income by Occupancy in Royse City
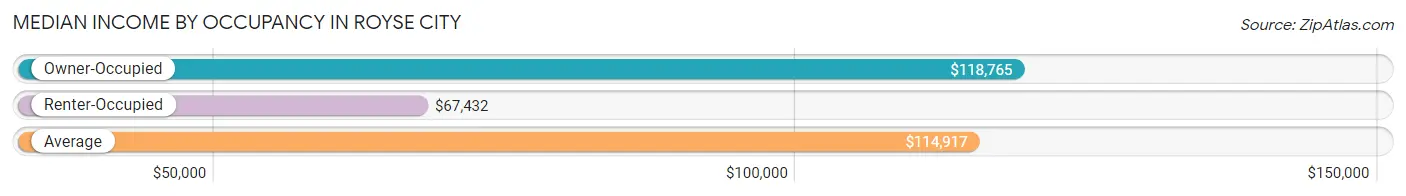
| Occupancy Type | # Households | Median Income |
| Owner-Occupied | 4,536 (87.1%) | $118,765 |
| Renter-Occupied | 672 (12.9%) | $67,432 |
| Average | 5,208 (100.0%) | $114,917 |
Occupancy by Householder Income Bracket in Royse City
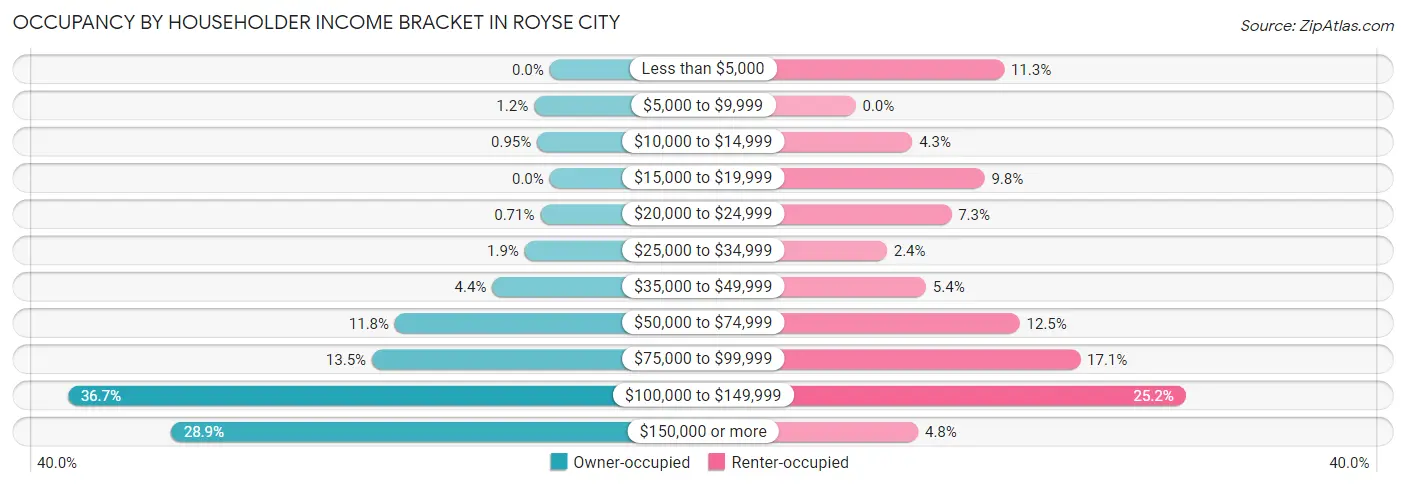
| Income Bracket | Owner-occupied | Renter-occupied |
| Less than $5,000 | 0 (0.0%) | 76 (11.3%) |
| $5,000 to $9,999 | 54 (1.2%) | 0 (0.0%) |
| $10,000 to $14,999 | 43 (0.9%) | 29 (4.3%) |
| $15,000 to $19,999 | 0 (0.0%) | 66 (9.8%) |
| $20,000 to $24,999 | 32 (0.7%) | 49 (7.3%) |
| $25,000 to $34,999 | 86 (1.9%) | 16 (2.4%) |
| $35,000 to $49,999 | 198 (4.4%) | 36 (5.4%) |
| $50,000 to $74,999 | 535 (11.8%) | 84 (12.5%) |
| $75,000 to $99,999 | 614 (13.5%) | 115 (17.1%) |
| $100,000 to $149,999 | 1,665 (36.7%) | 169 (25.2%) |
| $150,000 or more | 1,309 (28.9%) | 32 (4.8%) |
| Total | 4,536 (100.0%) | 672 (100.0%) |
Monthly Housing Cost Tiers in Royse City
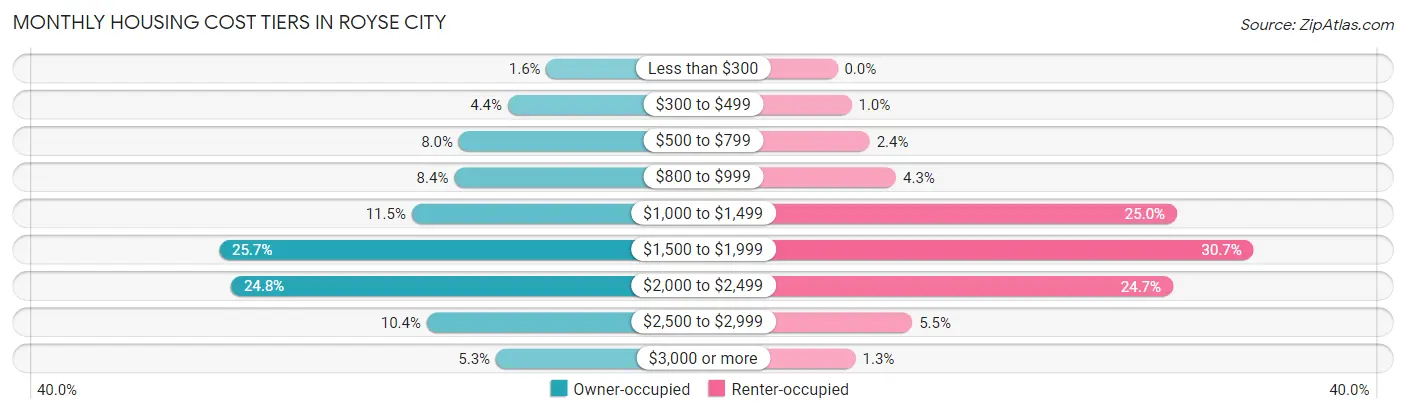
| Monthly Cost | Owner-occupied | Renter-occupied |
| Less than $300 | 71 (1.6%) | 0 (0.0%) |
| $300 to $499 | 200 (4.4%) | 7 (1.0%) |
| $500 to $799 | 364 (8.0%) | 16 (2.4%) |
| $800 to $999 | 379 (8.4%) | 29 (4.3%) |
| $1,000 to $1,499 | 521 (11.5%) | 168 (25.0%) |
| $1,500 to $1,999 | 1,165 (25.7%) | 206 (30.6%) |
| $2,000 to $2,499 | 1,125 (24.8%) | 166 (24.7%) |
| $2,500 to $2,999 | 471 (10.4%) | 37 (5.5%) |
| $3,000 or more | 240 (5.3%) | 9 (1.3%) |
| Total | 4,536 (100.0%) | 672 (100.0%) |
Physical Housing Characteristics in Royse City
Housing Structures in Royse City
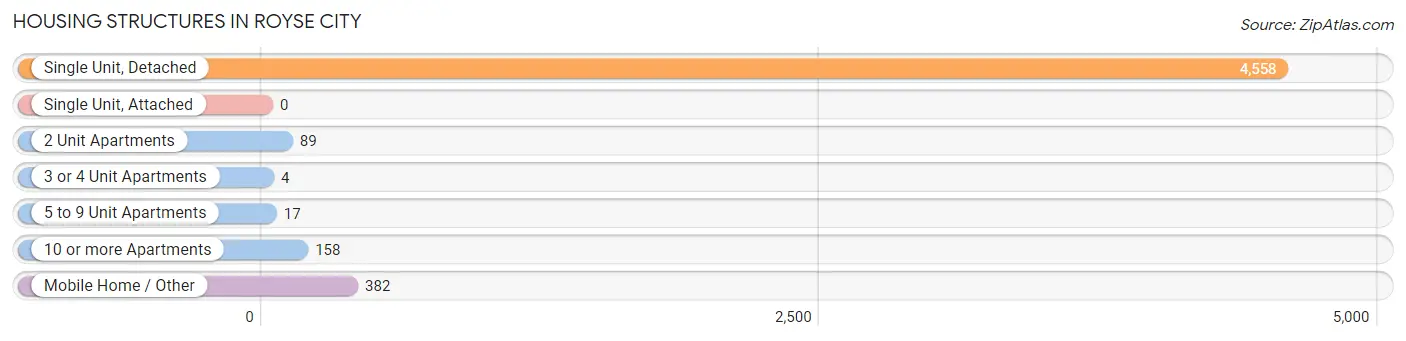
| Structure Type | # Housing Units | % Housing Units |
| Single Unit, Detached | 4,558 | 87.5% |
| Single Unit, Attached | 0 | 0.0% |
| 2 Unit Apartments | 89 | 1.7% |
| 3 or 4 Unit Apartments | 4 | 0.1% |
| 5 to 9 Unit Apartments | 17 | 0.3% |
| 10 or more Apartments | 158 | 3.0% |
| Mobile Home / Other | 382 | 7.3% |
| Total | 5,208 | 100.0% |
Housing Structures by Occupancy in Royse City
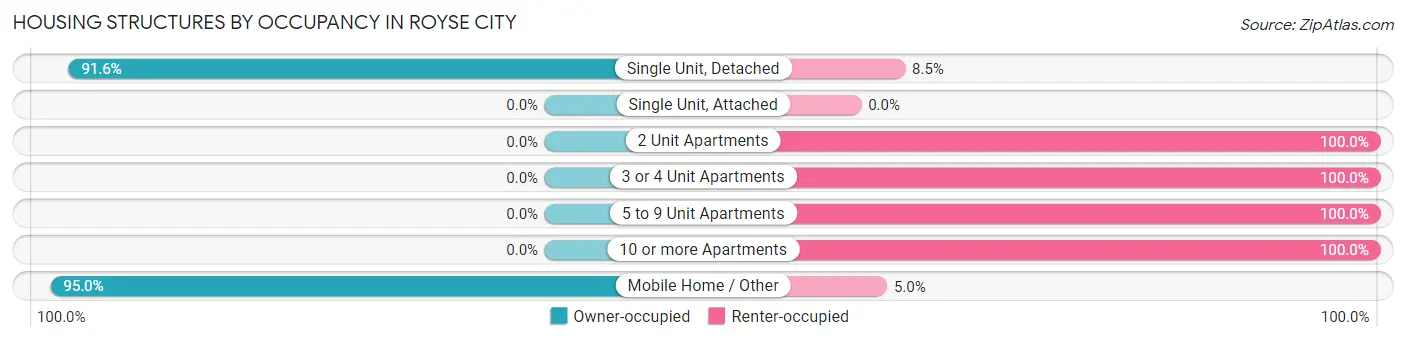
| Structure Type | Owner-occupied | Renter-occupied |
| Single Unit, Detached | 4,173 (91.5%) | 385 (8.5%) |
| Single Unit, Attached | 0 (0.0%) | 0 (0.0%) |
| 2 Unit Apartments | 0 (0.0%) | 89 (100.0%) |
| 3 or 4 Unit Apartments | 0 (0.0%) | 4 (100.0%) |
| 5 to 9 Unit Apartments | 0 (0.0%) | 17 (100.0%) |
| 10 or more Apartments | 0 (0.0%) | 158 (100.0%) |
| Mobile Home / Other | 363 (95.0%) | 19 (5.0%) |
| Total | 4,536 (87.1%) | 672 (12.9%) |
Housing Structures by Number of Rooms in Royse City
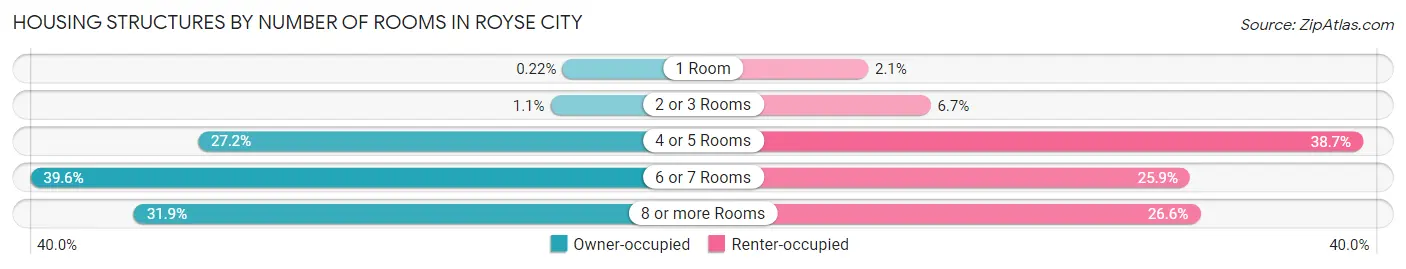
| Number of Rooms | Owner-occupied | Renter-occupied |
| 1 Room | 10 (0.2%) | 14 (2.1%) |
| 2 or 3 Rooms | 50 (1.1%) | 45 (6.7%) |
| 4 or 5 Rooms | 1,233 (27.2%) | 260 (38.7%) |
| 6 or 7 Rooms | 1,795 (39.6%) | 174 (25.9%) |
| 8 or more Rooms | 1,448 (31.9%) | 179 (26.6%) |
| Total | 4,536 (100.0%) | 672 (100.0%) |
Housing Structure by Heating Type in Royse City
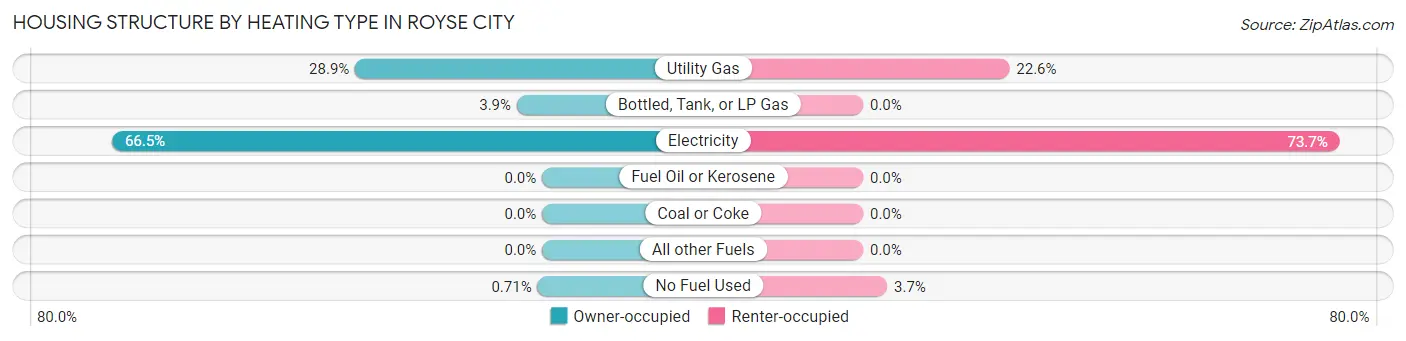
| Heating Type | Owner-occupied | Renter-occupied |
| Utility Gas | 1,311 (28.9%) | 152 (22.6%) |
| Bottled, Tank, or LP Gas | 177 (3.9%) | 0 (0.0%) |
| Electricity | 3,016 (66.5%) | 495 (73.7%) |
| Fuel Oil or Kerosene | 0 (0.0%) | 0 (0.0%) |
| Coal or Coke | 0 (0.0%) | 0 (0.0%) |
| All other Fuels | 0 (0.0%) | 0 (0.0%) |
| No Fuel Used | 32 (0.7%) | 25 (3.7%) |
| Total | 4,536 (100.0%) | 672 (100.0%) |
Household Vehicle Usage in Royse City
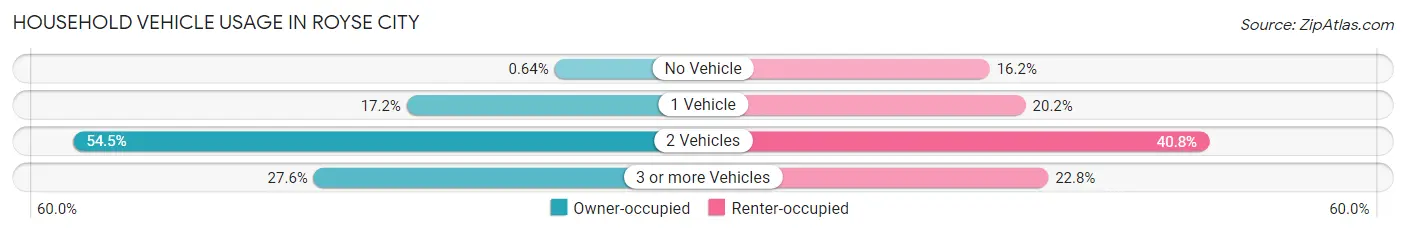
| Vehicles per Household | Owner-occupied | Renter-occupied |
| No Vehicle | 29 (0.6%) | 109 (16.2%) |
| 1 Vehicle | 780 (17.2%) | 136 (20.2%) |
| 2 Vehicles | 2,474 (54.5%) | 274 (40.8%) |
| 3 or more Vehicles | 1,253 (27.6%) | 153 (22.8%) |
| Total | 4,536 (100.0%) | 672 (100.0%) |
Real Estate & Mortgages in Royse City
Real Estate and Mortgage Overview in Royse City
| Characteristic | Without Mortgage | With Mortgage |
| Housing Units | 991 | 3,545 |
| Median Property Value | $174,000 | $285,500 |
| Median Household Income | $91,761 | $1,214 |
| Monthly Housing Costs | $679 | $240 |
| Real Estate Taxes | $4,130 | $204 |
Property Value by Mortgage Status in Royse City
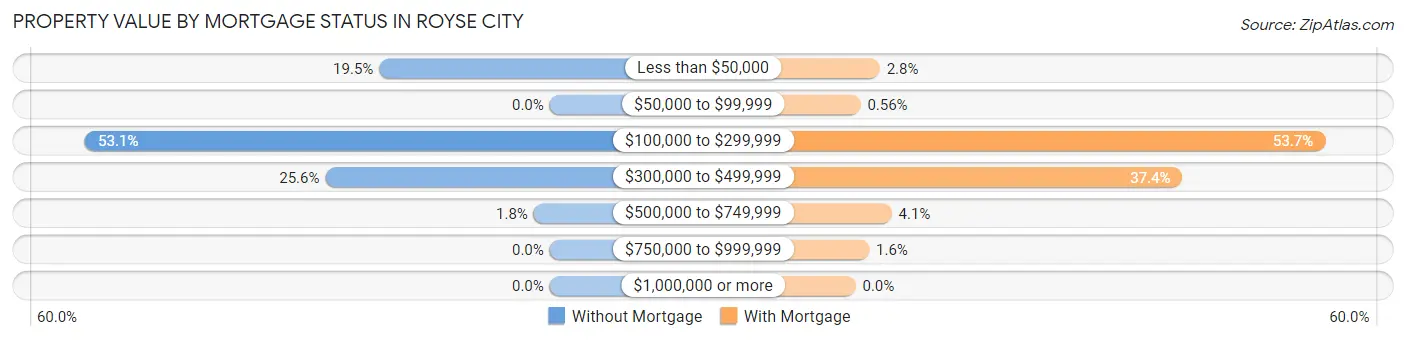
| Property Value | Without Mortgage | With Mortgage |
| Less than $50,000 | 193 (19.5%) | 98 (2.8%) |
| $50,000 to $99,999 | 0 (0.0%) | 20 (0.6%) |
| $100,000 to $299,999 | 526 (53.1%) | 1,902 (53.6%) |
| $300,000 to $499,999 | 254 (25.6%) | 1,324 (37.3%) |
| $500,000 to $749,999 | 18 (1.8%) | 146 (4.1%) |
| $750,000 to $999,999 | 0 (0.0%) | 55 (1.5%) |
| $1,000,000 or more | 0 (0.0%) | 0 (0.0%) |
| Total | 991 (100.0%) | 3,545 (100.0%) |
Household Income by Mortgage Status in Royse City
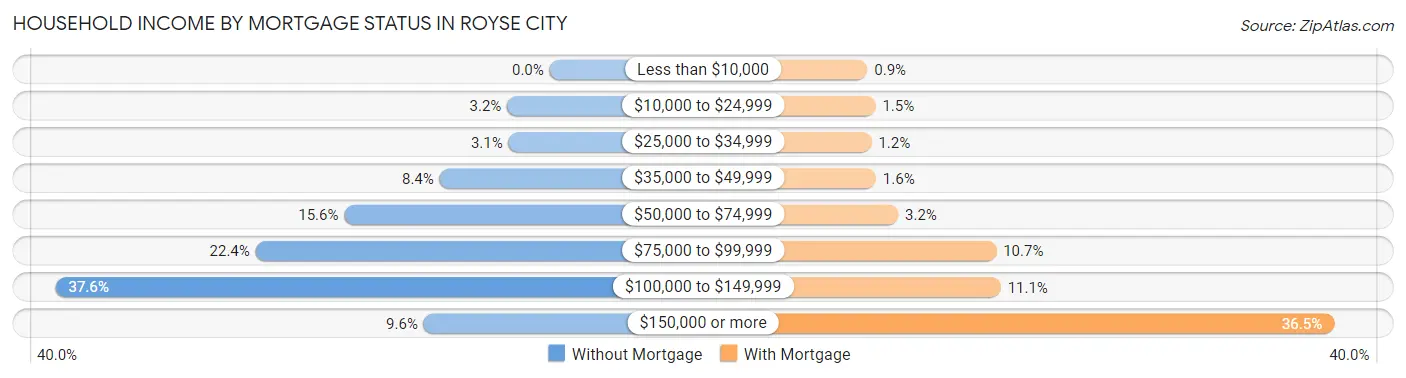
| Household Income | Without Mortgage | With Mortgage |
| Less than $10,000 | 0 (0.0%) | 32 (0.9%) |
| $10,000 to $24,999 | 32 (3.2%) | 54 (1.5%) |
| $25,000 to $34,999 | 31 (3.1%) | 43 (1.2%) |
| $35,000 to $49,999 | 83 (8.4%) | 55 (1.5%) |
| $50,000 to $74,999 | 155 (15.6%) | 115 (3.2%) |
| $75,000 to $99,999 | 222 (22.4%) | 380 (10.7%) |
| $100,000 to $149,999 | 373 (37.6%) | 392 (11.1%) |
| $150,000 or more | 95 (9.6%) | 1,292 (36.4%) |
| Total | 991 (100.0%) | 3,545 (100.0%) |
Property Value to Household Income Ratio in Royse City
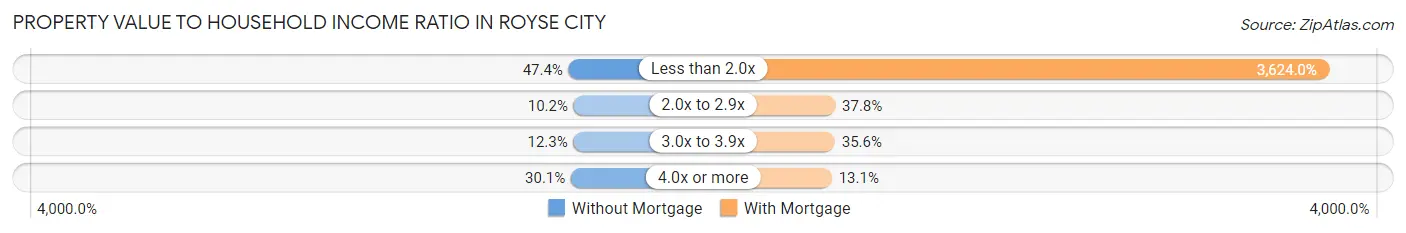
| Value-to-Income Ratio | Without Mortgage | With Mortgage |
| Less than 2.0x | 470 (47.4%) | 128,471 (3,624.0%) |
| 2.0x to 2.9x | 101 (10.2%) | 1,341 (37.8%) |
| 3.0x to 3.9x | 122 (12.3%) | 1,261 (35.6%) |
| 4.0x or more | 298 (30.1%) | 464 (13.1%) |
| Total | 991 (100.0%) | 3,545 (100.0%) |
Real Estate Taxes by Mortgage Status in Royse City
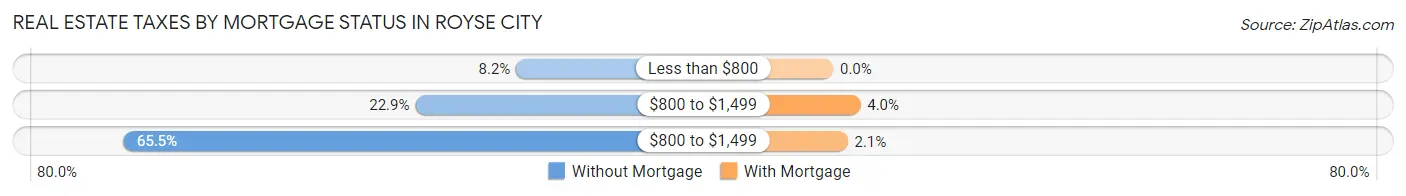
| Property Taxes | Without Mortgage | With Mortgage |
| Less than $800 | 81 (8.2%) | 0 (0.0%) |
| $800 to $1,499 | 227 (22.9%) | 141 (4.0%) |
| $800 to $1,499 | 649 (65.5%) | 75 (2.1%) |
| Total | 991 (100.0%) | 3,545 (100.0%) |
Health & Disability in Royse City
Health Insurance Coverage by Age in Royse City
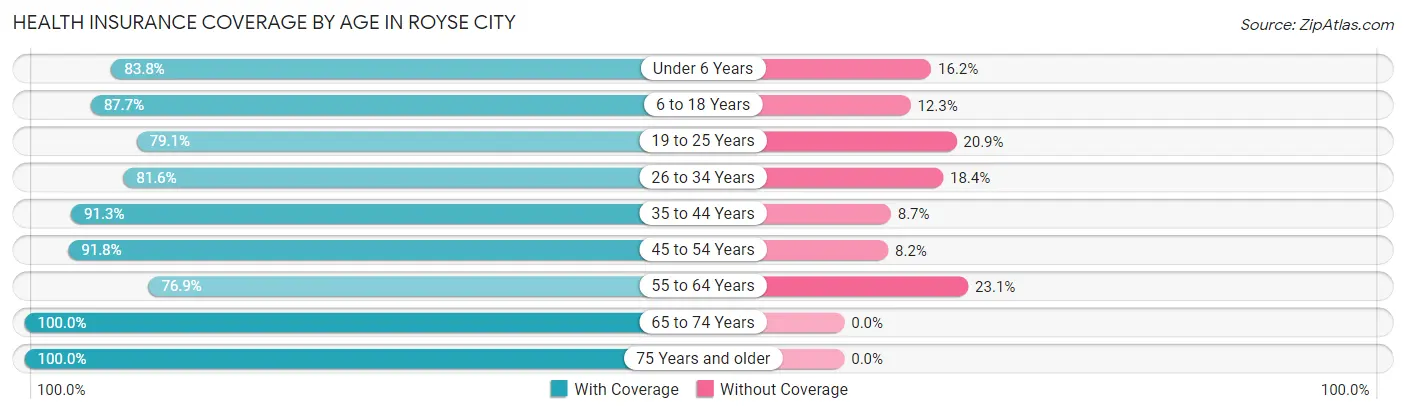
| Age Bracket | With Coverage | Without Coverage |
| Under 6 Years | 1,196 (83.8%) | 231 (16.2%) |
| 6 to 18 Years | 2,544 (87.7%) | 358 (12.3%) |
| 19 to 25 Years | 1,173 (79.1%) | 310 (20.9%) |
| 26 to 34 Years | 1,617 (81.6%) | 365 (18.4%) |
| 35 to 44 Years | 2,222 (91.3%) | 211 (8.7%) |
| 45 to 54 Years | 2,113 (91.8%) | 188 (8.2%) |
| 55 to 64 Years | 1,105 (76.9%) | 332 (23.1%) |
| 65 to 74 Years | 672 (100.0%) | 0 (0.0%) |
| 75 Years and older | 393 (100.0%) | 0 (0.0%) |
| Total | 13,035 (86.7%) | 1,995 (13.3%) |
Health Insurance Coverage by Citizenship Status in Royse City
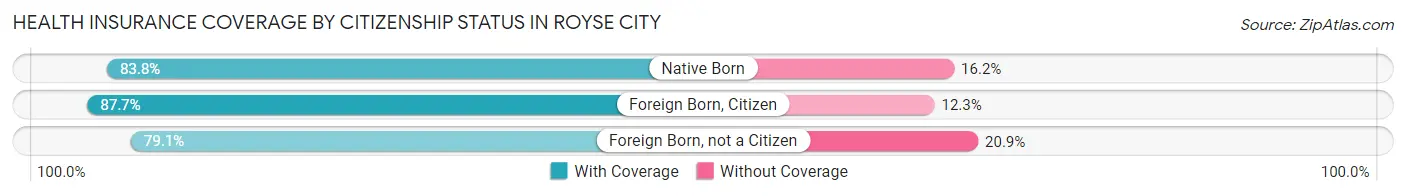
| Citizenship Status | With Coverage | Without Coverage |
| Native Born | 1,196 (83.8%) | 231 (16.2%) |
| Foreign Born, Citizen | 2,544 (87.7%) | 358 (12.3%) |
| Foreign Born, not a Citizen | 1,173 (79.1%) | 310 (20.9%) |
Health Insurance Coverage by Household Income in Royse City
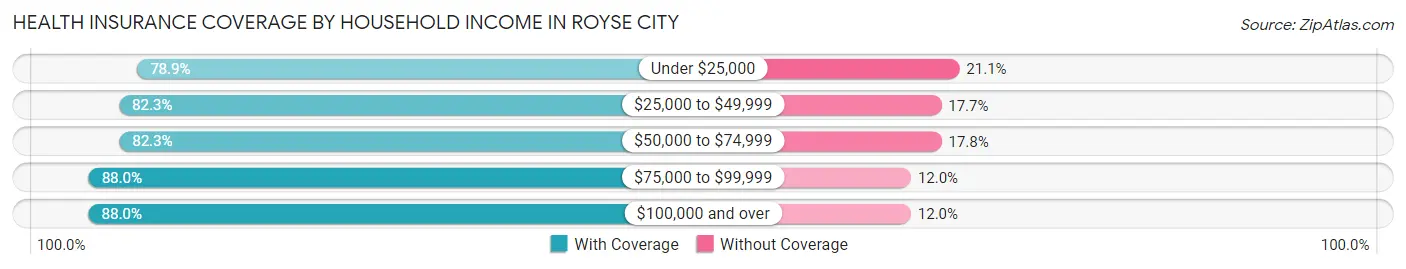
| Household Income | With Coverage | Without Coverage |
| Under $25,000 | 561 (78.9%) | 150 (21.1%) |
| $25,000 to $49,999 | 618 (82.3%) | 133 (17.7%) |
| $50,000 to $74,999 | 1,200 (82.3%) | 259 (17.7%) |
| $75,000 to $99,999 | 1,720 (88.0%) | 235 (12.0%) |
| $100,000 and over | 8,936 (88.0%) | 1,218 (12.0%) |
Public vs Private Health Insurance Coverage by Age in Royse City
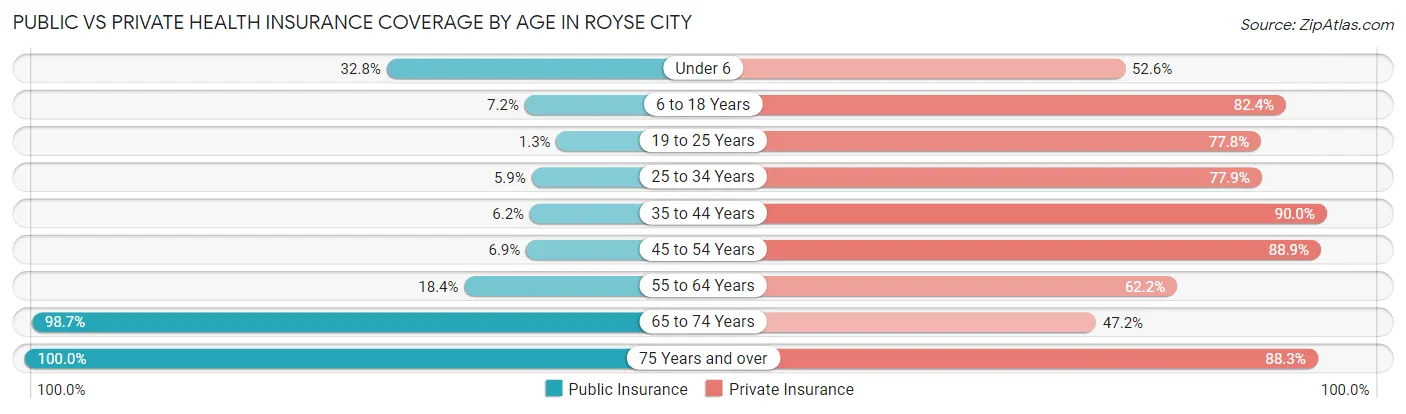
| Age Bracket | Public Insurance | Private Insurance |
| Under 6 | 468 (32.8%) | 750 (52.6%) |
| 6 to 18 Years | 208 (7.2%) | 2,392 (82.4%) |
| 19 to 25 Years | 19 (1.3%) | 1,154 (77.8%) |
| 25 to 34 Years | 117 (5.9%) | 1,544 (77.9%) |
| 35 to 44 Years | 151 (6.2%) | 2,190 (90.0%) |
| 45 to 54 Years | 159 (6.9%) | 2,046 (88.9%) |
| 55 to 64 Years | 264 (18.4%) | 894 (62.2%) |
| 65 to 74 Years | 663 (98.7%) | 317 (47.2%) |
| 75 Years and over | 393 (100.0%) | 347 (88.3%) |
| Total | 2,442 (16.3%) | 11,634 (77.4%) |
Disability Status by Sex by Age in Royse City
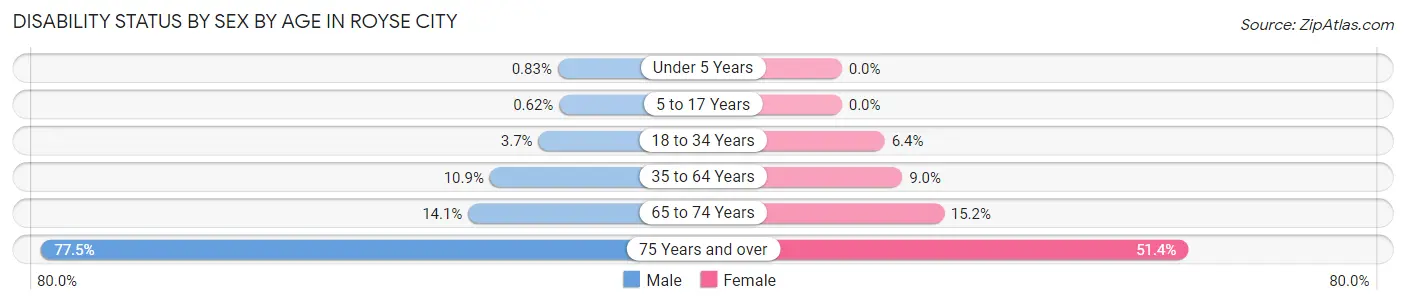
| Age Bracket | Male | Female |
| Under 5 Years | 5 (0.8%) | 0 (0.0%) |
| 5 to 17 Years | 7 (0.6%) | 0 (0.0%) |
| 18 to 34 Years | 54 (3.7%) | 150 (6.4%) |
| 35 to 64 Years | 369 (10.9%) | 251 (9.0%) |
| 65 to 74 Years | 39 (14.1%) | 60 (15.1%) |
| 75 Years and over | 169 (77.5%) | 90 (51.4%) |
Disability Class by Sex by Age in Royse City
Disability Class: Hearing Difficulty
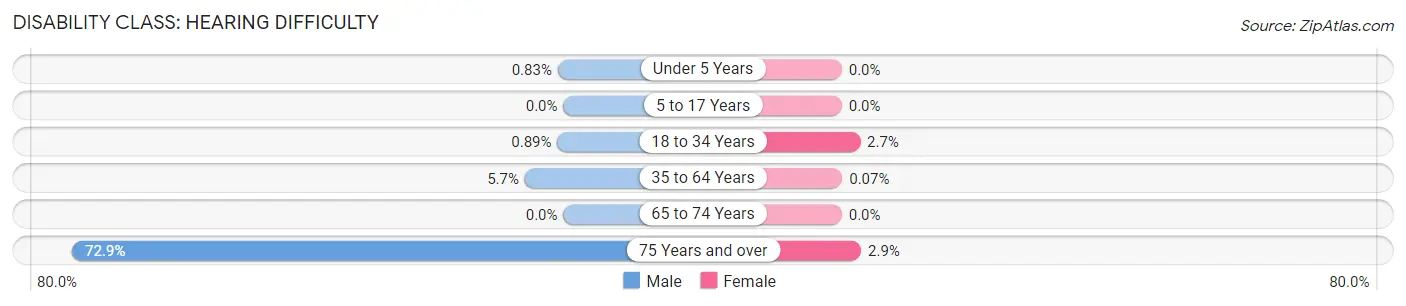
| Age Bracket | Male | Female |
| Under 5 Years | 5 (0.8%) | 0 (0.0%) |
| 5 to 17 Years | 0 (0.0%) | 0 (0.0%) |
| 18 to 34 Years | 13 (0.9%) | 64 (2.7%) |
| 35 to 64 Years | 193 (5.7%) | 2 (0.1%) |
| 65 to 74 Years | 0 (0.0%) | 0 (0.0%) |
| 75 Years and over | 159 (72.9%) | 5 (2.9%) |
Disability Class: Vision Difficulty
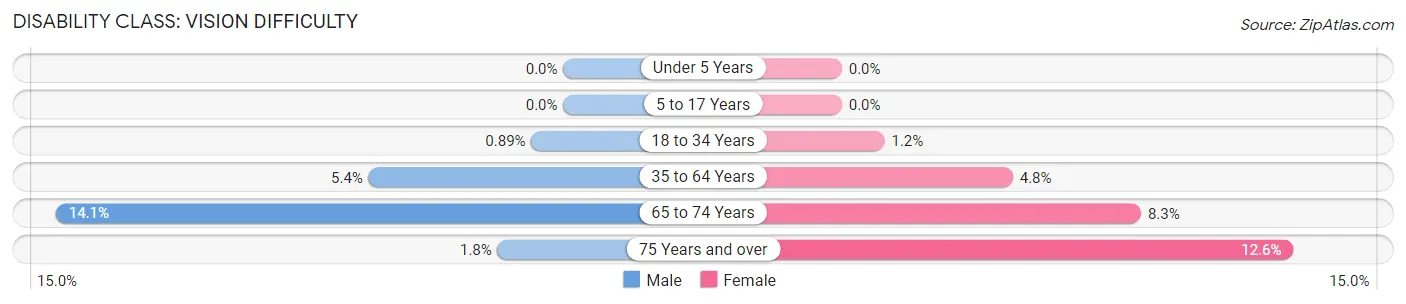
| Age Bracket | Male | Female |
| Under 5 Years | 0 (0.0%) | 0 (0.0%) |
| 5 to 17 Years | 0 (0.0%) | 0 (0.0%) |
| 18 to 34 Years | 13 (0.9%) | 28 (1.2%) |
| 35 to 64 Years | 183 (5.4%) | 133 (4.8%) |
| 65 to 74 Years | 39 (14.1%) | 33 (8.3%) |
| 75 Years and over | 4 (1.8%) | 22 (12.6%) |
Disability Class: Cognitive Difficulty
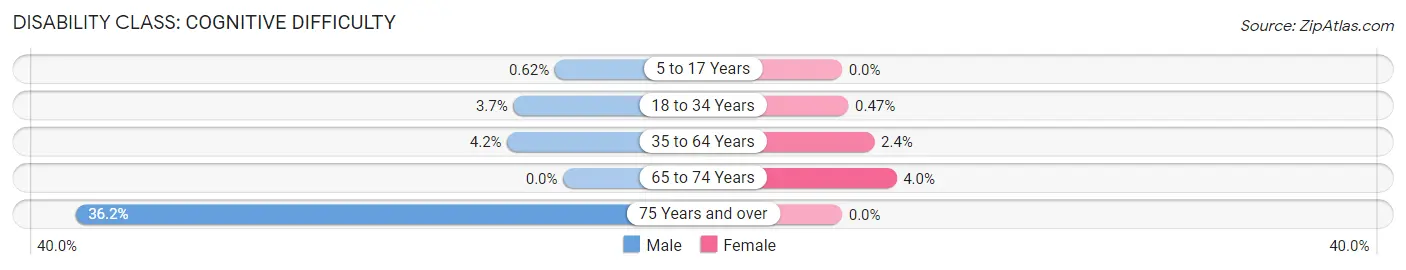
| Age Bracket | Male | Female |
| 5 to 17 Years | 7 (0.6%) | 0 (0.0%) |
| 18 to 34 Years | 54 (3.7%) | 11 (0.5%) |
| 35 to 64 Years | 140 (4.2%) | 67 (2.4%) |
| 65 to 74 Years | 0 (0.0%) | 16 (4.0%) |
| 75 Years and over | 79 (36.2%) | 0 (0.0%) |
Disability Class: Ambulatory Difficulty
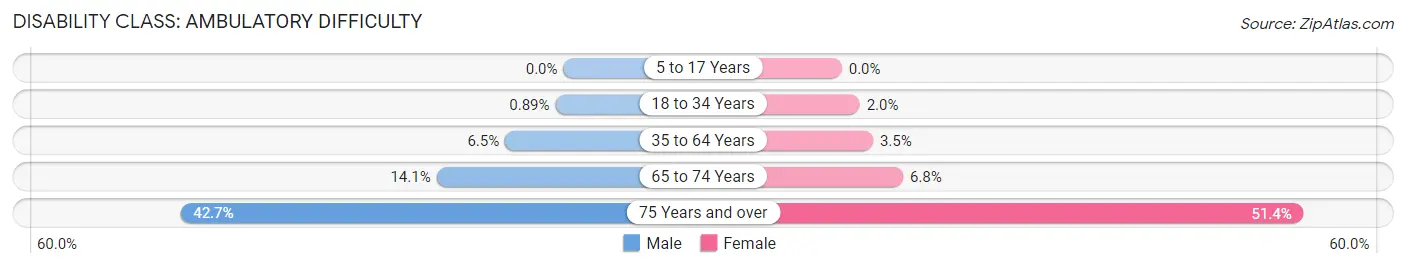
| Age Bracket | Male | Female |
| 5 to 17 Years | 0 (0.0%) | 0 (0.0%) |
| 18 to 34 Years | 13 (0.9%) | 47 (2.0%) |
| 35 to 64 Years | 219 (6.5%) | 97 (3.5%) |
| 65 to 74 Years | 39 (14.1%) | 27 (6.8%) |
| 75 Years and over | 93 (42.7%) | 90 (51.4%) |
Disability Class: Self-Care Difficulty
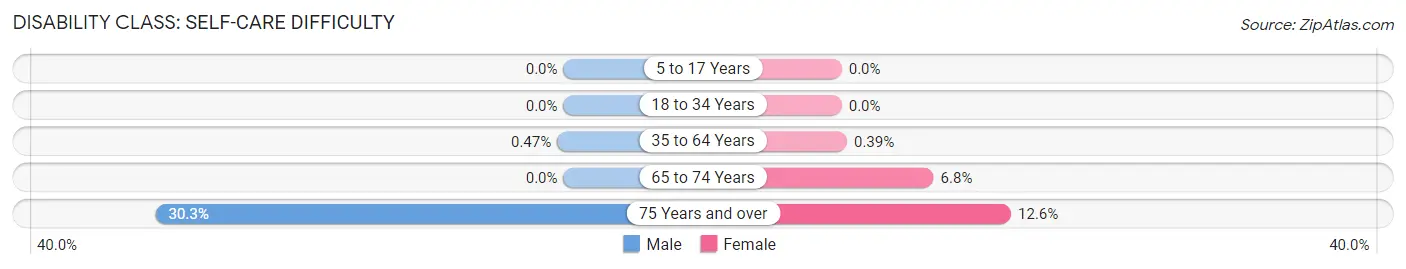
| Age Bracket | Male | Female |
| 5 to 17 Years | 0 (0.0%) | 0 (0.0%) |
| 18 to 34 Years | 0 (0.0%) | 0 (0.0%) |
| 35 to 64 Years | 16 (0.5%) | 11 (0.4%) |
| 65 to 74 Years | 0 (0.0%) | 27 (6.8%) |
| 75 Years and over | 66 (30.3%) | 22 (12.6%) |
Technology Access in Royse City
Computing Device Access in Royse City
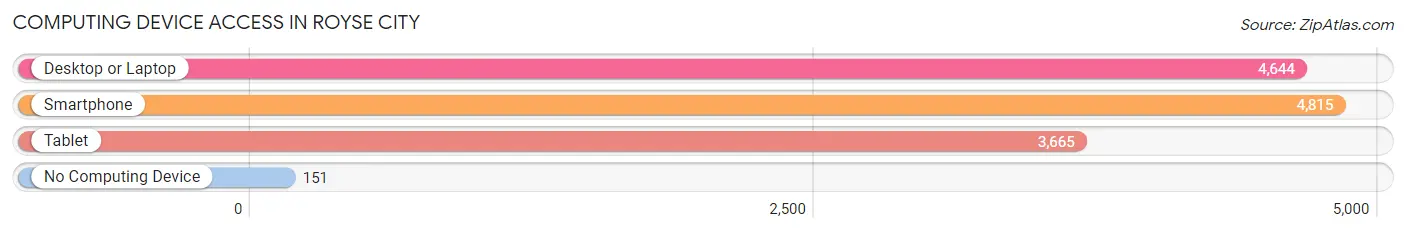
| Device Type | # Households | % Households |
| Desktop or Laptop | 4,644 | 89.2% |
| Smartphone | 4,815 | 92.4% |
| Tablet | 3,665 | 70.4% |
| No Computing Device | 151 | 2.9% |
| Total | 5,208 | 100.0% |
Internet Access in Royse City
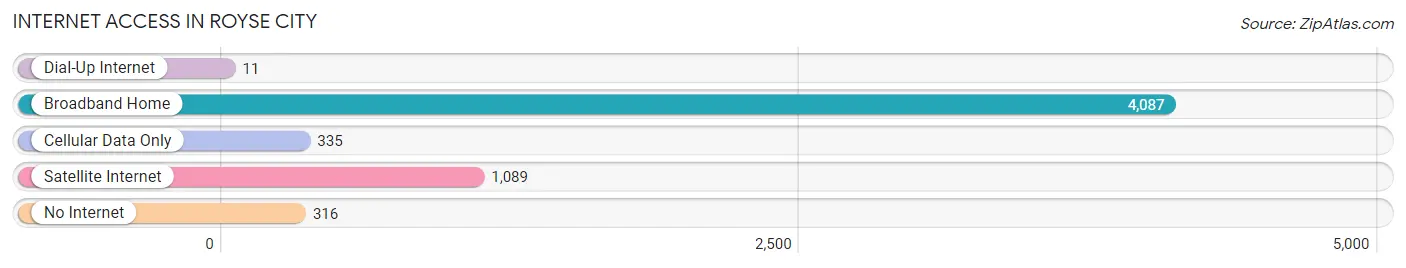
| Internet Type | # Households | % Households |
| Dial-Up Internet | 11 | 0.2% |
| Broadband Home | 4,087 | 78.5% |
| Cellular Data Only | 335 | 6.4% |
| Satellite Internet | 1,089 | 20.9% |
| No Internet | 316 | 6.1% |
| Total | 5,208 | 100.0% |
Royse City Summary
Introduction
Royse City is a city located in Rockwall and Collin counties in the U.S. state of Texas. It is a part of the Dallas-Fort Worth metroplex and is located about 30 miles northeast of Dallas. The city was founded in 1873 and has a population of about 13,000 people.
History
The area that is now Royse City was first settled in the 1840s by a group of settlers from Kentucky. The settlement was originally called "Kentucky Town" and was located near the present-day intersection of FM 548 and FM 2642. In 1873, the town was renamed Royse City after the first postmaster, William Royse.
The town grew slowly over the next few decades, but in the early 1900s, the population began to increase rapidly. This was due to the arrival of the St. Louis Southwestern Railway, which connected Royse City to the larger cities of Dallas and Fort Worth. The railroad also brought new businesses to the area, including a cotton gin, a grist mill, and a brick factory.
In the 1920s, Royse City experienced a period of growth and prosperity. The population increased from 1,000 to 2,000, and new businesses opened, including a bank, a hotel, and a movie theater. The city also built a new school and a new city hall.
In the 1950s, Royse City experienced a period of decline. The population decreased from 2,000 to 1,500, and many businesses closed. However, in the late 1970s, the city began to experience a period of growth and revitalization. New businesses opened, and the population increased to over 5,000.
Geography
Royse City is located in Rockwall and Collin counties in the U.S. state of Texas. It is part of the Dallas-Fort Worth metroplex and is located about 30 miles northeast of Dallas. The city has a total area of 8.3 square miles, of which 8.2 square miles is land and 0.1 square miles is water.
The city is located in the Blackland Prairie region of Texas, which is characterized by flat terrain and fertile soil. The city is located on the banks of the East Fork of the Trinity River, which provides a source of recreation for residents.
Economy
The economy of Royse City is largely based on agriculture and manufacturing. The city is home to several large farms, which produce cotton, corn, wheat, and other crops. The city is also home to several manufacturing companies, including a plastics manufacturer, a metal fabricator, and a food processing plant.
The city is also home to several retail stores, restaurants, and other businesses. The city is served by two major highways, Interstate 30 and U.S. Highway 80, which provide access to the larger cities of Dallas and Fort Worth.
Demographics
As of the 2010 census, the population of Royse City was 13,147. The racial makeup of the city was 79.3% White, 11.2% African American, 0.7% Native American, 0.7% Asian, 0.1% Pacific Islander, 5.7% from other races, and 2.2% from two or more races. Hispanic or Latino of any race were 16.2% of the population.
The median household income in Royse City was $50,945, and the median family income was $60,945. The per capita income was $22,945. About 11.2% of families and 14.2% of the population were below the poverty line, including 19.2% of those under age 18 and 8.2% of those age 65 or over.
Conclusion
Royse City is a city located in Rockwall and Collin counties in the U.S. state of Texas. It is a part of the Dallas-Fort Worth metroplex and is located about 30 miles northeast of Dallas. The city was founded in 1873 and has a population of about 13,000 people. The economy of Royse City is largely based on agriculture and manufacturing, and the city is served by two major highways, Interstate 30 and U.S. Highway 80. The racial makeup of the city is 79.3% White, 11.2% African American, 0.7% Native American, 0.7% Asian, 0.1% Pacific Islander, 5.7% from other races, and 2.2% from two or more races. The median household income in Royse City was $50,945, and the median family income was $60,945.
Common Questions
What is Per Capita Income in Royse City?
Per Capita income in Royse City is $40,668.
What is the Median Family Income in Royse City?
Median Family Income in Royse City is $113,375.
What is the Median Household income in Royse City?
Median Household Income in Royse City is $114,917.
What is Income or Wage Gap in Royse City?
Income or Wage Gap in Royse City is 27.1%.
Women in Royse City earn 72.9 cents for every dollar earned by a man.
What is Inequality or Gini Index in Royse City?
Inequality or Gini Index in Royse City is 0.29.
What is the Total Population of Royse City?
Total Population of Royse City is 15,051.
What is the Total Male Population of Royse City?
Total Male Population of Royse City is 7,070.
What is the Total Female Population of Royse City?
Total Female Population of Royse City is 7,981.
What is the Ratio of Males per 100 Females in Royse City?
There are 88.59 Males per 100 Females in Royse City.
What is the Ratio of Females per 100 Males in Royse City?
There are 112.89 Females per 100 Males in Royse City.
What is the Median Population Age in Royse City?
Median Population Age in Royse City is 33.6 Years.
What is the Average Family Size in Royse City
Average Family Size in Royse City is 3.2 People.
What is the Average Household Size in Royse City
Average Household Size in Royse City is 2.9 People.
How Large is the Labor Force in Royse City?
There are 8,540 People in the Labor Forcein in Royse City.
What is the Percentage of People in the Labor Force in Royse City?
75.7% of People are in the Labor Force in Royse City.
What is the Unemployment Rate in Royse City?
Unemployment Rate in Royse City is 1.0%.