Mountain Brook, AL Map & Demographics
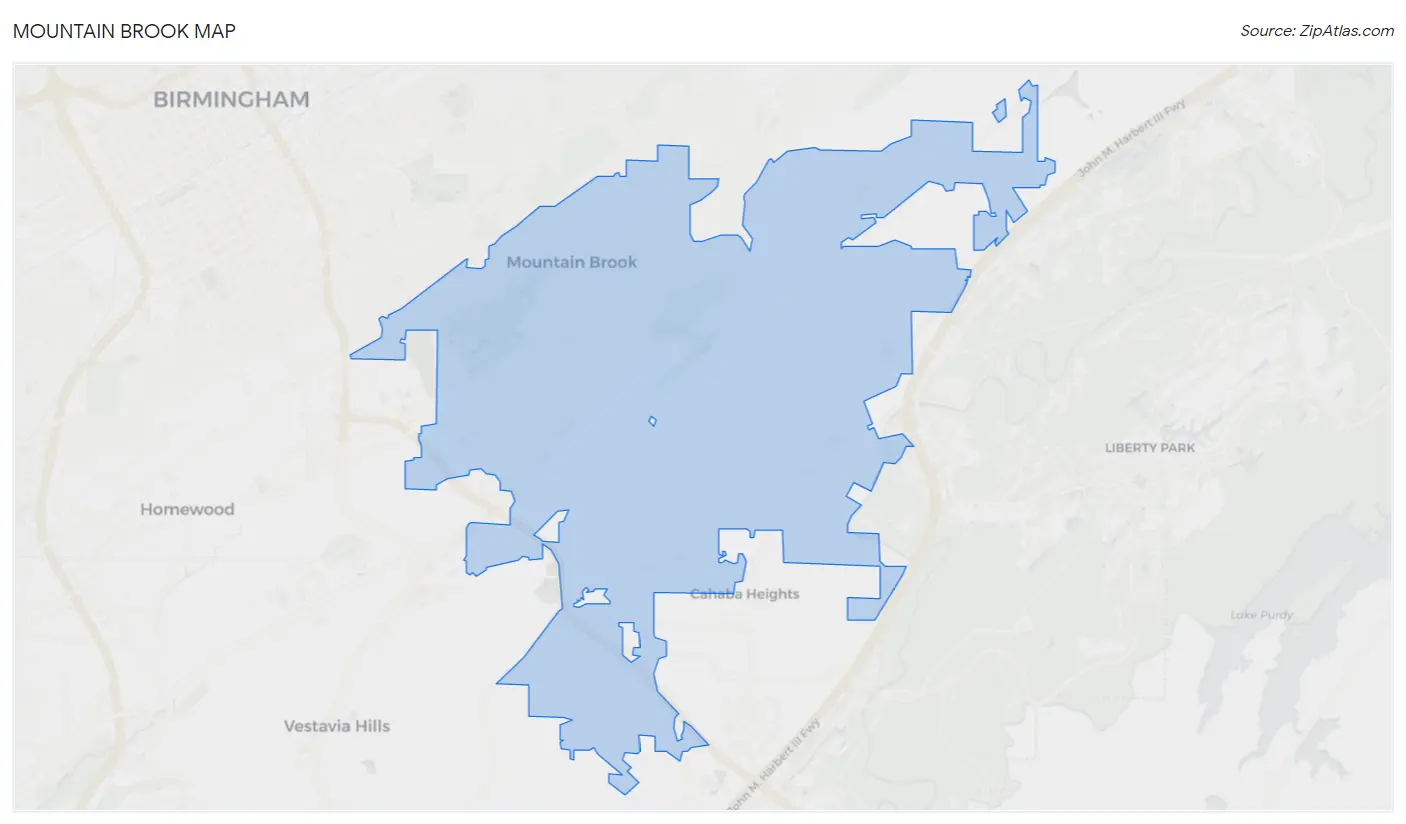
Mountain Brook Map
Mountain Brook Overview
$97,390
PER CAPITA INCOME
$206,417
AVG FAMILY INCOME
$167,007
AVG HOUSEHOLD INCOME
54.7%
WAGE / INCOME GAP [ % ]
45.3¢/ $1
WAGE / INCOME GAP [ $ ]
0.51
INEQUALITY / GINI INDEX
22,259
TOTAL POPULATION
10,705
MALE POPULATION
11,554
FEMALE POPULATION
92.65
MALES / 100 FEMALES
107.93
FEMALES / 100 MALES
41.1
MEDIAN AGE
3.2
AVG FAMILY SIZE
2.7
AVG HOUSEHOLD SIZE
9,989
LABOR FORCE [ PEOPLE ]
60.6%
PERCENT IN LABOR FORCE
0.9%
UNEMPLOYMENT RATE
Mountain Brook Area Codes
Income in Mountain Brook
Income Overview in Mountain Brook
Per Capita Income in Mountain Brook is $97,390, while median incomes of families and households are $206,417 and $167,007 respectively.
| Characteristic | Number | Measure |
| Per Capita Income | 22,259 | $97,390 |
| Median Family Income | 6,325 | $206,417 |
| Mean Family Income | 6,325 | $310,944 |
| Median Household Income | 8,230 | $167,007 |
| Mean Household Income | 8,230 | $267,337 |
| Income Deficit | 6,325 | $0 |
| Wage / Income Gap (%) | 22,259 | 54.73% |
| Wage / Income Gap ($) | 22,259 | 45.27¢ per $1 |
| Gini / Inequality Index | 22,259 | 0.51 |
Earnings by Sex in Mountain Brook
Average Earnings in Mountain Brook are $86,558, $119,595 for men and $54,136 for women, a difference of 54.7%.
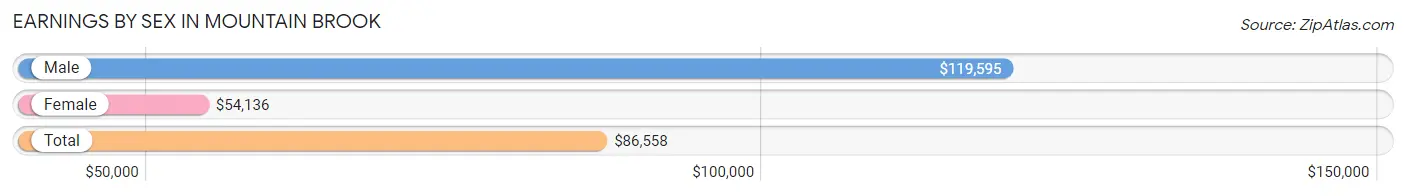
| Sex | Number | Average Earnings |
| Male | 6,014 (56.5%) | $119,595 |
| Female | 4,629 (43.5%) | $54,136 |
| Total | 10,643 (100.0%) | $86,558 |
Earnings by Sex by Income Bracket in Mountain Brook
The most common earnings brackets in Mountain Brook are $100,000+ for men (3,616 | 60.1%) and $100,000+ for women (1,019 | 22.0%).
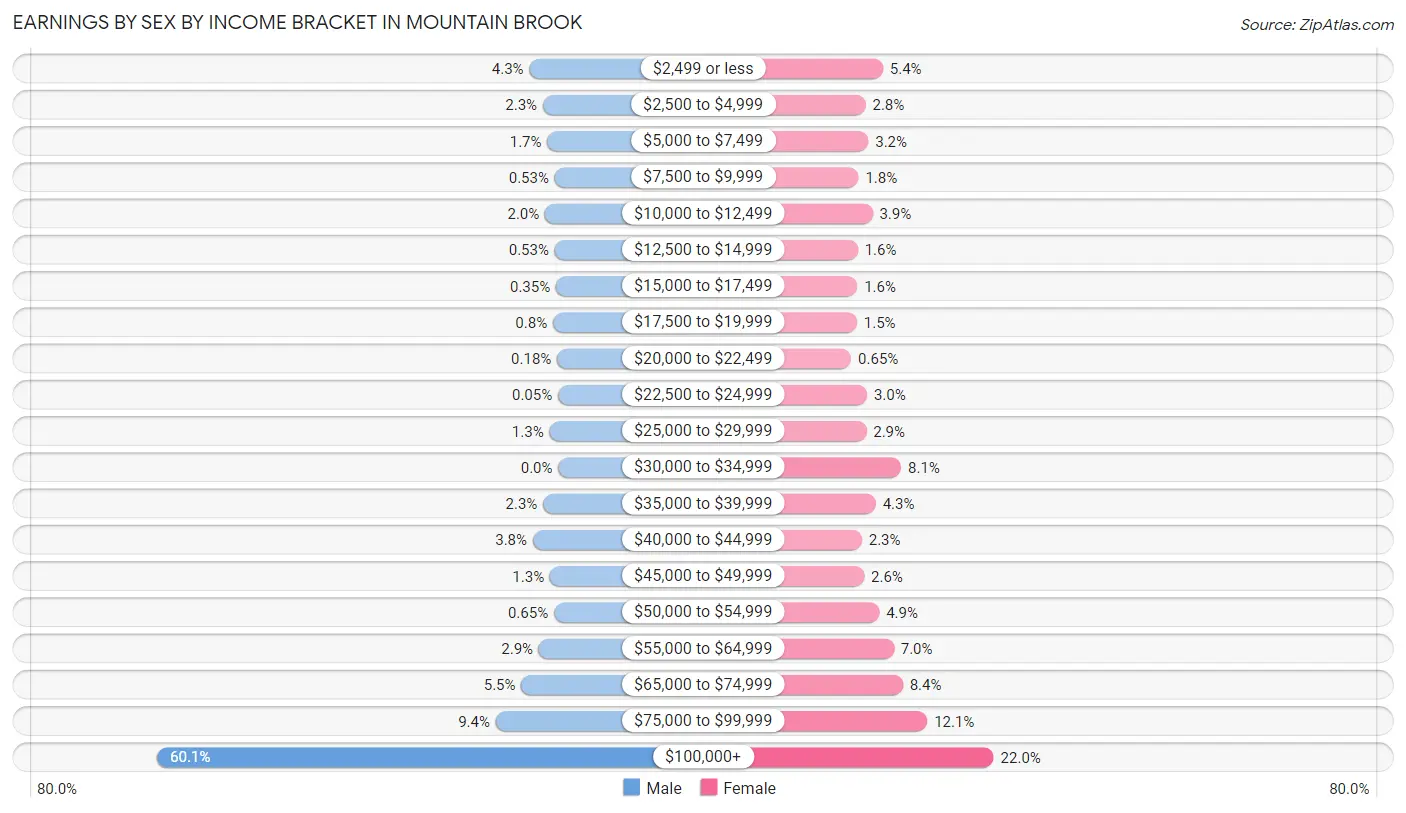
| Income | Male | Female |
| $2,499 or less | 261 (4.3%) | 250 (5.4%) |
| $2,500 to $4,999 | 139 (2.3%) | 130 (2.8%) |
| $5,000 to $7,499 | 99 (1.7%) | 149 (3.2%) |
| $7,500 to $9,999 | 32 (0.5%) | 81 (1.8%) |
| $10,000 to $12,499 | 119 (2.0%) | 178 (3.8%) |
| $12,500 to $14,999 | 32 (0.5%) | 76 (1.6%) |
| $15,000 to $17,499 | 21 (0.4%) | 72 (1.6%) |
| $17,500 to $19,999 | 48 (0.8%) | 70 (1.5%) |
| $20,000 to $22,499 | 11 (0.2%) | 30 (0.6%) |
| $22,500 to $24,999 | 3 (0.1%) | 140 (3.0%) |
| $25,000 to $29,999 | 80 (1.3%) | 135 (2.9%) |
| $30,000 to $34,999 | 0 (0.0%) | 377 (8.1%) |
| $35,000 to $39,999 | 137 (2.3%) | 201 (4.3%) |
| $40,000 to $44,999 | 230 (3.8%) | 104 (2.2%) |
| $45,000 to $49,999 | 75 (1.3%) | 120 (2.6%) |
| $50,000 to $54,999 | 39 (0.6%) | 225 (4.9%) |
| $55,000 to $64,999 | 175 (2.9%) | 326 (7.0%) |
| $65,000 to $74,999 | 333 (5.5%) | 388 (8.4%) |
| $75,000 to $99,999 | 564 (9.4%) | 558 (12.0%) |
| $100,000+ | 3,616 (60.1%) | 1,019 (22.0%) |
| Total | 6,014 (100.0%) | 4,629 (100.0%) |
Earnings by Sex by Educational Attainment in Mountain Brook
Average earnings in Mountain Brook are $138,230 for men and $58,804 for women, a difference of 57.5%. Men with an educational attainment of graduate degree enjoy the highest average annual earnings of $156,944, while those with college or associate's degree education earn the least with $40,521. Women with an educational attainment of graduate degree earn the most with the average annual earnings of $81,689, while those with college or associate's degree education have the smallest earnings of $43,063.
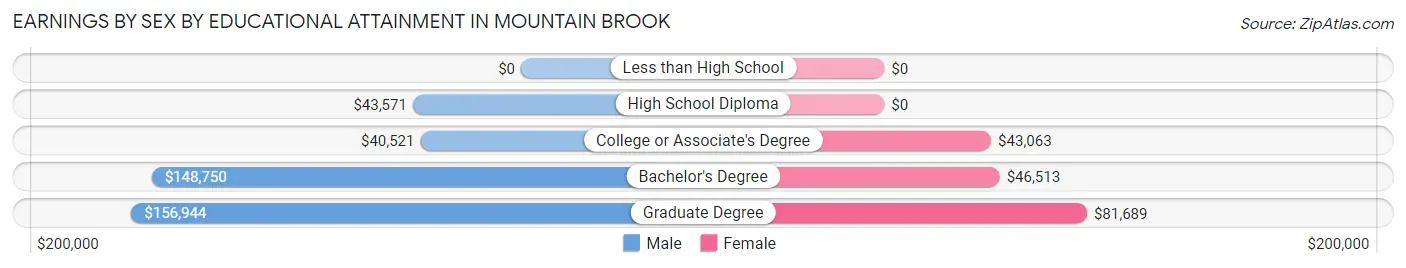
| Educational Attainment | Male Income | Female Income |
| Less than High School | - | - |
| High School Diploma | $43,571 | $0 |
| College or Associate's Degree | $40,521 | $43,063 |
| Bachelor's Degree | $148,750 | $46,513 |
| Graduate Degree | $156,944 | $81,689 |
| Total | $138,230 | $58,804 |
Family Income in Mountain Brook
Family Income Brackets in Mountain Brook
According to the Mountain Brook family income data, there are 3,276 families falling into the $200,000+ income range, which is the most common income bracket and makes up 51.8% of all families. Conversely, the $25,000 to $34,999 income bracket is the least frequent group with only 32 families (0.5%) belonging to this category.
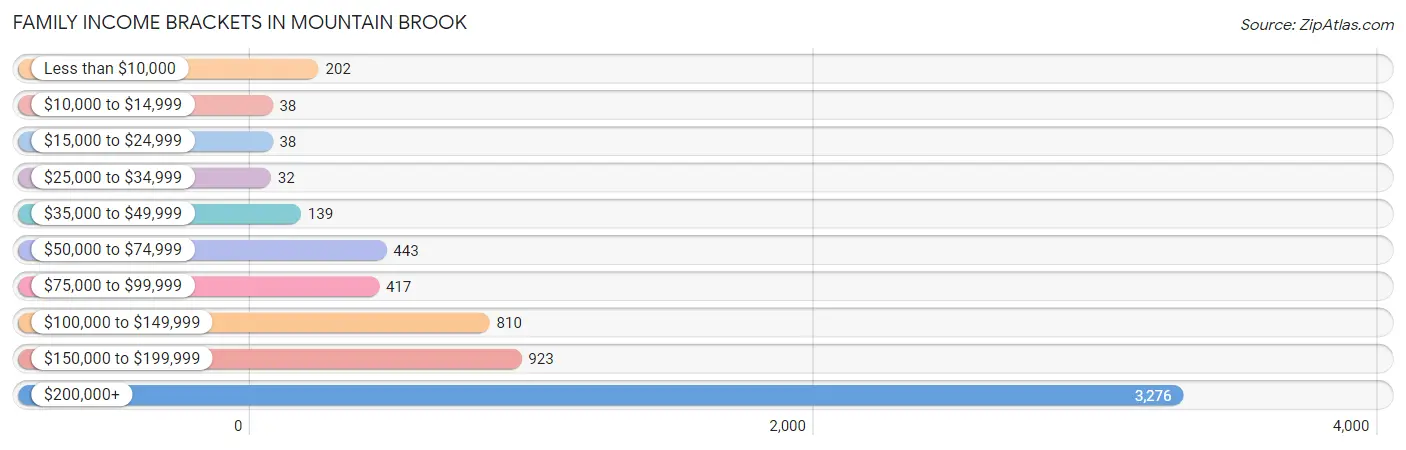
| Income Bracket | # Families | % Families |
| Less than $10,000 | 202 | 3.2% |
| $10,000 to $14,999 | 38 | 0.6% |
| $15,000 to $24,999 | 38 | 0.6% |
| $25,000 to $34,999 | 32 | 0.5% |
| $35,000 to $49,999 | 139 | 2.2% |
| $50,000 to $74,999 | 443 | 7.0% |
| $75,000 to $99,999 | 417 | 6.6% |
| $100,000 to $149,999 | 810 | 12.8% |
| $150,000 to $199,999 | 923 | 14.6% |
| $200,000+ | 3,276 | 51.8% |
Family Income by Famaliy Size in Mountain Brook
4-person families (1,684 | 26.6%) account for the highest median family income in Mountain Brook with $250,001 per family, while 2-person families (2,506 | 39.6%) have the highest median income of $83,500 per family member.
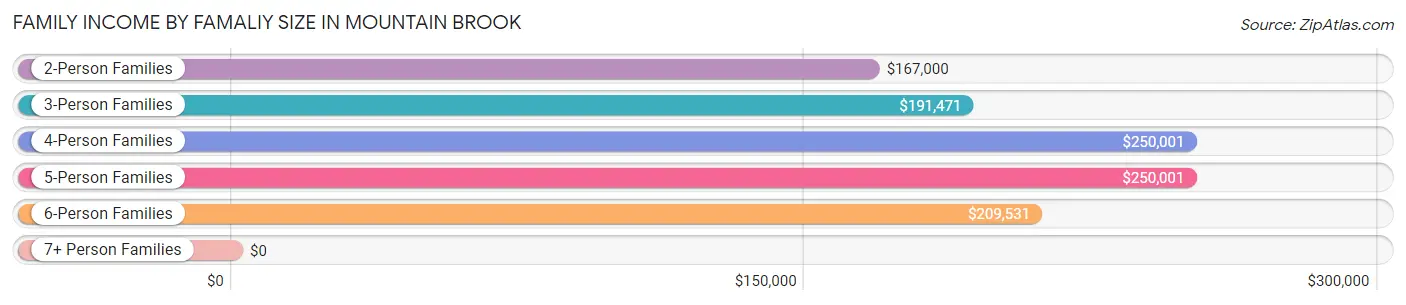
| Income Bracket | # Families | Median Income |
| 2-Person Families | 2,506 (39.6%) | $167,000 |
| 3-Person Families | 1,278 (20.2%) | $191,471 |
| 4-Person Families | 1,684 (26.6%) | $250,001 |
| 5-Person Families | 694 (11.0%) | $250,001 |
| 6-Person Families | 108 (1.7%) | $209,531 |
| 7+ Person Families | 55 (0.9%) | $0 |
| Total | 6,325 (100.0%) | $206,417 |
Family Income by Number of Earners in Mountain Brook
The median family income in Mountain Brook is $206,417, with families comprising 2 earners (2,635) having the highest median family income of $244,902, while families with no earners (845) have the lowest median family income of $67,375, accounting for 41.7% and 13.4% of families, respectively.
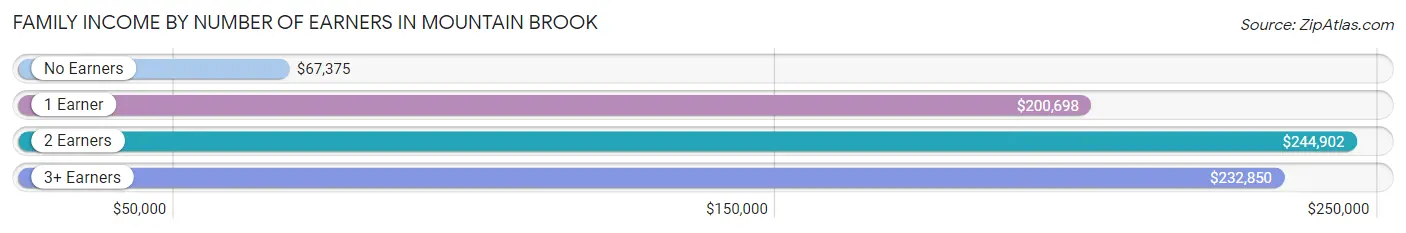
| Number of Earners | # Families | Median Income |
| No Earners | 845 (13.4%) | $67,375 |
| 1 Earner | 2,420 (38.3%) | $200,698 |
| 2 Earners | 2,635 (41.7%) | $244,902 |
| 3+ Earners | 425 (6.7%) | $232,850 |
| Total | 6,325 (100.0%) | $206,417 |
Household Income in Mountain Brook
Household Income Brackets in Mountain Brook
With 3,465 households falling in the category, the $200,000+ income range is the most frequent in Mountain Brook, accounting for 42.1% of all households. In contrast, only 107 households (1.3%) fall into the $25,000 to $34,999 income bracket, making it the least populous group.
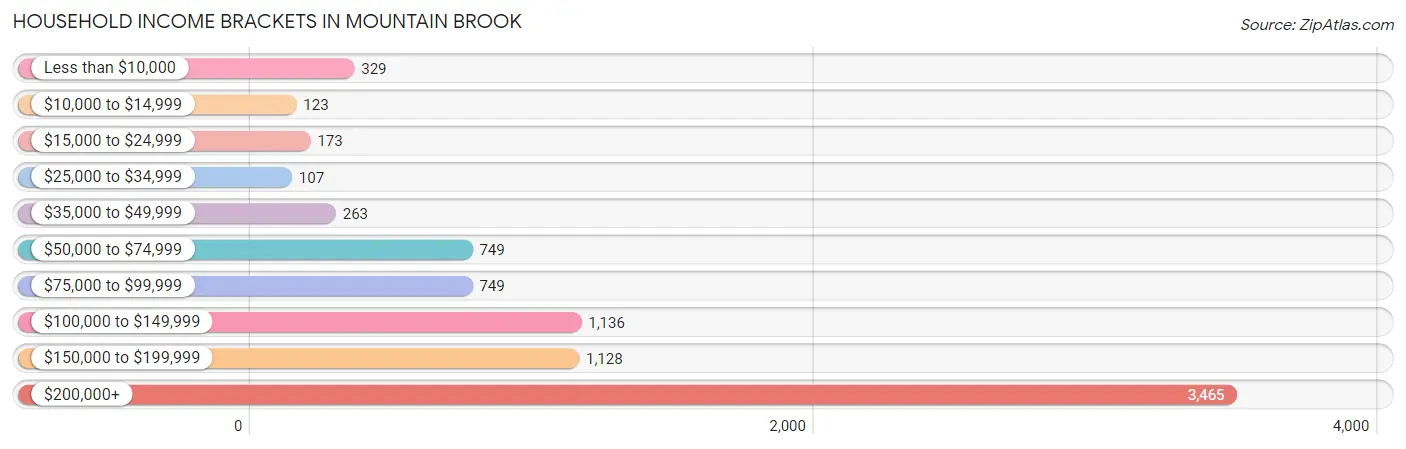
| Income Bracket | # Households | % Households |
| Less than $10,000 | 329 | 4.0% |
| $10,000 to $14,999 | 123 | 1.5% |
| $15,000 to $24,999 | 173 | 2.1% |
| $25,000 to $34,999 | 107 | 1.3% |
| $35,000 to $49,999 | 263 | 3.2% |
| $50,000 to $74,999 | 749 | 9.1% |
| $75,000 to $99,999 | 749 | 9.1% |
| $100,000 to $149,999 | 1,136 | 13.8% |
| $150,000 to $199,999 | 1,128 | 13.7% |
| $200,000+ | 3,465 | 42.1% |
Household Income by Householder Age in Mountain Brook
The median household income in Mountain Brook is $167,007, with the highest median household income of $228,636 found in the 45 to 64 years age bracket for the primary householder. A total of 3,276 households (39.8%) fall into this category. Meanwhile, the 15 to 24 years age bracket for the primary householder has the lowest median household income of $55,100, with 154 households (1.9%) in this group.
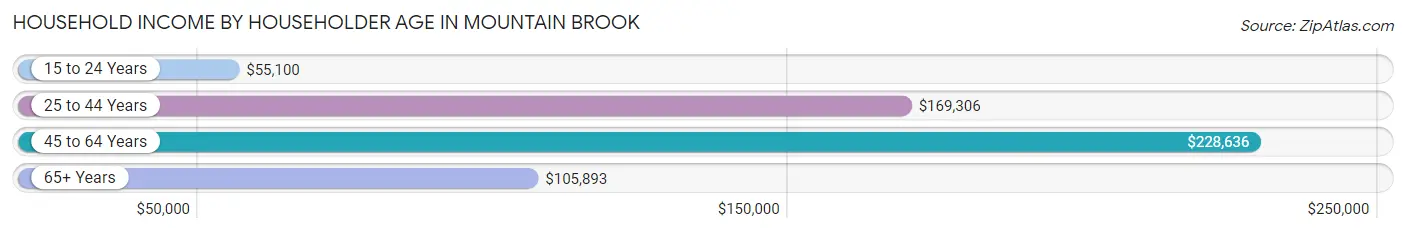
| Income Bracket | # Households | Median Income |
| 15 to 24 Years | 154 (1.9%) | $55,100 |
| 25 to 44 Years | 2,415 (29.3%) | $169,306 |
| 45 to 64 Years | 3,276 (39.8%) | $228,636 |
| 65+ Years | 2,385 (29.0%) | $105,893 |
| Total | 8,230 (100.0%) | $167,007 |
Poverty in Mountain Brook
Income Below Poverty by Sex and Age in Mountain Brook
With 2.7% poverty level for males and 3.8% for females among the residents of Mountain Brook, 65 to 74 year old males and 18 to 24 year old females are the most vulnerable to poverty, with 197 males (15.1%) and 55 females (12.1%) in their respective age groups living below the poverty level.
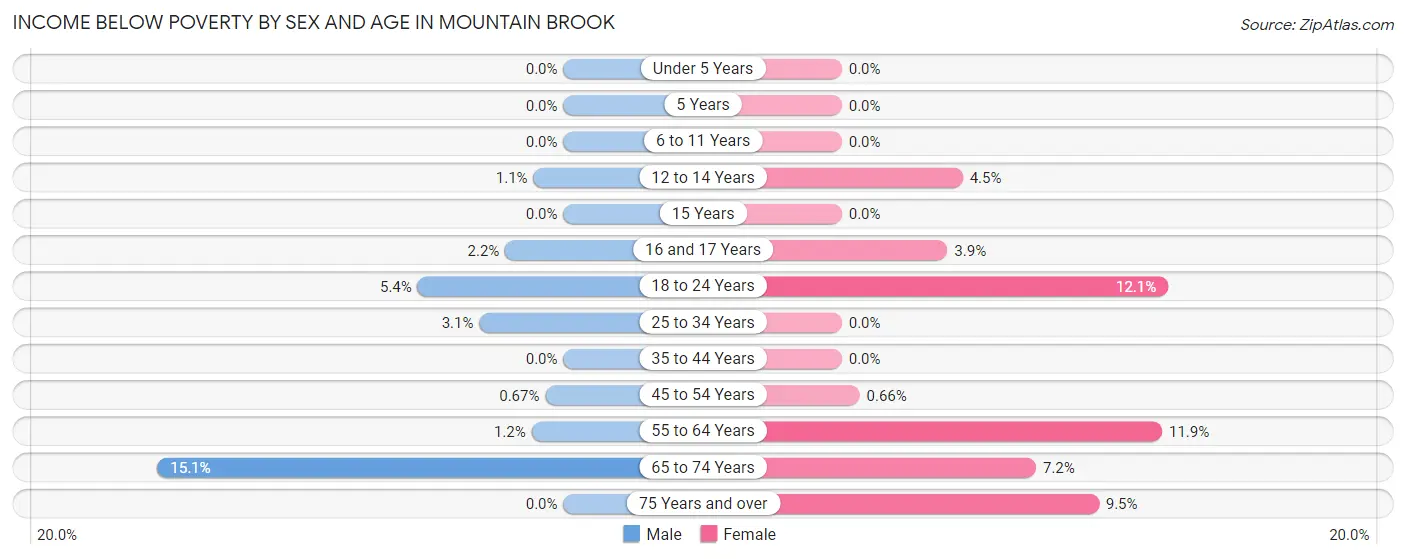
| Age Bracket | Male | Female |
| Under 5 Years | 0 (0.0%) | 0 (0.0%) |
| 5 Years | 0 (0.0%) | 0 (0.0%) |
| 6 to 11 Years | 0 (0.0%) | 0 (0.0%) |
| 12 to 14 Years | 7 (1.1%) | 21 (4.5%) |
| 15 Years | 0 (0.0%) | 0 (0.0%) |
| 16 and 17 Years | 10 (2.2%) | 10 (3.9%) |
| 18 to 24 Years | 27 (5.4%) | 55 (12.1%) |
| 25 to 34 Years | 25 (3.1%) | 0 (0.0%) |
| 35 to 44 Years | 0 (0.0%) | 0 (0.0%) |
| 45 to 54 Years | 11 (0.7%) | 11 (0.7%) |
| 55 to 64 Years | 15 (1.2%) | 174 (11.9%) |
| 65 to 74 Years | 197 (15.1%) | 88 (7.2%) |
| 75 Years and over | 0 (0.0%) | 80 (9.5%) |
| Total | 292 (2.7%) | 439 (3.8%) |
Income Above Poverty by Sex and Age in Mountain Brook
According to the poverty statistics in Mountain Brook, males aged under 5 years and females aged under 5 years are the age groups that are most secure financially, with 100.0% of males and 100.0% of females in these age groups living above the poverty line.
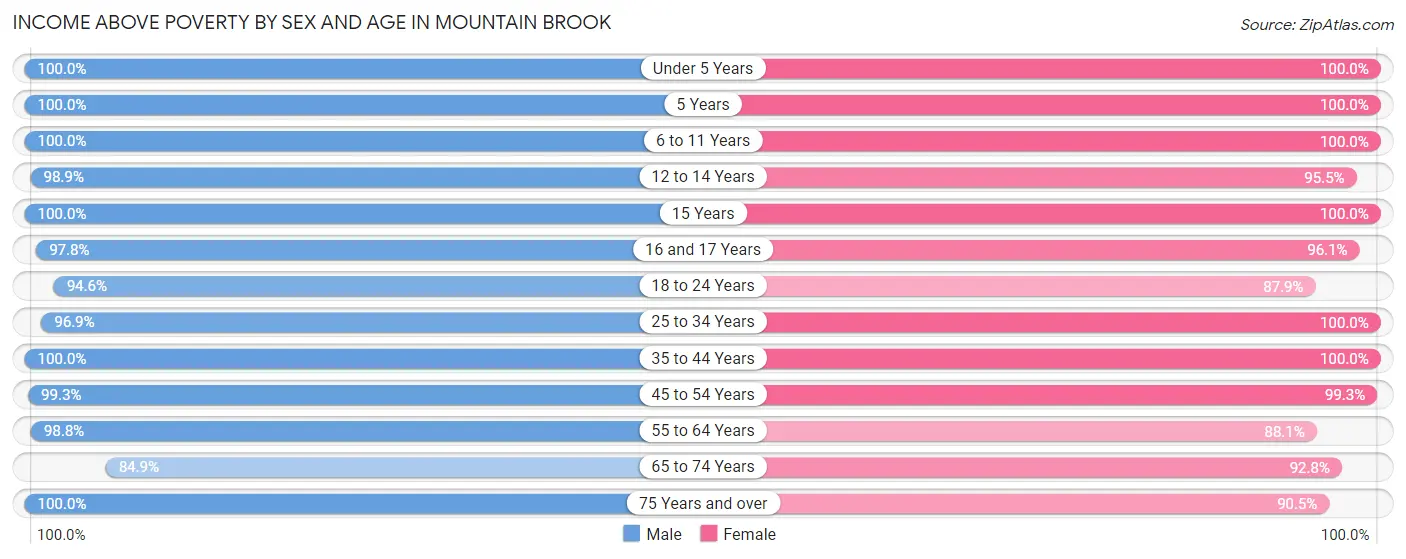
| Age Bracket | Male | Female |
| Under 5 Years | 848 (100.0%) | 956 (100.0%) |
| 5 Years | 135 (100.0%) | 216 (100.0%) |
| 6 to 11 Years | 1,202 (100.0%) | 980 (100.0%) |
| 12 to 14 Years | 624 (98.9%) | 447 (95.5%) |
| 15 Years | 152 (100.0%) | 187 (100.0%) |
| 16 and 17 Years | 452 (97.8%) | 245 (96.1%) |
| 18 to 24 Years | 472 (94.6%) | 399 (87.9%) |
| 25 to 34 Years | 776 (96.9%) | 1,224 (100.0%) |
| 35 to 44 Years | 1,275 (100.0%) | 1,616 (100.0%) |
| 45 to 54 Years | 1,637 (99.3%) | 1,645 (99.3%) |
| 55 to 64 Years | 1,255 (98.8%) | 1,289 (88.1%) |
| 65 to 74 Years | 1,110 (84.9%) | 1,133 (92.8%) |
| 75 Years and over | 475 (100.0%) | 759 (90.5%) |
| Total | 10,413 (97.3%) | 11,096 (96.2%) |
Income Below Poverty Among Married-Couple Families in Mountain Brook
The poverty statistics for married-couple families in Mountain Brook show that 3.2% or 187 of the total 5,938 families live below the poverty line. Families with no children have the highest poverty rate of 6.7%, comprising of 176 families. On the other hand, families with 1 or 2 children have the lowest poverty rate of 0.0%, which includes 0 families.
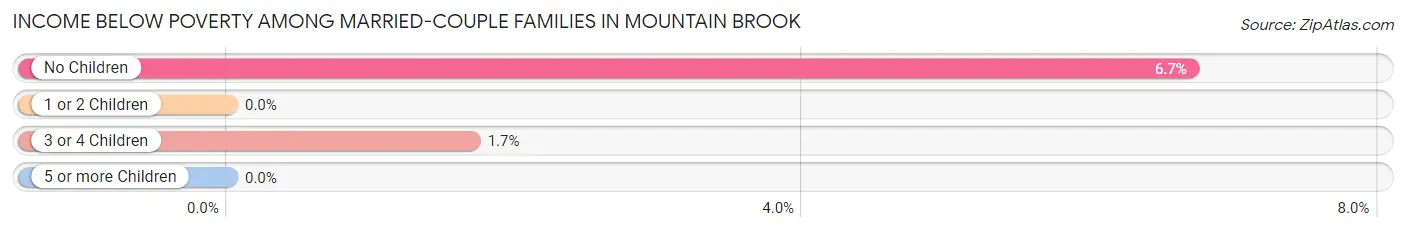
| Children | Above Poverty | Below Poverty |
| No Children | 2,453 (93.3%) | 176 (6.7%) |
| 1 or 2 Children | 2,603 (100.0%) | 0 (0.0%) |
| 3 or 4 Children | 640 (98.3%) | 11 (1.7%) |
| 5 or more Children | 55 (100.0%) | 0 (0.0%) |
| Total | 5,751 (96.9%) | 187 (3.2%) |
Income Below Poverty Among Single-Parent Households in Mountain Brook
According to the poverty data in Mountain Brook, 19.4% or 6 single-father households and 14.6% or 52 single-mother households are living below the poverty line. Among single-father households, those with 1 or 2 children have the highest poverty rate, with 6 households (31.6%) experiencing poverty. Likewise, among single-mother households, those with no children have the highest poverty rate, with 52 households (28.3%) falling below the poverty line.
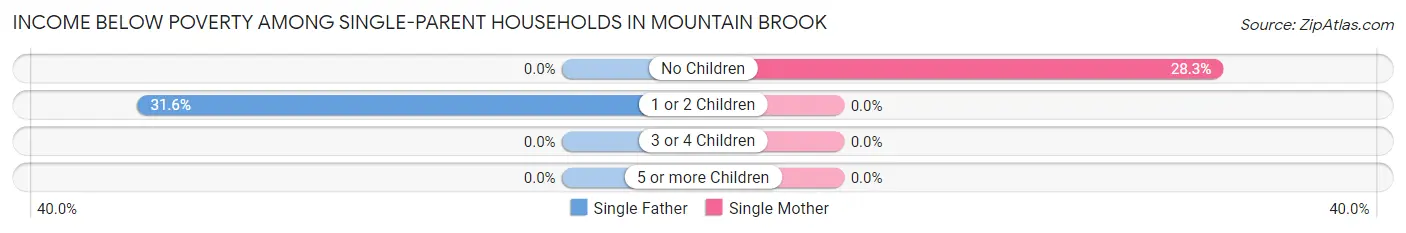
| Children | Single Father | Single Mother |
| No Children | 0 (0.0%) | 52 (28.3%) |
| 1 or 2 Children | 6 (31.6%) | 0 (0.0%) |
| 3 or 4 Children | 0 (0.0%) | 0 (0.0%) |
| 5 or more Children | 0 (0.0%) | 0 (0.0%) |
| Total | 6 (19.4%) | 52 (14.6%) |
Income Below Poverty Among Married-Couple vs Single-Parent Households in Mountain Brook
The poverty data for Mountain Brook shows that 187 of the married-couple family households (3.2%) and 58 of the single-parent households (15.0%) are living below the poverty level. Within the married-couple family households, those with no children have the highest poverty rate, with 176 households (6.7%) falling below the poverty line. Among the single-parent households, those with no children have the highest poverty rate, with 52 household (26.5%) living below poverty.
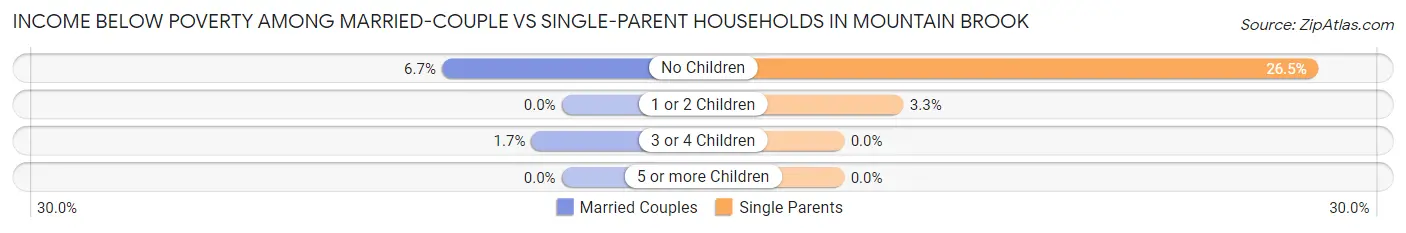
| Children | Married-Couple Families | Single-Parent Households |
| No Children | 176 (6.7%) | 52 (26.5%) |
| 1 or 2 Children | 0 (0.0%) | 6 (3.3%) |
| 3 or 4 Children | 11 (1.7%) | 0 (0.0%) |
| 5 or more Children | 0 (0.0%) | 0 (0.0%) |
| Total | 187 (3.2%) | 58 (15.0%) |
Race in Mountain Brook
The most populous races in Mountain Brook are White / Caucasian (21,736 | 97.7%), Asian (217 | 1.0%), and Two or more Races (182 | 0.8%).
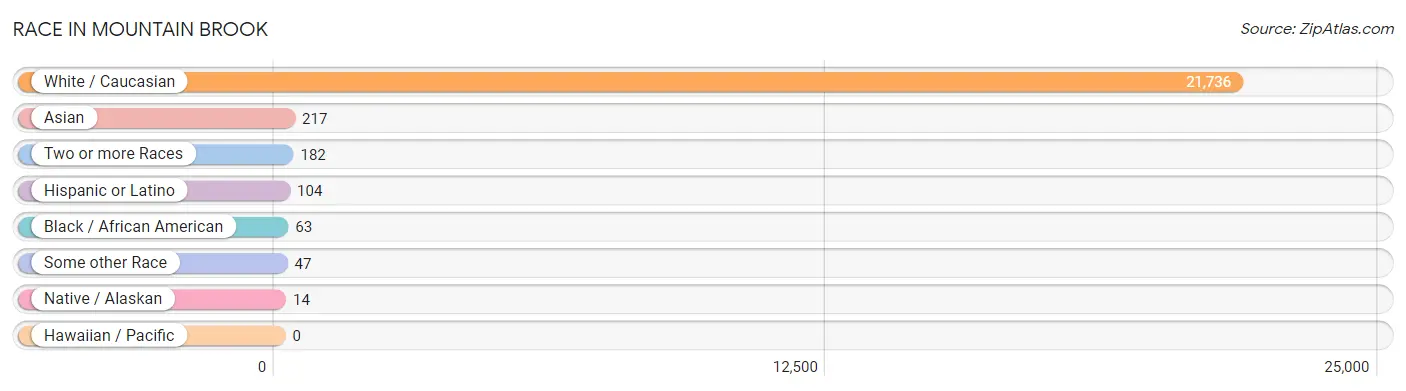
| Race | # Population | % Population |
| Asian | 217 | 1.0% |
| Black / African American | 63 | 0.3% |
| Hawaiian / Pacific | 0 | 0.0% |
| Hispanic or Latino | 104 | 0.5% |
| Native / Alaskan | 14 | 0.1% |
| White / Caucasian | 21,736 | 97.7% |
| Two or more Races | 182 | 0.8% |
| Some other Race | 47 | 0.2% |
| Total | 22,259 | 100.0% |
Ancestry in Mountain Brook
The most populous ancestries reported in Mountain Brook are English (5,840 | 26.2%), American (2,873 | 12.9%), Irish (2,397 | 10.8%), German (1,927 | 8.7%), and Scottish (1,479 | 6.6%), together accounting for 65.2% of all Mountain Brook residents.
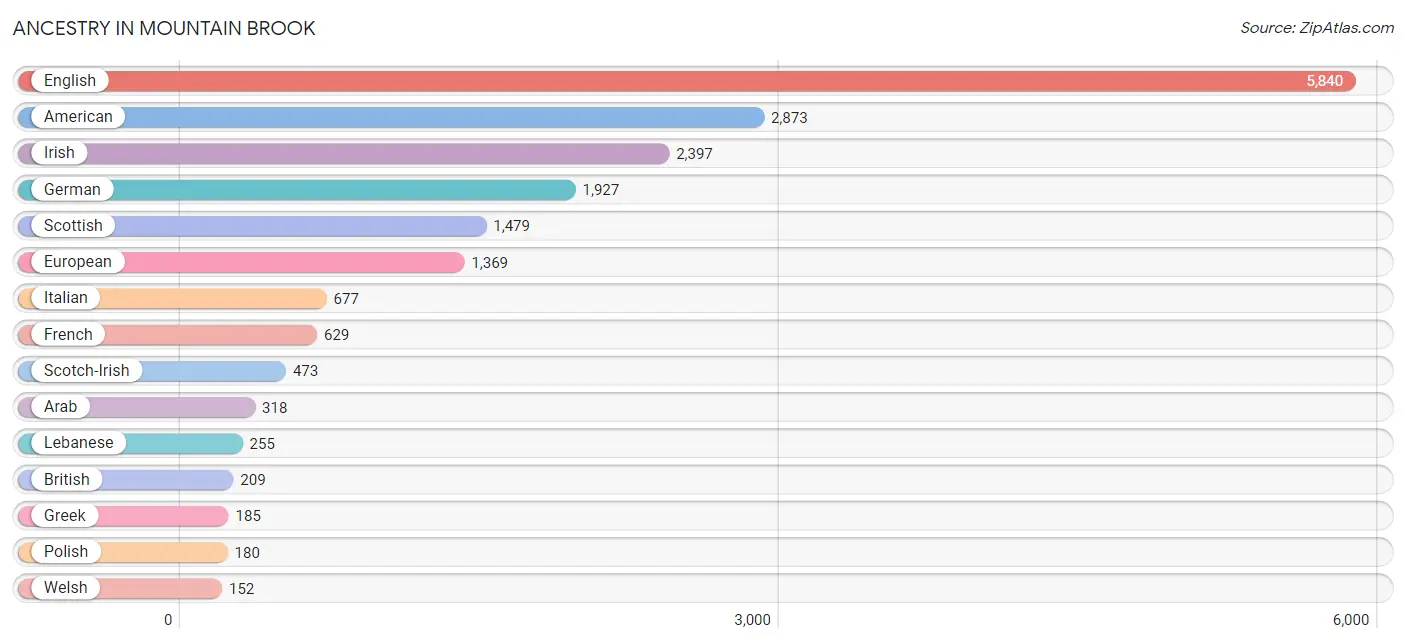
| Ancestry | # Population | % Population |
| Albanian | 10 | 0.0% |
| American | 2,873 | 12.9% |
| Arab | 318 | 1.4% |
| Australian | 14 | 0.1% |
| Austrian | 30 | 0.1% |
| Bhutanese | 15 | 0.1% |
| Brazilian | 45 | 0.2% |
| British | 209 | 0.9% |
| Canadian | 21 | 0.1% |
| Celtic | 26 | 0.1% |
| Central American | 57 | 0.3% |
| Central American Indian | 51 | 0.2% |
| Cherokee | 14 | 0.1% |
| Chilean | 14 | 0.1% |
| Czech | 5 | 0.0% |
| Czechoslovakian | 52 | 0.2% |
| Danish | 33 | 0.2% |
| Dutch | 100 | 0.4% |
| Eastern European | 136 | 0.6% |
| English | 5,840 | 26.2% |
| European | 1,369 | 6.1% |
| Finnish | 8 | 0.0% |
| French | 629 | 2.8% |
| German | 1,927 | 8.7% |
| Greek | 185 | 0.8% |
| Guatemalan | 51 | 0.2% |
| Hungarian | 105 | 0.5% |
| Indian (Asian) | 101 | 0.4% |
| Iranian | 38 | 0.2% |
| Irish | 2,397 | 10.8% |
| Italian | 677 | 3.0% |
| Korean | 25 | 0.1% |
| Lebanese | 255 | 1.1% |
| Lithuanian | 74 | 0.3% |
| Mexican | 16 | 0.1% |
| Nicaraguan | 6 | 0.0% |
| Northern European | 88 | 0.4% |
| Norwegian | 58 | 0.3% |
| Palestinian | 30 | 0.1% |
| Polish | 180 | 0.8% |
| Portuguese | 4 | 0.0% |
| Puerto Rican | 12 | 0.1% |
| Romanian | 7 | 0.0% |
| Russian | 142 | 0.6% |
| Scandinavian | 24 | 0.1% |
| Scotch-Irish | 473 | 2.1% |
| Scottish | 1,479 | 6.6% |
| Slovak | 19 | 0.1% |
| South American | 14 | 0.1% |
| South American Indian | 51 | 0.2% |
| Spanish | 4 | 0.0% |
| Swedish | 65 | 0.3% |
| Swiss | 143 | 0.6% |
| Thai | 131 | 0.6% |
| Ukrainian | 14 | 0.1% |
| Welsh | 152 | 0.7% | View All 56 Rows |
Immigrants in Mountain Brook
The most numerous immigrant groups reported in Mountain Brook came from Asia (166 | 0.7%), Europe (153 | 0.7%), India (101 | 0.4%), South Central Asia (101 | 0.4%), and Northern Europe (95 | 0.4%), together accounting for 2.8% of all Mountain Brook residents.
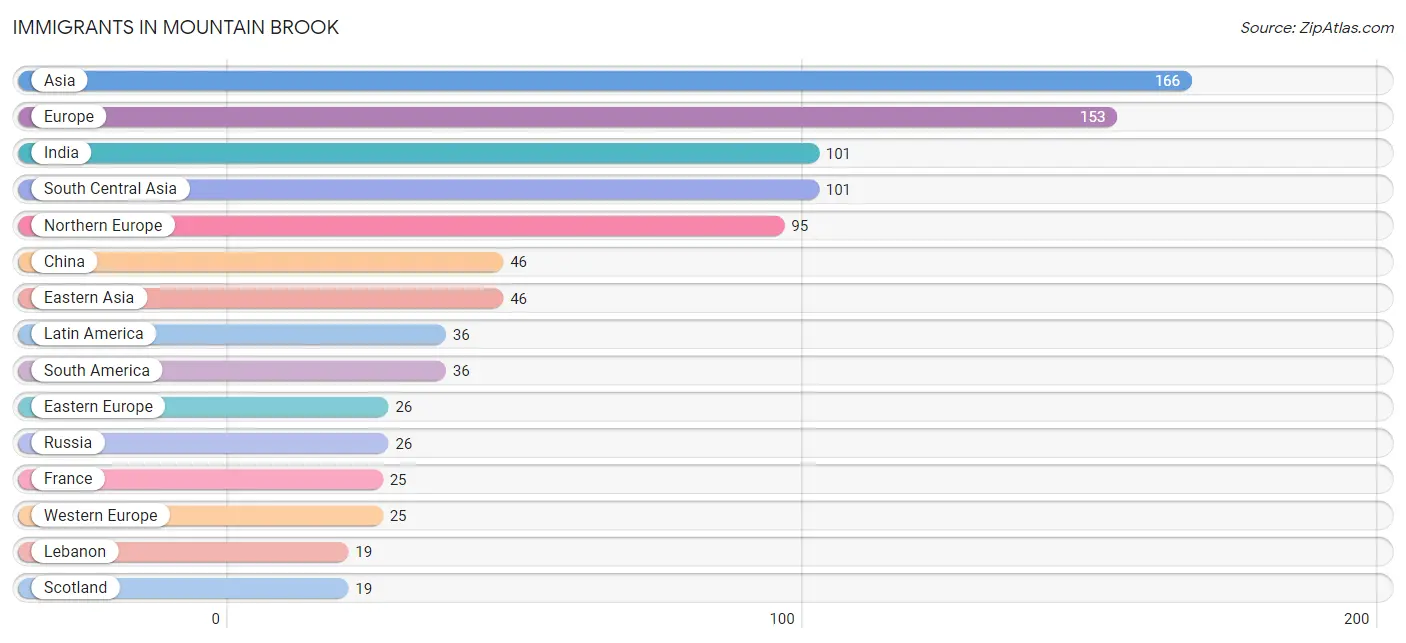
| Immigration Origin | # Population | % Population |
| Africa | 17 | 0.1% |
| Argentina | 13 | 0.1% |
| Asia | 166 | 0.7% |
| Brazil | 17 | 0.1% |
| Chile | 6 | 0.0% |
| China | 46 | 0.2% |
| Eastern Asia | 46 | 0.2% |
| Eastern Europe | 26 | 0.1% |
| England | 15 | 0.1% |
| Europe | 153 | 0.7% |
| France | 25 | 0.1% |
| India | 101 | 0.4% |
| Latin America | 36 | 0.2% |
| Lebanon | 19 | 0.1% |
| Northern Europe | 95 | 0.4% |
| Russia | 26 | 0.1% |
| Scotland | 19 | 0.1% |
| Sierra Leone | 17 | 0.1% |
| South America | 36 | 0.2% |
| South Central Asia | 101 | 0.4% |
| Southern Europe | 7 | 0.0% |
| Spain | 7 | 0.0% |
| Western Africa | 17 | 0.1% |
| Western Asia | 19 | 0.1% |
| Western Europe | 25 | 0.1% | View All 25 Rows |
Sex and Age in Mountain Brook
Sex and Age in Mountain Brook
The most populous age groups in Mountain Brook are 10 to 14 Years (1,034 | 9.7%) for men and 5 to 9 Years (985 | 8.5%) for women.
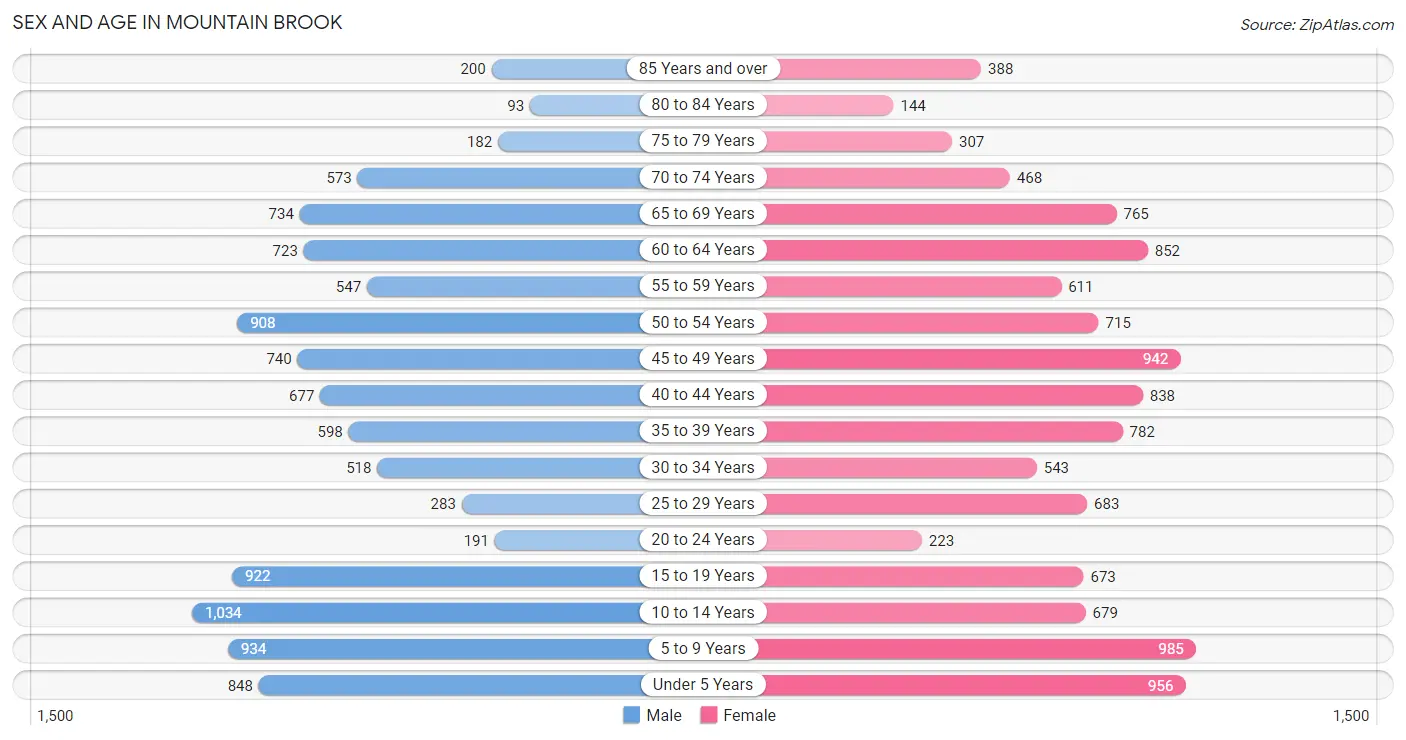
| Age Bracket | Male | Female |
| Under 5 Years | 848 (7.9%) | 956 (8.3%) |
| 5 to 9 Years | 934 (8.7%) | 985 (8.5%) |
| 10 to 14 Years | 1,034 (9.7%) | 679 (5.9%) |
| 15 to 19 Years | 922 (8.6%) | 673 (5.8%) |
| 20 to 24 Years | 191 (1.8%) | 223 (1.9%) |
| 25 to 29 Years | 283 (2.6%) | 683 (5.9%) |
| 30 to 34 Years | 518 (4.8%) | 543 (4.7%) |
| 35 to 39 Years | 598 (5.6%) | 782 (6.8%) |
| 40 to 44 Years | 677 (6.3%) | 838 (7.2%) |
| 45 to 49 Years | 740 (6.9%) | 942 (8.2%) |
| 50 to 54 Years | 908 (8.5%) | 715 (6.2%) |
| 55 to 59 Years | 547 (5.1%) | 611 (5.3%) |
| 60 to 64 Years | 723 (6.8%) | 852 (7.4%) |
| 65 to 69 Years | 734 (6.9%) | 765 (6.6%) |
| 70 to 74 Years | 573 (5.3%) | 468 (4.1%) |
| 75 to 79 Years | 182 (1.7%) | 307 (2.7%) |
| 80 to 84 Years | 93 (0.9%) | 144 (1.3%) |
| 85 Years and over | 200 (1.9%) | 388 (3.4%) |
| Total | 10,705 (100.0%) | 11,554 (100.0%) |
Families and Households in Mountain Brook
Median Family Size in Mountain Brook
The median family size in Mountain Brook is 3.16 persons per family, with married-couple families (5,938 | 93.9%) accounting for the largest median family size of 3.2 persons per family. On the other hand, single male/father families (31 | 0.5%) represent the smallest median family size with 2.55 persons per family.
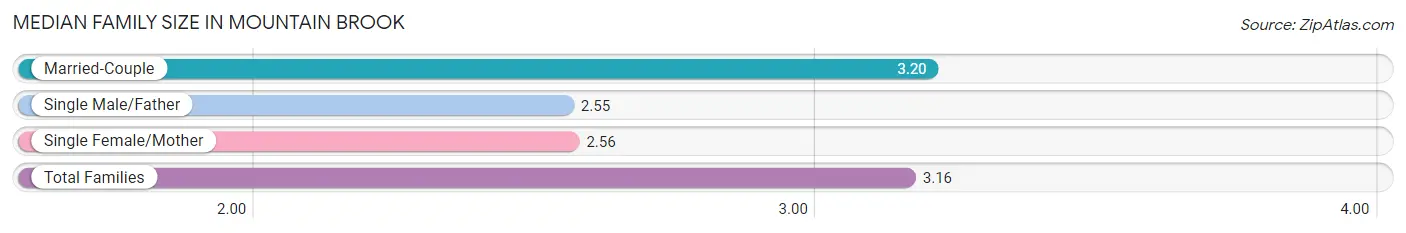
| Family Type | # Families | Family Size |
| Married-Couple | 5,938 (93.9%) | 3.20 |
| Single Male/Father | 31 (0.5%) | 2.55 |
| Single Female/Mother | 356 (5.6%) | 2.56 |
| Total Families | 6,325 (100.0%) | 3.16 |
Median Household Size in Mountain Brook
The median household size in Mountain Brook is 2.70 persons per household, with married-couple households (5,938 | 72.2%) accounting for the largest median household size of 3.2 persons per household. non-family households (1,905 | 23.2%) represent the smallest median household size with 1.11 persons per household.
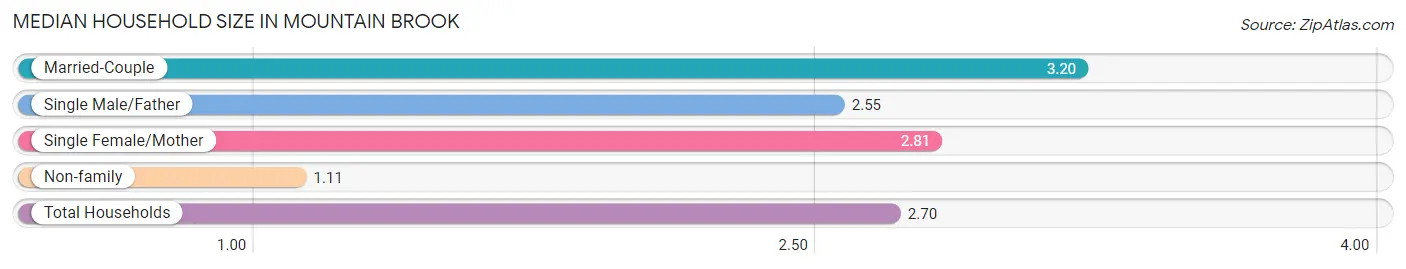
| Household Type | # Households | Household Size |
| Married-Couple | 5,938 (72.2%) | 3.20 |
| Single Male/Father | 31 (0.4%) | 2.55 |
| Single Female/Mother | 356 (4.3%) | 2.81 |
| Non-family | 1,905 (23.2%) | 1.11 |
| Total Households | 8,230 (100.0%) | 2.70 |
Household Size by Marriage Status in Mountain Brook
Out of a total of 8,230 households in Mountain Brook, 6,325 (76.8%) are family households, while 1,905 (23.2%) are nonfamily households. The most numerous type of family households are 2-person households, comprising 2,472, and the most common type of nonfamily households are 1-person households, comprising 1,695.
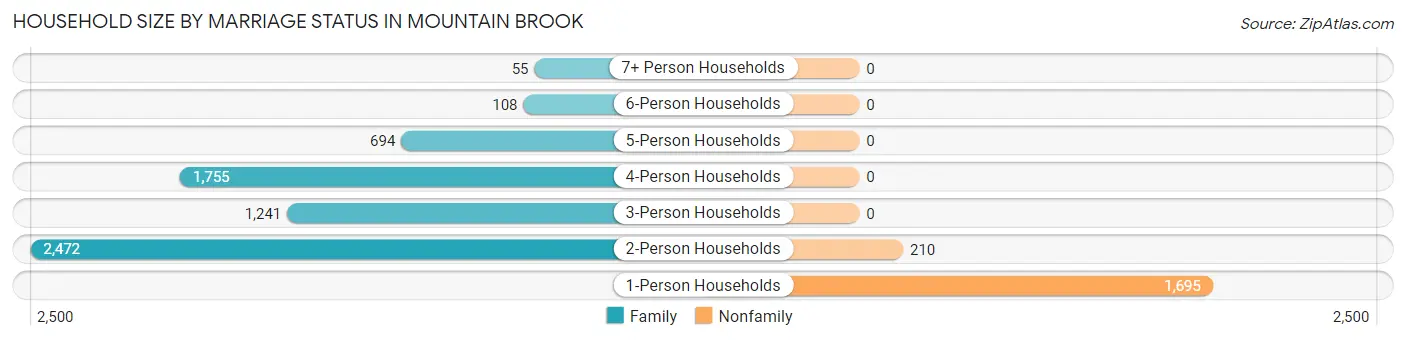
| Household Size | Family Households | Nonfamily Households |
| 1-Person Households | - | 1,695 (20.6%) |
| 2-Person Households | 2,472 (30.0%) | 210 (2.5%) |
| 3-Person Households | 1,241 (15.1%) | 0 (0.0%) |
| 4-Person Households | 1,755 (21.3%) | 0 (0.0%) |
| 5-Person Households | 694 (8.4%) | 0 (0.0%) |
| 6-Person Households | 108 (1.3%) | 0 (0.0%) |
| 7+ Person Households | 55 (0.7%) | 0 (0.0%) |
| Total | 6,325 (76.8%) | 1,905 (23.2%) |
Female Fertility in Mountain Brook
Fertility by Age in Mountain Brook
Average fertility rate in Mountain Brook is 95.0 births per 1,000 women. Women in the age bracket of 35 to 50 years have the highest fertility rate with 124.0 births per 1,000 women. Women in the age bracket of 35 to 50 years acount for 74.8% of all women with births.
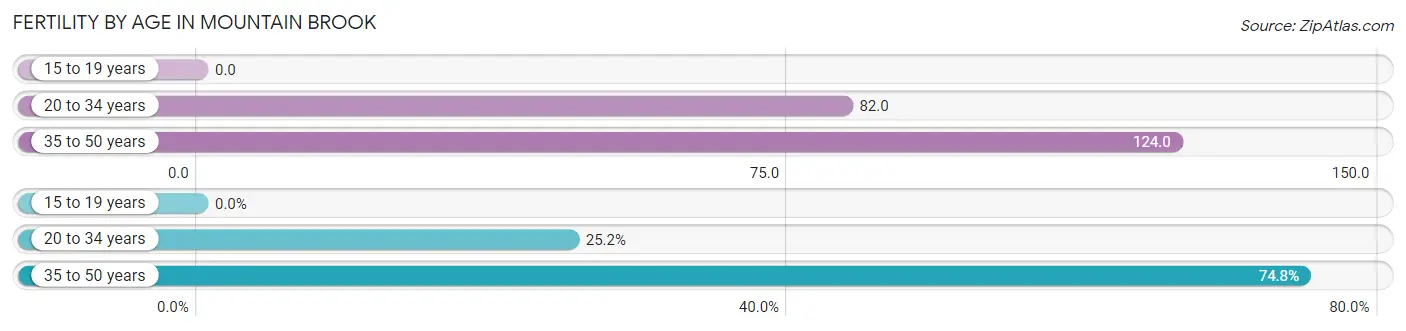
| Age Bracket | Women with Births | Births / 1,000 Women |
| 15 to 19 years | 0 (0.0%) | 0.0 |
| 20 to 34 years | 119 (25.2%) | 82.0 |
| 35 to 50 years | 354 (74.8%) | 124.0 |
| Total | 473 (100.0%) | 95.0 |
Fertility by Age by Marriage Status in Mountain Brook
99.8% of women with births (473) in Mountain Brook are married. The highest percentage of unmarried women with births falls into 20 to 34 years age bracket with 0.8% of them unmarried at the time of birth, while the lowest percentage of unmarried women with births belong to 35 to 50 years age bracket with 0.0% of them unmarried.
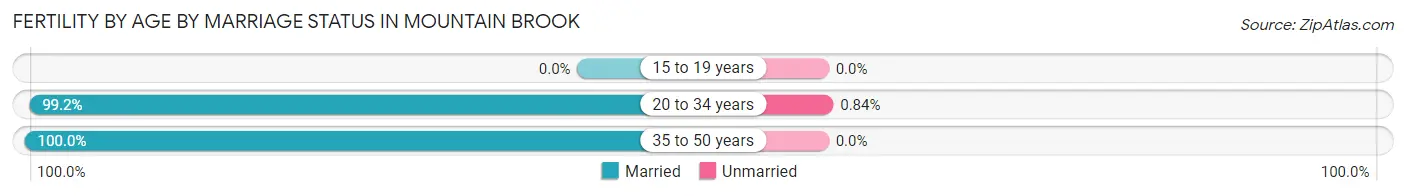
| Age Bracket | Married | Unmarried |
| 15 to 19 years | 0 (0.0%) | 0 (0.0%) |
| 20 to 34 years | 118 (99.2%) | 1 (0.8%) |
| 35 to 50 years | 354 (100.0%) | 0 (0.0%) |
| Total | 472 (99.8%) | 1 (0.2%) |
Fertility by Education in Mountain Brook
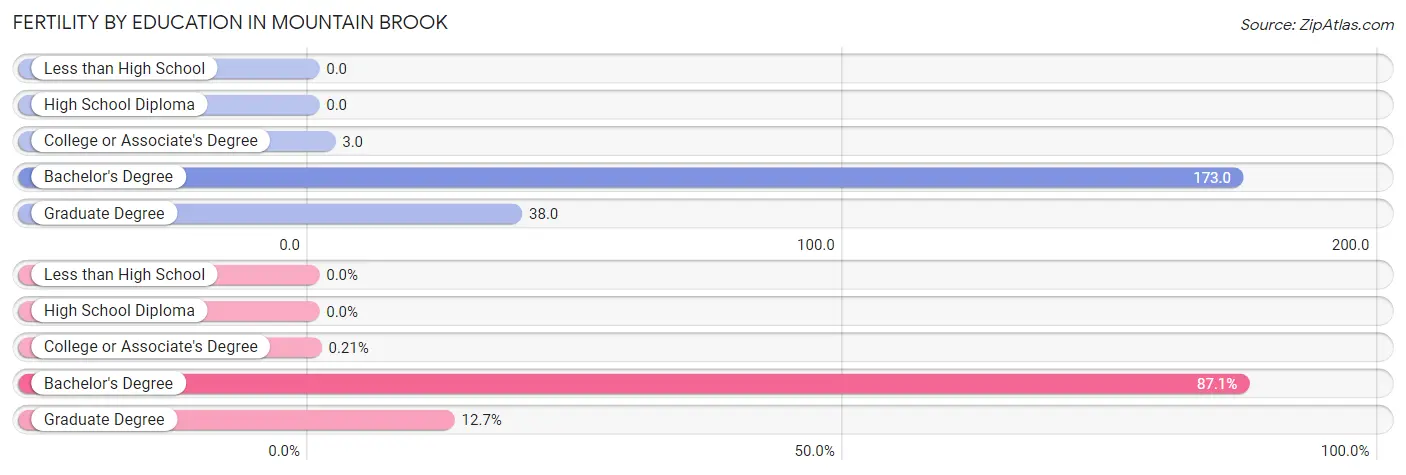
| Educational Attainment | Women with Births | Births / 1,000 Women |
| Less than High School | 0 (0.0%) | 0.0 |
| High School Diploma | 0 (0.0%) | 0.0 |
| College or Associate's Degree | 1 (0.2%) | 3.0 |
| Bachelor's Degree | 412 (87.1%) | 173.0 |
| Graduate Degree | 60 (12.7%) | 38.0 |
| Total | 473 (100.0%) | 95.0 |
Fertility by Education by Marriage Status in Mountain Brook
0.2% of women with births in Mountain Brook are unmarried. Women with the educational attainment of bachelor's degree are most likely to be married with 100.0% of them married at childbirth, while women with the educational attainment of college or associate's degree are least likely to be married with 100.0% of them unmarried at childbirth.
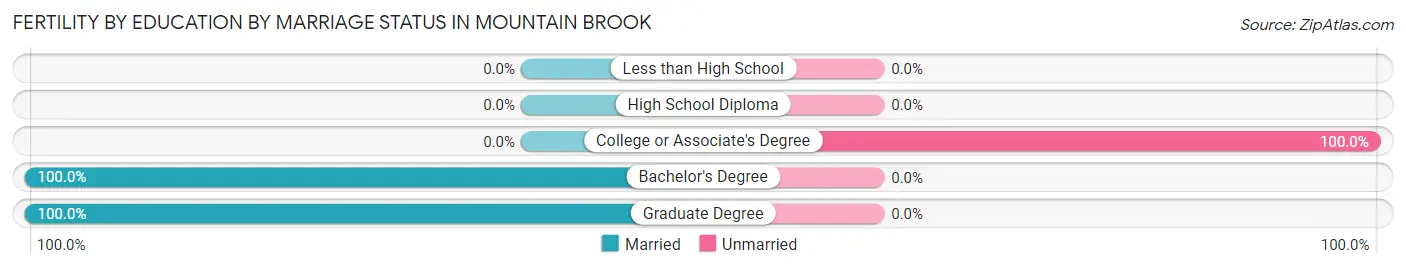
| Educational Attainment | Married | Unmarried |
| Less than High School | 0 (0.0%) | 0 (0.0%) |
| High School Diploma | 0 (0.0%) | 0 (0.0%) |
| College or Associate's Degree | 0 (0.0%) | 1 (100.0%) |
| Bachelor's Degree | 412 (100.0%) | 0 (0.0%) |
| Graduate Degree | 60 (100.0%) | 0 (0.0%) |
| Total | 472 (99.8%) | 1 (0.2%) |
Employment Characteristics in Mountain Brook
Employment by Class of Employer in Mountain Brook
Among the 9,809 employed individuals in Mountain Brook, private company employees (6,199 | 63.2%), self-employed (incorporated) (1,119 | 11.4%), and not-for-profit organizations (755 | 7.7%) make up the most common classes of employment.
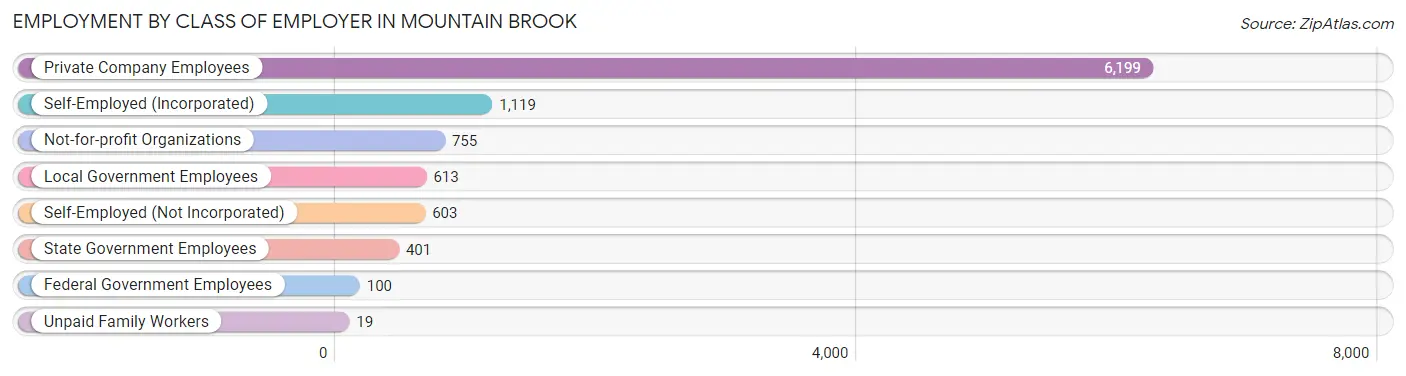
| Employer Class | # Employees | % Employees |
| Private Company Employees | 6,199 | 63.2% |
| Self-Employed (Incorporated) | 1,119 | 11.4% |
| Self-Employed (Not Incorporated) | 603 | 6.1% |
| Not-for-profit Organizations | 755 | 7.7% |
| Local Government Employees | 613 | 6.2% |
| State Government Employees | 401 | 4.1% |
| Federal Government Employees | 100 | 1.0% |
| Unpaid Family Workers | 19 | 0.2% |
| Total | 9,809 | 100.0% |
Employment Status by Age in Mountain Brook
According to the labor force statistics for Mountain Brook, out of the total population over 16 years of age (16,484), 60.6% or 9,989 individuals are in the labor force, with 0.9% or 90 of them unemployed. The age group with the highest labor force participation rate is 25 to 29 years, with 91.5% or 884 individuals in the labor force. Within the labor force, the 55 to 59 years age range has the highest percentage of unemployed individuals, with 5.3% or 47 of them being unemployed.
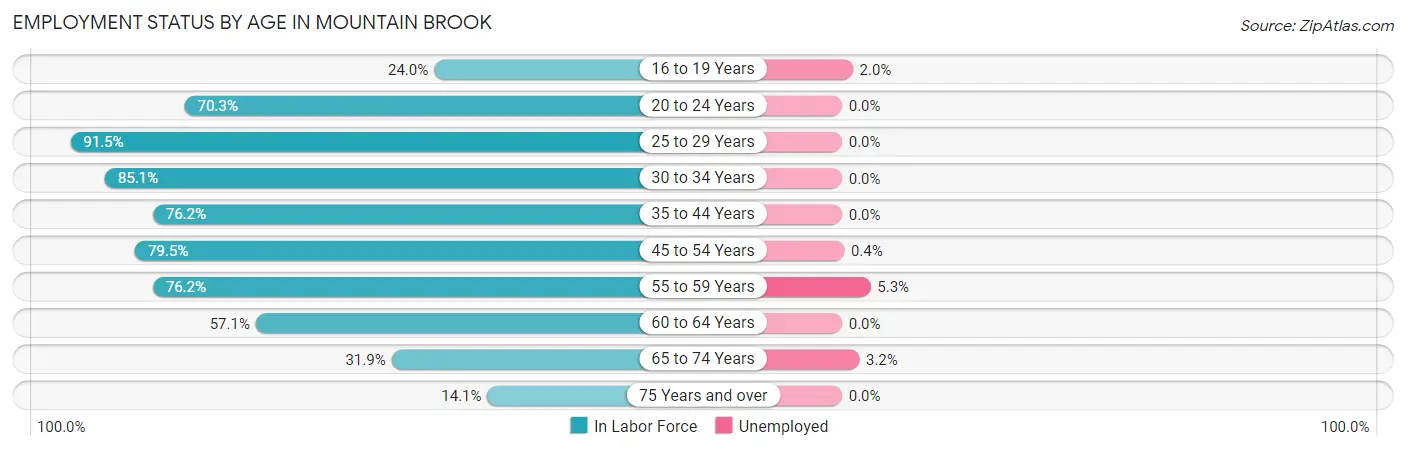
| Age Bracket | In Labor Force | Unemployed |
| 16 to 19 Years | 301 (24.0%) | 6 (2.0%) |
| 20 to 24 Years | 291 (70.3%) | 0 (0.0%) |
| 25 to 29 Years | 884 (91.5%) | 0 (0.0%) |
| 30 to 34 Years | 903 (85.1%) | 0 (0.0%) |
| 35 to 44 Years | 2,206 (76.2%) | 0 (0.0%) |
| 45 to 54 Years | 2,627 (79.5%) | 11 (0.4%) |
| 55 to 59 Years | 882 (76.2%) | 47 (5.3%) |
| 60 to 64 Years | 899 (57.1%) | 0 (0.0%) |
| 65 to 74 Years | 810 (31.9%) | 26 (3.2%) |
| 75 Years and over | 185 (14.1%) | 0 (0.0%) |
| Total | 9,989 (60.6%) | 90 (0.9%) |
Employment Status by Educational Attainment in Mountain Brook
According to labor force statistics for Mountain Brook, 76.7% of individuals (8,406) out of the total population between 25 and 64 years of age (10,960) are in the labor force, with 0.7% or 59 of them being unemployed. The group with the highest labor force participation rate are those with the educational attainment of less than high school, with 81.0% or 17 individuals in the labor force. Within the labor force, individuals with bachelor's degree or higher education have the highest percentage of unemployment, with 0.8% or 60 of them being unemployed.
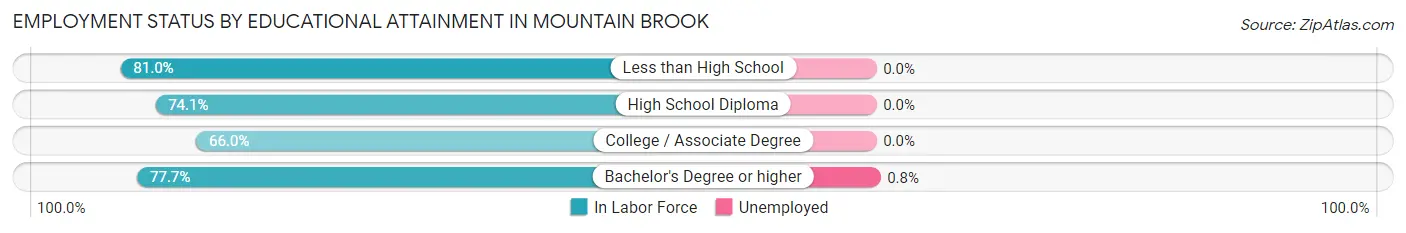
| Educational Attainment | In Labor Force | Unemployed |
| Less than High School | 17 (81.0%) | 0 (0.0%) |
| High School Diploma | 203 (74.1%) | 0 (0.0%) |
| College / Associate Degree | 617 (66.0%) | 0 (0.0%) |
| Bachelor's Degree or higher | 7,560 (77.7%) | 78 (0.8%) |
| Total | 8,406 (76.7%) | 77 (0.7%) |
Employment Occupations by Sex in Mountain Brook
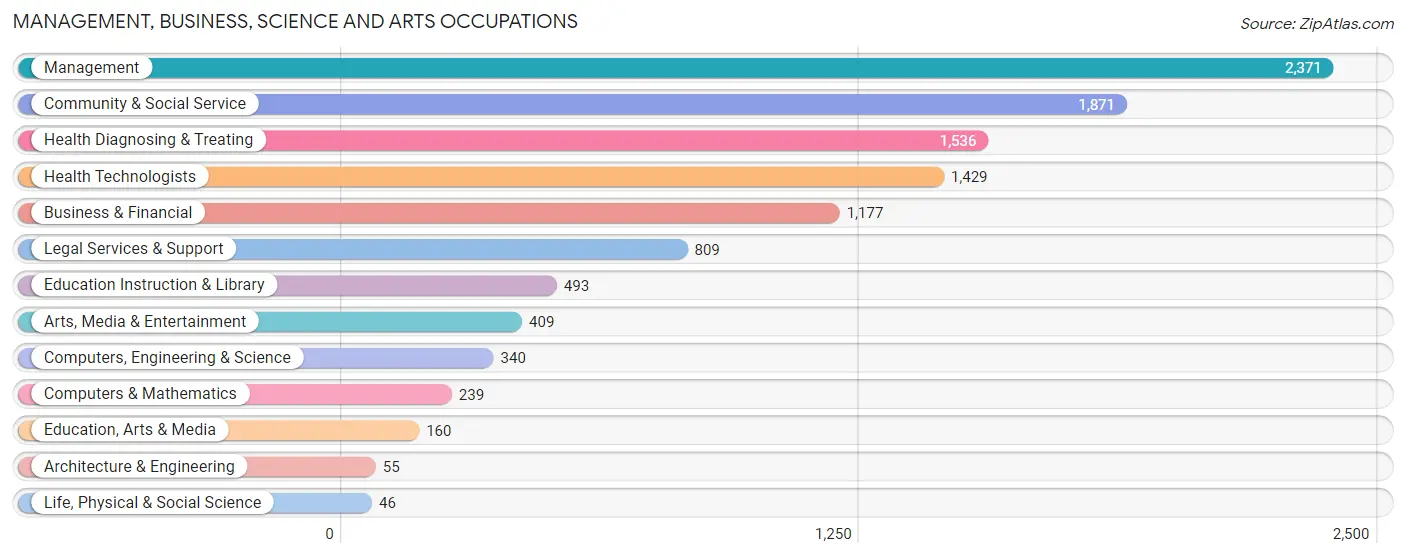
Management, Business, Science and Arts Occupations
The most common Management, Business, Science and Arts occupations in Mountain Brook are Management (2,371 | 24.0%), Community & Social Service (1,871 | 18.9%), Health Diagnosing & Treating (1,536 | 15.5%), Health Technologists (1,429 | 14.4%), and Business & Financial (1,177 | 11.9%).
Management, Business, Science and Arts Occupations by Sex
Within the Management, Business, Science and Arts occupations in Mountain Brook, the most male-oriented occupations are Architecture & Engineering (100.0%), Computers & Mathematics (93.3%), and Computers, Engineering & Science (90.6%), while the most female-oriented occupations are Arts, Media & Entertainment (81.4%), Education Instruction & Library (80.7%), and Education, Arts & Media (66.2%).
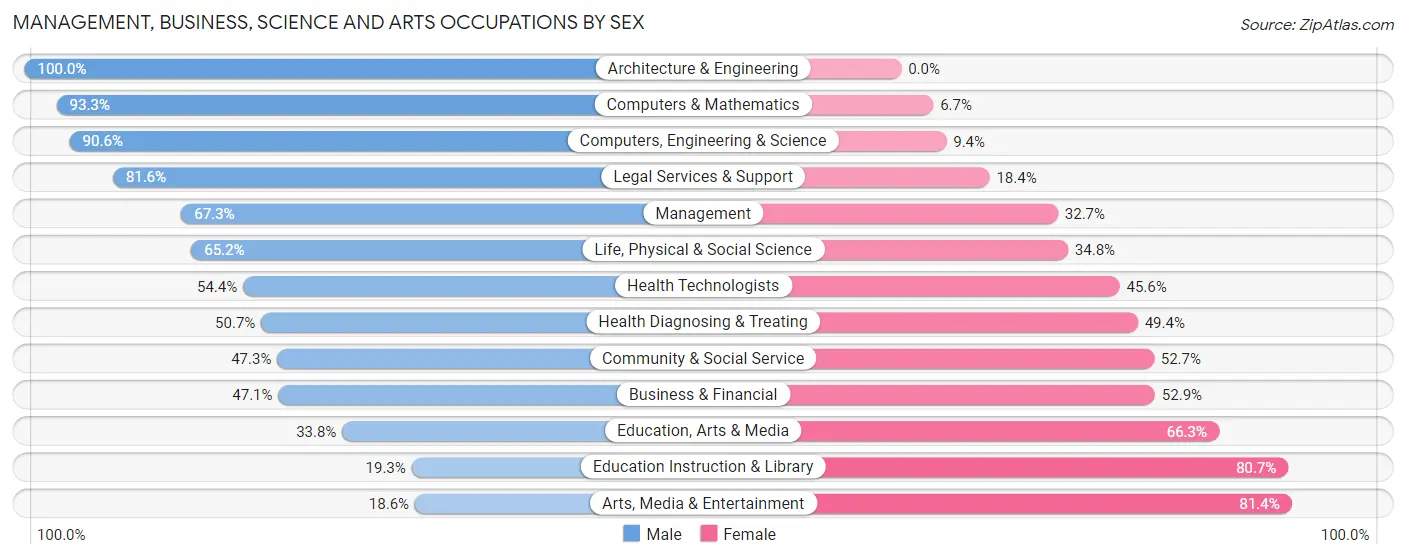
| Occupation | Male | Female |
| Management | 1,596 (67.3%) | 775 (32.7%) |
| Business & Financial | 554 (47.1%) | 623 (52.9%) |
| Computers, Engineering & Science | 308 (90.6%) | 32 (9.4%) |
| Computers & Mathematics | 223 (93.3%) | 16 (6.7%) |
| Architecture & Engineering | 55 (100.0%) | 0 (0.0%) |
| Life, Physical & Social Science | 30 (65.2%) | 16 (34.8%) |
| Community & Social Service | 885 (47.3%) | 986 (52.7%) |
| Education, Arts & Media | 54 (33.8%) | 106 (66.2%) |
| Legal Services & Support | 660 (81.6%) | 149 (18.4%) |
| Education Instruction & Library | 95 (19.3%) | 398 (80.7%) |
| Arts, Media & Entertainment | 76 (18.6%) | 333 (81.4%) |
| Health Diagnosing & Treating | 778 (50.6%) | 758 (49.3%) |
| Health Technologists | 778 (54.4%) | 651 (45.6%) |
| Total (Category) | 4,121 (56.5%) | 3,174 (43.5%) |
| Total (Overall) | 5,654 (57.1%) | 4,243 (42.9%) |
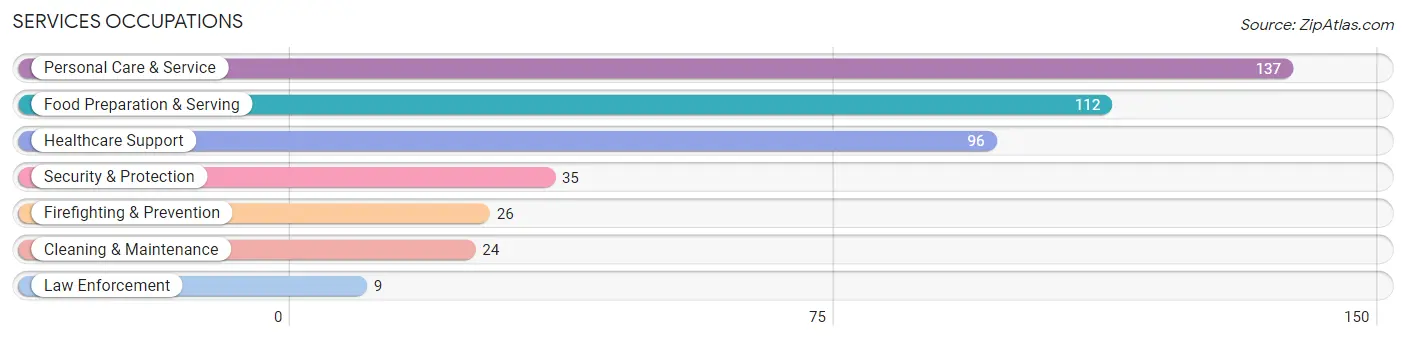
Services Occupations
The most common Services occupations in Mountain Brook are Personal Care & Service (137 | 1.4%), Food Preparation & Serving (112 | 1.1%), Healthcare Support (96 | 1.0%), Security & Protection (35 | 0.4%), and Firefighting & Prevention (26 | 0.3%).
Services Occupations by Sex
Within the Services occupations in Mountain Brook, the most male-oriented occupations are Security & Protection (100.0%), Firefighting & Prevention (100.0%), and Law Enforcement (100.0%), while the most female-oriented occupations are Healthcare Support (71.9%), and Personal Care & Service (59.1%).
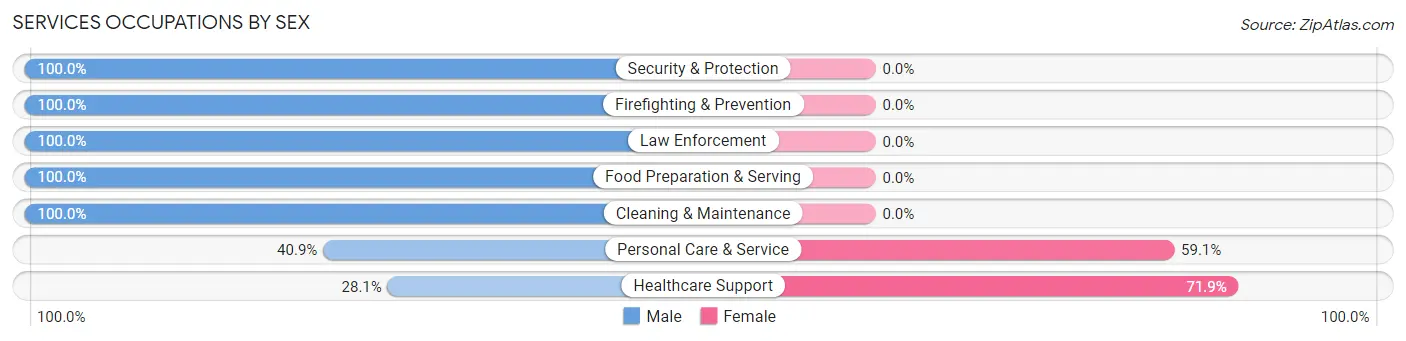
| Occupation | Male | Female |
| Healthcare Support | 27 (28.1%) | 69 (71.9%) |
| Security & Protection | 35 (100.0%) | 0 (0.0%) |
| Firefighting & Prevention | 26 (100.0%) | 0 (0.0%) |
| Law Enforcement | 9 (100.0%) | 0 (0.0%) |
| Food Preparation & Serving | 112 (100.0%) | 0 (0.0%) |
| Cleaning & Maintenance | 24 (100.0%) | 0 (0.0%) |
| Personal Care & Service | 56 (40.9%) | 81 (59.1%) |
| Total (Category) | 254 (62.9%) | 150 (37.1%) |
| Total (Overall) | 5,654 (57.1%) | 4,243 (42.9%) |
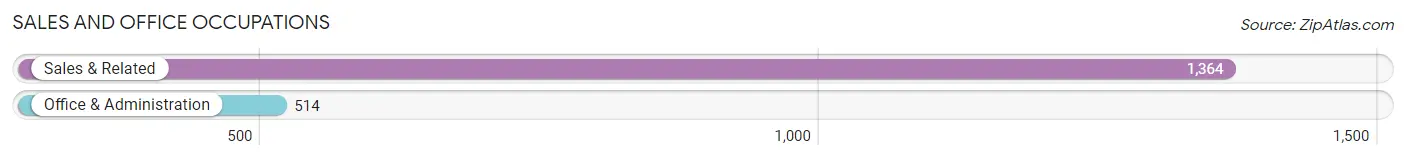
Sales and Office Occupations
The most common Sales and Office occupations in Mountain Brook are Sales & Related (1,364 | 13.8%), and Office & Administration (514 | 5.2%).
Sales and Office Occupations by Sex
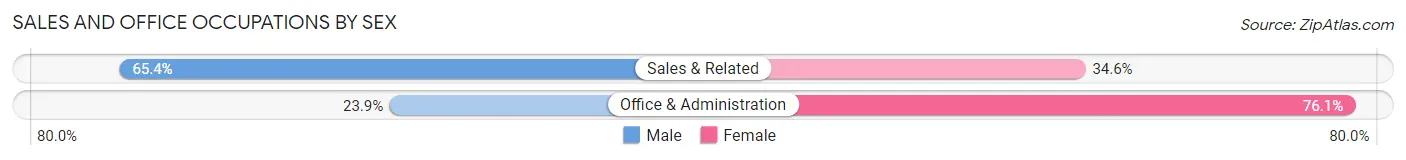
| Occupation | Male | Female |
| Sales & Related | 892 (65.4%) | 472 (34.6%) |
| Office & Administration | 123 (23.9%) | 391 (76.1%) |
| Total (Category) | 1,015 (54.0%) | 863 (46.0%) |
| Total (Overall) | 5,654 (57.1%) | 4,243 (42.9%) |
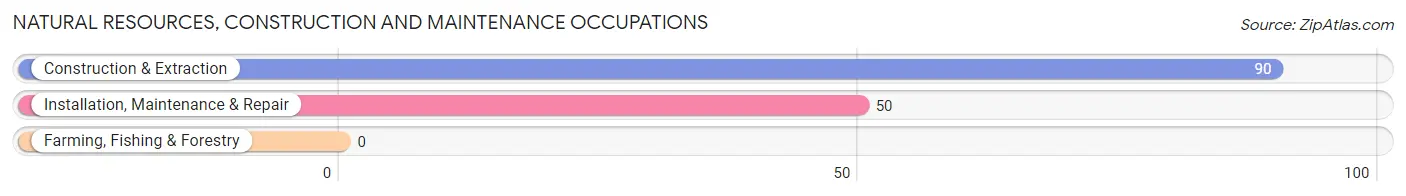
Natural Resources, Construction and Maintenance Occupations
The most common Natural Resources, Construction and Maintenance occupations in Mountain Brook are Construction & Extraction (90 | 0.9%), and Installation, Maintenance & Repair (50 | 0.5%).
Natural Resources, Construction and Maintenance Occupations by Sex
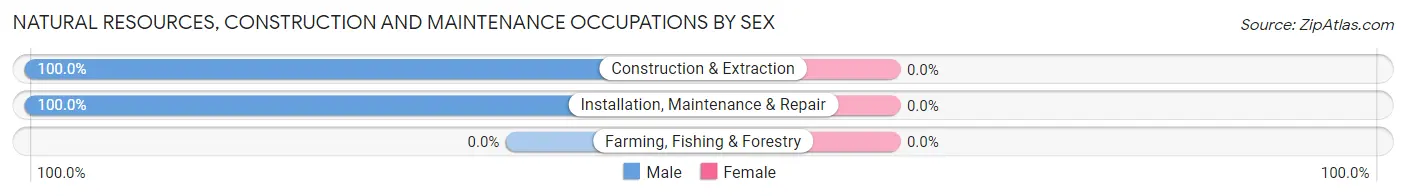
| Occupation | Male | Female |
| Farming, Fishing & Forestry | 0 (0.0%) | 0 (0.0%) |
| Construction & Extraction | 90 (100.0%) | 0 (0.0%) |
| Installation, Maintenance & Repair | 50 (100.0%) | 0 (0.0%) |
| Total (Category) | 140 (100.0%) | 0 (0.0%) |
| Total (Overall) | 5,654 (57.1%) | 4,243 (42.9%) |
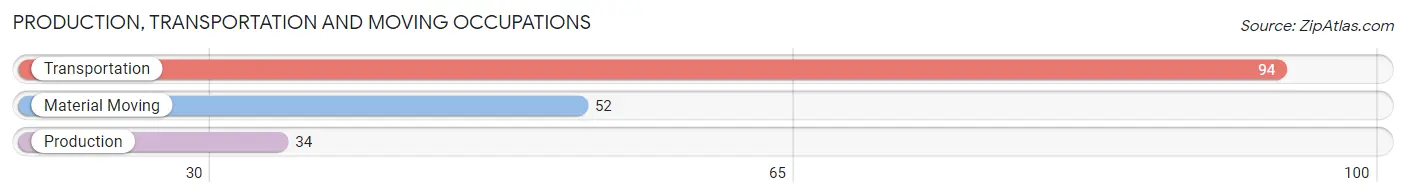
Production, Transportation and Moving Occupations
The most common Production, Transportation and Moving occupations in Mountain Brook are Transportation (94 | 0.9%), Material Moving (52 | 0.5%), and Production (34 | 0.3%).
Production, Transportation and Moving Occupations by Sex
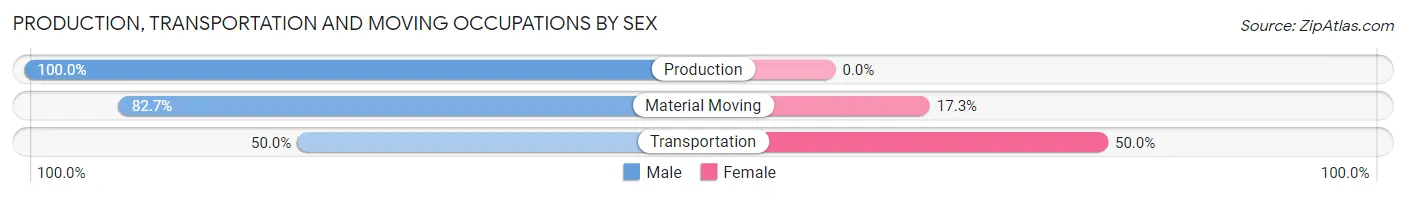
| Occupation | Male | Female |
| Production | 34 (100.0%) | 0 (0.0%) |
| Transportation | 47 (50.0%) | 47 (50.0%) |
| Material Moving | 43 (82.7%) | 9 (17.3%) |
| Total (Category) | 124 (68.9%) | 56 (31.1%) |
| Total (Overall) | 5,654 (57.1%) | 4,243 (42.9%) |
Employment Industries by Sex in Mountain Brook
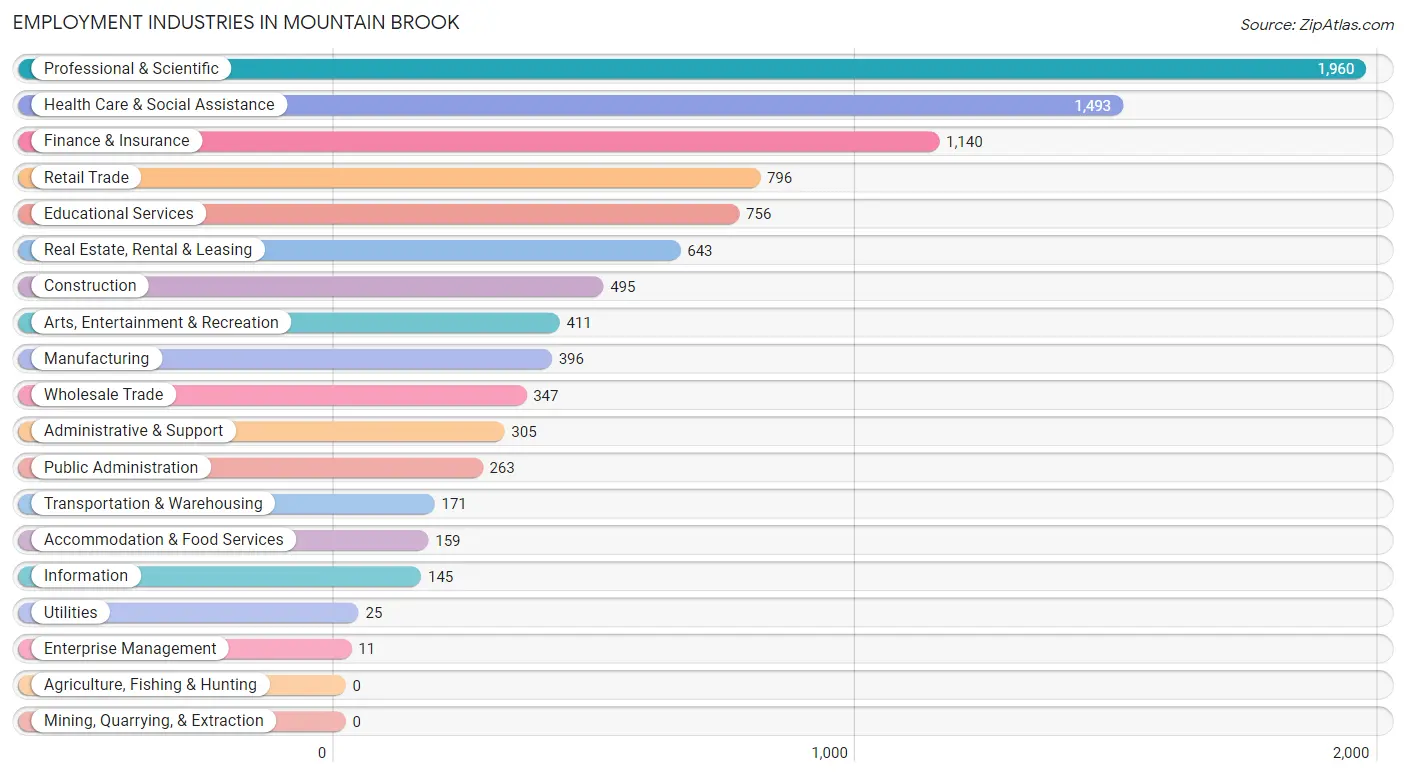
Employment Industries in Mountain Brook
The major employment industries in Mountain Brook include Professional & Scientific (1,960 | 19.8%), Health Care & Social Assistance (1,493 | 15.1%), Finance & Insurance (1,140 | 11.5%), Retail Trade (796 | 8.0%), and Educational Services (756 | 7.6%).
Employment Industries by Sex in Mountain Brook
The Mountain Brook industries that see more men than women are Enterprise Management (100.0%), Public Administration (95.4%), and Construction (88.1%), whereas the industries that tend to have a higher number of women are Arts, Entertainment & Recreation (71.3%), Utilities (68.0%), and Administrative & Support (64.6%).
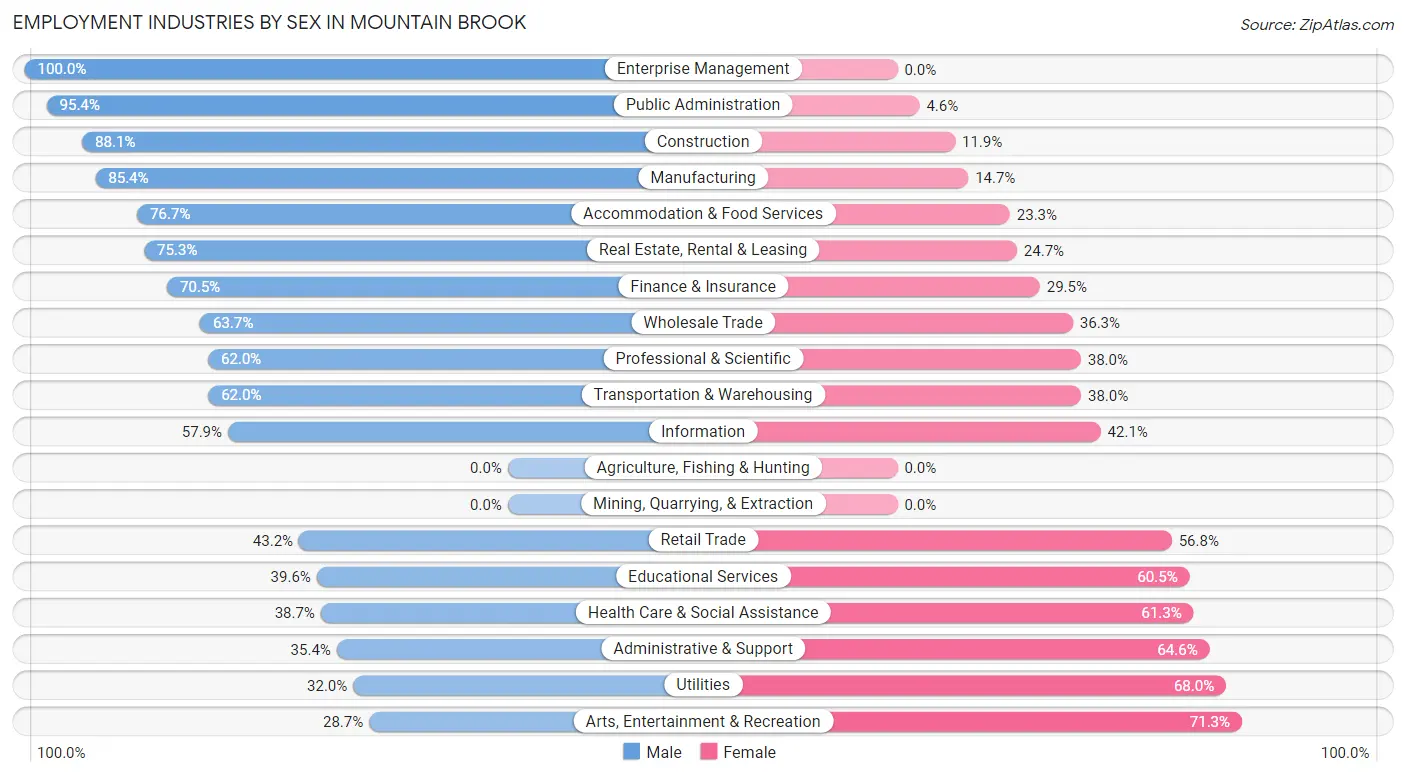
| Industry | Male | Female |
| Agriculture, Fishing & Hunting | 0 (0.0%) | 0 (0.0%) |
| Mining, Quarrying, & Extraction | 0 (0.0%) | 0 (0.0%) |
| Construction | 436 (88.1%) | 59 (11.9%) |
| Manufacturing | 338 (85.4%) | 58 (14.6%) |
| Wholesale Trade | 221 (63.7%) | 126 (36.3%) |
| Retail Trade | 344 (43.2%) | 452 (56.8%) |
| Transportation & Warehousing | 106 (62.0%) | 65 (38.0%) |
| Utilities | 8 (32.0%) | 17 (68.0%) |
| Information | 84 (57.9%) | 61 (42.1%) |
| Finance & Insurance | 804 (70.5%) | 336 (29.5%) |
| Real Estate, Rental & Leasing | 484 (75.3%) | 159 (24.7%) |
| Professional & Scientific | 1,216 (62.0%) | 744 (38.0%) |
| Enterprise Management | 11 (100.0%) | 0 (0.0%) |
| Administrative & Support | 108 (35.4%) | 197 (64.6%) |
| Educational Services | 299 (39.6%) | 457 (60.5%) |
| Health Care & Social Assistance | 578 (38.7%) | 915 (61.3%) |
| Arts, Entertainment & Recreation | 118 (28.7%) | 293 (71.3%) |
| Accommodation & Food Services | 122 (76.7%) | 37 (23.3%) |
| Public Administration | 251 (95.4%) | 12 (4.6%) |
| Total | 5,654 (57.1%) | 4,243 (42.9%) |
Education in Mountain Brook
School Enrollment in Mountain Brook
The most common levels of schooling among the 6,548 students in Mountain Brook are high school (1,540 | 23.5%), middle school (1,492 | 22.8%), and elementary school (1,295 | 19.8%).
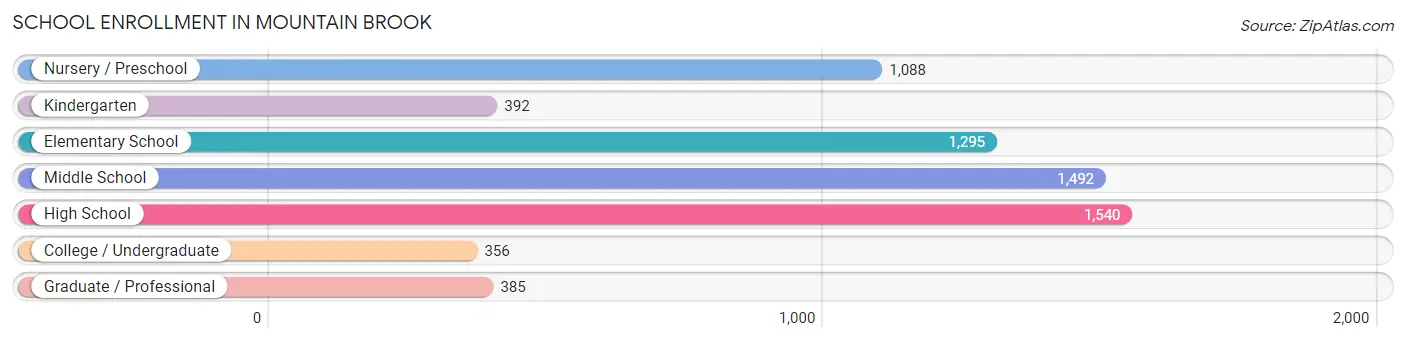
| School Level | # Students | % Students |
| Nursery / Preschool | 1,088 | 16.6% |
| Kindergarten | 392 | 6.0% |
| Elementary School | 1,295 | 19.8% |
| Middle School | 1,492 | 22.8% |
| High School | 1,540 | 23.5% |
| College / Undergraduate | 356 | 5.4% |
| Graduate / Professional | 385 | 5.9% |
| Total | 6,548 | 100.0% |
School Enrollment by Age by Funding Source in Mountain Brook
Out of a total of 6,548 students who are enrolled in schools in Mountain Brook, 1,598 (24.4%) attend a private institution, while the remaining 4,950 (75.6%) are enrolled in public schools. The age group of 3 to 4 year olds has the highest likelihood of being enrolled in private schools, with 691 (80.7% in the age bracket) enrolled. Conversely, the age group of 15 to 17 year olds has the lowest likelihood of being enrolled in a private school, with 981 (94.1% in the age bracket) attending a public institution.
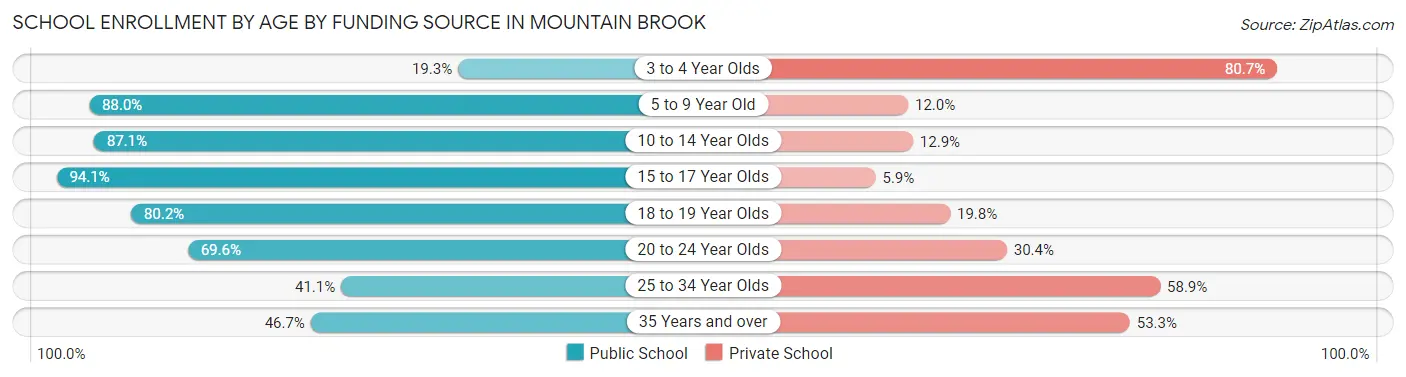
| Age Bracket | Public School | Private School |
| 3 to 4 Year Olds | 165 (19.3%) | 691 (80.7%) |
| 5 to 9 Year Old | 1,600 (88.0%) | 218 (12.0%) |
| 10 to 14 Year Olds | 1,452 (87.1%) | 215 (12.9%) |
| 15 to 17 Year Olds | 981 (94.1%) | 62 (5.9%) |
| 18 to 19 Year Olds | 425 (80.2%) | 105 (19.8%) |
| 20 to 24 Year Olds | 142 (69.6%) | 62 (30.4%) |
| 25 to 34 Year Olds | 108 (41.1%) | 155 (58.9%) |
| 35 Years and over | 78 (46.7%) | 89 (53.3%) |
| Total | 4,950 (75.6%) | 1,598 (24.4%) |
Educational Attainment by Field of Study in Mountain Brook
Business (3,567 | 26.2%), social sciences (1,288 | 9.5%), education (1,071 | 7.9%), communications (1,047 | 7.7%), and science & technology (927 | 6.8%) are the most common fields of study among 13,605 individuals in Mountain Brook who have obtained a bachelor's degree or higher.
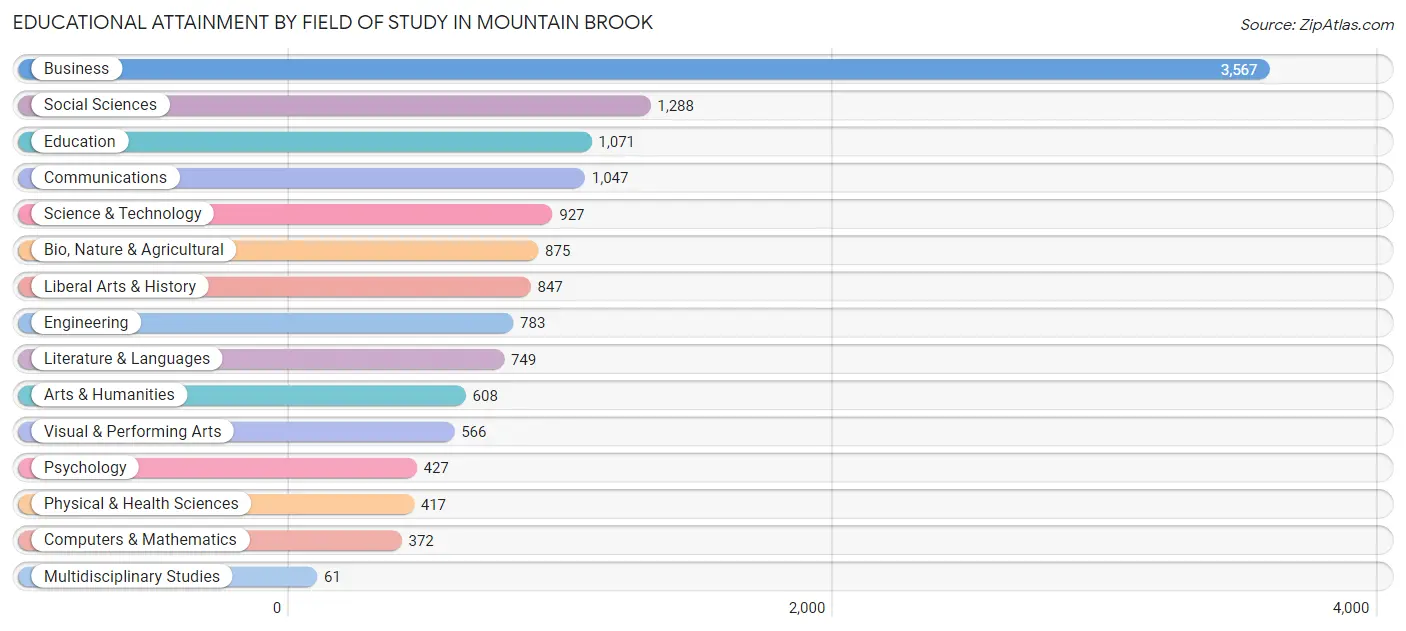
| Field of Study | # Graduates | % Graduates |
| Computers & Mathematics | 372 | 2.7% |
| Bio, Nature & Agricultural | 875 | 6.4% |
| Physical & Health Sciences | 417 | 3.1% |
| Psychology | 427 | 3.1% |
| Social Sciences | 1,288 | 9.5% |
| Engineering | 783 | 5.8% |
| Multidisciplinary Studies | 61 | 0.4% |
| Science & Technology | 927 | 6.8% |
| Business | 3,567 | 26.2% |
| Education | 1,071 | 7.9% |
| Literature & Languages | 749 | 5.5% |
| Liberal Arts & History | 847 | 6.2% |
| Visual & Performing Arts | 566 | 4.2% |
| Communications | 1,047 | 7.7% |
| Arts & Humanities | 608 | 4.5% |
| Total | 13,605 | 100.0% |
Transportation & Commute in Mountain Brook
Vehicle Availability by Sex in Mountain Brook
The most prevalent vehicle ownership categories in Mountain Brook are males with 2 vehicles (3,266, accounting for 58.0%) and females with 2 vehicles (2,471, making up 78.2%).
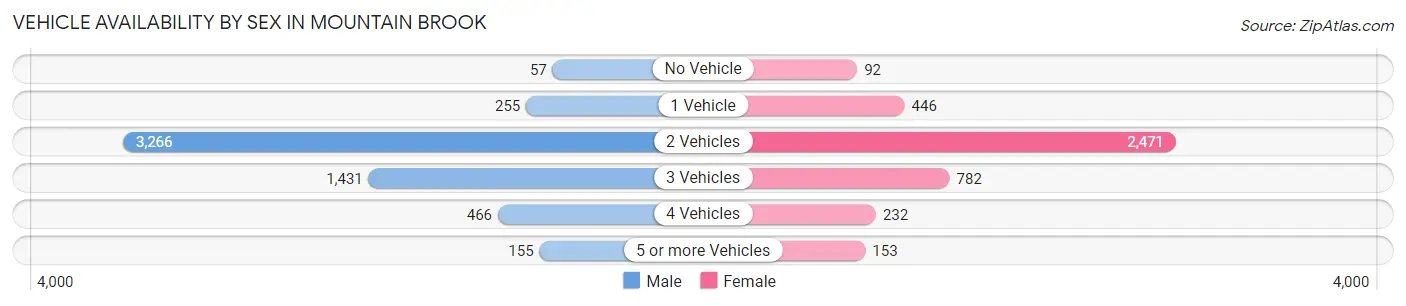
| Vehicles Available | Male | Female |
| No Vehicle | 57 (1.0%) | 92 (2.2%) |
| 1 Vehicle | 255 (4.5%) | 446 (10.7%) |
| 2 Vehicles | 3,266 (58.0%) | 2,471 (59.2%) |
| 3 Vehicles | 1,431 (25.4%) | 782 (18.7%) |
| 4 Vehicles | 466 (8.3%) | 232 (5.6%) |
| 5 or more Vehicles | 155 (2.8%) | 153 (3.7%) |
| Total | 5,630 (100.0%) | 4,176 (100.0%) |
Commute Time in Mountain Brook
The most frequently occuring commute durations in Mountain Brook are 15 to 19 minutes (2,181 commuters, 26.7%), 10 to 14 minutes (2,063 commuters, 25.3%), and 20 to 24 minutes (1,615 commuters, 19.8%).
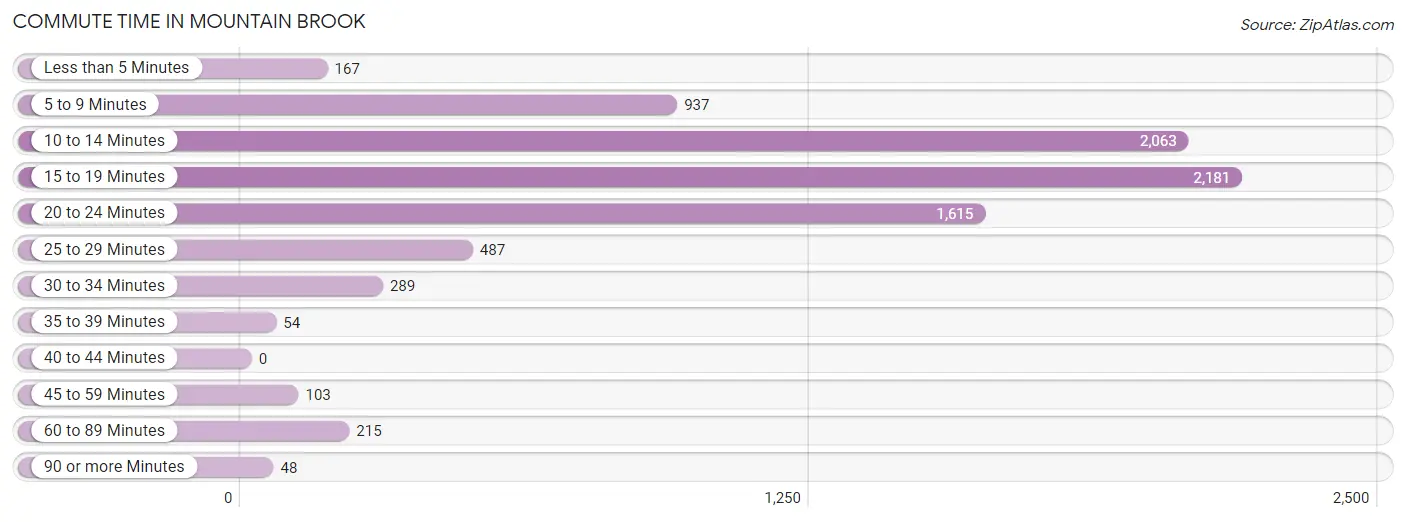
| Commute Time | # Commuters | % Commuters |
| Less than 5 Minutes | 167 | 2.1% |
| 5 to 9 Minutes | 937 | 11.5% |
| 10 to 14 Minutes | 2,063 | 25.3% |
| 15 to 19 Minutes | 2,181 | 26.7% |
| 20 to 24 Minutes | 1,615 | 19.8% |
| 25 to 29 Minutes | 487 | 6.0% |
| 30 to 34 Minutes | 289 | 3.5% |
| 35 to 39 Minutes | 54 | 0.7% |
| 40 to 44 Minutes | 0 | 0.0% |
| 45 to 59 Minutes | 103 | 1.3% |
| 60 to 89 Minutes | 215 | 2.6% |
| 90 or more Minutes | 48 | 0.6% |
Commute Time by Sex in Mountain Brook
The most common commute times in Mountain Brook are 15 to 19 minutes (1,293 commuters, 27.5%) for males and 10 to 14 minutes (928 commuters, 26.8%) for females.
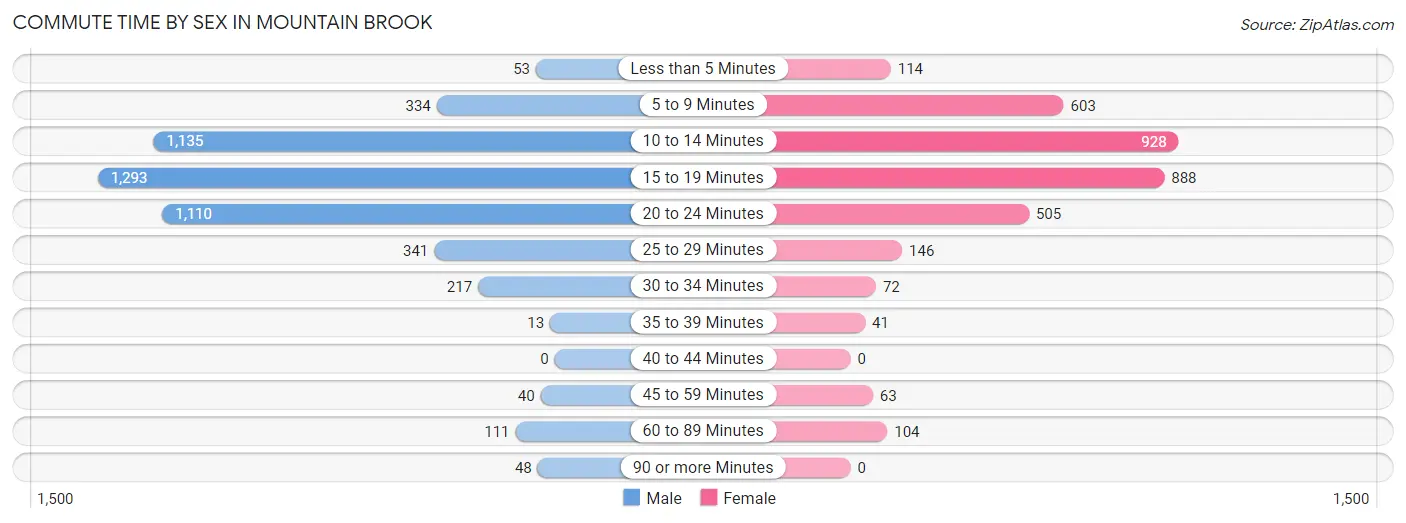
| Commute Time | Male | Female |
| Less than 5 Minutes | 53 (1.1%) | 114 (3.3%) |
| 5 to 9 Minutes | 334 (7.1%) | 603 (17.4%) |
| 10 to 14 Minutes | 1,135 (24.2%) | 928 (26.8%) |
| 15 to 19 Minutes | 1,293 (27.5%) | 888 (25.6%) |
| 20 to 24 Minutes | 1,110 (23.6%) | 505 (14.6%) |
| 25 to 29 Minutes | 341 (7.3%) | 146 (4.2%) |
| 30 to 34 Minutes | 217 (4.6%) | 72 (2.1%) |
| 35 to 39 Minutes | 13 (0.3%) | 41 (1.2%) |
| 40 to 44 Minutes | 0 (0.0%) | 0 (0.0%) |
| 45 to 59 Minutes | 40 (0.9%) | 63 (1.8%) |
| 60 to 89 Minutes | 111 (2.4%) | 104 (3.0%) |
| 90 or more Minutes | 48 (1.0%) | 0 (0.0%) |
Time of Departure to Work by Sex in Mountain Brook
The most frequent times of departure to work in Mountain Brook are 7:30 AM to 7:59 AM (991, 21.1%) for males and 7:30 AM to 7:59 AM (633, 18.3%) for females.
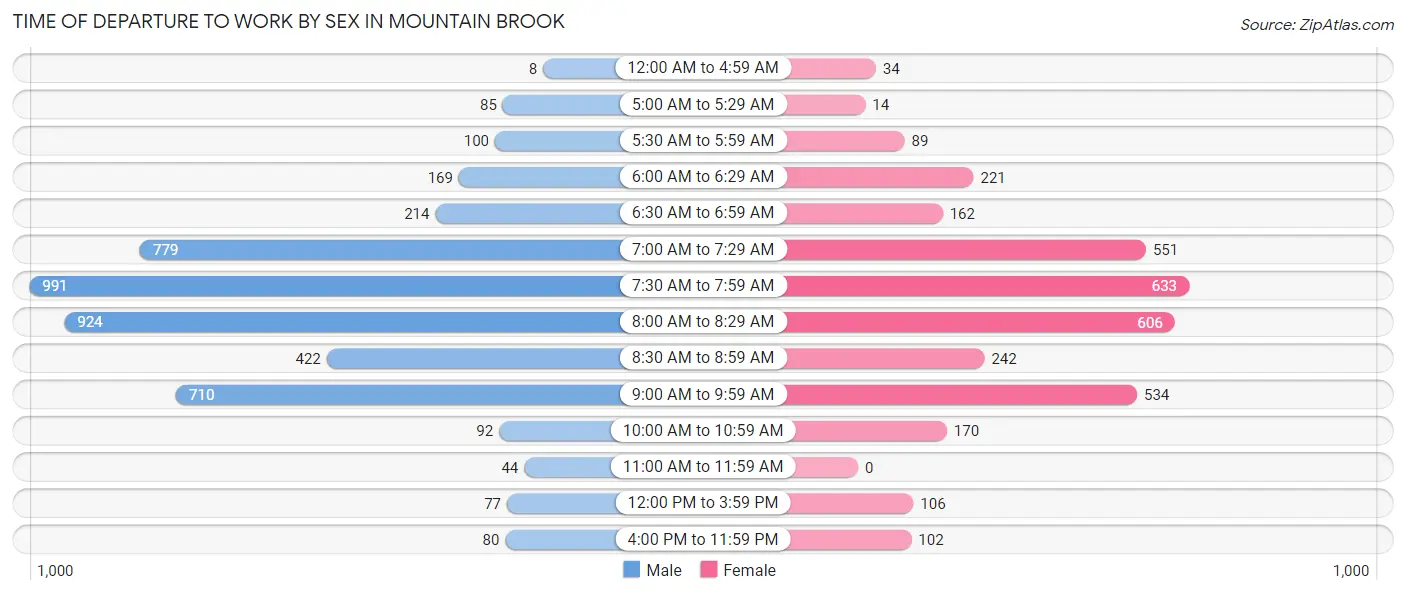
| Time of Departure | Male | Female |
| 12:00 AM to 4:59 AM | 8 (0.2%) | 34 (1.0%) |
| 5:00 AM to 5:29 AM | 85 (1.8%) | 14 (0.4%) |
| 5:30 AM to 5:59 AM | 100 (2.1%) | 89 (2.6%) |
| 6:00 AM to 6:29 AM | 169 (3.6%) | 221 (6.4%) |
| 6:30 AM to 6:59 AM | 214 (4.6%) | 162 (4.7%) |
| 7:00 AM to 7:29 AM | 779 (16.6%) | 551 (15.9%) |
| 7:30 AM to 7:59 AM | 991 (21.1%) | 633 (18.3%) |
| 8:00 AM to 8:29 AM | 924 (19.7%) | 606 (17.5%) |
| 8:30 AM to 8:59 AM | 422 (9.0%) | 242 (7.0%) |
| 9:00 AM to 9:59 AM | 710 (15.1%) | 534 (15.4%) |
| 10:00 AM to 10:59 AM | 92 (2.0%) | 170 (4.9%) |
| 11:00 AM to 11:59 AM | 44 (0.9%) | 0 (0.0%) |
| 12:00 PM to 3:59 PM | 77 (1.6%) | 106 (3.1%) |
| 4:00 PM to 11:59 PM | 80 (1.7%) | 102 (2.9%) |
| Total | 4,695 (100.0%) | 3,464 (100.0%) |
Housing Occupancy in Mountain Brook
Occupancy by Ownership in Mountain Brook
Of the total 8,230 dwellings in Mountain Brook, owner-occupied units account for 7,358 (89.4%), while renter-occupied units make up 872 (10.6%).
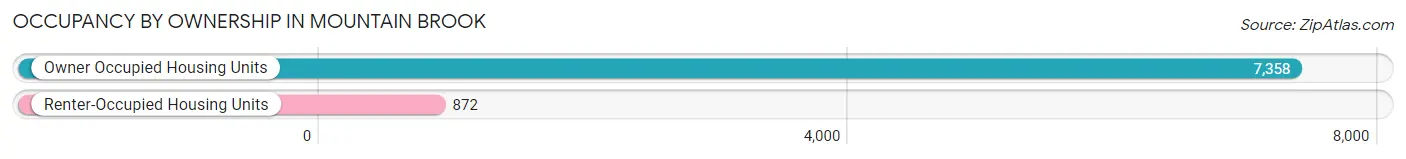
| Occupancy | # Housing Units | % Housing Units |
| Owner Occupied Housing Units | 7,358 | 89.4% |
| Renter-Occupied Housing Units | 872 | 10.6% |
| Total Occupied Housing Units | 8,230 | 100.0% |
Occupancy by Household Size in Mountain Brook
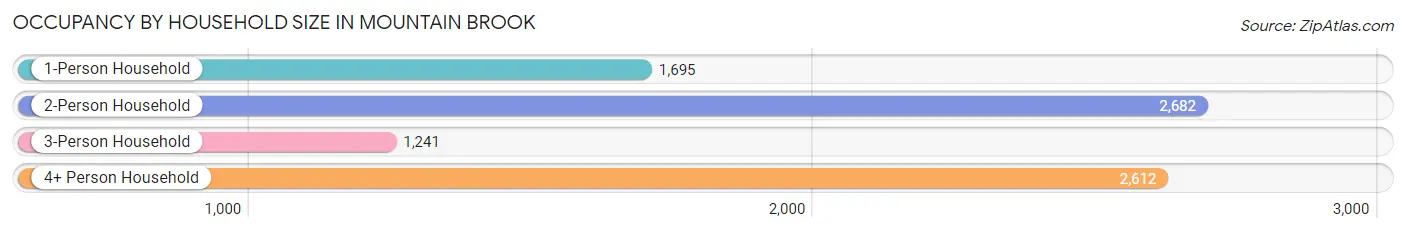
| Household Size | # Housing Units | % Housing Units |
| 1-Person Household | 1,695 | 20.6% |
| 2-Person Household | 2,682 | 32.6% |
| 3-Person Household | 1,241 | 15.1% |
| 4+ Person Household | 2,612 | 31.7% |
| Total Housing Units | 8,230 | 100.0% |
Occupancy by Ownership by Household Size in Mountain Brook
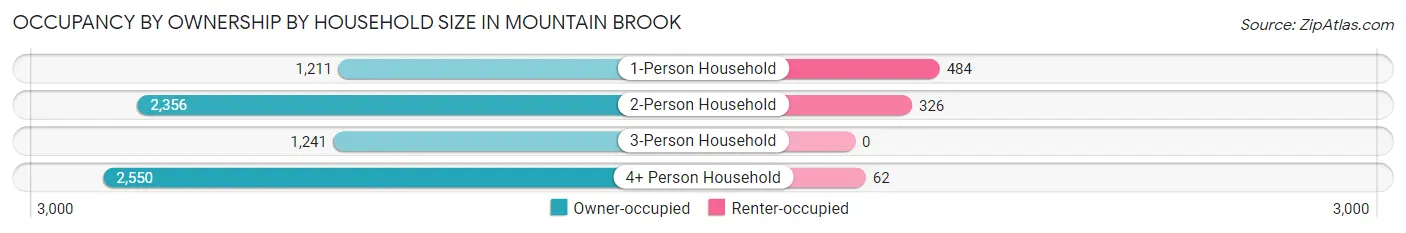
| Household Size | Owner-occupied | Renter-occupied |
| 1-Person Household | 1,211 (71.5%) | 484 (28.5%) |
| 2-Person Household | 2,356 (87.8%) | 326 (12.2%) |
| 3-Person Household | 1,241 (100.0%) | 0 (0.0%) |
| 4+ Person Household | 2,550 (97.6%) | 62 (2.4%) |
| Total Housing Units | 7,358 (89.4%) | 872 (10.6%) |
Occupancy by Educational Attainment in Mountain Brook
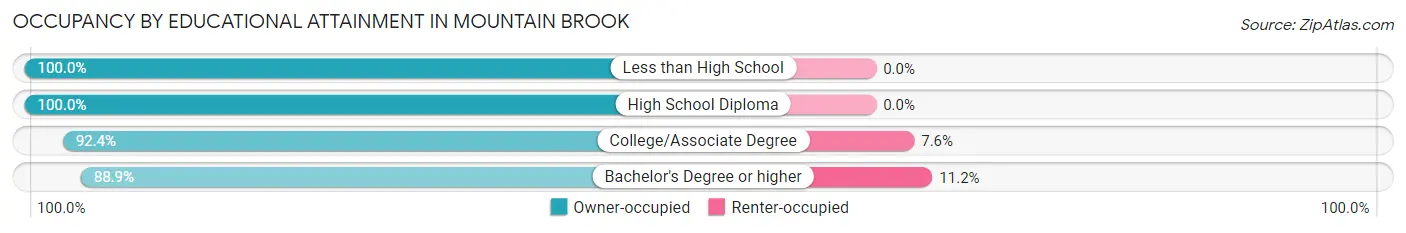
| Household Size | Owner-occupied | Renter-occupied |
| Less than High School | 46 (100.0%) | 0 (0.0%) |
| High School Diploma | 90 (100.0%) | 0 (0.0%) |
| College/Associate Degree | 783 (92.4%) | 64 (7.6%) |
| Bachelor's Degree or higher | 6,439 (88.8%) | 808 (11.2%) |
Occupancy by Age of Householder in Mountain Brook
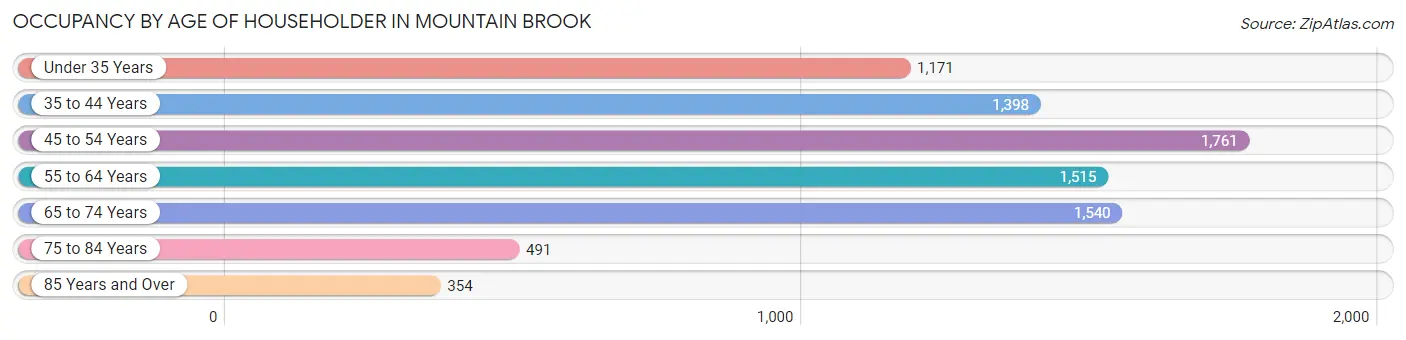
| Age Bracket | # Households | % Households |
| Under 35 Years | 1,171 | 14.2% |
| 35 to 44 Years | 1,398 | 17.0% |
| 45 to 54 Years | 1,761 | 21.4% |
| 55 to 64 Years | 1,515 | 18.4% |
| 65 to 74 Years | 1,540 | 18.7% |
| 75 to 84 Years | 491 | 6.0% |
| 85 Years and Over | 354 | 4.3% |
| Total | 8,230 | 100.0% |
Housing Finances in Mountain Brook
Median Income by Occupancy in Mountain Brook
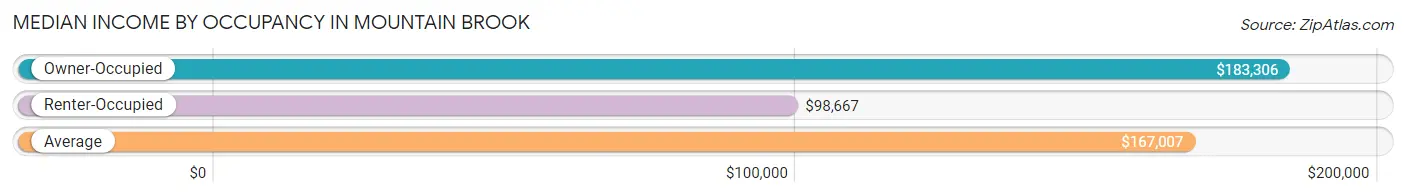
| Occupancy Type | # Households | Median Income |
| Owner-Occupied | 7,358 (89.4%) | $183,306 |
| Renter-Occupied | 872 (10.6%) | $98,667 |
| Average | 8,230 (100.0%) | $167,007 |
Occupancy by Householder Income Bracket in Mountain Brook
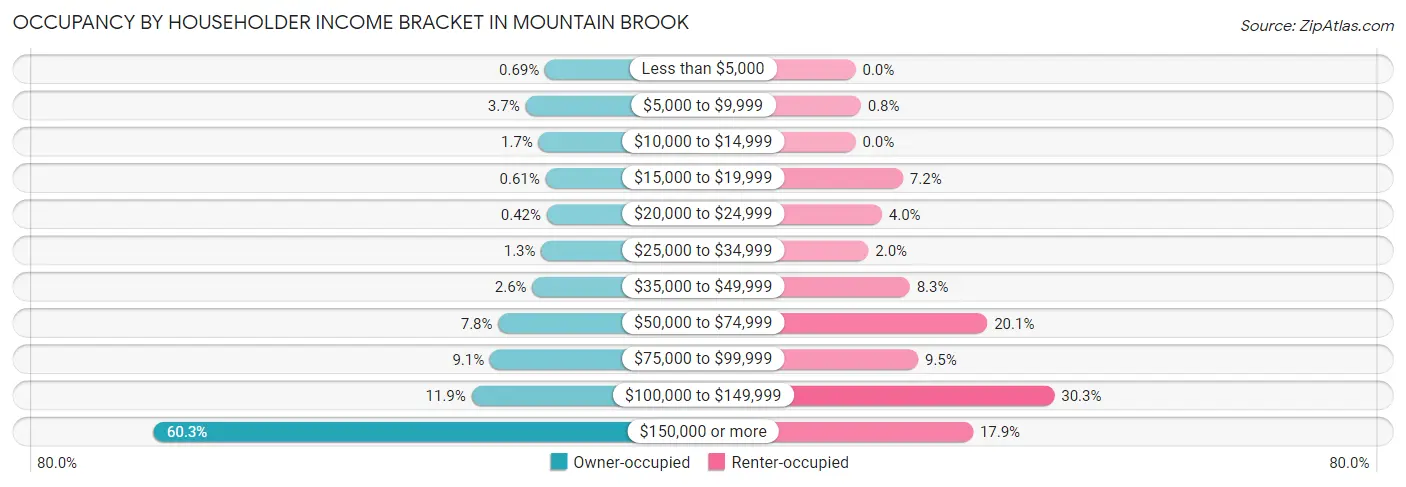
| Income Bracket | Owner-occupied | Renter-occupied |
| Less than $5,000 | 51 (0.7%) | 0 (0.0%) |
| $5,000 to $9,999 | 270 (3.7%) | 7 (0.8%) |
| $10,000 to $14,999 | 122 (1.7%) | 0 (0.0%) |
| $15,000 to $19,999 | 45 (0.6%) | 63 (7.2%) |
| $20,000 to $24,999 | 31 (0.4%) | 35 (4.0%) |
| $25,000 to $34,999 | 92 (1.3%) | 17 (1.9%) |
| $35,000 to $49,999 | 193 (2.6%) | 72 (8.3%) |
| $50,000 to $74,999 | 575 (7.8%) | 175 (20.1%) |
| $75,000 to $99,999 | 668 (9.1%) | 83 (9.5%) |
| $100,000 to $149,999 | 875 (11.9%) | 264 (30.3%) |
| $150,000 or more | 4,436 (60.3%) | 156 (17.9%) |
| Total | 7,358 (100.0%) | 872 (100.0%) |
Monthly Housing Cost Tiers in Mountain Brook
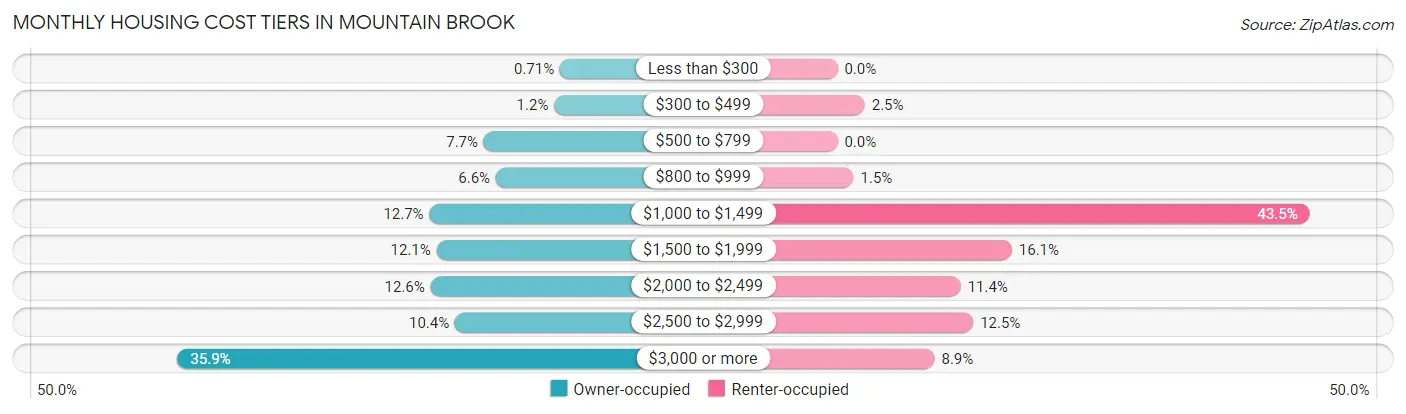
| Monthly Cost | Owner-occupied | Renter-occupied |
| Less than $300 | 52 (0.7%) | 0 (0.0%) |
| $300 to $499 | 91 (1.2%) | 22 (2.5%) |
| $500 to $799 | 568 (7.7%) | 0 (0.0%) |
| $800 to $999 | 486 (6.6%) | 13 (1.5%) |
| $1,000 to $1,499 | 937 (12.7%) | 379 (43.5%) |
| $1,500 to $1,999 | 888 (12.1%) | 140 (16.1%) |
| $2,000 to $2,499 | 929 (12.6%) | 99 (11.4%) |
| $2,500 to $2,999 | 763 (10.4%) | 109 (12.5%) |
| $3,000 or more | 2,644 (35.9%) | 78 (8.9%) |
| Total | 7,358 (100.0%) | 872 (100.0%) |
Physical Housing Characteristics in Mountain Brook
Housing Structures in Mountain Brook
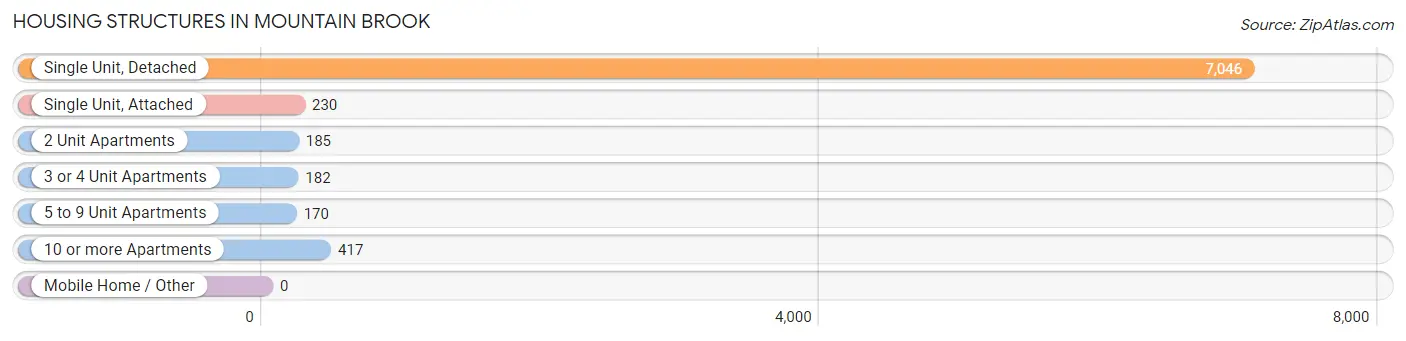
| Structure Type | # Housing Units | % Housing Units |
| Single Unit, Detached | 7,046 | 85.6% |
| Single Unit, Attached | 230 | 2.8% |
| 2 Unit Apartments | 185 | 2.2% |
| 3 or 4 Unit Apartments | 182 | 2.2% |
| 5 to 9 Unit Apartments | 170 | 2.1% |
| 10 or more Apartments | 417 | 5.1% |
| Mobile Home / Other | 0 | 0.0% |
| Total | 8,230 | 100.0% |
Housing Structures by Occupancy in Mountain Brook
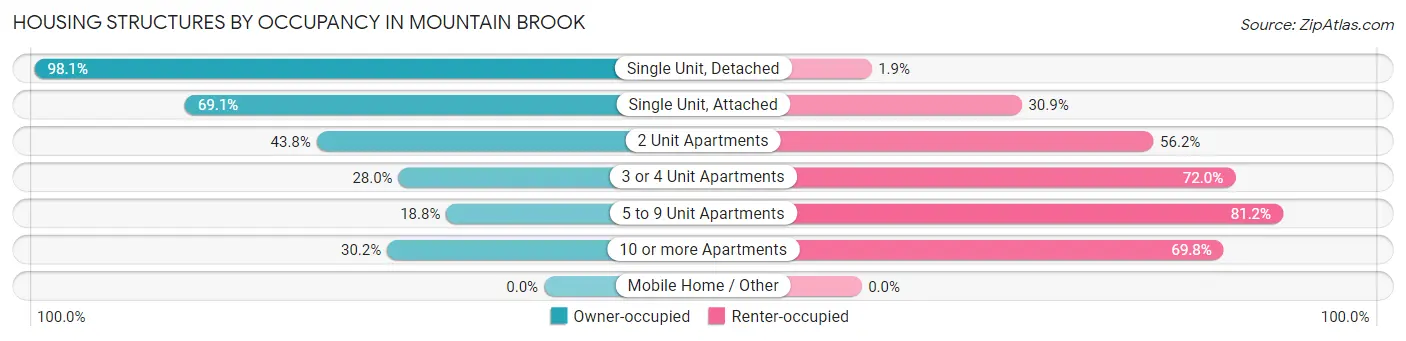
| Structure Type | Owner-occupied | Renter-occupied |
| Single Unit, Detached | 6,909 (98.1%) | 137 (1.9%) |
| Single Unit, Attached | 159 (69.1%) | 71 (30.9%) |
| 2 Unit Apartments | 81 (43.8%) | 104 (56.2%) |
| 3 or 4 Unit Apartments | 51 (28.0%) | 131 (72.0%) |
| 5 to 9 Unit Apartments | 32 (18.8%) | 138 (81.2%) |
| 10 or more Apartments | 126 (30.2%) | 291 (69.8%) |
| Mobile Home / Other | 0 (0.0%) | 0 (0.0%) |
| Total | 7,358 (89.4%) | 872 (10.6%) |
Housing Structures by Number of Rooms in Mountain Brook
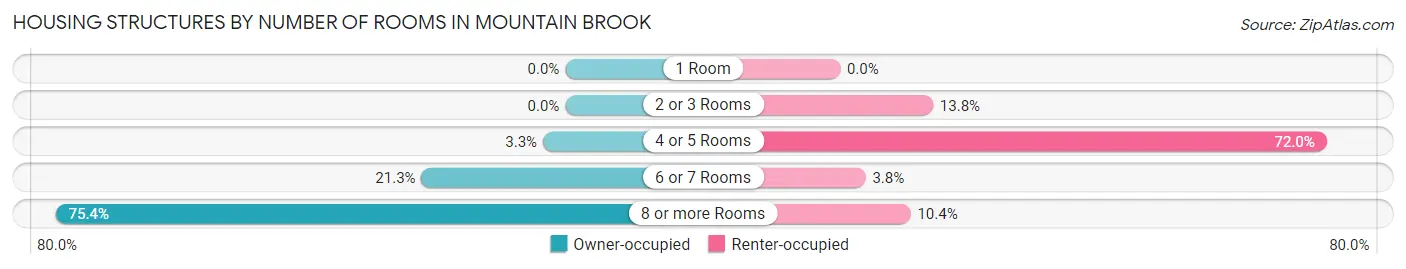
| Number of Rooms | Owner-occupied | Renter-occupied |
| 1 Room | 0 (0.0%) | 0 (0.0%) |
| 2 or 3 Rooms | 0 (0.0%) | 120 (13.8%) |
| 4 or 5 Rooms | 243 (3.3%) | 628 (72.0%) |
| 6 or 7 Rooms | 1,566 (21.3%) | 33 (3.8%) |
| 8 or more Rooms | 5,549 (75.4%) | 91 (10.4%) |
| Total | 7,358 (100.0%) | 872 (100.0%) |
Housing Structure by Heating Type in Mountain Brook
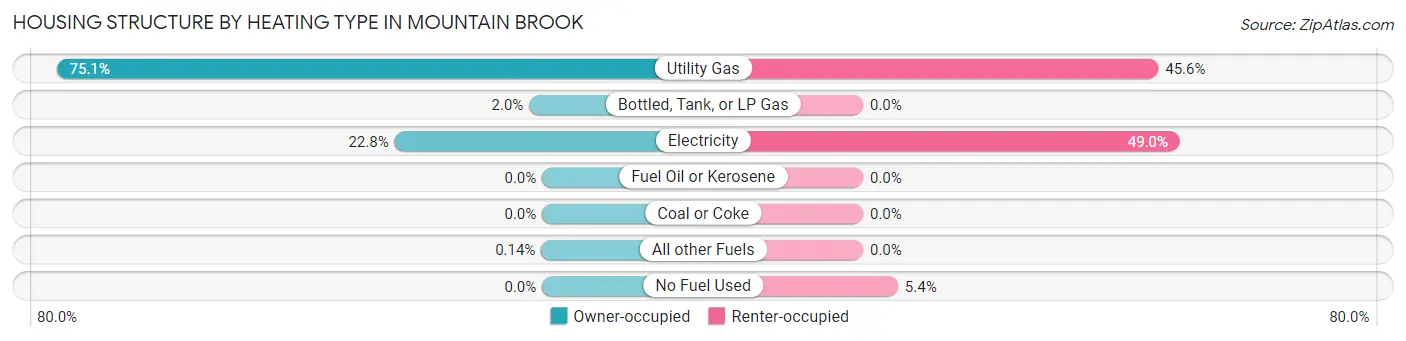
| Heating Type | Owner-occupied | Renter-occupied |
| Utility Gas | 5,522 (75.0%) | 398 (45.6%) |
| Bottled, Tank, or LP Gas | 147 (2.0%) | 0 (0.0%) |
| Electricity | 1,679 (22.8%) | 427 (49.0%) |
| Fuel Oil or Kerosene | 0 (0.0%) | 0 (0.0%) |
| Coal or Coke | 0 (0.0%) | 0 (0.0%) |
| All other Fuels | 10 (0.1%) | 0 (0.0%) |
| No Fuel Used | 0 (0.0%) | 47 (5.4%) |
| Total | 7,358 (100.0%) | 872 (100.0%) |
Household Vehicle Usage in Mountain Brook
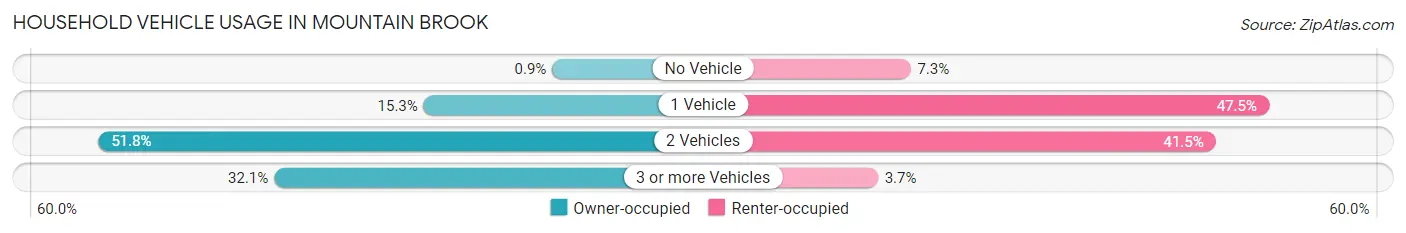
| Vehicles per Household | Owner-occupied | Renter-occupied |
| No Vehicle | 66 (0.9%) | 64 (7.3%) |
| 1 Vehicle | 1,126 (15.3%) | 414 (47.5%) |
| 2 Vehicles | 3,808 (51.7%) | 362 (41.5%) |
| 3 or more Vehicles | 2,358 (32.1%) | 32 (3.7%) |
| Total | 7,358 (100.0%) | 872 (100.0%) |
Real Estate & Mortgages in Mountain Brook
Real Estate and Mortgage Overview in Mountain Brook
| Characteristic | Without Mortgage | With Mortgage |
| Housing Units | 3,175 | 4,183 |
| Median Property Value | $867,900 | $764,000 |
| Median Household Income | $154,375 | $2,800 |
| Monthly Housing Costs | $1,317 | $2,421 |
| Real Estate Taxes | $7,391 | $50 |
Property Value by Mortgage Status in Mountain Brook
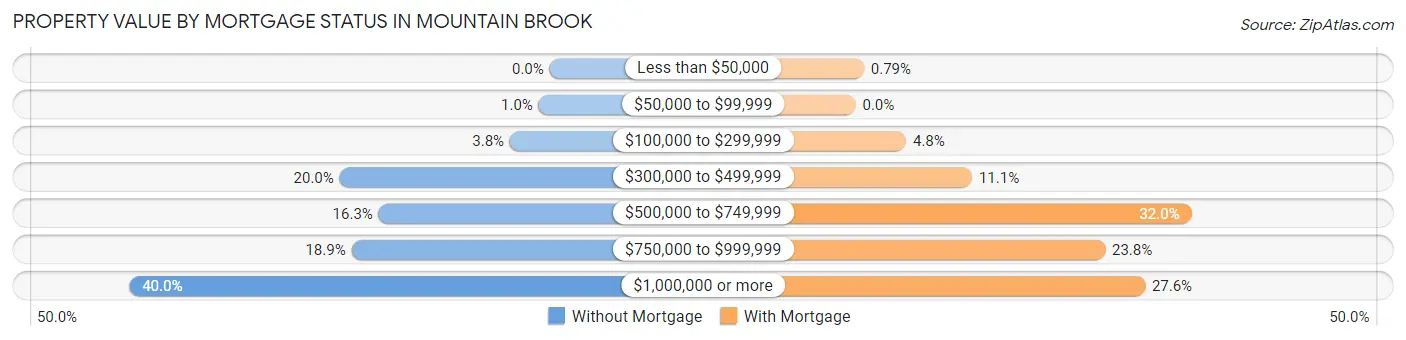
| Property Value | Without Mortgage | With Mortgage |
| Less than $50,000 | 0 (0.0%) | 33 (0.8%) |
| $50,000 to $99,999 | 33 (1.0%) | 0 (0.0%) |
| $100,000 to $299,999 | 120 (3.8%) | 201 (4.8%) |
| $300,000 to $499,999 | 635 (20.0%) | 464 (11.1%) |
| $500,000 to $749,999 | 517 (16.3%) | 1,338 (32.0%) |
| $750,000 to $999,999 | 599 (18.9%) | 994 (23.8%) |
| $1,000,000 or more | 1,271 (40.0%) | 1,153 (27.6%) |
| Total | 3,175 (100.0%) | 4,183 (100.0%) |
Household Income by Mortgage Status in Mountain Brook
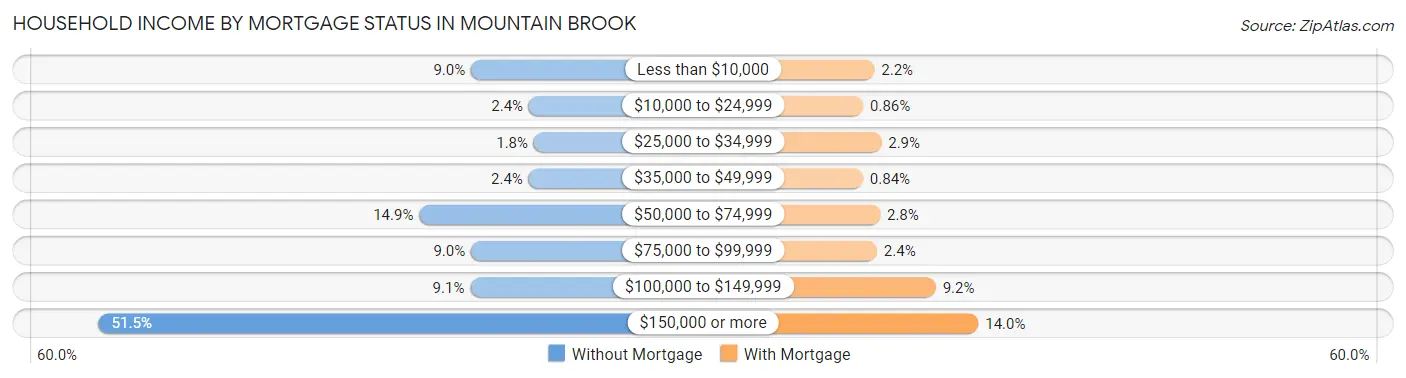
| Household Income | Without Mortgage | With Mortgage |
| Less than $10,000 | 285 (9.0%) | 90 (2.1%) |
| $10,000 to $24,999 | 75 (2.4%) | 36 (0.9%) |
| $25,000 to $34,999 | 57 (1.8%) | 123 (2.9%) |
| $35,000 to $49,999 | 76 (2.4%) | 35 (0.8%) |
| $50,000 to $74,999 | 473 (14.9%) | 117 (2.8%) |
| $75,000 to $99,999 | 285 (9.0%) | 102 (2.4%) |
| $100,000 to $149,999 | 288 (9.1%) | 383 (9.2%) |
| $150,000 or more | 1,636 (51.5%) | 587 (14.0%) |
| Total | 3,175 (100.0%) | 4,183 (100.0%) |
Property Value to Household Income Ratio in Mountain Brook
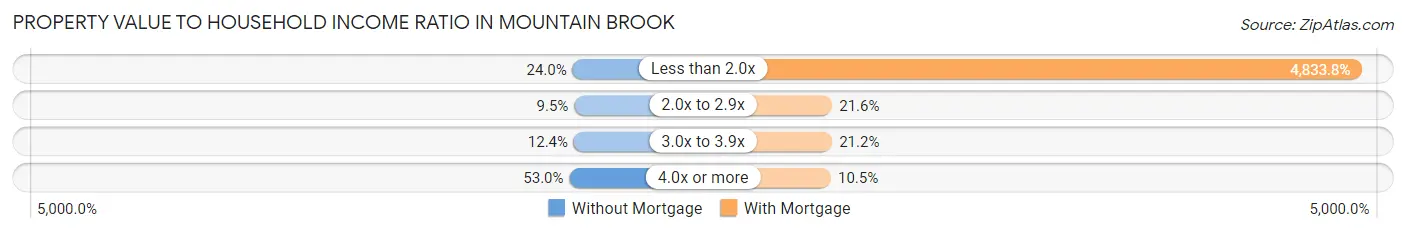
| Value-to-Income Ratio | Without Mortgage | With Mortgage |
| Less than 2.0x | 763 (24.0%) | 202,199 (4,833.8%) |
| 2.0x to 2.9x | 303 (9.5%) | 903 (21.6%) |
| 3.0x to 3.9x | 394 (12.4%) | 885 (21.2%) |
| 4.0x or more | 1,684 (53.0%) | 440 (10.5%) |
| Total | 3,175 (100.0%) | 4,183 (100.0%) |
Real Estate Taxes by Mortgage Status in Mountain Brook
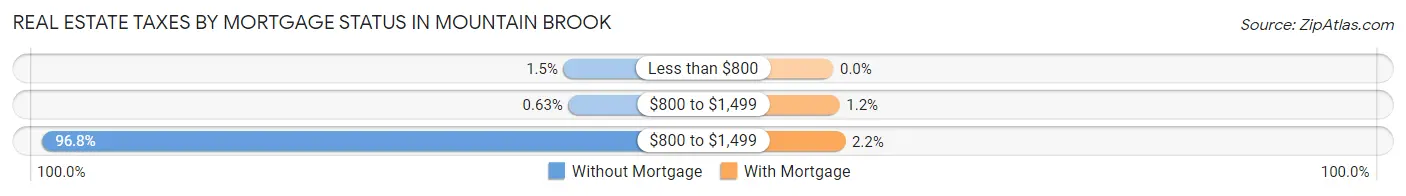
| Property Taxes | Without Mortgage | With Mortgage |
| Less than $800 | 48 (1.5%) | 0 (0.0%) |
| $800 to $1,499 | 20 (0.6%) | 48 (1.1%) |
| $800 to $1,499 | 3,072 (96.8%) | 91 (2.2%) |
| Total | 3,175 (100.0%) | 4,183 (100.0%) |
Health & Disability in Mountain Brook
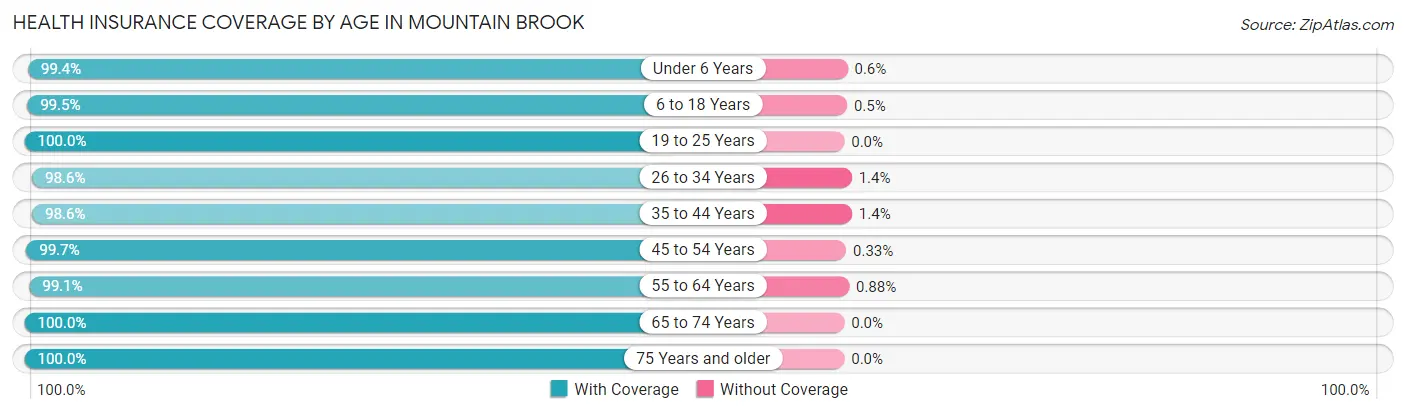
Health Insurance Coverage by Age in Mountain Brook
| Age Bracket | With Coverage | Without Coverage |
| Under 6 Years | 2,142 (99.4%) | 13 (0.6%) |
| 6 to 18 Years | 4,757 (99.5%) | 24 (0.5%) |
| 19 to 25 Years | 728 (100.0%) | 0 (0.0%) |
| 26 to 34 Years | 1,778 (98.6%) | 25 (1.4%) |
| 35 to 44 Years | 2,850 (98.6%) | 41 (1.4%) |
| 45 to 54 Years | 3,293 (99.7%) | 11 (0.3%) |
| 55 to 64 Years | 2,709 (99.1%) | 24 (0.9%) |
| 65 to 74 Years | 2,528 (100.0%) | 0 (0.0%) |
| 75 Years and older | 1,314 (100.0%) | 0 (0.0%) |
| Total | 22,099 (99.4%) | 138 (0.6%) |
Health Insurance Coverage by Citizenship Status in Mountain Brook
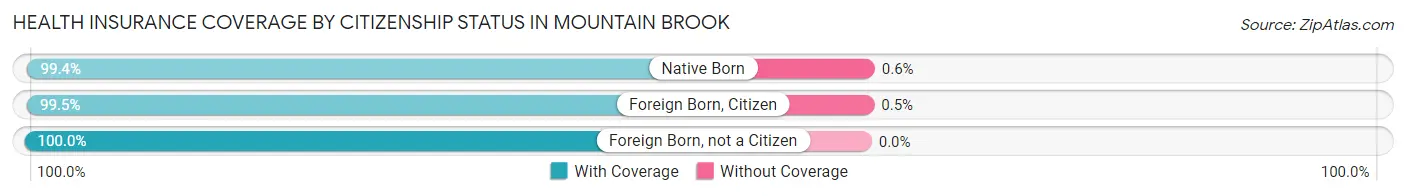
| Citizenship Status | With Coverage | Without Coverage |
| Native Born | 2,142 (99.4%) | 13 (0.6%) |
| Foreign Born, Citizen | 4,757 (99.5%) | 24 (0.5%) |
| Foreign Born, not a Citizen | 728 (100.0%) | 0 (0.0%) |
Health Insurance Coverage by Household Income in Mountain Brook
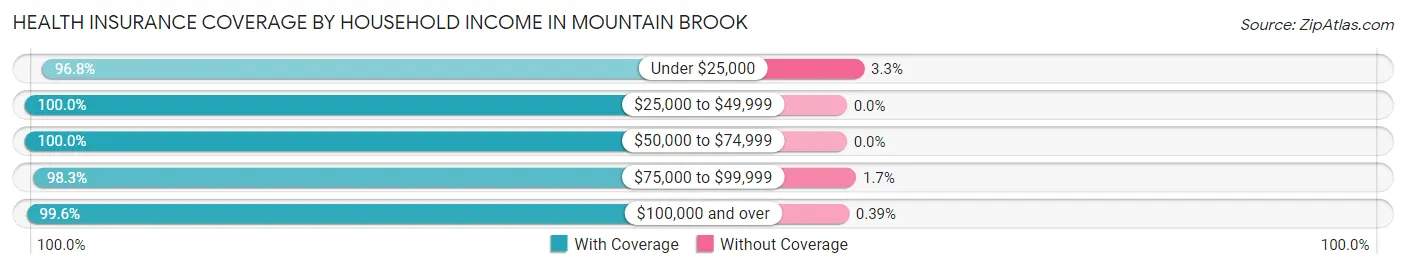
| Household Income | With Coverage | Without Coverage |
| Under $25,000 | 833 (96.8%) | 28 (3.3%) |
| $25,000 to $49,999 | 627 (100.0%) | 0 (0.0%) |
| $50,000 to $74,999 | 1,363 (100.0%) | 0 (0.0%) |
| $75,000 to $99,999 | 1,593 (98.3%) | 28 (1.7%) |
| $100,000 and over | 17,668 (99.6%) | 70 (0.4%) |
Public vs Private Health Insurance Coverage by Age in Mountain Brook
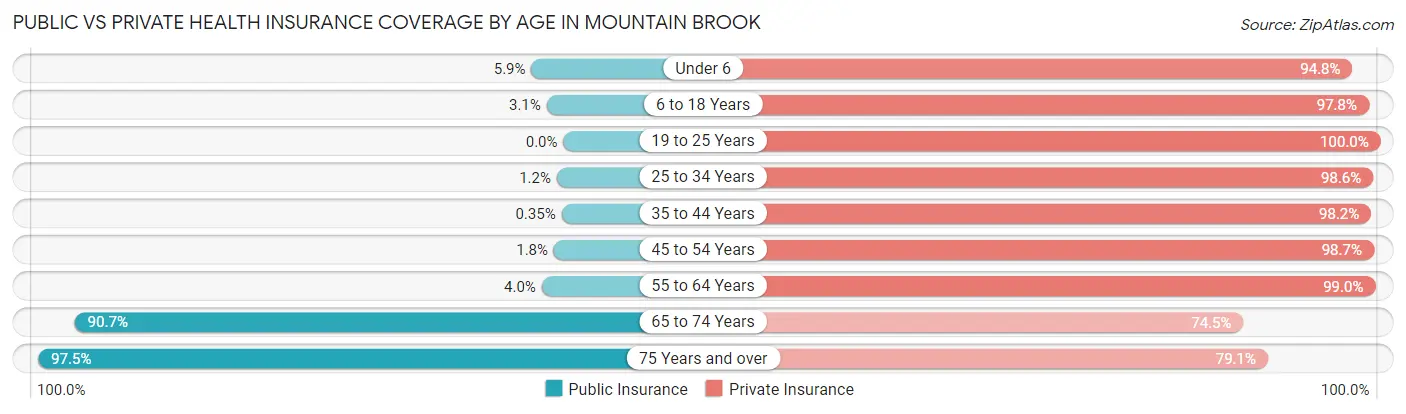
| Age Bracket | Public Insurance | Private Insurance |
| Under 6 | 128 (5.9%) | 2,042 (94.8%) |
| 6 to 18 Years | 148 (3.1%) | 4,677 (97.8%) |
| 19 to 25 Years | 0 (0.0%) | 728 (100.0%) |
| 25 to 34 Years | 22 (1.2%) | 1,778 (98.6%) |
| 35 to 44 Years | 10 (0.4%) | 2,840 (98.2%) |
| 45 to 54 Years | 58 (1.8%) | 3,262 (98.7%) |
| 55 to 64 Years | 110 (4.0%) | 2,706 (99.0%) |
| 65 to 74 Years | 2,293 (90.7%) | 1,884 (74.5%) |
| 75 Years and over | 1,281 (97.5%) | 1,039 (79.1%) |
| Total | 4,050 (18.2%) | 20,956 (94.2%) |
Disability Status by Sex by Age in Mountain Brook
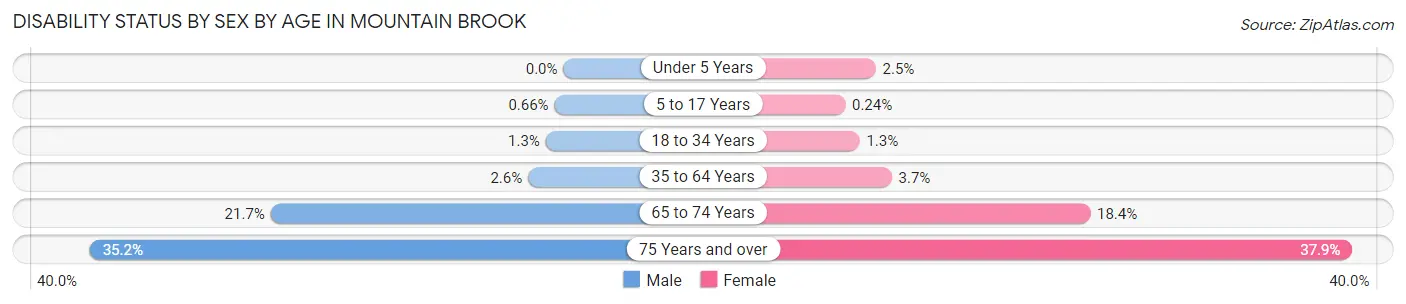
| Age Bracket | Male | Female |
| Under 5 Years | 0 (0.0%) | 24 (2.5%) |
| 5 to 17 Years | 17 (0.7%) | 5 (0.2%) |
| 18 to 34 Years | 17 (1.3%) | 22 (1.3%) |
| 35 to 64 Years | 110 (2.6%) | 175 (3.7%) |
| 65 to 74 Years | 284 (21.7%) | 225 (18.4%) |
| 75 Years and over | 167 (35.2%) | 318 (37.9%) |
Disability Class by Sex by Age in Mountain Brook
Disability Class: Hearing Difficulty
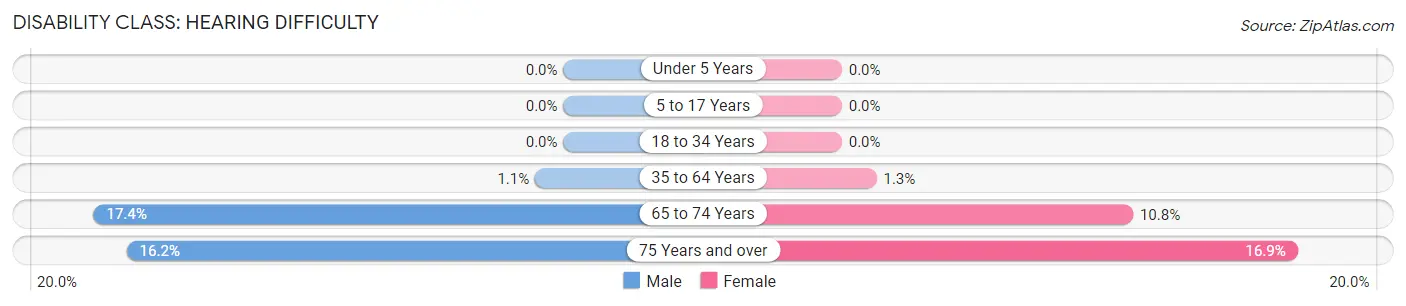
| Age Bracket | Male | Female |
| Under 5 Years | 0 (0.0%) | 0 (0.0%) |
| 5 to 17 Years | 0 (0.0%) | 0 (0.0%) |
| 18 to 34 Years | 0 (0.0%) | 0 (0.0%) |
| 35 to 64 Years | 44 (1.1%) | 61 (1.3%) |
| 65 to 74 Years | 228 (17.4%) | 132 (10.8%) |
| 75 Years and over | 77 (16.2%) | 142 (16.9%) |
Disability Class: Vision Difficulty
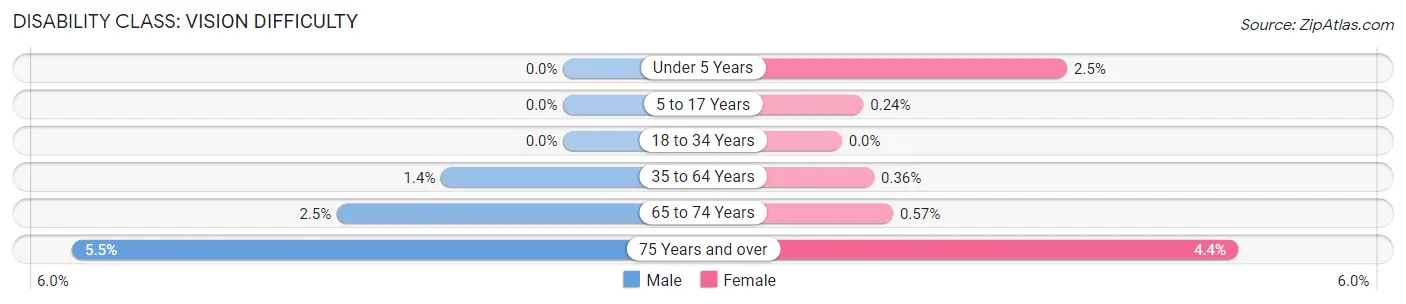
| Age Bracket | Male | Female |
| Under 5 Years | 0 (0.0%) | 24 (2.5%) |
| 5 to 17 Years | 0 (0.0%) | 5 (0.2%) |
| 18 to 34 Years | 0 (0.0%) | 0 (0.0%) |
| 35 to 64 Years | 57 (1.4%) | 17 (0.4%) |
| 65 to 74 Years | 33 (2.5%) | 7 (0.6%) |
| 75 Years and over | 26 (5.5%) | 37 (4.4%) |
Disability Class: Cognitive Difficulty
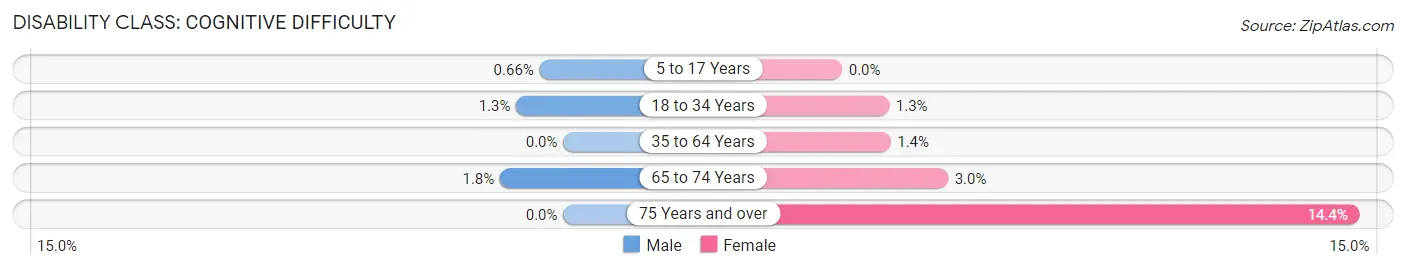
| Age Bracket | Male | Female |
| 5 to 17 Years | 17 (0.7%) | 0 (0.0%) |
| 18 to 34 Years | 17 (1.3%) | 22 (1.3%) |
| 35 to 64 Years | 0 (0.0%) | 64 (1.3%) |
| 65 to 74 Years | 23 (1.8%) | 36 (2.9%) |
| 75 Years and over | 0 (0.0%) | 121 (14.4%) |
Disability Class: Ambulatory Difficulty
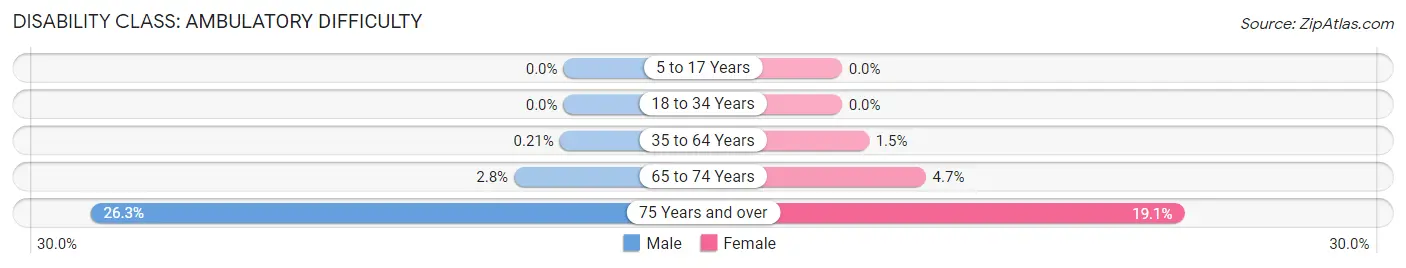
| Age Bracket | Male | Female |
| 5 to 17 Years | 0 (0.0%) | 0 (0.0%) |
| 18 to 34 Years | 0 (0.0%) | 0 (0.0%) |
| 35 to 64 Years | 9 (0.2%) | 71 (1.5%) |
| 65 to 74 Years | 36 (2.8%) | 57 (4.7%) |
| 75 Years and over | 125 (26.3%) | 160 (19.1%) |
Disability Class: Self-Care Difficulty
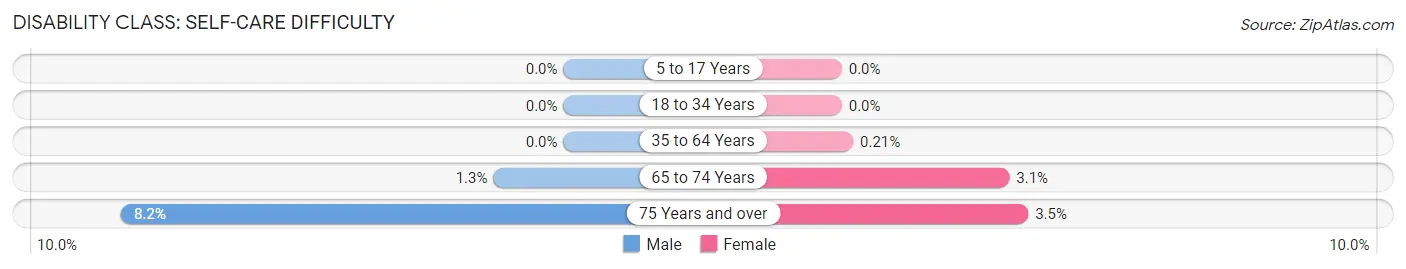
| Age Bracket | Male | Female |
| 5 to 17 Years | 0 (0.0%) | 0 (0.0%) |
| 18 to 34 Years | 0 (0.0%) | 0 (0.0%) |
| 35 to 64 Years | 0 (0.0%) | 10 (0.2%) |
| 65 to 74 Years | 17 (1.3%) | 38 (3.1%) |
| 75 Years and over | 39 (8.2%) | 29 (3.5%) |
Technology Access in Mountain Brook
Computing Device Access in Mountain Brook
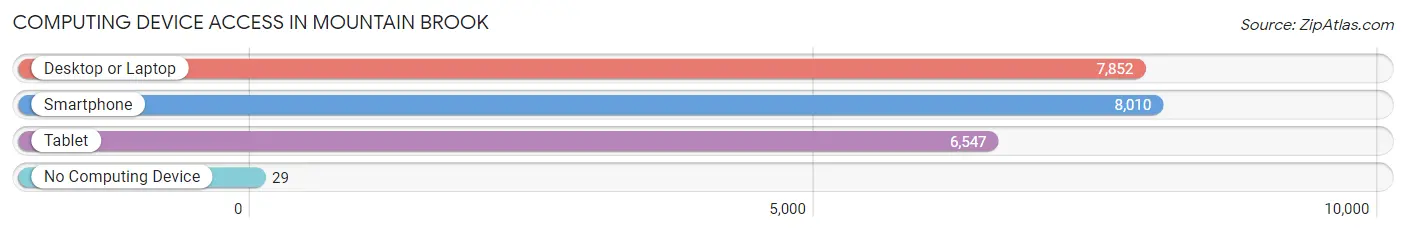
| Device Type | # Households | % Households |
| Desktop or Laptop | 7,852 | 95.4% |
| Smartphone | 8,010 | 97.3% |
| Tablet | 6,547 | 79.5% |
| No Computing Device | 29 | 0.4% |
| Total | 8,230 | 100.0% |
Internet Access in Mountain Brook
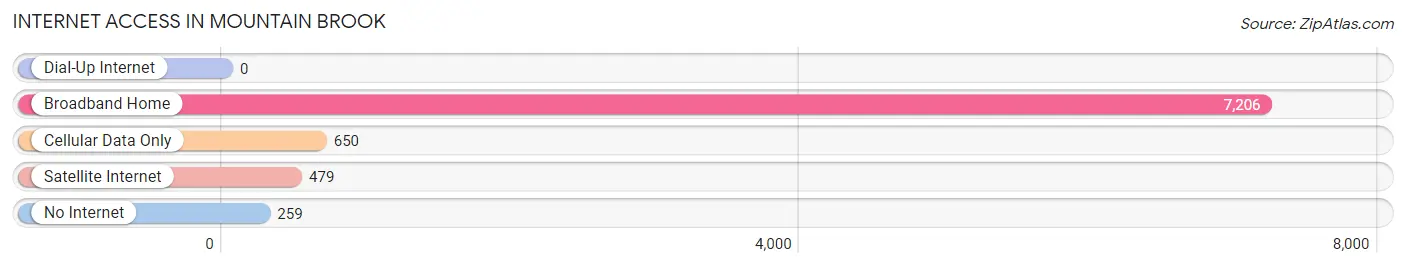
| Internet Type | # Households | % Households |
| Dial-Up Internet | 0 | 0.0% |
| Broadband Home | 7,206 | 87.6% |
| Cellular Data Only | 650 | 7.9% |
| Satellite Internet | 479 | 5.8% |
| No Internet | 259 | 3.2% |
| Total | 8,230 | 100.0% |
Mountain Brook Summary
Mountain Brook is a city located in Jefferson County, Alabama, United States. It is a suburb of Birmingham, located approximately 8 miles south of the city. The population was 20,413 at the 2010 census.
History
Mountain Brook was founded in 1929 by Robert Jemison, Jr., a real estate developer from Birmingham. He purchased the land from the Erskine family, who had owned it since the mid-1800s. Jemison envisioned a planned community that would be a refuge from the hustle and bustle of the city. He designed the community with winding roads, large lots, and plenty of green space. The city was incorporated in 1942.
Geography
Mountain Brook is located at 33°30'25" North, 86°45'17" West (33.506944, -86.754722). According to the U.S. Census Bureau, the city has a total area of 10.2 square miles, of which 10.1 square miles is land and 0.1 square miles is water.
Economy
Mountain Brook is a wealthy suburb of Birmingham and is home to many affluent residents. The city has a strong economy, with many businesses and organizations located in the area. The largest employers in the city are Brookwood Medical Center, Mountain Brook City Schools, and the Mountain Brook Chamber of Commerce.
Demographics
As of the 2010 census, there were 20,413 people, 8,093 households, and 5,845 families residing in the city. The population density was 2,011.3 people per square mile. The racial makeup of the city was 92.2% White, 4.2% Black or African American, 0.2% Native American, 2.3% Asian, 0.1% Pacific Islander, 0.5% from other races, and 0.7% from two or more races. Hispanic or Latino of any race were 1.7% of the population.
The median income for a household in the city was $125,845, and the median income for a family was $150,945. The per capita income for the city was $68,945. About 2.2% of families and 3.2% of the population were below the poverty line, including 3.7% of those under age 18 and 2.2% of those age 65 or over.
Common Questions
What is Per Capita Income in Mountain Brook?
Per Capita income in Mountain Brook is $97,390.
What is the Median Family Income in Mountain Brook?
Median Family Income in Mountain Brook is $206,417.
What is the Median Household income in Mountain Brook?
Median Household Income in Mountain Brook is $167,007.
What is Income or Wage Gap in Mountain Brook?
Income or Wage Gap in Mountain Brook is 54.7%.
Women in Mountain Brook earn 45.3 cents for every dollar earned by a man.
What is Inequality or Gini Index in Mountain Brook?
Inequality or Gini Index in Mountain Brook is 0.51.
What is the Total Population of Mountain Brook?
Total Population of Mountain Brook is 22,259.
What is the Total Male Population of Mountain Brook?
Total Male Population of Mountain Brook is 10,705.
What is the Total Female Population of Mountain Brook?
Total Female Population of Mountain Brook is 11,554.
What is the Ratio of Males per 100 Females in Mountain Brook?
There are 92.65 Males per 100 Females in Mountain Brook.
What is the Ratio of Females per 100 Males in Mountain Brook?
There are 107.93 Females per 100 Males in Mountain Brook.
What is the Median Population Age in Mountain Brook?
Median Population Age in Mountain Brook is 41.1 Years.
What is the Average Family Size in Mountain Brook
Average Family Size in Mountain Brook is 3.2 People.
What is the Average Household Size in Mountain Brook
Average Household Size in Mountain Brook is 2.7 People.
How Large is the Labor Force in Mountain Brook?
There are 9,989 People in the Labor Forcein in Mountain Brook.
What is the Percentage of People in the Labor Force in Mountain Brook?
60.6% of People are in the Labor Force in Mountain Brook.
What is the Unemployment Rate in Mountain Brook?
Unemployment Rate in Mountain Brook is 0.9%.