Happy Valley, OR Map & Demographics
Happy Valley Map
Happy Valley Overview
$54,453
PER CAPITA INCOME
$139,850
AVG FAMILY INCOME
$126,108
AVG HOUSEHOLD INCOME
37.4%
WAGE / INCOME GAP [ % ]
62.6¢/ $1
WAGE / INCOME GAP [ $ ]
0.43
INEQUALITY / GINI INDEX
24,381
TOTAL POPULATION
12,269
MALE POPULATION
12,112
FEMALE POPULATION
101.30
MALES / 100 FEMALES
98.72
FEMALES / 100 MALES
39.7
MEDIAN AGE
3.3
AVG FAMILY SIZE
3.0
AVG HOUSEHOLD SIZE
12,546
LABOR FORCE [ PEOPLE ]
67.5%
PERCENT IN LABOR FORCE
3.8%
UNEMPLOYMENT RATE
Happy Valley Zip Codes
Happy Valley Area Codes
Income in Happy Valley
Income Overview in Happy Valley
Per Capita Income in Happy Valley is $54,453, while median incomes of families and households are $139,850 and $126,108 respectively.
| Characteristic | Number | Measure |
| Per Capita Income | 24,381 | $54,453 |
| Median Family Income | 6,489 | $139,850 |
| Mean Family Income | 6,489 | $174,792 |
| Median Household Income | 8,148 | $126,108 |
| Mean Household Income | 8,148 | $160,954 |
| Income Deficit | 6,489 | $0 |
| Wage / Income Gap (%) | 24,381 | 37.40% |
| Wage / Income Gap ($) | 24,381 | 62.60¢ per $1 |
| Gini / Inequality Index | 24,381 | 0.43 |
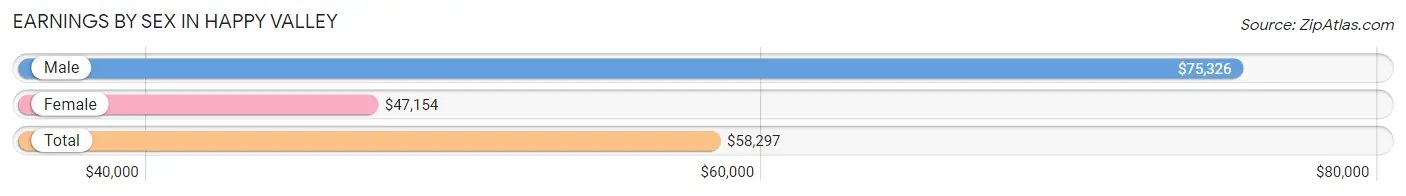
Earnings by Sex in Happy Valley
Average Earnings in Happy Valley are $58,297, $75,326 for men and $47,154 for women, a difference of 37.4%.
| Sex | Number | Average Earnings |
| Male | 6,996 (53.1%) | $75,326 |
| Female | 6,186 (46.9%) | $47,154 |
| Total | 13,182 (100.0%) | $58,297 |
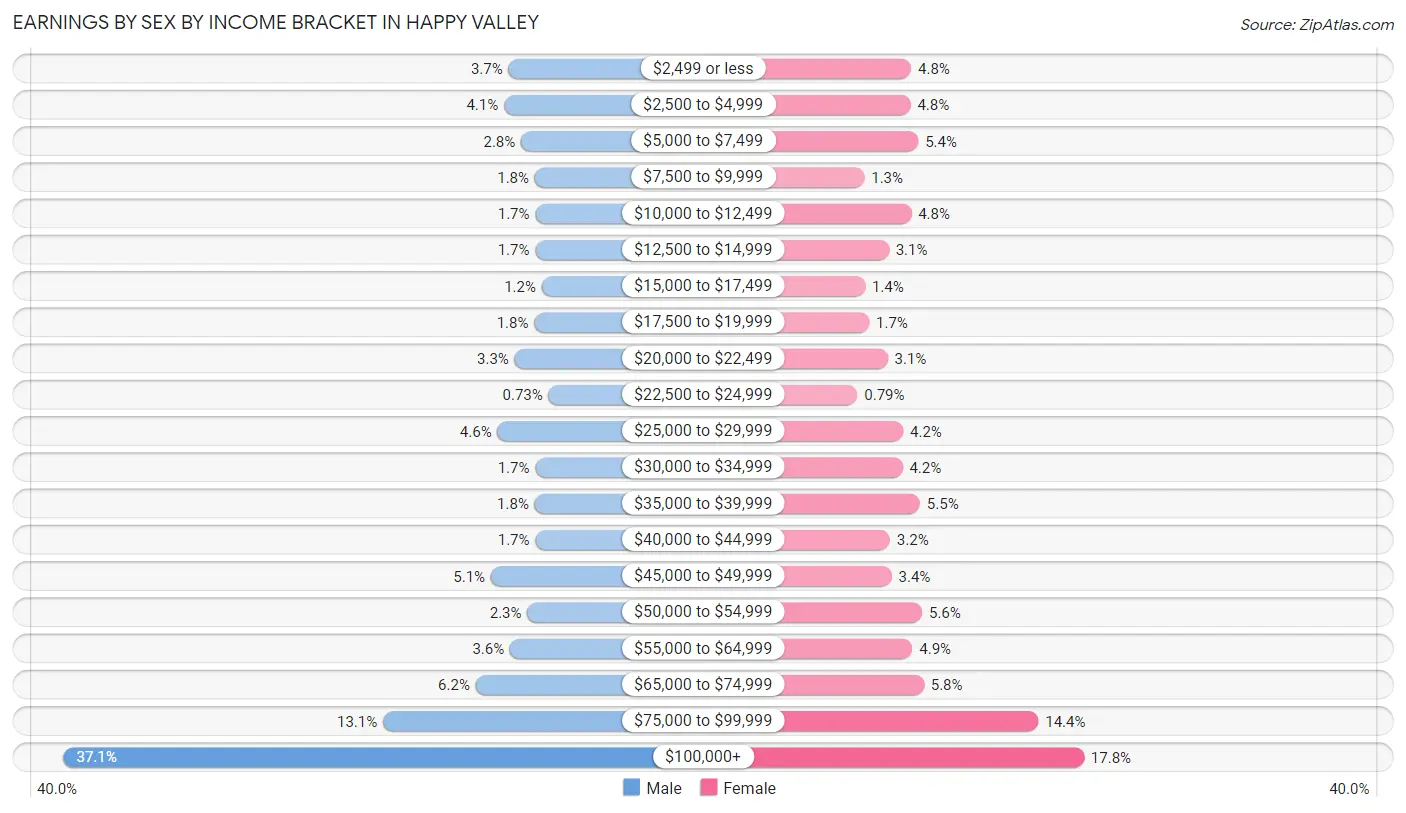
Earnings by Sex by Income Bracket in Happy Valley
The most common earnings brackets in Happy Valley are $100,000+ for men (2,594 | 37.1%) and $100,000+ for women (1,099 | 17.8%).
| Income | Male | Female |
| $2,499 or less | 261 (3.7%) | 298 (4.8%) |
| $2,500 to $4,999 | 285 (4.1%) | 295 (4.8%) |
| $5,000 to $7,499 | 195 (2.8%) | 331 (5.3%) |
| $7,500 to $9,999 | 123 (1.8%) | 81 (1.3%) |
| $10,000 to $12,499 | 120 (1.7%) | 299 (4.8%) |
| $12,500 to $14,999 | 121 (1.7%) | 194 (3.1%) |
| $15,000 to $17,499 | 87 (1.2%) | 84 (1.4%) |
| $17,500 to $19,999 | 126 (1.8%) | 103 (1.7%) |
| $20,000 to $22,499 | 229 (3.3%) | 189 (3.1%) |
| $22,500 to $24,999 | 51 (0.7%) | 49 (0.8%) |
| $25,000 to $29,999 | 319 (4.6%) | 261 (4.2%) |
| $30,000 to $34,999 | 121 (1.7%) | 258 (4.2%) |
| $35,000 to $39,999 | 124 (1.8%) | 339 (5.5%) |
| $40,000 to $44,999 | 120 (1.7%) | 200 (3.2%) |
| $45,000 to $49,999 | 353 (5.1%) | 208 (3.4%) |
| $50,000 to $54,999 | 162 (2.3%) | 349 (5.6%) |
| $55,000 to $64,999 | 253 (3.6%) | 304 (4.9%) |
| $65,000 to $74,999 | 433 (6.2%) | 357 (5.8%) |
| $75,000 to $99,999 | 919 (13.1%) | 888 (14.3%) |
| $100,000+ | 2,594 (37.1%) | 1,099 (17.8%) |
| Total | 6,996 (100.0%) | 6,186 (100.0%) |
Earnings by Sex by Educational Attainment in Happy Valley
Average earnings in Happy Valley are $84,220 for men and $53,978 for women, a difference of 35.9%. Men with an educational attainment of graduate degree enjoy the highest average annual earnings of $121,058, while those with college or associate's degree education earn the least with $64,509. Women with an educational attainment of graduate degree earn the most with the average annual earnings of $68,220, while those with high school diploma education have the smallest earnings of $23,173.
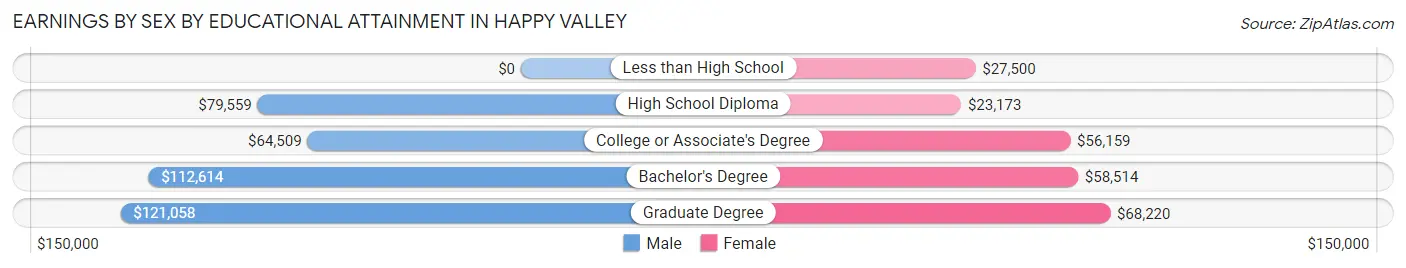
| Educational Attainment | Male Income | Female Income |
| Less than High School | - | - |
| High School Diploma | $79,559 | $23,173 |
| College or Associate's Degree | $64,509 | $56,159 |
| Bachelor's Degree | $112,614 | $58,514 |
| Graduate Degree | $121,058 | $68,220 |
| Total | $84,220 | $53,978 |
Family Income in Happy Valley
Family Income Brackets in Happy Valley
According to the Happy Valley family income data, there are 1,817 families falling into the $200,000+ income range, which is the most common income bracket and makes up 28.0% of all families. Conversely, the $15,000 to $24,999 income bracket is the least frequent group with only 13 families (0.2%) belonging to this category.
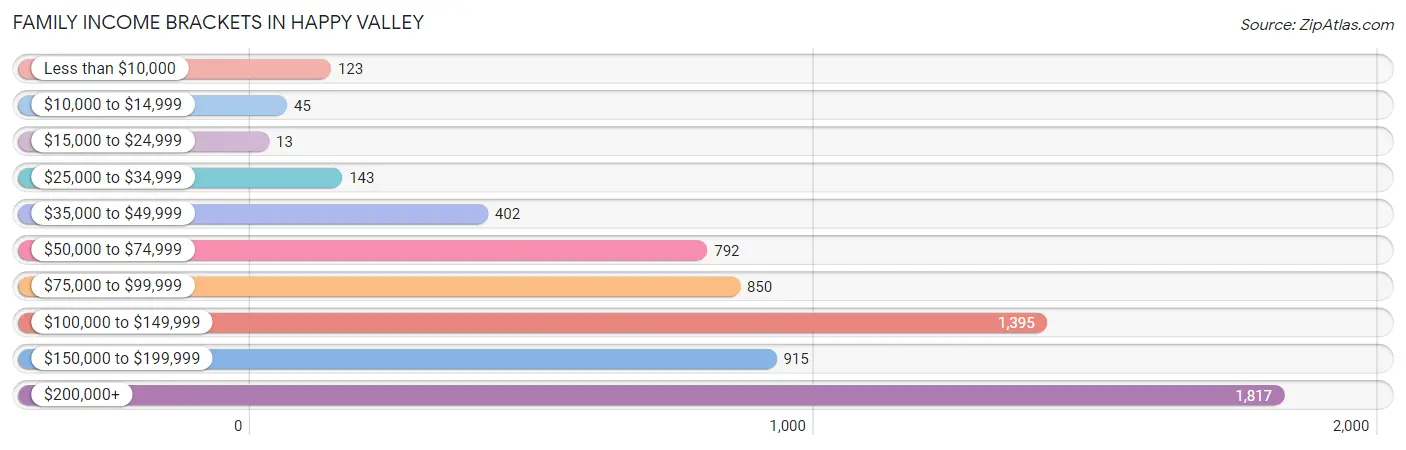
| Income Bracket | # Families | % Families |
| Less than $10,000 | 123 | 1.9% |
| $10,000 to $14,999 | 45 | 0.7% |
| $15,000 to $24,999 | 13 | 0.2% |
| $25,000 to $34,999 | 143 | 2.2% |
| $35,000 to $49,999 | 402 | 6.2% |
| $50,000 to $74,999 | 792 | 12.2% |
| $75,000 to $99,999 | 850 | 13.1% |
| $100,000 to $149,999 | 1,395 | 21.5% |
| $150,000 to $199,999 | 915 | 14.1% |
| $200,000+ | 1,817 | 28.0% |
Family Income by Famaliy Size in Happy Valley
7+ person families (130 | 2.0%) account for the highest median family income in Happy Valley with $250,001 per family, while 2-person families (2,605 | 40.1%) have the highest median income of $49,915 per family member.
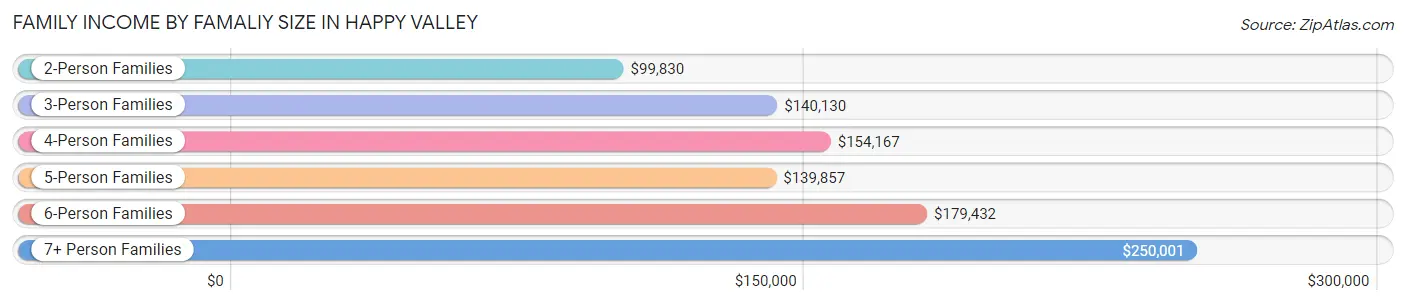
| Income Bracket | # Families | Median Income |
| 2-Person Families | 2,605 (40.1%) | $99,830 |
| 3-Person Families | 1,577 (24.3%) | $140,130 |
| 4-Person Families | 1,452 (22.4%) | $154,167 |
| 5-Person Families | 626 (9.7%) | $139,857 |
| 6-Person Families | 99 (1.5%) | $179,432 |
| 7+ Person Families | 130 (2.0%) | $250,001 |
| Total | 6,489 (100.0%) | $139,850 |
Family Income by Number of Earners in Happy Valley
The median family income in Happy Valley is $139,850, with families comprising 3+ earners (923) having the highest median family income of $227,522, while families with no earners (805) have the lowest median family income of $68,535, accounting for 14.2% and 12.4% of families, respectively.
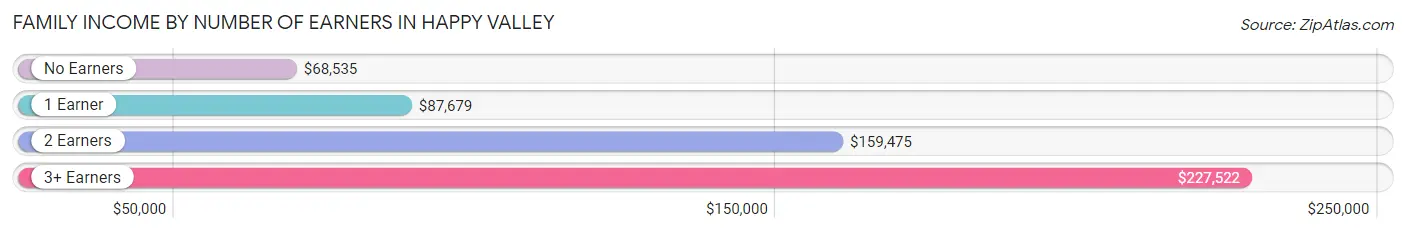
| Number of Earners | # Families | Median Income |
| No Earners | 805 (12.4%) | $68,535 |
| 1 Earner | 1,843 (28.4%) | $87,679 |
| 2 Earners | 2,918 (45.0%) | $159,475 |
| 3+ Earners | 923 (14.2%) | $227,522 |
| Total | 6,489 (100.0%) | $139,850 |
Household Income in Happy Valley
Household Income Brackets in Happy Valley
With 2,078 households falling in the category, the $200,000+ income range is the most frequent in Happy Valley, accounting for 25.5% of all households. In contrast, only 49 households (0.6%) fall into the $10,000 to $14,999 income bracket, making it the least populous group.
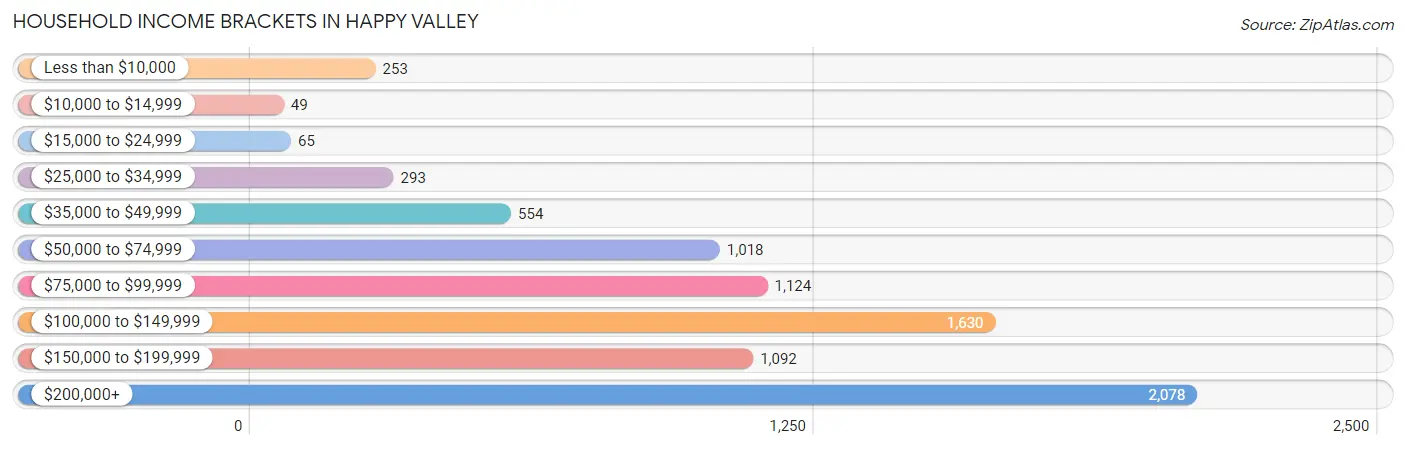
| Income Bracket | # Households | % Households |
| Less than $10,000 | 253 | 3.1% |
| $10,000 to $14,999 | 49 | 0.6% |
| $15,000 to $24,999 | 65 | 0.8% |
| $25,000 to $34,999 | 293 | 3.6% |
| $35,000 to $49,999 | 554 | 6.8% |
| $50,000 to $74,999 | 1,018 | 12.5% |
| $75,000 to $99,999 | 1,124 | 13.8% |
| $100,000 to $149,999 | 1,630 | 20.0% |
| $150,000 to $199,999 | 1,092 | 13.4% |
| $200,000+ | 2,078 | 25.5% |
Household Income by Householder Age in Happy Valley
The median household income in Happy Valley is $126,108, with the highest median household income of $159,167 found in the 45 to 64 years age bracket for the primary householder. A total of 3,302 households (40.5%) fall into this category. Meanwhile, the 15 to 24 years age bracket for the primary householder has the lowest median household income of $0, with 64 households (0.8%) in this group.
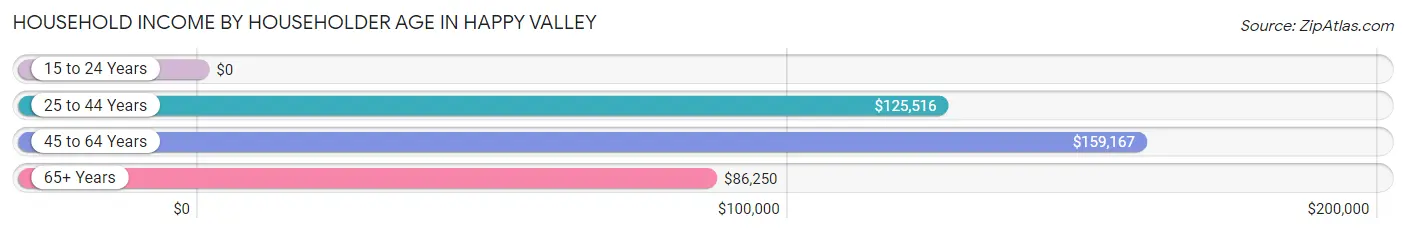
| Income Bracket | # Households | Median Income |
| 15 to 24 Years | 64 (0.8%) | $0 |
| 25 to 44 Years | 2,820 (34.6%) | $125,516 |
| 45 to 64 Years | 3,302 (40.5%) | $159,167 |
| 65+ Years | 1,962 (24.1%) | $86,250 |
| Total | 8,148 (100.0%) | $126,108 |
Poverty in Happy Valley
Income Below Poverty by Sex and Age in Happy Valley
With 4.5% poverty level for males and 6.7% for females among the residents of Happy Valley, under 5 year old males and 25 to 34 year old females are the most vulnerable to poverty, with 89 males (13.9%) and 235 females (20.6%) in their respective age groups living below the poverty level.
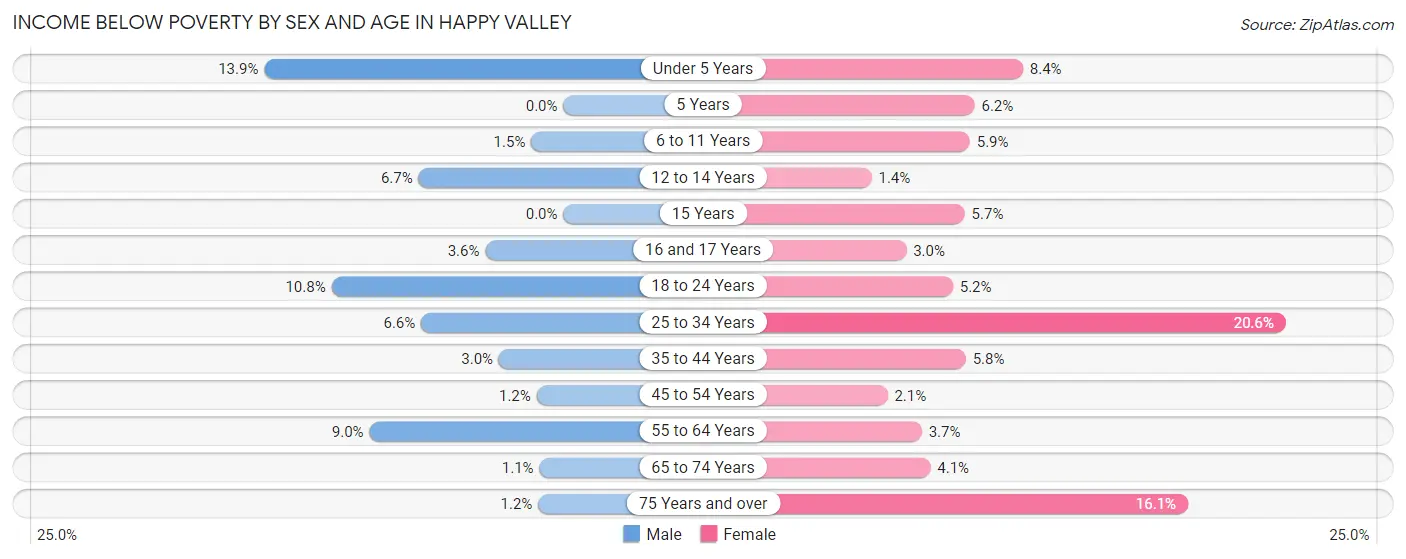
| Age Bracket | Male | Female |
| Under 5 Years | 89 (13.9%) | 30 (8.4%) |
| 5 Years | 0 (0.0%) | 13 (6.2%) |
| 6 to 11 Years | 17 (1.5%) | 77 (5.9%) |
| 12 to 14 Years | 57 (6.7%) | 11 (1.4%) |
| 15 Years | 0 (0.0%) | 9 (5.7%) |
| 16 and 17 Years | 20 (3.6%) | 11 (3.0%) |
| 18 to 24 Years | 75 (10.8%) | 54 (5.1%) |
| 25 to 34 Years | 68 (6.6%) | 235 (20.6%) |
| 35 to 44 Years | 57 (3.0%) | 104 (5.8%) |
| 45 to 54 Years | 22 (1.2%) | 36 (2.1%) |
| 55 to 64 Years | 125 (9.0%) | 52 (3.7%) |
| 65 to 74 Years | 14 (1.1%) | 40 (4.1%) |
| 75 Years and over | 8 (1.2%) | 136 (16.1%) |
| Total | 552 (4.5%) | 808 (6.7%) |
Income Above Poverty by Sex and Age in Happy Valley
According to the poverty statistics in Happy Valley, males aged 5 years and females aged 12 to 14 years are the age groups that are most secure financially, with 100.0% of males and 98.6% of females in these age groups living above the poverty line.
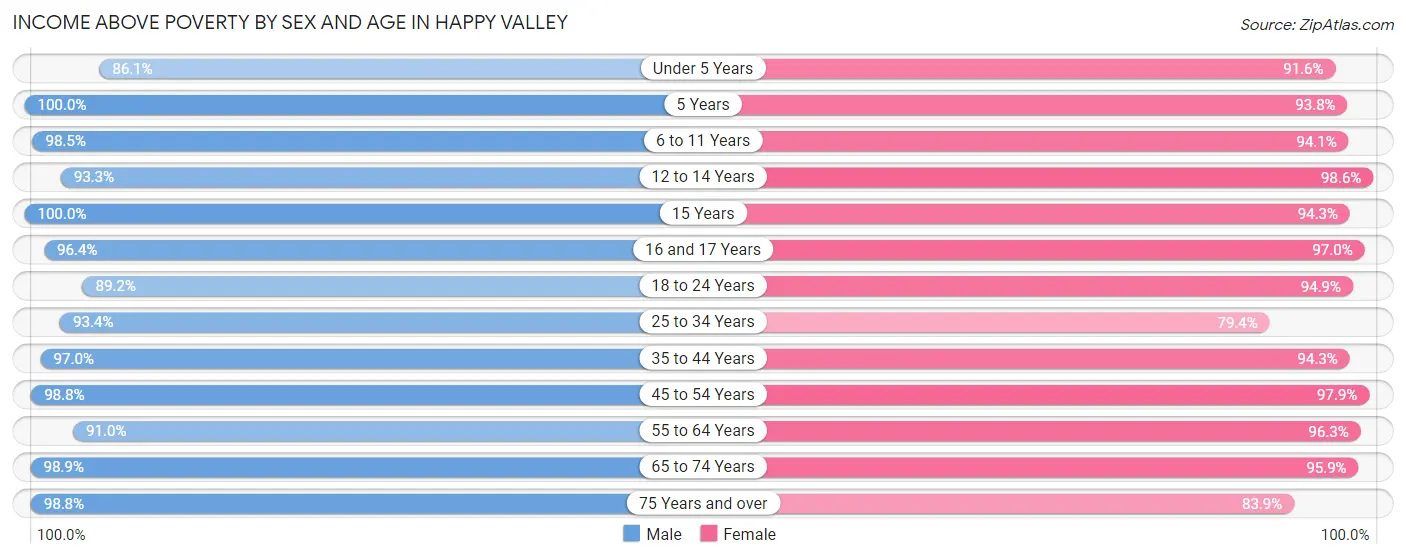
| Age Bracket | Male | Female |
| Under 5 Years | 552 (86.1%) | 327 (91.6%) |
| 5 Years | 131 (100.0%) | 198 (93.8%) |
| 6 to 11 Years | 1,125 (98.5%) | 1,219 (94.1%) |
| 12 to 14 Years | 791 (93.3%) | 786 (98.6%) |
| 15 Years | 186 (100.0%) | 149 (94.3%) |
| 16 and 17 Years | 533 (96.4%) | 357 (97.0%) |
| 18 to 24 Years | 622 (89.2%) | 994 (94.9%) |
| 25 to 34 Years | 963 (93.4%) | 906 (79.4%) |
| 35 to 44 Years | 1,851 (97.0%) | 1,706 (94.3%) |
| 45 to 54 Years | 1,748 (98.8%) | 1,659 (97.9%) |
| 55 to 64 Years | 1,264 (91.0%) | 1,350 (96.3%) |
| 65 to 74 Years | 1,248 (98.9%) | 934 (95.9%) |
| 75 Years and over | 678 (98.8%) | 711 (83.9%) |
| Total | 11,692 (95.5%) | 11,296 (93.3%) |
Income Below Poverty Among Married-Couple Families in Happy Valley
The poverty statistics for married-couple families in Happy Valley show that 1.4% or 74 of the total 5,182 families live below the poverty line. Families with 3 or 4 children have the highest poverty rate of 4.2%, comprising of 19 families. On the other hand, families with 5 or more children have the lowest poverty rate of 0.0%, which includes 0 families.
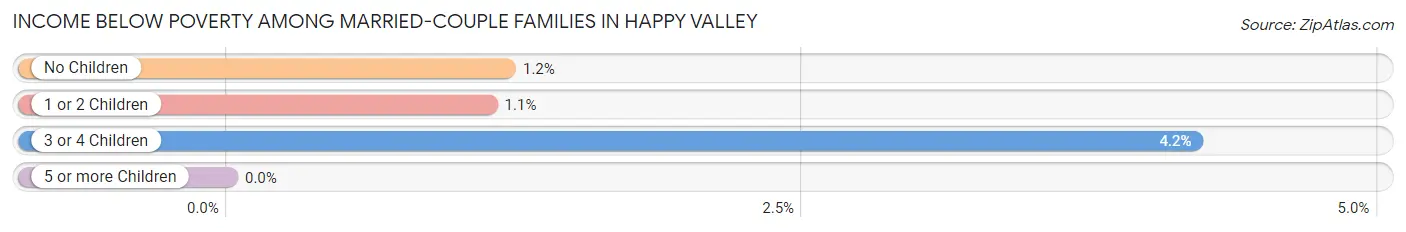
| Children | Above Poverty | Below Poverty |
| No Children | 2,695 (98.8%) | 33 (1.2%) |
| 1 or 2 Children | 1,923 (98.9%) | 22 (1.1%) |
| 3 or 4 Children | 433 (95.8%) | 19 (4.2%) |
| 5 or more Children | 57 (100.0%) | 0 (0.0%) |
| Total | 5,108 (98.6%) | 74 (1.4%) |
Income Below Poverty Among Single-Parent Households in Happy Valley
According to the poverty data in Happy Valley, 5.4% or 26 single-father households and 14.1% or 116 single-mother households are living below the poverty line. Among single-father households, those with 1 or 2 children have the highest poverty rate, with 26 households (9.4%) experiencing poverty. Likewise, among single-mother households, those with 3 or 4 children have the highest poverty rate, with 57 households (54.3%) falling below the poverty line.
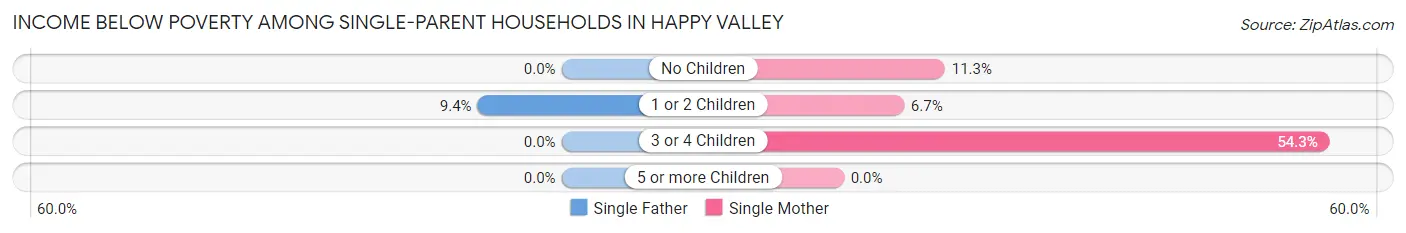
| Children | Single Father | Single Mother |
| No Children | 0 (0.0%) | 26 (11.3%) |
| 1 or 2 Children | 26 (9.4%) | 33 (6.7%) |
| 3 or 4 Children | 0 (0.0%) | 57 (54.3%) |
| 5 or more Children | 0 (0.0%) | 0 (0.0%) |
| Total | 26 (5.4%) | 116 (14.1%) |
Income Below Poverty Among Married-Couple vs Single-Parent Households in Happy Valley
The poverty data for Happy Valley shows that 74 of the married-couple family households (1.4%) and 142 of the single-parent households (10.9%) are living below the poverty level. Within the married-couple family households, those with 3 or 4 children have the highest poverty rate, with 19 households (4.2%) falling below the poverty line. Among the single-parent households, those with 3 or 4 children have the highest poverty rate, with 57 household (38.0%) living below poverty.
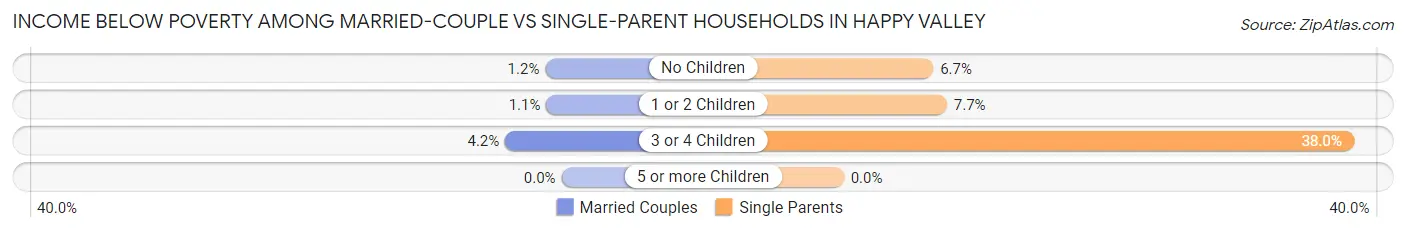
| Children | Married-Couple Families | Single-Parent Households |
| No Children | 33 (1.2%) | 26 (6.7%) |
| 1 or 2 Children | 22 (1.1%) | 59 (7.7%) |
| 3 or 4 Children | 19 (4.2%) | 57 (38.0%) |
| 5 or more Children | 0 (0.0%) | 0 (0.0%) |
| Total | 74 (1.4%) | 142 (10.9%) |
Race in Happy Valley
The most populous races in Happy Valley are White / Caucasian (16,375 | 67.2%), Asian (4,411 | 18.1%), and Two or more Races (2,550 | 10.5%).
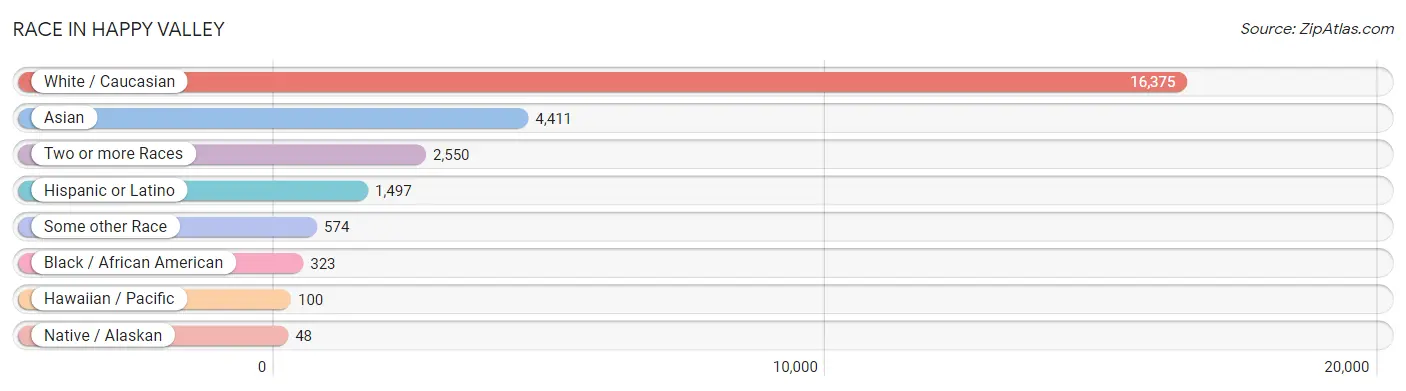
| Race | # Population | % Population |
| Asian | 4,411 | 18.1% |
| Black / African American | 323 | 1.3% |
| Hawaiian / Pacific | 100 | 0.4% |
| Hispanic or Latino | 1,497 | 6.1% |
| Native / Alaskan | 48 | 0.2% |
| White / Caucasian | 16,375 | 67.2% |
| Two or more Races | 2,550 | 10.5% |
| Some other Race | 574 | 2.4% |
| Total | 24,381 | 100.0% |
Ancestry in Happy Valley
The most populous ancestries reported in Happy Valley are German (3,657 | 15.0%), English (3,183 | 13.1%), Irish (2,031 | 8.3%), Indian (Asian) (1,558 | 6.4%), and Sri Lankan (1,257 | 5.2%), together accounting for 47.9% of all Happy Valley residents.
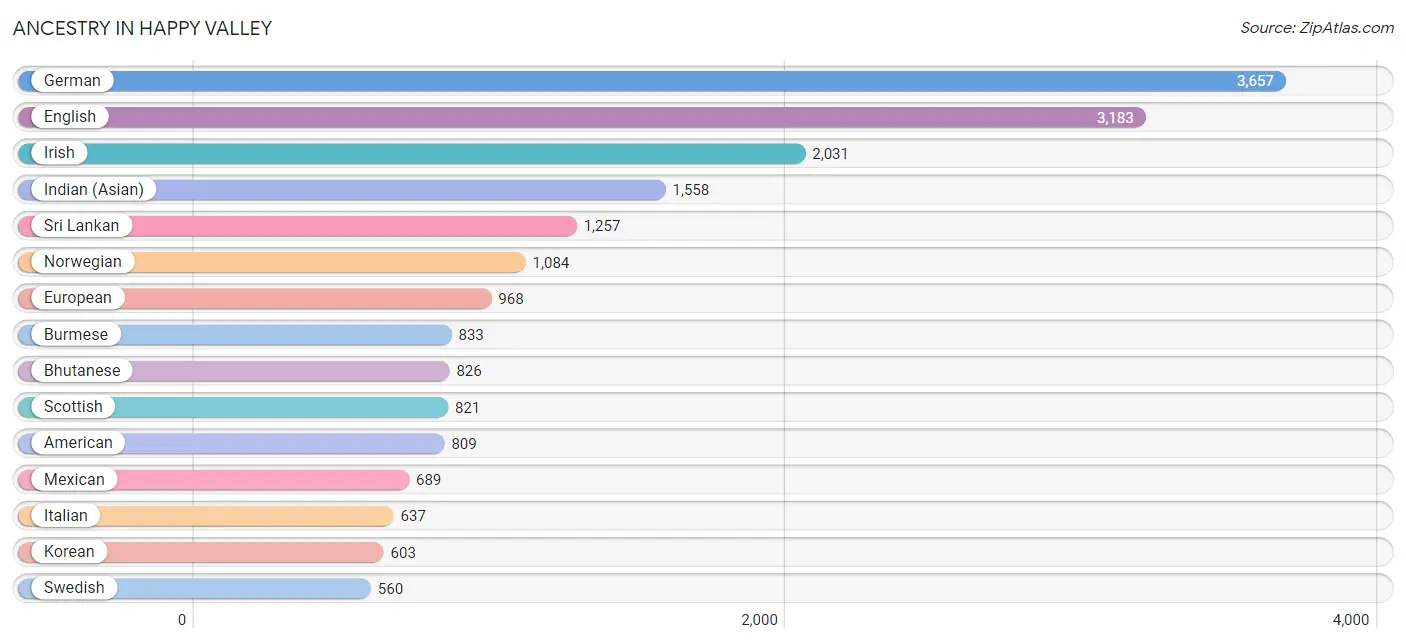
| Ancestry | # Population | % Population |
| African | 11 | 0.1% |
| American | 809 | 3.3% |
| Apache | 6 | 0.0% |
| Arab | 260 | 1.1% |
| Armenian | 26 | 0.1% |
| Bangladeshi | 228 | 0.9% |
| Belgian | 10 | 0.0% |
| Bhutanese | 826 | 3.4% |
| British | 227 | 0.9% |
| Burmese | 833 | 3.4% |
| Canadian | 51 | 0.2% |
| Central American | 50 | 0.2% |
| Cherokee | 213 | 0.9% |
| Chippewa | 4 | 0.0% |
| Choctaw | 42 | 0.2% |
| Colombian | 370 | 1.5% |
| Costa Rican | 4 | 0.0% |
| Croatian | 20 | 0.1% |
| Cuban | 174 | 0.7% |
| Czech | 55 | 0.2% |
| Danish | 527 | 2.2% |
| Dutch | 516 | 2.1% |
| Eastern European | 40 | 0.2% |
| English | 3,183 | 13.1% |
| European | 968 | 4.0% |
| Filipino | 113 | 0.5% |
| Finnish | 190 | 0.8% |
| French | 549 | 2.2% |
| French Canadian | 104 | 0.4% |
| German | 3,657 | 15.0% |
| Greek | 57 | 0.2% |
| Hungarian | 53 | 0.2% |
| Indian (Asian) | 1,558 | 6.4% |
| Iranian | 165 | 0.7% |
| Iraqi | 18 | 0.1% |
| Irish | 2,031 | 8.3% |
| Iroquois | 31 | 0.1% |
| Italian | 637 | 2.6% |
| Jamaican | 23 | 0.1% |
| Japanese | 34 | 0.1% |
| Kenyan | 15 | 0.1% |
| Korean | 603 | 2.5% |
| Lebanese | 194 | 0.8% |
| Lithuanian | 55 | 0.2% |
| Malaysian | 328 | 1.3% |
| Mexican | 689 | 2.8% |
| Native Hawaiian | 388 | 1.6% |
| Nepalese | 71 | 0.3% |
| Nicaraguan | 16 | 0.1% |
| Northern European | 302 | 1.2% |
| Norwegian | 1,084 | 4.4% |
| Pakistani | 234 | 1.0% |
| Peruvian | 40 | 0.2% |
| Polish | 441 | 1.8% |
| Portuguese | 64 | 0.3% |
| Puerto Rican | 27 | 0.1% |
| Puget Sound Salish | 13 | 0.1% |
| Romanian | 106 | 0.4% |
| Russian | 154 | 0.6% |
| Salvadoran | 30 | 0.1% |
| Scandinavian | 158 | 0.6% |
| Scotch-Irish | 180 | 0.7% |
| Scottish | 821 | 3.4% |
| Serbian | 12 | 0.1% |
| Shoshone | 16 | 0.1% |
| Slavic | 12 | 0.1% |
| Slovak | 25 | 0.1% |
| Slovene | 20 | 0.1% |
| South African | 29 | 0.1% |
| South American | 410 | 1.7% |
| Spanish | 147 | 0.6% |
| Sri Lankan | 1,257 | 5.2% |
| Subsaharan African | 64 | 0.3% |
| Swedish | 560 | 2.3% |
| Swiss | 448 | 1.8% |
| Syrian | 48 | 0.2% |
| Thai | 347 | 1.4% |
| Tohono O'Odham | 24 | 0.1% |
| Ukrainian | 114 | 0.5% |
| Ute | 51 | 0.2% |
| Welsh | 317 | 1.3% |
| Yaqui | 24 | 0.1% |
| Yugoslavian | 6 | 0.0% | View All 83 Rows |
Immigrants in Happy Valley
The most numerous immigrant groups reported in Happy Valley came from Asia (2,835 | 11.6%), Eastern Asia (1,410 | 5.8%), South Eastern Asia (1,151 | 4.7%), China (859 | 3.5%), and Vietnam (697 | 2.9%), together accounting for 28.5% of all Happy Valley residents.
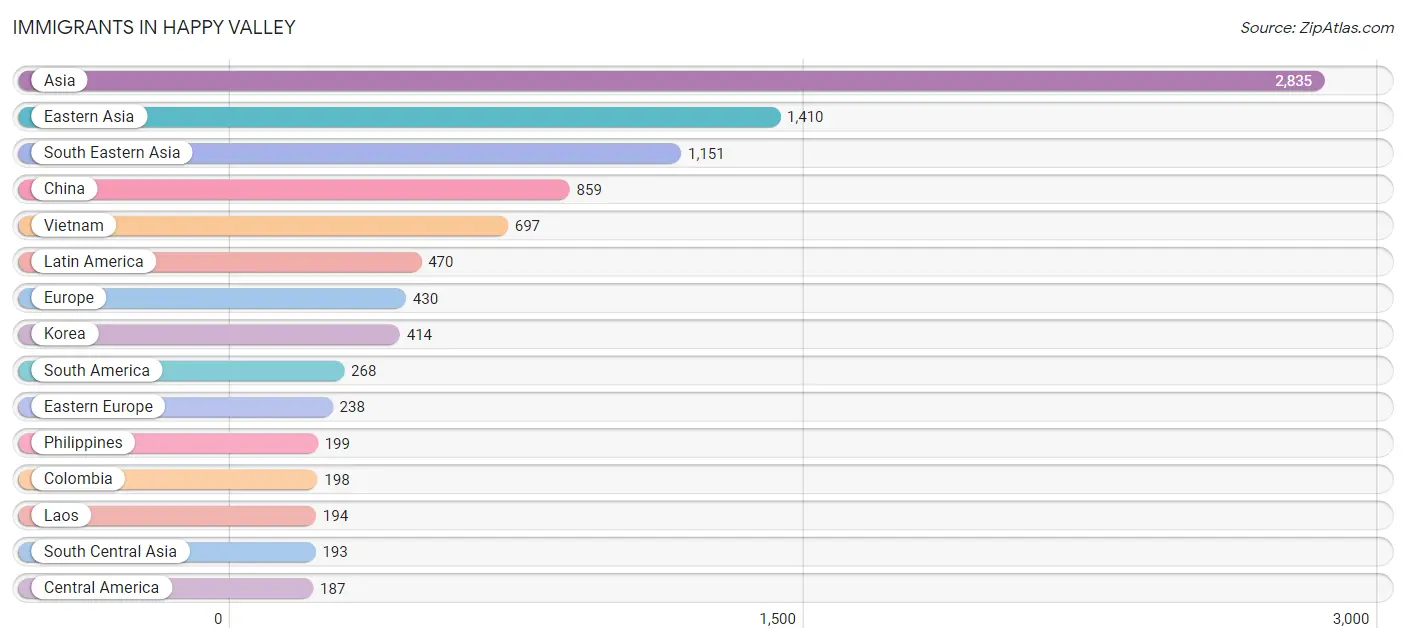
| Immigration Origin | # Population | % Population |
| Africa | 29 | 0.1% |
| Argentina | 10 | 0.0% |
| Asia | 2,835 | 11.6% |
| Australia | 12 | 0.1% |
| Belarus | 19 | 0.1% |
| Brazil | 20 | 0.1% |
| Cambodia | 15 | 0.1% |
| Canada | 32 | 0.1% |
| Caribbean | 15 | 0.1% |
| Central America | 187 | 0.8% |
| China | 859 | 3.5% |
| Colombia | 198 | 0.8% |
| Cuba | 15 | 0.1% |
| Eastern Africa | 15 | 0.1% |
| Eastern Asia | 1,410 | 5.8% |
| Eastern Europe | 238 | 1.0% |
| El Salvador | 18 | 0.1% |
| England | 25 | 0.1% |
| Europe | 430 | 1.8% |
| France | 8 | 0.0% |
| Germany | 44 | 0.2% |
| Hong Kong | 165 | 0.7% |
| India | 86 | 0.4% |
| Iran | 87 | 0.4% |
| Iraq | 18 | 0.1% |
| Israel | 16 | 0.1% |
| Japan | 137 | 0.6% |
| Kenya | 15 | 0.1% |
| Korea | 414 | 1.7% |
| Laos | 194 | 0.8% |
| Latin America | 470 | 1.9% |
| Lebanon | 40 | 0.2% |
| Mexico | 141 | 0.6% |
| Netherlands | 9 | 0.0% |
| Nicaragua | 28 | 0.1% |
| Northern Europe | 131 | 0.5% |
| Oceania | 12 | 0.1% |
| Peru | 40 | 0.2% |
| Philippines | 199 | 0.8% |
| Romania | 72 | 0.3% |
| Singapore | 8 | 0.0% |
| South Africa | 13 | 0.1% |
| South America | 268 | 1.1% |
| South Central Asia | 193 | 0.8% |
| South Eastern Asia | 1,151 | 4.7% |
| Taiwan | 130 | 0.5% |
| Thailand | 38 | 0.2% |
| Ukraine | 147 | 0.6% |
| Vietnam | 697 | 2.9% |
| Western Asia | 81 | 0.3% |
| Western Europe | 61 | 0.3% | View All 51 Rows |
Sex and Age in Happy Valley
Sex and Age in Happy Valley
The most populous age groups in Happy Valley are 10 to 14 Years (1,209 | 9.9%) for men and 5 to 9 Years (1,281 | 10.6%) for women.
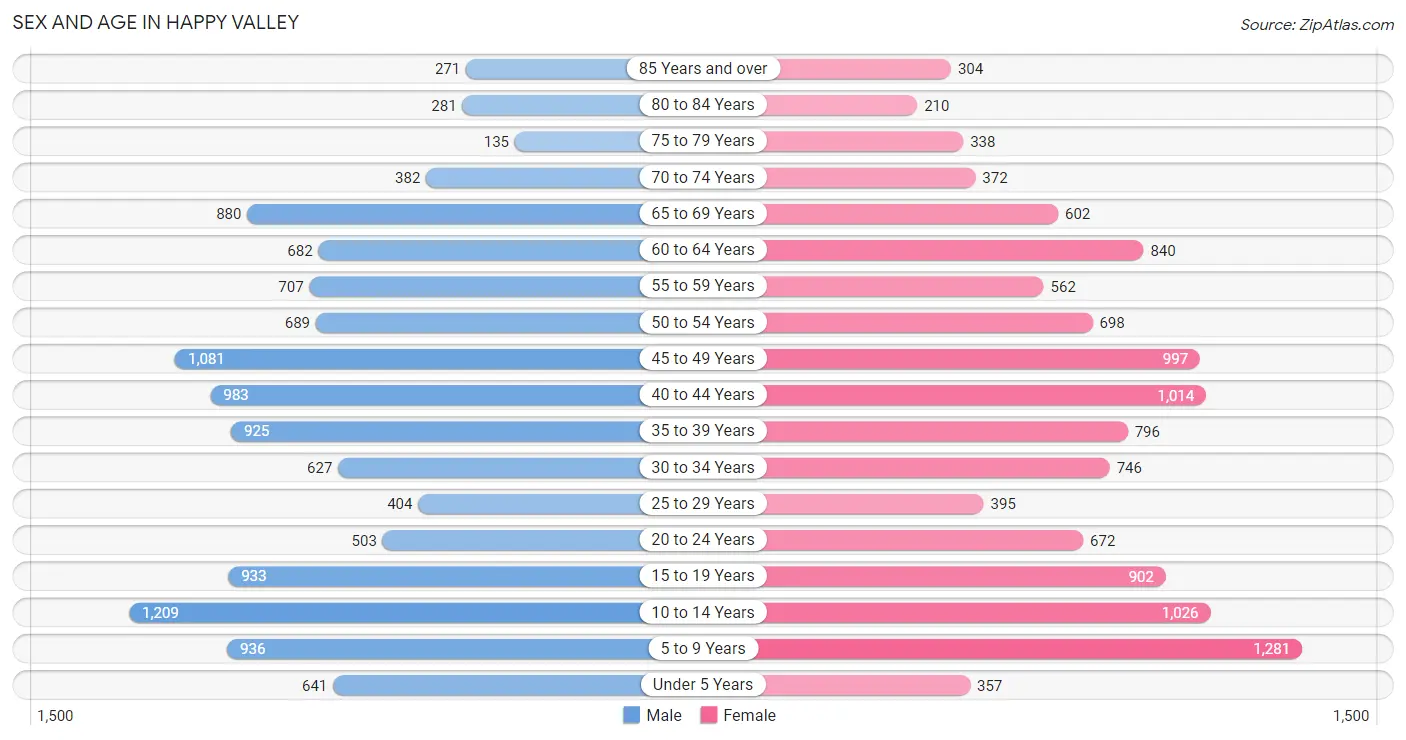
| Age Bracket | Male | Female |
| Under 5 Years | 641 (5.2%) | 357 (2.9%) |
| 5 to 9 Years | 936 (7.6%) | 1,281 (10.6%) |
| 10 to 14 Years | 1,209 (9.9%) | 1,026 (8.5%) |
| 15 to 19 Years | 933 (7.6%) | 902 (7.4%) |
| 20 to 24 Years | 503 (4.1%) | 672 (5.6%) |
| 25 to 29 Years | 404 (3.3%) | 395 (3.3%) |
| 30 to 34 Years | 627 (5.1%) | 746 (6.2%) |
| 35 to 39 Years | 925 (7.5%) | 796 (6.6%) |
| 40 to 44 Years | 983 (8.0%) | 1,014 (8.4%) |
| 45 to 49 Years | 1,081 (8.8%) | 997 (8.2%) |
| 50 to 54 Years | 689 (5.6%) | 698 (5.8%) |
| 55 to 59 Years | 707 (5.8%) | 562 (4.6%) |
| 60 to 64 Years | 682 (5.6%) | 840 (6.9%) |
| 65 to 69 Years | 880 (7.2%) | 602 (5.0%) |
| 70 to 74 Years | 382 (3.1%) | 372 (3.1%) |
| 75 to 79 Years | 135 (1.1%) | 338 (2.8%) |
| 80 to 84 Years | 281 (2.3%) | 210 (1.7%) |
| 85 Years and over | 271 (2.2%) | 304 (2.5%) |
| Total | 12,269 (100.0%) | 12,112 (100.0%) |
Families and Households in Happy Valley
Median Family Size in Happy Valley
The median family size in Happy Valley is 3.29 persons per family, with single male/father families (482 | 7.4%) accounting for the largest median family size of 3.44 persons per family. On the other hand, married-couple families (5,182 | 79.9%) represent the smallest median family size with 3.28 persons per family.
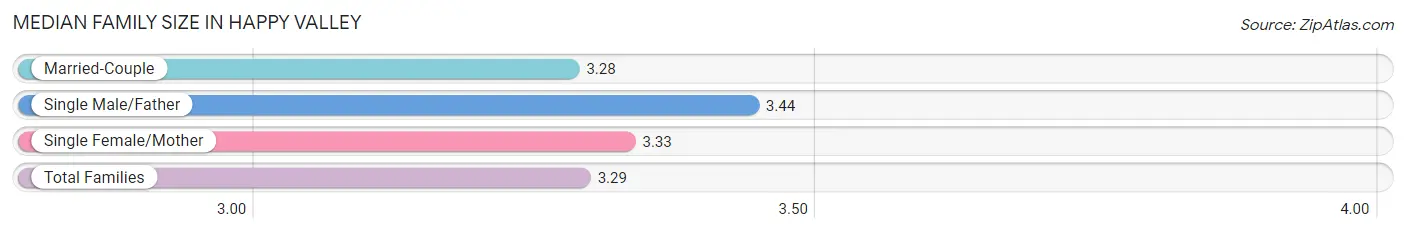
| Family Type | # Families | Family Size |
| Married-Couple | 5,182 (79.9%) | 3.28 |
| Single Male/Father | 482 (7.4%) | 3.44 |
| Single Female/Mother | 825 (12.7%) | 3.33 |
| Total Families | 6,489 (100.0%) | 3.29 |
Median Household Size in Happy Valley
The median household size in Happy Valley is 2.98 persons per household, with single male/father households (482 | 5.9%) accounting for the largest median household size of 4.18 persons per household. non-family households (1,659 | 20.4%) represent the smallest median household size with 1.24 persons per household.
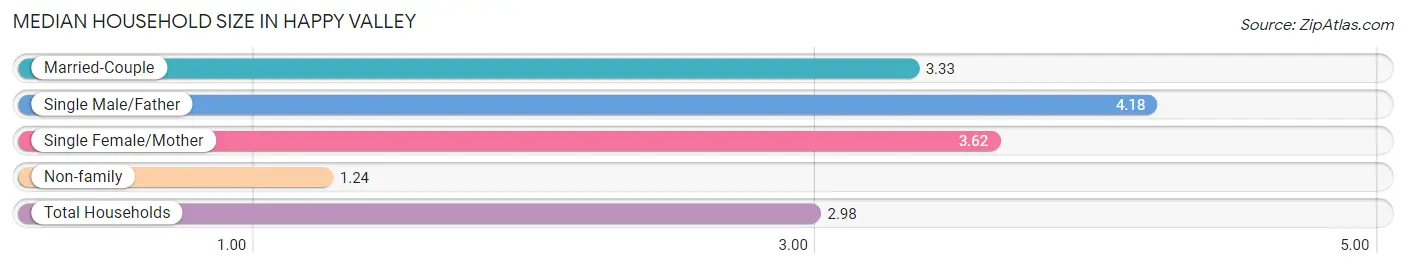
| Household Type | # Households | Household Size |
| Married-Couple | 5,182 (63.6%) | 3.33 |
| Single Male/Father | 482 (5.9%) | 4.18 |
| Single Female/Mother | 825 (10.1%) | 3.62 |
| Non-family | 1,659 (20.4%) | 1.24 |
| Total Households | 8,148 (100.0%) | 2.98 |
Household Size by Marriage Status in Happy Valley
Out of a total of 8,148 households in Happy Valley, 6,489 (79.6%) are family households, while 1,659 (20.4%) are nonfamily households. The most numerous type of family households are 2-person households, comprising 2,509, and the most common type of nonfamily households are 1-person households, comprising 1,230.
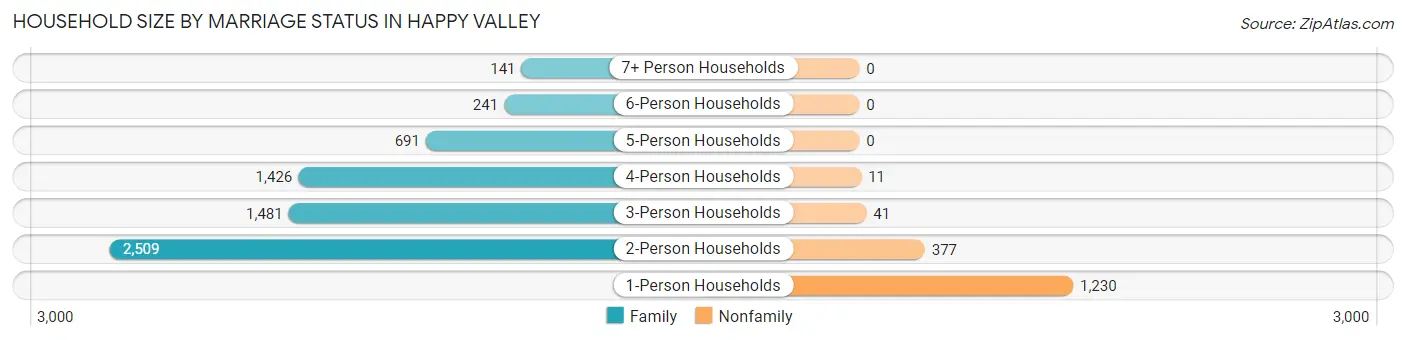
| Household Size | Family Households | Nonfamily Households |
| 1-Person Households | - | 1,230 (15.1%) |
| 2-Person Households | 2,509 (30.8%) | 377 (4.6%) |
| 3-Person Households | 1,481 (18.2%) | 41 (0.5%) |
| 4-Person Households | 1,426 (17.5%) | 11 (0.1%) |
| 5-Person Households | 691 (8.5%) | 0 (0.0%) |
| 6-Person Households | 241 (3.0%) | 0 (0.0%) |
| 7+ Person Households | 141 (1.7%) | 0 (0.0%) |
| Total | 6,489 (79.6%) | 1,659 (20.4%) |
Female Fertility in Happy Valley
Fertility by Age in Happy Valley
Average fertility rate in Happy Valley is 18.0 births per 1,000 women. Women in the age bracket of 35 to 50 years have the highest fertility rate with 31.0 births per 1,000 women. Women in the age bracket of 35 to 50 years acount for 90.0% of all women with births.
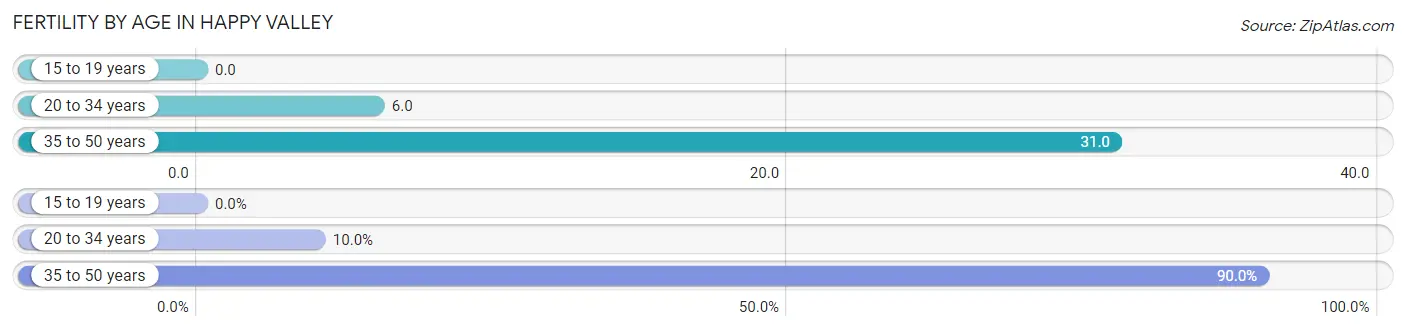
| Age Bracket | Women with Births | Births / 1,000 Women |
| 15 to 19 years | 0 (0.0%) | 0.0 |
| 20 to 34 years | 10 (10.0%) | 6.0 |
| 35 to 50 years | 90 (90.0%) | 31.0 |
| Total | 100 (100.0%) | 18.0 |
Fertility by Age by Marriage Status in Happy Valley
98.0% of women with births (100) in Happy Valley are married. The highest percentage of unmarried women with births falls into 20 to 34 years age bracket with 20.0% of them unmarried at the time of birth, while the lowest percentage of unmarried women with births belong to 35 to 50 years age bracket with 0.0% of them unmarried.
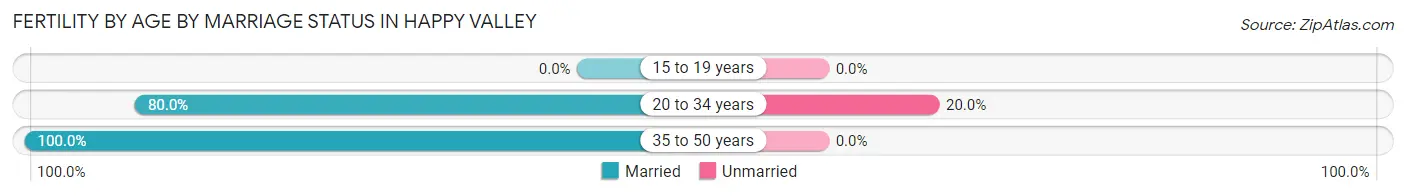
| Age Bracket | Married | Unmarried |
| 15 to 19 years | 0 (0.0%) | 0 (0.0%) |
| 20 to 34 years | 8 (80.0%) | 2 (20.0%) |
| 35 to 50 years | 90 (100.0%) | 0 (0.0%) |
| Total | 98 (98.0%) | 2 (2.0%) |
Fertility by Education in Happy Valley
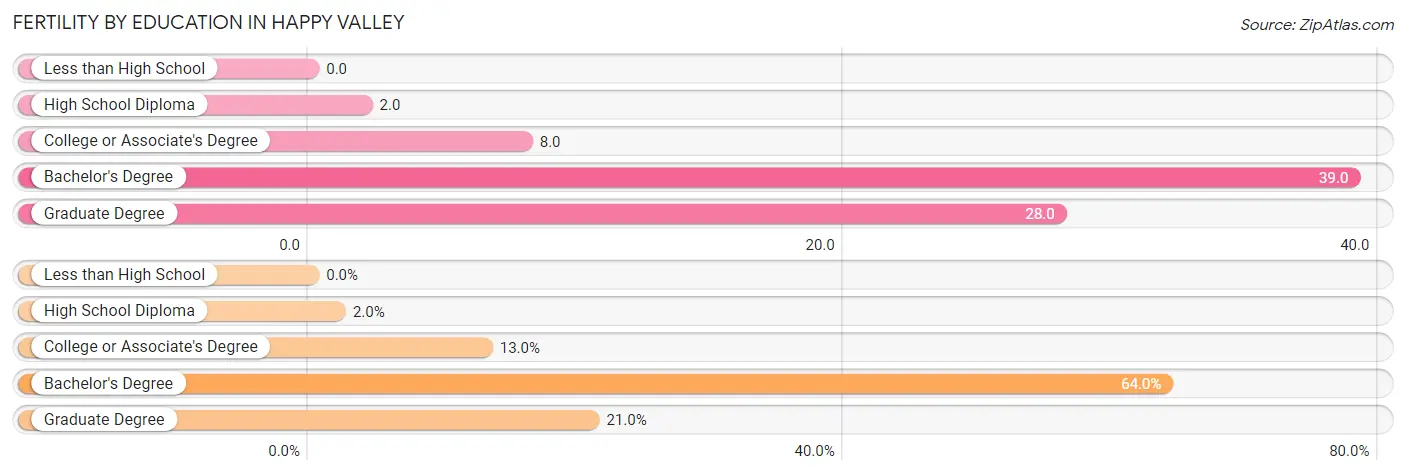
| Educational Attainment | Women with Births | Births / 1,000 Women |
| Less than High School | 0 (0.0%) | 0.0 |
| High School Diploma | 2 (2.0%) | 2.0 |
| College or Associate's Degree | 13 (13.0%) | 8.0 |
| Bachelor's Degree | 64 (64.0%) | 39.0 |
| Graduate Degree | 21 (21.0%) | 28.0 |
| Total | 100 (100.0%) | 18.0 |
Fertility by Education by Marriage Status in Happy Valley
2.0% of women with births in Happy Valley are unmarried. Women with the educational attainment of college or associate's degree are most likely to be married with 100.0% of them married at childbirth, while women with the educational attainment of high school diploma are least likely to be married with 100.0% of them unmarried at childbirth.
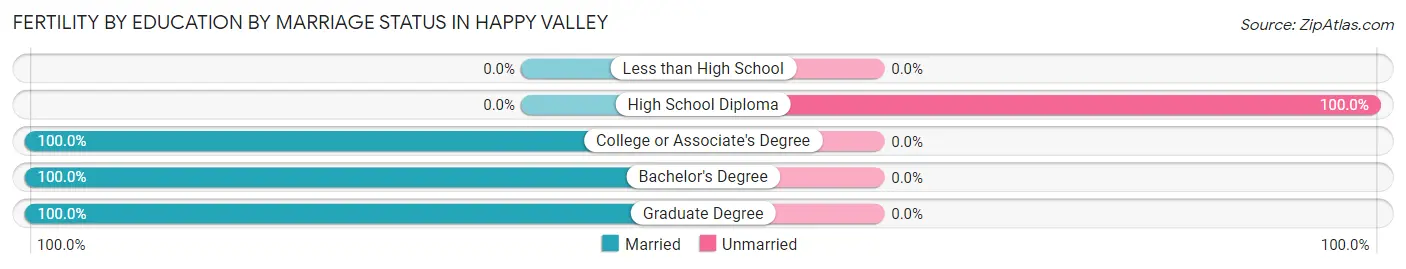
| Educational Attainment | Married | Unmarried |
| Less than High School | 0 (0.0%) | 0 (0.0%) |
| High School Diploma | 0 (0.0%) | 2 (100.0%) |
| College or Associate's Degree | 13 (100.0%) | 0 (0.0%) |
| Bachelor's Degree | 64 (100.0%) | 0 (0.0%) |
| Graduate Degree | 21 (100.0%) | 0 (0.0%) |
| Total | 98 (98.0%) | 2 (2.0%) |
Employment Characteristics in Happy Valley
Employment by Class of Employer in Happy Valley
Among the 11,773 employed individuals in Happy Valley, private company employees (7,344 | 62.4%), not-for-profit organizations (1,324 | 11.3%), and local government employees (942 | 8.0%) make up the most common classes of employment.
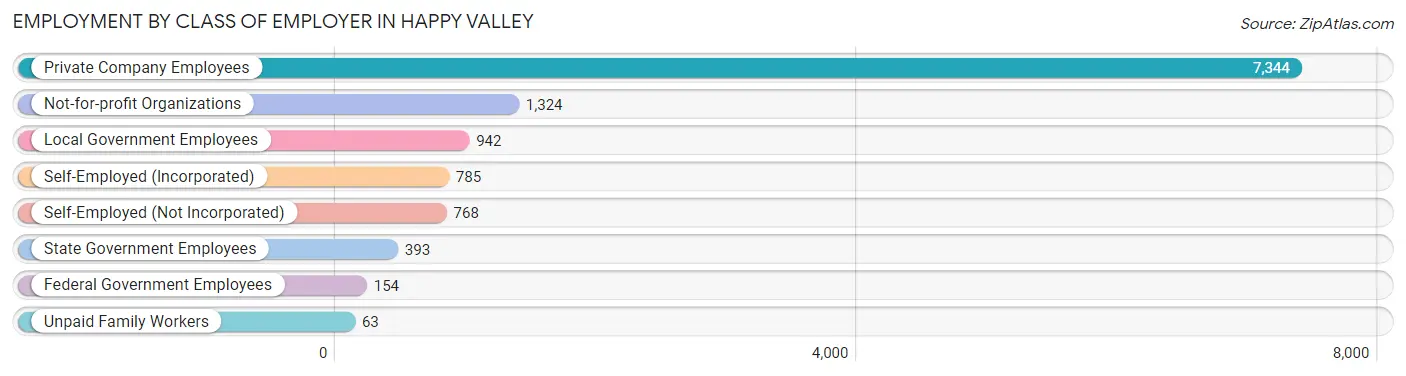
| Employer Class | # Employees | % Employees |
| Private Company Employees | 7,344 | 62.4% |
| Self-Employed (Incorporated) | 785 | 6.7% |
| Self-Employed (Not Incorporated) | 768 | 6.5% |
| Not-for-profit Organizations | 1,324 | 11.3% |
| Local Government Employees | 942 | 8.0% |
| State Government Employees | 393 | 3.3% |
| Federal Government Employees | 154 | 1.3% |
| Unpaid Family Workers | 63 | 0.5% |
| Total | 11,773 | 100.0% |
Employment Status by Age in Happy Valley
According to the labor force statistics for Happy Valley, out of the total population over 16 years of age (18,587), 67.5% or 12,546 individuals are in the labor force, with 3.8% or 477 of them unemployed. The age group with the highest labor force participation rate is 25 to 29 years, with 94.5% or 755 individuals in the labor force. Within the labor force, the 20 to 24 years age range has the highest percentage of unemployed individuals, with 18.5% or 184 of them being unemployed.
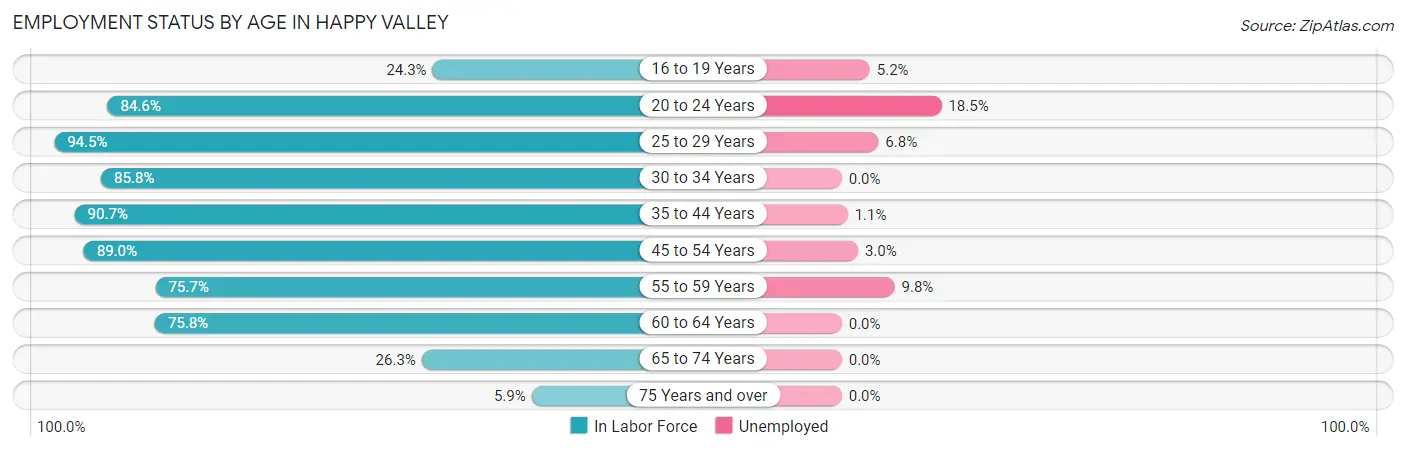
| Age Bracket | In Labor Force | Unemployed |
| 16 to 19 Years | 362 (24.3%) | 19 (5.2%) |
| 20 to 24 Years | 994 (84.6%) | 184 (18.5%) |
| 25 to 29 Years | 755 (94.5%) | 51 (6.8%) |
| 30 to 34 Years | 1,178 (85.8%) | 0 (0.0%) |
| 35 to 44 Years | 3,372 (90.7%) | 37 (1.1%) |
| 45 to 54 Years | 3,084 (89.0%) | 93 (3.0%) |
| 55 to 59 Years | 961 (75.7%) | 94 (9.8%) |
| 60 to 64 Years | 1,154 (75.8%) | 0 (0.0%) |
| 65 to 74 Years | 588 (26.3%) | 0 (0.0%) |
| 75 Years and over | 91 (5.9%) | 0 (0.0%) |
| Total | 12,546 (67.5%) | 477 (3.8%) |
Employment Status by Educational Attainment in Happy Valley
According to labor force statistics for Happy Valley, 86.5% of individuals (10,506) out of the total population between 25 and 64 years of age (12,146) are in the labor force, with 2.6% or 273 of them being unemployed. The group with the highest labor force participation rate are those with the educational attainment of college / associate degree, with 92.8% or 3,823 individuals in the labor force. Within the labor force, individuals with less than high school education have the highest percentage of unemployment, with 8.6% or 25 of them being unemployed.
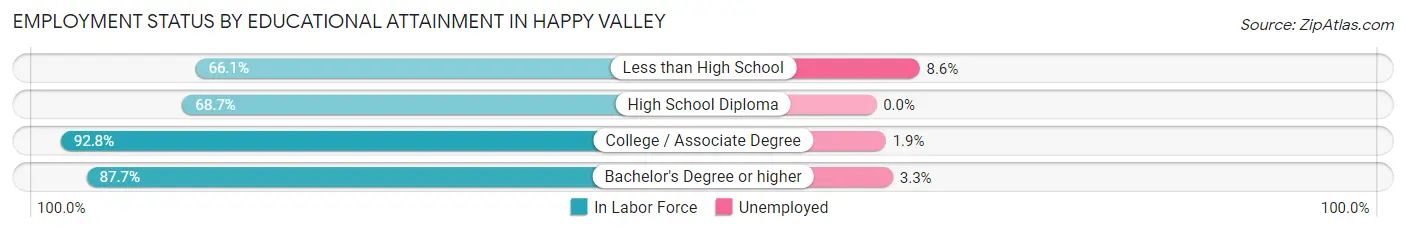
| Educational Attainment | In Labor Force | Unemployed |
| Less than High School | 291 (66.1%) | 38 (8.6%) |
| High School Diploma | 951 (68.7%) | 0 (0.0%) |
| College / Associate Degree | 3,823 (92.8%) | 78 (1.9%) |
| Bachelor's Degree or higher | 5,438 (87.7%) | 205 (3.3%) |
| Total | 10,506 (86.5%) | 316 (2.6%) |
Employment Occupations by Sex in Happy Valley
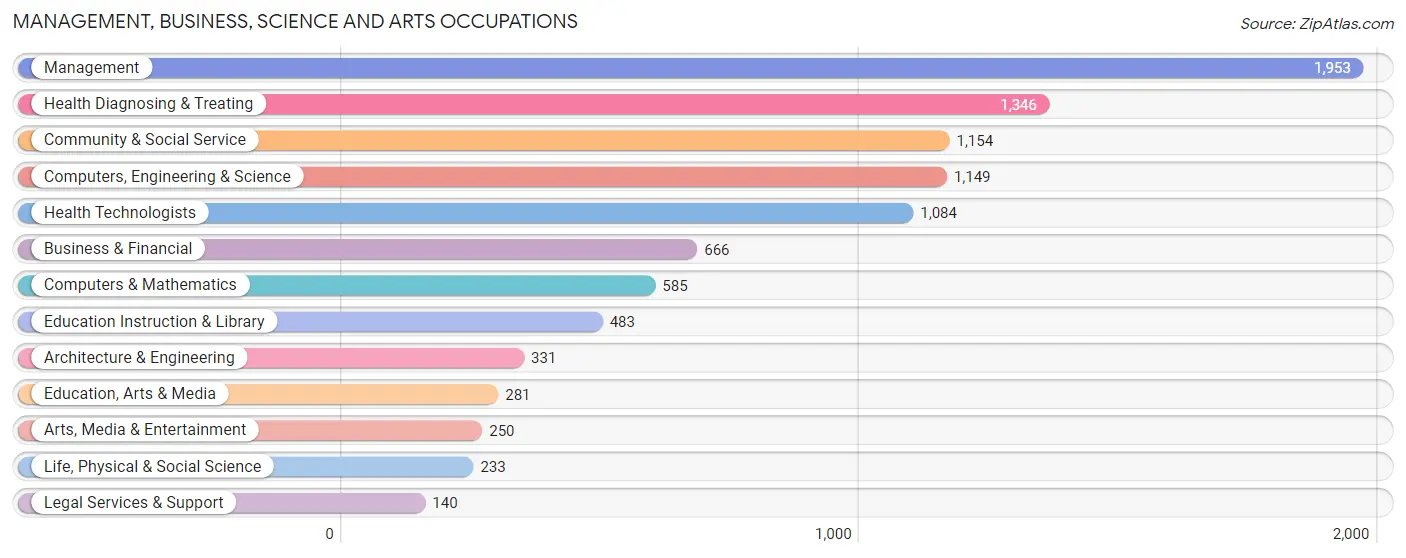
Management, Business, Science and Arts Occupations
The most common Management, Business, Science and Arts occupations in Happy Valley are Management (1,953 | 16.3%), Health Diagnosing & Treating (1,346 | 11.2%), Community & Social Service (1,154 | 9.6%), Computers, Engineering & Science (1,149 | 9.6%), and Health Technologists (1,084 | 9.0%).
Management, Business, Science and Arts Occupations by Sex
Within the Management, Business, Science and Arts occupations in Happy Valley, the most male-oriented occupations are Architecture & Engineering (96.4%), Computers, Engineering & Science (75.3%), and Computers & Mathematics (67.0%), while the most female-oriented occupations are Education, Arts & Media (74.0%), Health Diagnosing & Treating (70.7%), and Health Technologists (69.7%).
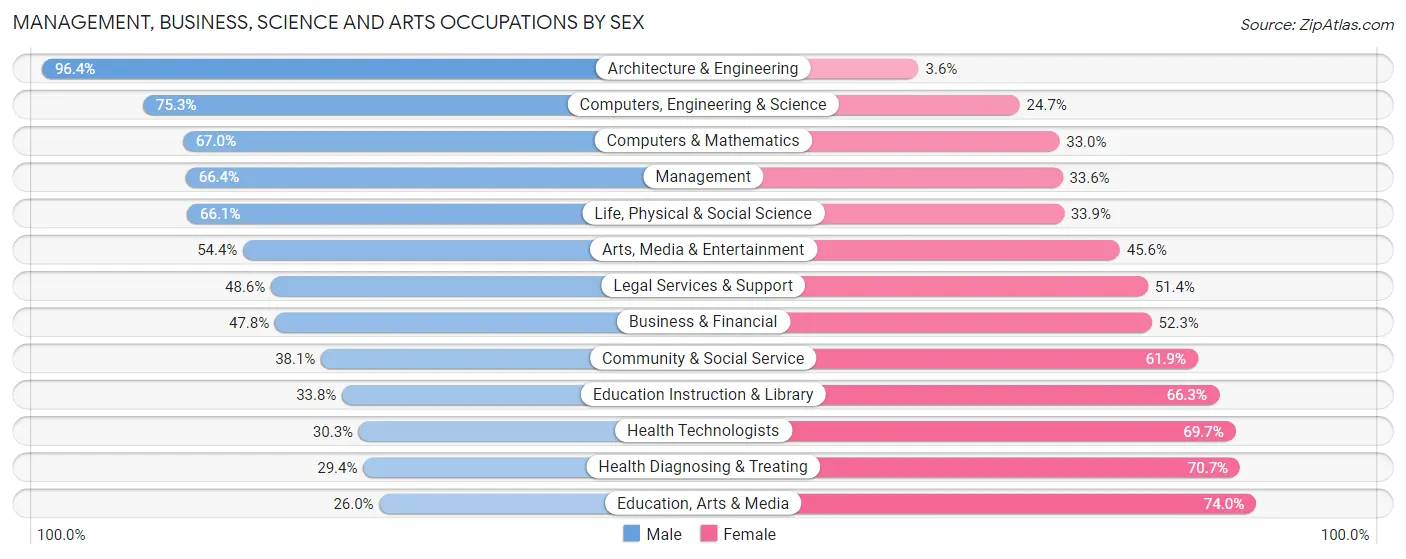
| Occupation | Male | Female |
| Management | 1,296 (66.4%) | 657 (33.6%) |
| Business & Financial | 318 (47.7%) | 348 (52.2%) |
| Computers, Engineering & Science | 865 (75.3%) | 284 (24.7%) |
| Computers & Mathematics | 392 (67.0%) | 193 (33.0%) |
| Architecture & Engineering | 319 (96.4%) | 12 (3.6%) |
| Life, Physical & Social Science | 154 (66.1%) | 79 (33.9%) |
| Community & Social Service | 440 (38.1%) | 714 (61.9%) |
| Education, Arts & Media | 73 (26.0%) | 208 (74.0%) |
| Legal Services & Support | 68 (48.6%) | 72 (51.4%) |
| Education Instruction & Library | 163 (33.8%) | 320 (66.2%) |
| Arts, Media & Entertainment | 136 (54.4%) | 114 (45.6%) |
| Health Diagnosing & Treating | 395 (29.3%) | 951 (70.7%) |
| Health Technologists | 328 (30.3%) | 756 (69.7%) |
| Total (Category) | 3,314 (52.9%) | 2,954 (47.1%) |
| Total (Overall) | 6,340 (52.8%) | 5,669 (47.2%) |
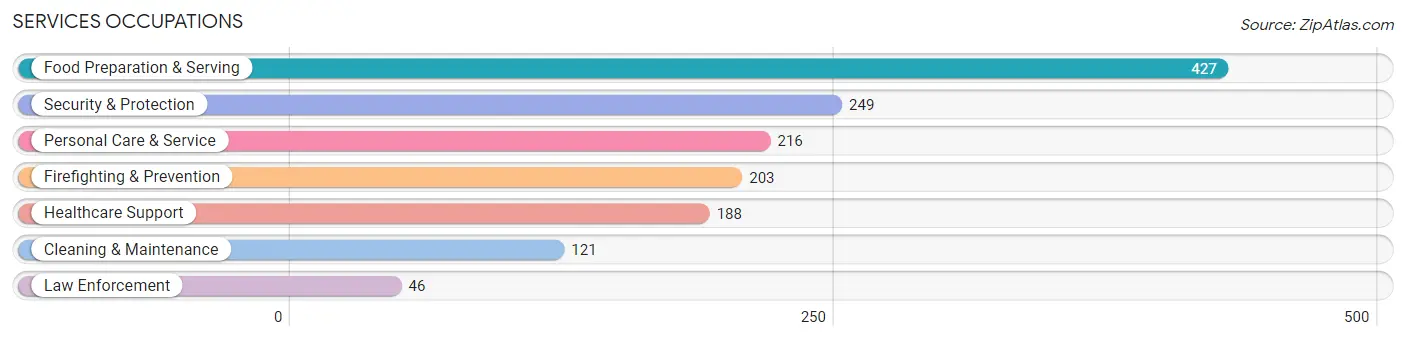
Services Occupations
The most common Services occupations in Happy Valley are Food Preparation & Serving (427 | 3.6%), Security & Protection (249 | 2.1%), Personal Care & Service (216 | 1.8%), Firefighting & Prevention (203 | 1.7%), and Healthcare Support (188 | 1.6%).
Services Occupations by Sex
Within the Services occupations in Happy Valley, the most male-oriented occupations are Law Enforcement (91.3%), Cleaning & Maintenance (78.5%), and Security & Protection (65.5%), while the most female-oriented occupations are Healthcare Support (100.0%), Personal Care & Service (88.4%), and Food Preparation & Serving (49.9%).
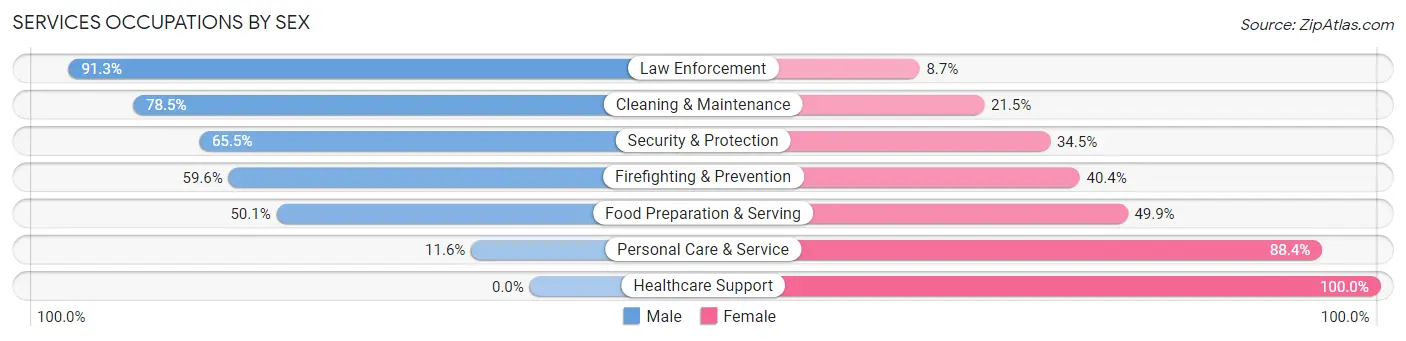
| Occupation | Male | Female |
| Healthcare Support | 0 (0.0%) | 188 (100.0%) |
| Security & Protection | 163 (65.5%) | 86 (34.5%) |
| Firefighting & Prevention | 121 (59.6%) | 82 (40.4%) |
| Law Enforcement | 42 (91.3%) | 4 (8.7%) |
| Food Preparation & Serving | 214 (50.1%) | 213 (49.9%) |
| Cleaning & Maintenance | 95 (78.5%) | 26 (21.5%) |
| Personal Care & Service | 25 (11.6%) | 191 (88.4%) |
| Total (Category) | 497 (41.4%) | 704 (58.6%) |
| Total (Overall) | 6,340 (52.8%) | 5,669 (47.2%) |
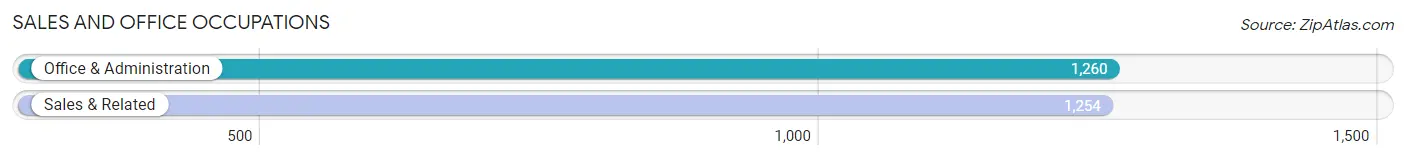
Sales and Office Occupations
The most common Sales and Office occupations in Happy Valley are Office & Administration (1,260 | 10.5%), and Sales & Related (1,254 | 10.4%).
Sales and Office Occupations by Sex
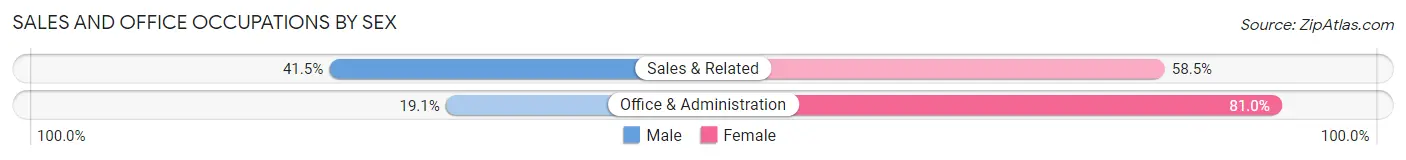
| Occupation | Male | Female |
| Sales & Related | 520 (41.5%) | 734 (58.5%) |
| Office & Administration | 240 (19.1%) | 1,020 (80.9%) |
| Total (Category) | 760 (30.2%) | 1,754 (69.8%) |
| Total (Overall) | 6,340 (52.8%) | 5,669 (47.2%) |
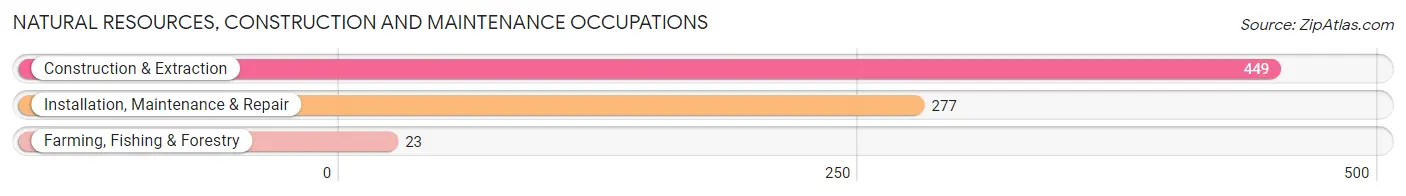
Natural Resources, Construction and Maintenance Occupations
The most common Natural Resources, Construction and Maintenance occupations in Happy Valley are Construction & Extraction (449 | 3.7%), Installation, Maintenance & Repair (277 | 2.3%), and Farming, Fishing & Forestry (23 | 0.2%).
Natural Resources, Construction and Maintenance Occupations by Sex
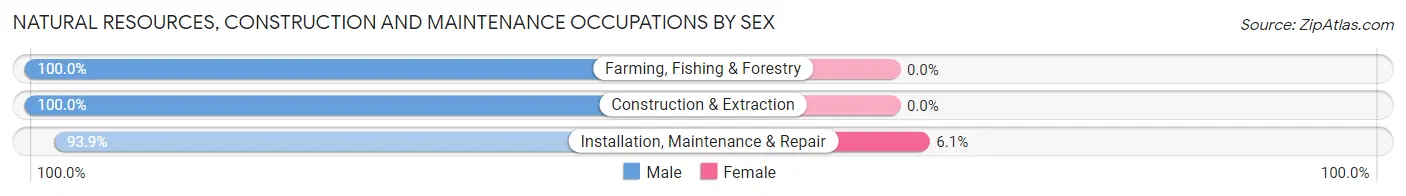
| Occupation | Male | Female |
| Farming, Fishing & Forestry | 23 (100.0%) | 0 (0.0%) |
| Construction & Extraction | 449 (100.0%) | 0 (0.0%) |
| Installation, Maintenance & Repair | 260 (93.9%) | 17 (6.1%) |
| Total (Category) | 732 (97.7%) | 17 (2.3%) |
| Total (Overall) | 6,340 (52.8%) | 5,669 (47.2%) |
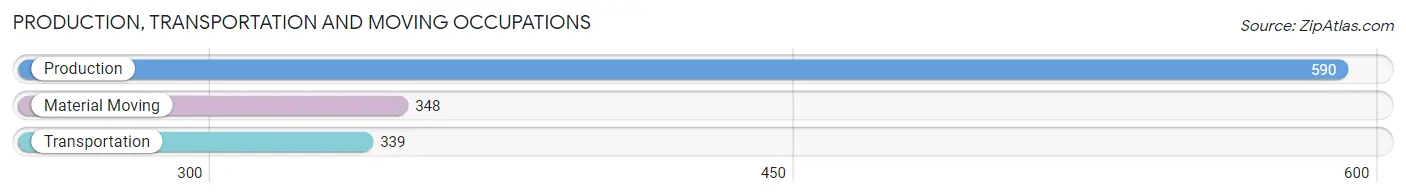
Production, Transportation and Moving Occupations
The most common Production, Transportation and Moving occupations in Happy Valley are Production (590 | 4.9%), Material Moving (348 | 2.9%), and Transportation (339 | 2.8%).
Production, Transportation and Moving Occupations by Sex
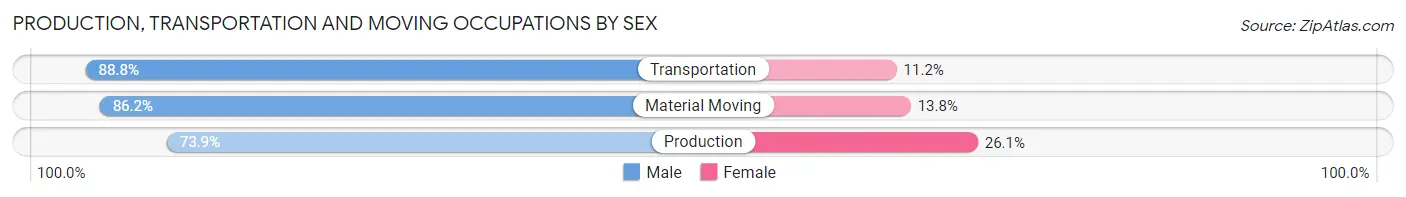
| Occupation | Male | Female |
| Production | 436 (73.9%) | 154 (26.1%) |
| Transportation | 301 (88.8%) | 38 (11.2%) |
| Material Moving | 300 (86.2%) | 48 (13.8%) |
| Total (Category) | 1,037 (81.2%) | 240 (18.8%) |
| Total (Overall) | 6,340 (52.8%) | 5,669 (47.2%) |
Employment Industries by Sex in Happy Valley
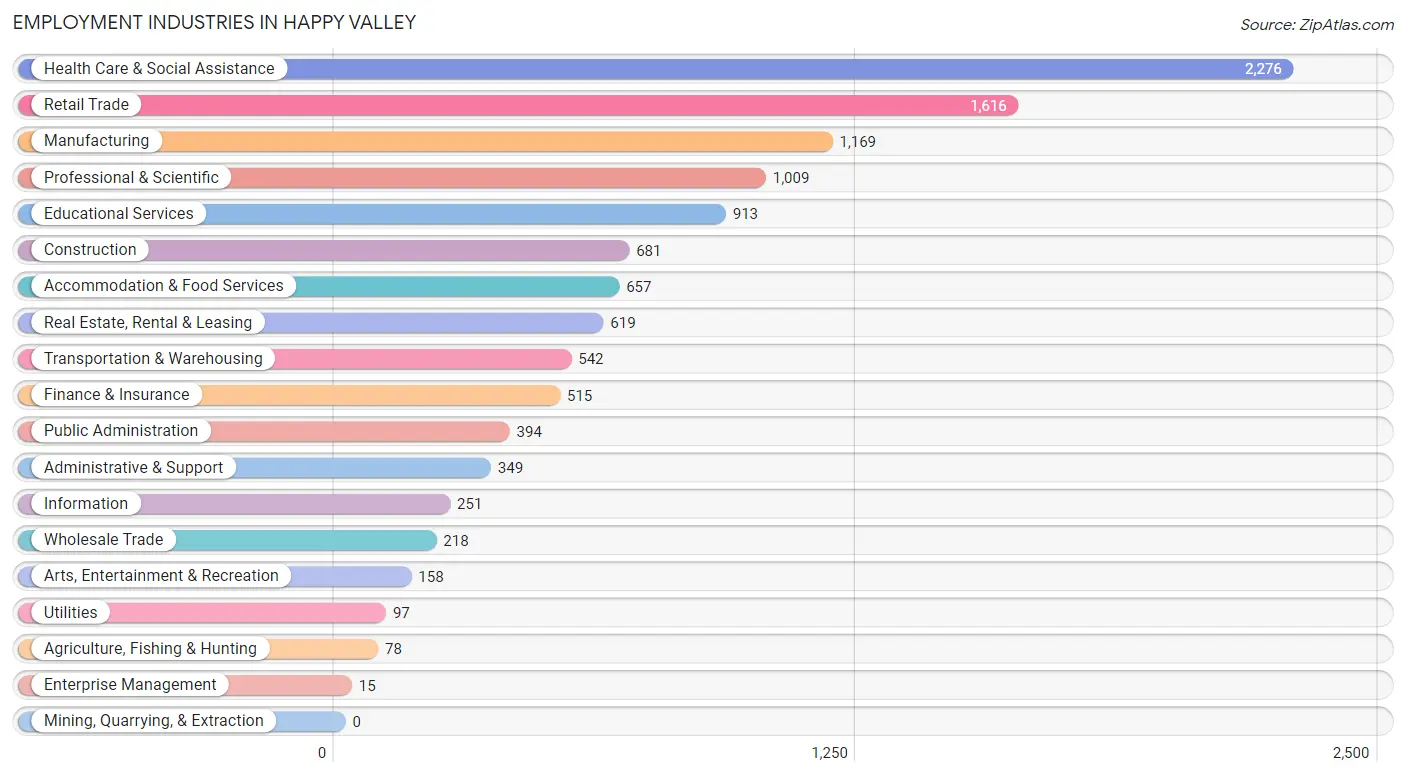
Employment Industries in Happy Valley
The major employment industries in Happy Valley include Health Care & Social Assistance (2,276 | 19.0%), Retail Trade (1,616 | 13.5%), Manufacturing (1,169 | 9.7%), Professional & Scientific (1,009 | 8.4%), and Educational Services (913 | 7.6%).
Employment Industries by Sex in Happy Valley
The Happy Valley industries that see more men than women are Enterprise Management (100.0%), Information (88.0%), and Wholesale Trade (83.5%), whereas the industries that tend to have a higher number of women are Real Estate, Rental & Leasing (73.0%), Health Care & Social Assistance (73.0%), and Agriculture, Fishing & Hunting (69.2%).
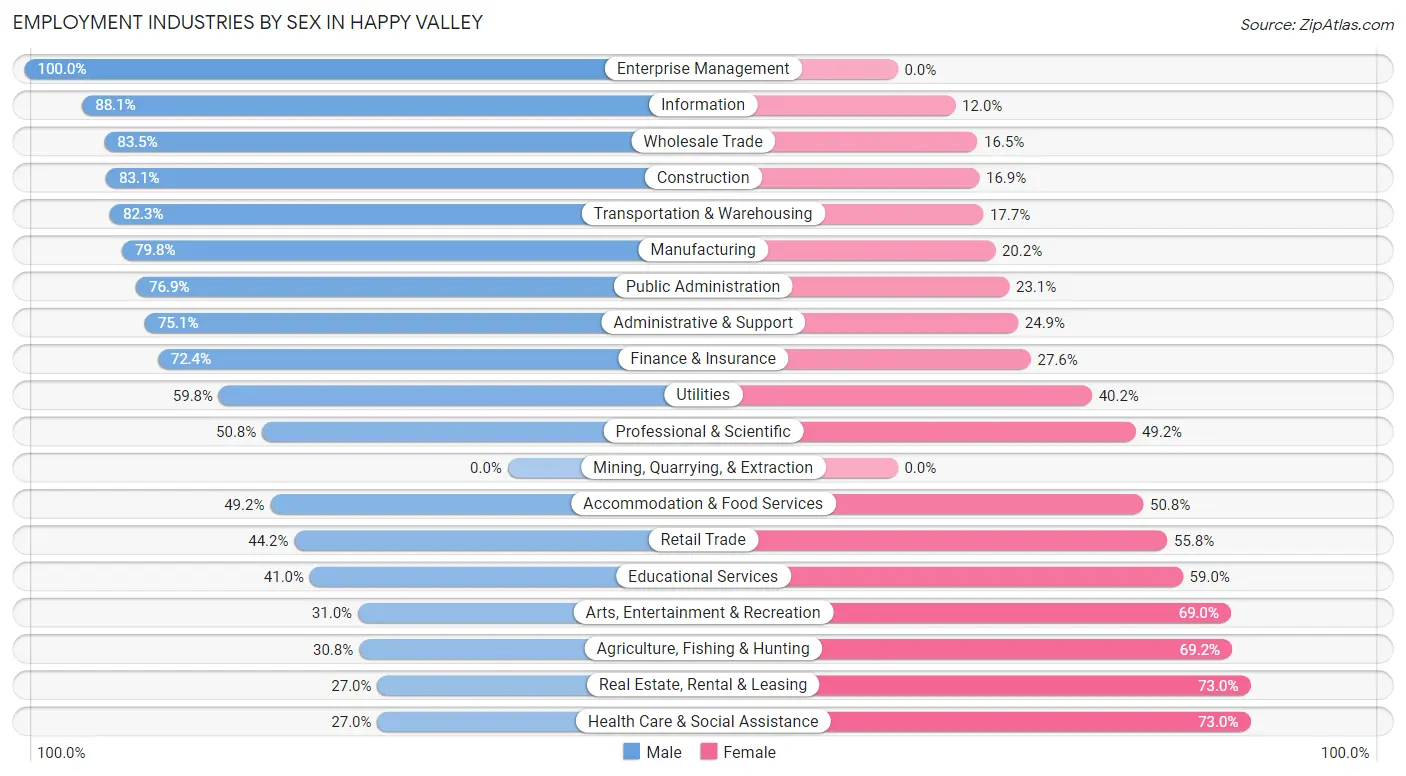
| Industry | Male | Female |
| Agriculture, Fishing & Hunting | 24 (30.8%) | 54 (69.2%) |
| Mining, Quarrying, & Extraction | 0 (0.0%) | 0 (0.0%) |
| Construction | 566 (83.1%) | 115 (16.9%) |
| Manufacturing | 933 (79.8%) | 236 (20.2%) |
| Wholesale Trade | 182 (83.5%) | 36 (16.5%) |
| Retail Trade | 714 (44.2%) | 902 (55.8%) |
| Transportation & Warehousing | 446 (82.3%) | 96 (17.7%) |
| Utilities | 58 (59.8%) | 39 (40.2%) |
| Information | 221 (88.0%) | 30 (11.9%) |
| Finance & Insurance | 373 (72.4%) | 142 (27.6%) |
| Real Estate, Rental & Leasing | 167 (27.0%) | 452 (73.0%) |
| Professional & Scientific | 513 (50.8%) | 496 (49.2%) |
| Enterprise Management | 15 (100.0%) | 0 (0.0%) |
| Administrative & Support | 262 (75.1%) | 87 (24.9%) |
| Educational Services | 374 (41.0%) | 539 (59.0%) |
| Health Care & Social Assistance | 614 (27.0%) | 1,662 (73.0%) |
| Arts, Entertainment & Recreation | 49 (31.0%) | 109 (69.0%) |
| Accommodation & Food Services | 323 (49.2%) | 334 (50.8%) |
| Public Administration | 303 (76.9%) | 91 (23.1%) |
| Total | 6,340 (52.8%) | 5,669 (47.2%) |
Education in Happy Valley
School Enrollment in Happy Valley
The most common levels of schooling among the 7,415 students in Happy Valley are high school (2,025 | 27.3%), elementary school (1,799 | 24.3%), and middle school (1,578 | 21.3%).
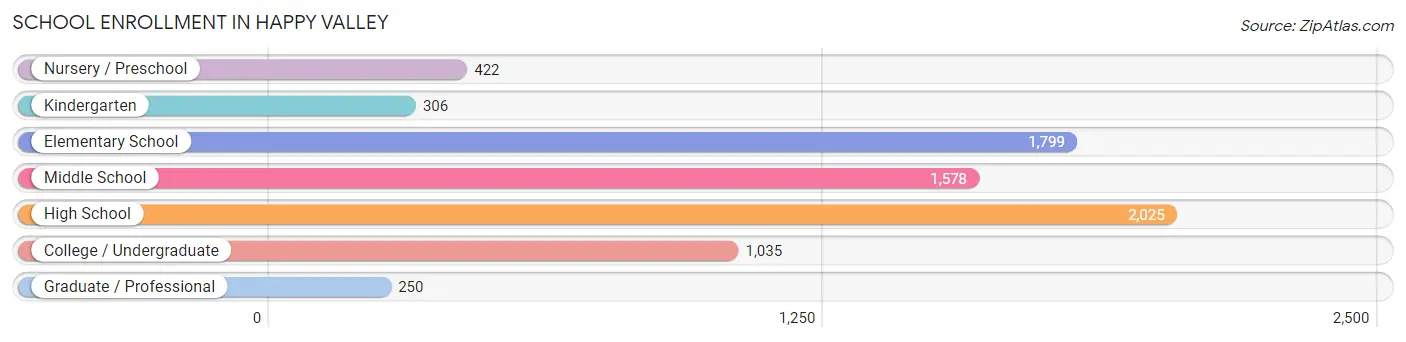
| School Level | # Students | % Students |
| Nursery / Preschool | 422 | 5.7% |
| Kindergarten | 306 | 4.1% |
| Elementary School | 1,799 | 24.3% |
| Middle School | 1,578 | 21.3% |
| High School | 2,025 | 27.3% |
| College / Undergraduate | 1,035 | 14.0% |
| Graduate / Professional | 250 | 3.4% |
| Total | 7,415 | 100.0% |
School Enrollment by Age by Funding Source in Happy Valley
Out of a total of 7,415 students who are enrolled in schools in Happy Valley, 1,780 (24.0%) attend a private institution, while the remaining 5,635 (76.0%) are enrolled in public schools. The age group of 3 to 4 year olds has the highest likelihood of being enrolled in private schools, with 168 (73.0% in the age bracket) enrolled. Conversely, the age group of 5 to 9 year old has the lowest likelihood of being enrolled in a private school, with 1,823 (85.0% in the age bracket) attending a public institution.
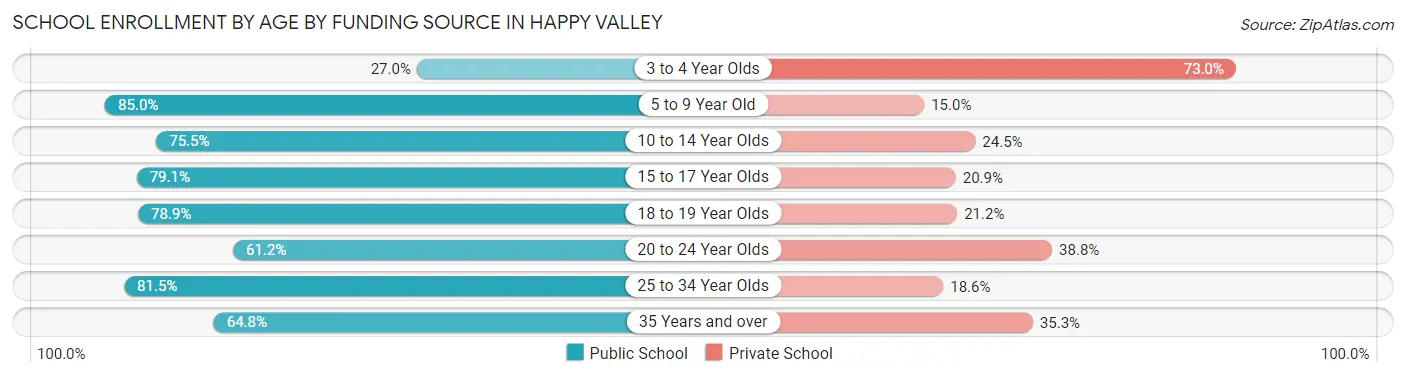
| Age Bracket | Public School | Private School |
| 3 to 4 Year Olds | 62 (27.0%) | 168 (73.0%) |
| 5 to 9 Year Old | 1,823 (85.0%) | 322 (15.0%) |
| 10 to 14 Year Olds | 1,676 (75.5%) | 545 (24.5%) |
| 15 to 17 Year Olds | 1,000 (79.1%) | 264 (20.9%) |
| 18 to 19 Year Olds | 369 (78.8%) | 99 (21.1%) |
| 20 to 24 Year Olds | 334 (61.2%) | 212 (38.8%) |
| 25 to 34 Year Olds | 101 (81.5%) | 23 (18.5%) |
| 35 Years and over | 270 (64.7%) | 147 (35.2%) |
| Total | 5,635 (76.0%) | 1,780 (24.0%) |
Educational Attainment by Field of Study in Happy Valley
Business (1,831 | 21.5%), education (860 | 10.1%), bio, nature & agricultural (801 | 9.4%), science & technology (801 | 9.4%), and engineering (635 | 7.4%) are the most common fields of study among 8,518 individuals in Happy Valley who have obtained a bachelor's degree or higher.
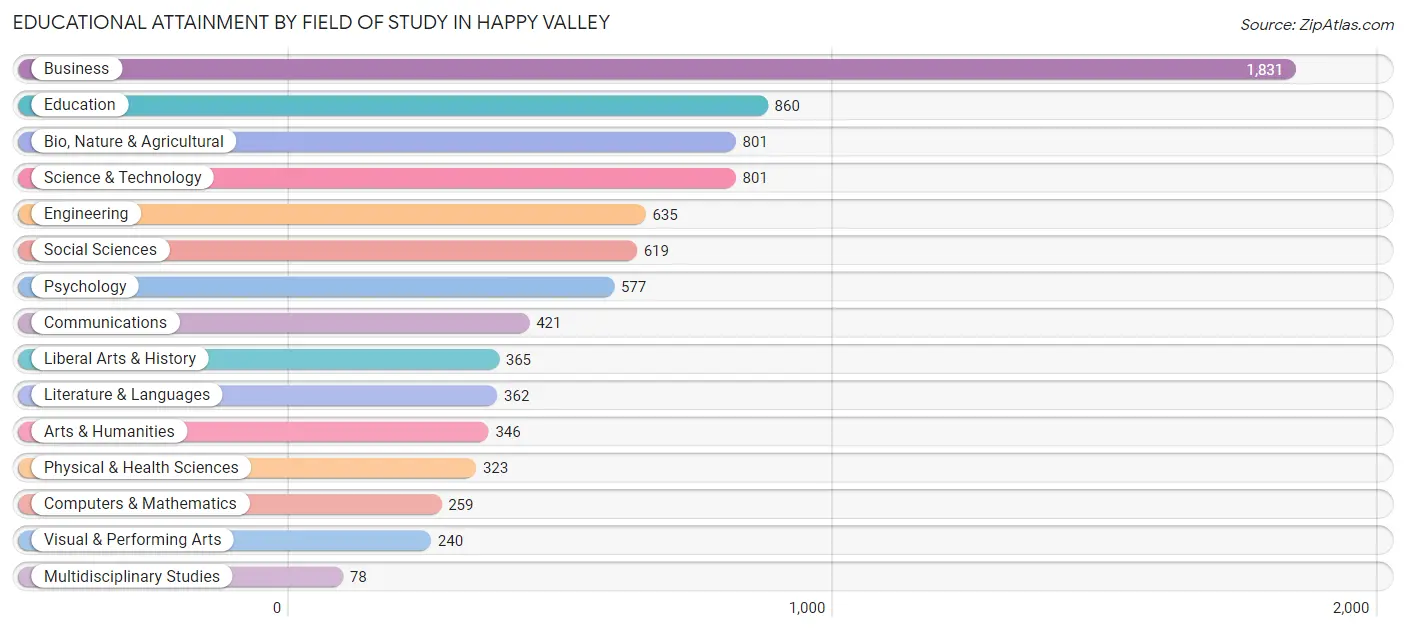
| Field of Study | # Graduates | % Graduates |
| Computers & Mathematics | 259 | 3.0% |
| Bio, Nature & Agricultural | 801 | 9.4% |
| Physical & Health Sciences | 323 | 3.8% |
| Psychology | 577 | 6.8% |
| Social Sciences | 619 | 7.3% |
| Engineering | 635 | 7.4% |
| Multidisciplinary Studies | 78 | 0.9% |
| Science & Technology | 801 | 9.4% |
| Business | 1,831 | 21.5% |
| Education | 860 | 10.1% |
| Literature & Languages | 362 | 4.3% |
| Liberal Arts & History | 365 | 4.3% |
| Visual & Performing Arts | 240 | 2.8% |
| Communications | 421 | 4.9% |
| Arts & Humanities | 346 | 4.1% |
| Total | 8,518 | 100.0% |
Transportation & Commute in Happy Valley
Vehicle Availability by Sex in Happy Valley
The most prevalent vehicle ownership categories in Happy Valley are males with 2 vehicles (2,612, accounting for 41.6%) and females with 2 vehicles (2,112, making up 47.6%).
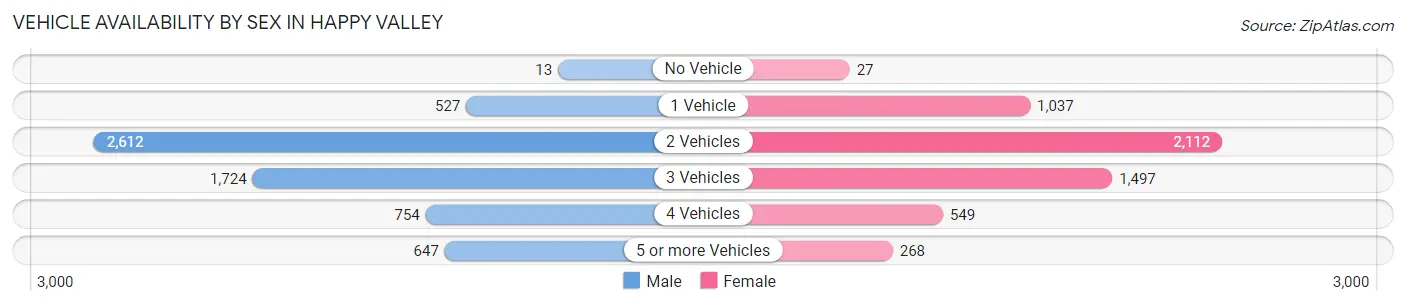
| Vehicles Available | Male | Female |
| No Vehicle | 13 (0.2%) | 27 (0.5%) |
| 1 Vehicle | 527 (8.4%) | 1,037 (18.9%) |
| 2 Vehicles | 2,612 (41.6%) | 2,112 (38.5%) |
| 3 Vehicles | 1,724 (27.5%) | 1,497 (27.3%) |
| 4 Vehicles | 754 (12.0%) | 549 (10.0%) |
| 5 or more Vehicles | 647 (10.3%) | 268 (4.9%) |
| Total | 6,277 (100.0%) | 5,490 (100.0%) |
Commute Time in Happy Valley
The most frequently occuring commute durations in Happy Valley are 30 to 34 minutes (1,466 commuters, 15.3%), 20 to 24 minutes (1,297 commuters, 13.6%), and 10 to 14 minutes (1,118 commuters, 11.7%).
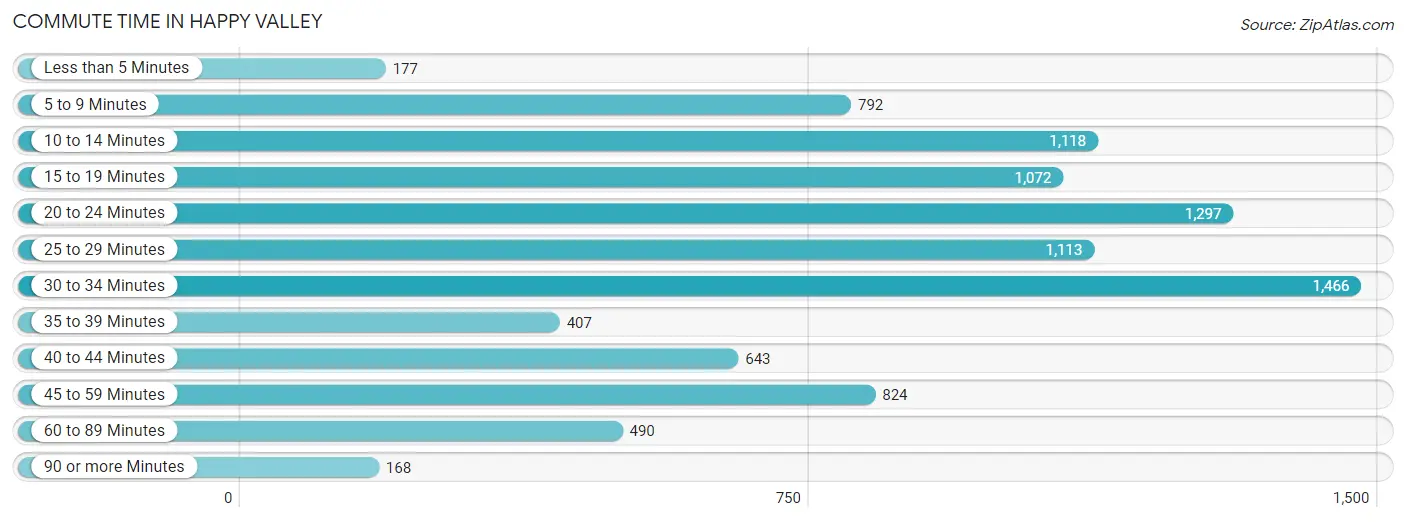
| Commute Time | # Commuters | % Commuters |
| Less than 5 Minutes | 177 | 1.8% |
| 5 to 9 Minutes | 792 | 8.3% |
| 10 to 14 Minutes | 1,118 | 11.7% |
| 15 to 19 Minutes | 1,072 | 11.2% |
| 20 to 24 Minutes | 1,297 | 13.6% |
| 25 to 29 Minutes | 1,113 | 11.6% |
| 30 to 34 Minutes | 1,466 | 15.3% |
| 35 to 39 Minutes | 407 | 4.3% |
| 40 to 44 Minutes | 643 | 6.7% |
| 45 to 59 Minutes | 824 | 8.6% |
| 60 to 89 Minutes | 490 | 5.1% |
| 90 or more Minutes | 168 | 1.8% |
Commute Time by Sex in Happy Valley
The most common commute times in Happy Valley are 30 to 34 minutes (975 commuters, 18.4%) for males and 10 to 14 minutes (638 commuters, 14.9%) for females.
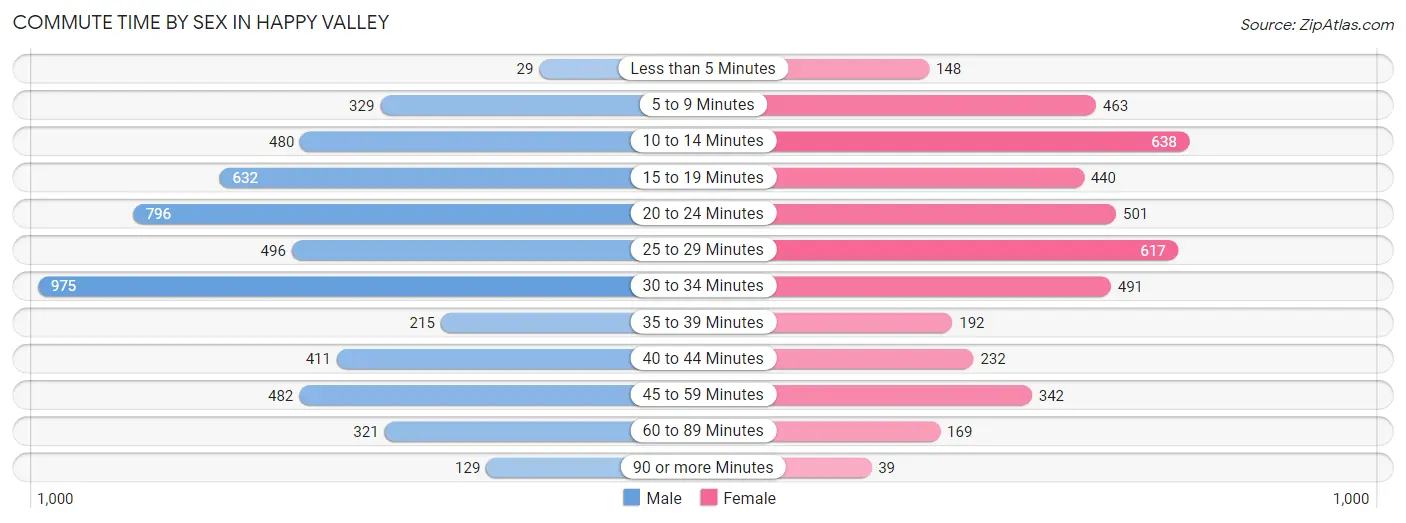
| Commute Time | Male | Female |
| Less than 5 Minutes | 29 (0.5%) | 148 (3.5%) |
| 5 to 9 Minutes | 329 (6.2%) | 463 (10.8%) |
| 10 to 14 Minutes | 480 (9.1%) | 638 (14.9%) |
| 15 to 19 Minutes | 632 (11.9%) | 440 (10.3%) |
| 20 to 24 Minutes | 796 (15.0%) | 501 (11.7%) |
| 25 to 29 Minutes | 496 (9.4%) | 617 (14.4%) |
| 30 to 34 Minutes | 975 (18.4%) | 491 (11.5%) |
| 35 to 39 Minutes | 215 (4.1%) | 192 (4.5%) |
| 40 to 44 Minutes | 411 (7.8%) | 232 (5.4%) |
| 45 to 59 Minutes | 482 (9.1%) | 342 (8.0%) |
| 60 to 89 Minutes | 321 (6.1%) | 169 (4.0%) |
| 90 or more Minutes | 129 (2.4%) | 39 (0.9%) |
Time of Departure to Work by Sex in Happy Valley
The most frequent times of departure to work in Happy Valley are 6:00 AM to 6:29 AM (788, 14.9%) for males and 7:30 AM to 7:59 AM (598, 14.0%) for females.
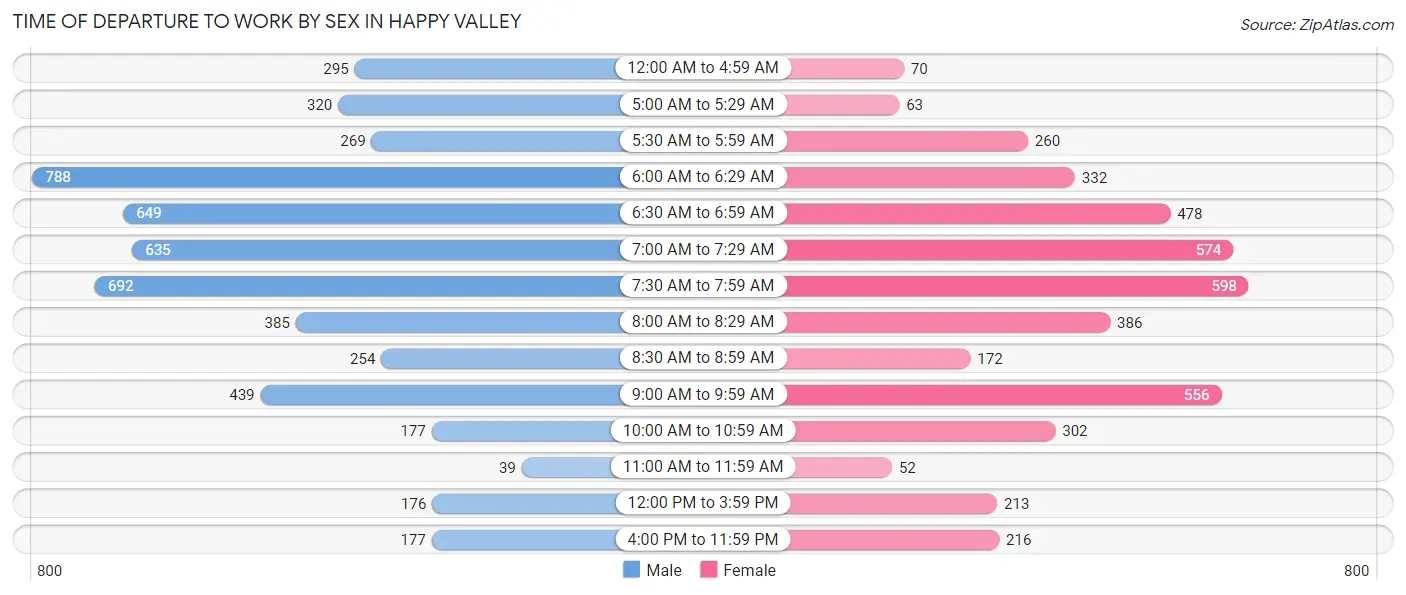
| Time of Departure | Male | Female |
| 12:00 AM to 4:59 AM | 295 (5.6%) | 70 (1.6%) |
| 5:00 AM to 5:29 AM | 320 (6.0%) | 63 (1.5%) |
| 5:30 AM to 5:59 AM | 269 (5.1%) | 260 (6.1%) |
| 6:00 AM to 6:29 AM | 788 (14.9%) | 332 (7.8%) |
| 6:30 AM to 6:59 AM | 649 (12.3%) | 478 (11.2%) |
| 7:00 AM to 7:29 AM | 635 (12.0%) | 574 (13.4%) |
| 7:30 AM to 7:59 AM | 692 (13.1%) | 598 (14.0%) |
| 8:00 AM to 8:29 AM | 385 (7.3%) | 386 (9.0%) |
| 8:30 AM to 8:59 AM | 254 (4.8%) | 172 (4.0%) |
| 9:00 AM to 9:59 AM | 439 (8.3%) | 556 (13.0%) |
| 10:00 AM to 10:59 AM | 177 (3.3%) | 302 (7.1%) |
| 11:00 AM to 11:59 AM | 39 (0.7%) | 52 (1.2%) |
| 12:00 PM to 3:59 PM | 176 (3.3%) | 213 (5.0%) |
| 4:00 PM to 11:59 PM | 177 (3.3%) | 216 (5.1%) |
| Total | 5,295 (100.0%) | 4,272 (100.0%) |
Housing Occupancy in Happy Valley
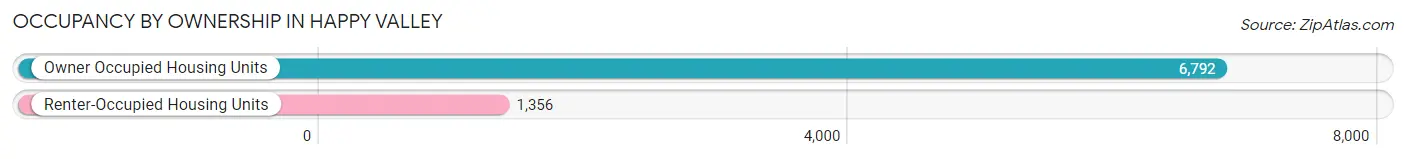
Occupancy by Ownership in Happy Valley
Of the total 8,148 dwellings in Happy Valley, owner-occupied units account for 6,792 (83.4%), while renter-occupied units make up 1,356 (16.6%).
| Occupancy | # Housing Units | % Housing Units |
| Owner Occupied Housing Units | 6,792 | 83.4% |
| Renter-Occupied Housing Units | 1,356 | 16.6% |
| Total Occupied Housing Units | 8,148 | 100.0% |
Occupancy by Household Size in Happy Valley
| Household Size | # Housing Units | % Housing Units |
| 1-Person Household | 1,230 | 15.1% |
| 2-Person Household | 2,886 | 35.4% |
| 3-Person Household | 1,522 | 18.7% |
| 4+ Person Household | 2,510 | 30.8% |
| Total Housing Units | 8,148 | 100.0% |
Occupancy by Ownership by Household Size in Happy Valley
| Household Size | Owner-occupied | Renter-occupied |
| 1-Person Household | 735 (59.8%) | 495 (40.2%) |
| 2-Person Household | 2,422 (83.9%) | 464 (16.1%) |
| 3-Person Household | 1,347 (88.5%) | 175 (11.5%) |
| 4+ Person Household | 2,288 (91.2%) | 222 (8.8%) |
| Total Housing Units | 6,792 (83.4%) | 1,356 (16.6%) |
Occupancy by Educational Attainment in Happy Valley
| Household Size | Owner-occupied | Renter-occupied |
| Less than High School | 250 (86.8%) | 38 (13.2%) |
| High School Diploma | 678 (72.1%) | 262 (27.9%) |
| College/Associate Degree | 2,288 (80.3%) | 561 (19.7%) |
| Bachelor's Degree or higher | 3,576 (87.8%) | 495 (12.2%) |
Occupancy by Age of Householder in Happy Valley
| Age Bracket | # Households | % Households |
| Under 35 Years | 965 | 11.8% |
| 35 to 44 Years | 1,919 | 23.5% |
| 45 to 54 Years | 1,822 | 22.4% |
| 55 to 64 Years | 1,480 | 18.2% |
| 65 to 74 Years | 1,204 | 14.8% |
| 75 to 84 Years | 473 | 5.8% |
| 85 Years and Over | 285 | 3.5% |
| Total | 8,148 | 100.0% |
Housing Finances in Happy Valley
Median Income by Occupancy in Happy Valley
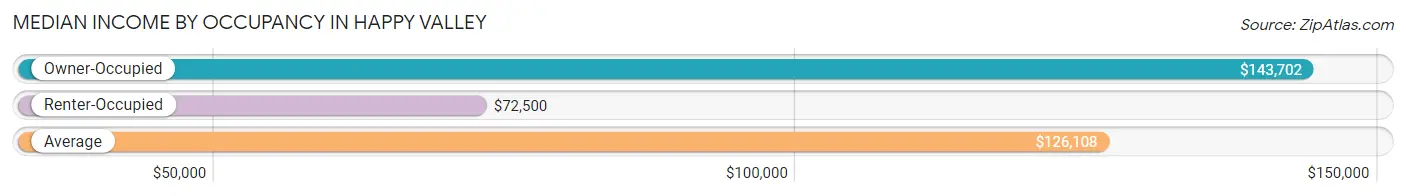
| Occupancy Type | # Households | Median Income |
| Owner-Occupied | 6,792 (83.4%) | $143,702 |
| Renter-Occupied | 1,356 (16.6%) | $72,500 |
| Average | 8,148 (100.0%) | $126,108 |
Occupancy by Householder Income Bracket in Happy Valley
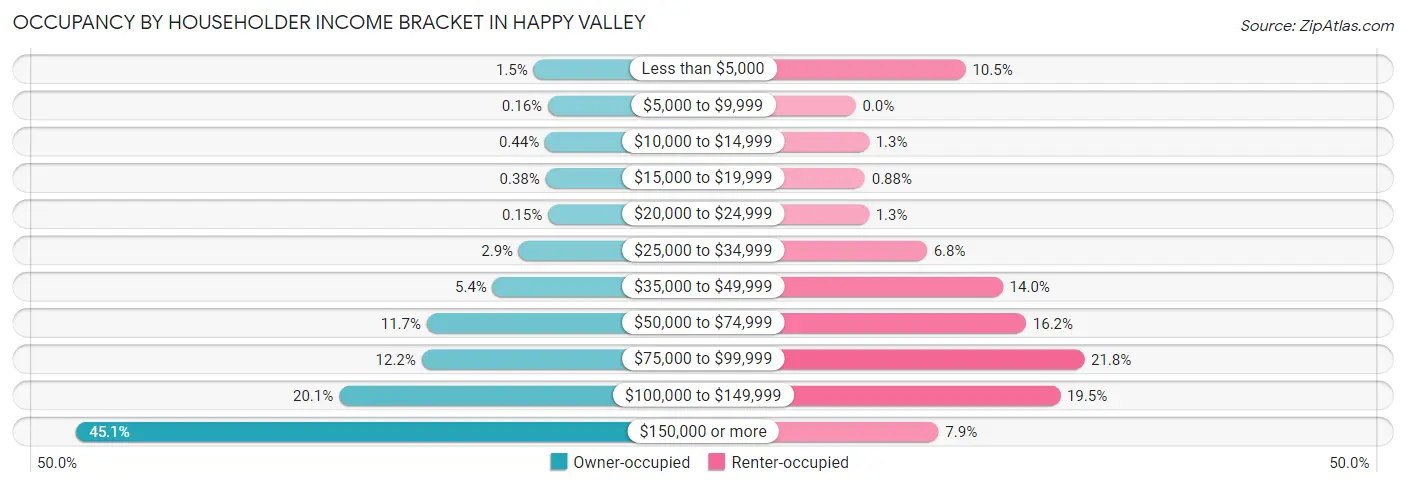
| Income Bracket | Owner-occupied | Renter-occupied |
| Less than $5,000 | 103 (1.5%) | 142 (10.5%) |
| $5,000 to $9,999 | 11 (0.2%) | 0 (0.0%) |
| $10,000 to $14,999 | 30 (0.4%) | 17 (1.3%) |
| $15,000 to $19,999 | 26 (0.4%) | 12 (0.9%) |
| $20,000 to $24,999 | 10 (0.2%) | 17 (1.3%) |
| $25,000 to $34,999 | 198 (2.9%) | 92 (6.8%) |
| $35,000 to $49,999 | 368 (5.4%) | 190 (14.0%) |
| $50,000 to $74,999 | 795 (11.7%) | 220 (16.2%) |
| $75,000 to $99,999 | 828 (12.2%) | 295 (21.8%) |
| $100,000 to $149,999 | 1,362 (20.1%) | 264 (19.5%) |
| $150,000 or more | 3,061 (45.1%) | 107 (7.9%) |
| Total | 6,792 (100.0%) | 1,356 (100.0%) |
Monthly Housing Cost Tiers in Happy Valley
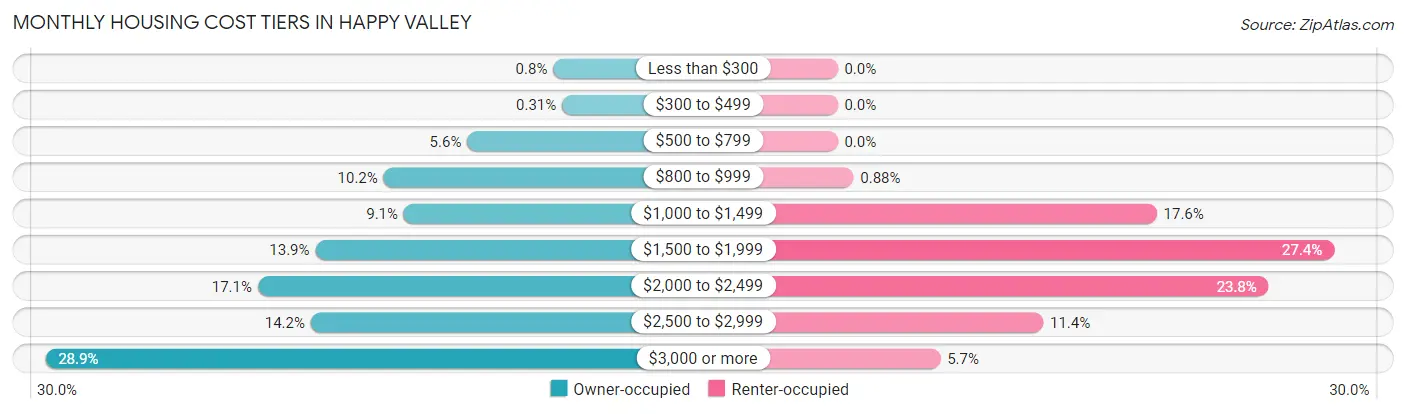
| Monthly Cost | Owner-occupied | Renter-occupied |
| Less than $300 | 54 (0.8%) | 0 (0.0%) |
| $300 to $499 | 21 (0.3%) | 0 (0.0%) |
| $500 to $799 | 377 (5.6%) | 0 (0.0%) |
| $800 to $999 | 691 (10.2%) | 12 (0.9%) |
| $1,000 to $1,499 | 615 (9.0%) | 239 (17.6%) |
| $1,500 to $1,999 | 947 (13.9%) | 372 (27.4%) |
| $2,000 to $2,499 | 1,163 (17.1%) | 323 (23.8%) |
| $2,500 to $2,999 | 964 (14.2%) | 154 (11.4%) |
| $3,000 or more | 1,960 (28.9%) | 77 (5.7%) |
| Total | 6,792 (100.0%) | 1,356 (100.0%) |
Physical Housing Characteristics in Happy Valley
Housing Structures in Happy Valley
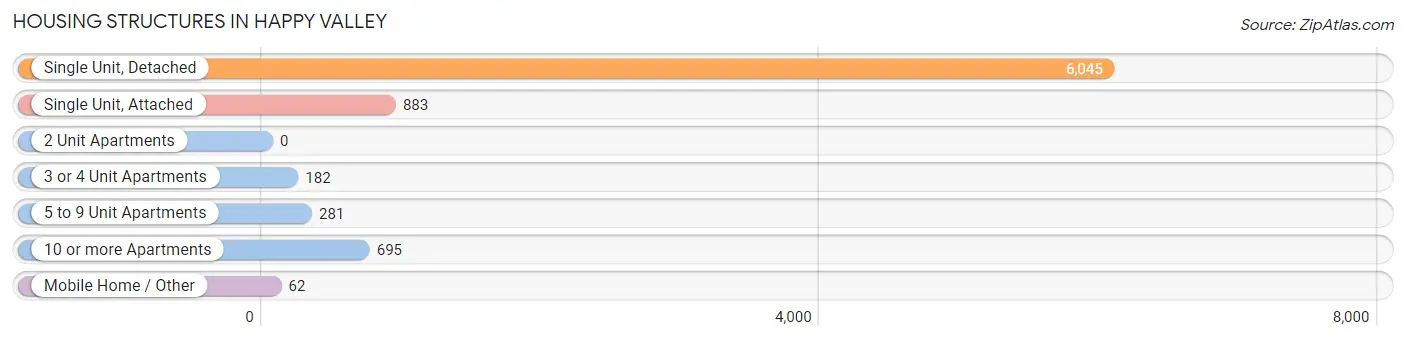
| Structure Type | # Housing Units | % Housing Units |
| Single Unit, Detached | 6,045 | 74.2% |
| Single Unit, Attached | 883 | 10.8% |
| 2 Unit Apartments | 0 | 0.0% |
| 3 or 4 Unit Apartments | 182 | 2.2% |
| 5 to 9 Unit Apartments | 281 | 3.5% |
| 10 or more Apartments | 695 | 8.5% |
| Mobile Home / Other | 62 | 0.8% |
| Total | 8,148 | 100.0% |
Housing Structures by Occupancy in Happy Valley
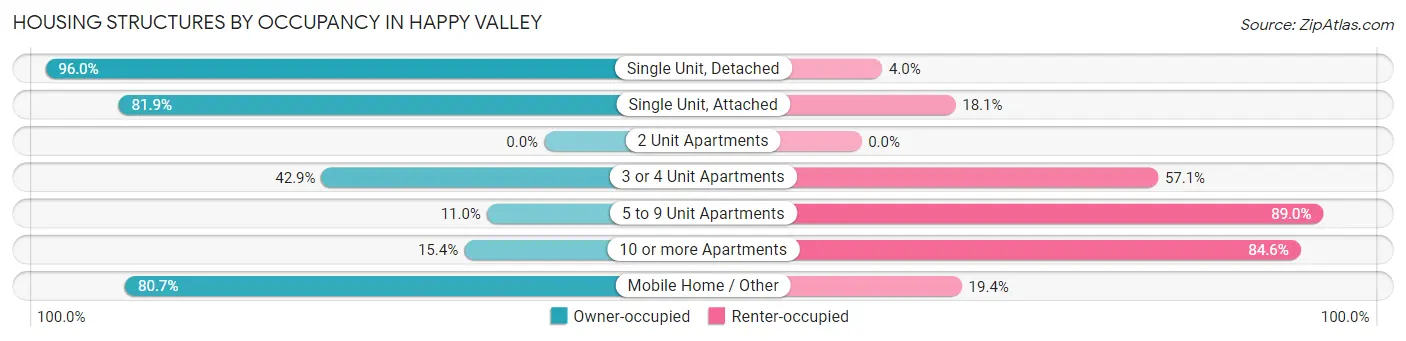
| Structure Type | Owner-occupied | Renter-occupied |
| Single Unit, Detached | 5,803 (96.0%) | 242 (4.0%) |
| Single Unit, Attached | 723 (81.9%) | 160 (18.1%) |
| 2 Unit Apartments | 0 (0.0%) | 0 (0.0%) |
| 3 or 4 Unit Apartments | 78 (42.9%) | 104 (57.1%) |
| 5 to 9 Unit Apartments | 31 (11.0%) | 250 (89.0%) |
| 10 or more Apartments | 107 (15.4%) | 588 (84.6%) |
| Mobile Home / Other | 50 (80.6%) | 12 (19.4%) |
| Total | 6,792 (83.4%) | 1,356 (16.6%) |
Housing Structures by Number of Rooms in Happy Valley
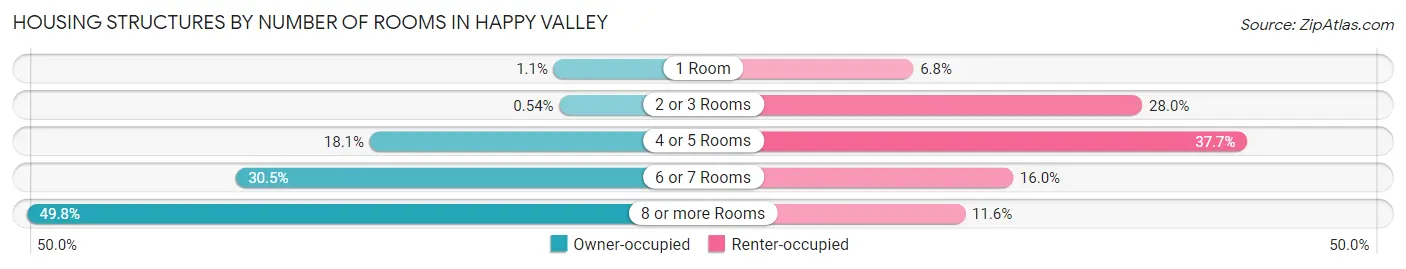
| Number of Rooms | Owner-occupied | Renter-occupied |
| 1 Room | 72 (1.1%) | 92 (6.8%) |
| 2 or 3 Rooms | 37 (0.5%) | 379 (28.0%) |
| 4 or 5 Rooms | 1,227 (18.1%) | 511 (37.7%) |
| 6 or 7 Rooms | 2,073 (30.5%) | 217 (16.0%) |
| 8 or more Rooms | 3,383 (49.8%) | 157 (11.6%) |
| Total | 6,792 (100.0%) | 1,356 (100.0%) |
Housing Structure by Heating Type in Happy Valley
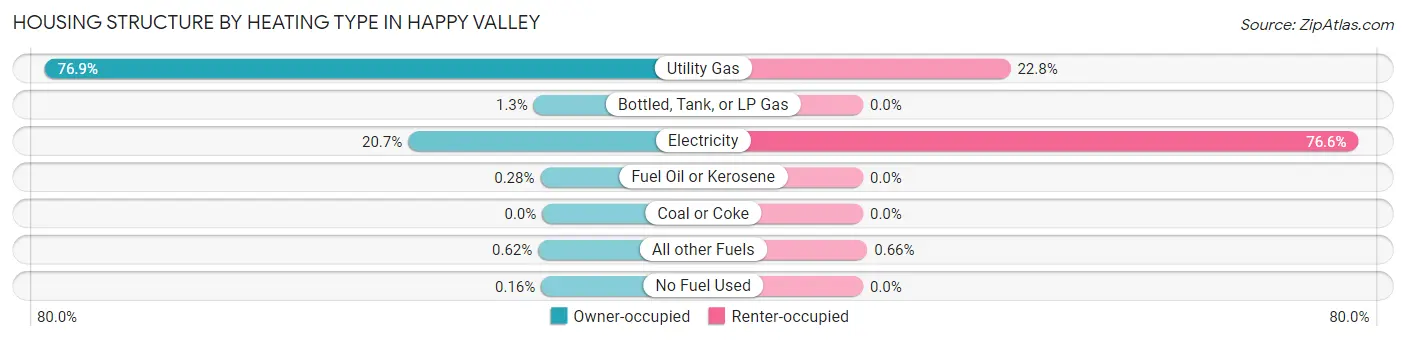
| Heating Type | Owner-occupied | Renter-occupied |
| Utility Gas | 5,224 (76.9%) | 309 (22.8%) |
| Bottled, Tank, or LP Gas | 89 (1.3%) | 0 (0.0%) |
| Electricity | 1,407 (20.7%) | 1,038 (76.5%) |
| Fuel Oil or Kerosene | 19 (0.3%) | 0 (0.0%) |
| Coal or Coke | 0 (0.0%) | 0 (0.0%) |
| All other Fuels | 42 (0.6%) | 9 (0.7%) |
| No Fuel Used | 11 (0.2%) | 0 (0.0%) |
| Total | 6,792 (100.0%) | 1,356 (100.0%) |
Household Vehicle Usage in Happy Valley
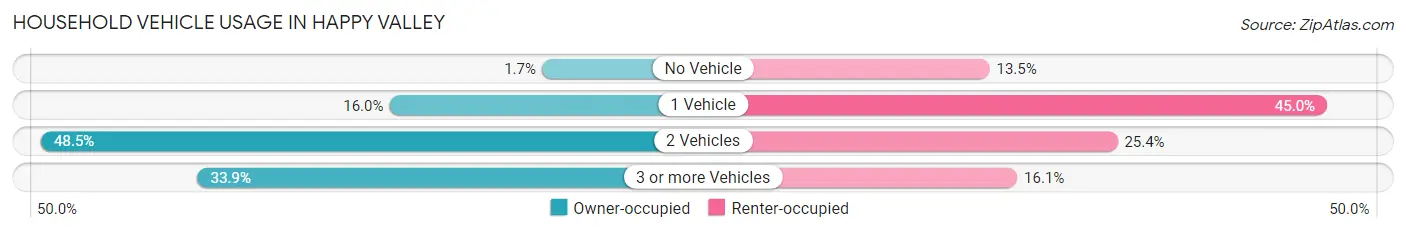
| Vehicles per Household | Owner-occupied | Renter-occupied |
| No Vehicle | 117 (1.7%) | 183 (13.5%) |
| 1 Vehicle | 1,084 (16.0%) | 610 (45.0%) |
| 2 Vehicles | 3,292 (48.5%) | 345 (25.4%) |
| 3 or more Vehicles | 2,299 (33.9%) | 218 (16.1%) |
| Total | 6,792 (100.0%) | 1,356 (100.0%) |
Real Estate & Mortgages in Happy Valley
Real Estate and Mortgage Overview in Happy Valley
| Characteristic | Without Mortgage | With Mortgage |
| Housing Units | 1,811 | 4,981 |
| Median Property Value | $625,000 | $636,100 |
| Median Household Income | $97,026 | $2,407 |
| Monthly Housing Costs | $961 | $1,960 |
| Real Estate Taxes | $6,949 | $59 |
Property Value by Mortgage Status in Happy Valley
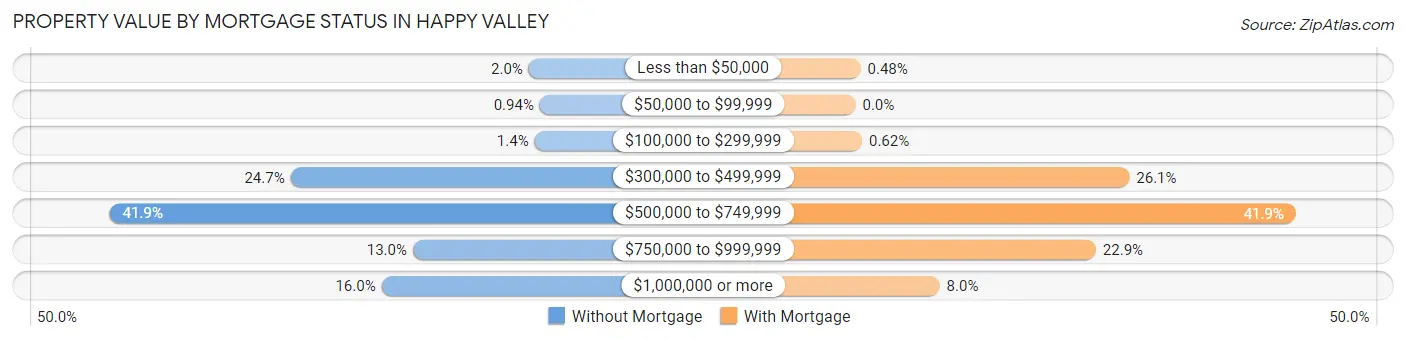
| Property Value | Without Mortgage | With Mortgage |
| Less than $50,000 | 36 (2.0%) | 24 (0.5%) |
| $50,000 to $99,999 | 17 (0.9%) | 0 (0.0%) |
| $100,000 to $299,999 | 26 (1.4%) | 31 (0.6%) |
| $300,000 to $499,999 | 447 (24.7%) | 1,299 (26.1%) |
| $500,000 to $749,999 | 759 (41.9%) | 2,088 (41.9%) |
| $750,000 to $999,999 | 236 (13.0%) | 1,140 (22.9%) |
| $1,000,000 or more | 290 (16.0%) | 399 (8.0%) |
| Total | 1,811 (100.0%) | 4,981 (100.0%) |
Household Income by Mortgage Status in Happy Valley
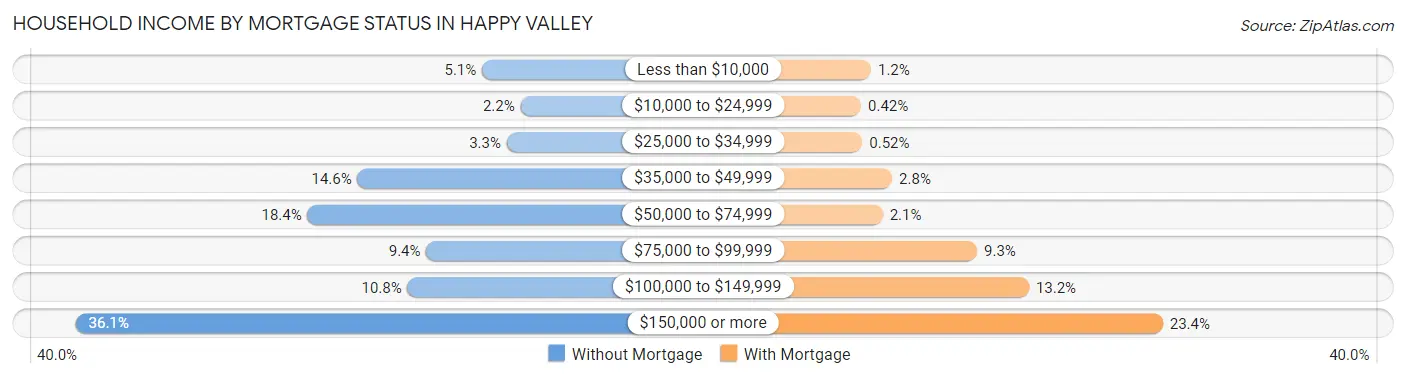
| Household Income | Without Mortgage | With Mortgage |
| Less than $10,000 | 93 (5.1%) | 59 (1.2%) |
| $10,000 to $24,999 | 40 (2.2%) | 21 (0.4%) |
| $25,000 to $34,999 | 59 (3.3%) | 26 (0.5%) |
| $35,000 to $49,999 | 265 (14.6%) | 139 (2.8%) |
| $50,000 to $74,999 | 334 (18.4%) | 103 (2.1%) |
| $75,000 to $99,999 | 170 (9.4%) | 461 (9.3%) |
| $100,000 to $149,999 | 196 (10.8%) | 658 (13.2%) |
| $150,000 or more | 654 (36.1%) | 1,166 (23.4%) |
| Total | 1,811 (100.0%) | 4,981 (100.0%) |
Property Value to Household Income Ratio in Happy Valley
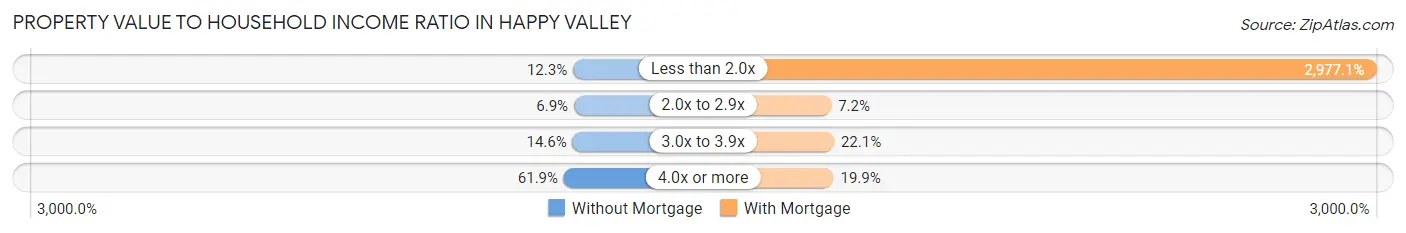
| Value-to-Income Ratio | Without Mortgage | With Mortgage |
| Less than 2.0x | 222 (12.3%) | 148,289 (2,977.1%) |
| 2.0x to 2.9x | 125 (6.9%) | 358 (7.2%) |
| 3.0x to 3.9x | 265 (14.6%) | 1,100 (22.1%) |
| 4.0x or more | 1,121 (61.9%) | 991 (19.9%) |
| Total | 1,811 (100.0%) | 4,981 (100.0%) |
Real Estate Taxes by Mortgage Status in Happy Valley
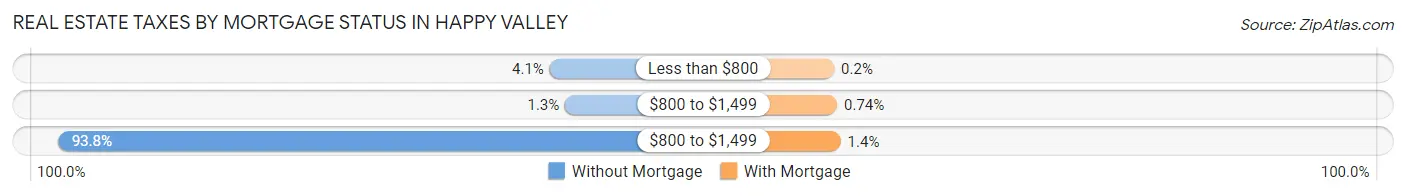
| Property Taxes | Without Mortgage | With Mortgage |
| Less than $800 | 74 (4.1%) | 10 (0.2%) |
| $800 to $1,499 | 23 (1.3%) | 37 (0.7%) |
| $800 to $1,499 | 1,698 (93.8%) | 69 (1.4%) |
| Total | 1,811 (100.0%) | 4,981 (100.0%) |
Health & Disability in Happy Valley
Health Insurance Coverage by Age in Happy Valley
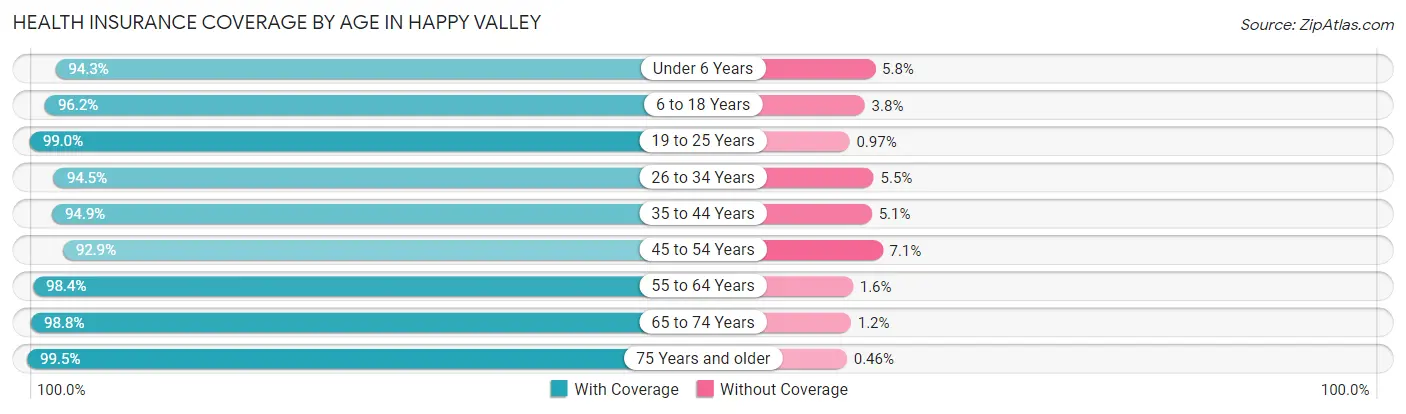
| Age Bracket | With Coverage | Without Coverage |
| Under 6 Years | 1,263 (94.3%) | 77 (5.8%) |
| 6 to 18 Years | 5,471 (96.2%) | 216 (3.8%) |
| 19 to 25 Years | 1,537 (99.0%) | 15 (1.0%) |
| 26 to 34 Years | 1,889 (94.5%) | 109 (5.5%) |
| 35 to 44 Years | 3,528 (94.9%) | 190 (5.1%) |
| 45 to 54 Years | 3,218 (92.9%) | 247 (7.1%) |
| 55 to 64 Years | 2,747 (98.4%) | 44 (1.6%) |
| 65 to 74 Years | 2,209 (98.8%) | 27 (1.2%) |
| 75 Years and older | 1,526 (99.5%) | 7 (0.5%) |
| Total | 23,388 (96.2%) | 932 (3.8%) |
Health Insurance Coverage by Citizenship Status in Happy Valley
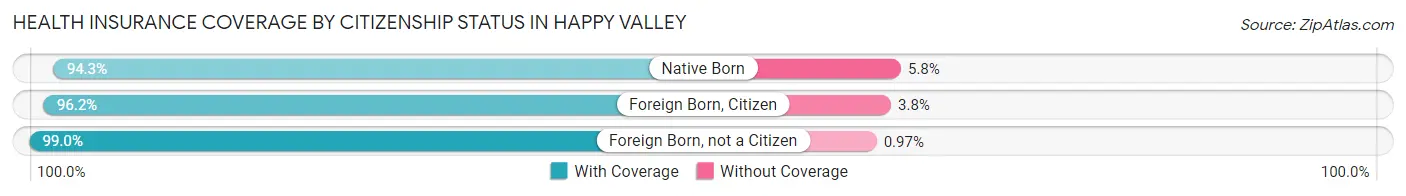
| Citizenship Status | With Coverage | Without Coverage |
| Native Born | 1,263 (94.3%) | 77 (5.8%) |
| Foreign Born, Citizen | 5,471 (96.2%) | 216 (3.8%) |
| Foreign Born, not a Citizen | 1,537 (99.0%) | 15 (1.0%) |
Health Insurance Coverage by Household Income in Happy Valley
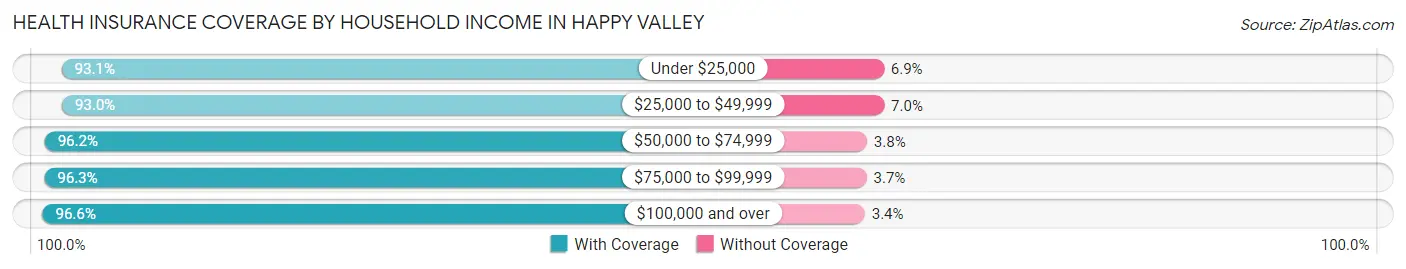
| Household Income | With Coverage | Without Coverage |
| Under $25,000 | 617 (93.1%) | 46 (6.9%) |
| $25,000 to $49,999 | 1,621 (93.0%) | 122 (7.0%) |
| $50,000 to $74,999 | 2,320 (96.2%) | 91 (3.8%) |
| $75,000 to $99,999 | 2,650 (96.3%) | 102 (3.7%) |
| $100,000 and over | 16,123 (96.6%) | 562 (3.4%) |
Public vs Private Health Insurance Coverage by Age in Happy Valley
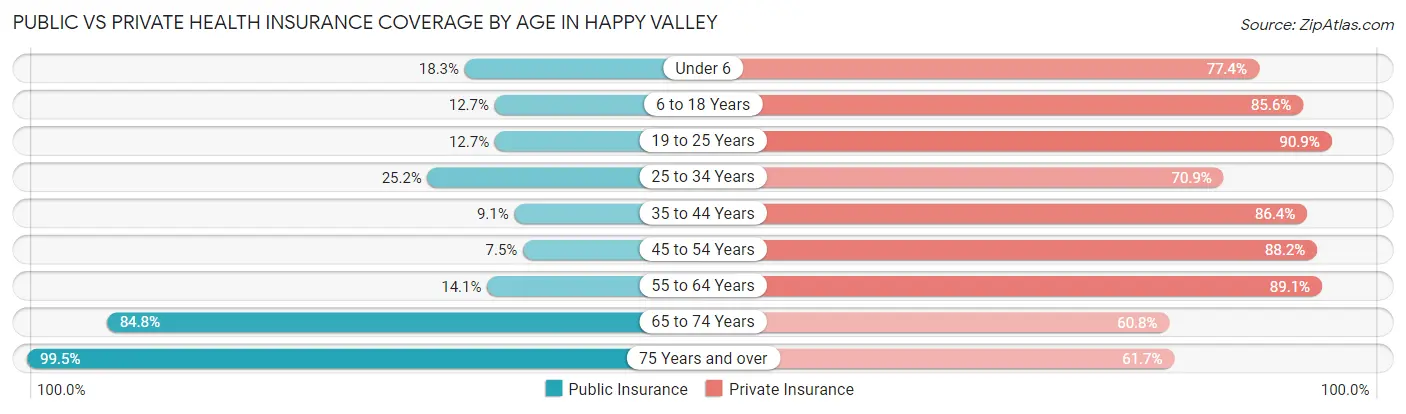
| Age Bracket | Public Insurance | Private Insurance |
| Under 6 | 245 (18.3%) | 1,037 (77.4%) |
| 6 to 18 Years | 724 (12.7%) | 4,870 (85.6%) |
| 19 to 25 Years | 197 (12.7%) | 1,411 (90.9%) |
| 25 to 34 Years | 503 (25.2%) | 1,416 (70.9%) |
| 35 to 44 Years | 337 (9.1%) | 3,211 (86.4%) |
| 45 to 54 Years | 258 (7.4%) | 3,057 (88.2%) |
| 55 to 64 Years | 394 (14.1%) | 2,487 (89.1%) |
| 65 to 74 Years | 1,895 (84.8%) | 1,359 (60.8%) |
| 75 Years and over | 1,526 (99.5%) | 946 (61.7%) |
| Total | 6,079 (25.0%) | 19,794 (81.4%) |
Disability Status by Sex by Age in Happy Valley
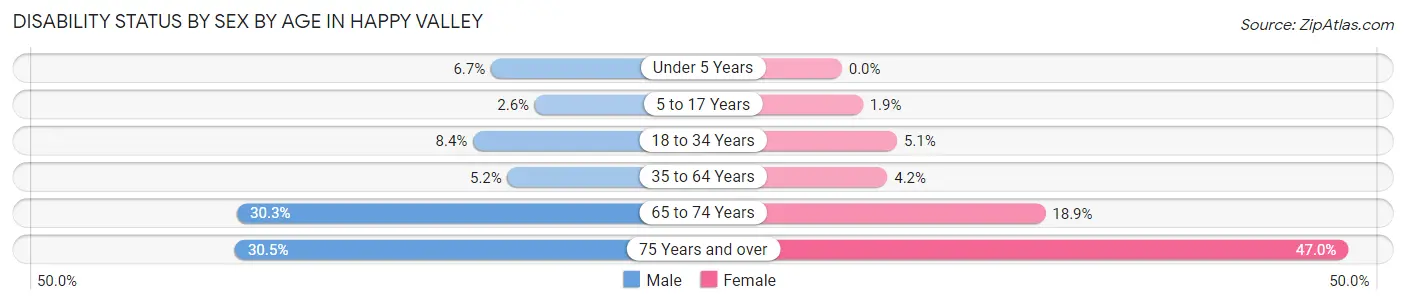
| Age Bracket | Male | Female |
| Under 5 Years | 43 (6.7%) | 0 (0.0%) |
| 5 to 17 Years | 76 (2.6%) | 55 (1.9%) |
| 18 to 34 Years | 140 (8.4%) | 112 (5.1%) |
| 35 to 64 Years | 262 (5.2%) | 207 (4.2%) |
| 65 to 74 Years | 382 (30.3%) | 184 (18.9%) |
| 75 Years and over | 209 (30.5%) | 398 (47.0%) |
Disability Class by Sex by Age in Happy Valley
Disability Class: Hearing Difficulty
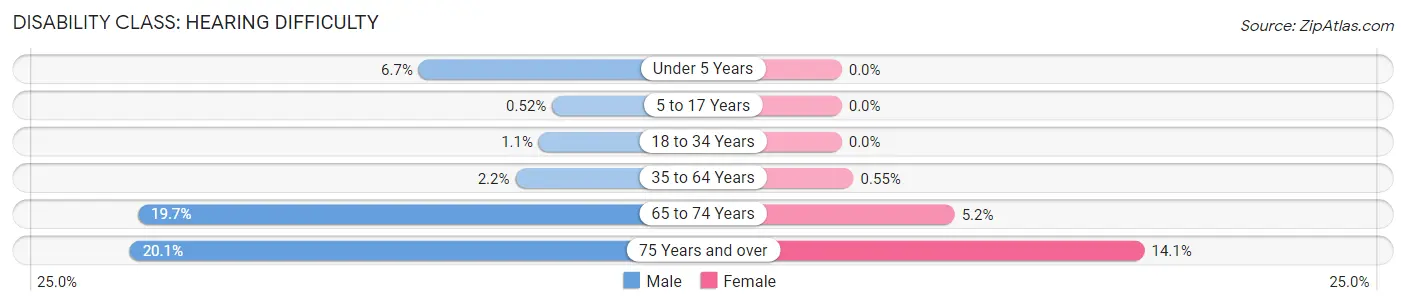
| Age Bracket | Male | Female |
| Under 5 Years | 43 (6.7%) | 0 (0.0%) |
| 5 to 17 Years | 15 (0.5%) | 0 (0.0%) |
| 18 to 34 Years | 19 (1.1%) | 0 (0.0%) |
| 35 to 64 Years | 113 (2.2%) | 27 (0.5%) |
| 65 to 74 Years | 249 (19.7%) | 51 (5.2%) |
| 75 Years and over | 138 (20.1%) | 119 (14.1%) |
Disability Class: Vision Difficulty
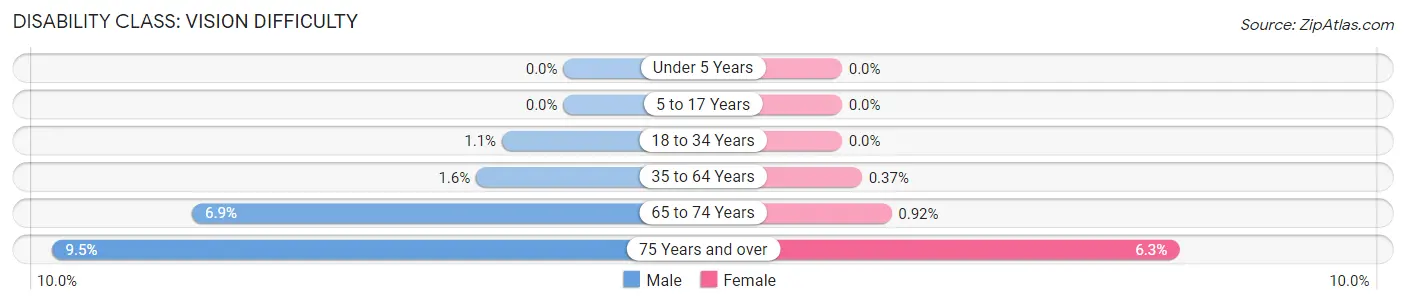
| Age Bracket | Male | Female |
| Under 5 Years | 0 (0.0%) | 0 (0.0%) |
| 5 to 17 Years | 0 (0.0%) | 0 (0.0%) |
| 18 to 34 Years | 19 (1.1%) | 0 (0.0%) |
| 35 to 64 Years | 82 (1.6%) | 18 (0.4%) |
| 65 to 74 Years | 87 (6.9%) | 9 (0.9%) |
| 75 Years and over | 65 (9.5%) | 53 (6.3%) |
Disability Class: Cognitive Difficulty
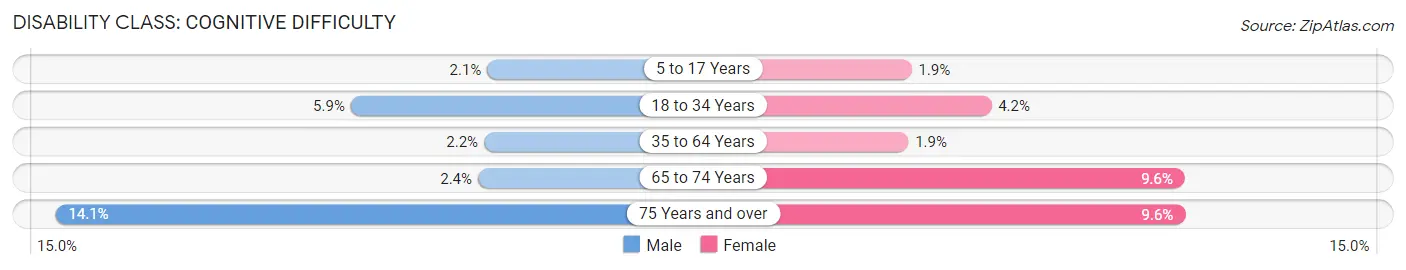
| Age Bracket | Male | Female |
| 5 to 17 Years | 61 (2.1%) | 55 (1.9%) |
| 18 to 34 Years | 99 (5.9%) | 91 (4.2%) |
| 35 to 64 Years | 112 (2.2%) | 91 (1.8%) |
| 65 to 74 Years | 30 (2.4%) | 93 (9.6%) |
| 75 Years and over | 97 (14.1%) | 81 (9.6%) |
Disability Class: Ambulatory Difficulty
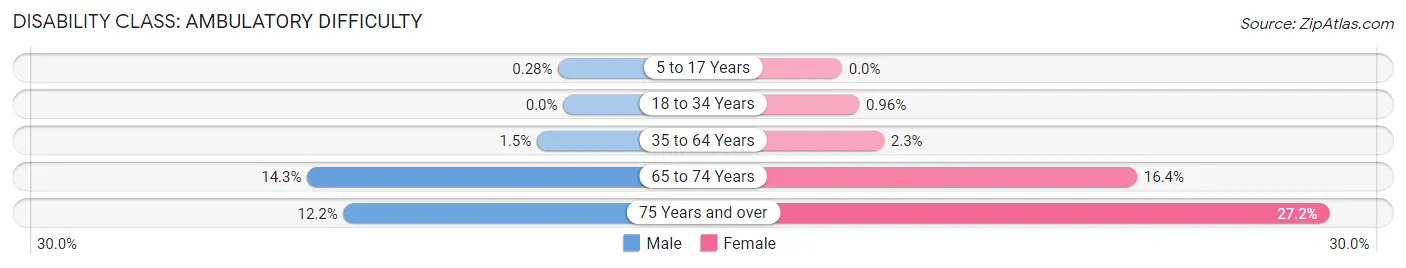
| Age Bracket | Male | Female |
| 5 to 17 Years | 8 (0.3%) | 0 (0.0%) |
| 18 to 34 Years | 0 (0.0%) | 21 (1.0%) |
| 35 to 64 Years | 74 (1.5%) | 115 (2.3%) |
| 65 to 74 Years | 180 (14.3%) | 160 (16.4%) |
| 75 Years and over | 84 (12.2%) | 230 (27.2%) |
Disability Class: Self-Care Difficulty
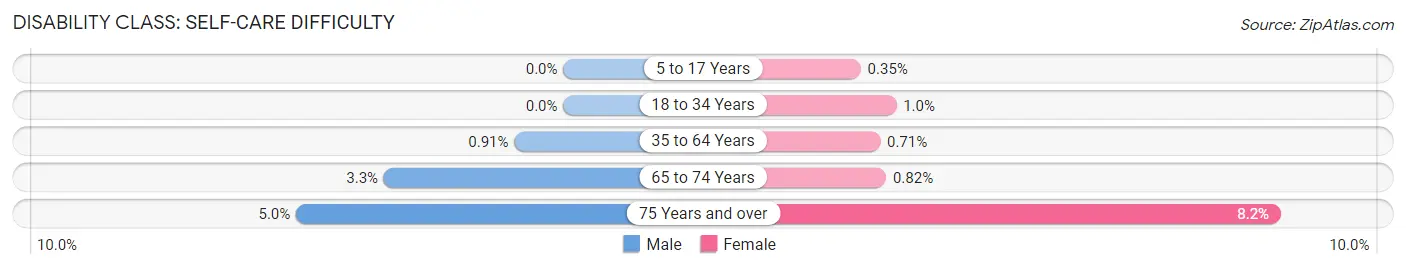
| Age Bracket | Male | Female |
| 5 to 17 Years | 0 (0.0%) | 10 (0.4%) |
| 18 to 34 Years | 0 (0.0%) | 22 (1.0%) |
| 35 to 64 Years | 46 (0.9%) | 35 (0.7%) |
| 65 to 74 Years | 42 (3.3%) | 8 (0.8%) |
| 75 Years and over | 34 (5.0%) | 69 (8.2%) |
Technology Access in Happy Valley
Computing Device Access in Happy Valley
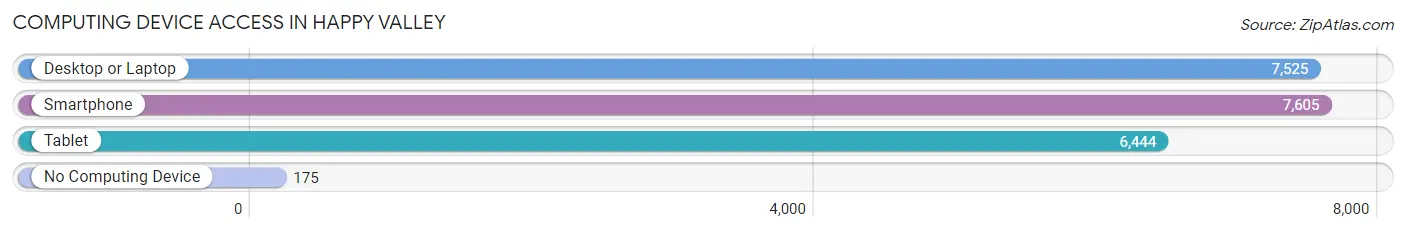
| Device Type | # Households | % Households |
| Desktop or Laptop | 7,525 | 92.3% |
| Smartphone | 7,605 | 93.3% |
| Tablet | 6,444 | 79.1% |
| No Computing Device | 175 | 2.1% |
| Total | 8,148 | 100.0% |
Internet Access in Happy Valley
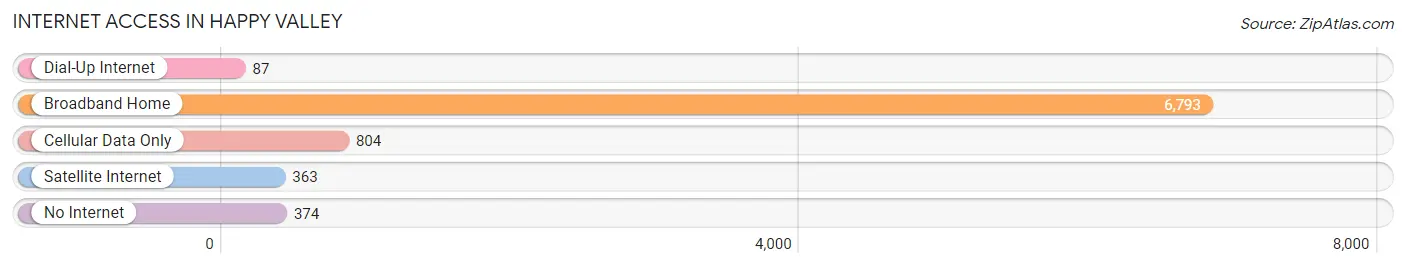
| Internet Type | # Households | % Households |
| Dial-Up Internet | 87 | 1.1% |
| Broadband Home | 6,793 | 83.4% |
| Cellular Data Only | 804 | 9.9% |
| Satellite Internet | 363 | 4.5% |
| No Internet | 374 | 4.6% |
| Total | 8,148 | 100.0% |
Happy Valley Summary
Valley History
Happy Valley is a city located in Clackamas County, Oregon, United States. It is a suburb of Portland, located about 12 miles (19 km) southeast of the city. The population was 13,903 at the 2010 census.
The area that is now Happy Valley was first settled in the 1840s by pioneers who were drawn to the area by its fertile soil and abundant natural resources. The first post office in the area was established in 1851, and the community was officially incorporated as a city in 1965.
Happy Valley has a rich history of agriculture and industry. The area was once home to several large dairy farms, and the city was also the site of a large lumber mill. In the late 19th century, the area was also home to a number of brickyards, which supplied the bricks used to build many of the homes and businesses in the area.
Geography
Happy Valley is located in Clackamas County, Oregon, at the base of the foothills of the Cascade Range. The city is situated on the east side of the Willamette River, about 12 miles (19 km) southeast of Portland. The city covers an area of 8.3 square miles (21.5 km2), with an elevation of 545 feet (166 m).
The city is bordered by the cities of Damascus to the north, Gresham to the east, and Oregon City to the south. To the west, the city is bordered by unincorporated Clackamas County.
Economy
Happy Valley is a primarily residential community, with a strong focus on family-oriented activities. The city is home to several large employers, including Intel, Nike, and the Clackamas Town Center Mall.
The city is also home to a number of small businesses, including restaurants, retail stores, and professional services. The city is served by several major highways, including Interstate 205, Oregon Route 212, and Oregon Route 224.
Demographics
As of the 2010 census, there were 13,903 people, 5,093 households, and 3,717 families residing in the city. The population density was 1,683.3 people per square mile (650.2/km2). There were 5,541 housing units at an average density of 668.3 per square mile (258.2/km2).
The racial makeup of the city was 79.2% White, 5.2% African American, 0.7% Native American, 6.3% Asian, 0.3% Pacific Islander, 3.7% from other races, and 4.7% from two or more races. Hispanic or Latino of any race were 8.3% of the population.
Conclusion
Happy Valley is a city located in Clackamas County, Oregon, United States. It is a suburb of Portland, located about 12 miles (19 km) southeast of the city. The population was 13,903 at the 2010 census. The area that is now Happy Valley was first settled in the 1840s by pioneers who were drawn to the area by its fertile soil and abundant natural resources. The city is primarily residential, with a strong focus on family-oriented activities. The city is home to several large employers, including Intel, Nike, and the Clackamas Town Center Mall. As of the 2010 census, the population was 79.2% White, 5.2% African American, 0.7% Native American, 6.3% Asian, 0.3% Pacific Islander, 3.7% from other races, and 4.7% from two or more races. Hispanic or Latino of any race were 8.3% of the population. Happy Valley is a vibrant community with a rich history and a bright future.
Common Questions
What is Per Capita Income in Happy Valley?
Per Capita income in Happy Valley is $54,453.
What is the Median Family Income in Happy Valley?
Median Family Income in Happy Valley is $139,850.
What is the Median Household income in Happy Valley?
Median Household Income in Happy Valley is $126,108.
What is Income or Wage Gap in Happy Valley?
Income or Wage Gap in Happy Valley is 37.4%.
Women in Happy Valley earn 62.6 cents for every dollar earned by a man.
What is Inequality or Gini Index in Happy Valley?
Inequality or Gini Index in Happy Valley is 0.43.
What is the Total Population of Happy Valley?
Total Population of Happy Valley is 24,381.
What is the Total Male Population of Happy Valley?
Total Male Population of Happy Valley is 12,269.
What is the Total Female Population of Happy Valley?
Total Female Population of Happy Valley is 12,112.
What is the Ratio of Males per 100 Females in Happy Valley?
There are 101.30 Males per 100 Females in Happy Valley.
What is the Ratio of Females per 100 Males in Happy Valley?
There are 98.72 Females per 100 Males in Happy Valley.
What is the Median Population Age in Happy Valley?
Median Population Age in Happy Valley is 39.7 Years.
What is the Average Family Size in Happy Valley
Average Family Size in Happy Valley is 3.3 People.
What is the Average Household Size in Happy Valley
Average Household Size in Happy Valley is 3.0 People.
How Large is the Labor Force in Happy Valley?
There are 12,546 People in the Labor Forcein in Happy Valley.
What is the Percentage of People in the Labor Force in Happy Valley?
67.5% of People are in the Labor Force in Happy Valley.
What is the Unemployment Rate in Happy Valley?
Unemployment Rate in Happy Valley is 3.8%.