Milton, GA Map & Demographics
Milton Map
Milton Overview
$79,468
PER CAPITA INCOME
$178,317
AVG FAMILY INCOME
$142,845
AVG HOUSEHOLD INCOME
51.4%
WAGE / INCOME GAP [ % ]
48.6¢/ $1
WAGE / INCOME GAP [ $ ]
0.48
INEQUALITY / GINI INDEX
41,029
TOTAL POPULATION
20,696
MALE POPULATION
20,333
FEMALE POPULATION
101.79
MALES / 100 FEMALES
98.25
FEMALES / 100 MALES
40.1
MEDIAN AGE
3.1
AVG FAMILY SIZE
2.7
AVG HOUSEHOLD SIZE
22,269
LABOR FORCE [ PEOPLE ]
71.5%
PERCENT IN LABOR FORCE
3.2%
UNEMPLOYMENT RATE
Milton Area Codes
Income in Milton
Income Overview in Milton
Per Capita Income in Milton is $79,468, while median incomes of families and households are $178,317 and $142,845 respectively.
| Characteristic | Number | Measure |
| Per Capita Income | 41,029 | $79,468 |
| Median Family Income | 11,769 | $178,317 |
| Mean Family Income | 11,769 | $247,427 |
| Median Household Income | 15,192 | $142,845 |
| Mean Household Income | 15,192 | $214,213 |
| Income Deficit | 11,769 | $0 |
| Wage / Income Gap (%) | 41,029 | 51.42% |
| Wage / Income Gap ($) | 41,029 | 48.58¢ per $1 |
| Gini / Inequality Index | 41,029 | 0.48 |
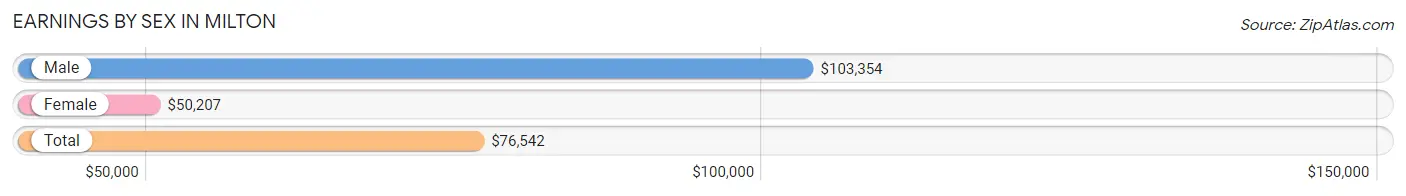
Earnings by Sex in Milton
Average Earnings in Milton are $76,542, $103,354 for men and $50,207 for women, a difference of 51.4%.
| Sex | Number | Average Earnings |
| Male | 12,578 (54.5%) | $103,354 |
| Female | 10,506 (45.5%) | $50,207 |
| Total | 23,084 (100.0%) | $76,542 |
Earnings by Sex by Income Bracket in Milton
The most common earnings brackets in Milton are $100,000+ for men (6,409 | 50.9%) and $100,000+ for women (2,555 | 24.3%).
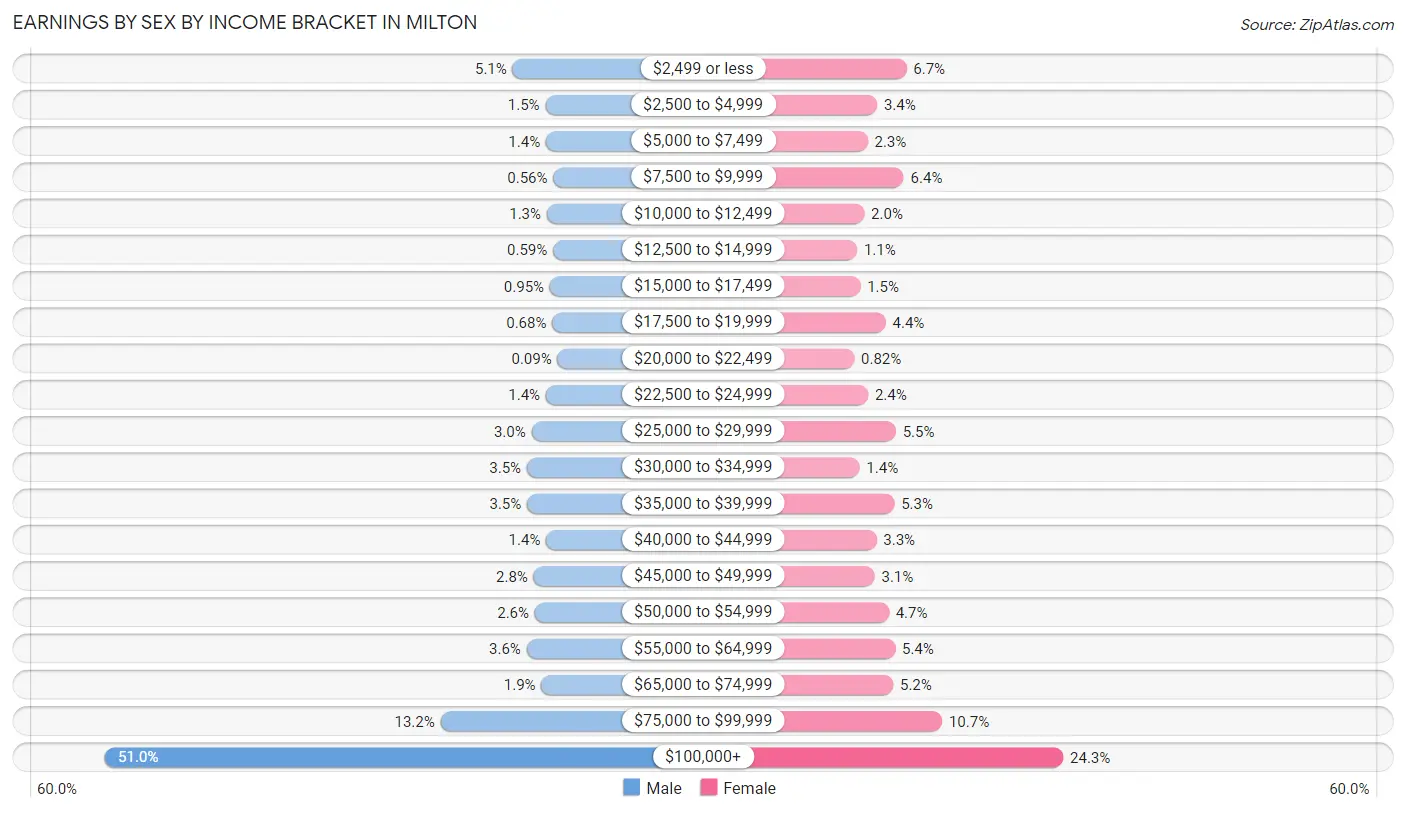
| Income | Male | Female |
| $2,499 or less | 646 (5.1%) | 703 (6.7%) |
| $2,500 to $4,999 | 182 (1.5%) | 356 (3.4%) |
| $5,000 to $7,499 | 175 (1.4%) | 245 (2.3%) |
| $7,500 to $9,999 | 70 (0.6%) | 671 (6.4%) |
| $10,000 to $12,499 | 162 (1.3%) | 205 (1.9%) |
| $12,500 to $14,999 | 74 (0.6%) | 120 (1.1%) |
| $15,000 to $17,499 | 120 (0.9%) | 159 (1.5%) |
| $17,500 to $19,999 | 86 (0.7%) | 458 (4.4%) |
| $20,000 to $22,499 | 11 (0.1%) | 86 (0.8%) |
| $22,500 to $24,999 | 176 (1.4%) | 250 (2.4%) |
| $25,000 to $29,999 | 379 (3.0%) | 578 (5.5%) |
| $30,000 to $34,999 | 444 (3.5%) | 149 (1.4%) |
| $35,000 to $39,999 | 441 (3.5%) | 560 (5.3%) |
| $40,000 to $44,999 | 171 (1.4%) | 349 (3.3%) |
| $45,000 to $49,999 | 348 (2.8%) | 328 (3.1%) |
| $50,000 to $54,999 | 332 (2.6%) | 495 (4.7%) |
| $55,000 to $64,999 | 448 (3.6%) | 569 (5.4%) |
| $65,000 to $74,999 | 239 (1.9%) | 546 (5.2%) |
| $75,000 to $99,999 | 1,665 (13.2%) | 1,124 (10.7%) |
| $100,000+ | 6,409 (50.9%) | 2,555 (24.3%) |
| Total | 12,578 (100.0%) | 10,506 (100.0%) |
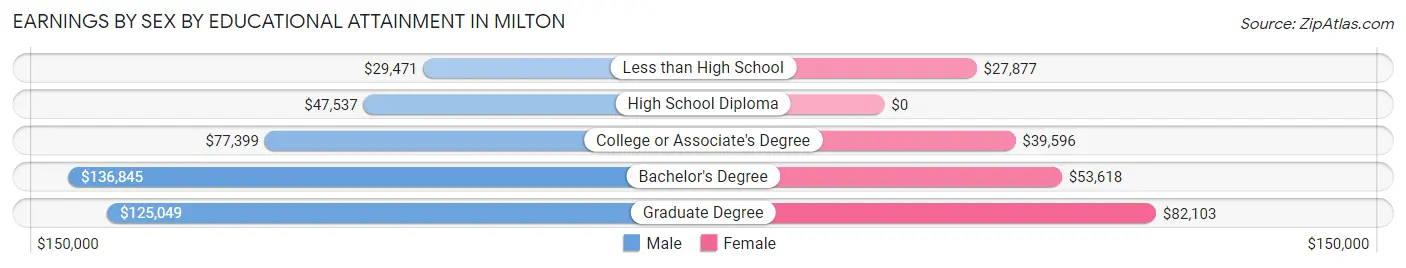
Earnings by Sex by Educational Attainment in Milton
Average earnings in Milton are $111,028 for men and $57,063 for women, a difference of 48.6%. Men with an educational attainment of bachelor's degree enjoy the highest average annual earnings of $136,845, while those with less than high school education earn the least with $29,471. Women with an educational attainment of graduate degree earn the most with the average annual earnings of $82,103, while those with less than high school education have the smallest earnings of $27,877.
| Educational Attainment | Male Income | Female Income |
| Less than High School | $29,471 | $27,877 |
| High School Diploma | $47,537 | $0 |
| College or Associate's Degree | $77,399 | $39,596 |
| Bachelor's Degree | $136,845 | $53,618 |
| Graduate Degree | $125,049 | $82,103 |
| Total | $111,028 | $57,063 |
Family Income in Milton
Family Income Brackets in Milton
According to the Milton family income data, there are 5,320 families falling into the $200,000+ income range, which is the most common income bracket and makes up 45.2% of all families. Conversely, the $10,000 to $14,999 income bracket is the least frequent group with only 82 families (0.7%) belonging to this category.
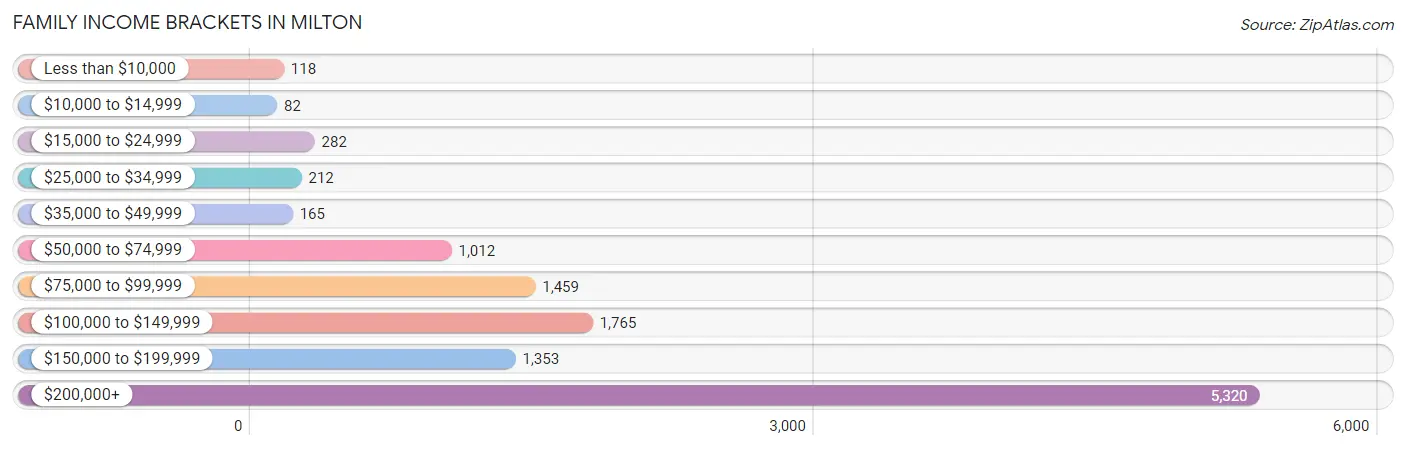
| Income Bracket | # Families | % Families |
| Less than $10,000 | 118 | 1.0% |
| $10,000 to $14,999 | 82 | 0.7% |
| $15,000 to $24,999 | 282 | 2.4% |
| $25,000 to $34,999 | 212 | 1.8% |
| $35,000 to $49,999 | 165 | 1.4% |
| $50,000 to $74,999 | 1,012 | 8.6% |
| $75,000 to $99,999 | 1,459 | 12.4% |
| $100,000 to $149,999 | 1,765 | 15.0% |
| $150,000 to $199,999 | 1,353 | 11.5% |
| $200,000+ | 5,320 | 45.2% |
Family Income by Famaliy Size in Milton
5-person families (769 | 6.5%) account for the highest median family income in Milton with $244,688 per family, while 2-person families (4,119 | 35.0%) have the highest median income of $90,218 per family member.
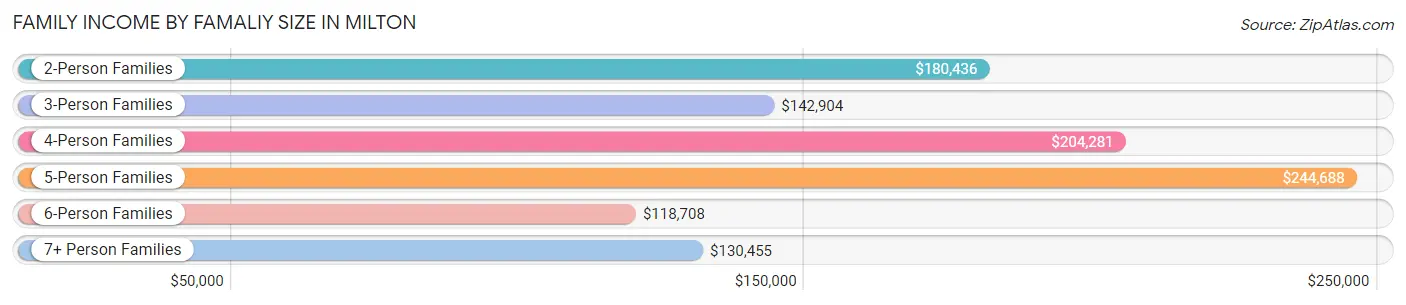
| Income Bracket | # Families | Median Income |
| 2-Person Families | 4,119 (35.0%) | $180,436 |
| 3-Person Families | 3,459 (29.4%) | $142,904 |
| 4-Person Families | 3,071 (26.1%) | $204,281 |
| 5-Person Families | 769 (6.5%) | $244,688 |
| 6-Person Families | 311 (2.6%) | $118,708 |
| 7+ Person Families | 40 (0.3%) | $130,455 |
| Total | 11,769 (100.0%) | $178,317 |
Family Income by Number of Earners in Milton
The median family income in Milton is $178,317, with families comprising 3+ earners (1,606) having the highest median family income of $249,671, while families with no earners (962) have the lowest median family income of $84,433, accounting for 13.7% and 8.2% of families, respectively.
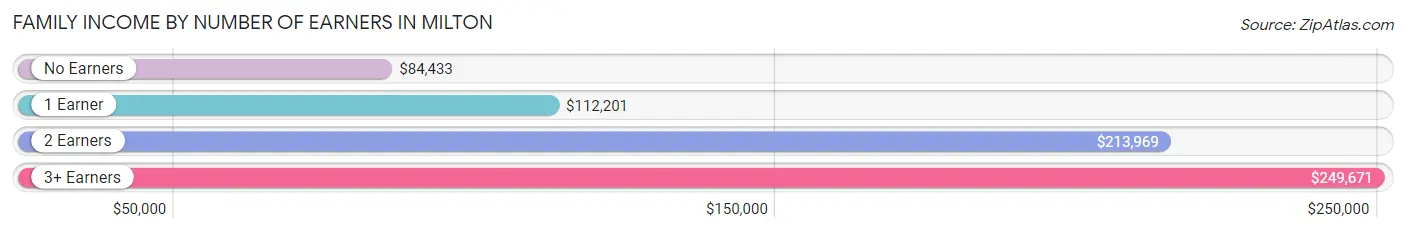
| Number of Earners | # Families | Median Income |
| No Earners | 962 (8.2%) | $84,433 |
| 1 Earner | 3,529 (30.0%) | $112,201 |
| 2 Earners | 5,672 (48.2%) | $213,969 |
| 3+ Earners | 1,606 (13.7%) | $249,671 |
| Total | 11,769 (100.0%) | $178,317 |
Household Income in Milton
Household Income Brackets in Milton
With 5,682 households falling in the category, the $200,000+ income range is the most frequent in Milton, accounting for 37.4% of all households. In contrast, only 167 households (1.1%) fall into the $10,000 to $14,999 income bracket, making it the least populous group.
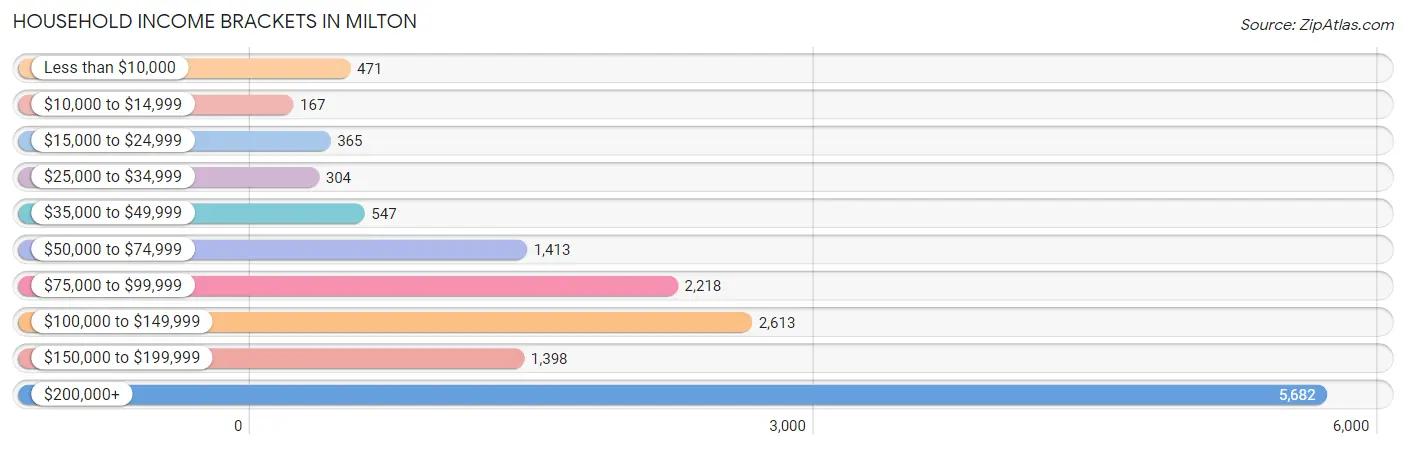
| Income Bracket | # Households | % Households |
| Less than $10,000 | 471 | 3.1% |
| $10,000 to $14,999 | 167 | 1.1% |
| $15,000 to $24,999 | 365 | 2.4% |
| $25,000 to $34,999 | 304 | 2.0% |
| $35,000 to $49,999 | 547 | 3.6% |
| $50,000 to $74,999 | 1,413 | 9.3% |
| $75,000 to $99,999 | 2,218 | 14.6% |
| $100,000 to $149,999 | 2,613 | 17.2% |
| $150,000 to $199,999 | 1,398 | 9.2% |
| $200,000+ | 5,682 | 37.4% |
Household Income by Householder Age in Milton
The median household income in Milton is $142,845, with the highest median household income of $223,066 found in the 45 to 64 years age bracket for the primary householder. A total of 7,569 households (49.8%) fall into this category. Meanwhile, the 15 to 24 years age bracket for the primary householder has the lowest median household income of $0, with 47 households (0.3%) in this group.
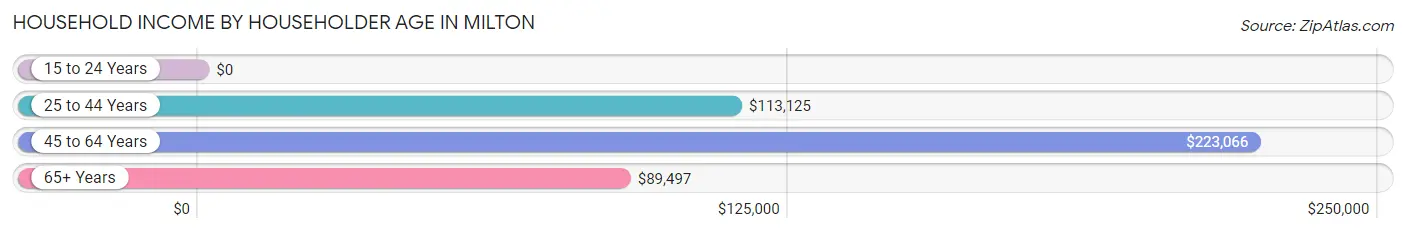
| Income Bracket | # Households | Median Income |
| 15 to 24 Years | 47 (0.3%) | $0 |
| 25 to 44 Years | 5,445 (35.8%) | $113,125 |
| 45 to 64 Years | 7,569 (49.8%) | $223,066 |
| 65+ Years | 2,131 (14.0%) | $89,497 |
| Total | 15,192 (100.0%) | $142,845 |
Poverty in Milton
Income Below Poverty by Sex and Age in Milton
With 3.1% poverty level for males and 4.5% for females among the residents of Milton, 75 year old and over males and 6 to 11 year old females are the most vulnerable to poverty, with 54 males (11.5%) and 225 females (14.7%) in their respective age groups living below the poverty level.
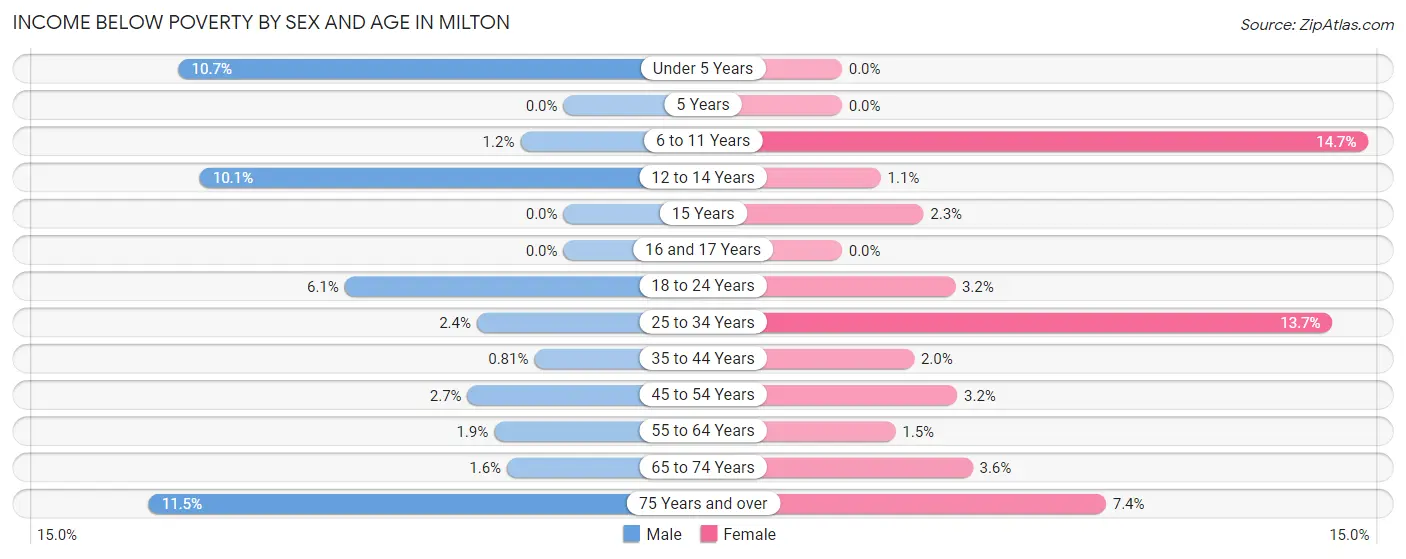
| Age Bracket | Male | Female |
| Under 5 Years | 158 (10.7%) | 0 (0.0%) |
| 5 Years | 0 (0.0%) | 0 (0.0%) |
| 6 to 11 Years | 28 (1.2%) | 225 (14.7%) |
| 12 to 14 Years | 96 (10.1%) | 10 (1.1%) |
| 15 Years | 0 (0.0%) | 14 (2.3%) |
| 16 and 17 Years | 0 (0.0%) | 0 (0.0%) |
| 18 to 24 Years | 61 (6.1%) | 32 (3.2%) |
| 25 to 34 Years | 45 (2.4%) | 316 (13.7%) |
| 35 to 44 Years | 23 (0.8%) | 71 (2.0%) |
| 45 to 54 Years | 100 (2.7%) | 106 (3.2%) |
| 55 to 64 Years | 59 (1.9%) | 48 (1.5%) |
| 65 to 74 Years | 22 (1.6%) | 54 (3.6%) |
| 75 Years and over | 54 (11.5%) | 41 (7.3%) |
| Total | 646 (3.1%) | 917 (4.5%) |
Income Above Poverty by Sex and Age in Milton
According to the poverty statistics in Milton, males aged 5 years and females aged under 5 years are the age groups that are most secure financially, with 100.0% of males and 100.0% of females in these age groups living above the poverty line.
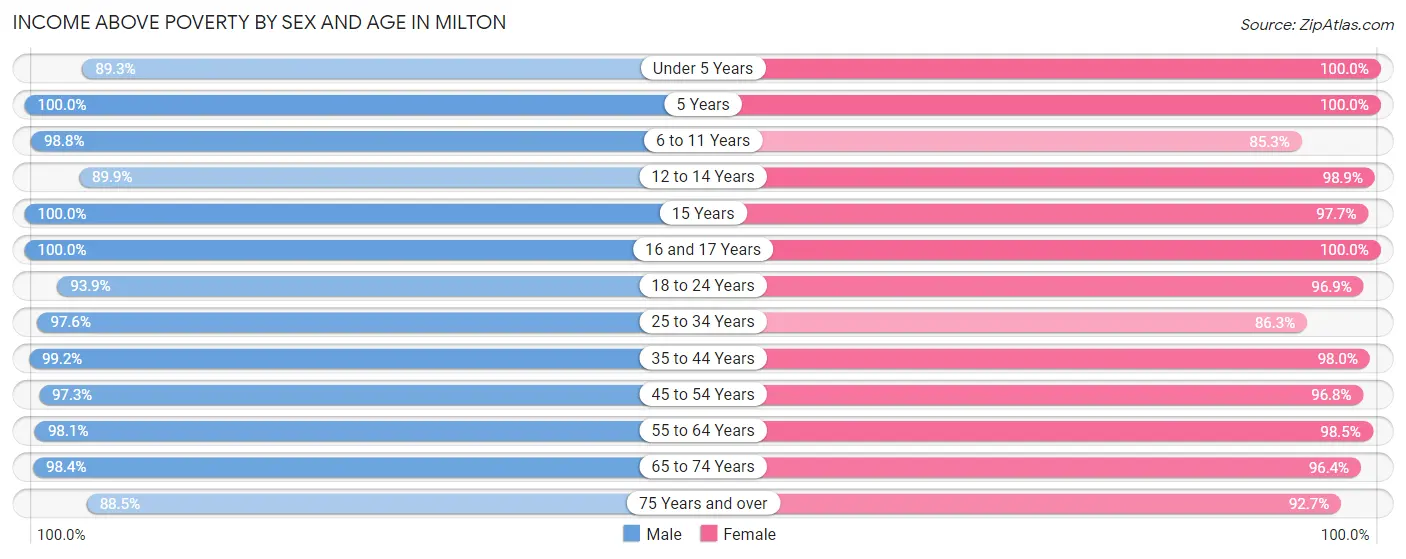
| Age Bracket | Male | Female |
| Under 5 Years | 1,317 (89.3%) | 989 (100.0%) |
| 5 Years | 523 (100.0%) | 163 (100.0%) |
| 6 to 11 Years | 2,307 (98.8%) | 1,310 (85.3%) |
| 12 to 14 Years | 853 (89.9%) | 919 (98.9%) |
| 15 Years | 349 (100.0%) | 604 (97.7%) |
| 16 and 17 Years | 686 (100.0%) | 645 (100.0%) |
| 18 to 24 Years | 941 (93.9%) | 983 (96.9%) |
| 25 to 34 Years | 1,824 (97.6%) | 1,997 (86.3%) |
| 35 to 44 Years | 2,810 (99.2%) | 3,463 (98.0%) |
| 45 to 54 Years | 3,644 (97.3%) | 3,200 (96.8%) |
| 55 to 64 Years | 3,003 (98.1%) | 3,176 (98.5%) |
| 65 to 74 Years | 1,379 (98.4%) | 1,431 (96.4%) |
| 75 Years and over | 414 (88.5%) | 517 (92.6%) |
| Total | 20,050 (96.9%) | 19,397 (95.5%) |
Income Below Poverty Among Married-Couple Families in Milton
The poverty statistics for married-couple families in Milton show that 1.5% or 159 of the total 10,804 families live below the poverty line. Families with 3 or 4 children have the highest poverty rate of 3.7%, comprising of 26 families. On the other hand, families with 1 or 2 children have the lowest poverty rate of 0.0%, which includes 0 families.
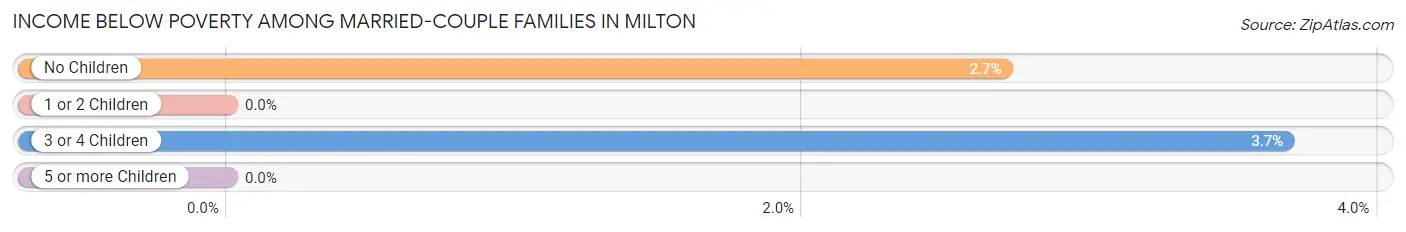
| Children | Above Poverty | Below Poverty |
| No Children | 4,786 (97.3%) | 133 (2.7%) |
| 1 or 2 Children | 5,179 (100.0%) | 0 (0.0%) |
| 3 or 4 Children | 680 (96.3%) | 26 (3.7%) |
| 5 or more Children | 0 (0.0%) | 0 (0.0%) |
| Total | 10,645 (98.5%) | 159 (1.5%) |
Income Below Poverty Among Single-Parent Households in Milton
According to the poverty data in Milton, 27.3% or 73 single-father households and 18.8% or 131 single-mother households are living below the poverty line. Among single-father households, those with 1 or 2 children have the highest poverty rate, with 73 households (42.4%) experiencing poverty. Likewise, among single-mother households, those with no children have the highest poverty rate, with 60 households (24.0%) falling below the poverty line.
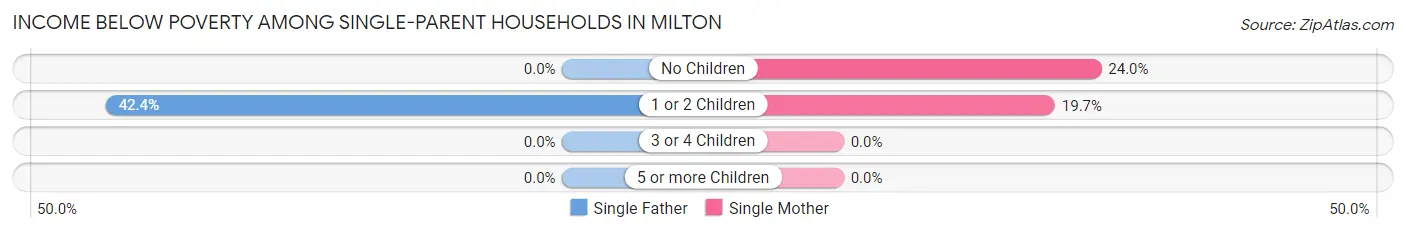
| Children | Single Father | Single Mother |
| No Children | 0 (0.0%) | 60 (24.0%) |
| 1 or 2 Children | 73 (42.4%) | 71 (19.7%) |
| 3 or 4 Children | 0 (0.0%) | 0 (0.0%) |
| 5 or more Children | 0 (0.0%) | 0 (0.0%) |
| Total | 73 (27.3%) | 131 (18.8%) |
Income Below Poverty Among Married-Couple vs Single-Parent Households in Milton
The poverty data for Milton shows that 159 of the married-couple family households (1.5%) and 204 of the single-parent households (21.1%) are living below the poverty level. Within the married-couple family households, those with 3 or 4 children have the highest poverty rate, with 26 households (3.7%) falling below the poverty line. Among the single-parent households, those with 1 or 2 children have the highest poverty rate, with 144 household (27.0%) living below poverty.
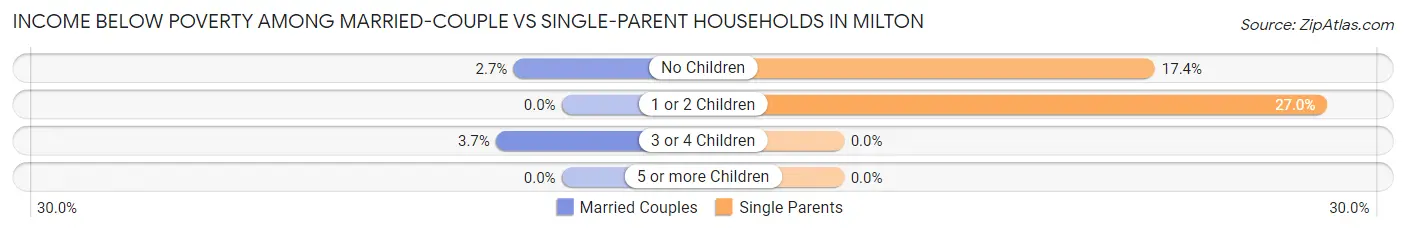
| Children | Married-Couple Families | Single-Parent Households |
| No Children | 133 (2.7%) | 60 (17.4%) |
| 1 or 2 Children | 0 (0.0%) | 144 (27.0%) |
| 3 or 4 Children | 26 (3.7%) | 0 (0.0%) |
| 5 or more Children | 0 (0.0%) | 0 (0.0%) |
| Total | 159 (1.5%) | 204 (21.1%) |
Race in Milton
The most populous races in Milton are White / Caucasian (24,842 | 60.6%), Asian (6,811 | 16.6%), and Black / African American (5,468 | 13.3%).
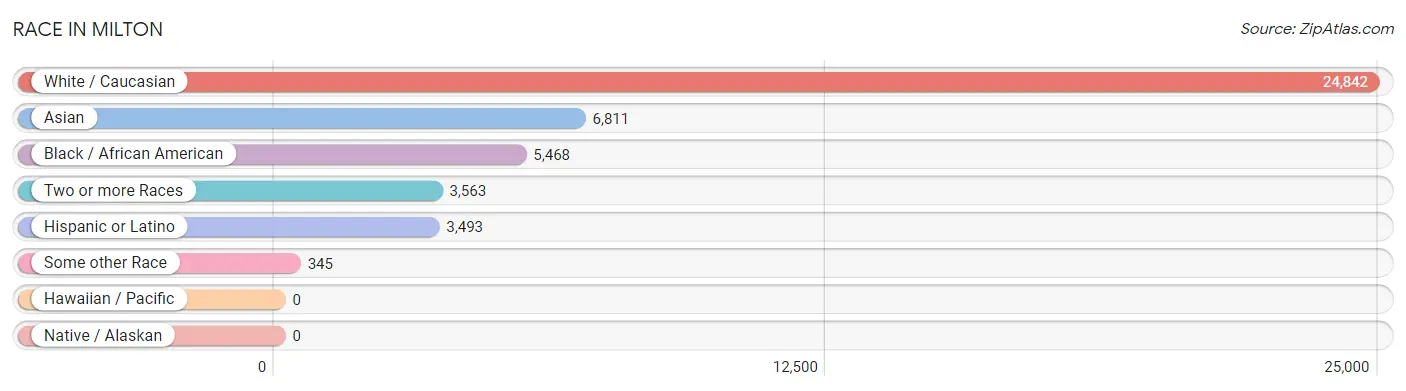
| Race | # Population | % Population |
| Asian | 6,811 | 16.6% |
| Black / African American | 5,468 | 13.3% |
| Hawaiian / Pacific | 0 | 0.0% |
| Hispanic or Latino | 3,493 | 8.5% |
| Native / Alaskan | 0 | 0.0% |
| White / Caucasian | 24,842 | 60.6% |
| Two or more Races | 3,563 | 8.7% |
| Some other Race | 345 | 0.8% |
| Total | 41,029 | 100.0% |
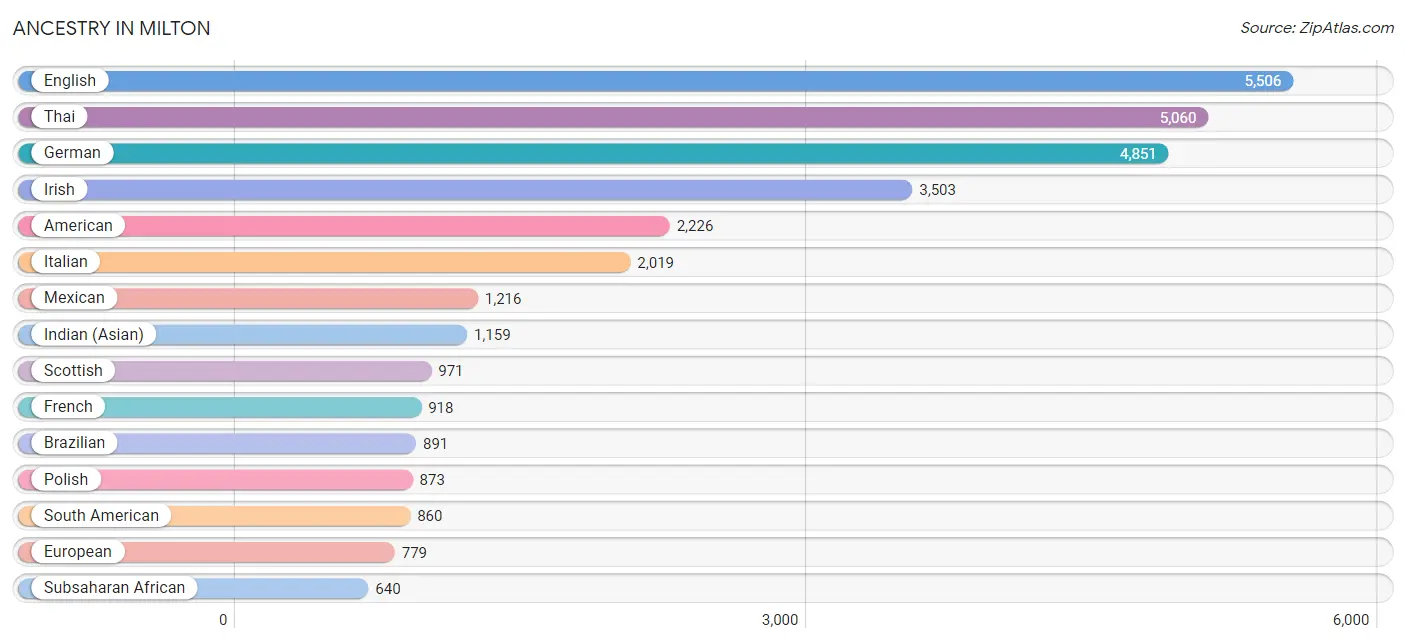
Ancestry in Milton
The most populous ancestries reported in Milton are English (5,506 | 13.4%), Thai (5,060 | 12.3%), German (4,851 | 11.8%), Irish (3,503 | 8.5%), and American (2,226 | 5.4%), together accounting for 51.5% of all Milton residents.
| Ancestry | # Population | % Population |
| African | 267 | 0.6% |
| American | 2,226 | 5.4% |
| Arab | 306 | 0.7% |
| Argentinean | 72 | 0.2% |
| Armenian | 12 | 0.0% |
| Austrian | 174 | 0.4% |
| Bhutanese | 224 | 0.5% |
| Blackfeet | 114 | 0.3% |
| Brazilian | 891 | 2.2% |
| British | 271 | 0.7% |
| Burmese | 410 | 1.0% |
| Canadian | 35 | 0.1% |
| Central American | 139 | 0.3% |
| Central American Indian | 33 | 0.1% |
| Cherokee | 32 | 0.1% |
| Colombian | 227 | 0.5% |
| Costa Rican | 33 | 0.1% |
| Croatian | 12 | 0.0% |
| Cuban | 216 | 0.5% |
| Czech | 108 | 0.3% |
| Czechoslovakian | 76 | 0.2% |
| Danish | 221 | 0.5% |
| Dominican | 11 | 0.0% |
| Dutch | 191 | 0.5% |
| Ecuadorian | 11 | 0.0% |
| English | 5,506 | 13.4% |
| European | 779 | 1.9% |
| Finnish | 193 | 0.5% |
| French | 918 | 2.2% |
| French Canadian | 97 | 0.2% |
| German | 4,851 | 11.8% |
| Greek | 65 | 0.2% |
| Haitian | 36 | 0.1% |
| Honduran | 106 | 0.3% |
| Hungarian | 208 | 0.5% |
| Icelander | 22 | 0.1% |
| Indian (Asian) | 1,159 | 2.8% |
| Iranian | 486 | 1.2% |
| Irish | 3,503 | 8.5% |
| Italian | 2,019 | 4.9% |
| Jamaican | 38 | 0.1% |
| Jordanian | 46 | 0.1% |
| Korean | 257 | 0.6% |
| Lebanese | 181 | 0.4% |
| Lithuanian | 50 | 0.1% |
| Mexican | 1,216 | 3.0% |
| Moroccan | 14 | 0.0% |
| Navajo | 35 | 0.1% |
| Nigerian | 116 | 0.3% |
| Northern European | 58 | 0.1% |
| Norwegian | 51 | 0.1% |
| Palestinian | 45 | 0.1% |
| Peruvian | 34 | 0.1% |
| Polish | 873 | 2.1% |
| Portuguese | 97 | 0.2% |
| Puerto Rican | 485 | 1.2% |
| Romanian | 85 | 0.2% |
| Russian | 393 | 1.0% |
| Scandinavian | 227 | 0.5% |
| Scotch-Irish | 596 | 1.5% |
| Scottish | 971 | 2.4% |
| Seminole | 67 | 0.2% |
| Serbian | 41 | 0.1% |
| Slovak | 120 | 0.3% |
| Slovene | 31 | 0.1% |
| South American | 860 | 2.1% |
| Spaniard | 202 | 0.5% |
| Spanish | 314 | 0.8% |
| Sri Lankan | 80 | 0.2% |
| Subsaharan African | 640 | 1.6% |
| Sudanese | 134 | 0.3% |
| Swedish | 374 | 0.9% |
| Swiss | 80 | 0.2% |
| Syrian | 7 | 0.0% |
| Thai | 5,060 | 12.3% |
| Trinidadian and Tobagonian | 56 | 0.1% |
| Turkish | 80 | 0.2% |
| Ukrainian | 50 | 0.1% |
| Uruguayan | 77 | 0.2% |
| Venezuelan | 439 | 1.1% |
| Welsh | 477 | 1.2% | View All 81 Rows |
Immigrants in Milton
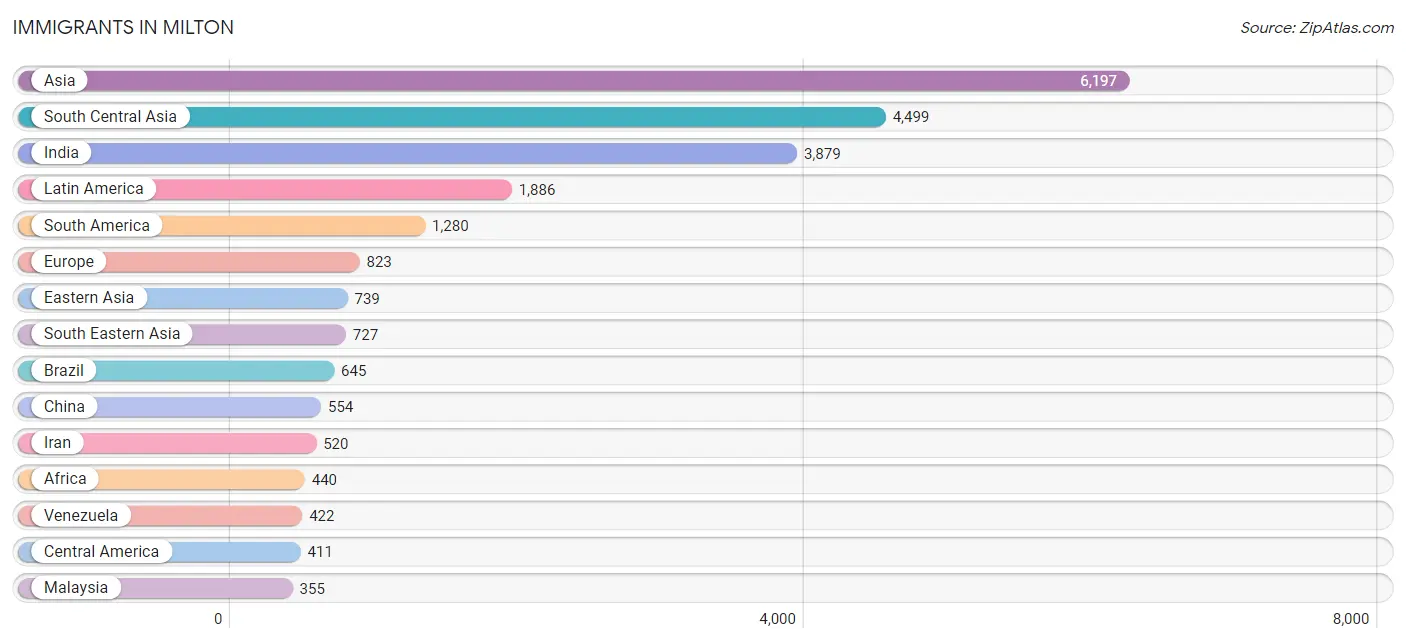
The most numerous immigrant groups reported in Milton came from Asia (6,197 | 15.1%), South Central Asia (4,499 | 11.0%), India (3,879 | 9.5%), Latin America (1,886 | 4.6%), and South America (1,280 | 3.1%), together accounting for 43.2% of all Milton residents.
| Immigration Origin | # Population | % Population |
| Africa | 440 | 1.1% |
| Argentina | 32 | 0.1% |
| Asia | 6,197 | 15.1% |
| Brazil | 645 | 1.6% |
| Canada | 159 | 0.4% |
| Caribbean | 195 | 0.5% |
| Central America | 411 | 1.0% |
| China | 554 | 1.3% |
| Colombia | 110 | 0.3% |
| Costa Rica | 33 | 0.1% |
| Cuba | 84 | 0.2% |
| Denmark | 71 | 0.2% |
| Eastern Africa | 9 | 0.0% |
| Eastern Asia | 739 | 1.8% |
| Eastern Europe | 198 | 0.5% |
| England | 69 | 0.2% |
| Europe | 823 | 2.0% |
| Germany | 273 | 0.7% |
| Haiti | 31 | 0.1% |
| Honduras | 65 | 0.2% |
| India | 3,879 | 9.5% |
| Iran | 520 | 1.3% |
| Israel | 37 | 0.1% |
| Italy | 17 | 0.0% |
| Jamaica | 32 | 0.1% |
| Japan | 66 | 0.2% |
| Jordan | 15 | 0.0% |
| Kazakhstan | 13 | 0.0% |
| Korea | 119 | 0.3% |
| Latin America | 1,886 | 4.6% |
| Lebanon | 63 | 0.2% |
| Malaysia | 355 | 0.9% |
| Mexico | 313 | 0.8% |
| Morocco | 14 | 0.0% |
| Nepal | 82 | 0.2% |
| Nigeria | 105 | 0.3% |
| Northern Africa | 14 | 0.0% |
| Northern Europe | 335 | 0.8% |
| Pakistan | 5 | 0.0% |
| Peru | 34 | 0.1% |
| Philippines | 239 | 0.6% |
| Romania | 52 | 0.1% |
| Russia | 146 | 0.4% |
| South Africa | 61 | 0.2% |
| South America | 1,280 | 3.1% |
| South Central Asia | 4,499 | 11.0% |
| South Eastern Asia | 727 | 1.8% |
| Southern Europe | 17 | 0.0% |
| Sweden | 17 | 0.0% |
| Taiwan | 34 | 0.1% |
| Trinidad and Tobago | 37 | 0.1% |
| Turkey | 5 | 0.0% |
| Uganda | 9 | 0.0% |
| Uruguay | 37 | 0.1% |
| Venezuela | 422 | 1.0% |
| Vietnam | 133 | 0.3% |
| Western Africa | 105 | 0.3% |
| Western Asia | 232 | 0.6% |
| Western Europe | 273 | 0.7% | View All 59 Rows |
Sex and Age in Milton
Sex and Age in Milton
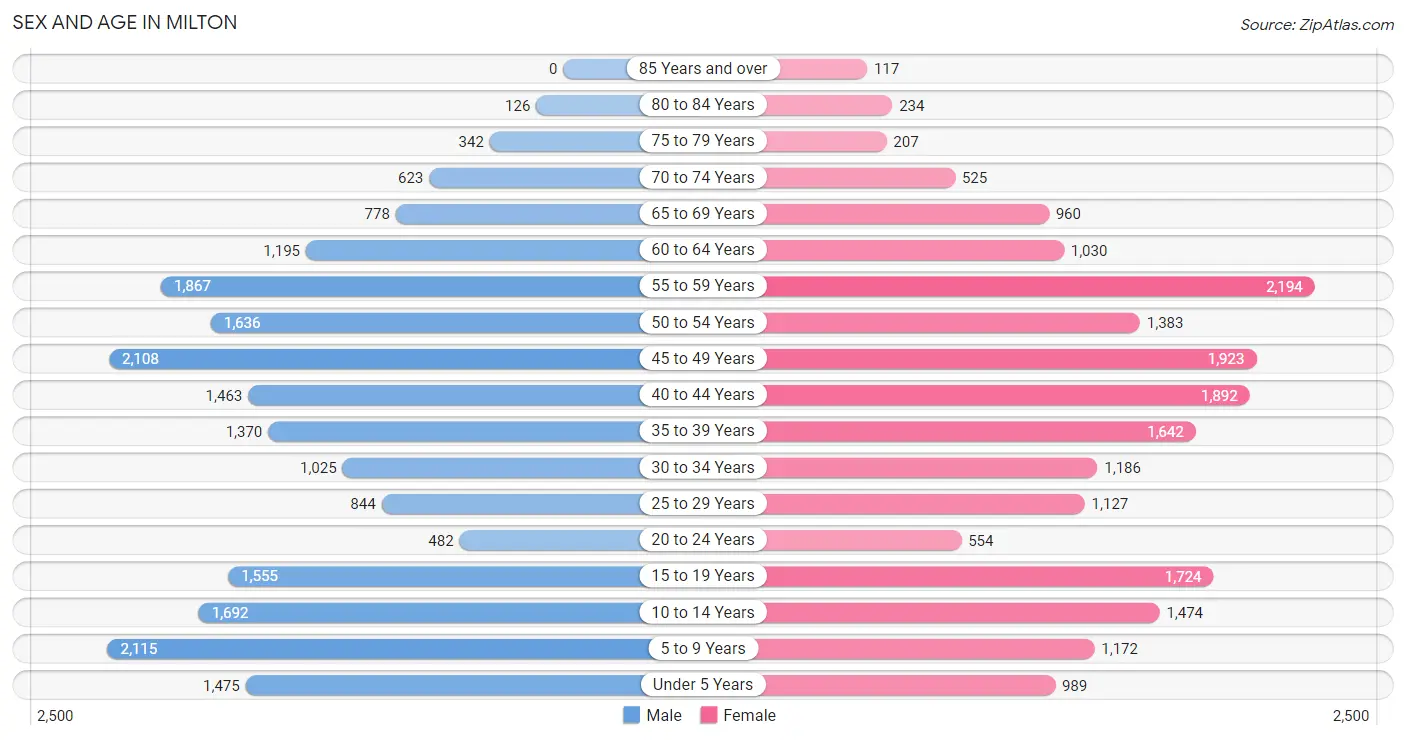
The most populous age groups in Milton are 5 to 9 Years (2,115 | 10.2%) for men and 55 to 59 Years (2,194 | 10.8%) for women.
| Age Bracket | Male | Female |
| Under 5 Years | 1,475 (7.1%) | 989 (4.9%) |
| 5 to 9 Years | 2,115 (10.2%) | 1,172 (5.8%) |
| 10 to 14 Years | 1,692 (8.2%) | 1,474 (7.2%) |
| 15 to 19 Years | 1,555 (7.5%) | 1,724 (8.5%) |
| 20 to 24 Years | 482 (2.3%) | 554 (2.7%) |
| 25 to 29 Years | 844 (4.1%) | 1,127 (5.5%) |
| 30 to 34 Years | 1,025 (5.0%) | 1,186 (5.8%) |
| 35 to 39 Years | 1,370 (6.6%) | 1,642 (8.1%) |
| 40 to 44 Years | 1,463 (7.1%) | 1,892 (9.3%) |
| 45 to 49 Years | 2,108 (10.2%) | 1,923 (9.5%) |
| 50 to 54 Years | 1,636 (7.9%) | 1,383 (6.8%) |
| 55 to 59 Years | 1,867 (9.0%) | 2,194 (10.8%) |
| 60 to 64 Years | 1,195 (5.8%) | 1,030 (5.1%) |
| 65 to 69 Years | 778 (3.8%) | 960 (4.7%) |
| 70 to 74 Years | 623 (3.0%) | 525 (2.6%) |
| 75 to 79 Years | 342 (1.7%) | 207 (1.0%) |
| 80 to 84 Years | 126 (0.6%) | 234 (1.1%) |
| 85 Years and over | 0 (0.0%) | 117 (0.6%) |
| Total | 20,696 (100.0%) | 20,333 (100.0%) |
Families and Households in Milton
Median Family Size in Milton
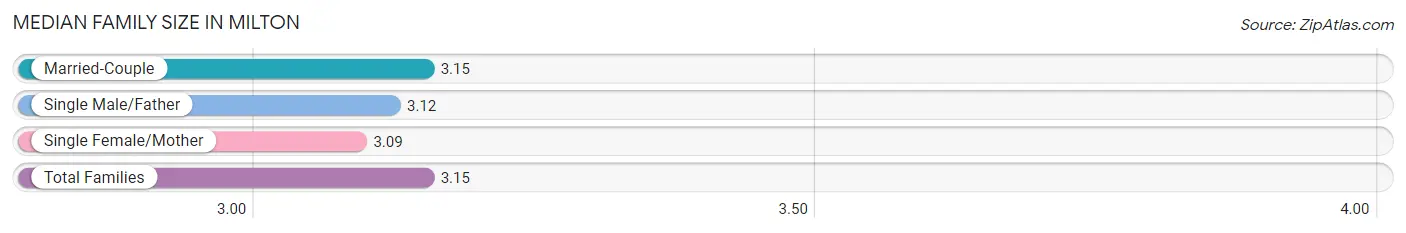
The median family size in Milton is 3.15 persons per family, with married-couple families (10,804 | 91.8%) accounting for the largest median family size of 3.15 persons per family. On the other hand, single female/mother families (698 | 5.9%) represent the smallest median family size with 3.09 persons per family.
| Family Type | # Families | Family Size |
| Married-Couple | 10,804 (91.8%) | 3.15 |
| Single Male/Father | 267 (2.3%) | 3.12 |
| Single Female/Mother | 698 (5.9%) | 3.09 |
| Total Families | 11,769 (100.0%) | 3.15 |
Median Household Size in Milton
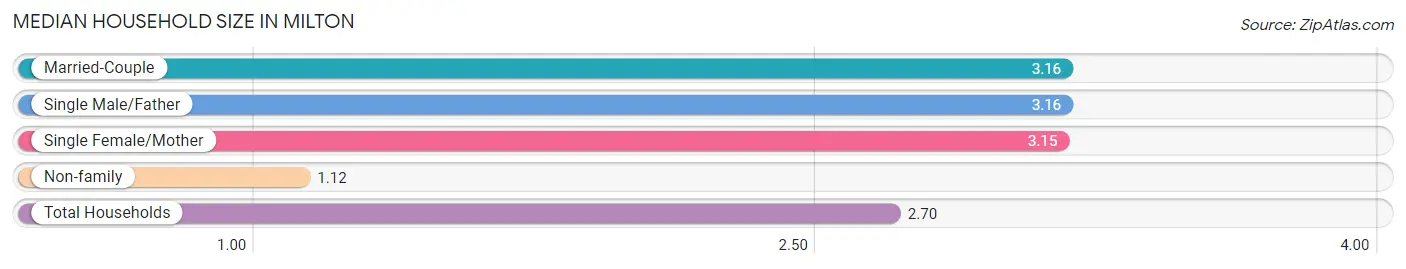
The median household size in Milton is 2.70 persons per household, with married-couple households (10,804 | 71.1%) accounting for the largest median household size of 3.16 persons per household. non-family households (3,423 | 22.5%) represent the smallest median household size with 1.12 persons per household.
| Household Type | # Households | Household Size |
| Married-Couple | 10,804 (71.1%) | 3.16 |
| Single Male/Father | 267 (1.8%) | 3.16 |
| Single Female/Mother | 698 (4.6%) | 3.15 |
| Non-family | 3,423 (22.5%) | 1.12 |
| Total Households | 15,192 (100.0%) | 2.70 |
Household Size by Marriage Status in Milton
Out of a total of 15,192 households in Milton, 11,769 (77.5%) are family households, while 3,423 (22.5%) are nonfamily households. The most numerous type of family households are 2-person households, comprising 4,071, and the most common type of nonfamily households are 1-person households, comprising 3,037.
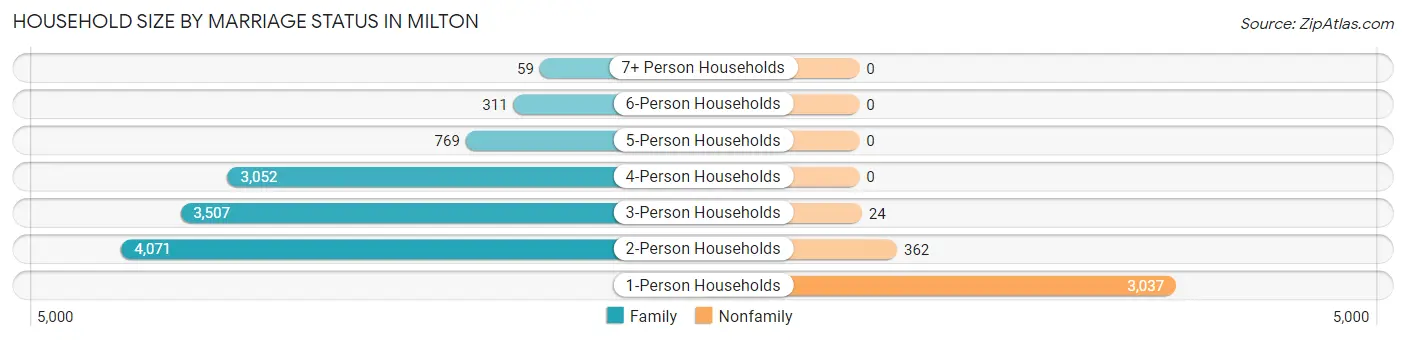
| Household Size | Family Households | Nonfamily Households |
| 1-Person Households | - | 3,037 (20.0%) |
| 2-Person Households | 4,071 (26.8%) | 362 (2.4%) |
| 3-Person Households | 3,507 (23.1%) | 24 (0.2%) |
| 4-Person Households | 3,052 (20.1%) | 0 (0.0%) |
| 5-Person Households | 769 (5.1%) | 0 (0.0%) |
| 6-Person Households | 311 (2.1%) | 0 (0.0%) |
| 7+ Person Households | 59 (0.4%) | 0 (0.0%) |
| Total | 11,769 (77.5%) | 3,423 (22.5%) |
Female Fertility in Milton
Fertility by Age in Milton
Average fertility rate in Milton is 55.0 births per 1,000 women. Women in the age bracket of 35 to 50 years have the highest fertility rate with 85.0 births per 1,000 women. Women in the age bracket of 35 to 50 years acount for 86.5% of all women with births.
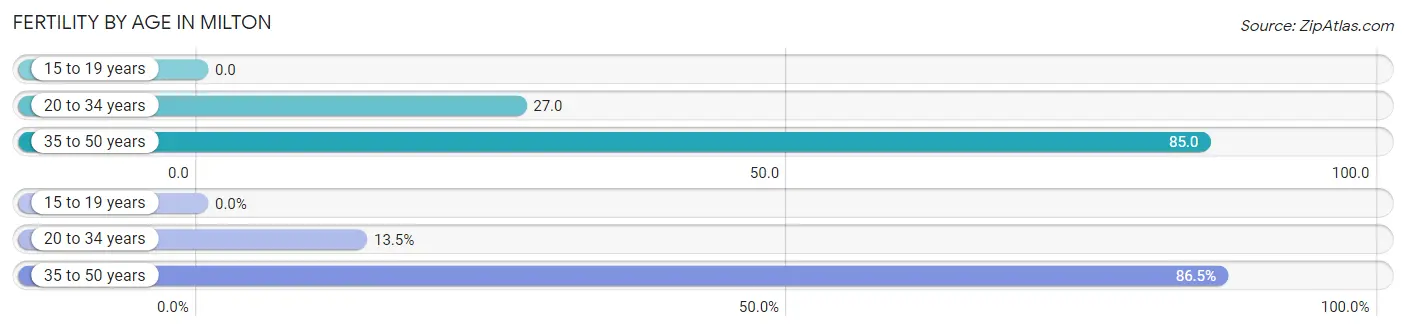
| Age Bracket | Women with Births | Births / 1,000 Women |
| 15 to 19 years | 0 (0.0%) | 0.0 |
| 20 to 34 years | 77 (13.5%) | 27.0 |
| 35 to 50 years | 494 (86.5%) | 85.0 |
| Total | 571 (100.0%) | 55.0 |
Fertility by Age by Marriage Status in Milton
98.2% of women with births (571) in Milton are married. The highest percentage of unmarried women with births falls into 20 to 34 years age bracket with 13.0% of them unmarried at the time of birth, while the lowest percentage of unmarried women with births belong to 35 to 50 years age bracket with 0.0% of them unmarried.
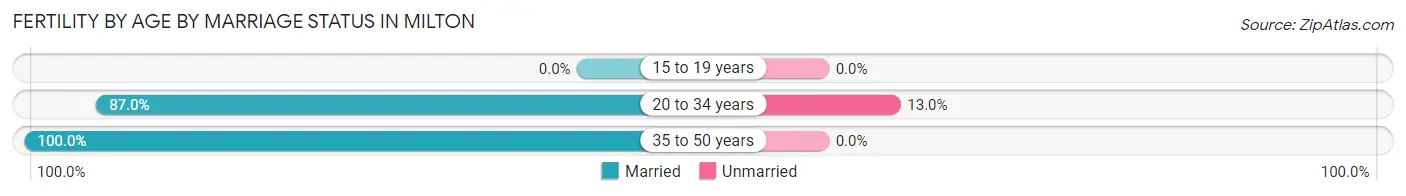
| Age Bracket | Married | Unmarried |
| 15 to 19 years | 0 (0.0%) | 0 (0.0%) |
| 20 to 34 years | 67 (87.0%) | 10 (13.0%) |
| 35 to 50 years | 494 (100.0%) | 0 (0.0%) |
| Total | 561 (98.3%) | 10 (1.8%) |
Fertility by Education in Milton
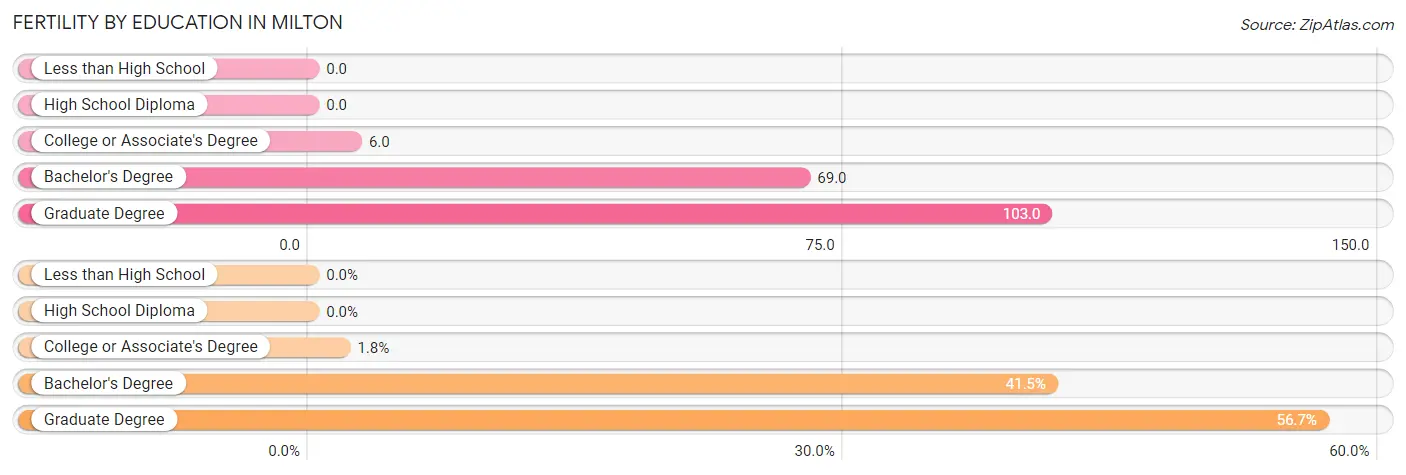
| Educational Attainment | Women with Births | Births / 1,000 Women |
| Less than High School | 0 (0.0%) | 0.0 |
| High School Diploma | 0 (0.0%) | 0.0 |
| College or Associate's Degree | 10 (1.8%) | 6.0 |
| Bachelor's Degree | 237 (41.5%) | 69.0 |
| Graduate Degree | 324 (56.7%) | 103.0 |
| Total | 571 (100.0%) | 55.0 |
Fertility by Education by Marriage Status in Milton
1.8% of women with births in Milton are unmarried. Women with the educational attainment of bachelor's degree are most likely to be married with 100.0% of them married at childbirth, while women with the educational attainment of college or associate's degree are least likely to be married with 100.0% of them unmarried at childbirth.
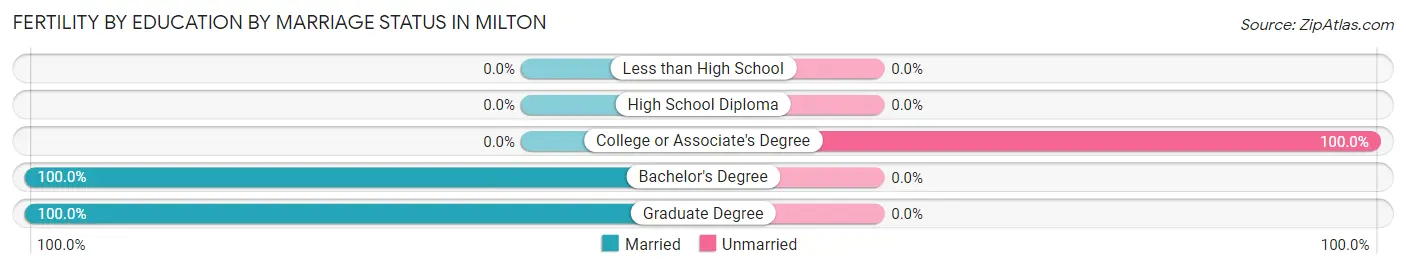
| Educational Attainment | Married | Unmarried |
| Less than High School | 0 (0.0%) | 0 (0.0%) |
| High School Diploma | 0 (0.0%) | 0 (0.0%) |
| College or Associate's Degree | 0 (0.0%) | 10 (100.0%) |
| Bachelor's Degree | 237 (100.0%) | 0 (0.0%) |
| Graduate Degree | 324 (100.0%) | 0 (0.0%) |
| Total | 561 (98.3%) | 10 (1.8%) |
Employment Characteristics in Milton
Employment by Class of Employer in Milton
Among the 21,469 employed individuals in Milton, private company employees (16,271 | 75.8%), self-employed (incorporated) (1,585 | 7.4%), and self-employed (not incorporated) (1,300 | 6.1%) make up the most common classes of employment.
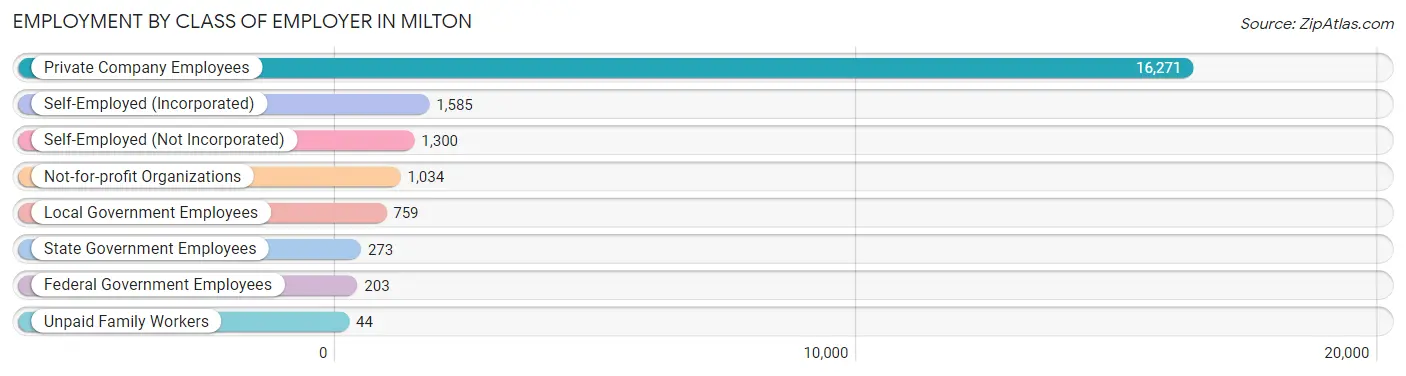
| Employer Class | # Employees | % Employees |
| Private Company Employees | 16,271 | 75.8% |
| Self-Employed (Incorporated) | 1,585 | 7.4% |
| Self-Employed (Not Incorporated) | 1,300 | 6.1% |
| Not-for-profit Organizations | 1,034 | 4.8% |
| Local Government Employees | 759 | 3.5% |
| State Government Employees | 273 | 1.3% |
| Federal Government Employees | 203 | 0.9% |
| Unpaid Family Workers | 44 | 0.2% |
| Total | 21,469 | 100.0% |
Employment Status by Age in Milton
According to the labor force statistics for Milton, out of the total population over 16 years of age (31,145), 71.5% or 22,269 individuals are in the labor force, with 3.2% or 713 of them unemployed. The age group with the highest labor force participation rate is 45 to 54 years, with 90.0% or 6,345 individuals in the labor force. Within the labor force, the 30 to 34 years age range has the highest percentage of unemployed individuals, with 7.4% or 116 of them being unemployed.
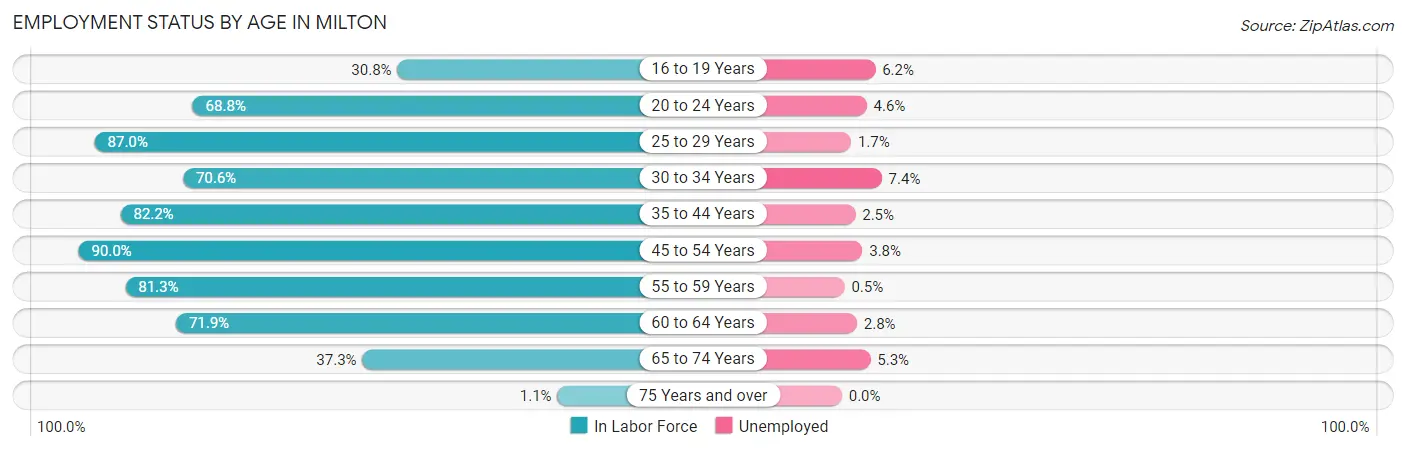
| Age Bracket | In Labor Force | Unemployed |
| 16 to 19 Years | 712 (30.8%) | 44 (6.2%) |
| 20 to 24 Years | 713 (68.8%) | 33 (4.6%) |
| 25 to 29 Years | 1,715 (87.0%) | 29 (1.7%) |
| 30 to 34 Years | 1,561 (70.6%) | 116 (7.4%) |
| 35 to 44 Years | 5,234 (82.2%) | 131 (2.5%) |
| 45 to 54 Years | 6,345 (90.0%) | 241 (3.8%) |
| 55 to 59 Years | 3,302 (81.3%) | 17 (0.5%) |
| 60 to 64 Years | 1,600 (71.9%) | 45 (2.8%) |
| 65 to 74 Years | 1,076 (37.3%) | 57 (5.3%) |
| 75 Years and over | 11 (1.1%) | 0 (0.0%) |
| Total | 22,269 (71.5%) | 713 (3.2%) |
Employment Status by Educational Attainment in Milton
According to labor force statistics for Milton, 82.7% of individuals (19,753) out of the total population between 25 and 64 years of age (23,885) are in the labor force, with 2.9% or 573 of them being unemployed. The group with the highest labor force participation rate are those with the educational attainment of high school diploma, with 84.5% or 920 individuals in the labor force. Within the labor force, individuals with less than high school education have the highest percentage of unemployment, with 7.8% or 56 of them being unemployed.
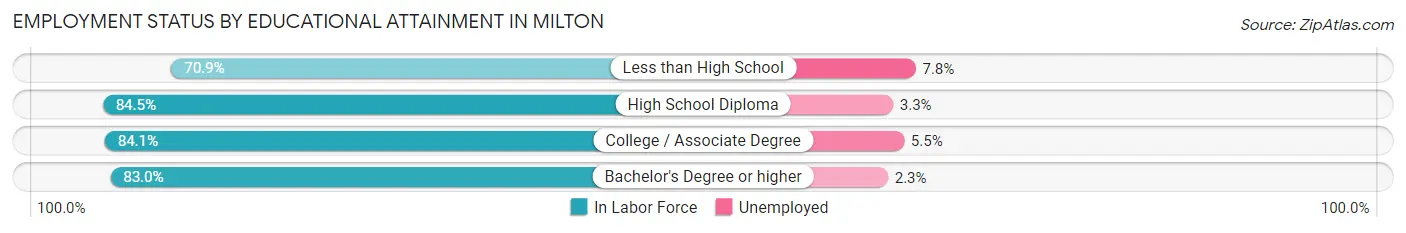
| Educational Attainment | In Labor Force | Unemployed |
| Less than High School | 715 (70.9%) | 79 (7.8%) |
| High School Diploma | 920 (84.5%) | 36 (3.3%) |
| College / Associate Degree | 2,425 (84.1%) | 159 (5.5%) |
| Bachelor's Degree or higher | 15,691 (83.0%) | 435 (2.3%) |
| Total | 19,753 (82.7%) | 693 (2.9%) |
Employment Occupations by Sex in Milton
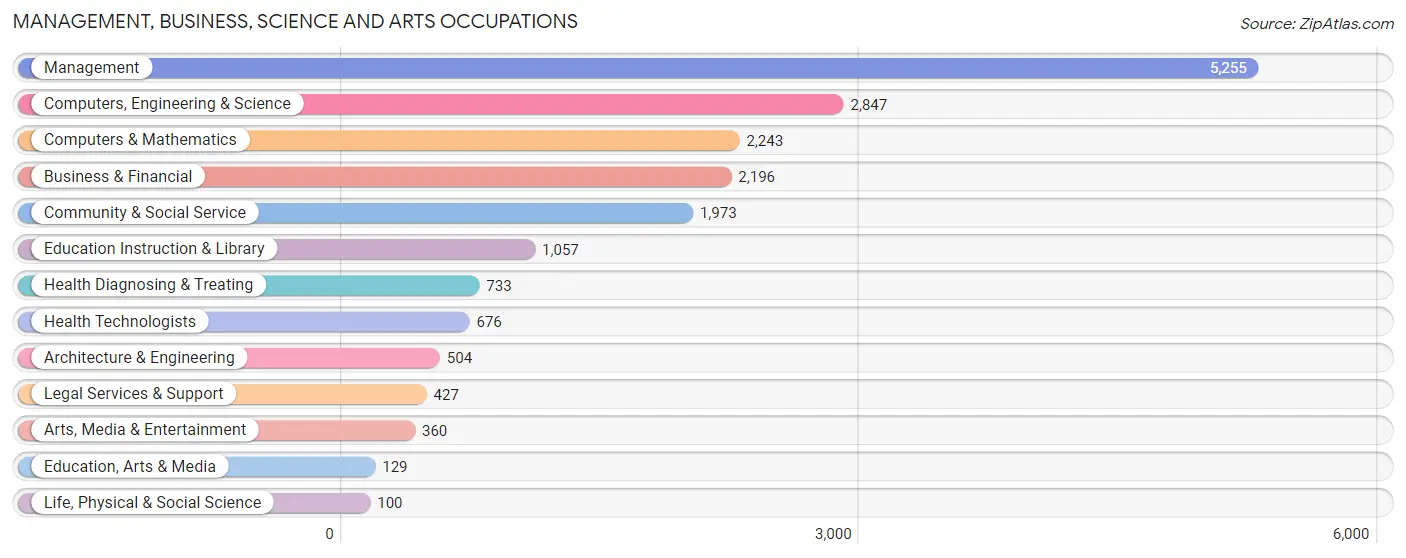
Management, Business, Science and Arts Occupations
The most common Management, Business, Science and Arts occupations in Milton are Management (5,255 | 24.5%), Computers, Engineering & Science (2,847 | 13.3%), Computers & Mathematics (2,243 | 10.4%), Business & Financial (2,196 | 10.2%), and Community & Social Service (1,973 | 9.2%).
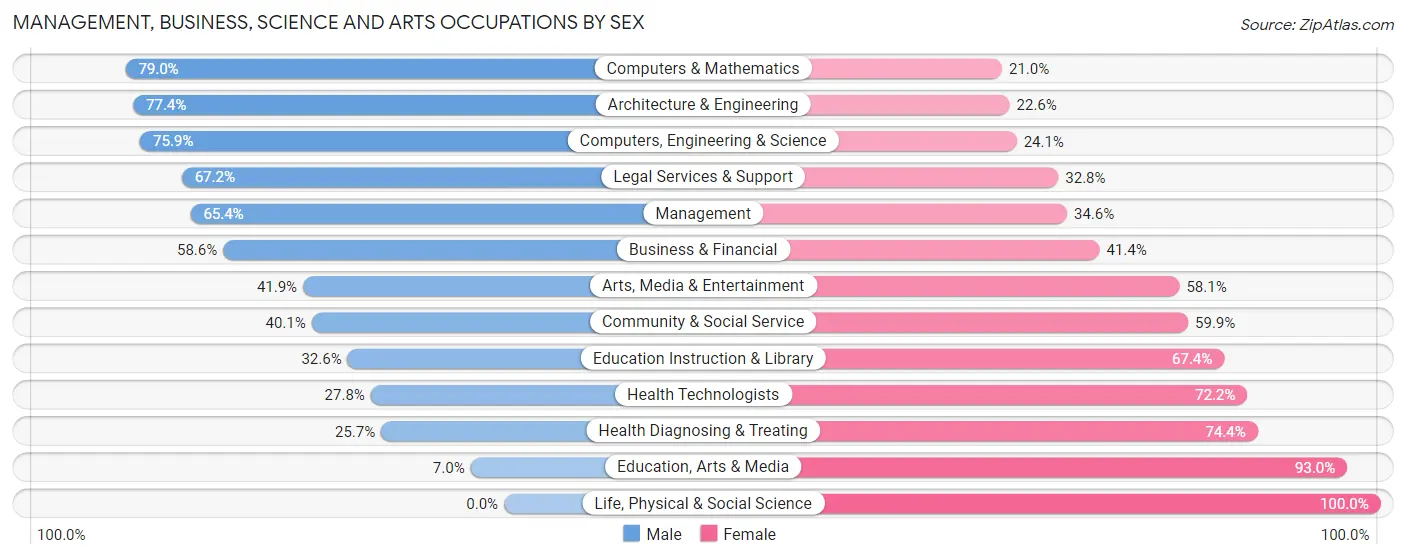
Management, Business, Science and Arts Occupations by Sex
Within the Management, Business, Science and Arts occupations in Milton, the most male-oriented occupations are Computers & Mathematics (79.0%), Architecture & Engineering (77.4%), and Computers, Engineering & Science (75.9%), while the most female-oriented occupations are Life, Physical & Social Science (100.0%), Education, Arts & Media (93.0%), and Health Diagnosing & Treating (74.4%).
| Occupation | Male | Female |
| Management | 3,437 (65.4%) | 1,818 (34.6%) |
| Business & Financial | 1,287 (58.6%) | 909 (41.4%) |
| Computers, Engineering & Science | 2,161 (75.9%) | 686 (24.1%) |
| Computers & Mathematics | 1,771 (79.0%) | 472 (21.0%) |
| Architecture & Engineering | 390 (77.4%) | 114 (22.6%) |
| Life, Physical & Social Science | 0 (0.0%) | 100 (100.0%) |
| Community & Social Service | 792 (40.1%) | 1,181 (59.9%) |
| Education, Arts & Media | 9 (7.0%) | 120 (93.0%) |
| Legal Services & Support | 287 (67.2%) | 140 (32.8%) |
| Education Instruction & Library | 345 (32.6%) | 712 (67.4%) |
| Arts, Media & Entertainment | 151 (41.9%) | 209 (58.1%) |
| Health Diagnosing & Treating | 188 (25.7%) | 545 (74.4%) |
| Health Technologists | 188 (27.8%) | 488 (72.2%) |
| Total (Category) | 7,865 (60.5%) | 5,139 (39.5%) |
| Total (Overall) | 11,778 (54.9%) | 9,693 (45.1%) |
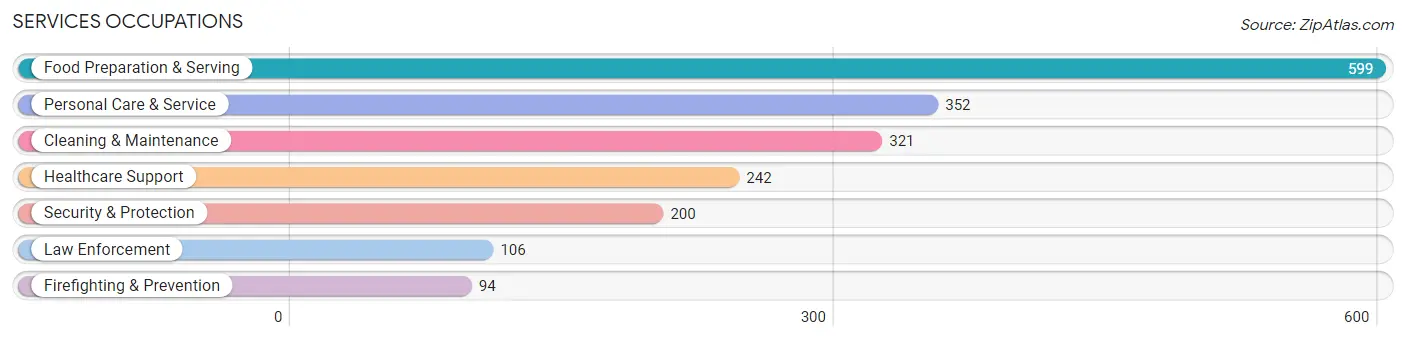
Services Occupations
The most common Services occupations in Milton are Food Preparation & Serving (599 | 2.8%), Personal Care & Service (352 | 1.6%), Cleaning & Maintenance (321 | 1.5%), Healthcare Support (242 | 1.1%), and Security & Protection (200 | 0.9%).
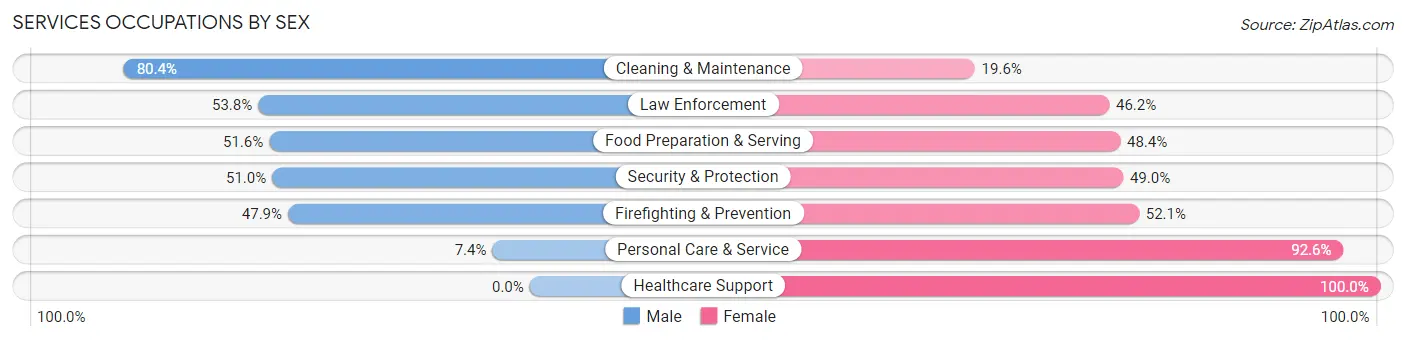
Services Occupations by Sex
Within the Services occupations in Milton, the most male-oriented occupations are Cleaning & Maintenance (80.4%), Law Enforcement (53.8%), and Food Preparation & Serving (51.6%), while the most female-oriented occupations are Healthcare Support (100.0%), Personal Care & Service (92.6%), and Firefighting & Prevention (52.1%).
| Occupation | Male | Female |
| Healthcare Support | 0 (0.0%) | 242 (100.0%) |
| Security & Protection | 102 (51.0%) | 98 (49.0%) |
| Firefighting & Prevention | 45 (47.9%) | 49 (52.1%) |
| Law Enforcement | 57 (53.8%) | 49 (46.2%) |
| Food Preparation & Serving | 309 (51.6%) | 290 (48.4%) |
| Cleaning & Maintenance | 258 (80.4%) | 63 (19.6%) |
| Personal Care & Service | 26 (7.4%) | 326 (92.6%) |
| Total (Category) | 695 (40.6%) | 1,019 (59.5%) |
| Total (Overall) | 11,778 (54.9%) | 9,693 (45.1%) |
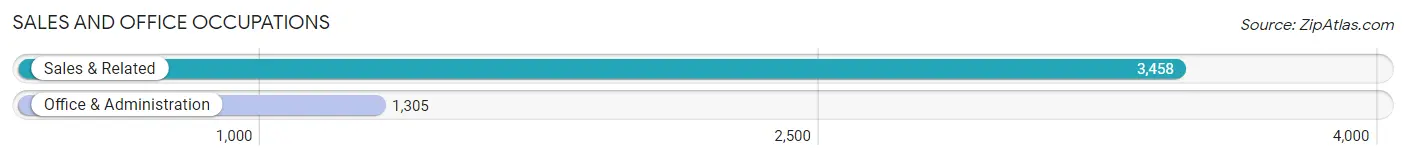
Sales and Office Occupations
The most common Sales and Office occupations in Milton are Sales & Related (3,458 | 16.1%), and Office & Administration (1,305 | 6.1%).
Sales and Office Occupations by Sex
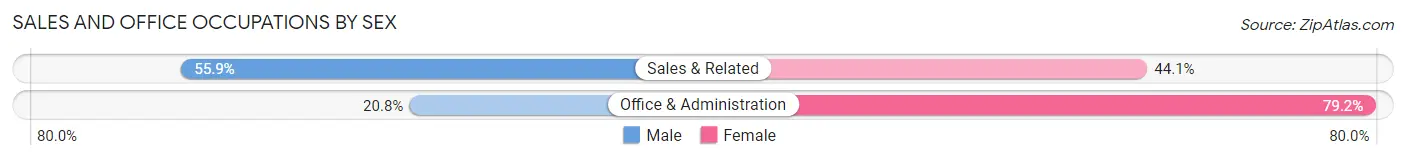
| Occupation | Male | Female |
| Sales & Related | 1,932 (55.9%) | 1,526 (44.1%) |
| Office & Administration | 272 (20.8%) | 1,033 (79.2%) |
| Total (Category) | 2,204 (46.3%) | 2,559 (53.7%) |
| Total (Overall) | 11,778 (54.9%) | 9,693 (45.1%) |
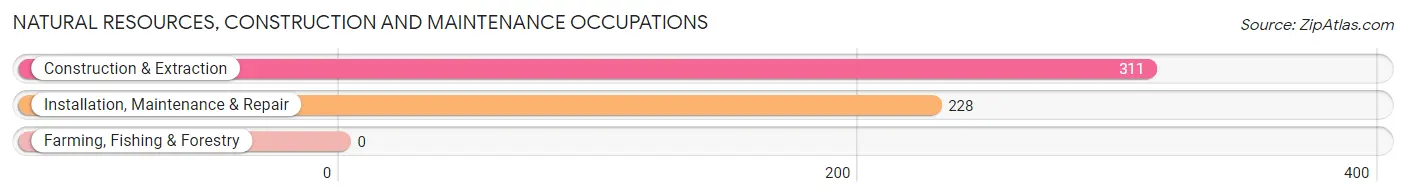
Natural Resources, Construction and Maintenance Occupations
The most common Natural Resources, Construction and Maintenance occupations in Milton are Construction & Extraction (311 | 1.5%), and Installation, Maintenance & Repair (228 | 1.1%).
Natural Resources, Construction and Maintenance Occupations by Sex
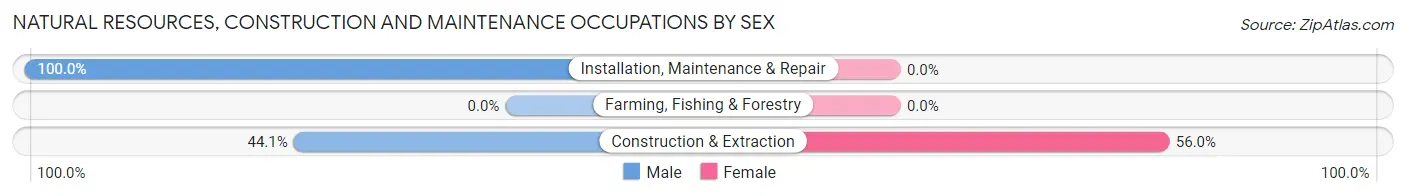
| Occupation | Male | Female |
| Farming, Fishing & Forestry | 0 (0.0%) | 0 (0.0%) |
| Construction & Extraction | 137 (44.1%) | 174 (55.9%) |
| Installation, Maintenance & Repair | 228 (100.0%) | 0 (0.0%) |
| Total (Category) | 365 (67.7%) | 174 (32.3%) |
| Total (Overall) | 11,778 (54.9%) | 9,693 (45.1%) |
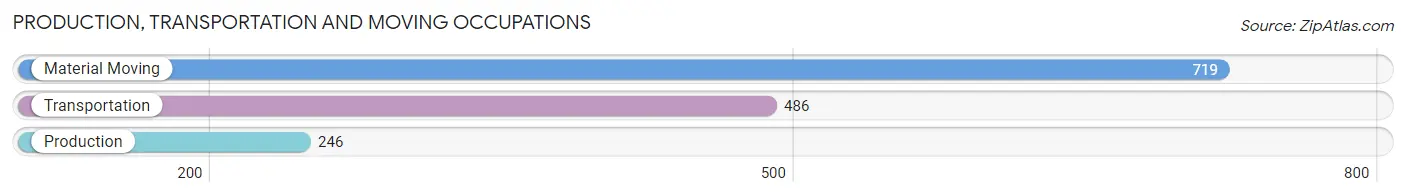
Production, Transportation and Moving Occupations
The most common Production, Transportation and Moving occupations in Milton are Material Moving (719 | 3.4%), Transportation (486 | 2.3%), and Production (246 | 1.1%).
Production, Transportation and Moving Occupations by Sex
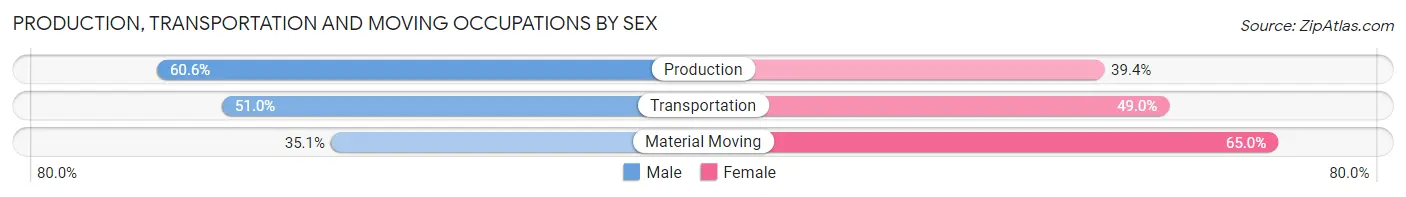
| Occupation | Male | Female |
| Production | 149 (60.6%) | 97 (39.4%) |
| Transportation | 248 (51.0%) | 238 (49.0%) |
| Material Moving | 252 (35.0%) | 467 (64.9%) |
| Total (Category) | 649 (44.7%) | 802 (55.3%) |
| Total (Overall) | 11,778 (54.9%) | 9,693 (45.1%) |
Employment Industries by Sex in Milton
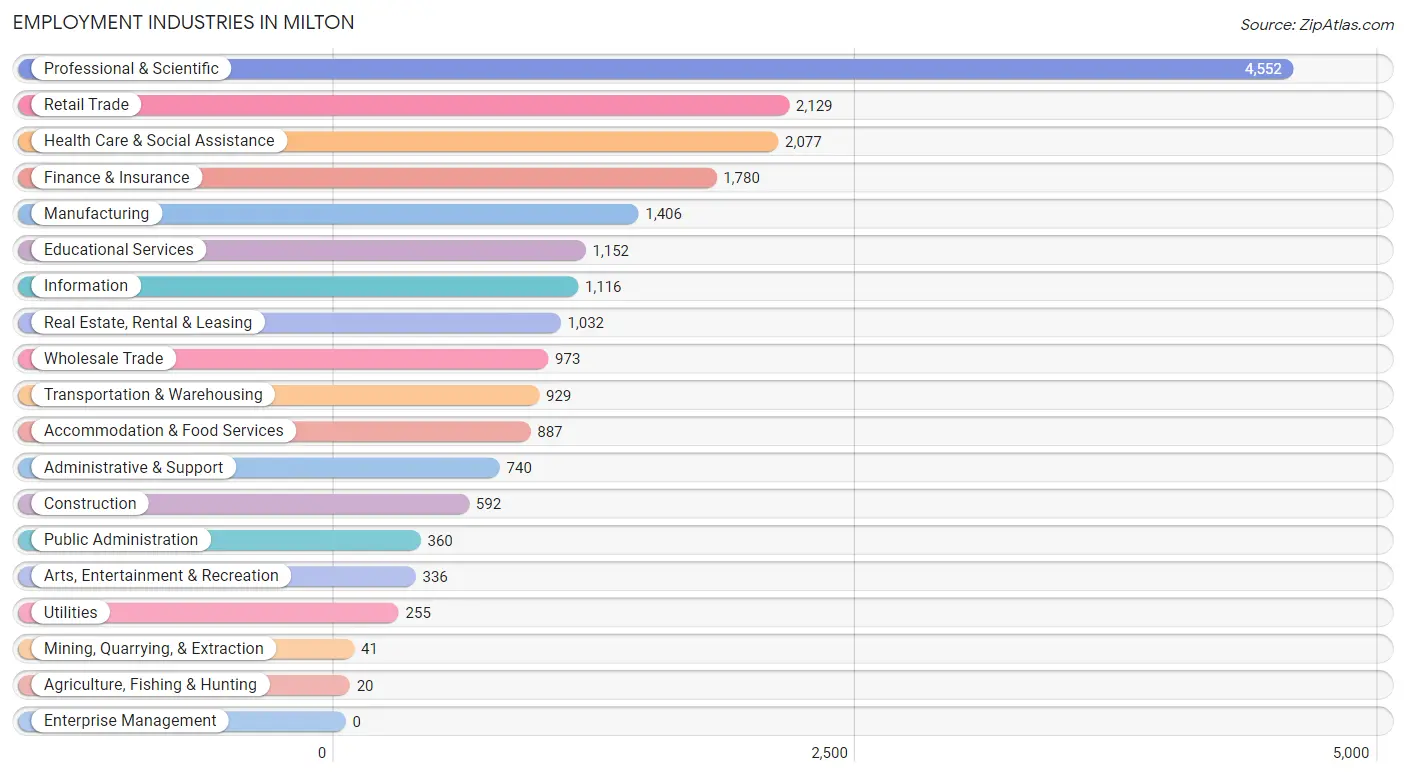
Employment Industries in Milton
The major employment industries in Milton include Professional & Scientific (4,552 | 21.2%), Retail Trade (2,129 | 9.9%), Health Care & Social Assistance (2,077 | 9.7%), Finance & Insurance (1,780 | 8.3%), and Manufacturing (1,406 | 6.6%).
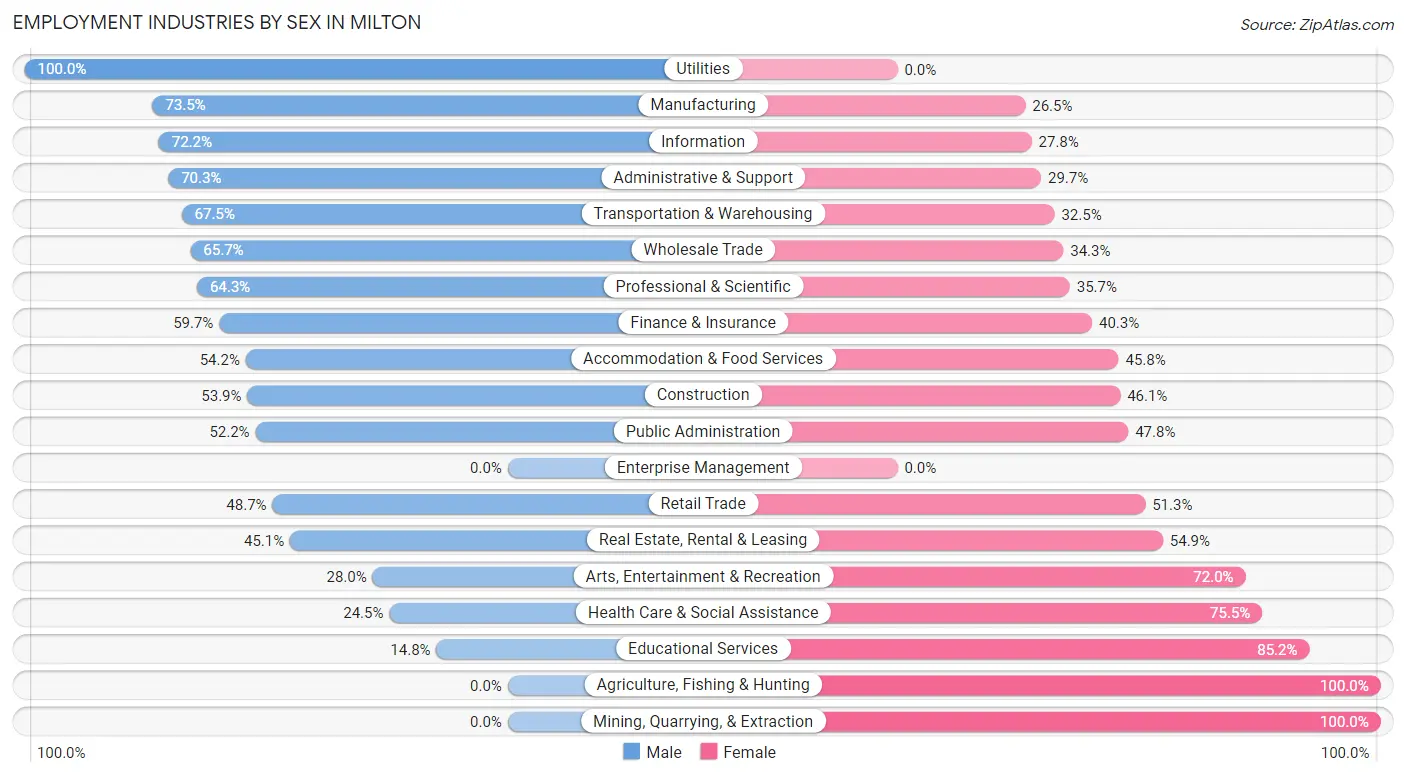
Employment Industries by Sex in Milton
The Milton industries that see more men than women are Utilities (100.0%), Manufacturing (73.5%), and Information (72.2%), whereas the industries that tend to have a higher number of women are Agriculture, Fishing & Hunting (100.0%), Mining, Quarrying, & Extraction (100.0%), and Educational Services (85.2%).
| Industry | Male | Female |
| Agriculture, Fishing & Hunting | 0 (0.0%) | 20 (100.0%) |
| Mining, Quarrying, & Extraction | 0 (0.0%) | 41 (100.0%) |
| Construction | 319 (53.9%) | 273 (46.1%) |
| Manufacturing | 1,034 (73.5%) | 372 (26.5%) |
| Wholesale Trade | 639 (65.7%) | 334 (34.3%) |
| Retail Trade | 1,037 (48.7%) | 1,092 (51.3%) |
| Transportation & Warehousing | 627 (67.5%) | 302 (32.5%) |
| Utilities | 255 (100.0%) | 0 (0.0%) |
| Information | 806 (72.2%) | 310 (27.8%) |
| Finance & Insurance | 1,063 (59.7%) | 717 (40.3%) |
| Real Estate, Rental & Leasing | 465 (45.1%) | 567 (54.9%) |
| Professional & Scientific | 2,928 (64.3%) | 1,624 (35.7%) |
| Enterprise Management | 0 (0.0%) | 0 (0.0%) |
| Administrative & Support | 520 (70.3%) | 220 (29.7%) |
| Educational Services | 170 (14.8%) | 982 (85.2%) |
| Health Care & Social Assistance | 509 (24.5%) | 1,568 (75.5%) |
| Arts, Entertainment & Recreation | 94 (28.0%) | 242 (72.0%) |
| Accommodation & Food Services | 481 (54.2%) | 406 (45.8%) |
| Public Administration | 188 (52.2%) | 172 (47.8%) |
| Total | 11,778 (54.9%) | 9,693 (45.1%) |
Education in Milton
School Enrollment in Milton
The most common levels of schooling among the 11,522 students in Milton are high school (3,435 | 29.8%), elementary school (2,579 | 22.4%), and middle school (2,326 | 20.2%).
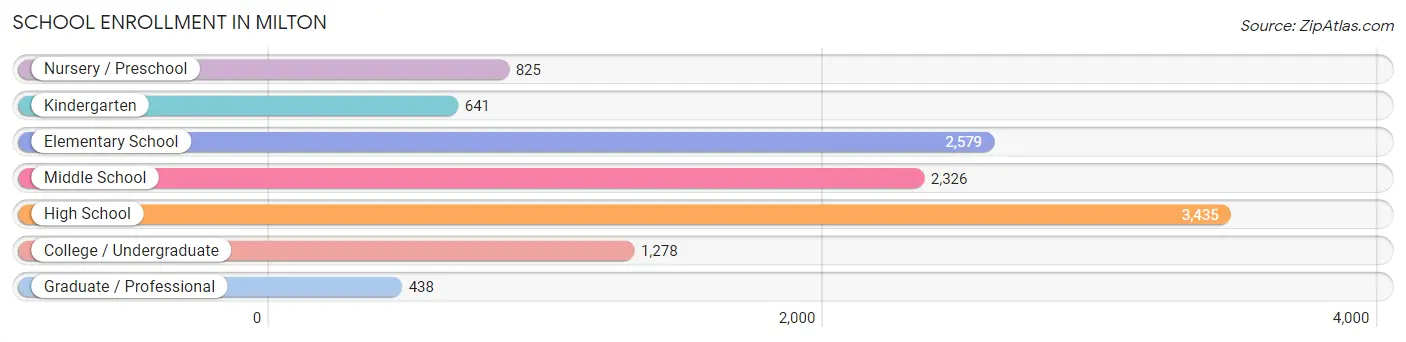
| School Level | # Students | % Students |
| Nursery / Preschool | 825 | 7.2% |
| Kindergarten | 641 | 5.6% |
| Elementary School | 2,579 | 22.4% |
| Middle School | 2,326 | 20.2% |
| High School | 3,435 | 29.8% |
| College / Undergraduate | 1,278 | 11.1% |
| Graduate / Professional | 438 | 3.8% |
| Total | 11,522 | 100.0% |
School Enrollment by Age by Funding Source in Milton
Out of a total of 11,522 students who are enrolled in schools in Milton, 2,201 (19.1%) attend a private institution, while the remaining 9,321 (80.9%) are enrolled in public schools. The age group of 3 to 4 year olds has the highest likelihood of being enrolled in private schools, with 360 (63.6% in the age bracket) enrolled. Conversely, the age group of 15 to 17 year olds has the lowest likelihood of being enrolled in a private school, with 1,981 (86.7% in the age bracket) attending a public institution.
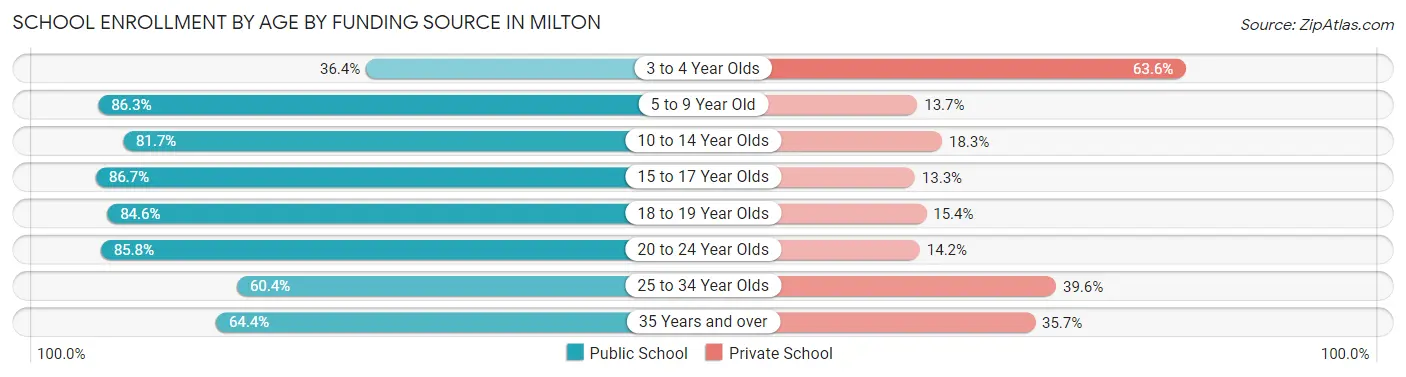
| Age Bracket | Public School | Private School |
| 3 to 4 Year Olds | 206 (36.4%) | 360 (63.6%) |
| 5 to 9 Year Old | 2,761 (86.3%) | 439 (13.7%) |
| 10 to 14 Year Olds | 2,586 (81.7%) | 580 (18.3%) |
| 15 to 17 Year Olds | 1,981 (86.7%) | 303 (13.3%) |
| 18 to 19 Year Olds | 742 (84.6%) | 135 (15.4%) |
| 20 to 24 Year Olds | 532 (85.8%) | 88 (14.2%) |
| 25 to 34 Year Olds | 55 (60.4%) | 36 (39.6%) |
| 35 Years and over | 462 (64.3%) | 256 (35.6%) |
| Total | 9,321 (80.9%) | 2,201 (19.1%) |
Educational Attainment by Field of Study in Milton
Business (6,471 | 27.6%), engineering (3,477 | 14.8%), computers & mathematics (2,075 | 8.8%), science & technology (1,678 | 7.2%), and education (1,622 | 6.9%) are the most common fields of study among 23,438 individuals in Milton who have obtained a bachelor's degree or higher.
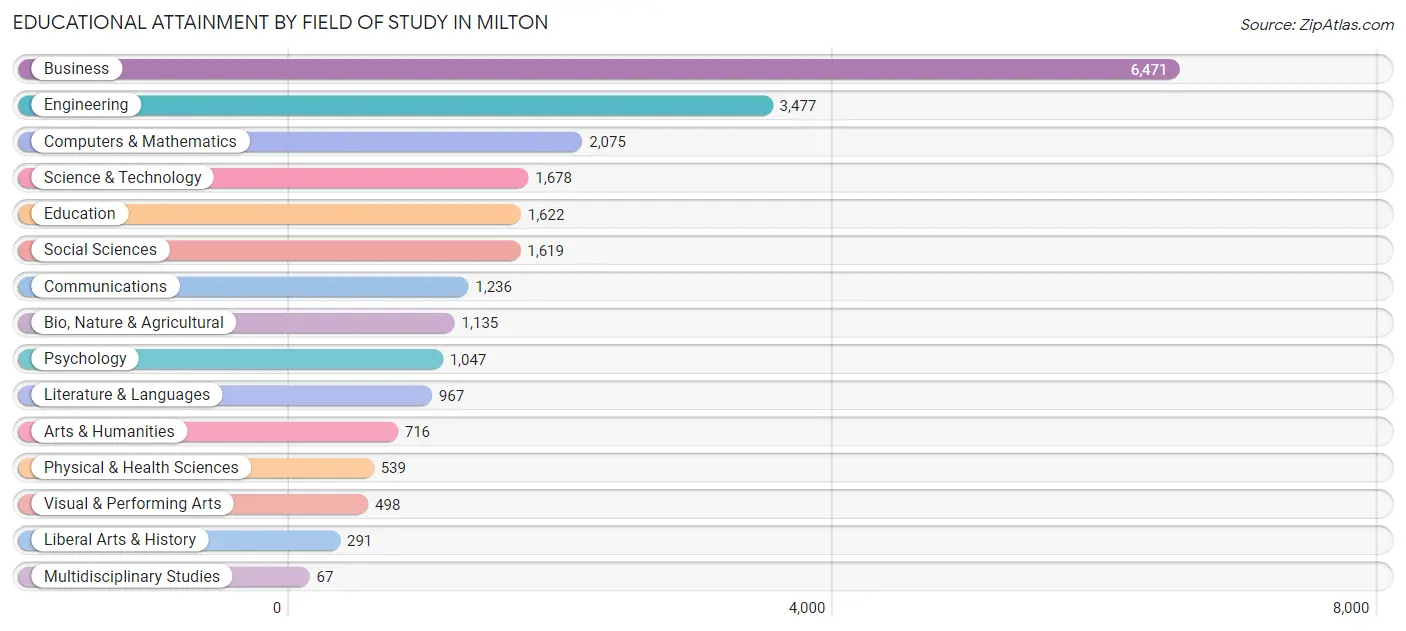
| Field of Study | # Graduates | % Graduates |
| Computers & Mathematics | 2,075 | 8.8% |
| Bio, Nature & Agricultural | 1,135 | 4.8% |
| Physical & Health Sciences | 539 | 2.3% |
| Psychology | 1,047 | 4.5% |
| Social Sciences | 1,619 | 6.9% |
| Engineering | 3,477 | 14.8% |
| Multidisciplinary Studies | 67 | 0.3% |
| Science & Technology | 1,678 | 7.2% |
| Business | 6,471 | 27.6% |
| Education | 1,622 | 6.9% |
| Literature & Languages | 967 | 4.1% |
| Liberal Arts & History | 291 | 1.2% |
| Visual & Performing Arts | 498 | 2.1% |
| Communications | 1,236 | 5.3% |
| Arts & Humanities | 716 | 3.0% |
| Total | 23,438 | 100.0% |
Transportation & Commute in Milton
Vehicle Availability by Sex in Milton
The most prevalent vehicle ownership categories in Milton are males with 2 vehicles (5,153, accounting for 43.9%) and females with 2 vehicles (3,612, making up 52.9%).
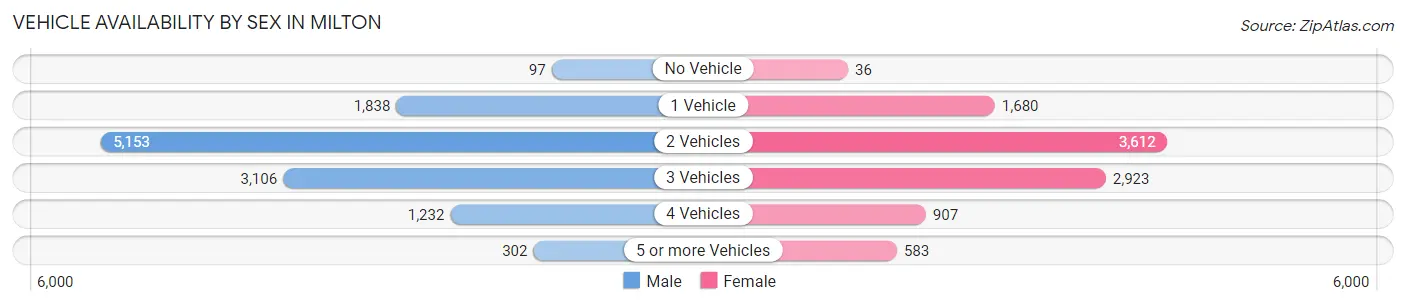
| Vehicles Available | Male | Female |
| No Vehicle | 97 (0.8%) | 36 (0.4%) |
| 1 Vehicle | 1,838 (15.7%) | 1,680 (17.2%) |
| 2 Vehicles | 5,153 (43.9%) | 3,612 (37.1%) |
| 3 Vehicles | 3,106 (26.5%) | 2,923 (30.0%) |
| 4 Vehicles | 1,232 (10.5%) | 907 (9.3%) |
| 5 or more Vehicles | 302 (2.6%) | 583 (6.0%) |
| Total | 11,728 (100.0%) | 9,741 (100.0%) |
Commute Time in Milton
The most frequently occuring commute durations in Milton are 20 to 24 minutes (2,595 commuters, 17.3%), 45 to 59 minutes (2,107 commuters, 14.0%), and 15 to 19 minutes (1,903 commuters, 12.7%).
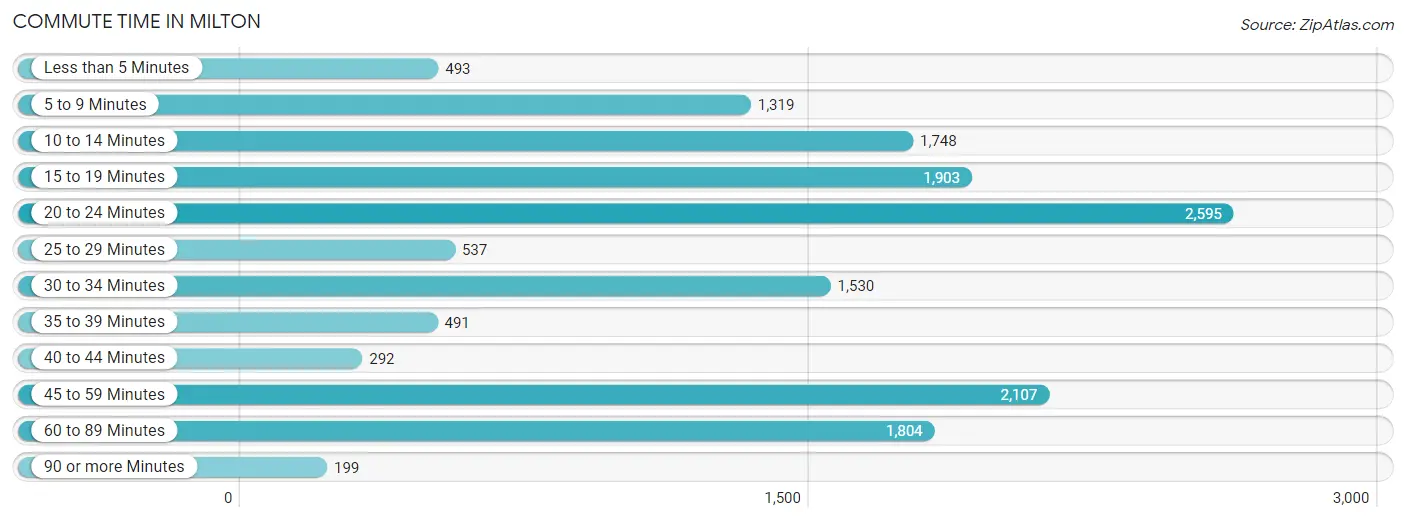
| Commute Time | # Commuters | % Commuters |
| Less than 5 Minutes | 493 | 3.3% |
| 5 to 9 Minutes | 1,319 | 8.8% |
| 10 to 14 Minutes | 1,748 | 11.6% |
| 15 to 19 Minutes | 1,903 | 12.7% |
| 20 to 24 Minutes | 2,595 | 17.3% |
| 25 to 29 Minutes | 537 | 3.6% |
| 30 to 34 Minutes | 1,530 | 10.2% |
| 35 to 39 Minutes | 491 | 3.3% |
| 40 to 44 Minutes | 292 | 1.9% |
| 45 to 59 Minutes | 2,107 | 14.0% |
| 60 to 89 Minutes | 1,804 | 12.0% |
| 90 or more Minutes | 199 | 1.3% |
Commute Time by Sex in Milton
The most common commute times in Milton are 20 to 24 minutes (1,645 commuters, 21.0%) for males and 10 to 14 minutes (1,244 commuters, 17.3%) for females.
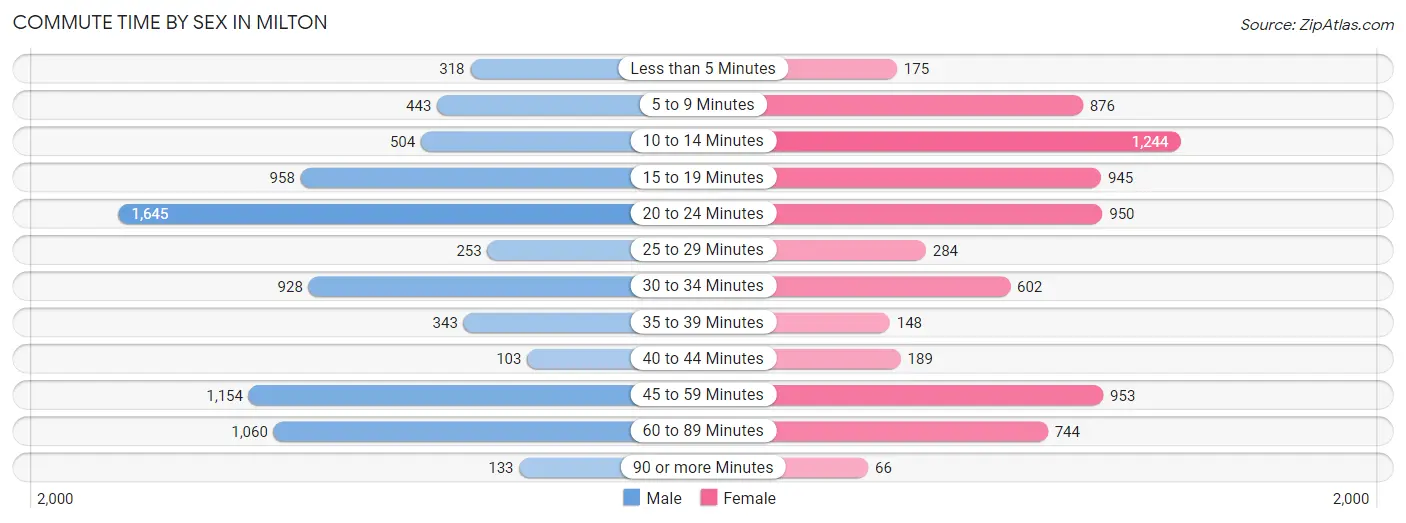
| Commute Time | Male | Female |
| Less than 5 Minutes | 318 (4.1%) | 175 (2.4%) |
| 5 to 9 Minutes | 443 (5.7%) | 876 (12.2%) |
| 10 to 14 Minutes | 504 (6.4%) | 1,244 (17.3%) |
| 15 to 19 Minutes | 958 (12.2%) | 945 (13.2%) |
| 20 to 24 Minutes | 1,645 (21.0%) | 950 (13.2%) |
| 25 to 29 Minutes | 253 (3.2%) | 284 (4.0%) |
| 30 to 34 Minutes | 928 (11.8%) | 602 (8.4%) |
| 35 to 39 Minutes | 343 (4.4%) | 148 (2.1%) |
| 40 to 44 Minutes | 103 (1.3%) | 189 (2.6%) |
| 45 to 59 Minutes | 1,154 (14.7%) | 953 (13.3%) |
| 60 to 89 Minutes | 1,060 (13.5%) | 744 (10.4%) |
| 90 or more Minutes | 133 (1.7%) | 66 (0.9%) |
Time of Departure to Work by Sex in Milton
The most frequent times of departure to work in Milton are 8:00 AM to 8:29 AM (1,700, 21.7%) for males and 8:00 AM to 8:29 AM (1,241, 17.3%) for females.
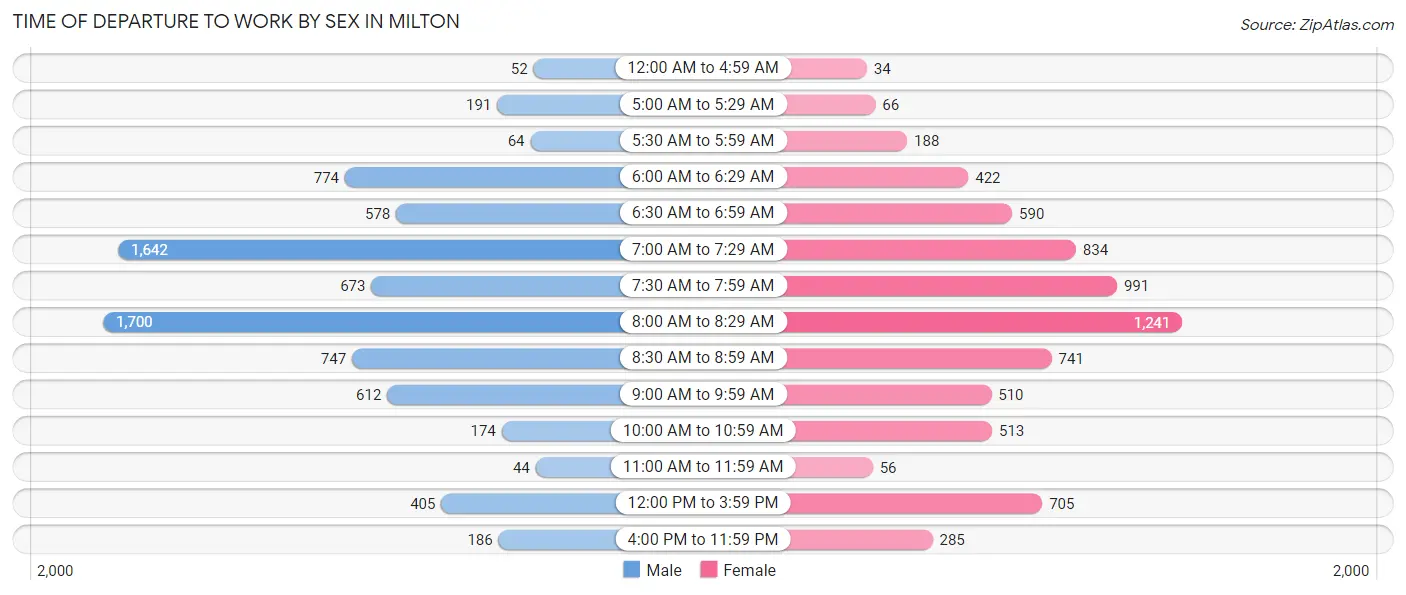
| Time of Departure | Male | Female |
| 12:00 AM to 4:59 AM | 52 (0.7%) | 34 (0.5%) |
| 5:00 AM to 5:29 AM | 191 (2.4%) | 66 (0.9%) |
| 5:30 AM to 5:59 AM | 64 (0.8%) | 188 (2.6%) |
| 6:00 AM to 6:29 AM | 774 (9.9%) | 422 (5.9%) |
| 6:30 AM to 6:59 AM | 578 (7.4%) | 590 (8.2%) |
| 7:00 AM to 7:29 AM | 1,642 (20.9%) | 834 (11.6%) |
| 7:30 AM to 7:59 AM | 673 (8.6%) | 991 (13.8%) |
| 8:00 AM to 8:29 AM | 1,700 (21.7%) | 1,241 (17.3%) |
| 8:30 AM to 8:59 AM | 747 (9.5%) | 741 (10.3%) |
| 9:00 AM to 9:59 AM | 612 (7.8%) | 510 (7.1%) |
| 10:00 AM to 10:59 AM | 174 (2.2%) | 513 (7.1%) |
| 11:00 AM to 11:59 AM | 44 (0.6%) | 56 (0.8%) |
| 12:00 PM to 3:59 PM | 405 (5.2%) | 705 (9.8%) |
| 4:00 PM to 11:59 PM | 186 (2.4%) | 285 (4.0%) |
| Total | 7,842 (100.0%) | 7,176 (100.0%) |
Housing Occupancy in Milton
Occupancy by Ownership in Milton
Of the total 15,192 dwellings in Milton, owner-occupied units account for 11,236 (74.0%), while renter-occupied units make up 3,956 (26.0%).
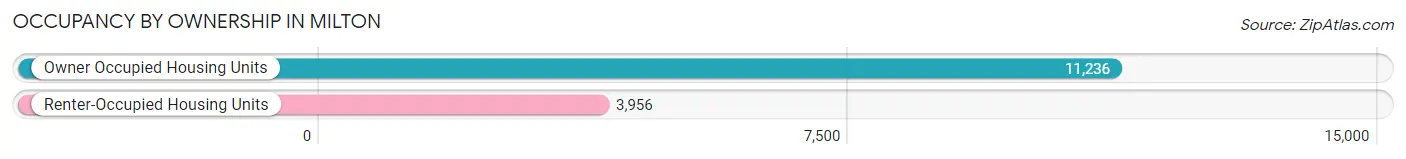
| Occupancy | # Housing Units | % Housing Units |
| Owner Occupied Housing Units | 11,236 | 74.0% |
| Renter-Occupied Housing Units | 3,956 | 26.0% |
| Total Occupied Housing Units | 15,192 | 100.0% |
Occupancy by Household Size in Milton
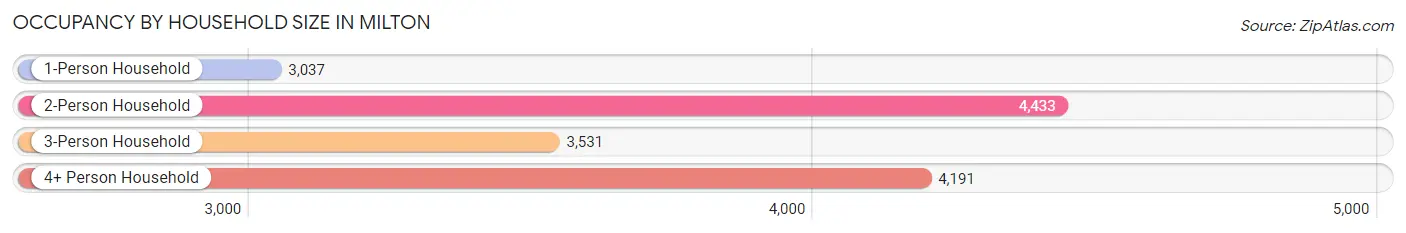
| Household Size | # Housing Units | % Housing Units |
| 1-Person Household | 3,037 | 20.0% |
| 2-Person Household | 4,433 | 29.2% |
| 3-Person Household | 3,531 | 23.2% |
| 4+ Person Household | 4,191 | 27.6% |
| Total Housing Units | 15,192 | 100.0% |
Occupancy by Ownership by Household Size in Milton
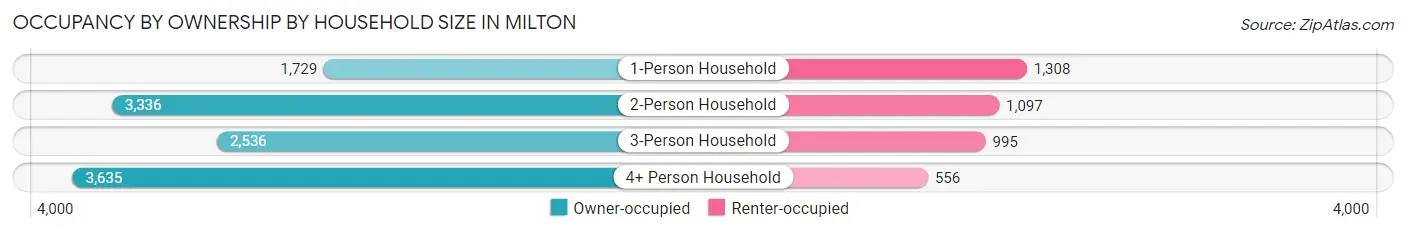
| Household Size | Owner-occupied | Renter-occupied |
| 1-Person Household | 1,729 (56.9%) | 1,308 (43.1%) |
| 2-Person Household | 3,336 (75.2%) | 1,097 (24.7%) |
| 3-Person Household | 2,536 (71.8%) | 995 (28.2%) |
| 4+ Person Household | 3,635 (86.7%) | 556 (13.3%) |
| Total Housing Units | 11,236 (74.0%) | 3,956 (26.0%) |
Occupancy by Educational Attainment in Milton
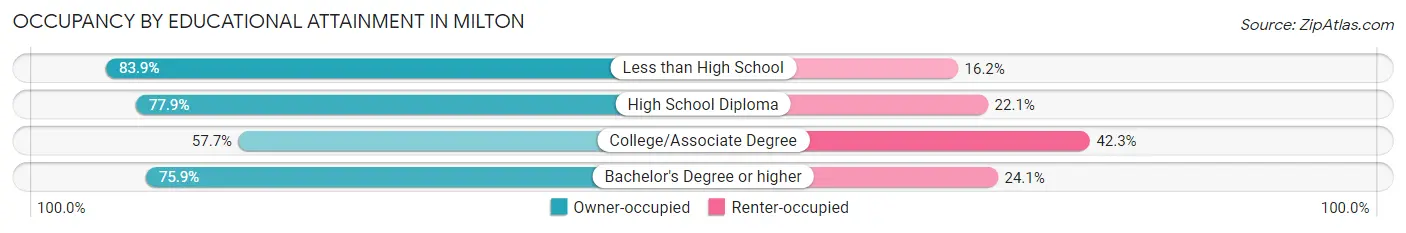
| Household Size | Owner-occupied | Renter-occupied |
| Less than High School | 353 (83.9%) | 68 (16.2%) |
| High School Diploma | 511 (77.9%) | 145 (22.1%) |
| College/Associate Degree | 1,093 (57.7%) | 801 (42.3%) |
| Bachelor's Degree or higher | 9,279 (75.9%) | 2,942 (24.1%) |
Occupancy by Age of Householder in Milton
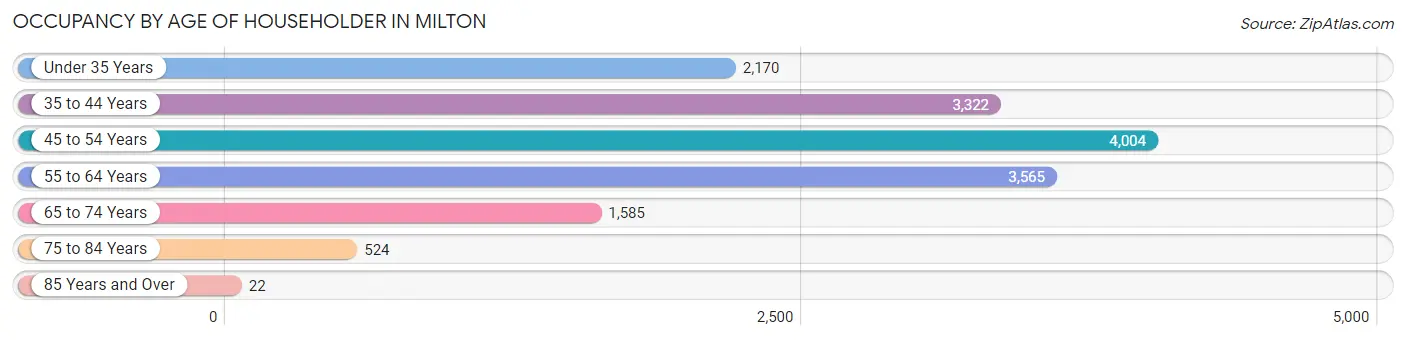
| Age Bracket | # Households | % Households |
| Under 35 Years | 2,170 | 14.3% |
| 35 to 44 Years | 3,322 | 21.9% |
| 45 to 54 Years | 4,004 | 26.4% |
| 55 to 64 Years | 3,565 | 23.5% |
| 65 to 74 Years | 1,585 | 10.4% |
| 75 to 84 Years | 524 | 3.5% |
| 85 Years and Over | 22 | 0.1% |
| Total | 15,192 | 100.0% |
Housing Finances in Milton
Median Income by Occupancy in Milton
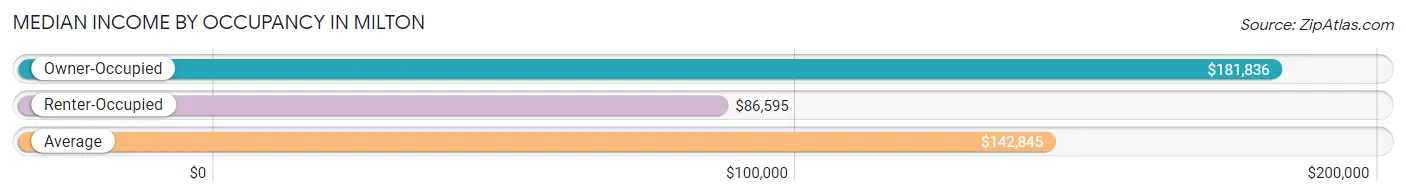
| Occupancy Type | # Households | Median Income |
| Owner-Occupied | 11,236 (74.0%) | $181,836 |
| Renter-Occupied | 3,956 (26.0%) | $86,595 |
| Average | 15,192 (100.0%) | $142,845 |
Occupancy by Householder Income Bracket in Milton
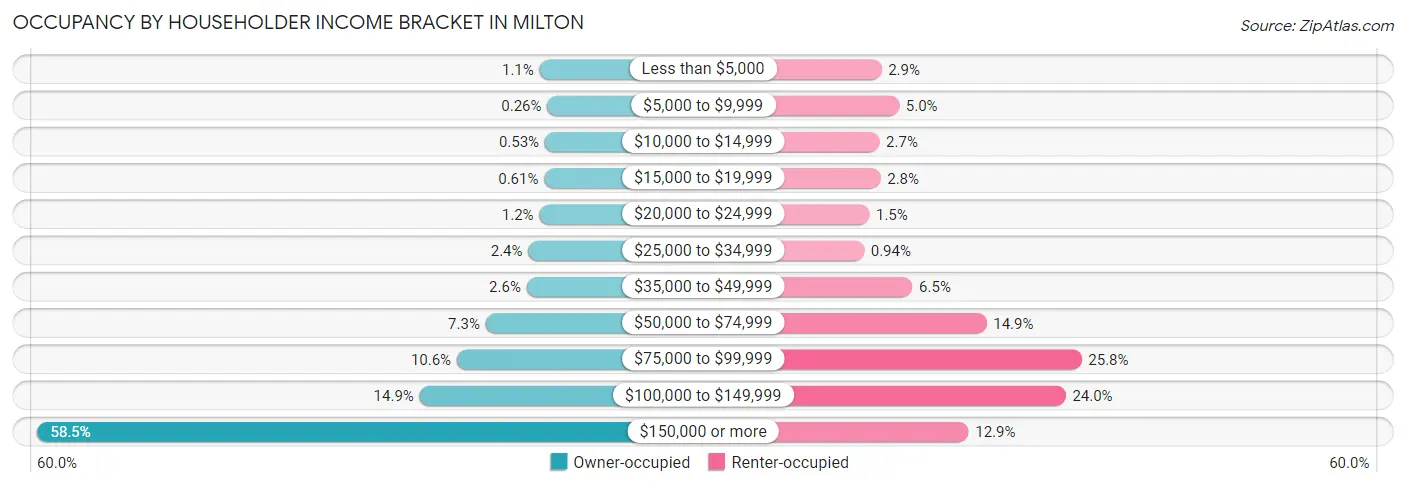
| Income Bracket | Owner-occupied | Renter-occupied |
| Less than $5,000 | 128 (1.1%) | 116 (2.9%) |
| $5,000 to $9,999 | 29 (0.3%) | 196 (5.0%) |
| $10,000 to $14,999 | 59 (0.5%) | 107 (2.7%) |
| $15,000 to $19,999 | 68 (0.6%) | 112 (2.8%) |
| $20,000 to $24,999 | 130 (1.2%) | 61 (1.5%) |
| $25,000 to $34,999 | 273 (2.4%) | 37 (0.9%) |
| $35,000 to $49,999 | 293 (2.6%) | 256 (6.5%) |
| $50,000 to $74,999 | 820 (7.3%) | 591 (14.9%) |
| $75,000 to $99,999 | 1,190 (10.6%) | 1,021 (25.8%) |
| $100,000 to $149,999 | 1,668 (14.8%) | 949 (24.0%) |
| $150,000 or more | 6,578 (58.5%) | 510 (12.9%) |
| Total | 11,236 (100.0%) | 3,956 (100.0%) |
Monthly Housing Cost Tiers in Milton
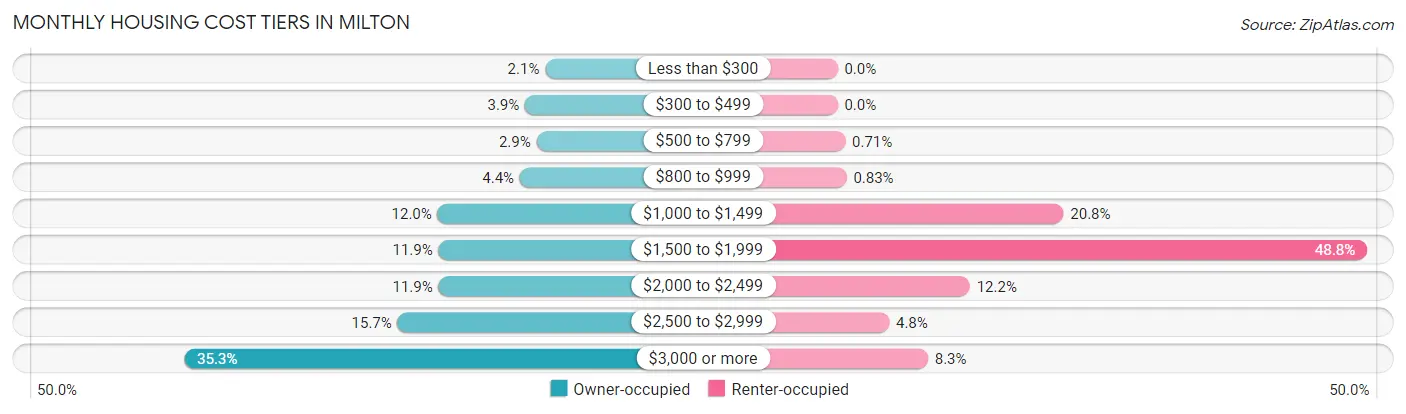
| Monthly Cost | Owner-occupied | Renter-occupied |
| Less than $300 | 233 (2.1%) | 0 (0.0%) |
| $300 to $499 | 441 (3.9%) | 0 (0.0%) |
| $500 to $799 | 322 (2.9%) | 28 (0.7%) |
| $800 to $999 | 494 (4.4%) | 33 (0.8%) |
| $1,000 to $1,499 | 1,346 (12.0%) | 823 (20.8%) |
| $1,500 to $1,999 | 1,336 (11.9%) | 1,929 (48.8%) |
| $2,000 to $2,499 | 1,336 (11.9%) | 482 (12.2%) |
| $2,500 to $2,999 | 1,759 (15.7%) | 188 (4.8%) |
| $3,000 or more | 3,969 (35.3%) | 329 (8.3%) |
| Total | 11,236 (100.0%) | 3,956 (100.0%) |
Physical Housing Characteristics in Milton
Housing Structures in Milton
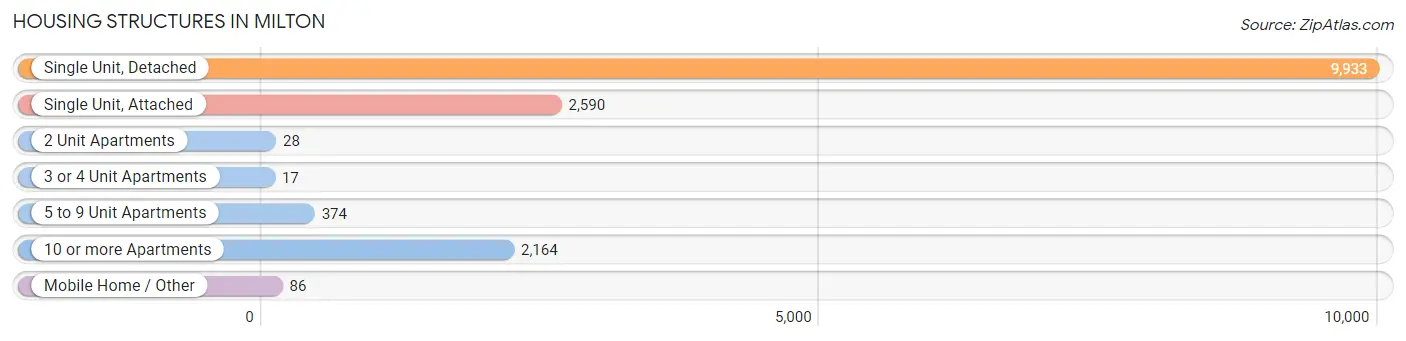
| Structure Type | # Housing Units | % Housing Units |
| Single Unit, Detached | 9,933 | 65.4% |
| Single Unit, Attached | 2,590 | 17.1% |
| 2 Unit Apartments | 28 | 0.2% |
| 3 or 4 Unit Apartments | 17 | 0.1% |
| 5 to 9 Unit Apartments | 374 | 2.5% |
| 10 or more Apartments | 2,164 | 14.2% |
| Mobile Home / Other | 86 | 0.6% |
| Total | 15,192 | 100.0% |
Housing Structures by Occupancy in Milton
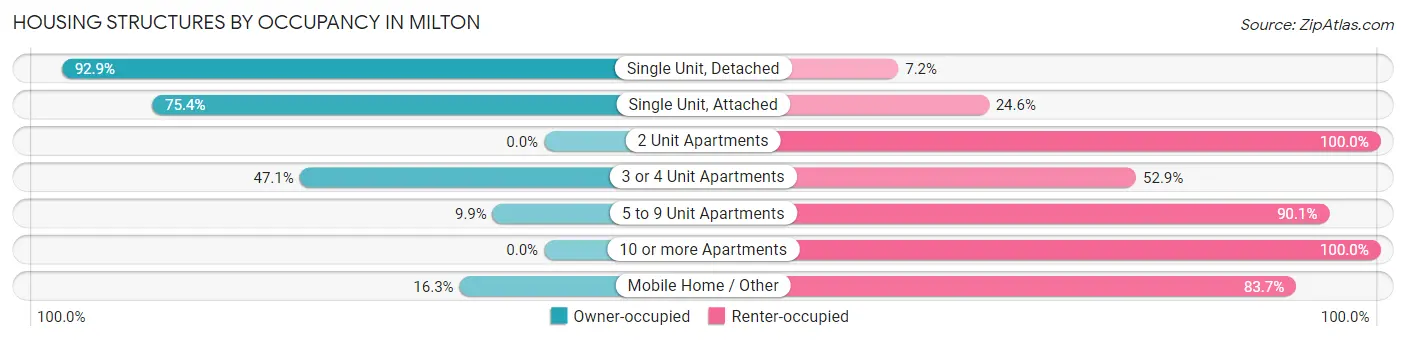
| Structure Type | Owner-occupied | Renter-occupied |
| Single Unit, Detached | 9,223 (92.8%) | 710 (7.1%) |
| Single Unit, Attached | 1,954 (75.4%) | 636 (24.6%) |
| 2 Unit Apartments | 0 (0.0%) | 28 (100.0%) |
| 3 or 4 Unit Apartments | 8 (47.1%) | 9 (52.9%) |
| 5 to 9 Unit Apartments | 37 (9.9%) | 337 (90.1%) |
| 10 or more Apartments | 0 (0.0%) | 2,164 (100.0%) |
| Mobile Home / Other | 14 (16.3%) | 72 (83.7%) |
| Total | 11,236 (74.0%) | 3,956 (26.0%) |
Housing Structures by Number of Rooms in Milton
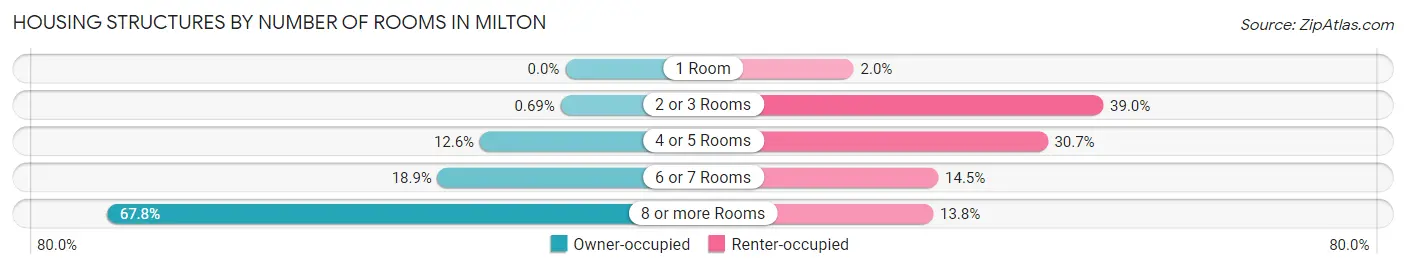
| Number of Rooms | Owner-occupied | Renter-occupied |
| 1 Room | 0 (0.0%) | 80 (2.0%) |
| 2 or 3 Rooms | 77 (0.7%) | 1,541 (39.0%) |
| 4 or 5 Rooms | 1,418 (12.6%) | 1,215 (30.7%) |
| 6 or 7 Rooms | 2,120 (18.9%) | 575 (14.5%) |
| 8 or more Rooms | 7,621 (67.8%) | 545 (13.8%) |
| Total | 11,236 (100.0%) | 3,956 (100.0%) |
Housing Structure by Heating Type in Milton
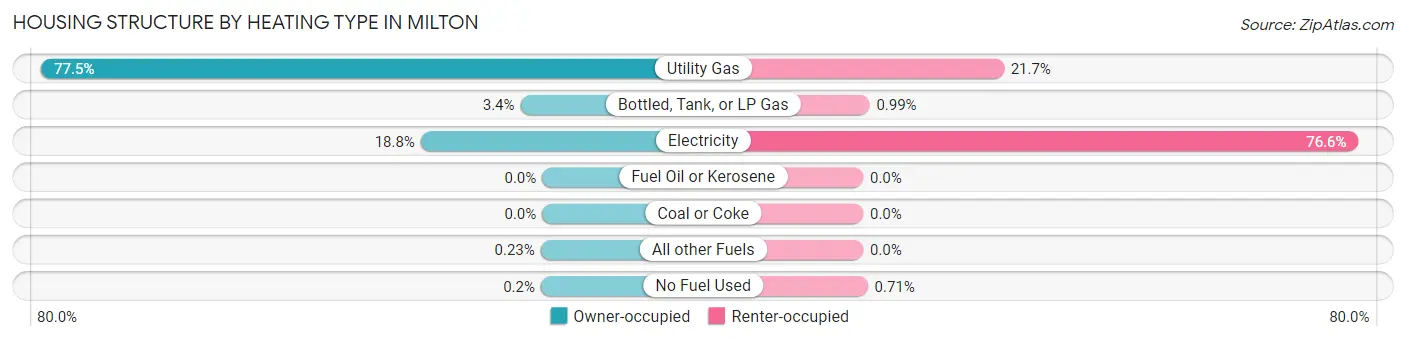
| Heating Type | Owner-occupied | Renter-occupied |
| Utility Gas | 8,702 (77.4%) | 860 (21.7%) |
| Bottled, Tank, or LP Gas | 377 (3.4%) | 39 (1.0%) |
| Electricity | 2,109 (18.8%) | 3,029 (76.6%) |
| Fuel Oil or Kerosene | 0 (0.0%) | 0 (0.0%) |
| Coal or Coke | 0 (0.0%) | 0 (0.0%) |
| All other Fuels | 26 (0.2%) | 0 (0.0%) |
| No Fuel Used | 22 (0.2%) | 28 (0.7%) |
| Total | 11,236 (100.0%) | 3,956 (100.0%) |
Household Vehicle Usage in Milton
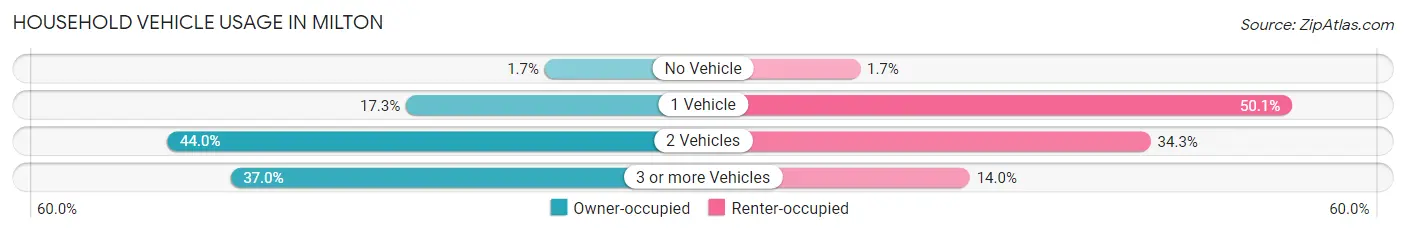
| Vehicles per Household | Owner-occupied | Renter-occupied |
| No Vehicle | 194 (1.7%) | 67 (1.7%) |
| 1 Vehicle | 1,941 (17.3%) | 1,981 (50.1%) |
| 2 Vehicles | 4,948 (44.0%) | 1,355 (34.3%) |
| 3 or more Vehicles | 4,153 (37.0%) | 553 (14.0%) |
| Total | 11,236 (100.0%) | 3,956 (100.0%) |
Real Estate & Mortgages in Milton
Real Estate and Mortgage Overview in Milton
| Characteristic | Without Mortgage | With Mortgage |
| Housing Units | 2,618 | 8,618 |
| Median Property Value | $586,200 | $659,500 |
| Median Household Income | $179,401 | $5,124 |
| Monthly Housing Costs | $953 | $3,948 |
| Real Estate Taxes | $5,428 | $98 |
Property Value by Mortgage Status in Milton
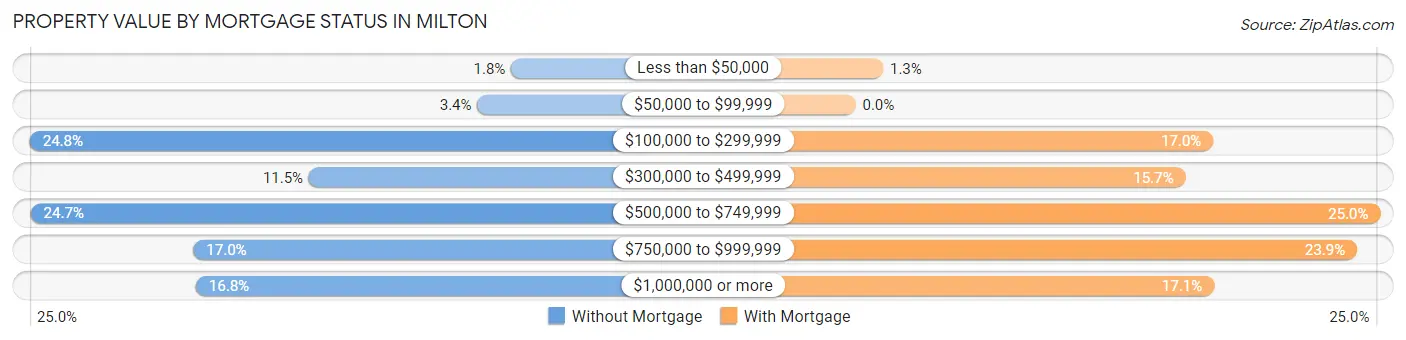
| Property Value | Without Mortgage | With Mortgage |
| Less than $50,000 | 48 (1.8%) | 113 (1.3%) |
| $50,000 to $99,999 | 90 (3.4%) | 0 (0.0%) |
| $100,000 to $299,999 | 648 (24.7%) | 1,468 (17.0%) |
| $300,000 to $499,999 | 300 (11.5%) | 1,354 (15.7%) |
| $500,000 to $749,999 | 647 (24.7%) | 2,154 (25.0%) |
| $750,000 to $999,999 | 444 (17.0%) | 2,058 (23.9%) |
| $1,000,000 or more | 441 (16.8%) | 1,471 (17.1%) |
| Total | 2,618 (100.0%) | 8,618 (100.0%) |
Household Income by Mortgage Status in Milton
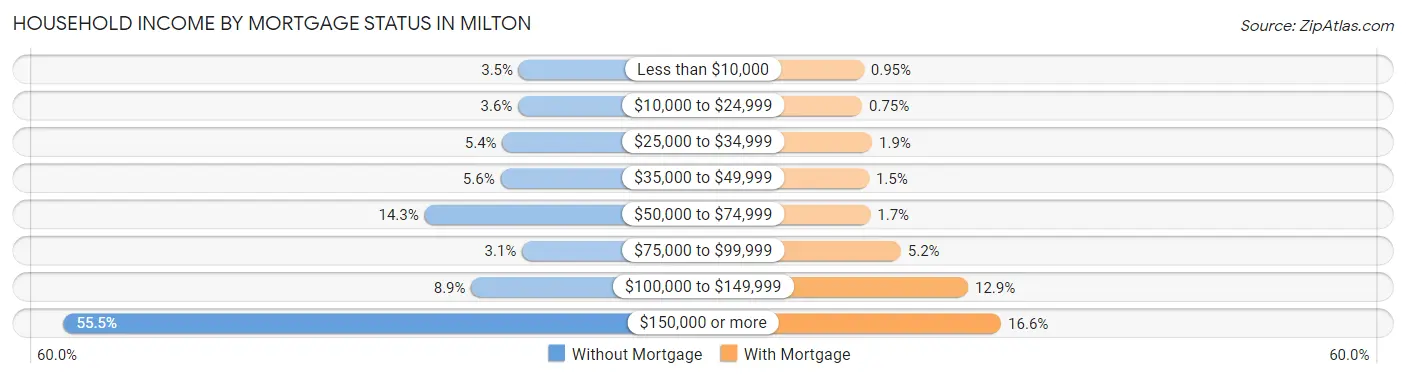
| Household Income | Without Mortgage | With Mortgage |
| Less than $10,000 | 92 (3.5%) | 82 (0.9%) |
| $10,000 to $24,999 | 94 (3.6%) | 65 (0.7%) |
| $25,000 to $34,999 | 141 (5.4%) | 163 (1.9%) |
| $35,000 to $49,999 | 147 (5.6%) | 132 (1.5%) |
| $50,000 to $74,999 | 374 (14.3%) | 146 (1.7%) |
| $75,000 to $99,999 | 82 (3.1%) | 446 (5.2%) |
| $100,000 to $149,999 | 234 (8.9%) | 1,108 (12.9%) |
| $150,000 or more | 1,454 (55.5%) | 1,434 (16.6%) |
| Total | 2,618 (100.0%) | 8,618 (100.0%) |
Property Value to Household Income Ratio in Milton
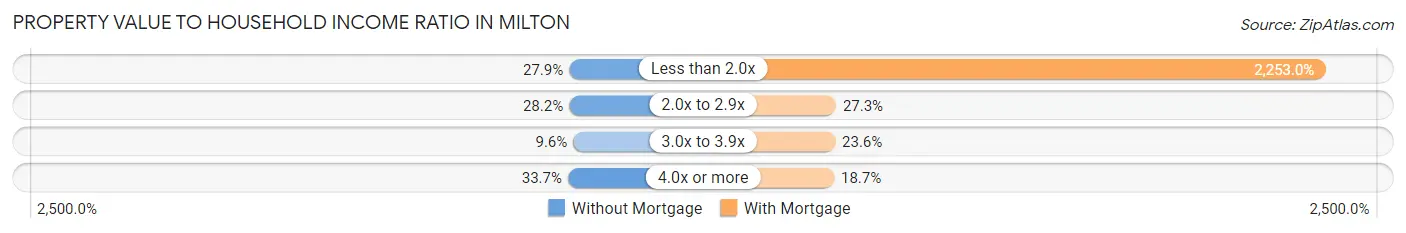
| Value-to-Income Ratio | Without Mortgage | With Mortgage |
| Less than 2.0x | 729 (27.9%) | 194,167 (2,253.0%) |
| 2.0x to 2.9x | 739 (28.2%) | 2,356 (27.3%) |
| 3.0x to 3.9x | 250 (9.6%) | 2,031 (23.6%) |
| 4.0x or more | 881 (33.7%) | 1,608 (18.7%) |
| Total | 2,618 (100.0%) | 8,618 (100.0%) |
Real Estate Taxes by Mortgage Status in Milton
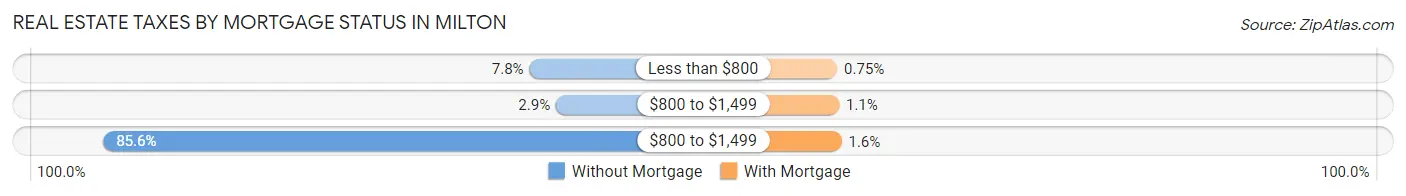
| Property Taxes | Without Mortgage | With Mortgage |
| Less than $800 | 204 (7.8%) | 65 (0.7%) |
| $800 to $1,499 | 77 (2.9%) | 94 (1.1%) |
| $800 to $1,499 | 2,242 (85.6%) | 134 (1.5%) |
| Total | 2,618 (100.0%) | 8,618 (100.0%) |
Health & Disability in Milton
Health Insurance Coverage by Age in Milton
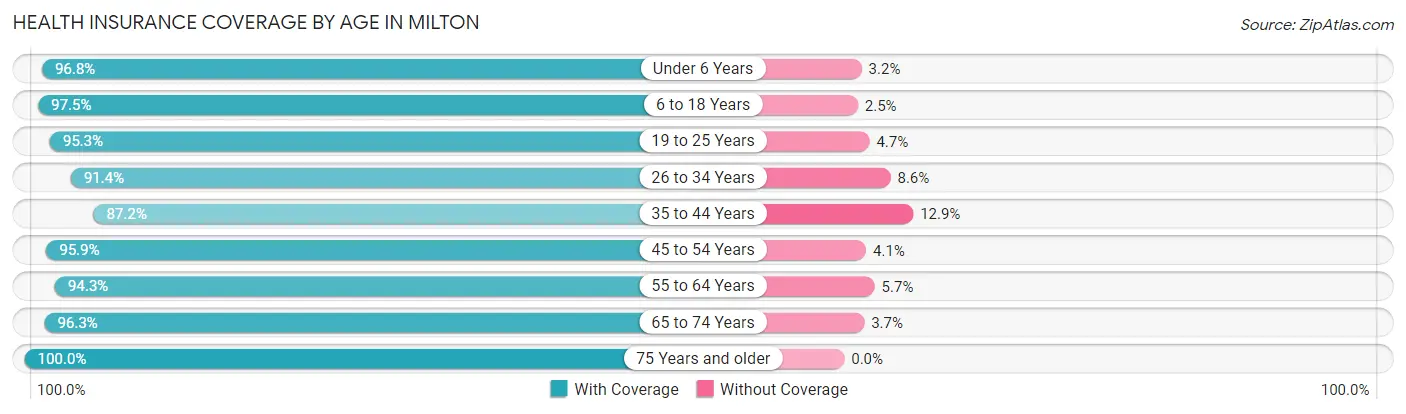
| Age Bracket | With Coverage | Without Coverage |
| Under 6 Years | 3,048 (96.8%) | 102 (3.2%) |
| 6 to 18 Years | 8,477 (97.5%) | 220 (2.5%) |
| 19 to 25 Years | 1,459 (95.3%) | 72 (4.7%) |
| 26 to 34 Years | 3,688 (91.4%) | 348 (8.6%) |
| 35 to 44 Years | 5,473 (87.2%) | 807 (12.9%) |
| 45 to 54 Years | 6,764 (95.9%) | 286 (4.1%) |
| 55 to 64 Years | 5,930 (94.3%) | 356 (5.7%) |
| 65 to 74 Years | 2,779 (96.3%) | 107 (3.7%) |
| 75 Years and older | 1,026 (100.0%) | 0 (0.0%) |
| Total | 38,644 (94.4%) | 2,298 (5.6%) |
Health Insurance Coverage by Citizenship Status in Milton
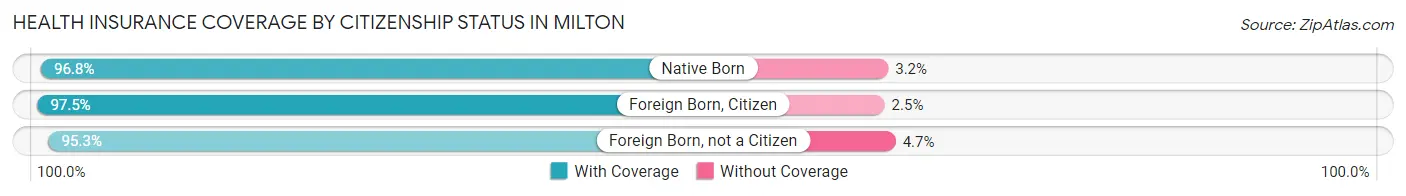
| Citizenship Status | With Coverage | Without Coverage |
| Native Born | 3,048 (96.8%) | 102 (3.2%) |
| Foreign Born, Citizen | 8,477 (97.5%) | 220 (2.5%) |
| Foreign Born, not a Citizen | 1,459 (95.3%) | 72 (4.7%) |
Health Insurance Coverage by Household Income in Milton
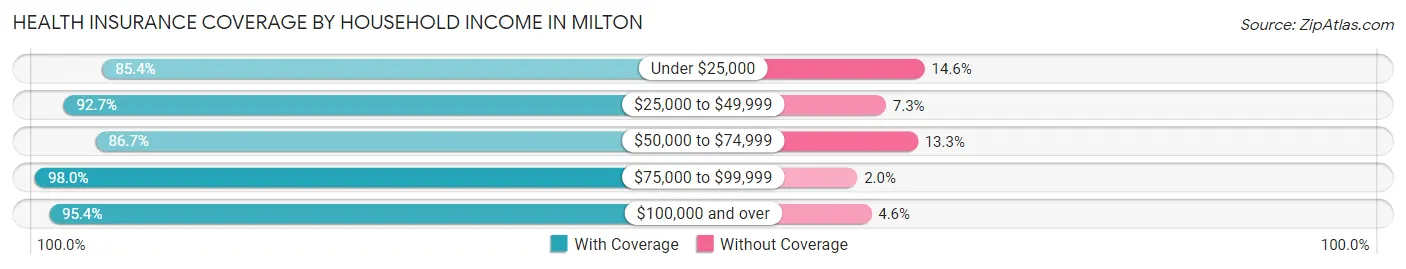
| Household Income | With Coverage | Without Coverage |
| Under $25,000 | 1,641 (85.4%) | 280 (14.6%) |
| $25,000 to $49,999 | 1,342 (92.7%) | 106 (7.3%) |
| $50,000 to $74,999 | 3,223 (86.7%) | 494 (13.3%) |
| $75,000 to $99,999 | 5,042 (98.0%) | 101 (2.0%) |
| $100,000 and over | 27,370 (95.4%) | 1,317 (4.6%) |
Public vs Private Health Insurance Coverage by Age in Milton
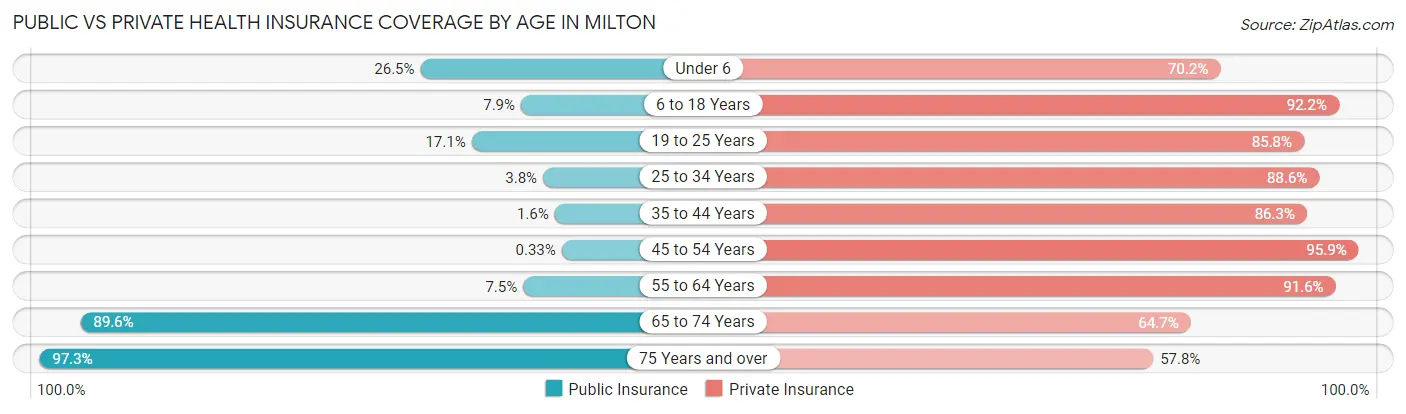
| Age Bracket | Public Insurance | Private Insurance |
| Under 6 | 836 (26.5%) | 2,212 (70.2%) |
| 6 to 18 Years | 686 (7.9%) | 8,022 (92.2%) |
| 19 to 25 Years | 261 (17.1%) | 1,313 (85.8%) |
| 25 to 34 Years | 153 (3.8%) | 3,576 (88.6%) |
| 35 to 44 Years | 103 (1.6%) | 5,419 (86.3%) |
| 45 to 54 Years | 23 (0.3%) | 6,763 (95.9%) |
| 55 to 64 Years | 470 (7.5%) | 5,759 (91.6%) |
| 65 to 74 Years | 2,587 (89.6%) | 1,868 (64.7%) |
| 75 Years and over | 998 (97.3%) | 593 (57.8%) |
| Total | 6,117 (14.9%) | 35,525 (86.8%) |
Disability Status by Sex by Age in Milton
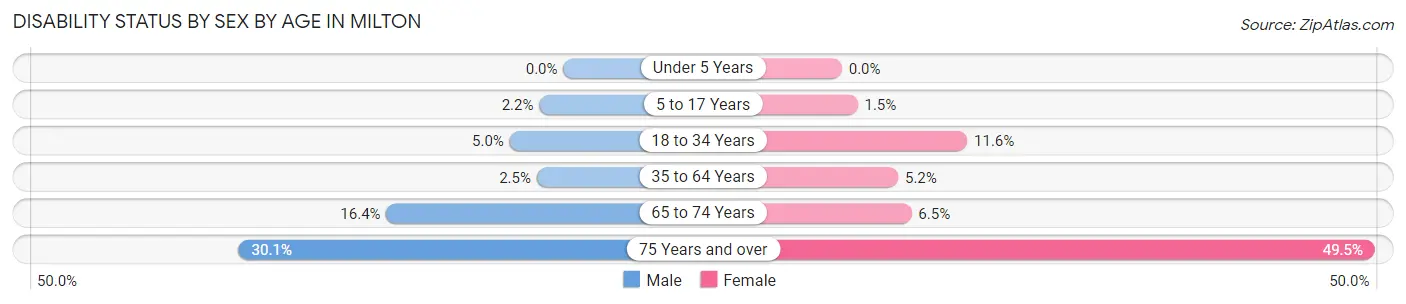
| Age Bracket | Male | Female |
| Under 5 Years | 0 (0.0%) | 0 (0.0%) |
| 5 to 17 Years | 108 (2.2%) | 57 (1.5%) |
| 18 to 34 Years | 143 (5.0%) | 387 (11.6%) |
| 35 to 64 Years | 237 (2.5%) | 521 (5.2%) |
| 65 to 74 Years | 230 (16.4%) | 96 (6.5%) |
| 75 Years and over | 141 (30.1%) | 276 (49.5%) |
Disability Class by Sex by Age in Milton
Disability Class: Hearing Difficulty
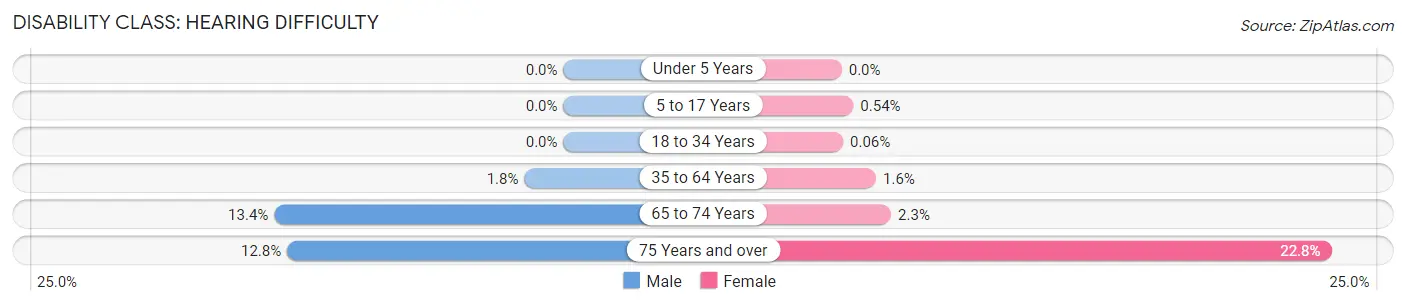
| Age Bracket | Male | Female |
| Under 5 Years | 0 (0.0%) | 0 (0.0%) |
| 5 to 17 Years | 0 (0.0%) | 21 (0.5%) |
| 18 to 34 Years | 0 (0.0%) | 2 (0.1%) |
| 35 to 64 Years | 174 (1.8%) | 159 (1.6%) |
| 65 to 74 Years | 188 (13.4%) | 34 (2.3%) |
| 75 Years and over | 60 (12.8%) | 127 (22.8%) |
Disability Class: Vision Difficulty
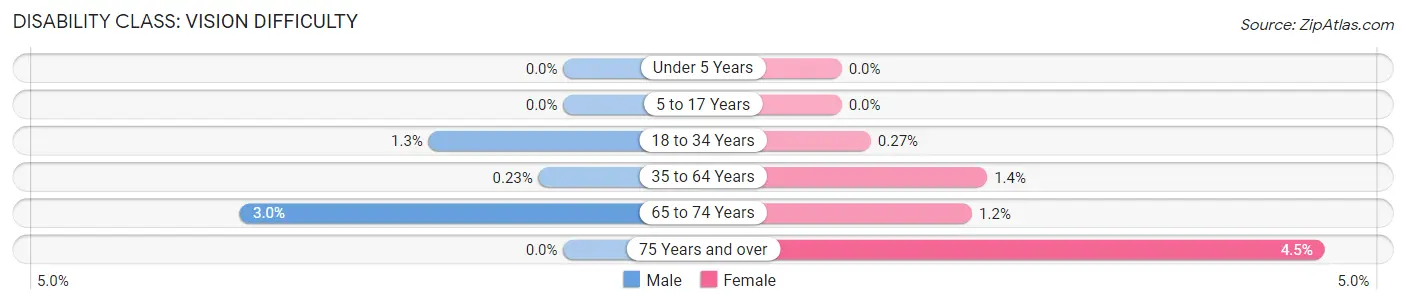
| Age Bracket | Male | Female |
| Under 5 Years | 0 (0.0%) | 0 (0.0%) |
| 5 to 17 Years | 0 (0.0%) | 0 (0.0%) |
| 18 to 34 Years | 36 (1.3%) | 9 (0.3%) |
| 35 to 64 Years | 22 (0.2%) | 135 (1.3%) |
| 65 to 74 Years | 42 (3.0%) | 18 (1.2%) |
| 75 Years and over | 0 (0.0%) | 25 (4.5%) |
Disability Class: Cognitive Difficulty
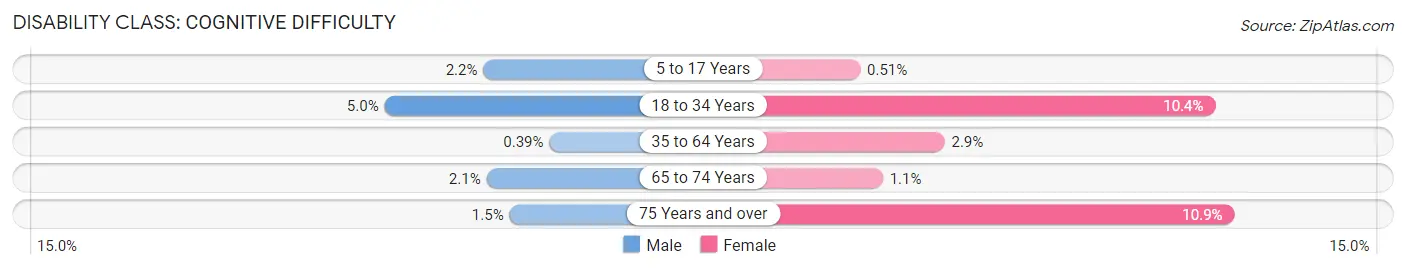
| Age Bracket | Male | Female |
| 5 to 17 Years | 108 (2.2%) | 20 (0.5%) |
| 18 to 34 Years | 143 (5.0%) | 346 (10.4%) |
| 35 to 64 Years | 38 (0.4%) | 285 (2.9%) |
| 65 to 74 Years | 30 (2.1%) | 17 (1.1%) |
| 75 Years and over | 7 (1.5%) | 61 (10.9%) |
Disability Class: Ambulatory Difficulty
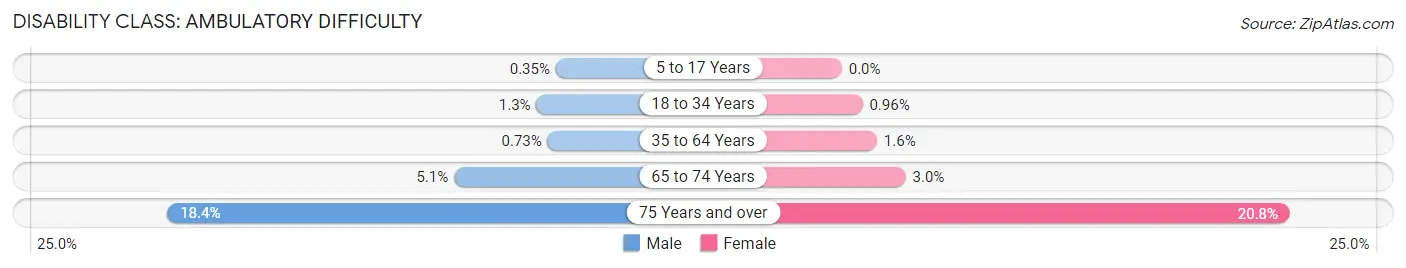
| Age Bracket | Male | Female |
| 5 to 17 Years | 17 (0.4%) | 0 (0.0%) |
| 18 to 34 Years | 36 (1.3%) | 32 (1.0%) |
| 35 to 64 Years | 70 (0.7%) | 163 (1.6%) |
| 65 to 74 Years | 71 (5.1%) | 44 (3.0%) |
| 75 Years and over | 86 (18.4%) | 116 (20.8%) |
Disability Class: Self-Care Difficulty
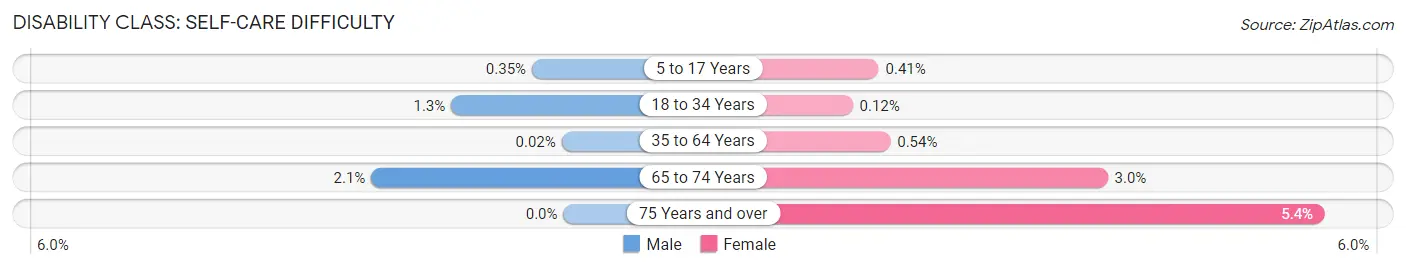
| Age Bracket | Male | Female |
| 5 to 17 Years | 17 (0.4%) | 16 (0.4%) |
| 18 to 34 Years | 36 (1.3%) | 4 (0.1%) |
| 35 to 64 Years | 2 (0.0%) | 54 (0.5%) |
| 65 to 74 Years | 30 (2.1%) | 44 (3.0%) |
| 75 Years and over | 0 (0.0%) | 30 (5.4%) |
Technology Access in Milton
Computing Device Access in Milton
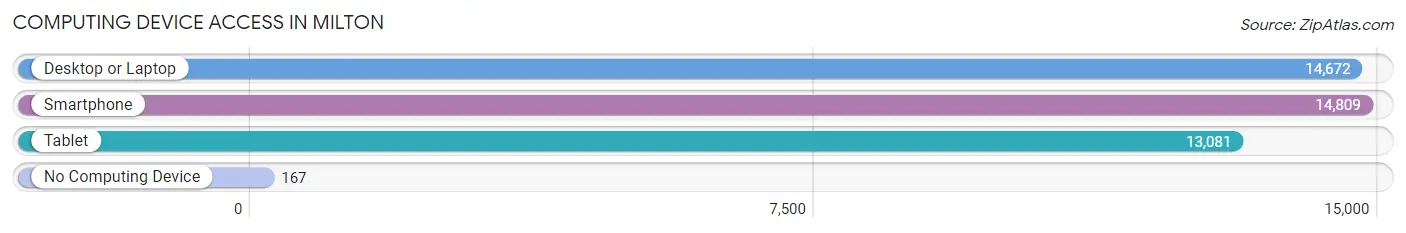
| Device Type | # Households | % Households |
| Desktop or Laptop | 14,672 | 96.6% |
| Smartphone | 14,809 | 97.5% |
| Tablet | 13,081 | 86.1% |
| No Computing Device | 167 | 1.1% |
| Total | 15,192 | 100.0% |
Internet Access in Milton
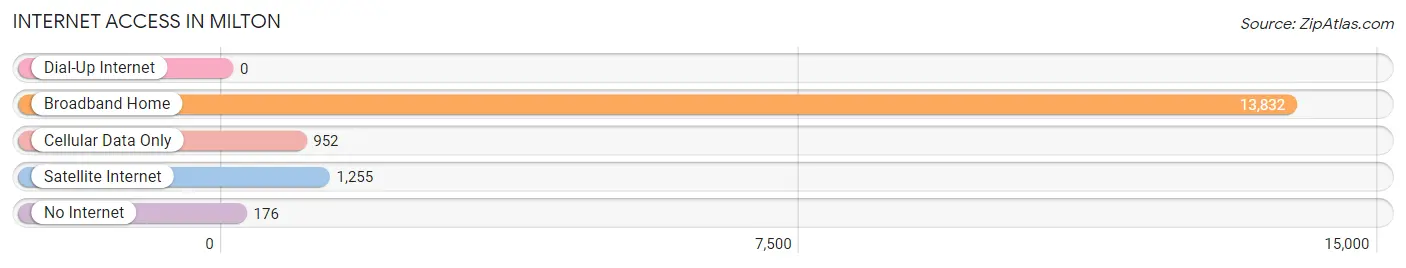
| Internet Type | # Households | % Households |
| Dial-Up Internet | 0 | 0.0% |
| Broadband Home | 13,832 | 91.0% |
| Cellular Data Only | 952 | 6.3% |
| Satellite Internet | 1,255 | 8.3% |
| No Internet | 176 | 1.2% |
| Total | 15,192 | 100.0% |
Milton Summary
Milton, Georgia is a city located in Fulton County, Georgia, United States. It is an affluent suburb of Atlanta, located about 30 miles north of the city. The population of Milton was 32,661 at the 2010 census, making it the 13th largest city in the state.
History
Milton was founded in 1858 by John Milton, a former mayor of nearby Alpharetta. The city was named after him in honor of his contributions to the area. The city was incorporated in 2006, making it one of the newest cities in Georgia.
Geography
Milton is located in northern Fulton County, Georgia, about 30 miles north of Atlanta. It is bordered by Alpharetta to the east, Roswell to the south, and Johns Creek to the west. The city covers an area of approximately 24 square miles.
The terrain of Milton is mostly hilly, with some flat areas. The city is located in the Piedmont region of Georgia, and is part of the Atlanta metropolitan area.
Economy
Milton has a strong economy, with a variety of businesses and industries. The city is home to several corporate headquarters, including the headquarters of the Home Depot, the world’s largest home improvement retailer. Other major employers in the city include the Northside Hospital, the Georgia Institute of Technology, and the Georgia Department of Transportation.
The city also has a thriving retail sector, with several shopping centers and malls. The city is home to the North Point Mall, which is one of the largest malls in the state.
Demographics
As of the 2010 census, the population of Milton was 32,661. The racial makeup of the city was 79.2% White, 11.2% African American, 0.3% Native American, 5.2% Asian, 0.1% Pacific Islander, 1.7% from other races, and 2.3% from two or more races. Hispanic or Latino of any race were 4.7% of the population.
The median income for a household in Milton was $106,845, and the median income for a family was $125,845. The per capita income for the city was $50,845. About 4.2% of families and 5.7% of the population were below the poverty line, including 6.3% of those under age 18 and 4.2% of those age 65 or over.
Milton is a diverse city, with a variety of cultures and backgrounds represented. The city is home to a large number of immigrants, with the largest groups coming from India, China, and Mexico. The city also has a large Jewish population, with many of the city’s residents being of Jewish descent.
Common Questions
What is Per Capita Income in Milton?
Per Capita income in Milton is $79,468.
What is the Median Family Income in Milton?
Median Family Income in Milton is $178,317.
What is the Median Household income in Milton?
Median Household Income in Milton is $142,845.
What is Income or Wage Gap in Milton?
Income or Wage Gap in Milton is 51.4%.
Women in Milton earn 48.6 cents for every dollar earned by a man.
What is Inequality or Gini Index in Milton?
Inequality or Gini Index in Milton is 0.48.
What is the Total Population of Milton?
Total Population of Milton is 41,029.
What is the Total Male Population of Milton?
Total Male Population of Milton is 20,696.
What is the Total Female Population of Milton?
Total Female Population of Milton is 20,333.
What is the Ratio of Males per 100 Females in Milton?
There are 101.79 Males per 100 Females in Milton.
What is the Ratio of Females per 100 Males in Milton?
There are 98.25 Females per 100 Males in Milton.
What is the Median Population Age in Milton?
Median Population Age in Milton is 40.1 Years.
What is the Average Family Size in Milton
Average Family Size in Milton is 3.1 People.
What is the Average Household Size in Milton
Average Household Size in Milton is 2.7 People.
How Large is the Labor Force in Milton?
There are 22,269 People in the Labor Forcein in Milton.
What is the Percentage of People in the Labor Force in Milton?
71.5% of People are in the Labor Force in Milton.
What is the Unemployment Rate in Milton?
Unemployment Rate in Milton is 3.2%.