Shelbyville, KY Map & Demographics
Shelbyville Map
Shelbyville Overview
$34,697
PER CAPITA INCOME
$82,632
AVG FAMILY INCOME
$74,433
AVG HOUSEHOLD INCOME
15.7%
WAGE / INCOME GAP [ % ]
84.3¢/ $1
WAGE / INCOME GAP [ $ ]
0.43
INEQUALITY / GINI INDEX
17,239
TOTAL POPULATION
8,216
MALE POPULATION
9,023
FEMALE POPULATION
91.06
MALES / 100 FEMALES
109.82
FEMALES / 100 MALES
37.4
MEDIAN AGE
3.1
AVG FAMILY SIZE
2.6
AVG HOUSEHOLD SIZE
9,385
LABOR FORCE [ PEOPLE ]
69.2%
PERCENT IN LABOR FORCE
2.9%
UNEMPLOYMENT RATE
Shelbyville Zip Codes
Shelbyville Area Codes
Income in Shelbyville
Income Overview in Shelbyville
Per Capita Income in Shelbyville is $34,697, while median incomes of families and households are $82,632 and $74,433 respectively.
| Characteristic | Number | Measure |
| Per Capita Income | 17,239 | $34,697 |
| Median Family Income | 4,442 | $82,632 |
| Mean Family Income | 4,442 | $101,795 |
| Median Household Income | 6,442 | $74,433 |
| Mean Household Income | 6,442 | $89,669 |
| Income Deficit | 4,442 | $0 |
| Wage / Income Gap (%) | 17,239 | 15.71% |
| Wage / Income Gap ($) | 17,239 | 84.29¢ per $1 |
| Gini / Inequality Index | 17,239 | 0.43 |
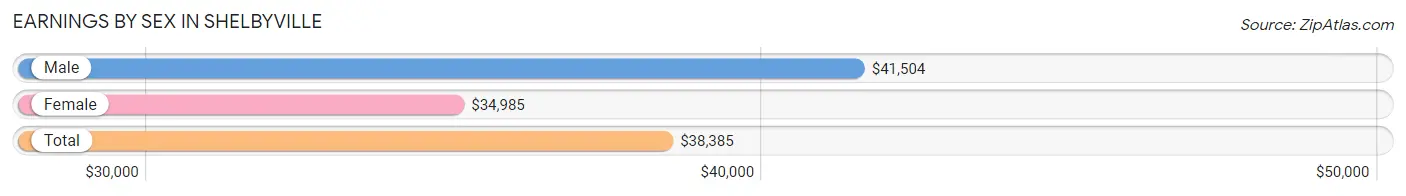
Earnings by Sex in Shelbyville
Average Earnings in Shelbyville are $38,385, $41,504 for men and $34,985 for women, a difference of 15.7%.
| Sex | Number | Average Earnings |
| Male | 4,819 (49.2%) | $41,504 |
| Female | 4,975 (50.8%) | $34,985 |
| Total | 9,794 (100.0%) | $38,385 |
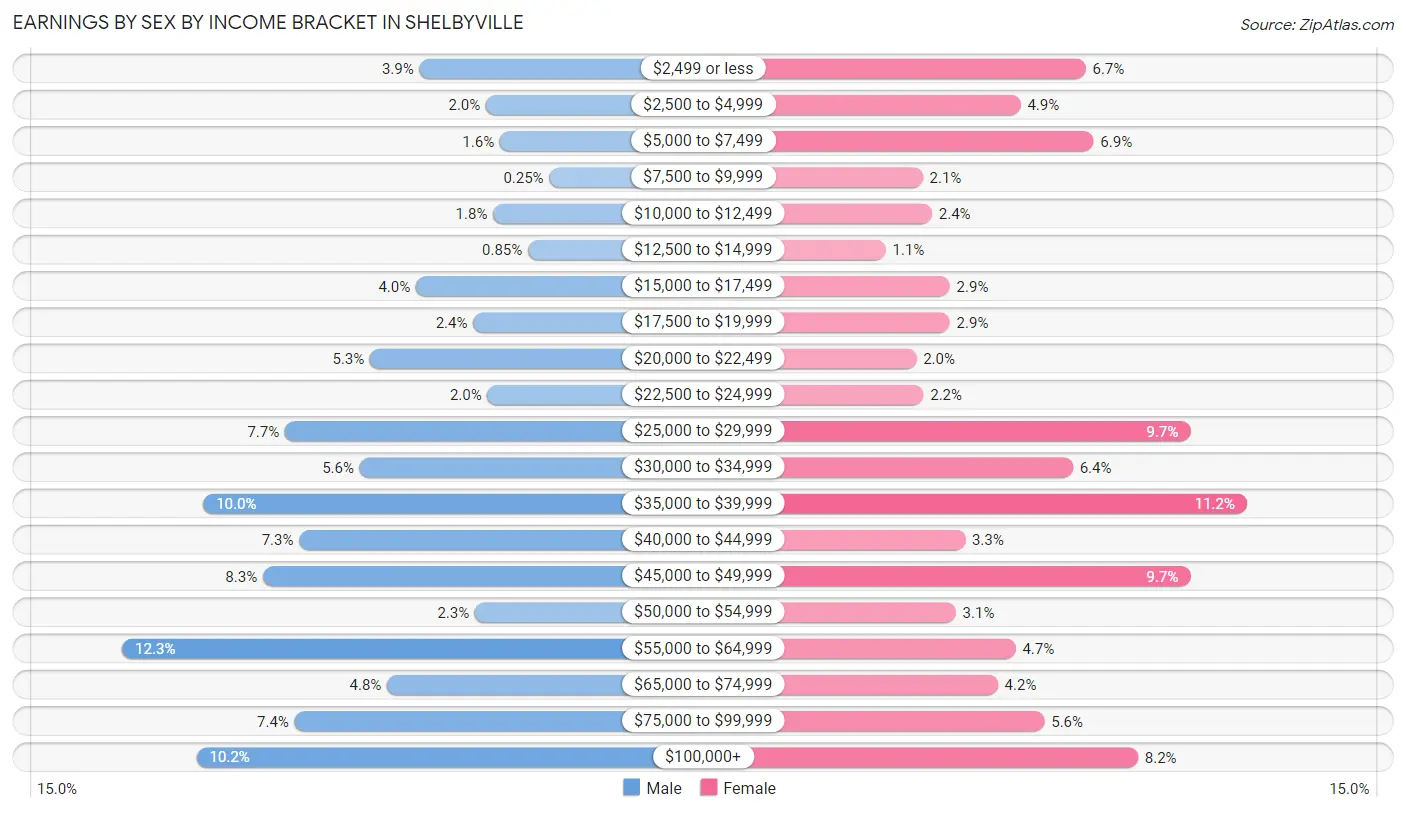
Earnings by Sex by Income Bracket in Shelbyville
The most common earnings brackets in Shelbyville are $55,000 to $64,999 for men (591 | 12.3%) and $35,000 to $39,999 for women (559 | 11.2%).
| Income | Male | Female |
| $2,499 or less | 188 (3.9%) | 334 (6.7%) |
| $2,500 to $4,999 | 98 (2.0%) | 243 (4.9%) |
| $5,000 to $7,499 | 79 (1.6%) | 345 (6.9%) |
| $7,500 to $9,999 | 12 (0.3%) | 106 (2.1%) |
| $10,000 to $12,499 | 88 (1.8%) | 119 (2.4%) |
| $12,500 to $14,999 | 41 (0.9%) | 54 (1.1%) |
| $15,000 to $17,499 | 193 (4.0%) | 144 (2.9%) |
| $17,500 to $19,999 | 115 (2.4%) | 144 (2.9%) |
| $20,000 to $22,499 | 255 (5.3%) | 97 (1.9%) |
| $22,500 to $24,999 | 96 (2.0%) | 107 (2.1%) |
| $25,000 to $29,999 | 370 (7.7%) | 480 (9.7%) |
| $30,000 to $34,999 | 269 (5.6%) | 316 (6.4%) |
| $35,000 to $39,999 | 481 (10.0%) | 559 (11.2%) |
| $40,000 to $44,999 | 351 (7.3%) | 165 (3.3%) |
| $45,000 to $49,999 | 400 (8.3%) | 480 (9.7%) |
| $50,000 to $54,999 | 113 (2.3%) | 152 (3.1%) |
| $55,000 to $64,999 | 591 (12.3%) | 236 (4.7%) |
| $65,000 to $74,999 | 232 (4.8%) | 211 (4.2%) |
| $75,000 to $99,999 | 357 (7.4%) | 276 (5.6%) |
| $100,000+ | 490 (10.2%) | 407 (8.2%) |
| Total | 4,819 (100.0%) | 4,975 (100.0%) |
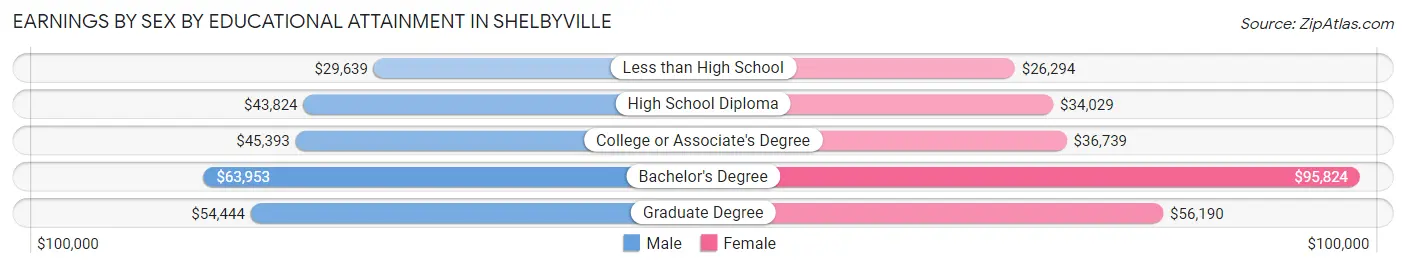
Earnings by Sex by Educational Attainment in Shelbyville
Average earnings in Shelbyville are $45,025 for men and $38,564 for women, a difference of 14.3%. Men with an educational attainment of bachelor's degree enjoy the highest average annual earnings of $63,953, while those with less than high school education earn the least with $29,639. Women with an educational attainment of bachelor's degree earn the most with the average annual earnings of $95,824, while those with less than high school education have the smallest earnings of $26,294.
| Educational Attainment | Male Income | Female Income |
| Less than High School | $29,639 | $26,294 |
| High School Diploma | $43,824 | $34,029 |
| College or Associate's Degree | $45,393 | $36,739 |
| Bachelor's Degree | $63,953 | $95,824 |
| Graduate Degree | $54,444 | $56,190 |
| Total | $45,025 | $38,564 |
Family Income in Shelbyville
Family Income Brackets in Shelbyville
According to the Shelbyville family income data, there are 933 families falling into the $100,000 to $149,999 income range, which is the most common income bracket and makes up 21.0% of all families. Conversely, the $10,000 to $14,999 income bracket is the least frequent group with only 71 families (1.6%) belonging to this category.
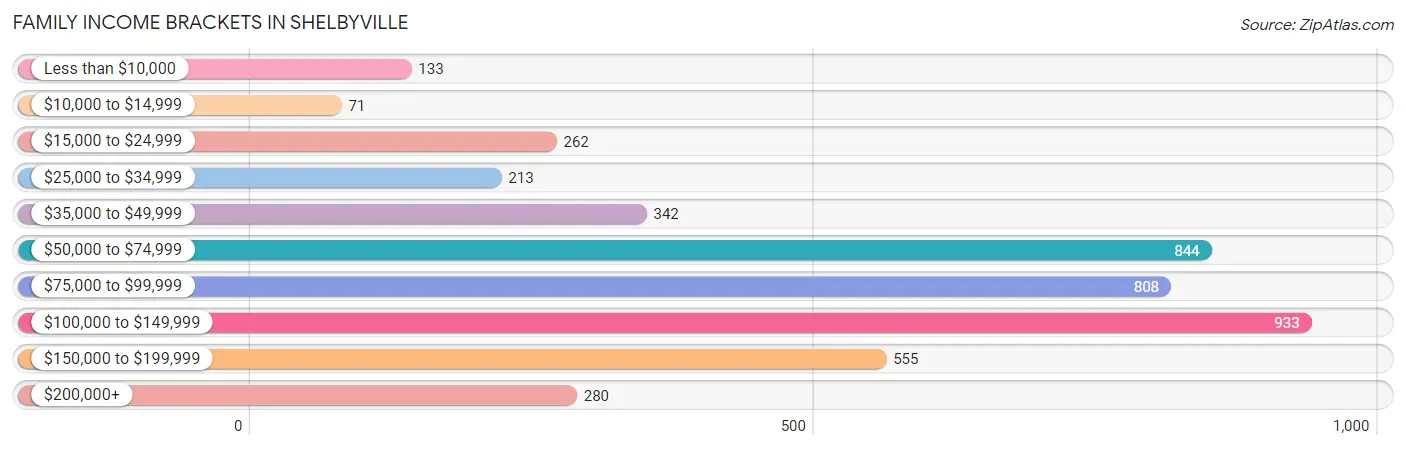
| Income Bracket | # Families | % Families |
| Less than $10,000 | 133 | 3.0% |
| $10,000 to $14,999 | 71 | 1.6% |
| $15,000 to $24,999 | 262 | 5.9% |
| $25,000 to $34,999 | 213 | 4.8% |
| $35,000 to $49,999 | 342 | 7.7% |
| $50,000 to $74,999 | 844 | 19.0% |
| $75,000 to $99,999 | 808 | 18.2% |
| $100,000 to $149,999 | 933 | 21.0% |
| $150,000 to $199,999 | 555 | 12.5% |
| $200,000+ | 280 | 6.3% |
Family Income by Famaliy Size in Shelbyville
4-person families (893 | 20.1%) account for the highest median family income in Shelbyville with $116,875 per family, while 2-person families (2,048 | 46.1%) have the highest median income of $36,160 per family member.
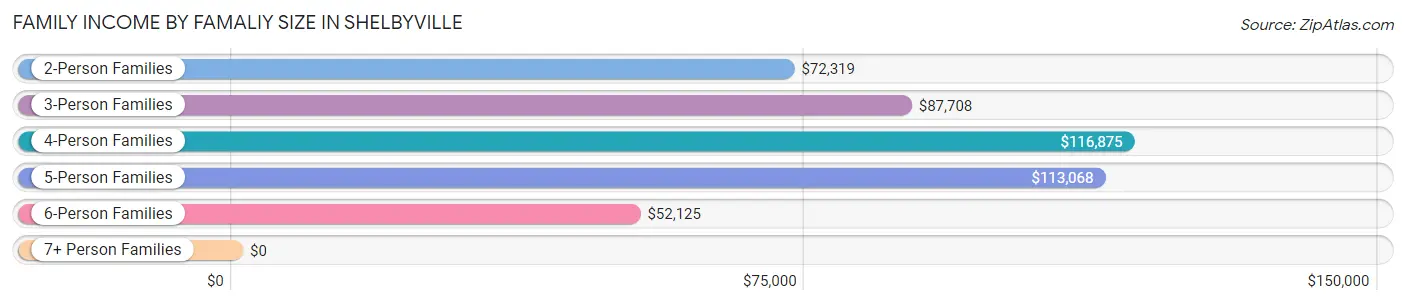
| Income Bracket | # Families | Median Income |
| 2-Person Families | 2,048 (46.1%) | $72,319 |
| 3-Person Families | 953 (21.4%) | $87,708 |
| 4-Person Families | 893 (20.1%) | $116,875 |
| 5-Person Families | 398 (9.0%) | $113,068 |
| 6-Person Families | 113 (2.5%) | $52,125 |
| 7+ Person Families | 37 (0.8%) | $0 |
| Total | 4,442 (100.0%) | $82,632 |
Family Income by Number of Earners in Shelbyville
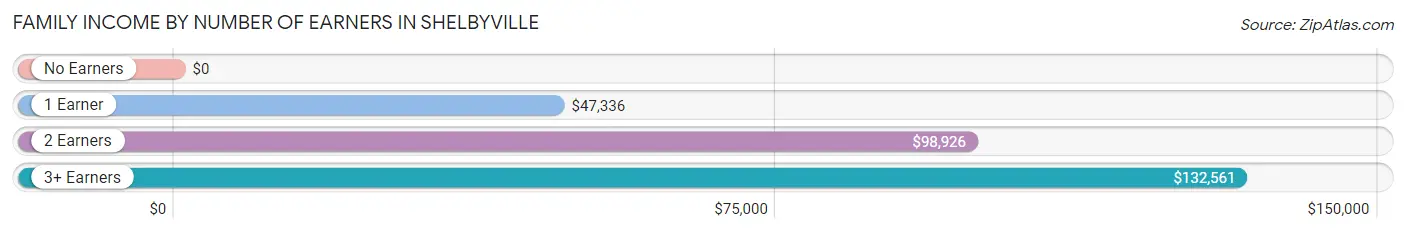
| Number of Earners | # Families | Median Income |
| No Earners | 381 (8.6%) | $0 |
| 1 Earner | 1,334 (30.0%) | $47,336 |
| 2 Earners | 2,311 (52.0%) | $98,926 |
| 3+ Earners | 416 (9.4%) | $132,561 |
| Total | 4,442 (100.0%) | $82,632 |
Household Income in Shelbyville
Household Income Brackets in Shelbyville
With 1,211 households falling in the category, the $100,000 to $149,999 income range is the most frequent in Shelbyville, accounting for 18.8% of all households. In contrast, only 180 households (2.8%) fall into the $10,000 to $14,999 income bracket, making it the least populous group.
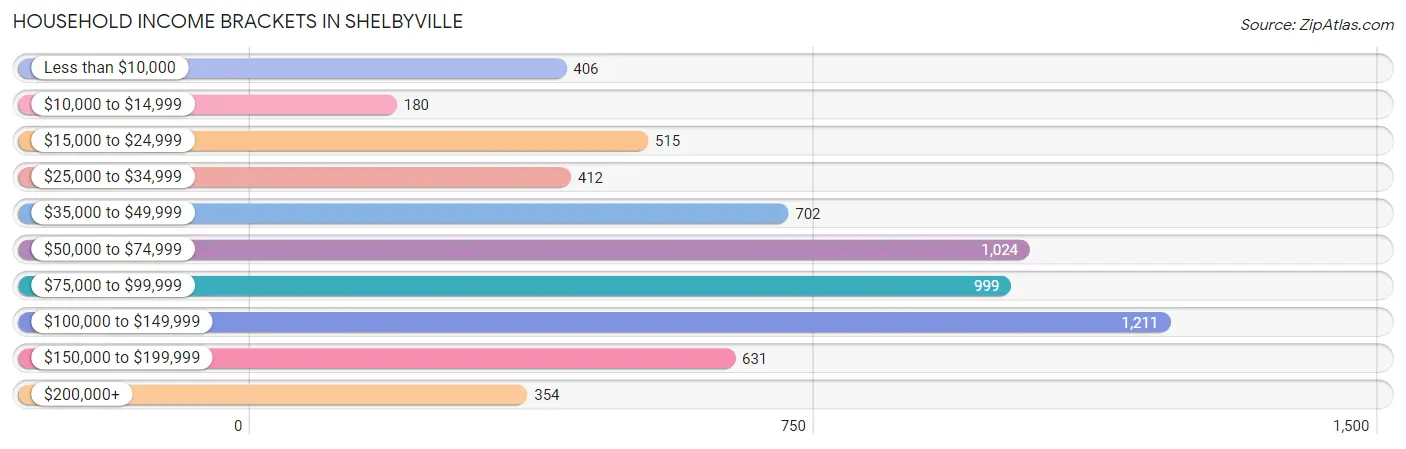
| Income Bracket | # Households | % Households |
| Less than $10,000 | 406 | 6.3% |
| $10,000 to $14,999 | 180 | 2.8% |
| $15,000 to $24,999 | 515 | 8.0% |
| $25,000 to $34,999 | 412 | 6.4% |
| $35,000 to $49,999 | 702 | 10.9% |
| $50,000 to $74,999 | 1,024 | 15.9% |
| $75,000 to $99,999 | 999 | 15.5% |
| $100,000 to $149,999 | 1,211 | 18.8% |
| $150,000 to $199,999 | 631 | 9.8% |
| $200,000+ | 354 | 5.5% |
Household Income by Householder Age in Shelbyville
The median household income in Shelbyville is $74,433, with the highest median household income of $86,692 found in the 25 to 44 years age bracket for the primary householder. A total of 2,466 households (38.3%) fall into this category. Meanwhile, the 15 to 24 years age bracket for the primary householder has the lowest median household income of $42,206, with 320 households (5.0%) in this group.
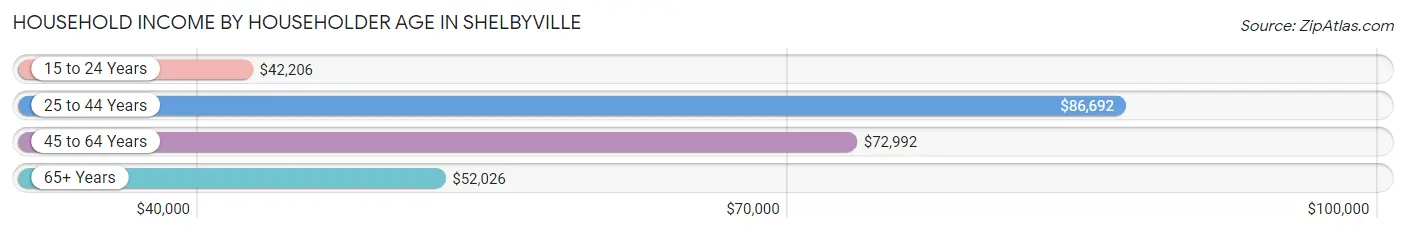
| Income Bracket | # Households | Median Income |
| 15 to 24 Years | 320 (5.0%) | $42,206 |
| 25 to 44 Years | 2,466 (38.3%) | $86,692 |
| 45 to 64 Years | 2,461 (38.2%) | $72,992 |
| 65+ Years | 1,195 (18.5%) | $52,026 |
| Total | 6,442 (100.0%) | $74,433 |
Poverty in Shelbyville
Income Below Poverty by Sex and Age in Shelbyville
With 7.1% poverty level for males and 12.3% for females among the residents of Shelbyville, 5 year old males and 12 to 14 year old females are the most vulnerable to poverty, with 20 males (42.5%) and 96 females (31.3%) in their respective age groups living below the poverty level.
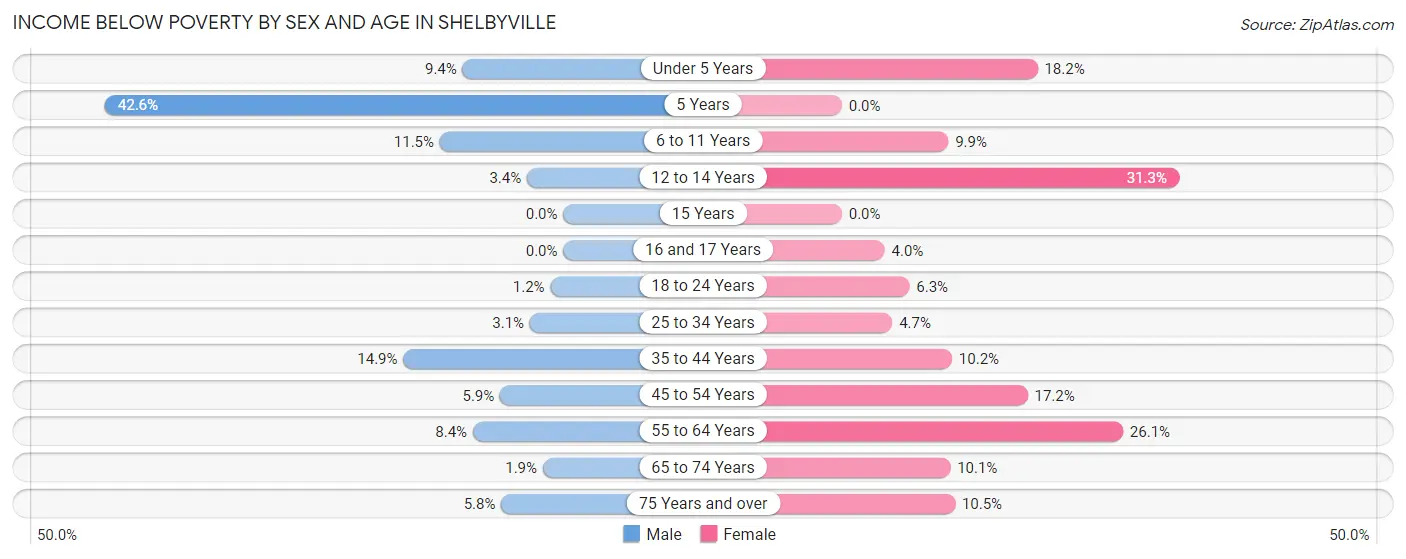
| Age Bracket | Male | Female |
| Under 5 Years | 68 (9.3%) | 83 (18.2%) |
| 5 Years | 20 (42.5%) | 0 (0.0%) |
| 6 to 11 Years | 77 (11.5%) | 57 (9.9%) |
| 12 to 14 Years | 14 (3.4%) | 96 (31.3%) |
| 15 Years | 0 (0.0%) | 0 (0.0%) |
| 16 and 17 Years | 0 (0.0%) | 11 (4.0%) |
| 18 to 24 Years | 7 (1.2%) | 66 (6.3%) |
| 25 to 34 Years | 31 (3.1%) | 52 (4.7%) |
| 35 to 44 Years | 180 (14.8%) | 143 (10.2%) |
| 45 to 54 Years | 72 (5.9%) | 185 (17.2%) |
| 55 to 64 Years | 78 (8.4%) | 263 (26.1%) |
| 65 to 74 Years | 14 (1.9%) | 80 (10.1%) |
| 75 Years and over | 11 (5.8%) | 55 (10.5%) |
| Total | 572 (7.1%) | 1,091 (12.3%) |
Income Above Poverty by Sex and Age in Shelbyville
According to the poverty statistics in Shelbyville, males aged 15 years and females aged 5 years are the age groups that are most secure financially, with 100.0% of males and 100.0% of females in these age groups living above the poverty line.
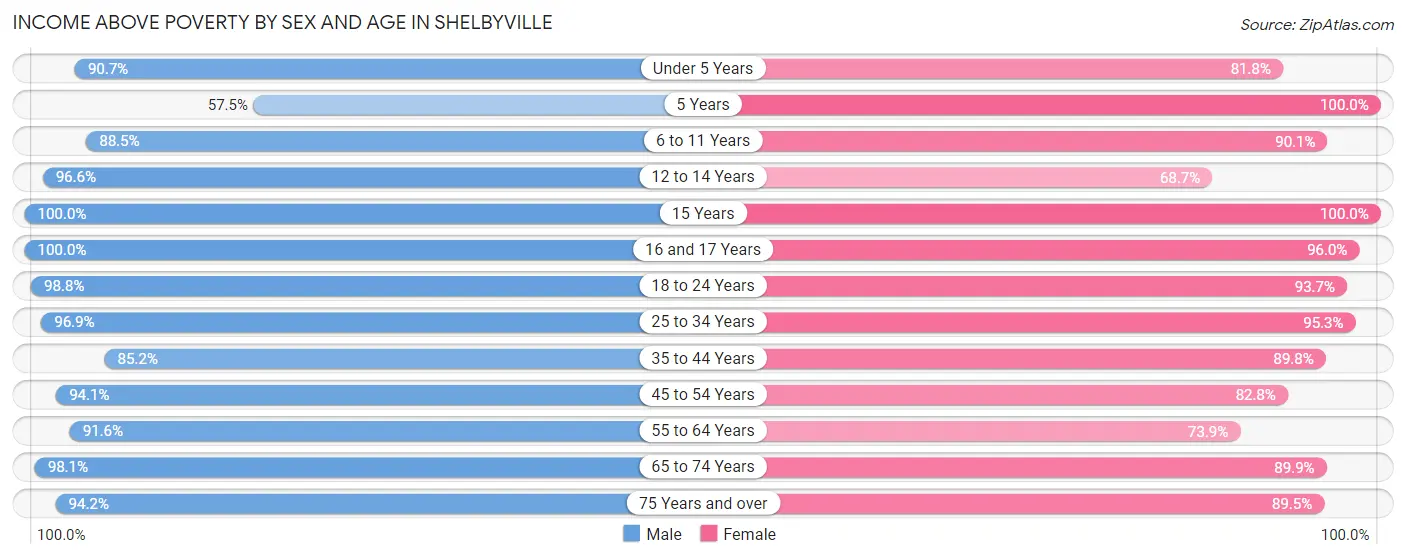
| Age Bracket | Male | Female |
| Under 5 Years | 659 (90.6%) | 374 (81.8%) |
| 5 Years | 27 (57.5%) | 199 (100.0%) |
| 6 to 11 Years | 595 (88.5%) | 520 (90.1%) |
| 12 to 14 Years | 401 (96.6%) | 211 (68.7%) |
| 15 Years | 40 (100.0%) | 76 (100.0%) |
| 16 and 17 Years | 236 (100.0%) | 266 (96.0%) |
| 18 to 24 Years | 574 (98.8%) | 986 (93.7%) |
| 25 to 34 Years | 970 (96.9%) | 1,059 (95.3%) |
| 35 to 44 Years | 1,032 (85.2%) | 1,256 (89.8%) |
| 45 to 54 Years | 1,154 (94.1%) | 888 (82.8%) |
| 55 to 64 Years | 852 (91.6%) | 745 (73.9%) |
| 65 to 74 Years | 722 (98.1%) | 715 (89.9%) |
| 75 Years and over | 180 (94.2%) | 469 (89.5%) |
| Total | 7,442 (92.9%) | 7,764 (87.7%) |
Income Below Poverty Among Married-Couple Families in Shelbyville
The poverty statistics for married-couple families in Shelbyville show that 4.5% or 145 of the total 3,190 families live below the poverty line. Families with 3 or 4 children have the highest poverty rate of 6.5%, comprising of 15 families. On the other hand, families with 5 or more children have the lowest poverty rate of 0.0%, which includes 0 families.
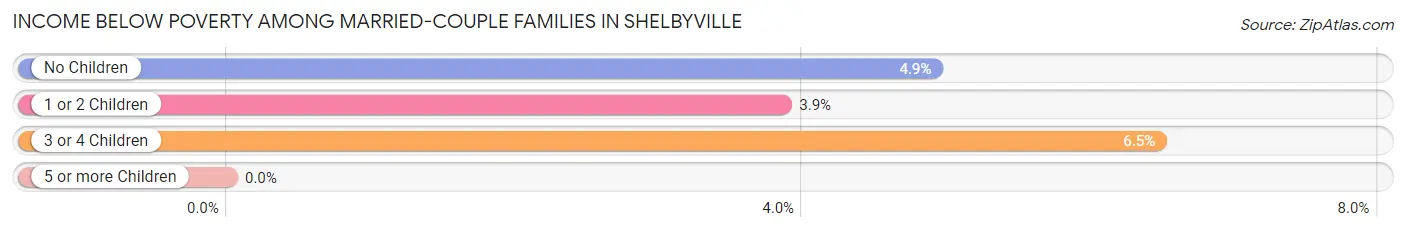
| Children | Above Poverty | Below Poverty |
| No Children | 1,529 (95.1%) | 79 (4.9%) |
| 1 or 2 Children | 1,270 (96.1%) | 51 (3.9%) |
| 3 or 4 Children | 217 (93.5%) | 15 (6.5%) |
| 5 or more Children | 29 (100.0%) | 0 (0.0%) |
| Total | 3,045 (95.5%) | 145 (4.5%) |
Income Below Poverty Among Single-Parent Households in Shelbyville
According to the poverty data in Shelbyville, 3.0% or 14 single-father households and 18.5% or 146 single-mother households are living below the poverty line. Among single-father households, those with 1 or 2 children have the highest poverty rate, with 14 households (9.4%) experiencing poverty. Likewise, among single-mother households, those with 5 or more children have the highest poverty rate, with 13 households (100.0%) falling below the poverty line.
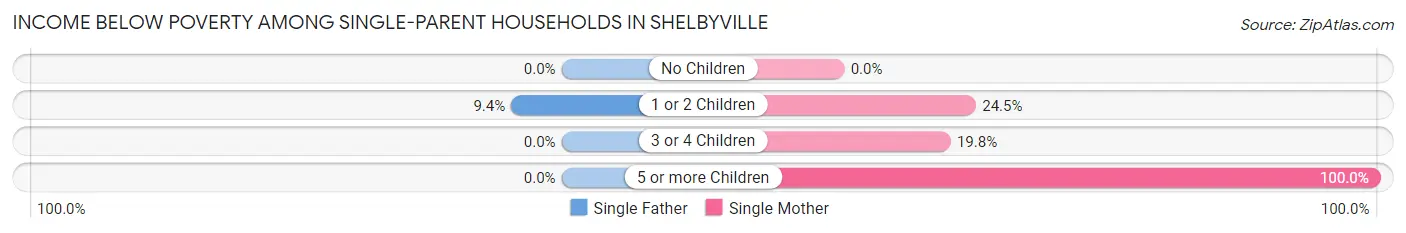
| Children | Single Father | Single Mother |
| No Children | 0 (0.0%) | 0 (0.0%) |
| 1 or 2 Children | 14 (9.4%) | 113 (24.5%) |
| 3 or 4 Children | 0 (0.0%) | 20 (19.8%) |
| 5 or more Children | 0 (0.0%) | 13 (100.0%) |
| Total | 14 (3.0%) | 146 (18.5%) |
Income Below Poverty Among Married-Couple vs Single-Parent Households in Shelbyville
The poverty data for Shelbyville shows that 145 of the married-couple family households (4.5%) and 160 of the single-parent households (12.8%) are living below the poverty level. Within the married-couple family households, those with 3 or 4 children have the highest poverty rate, with 15 households (6.5%) falling below the poverty line. Among the single-parent households, those with 5 or more children have the highest poverty rate, with 13 household (100.0%) living below poverty.
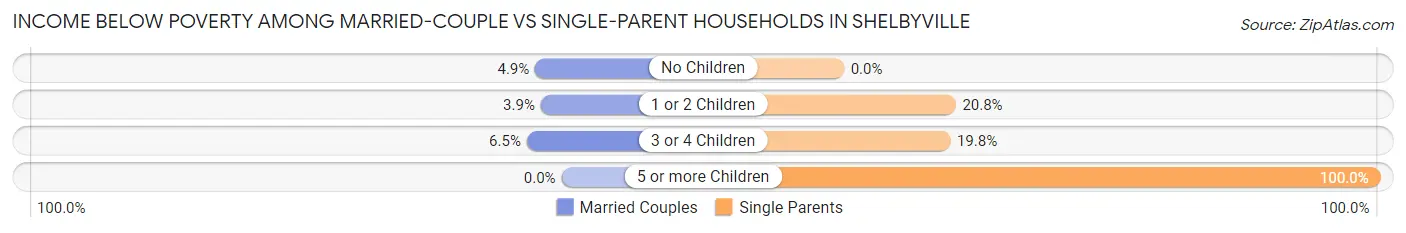
| Children | Married-Couple Families | Single-Parent Households |
| No Children | 79 (4.9%) | 0 (0.0%) |
| 1 or 2 Children | 51 (3.9%) | 127 (20.8%) |
| 3 or 4 Children | 15 (6.5%) | 20 (19.8%) |
| 5 or more Children | 0 (0.0%) | 13 (100.0%) |
| Total | 145 (4.5%) | 160 (12.8%) |
Race in Shelbyville
The most populous races in Shelbyville are White / Caucasian (12,589 | 73.0%), Hispanic or Latino (3,074 | 17.8%), and Two or more Races (1,750 | 10.2%).
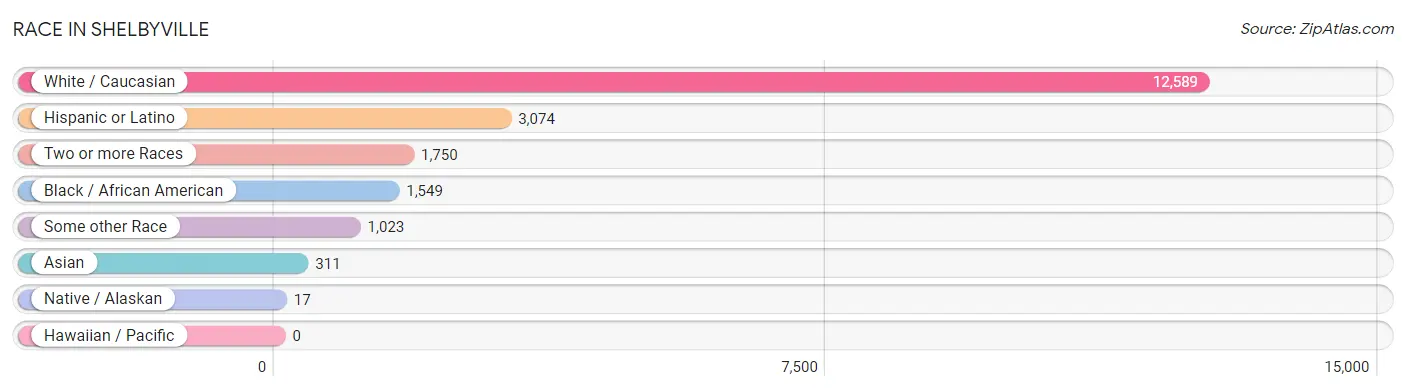
| Race | # Population | % Population |
| Asian | 311 | 1.8% |
| Black / African American | 1,549 | 9.0% |
| Hawaiian / Pacific | 0 | 0.0% |
| Hispanic or Latino | 3,074 | 17.8% |
| Native / Alaskan | 17 | 0.1% |
| White / Caucasian | 12,589 | 73.0% |
| Two or more Races | 1,750 | 10.2% |
| Some other Race | 1,023 | 5.9% |
| Total | 17,239 | 100.0% |
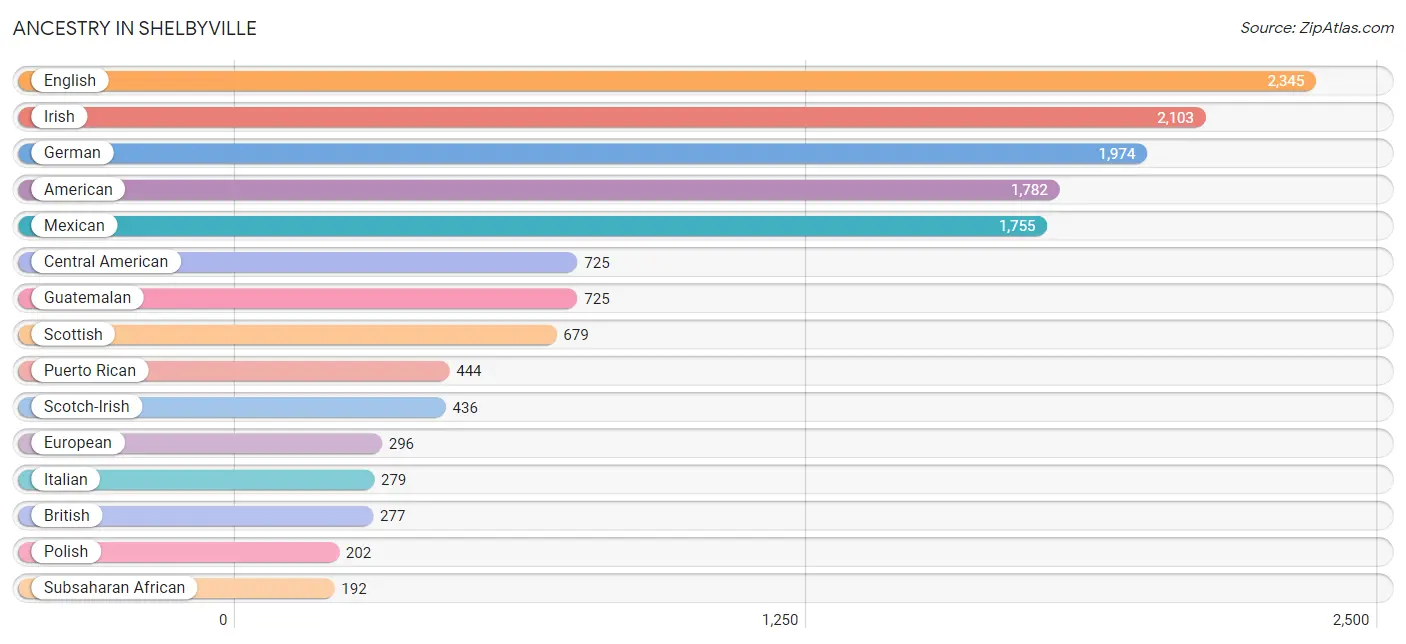
Ancestry in Shelbyville
The most populous ancestries reported in Shelbyville are English (2,345 | 13.6%), Irish (2,103 | 12.2%), German (1,974 | 11.5%), American (1,782 | 10.3%), and Mexican (1,755 | 10.2%), together accounting for 57.8% of all Shelbyville residents.
| Ancestry | # Population | % Population |
| American | 1,782 | 10.3% |
| Arab | 9 | 0.1% |
| Austrian | 56 | 0.3% |
| Bhutanese | 3 | 0.0% |
| British | 277 | 1.6% |
| Central American | 725 | 4.2% |
| Cherokee | 146 | 0.9% |
| Cuban | 44 | 0.3% |
| Dutch | 120 | 0.7% |
| Eastern European | 8 | 0.1% |
| English | 2,345 | 13.6% |
| Ethiopian | 28 | 0.2% |
| European | 296 | 1.7% |
| Finnish | 8 | 0.1% |
| French | 95 | 0.5% |
| German | 1,974 | 11.5% |
| Guatemalan | 725 | 4.2% |
| Hungarian | 28 | 0.2% |
| Indian (Asian) | 190 | 1.1% |
| Irish | 2,103 | 12.2% |
| Italian | 279 | 1.6% |
| Korean | 96 | 0.6% |
| Mexican | 1,755 | 10.2% |
| Northern European | 17 | 0.1% |
| Norwegian | 54 | 0.3% |
| Polish | 202 | 1.2% |
| Portuguese | 25 | 0.2% |
| Puerto Rican | 444 | 2.6% |
| Scandinavian | 41 | 0.2% |
| Scotch-Irish | 436 | 2.5% |
| Scottish | 679 | 3.9% |
| Senegalese | 162 | 0.9% |
| South African | 2 | 0.0% |
| Spaniard | 58 | 0.3% |
| Spanish | 48 | 0.3% |
| Subsaharan African | 192 | 1.1% |
| Swedish | 163 | 0.9% |
| Swiss | 62 | 0.4% |
| Thai | 88 | 0.5% |
| Welsh | 94 | 0.5% | View All 40 Rows |
Immigrants in Shelbyville
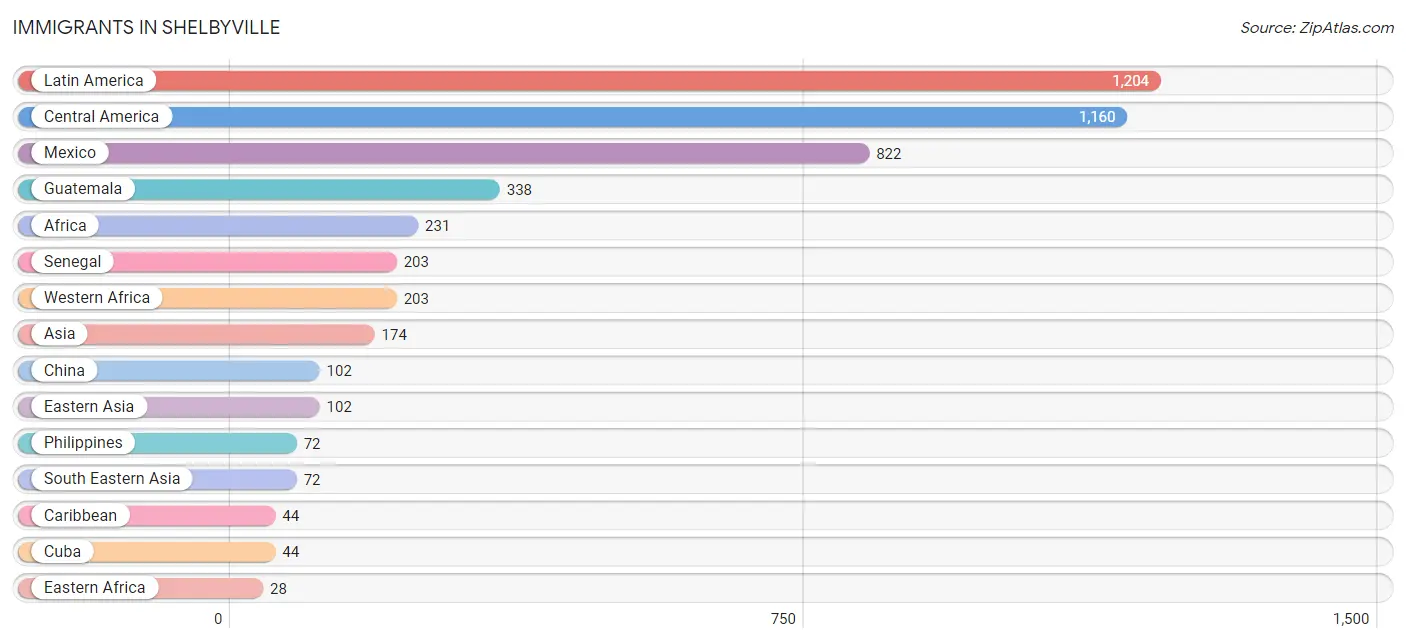
The most numerous immigrant groups reported in Shelbyville came from Latin America (1,204 | 7.0%), Central America (1,160 | 6.7%), Mexico (822 | 4.8%), Guatemala (338 | 2.0%), and Africa (231 | 1.3%), together accounting for 21.8% of all Shelbyville residents.
| Immigration Origin | # Population | % Population |
| Africa | 231 | 1.3% |
| Asia | 174 | 1.0% |
| Australia | 17 | 0.1% |
| Caribbean | 44 | 0.3% |
| Central America | 1,160 | 6.7% |
| China | 102 | 0.6% |
| Cuba | 44 | 0.3% |
| Eastern Africa | 28 | 0.2% |
| Eastern Asia | 102 | 0.6% |
| Ethiopia | 28 | 0.2% |
| Europe | 15 | 0.1% |
| Germany | 15 | 0.1% |
| Guatemala | 338 | 2.0% |
| Latin America | 1,204 | 7.0% |
| Mexico | 822 | 4.8% |
| Oceania | 17 | 0.1% |
| Philippines | 72 | 0.4% |
| Senegal | 203 | 1.2% |
| South Eastern Asia | 72 | 0.4% |
| Western Africa | 203 | 1.2% |
| Western Europe | 15 | 0.1% | View All 21 Rows |
Sex and Age in Shelbyville
Sex and Age in Shelbyville
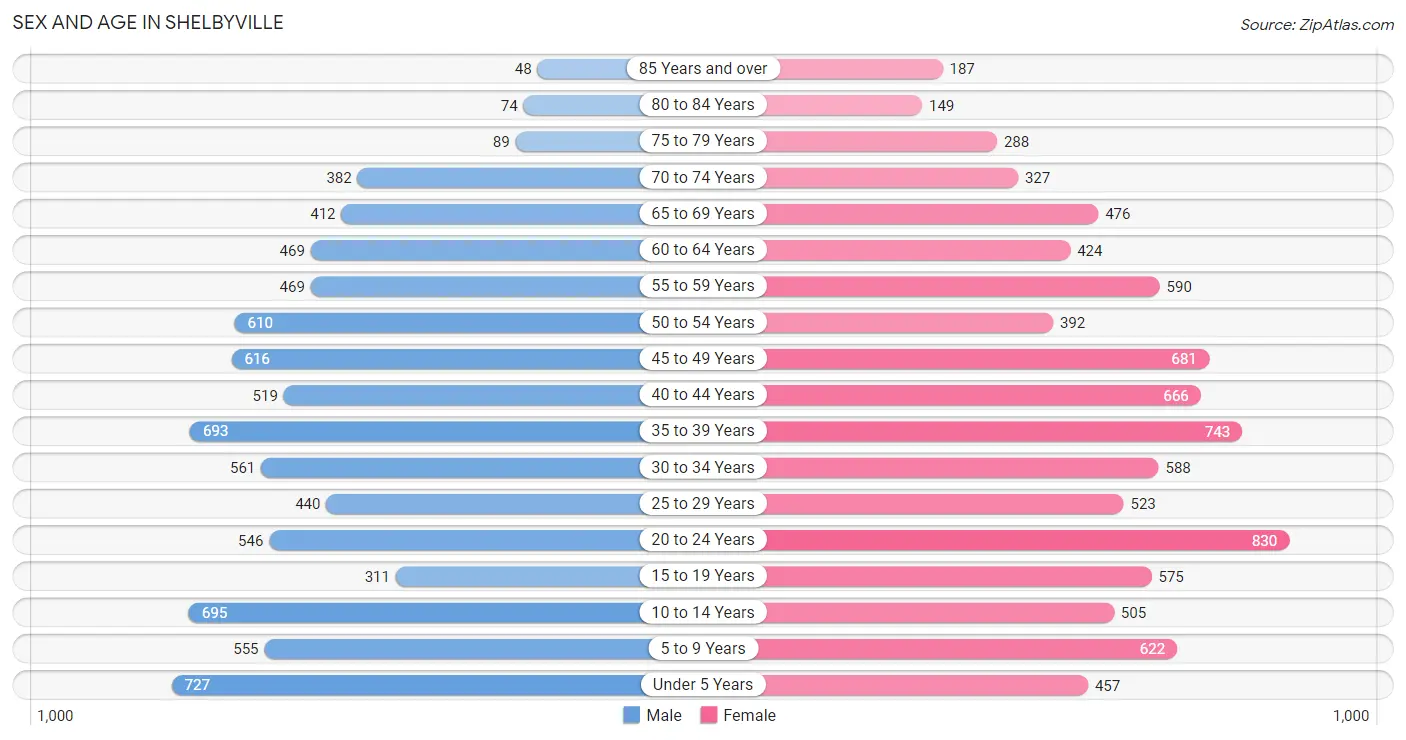
The most populous age groups in Shelbyville are Under 5 Years (727 | 8.8%) for men and 20 to 24 Years (830 | 9.2%) for women.
| Age Bracket | Male | Female |
| Under 5 Years | 727 (8.8%) | 457 (5.1%) |
| 5 to 9 Years | 555 (6.8%) | 622 (6.9%) |
| 10 to 14 Years | 695 (8.5%) | 505 (5.6%) |
| 15 to 19 Years | 311 (3.8%) | 575 (6.4%) |
| 20 to 24 Years | 546 (6.7%) | 830 (9.2%) |
| 25 to 29 Years | 440 (5.4%) | 523 (5.8%) |
| 30 to 34 Years | 561 (6.8%) | 588 (6.5%) |
| 35 to 39 Years | 693 (8.4%) | 743 (8.2%) |
| 40 to 44 Years | 519 (6.3%) | 666 (7.4%) |
| 45 to 49 Years | 616 (7.5%) | 681 (7.5%) |
| 50 to 54 Years | 610 (7.4%) | 392 (4.3%) |
| 55 to 59 Years | 469 (5.7%) | 590 (6.5%) |
| 60 to 64 Years | 469 (5.7%) | 424 (4.7%) |
| 65 to 69 Years | 412 (5.0%) | 476 (5.3%) |
| 70 to 74 Years | 382 (4.6%) | 327 (3.6%) |
| 75 to 79 Years | 89 (1.1%) | 288 (3.2%) |
| 80 to 84 Years | 74 (0.9%) | 149 (1.7%) |
| 85 Years and over | 48 (0.6%) | 187 (2.1%) |
| Total | 8,216 (100.0%) | 9,023 (100.0%) |
Families and Households in Shelbyville
Median Family Size in Shelbyville
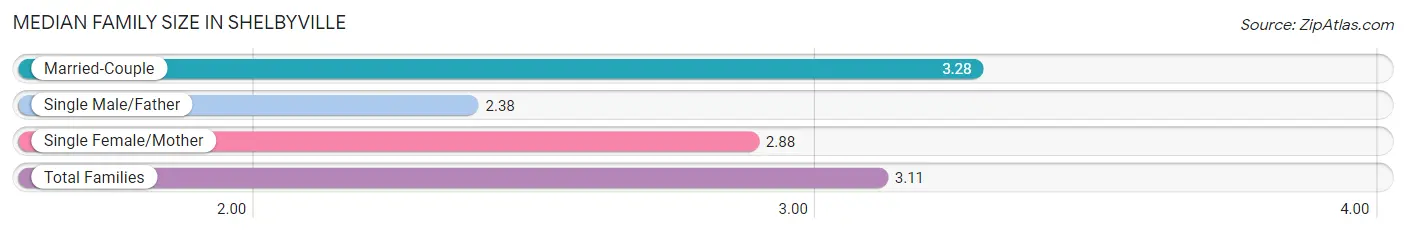
The median family size in Shelbyville is 3.11 persons per family, with married-couple families (3,190 | 71.8%) accounting for the largest median family size of 3.28 persons per family. On the other hand, single male/father families (464 | 10.4%) represent the smallest median family size with 2.38 persons per family.
| Family Type | # Families | Family Size |
| Married-Couple | 3,190 (71.8%) | 3.28 |
| Single Male/Father | 464 (10.4%) | 2.38 |
| Single Female/Mother | 788 (17.7%) | 2.88 |
| Total Families | 4,442 (100.0%) | 3.11 |
Median Household Size in Shelbyville
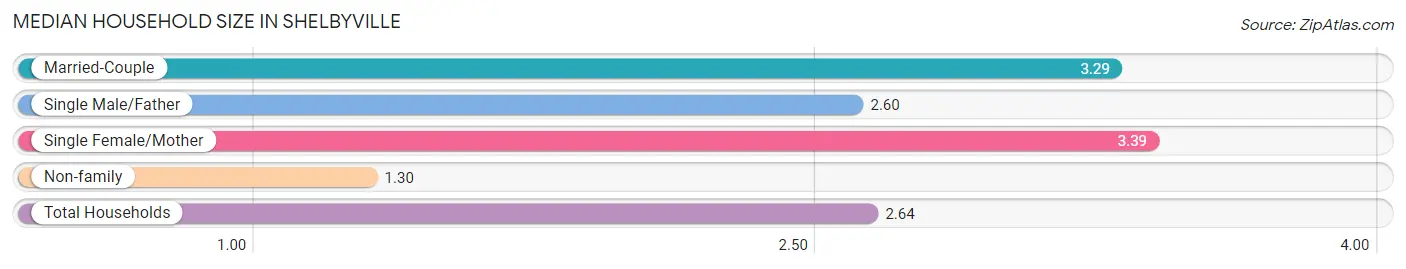
The median household size in Shelbyville is 2.64 persons per household, with single female/mother households (788 | 12.2%) accounting for the largest median household size of 3.39 persons per household. non-family households (2,000 | 31.0%) represent the smallest median household size with 1.30 persons per household.
| Household Type | # Households | Household Size |
| Married-Couple | 3,190 (49.5%) | 3.29 |
| Single Male/Father | 464 (7.2%) | 2.60 |
| Single Female/Mother | 788 (12.2%) | 3.39 |
| Non-family | 2,000 (31.0%) | 1.30 |
| Total Households | 6,442 (100.0%) | 2.64 |
Household Size by Marriage Status in Shelbyville
Out of a total of 6,442 households in Shelbyville, 4,442 (69.0%) are family households, while 2,000 (31.0%) are nonfamily households. The most numerous type of family households are 2-person households, comprising 1,801, and the most common type of nonfamily households are 1-person households, comprising 1,549.
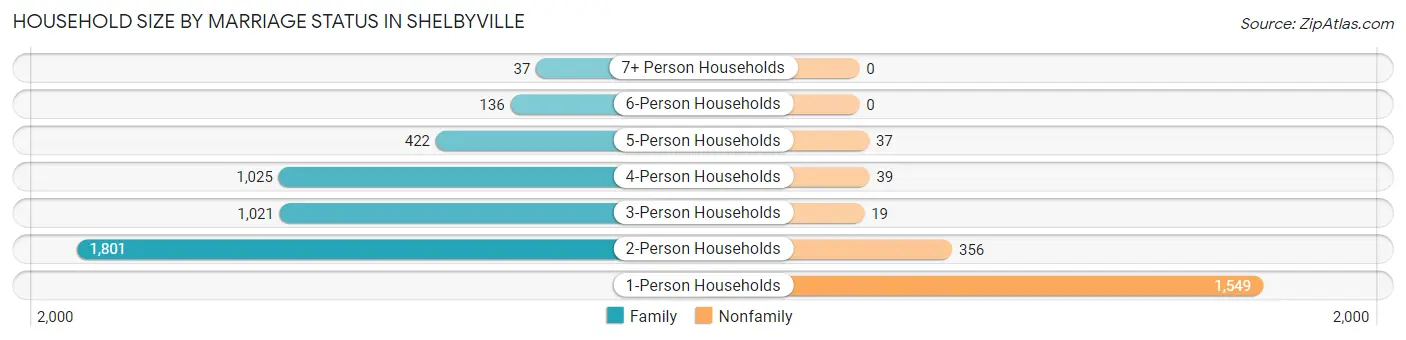
| Household Size | Family Households | Nonfamily Households |
| 1-Person Households | - | 1,549 (24.0%) |
| 2-Person Households | 1,801 (28.0%) | 356 (5.5%) |
| 3-Person Households | 1,021 (15.9%) | 19 (0.3%) |
| 4-Person Households | 1,025 (15.9%) | 39 (0.6%) |
| 5-Person Households | 422 (6.6%) | 37 (0.6%) |
| 6-Person Households | 136 (2.1%) | 0 (0.0%) |
| 7+ Person Households | 37 (0.6%) | 0 (0.0%) |
| Total | 4,442 (69.0%) | 2,000 (31.0%) |
Female Fertility in Shelbyville
Fertility by Age in Shelbyville
Average fertility rate in Shelbyville is 35.0 births per 1,000 women. Women in the age bracket of 20 to 34 years have the highest fertility rate with 77.0 births per 1,000 women. Women in the age bracket of 20 to 34 years acount for 90.8% of all women with births.
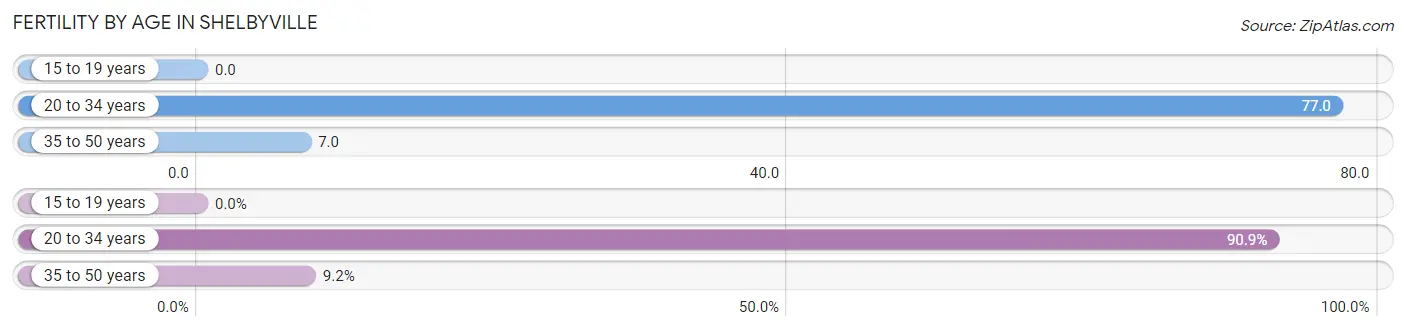
| Age Bracket | Women with Births | Births / 1,000 Women |
| 15 to 19 years | 0 (0.0%) | 0.0 |
| 20 to 34 years | 149 (90.8%) | 77.0 |
| 35 to 50 years | 15 (9.1%) | 7.0 |
| Total | 164 (100.0%) | 35.0 |
Fertility by Age by Marriage Status in Shelbyville
97.6% of women with births (164) in Shelbyville are married. The highest percentage of unmarried women with births falls into 20 to 34 years age bracket with 2.7% of them unmarried at the time of birth, while the lowest percentage of unmarried women with births belong to 35 to 50 years age bracket with 0.0% of them unmarried.
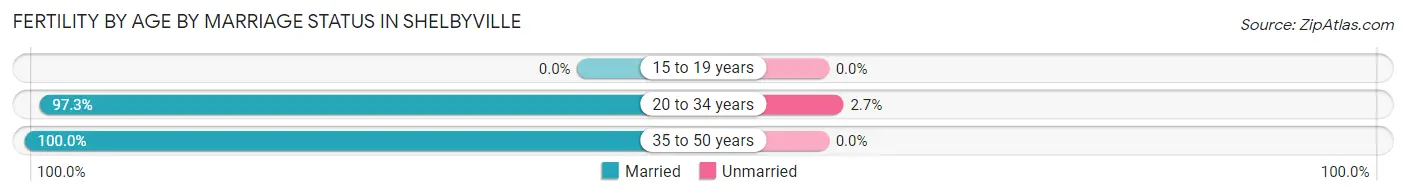
| Age Bracket | Married | Unmarried |
| 15 to 19 years | 0 (0.0%) | 0 (0.0%) |
| 20 to 34 years | 145 (97.3%) | 4 (2.7%) |
| 35 to 50 years | 15 (100.0%) | 0 (0.0%) |
| Total | 160 (97.6%) | 4 (2.4%) |
Fertility by Education in Shelbyville
Average fertility rate in Shelbyville is 35.0 births per 1,000 women. Women with the education attainment of graduate degree have the highest fertility rate of 98.0 births per 1,000 women, while women with the education attainment of bachelor's degree have the lowest fertility at 14.0 births per 1,000 women. Women with the education attainment of graduate degree represent 38.4% of all women with births.
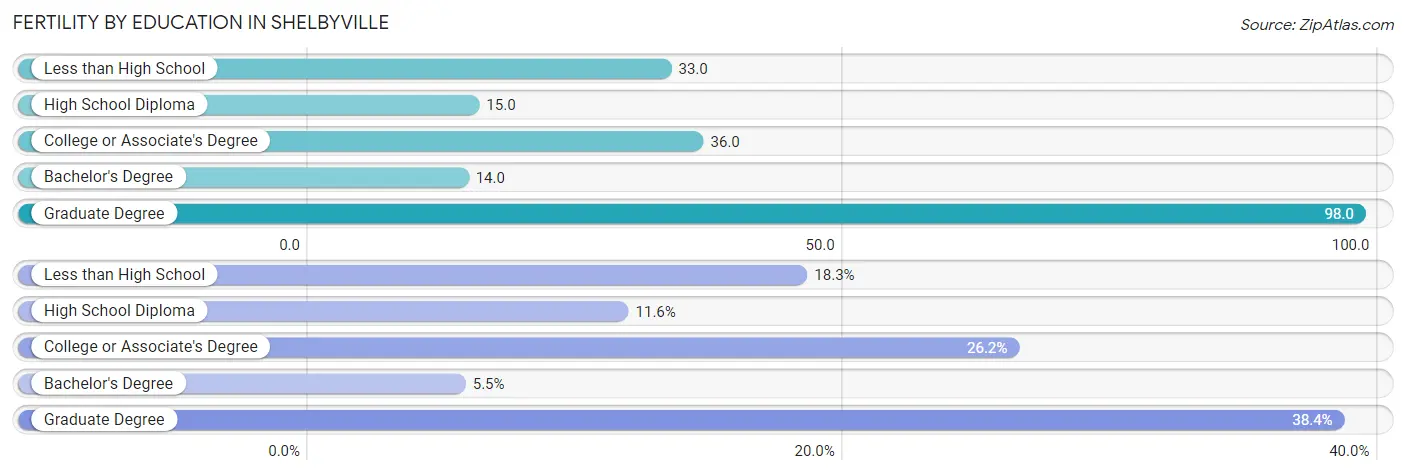
| Educational Attainment | Women with Births | Births / 1,000 Women |
| Less than High School | 30 (18.3%) | 33.0 |
| High School Diploma | 19 (11.6%) | 15.0 |
| College or Associate's Degree | 43 (26.2%) | 36.0 |
| Bachelor's Degree | 9 (5.5%) | 14.0 |
| Graduate Degree | 63 (38.4%) | 98.0 |
| Total | 164 (100.0%) | 35.0 |
Fertility by Education by Marriage Status in Shelbyville
2.4% of women with births in Shelbyville are unmarried. Women with the educational attainment of high school diploma are most likely to be married with 100.0% of them married at childbirth, while women with the educational attainment of less than high school are least likely to be married with 13.3% of them unmarried at childbirth.
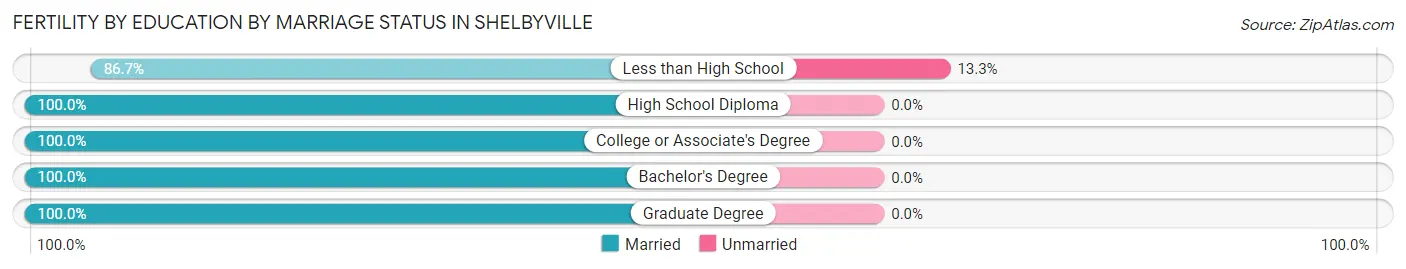
| Educational Attainment | Married | Unmarried |
| Less than High School | 26 (86.7%) | 4 (13.3%) |
| High School Diploma | 19 (100.0%) | 0 (0.0%) |
| College or Associate's Degree | 43 (100.0%) | 0 (0.0%) |
| Bachelor's Degree | 9 (100.0%) | 0 (0.0%) |
| Graduate Degree | 63 (100.0%) | 0 (0.0%) |
| Total | 160 (97.6%) | 4 (2.4%) |
Employment Characteristics in Shelbyville
Employment by Class of Employer in Shelbyville
Among the 8,888 employed individuals in Shelbyville, private company employees (6,941 | 78.1%), not-for-profit organizations (524 | 5.9%), and local government employees (454 | 5.1%) make up the most common classes of employment.
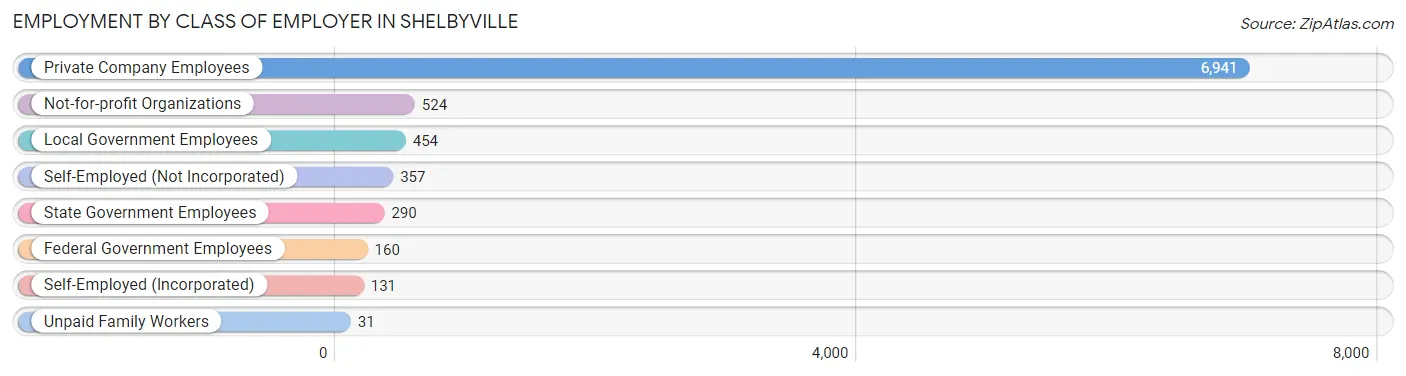
| Employer Class | # Employees | % Employees |
| Private Company Employees | 6,941 | 78.1% |
| Self-Employed (Incorporated) | 131 | 1.5% |
| Self-Employed (Not Incorporated) | 357 | 4.0% |
| Not-for-profit Organizations | 524 | 5.9% |
| Local Government Employees | 454 | 5.1% |
| State Government Employees | 290 | 3.3% |
| Federal Government Employees | 160 | 1.8% |
| Unpaid Family Workers | 31 | 0.4% |
| Total | 8,888 | 100.0% |
Employment Status by Age in Shelbyville
According to the labor force statistics for Shelbyville, out of the total population over 16 years of age (13,562), 69.2% or 9,385 individuals are in the labor force, with 2.9% or 272 of them unemployed. The age group with the highest labor force participation rate is 20 to 24 years, with 92.5% or 1,273 individuals in the labor force. Within the labor force, the 16 to 19 years age range has the highest percentage of unemployed individuals, with 14.8% or 35 of them being unemployed.
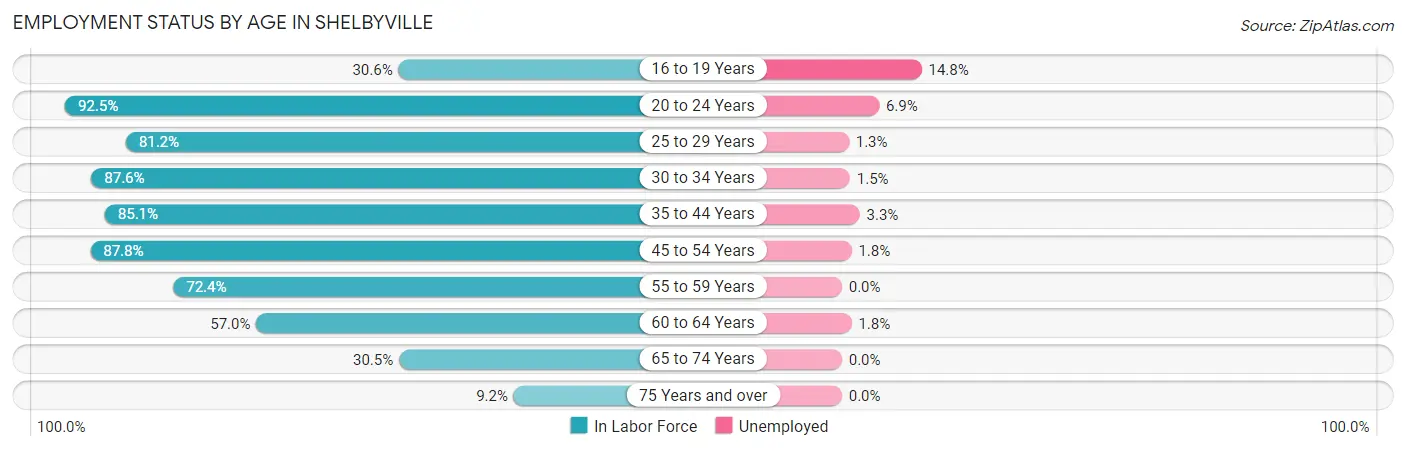
| Age Bracket | In Labor Force | Unemployed |
| 16 to 19 Years | 236 (30.6%) | 35 (14.8%) |
| 20 to 24 Years | 1,273 (92.5%) | 88 (6.9%) |
| 25 to 29 Years | 782 (81.2%) | 10 (1.3%) |
| 30 to 34 Years | 1,007 (87.6%) | 15 (1.5%) |
| 35 to 44 Years | 2,230 (85.1%) | 74 (3.3%) |
| 45 to 54 Years | 2,019 (87.8%) | 36 (1.8%) |
| 55 to 59 Years | 767 (72.4%) | 0 (0.0%) |
| 60 to 64 Years | 509 (57.0%) | 9 (1.8%) |
| 65 to 74 Years | 487 (30.5%) | 0 (0.0%) |
| 75 Years and over | 77 (9.2%) | 0 (0.0%) |
| Total | 9,385 (69.2%) | 272 (2.9%) |
Employment Status by Educational Attainment in Shelbyville
According to labor force statistics for Shelbyville, 81.4% of individuals (7,313) out of the total population between 25 and 64 years of age (8,984) are in the labor force, with 2.0% or 146 of them being unemployed. The group with the highest labor force participation rate are those with the educational attainment of bachelor's degree or higher, with 91.7% or 2,233 individuals in the labor force. Within the labor force, individuals with high school diploma education have the highest percentage of unemployment, with 3.3% or 73 of them being unemployed.
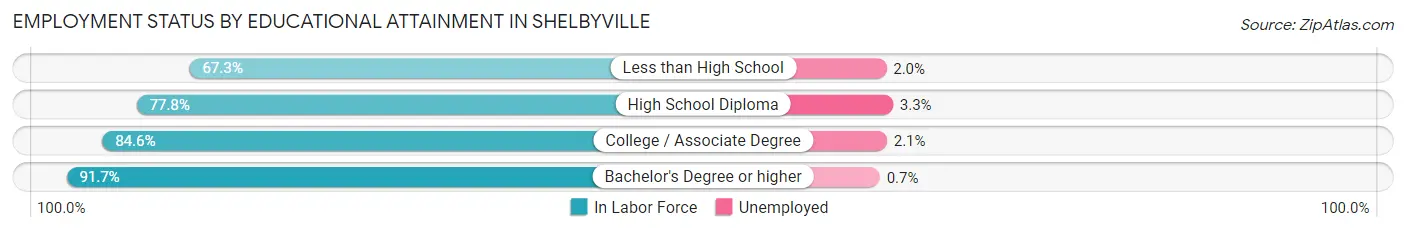
| Educational Attainment | In Labor Force | Unemployed |
| Less than High School | 1,042 (67.3%) | 31 (2.0%) |
| High School Diploma | 2,199 (77.8%) | 93 (3.3%) |
| College / Associate Degree | 1,839 (84.6%) | 46 (2.1%) |
| Bachelor's Degree or higher | 2,233 (91.7%) | 17 (0.7%) |
| Total | 7,313 (81.4%) | 180 (2.0%) |
Employment Occupations by Sex in Shelbyville
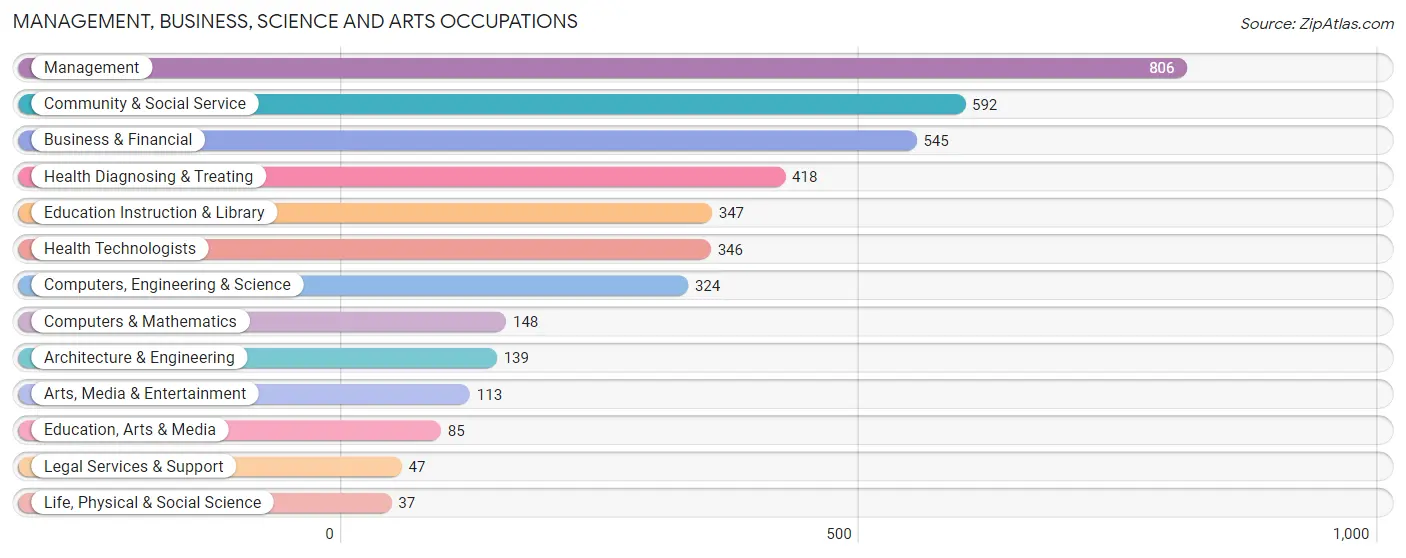
Management, Business, Science and Arts Occupations
The most common Management, Business, Science and Arts occupations in Shelbyville are Management (806 | 8.9%), Community & Social Service (592 | 6.5%), Business & Financial (545 | 6.0%), Health Diagnosing & Treating (418 | 4.6%), and Education Instruction & Library (347 | 3.8%).
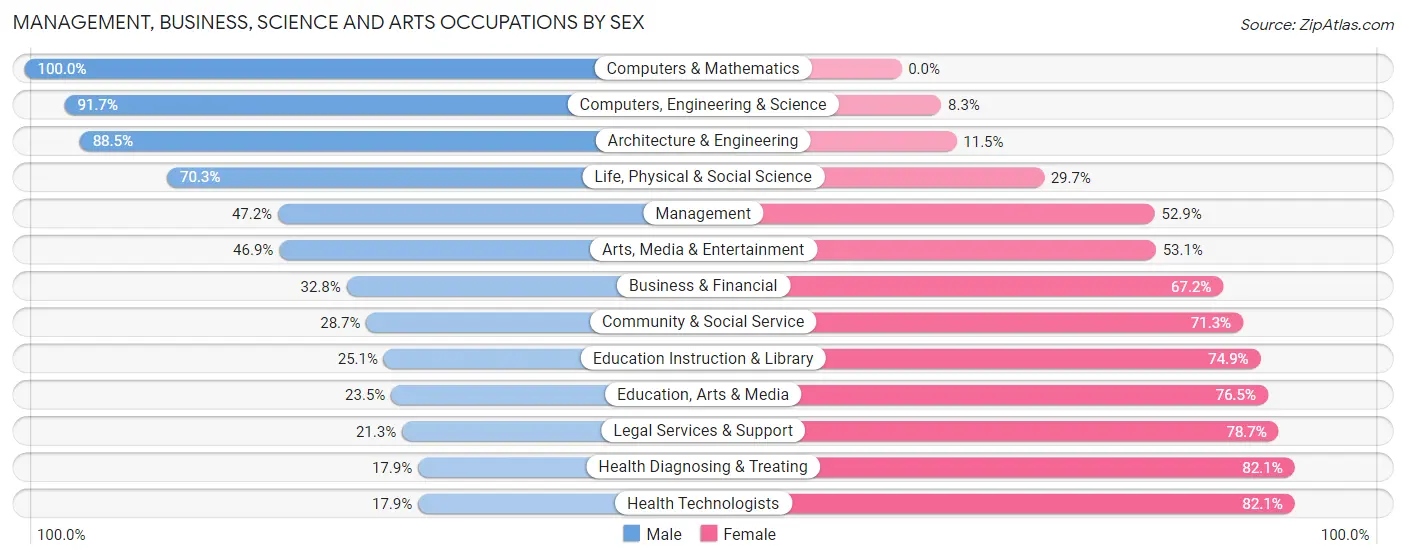
Management, Business, Science and Arts Occupations by Sex
Within the Management, Business, Science and Arts occupations in Shelbyville, the most male-oriented occupations are Computers & Mathematics (100.0%), Computers, Engineering & Science (91.7%), and Architecture & Engineering (88.5%), while the most female-oriented occupations are Health Technologists (82.1%), Health Diagnosing & Treating (82.1%), and Legal Services & Support (78.7%).
| Occupation | Male | Female |
| Management | 380 (47.1%) | 426 (52.8%) |
| Business & Financial | 179 (32.8%) | 366 (67.2%) |
| Computers, Engineering & Science | 297 (91.7%) | 27 (8.3%) |
| Computers & Mathematics | 148 (100.0%) | 0 (0.0%) |
| Architecture & Engineering | 123 (88.5%) | 16 (11.5%) |
| Life, Physical & Social Science | 26 (70.3%) | 11 (29.7%) |
| Community & Social Service | 170 (28.7%) | 422 (71.3%) |
| Education, Arts & Media | 20 (23.5%) | 65 (76.5%) |
| Legal Services & Support | 10 (21.3%) | 37 (78.7%) |
| Education Instruction & Library | 87 (25.1%) | 260 (74.9%) |
| Arts, Media & Entertainment | 53 (46.9%) | 60 (53.1%) |
| Health Diagnosing & Treating | 75 (17.9%) | 343 (82.1%) |
| Health Technologists | 62 (17.9%) | 284 (82.1%) |
| Total (Category) | 1,101 (41.0%) | 1,584 (59.0%) |
| Total (Overall) | 4,547 (50.1%) | 4,519 (49.8%) |
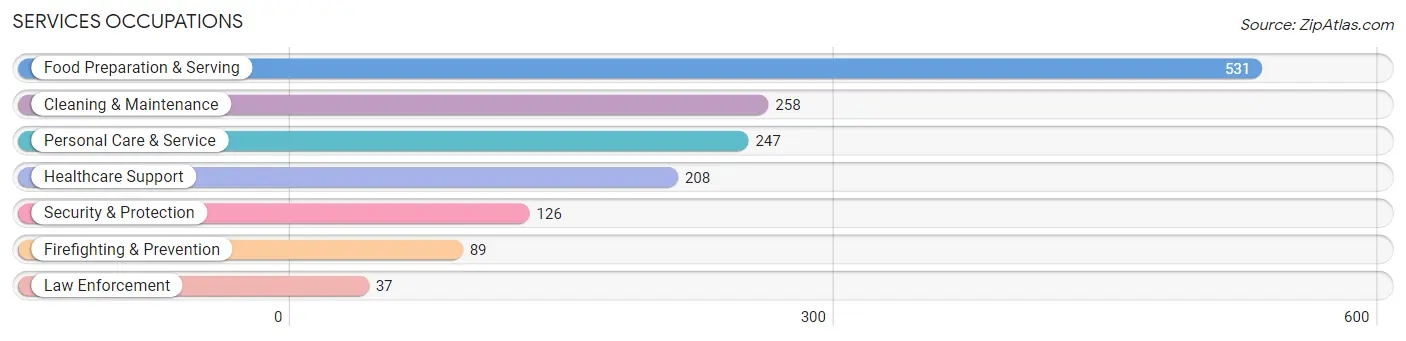
Services Occupations
The most common Services occupations in Shelbyville are Food Preparation & Serving (531 | 5.9%), Cleaning & Maintenance (258 | 2.9%), Personal Care & Service (247 | 2.7%), Healthcare Support (208 | 2.3%), and Security & Protection (126 | 1.4%).
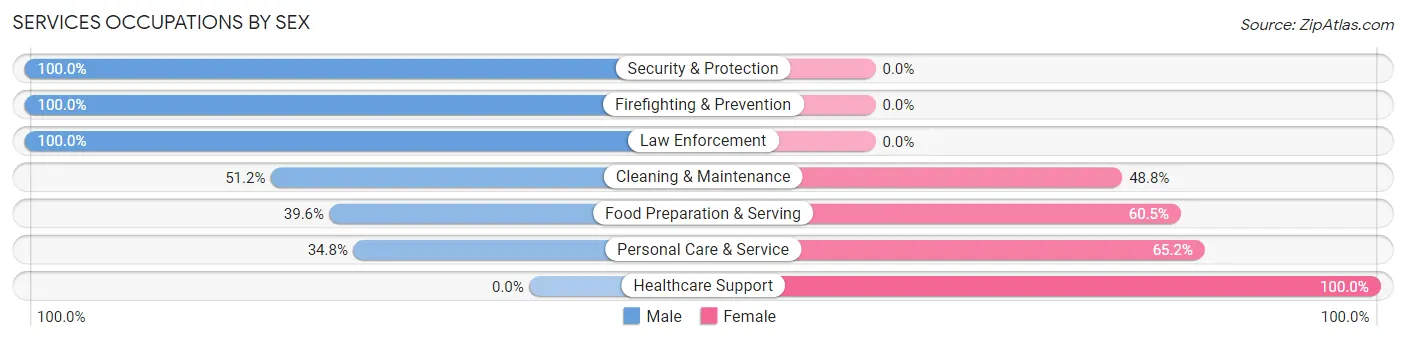
Services Occupations by Sex
Within the Services occupations in Shelbyville, the most male-oriented occupations are Security & Protection (100.0%), Firefighting & Prevention (100.0%), and Law Enforcement (100.0%), while the most female-oriented occupations are Healthcare Support (100.0%), Personal Care & Service (65.2%), and Food Preparation & Serving (60.5%).
| Occupation | Male | Female |
| Healthcare Support | 0 (0.0%) | 208 (100.0%) |
| Security & Protection | 126 (100.0%) | 0 (0.0%) |
| Firefighting & Prevention | 89 (100.0%) | 0 (0.0%) |
| Law Enforcement | 37 (100.0%) | 0 (0.0%) |
| Food Preparation & Serving | 210 (39.6%) | 321 (60.5%) |
| Cleaning & Maintenance | 132 (51.2%) | 126 (48.8%) |
| Personal Care & Service | 86 (34.8%) | 161 (65.2%) |
| Total (Category) | 554 (40.4%) | 816 (59.6%) |
| Total (Overall) | 4,547 (50.1%) | 4,519 (49.8%) |
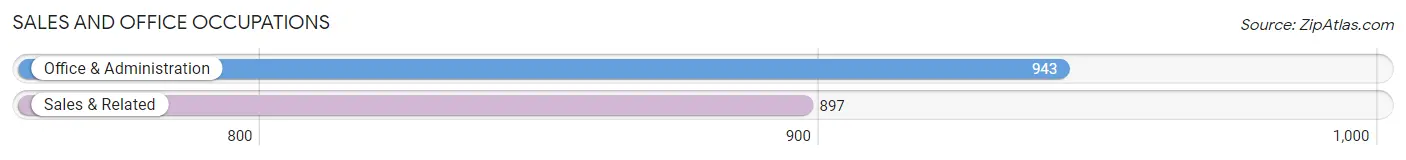
Sales and Office Occupations
The most common Sales and Office occupations in Shelbyville are Office & Administration (943 | 10.4%), and Sales & Related (897 | 9.9%).
Sales and Office Occupations by Sex
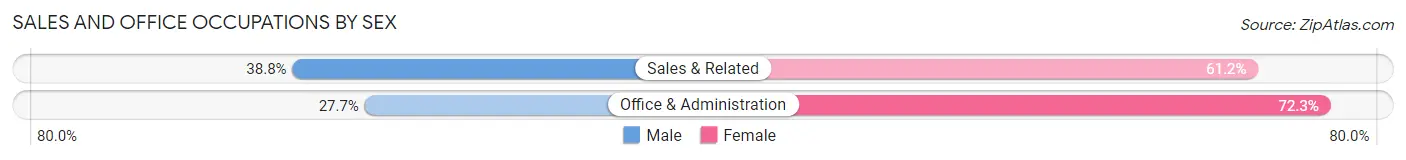
| Occupation | Male | Female |
| Sales & Related | 348 (38.8%) | 549 (61.2%) |
| Office & Administration | 261 (27.7%) | 682 (72.3%) |
| Total (Category) | 609 (33.1%) | 1,231 (66.9%) |
| Total (Overall) | 4,547 (50.1%) | 4,519 (49.8%) |
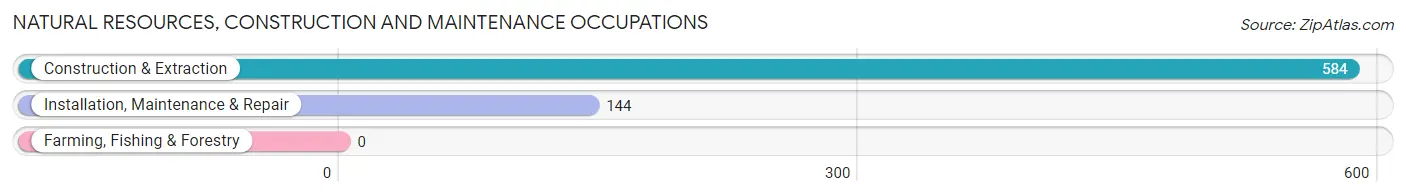
Natural Resources, Construction and Maintenance Occupations
The most common Natural Resources, Construction and Maintenance occupations in Shelbyville are Construction & Extraction (584 | 6.4%), and Installation, Maintenance & Repair (144 | 1.6%).
Natural Resources, Construction and Maintenance Occupations by Sex
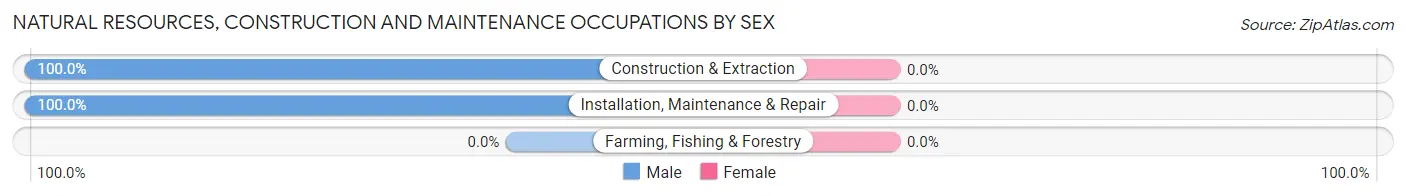
| Occupation | Male | Female |
| Farming, Fishing & Forestry | 0 (0.0%) | 0 (0.0%) |
| Construction & Extraction | 584 (100.0%) | 0 (0.0%) |
| Installation, Maintenance & Repair | 144 (100.0%) | 0 (0.0%) |
| Total (Category) | 728 (100.0%) | 0 (0.0%) |
| Total (Overall) | 4,547 (50.1%) | 4,519 (49.8%) |
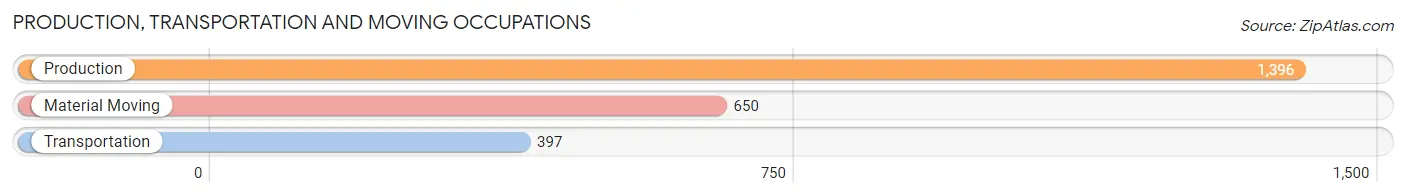
Production, Transportation and Moving Occupations
The most common Production, Transportation and Moving occupations in Shelbyville are Production (1,396 | 15.4%), Material Moving (650 | 7.2%), and Transportation (397 | 4.4%).
Production, Transportation and Moving Occupations by Sex
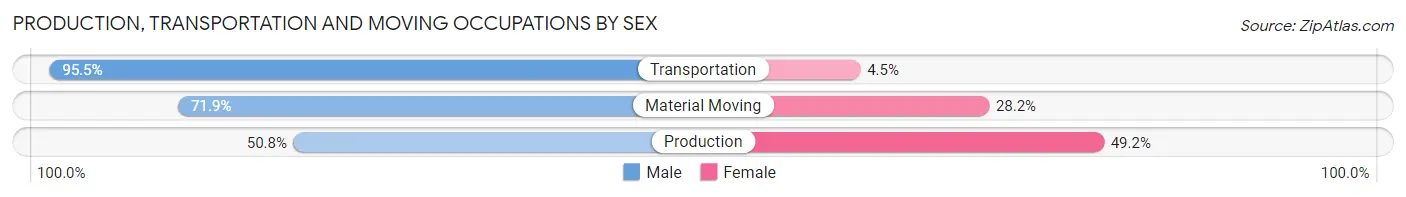
| Occupation | Male | Female |
| Production | 709 (50.8%) | 687 (49.2%) |
| Transportation | 379 (95.5%) | 18 (4.5%) |
| Material Moving | 467 (71.9%) | 183 (28.1%) |
| Total (Category) | 1,555 (63.6%) | 888 (36.3%) |
| Total (Overall) | 4,547 (50.1%) | 4,519 (49.8%) |
Employment Industries by Sex in Shelbyville
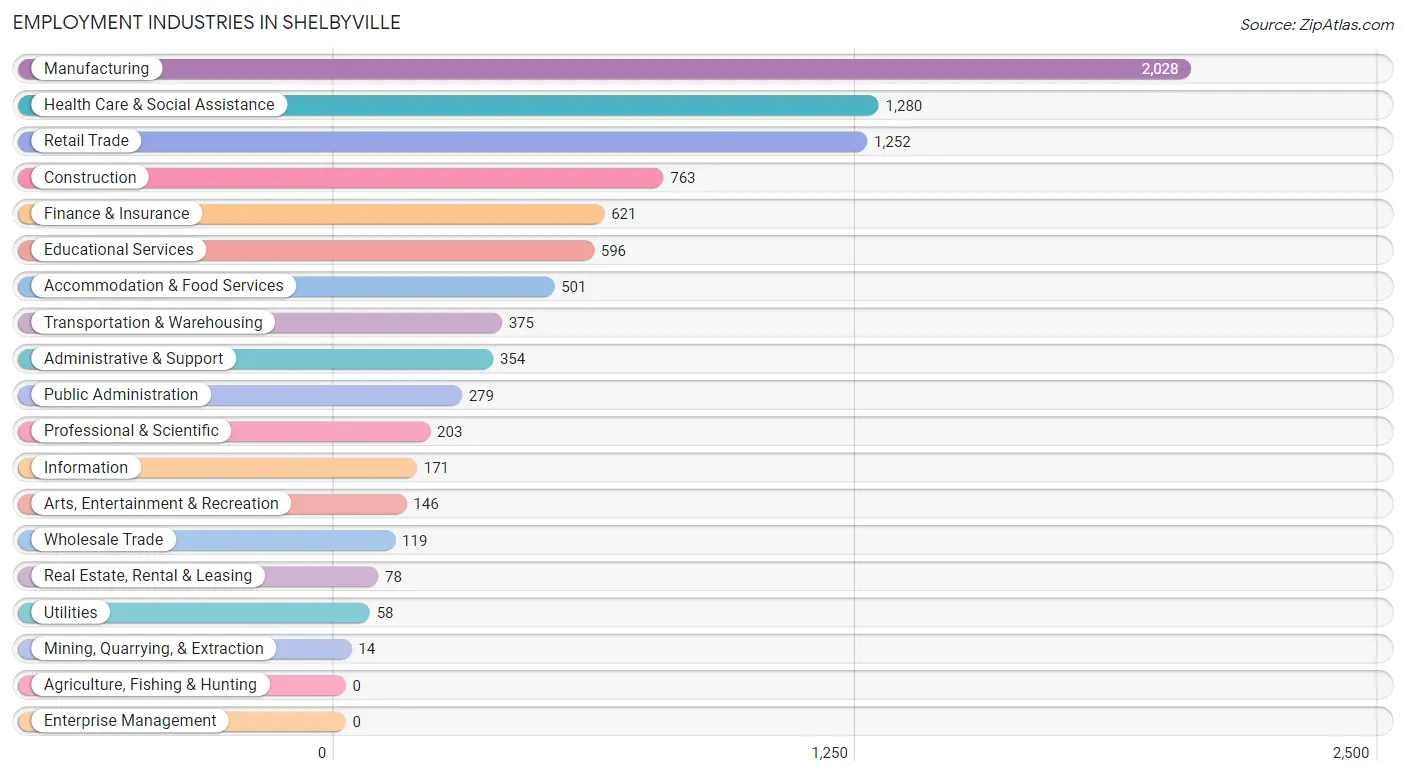
Employment Industries in Shelbyville
The major employment industries in Shelbyville include Manufacturing (2,028 | 22.4%), Health Care & Social Assistance (1,280 | 14.1%), Retail Trade (1,252 | 13.8%), Construction (763 | 8.4%), and Finance & Insurance (621 | 6.9%).
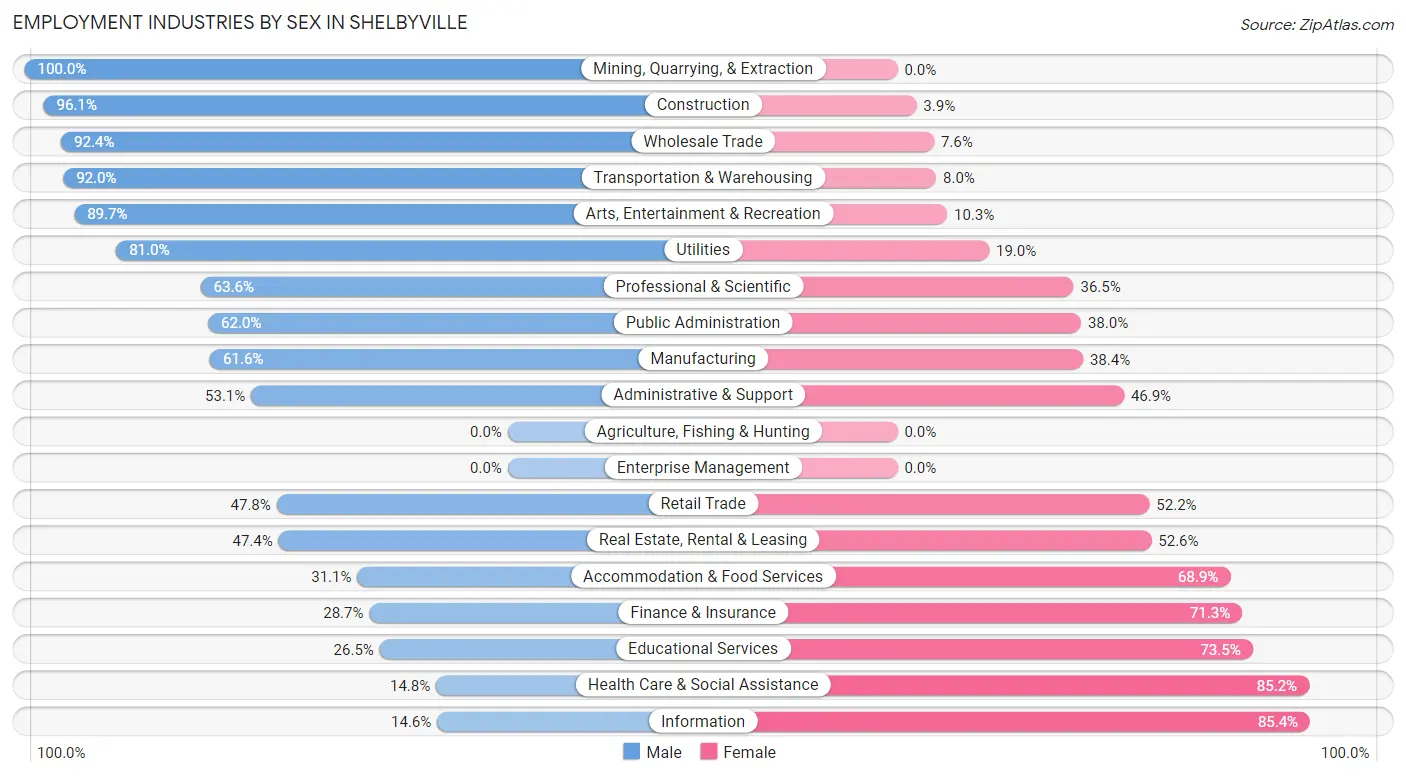
Employment Industries by Sex in Shelbyville
The Shelbyville industries that see more men than women are Mining, Quarrying, & Extraction (100.0%), Construction (96.1%), and Wholesale Trade (92.4%), whereas the industries that tend to have a higher number of women are Information (85.4%), Health Care & Social Assistance (85.2%), and Educational Services (73.5%).
| Industry | Male | Female |
| Agriculture, Fishing & Hunting | 0 (0.0%) | 0 (0.0%) |
| Mining, Quarrying, & Extraction | 14 (100.0%) | 0 (0.0%) |
| Construction | 733 (96.1%) | 30 (3.9%) |
| Manufacturing | 1,249 (61.6%) | 779 (38.4%) |
| Wholesale Trade | 110 (92.4%) | 9 (7.6%) |
| Retail Trade | 599 (47.8%) | 653 (52.2%) |
| Transportation & Warehousing | 345 (92.0%) | 30 (8.0%) |
| Utilities | 47 (81.0%) | 11 (19.0%) |
| Information | 25 (14.6%) | 146 (85.4%) |
| Finance & Insurance | 178 (28.7%) | 443 (71.3%) |
| Real Estate, Rental & Leasing | 37 (47.4%) | 41 (52.6%) |
| Professional & Scientific | 129 (63.5%) | 74 (36.4%) |
| Enterprise Management | 0 (0.0%) | 0 (0.0%) |
| Administrative & Support | 188 (53.1%) | 166 (46.9%) |
| Educational Services | 158 (26.5%) | 438 (73.5%) |
| Health Care & Social Assistance | 190 (14.8%) | 1,090 (85.2%) |
| Arts, Entertainment & Recreation | 131 (89.7%) | 15 (10.3%) |
| Accommodation & Food Services | 156 (31.1%) | 345 (68.9%) |
| Public Administration | 173 (62.0%) | 106 (38.0%) |
| Total | 4,547 (50.1%) | 4,519 (49.8%) |
Education in Shelbyville
School Enrollment in Shelbyville
The most common levels of schooling among the 4,152 students in Shelbyville are elementary school (875 | 21.1%), high school (872 | 21.0%), and middle school (869 | 20.9%).
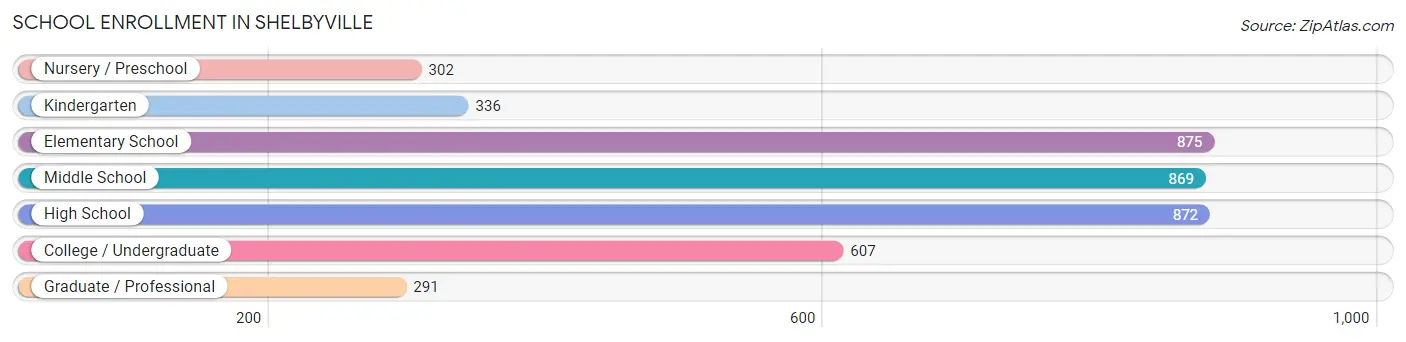
| School Level | # Students | % Students |
| Nursery / Preschool | 302 | 7.3% |
| Kindergarten | 336 | 8.1% |
| Elementary School | 875 | 21.1% |
| Middle School | 869 | 20.9% |
| High School | 872 | 21.0% |
| College / Undergraduate | 607 | 14.6% |
| Graduate / Professional | 291 | 7.0% |
| Total | 4,152 | 100.0% |
School Enrollment by Age by Funding Source in Shelbyville
Out of a total of 4,152 students who are enrolled in schools in Shelbyville, 1,030 (24.8%) attend a private institution, while the remaining 3,122 (75.2%) are enrolled in public schools. The age group of 35 years and over has the highest likelihood of being enrolled in private schools, with 106 (54.6% in the age bracket) enrolled. Conversely, the age group of 18 to 19 year olds has the lowest likelihood of being enrolled in a private school, with 121 (89.0% in the age bracket) attending a public institution.
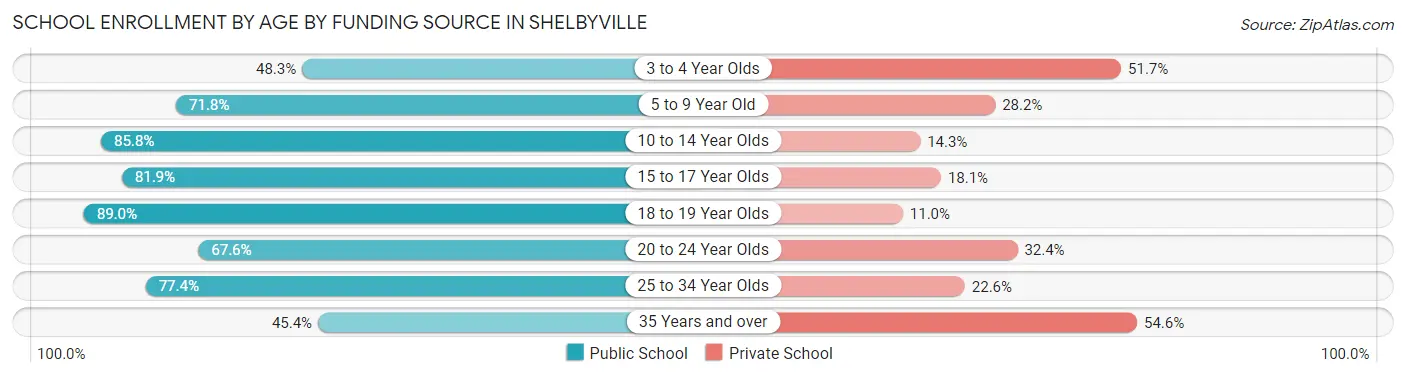
| Age Bracket | Public School | Private School |
| 3 to 4 Year Olds | 115 (48.3%) | 123 (51.7%) |
| 5 to 9 Year Old | 786 (71.8%) | 309 (28.2%) |
| 10 to 14 Year Olds | 1,017 (85.8%) | 169 (14.2%) |
| 15 to 17 Year Olds | 515 (81.9%) | 114 (18.1%) |
| 18 to 19 Year Olds | 121 (89.0%) | 15 (11.0%) |
| 20 to 24 Year Olds | 282 (67.6%) | 135 (32.4%) |
| 25 to 34 Year Olds | 199 (77.4%) | 58 (22.6%) |
| 35 Years and over | 88 (45.4%) | 106 (54.6%) |
| Total | 3,122 (75.2%) | 1,030 (24.8%) |
Educational Attainment by Field of Study in Shelbyville
Business (776 | 24.5%), education (452 | 14.3%), science & technology (341 | 10.8%), arts & humanities (284 | 9.0%), and bio, nature & agricultural (233 | 7.4%) are the most common fields of study among 3,161 individuals in Shelbyville who have obtained a bachelor's degree or higher.
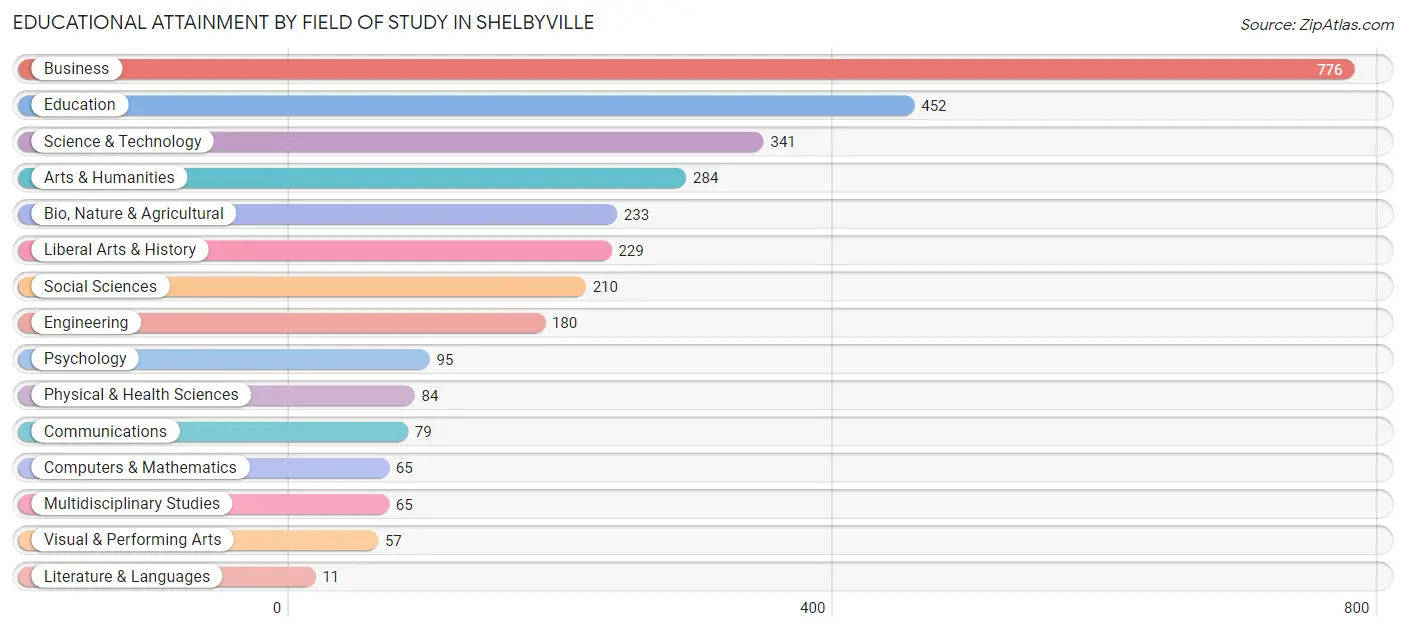
| Field of Study | # Graduates | % Graduates |
| Computers & Mathematics | 65 | 2.1% |
| Bio, Nature & Agricultural | 233 | 7.4% |
| Physical & Health Sciences | 84 | 2.7% |
| Psychology | 95 | 3.0% |
| Social Sciences | 210 | 6.6% |
| Engineering | 180 | 5.7% |
| Multidisciplinary Studies | 65 | 2.1% |
| Science & Technology | 341 | 10.8% |
| Business | 776 | 24.5% |
| Education | 452 | 14.3% |
| Literature & Languages | 11 | 0.4% |
| Liberal Arts & History | 229 | 7.2% |
| Visual & Performing Arts | 57 | 1.8% |
| Communications | 79 | 2.5% |
| Arts & Humanities | 284 | 9.0% |
| Total | 3,161 | 100.0% |
Transportation & Commute in Shelbyville
Vehicle Availability by Sex in Shelbyville
The most prevalent vehicle ownership categories in Shelbyville are males with 2 vehicles (2,336, accounting for 53.3%) and females with 2 vehicles (2,110, making up 52.1%).
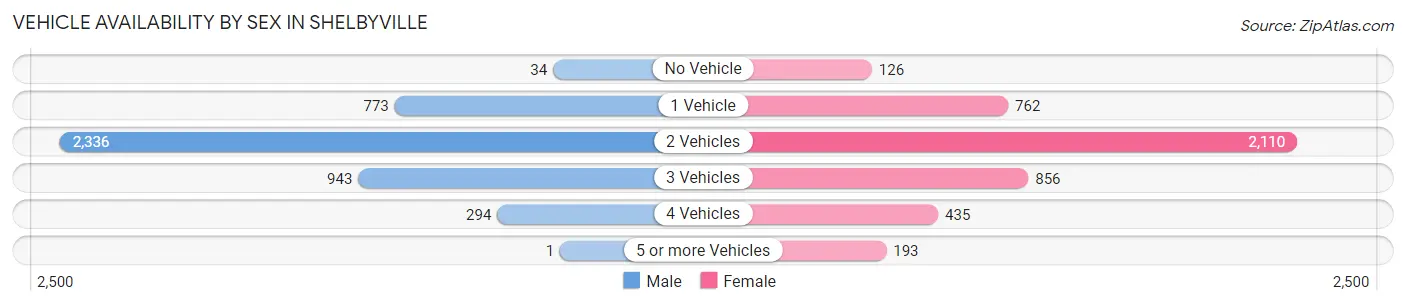
| Vehicles Available | Male | Female |
| No Vehicle | 34 (0.8%) | 126 (2.8%) |
| 1 Vehicle | 773 (17.6%) | 762 (17.0%) |
| 2 Vehicles | 2,336 (53.3%) | 2,110 (47.1%) |
| 3 Vehicles | 943 (21.5%) | 856 (19.1%) |
| 4 Vehicles | 294 (6.7%) | 435 (9.7%) |
| 5 or more Vehicles | 1 (0.0%) | 193 (4.3%) |
| Total | 4,381 (100.0%) | 4,482 (100.0%) |
Commute Time in Shelbyville
The most frequently occuring commute durations in Shelbyville are 15 to 19 minutes (1,242 commuters, 15.1%), 10 to 14 minutes (1,228 commuters, 14.9%), and 5 to 9 minutes (1,206 commuters, 14.6%).
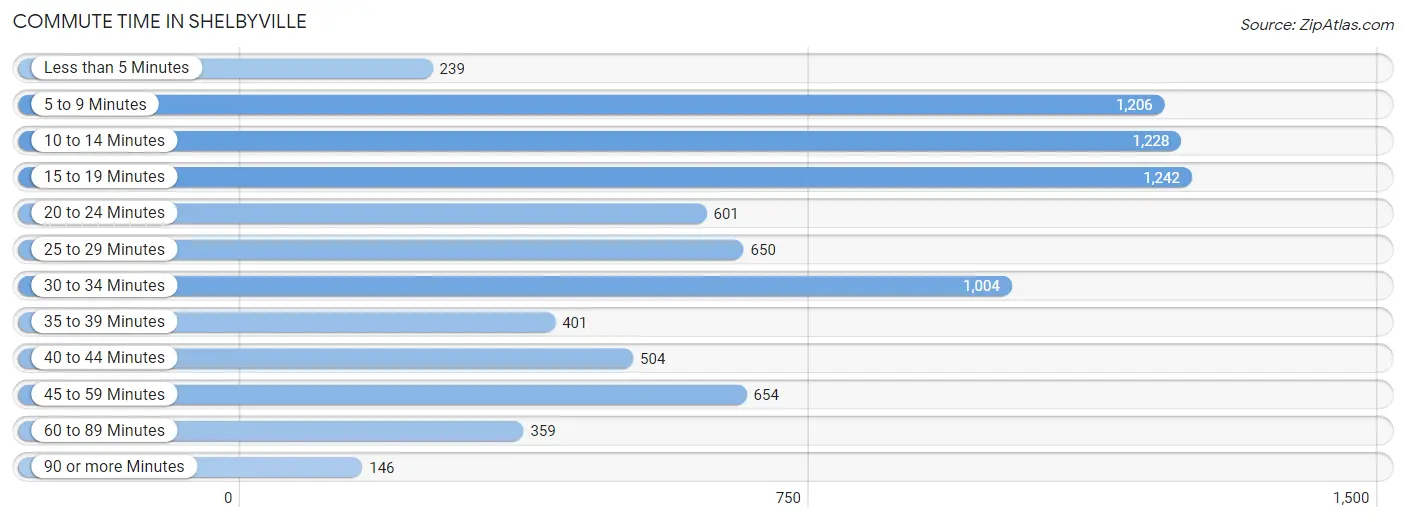
| Commute Time | # Commuters | % Commuters |
| Less than 5 Minutes | 239 | 2.9% |
| 5 to 9 Minutes | 1,206 | 14.6% |
| 10 to 14 Minutes | 1,228 | 14.9% |
| 15 to 19 Minutes | 1,242 | 15.1% |
| 20 to 24 Minutes | 601 | 7.3% |
| 25 to 29 Minutes | 650 | 7.9% |
| 30 to 34 Minutes | 1,004 | 12.2% |
| 35 to 39 Minutes | 401 | 4.9% |
| 40 to 44 Minutes | 504 | 6.1% |
| 45 to 59 Minutes | 654 | 7.9% |
| 60 to 89 Minutes | 359 | 4.4% |
| 90 or more Minutes | 146 | 1.8% |
Commute Time by Sex in Shelbyville
The most common commute times in Shelbyville are 15 to 19 minutes (766 commuters, 18.6%) for males and 5 to 9 minutes (648 commuters, 15.7%) for females.
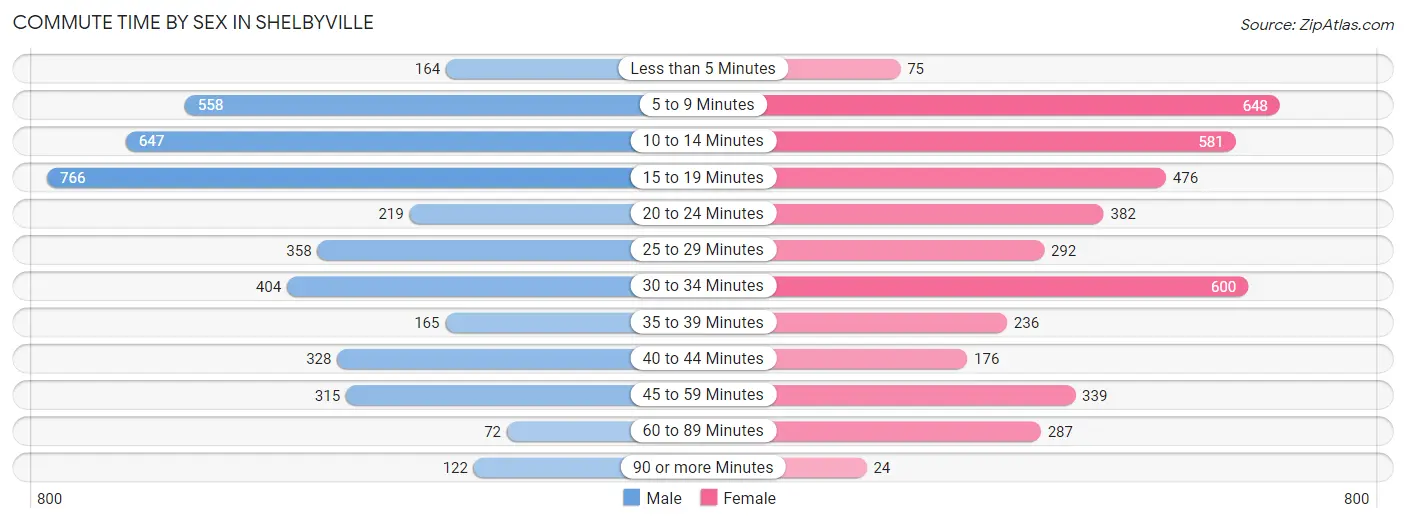
| Commute Time | Male | Female |
| Less than 5 Minutes | 164 (4.0%) | 75 (1.8%) |
| 5 to 9 Minutes | 558 (13.6%) | 648 (15.7%) |
| 10 to 14 Minutes | 647 (15.7%) | 581 (14.1%) |
| 15 to 19 Minutes | 766 (18.6%) | 476 (11.6%) |
| 20 to 24 Minutes | 219 (5.3%) | 382 (9.3%) |
| 25 to 29 Minutes | 358 (8.7%) | 292 (7.1%) |
| 30 to 34 Minutes | 404 (9.8%) | 600 (14.6%) |
| 35 to 39 Minutes | 165 (4.0%) | 236 (5.7%) |
| 40 to 44 Minutes | 328 (8.0%) | 176 (4.3%) |
| 45 to 59 Minutes | 315 (7.6%) | 339 (8.2%) |
| 60 to 89 Minutes | 72 (1.8%) | 287 (7.0%) |
| 90 or more Minutes | 122 (3.0%) | 24 (0.6%) |
Time of Departure to Work by Sex in Shelbyville
The most frequent times of departure to work in Shelbyville are 4:00 PM to 11:59 PM (620, 15.1%) for males and 7:00 AM to 7:29 AM (743, 18.0%) for females.
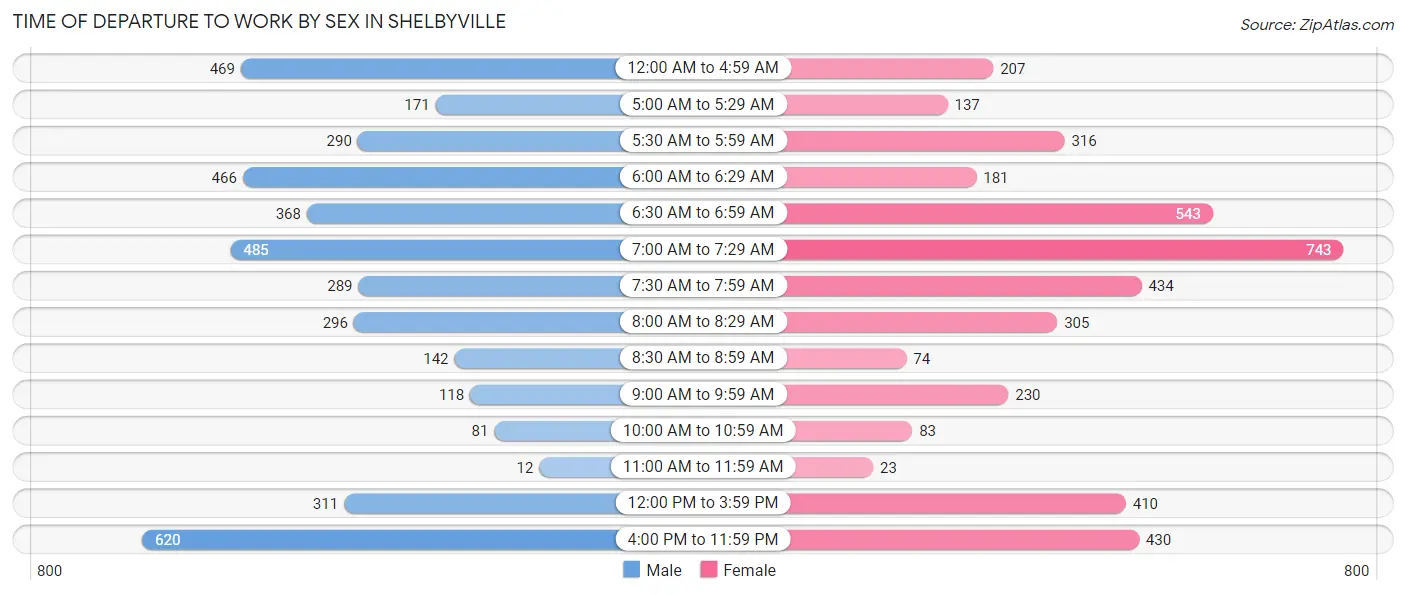
| Time of Departure | Male | Female |
| 12:00 AM to 4:59 AM | 469 (11.4%) | 207 (5.0%) |
| 5:00 AM to 5:29 AM | 171 (4.2%) | 137 (3.3%) |
| 5:30 AM to 5:59 AM | 290 (7.0%) | 316 (7.7%) |
| 6:00 AM to 6:29 AM | 466 (11.3%) | 181 (4.4%) |
| 6:30 AM to 6:59 AM | 368 (8.9%) | 543 (13.2%) |
| 7:00 AM to 7:29 AM | 485 (11.8%) | 743 (18.0%) |
| 7:30 AM to 7:59 AM | 289 (7.0%) | 434 (10.5%) |
| 8:00 AM to 8:29 AM | 296 (7.2%) | 305 (7.4%) |
| 8:30 AM to 8:59 AM | 142 (3.5%) | 74 (1.8%) |
| 9:00 AM to 9:59 AM | 118 (2.9%) | 230 (5.6%) |
| 10:00 AM to 10:59 AM | 81 (2.0%) | 83 (2.0%) |
| 11:00 AM to 11:59 AM | 12 (0.3%) | 23 (0.6%) |
| 12:00 PM to 3:59 PM | 311 (7.5%) | 410 (10.0%) |
| 4:00 PM to 11:59 PM | 620 (15.1%) | 430 (10.4%) |
| Total | 4,118 (100.0%) | 4,116 (100.0%) |
Housing Occupancy in Shelbyville
Occupancy by Ownership in Shelbyville
Of the total 6,442 dwellings in Shelbyville, owner-occupied units account for 3,551 (55.1%), while renter-occupied units make up 2,891 (44.9%).
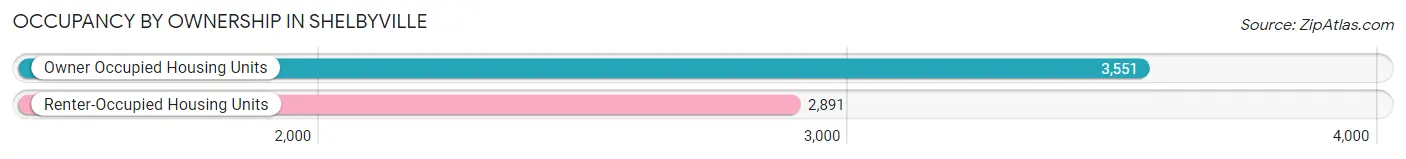
| Occupancy | # Housing Units | % Housing Units |
| Owner Occupied Housing Units | 3,551 | 55.1% |
| Renter-Occupied Housing Units | 2,891 | 44.9% |
| Total Occupied Housing Units | 6,442 | 100.0% |
Occupancy by Household Size in Shelbyville
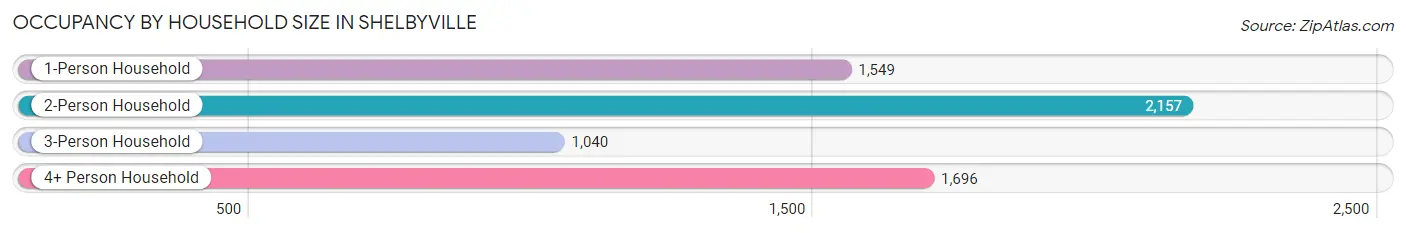
| Household Size | # Housing Units | % Housing Units |
| 1-Person Household | 1,549 | 24.0% |
| 2-Person Household | 2,157 | 33.5% |
| 3-Person Household | 1,040 | 16.1% |
| 4+ Person Household | 1,696 | 26.3% |
| Total Housing Units | 6,442 | 100.0% |
Occupancy by Ownership by Household Size in Shelbyville
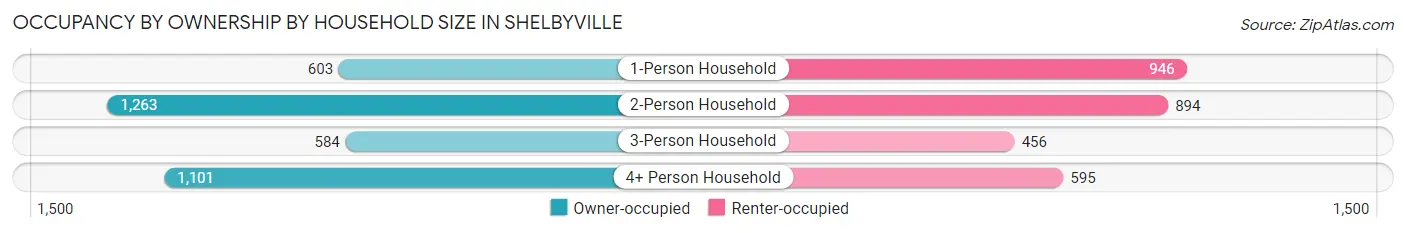
| Household Size | Owner-occupied | Renter-occupied |
| 1-Person Household | 603 (38.9%) | 946 (61.1%) |
| 2-Person Household | 1,263 (58.6%) | 894 (41.4%) |
| 3-Person Household | 584 (56.1%) | 456 (43.9%) |
| 4+ Person Household | 1,101 (64.9%) | 595 (35.1%) |
| Total Housing Units | 3,551 (55.1%) | 2,891 (44.9%) |
Occupancy by Educational Attainment in Shelbyville
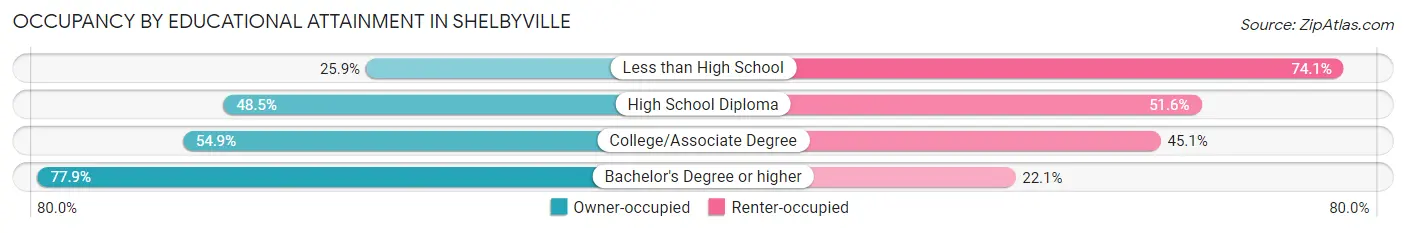
| Household Size | Owner-occupied | Renter-occupied |
| Less than High School | 255 (25.9%) | 731 (74.1%) |
| High School Diploma | 924 (48.4%) | 983 (51.5%) |
| College/Associate Degree | 938 (54.9%) | 771 (45.1%) |
| Bachelor's Degree or higher | 1,434 (77.9%) | 406 (22.1%) |
Occupancy by Age of Householder in Shelbyville
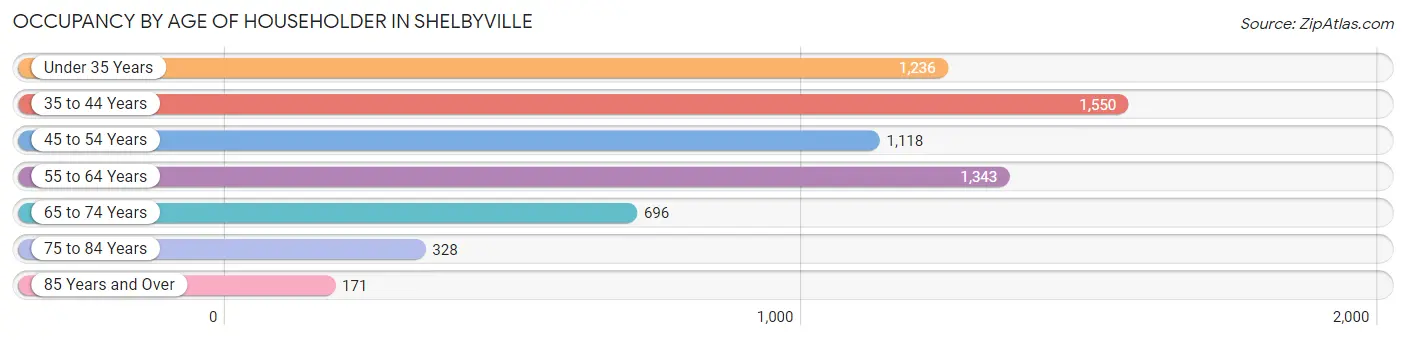
| Age Bracket | # Households | % Households |
| Under 35 Years | 1,236 | 19.2% |
| 35 to 44 Years | 1,550 | 24.1% |
| 45 to 54 Years | 1,118 | 17.3% |
| 55 to 64 Years | 1,343 | 20.8% |
| 65 to 74 Years | 696 | 10.8% |
| 75 to 84 Years | 328 | 5.1% |
| 85 Years and Over | 171 | 2.6% |
| Total | 6,442 | 100.0% |
Housing Finances in Shelbyville
Median Income by Occupancy in Shelbyville
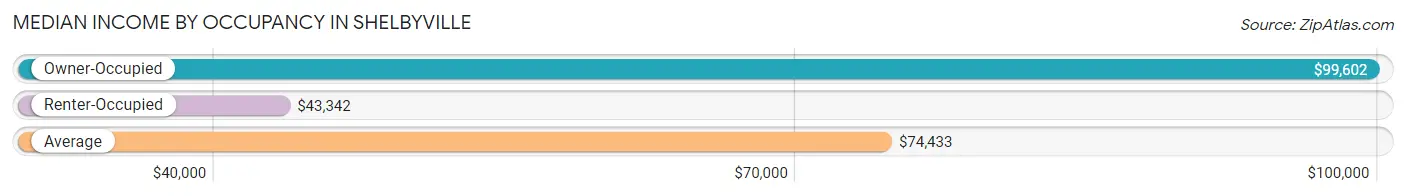
| Occupancy Type | # Households | Median Income |
| Owner-Occupied | 3,551 (55.1%) | $99,602 |
| Renter-Occupied | 2,891 (44.9%) | $43,342 |
| Average | 6,442 (100.0%) | $74,433 |
Occupancy by Householder Income Bracket in Shelbyville
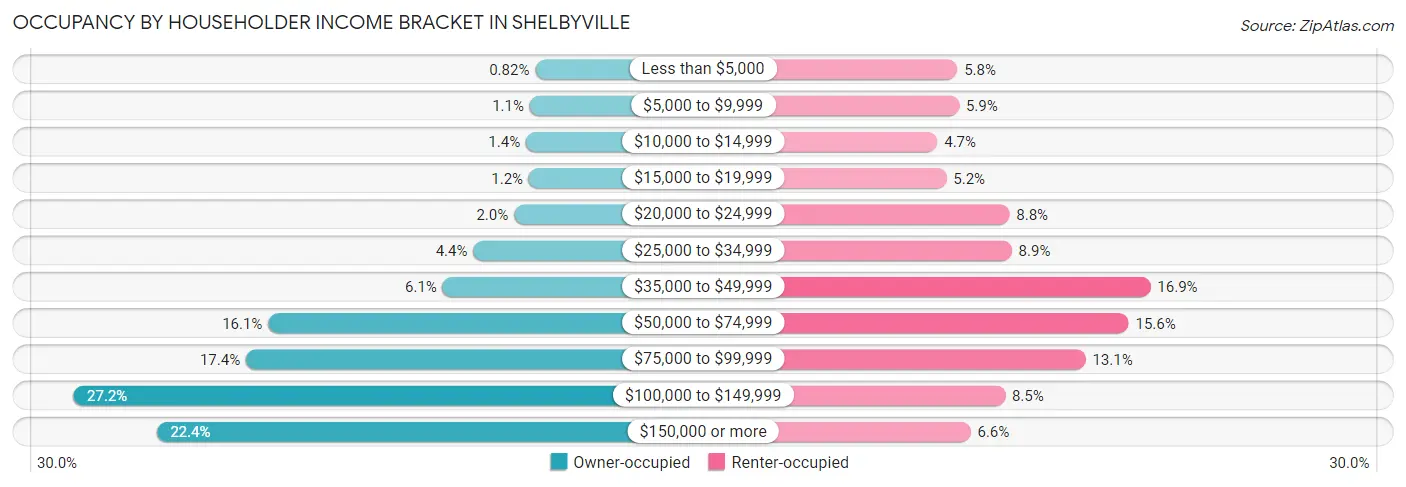
| Income Bracket | Owner-occupied | Renter-occupied |
| Less than $5,000 | 29 (0.8%) | 168 (5.8%) |
| $5,000 to $9,999 | 40 (1.1%) | 171 (5.9%) |
| $10,000 to $14,999 | 48 (1.3%) | 135 (4.7%) |
| $15,000 to $19,999 | 42 (1.2%) | 150 (5.2%) |
| $20,000 to $24,999 | 72 (2.0%) | 254 (8.8%) |
| $25,000 to $34,999 | 155 (4.4%) | 258 (8.9%) |
| $35,000 to $49,999 | 217 (6.1%) | 487 (16.9%) |
| $50,000 to $74,999 | 571 (16.1%) | 451 (15.6%) |
| $75,000 to $99,999 | 616 (17.3%) | 380 (13.1%) |
| $100,000 to $149,999 | 965 (27.2%) | 247 (8.5%) |
| $150,000 or more | 796 (22.4%) | 190 (6.6%) |
| Total | 3,551 (100.0%) | 2,891 (100.0%) |
Monthly Housing Cost Tiers in Shelbyville
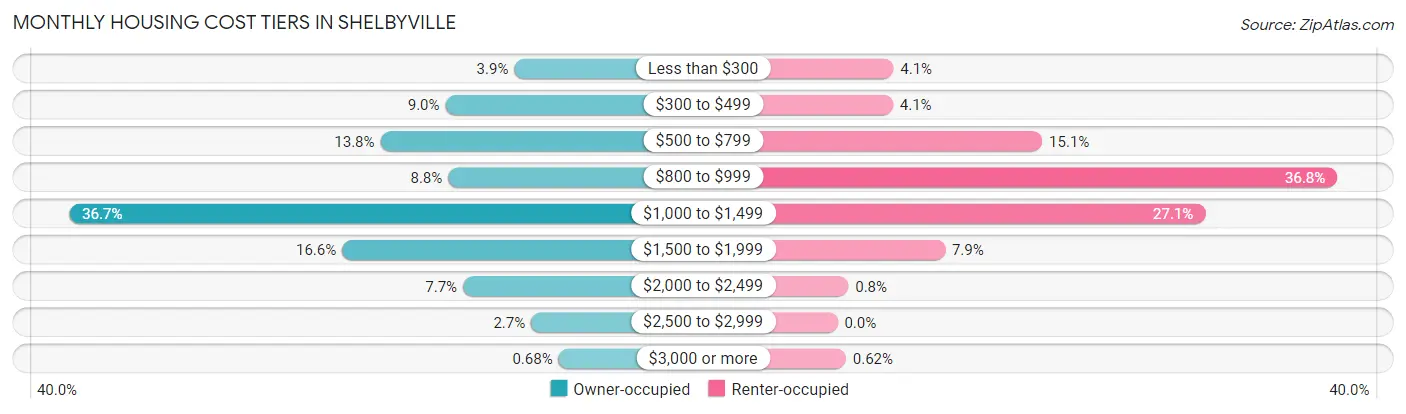
| Monthly Cost | Owner-occupied | Renter-occupied |
| Less than $300 | 140 (3.9%) | 119 (4.1%) |
| $300 to $499 | 320 (9.0%) | 118 (4.1%) |
| $500 to $799 | 490 (13.8%) | 436 (15.1%) |
| $800 to $999 | 313 (8.8%) | 1,064 (36.8%) |
| $1,000 to $1,499 | 1,304 (36.7%) | 783 (27.1%) |
| $1,500 to $1,999 | 590 (16.6%) | 229 (7.9%) |
| $2,000 to $2,499 | 274 (7.7%) | 23 (0.8%) |
| $2,500 to $2,999 | 96 (2.7%) | 0 (0.0%) |
| $3,000 or more | 24 (0.7%) | 18 (0.6%) |
| Total | 3,551 (100.0%) | 2,891 (100.0%) |
Physical Housing Characteristics in Shelbyville
Housing Structures in Shelbyville
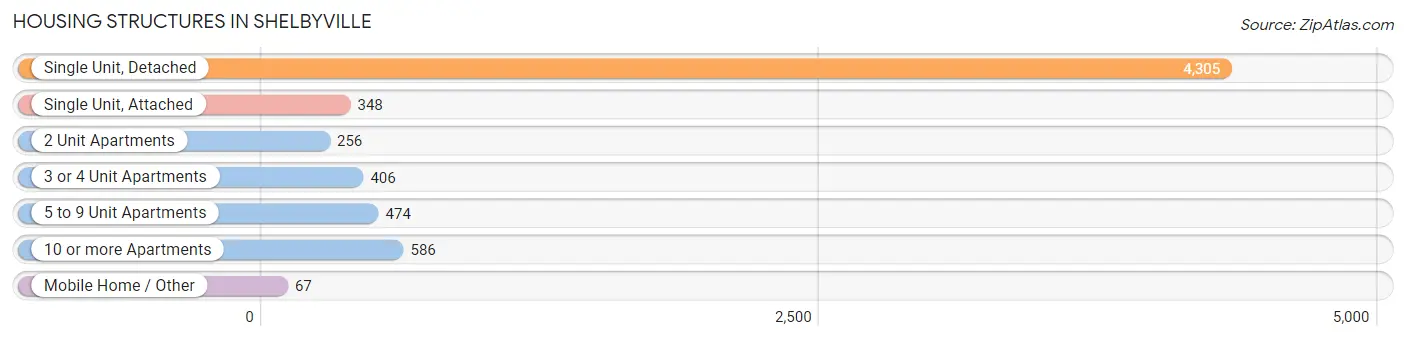
| Structure Type | # Housing Units | % Housing Units |
| Single Unit, Detached | 4,305 | 66.8% |
| Single Unit, Attached | 348 | 5.4% |
| 2 Unit Apartments | 256 | 4.0% |
| 3 or 4 Unit Apartments | 406 | 6.3% |
| 5 to 9 Unit Apartments | 474 | 7.4% |
| 10 or more Apartments | 586 | 9.1% |
| Mobile Home / Other | 67 | 1.0% |
| Total | 6,442 | 100.0% |
Housing Structures by Occupancy in Shelbyville
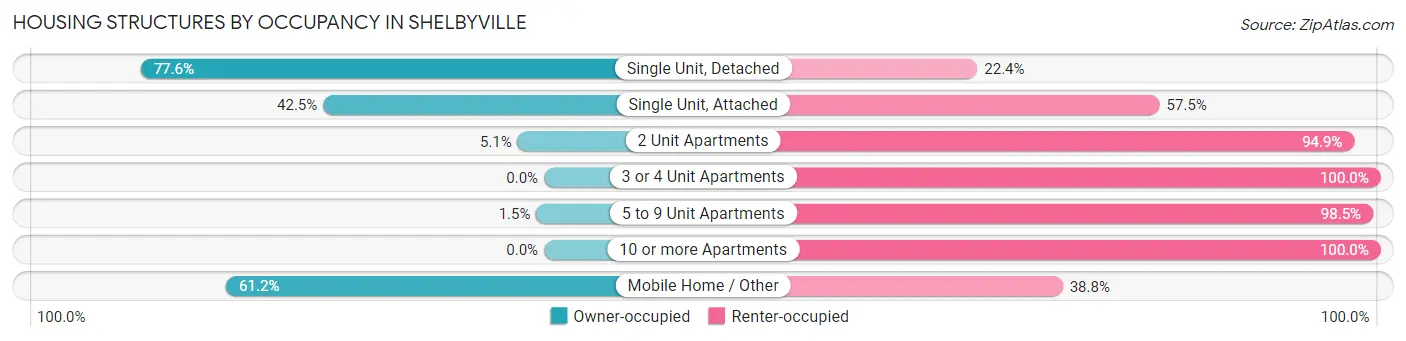
| Structure Type | Owner-occupied | Renter-occupied |
| Single Unit, Detached | 3,342 (77.6%) | 963 (22.4%) |
| Single Unit, Attached | 148 (42.5%) | 200 (57.5%) |
| 2 Unit Apartments | 13 (5.1%) | 243 (94.9%) |
| 3 or 4 Unit Apartments | 0 (0.0%) | 406 (100.0%) |
| 5 to 9 Unit Apartments | 7 (1.5%) | 467 (98.5%) |
| 10 or more Apartments | 0 (0.0%) | 586 (100.0%) |
| Mobile Home / Other | 41 (61.2%) | 26 (38.8%) |
| Total | 3,551 (55.1%) | 2,891 (44.9%) |
Housing Structures by Number of Rooms in Shelbyville
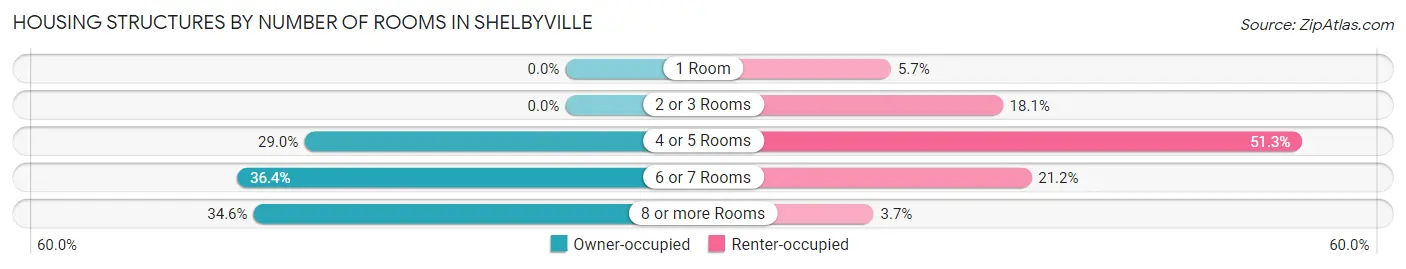
| Number of Rooms | Owner-occupied | Renter-occupied |
| 1 Room | 0 (0.0%) | 164 (5.7%) |
| 2 or 3 Rooms | 0 (0.0%) | 522 (18.1%) |
| 4 or 5 Rooms | 1,029 (29.0%) | 1,483 (51.3%) |
| 6 or 7 Rooms | 1,293 (36.4%) | 614 (21.2%) |
| 8 or more Rooms | 1,229 (34.6%) | 108 (3.7%) |
| Total | 3,551 (100.0%) | 2,891 (100.0%) |
Housing Structure by Heating Type in Shelbyville
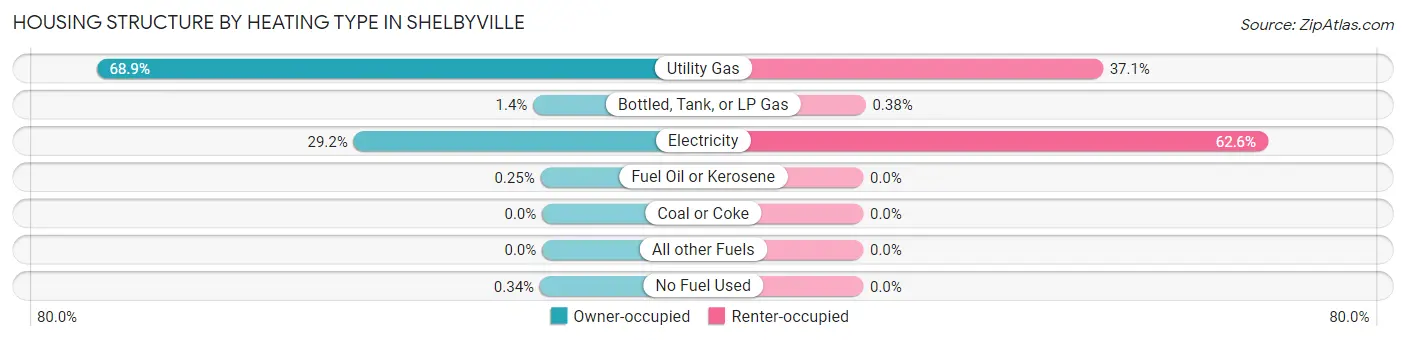
| Heating Type | Owner-occupied | Renter-occupied |
| Utility Gas | 2,446 (68.9%) | 1,071 (37.0%) |
| Bottled, Tank, or LP Gas | 49 (1.4%) | 11 (0.4%) |
| Electricity | 1,035 (29.1%) | 1,809 (62.6%) |
| Fuel Oil or Kerosene | 9 (0.3%) | 0 (0.0%) |
| Coal or Coke | 0 (0.0%) | 0 (0.0%) |
| All other Fuels | 0 (0.0%) | 0 (0.0%) |
| No Fuel Used | 12 (0.3%) | 0 (0.0%) |
| Total | 3,551 (100.0%) | 2,891 (100.0%) |
Household Vehicle Usage in Shelbyville
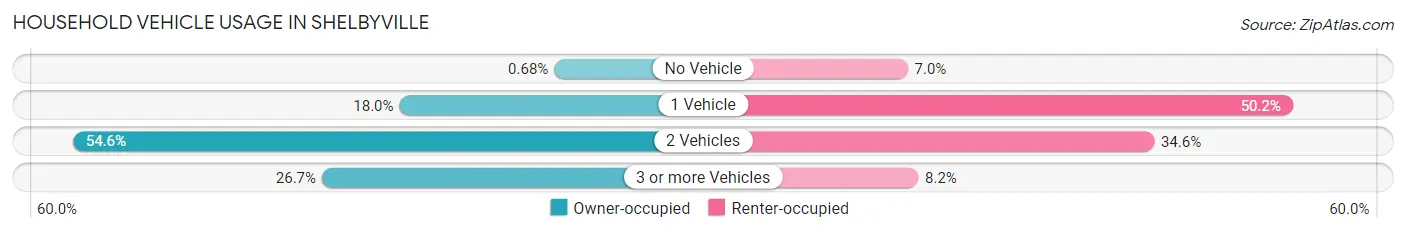
| Vehicles per Household | Owner-occupied | Renter-occupied |
| No Vehicle | 24 (0.7%) | 203 (7.0%) |
| 1 Vehicle | 640 (18.0%) | 1,450 (50.2%) |
| 2 Vehicles | 1,939 (54.6%) | 1,001 (34.6%) |
| 3 or more Vehicles | 948 (26.7%) | 237 (8.2%) |
| Total | 3,551 (100.0%) | 2,891 (100.0%) |
Real Estate & Mortgages in Shelbyville
Real Estate and Mortgage Overview in Shelbyville
| Characteristic | Without Mortgage | With Mortgage |
| Housing Units | 834 | 2,717 |
| Median Property Value | $243,400 | $221,600 |
| Median Household Income | $57,604 | $641 |
| Monthly Housing Costs | $470 | $24 |
| Real Estate Taxes | $1,817 | $4 |
Property Value by Mortgage Status in Shelbyville
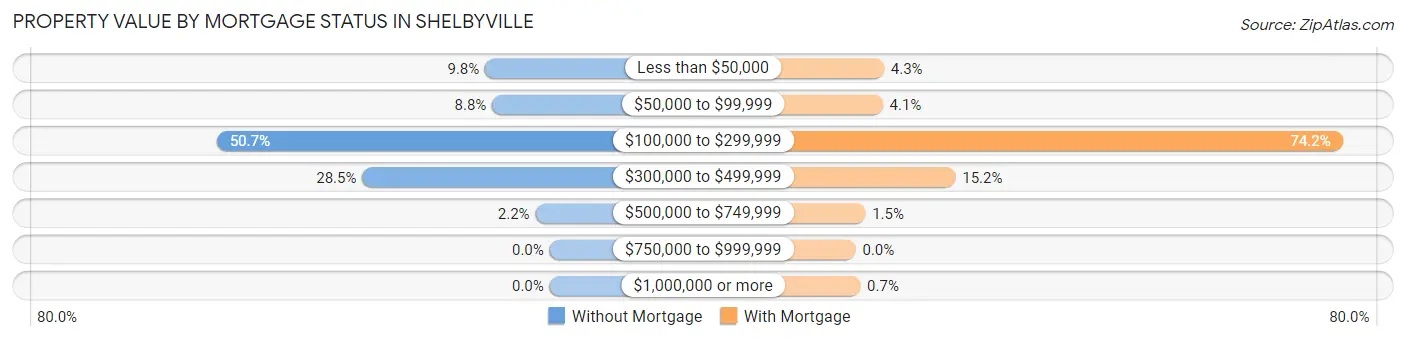
| Property Value | Without Mortgage | With Mortgage |
| Less than $50,000 | 82 (9.8%) | 117 (4.3%) |
| $50,000 to $99,999 | 73 (8.7%) | 112 (4.1%) |
| $100,000 to $299,999 | 423 (50.7%) | 2,016 (74.2%) |
| $300,000 to $499,999 | 238 (28.5%) | 413 (15.2%) |
| $500,000 to $749,999 | 18 (2.2%) | 40 (1.5%) |
| $750,000 to $999,999 | 0 (0.0%) | 0 (0.0%) |
| $1,000,000 or more | 0 (0.0%) | 19 (0.7%) |
| Total | 834 (100.0%) | 2,717 (100.0%) |
Household Income by Mortgage Status in Shelbyville
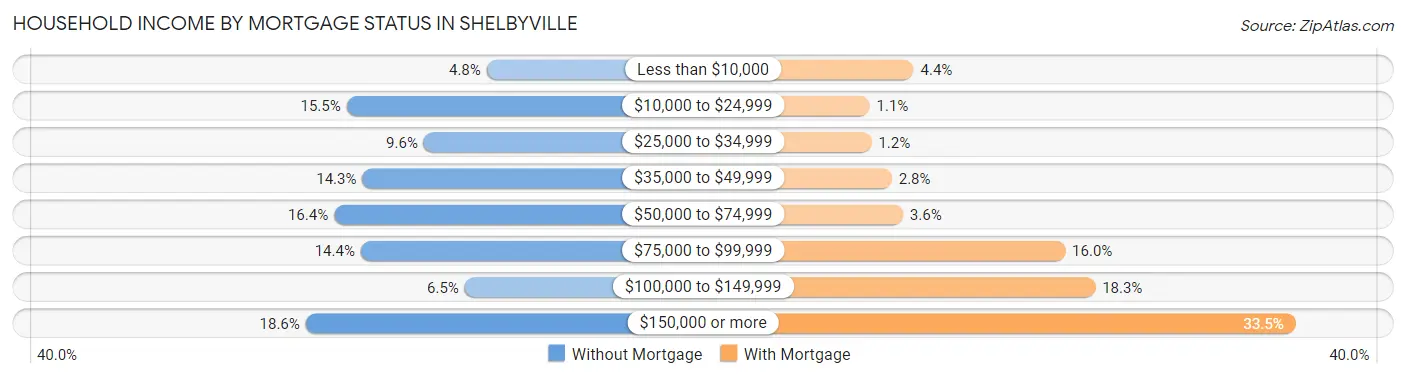
| Household Income | Without Mortgage | With Mortgage |
| Less than $10,000 | 40 (4.8%) | 120 (4.4%) |
| $10,000 to $24,999 | 129 (15.5%) | 29 (1.1%) |
| $25,000 to $34,999 | 80 (9.6%) | 33 (1.2%) |
| $35,000 to $49,999 | 119 (14.3%) | 75 (2.8%) |
| $50,000 to $74,999 | 137 (16.4%) | 98 (3.6%) |
| $75,000 to $99,999 | 120 (14.4%) | 434 (16.0%) |
| $100,000 to $149,999 | 54 (6.5%) | 496 (18.3%) |
| $150,000 or more | 155 (18.6%) | 911 (33.5%) |
| Total | 834 (100.0%) | 2,717 (100.0%) |
Property Value to Household Income Ratio in Shelbyville
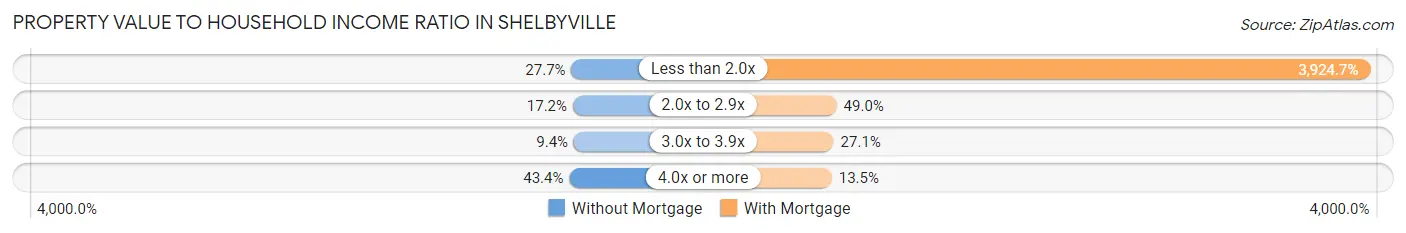
| Value-to-Income Ratio | Without Mortgage | With Mortgage |
| Less than 2.0x | 231 (27.7%) | 106,635 (3,924.7%) |
| 2.0x to 2.9x | 143 (17.2%) | 1,332 (49.0%) |
| 3.0x to 3.9x | 78 (9.3%) | 736 (27.1%) |
| 4.0x or more | 362 (43.4%) | 366 (13.5%) |
| Total | 834 (100.0%) | 2,717 (100.0%) |
Real Estate Taxes by Mortgage Status in Shelbyville
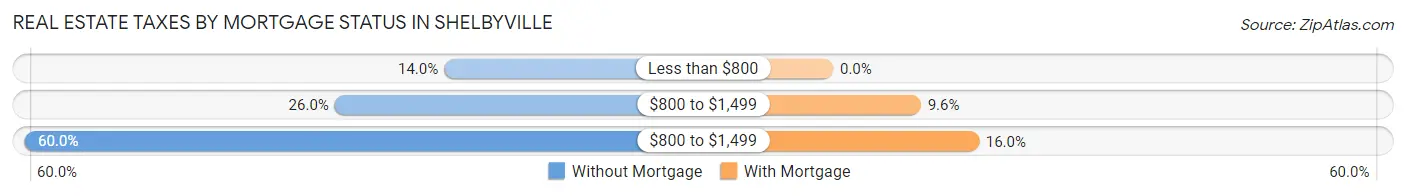
| Property Taxes | Without Mortgage | With Mortgage |
| Less than $800 | 117 (14.0%) | 0 (0.0%) |
| $800 to $1,499 | 217 (26.0%) | 261 (9.6%) |
| $800 to $1,499 | 500 (60.0%) | 434 (16.0%) |
| Total | 834 (100.0%) | 2,717 (100.0%) |
Health & Disability in Shelbyville
Health Insurance Coverage by Age in Shelbyville
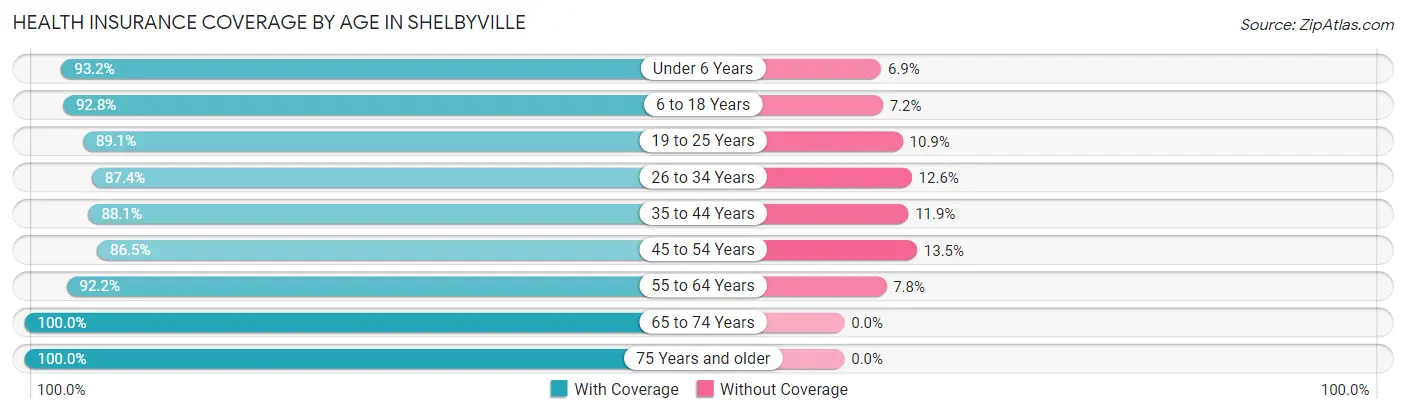
| Age Bracket | With Coverage | Without Coverage |
| Under 6 Years | 1,332 (93.1%) | 98 (6.9%) |
| 6 to 18 Years | 2,685 (92.8%) | 207 (7.2%) |
| 19 to 25 Years | 1,468 (89.1%) | 179 (10.9%) |
| 26 to 34 Years | 1,713 (87.4%) | 246 (12.6%) |
| 35 to 44 Years | 2,298 (88.1%) | 311 (11.9%) |
| 45 to 54 Years | 1,988 (86.5%) | 311 (13.5%) |
| 55 to 64 Years | 1,744 (92.2%) | 148 (7.8%) |
| 65 to 74 Years | 1,531 (100.0%) | 0 (0.0%) |
| 75 Years and older | 715 (100.0%) | 0 (0.0%) |
| Total | 15,474 (91.2%) | 1,500 (8.8%) |
Health Insurance Coverage by Citizenship Status in Shelbyville
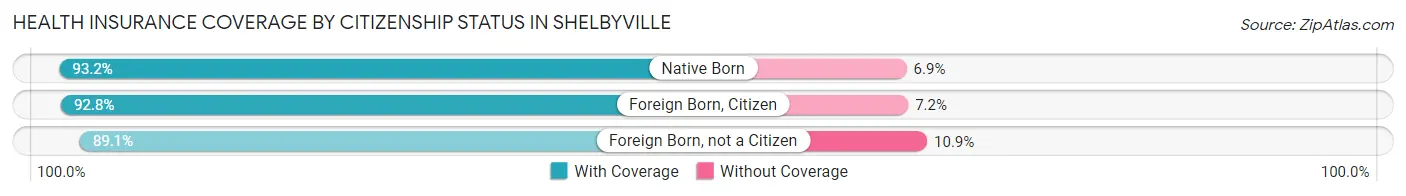
| Citizenship Status | With Coverage | Without Coverage |
| Native Born | 1,332 (93.1%) | 98 (6.9%) |
| Foreign Born, Citizen | 2,685 (92.8%) | 207 (7.2%) |
| Foreign Born, not a Citizen | 1,468 (89.1%) | 179 (10.9%) |
Health Insurance Coverage by Household Income in Shelbyville
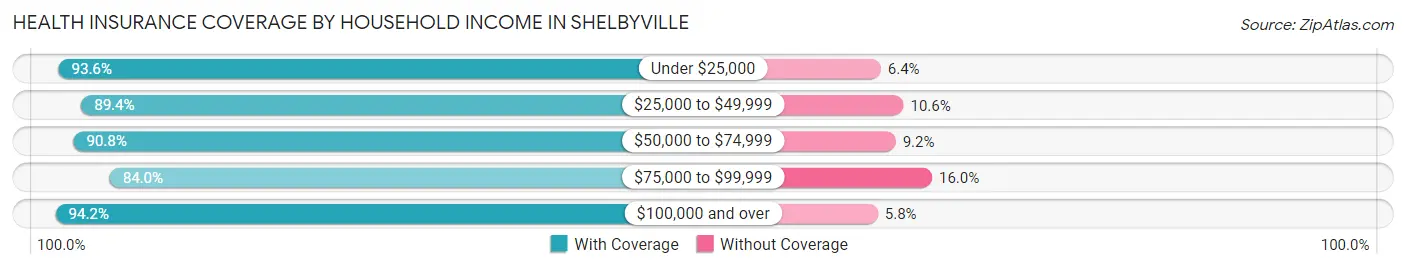
| Household Income | With Coverage | Without Coverage |
| Under $25,000 | 1,760 (93.6%) | 120 (6.4%) |
| $25,000 to $49,999 | 1,724 (89.4%) | 205 (10.6%) |
| $50,000 to $74,999 | 2,456 (90.8%) | 248 (9.2%) |
| $75,000 to $99,999 | 2,657 (84.0%) | 505 (16.0%) |
| $100,000 and over | 6,829 (94.2%) | 422 (5.8%) |
Public vs Private Health Insurance Coverage by Age in Shelbyville
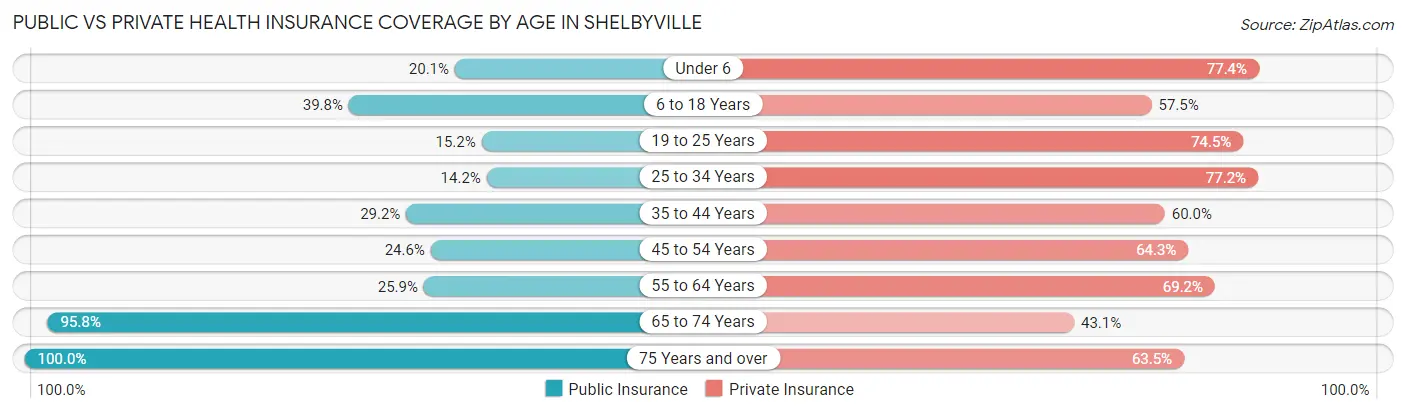
| Age Bracket | Public Insurance | Private Insurance |
| Under 6 | 288 (20.1%) | 1,107 (77.4%) |
| 6 to 18 Years | 1,152 (39.8%) | 1,663 (57.5%) |
| 19 to 25 Years | 250 (15.2%) | 1,227 (74.5%) |
| 25 to 34 Years | 279 (14.2%) | 1,513 (77.2%) |
| 35 to 44 Years | 761 (29.2%) | 1,564 (60.0%) |
| 45 to 54 Years | 566 (24.6%) | 1,478 (64.3%) |
| 55 to 64 Years | 490 (25.9%) | 1,310 (69.2%) |
| 65 to 74 Years | 1,466 (95.8%) | 660 (43.1%) |
| 75 Years and over | 715 (100.0%) | 454 (63.5%) |
| Total | 5,967 (35.1%) | 10,976 (64.7%) |
Disability Status by Sex by Age in Shelbyville
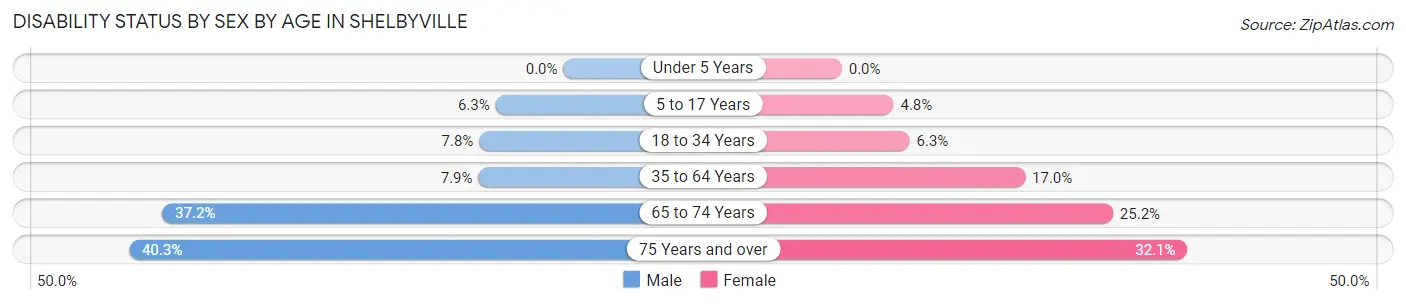
| Age Bracket | Male | Female |
| Under 5 Years | 0 (0.0%) | 0 (0.0%) |
| 5 to 17 Years | 96 (6.3%) | 71 (4.8%) |
| 18 to 34 Years | 123 (7.8%) | 136 (6.3%) |
| 35 to 64 Years | 262 (7.9%) | 592 (17.0%) |
| 65 to 74 Years | 274 (37.2%) | 200 (25.2%) |
| 75 Years and over | 77 (40.3%) | 168 (32.1%) |
Disability Class by Sex by Age in Shelbyville
Disability Class: Hearing Difficulty
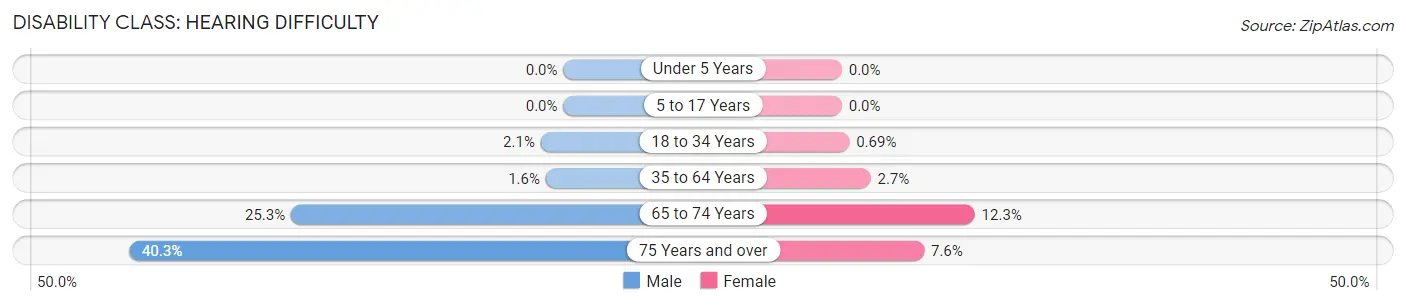
| Age Bracket | Male | Female |
| Under 5 Years | 0 (0.0%) | 0 (0.0%) |
| 5 to 17 Years | 0 (0.0%) | 0 (0.0%) |
| 18 to 34 Years | 33 (2.1%) | 15 (0.7%) |
| 35 to 64 Years | 54 (1.6%) | 93 (2.7%) |
| 65 to 74 Years | 186 (25.3%) | 98 (12.3%) |
| 75 Years and over | 77 (40.3%) | 40 (7.6%) |
Disability Class: Vision Difficulty
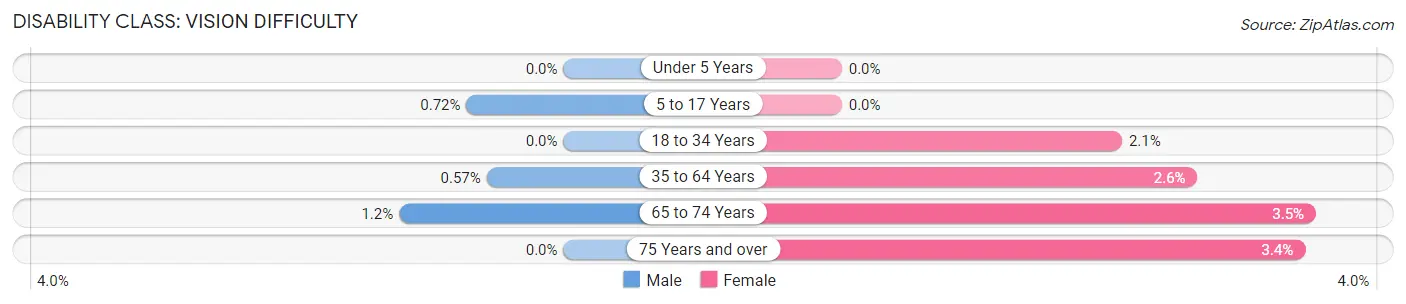
| Age Bracket | Male | Female |
| Under 5 Years | 0 (0.0%) | 0 (0.0%) |
| 5 to 17 Years | 11 (0.7%) | 0 (0.0%) |
| 18 to 34 Years | 0 (0.0%) | 45 (2.1%) |
| 35 to 64 Years | 19 (0.6%) | 92 (2.6%) |
| 65 to 74 Years | 9 (1.2%) | 28 (3.5%) |
| 75 Years and over | 0 (0.0%) | 18 (3.4%) |
Disability Class: Cognitive Difficulty
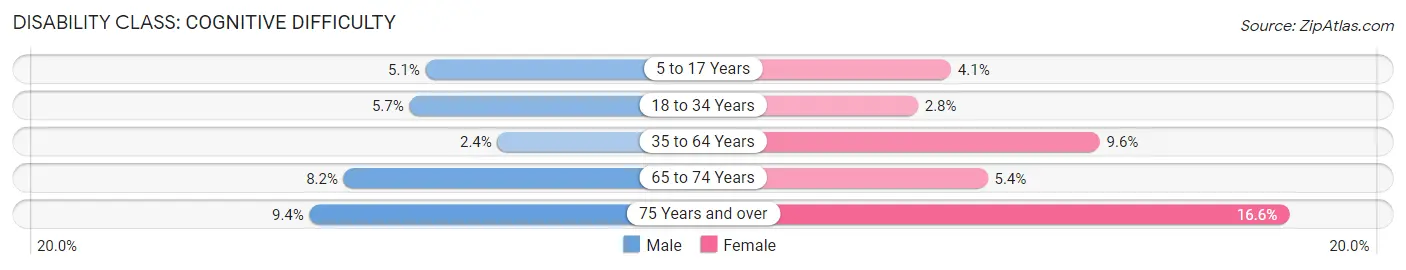
| Age Bracket | Male | Female |
| 5 to 17 Years | 78 (5.1%) | 60 (4.1%) |
| 18 to 34 Years | 90 (5.7%) | 61 (2.8%) |
| 35 to 64 Years | 81 (2.4%) | 333 (9.6%) |
| 65 to 74 Years | 60 (8.2%) | 43 (5.4%) |
| 75 Years and over | 18 (9.4%) | 87 (16.6%) |
Disability Class: Ambulatory Difficulty
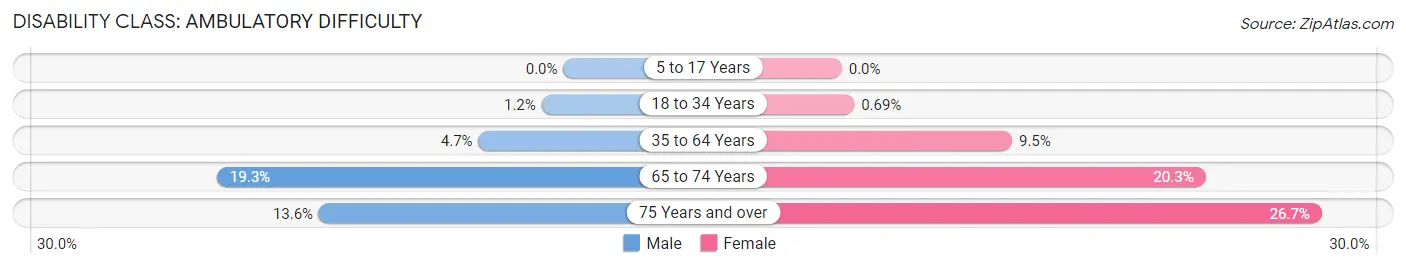
| Age Bracket | Male | Female |
| 5 to 17 Years | 0 (0.0%) | 0 (0.0%) |
| 18 to 34 Years | 19 (1.2%) | 15 (0.7%) |
| 35 to 64 Years | 157 (4.7%) | 330 (9.5%) |
| 65 to 74 Years | 142 (19.3%) | 161 (20.3%) |
| 75 Years and over | 26 (13.6%) | 140 (26.7%) |
Disability Class: Self-Care Difficulty
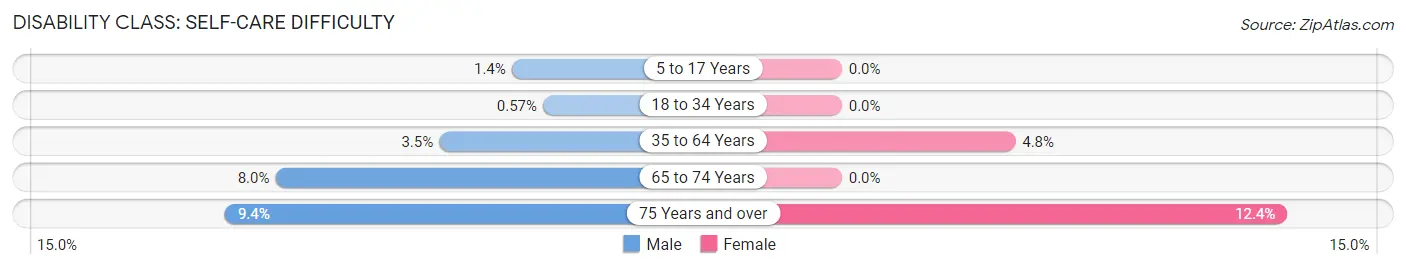
| Age Bracket | Male | Female |
| 5 to 17 Years | 22 (1.4%) | 0 (0.0%) |
| 18 to 34 Years | 9 (0.6%) | 0 (0.0%) |
| 35 to 64 Years | 115 (3.5%) | 168 (4.8%) |
| 65 to 74 Years | 59 (8.0%) | 0 (0.0%) |
| 75 Years and over | 18 (9.4%) | 65 (12.4%) |
Technology Access in Shelbyville
Computing Device Access in Shelbyville
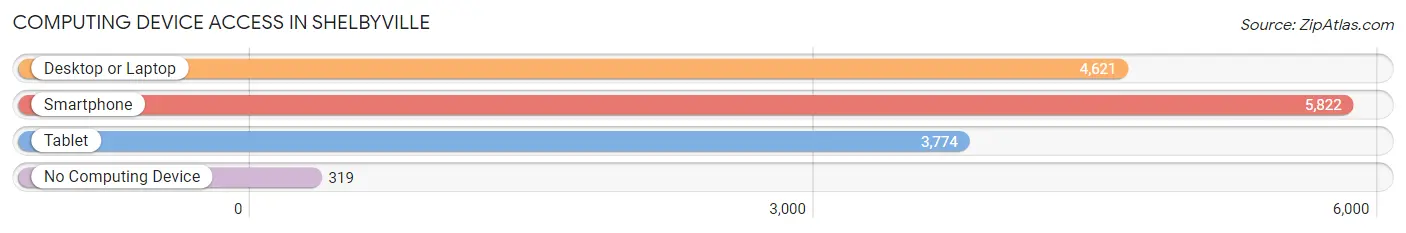
| Device Type | # Households | % Households |
| Desktop or Laptop | 4,621 | 71.7% |
| Smartphone | 5,822 | 90.4% |
| Tablet | 3,774 | 58.6% |
| No Computing Device | 319 | 5.0% |
| Total | 6,442 | 100.0% |
Internet Access in Shelbyville
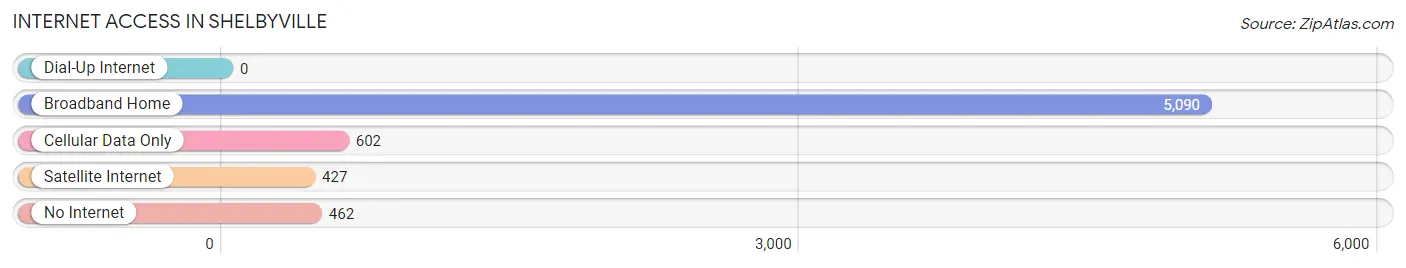
| Internet Type | # Households | % Households |
| Dial-Up Internet | 0 | 0.0% |
| Broadband Home | 5,090 | 79.0% |
| Cellular Data Only | 602 | 9.3% |
| Satellite Internet | 427 | 6.6% |
| No Internet | 462 | 7.2% |
| Total | 6,442 | 100.0% |
Shelbyville Summary
Shelbyville, Kentucky is a city located in the heart of the Bluegrass Region of the state. It is the county seat of Shelby County and is located about 25 miles east of Louisville. The city has a population of 14,045 according to the 2010 census.
History
Shelbyville was founded in 1792 by William and Mary Shelby. The city was named after William Shelby, who was a Revolutionary War veteran and a member of the Kentucky state legislature. The city was incorporated in 1845 and has since grown to become the county seat of Shelby County.
The city was an important stop on the Louisville and Nashville Railroad, which was completed in 1859. This allowed the city to become a major hub for trade and commerce. The city was also home to several large tobacco warehouses, which were used to store and process tobacco for shipment.
The city was also home to several large distilleries, which produced bourbon whiskey. The city was also home to several large horse farms, which were used to breed and train racehorses. The city was also home to several large manufacturing plants, which produced a variety of products, including furniture, clothing, and textiles.
Geography
Shelbyville is located in the Bluegrass Region of Kentucky. The city is situated in the rolling hills of the region and is surrounded by farmland. The city is located about 25 miles east of Louisville and is situated along the Kentucky River.
The city has a total area of 8.3 square miles, of which 8.2 square miles is land and 0.1 square miles is water. The city has a humid subtropical climate, with hot, humid summers and mild winters.
Economy
Shelbyville’s economy is largely based on agriculture and manufacturing. The city is home to several large horse farms, which are used to breed and train racehorses. The city is also home to several large manufacturing plants, which produce a variety of products, including furniture, clothing, and textiles.
The city is also home to several large distilleries, which produce bourbon whiskey. The city is also home to several large tobacco warehouses, which are used to store and process tobacco for shipment.
Demographics
According to the 2010 census, the population of Shelbyville was 14,045. The racial makeup of the city was 87.3% White, 8.7% African American, 0.3% Native American, 0.7% Asian, 0.1% Pacific Islander, 1.2% from other races, and 2.0% from two or more races. Hispanic or Latino of any race were 3.2% of the population.
The median income for a household in the city was $37,945, and the median income for a family was $45,945. The per capita income for the city was $20,845. About 11.2% of families and 14.2% of the population were below the poverty line, including 19.2% of those under age 18 and 10.2% of those age 65 or over.
Common Questions
What is Per Capita Income in Shelbyville?
Per Capita income in Shelbyville is $34,697.
What is the Median Family Income in Shelbyville?
Median Family Income in Shelbyville is $82,632.
What is the Median Household income in Shelbyville?
Median Household Income in Shelbyville is $74,433.
What is Income or Wage Gap in Shelbyville?
Income or Wage Gap in Shelbyville is 15.7%.
Women in Shelbyville earn 84.3 cents for every dollar earned by a man.
What is Inequality or Gini Index in Shelbyville?
Inequality or Gini Index in Shelbyville is 0.43.
What is the Total Population of Shelbyville?
Total Population of Shelbyville is 17,239.
What is the Total Male Population of Shelbyville?
Total Male Population of Shelbyville is 8,216.
What is the Total Female Population of Shelbyville?
Total Female Population of Shelbyville is 9,023.
What is the Ratio of Males per 100 Females in Shelbyville?
There are 91.06 Males per 100 Females in Shelbyville.
What is the Ratio of Females per 100 Males in Shelbyville?
There are 109.82 Females per 100 Males in Shelbyville.
What is the Median Population Age in Shelbyville?
Median Population Age in Shelbyville is 37.4 Years.
What is the Average Family Size in Shelbyville
Average Family Size in Shelbyville is 3.1 People.
What is the Average Household Size in Shelbyville
Average Household Size in Shelbyville is 2.6 People.
How Large is the Labor Force in Shelbyville?
There are 9,385 People in the Labor Forcein in Shelbyville.
What is the Percentage of People in the Labor Force in Shelbyville?
69.2% of People are in the Labor Force in Shelbyville.
What is the Unemployment Rate in Shelbyville?
Unemployment Rate in Shelbyville is 2.9%.