Cottonwood Heights, UT Map & Demographics
Cottonwood Heights Map
Cottonwood Heights Overview
$54,444
PER CAPITA INCOME
$135,888
AVG FAMILY INCOME
$110,197
AVG HOUSEHOLD INCOME
28.7%
WAGE / INCOME GAP [ % ]
71.3¢/ $1
WAGE / INCOME GAP [ $ ]
0.43
INEQUALITY / GINI INDEX
33,257
TOTAL POPULATION
16,467
MALE POPULATION
16,790
FEMALE POPULATION
98.08
MALES / 100 FEMALES
101.96
FEMALES / 100 MALES
39.4
MEDIAN AGE
3.1
AVG FAMILY SIZE
2.7
AVG HOUSEHOLD SIZE
18,803
LABOR FORCE [ PEOPLE ]
70.2%
PERCENT IN LABOR FORCE
3.2%
UNEMPLOYMENT RATE
Cottonwood Heights Area Codes
Income in Cottonwood Heights
Income Overview in Cottonwood Heights
Per Capita Income in Cottonwood Heights is $54,444, while median incomes of families and households are $135,888 and $110,197 respectively.
| Characteristic | Number | Measure |
| Per Capita Income | 33,257 | $54,444 |
| Median Family Income | 8,754 | $135,888 |
| Mean Family Income | 8,754 | $162,015 |
| Median Household Income | 12,361 | $110,197 |
| Mean Household Income | 12,361 | $143,689 |
| Income Deficit | 8,754 | $0 |
| Wage / Income Gap (%) | 33,257 | 28.71% |
| Wage / Income Gap ($) | 33,257 | 71.29¢ per $1 |
| Gini / Inequality Index | 33,257 | 0.43 |
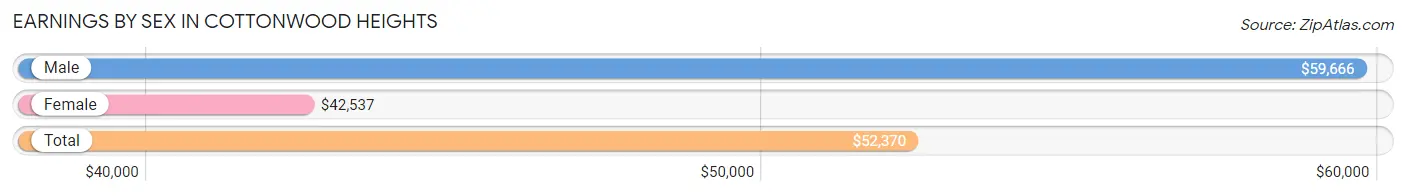
Earnings by Sex in Cottonwood Heights
Average Earnings in Cottonwood Heights are $52,370, $59,666 for men and $42,537 for women, a difference of 28.7%.
| Sex | Number | Average Earnings |
| Male | 10,678 (54.0%) | $59,666 |
| Female | 9,103 (46.0%) | $42,537 |
| Total | 19,781 (100.0%) | $52,370 |
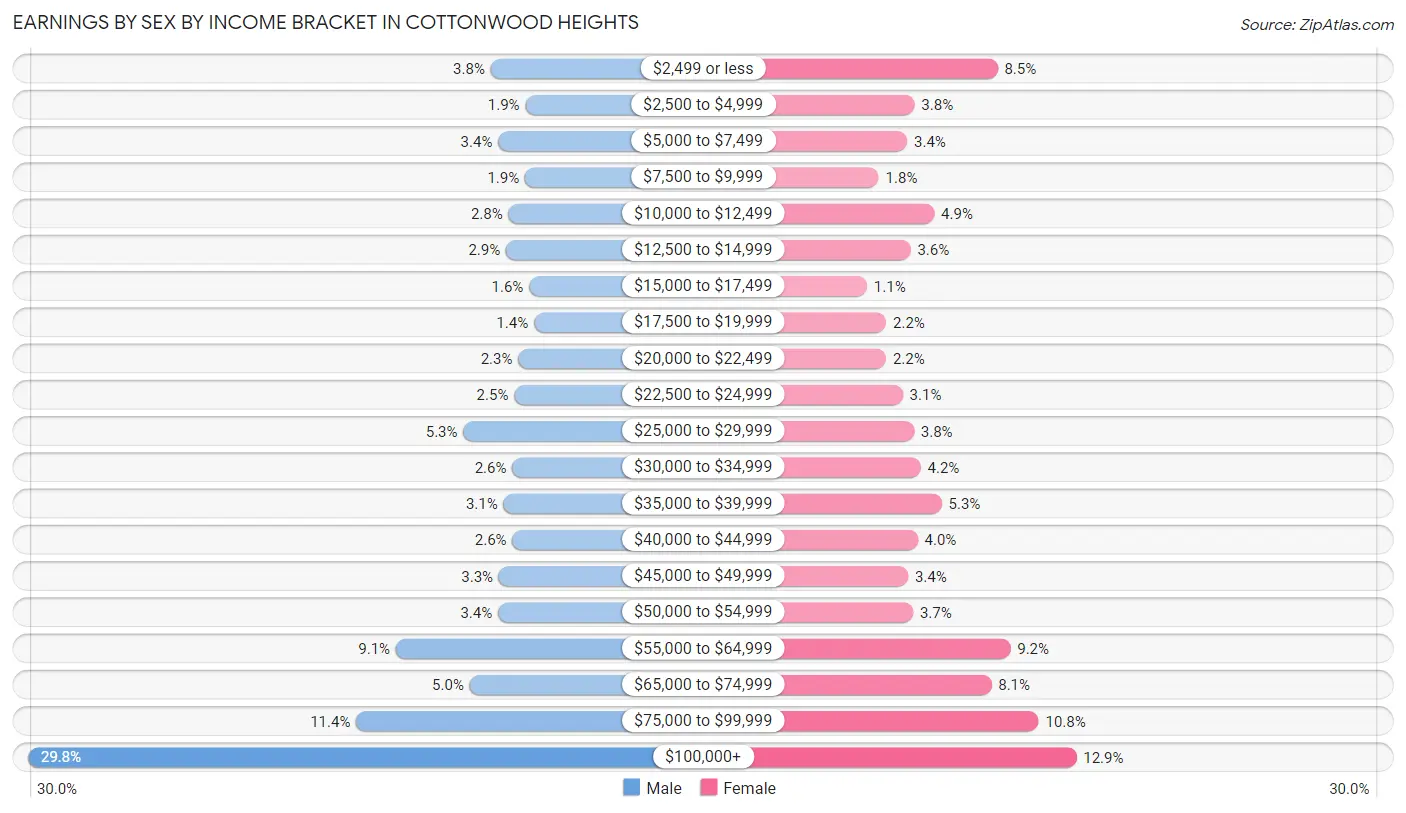
Earnings by Sex by Income Bracket in Cottonwood Heights
The most common earnings brackets in Cottonwood Heights are $100,000+ for men (3,184 | 29.8%) and $100,000+ for women (1,174 | 12.9%).
| Income | Male | Female |
| $2,499 or less | 406 (3.8%) | 771 (8.5%) |
| $2,500 to $4,999 | 198 (1.8%) | 346 (3.8%) |
| $5,000 to $7,499 | 361 (3.4%) | 309 (3.4%) |
| $7,500 to $9,999 | 200 (1.9%) | 163 (1.8%) |
| $10,000 to $12,499 | 299 (2.8%) | 447 (4.9%) |
| $12,500 to $14,999 | 314 (2.9%) | 326 (3.6%) |
| $15,000 to $17,499 | 175 (1.6%) | 103 (1.1%) |
| $17,500 to $19,999 | 146 (1.4%) | 201 (2.2%) |
| $20,000 to $22,499 | 240 (2.2%) | 200 (2.2%) |
| $22,500 to $24,999 | 265 (2.5%) | 286 (3.1%) |
| $25,000 to $29,999 | 570 (5.3%) | 343 (3.8%) |
| $30,000 to $34,999 | 277 (2.6%) | 378 (4.2%) |
| $35,000 to $39,999 | 329 (3.1%) | 485 (5.3%) |
| $40,000 to $44,999 | 275 (2.6%) | 362 (4.0%) |
| $45,000 to $49,999 | 357 (3.3%) | 313 (3.4%) |
| $50,000 to $54,999 | 362 (3.4%) | 339 (3.7%) |
| $55,000 to $64,999 | 975 (9.1%) | 837 (9.2%) |
| $65,000 to $74,999 | 532 (5.0%) | 739 (8.1%) |
| $75,000 to $99,999 | 1,213 (11.4%) | 981 (10.8%) |
| $100,000+ | 3,184 (29.8%) | 1,174 (12.9%) |
| Total | 10,678 (100.0%) | 9,103 (100.0%) |
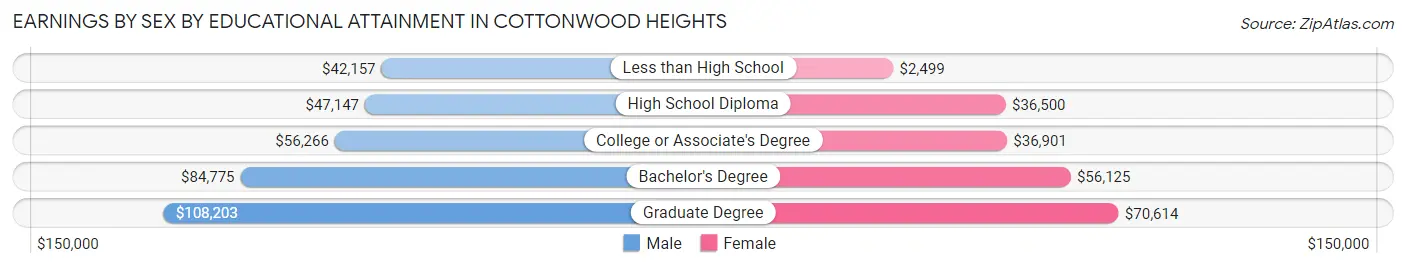
Earnings by Sex by Educational Attainment in Cottonwood Heights
Average earnings in Cottonwood Heights are $69,467 for men and $52,440 for women, a difference of 24.5%. Men with an educational attainment of graduate degree enjoy the highest average annual earnings of $108,203, while those with less than high school education earn the least with $42,157. Women with an educational attainment of graduate degree earn the most with the average annual earnings of $70,614, while those with less than high school education have the smallest earnings of $2,499.
| Educational Attainment | Male Income | Female Income |
| Less than High School | $42,157 | $2,499 |
| High School Diploma | $47,147 | $36,500 |
| College or Associate's Degree | $56,266 | $36,901 |
| Bachelor's Degree | $84,775 | $56,125 |
| Graduate Degree | $108,203 | $70,614 |
| Total | $69,467 | $52,440 |
Family Income in Cottonwood Heights
Family Income Brackets in Cottonwood Heights
According to the Cottonwood Heights family income data, there are 2,372 families falling into the $200,000+ income range, which is the most common income bracket and makes up 27.1% of all families. Conversely, the $10,000 to $14,999 income bracket is the least frequent group with only 96 families (1.1%) belonging to this category.
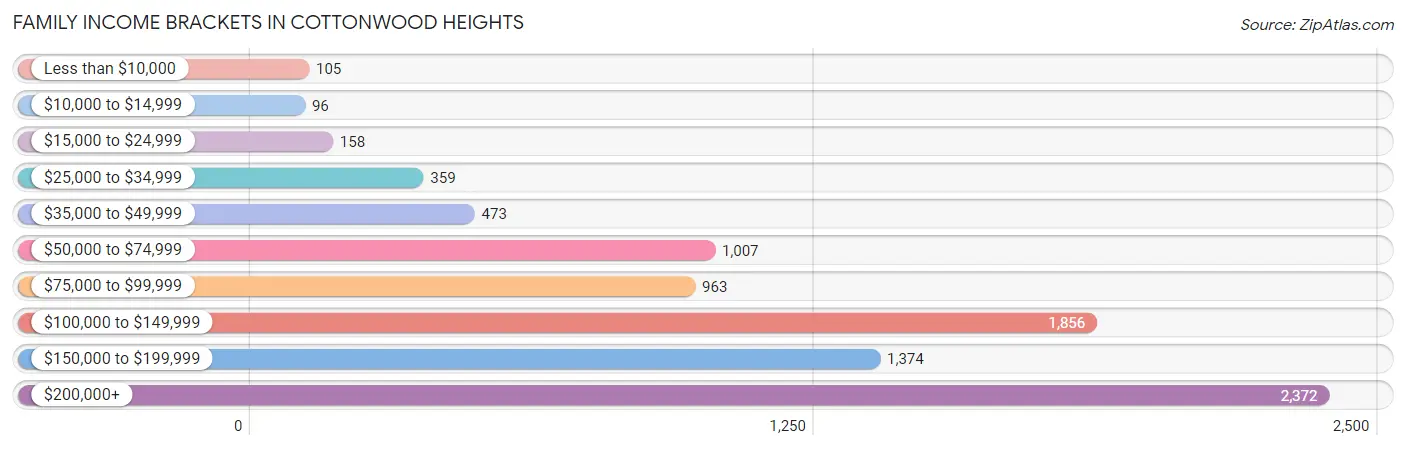
| Income Bracket | # Families | % Families |
| Less than $10,000 | 105 | 1.2% |
| $10,000 to $14,999 | 96 | 1.1% |
| $15,000 to $24,999 | 158 | 1.8% |
| $25,000 to $34,999 | 359 | 4.1% |
| $35,000 to $49,999 | 473 | 5.4% |
| $50,000 to $74,999 | 1,007 | 11.5% |
| $75,000 to $99,999 | 963 | 11.0% |
| $100,000 to $149,999 | 1,856 | 21.2% |
| $150,000 to $199,999 | 1,374 | 15.7% |
| $200,000+ | 2,372 | 27.1% |
Family Income by Famaliy Size in Cottonwood Heights
7+ person families (192 | 2.2%) account for the highest median family income in Cottonwood Heights with $202,841 per family, while 2-person families (4,133 | 47.2%) have the highest median income of $55,992 per family member.
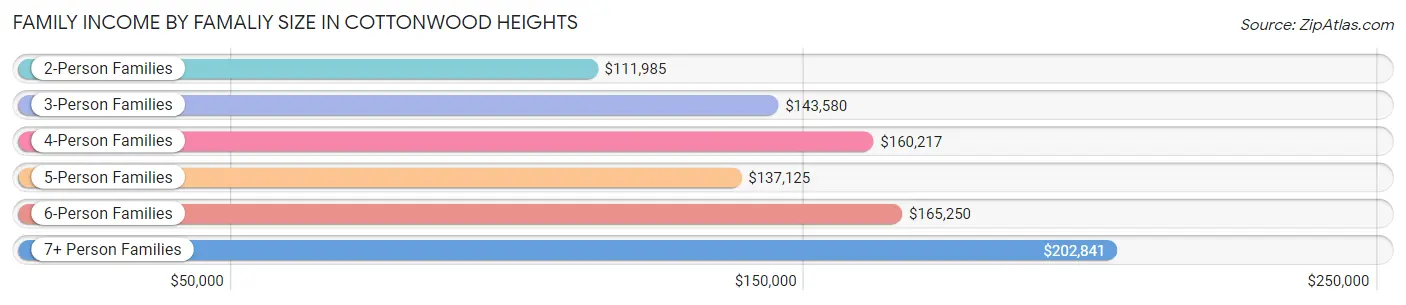
| Income Bracket | # Families | Median Income |
| 2-Person Families | 4,133 (47.2%) | $111,985 |
| 3-Person Families | 1,983 (22.7%) | $143,580 |
| 4-Person Families | 1,472 (16.8%) | $160,217 |
| 5-Person Families | 628 (7.2%) | $137,125 |
| 6-Person Families | 346 (4.0%) | $165,250 |
| 7+ Person Families | 192 (2.2%) | $202,841 |
| Total | 8,754 (100.0%) | $135,888 |
Family Income by Number of Earners in Cottonwood Heights
The median family income in Cottonwood Heights is $135,888, with families comprising 3+ earners (1,346) having the highest median family income of $169,731, while families with no earners (1,178) have the lowest median family income of $69,244, accounting for 15.4% and 13.5% of families, respectively.
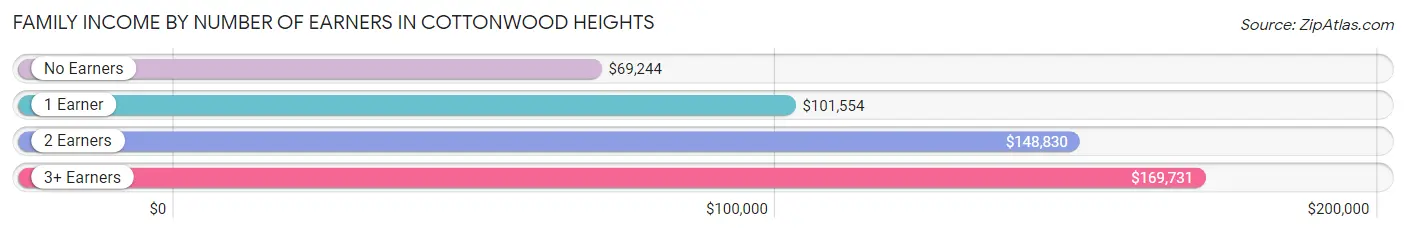
| Number of Earners | # Families | Median Income |
| No Earners | 1,178 (13.5%) | $69,244 |
| 1 Earner | 2,242 (25.6%) | $101,554 |
| 2 Earners | 3,988 (45.6%) | $148,830 |
| 3+ Earners | 1,346 (15.4%) | $169,731 |
| Total | 8,754 (100.0%) | $135,888 |
Household Income in Cottonwood Heights
Household Income Brackets in Cottonwood Heights
With 2,633 households falling in the category, the $200,000+ income range is the most frequent in Cottonwood Heights, accounting for 21.3% of all households. In contrast, only 272 households (2.2%) fall into the $10,000 to $14,999 income bracket, making it the least populous group.
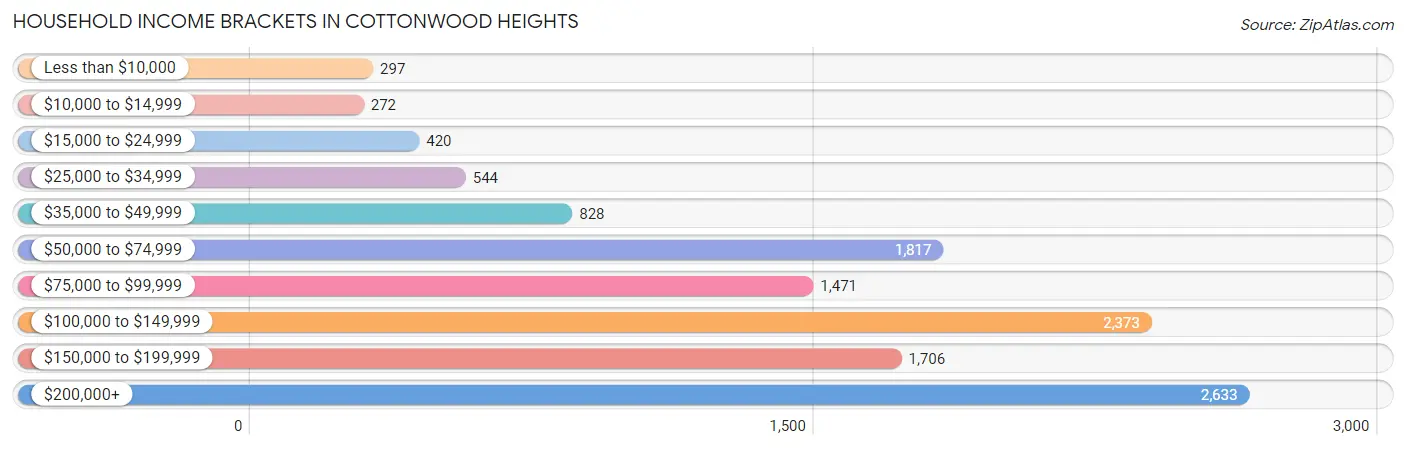
| Income Bracket | # Households | % Households |
| Less than $10,000 | 297 | 2.4% |
| $10,000 to $14,999 | 272 | 2.2% |
| $15,000 to $24,999 | 420 | 3.4% |
| $25,000 to $34,999 | 544 | 4.4% |
| $35,000 to $49,999 | 828 | 6.7% |
| $50,000 to $74,999 | 1,817 | 14.7% |
| $75,000 to $99,999 | 1,471 | 11.9% |
| $100,000 to $149,999 | 2,373 | 19.2% |
| $150,000 to $199,999 | 1,706 | 13.8% |
| $200,000+ | 2,633 | 21.3% |
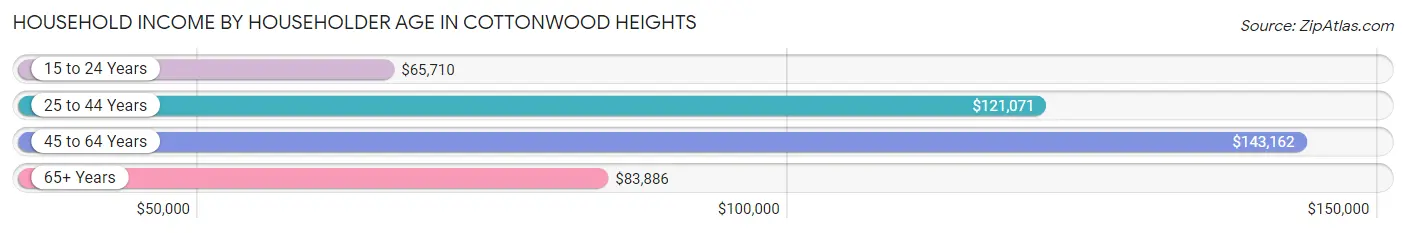
Household Income by Householder Age in Cottonwood Heights
The median household income in Cottonwood Heights is $110,197, with the highest median household income of $143,162 found in the 45 to 64 years age bracket for the primary householder. A total of 4,508 households (36.5%) fall into this category. Meanwhile, the 15 to 24 years age bracket for the primary householder has the lowest median household income of $65,710, with 331 households (2.7%) in this group.
| Income Bracket | # Households | Median Income |
| 15 to 24 Years | 331 (2.7%) | $65,710 |
| 25 to 44 Years | 4,042 (32.7%) | $121,071 |
| 45 to 64 Years | 4,508 (36.5%) | $143,162 |
| 65+ Years | 3,480 (28.1%) | $83,886 |
| Total | 12,361 (100.0%) | $110,197 |
Poverty in Cottonwood Heights
Income Below Poverty by Sex and Age in Cottonwood Heights
With 6.0% poverty level for males and 8.7% for females among the residents of Cottonwood Heights, under 5 year old males and 6 to 11 year old females are the most vulnerable to poverty, with 104 males (14.3%) and 210 females (15.8%) in their respective age groups living below the poverty level.
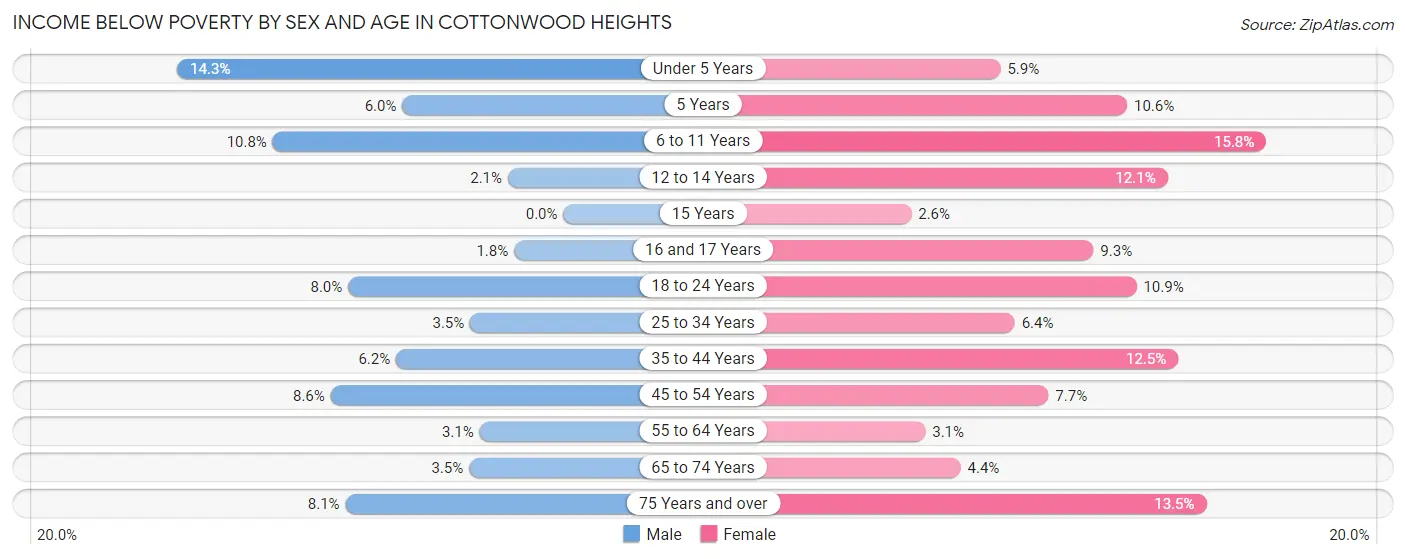
| Age Bracket | Male | Female |
| Under 5 Years | 104 (14.3%) | 65 (5.9%) |
| 5 Years | 11 (6.0%) | 18 (10.6%) |
| 6 to 11 Years | 112 (10.8%) | 210 (15.8%) |
| 12 to 14 Years | 14 (2.1%) | 84 (12.1%) |
| 15 Years | 0 (0.0%) | 6 (2.6%) |
| 16 and 17 Years | 8 (1.8%) | 38 (9.3%) |
| 18 to 24 Years | 116 (8.0%) | 149 (10.9%) |
| 25 to 34 Years | 82 (3.5%) | 123 (6.4%) |
| 35 to 44 Years | 147 (6.2%) | 298 (12.5%) |
| 45 to 54 Years | 183 (8.6%) | 157 (7.7%) |
| 55 to 64 Years | 64 (3.1%) | 67 (3.1%) |
| 65 to 74 Years | 58 (3.5%) | 74 (4.4%) |
| 75 Years and over | 88 (8.1%) | 174 (13.5%) |
| Total | 987 (6.0%) | 1,463 (8.7%) |
Income Above Poverty by Sex and Age in Cottonwood Heights
According to the poverty statistics in Cottonwood Heights, males aged 15 years and females aged 15 years are the age groups that are most secure financially, with 100.0% of males and 97.4% of females in these age groups living above the poverty line.
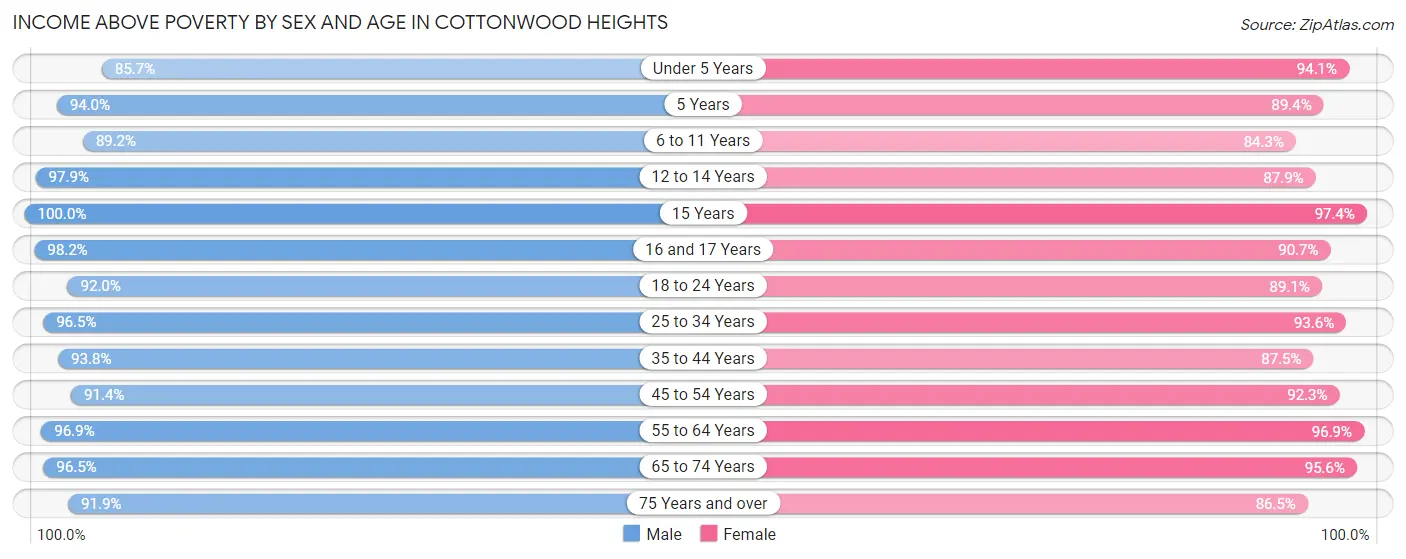
| Age Bracket | Male | Female |
| Under 5 Years | 621 (85.7%) | 1,038 (94.1%) |
| 5 Years | 173 (94.0%) | 152 (89.4%) |
| 6 to 11 Years | 926 (89.2%) | 1,123 (84.3%) |
| 12 to 14 Years | 666 (97.9%) | 611 (87.9%) |
| 15 Years | 226 (100.0%) | 227 (97.4%) |
| 16 and 17 Years | 428 (98.2%) | 369 (90.7%) |
| 18 to 24 Years | 1,336 (92.0%) | 1,213 (89.1%) |
| 25 to 34 Years | 2,285 (96.5%) | 1,793 (93.6%) |
| 35 to 44 Years | 2,221 (93.8%) | 2,089 (87.5%) |
| 45 to 54 Years | 1,935 (91.4%) | 1,890 (92.3%) |
| 55 to 64 Years | 1,993 (96.9%) | 2,091 (96.9%) |
| 65 to 74 Years | 1,601 (96.5%) | 1,603 (95.6%) |
| 75 Years and over | 1,000 (91.9%) | 1,112 (86.5%) |
| Total | 15,411 (94.0%) | 15,311 (91.3%) |
Income Below Poverty Among Married-Couple Families in Cottonwood Heights
The poverty statistics for married-couple families in Cottonwood Heights show that 3.9% or 282 of the total 7,248 families live below the poverty line. Families with 5 or more children have the highest poverty rate of 41.7%, comprising of 10 families. On the other hand, families with no children have the lowest poverty rate of 2.2%, which includes 100 families.
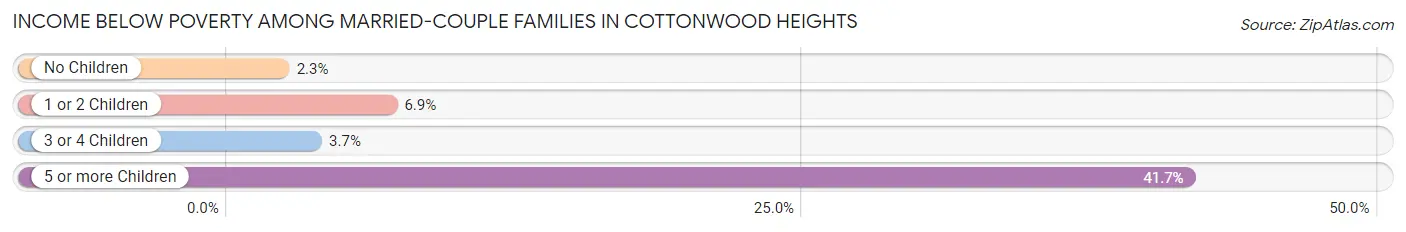
| Children | Above Poverty | Below Poverty |
| No Children | 4,337 (97.8%) | 100 (2.2%) |
| 1 or 2 Children | 1,984 (93.1%) | 148 (6.9%) |
| 3 or 4 Children | 631 (96.3%) | 24 (3.7%) |
| 5 or more Children | 14 (58.3%) | 10 (41.7%) |
| Total | 6,966 (96.1%) | 282 (3.9%) |
Income Below Poverty Among Single-Parent Households in Cottonwood Heights
According to the poverty data in Cottonwood Heights, 3.3% or 11 single-father households and 11.0% or 129 single-mother households are living below the poverty line. Among single-father households, those with no children have the highest poverty rate, with 11 households (7.6%) experiencing poverty. Likewise, among single-mother households, those with 3 or 4 children have the highest poverty rate, with 40 households (28.4%) falling below the poverty line.
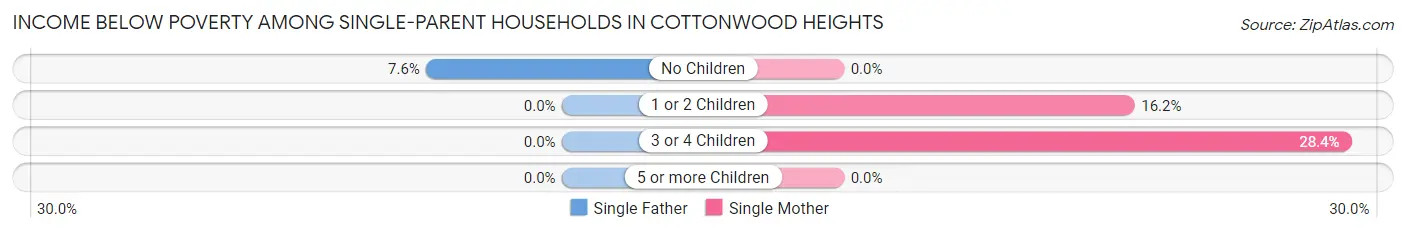
| Children | Single Father | Single Mother |
| No Children | 11 (7.6%) | 0 (0.0%) |
| 1 or 2 Children | 0 (0.0%) | 89 (16.2%) |
| 3 or 4 Children | 0 (0.0%) | 40 (28.4%) |
| 5 or more Children | 0 (0.0%) | 0 (0.0%) |
| Total | 11 (3.3%) | 129 (11.0%) |
Income Below Poverty Among Married-Couple vs Single-Parent Households in Cottonwood Heights
The poverty data for Cottonwood Heights shows that 282 of the married-couple family households (3.9%) and 140 of the single-parent households (9.3%) are living below the poverty level. Within the married-couple family households, those with 5 or more children have the highest poverty rate, with 10 households (41.7%) falling below the poverty line. Among the single-parent households, those with 3 or 4 children have the highest poverty rate, with 40 household (23.5%) living below poverty.
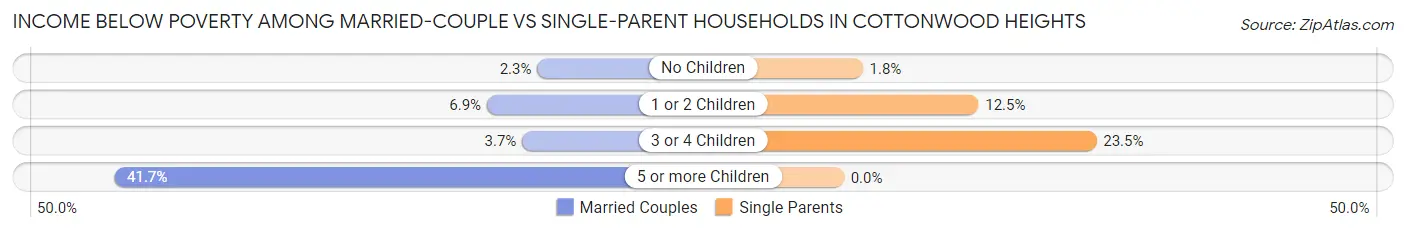
| Children | Married-Couple Families | Single-Parent Households |
| No Children | 100 (2.2%) | 11 (1.8%) |
| 1 or 2 Children | 148 (6.9%) | 89 (12.5%) |
| 3 or 4 Children | 24 (3.7%) | 40 (23.5%) |
| 5 or more Children | 10 (41.7%) | 0 (0.0%) |
| Total | 282 (3.9%) | 140 (9.3%) |
Race in Cottonwood Heights
The most populous races in Cottonwood Heights are White / Caucasian (29,328 | 88.2%), Hispanic or Latino (1,760 | 5.3%), and Two or more Races (1,758 | 5.3%).
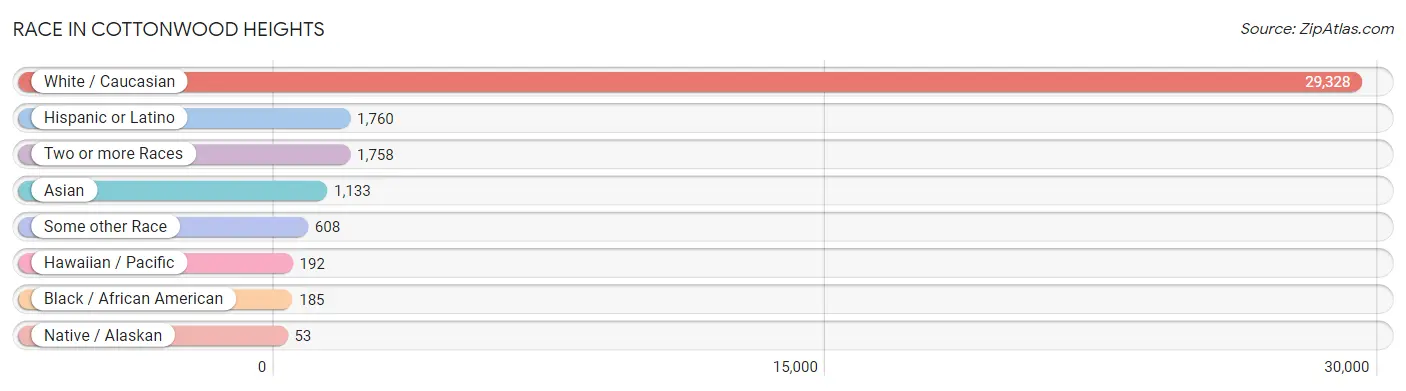
| Race | # Population | % Population |
| Asian | 1,133 | 3.4% |
| Black / African American | 185 | 0.6% |
| Hawaiian / Pacific | 192 | 0.6% |
| Hispanic or Latino | 1,760 | 5.3% |
| Native / Alaskan | 53 | 0.2% |
| White / Caucasian | 29,328 | 88.2% |
| Two or more Races | 1,758 | 5.3% |
| Some other Race | 608 | 1.8% |
| Total | 33,257 | 100.0% |
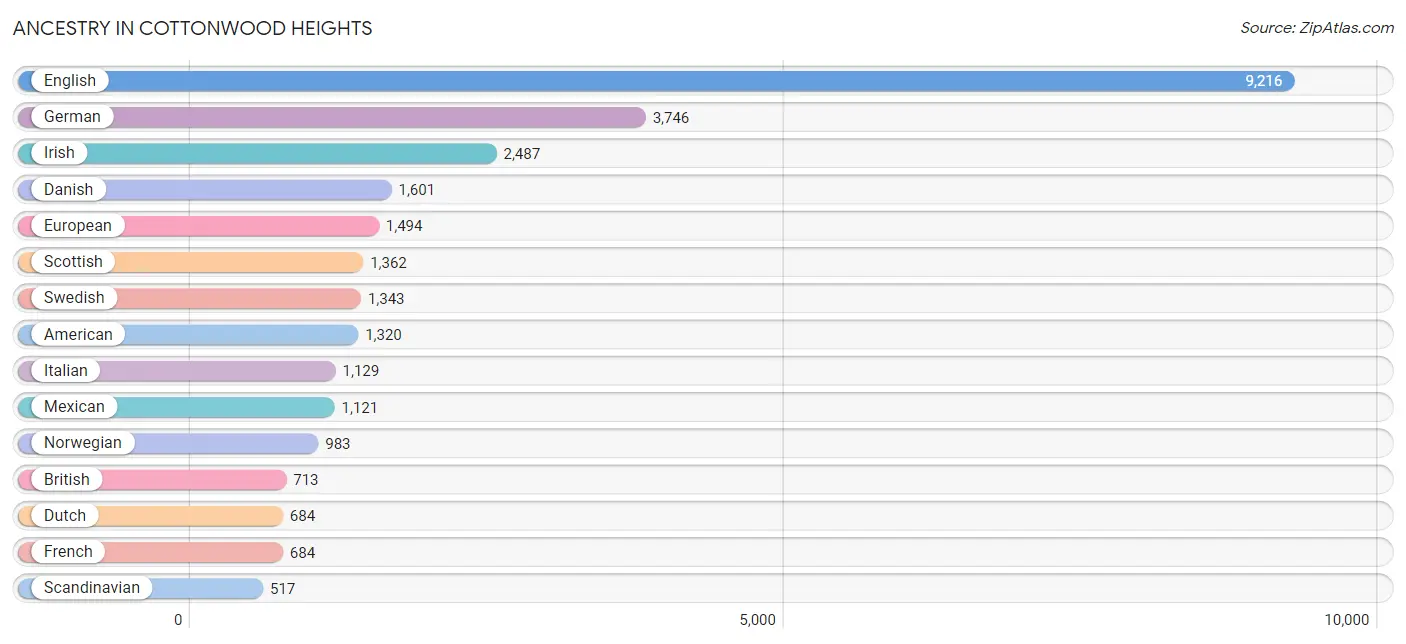
Ancestry in Cottonwood Heights
The most populous ancestries reported in Cottonwood Heights are English (9,216 | 27.7%), German (3,746 | 11.3%), Irish (2,487 | 7.5%), Danish (1,601 | 4.8%), and European (1,494 | 4.5%), together accounting for 55.8% of all Cottonwood Heights residents.
| Ancestry | # Population | % Population |
| African | 25 | 0.1% |
| Albanian | 8 | 0.0% |
| American | 1,320 | 4.0% |
| Apache | 29 | 0.1% |
| Arab | 178 | 0.5% |
| Argentinean | 3 | 0.0% |
| Armenian | 13 | 0.0% |
| Australian | 18 | 0.1% |
| Austrian | 79 | 0.2% |
| Basque | 18 | 0.1% |
| Belgian | 17 | 0.1% |
| Bhutanese | 145 | 0.4% |
| Brazilian | 100 | 0.3% |
| British | 713 | 2.1% |
| Burmese | 77 | 0.2% |
| Canadian | 79 | 0.2% |
| Celtic | 16 | 0.1% |
| Central American | 118 | 0.4% |
| Cherokee | 43 | 0.1% |
| Chilean | 27 | 0.1% |
| Chippewa | 4 | 0.0% |
| Colombian | 23 | 0.1% |
| Costa Rican | 79 | 0.2% |
| Croatian | 61 | 0.2% |
| Czech | 61 | 0.2% |
| Danish | 1,601 | 4.8% |
| Dutch | 684 | 2.1% |
| Eastern European | 22 | 0.1% |
| English | 9,216 | 27.7% |
| European | 1,494 | 4.5% |
| Filipino | 44 | 0.1% |
| Finnish | 51 | 0.2% |
| French | 684 | 2.1% |
| French Canadian | 155 | 0.5% |
| German | 3,746 | 11.3% |
| Greek | 246 | 0.7% |
| Guatemalan | 32 | 0.1% |
| Honduran | 7 | 0.0% |
| Hungarian | 154 | 0.5% |
| Icelander | 74 | 0.2% |
| Indian (Asian) | 485 | 1.5% |
| Iranian | 253 | 0.8% |
| Iraqi | 23 | 0.1% |
| Irish | 2,487 | 7.5% |
| Iroquois | 23 | 0.1% |
| Israeli | 46 | 0.1% |
| Italian | 1,129 | 3.4% |
| Korean | 288 | 0.9% |
| Laotian | 18 | 0.1% |
| Lebanese | 155 | 0.5% |
| Liberian | 38 | 0.1% |
| Lithuanian | 95 | 0.3% |
| Mexican | 1,121 | 3.4% |
| Mexican American Indian | 95 | 0.3% |
| Native Hawaiian | 91 | 0.3% |
| Navajo | 66 | 0.2% |
| New Zealander | 19 | 0.1% |
| Northern European | 204 | 0.6% |
| Norwegian | 983 | 3.0% |
| Pakistani | 20 | 0.1% |
| Peruvian | 35 | 0.1% |
| Polish | 449 | 1.3% |
| Portuguese | 31 | 0.1% |
| Potawatomi | 12 | 0.0% |
| Puerto Rican | 71 | 0.2% |
| Romanian | 31 | 0.1% |
| Russian | 256 | 0.8% |
| Samoan | 185 | 0.6% |
| Scandinavian | 517 | 1.5% |
| Scotch-Irish | 286 | 0.9% |
| Scottish | 1,362 | 4.1% |
| Serbian | 16 | 0.1% |
| Sioux | 30 | 0.1% |
| Slavic | 38 | 0.1% |
| Slovene | 53 | 0.2% |
| South African | 31 | 0.1% |
| South American | 200 | 0.6% |
| South American Indian | 26 | 0.1% |
| Spaniard | 94 | 0.3% |
| Spanish | 111 | 0.3% |
| Sri Lankan | 22 | 0.1% |
| Subsaharan African | 160 | 0.5% |
| Sudanese | 26 | 0.1% |
| Swedish | 1,343 | 4.0% |
| Swiss | 372 | 1.1% |
| Thai | 492 | 1.5% |
| Tongan | 259 | 0.8% |
| Ugandan | 16 | 0.1% |
| Ukrainian | 23 | 0.1% |
| Uruguayan | 10 | 0.0% |
| Venezuelan | 102 | 0.3% |
| Welsh | 341 | 1.0% |
| Yugoslavian | 13 | 0.0% | View All 93 Rows |
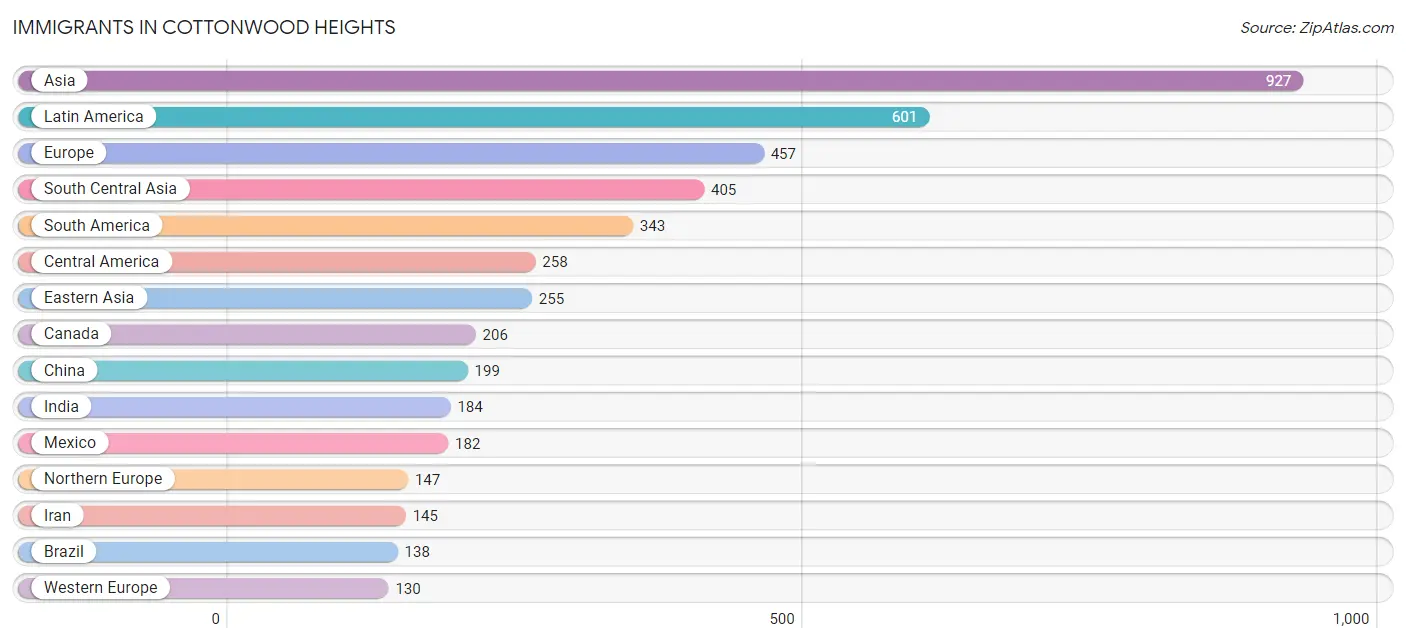
Immigrants in Cottonwood Heights
The most numerous immigrant groups reported in Cottonwood Heights came from Asia (927 | 2.8%), Latin America (601 | 1.8%), Europe (457 | 1.4%), South Central Asia (405 | 1.2%), and South America (343 | 1.0%), together accounting for 8.2% of all Cottonwood Heights residents.
| Immigration Origin | # Population | % Population |
| Africa | 108 | 0.3% |
| Argentina | 23 | 0.1% |
| Asia | 927 | 2.8% |
| Australia | 4 | 0.0% |
| Bolivia | 26 | 0.1% |
| Brazil | 138 | 0.4% |
| Canada | 206 | 0.6% |
| Central America | 258 | 0.8% |
| Chile | 13 | 0.0% |
| China | 199 | 0.6% |
| Colombia | 23 | 0.1% |
| Costa Rica | 44 | 0.1% |
| Czechoslovakia | 33 | 0.1% |
| Eastern Africa | 16 | 0.1% |
| Eastern Asia | 255 | 0.8% |
| Eastern Europe | 107 | 0.3% |
| England | 21 | 0.1% |
| Europe | 457 | 1.4% |
| Germany | 105 | 0.3% |
| Greece | 58 | 0.2% |
| Guatemala | 32 | 0.1% |
| Hungary | 6 | 0.0% |
| India | 184 | 0.5% |
| Iran | 145 | 0.4% |
| Iraq | 23 | 0.1% |
| Israel | 16 | 0.1% |
| Japan | 22 | 0.1% |
| Korea | 34 | 0.1% |
| Kuwait | 7 | 0.0% |
| Laos | 29 | 0.1% |
| Latin America | 601 | 1.8% |
| Liberia | 38 | 0.1% |
| Lithuania | 42 | 0.1% |
| Mexico | 182 | 0.5% |
| Netherlands | 5 | 0.0% |
| Northern Europe | 147 | 0.4% |
| Oceania | 28 | 0.1% |
| Pakistan | 76 | 0.2% |
| Peru | 18 | 0.1% |
| Philippines | 31 | 0.1% |
| Poland | 9 | 0.0% |
| Romania | 8 | 0.0% |
| Russia | 9 | 0.0% |
| South Africa | 54 | 0.2% |
| South America | 343 | 1.0% |
| South Central Asia | 405 | 1.2% |
| South Eastern Asia | 99 | 0.3% |
| Southern Europe | 73 | 0.2% |
| Spain | 15 | 0.1% |
| Switzerland | 20 | 0.1% |
| Taiwan | 25 | 0.1% |
| Thailand | 9 | 0.0% |
| Uganda | 16 | 0.1% |
| Venezuela | 102 | 0.3% |
| Vietnam | 30 | 0.1% |
| Western Africa | 38 | 0.1% |
| Western Asia | 81 | 0.2% |
| Western Europe | 130 | 0.4% | View All 58 Rows |
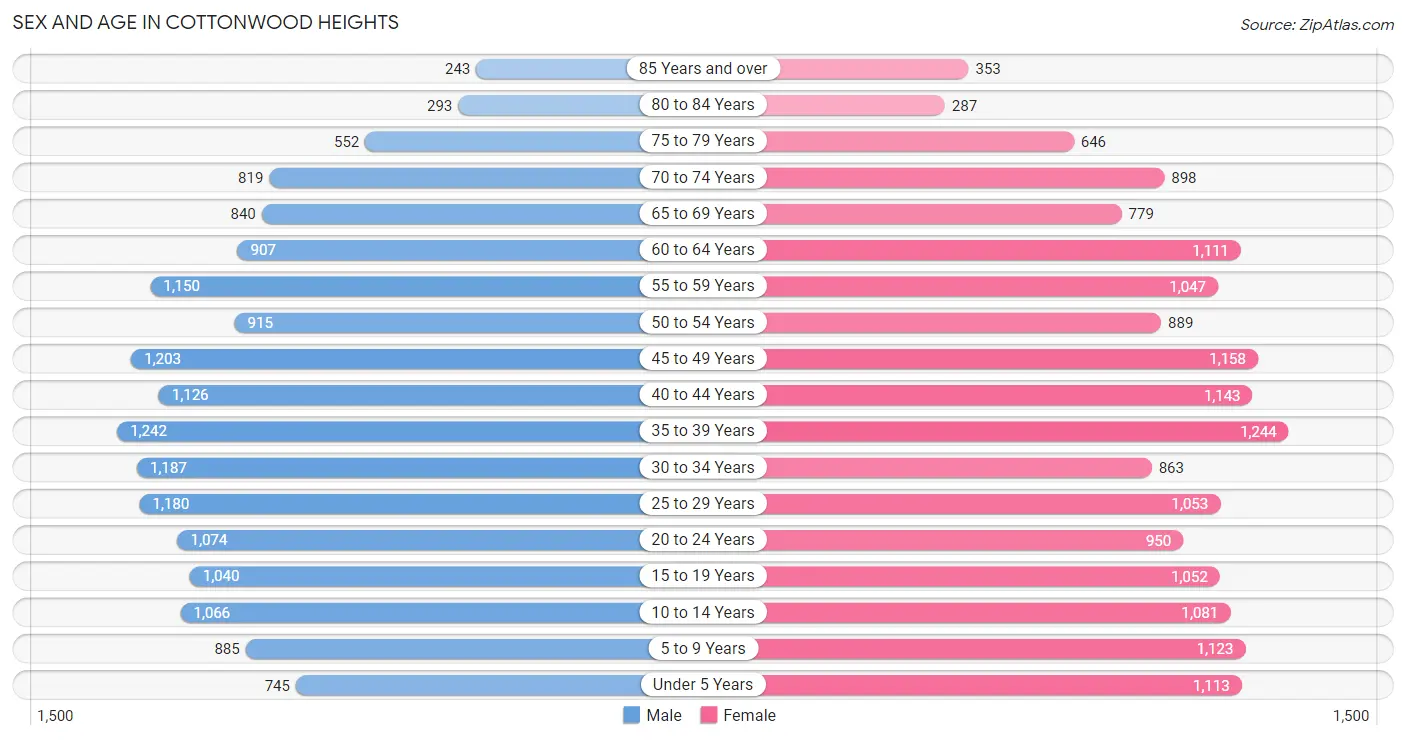
Sex and Age in Cottonwood Heights
Sex and Age in Cottonwood Heights
The most populous age groups in Cottonwood Heights are 35 to 39 Years (1,242 | 7.5%) for men and 35 to 39 Years (1,244 | 7.4%) for women.
| Age Bracket | Male | Female |
| Under 5 Years | 745 (4.5%) | 1,113 (6.6%) |
| 5 to 9 Years | 885 (5.4%) | 1,123 (6.7%) |
| 10 to 14 Years | 1,066 (6.5%) | 1,081 (6.4%) |
| 15 to 19 Years | 1,040 (6.3%) | 1,052 (6.3%) |
| 20 to 24 Years | 1,074 (6.5%) | 950 (5.7%) |
| 25 to 29 Years | 1,180 (7.2%) | 1,053 (6.3%) |
| 30 to 34 Years | 1,187 (7.2%) | 863 (5.1%) |
| 35 to 39 Years | 1,242 (7.5%) | 1,244 (7.4%) |
| 40 to 44 Years | 1,126 (6.8%) | 1,143 (6.8%) |
| 45 to 49 Years | 1,203 (7.3%) | 1,158 (6.9%) |
| 50 to 54 Years | 915 (5.6%) | 889 (5.3%) |
| 55 to 59 Years | 1,150 (7.0%) | 1,047 (6.2%) |
| 60 to 64 Years | 907 (5.5%) | 1,111 (6.6%) |
| 65 to 69 Years | 840 (5.1%) | 779 (4.6%) |
| 70 to 74 Years | 819 (5.0%) | 898 (5.3%) |
| 75 to 79 Years | 552 (3.4%) | 646 (3.8%) |
| 80 to 84 Years | 293 (1.8%) | 287 (1.7%) |
| 85 Years and over | 243 (1.5%) | 353 (2.1%) |
| Total | 16,467 (100.0%) | 16,790 (100.0%) |
Families and Households in Cottonwood Heights
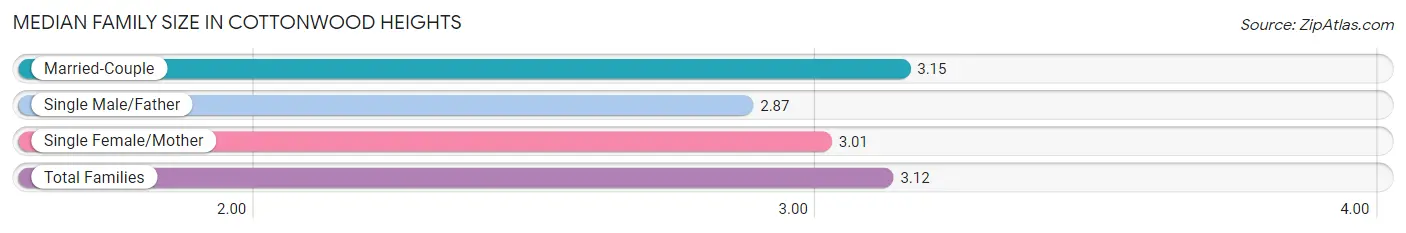
Median Family Size in Cottonwood Heights
The median family size in Cottonwood Heights is 3.12 persons per family, with married-couple families (7,248 | 82.8%) accounting for the largest median family size of 3.15 persons per family. On the other hand, single male/father families (336 | 3.8%) represent the smallest median family size with 2.87 persons per family.
| Family Type | # Families | Family Size |
| Married-Couple | 7,248 (82.8%) | 3.15 |
| Single Male/Father | 336 (3.8%) | 2.87 |
| Single Female/Mother | 1,170 (13.4%) | 3.01 |
| Total Families | 8,754 (100.0%) | 3.12 |
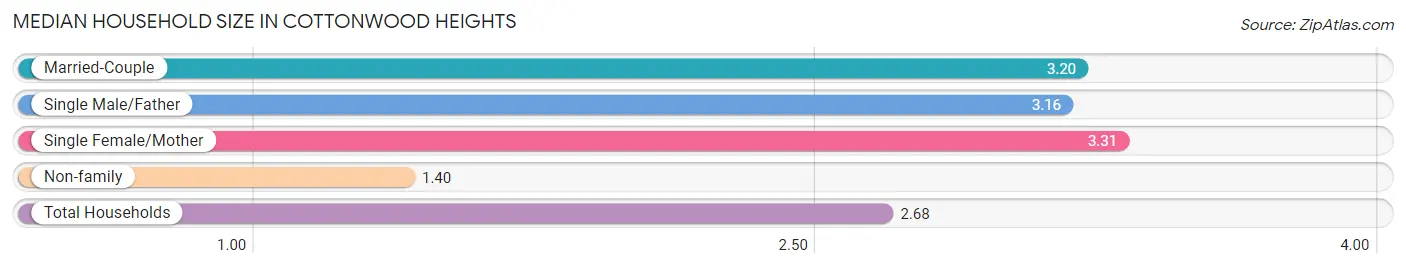
Median Household Size in Cottonwood Heights
The median household size in Cottonwood Heights is 2.68 persons per household, with single female/mother households (1,170 | 9.5%) accounting for the largest median household size of 3.31 persons per household. non-family households (3,607 | 29.2%) represent the smallest median household size with 1.40 persons per household.
| Household Type | # Households | Household Size |
| Married-Couple | 7,248 (58.6%) | 3.20 |
| Single Male/Father | 336 (2.7%) | 3.16 |
| Single Female/Mother | 1,170 (9.5%) | 3.31 |
| Non-family | 3,607 (29.2%) | 1.40 |
| Total Households | 12,361 (100.0%) | 2.68 |
Household Size by Marriage Status in Cottonwood Heights
Out of a total of 12,361 households in Cottonwood Heights, 8,754 (70.8%) are family households, while 3,607 (29.2%) are nonfamily households. The most numerous type of family households are 2-person households, comprising 3,968, and the most common type of nonfamily households are 1-person households, comprising 2,656.
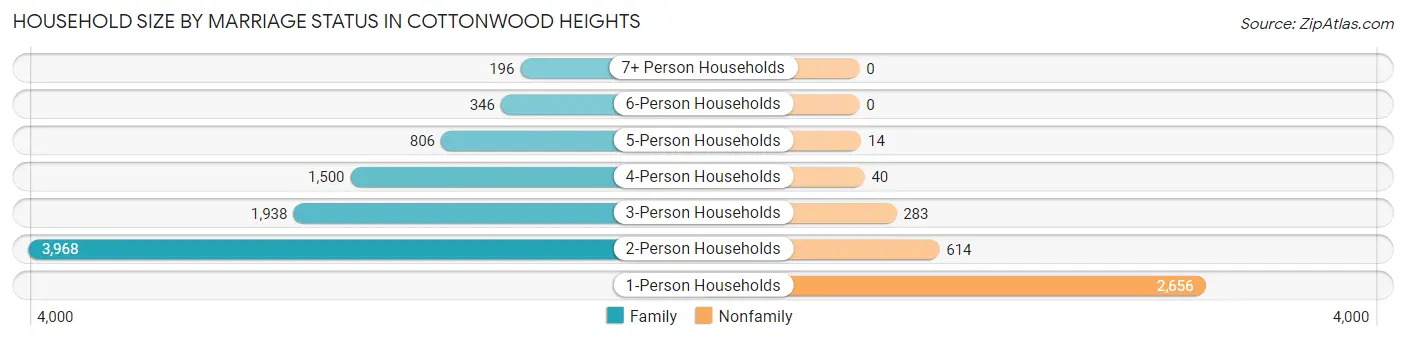
| Household Size | Family Households | Nonfamily Households |
| 1-Person Households | - | 2,656 (21.5%) |
| 2-Person Households | 3,968 (32.1%) | 614 (5.0%) |
| 3-Person Households | 1,938 (15.7%) | 283 (2.3%) |
| 4-Person Households | 1,500 (12.1%) | 40 (0.3%) |
| 5-Person Households | 806 (6.5%) | 14 (0.1%) |
| 6-Person Households | 346 (2.8%) | 0 (0.0%) |
| 7+ Person Households | 196 (1.6%) | 0 (0.0%) |
| Total | 8,754 (70.8%) | 3,607 (29.2%) |
Female Fertility in Cottonwood Heights
Fertility by Age in Cottonwood Heights
Average fertility rate in Cottonwood Heights is 57.0 births per 1,000 women. Women in the age bracket of 20 to 34 years have the highest fertility rate with 79.0 births per 1,000 women. Women in the age bracket of 20 to 34 years acount for 52.3% of all women with births.
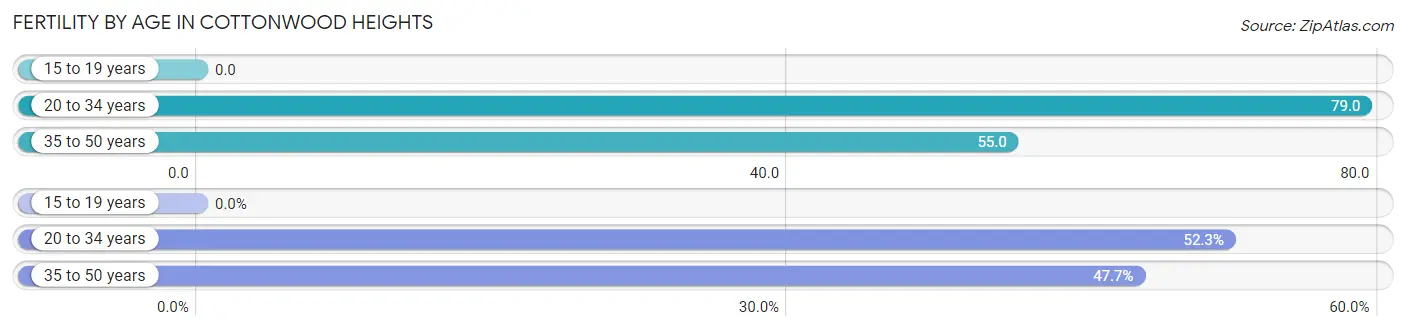
| Age Bracket | Women with Births | Births / 1,000 Women |
| 15 to 19 years | 0 (0.0%) | 0.0 |
| 20 to 34 years | 227 (52.3%) | 79.0 |
| 35 to 50 years | 207 (47.7%) | 55.0 |
| Total | 434 (100.0%) | 57.0 |
Fertility by Age by Marriage Status in Cottonwood Heights
99.3% of women with births (434) in Cottonwood Heights are married. The highest percentage of unmarried women with births falls into 20 to 34 years age bracket with 1.3% of them unmarried at the time of birth, while the lowest percentage of unmarried women with births belong to 35 to 50 years age bracket with 0.0% of them unmarried.
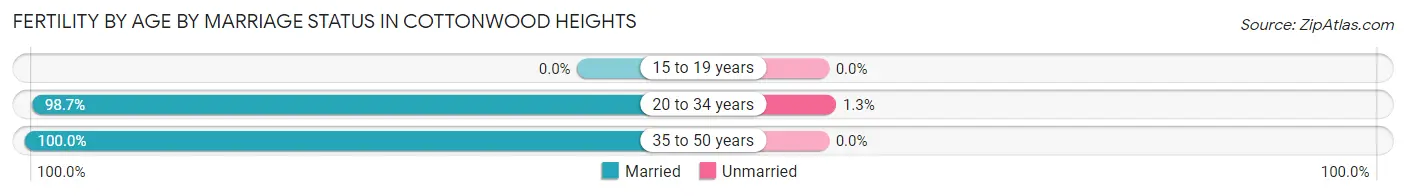
| Age Bracket | Married | Unmarried |
| 15 to 19 years | 0 (0.0%) | 0 (0.0%) |
| 20 to 34 years | 224 (98.7%) | 3 (1.3%) |
| 35 to 50 years | 207 (100.0%) | 0 (0.0%) |
| Total | 431 (99.3%) | 3 (0.7%) |
Fertility by Education in Cottonwood Heights
Average fertility rate in Cottonwood Heights is 57.0 births per 1,000 women. Women with the education attainment of graduate degree have the highest fertility rate of 101.0 births per 1,000 women, while women with the education attainment of high school diploma have the lowest fertility at 16.0 births per 1,000 women. Women with the education attainment of college or associate's degree represent 35.7% of all women with births.
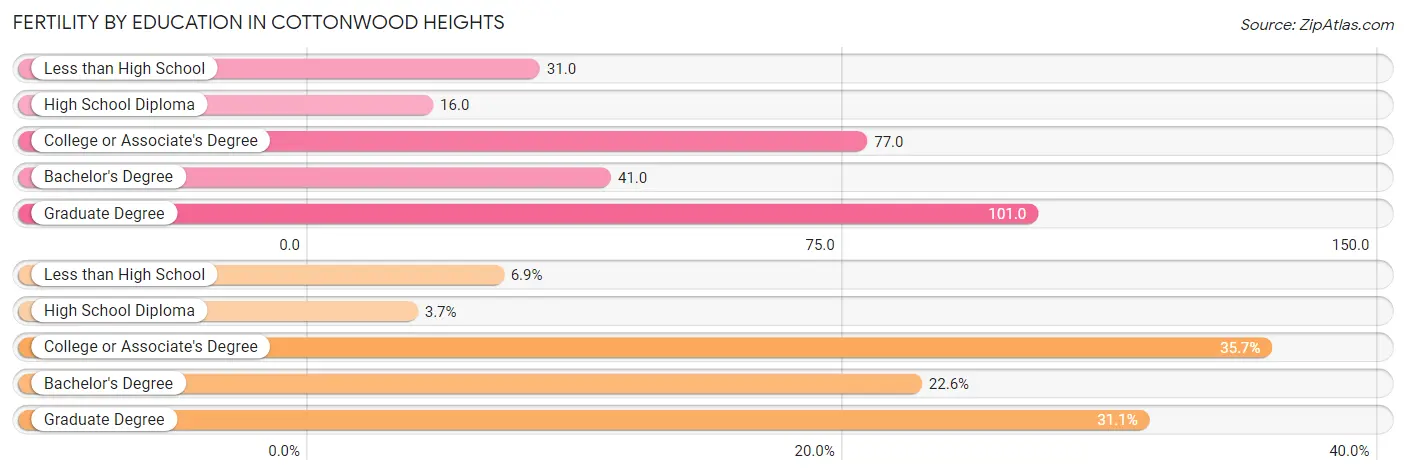
| Educational Attainment | Women with Births | Births / 1,000 Women |
| Less than High School | 30 (6.9%) | 31.0 |
| High School Diploma | 16 (3.7%) | 16.0 |
| College or Associate's Degree | 155 (35.7%) | 77.0 |
| Bachelor's Degree | 98 (22.6%) | 41.0 |
| Graduate Degree | 135 (31.1%) | 101.0 |
| Total | 434 (100.0%) | 57.0 |
Fertility by Education by Marriage Status in Cottonwood Heights
0.7% of women with births in Cottonwood Heights are unmarried. Women with the educational attainment of less than high school are most likely to be married with 100.0% of them married at childbirth, while women with the educational attainment of high school diploma are least likely to be married with 18.8% of them unmarried at childbirth.
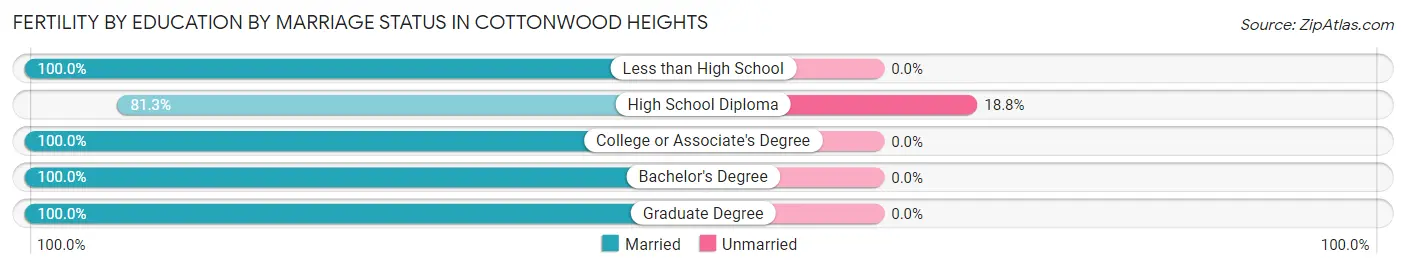
| Educational Attainment | Married | Unmarried |
| Less than High School | 30 (100.0%) | 0 (0.0%) |
| High School Diploma | 13 (81.2%) | 3 (18.8%) |
| College or Associate's Degree | 155 (100.0%) | 0 (0.0%) |
| Bachelor's Degree | 98 (100.0%) | 0 (0.0%) |
| Graduate Degree | 135 (100.0%) | 0 (0.0%) |
| Total | 431 (99.3%) | 3 (0.7%) |
Employment Characteristics in Cottonwood Heights
Employment by Class of Employer in Cottonwood Heights
Among the 17,894 employed individuals in Cottonwood Heights, private company employees (11,729 | 65.5%), not-for-profit organizations (1,700 | 9.5%), and self-employed (not incorporated) (1,257 | 7.0%) make up the most common classes of employment.
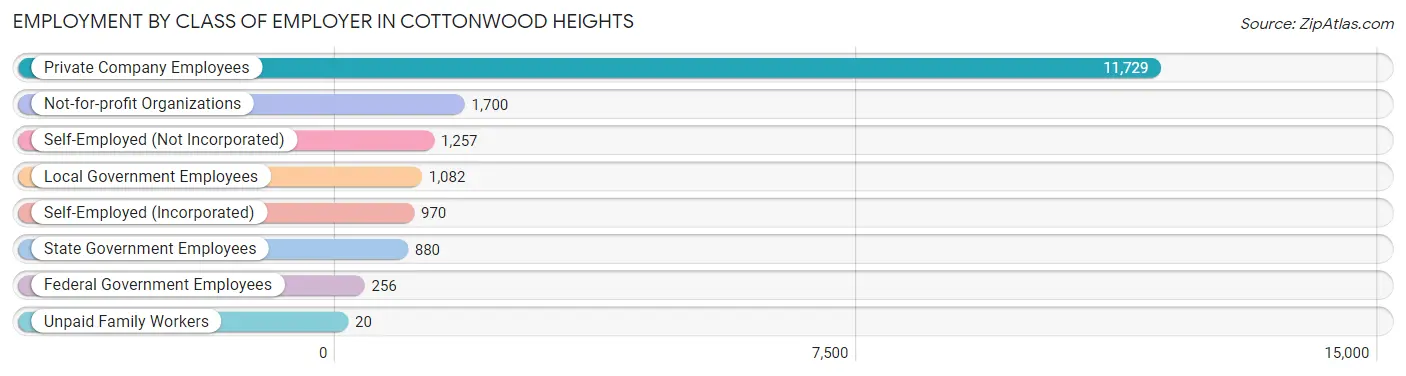
| Employer Class | # Employees | % Employees |
| Private Company Employees | 11,729 | 65.5% |
| Self-Employed (Incorporated) | 970 | 5.4% |
| Self-Employed (Not Incorporated) | 1,257 | 7.0% |
| Not-for-profit Organizations | 1,700 | 9.5% |
| Local Government Employees | 1,082 | 6.0% |
| State Government Employees | 880 | 4.9% |
| Federal Government Employees | 256 | 1.4% |
| Unpaid Family Workers | 20 | 0.1% |
| Total | 17,894 | 100.0% |
Employment Status by Age in Cottonwood Heights
According to the labor force statistics for Cottonwood Heights, out of the total population over 16 years of age (26,785), 70.2% or 18,803 individuals are in the labor force, with 3.2% or 602 of them unemployed. The age group with the highest labor force participation rate is 35 to 44 years, with 89.7% or 4,265 individuals in the labor force. Within the labor force, the 16 to 19 years age range has the highest percentage of unemployed individuals, with 13.4% or 116 of them being unemployed.
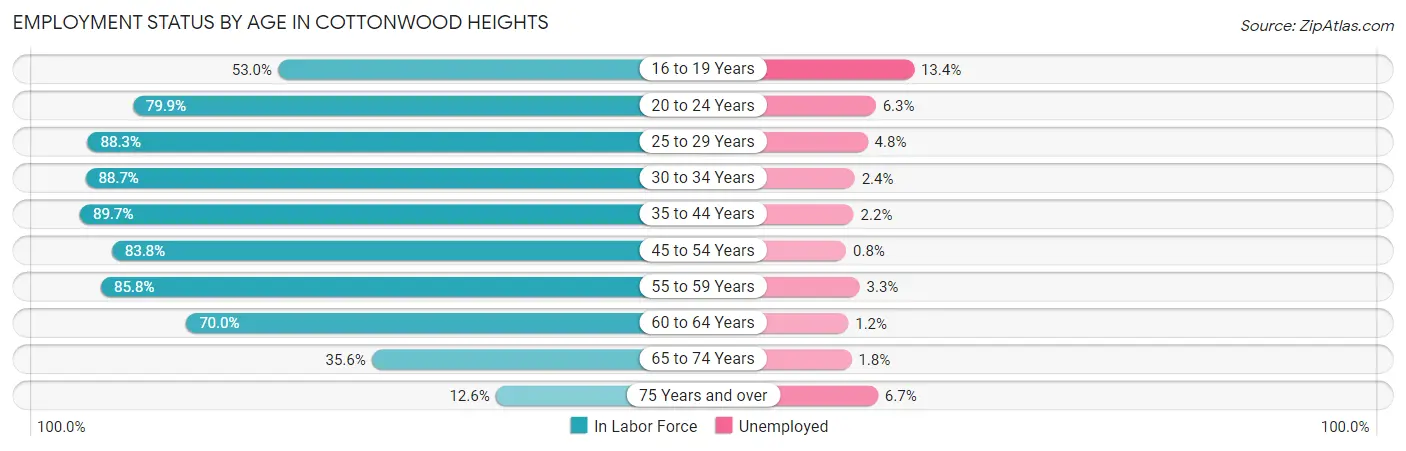
| Age Bracket | In Labor Force | Unemployed |
| 16 to 19 Years | 865 (53.0%) | 116 (13.4%) |
| 20 to 24 Years | 1,617 (79.9%) | 102 (6.3%) |
| 25 to 29 Years | 1,972 (88.3%) | 95 (4.8%) |
| 30 to 34 Years | 1,818 (88.7%) | 44 (2.4%) |
| 35 to 44 Years | 4,265 (89.7%) | 94 (2.2%) |
| 45 to 54 Years | 3,490 (83.8%) | 28 (0.8%) |
| 55 to 59 Years | 1,885 (85.8%) | 62 (3.3%) |
| 60 to 64 Years | 1,413 (70.0%) | 17 (1.2%) |
| 65 to 74 Years | 1,188 (35.6%) | 21 (1.8%) |
| 75 Years and over | 299 (12.6%) | 20 (6.7%) |
| Total | 18,803 (70.2%) | 602 (3.2%) |
Employment Status by Educational Attainment in Cottonwood Heights
According to labor force statistics for Cottonwood Heights, 85.2% of individuals (14,840) out of the total population between 25 and 64 years of age (17,418) are in the labor force, with 2.3% or 341 of them being unemployed. The group with the highest labor force participation rate are those with the educational attainment of bachelor's degree or higher, with 87.6% or 8,730 individuals in the labor force. Within the labor force, individuals with high school diploma education have the highest percentage of unemployment, with 2.6% or 59 of them being unemployed.
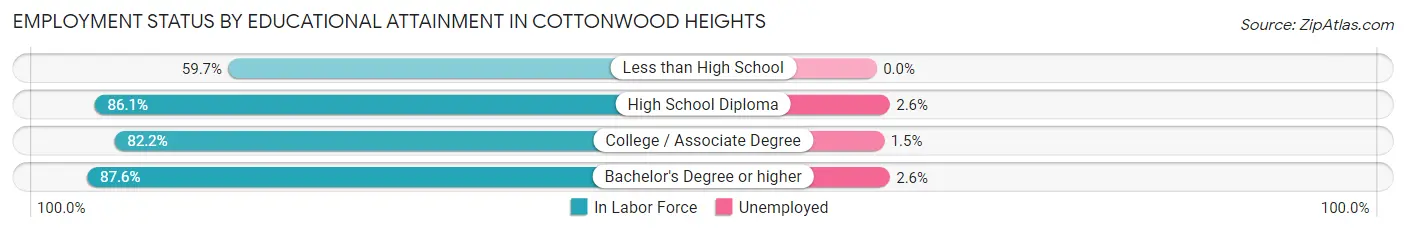
| Educational Attainment | In Labor Force | Unemployed |
| Less than High School | 324 (59.7%) | 0 (0.0%) |
| High School Diploma | 2,265 (86.1%) | 68 (2.6%) |
| College / Associate Degree | 3,517 (82.2%) | 64 (1.5%) |
| Bachelor's Degree or higher | 8,730 (87.6%) | 259 (2.6%) |
| Total | 14,840 (85.2%) | 401 (2.3%) |
Employment Occupations by Sex in Cottonwood Heights
Management, Business, Science and Arts Occupations
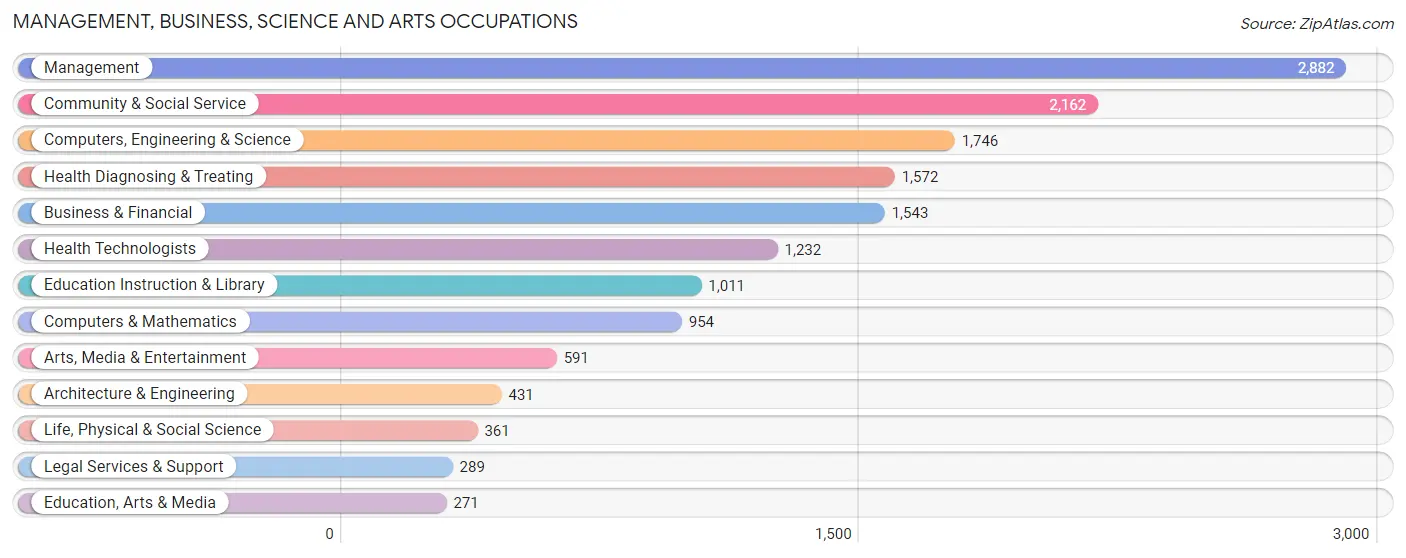
The most common Management, Business, Science and Arts occupations in Cottonwood Heights are Management (2,882 | 15.8%), Community & Social Service (2,162 | 11.9%), Computers, Engineering & Science (1,746 | 9.6%), Health Diagnosing & Treating (1,572 | 8.6%), and Business & Financial (1,543 | 8.5%).
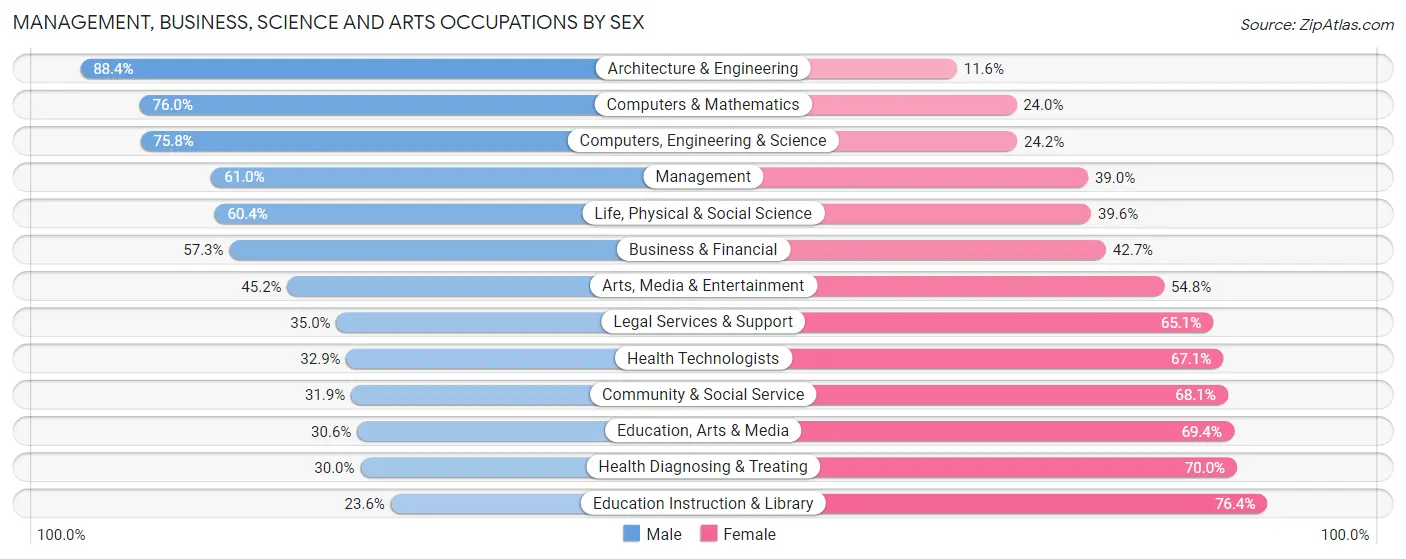
Management, Business, Science and Arts Occupations by Sex
Within the Management, Business, Science and Arts occupations in Cottonwood Heights, the most male-oriented occupations are Architecture & Engineering (88.4%), Computers & Mathematics (76.0%), and Computers, Engineering & Science (75.8%), while the most female-oriented occupations are Education Instruction & Library (76.4%), Health Diagnosing & Treating (70.0%), and Education, Arts & Media (69.4%).
| Occupation | Male | Female |
| Management | 1,759 (61.0%) | 1,123 (39.0%) |
| Business & Financial | 884 (57.3%) | 659 (42.7%) |
| Computers, Engineering & Science | 1,324 (75.8%) | 422 (24.2%) |
| Computers & Mathematics | 725 (76.0%) | 229 (24.0%) |
| Architecture & Engineering | 381 (88.4%) | 50 (11.6%) |
| Life, Physical & Social Science | 218 (60.4%) | 143 (39.6%) |
| Community & Social Service | 690 (31.9%) | 1,472 (68.1%) |
| Education, Arts & Media | 83 (30.6%) | 188 (69.4%) |
| Legal Services & Support | 101 (34.9%) | 188 (65.0%) |
| Education Instruction & Library | 239 (23.6%) | 772 (76.4%) |
| Arts, Media & Entertainment | 267 (45.2%) | 324 (54.8%) |
| Health Diagnosing & Treating | 471 (30.0%) | 1,101 (70.0%) |
| Health Technologists | 405 (32.9%) | 827 (67.1%) |
| Total (Category) | 5,128 (51.8%) | 4,777 (48.2%) |
| Total (Overall) | 9,797 (53.8%) | 8,411 (46.2%) |
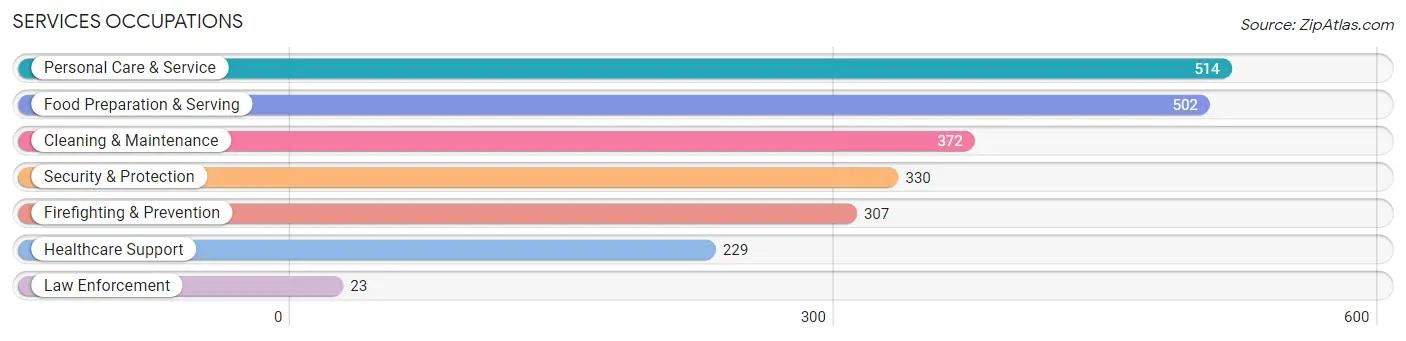
Services Occupations
The most common Services occupations in Cottonwood Heights are Personal Care & Service (514 | 2.8%), Food Preparation & Serving (502 | 2.8%), Cleaning & Maintenance (372 | 2.0%), Security & Protection (330 | 1.8%), and Firefighting & Prevention (307 | 1.7%).
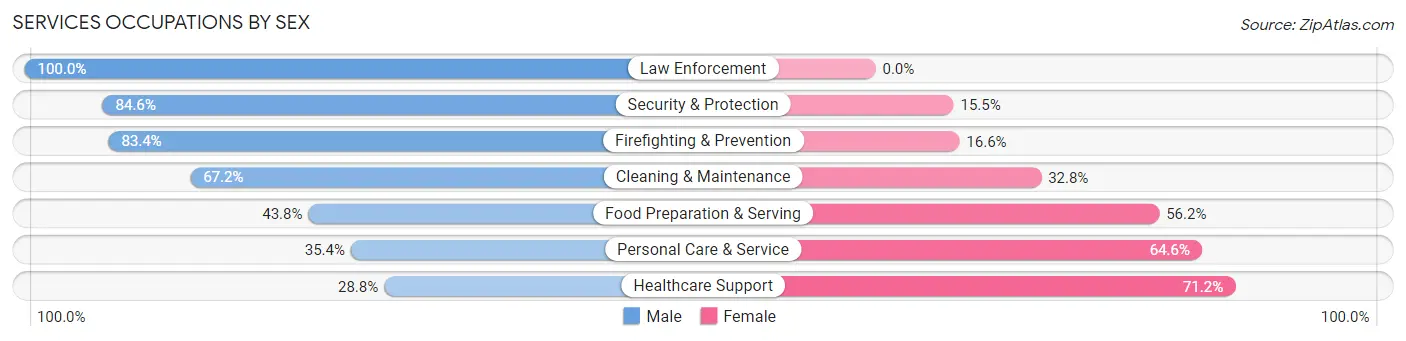
Services Occupations by Sex
Within the Services occupations in Cottonwood Heights, the most male-oriented occupations are Law Enforcement (100.0%), Security & Protection (84.6%), and Firefighting & Prevention (83.4%), while the most female-oriented occupations are Healthcare Support (71.2%), Personal Care & Service (64.6%), and Food Preparation & Serving (56.2%).
| Occupation | Male | Female |
| Healthcare Support | 66 (28.8%) | 163 (71.2%) |
| Security & Protection | 279 (84.6%) | 51 (15.4%) |
| Firefighting & Prevention | 256 (83.4%) | 51 (16.6%) |
| Law Enforcement | 23 (100.0%) | 0 (0.0%) |
| Food Preparation & Serving | 220 (43.8%) | 282 (56.2%) |
| Cleaning & Maintenance | 250 (67.2%) | 122 (32.8%) |
| Personal Care & Service | 182 (35.4%) | 332 (64.6%) |
| Total (Category) | 997 (51.2%) | 950 (48.8%) |
| Total (Overall) | 9,797 (53.8%) | 8,411 (46.2%) |
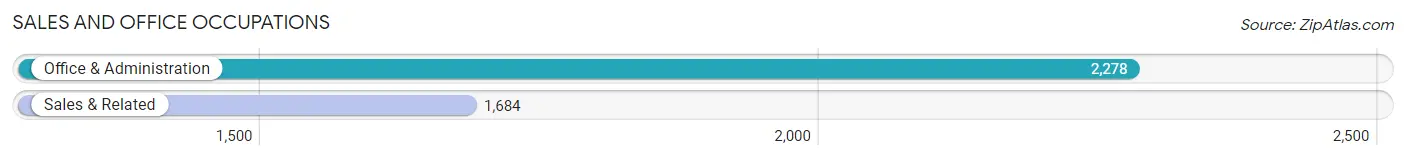
Sales and Office Occupations
The most common Sales and Office occupations in Cottonwood Heights are Office & Administration (2,278 | 12.5%), and Sales & Related (1,684 | 9.2%).
Sales and Office Occupations by Sex
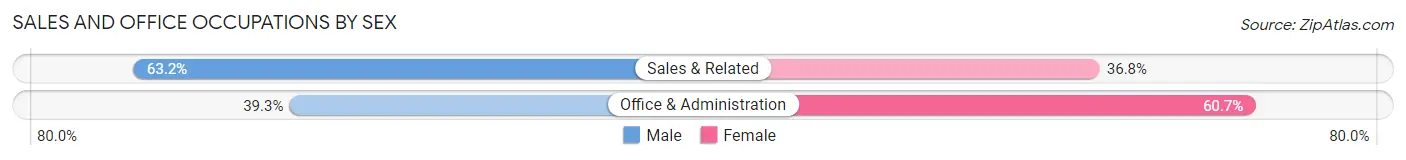
| Occupation | Male | Female |
| Sales & Related | 1,064 (63.2%) | 620 (36.8%) |
| Office & Administration | 895 (39.3%) | 1,383 (60.7%) |
| Total (Category) | 1,959 (49.4%) | 2,003 (50.6%) |
| Total (Overall) | 9,797 (53.8%) | 8,411 (46.2%) |
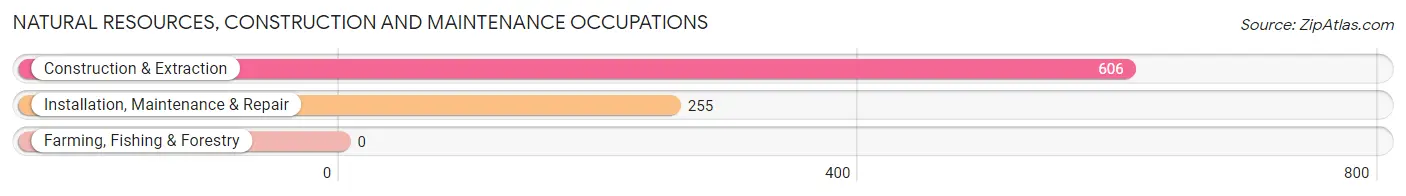
Natural Resources, Construction and Maintenance Occupations
The most common Natural Resources, Construction and Maintenance occupations in Cottonwood Heights are Construction & Extraction (606 | 3.3%), and Installation, Maintenance & Repair (255 | 1.4%).
Natural Resources, Construction and Maintenance Occupations by Sex
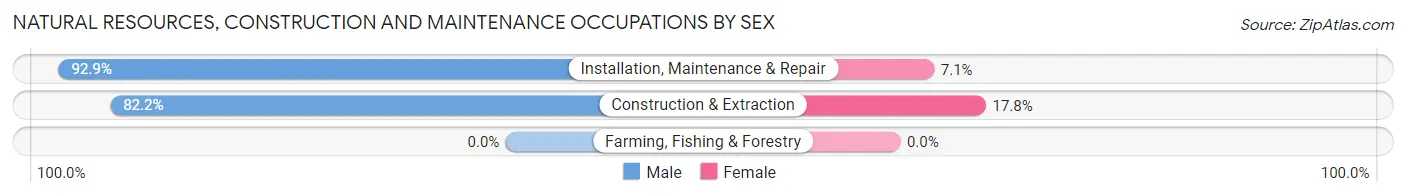
| Occupation | Male | Female |
| Farming, Fishing & Forestry | 0 (0.0%) | 0 (0.0%) |
| Construction & Extraction | 498 (82.2%) | 108 (17.8%) |
| Installation, Maintenance & Repair | 237 (92.9%) | 18 (7.1%) |
| Total (Category) | 735 (85.4%) | 126 (14.6%) |
| Total (Overall) | 9,797 (53.8%) | 8,411 (46.2%) |
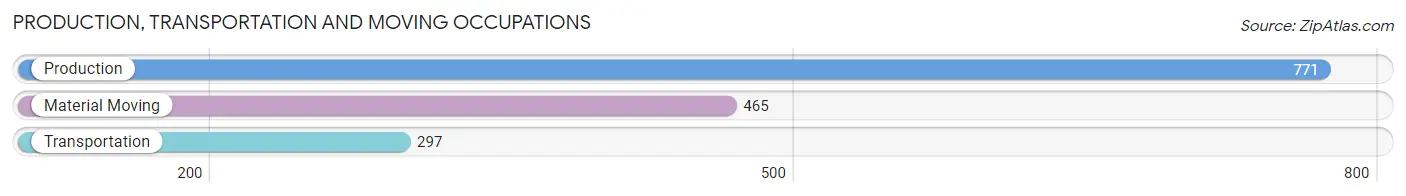
Production, Transportation and Moving Occupations
The most common Production, Transportation and Moving occupations in Cottonwood Heights are Production (771 | 4.2%), Material Moving (465 | 2.5%), and Transportation (297 | 1.6%).
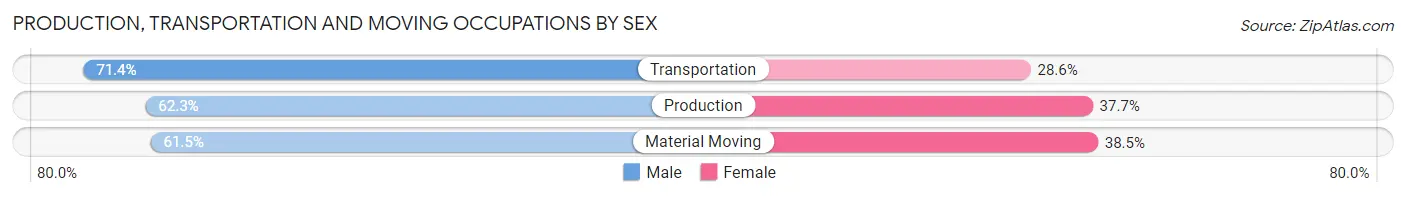
Production, Transportation and Moving Occupations by Sex
| Occupation | Male | Female |
| Production | 480 (62.3%) | 291 (37.7%) |
| Transportation | 212 (71.4%) | 85 (28.6%) |
| Material Moving | 286 (61.5%) | 179 (38.5%) |
| Total (Category) | 978 (63.8%) | 555 (36.2%) |
| Total (Overall) | 9,797 (53.8%) | 8,411 (46.2%) |
Employment Industries by Sex in Cottonwood Heights
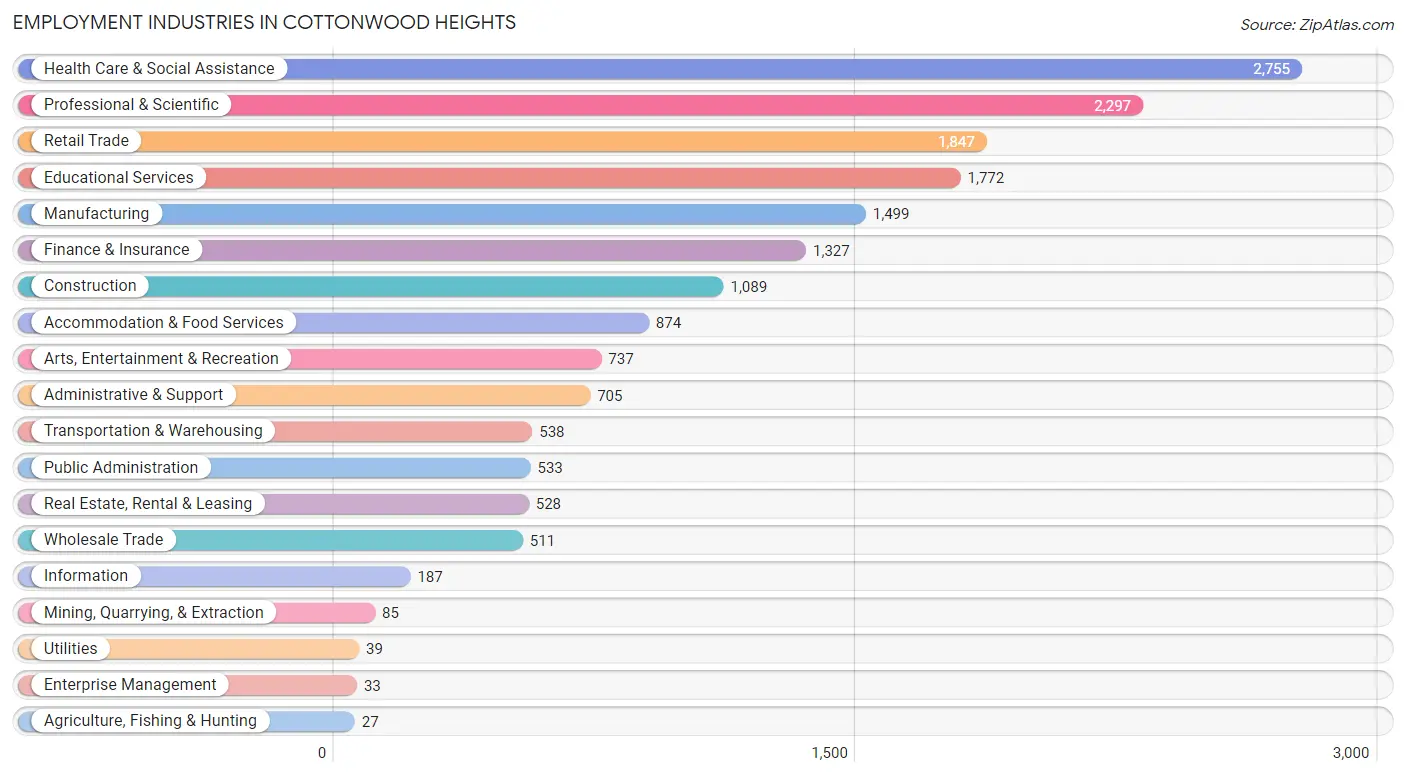
Employment Industries in Cottonwood Heights
The major employment industries in Cottonwood Heights include Health Care & Social Assistance (2,755 | 15.1%), Professional & Scientific (2,297 | 12.6%), Retail Trade (1,847 | 10.1%), Educational Services (1,772 | 9.7%), and Manufacturing (1,499 | 8.2%).
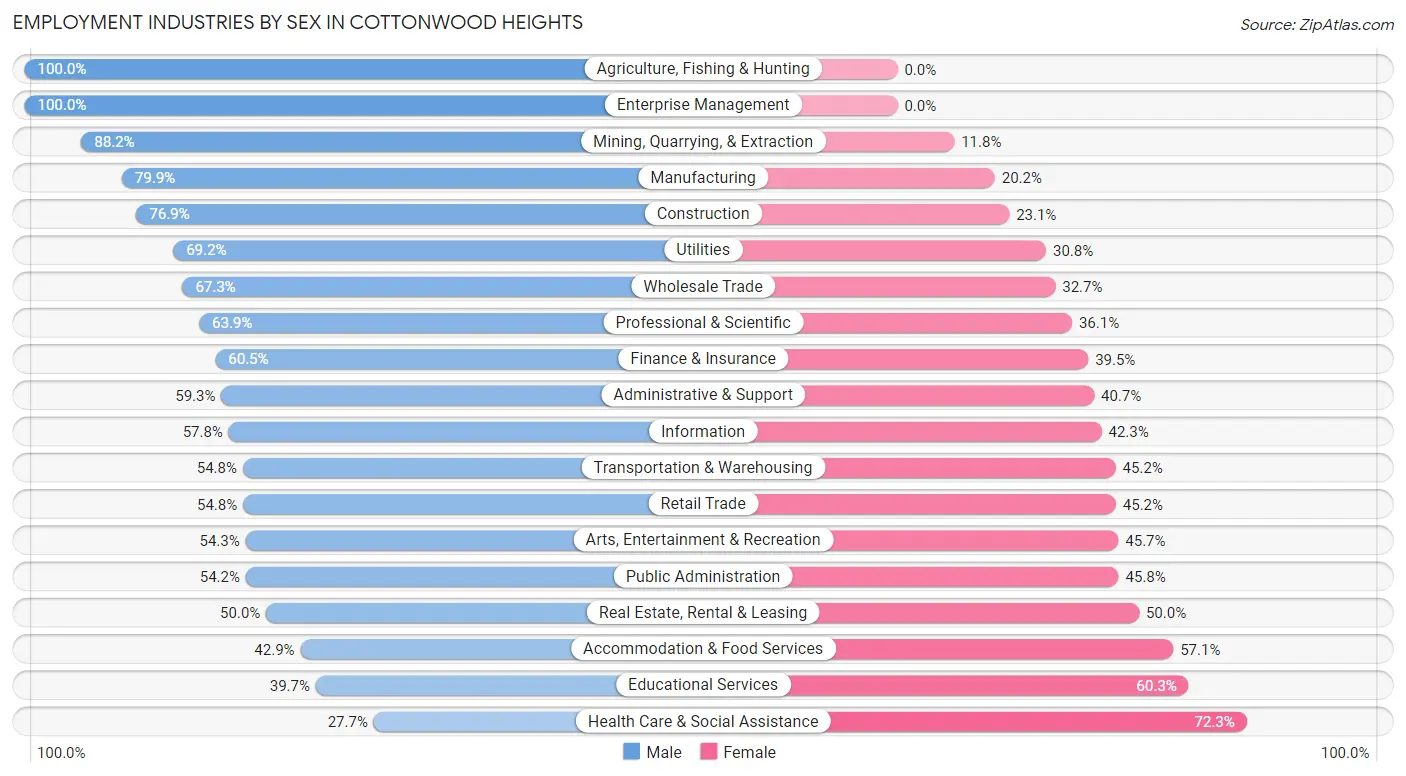
Employment Industries by Sex in Cottonwood Heights
The Cottonwood Heights industries that see more men than women are Agriculture, Fishing & Hunting (100.0%), Enterprise Management (100.0%), and Mining, Quarrying, & Extraction (88.2%), whereas the industries that tend to have a higher number of women are Health Care & Social Assistance (72.3%), Educational Services (60.3%), and Accommodation & Food Services (57.1%).
| Industry | Male | Female |
| Agriculture, Fishing & Hunting | 27 (100.0%) | 0 (0.0%) |
| Mining, Quarrying, & Extraction | 75 (88.2%) | 10 (11.8%) |
| Construction | 837 (76.9%) | 252 (23.1%) |
| Manufacturing | 1,197 (79.8%) | 302 (20.2%) |
| Wholesale Trade | 344 (67.3%) | 167 (32.7%) |
| Retail Trade | 1,012 (54.8%) | 835 (45.2%) |
| Transportation & Warehousing | 295 (54.8%) | 243 (45.2%) |
| Utilities | 27 (69.2%) | 12 (30.8%) |
| Information | 108 (57.8%) | 79 (42.2%) |
| Finance & Insurance | 803 (60.5%) | 524 (39.5%) |
| Real Estate, Rental & Leasing | 264 (50.0%) | 264 (50.0%) |
| Professional & Scientific | 1,467 (63.9%) | 830 (36.1%) |
| Enterprise Management | 33 (100.0%) | 0 (0.0%) |
| Administrative & Support | 418 (59.3%) | 287 (40.7%) |
| Educational Services | 704 (39.7%) | 1,068 (60.3%) |
| Health Care & Social Assistance | 764 (27.7%) | 1,991 (72.3%) |
| Arts, Entertainment & Recreation | 400 (54.3%) | 337 (45.7%) |
| Accommodation & Food Services | 375 (42.9%) | 499 (57.1%) |
| Public Administration | 289 (54.2%) | 244 (45.8%) |
| Total | 9,797 (53.8%) | 8,411 (46.2%) |
Education in Cottonwood Heights
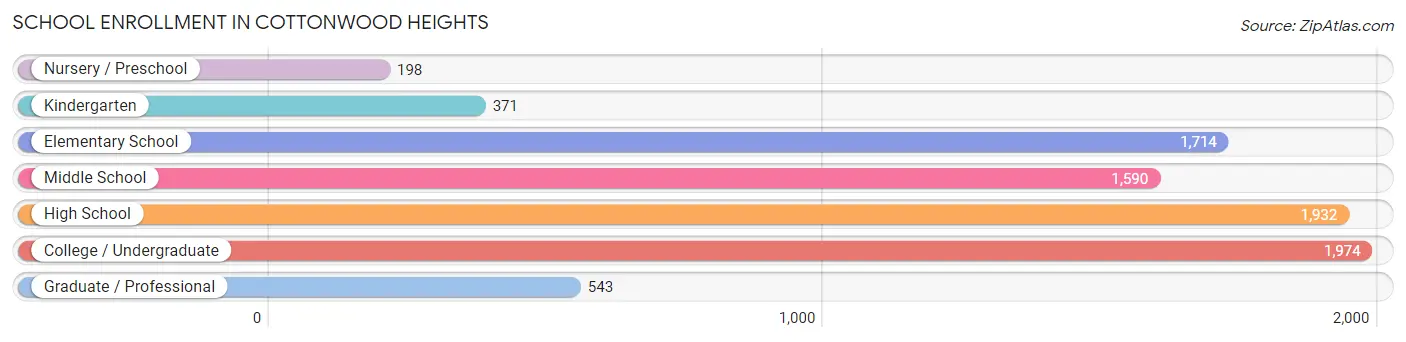
School Enrollment in Cottonwood Heights
The most common levels of schooling among the 8,322 students in Cottonwood Heights are college / undergraduate (1,974 | 23.7%), high school (1,932 | 23.2%), and elementary school (1,714 | 20.6%).
| School Level | # Students | % Students |
| Nursery / Preschool | 198 | 2.4% |
| Kindergarten | 371 | 4.5% |
| Elementary School | 1,714 | 20.6% |
| Middle School | 1,590 | 19.1% |
| High School | 1,932 | 23.2% |
| College / Undergraduate | 1,974 | 23.7% |
| Graduate / Professional | 543 | 6.5% |
| Total | 8,322 | 100.0% |
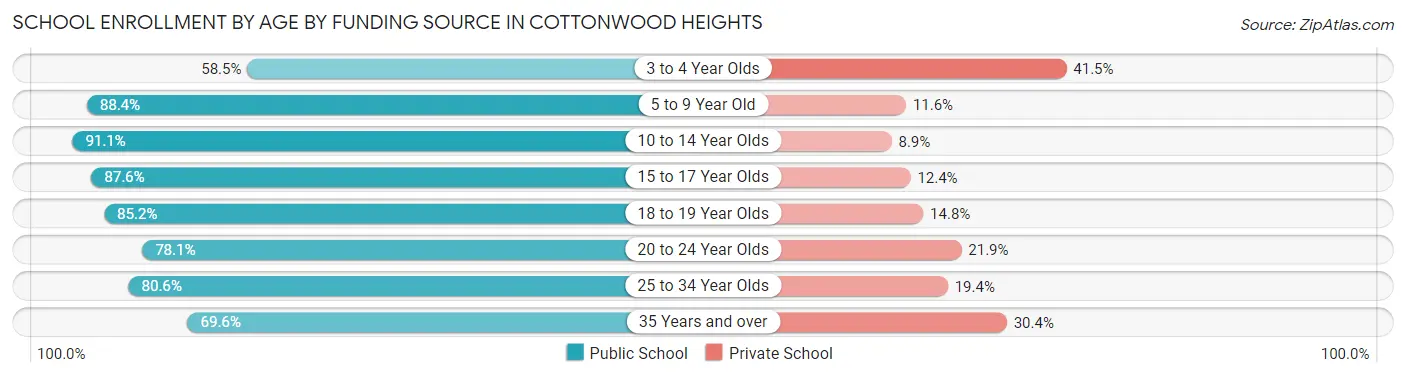
School Enrollment by Age by Funding Source in Cottonwood Heights
Out of a total of 8,322 students who are enrolled in schools in Cottonwood Heights, 1,257 (15.1%) attend a private institution, while the remaining 7,065 (84.9%) are enrolled in public schools. The age group of 3 to 4 year olds has the highest likelihood of being enrolled in private schools, with 73 (41.5% in the age bracket) enrolled. Conversely, the age group of 10 to 14 year olds has the lowest likelihood of being enrolled in a private school, with 1,940 (91.1% in the age bracket) attending a public institution.
| Age Bracket | Public School | Private School |
| 3 to 4 Year Olds | 103 (58.5%) | 73 (41.5%) |
| 5 to 9 Year Old | 1,654 (88.4%) | 217 (11.6%) |
| 10 to 14 Year Olds | 1,940 (91.1%) | 190 (8.9%) |
| 15 to 17 Year Olds | 1,140 (87.6%) | 162 (12.4%) |
| 18 to 19 Year Olds | 552 (85.2%) | 96 (14.8%) |
| 20 to 24 Year Olds | 773 (78.1%) | 217 (21.9%) |
| 25 to 34 Year Olds | 491 (80.6%) | 118 (19.4%) |
| 35 Years and over | 415 (69.6%) | 181 (30.4%) |
| Total | 7,065 (84.9%) | 1,257 (15.1%) |
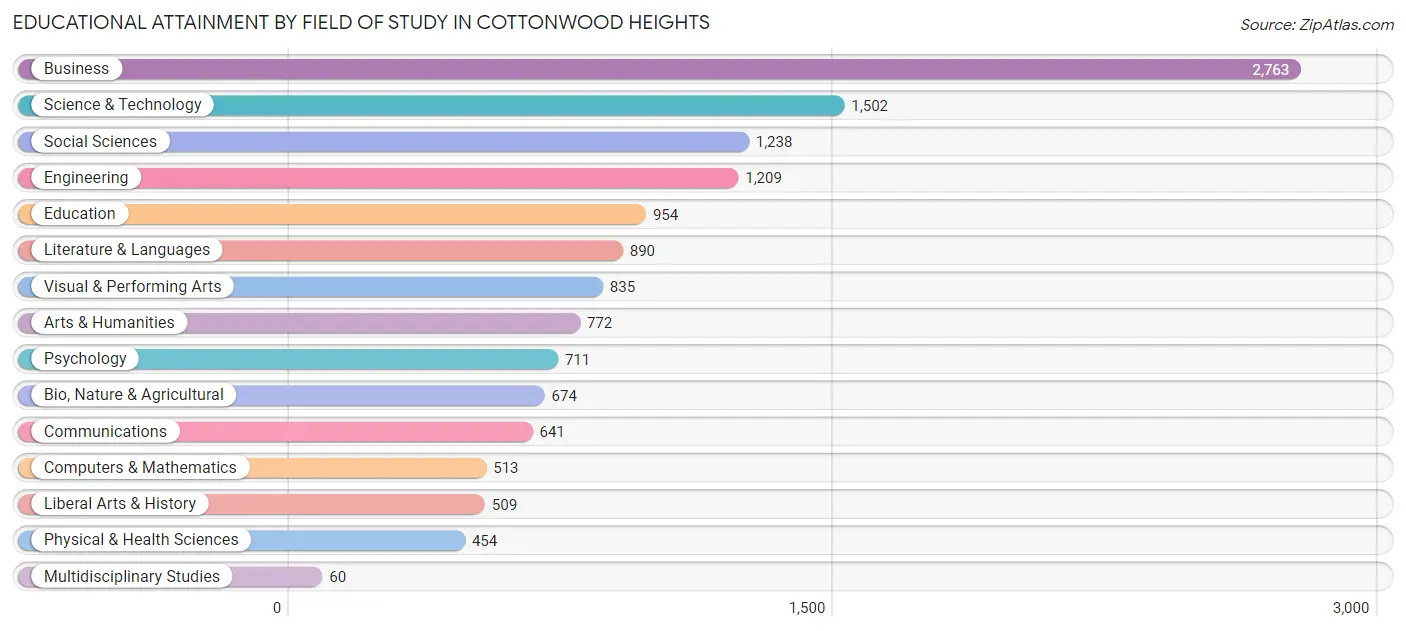
Educational Attainment by Field of Study in Cottonwood Heights
Business (2,763 | 20.1%), science & technology (1,502 | 10.9%), social sciences (1,238 | 9.0%), engineering (1,209 | 8.8%), and education (954 | 7.0%) are the most common fields of study among 13,725 individuals in Cottonwood Heights who have obtained a bachelor's degree or higher.
| Field of Study | # Graduates | % Graduates |
| Computers & Mathematics | 513 | 3.7% |
| Bio, Nature & Agricultural | 674 | 4.9% |
| Physical & Health Sciences | 454 | 3.3% |
| Psychology | 711 | 5.2% |
| Social Sciences | 1,238 | 9.0% |
| Engineering | 1,209 | 8.8% |
| Multidisciplinary Studies | 60 | 0.4% |
| Science & Technology | 1,502 | 10.9% |
| Business | 2,763 | 20.1% |
| Education | 954 | 7.0% |
| Literature & Languages | 890 | 6.5% |
| Liberal Arts & History | 509 | 3.7% |
| Visual & Performing Arts | 835 | 6.1% |
| Communications | 641 | 4.7% |
| Arts & Humanities | 772 | 5.6% |
| Total | 13,725 | 100.0% |
Transportation & Commute in Cottonwood Heights
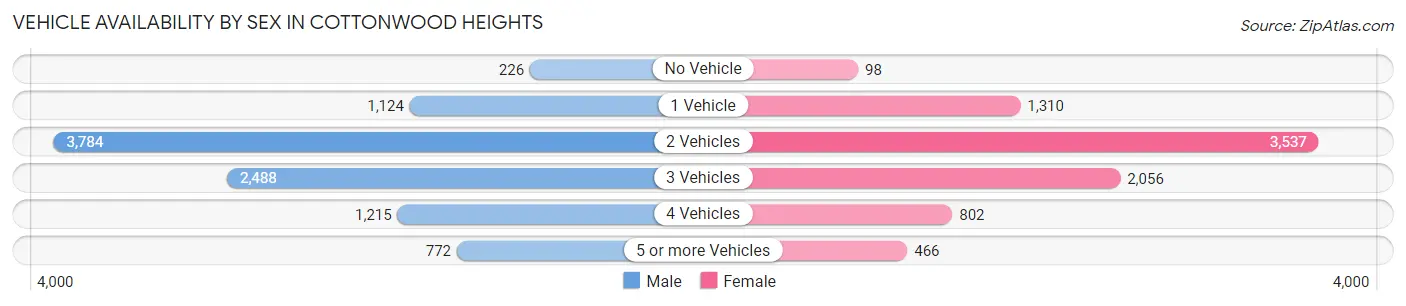
Vehicle Availability by Sex in Cottonwood Heights
The most prevalent vehicle ownership categories in Cottonwood Heights are males with 2 vehicles (3,784, accounting for 39.4%) and females with 2 vehicles (3,537, making up 45.8%).
| Vehicles Available | Male | Female |
| No Vehicle | 226 (2.4%) | 98 (1.2%) |
| 1 Vehicle | 1,124 (11.7%) | 1,310 (15.8%) |
| 2 Vehicles | 3,784 (39.4%) | 3,537 (42.8%) |
| 3 Vehicles | 2,488 (25.9%) | 2,056 (24.9%) |
| 4 Vehicles | 1,215 (12.6%) | 802 (9.7%) |
| 5 or more Vehicles | 772 (8.0%) | 466 (5.6%) |
| Total | 9,609 (100.0%) | 8,269 (100.0%) |
Commute Time in Cottonwood Heights
The most frequently occuring commute durations in Cottonwood Heights are 20 to 24 minutes (3,697 commuters, 26.1%), 15 to 19 minutes (2,216 commuters, 15.6%), and 10 to 14 minutes (1,809 commuters, 12.8%).
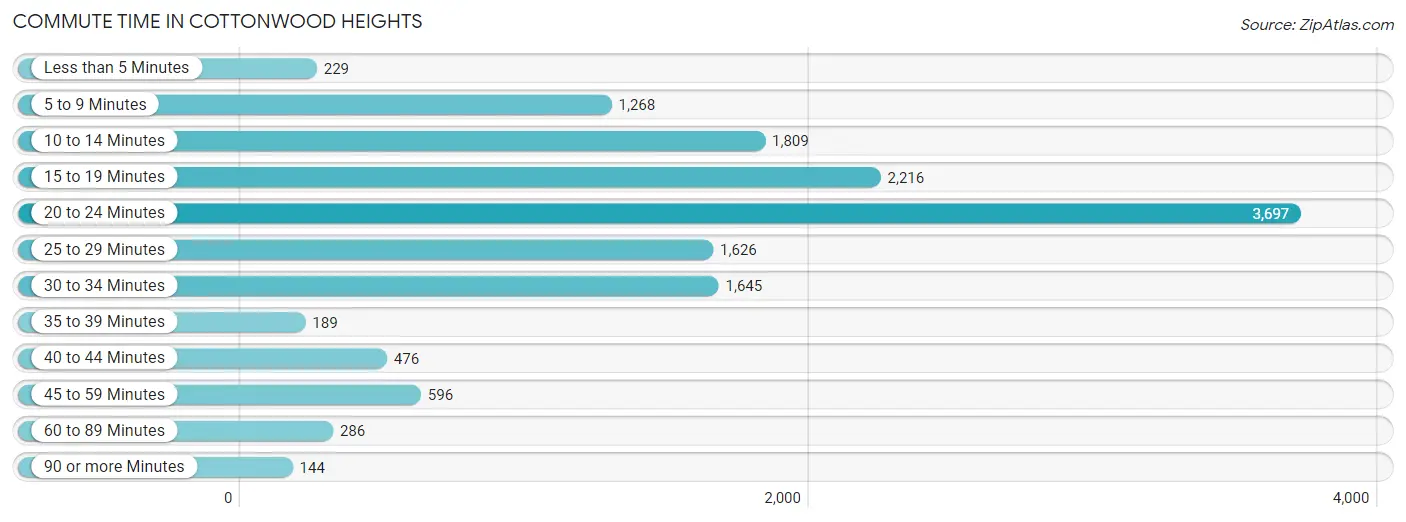
| Commute Time | # Commuters | % Commuters |
| Less than 5 Minutes | 229 | 1.6% |
| 5 to 9 Minutes | 1,268 | 8.9% |
| 10 to 14 Minutes | 1,809 | 12.8% |
| 15 to 19 Minutes | 2,216 | 15.6% |
| 20 to 24 Minutes | 3,697 | 26.1% |
| 25 to 29 Minutes | 1,626 | 11.5% |
| 30 to 34 Minutes | 1,645 | 11.6% |
| 35 to 39 Minutes | 189 | 1.3% |
| 40 to 44 Minutes | 476 | 3.4% |
| 45 to 59 Minutes | 596 | 4.2% |
| 60 to 89 Minutes | 286 | 2.0% |
| 90 or more Minutes | 144 | 1.0% |
Commute Time by Sex in Cottonwood Heights
The most common commute times in Cottonwood Heights are 20 to 24 minutes (1,975 commuters, 25.6%) for males and 20 to 24 minutes (1,722 commuters, 26.6%) for females.
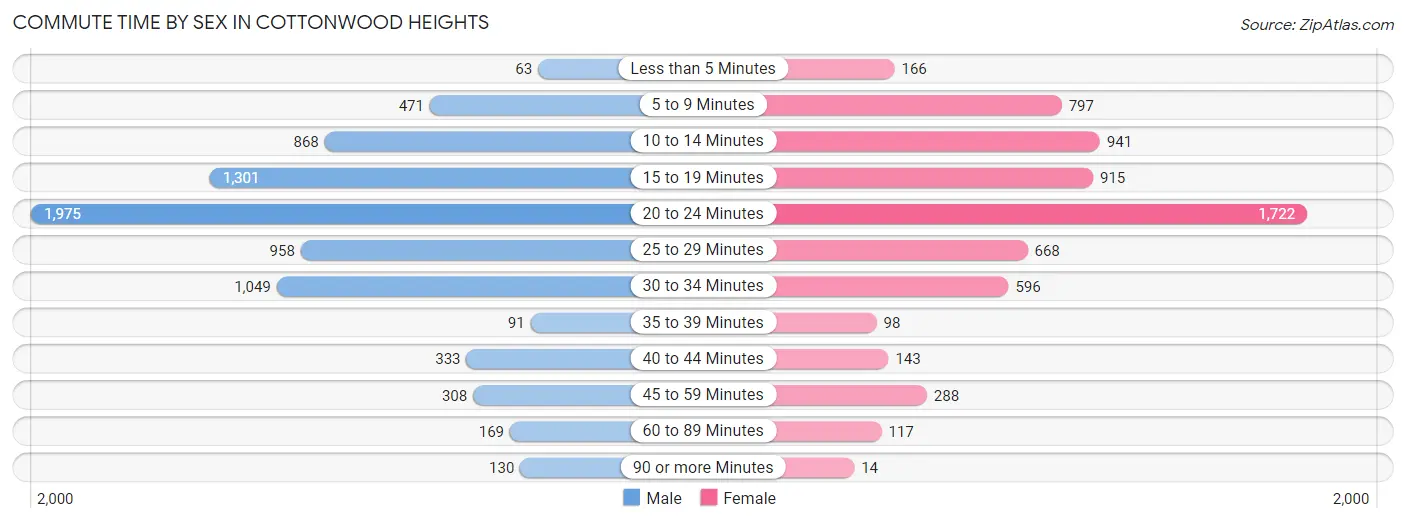
| Commute Time | Male | Female |
| Less than 5 Minutes | 63 (0.8%) | 166 (2.6%) |
| 5 to 9 Minutes | 471 (6.1%) | 797 (12.3%) |
| 10 to 14 Minutes | 868 (11.3%) | 941 (14.6%) |
| 15 to 19 Minutes | 1,301 (16.9%) | 915 (14.1%) |
| 20 to 24 Minutes | 1,975 (25.6%) | 1,722 (26.6%) |
| 25 to 29 Minutes | 958 (12.4%) | 668 (10.3%) |
| 30 to 34 Minutes | 1,049 (13.6%) | 596 (9.2%) |
| 35 to 39 Minutes | 91 (1.2%) | 98 (1.5%) |
| 40 to 44 Minutes | 333 (4.3%) | 143 (2.2%) |
| 45 to 59 Minutes | 308 (4.0%) | 288 (4.4%) |
| 60 to 89 Minutes | 169 (2.2%) | 117 (1.8%) |
| 90 or more Minutes | 130 (1.7%) | 14 (0.2%) |
Time of Departure to Work by Sex in Cottonwood Heights
The most frequent times of departure to work in Cottonwood Heights are 8:00 AM to 8:29 AM (1,061, 13.8%) for males and 8:00 AM to 8:29 AM (1,037, 16.0%) for females.
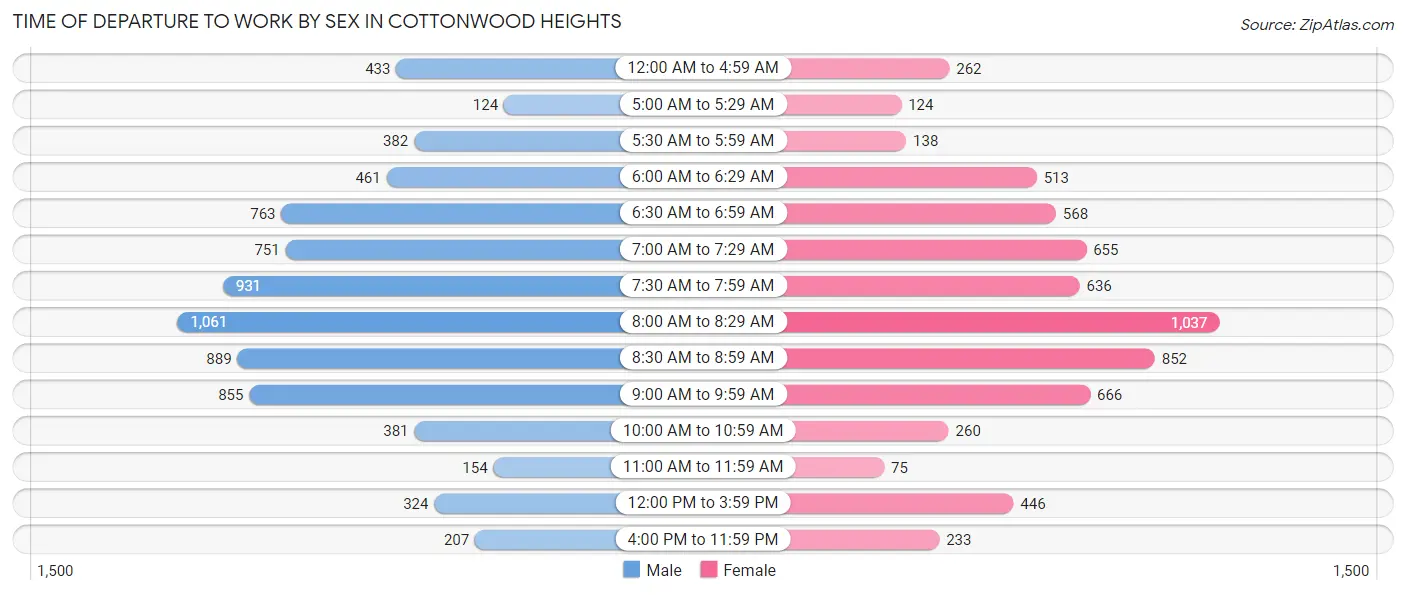
| Time of Departure | Male | Female |
| 12:00 AM to 4:59 AM | 433 (5.6%) | 262 (4.1%) |
| 5:00 AM to 5:29 AM | 124 (1.6%) | 124 (1.9%) |
| 5:30 AM to 5:59 AM | 382 (5.0%) | 138 (2.1%) |
| 6:00 AM to 6:29 AM | 461 (6.0%) | 513 (7.9%) |
| 6:30 AM to 6:59 AM | 763 (9.9%) | 568 (8.8%) |
| 7:00 AM to 7:29 AM | 751 (9.7%) | 655 (10.1%) |
| 7:30 AM to 7:59 AM | 931 (12.1%) | 636 (9.8%) |
| 8:00 AM to 8:29 AM | 1,061 (13.8%) | 1,037 (16.0%) |
| 8:30 AM to 8:59 AM | 889 (11.5%) | 852 (13.2%) |
| 9:00 AM to 9:59 AM | 855 (11.1%) | 666 (10.3%) |
| 10:00 AM to 10:59 AM | 381 (4.9%) | 260 (4.0%) |
| 11:00 AM to 11:59 AM | 154 (2.0%) | 75 (1.2%) |
| 12:00 PM to 3:59 PM | 324 (4.2%) | 446 (6.9%) |
| 4:00 PM to 11:59 PM | 207 (2.7%) | 233 (3.6%) |
| Total | 7,716 (100.0%) | 6,465 (100.0%) |
Housing Occupancy in Cottonwood Heights
Occupancy by Ownership in Cottonwood Heights
Of the total 12,361 dwellings in Cottonwood Heights, owner-occupied units account for 8,797 (71.2%), while renter-occupied units make up 3,564 (28.8%).
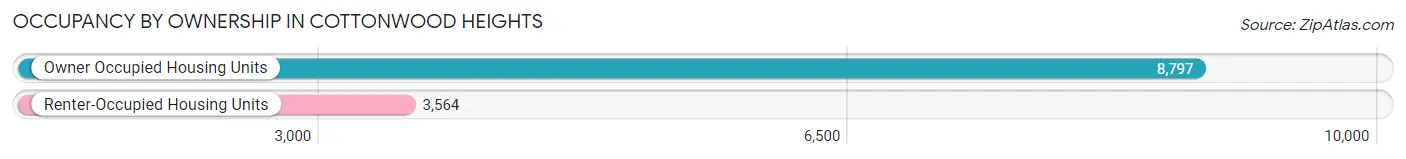
| Occupancy | # Housing Units | % Housing Units |
| Owner Occupied Housing Units | 8,797 | 71.2% |
| Renter-Occupied Housing Units | 3,564 | 28.8% |
| Total Occupied Housing Units | 12,361 | 100.0% |
Occupancy by Household Size in Cottonwood Heights
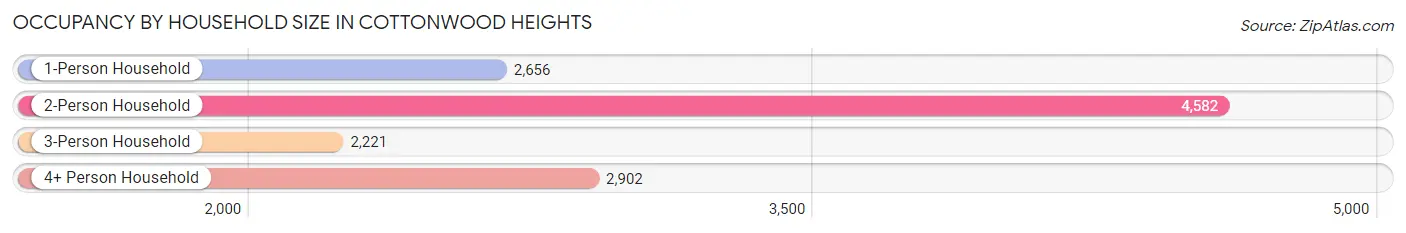
| Household Size | # Housing Units | % Housing Units |
| 1-Person Household | 2,656 | 21.5% |
| 2-Person Household | 4,582 | 37.1% |
| 3-Person Household | 2,221 | 18.0% |
| 4+ Person Household | 2,902 | 23.5% |
| Total Housing Units | 12,361 | 100.0% |
Occupancy by Ownership by Household Size in Cottonwood Heights
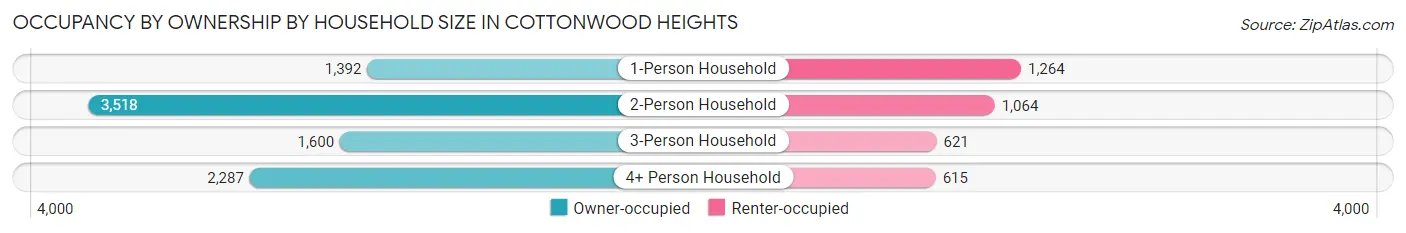
| Household Size | Owner-occupied | Renter-occupied |
| 1-Person Household | 1,392 (52.4%) | 1,264 (47.6%) |
| 2-Person Household | 3,518 (76.8%) | 1,064 (23.2%) |
| 3-Person Household | 1,600 (72.0%) | 621 (28.0%) |
| 4+ Person Household | 2,287 (78.8%) | 615 (21.2%) |
| Total Housing Units | 8,797 (71.2%) | 3,564 (28.8%) |
Occupancy by Educational Attainment in Cottonwood Heights
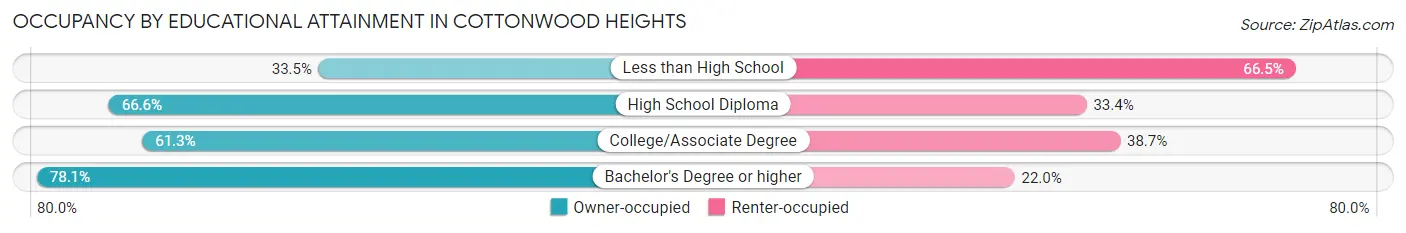
| Household Size | Owner-occupied | Renter-occupied |
| Less than High School | 70 (33.5%) | 139 (66.5%) |
| High School Diploma | 1,011 (66.6%) | 506 (33.4%) |
| College/Associate Degree | 2,143 (61.3%) | 1,352 (38.7%) |
| Bachelor's Degree or higher | 5,573 (78.0%) | 1,567 (22.0%) |
Occupancy by Age of Householder in Cottonwood Heights
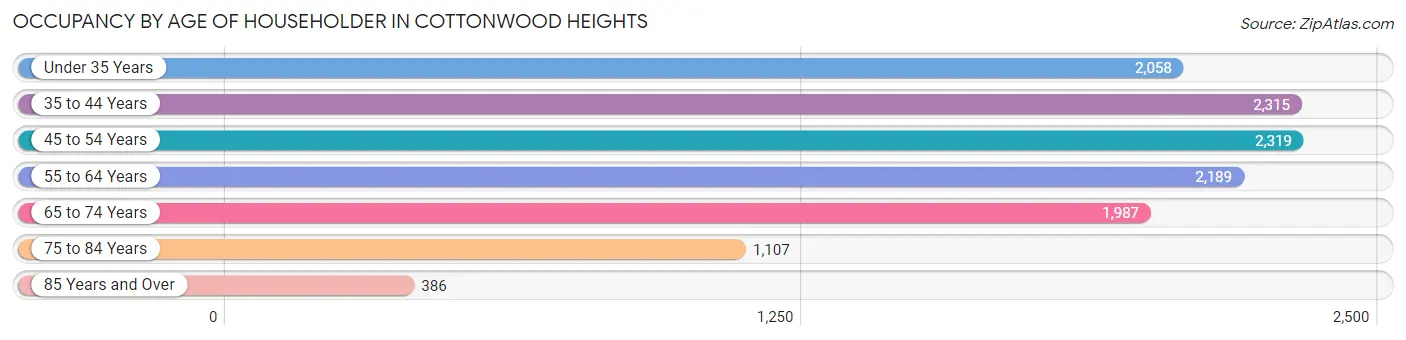
| Age Bracket | # Households | % Households |
| Under 35 Years | 2,058 | 16.7% |
| 35 to 44 Years | 2,315 | 18.7% |
| 45 to 54 Years | 2,319 | 18.8% |
| 55 to 64 Years | 2,189 | 17.7% |
| 65 to 74 Years | 1,987 | 16.1% |
| 75 to 84 Years | 1,107 | 9.0% |
| 85 Years and Over | 386 | 3.1% |
| Total | 12,361 | 100.0% |
Housing Finances in Cottonwood Heights
Median Income by Occupancy in Cottonwood Heights
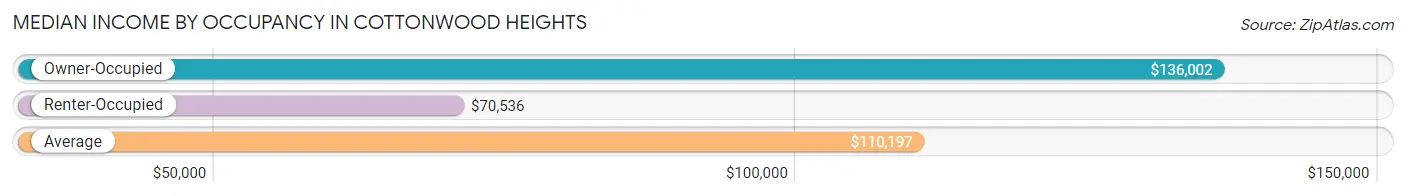
| Occupancy Type | # Households | Median Income |
| Owner-Occupied | 8,797 (71.2%) | $136,002 |
| Renter-Occupied | 3,564 (28.8%) | $70,536 |
| Average | 12,361 (100.0%) | $110,197 |
Occupancy by Householder Income Bracket in Cottonwood Heights
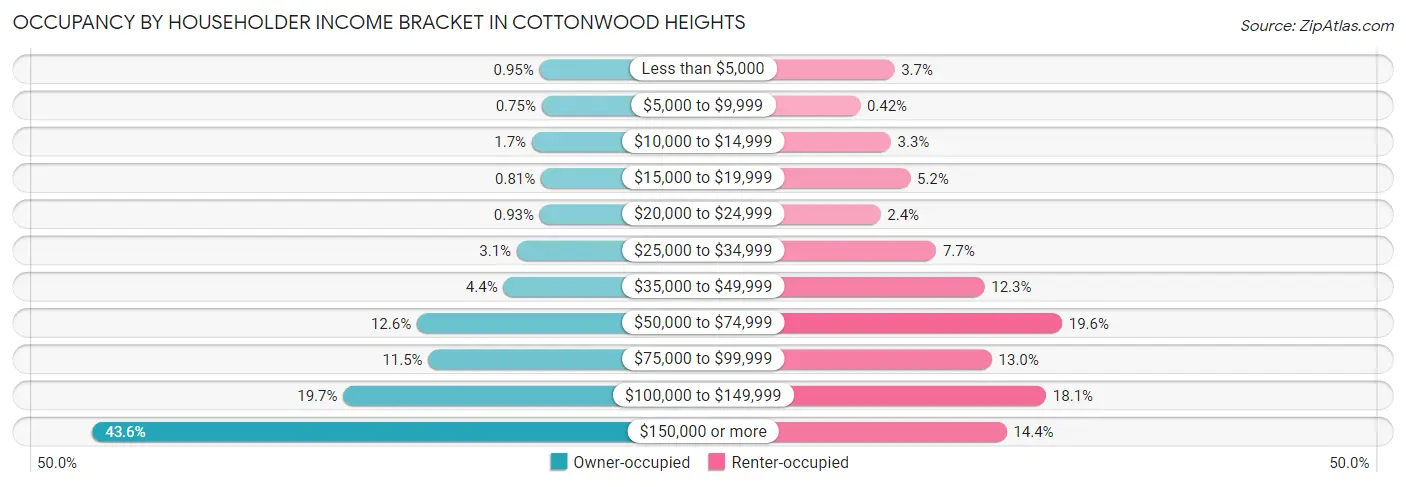
| Income Bracket | Owner-occupied | Renter-occupied |
| Less than $5,000 | 84 (0.9%) | 131 (3.7%) |
| $5,000 to $9,999 | 66 (0.7%) | 15 (0.4%) |
| $10,000 to $14,999 | 148 (1.7%) | 119 (3.3%) |
| $15,000 to $19,999 | 71 (0.8%) | 185 (5.2%) |
| $20,000 to $24,999 | 82 (0.9%) | 84 (2.4%) |
| $25,000 to $34,999 | 274 (3.1%) | 273 (7.7%) |
| $35,000 to $49,999 | 386 (4.4%) | 437 (12.3%) |
| $50,000 to $74,999 | 1,111 (12.6%) | 700 (19.6%) |
| $75,000 to $99,999 | 1,015 (11.5%) | 462 (13.0%) |
| $100,000 to $149,999 | 1,729 (19.7%) | 646 (18.1%) |
| $150,000 or more | 3,831 (43.5%) | 512 (14.4%) |
| Total | 8,797 (100.0%) | 3,564 (100.0%) |
Monthly Housing Cost Tiers in Cottonwood Heights
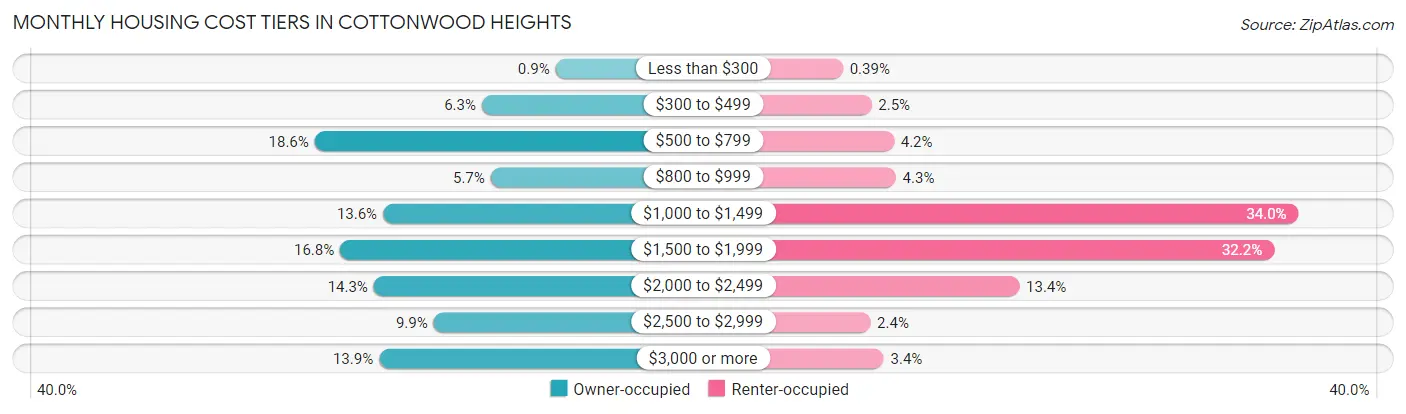
| Monthly Cost | Owner-occupied | Renter-occupied |
| Less than $300 | 79 (0.9%) | 14 (0.4%) |
| $300 to $499 | 557 (6.3%) | 89 (2.5%) |
| $500 to $799 | 1,640 (18.6%) | 148 (4.2%) |
| $800 to $999 | 500 (5.7%) | 153 (4.3%) |
| $1,000 to $1,499 | 1,197 (13.6%) | 1,210 (34.0%) |
| $1,500 to $1,999 | 1,475 (16.8%) | 1,146 (32.2%) |
| $2,000 to $2,499 | 1,257 (14.3%) | 477 (13.4%) |
| $2,500 to $2,999 | 869 (9.9%) | 86 (2.4%) |
| $3,000 or more | 1,223 (13.9%) | 121 (3.4%) |
| Total | 8,797 (100.0%) | 3,564 (100.0%) |
Physical Housing Characteristics in Cottonwood Heights
Housing Structures in Cottonwood Heights
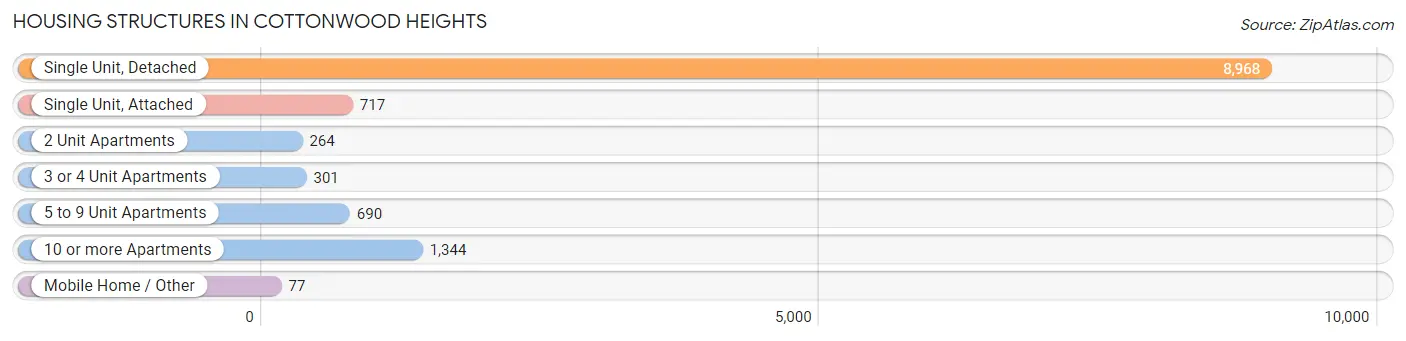
| Structure Type | # Housing Units | % Housing Units |
| Single Unit, Detached | 8,968 | 72.6% |
| Single Unit, Attached | 717 | 5.8% |
| 2 Unit Apartments | 264 | 2.1% |
| 3 or 4 Unit Apartments | 301 | 2.4% |
| 5 to 9 Unit Apartments | 690 | 5.6% |
| 10 or more Apartments | 1,344 | 10.9% |
| Mobile Home / Other | 77 | 0.6% |
| Total | 12,361 | 100.0% |
Housing Structures by Occupancy in Cottonwood Heights
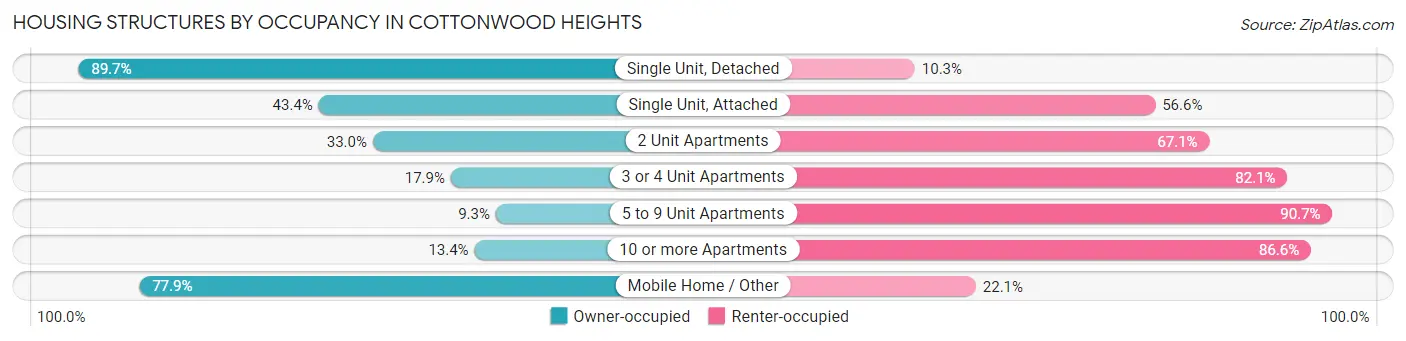
| Structure Type | Owner-occupied | Renter-occupied |
| Single Unit, Detached | 8,041 (89.7%) | 927 (10.3%) |
| Single Unit, Attached | 311 (43.4%) | 406 (56.6%) |
| 2 Unit Apartments | 87 (33.0%) | 177 (67.0%) |
| 3 or 4 Unit Apartments | 54 (17.9%) | 247 (82.1%) |
| 5 to 9 Unit Apartments | 64 (9.3%) | 626 (90.7%) |
| 10 or more Apartments | 180 (13.4%) | 1,164 (86.6%) |
| Mobile Home / Other | 60 (77.9%) | 17 (22.1%) |
| Total | 8,797 (71.2%) | 3,564 (28.8%) |
Housing Structures by Number of Rooms in Cottonwood Heights
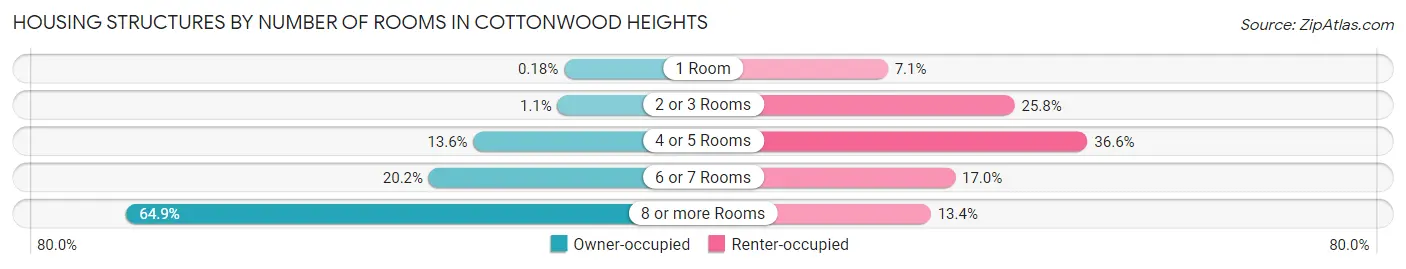
| Number of Rooms | Owner-occupied | Renter-occupied |
| 1 Room | 16 (0.2%) | 252 (7.1%) |
| 2 or 3 Rooms | 99 (1.1%) | 921 (25.8%) |
| 4 or 5 Rooms | 1,195 (13.6%) | 1,305 (36.6%) |
| 6 or 7 Rooms | 1,775 (20.2%) | 607 (17.0%) |
| 8 or more Rooms | 5,712 (64.9%) | 479 (13.4%) |
| Total | 8,797 (100.0%) | 3,564 (100.0%) |
Housing Structure by Heating Type in Cottonwood Heights
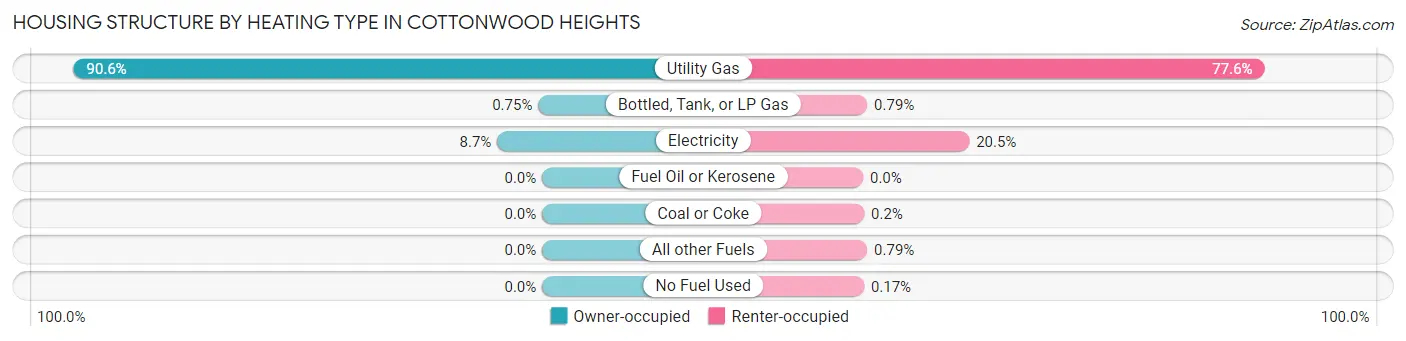
| Heating Type | Owner-occupied | Renter-occupied |
| Utility Gas | 7,967 (90.6%) | 2,764 (77.5%) |
| Bottled, Tank, or LP Gas | 66 (0.7%) | 28 (0.8%) |
| Electricity | 764 (8.7%) | 731 (20.5%) |
| Fuel Oil or Kerosene | 0 (0.0%) | 0 (0.0%) |
| Coal or Coke | 0 (0.0%) | 7 (0.2%) |
| All other Fuels | 0 (0.0%) | 28 (0.8%) |
| No Fuel Used | 0 (0.0%) | 6 (0.2%) |
| Total | 8,797 (100.0%) | 3,564 (100.0%) |
Household Vehicle Usage in Cottonwood Heights
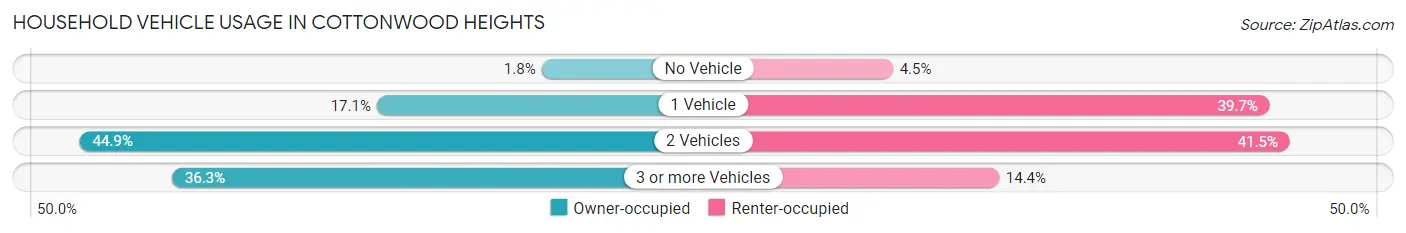
| Vehicles per Household | Owner-occupied | Renter-occupied |
| No Vehicle | 154 (1.8%) | 159 (4.5%) |
| 1 Vehicle | 1,507 (17.1%) | 1,413 (39.7%) |
| 2 Vehicles | 3,947 (44.9%) | 1,480 (41.5%) |
| 3 or more Vehicles | 3,189 (36.2%) | 512 (14.4%) |
| Total | 8,797 (100.0%) | 3,564 (100.0%) |
Real Estate & Mortgages in Cottonwood Heights
Real Estate and Mortgage Overview in Cottonwood Heights
| Characteristic | Without Mortgage | With Mortgage |
| Housing Units | 3,091 | 5,706 |
| Median Property Value | $545,300 | $569,600 |
| Median Household Income | $94,801 | $2,863 |
| Monthly Housing Costs | $660 | $1,216 |
| Real Estate Taxes | $3,359 | $51 |
Property Value by Mortgage Status in Cottonwood Heights
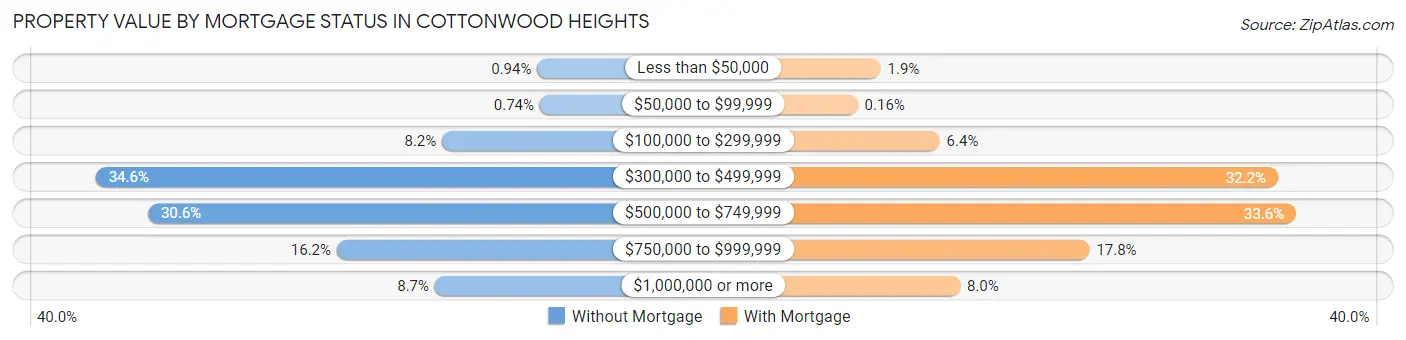
| Property Value | Without Mortgage | With Mortgage |
| Less than $50,000 | 29 (0.9%) | 109 (1.9%) |
| $50,000 to $99,999 | 23 (0.7%) | 9 (0.2%) |
| $100,000 to $299,999 | 253 (8.2%) | 366 (6.4%) |
| $300,000 to $499,999 | 1,069 (34.6%) | 1,836 (32.2%) |
| $500,000 to $749,999 | 946 (30.6%) | 1,915 (33.6%) |
| $750,000 to $999,999 | 501 (16.2%) | 1,017 (17.8%) |
| $1,000,000 or more | 270 (8.7%) | 454 (8.0%) |
| Total | 3,091 (100.0%) | 5,706 (100.0%) |
Household Income by Mortgage Status in Cottonwood Heights
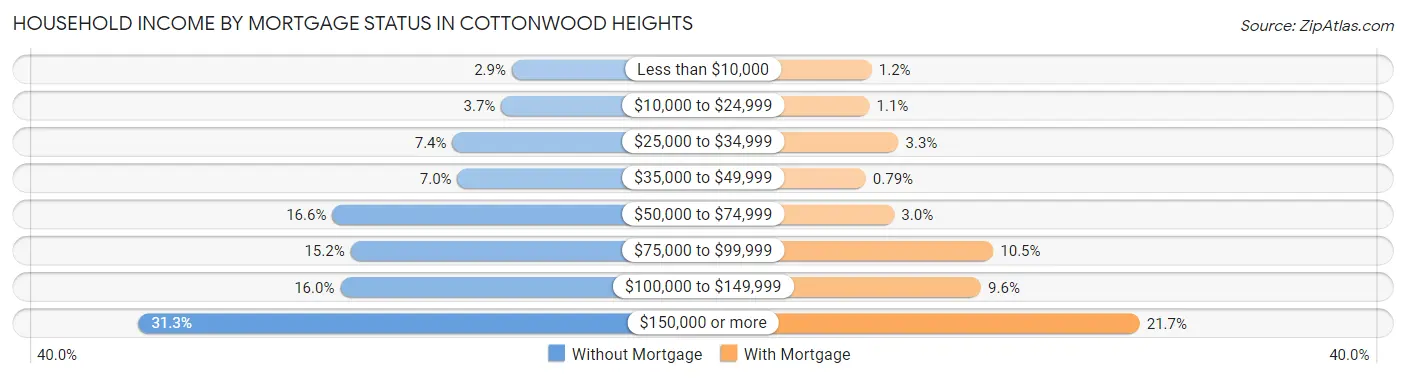
| Household Income | Without Mortgage | With Mortgage |
| Less than $10,000 | 89 (2.9%) | 71 (1.2%) |
| $10,000 to $24,999 | 114 (3.7%) | 61 (1.1%) |
| $25,000 to $34,999 | 229 (7.4%) | 187 (3.3%) |
| $35,000 to $49,999 | 217 (7.0%) | 45 (0.8%) |
| $50,000 to $74,999 | 512 (16.6%) | 169 (3.0%) |
| $75,000 to $99,999 | 469 (15.2%) | 599 (10.5%) |
| $100,000 to $149,999 | 493 (16.0%) | 546 (9.6%) |
| $150,000 or more | 968 (31.3%) | 1,236 (21.7%) |
| Total | 3,091 (100.0%) | 5,706 (100.0%) |
Property Value to Household Income Ratio in Cottonwood Heights
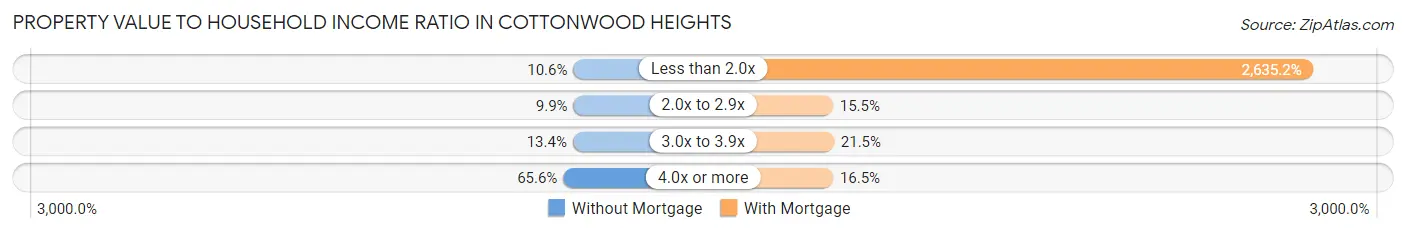
| Value-to-Income Ratio | Without Mortgage | With Mortgage |
| Less than 2.0x | 326 (10.5%) | 150,362 (2,635.2%) |
| 2.0x to 2.9x | 307 (9.9%) | 884 (15.5%) |
| 3.0x to 3.9x | 415 (13.4%) | 1,227 (21.5%) |
| 4.0x or more | 2,026 (65.5%) | 941 (16.5%) |
| Total | 3,091 (100.0%) | 5,706 (100.0%) |
Real Estate Taxes by Mortgage Status in Cottonwood Heights
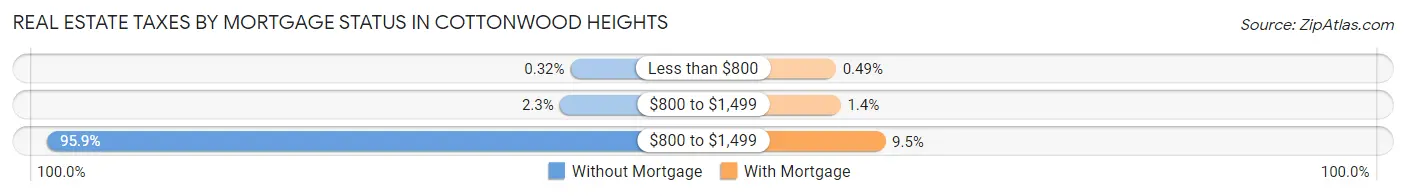
| Property Taxes | Without Mortgage | With Mortgage |
| Less than $800 | 10 (0.3%) | 28 (0.5%) |
| $800 to $1,499 | 71 (2.3%) | 77 (1.3%) |
| $800 to $1,499 | 2,964 (95.9%) | 542 (9.5%) |
| Total | 3,091 (100.0%) | 5,706 (100.0%) |
Health & Disability in Cottonwood Heights
Health Insurance Coverage by Age in Cottonwood Heights
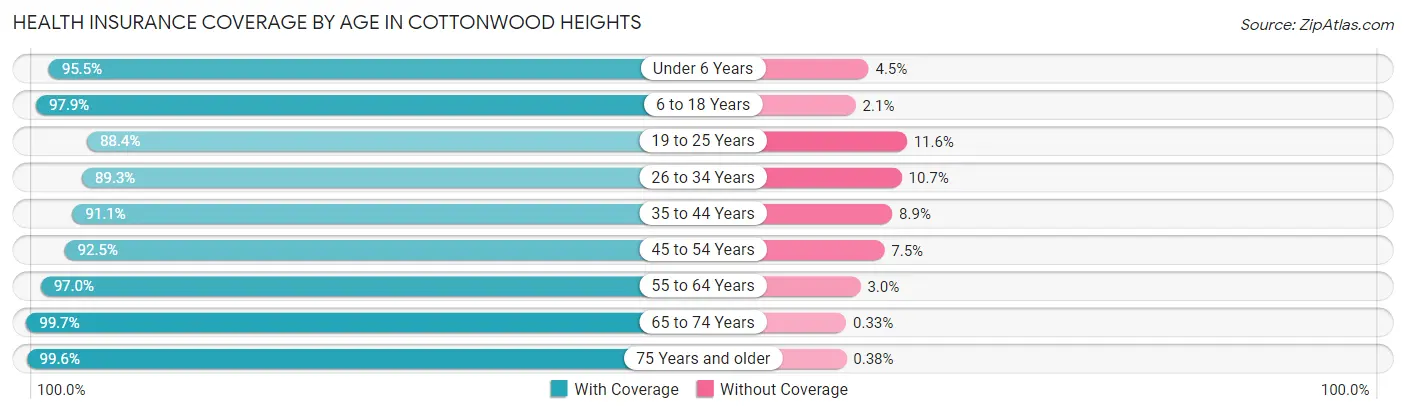
| Age Bracket | With Coverage | Without Coverage |
| Under 6 Years | 2,112 (95.5%) | 100 (4.5%) |
| 6 to 18 Years | 5,538 (97.9%) | 120 (2.1%) |
| 19 to 25 Years | 2,414 (88.4%) | 318 (11.6%) |
| 26 to 34 Years | 3,400 (89.3%) | 407 (10.7%) |
| 35 to 44 Years | 4,331 (91.1%) | 424 (8.9%) |
| 45 to 54 Years | 3,854 (92.5%) | 311 (7.5%) |
| 55 to 64 Years | 4,088 (97.0%) | 127 (3.0%) |
| 65 to 74 Years | 3,325 (99.7%) | 11 (0.3%) |
| 75 Years and older | 2,365 (99.6%) | 9 (0.4%) |
| Total | 31,427 (94.5%) | 1,827 (5.5%) |
Health Insurance Coverage by Citizenship Status in Cottonwood Heights
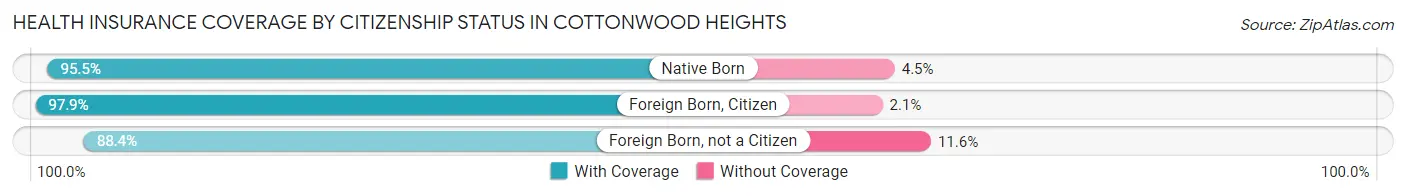
| Citizenship Status | With Coverage | Without Coverage |
| Native Born | 2,112 (95.5%) | 100 (4.5%) |
| Foreign Born, Citizen | 5,538 (97.9%) | 120 (2.1%) |
| Foreign Born, not a Citizen | 2,414 (88.4%) | 318 (11.6%) |
Health Insurance Coverage by Household Income in Cottonwood Heights
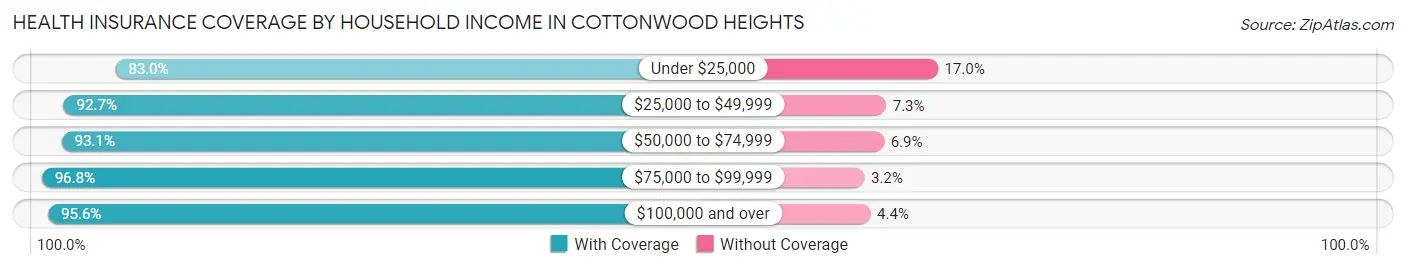
| Household Income | With Coverage | Without Coverage |
| Under $25,000 | 1,490 (83.0%) | 305 (17.0%) |
| $25,000 to $49,999 | 2,737 (92.7%) | 216 (7.3%) |
| $50,000 to $74,999 | 3,659 (93.1%) | 272 (6.9%) |
| $75,000 to $99,999 | 3,333 (96.8%) | 111 (3.2%) |
| $100,000 and over | 20,111 (95.6%) | 921 (4.4%) |
Public vs Private Health Insurance Coverage by Age in Cottonwood Heights
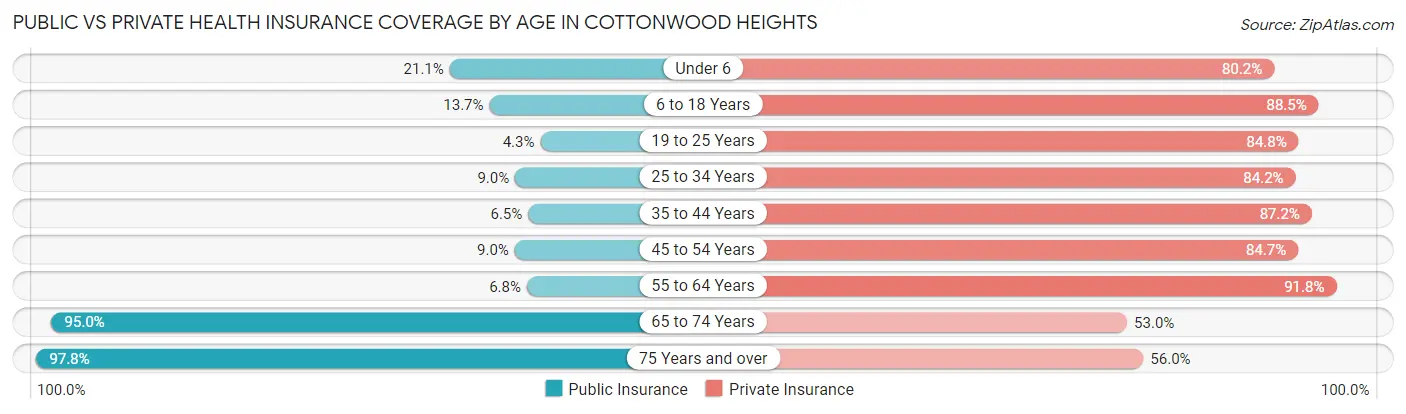
| Age Bracket | Public Insurance | Private Insurance |
| Under 6 | 467 (21.1%) | 1,775 (80.2%) |
| 6 to 18 Years | 777 (13.7%) | 5,007 (88.5%) |
| 19 to 25 Years | 117 (4.3%) | 2,316 (84.8%) |
| 25 to 34 Years | 341 (9.0%) | 3,205 (84.2%) |
| 35 to 44 Years | 311 (6.5%) | 4,147 (87.2%) |
| 45 to 54 Years | 376 (9.0%) | 3,527 (84.7%) |
| 55 to 64 Years | 286 (6.8%) | 3,868 (91.8%) |
| 65 to 74 Years | 3,170 (95.0%) | 1,767 (53.0%) |
| 75 Years and over | 2,322 (97.8%) | 1,329 (56.0%) |
| Total | 8,167 (24.6%) | 26,941 (81.0%) |
Disability Status by Sex by Age in Cottonwood Heights
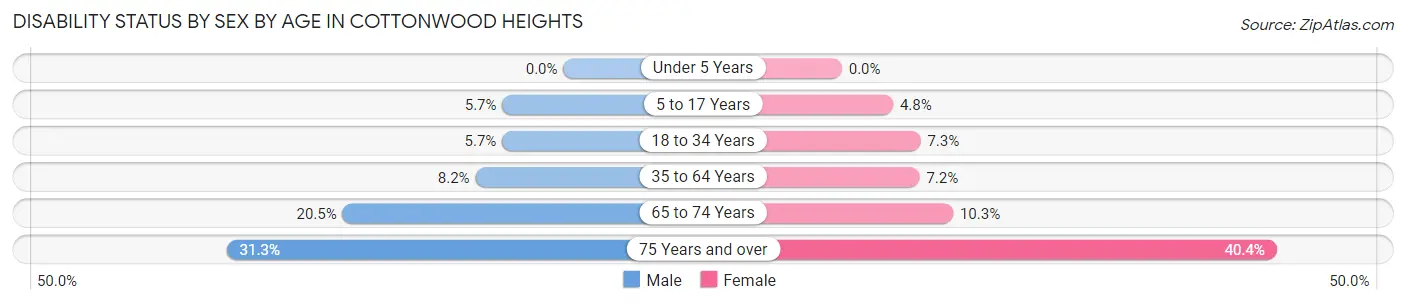
| Age Bracket | Male | Female |
| Under 5 Years | 0 (0.0%) | 0 (0.0%) |
| 5 to 17 Years | 148 (5.7%) | 135 (4.8%) |
| 18 to 34 Years | 217 (5.7%) | 239 (7.3%) |
| 35 to 64 Years | 534 (8.2%) | 475 (7.2%) |
| 65 to 74 Years | 340 (20.5%) | 173 (10.3%) |
| 75 Years and over | 340 (31.2%) | 519 (40.4%) |
Disability Class by Sex by Age in Cottonwood Heights
Disability Class: Hearing Difficulty
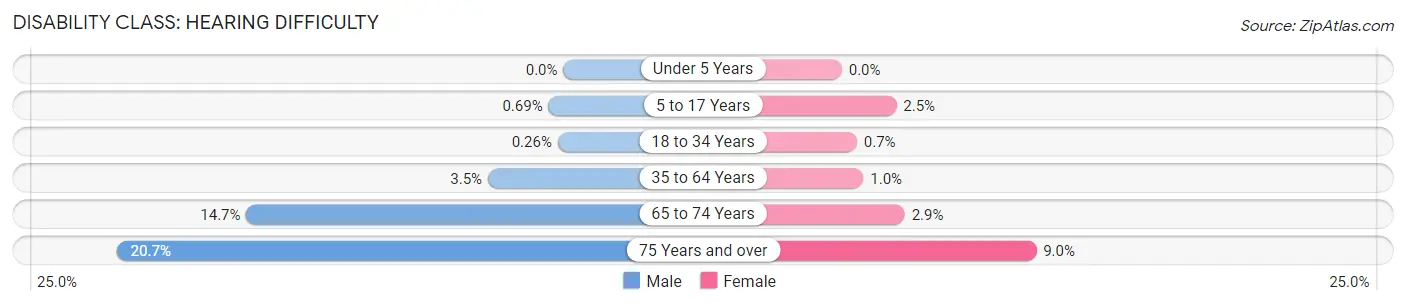
| Age Bracket | Male | Female |
| Under 5 Years | 0 (0.0%) | 0 (0.0%) |
| 5 to 17 Years | 18 (0.7%) | 72 (2.5%) |
| 18 to 34 Years | 10 (0.3%) | 23 (0.7%) |
| 35 to 64 Years | 229 (3.5%) | 66 (1.0%) |
| 65 to 74 Years | 244 (14.7%) | 49 (2.9%) |
| 75 Years and over | 225 (20.7%) | 116 (9.0%) |
Disability Class: Vision Difficulty
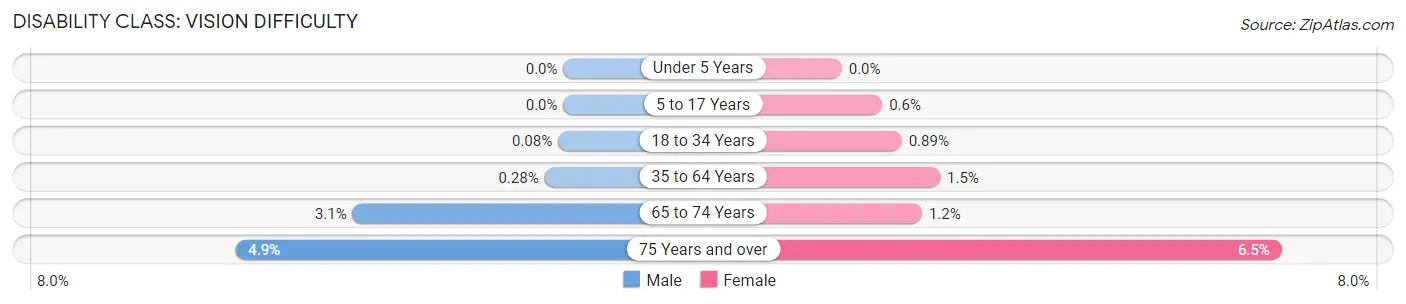
| Age Bracket | Male | Female |
| Under 5 Years | 0 (0.0%) | 0 (0.0%) |
| 5 to 17 Years | 0 (0.0%) | 17 (0.6%) |
| 18 to 34 Years | 3 (0.1%) | 29 (0.9%) |
| 35 to 64 Years | 18 (0.3%) | 96 (1.5%) |
| 65 to 74 Years | 52 (3.1%) | 20 (1.2%) |
| 75 Years and over | 53 (4.9%) | 84 (6.5%) |
Disability Class: Cognitive Difficulty
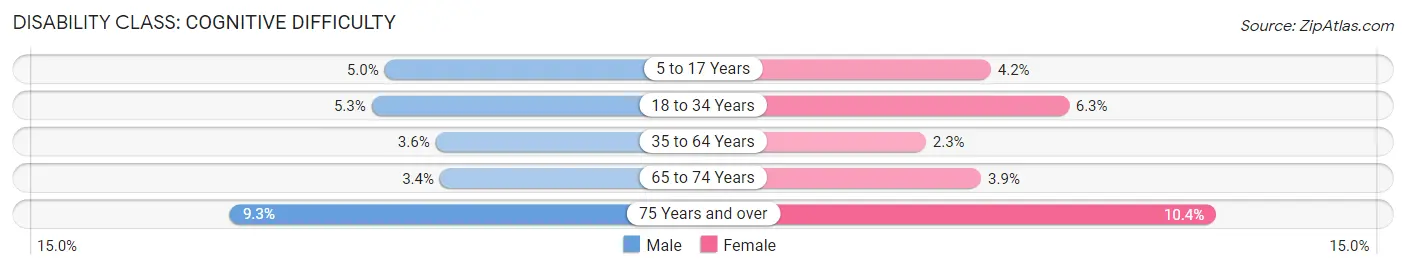
| Age Bracket | Male | Female |
| 5 to 17 Years | 130 (5.0%) | 118 (4.2%) |
| 18 to 34 Years | 204 (5.3%) | 207 (6.3%) |
| 35 to 64 Years | 233 (3.6%) | 154 (2.3%) |
| 65 to 74 Years | 57 (3.4%) | 65 (3.9%) |
| 75 Years and over | 101 (9.3%) | 134 (10.4%) |
Disability Class: Ambulatory Difficulty
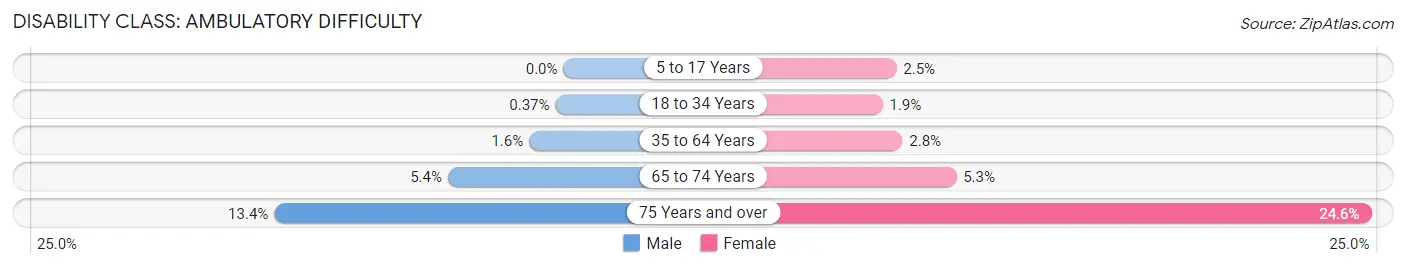
| Age Bracket | Male | Female |
| 5 to 17 Years | 0 (0.0%) | 72 (2.5%) |
| 18 to 34 Years | 14 (0.4%) | 62 (1.9%) |
| 35 to 64 Years | 104 (1.6%) | 185 (2.8%) |
| 65 to 74 Years | 89 (5.4%) | 89 (5.3%) |
| 75 Years and over | 146 (13.4%) | 316 (24.6%) |
Disability Class: Self-Care Difficulty
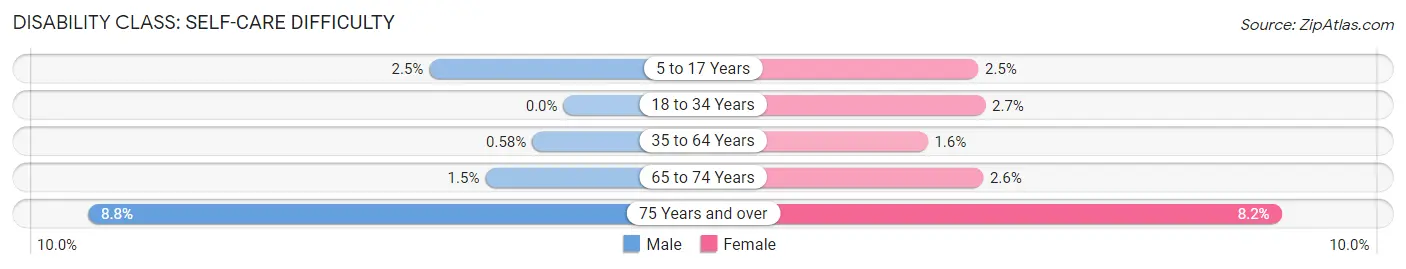
| Age Bracket | Male | Female |
| 5 to 17 Years | 65 (2.5%) | 72 (2.5%) |
| 18 to 34 Years | 0 (0.0%) | 87 (2.7%) |
| 35 to 64 Years | 38 (0.6%) | 105 (1.6%) |
| 65 to 74 Years | 24 (1.5%) | 44 (2.6%) |
| 75 Years and over | 96 (8.8%) | 105 (8.2%) |
Technology Access in Cottonwood Heights
Computing Device Access in Cottonwood Heights
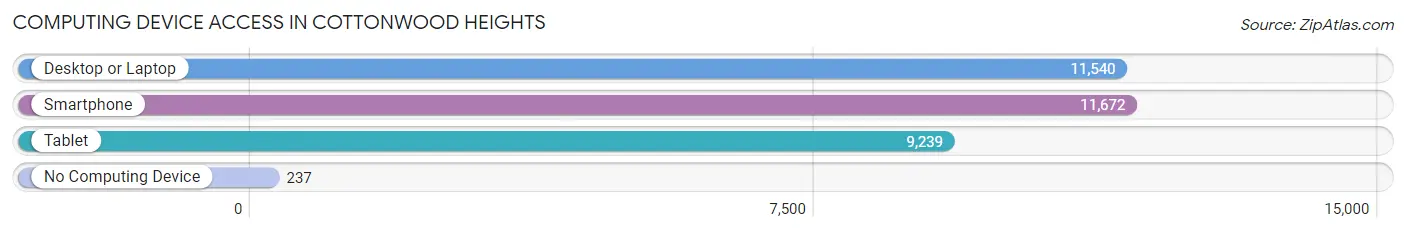
| Device Type | # Households | % Households |
| Desktop or Laptop | 11,540 | 93.4% |
| Smartphone | 11,672 | 94.4% |
| Tablet | 9,239 | 74.7% |
| No Computing Device | 237 | 1.9% |
| Total | 12,361 | 100.0% |
Internet Access in Cottonwood Heights
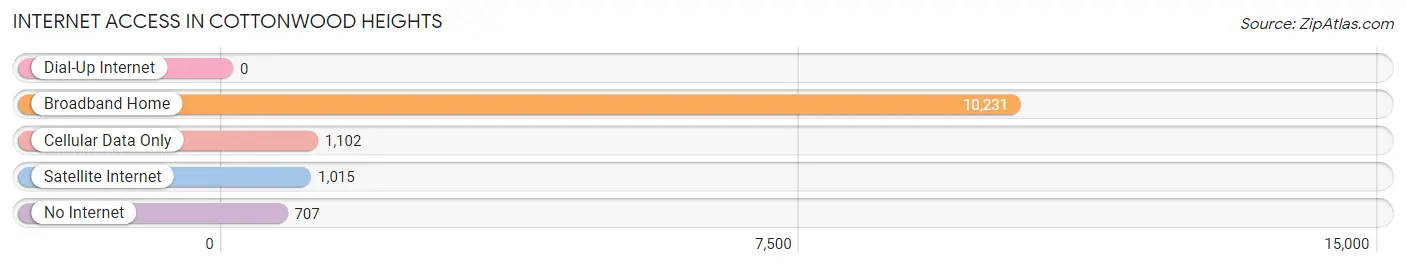
| Internet Type | # Households | % Households |
| Dial-Up Internet | 0 | 0.0% |
| Broadband Home | 10,231 | 82.8% |
| Cellular Data Only | 1,102 | 8.9% |
| Satellite Internet | 1,015 | 8.2% |
| No Internet | 707 | 5.7% |
| Total | 12,361 | 100.0% |
Cottonwood Heights Summary
Cottonwood Heights is a city located in Salt Lake County, Utah, United States. It is part of the Salt Lake City metropolitan area. The population was 33,433 at the 2010 census. Cottonwood Heights is located at the base of the Wasatch Mountains, just east of the Salt Lake Valley.
History
Cottonwood Heights was originally part of the unincorporated area of Salt Lake County known as “Cottonwood.” The area was first settled in the mid-1800s by Mormon pioneers. The area was named for the abundance of cottonwood trees in the area.
In the early 1900s, the area began to develop as a residential area. The area was annexed by the city of Holladay in the 1950s. In the late 1990s, residents of the area began to push for the creation of a new city. In 2004, the residents of the area voted to incorporate as the City of Cottonwood Heights.
Geography
Cottonwood Heights is located in the Wasatch Mountains, just east of the Salt Lake Valley. The city is bordered by the cities of Holladay, Murray, Midvale, and Sandy. The city covers an area of 8.3 square miles.
The city is located at an elevation of 4,521 feet above sea level. The city is located in a temperate climate zone, with hot summers and cold winters. The average annual temperature is 46.2 degrees Fahrenheit.
Economy
Cottonwood Heights is home to a variety of businesses and industries. The city is home to several large employers, including the University of Utah, Intermountain Healthcare, and the Salt Lake City International Airport.
The city is also home to a variety of retail and dining establishments. The city is home to several shopping centers, including the Cottonwood Mall and the Cottonwood Heights Towne Center.
Demographics
As of the 2010 census, the population of Cottonwood Heights was 33,433. The population is made up of a variety of ethnic and racial backgrounds. The largest racial group is White (83.3%), followed by Hispanic or Latino (7.2%), Asian (3.7%), and African American (2.2%).
The median household income in Cottonwood Heights is $77,845. The median age of the population is 37.7 years. The city has a higher than average rate of college-educated residents, with 44.3% of the population having a bachelor’s degree or higher.
Conclusion
Cottonwood Heights is a city located in Salt Lake County, Utah, United States. It is part of the Salt Lake City metropolitan area. The city was incorporated in 2004 and has a population of 33,433. The city is located in the Wasatch Mountains, just east of the Salt Lake Valley. The city is home to a variety of businesses and industries, and has a median household income of $77,845. The population is made up of a variety of ethnic and racial backgrounds, with the largest racial group being White (83.3%). The city has a higher than average rate of college-educated residents, with 44.3% of the population having a bachelor’s degree or higher.
Common Questions
What is Per Capita Income in Cottonwood Heights?
Per Capita income in Cottonwood Heights is $54,444.
What is the Median Family Income in Cottonwood Heights?
Median Family Income in Cottonwood Heights is $135,888.
What is the Median Household income in Cottonwood Heights?
Median Household Income in Cottonwood Heights is $110,197.
What is Income or Wage Gap in Cottonwood Heights?
Income or Wage Gap in Cottonwood Heights is 28.7%.
Women in Cottonwood Heights earn 71.3 cents for every dollar earned by a man.
What is Inequality or Gini Index in Cottonwood Heights?
Inequality or Gini Index in Cottonwood Heights is 0.43.
What is the Total Population of Cottonwood Heights?
Total Population of Cottonwood Heights is 33,257.
What is the Total Male Population of Cottonwood Heights?
Total Male Population of Cottonwood Heights is 16,467.
What is the Total Female Population of Cottonwood Heights?
Total Female Population of Cottonwood Heights is 16,790.
What is the Ratio of Males per 100 Females in Cottonwood Heights?
There are 98.08 Males per 100 Females in Cottonwood Heights.
What is the Ratio of Females per 100 Males in Cottonwood Heights?
There are 101.96 Females per 100 Males in Cottonwood Heights.
What is the Median Population Age in Cottonwood Heights?
Median Population Age in Cottonwood Heights is 39.4 Years.
What is the Average Family Size in Cottonwood Heights
Average Family Size in Cottonwood Heights is 3.1 People.
What is the Average Household Size in Cottonwood Heights
Average Household Size in Cottonwood Heights is 2.7 People.
How Large is the Labor Force in Cottonwood Heights?
There are 18,803 People in the Labor Forcein in Cottonwood Heights.
What is the Percentage of People in the Labor Force in Cottonwood Heights?
70.2% of People are in the Labor Force in Cottonwood Heights.
What is the Unemployment Rate in Cottonwood Heights?
Unemployment Rate in Cottonwood Heights is 3.2%.