Fort Carson, CO Map & Demographics
Fort Carson Map
Fort Carson Overview
$24,800
PER CAPITA INCOME
$62,532
AVG FAMILY INCOME
$62,582
AVG HOUSEHOLD INCOME
16.9%
WAGE / INCOME GAP [ % ]
83.1¢/ $1
WAGE / INCOME GAP [ $ ]
$11,837
FAMILY INCOME DEFICIT
0.33
INEQUALITY / GINI INDEX
18,105
TOTAL POPULATION
12,240
MALE POPULATION
5,865
FEMALE POPULATION
208.70
MALES / 100 FEMALES
47.92
FEMALES / 100 MALES
21.9
MEDIAN AGE
3.4
AVG FAMILY SIZE
3.4
AVG HOUSEHOLD SIZE
11,530
LABOR FORCE [ PEOPLE ]
85.1%
PERCENT IN LABOR FORCE
1.9%
UNEMPLOYMENT RATE
Fort Carson Area Codes
Income in Fort Carson
Income Overview in Fort Carson
Per Capita Income in Fort Carson is $24,800, while median incomes of families and households are $62,532 and $62,582 respectively.
| Characteristic | Number | Measure |
| Per Capita Income | 18,105 | $24,800 |
| Median Family Income | 3,223 | $62,532 |
| Mean Family Income | 3,223 | $70,577 |
| Median Household Income | 3,329 | $62,582 |
| Mean Household Income | 3,329 | $69,917 |
| Income Deficit | 3,223 | $11,837 |
| Wage / Income Gap (%) | 18,105 | 16.91% |
| Wage / Income Gap ($) | 18,105 | 83.09¢ per $1 |
| Gini / Inequality Index | 18,105 | 0.33 |
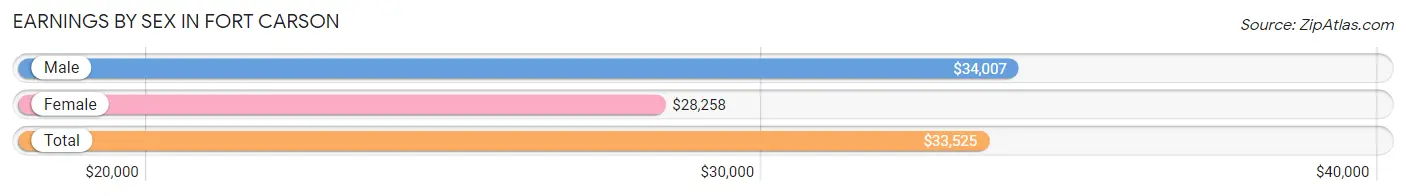
Earnings by Sex in Fort Carson
Average Earnings in Fort Carson are $33,525, $34,007 for men and $28,258 for women, a difference of 16.9%.
| Sex | Number | Average Earnings |
| Male | 9,375 (80.1%) | $34,007 |
| Female | 2,327 (19.9%) | $28,258 |
| Total | 11,702 (100.0%) | $33,525 |
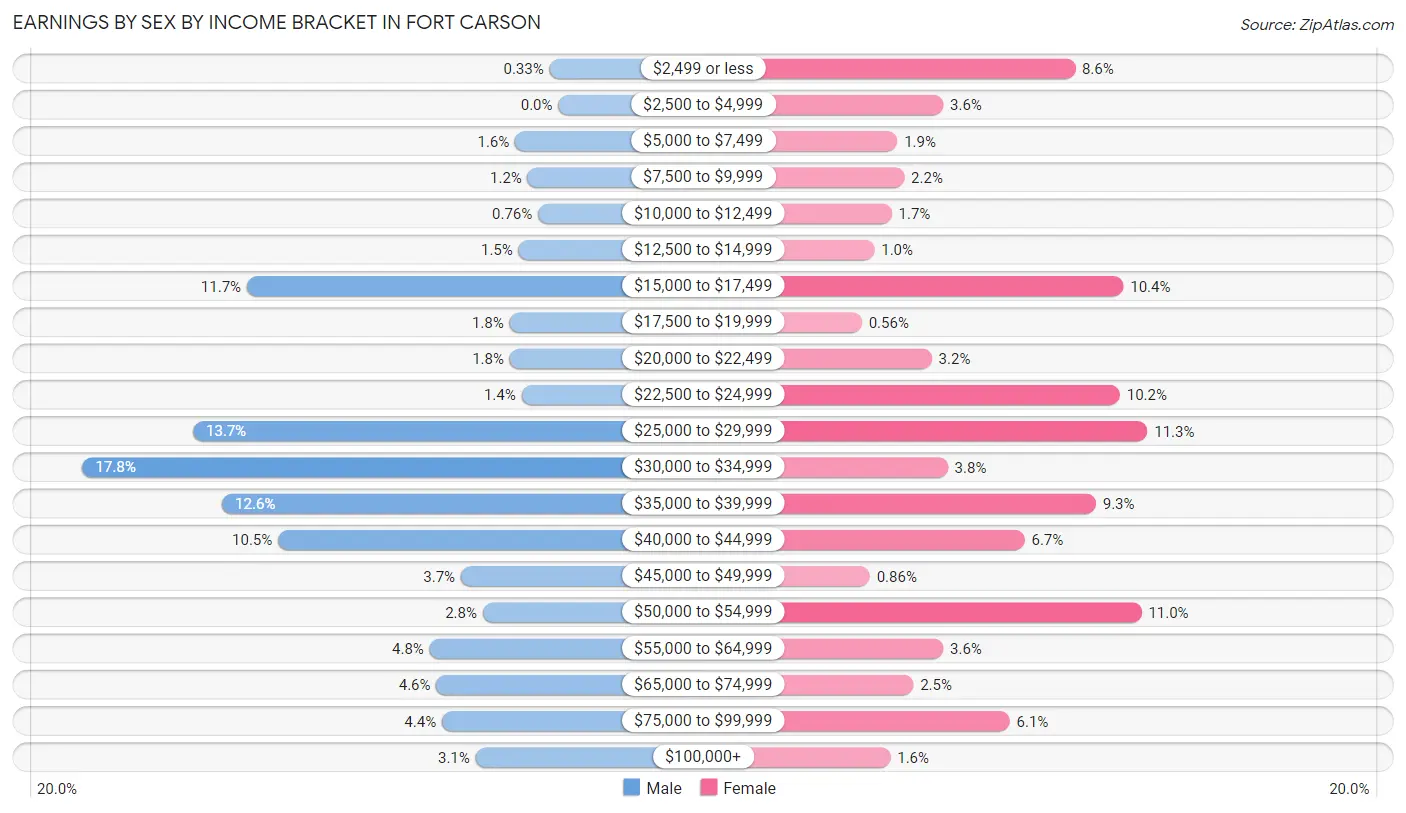
Earnings by Sex by Income Bracket in Fort Carson
The most common earnings brackets in Fort Carson are $30,000 to $34,999 for men (1,672 | 17.8%) and $25,000 to $29,999 for women (262 | 11.3%).
| Income | Male | Female |
| $2,499 or less | 31 (0.3%) | 199 (8.6%) |
| $2,500 to $4,999 | 0 (0.0%) | 84 (3.6%) |
| $5,000 to $7,499 | 152 (1.6%) | 44 (1.9%) |
| $7,500 to $9,999 | 108 (1.1%) | 50 (2.1%) |
| $10,000 to $12,499 | 71 (0.8%) | 39 (1.7%) |
| $12,500 to $14,999 | 140 (1.5%) | 24 (1.0%) |
| $15,000 to $17,499 | 1,094 (11.7%) | 241 (10.4%) |
| $17,500 to $19,999 | 172 (1.8%) | 13 (0.6%) |
| $20,000 to $22,499 | 171 (1.8%) | 74 (3.2%) |
| $22,500 to $24,999 | 129 (1.4%) | 238 (10.2%) |
| $25,000 to $29,999 | 1,283 (13.7%) | 262 (11.3%) |
| $30,000 to $34,999 | 1,672 (17.8%) | 88 (3.8%) |
| $35,000 to $39,999 | 1,181 (12.6%) | 217 (9.3%) |
| $40,000 to $44,999 | 984 (10.5%) | 155 (6.7%) |
| $45,000 to $49,999 | 342 (3.6%) | 20 (0.9%) |
| $50,000 to $54,999 | 265 (2.8%) | 257 (11.0%) |
| $55,000 to $64,999 | 452 (4.8%) | 84 (3.6%) |
| $65,000 to $74,999 | 428 (4.6%) | 58 (2.5%) |
| $75,000 to $99,999 | 409 (4.4%) | 142 (6.1%) |
| $100,000+ | 291 (3.1%) | 38 (1.6%) |
| Total | 9,375 (100.0%) | 2,327 (100.0%) |
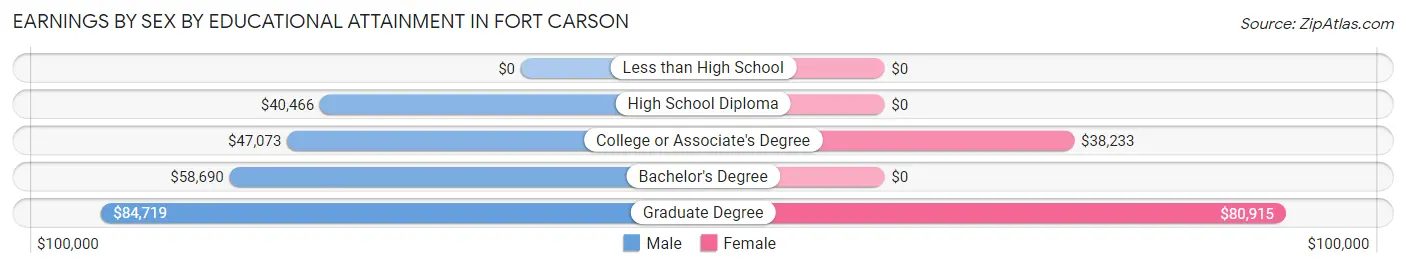
Earnings by Sex by Educational Attainment in Fort Carson
Average earnings in Fort Carson are $46,087 for men and $38,556 for women, a difference of 16.3%. Men with an educational attainment of graduate degree enjoy the highest average annual earnings of $84,719, while those with high school diploma education earn the least with $40,466. Women with an educational attainment of graduate degree earn the most with the average annual earnings of $80,915, while those with college or associate's degree education have the smallest earnings of $38,233.
| Educational Attainment | Male Income | Female Income |
| Less than High School | - | - |
| High School Diploma | $40,466 | $0 |
| College or Associate's Degree | $47,073 | $38,233 |
| Bachelor's Degree | $58,690 | $0 |
| Graduate Degree | $84,719 | $80,915 |
| Total | $46,087 | $38,556 |
Family Income in Fort Carson
Family Income Brackets in Fort Carson
According to the Fort Carson family income data, there are 1,038 families falling into the $50,000 to $74,999 income range, which is the most common income bracket and makes up 32.2% of all families. Conversely, the $10,000 to $14,999 income bracket is the least frequent group with only 13 families (0.4%) belonging to this category.
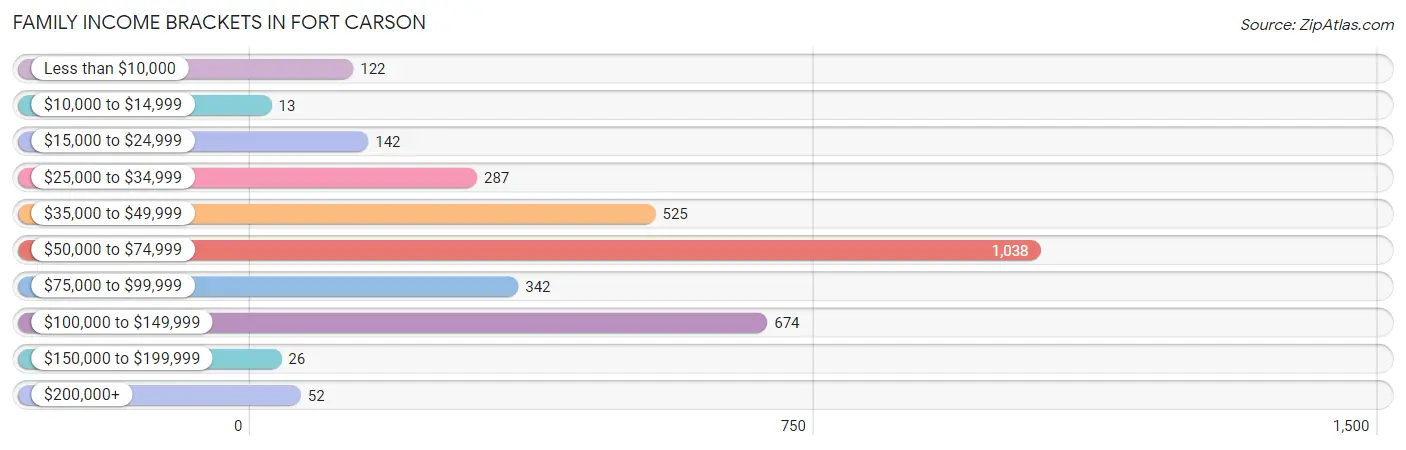
| Income Bracket | # Families | % Families |
| Less than $10,000 | 122 | 3.8% |
| $10,000 to $14,999 | 13 | 0.4% |
| $15,000 to $24,999 | 142 | 4.4% |
| $25,000 to $34,999 | 287 | 8.9% |
| $35,000 to $49,999 | 525 | 16.3% |
| $50,000 to $74,999 | 1,038 | 32.2% |
| $75,000 to $99,999 | 342 | 10.6% |
| $100,000 to $149,999 | 674 | 20.9% |
| $150,000 to $199,999 | 26 | 0.8% |
| $200,000+ | 52 | 1.6% |
Family Income by Famaliy Size in Fort Carson
6-person families (83 | 2.6%) account for the highest median family income in Fort Carson with $69,458 per family, while 2-person families (588 | 18.2%) have the highest median income of $29,750 per family member.
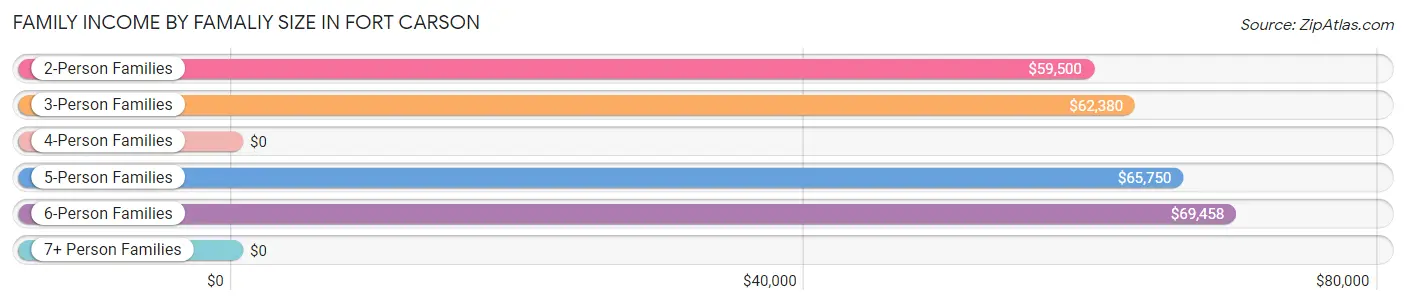
| Income Bracket | # Families | Median Income |
| 2-Person Families | 588 (18.2%) | $59,500 |
| 3-Person Families | 1,299 (40.3%) | $62,380 |
| 4-Person Families | 645 (20.0%) | $0 |
| 5-Person Families | 581 (18.0%) | $65,750 |
| 6-Person Families | 83 (2.6%) | $69,458 |
| 7+ Person Families | 27 (0.8%) | $0 |
| Total | 3,223 (100.0%) | $62,532 |
Family Income by Number of Earners in Fort Carson
The median family income in Fort Carson is $62,532, with families comprising 3+ earners (71) having the highest median family income of $208,112, while families with no earners (108) have the lowest median family income of $2,499, accounting for 2.2% and 3.4% of families, respectively.
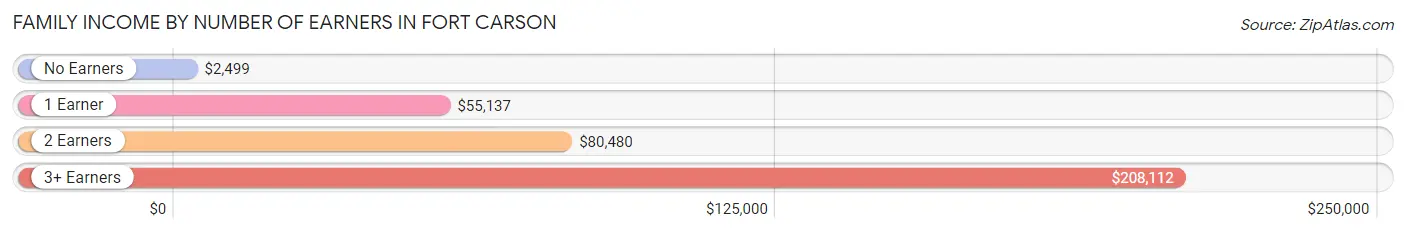
| Number of Earners | # Families | Median Income |
| No Earners | 108 (3.4%) | $2,499 |
| 1 Earner | 1,683 (52.2%) | $55,137 |
| 2 Earners | 1,361 (42.2%) | $80,480 |
| 3+ Earners | 71 (2.2%) | $208,112 |
| Total | 3,223 (100.0%) | $62,532 |
Household Income in Fort Carson
Household Income Brackets in Fort Carson
With 1,039 households falling in the category, the $50,000 to $74,999 income range is the most frequent in Fort Carson, accounting for 31.2% of all households. In contrast, only 13 households (0.4%) fall into the $10,000 to $14,999 income bracket, making it the least populous group.
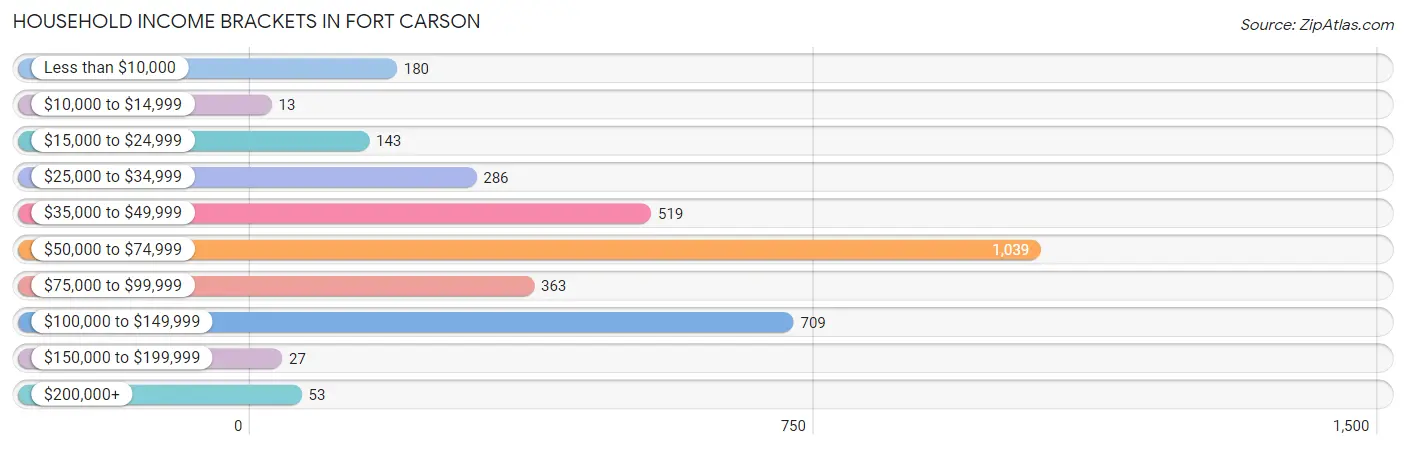
| Income Bracket | # Households | % Households |
| Less than $10,000 | 180 | 5.4% |
| $10,000 to $14,999 | 13 | 0.4% |
| $15,000 to $24,999 | 143 | 4.3% |
| $25,000 to $34,999 | 286 | 8.6% |
| $35,000 to $49,999 | 519 | 15.6% |
| $50,000 to $74,999 | 1,039 | 31.2% |
| $75,000 to $99,999 | 363 | 10.9% |
| $100,000 to $149,999 | 709 | 21.3% |
| $150,000 to $199,999 | 27 | 0.8% |
| $200,000+ | 53 | 1.6% |
Household Income by Householder Age in Fort Carson
The median household income in Fort Carson is $62,582, with the highest median household income of $109,361 found in the 45 to 64 years age bracket for the primary householder. A total of 199 households (6.0%) fall into this category.
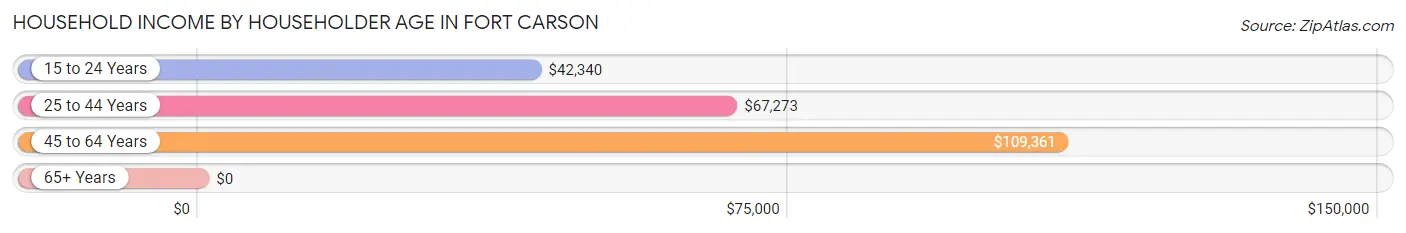
| Income Bracket | # Households | Median Income |
| 15 to 24 Years | 696 (20.9%) | $42,340 |
| 25 to 44 Years | 2,434 (73.1%) | $67,273 |
| 45 to 64 Years | 199 (6.0%) | $109,361 |
| 65+ Years | 0 (0.0%) | $0 |
| Total | 3,329 (100.0%) | $62,582 |
Poverty in Fort Carson
Income Below Poverty by Sex and Age in Fort Carson
With 10.1% poverty level for males and 10.2% for females among the residents of Fort Carson, 5 year old males and 18 to 24 year old females are the most vulnerable to poverty, with 47 males (20.5%) and 139 females (19.5%) in their respective age groups living below the poverty level.
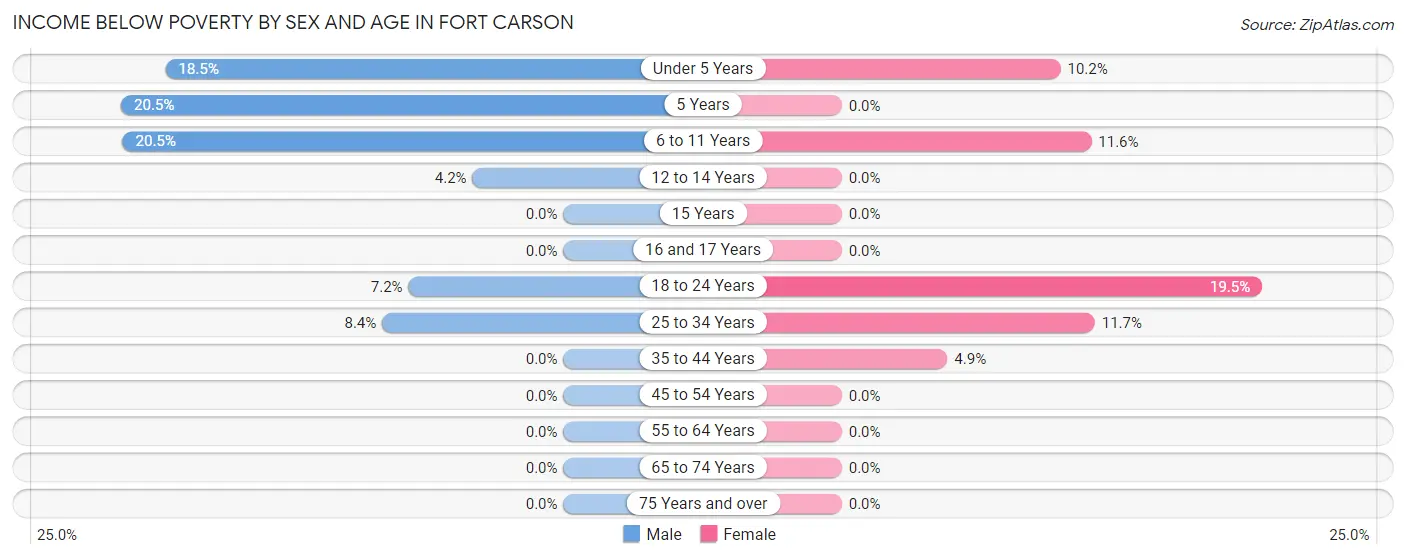
| Age Bracket | Male | Female |
| Under 5 Years | 223 (18.5%) | 76 (10.2%) |
| 5 Years | 47 (20.5%) | 0 (0.0%) |
| 6 to 11 Years | 147 (20.4%) | 83 (11.6%) |
| 12 to 14 Years | 13 (4.2%) | 0 (0.0%) |
| 15 Years | 0 (0.0%) | 0 (0.0%) |
| 16 and 17 Years | 0 (0.0%) | 0 (0.0%) |
| 18 to 24 Years | 52 (7.2%) | 139 (19.5%) |
| 25 to 34 Years | 114 (8.4%) | 199 (11.7%) |
| 35 to 44 Years | 0 (0.0%) | 35 (4.9%) |
| 45 to 54 Years | 0 (0.0%) | 0 (0.0%) |
| 55 to 64 Years | 0 (0.0%) | 0 (0.0%) |
| 65 to 74 Years | 0 (0.0%) | 0 (0.0%) |
| 75 Years and over | 0 (0.0%) | 0 (0.0%) |
| Total | 596 (10.1%) | 532 (10.2%) |
Income Above Poverty by Sex and Age in Fort Carson
According to the poverty statistics in Fort Carson, males aged 15 years and females aged 5 years are the age groups that are most secure financially, with 100.0% of males and 100.0% of females in these age groups living above the poverty line.
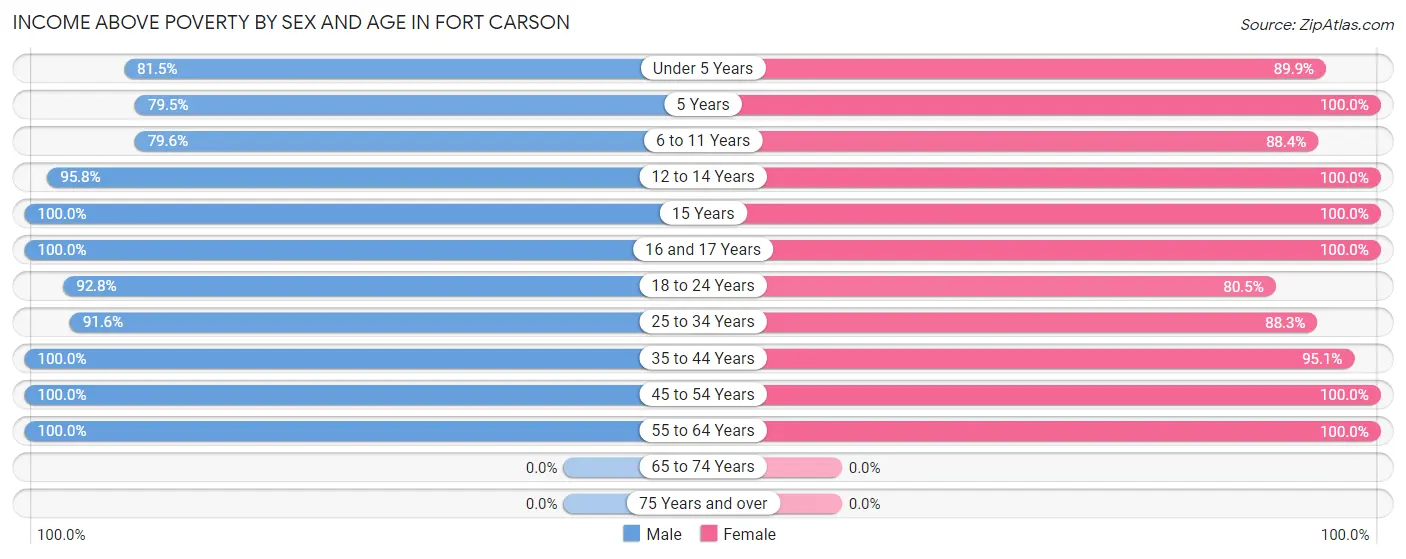
| Age Bracket | Male | Female |
| Under 5 Years | 985 (81.5%) | 673 (89.8%) |
| 5 Years | 182 (79.5%) | 71 (100.0%) |
| 6 to 11 Years | 572 (79.5%) | 634 (88.4%) |
| 12 to 14 Years | 295 (95.8%) | 184 (100.0%) |
| 15 Years | 112 (100.0%) | 164 (100.0%) |
| 16 and 17 Years | 149 (100.0%) | 30 (100.0%) |
| 18 to 24 Years | 671 (92.8%) | 574 (80.5%) |
| 25 to 34 Years | 1,242 (91.6%) | 1,496 (88.3%) |
| 35 to 44 Years | 864 (100.0%) | 679 (95.1%) |
| 45 to 54 Years | 194 (100.0%) | 131 (100.0%) |
| 55 to 64 Years | 58 (100.0%) | 24 (100.0%) |
| 65 to 74 Years | 0 (0.0%) | 0 (0.0%) |
| 75 Years and over | 0 (0.0%) | 0 (0.0%) |
| Total | 5,324 (89.9%) | 4,660 (89.7%) |
Income Below Poverty Among Married-Couple Families in Fort Carson
The poverty statistics for married-couple families in Fort Carson show that 5.7% or 166 of the total 2,916 families live below the poverty line. Families with 1 or 2 children have the highest poverty rate of 9.5%, comprising of 166 families. On the other hand, families with no children have the lowest poverty rate of 0.0%, which includes 0 families.
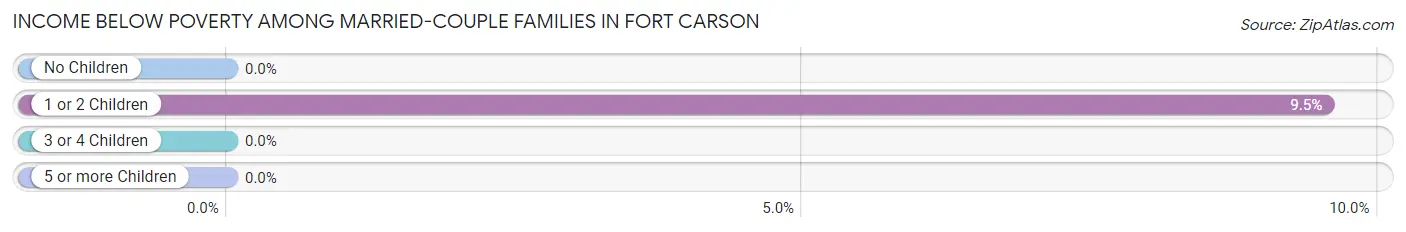
| Children | Above Poverty | Below Poverty |
| No Children | 536 (100.0%) | 0 (0.0%) |
| 1 or 2 Children | 1,574 (90.5%) | 166 (9.5%) |
| 3 or 4 Children | 627 (100.0%) | 0 (0.0%) |
| 5 or more Children | 13 (100.0%) | 0 (0.0%) |
| Total | 2,750 (94.3%) | 166 (5.7%) |
Income Below Poverty Among Single-Parent Households in Fort Carson
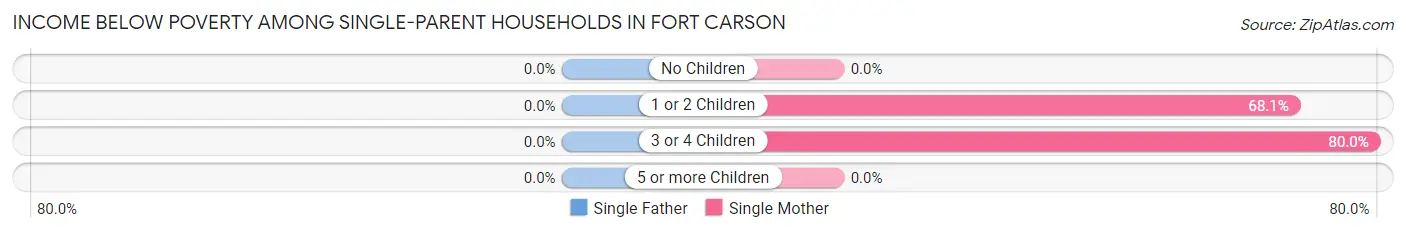
| Children | Single Father | Single Mother |
| No Children | 0 (0.0%) | 0 (0.0%) |
| 1 or 2 Children | 0 (0.0%) | 145 (68.1%) |
| 3 or 4 Children | 0 (0.0%) | 20 (80.0%) |
| 5 or more Children | 0 (0.0%) | 0 (0.0%) |
| Total | 0 (0.0%) | 165 (67.1%) |
Income Below Poverty Among Married-Couple vs Single-Parent Households in Fort Carson
The poverty data for Fort Carson shows that 166 of the married-couple family households (5.7%) and 165 of the single-parent households (53.7%) are living below the poverty level. Within the married-couple family households, those with 1 or 2 children have the highest poverty rate, with 166 households (9.5%) falling below the poverty line. Among the single-parent households, those with 1 or 2 children have the highest poverty rate, with 145 household (64.7%) living below poverty.
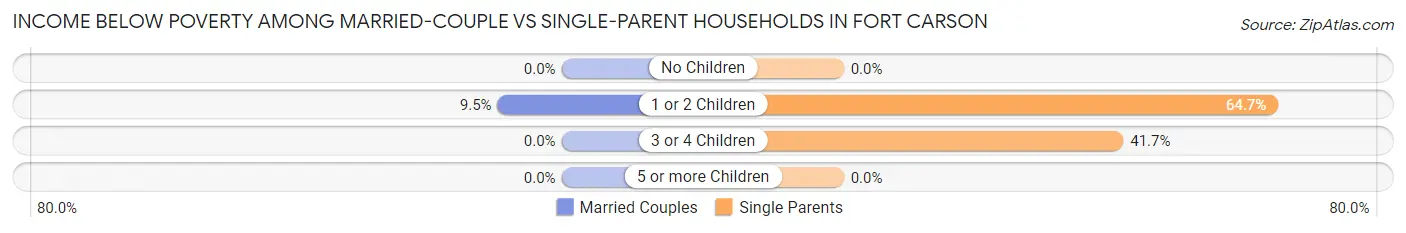
| Children | Married-Couple Families | Single-Parent Households |
| No Children | 0 (0.0%) | 0 (0.0%) |
| 1 or 2 Children | 166 (9.5%) | 145 (64.7%) |
| 3 or 4 Children | 0 (0.0%) | 20 (41.7%) |
| 5 or more Children | 0 (0.0%) | 0 (0.0%) |
| Total | 166 (5.7%) | 165 (53.7%) |
Race in Fort Carson
The most populous races in Fort Carson are White / Caucasian (11,943 | 66.0%), Hispanic or Latino (3,963 | 21.9%), and Black / African American (2,768 | 15.3%).
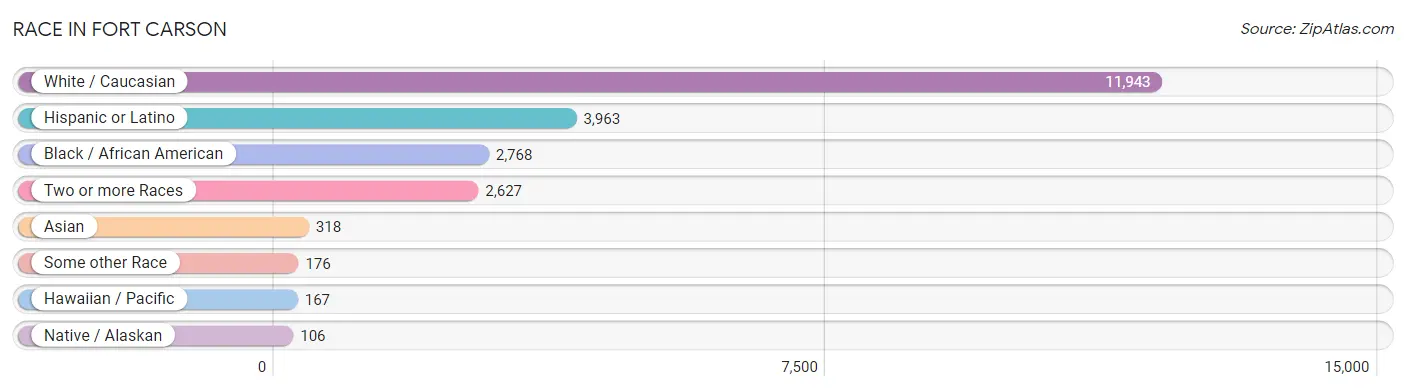
| Race | # Population | % Population |
| Asian | 318 | 1.8% |
| Black / African American | 2,768 | 15.3% |
| Hawaiian / Pacific | 167 | 0.9% |
| Hispanic or Latino | 3,963 | 21.9% |
| Native / Alaskan | 106 | 0.6% |
| White / Caucasian | 11,943 | 66.0% |
| Two or more Races | 2,627 | 14.5% |
| Some other Race | 176 | 1.0% |
| Total | 18,105 | 100.0% |
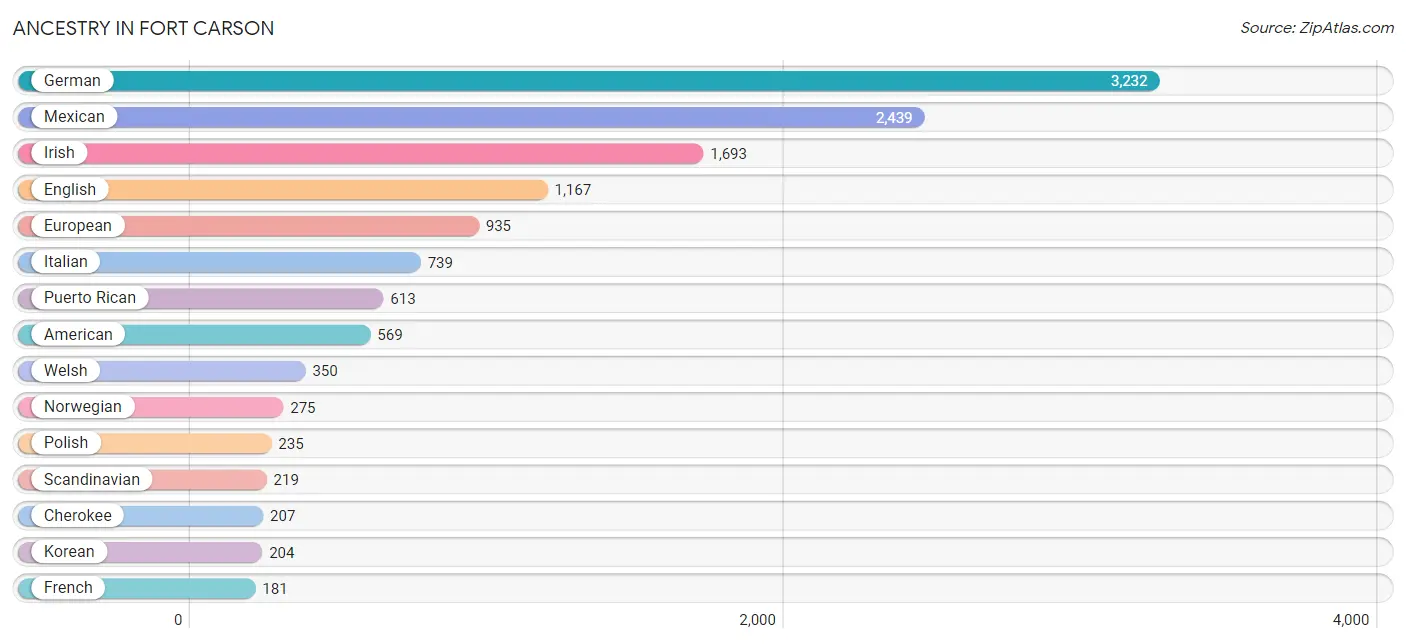
Ancestry in Fort Carson
The most populous ancestries reported in Fort Carson are German (3,232 | 17.8%), Mexican (2,439 | 13.5%), Irish (1,693 | 9.3%), English (1,167 | 6.5%), and European (935 | 5.2%), together accounting for 52.3% of all Fort Carson residents.
| Ancestry | # Population | % Population |
| African | 63 | 0.4% |
| American | 569 | 3.1% |
| Apache | 16 | 0.1% |
| Arab | 26 | 0.1% |
| Bangladeshi | 6 | 0.0% |
| Basque | 11 | 0.1% |
| Belgian | 17 | 0.1% |
| Bhutanese | 41 | 0.2% |
| Brazilian | 5 | 0.0% |
| British | 17 | 0.1% |
| British West Indian | 5 | 0.0% |
| Burmese | 50 | 0.3% |
| Canadian | 60 | 0.3% |
| Central American | 144 | 0.8% |
| Central American Indian | 17 | 0.1% |
| Cherokee | 207 | 1.1% |
| Chinese | 5 | 0.0% |
| Choctaw | 14 | 0.1% |
| Colombian | 23 | 0.1% |
| Comanche | 18 | 0.1% |
| Cuban | 52 | 0.3% |
| Czech | 158 | 0.9% |
| Dominican | 89 | 0.5% |
| Dutch | 165 | 0.9% |
| Eastern European | 86 | 0.5% |
| Ecuadorian | 112 | 0.6% |
| English | 1,167 | 6.5% |
| European | 935 | 5.2% |
| Filipino | 37 | 0.2% |
| Finnish | 8 | 0.0% |
| French | 181 | 1.0% |
| French Canadian | 7 | 0.0% |
| German | 3,232 | 17.8% |
| Greek | 30 | 0.2% |
| Guamanian / Chamorro | 123 | 0.7% |
| Guatemalan | 61 | 0.3% |
| Haitian | 43 | 0.2% |
| Honduran | 31 | 0.2% |
| Hopi | 14 | 0.1% |
| Hungarian | 83 | 0.5% |
| Indian (Asian) | 66 | 0.4% |
| Inupiat | 25 | 0.1% |
| Iranian | 14 | 0.1% |
| Irish | 1,693 | 9.3% |
| Italian | 739 | 4.1% |
| Jamaican | 135 | 0.7% |
| Kenyan | 18 | 0.1% |
| Korean | 204 | 1.1% |
| Laotian | 17 | 0.1% |
| Latvian | 19 | 0.1% |
| Lebanese | 15 | 0.1% |
| Liberian | 1 | 0.0% |
| Malaysian | 12 | 0.1% |
| Mexican | 2,439 | 13.5% |
| Native Hawaiian | 57 | 0.3% |
| Navajo | 78 | 0.4% |
| Nicaraguan | 34 | 0.2% |
| Nigerian | 6 | 0.0% |
| Norwegian | 275 | 1.5% |
| Pakistani | 3 | 0.0% |
| Panamanian | 7 | 0.0% |
| Peruvian | 36 | 0.2% |
| Polish | 235 | 1.3% |
| Portuguese | 62 | 0.3% |
| Potawatomi | 7 | 0.0% |
| Puerto Rican | 613 | 3.4% |
| Romanian | 13 | 0.1% |
| Russian | 117 | 0.6% |
| Salvadoran | 11 | 0.1% |
| Samoan | 31 | 0.2% |
| Scandinavian | 219 | 1.2% |
| Scotch-Irish | 148 | 0.8% |
| Scottish | 109 | 0.6% |
| Shoshone | 2 | 0.0% |
| Sioux | 36 | 0.2% |
| Slavic | 1 | 0.0% |
| Slovak | 29 | 0.2% |
| Somali | 28 | 0.2% |
| South American | 171 | 0.9% |
| Spaniard | 162 | 0.9% |
| Spanish | 23 | 0.1% |
| Sri Lankan | 39 | 0.2% |
| Subsaharan African | 136 | 0.7% |
| Sudanese | 28 | 0.2% |
| Swedish | 140 | 0.8% |
| Thai | 18 | 0.1% |
| Tlingit-Haida | 8 | 0.0% |
| Trinidadian and Tobagonian | 10 | 0.1% |
| Ukrainian | 22 | 0.1% |
| Welsh | 350 | 1.9% |
| Yugoslavian | 3 | 0.0% |
| Yuman | 1 | 0.0% | View All 92 Rows |
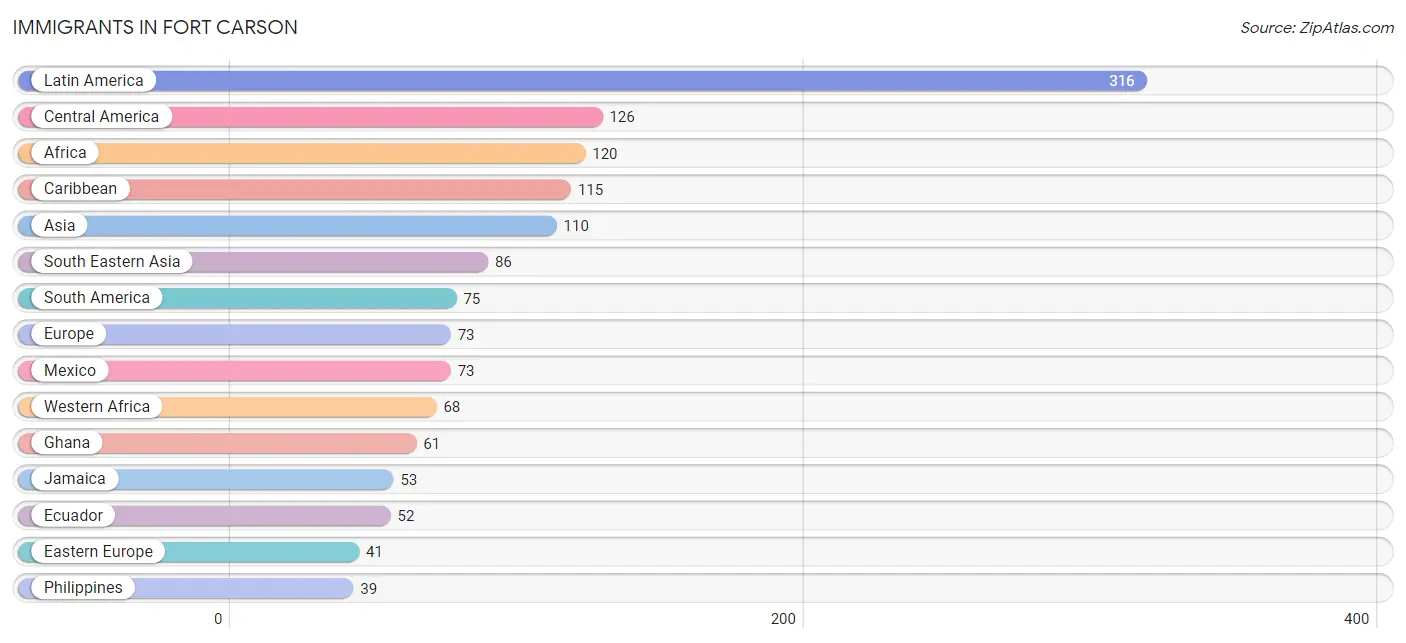
Immigrants in Fort Carson
The most numerous immigrant groups reported in Fort Carson came from Latin America (316 | 1.8%), Central America (126 | 0.7%), Africa (120 | 0.7%), Caribbean (115 | 0.6%), and Asia (110 | 0.6%), together accounting for 4.4% of all Fort Carson residents.
| Immigration Origin | # Population | % Population |
| Africa | 120 | 0.7% |
| Asia | 110 | 0.6% |
| Caribbean | 115 | 0.6% |
| Central America | 126 | 0.7% |
| China | 2 | 0.0% |
| Colombia | 17 | 0.1% |
| Dominican Republic | 21 | 0.1% |
| Eastern Africa | 18 | 0.1% |
| Eastern Asia | 8 | 0.0% |
| Eastern Europe | 41 | 0.2% |
| Ecuador | 52 | 0.3% |
| England | 6 | 0.0% |
| Europe | 73 | 0.4% |
| Germany | 20 | 0.1% |
| Ghana | 61 | 0.3% |
| Guatemala | 37 | 0.2% |
| Haiti | 31 | 0.2% |
| Honduras | 9 | 0.1% |
| Italy | 6 | 0.0% |
| Jamaica | 53 | 0.3% |
| Kenya | 18 | 0.1% |
| Korea | 6 | 0.0% |
| Latin America | 316 | 1.8% |
| Liberia | 1 | 0.0% |
| Mexico | 73 | 0.4% |
| Nigeria | 6 | 0.0% |
| Northern Africa | 9 | 0.1% |
| Northern Europe | 6 | 0.0% |
| Oceania | 23 | 0.1% |
| Pakistan | 14 | 0.1% |
| Panama | 7 | 0.0% |
| Peru | 6 | 0.0% |
| Philippines | 39 | 0.2% |
| Romania | 7 | 0.0% |
| Russia | 20 | 0.1% |
| South Africa | 23 | 0.1% |
| South America | 75 | 0.4% |
| South Central Asia | 16 | 0.1% |
| South Eastern Asia | 86 | 0.5% |
| Southern Europe | 6 | 0.0% |
| Thailand | 28 | 0.2% |
| Trinidad and Tobago | 10 | 0.1% |
| Ukraine | 14 | 0.1% |
| Uzbekistan | 2 | 0.0% |
| Vietnam | 19 | 0.1% |
| Western Africa | 68 | 0.4% |
| Western Europe | 20 | 0.1% | View All 47 Rows |
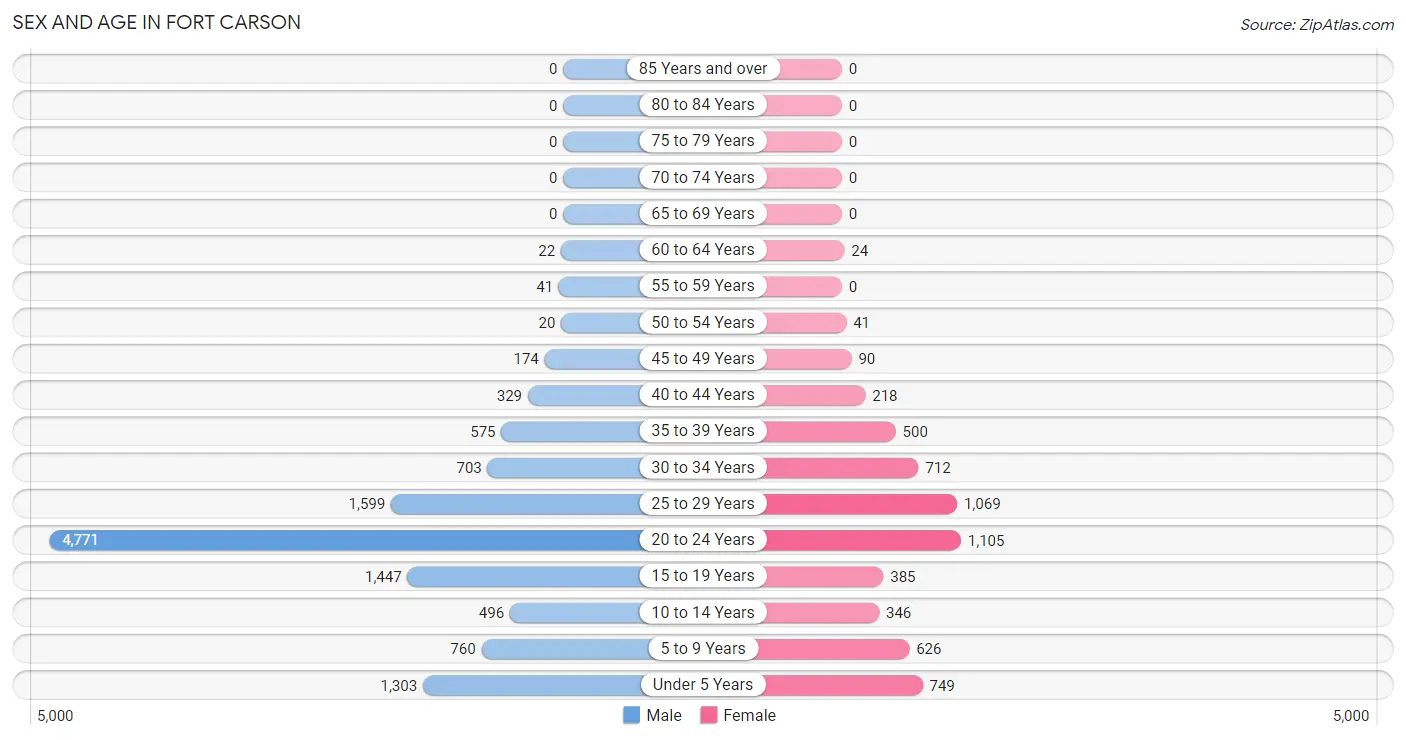
Sex and Age in Fort Carson
Sex and Age in Fort Carson
The most populous age groups in Fort Carson are 20 to 24 Years (4,771 | 39.0%) for men and 20 to 24 Years (1,105 | 18.8%) for women.
| Age Bracket | Male | Female |
| Under 5 Years | 1,303 (10.6%) | 749 (12.8%) |
| 5 to 9 Years | 760 (6.2%) | 626 (10.7%) |
| 10 to 14 Years | 496 (4.1%) | 346 (5.9%) |
| 15 to 19 Years | 1,447 (11.8%) | 385 (6.6%) |
| 20 to 24 Years | 4,771 (39.0%) | 1,105 (18.8%) |
| 25 to 29 Years | 1,599 (13.1%) | 1,069 (18.2%) |
| 30 to 34 Years | 703 (5.7%) | 712 (12.1%) |
| 35 to 39 Years | 575 (4.7%) | 500 (8.5%) |
| 40 to 44 Years | 329 (2.7%) | 218 (3.7%) |
| 45 to 49 Years | 174 (1.4%) | 90 (1.5%) |
| 50 to 54 Years | 20 (0.2%) | 41 (0.7%) |
| 55 to 59 Years | 41 (0.3%) | 0 (0.0%) |
| 60 to 64 Years | 22 (0.2%) | 24 (0.4%) |
| 65 to 69 Years | 0 (0.0%) | 0 (0.0%) |
| 70 to 74 Years | 0 (0.0%) | 0 (0.0%) |
| 75 to 79 Years | 0 (0.0%) | 0 (0.0%) |
| 80 to 84 Years | 0 (0.0%) | 0 (0.0%) |
| 85 Years and over | 0 (0.0%) | 0 (0.0%) |
| Total | 12,240 (100.0%) | 5,865 (100.0%) |
Families and Households in Fort Carson
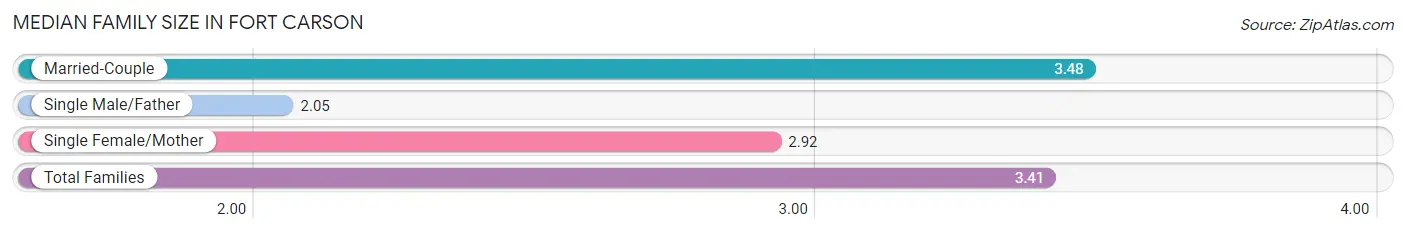
Median Family Size in Fort Carson
The median family size in Fort Carson is 3.41 persons per family, with married-couple families (2,916 | 90.5%) accounting for the largest median family size of 3.48 persons per family. On the other hand, single male/father families (61 | 1.9%) represent the smallest median family size with 2.05 persons per family.
| Family Type | # Families | Family Size |
| Married-Couple | 2,916 (90.5%) | 3.48 |
| Single Male/Father | 61 (1.9%) | 2.05 |
| Single Female/Mother | 246 (7.6%) | 2.92 |
| Total Families | 3,223 (100.0%) | 3.41 |
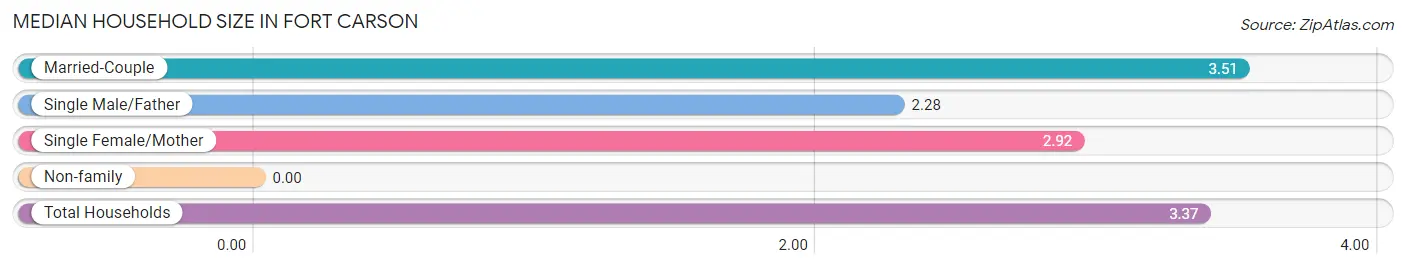
Median Household Size in Fort Carson
| Household Type | # Households | Household Size |
| Married-Couple | 2,916 (87.6%) | 3.51 |
| Single Male/Father | 61 (1.8%) | 2.28 |
| Single Female/Mother | 246 (7.4%) | 2.92 |
| Non-family | 106 (3.2%) | - |
| Total Households | 3,329 (100.0%) | 3.37 |
Household Size by Marriage Status in Fort Carson
Out of a total of 3,329 households in Fort Carson, 3,223 (96.8%) are family households, while 106 (3.2%) are nonfamily households. The most numerous type of family households are 3-person households, comprising 1,299, and the most common type of nonfamily households are 1-person households, comprising 106.
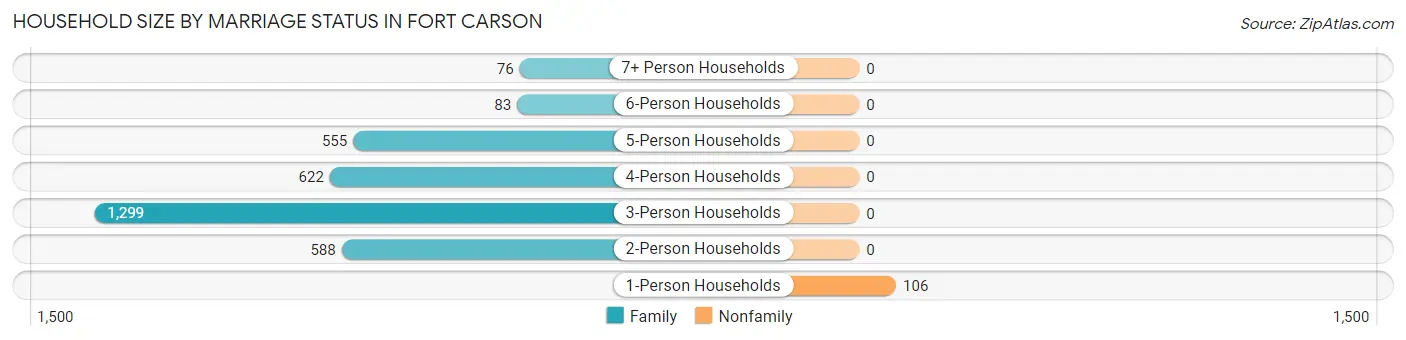
| Household Size | Family Households | Nonfamily Households |
| 1-Person Households | - | 106 (3.2%) |
| 2-Person Households | 588 (17.7%) | 0 (0.0%) |
| 3-Person Households | 1,299 (39.0%) | 0 (0.0%) |
| 4-Person Households | 622 (18.7%) | 0 (0.0%) |
| 5-Person Households | 555 (16.7%) | 0 (0.0%) |
| 6-Person Households | 83 (2.5%) | 0 (0.0%) |
| 7+ Person Households | 76 (2.3%) | 0 (0.0%) |
| Total | 3,223 (96.8%) | 106 (3.2%) |
Female Fertility in Fort Carson
Fertility by Age in Fort Carson
Average fertility rate in Fort Carson is 135.0 births per 1,000 women. Women in the age bracket of 20 to 34 years have the highest fertility rate with 188.0 births per 1,000 women. Women in the age bracket of 20 to 34 years acount for 98.6% of all women with births.
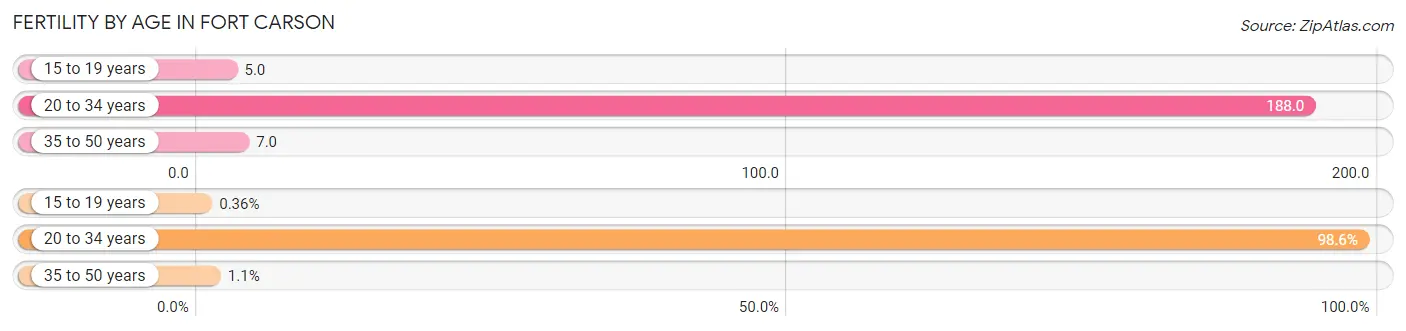
| Age Bracket | Women with Births | Births / 1,000 Women |
| 15 to 19 years | 2 (0.4%) | 5.0 |
| 20 to 34 years | 542 (98.6%) | 188.0 |
| 35 to 50 years | 6 (1.1%) | 7.0 |
| Total | 550 (100.0%) | 135.0 |
Fertility by Age by Marriage Status in Fort Carson
98.7% of women with births (550) in Fort Carson are married. The highest percentage of unmarried women with births falls into 15 to 19 years age bracket with 100.0% of them unmarried at the time of birth, while the lowest percentage of unmarried women with births belong to 35 to 50 years age bracket with 0.0% of them unmarried.
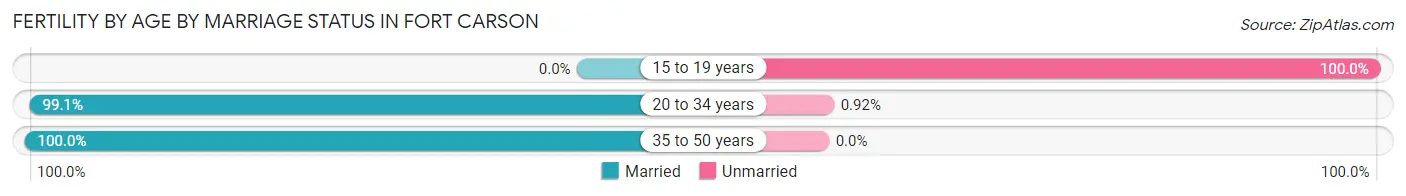
| Age Bracket | Married | Unmarried |
| 15 to 19 years | 0 (0.0%) | 2 (100.0%) |
| 20 to 34 years | 537 (99.1%) | 5 (0.9%) |
| 35 to 50 years | 6 (100.0%) | 0 (0.0%) |
| Total | 543 (98.7%) | 7 (1.3%) |
Fertility by Education in Fort Carson
Average fertility rate in Fort Carson is 135.0 births per 1,000 women. Women with the education attainment of bachelor's degree have the highest fertility rate of 188.0 births per 1,000 women, while women with the education attainment of graduate degree have the lowest fertility at 27.0 births per 1,000 women. Women with the education attainment of college or associate's degree represent 68.7% of all women with births.
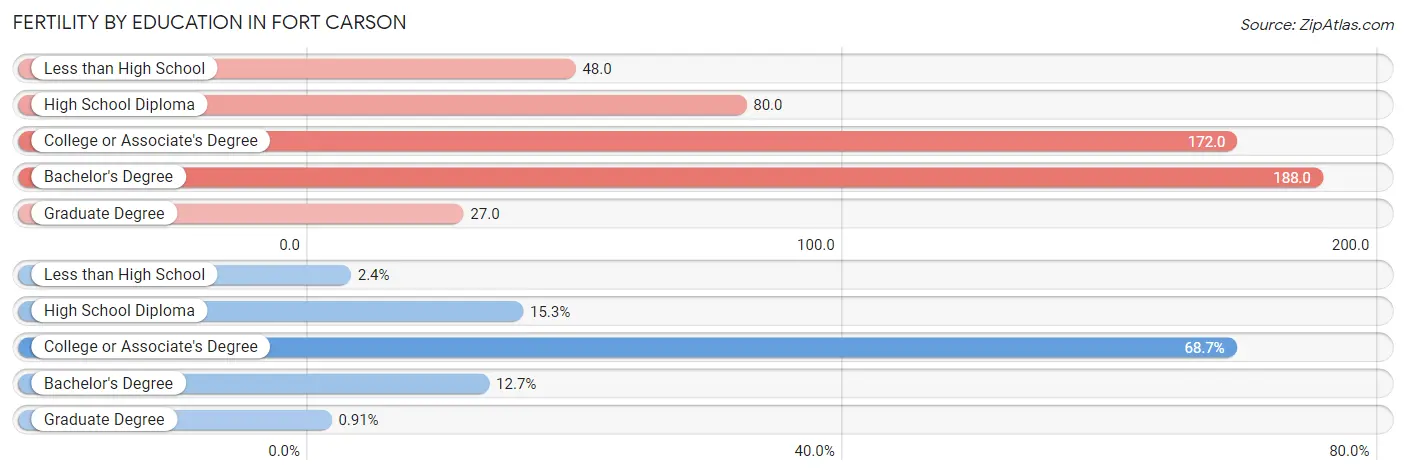
| Educational Attainment | Women with Births | Births / 1,000 Women |
| Less than High School | 13 (2.4%) | 48.0 |
| High School Diploma | 84 (15.3%) | 80.0 |
| College or Associate's Degree | 378 (68.7%) | 172.0 |
| Bachelor's Degree | 70 (12.7%) | 188.0 |
| Graduate Degree | 5 (0.9%) | 27.0 |
| Total | 550 (100.0%) | 135.0 |
Fertility by Education by Marriage Status in Fort Carson
1.3% of women with births in Fort Carson are unmarried. Women with the educational attainment of less than high school are most likely to be married with 100.0% of them married at childbirth, while women with the educational attainment of high school diploma are least likely to be married with 2.4% of them unmarried at childbirth.
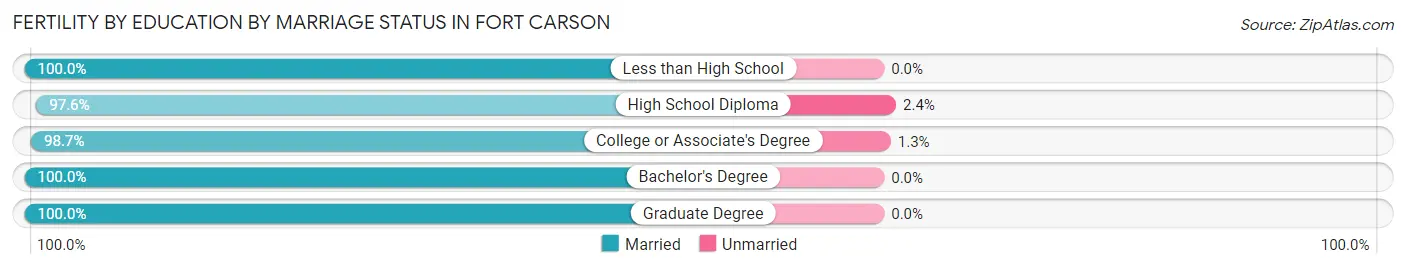
| Educational Attainment | Married | Unmarried |
| Less than High School | 13 (100.0%) | 0 (0.0%) |
| High School Diploma | 82 (97.6%) | 2 (2.4%) |
| College or Associate's Degree | 373 (98.7%) | 5 (1.3%) |
| Bachelor's Degree | 70 (100.0%) | 0 (0.0%) |
| Graduate Degree | 5 (100.0%) | 0 (0.0%) |
| Total | 543 (98.7%) | 7 (1.3%) |
Employment Characteristics in Fort Carson
Employment by Class of Employer in Fort Carson
Among the 11,460 employed individuals in Fort Carson, federal government employees (9,999 | 87.3%), private company employees (1,110 | 9.7%), and state government employees (96 | 0.8%) make up the most common classes of employment.
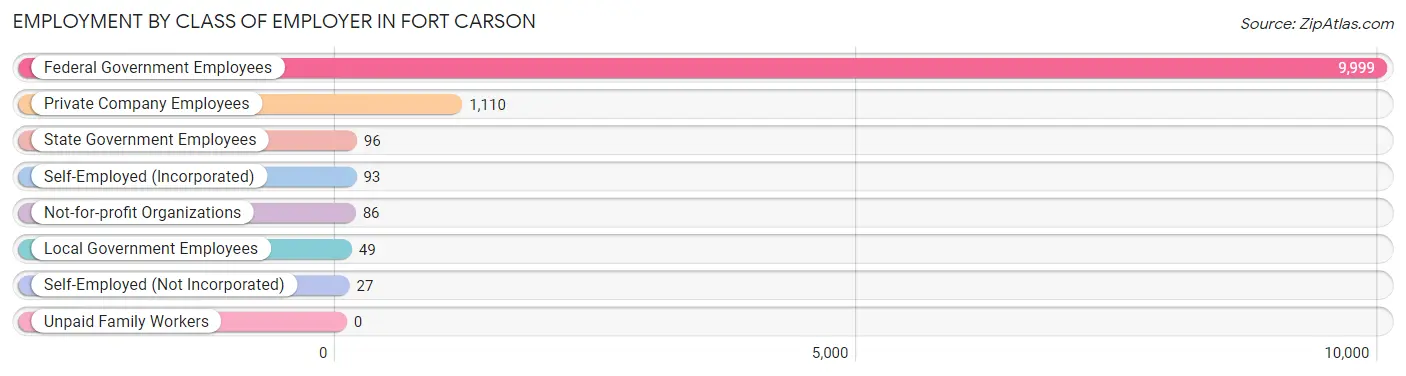
| Employer Class | # Employees | % Employees |
| Private Company Employees | 1,110 | 9.7% |
| Self-Employed (Incorporated) | 93 | 0.8% |
| Self-Employed (Not Incorporated) | 27 | 0.2% |
| Not-for-profit Organizations | 86 | 0.7% |
| Local Government Employees | 49 | 0.4% |
| State Government Employees | 96 | 0.8% |
| Federal Government Employees | 9,999 | 87.3% |
| Unpaid Family Workers | 0 | 0.0% |
| Total | 11,460 | 100.0% |
Employment Status by Age in Fort Carson
According to the labor force statistics for Fort Carson, out of the total population over 16 years of age (13,549), 85.1% or 11,530 individuals are in the labor force, with 1.9% or 219 of them unemployed. The age group with the highest labor force participation rate is 55 to 59 years, with 100.0% or 41 individuals in the labor force. Within the labor force, the 25 to 29 years age range has the highest percentage of unemployed individuals, with 7.0% or 147 of them being unemployed.
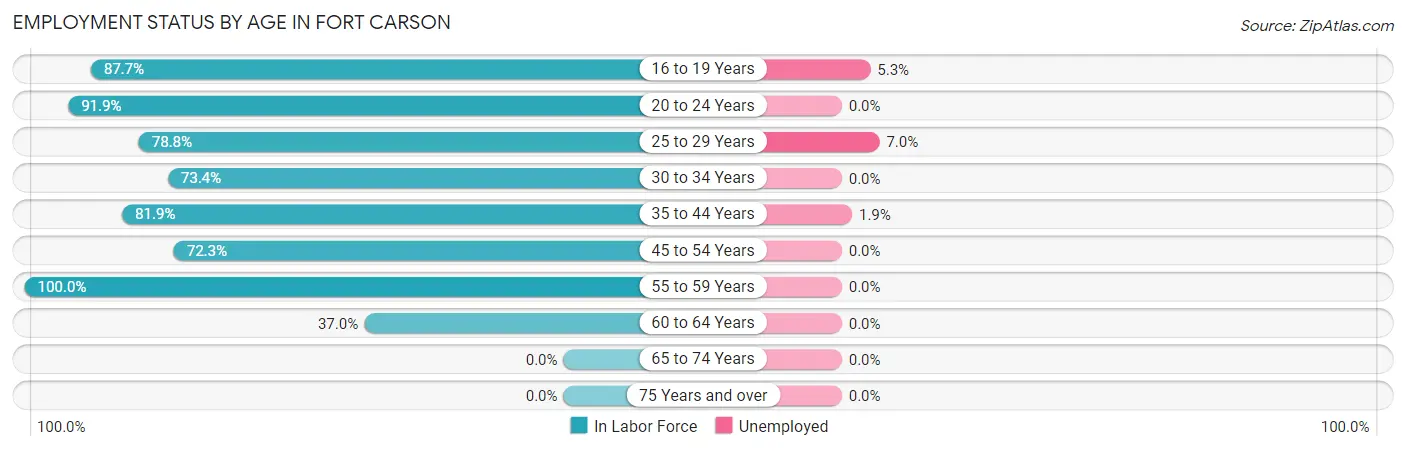
| Age Bracket | In Labor Force | Unemployed |
| 16 to 19 Years | 1,365 (87.7%) | 72 (5.3%) |
| 20 to 24 Years | 5,400 (91.9%) | 0 (0.0%) |
| 25 to 29 Years | 2,102 (78.8%) | 147 (7.0%) |
| 30 to 34 Years | 1,039 (73.4%) | 0 (0.0%) |
| 35 to 44 Years | 1,328 (81.9%) | 25 (1.9%) |
| 45 to 54 Years | 235 (72.3%) | 0 (0.0%) |
| 55 to 59 Years | 41 (100.0%) | 0 (0.0%) |
| 60 to 64 Years | 17 (37.0%) | 0 (0.0%) |
| 65 to 74 Years | 0 (0.0%) | 0 (0.0%) |
| 75 Years and over | 0 (0.0%) | 0 (0.0%) |
| Total | 11,530 (85.1%) | 219 (1.9%) |
Employment Status by Educational Attainment in Fort Carson
According to labor force statistics for Fort Carson, 77.8% of individuals (4,759) out of the total population between 25 and 64 years of age (6,117) are in the labor force, with 2.4% or 114 of them being unemployed. The group with the highest labor force participation rate are those with the educational attainment of high school diploma, with 81.2% or 1,370 individuals in the labor force. Within the labor force, individuals with bachelor's degree or higher education have the highest percentage of unemployment, with 6.9% or 66 of them being unemployed.
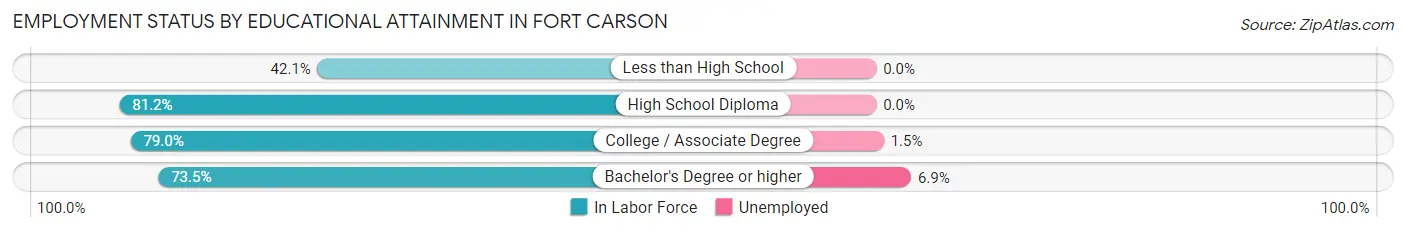
| Educational Attainment | In Labor Force | Unemployed |
| Less than High School | 40 (42.1%) | 0 (0.0%) |
| High School Diploma | 1,370 (81.2%) | 0 (0.0%) |
| College / Associate Degree | 2,397 (79.0%) | 46 (1.5%) |
| Bachelor's Degree or higher | 956 (73.5%) | 90 (6.9%) |
| Total | 4,759 (77.8%) | 147 (2.4%) |
Employment Occupations by Sex in Fort Carson
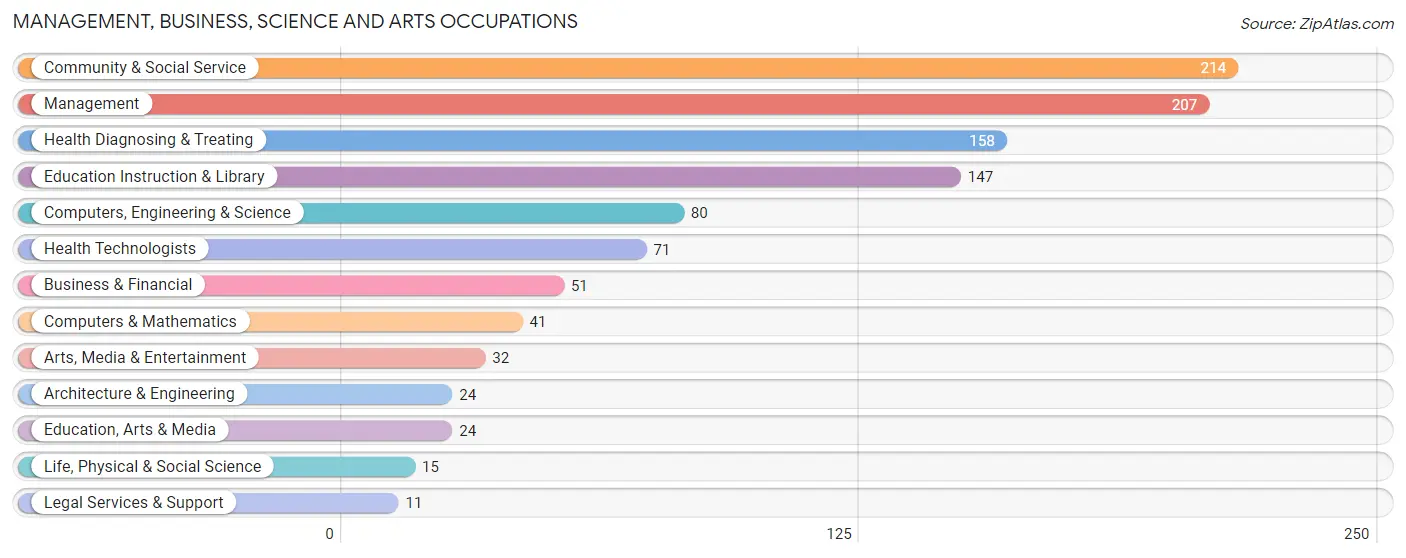
Management, Business, Science and Arts Occupations
The most common Management, Business, Science and Arts occupations in Fort Carson are Community & Social Service (214 | 9.8%), Management (207 | 9.5%), Health Diagnosing & Treating (158 | 7.3%), Education Instruction & Library (147 | 6.8%), and Computers, Engineering & Science (80 | 3.7%).
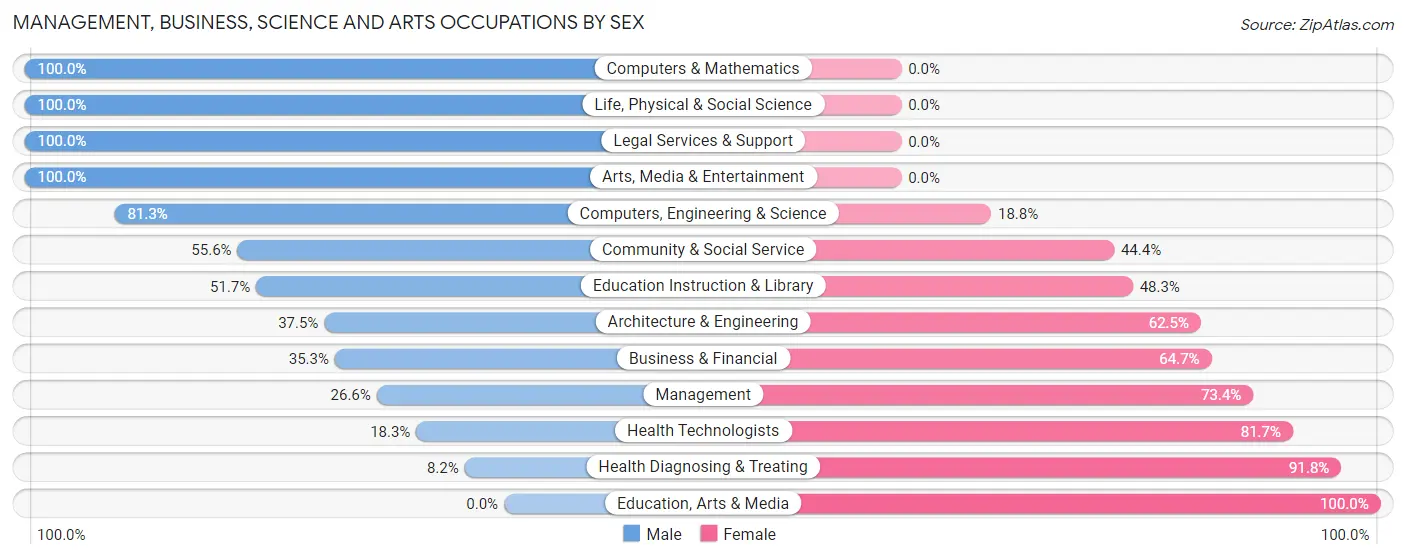
Management, Business, Science and Arts Occupations by Sex
Within the Management, Business, Science and Arts occupations in Fort Carson, the most male-oriented occupations are Computers & Mathematics (100.0%), Life, Physical & Social Science (100.0%), and Legal Services & Support (100.0%), while the most female-oriented occupations are Education, Arts & Media (100.0%), Health Diagnosing & Treating (91.8%), and Health Technologists (81.7%).
| Occupation | Male | Female |
| Management | 55 (26.6%) | 152 (73.4%) |
| Business & Financial | 18 (35.3%) | 33 (64.7%) |
| Computers, Engineering & Science | 65 (81.2%) | 15 (18.8%) |
| Computers & Mathematics | 41 (100.0%) | 0 (0.0%) |
| Architecture & Engineering | 9 (37.5%) | 15 (62.5%) |
| Life, Physical & Social Science | 15 (100.0%) | 0 (0.0%) |
| Community & Social Service | 119 (55.6%) | 95 (44.4%) |
| Education, Arts & Media | 0 (0.0%) | 24 (100.0%) |
| Legal Services & Support | 11 (100.0%) | 0 (0.0%) |
| Education Instruction & Library | 76 (51.7%) | 71 (48.3%) |
| Arts, Media & Entertainment | 32 (100.0%) | 0 (0.0%) |
| Health Diagnosing & Treating | 13 (8.2%) | 145 (91.8%) |
| Health Technologists | 13 (18.3%) | 58 (81.7%) |
| Total (Category) | 270 (38.0%) | 440 (62.0%) |
| Total (Overall) | 949 (43.6%) | 1,225 (56.4%) |
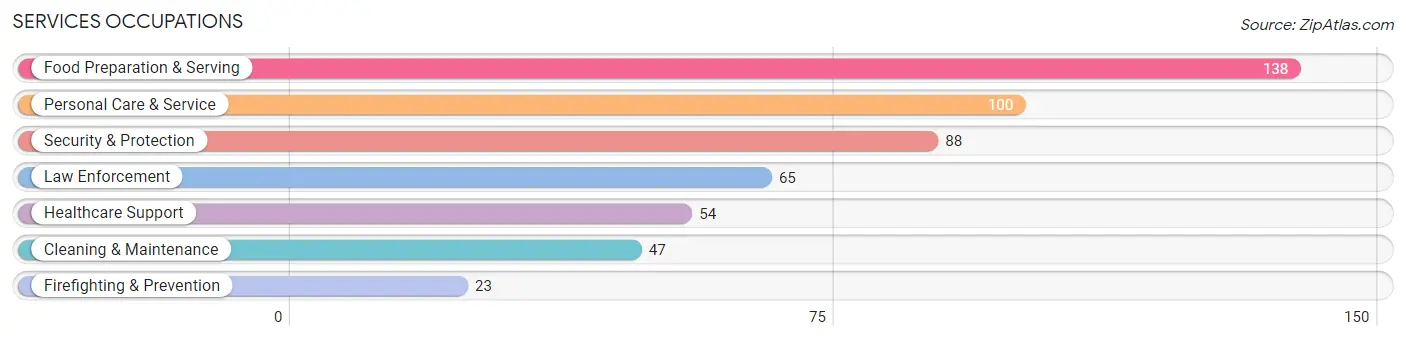
Services Occupations
The most common Services occupations in Fort Carson are Food Preparation & Serving (138 | 6.4%), Personal Care & Service (100 | 4.6%), Security & Protection (88 | 4.1%), Law Enforcement (65 | 3.0%), and Healthcare Support (54 | 2.5%).
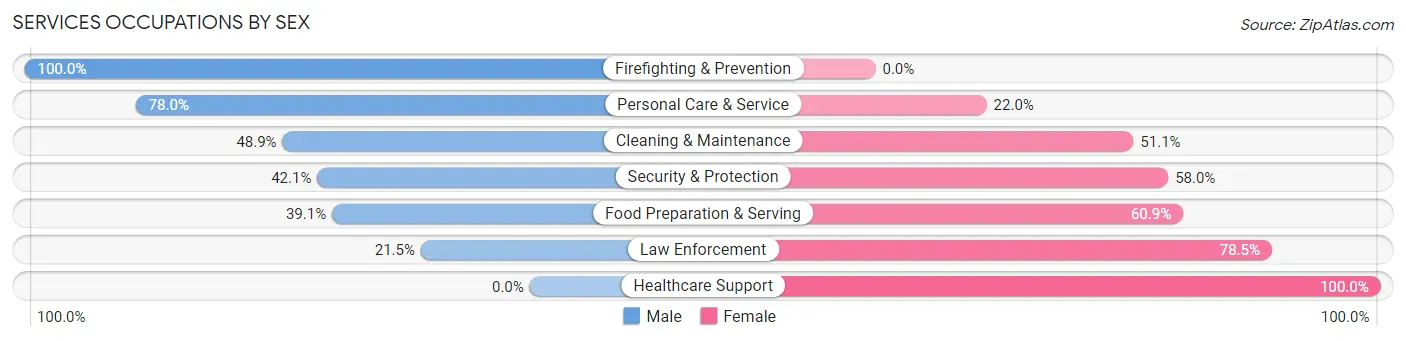
Services Occupations by Sex
Within the Services occupations in Fort Carson, the most male-oriented occupations are Firefighting & Prevention (100.0%), Personal Care & Service (78.0%), and Cleaning & Maintenance (48.9%), while the most female-oriented occupations are Healthcare Support (100.0%), Law Enforcement (78.5%), and Food Preparation & Serving (60.9%).
| Occupation | Male | Female |
| Healthcare Support | 0 (0.0%) | 54 (100.0%) |
| Security & Protection | 37 (42.0%) | 51 (58.0%) |
| Firefighting & Prevention | 23 (100.0%) | 0 (0.0%) |
| Law Enforcement | 14 (21.5%) | 51 (78.5%) |
| Food Preparation & Serving | 54 (39.1%) | 84 (60.9%) |
| Cleaning & Maintenance | 23 (48.9%) | 24 (51.1%) |
| Personal Care & Service | 78 (78.0%) | 22 (22.0%) |
| Total (Category) | 192 (45.0%) | 235 (55.0%) |
| Total (Overall) | 949 (43.6%) | 1,225 (56.4%) |
Sales and Office Occupations
The most common Sales and Office occupations in Fort Carson are Office & Administration (484 | 22.3%), and Sales & Related (123 | 5.7%).
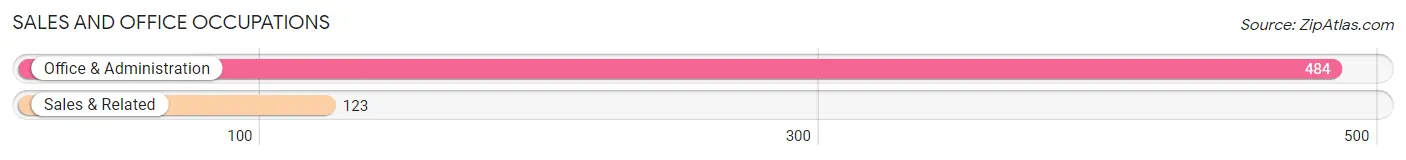
Sales and Office Occupations by Sex
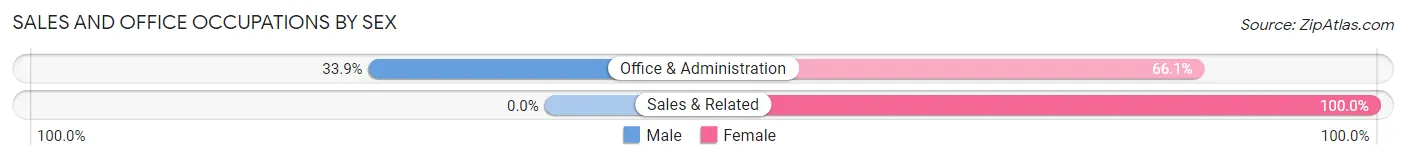
| Occupation | Male | Female |
| Sales & Related | 0 (0.0%) | 123 (100.0%) |
| Office & Administration | 164 (33.9%) | 320 (66.1%) |
| Total (Category) | 164 (27.0%) | 443 (73.0%) |
| Total (Overall) | 949 (43.6%) | 1,225 (56.4%) |
Natural Resources, Construction and Maintenance Occupations
The most common Natural Resources, Construction and Maintenance occupations in Fort Carson are Construction & Extraction (89 | 4.1%), Installation, Maintenance & Repair (73 | 3.4%), and Farming, Fishing & Forestry (8 | 0.4%).
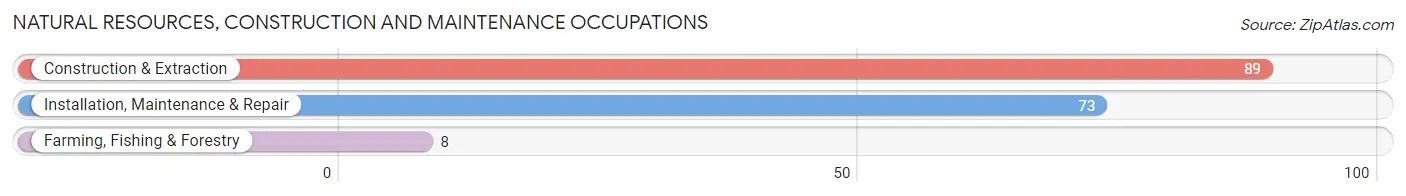
Natural Resources, Construction and Maintenance Occupations by Sex
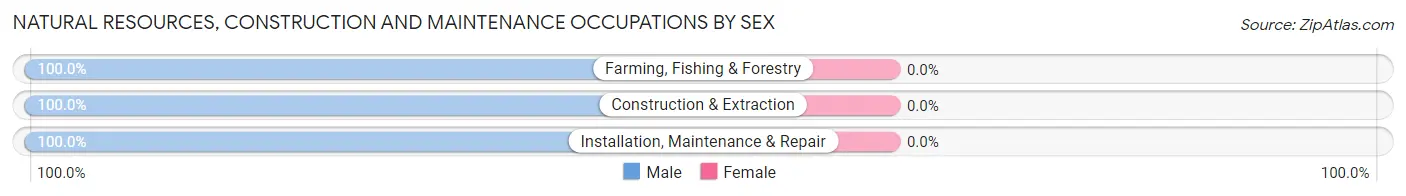
| Occupation | Male | Female |
| Farming, Fishing & Forestry | 8 (100.0%) | 0 (0.0%) |
| Construction & Extraction | 89 (100.0%) | 0 (0.0%) |
| Installation, Maintenance & Repair | 73 (100.0%) | 0 (0.0%) |
| Total (Category) | 170 (100.0%) | 0 (0.0%) |
| Total (Overall) | 949 (43.6%) | 1,225 (56.4%) |
Production, Transportation and Moving Occupations
The most common Production, Transportation and Moving occupations in Fort Carson are Material Moving (140 | 6.4%), Transportation (81 | 3.7%), and Production (39 | 1.8%).
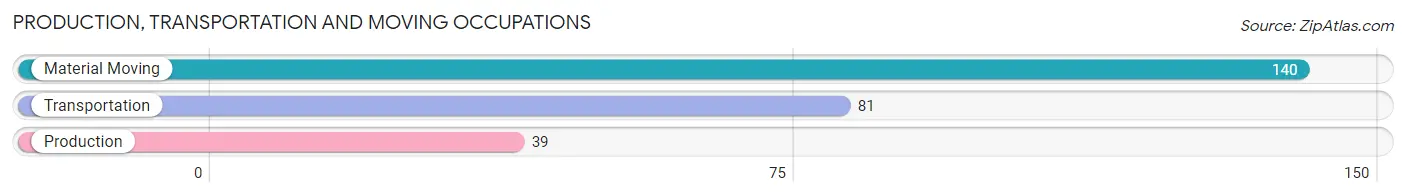
Production, Transportation and Moving Occupations by Sex
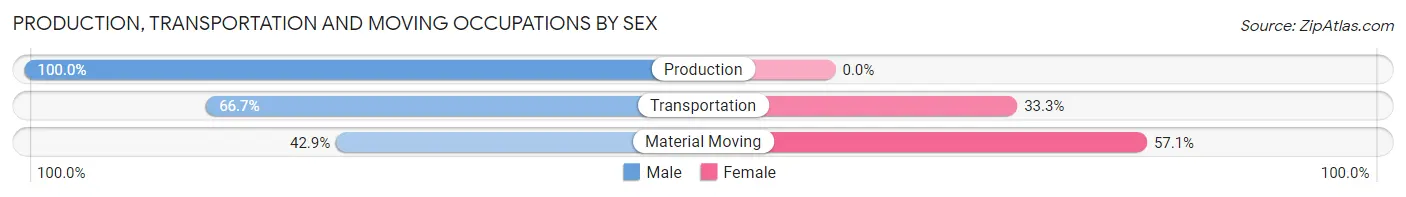
| Occupation | Male | Female |
| Production | 39 (100.0%) | 0 (0.0%) |
| Transportation | 54 (66.7%) | 27 (33.3%) |
| Material Moving | 60 (42.9%) | 80 (57.1%) |
| Total (Category) | 153 (58.9%) | 107 (41.1%) |
| Total (Overall) | 949 (43.6%) | 1,225 (56.4%) |
Employment Industries by Sex in Fort Carson
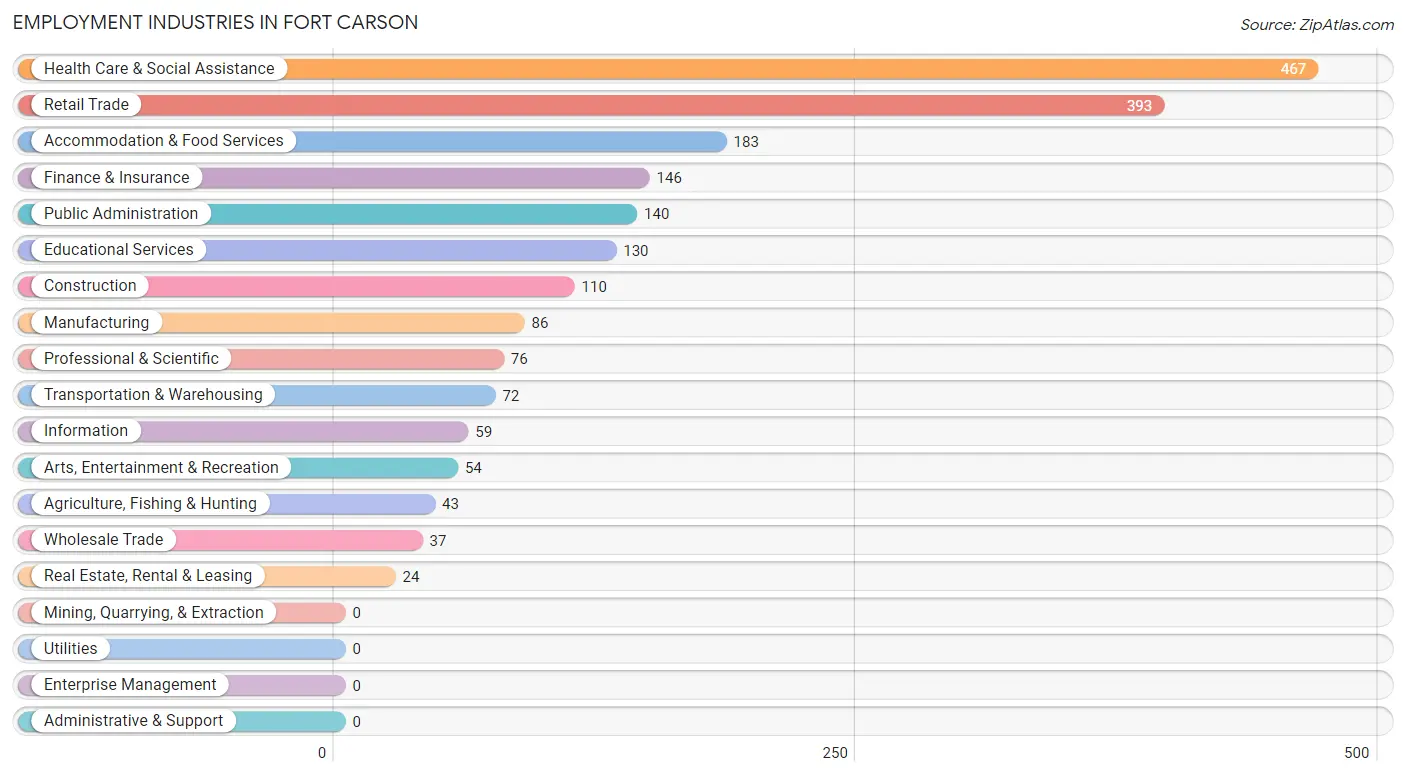
Employment Industries in Fort Carson
The major employment industries in Fort Carson include Health Care & Social Assistance (467 | 21.5%), Retail Trade (393 | 18.1%), Accommodation & Food Services (183 | 8.4%), Finance & Insurance (146 | 6.7%), and Public Administration (140 | 6.4%).
Employment Industries by Sex in Fort Carson
The Fort Carson industries that see more men than women are Agriculture, Fishing & Hunting (100.0%), Finance & Insurance (100.0%), and Professional & Scientific (78.9%), whereas the industries that tend to have a higher number of women are Wholesale Trade (100.0%), Transportation & Warehousing (91.7%), and Information (91.5%).
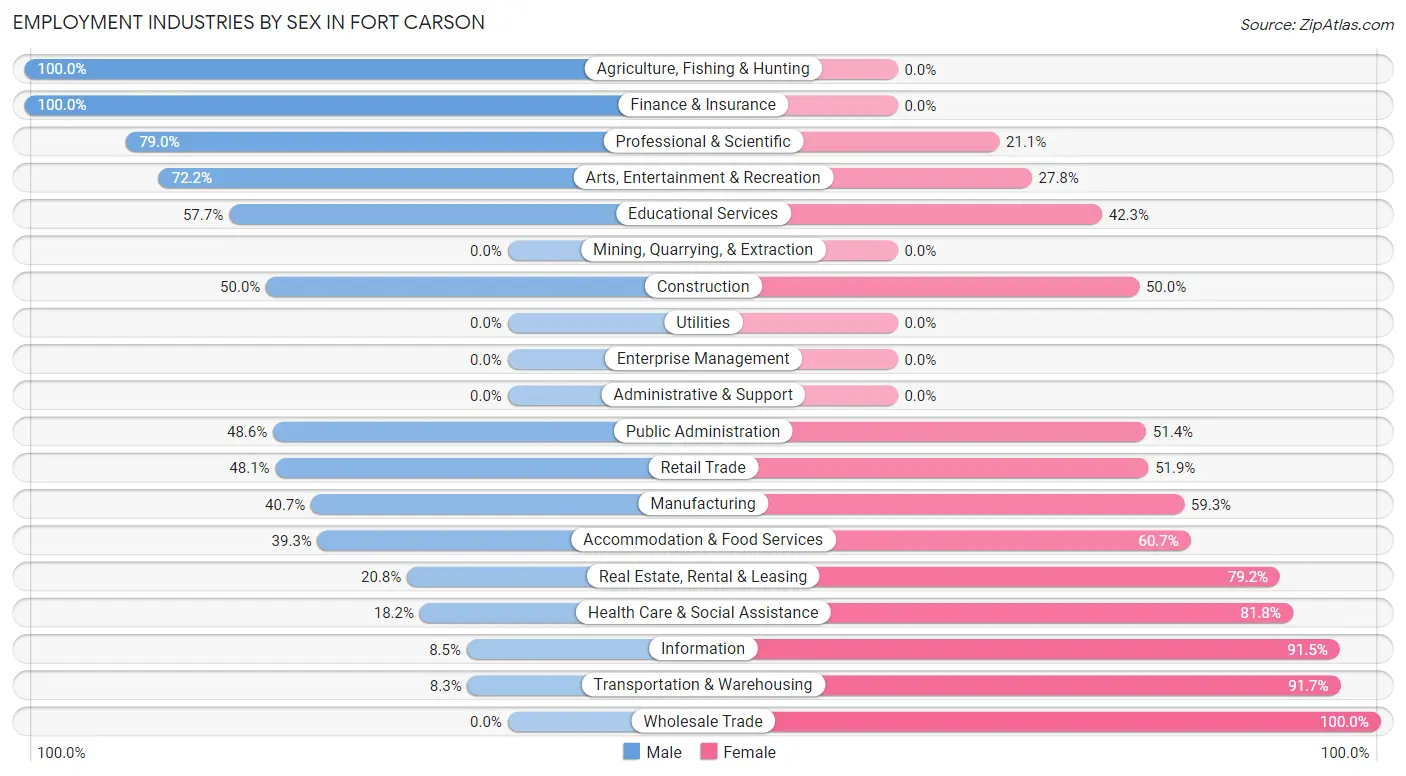
| Industry | Male | Female |
| Agriculture, Fishing & Hunting | 43 (100.0%) | 0 (0.0%) |
| Mining, Quarrying, & Extraction | 0 (0.0%) | 0 (0.0%) |
| Construction | 55 (50.0%) | 55 (50.0%) |
| Manufacturing | 35 (40.7%) | 51 (59.3%) |
| Wholesale Trade | 0 (0.0%) | 37 (100.0%) |
| Retail Trade | 189 (48.1%) | 204 (51.9%) |
| Transportation & Warehousing | 6 (8.3%) | 66 (91.7%) |
| Utilities | 0 (0.0%) | 0 (0.0%) |
| Information | 5 (8.5%) | 54 (91.5%) |
| Finance & Insurance | 146 (100.0%) | 0 (0.0%) |
| Real Estate, Rental & Leasing | 5 (20.8%) | 19 (79.2%) |
| Professional & Scientific | 60 (78.9%) | 16 (21.0%) |
| Enterprise Management | 0 (0.0%) | 0 (0.0%) |
| Administrative & Support | 0 (0.0%) | 0 (0.0%) |
| Educational Services | 75 (57.7%) | 55 (42.3%) |
| Health Care & Social Assistance | 85 (18.2%) | 382 (81.8%) |
| Arts, Entertainment & Recreation | 39 (72.2%) | 15 (27.8%) |
| Accommodation & Food Services | 72 (39.3%) | 111 (60.7%) |
| Public Administration | 68 (48.6%) | 72 (51.4%) |
| Total | 949 (43.6%) | 1,225 (56.4%) |
Education in Fort Carson
School Enrollment in Fort Carson
The most common levels of schooling among the 5,557 students in Fort Carson are college / undergraduate (2,602 | 46.8%), elementary school (1,169 | 21.0%), and middle school (616 | 11.1%).
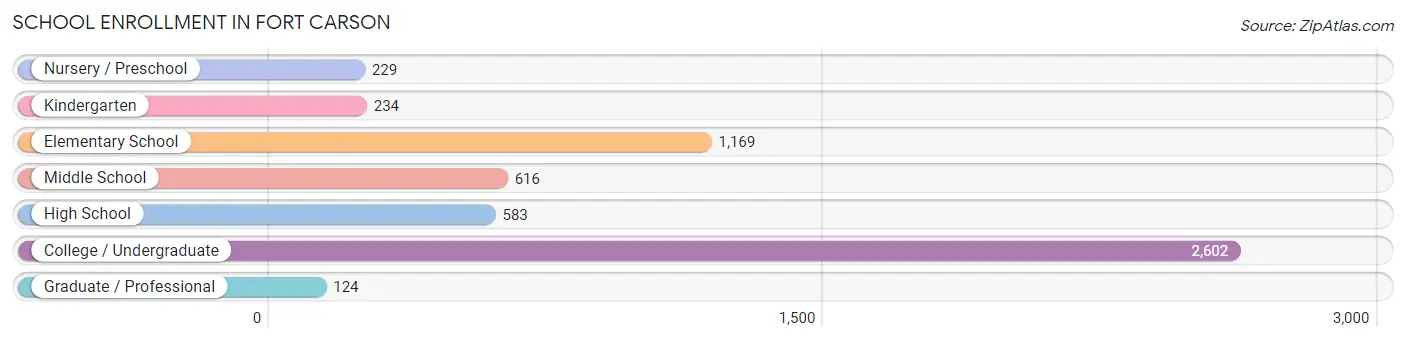
| School Level | # Students | % Students |
| Nursery / Preschool | 229 | 4.1% |
| Kindergarten | 234 | 4.2% |
| Elementary School | 1,169 | 21.0% |
| Middle School | 616 | 11.1% |
| High School | 583 | 10.5% |
| College / Undergraduate | 2,602 | 46.8% |
| Graduate / Professional | 124 | 2.2% |
| Total | 5,557 | 100.0% |
School Enrollment by Age by Funding Source in Fort Carson
Out of a total of 5,557 students who are enrolled in schools in Fort Carson, 289 (5.2%) attend a private institution, while the remaining 5,268 (94.8%) are enrolled in public schools. The age group of 25 to 34 year olds has the highest likelihood of being enrolled in private schools, with 93 (21.8% in the age bracket) enrolled. Conversely, the age group of 18 to 19 year olds has the lowest likelihood of being enrolled in a private school, with 556 (100.0% in the age bracket) attending a public institution.
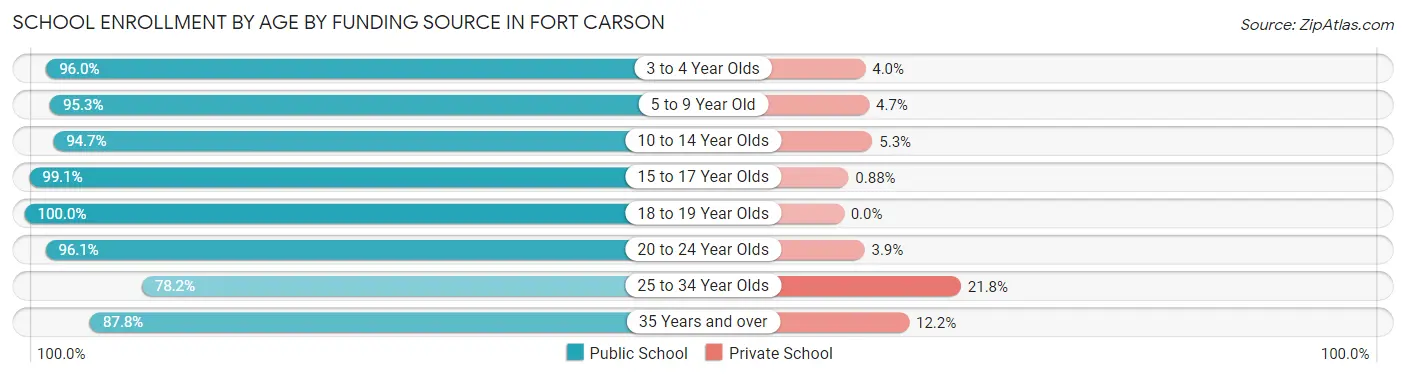
| Age Bracket | Public School | Private School |
| 3 to 4 Year Olds | 238 (96.0%) | 10 (4.0%) |
| 5 to 9 Year Old | 1,208 (95.3%) | 60 (4.7%) |
| 10 to 14 Year Olds | 797 (94.7%) | 45 (5.3%) |
| 15 to 17 Year Olds | 451 (99.1%) | 4 (0.9%) |
| 18 to 19 Year Olds | 556 (100.0%) | 0 (0.0%) |
| 20 to 24 Year Olds | 1,583 (96.1%) | 64 (3.9%) |
| 25 to 34 Year Olds | 333 (78.2%) | 93 (21.8%) |
| 35 Years and over | 101 (87.8%) | 14 (12.2%) |
| Total | 5,268 (94.8%) | 289 (5.2%) |
Educational Attainment by Field of Study in Fort Carson
Business (304 | 21.5%), arts & humanities (285 | 20.2%), psychology (191 | 13.5%), computers & mathematics (112 | 7.9%), and science & technology (110 | 7.8%) are the most common fields of study among 1,413 individuals in Fort Carson who have obtained a bachelor's degree or higher.
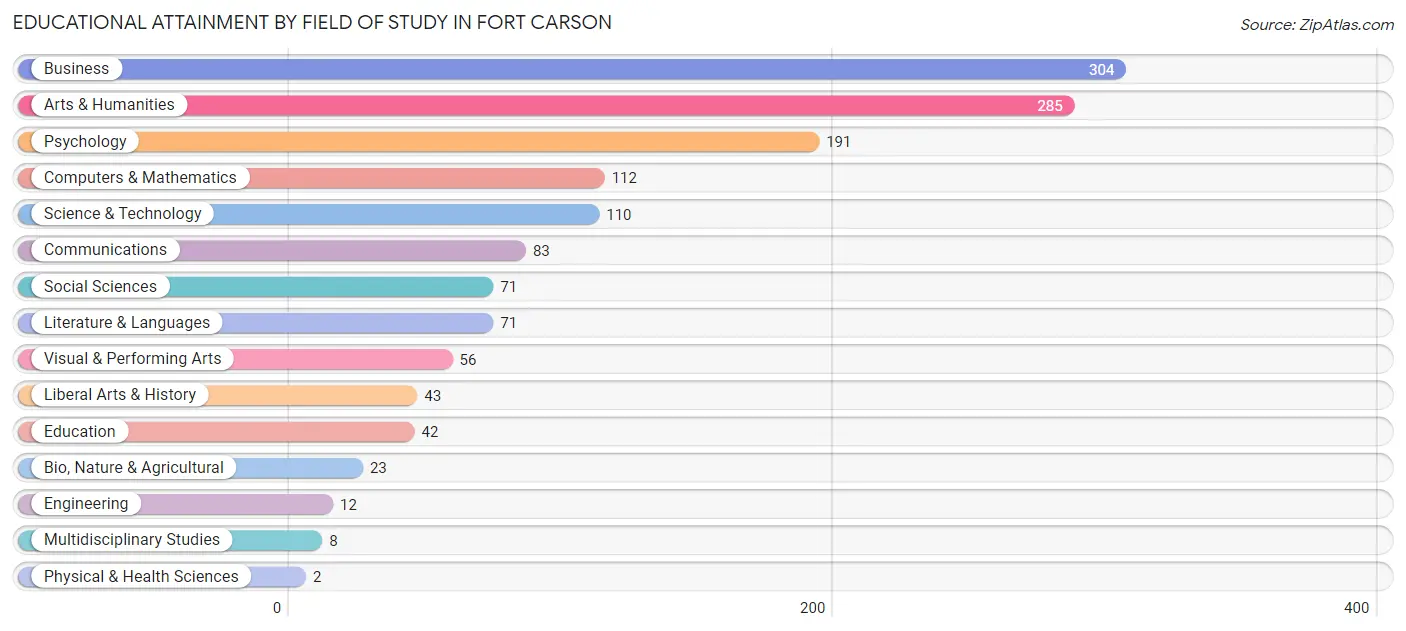
| Field of Study | # Graduates | % Graduates |
| Computers & Mathematics | 112 | 7.9% |
| Bio, Nature & Agricultural | 23 | 1.6% |
| Physical & Health Sciences | 2 | 0.1% |
| Psychology | 191 | 13.5% |
| Social Sciences | 71 | 5.0% |
| Engineering | 12 | 0.9% |
| Multidisciplinary Studies | 8 | 0.6% |
| Science & Technology | 110 | 7.8% |
| Business | 304 | 21.5% |
| Education | 42 | 3.0% |
| Literature & Languages | 71 | 5.0% |
| Liberal Arts & History | 43 | 3.0% |
| Visual & Performing Arts | 56 | 4.0% |
| Communications | 83 | 5.9% |
| Arts & Humanities | 285 | 20.2% |
| Total | 1,413 | 100.0% |
Transportation & Commute in Fort Carson
Vehicle Availability by Sex in Fort Carson
The most prevalent vehicle ownership categories in Fort Carson are males with 2 vehicles (1,591, accounting for 50.4%) and females with 2 vehicles (779, making up 110.9%).

| Vehicles Available | Male | Female |
| No Vehicle | 61 (1.9%) | 0 (0.0%) |
| 1 Vehicle | 1,076 (34.1%) | 283 (19.7%) |
| 2 Vehicles | 1,591 (50.4%) | 779 (54.3%) |
| 3 Vehicles | 382 (12.1%) | 333 (23.2%) |
| 4 Vehicles | 45 (1.4%) | 40 (2.8%) |
| 5 or more Vehicles | 0 (0.0%) | 0 (0.0%) |
| Total | 3,155 (100.0%) | 1,435 (100.0%) |
Commute Time in Fort Carson
The most frequently occuring commute durations in Fort Carson are 5 to 9 minutes (3,400 commuters, 30.2%), 10 to 14 minutes (3,101 commuters, 27.5%), and 15 to 19 minutes (1,663 commuters, 14.8%).
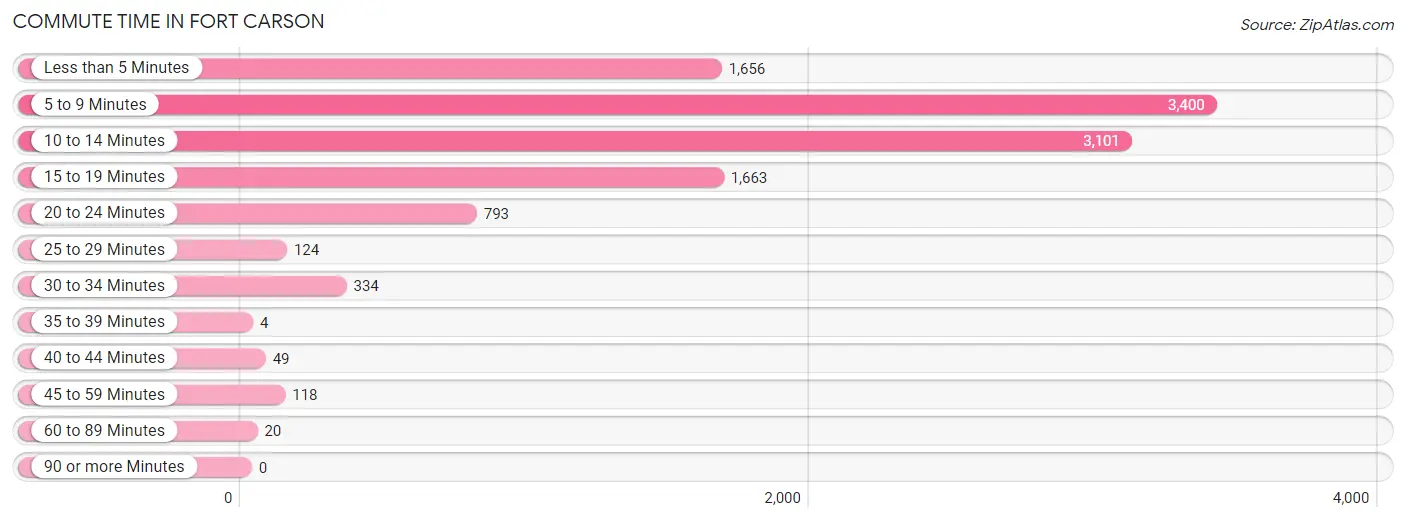
| Commute Time | # Commuters | % Commuters |
| Less than 5 Minutes | 1,656 | 14.7% |
| 5 to 9 Minutes | 3,400 | 30.2% |
| 10 to 14 Minutes | 3,101 | 27.5% |
| 15 to 19 Minutes | 1,663 | 14.8% |
| 20 to 24 Minutes | 793 | 7.0% |
| 25 to 29 Minutes | 124 | 1.1% |
| 30 to 34 Minutes | 334 | 3.0% |
| 35 to 39 Minutes | 4 | 0.0% |
| 40 to 44 Minutes | 49 | 0.4% |
| 45 to 59 Minutes | 118 | 1.1% |
| 60 to 89 Minutes | 20 | 0.2% |
| 90 or more Minutes | 0 | 0.0% |
Commute Time by Sex in Fort Carson
The most common commute times in Fort Carson are 5 to 9 minutes (2,792 commuters, 30.3%) for males and 5 to 9 minutes (608 commuters, 29.8%) for females.
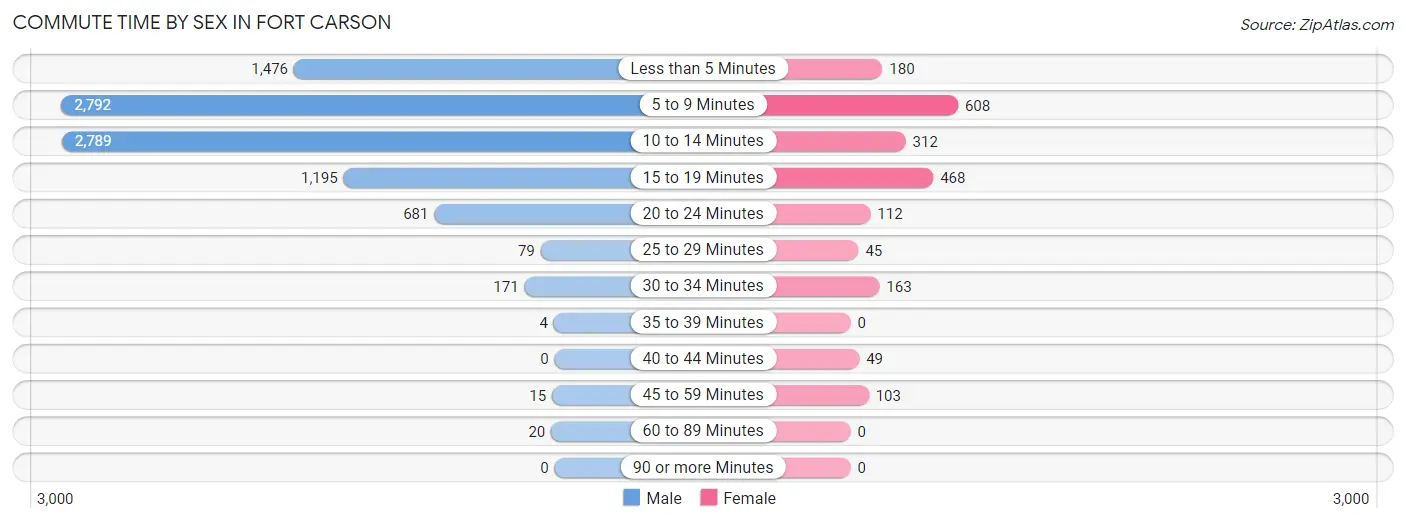
| Commute Time | Male | Female |
| Less than 5 Minutes | 1,476 (16.0%) | 180 (8.8%) |
| 5 to 9 Minutes | 2,792 (30.3%) | 608 (29.8%) |
| 10 to 14 Minutes | 2,789 (30.2%) | 312 (15.3%) |
| 15 to 19 Minutes | 1,195 (13.0%) | 468 (22.9%) |
| 20 to 24 Minutes | 681 (7.4%) | 112 (5.5%) |
| 25 to 29 Minutes | 79 (0.9%) | 45 (2.2%) |
| 30 to 34 Minutes | 171 (1.8%) | 163 (8.0%) |
| 35 to 39 Minutes | 4 (0.0%) | 0 (0.0%) |
| 40 to 44 Minutes | 0 (0.0%) | 49 (2.4%) |
| 45 to 59 Minutes | 15 (0.2%) | 103 (5.1%) |
| 60 to 89 Minutes | 20 (0.2%) | 0 (0.0%) |
| 90 or more Minutes | 0 (0.0%) | 0 (0.0%) |
Time of Departure to Work by Sex in Fort Carson
The most frequent times of departure to work in Fort Carson are 6:00 AM to 6:29 AM (2,261, 24.5%) for males and 5:30 AM to 5:59 AM (372, 18.2%) for females.
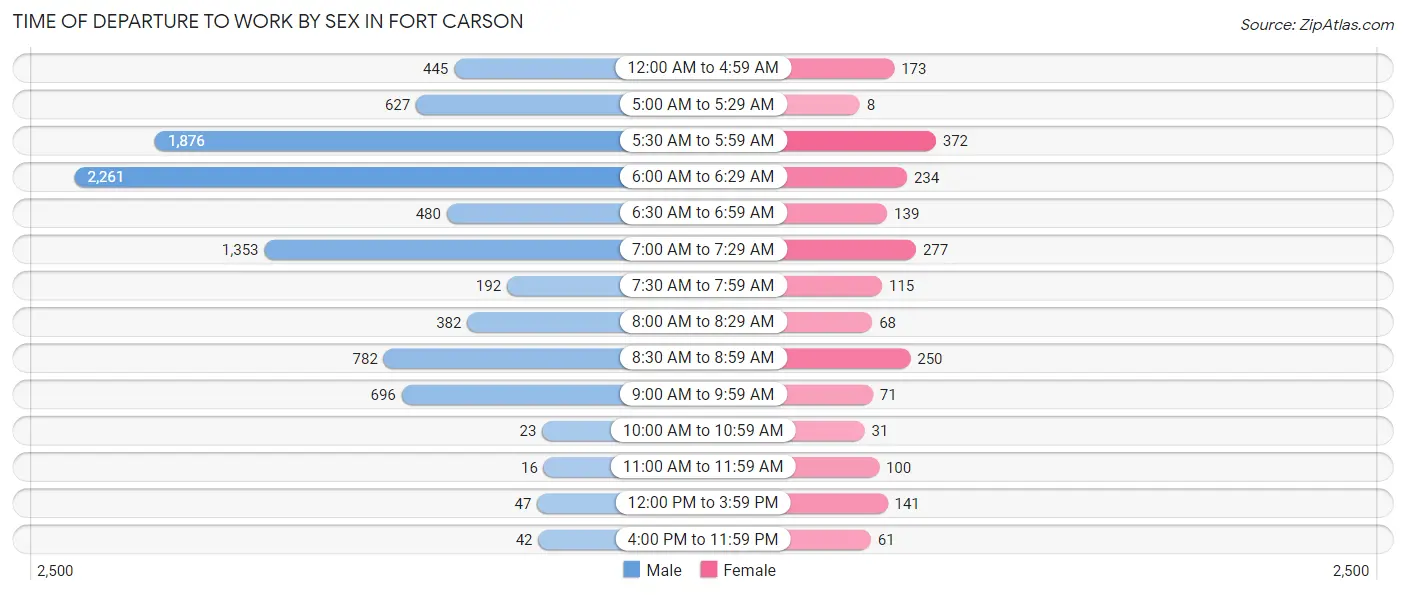
| Time of Departure | Male | Female |
| 12:00 AM to 4:59 AM | 445 (4.8%) | 173 (8.5%) |
| 5:00 AM to 5:29 AM | 627 (6.8%) | 8 (0.4%) |
| 5:30 AM to 5:59 AM | 1,876 (20.3%) | 372 (18.2%) |
| 6:00 AM to 6:29 AM | 2,261 (24.5%) | 234 (11.5%) |
| 6:30 AM to 6:59 AM | 480 (5.2%) | 139 (6.8%) |
| 7:00 AM to 7:29 AM | 1,353 (14.7%) | 277 (13.6%) |
| 7:30 AM to 7:59 AM | 192 (2.1%) | 115 (5.6%) |
| 8:00 AM to 8:29 AM | 382 (4.1%) | 68 (3.3%) |
| 8:30 AM to 8:59 AM | 782 (8.5%) | 250 (12.2%) |
| 9:00 AM to 9:59 AM | 696 (7.5%) | 71 (3.5%) |
| 10:00 AM to 10:59 AM | 23 (0.3%) | 31 (1.5%) |
| 11:00 AM to 11:59 AM | 16 (0.2%) | 100 (4.9%) |
| 12:00 PM to 3:59 PM | 47 (0.5%) | 141 (6.9%) |
| 4:00 PM to 11:59 PM | 42 (0.5%) | 61 (3.0%) |
| Total | 9,222 (100.0%) | 2,040 (100.0%) |
Housing Occupancy in Fort Carson
Occupancy by Ownership in Fort Carson
Of the total 3,329 dwellings in Fort Carson, owner-occupied units account for 0 (0.0%), while renter-occupied units make up 3,329 (100.0%).
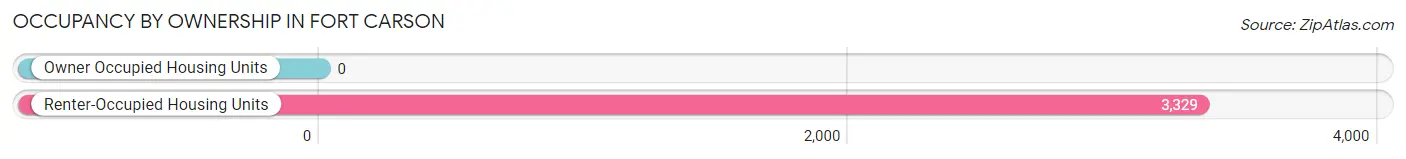
| Occupancy | # Housing Units | % Housing Units |
| Owner Occupied Housing Units | 0 | 0.0% |
| Renter-Occupied Housing Units | 3,329 | 100.0% |
| Total Occupied Housing Units | 3,329 | 100.0% |
Occupancy by Household Size in Fort Carson
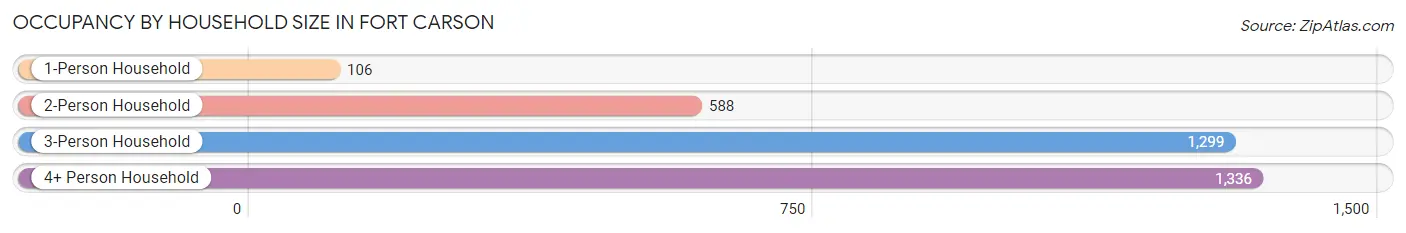
| Household Size | # Housing Units | % Housing Units |
| 1-Person Household | 106 | 3.2% |
| 2-Person Household | 588 | 17.7% |
| 3-Person Household | 1,299 | 39.0% |
| 4+ Person Household | 1,336 | 40.1% |
| Total Housing Units | 3,329 | 100.0% |
Occupancy by Ownership by Household Size in Fort Carson
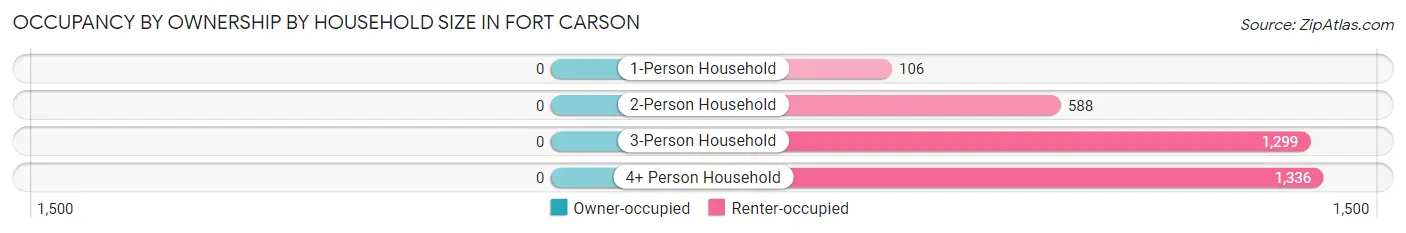
| Household Size | Owner-occupied | Renter-occupied |
| 1-Person Household | 0 (0.0%) | 106 (100.0%) |
| 2-Person Household | 0 (0.0%) | 588 (100.0%) |
| 3-Person Household | 0 (0.0%) | 1,299 (100.0%) |
| 4+ Person Household | 0 (0.0%) | 1,336 (100.0%) |
| Total Housing Units | 0 (0.0%) | 3,329 (100.0%) |
Occupancy by Educational Attainment in Fort Carson
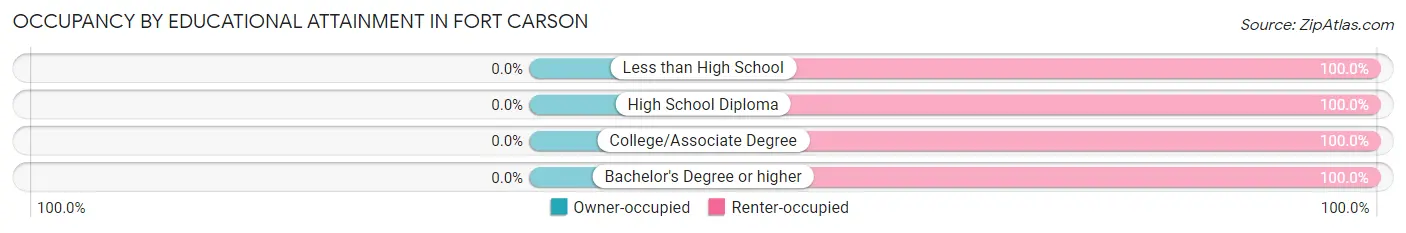
| Household Size | Owner-occupied | Renter-occupied |
| Less than High School | 0 (0.0%) | 54 (100.0%) |
| High School Diploma | 0 (0.0%) | 867 (100.0%) |
| College/Associate Degree | 0 (0.0%) | 1,835 (100.0%) |
| Bachelor's Degree or higher | 0 (0.0%) | 573 (100.0%) |
Occupancy by Age of Householder in Fort Carson
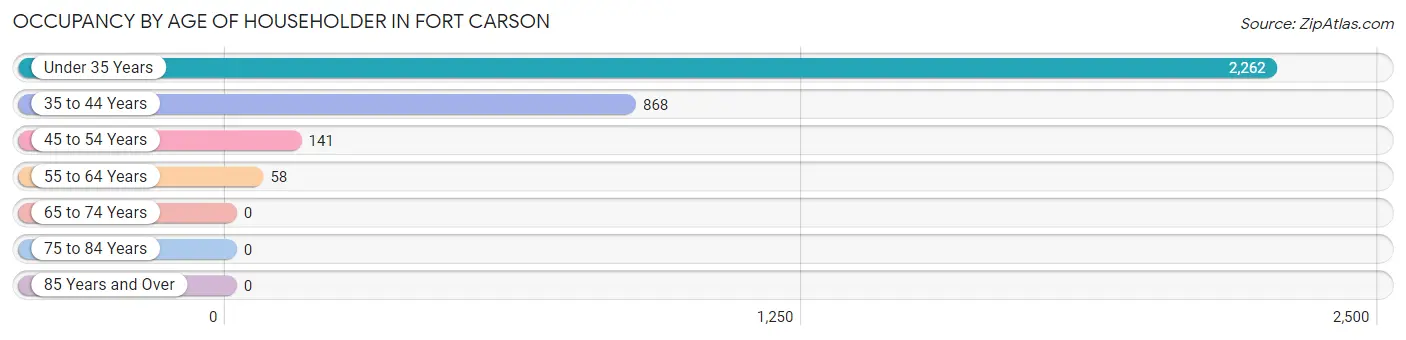
| Age Bracket | # Households | % Households |
| Under 35 Years | 2,262 | 67.9% |
| 35 to 44 Years | 868 | 26.1% |
| 45 to 54 Years | 141 | 4.2% |
| 55 to 64 Years | 58 | 1.7% |
| 65 to 74 Years | 0 | 0.0% |
| 75 to 84 Years | 0 | 0.0% |
| 85 Years and Over | 0 | 0.0% |
| Total | 3,329 | 100.0% |
Housing Finances in Fort Carson
Median Income by Occupancy in Fort Carson
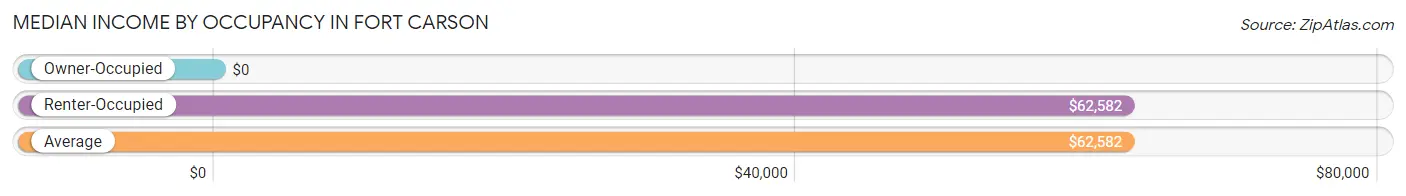
| Occupancy Type | # Households | Median Income |
| Owner-Occupied | 0 (0.0%) | $0 |
| Renter-Occupied | 3,329 (100.0%) | $62,582 |
| Average | 3,329 (100.0%) | $62,582 |
Occupancy by Householder Income Bracket in Fort Carson

| Income Bracket | Owner-occupied | Renter-occupied |
| Less than $5,000 | 0 (0.0%) | 163 (4.9%) |
| $5,000 to $9,999 | 0 (0.0%) | 16 (0.5%) |
| $10,000 to $14,999 | 0 (0.0%) | 13 (0.4%) |
| $15,000 to $19,999 | 0 (0.0%) | 114 (3.4%) |
| $20,000 to $24,999 | 0 (0.0%) | 28 (0.8%) |
| $25,000 to $34,999 | 0 (0.0%) | 287 (8.6%) |
| $35,000 to $49,999 | 0 (0.0%) | 520 (15.6%) |
| $50,000 to $74,999 | 0 (0.0%) | 1,038 (31.2%) |
| $75,000 to $99,999 | 0 (0.0%) | 364 (10.9%) |
| $100,000 to $149,999 | 0 (0.0%) | 709 (21.3%) |
| $150,000 or more | 0 (0.0%) | 77 (2.3%) |
| Total | 0 (0.0%) | 3,329 (100.0%) |
Monthly Housing Cost Tiers in Fort Carson
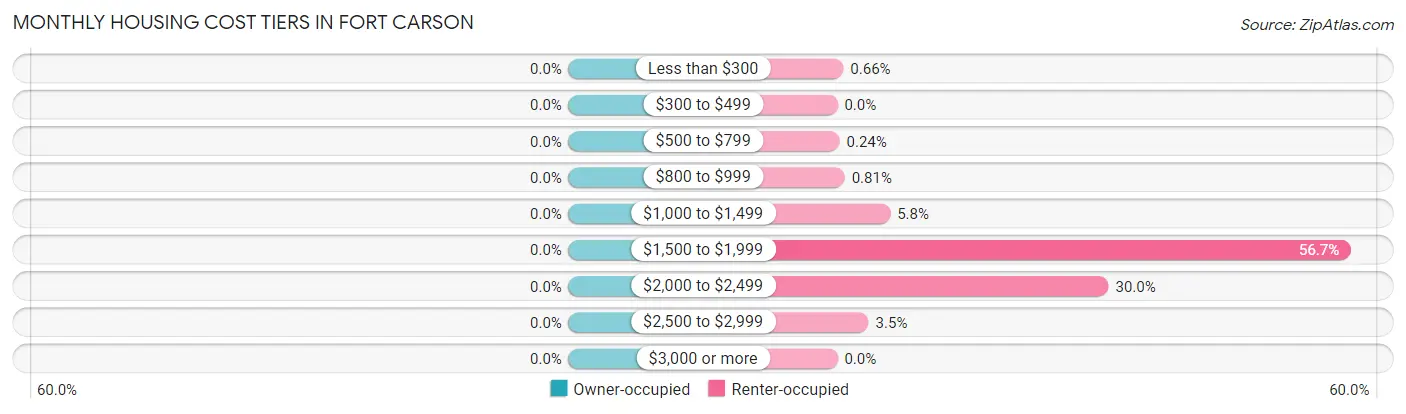
| Monthly Cost | Owner-occupied | Renter-occupied |
| Less than $300 | 0 (0.0%) | 22 (0.7%) |
| $300 to $499 | 0 (0.0%) | 0 (0.0%) |
| $500 to $799 | 0 (0.0%) | 8 (0.2%) |
| $800 to $999 | 0 (0.0%) | 27 (0.8%) |
| $1,000 to $1,499 | 0 (0.0%) | 194 (5.8%) |
| $1,500 to $1,999 | 0 (0.0%) | 1,889 (56.7%) |
| $2,000 to $2,499 | 0 (0.0%) | 997 (29.9%) |
| $2,500 to $2,999 | 0 (0.0%) | 115 (3.5%) |
| $3,000 or more | 0 (0.0%) | 0 (0.0%) |
| Total | 0 (0.0%) | 3,329 (100.0%) |
Physical Housing Characteristics in Fort Carson
Housing Structures in Fort Carson
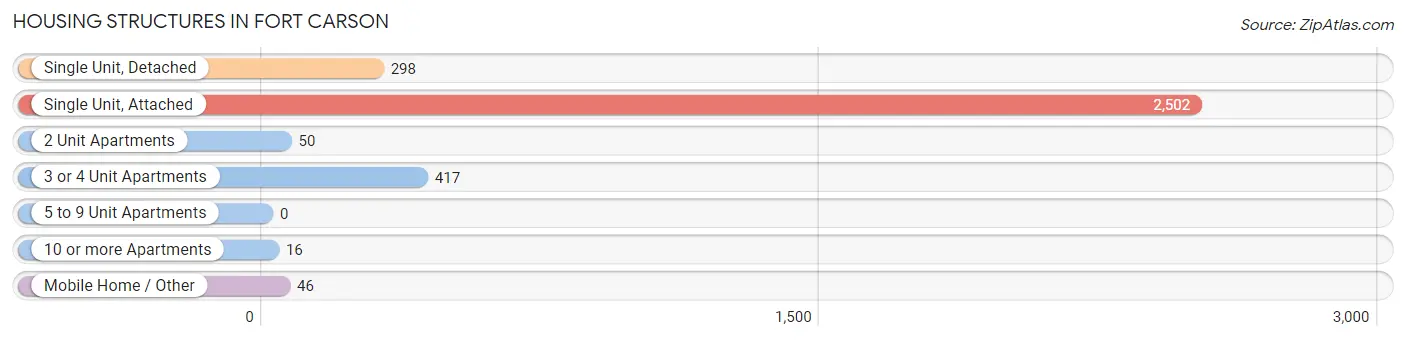
| Structure Type | # Housing Units | % Housing Units |
| Single Unit, Detached | 298 | 8.9% |
| Single Unit, Attached | 2,502 | 75.2% |
| 2 Unit Apartments | 50 | 1.5% |
| 3 or 4 Unit Apartments | 417 | 12.5% |
| 5 to 9 Unit Apartments | 0 | 0.0% |
| 10 or more Apartments | 16 | 0.5% |
| Mobile Home / Other | 46 | 1.4% |
| Total | 3,329 | 100.0% |
Housing Structures by Occupancy in Fort Carson
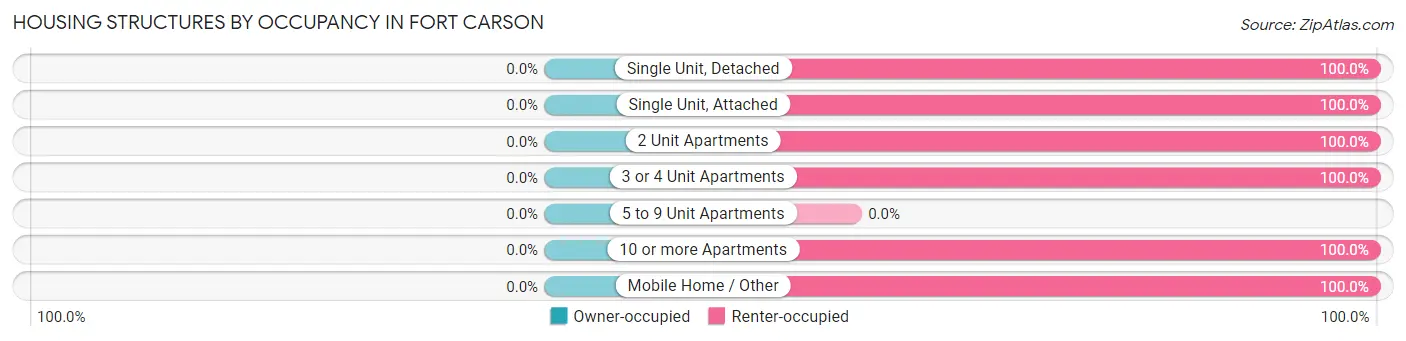
| Structure Type | Owner-occupied | Renter-occupied |
| Single Unit, Detached | 0 (0.0%) | 298 (100.0%) |
| Single Unit, Attached | 0 (0.0%) | 2,502 (100.0%) |
| 2 Unit Apartments | 0 (0.0%) | 50 (100.0%) |
| 3 or 4 Unit Apartments | 0 (0.0%) | 417 (100.0%) |
| 5 to 9 Unit Apartments | 0 (0.0%) | 0 (0.0%) |
| 10 or more Apartments | 0 (0.0%) | 16 (100.0%) |
| Mobile Home / Other | 0 (0.0%) | 46 (100.0%) |
| Total | 0 (0.0%) | 3,329 (100.0%) |
Housing Structures by Number of Rooms in Fort Carson
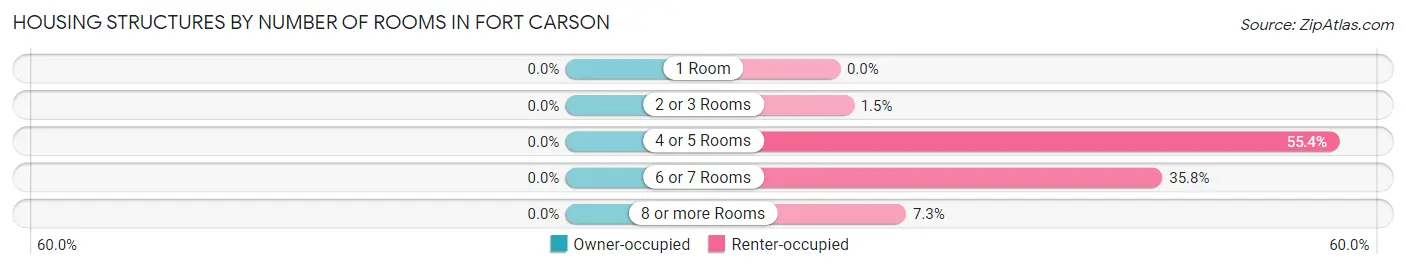
| Number of Rooms | Owner-occupied | Renter-occupied |
| 1 Room | 0 (0.0%) | 0 (0.0%) |
| 2 or 3 Rooms | 0 (0.0%) | 51 (1.5%) |
| 4 or 5 Rooms | 0 (0.0%) | 1,843 (55.4%) |
| 6 or 7 Rooms | 0 (0.0%) | 1,191 (35.8%) |
| 8 or more Rooms | 0 (0.0%) | 244 (7.3%) |
| Total | 0 (0.0%) | 3,329 (100.0%) |
Housing Structure by Heating Type in Fort Carson
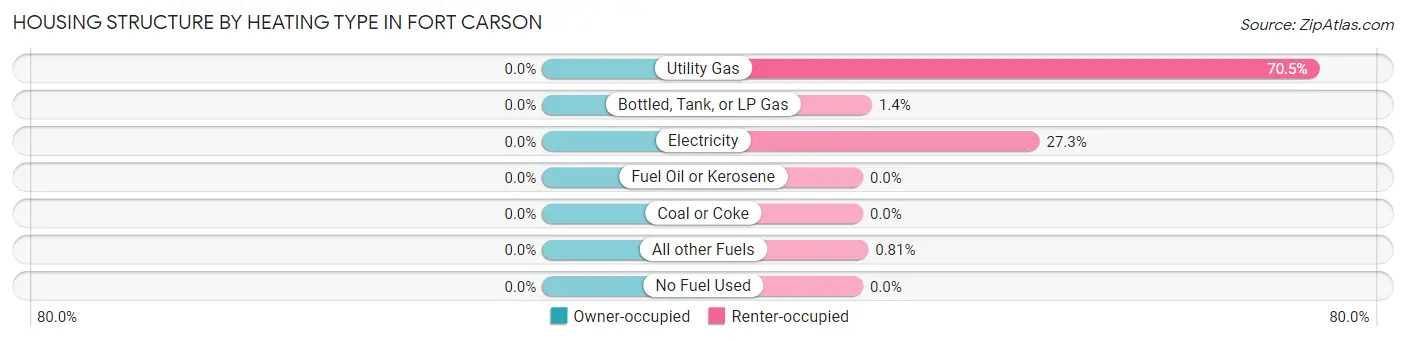
| Heating Type | Owner-occupied | Renter-occupied |
| Utility Gas | 0 (0.0%) | 2,348 (70.5%) |
| Bottled, Tank, or LP Gas | 0 (0.0%) | 46 (1.4%) |
| Electricity | 0 (0.0%) | 908 (27.3%) |
| Fuel Oil or Kerosene | 0 (0.0%) | 0 (0.0%) |
| Coal or Coke | 0 (0.0%) | 0 (0.0%) |
| All other Fuels | 0 (0.0%) | 27 (0.8%) |
| No Fuel Used | 0 (0.0%) | 0 (0.0%) |
| Total | 0 (0.0%) | 3,329 (100.0%) |
Household Vehicle Usage in Fort Carson
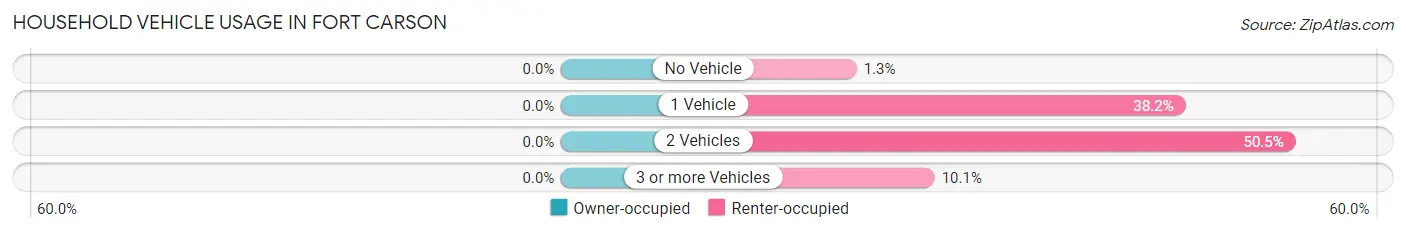
| Vehicles per Household | Owner-occupied | Renter-occupied |
| No Vehicle | 0 (0.0%) | 44 (1.3%) |
| 1 Vehicle | 0 (0.0%) | 1,270 (38.2%) |
| 2 Vehicles | 0 (0.0%) | 1,680 (50.5%) |
| 3 or more Vehicles | 0 (0.0%) | 335 (10.1%) |
| Total | 0 (0.0%) | 3,329 (100.0%) |
Real Estate & Mortgages in Fort Carson
Real Estate and Mortgage Overview in Fort Carson
| Characteristic | Without Mortgage | With Mortgage |
| Housing Units | 0 | 0 |
| Median Property Value | - | - |
| Median Household Income | - | - |
| Monthly Housing Costs | - | - |
| Real Estate Taxes | - | - |
Property Value by Mortgage Status in Fort Carson
| Property Value | Without Mortgage | With Mortgage |
| Less than $50,000 | 0 (0.0%) | 0 (0.0%) |
| $50,000 to $99,999 | 0 (0.0%) | 0 (0.0%) |
| $100,000 to $299,999 | 0 (0.0%) | 0 (0.0%) |
| $300,000 to $499,999 | 0 (0.0%) | 0 (0.0%) |
| $500,000 to $749,999 | 0 (0.0%) | 0 (0.0%) |
| $750,000 to $999,999 | 0 (0.0%) | 0 (0.0%) |
| $1,000,000 or more | 0 (0.0%) | 0 (0.0%) |
| Total | 0 (0.0%) | 0 (0.0%) |
Household Income by Mortgage Status in Fort Carson
| Household Income | Without Mortgage | With Mortgage |
| Less than $10,000 | 0 (0.0%) | 0 (0.0%) |
| $10,000 to $24,999 | 0 (0.0%) | 0 (0.0%) |
| $25,000 to $34,999 | 0 (0.0%) | 0 (0.0%) |
| $35,000 to $49,999 | 0 (0.0%) | 0 (0.0%) |
| $50,000 to $74,999 | 0 (0.0%) | 0 (0.0%) |
| $75,000 to $99,999 | 0 (0.0%) | 0 (0.0%) |
| $100,000 to $149,999 | 0 (0.0%) | 0 (0.0%) |
| $150,000 or more | 0 (0.0%) | 0 (0.0%) |
| Total | 0 (0.0%) | 0 (0.0%) |
Property Value to Household Income Ratio in Fort Carson
| Value-to-Income Ratio | Without Mortgage | With Mortgage |
| Less than 2.0x | 0 (0.0%) | 0 (0.0%) |
| 2.0x to 2.9x | 0 (0.0%) | 0 (0.0%) |
| 3.0x to 3.9x | 0 (0.0%) | 0 (0.0%) |
| 4.0x or more | 0 (0.0%) | 0 (0.0%) |
| Total | 0 (0.0%) | 0 (0.0%) |
Real Estate Taxes by Mortgage Status in Fort Carson
| Property Taxes | Without Mortgage | With Mortgage |
| Less than $800 | 0 (0.0%) | 0 (0.0%) |
| $800 to $1,499 | 0 (0.0%) | 0 (0.0%) |
| $800 to $1,499 | 0 (0.0%) | 0 (0.0%) |
| Total | 0 (0.0%) | 0 (0.0%) |
Health & Disability in Fort Carson
Health Insurance Coverage by Age in Fort Carson
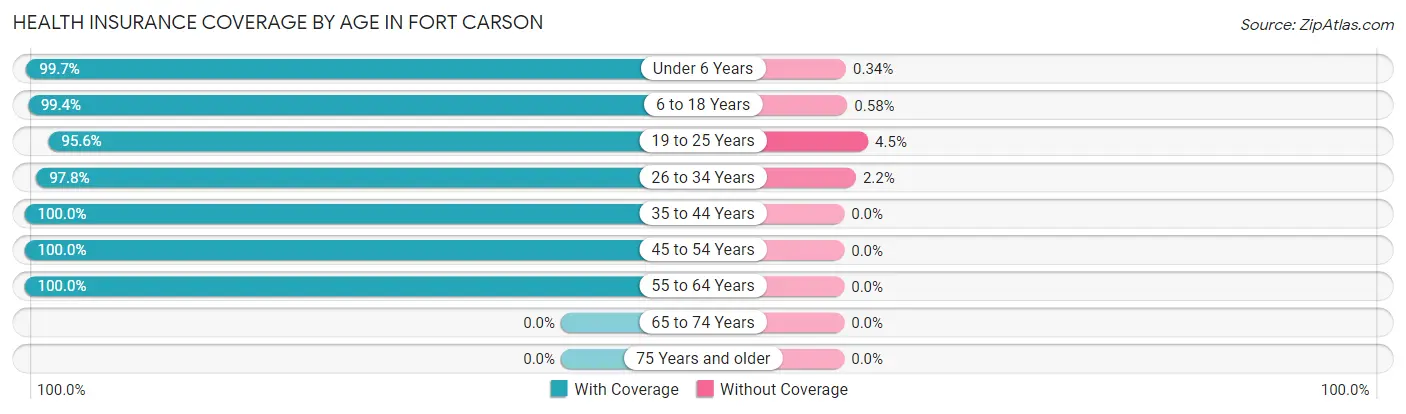
| Age Bracket | With Coverage | Without Coverage |
| Under 6 Years | 2,344 (99.7%) | 8 (0.3%) |
| 6 to 18 Years | 2,406 (99.4%) | 14 (0.6%) |
| 19 to 25 Years | 923 (95.6%) | 43 (4.4%) |
| 26 to 34 Years | 1,394 (97.8%) | 31 (2.2%) |
| 35 to 44 Years | 925 (100.0%) | 0 (0.0%) |
| 45 to 54 Years | 234 (100.0%) | 0 (0.0%) |
| 55 to 64 Years | 82 (100.0%) | 0 (0.0%) |
| 65 to 74 Years | 0 (0.0%) | 0 (0.0%) |
| 75 Years and older | 0 (0.0%) | 0 (0.0%) |
| Total | 8,308 (98.9%) | 96 (1.1%) |
Health Insurance Coverage by Citizenship Status in Fort Carson
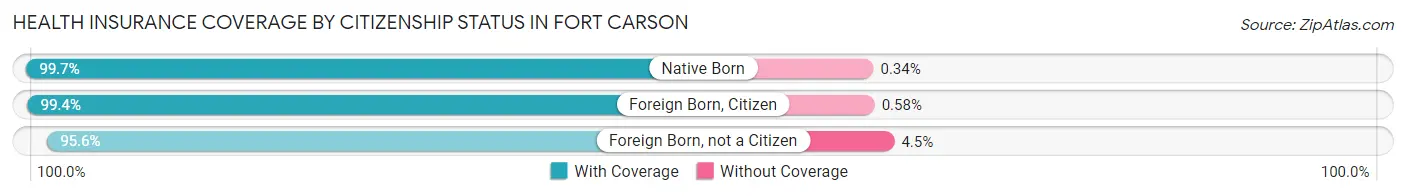
| Citizenship Status | With Coverage | Without Coverage |
| Native Born | 2,344 (99.7%) | 8 (0.3%) |
| Foreign Born, Citizen | 2,406 (99.4%) | 14 (0.6%) |
| Foreign Born, not a Citizen | 923 (95.6%) | 43 (4.4%) |
Health Insurance Coverage by Household Income in Fort Carson
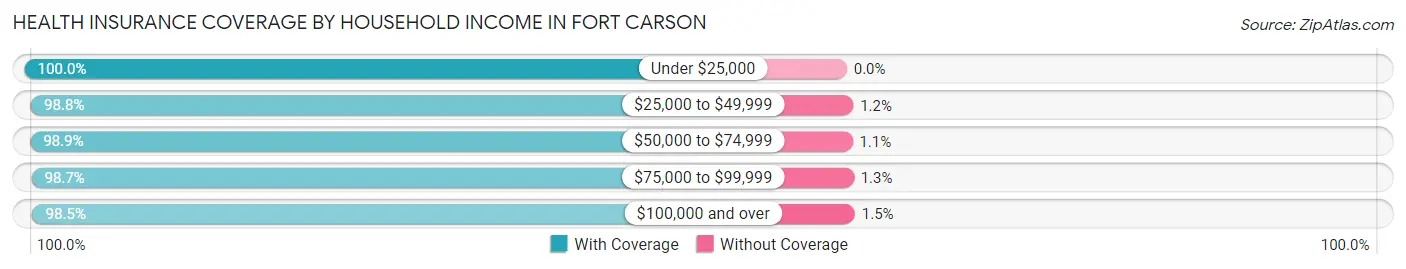
| Household Income | With Coverage | Without Coverage |
| Under $25,000 | 800 (100.0%) | 0 (0.0%) |
| $25,000 to $49,999 | 1,878 (98.8%) | 23 (1.2%) |
| $50,000 to $74,999 | 2,342 (98.9%) | 25 (1.1%) |
| $75,000 to $99,999 | 1,071 (98.7%) | 14 (1.3%) |
| $100,000 and over | 2,217 (98.5%) | 34 (1.5%) |
Public vs Private Health Insurance Coverage by Age in Fort Carson
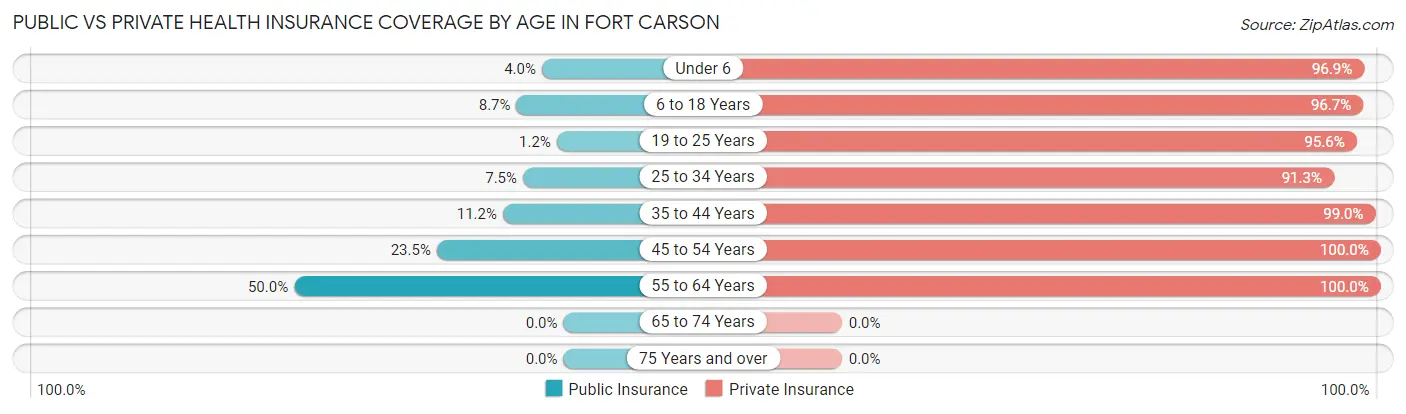
| Age Bracket | Public Insurance | Private Insurance |
| Under 6 | 94 (4.0%) | 2,280 (96.9%) |
| 6 to 18 Years | 211 (8.7%) | 2,341 (96.7%) |
| 19 to 25 Years | 12 (1.2%) | 923 (95.6%) |
| 25 to 34 Years | 107 (7.5%) | 1,301 (91.3%) |
| 35 to 44 Years | 104 (11.2%) | 916 (99.0%) |
| 45 to 54 Years | 55 (23.5%) | 234 (100.0%) |
| 55 to 64 Years | 41 (50.0%) | 82 (100.0%) |
| 65 to 74 Years | 0 (0.0%) | 0 (0.0%) |
| 75 Years and over | 0 (0.0%) | 0 (0.0%) |
| Total | 624 (7.4%) | 8,077 (96.1%) |
Disability Status by Sex by Age in Fort Carson
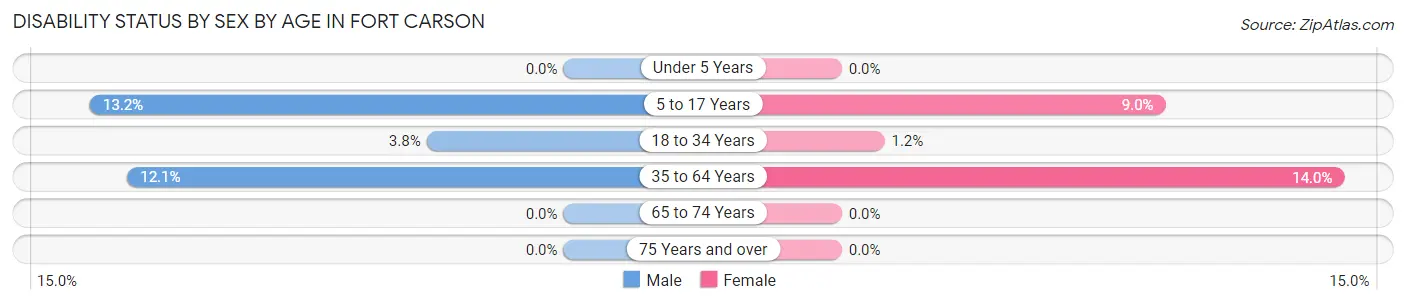
| Age Bracket | Male | Female |
| Under 5 Years | 0 (0.0%) | 0 (0.0%) |
| 5 to 17 Years | 200 (13.2%) | 105 (9.0%) |
| 18 to 34 Years | 9 (3.8%) | 26 (1.2%) |
| 35 to 64 Years | 50 (12.1%) | 116 (14.0%) |
| 65 to 74 Years | 0 (0.0%) | 0 (0.0%) |
| 75 Years and over | 0 (0.0%) | 0 (0.0%) |
Disability Class by Sex by Age in Fort Carson
Disability Class: Hearing Difficulty
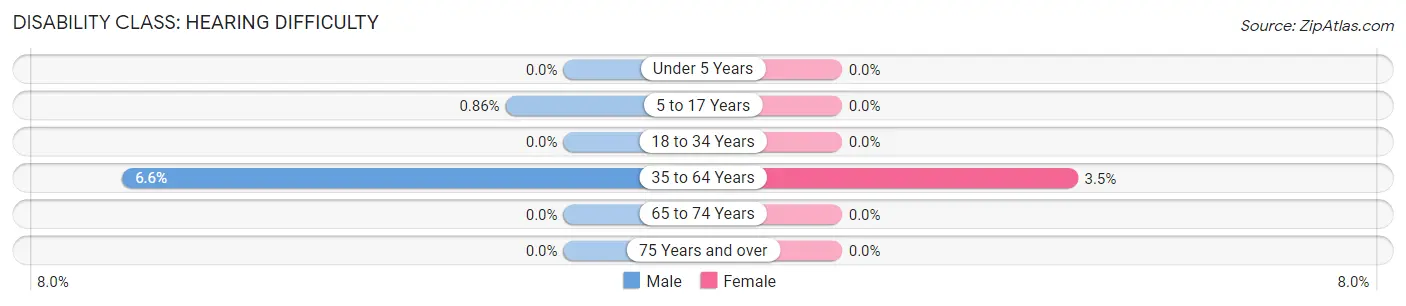
| Age Bracket | Male | Female |
| Under 5 Years | 0 (0.0%) | 0 (0.0%) |
| 5 to 17 Years | 13 (0.9%) | 0 (0.0%) |
| 18 to 34 Years | 0 (0.0%) | 0 (0.0%) |
| 35 to 64 Years | 27 (6.6%) | 29 (3.5%) |
| 65 to 74 Years | 0 (0.0%) | 0 (0.0%) |
| 75 Years and over | 0 (0.0%) | 0 (0.0%) |
Disability Class: Vision Difficulty
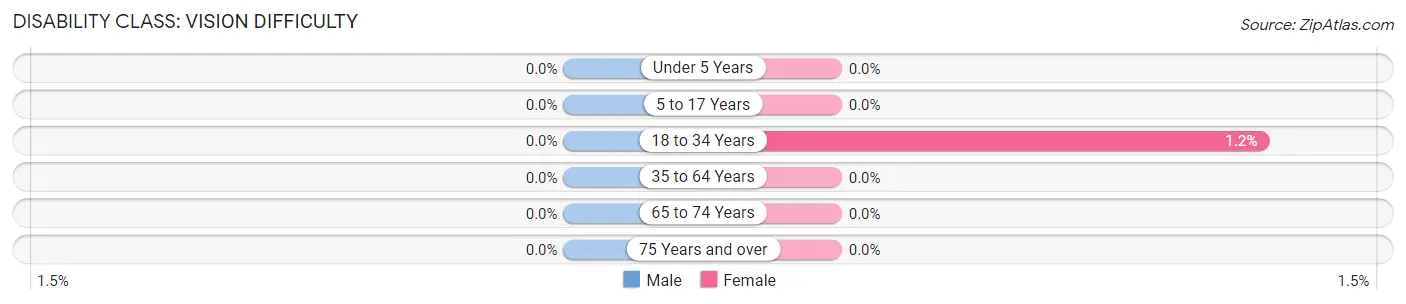
| Age Bracket | Male | Female |
| Under 5 Years | 0 (0.0%) | 0 (0.0%) |
| 5 to 17 Years | 0 (0.0%) | 0 (0.0%) |
| 18 to 34 Years | 0 (0.0%) | 26 (1.2%) |
| 35 to 64 Years | 0 (0.0%) | 0 (0.0%) |
| 65 to 74 Years | 0 (0.0%) | 0 (0.0%) |
| 75 Years and over | 0 (0.0%) | 0 (0.0%) |
Disability Class: Cognitive Difficulty
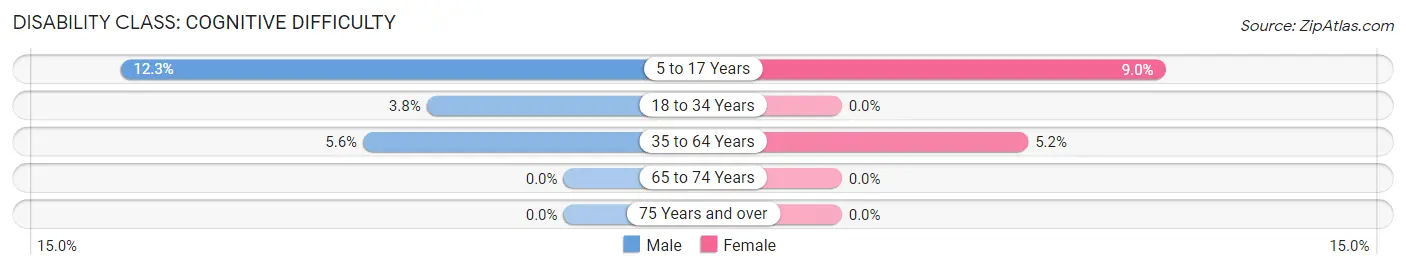
| Age Bracket | Male | Female |
| 5 to 17 Years | 187 (12.3%) | 105 (9.0%) |
| 18 to 34 Years | 9 (3.8%) | 0 (0.0%) |
| 35 to 64 Years | 23 (5.6%) | 43 (5.2%) |
| 65 to 74 Years | 0 (0.0%) | 0 (0.0%) |
| 75 Years and over | 0 (0.0%) | 0 (0.0%) |
Disability Class: Ambulatory Difficulty
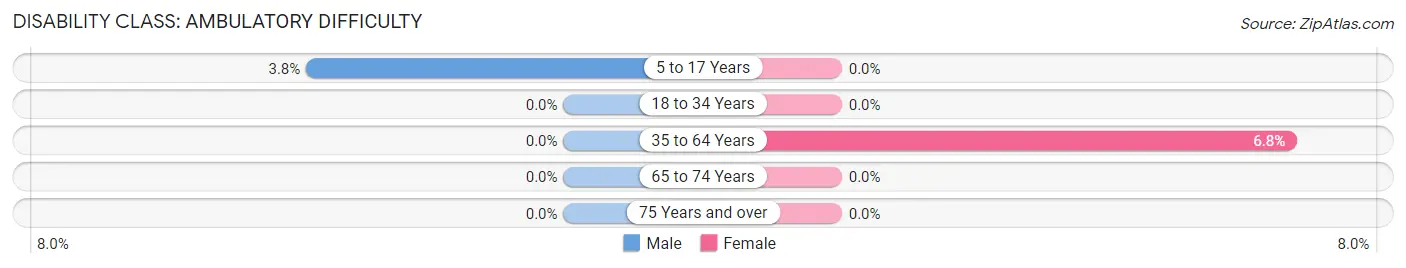
| Age Bracket | Male | Female |
| 5 to 17 Years | 58 (3.8%) | 0 (0.0%) |
| 18 to 34 Years | 0 (0.0%) | 0 (0.0%) |
| 35 to 64 Years | 0 (0.0%) | 56 (6.8%) |
| 65 to 74 Years | 0 (0.0%) | 0 (0.0%) |
| 75 Years and over | 0 (0.0%) | 0 (0.0%) |
Disability Class: Self-Care Difficulty
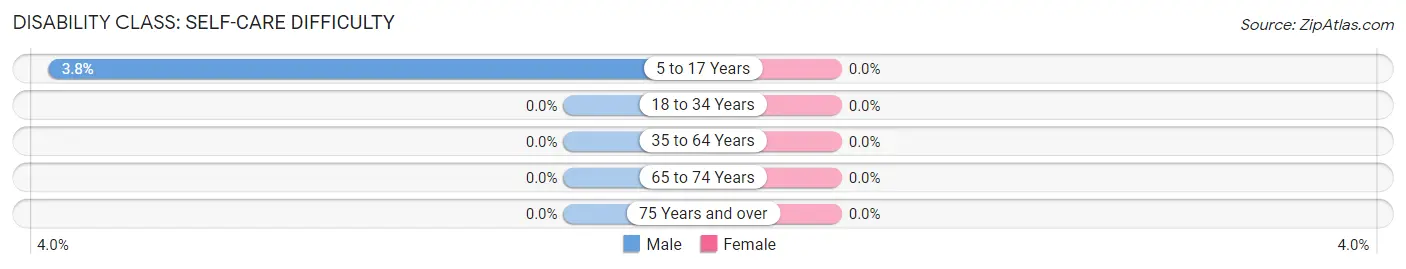
| Age Bracket | Male | Female |
| 5 to 17 Years | 58 (3.8%) | 0 (0.0%) |
| 18 to 34 Years | 0 (0.0%) | 0 (0.0%) |
| 35 to 64 Years | 0 (0.0%) | 0 (0.0%) |
| 65 to 74 Years | 0 (0.0%) | 0 (0.0%) |
| 75 Years and over | 0 (0.0%) | 0 (0.0%) |
Technology Access in Fort Carson
Computing Device Access in Fort Carson
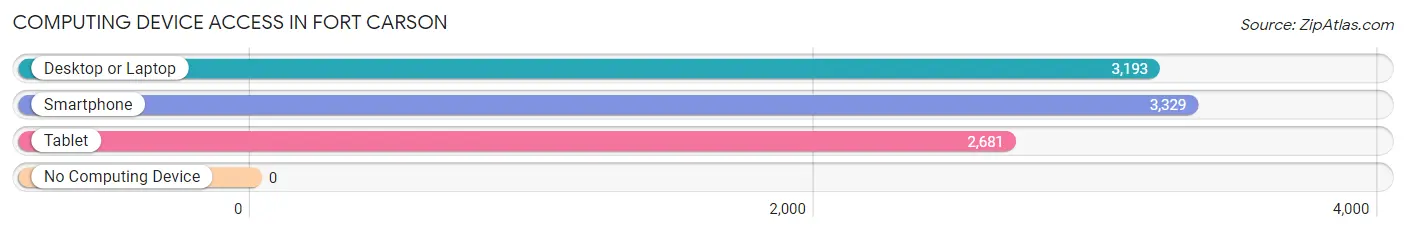
| Device Type | # Households | % Households |
| Desktop or Laptop | 3,193 | 95.9% |
| Smartphone | 3,329 | 100.0% |
| Tablet | 2,681 | 80.5% |
| No Computing Device | 0 | 0.0% |
| Total | 3,329 | 100.0% |
Internet Access in Fort Carson
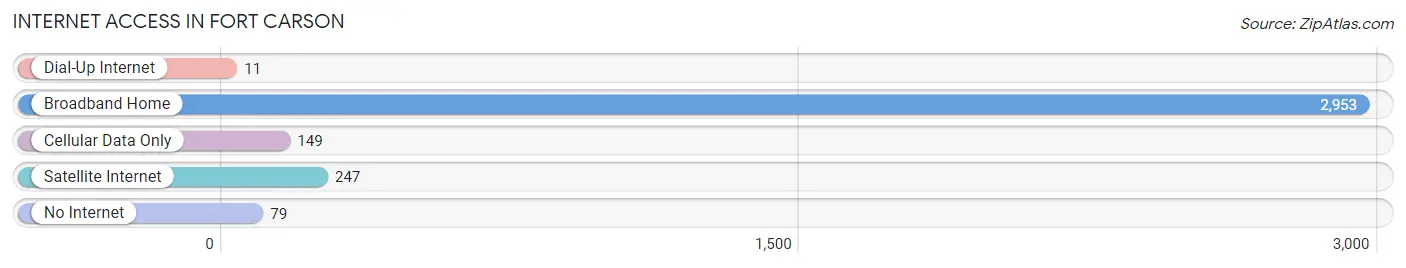
| Internet Type | # Households | % Households |
| Dial-Up Internet | 11 | 0.3% |
| Broadband Home | 2,953 | 88.7% |
| Cellular Data Only | 149 | 4.5% |
| Satellite Internet | 247 | 7.4% |
| No Internet | 79 | 2.4% |
| Total | 3,329 | 100.0% |
Fort Carson Summary
History
Fort Carson is a United States Army installation located in El Paso County, Colorado. It is located just south of Colorado Springs and is home to the 4th Infantry Division and the 10th Special Forces Group. The installation was established in 1942 and has been an important part of the Colorado Springs community ever since.
Fort Carson was originally established as Camp Carson in 1942, during World War II. It was named after General Christopher "Kit" Carson, a famous frontiersman and Indian fighter. The camp was initially used as a training center for the Army's 10th Mountain Division. After the war, the camp was deactivated and the land was returned to the local community.
In 1951, the camp was reactivated and renamed Fort Carson. The fort was used as a training center for the Army's 4th Infantry Division. During the Vietnam War, Fort Carson was used as a staging area for troops being deployed to Vietnam. In the 1980s, the fort was used as a training center for the Army's 10th Special Forces Group.
Today, Fort Carson is home to the 4th Infantry Division and the 10th Special Forces Group. The fort is also home to the Army's Warrior Transition Battalion, which provides medical and psychological care for wounded soldiers.
Geography
Fort Carson is located in El Paso County, Colorado, just south of Colorado Springs. The installation is situated at the base of the Rocky Mountains, and is surrounded by the Pike National Forest. The installation covers an area of approximately 16,000 acres.
The climate in the area is semi-arid, with hot summers and cold winters. The average annual temperature is around 50 degrees Fahrenheit. The average annual precipitation is around 16 inches.
Economy
Fort Carson is a major economic driver for the Colorado Springs area. The installation has an annual economic impact of over $2 billion. The installation is home to over 20,000 military personnel and their families, and provides over 10,000 civilian jobs.
The installation is home to a variety of businesses, including retail stores, restaurants, and hotels. The installation also has a variety of recreational activities, including golf courses, swimming pools, and a bowling alley.
Demographics
As of 2019, the population of Fort Carson was estimated to be around 25,000. The population is predominantly white (83.3%), followed by African American (7.2%), Hispanic (5.3%), and Asian (2.2%). The median household income is around $60,000. The median age is around 28 years old.
Conclusion
Fort Carson is a United States Army installation located in El Paso County, Colorado. It was established in 1942 and is home to the 4th Infantry Division and the 10th Special Forces Group. The installation covers an area of approximately 16,000 acres and has an annual economic impact of over $2 billion. The population of Fort Carson is predominantly white, with a median household income of around $60,000 and a median age of around 28 years old.
Common Questions
What is Per Capita Income in Fort Carson?
Per Capita income in Fort Carson is $24,800.
What is the Median Family Income in Fort Carson?
Median Family Income in Fort Carson is $62,532.
What is the Median Household income in Fort Carson?
Median Household Income in Fort Carson is $62,582.
What is Income or Wage Gap in Fort Carson?
Income or Wage Gap in Fort Carson is 16.9%.
Women in Fort Carson earn 83.1 cents for every dollar earned by a man.
What is Family Income Deficit in Fort Carson?
Family Income Deficit in Fort Carson is $11,837.
Families that are below poverty line in Fort Carson earn $11,837 less on average than the poverty threshold level.
What is Inequality or Gini Index in Fort Carson?
Inequality or Gini Index in Fort Carson is 0.33.
What is the Total Population of Fort Carson?
Total Population of Fort Carson is 18,105.
What is the Total Male Population of Fort Carson?
Total Male Population of Fort Carson is 12,240.
What is the Total Female Population of Fort Carson?
Total Female Population of Fort Carson is 5,865.
What is the Ratio of Males per 100 Females in Fort Carson?
There are 208.70 Males per 100 Females in Fort Carson.
What is the Ratio of Females per 100 Males in Fort Carson?
There are 47.92 Females per 100 Males in Fort Carson.
What is the Median Population Age in Fort Carson?
Median Population Age in Fort Carson is 21.9 Years.
What is the Average Family Size in Fort Carson
Average Family Size in Fort Carson is 3.4 People.
What is the Average Household Size in Fort Carson
Average Household Size in Fort Carson is 3.4 People.
How Large is the Labor Force in Fort Carson?
There are 11,530 People in the Labor Forcein in Fort Carson.
What is the Percentage of People in the Labor Force in Fort Carson?
85.1% of People are in the Labor Force in Fort Carson.
What is the Unemployment Rate in Fort Carson?
Unemployment Rate in Fort Carson is 1.9%.