The Woodlands, TX Map & Demographics
The Woodlands Map
The Woodlands Overview
$72,214
PER CAPITA INCOME
$167,650
AVG FAMILY INCOME
$142,384
AVG HOUSEHOLD INCOME
59.5%
WAGE / INCOME GAP [ % ]
40.5¢/ $1
WAGE / INCOME GAP [ $ ]
0.48
INEQUALITY / GINI INDEX
118,402
TOTAL POPULATION
58,206
MALE POPULATION
60,196
FEMALE POPULATION
96.69
MALES / 100 FEMALES
103.42
FEMALES / 100 MALES
40.7
MEDIAN AGE
3.2
AVG FAMILY SIZE
2.7
AVG HOUSEHOLD SIZE
56,085
LABOR FORCE [ PEOPLE ]
62.5%
PERCENT IN LABOR FORCE
5.3%
UNEMPLOYMENT RATE
Income in The Woodlands
Income Overview in The Woodlands
Per Capita Income in The Woodlands is $72,214, while median incomes of families and households are $167,650 and $142,384 respectively.
| Characteristic | Number | Measure |
| Per Capita Income | 118,402 | $72,214 |
| Median Family Income | 32,520 | $167,650 |
| Mean Family Income | 32,520 | $227,284 |
| Median Household Income | 43,164 | $142,384 |
| Mean Household Income | 43,164 | $196,603 |
| Income Deficit | 32,520 | $0 |
| Wage / Income Gap (%) | 118,402 | 59.47% |
| Wage / Income Gap ($) | 118,402 | 40.53¢ per $1 |
| Gini / Inequality Index | 118,402 | 0.48 |
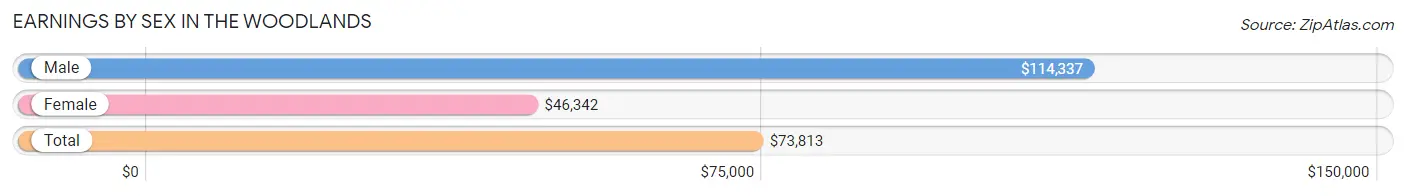
Earnings by Sex in The Woodlands
Average Earnings in The Woodlands are $73,813, $114,337 for men and $46,342 for women, a difference of 59.5%.
| Sex | Number | Average Earnings |
| Male | 33,385 (57.1%) | $114,337 |
| Female | 25,039 (42.9%) | $46,342 |
| Total | 58,424 (100.0%) | $73,813 |
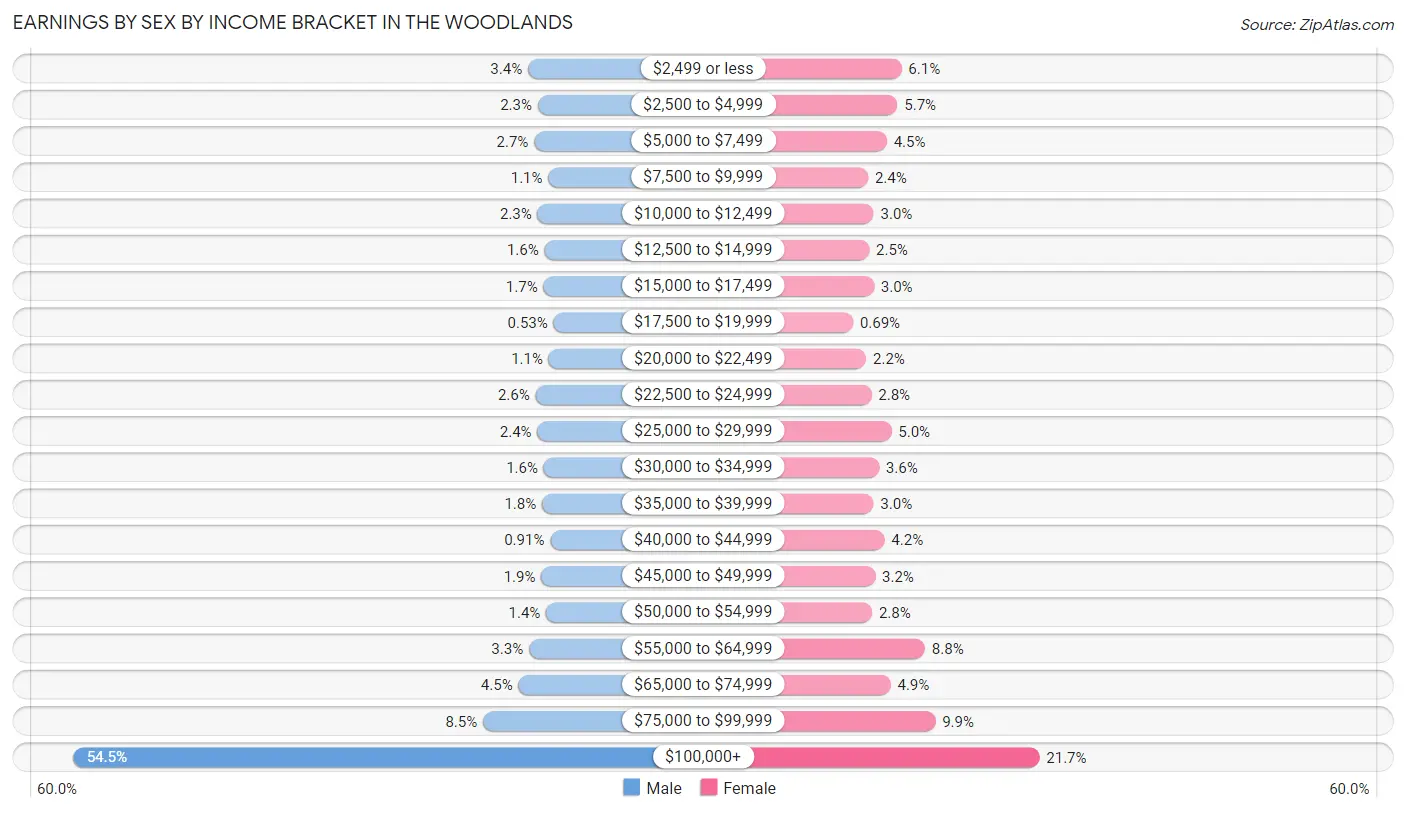
Earnings by Sex by Income Bracket in The Woodlands
The most common earnings brackets in The Woodlands are $100,000+ for men (18,184 | 54.5%) and $100,000+ for women (5,422 | 21.6%).
| Income | Male | Female |
| $2,499 or less | 1,138 (3.4%) | 1,537 (6.1%) |
| $2,500 to $4,999 | 770 (2.3%) | 1,422 (5.7%) |
| $5,000 to $7,499 | 909 (2.7%) | 1,125 (4.5%) |
| $7,500 to $9,999 | 373 (1.1%) | 597 (2.4%) |
| $10,000 to $12,499 | 777 (2.3%) | 753 (3.0%) |
| $12,500 to $14,999 | 519 (1.5%) | 629 (2.5%) |
| $15,000 to $17,499 | 559 (1.7%) | 760 (3.0%) |
| $17,500 to $19,999 | 176 (0.5%) | 172 (0.7%) |
| $20,000 to $22,499 | 356 (1.1%) | 544 (2.2%) |
| $22,500 to $24,999 | 854 (2.6%) | 690 (2.8%) |
| $25,000 to $29,999 | 784 (2.4%) | 1,254 (5.0%) |
| $30,000 to $34,999 | 549 (1.6%) | 903 (3.6%) |
| $35,000 to $39,999 | 612 (1.8%) | 748 (3.0%) |
| $40,000 to $44,999 | 305 (0.9%) | 1,058 (4.2%) |
| $45,000 to $49,999 | 642 (1.9%) | 796 (3.2%) |
| $50,000 to $54,999 | 458 (1.4%) | 708 (2.8%) |
| $55,000 to $64,999 | 1,101 (3.3%) | 2,198 (8.8%) |
| $65,000 to $74,999 | 1,495 (4.5%) | 1,233 (4.9%) |
| $75,000 to $99,999 | 2,824 (8.5%) | 2,490 (9.9%) |
| $100,000+ | 18,184 (54.5%) | 5,422 (21.6%) |
| Total | 33,385 (100.0%) | 25,039 (100.0%) |
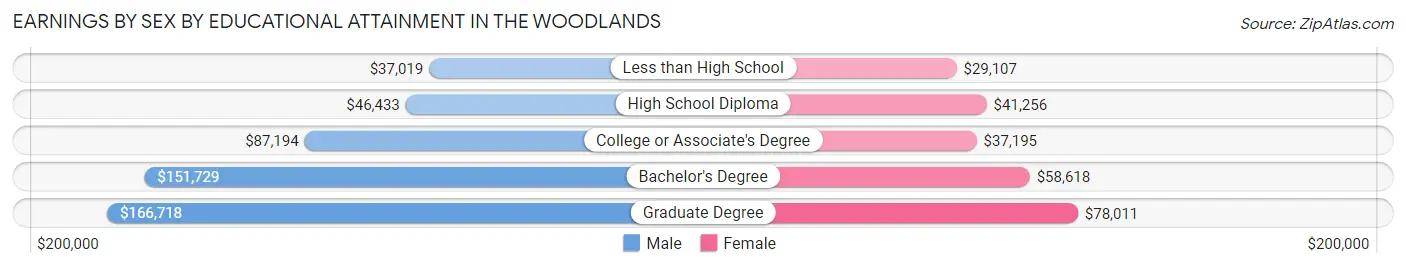
Earnings by Sex by Educational Attainment in The Woodlands
Average earnings in The Woodlands are $128,560 for men and $54,895 for women, a difference of 57.3%. Men with an educational attainment of graduate degree enjoy the highest average annual earnings of $166,718, while those with less than high school education earn the least with $37,019. Women with an educational attainment of graduate degree earn the most with the average annual earnings of $78,011, while those with less than high school education have the smallest earnings of $29,107.
| Educational Attainment | Male Income | Female Income |
| Less than High School | $37,019 | $29,107 |
| High School Diploma | $46,433 | $41,256 |
| College or Associate's Degree | $87,194 | $37,195 |
| Bachelor's Degree | $151,729 | $58,618 |
| Graduate Degree | $166,718 | $78,011 |
| Total | $128,560 | $54,895 |
Family Income in The Woodlands
Family Income Brackets in The Woodlands
According to the The Woodlands family income data, there are 13,788 families falling into the $200,000+ income range, which is the most common income bracket and makes up 42.4% of all families. Conversely, the $10,000 to $14,999 income bracket is the least frequent group with only 163 families (0.5%) belonging to this category.
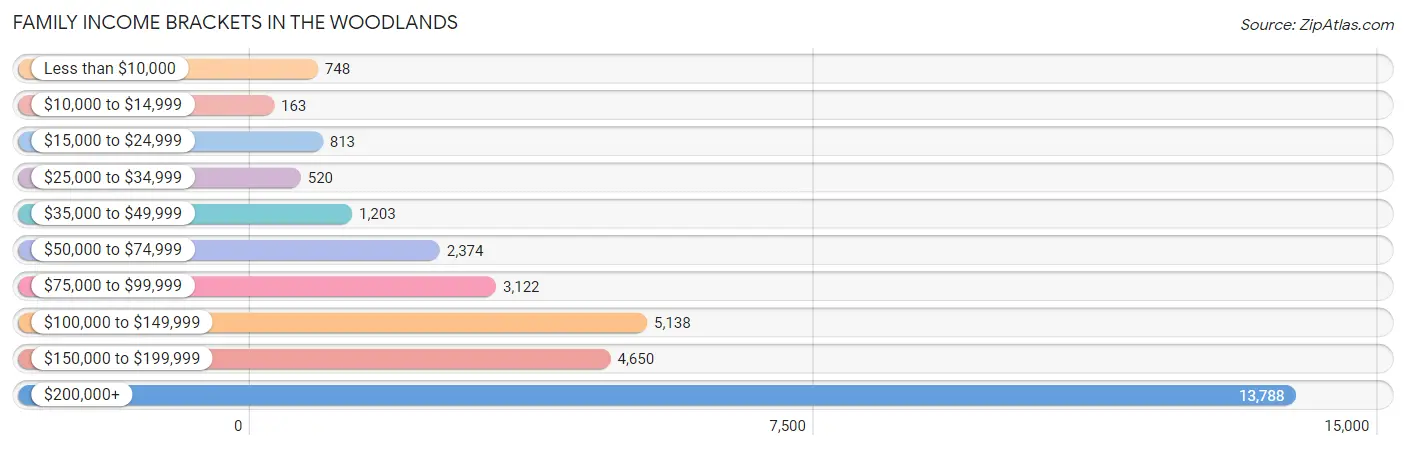
| Income Bracket | # Families | % Families |
| Less than $10,000 | 748 | 2.3% |
| $10,000 to $14,999 | 163 | 0.5% |
| $15,000 to $24,999 | 813 | 2.5% |
| $25,000 to $34,999 | 520 | 1.6% |
| $35,000 to $49,999 | 1,203 | 3.7% |
| $50,000 to $74,999 | 2,374 | 7.3% |
| $75,000 to $99,999 | 3,122 | 9.6% |
| $100,000 to $149,999 | 5,138 | 15.8% |
| $150,000 to $199,999 | 4,650 | 14.3% |
| $200,000+ | 13,788 | 42.4% |
Family Income by Famaliy Size in The Woodlands
6-person families (610 | 1.9%) account for the highest median family income in The Woodlands with $250,001 per family, while 2-person families (13,857 | 42.6%) have the highest median income of $67,920 per family member.
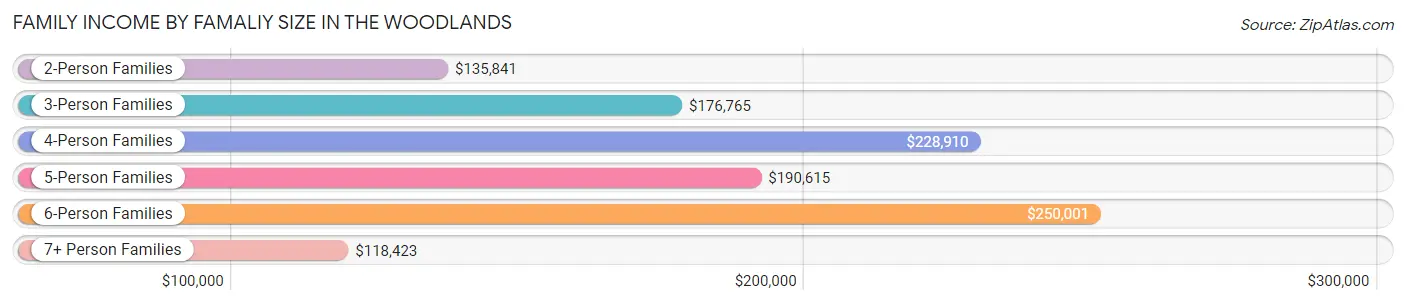
| Income Bracket | # Families | Median Income |
| 2-Person Families | 13,857 (42.6%) | $135,841 |
| 3-Person Families | 6,456 (19.9%) | $176,765 |
| 4-Person Families | 8,462 (26.0%) | $228,910 |
| 5-Person Families | 2,978 (9.2%) | $190,615 |
| 6-Person Families | 610 (1.9%) | $250,001 |
| 7+ Person Families | 157 (0.5%) | $118,423 |
| Total | 32,520 (100.0%) | $167,650 |
Family Income by Number of Earners in The Woodlands
The median family income in The Woodlands is $167,650, with families comprising 3+ earners (2,474) having the highest median family income of $227,750, while families with no earners (4,211) have the lowest median family income of $81,193, accounting for 7.6% and 13.0% of families, respectively.
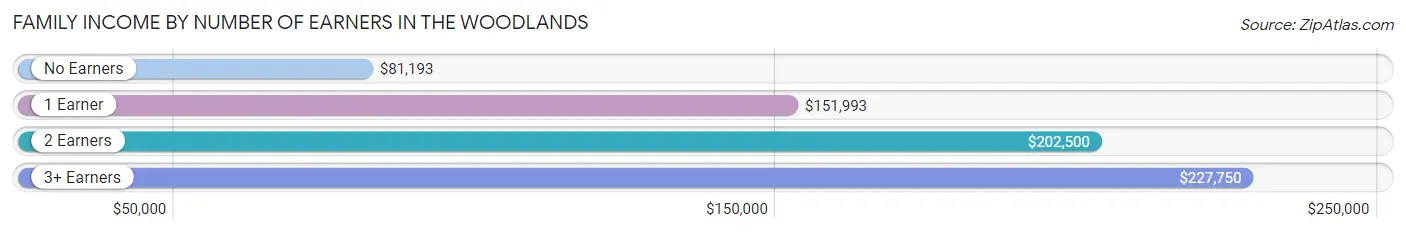
| Number of Earners | # Families | Median Income |
| No Earners | 4,211 (13.0%) | $81,193 |
| 1 Earner | 11,871 (36.5%) | $151,993 |
| 2 Earners | 13,964 (42.9%) | $202,500 |
| 3+ Earners | 2,474 (7.6%) | $227,750 |
| Total | 32,520 (100.0%) | $167,650 |
Household Income in The Woodlands
Household Income Brackets in The Woodlands
With 14,935 households falling in the category, the $200,000+ income range is the most frequent in The Woodlands, accounting for 34.6% of all households. In contrast, only 691 households (1.6%) fall into the $10,000 to $14,999 income bracket, making it the least populous group.
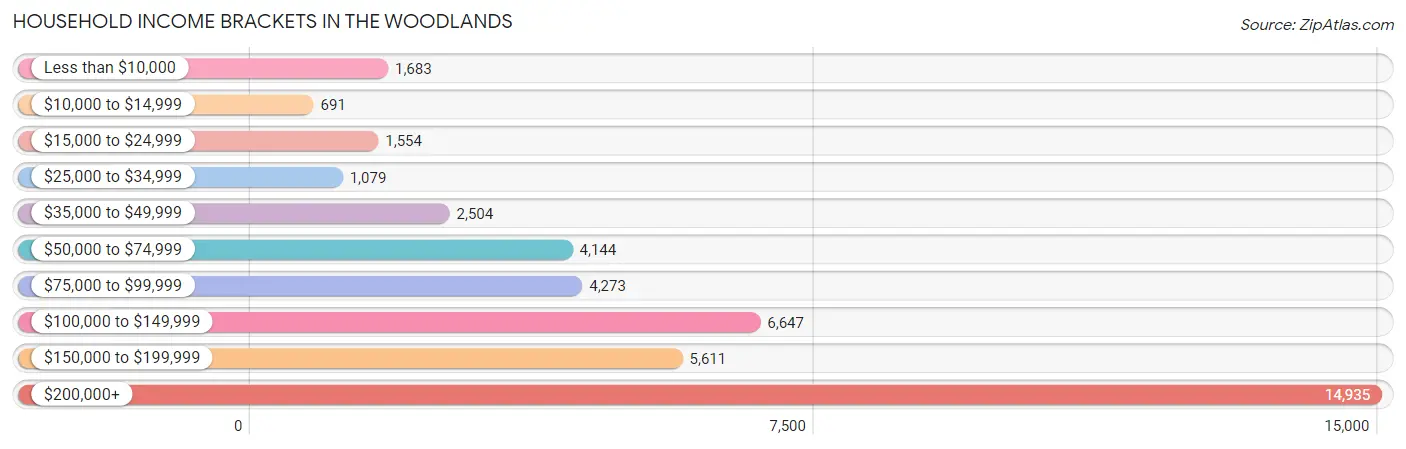
| Income Bracket | # Households | % Households |
| Less than $10,000 | 1,683 | 3.9% |
| $10,000 to $14,999 | 691 | 1.6% |
| $15,000 to $24,999 | 1,554 | 3.6% |
| $25,000 to $34,999 | 1,079 | 2.5% |
| $35,000 to $49,999 | 2,504 | 5.8% |
| $50,000 to $74,999 | 4,144 | 9.6% |
| $75,000 to $99,999 | 4,273 | 9.9% |
| $100,000 to $149,999 | 6,647 | 15.4% |
| $150,000 to $199,999 | 5,611 | 13.0% |
| $200,000+ | 14,935 | 34.6% |
Household Income by Householder Age in The Woodlands
The median household income in The Woodlands is $142,384, with the highest median household income of $179,916 found in the 45 to 64 years age bracket for the primary householder. A total of 18,959 households (43.9%) fall into this category. Meanwhile, the 15 to 24 years age bracket for the primary householder has the lowest median household income of $39,564, with 1,061 households (2.5%) in this group.
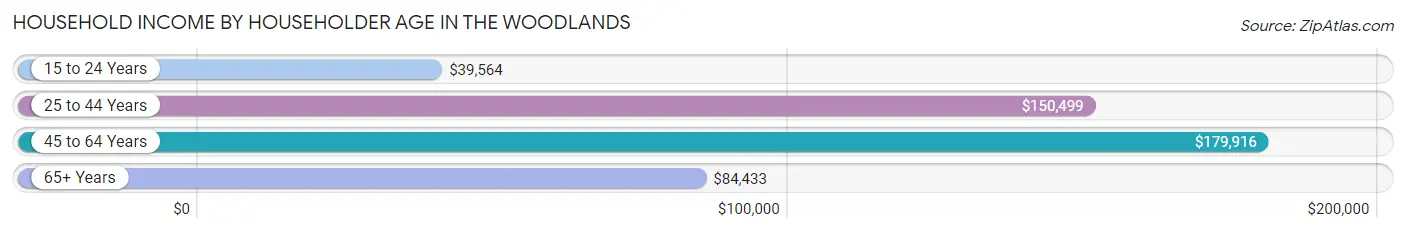
| Income Bracket | # Households | Median Income |
| 15 to 24 Years | 1,061 (2.5%) | $39,564 |
| 25 to 44 Years | 13,433 (31.1%) | $150,499 |
| 45 to 64 Years | 18,959 (43.9%) | $179,916 |
| 65+ Years | 9,711 (22.5%) | $84,433 |
| Total | 43,164 (100.0%) | $142,384 |
Poverty in The Woodlands
Income Below Poverty by Sex and Age in The Woodlands
With 4.1% poverty level for males and 7.2% for females among the residents of The Woodlands, 5 year old males and 18 to 24 year old females are the most vulnerable to poverty, with 187 males (15.5%) and 462 females (12.9%) in their respective age groups living below the poverty level.
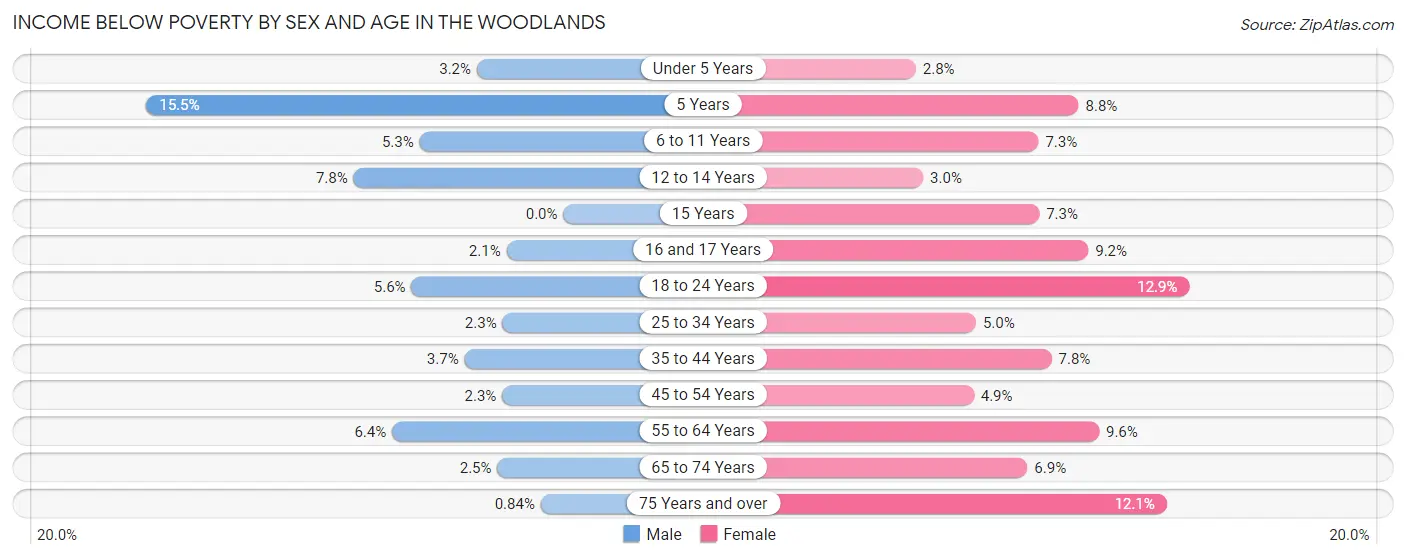
| Age Bracket | Male | Female |
| Under 5 Years | 118 (3.2%) | 88 (2.8%) |
| 5 Years | 187 (15.5%) | 43 (8.8%) |
| 6 to 11 Years | 264 (5.3%) | 467 (7.3%) |
| 12 to 14 Years | 307 (7.8%) | 92 (3.0%) |
| 15 Years | 0 (0.0%) | 58 (7.3%) |
| 16 and 17 Years | 43 (2.1%) | 196 (9.1%) |
| 18 to 24 Years | 214 (5.6%) | 462 (12.9%) |
| 25 to 34 Years | 120 (2.3%) | 299 (5.0%) |
| 35 to 44 Years | 288 (3.7%) | 635 (7.8%) |
| 45 to 54 Years | 221 (2.3%) | 492 (4.9%) |
| 55 to 64 Years | 470 (6.4%) | 707 (9.6%) |
| 65 to 74 Years | 117 (2.5%) | 360 (6.9%) |
| 75 Years and over | 21 (0.8%) | 402 (12.1%) |
| Total | 2,370 (4.1%) | 4,301 (7.2%) |
Income Above Poverty by Sex and Age in The Woodlands
According to the poverty statistics in The Woodlands, males aged 15 years and females aged under 5 years are the age groups that are most secure financially, with 100.0% of males and 97.3% of females in these age groups living above the poverty line.
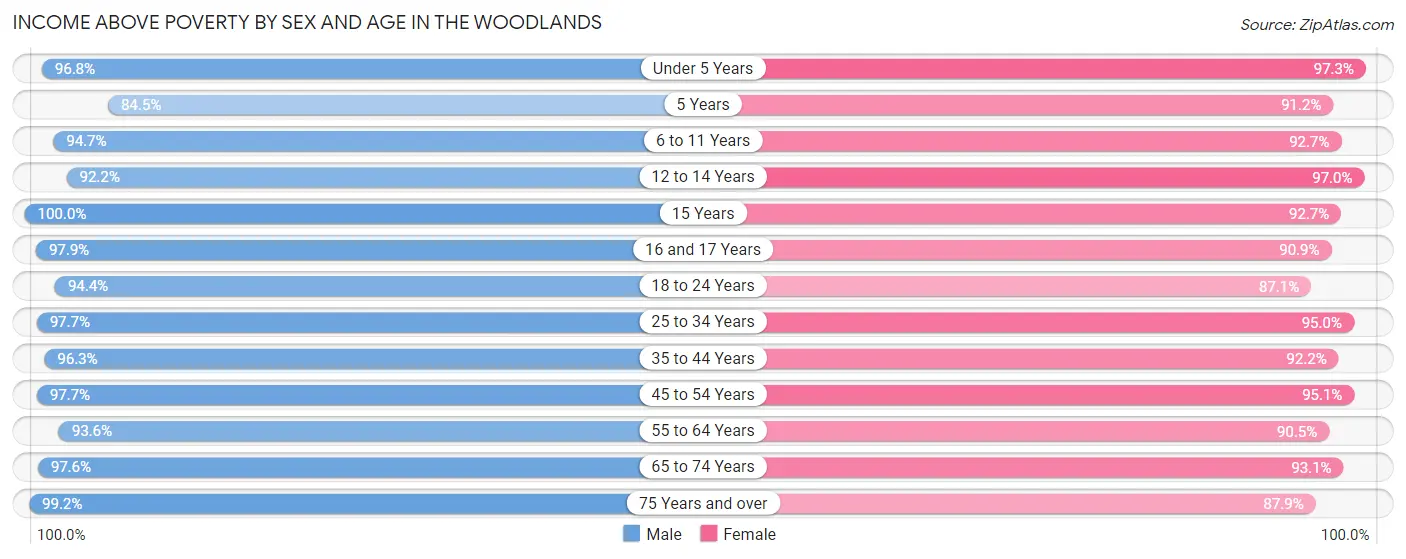
| Age Bracket | Male | Female |
| Under 5 Years | 3,556 (96.8%) | 3,107 (97.3%) |
| 5 Years | 1,021 (84.5%) | 446 (91.2%) |
| 6 to 11 Years | 4,684 (94.7%) | 5,933 (92.7%) |
| 12 to 14 Years | 3,634 (92.2%) | 2,955 (97.0%) |
| 15 Years | 720 (100.0%) | 733 (92.7%) |
| 16 and 17 Years | 1,992 (97.9%) | 1,946 (90.8%) |
| 18 to 24 Years | 3,579 (94.4%) | 3,119 (87.1%) |
| 25 to 34 Years | 5,191 (97.7%) | 5,707 (95.0%) |
| 35 to 44 Years | 7,555 (96.3%) | 7,520 (92.2%) |
| 45 to 54 Years | 9,512 (97.7%) | 9,541 (95.1%) |
| 55 to 64 Years | 6,919 (93.6%) | 6,698 (90.4%) |
| 65 to 74 Years | 4,665 (97.6%) | 4,865 (93.1%) |
| 75 Years and over | 2,481 (99.2%) | 2,932 (87.9%) |
| Total | 55,509 (95.9%) | 55,502 (92.8%) |
Income Below Poverty Among Married-Couple Families in The Woodlands
The poverty statistics for married-couple families in The Woodlands show that 2.3% or 661 of the total 28,693 families live below the poverty line. Families with 3 or 4 children have the highest poverty rate of 6.1%, comprising of 154 families. On the other hand, families with 5 or more children have the lowest poverty rate of 0.0%, which includes 0 families.
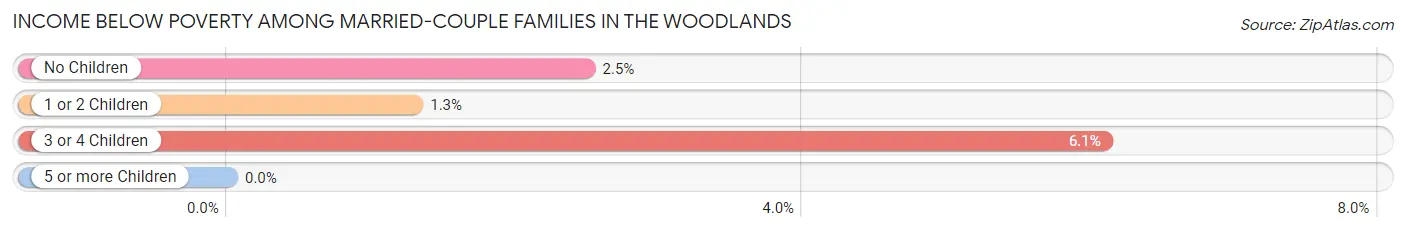
| Children | Above Poverty | Below Poverty |
| No Children | 13,856 (97.5%) | 354 (2.5%) |
| 1 or 2 Children | 11,743 (98.7%) | 153 (1.3%) |
| 3 or 4 Children | 2,373 (93.9%) | 154 (6.1%) |
| 5 or more Children | 60 (100.0%) | 0 (0.0%) |
| Total | 28,032 (97.7%) | 661 (2.3%) |
Income Below Poverty Among Single-Parent Households in The Woodlands
According to the poverty data in The Woodlands, 1.1% or 9 single-father households and 19.9% or 595 single-mother households are living below the poverty line. Among single-father households, those with no children have the highest poverty rate, with 9 households (2.6%) experiencing poverty. Likewise, among single-mother households, those with 5 or more children have the highest poverty rate, with 33 households (100.0%) falling below the poverty line.
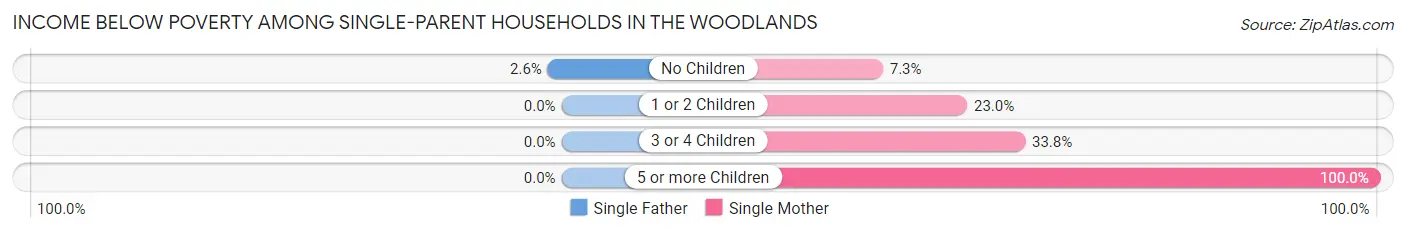
| Children | Single Father | Single Mother |
| No Children | 9 (2.6%) | 74 (7.3%) |
| 1 or 2 Children | 0 (0.0%) | 361 (23.0%) |
| 3 or 4 Children | 0 (0.0%) | 127 (33.8%) |
| 5 or more Children | 0 (0.0%) | 33 (100.0%) |
| Total | 9 (1.1%) | 595 (19.9%) |
Income Below Poverty Among Married-Couple vs Single-Parent Households in The Woodlands
The poverty data for The Woodlands shows that 661 of the married-couple family households (2.3%) and 604 of the single-parent households (15.8%) are living below the poverty level. Within the married-couple family households, those with 3 or 4 children have the highest poverty rate, with 154 households (6.1%) falling below the poverty line. Among the single-parent households, those with 5 or more children have the highest poverty rate, with 33 household (100.0%) living below poverty.
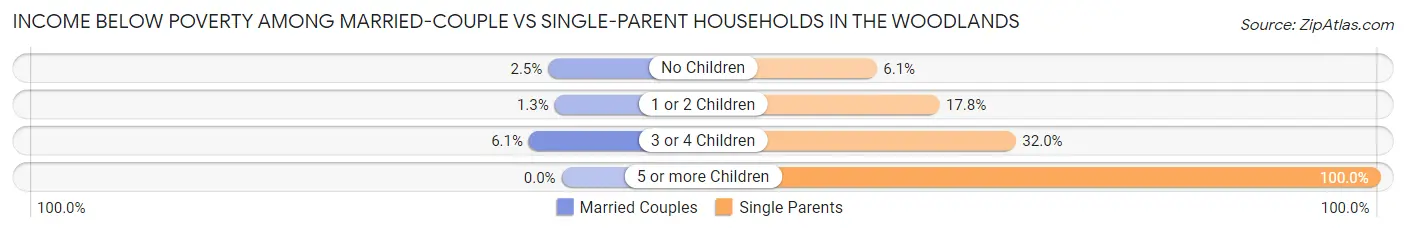
| Children | Married-Couple Families | Single-Parent Households |
| No Children | 354 (2.5%) | 83 (6.1%) |
| 1 or 2 Children | 153 (1.3%) | 361 (17.8%) |
| 3 or 4 Children | 154 (6.1%) | 127 (32.0%) |
| 5 or more Children | 0 (0.0%) | 33 (100.0%) |
| Total | 661 (2.3%) | 604 (15.8%) |
Race in The Woodlands
The most populous races in The Woodlands are White / Caucasian (88,350 | 74.6%), Hispanic or Latino (22,548 | 19.0%), and Two or more Races (14,437 | 12.2%).
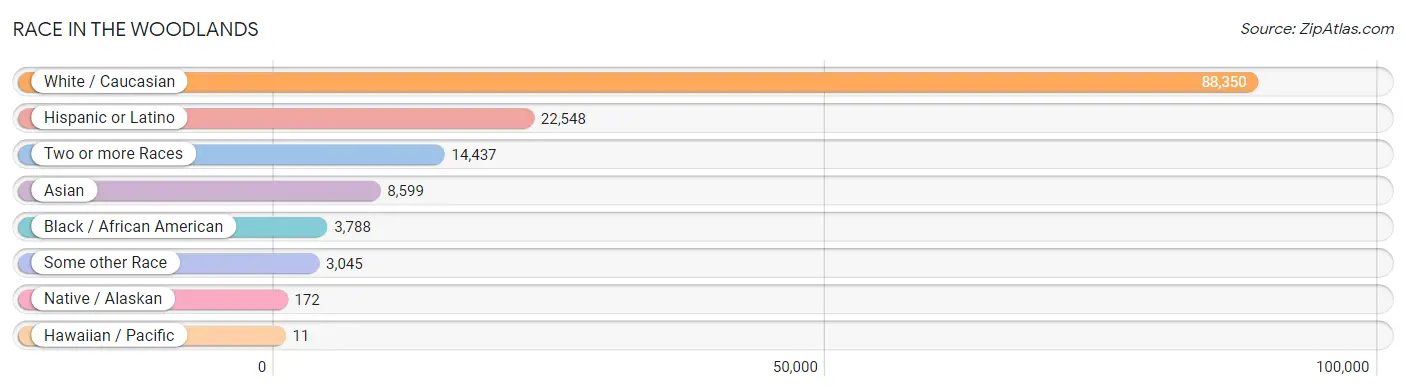
| Race | # Population | % Population |
| Asian | 8,599 | 7.3% |
| Black / African American | 3,788 | 3.2% |
| Hawaiian / Pacific | 11 | 0.0% |
| Hispanic or Latino | 22,548 | 19.0% |
| Native / Alaskan | 172 | 0.2% |
| White / Caucasian | 88,350 | 74.6% |
| Two or more Races | 14,437 | 12.2% |
| Some other Race | 3,045 | 2.6% |
| Total | 118,402 | 100.0% |
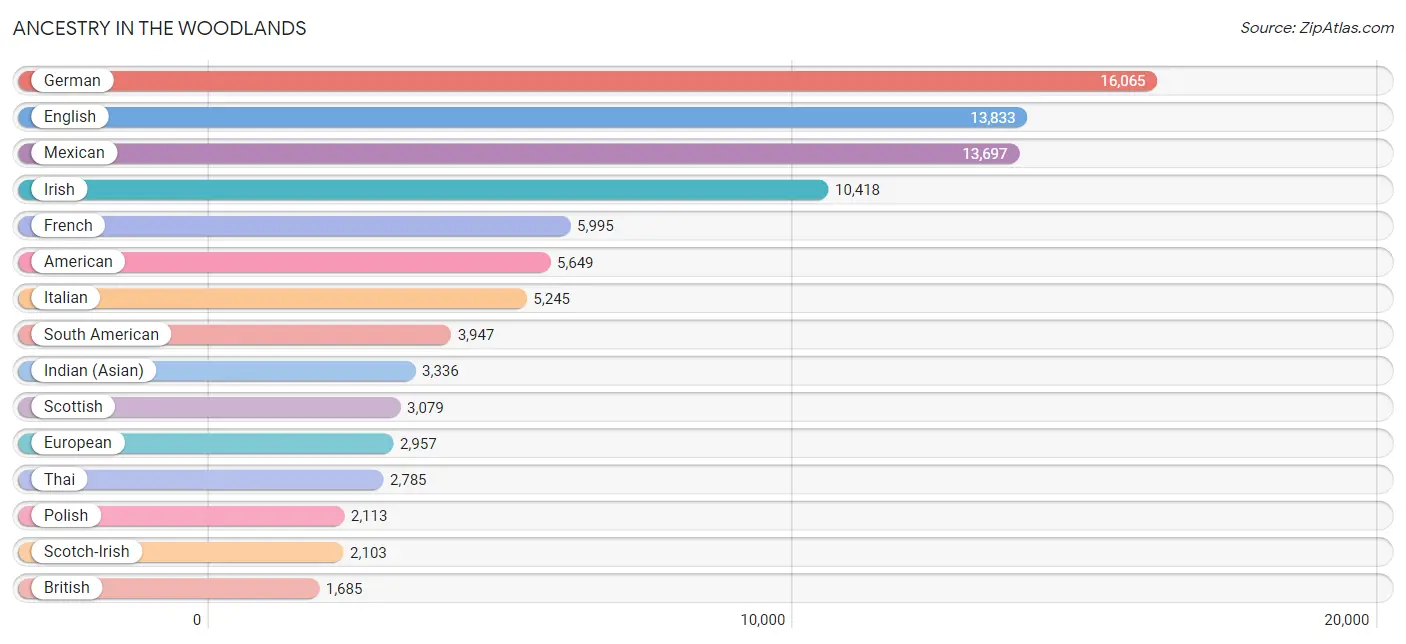
Ancestry in The Woodlands
The most populous ancestries reported in The Woodlands are German (16,065 | 13.6%), English (13,833 | 11.7%), Mexican (13,697 | 11.6%), Irish (10,418 | 8.8%), and French (5,995 | 5.1%), together accounting for 50.7% of all The Woodlands residents.
| Ancestry | # Population | % Population |
| African | 516 | 0.4% |
| Albanian | 67 | 0.1% |
| Alsatian | 19 | 0.0% |
| American | 5,649 | 4.8% |
| Arab | 1,133 | 1.0% |
| Argentinean | 800 | 0.7% |
| Armenian | 156 | 0.1% |
| Australian | 287 | 0.2% |
| Austrian | 399 | 0.3% |
| Basque | 10 | 0.0% |
| Belgian | 275 | 0.2% |
| Belizean | 25 | 0.0% |
| Bhutanese | 305 | 0.3% |
| Bolivian | 64 | 0.1% |
| Brazilian | 250 | 0.2% |
| British | 1,685 | 1.4% |
| British West Indian | 82 | 0.1% |
| Bulgarian | 19 | 0.0% |
| Burmese | 251 | 0.2% |
| Cajun | 60 | 0.1% |
| Canadian | 1,068 | 0.9% |
| Celtic | 25 | 0.0% |
| Central American | 1,623 | 1.4% |
| Cherokee | 296 | 0.3% |
| Chickasaw | 9 | 0.0% |
| Chilean | 175 | 0.2% |
| Choctaw | 63 | 0.1% |
| Colombian | 1,076 | 0.9% |
| Comanche | 10 | 0.0% |
| Costa Rican | 155 | 0.1% |
| Creek | 42 | 0.0% |
| Croatian | 195 | 0.2% |
| Cuban | 288 | 0.2% |
| Czech | 1,621 | 1.4% |
| Czechoslovakian | 5 | 0.0% |
| Danish | 463 | 0.4% |
| Dominican | 172 | 0.2% |
| Dutch | 1,363 | 1.1% |
| Eastern European | 515 | 0.4% |
| Ecuadorian | 162 | 0.1% |
| Egyptian | 16 | 0.0% |
| English | 13,833 | 11.7% |
| Estonian | 8 | 0.0% |
| Ethiopian | 60 | 0.1% |
| European | 2,957 | 2.5% |
| Filipino | 159 | 0.1% |
| Finnish | 349 | 0.3% |
| French | 5,995 | 5.1% |
| French Canadian | 495 | 0.4% |
| German | 16,065 | 13.6% |
| Greek | 399 | 0.3% |
| Guatemalan | 441 | 0.4% |
| Guyanese | 38 | 0.0% |
| Honduran | 440 | 0.4% |
| Hungarian | 364 | 0.3% |
| Indian (Asian) | 3,336 | 2.8% |
| Iranian | 230 | 0.2% |
| Irish | 10,418 | 8.8% |
| Israeli | 31 | 0.0% |
| Italian | 5,245 | 4.4% |
| Jamaican | 60 | 0.1% |
| Japanese | 68 | 0.1% |
| Jordanian | 13 | 0.0% |
| Kenyan | 97 | 0.1% |
| Kiowa | 5 | 0.0% |
| Korean | 823 | 0.7% |
| Laotian | 247 | 0.2% |
| Latvian | 25 | 0.0% |
| Lebanese | 432 | 0.4% |
| Lithuanian | 545 | 0.5% |
| Luxembourger | 36 | 0.0% |
| Maltese | 151 | 0.1% |
| Mexican | 13,697 | 11.6% |
| Mexican American Indian | 13 | 0.0% |
| Mongolian | 51 | 0.0% |
| Native Hawaiian | 43 | 0.0% |
| Navajo | 30 | 0.0% |
| Nicaraguan | 78 | 0.1% |
| Nigerian | 201 | 0.2% |
| Northern European | 163 | 0.1% |
| Norwegian | 1,179 | 1.0% |
| Okinawan | 38 | 0.0% |
| Osage | 51 | 0.0% |
| Pakistani | 223 | 0.2% |
| Palestinian | 84 | 0.1% |
| Panamanian | 50 | 0.0% |
| Peruvian | 470 | 0.4% |
| Polish | 2,113 | 1.8% |
| Portuguese | 1,036 | 0.9% |
| Pueblo | 15 | 0.0% |
| Puerto Rican | 1,230 | 1.0% |
| Romanian | 83 | 0.1% |
| Russian | 953 | 0.8% |
| Salvadoran | 402 | 0.3% |
| Scandinavian | 949 | 0.8% |
| Scotch-Irish | 2,103 | 1.8% |
| Scottish | 3,079 | 2.6% |
| Serbian | 56 | 0.1% |
| Sierra Leonean | 8 | 0.0% |
| Slavic | 257 | 0.2% |
| Slovak | 132 | 0.1% |
| Slovene | 141 | 0.1% |
| South African | 55 | 0.1% |
| South American | 3,947 | 3.3% |
| South American Indian | 9 | 0.0% |
| Spaniard | 926 | 0.8% |
| Spanish | 286 | 0.2% |
| Sri Lankan | 1,014 | 0.9% |
| Subsaharan African | 1,124 | 0.9% |
| Swedish | 1,426 | 1.2% |
| Swiss | 299 | 0.3% |
| Syrian | 88 | 0.1% |
| Thai | 2,785 | 2.4% |
| Turkish | 486 | 0.4% |
| Ukrainian | 575 | 0.5% |
| Uruguayan | 193 | 0.2% |
| Venezuelan | 1,007 | 0.9% |
| Vietnamese | 43 | 0.0% |
| Welsh | 1,048 | 0.9% |
| West Indian | 124 | 0.1% |
| Yugoslavian | 3 | 0.0% |
| Zimbabwean | 8 | 0.0% | View All 122 Rows |
Immigrants in The Woodlands
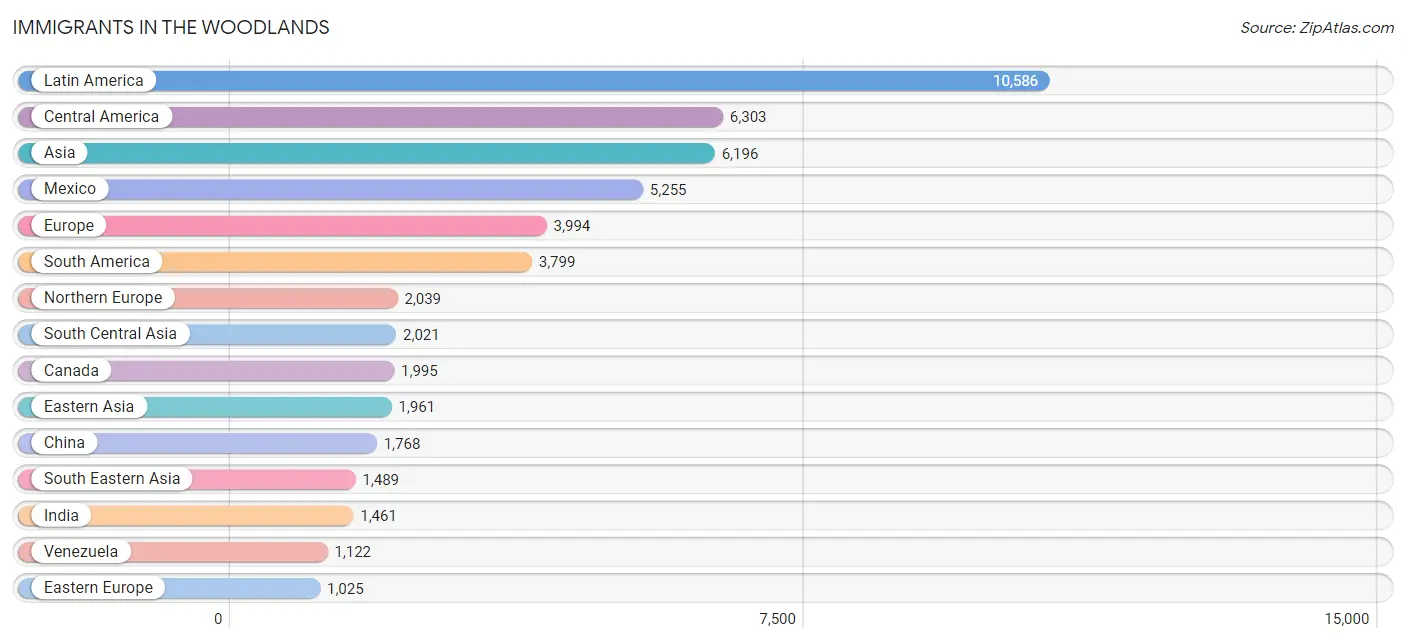
The most numerous immigrant groups reported in The Woodlands came from Latin America (10,586 | 8.9%), Central America (6,303 | 5.3%), Asia (6,196 | 5.2%), Mexico (5,255 | 4.4%), and Europe (3,994 | 3.4%), together accounting for 27.3% of all The Woodlands residents.
| Immigration Origin | # Population | % Population |
| Africa | 732 | 0.6% |
| Albania | 19 | 0.0% |
| Argentina | 941 | 0.8% |
| Asia | 6,196 | 5.2% |
| Australia | 498 | 0.4% |
| Belarus | 113 | 0.1% |
| Belgium | 68 | 0.1% |
| Belize | 31 | 0.0% |
| Bolivia | 9 | 0.0% |
| Brazil | 173 | 0.2% |
| Bulgaria | 10 | 0.0% |
| Canada | 1,995 | 1.7% |
| Caribbean | 484 | 0.4% |
| Central America | 6,303 | 5.3% |
| Chile | 235 | 0.2% |
| China | 1,768 | 1.5% |
| Colombia | 694 | 0.6% |
| Costa Rica | 109 | 0.1% |
| Cuba | 215 | 0.2% |
| Czechoslovakia | 59 | 0.1% |
| Denmark | 7 | 0.0% |
| Dominican Republic | 90 | 0.1% |
| Eastern Africa | 233 | 0.2% |
| Eastern Asia | 1,961 | 1.7% |
| Eastern Europe | 1,025 | 0.9% |
| Ecuador | 215 | 0.2% |
| Egypt | 35 | 0.0% |
| El Salvador | 365 | 0.3% |
| England | 566 | 0.5% |
| Ethiopia | 60 | 0.1% |
| Europe | 3,994 | 3.4% |
| France | 80 | 0.1% |
| Germany | 203 | 0.2% |
| Ghana | 29 | 0.0% |
| Greece | 52 | 0.0% |
| Guatemala | 257 | 0.2% |
| Guyana | 14 | 0.0% |
| Honduras | 183 | 0.2% |
| Hong Kong | 143 | 0.1% |
| Hungary | 68 | 0.1% |
| India | 1,461 | 1.2% |
| Indonesia | 144 | 0.1% |
| Iran | 165 | 0.1% |
| Israel | 15 | 0.0% |
| Italy | 106 | 0.1% |
| Jamaica | 66 | 0.1% |
| Japan | 106 | 0.1% |
| Kazakhstan | 19 | 0.0% |
| Kenya | 72 | 0.1% |
| Korea | 87 | 0.1% |
| Laos | 11 | 0.0% |
| Latin America | 10,586 | 8.9% |
| Lebanon | 74 | 0.1% |
| Malaysia | 216 | 0.2% |
| Mexico | 5,255 | 4.4% |
| Middle Africa | 11 | 0.0% |
| Moldova | 32 | 0.0% |
| Netherlands | 148 | 0.1% |
| Nicaragua | 28 | 0.0% |
| Nigeria | 53 | 0.0% |
| Northern Africa | 53 | 0.0% |
| Northern Europe | 2,039 | 1.7% |
| Norway | 117 | 0.1% |
| Oceania | 507 | 0.4% |
| Pakistan | 280 | 0.2% |
| Panama | 75 | 0.1% |
| Peru | 273 | 0.2% |
| Philippines | 248 | 0.2% |
| Poland | 24 | 0.0% |
| Portugal | 13 | 0.0% |
| Russia | 416 | 0.4% |
| Scotland | 227 | 0.2% |
| Senegal | 79 | 0.1% |
| Serbia | 31 | 0.0% |
| Singapore | 160 | 0.1% |
| South Africa | 274 | 0.2% |
| South America | 3,799 | 3.2% |
| South Central Asia | 2,021 | 1.7% |
| South Eastern Asia | 1,489 | 1.3% |
| Southern Europe | 341 | 0.3% |
| Spain | 170 | 0.1% |
| Sri Lanka | 85 | 0.1% |
| Switzerland | 90 | 0.1% |
| Syria | 18 | 0.0% |
| Taiwan | 113 | 0.1% |
| Thailand | 127 | 0.1% |
| Trinidad and Tobago | 113 | 0.1% |
| Turkey | 401 | 0.3% |
| Ukraine | 211 | 0.2% |
| Uruguay | 123 | 0.1% |
| Venezuela | 1,122 | 0.9% |
| Vietnam | 576 | 0.5% |
| Western Africa | 161 | 0.1% |
| Western Asia | 725 | 0.6% |
| Western Europe | 589 | 0.5% |
| Yemen | 72 | 0.1% |
| Zimbabwe | 40 | 0.0% | View All 97 Rows |
Sex and Age in The Woodlands
Sex and Age in The Woodlands
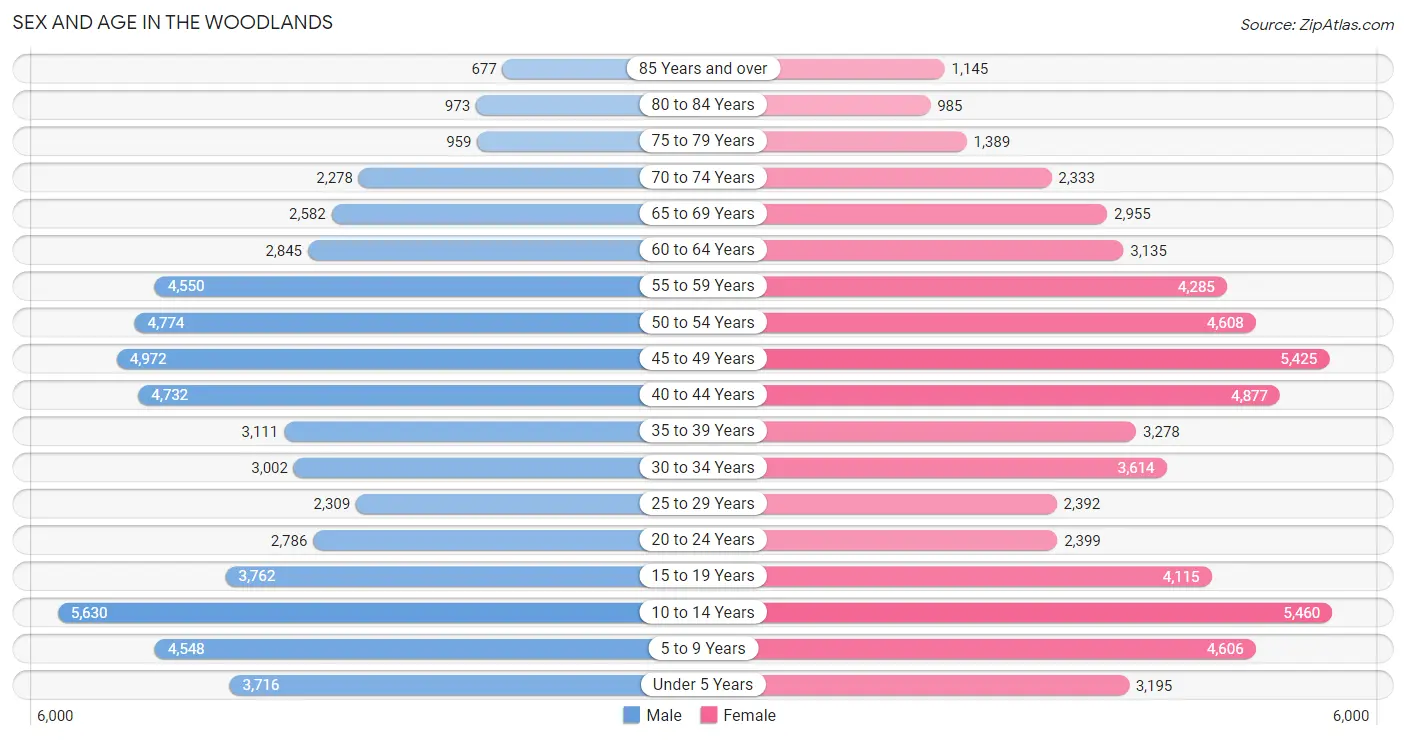
The most populous age groups in The Woodlands are 10 to 14 Years (5,630 | 9.7%) for men and 10 to 14 Years (5,460 | 9.1%) for women.
| Age Bracket | Male | Female |
| Under 5 Years | 3,716 (6.4%) | 3,195 (5.3%) |
| 5 to 9 Years | 4,548 (7.8%) | 4,606 (7.6%) |
| 10 to 14 Years | 5,630 (9.7%) | 5,460 (9.1%) |
| 15 to 19 Years | 3,762 (6.5%) | 4,115 (6.8%) |
| 20 to 24 Years | 2,786 (4.8%) | 2,399 (4.0%) |
| 25 to 29 Years | 2,309 (4.0%) | 2,392 (4.0%) |
| 30 to 34 Years | 3,002 (5.2%) | 3,614 (6.0%) |
| 35 to 39 Years | 3,111 (5.3%) | 3,278 (5.4%) |
| 40 to 44 Years | 4,732 (8.1%) | 4,877 (8.1%) |
| 45 to 49 Years | 4,972 (8.5%) | 5,425 (9.0%) |
| 50 to 54 Years | 4,774 (8.2%) | 4,608 (7.6%) |
| 55 to 59 Years | 4,550 (7.8%) | 4,285 (7.1%) |
| 60 to 64 Years | 2,845 (4.9%) | 3,135 (5.2%) |
| 65 to 69 Years | 2,582 (4.4%) | 2,955 (4.9%) |
| 70 to 74 Years | 2,278 (3.9%) | 2,333 (3.9%) |
| 75 to 79 Years | 959 (1.7%) | 1,389 (2.3%) |
| 80 to 84 Years | 973 (1.7%) | 985 (1.6%) |
| 85 Years and over | 677 (1.2%) | 1,145 (1.9%) |
| Total | 58,206 (100.0%) | 60,196 (100.0%) |
Families and Households in The Woodlands
Median Family Size in The Woodlands
The median family size in The Woodlands is 3.20 persons per family, with married-couple families (28,693 | 88.2%) accounting for the largest median family size of 3.26 persons per family. On the other hand, single male/father families (832 | 2.6%) represent the smallest median family size with 2.43 persons per family.

| Family Type | # Families | Family Size |
| Married-Couple | 28,693 (88.2%) | 3.26 |
| Single Male/Father | 832 (2.6%) | 2.43 |
| Single Female/Mother | 2,995 (9.2%) | 2.85 |
| Total Families | 32,520 (100.0%) | 3.20 |
Median Household Size in The Woodlands
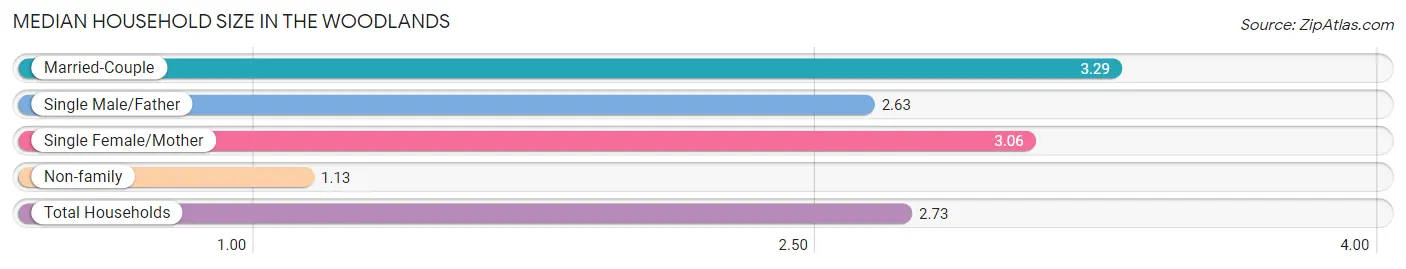
The median household size in The Woodlands is 2.73 persons per household, with married-couple households (28,693 | 66.5%) accounting for the largest median household size of 3.29 persons per household. non-family households (10,644 | 24.7%) represent the smallest median household size with 1.13 persons per household.
| Household Type | # Households | Household Size |
| Married-Couple | 28,693 (66.5%) | 3.29 |
| Single Male/Father | 832 (1.9%) | 2.63 |
| Single Female/Mother | 2,995 (6.9%) | 3.06 |
| Non-family | 10,644 (24.7%) | 1.13 |
| Total Households | 43,164 (100.0%) | 2.73 |
Household Size by Marriage Status in The Woodlands
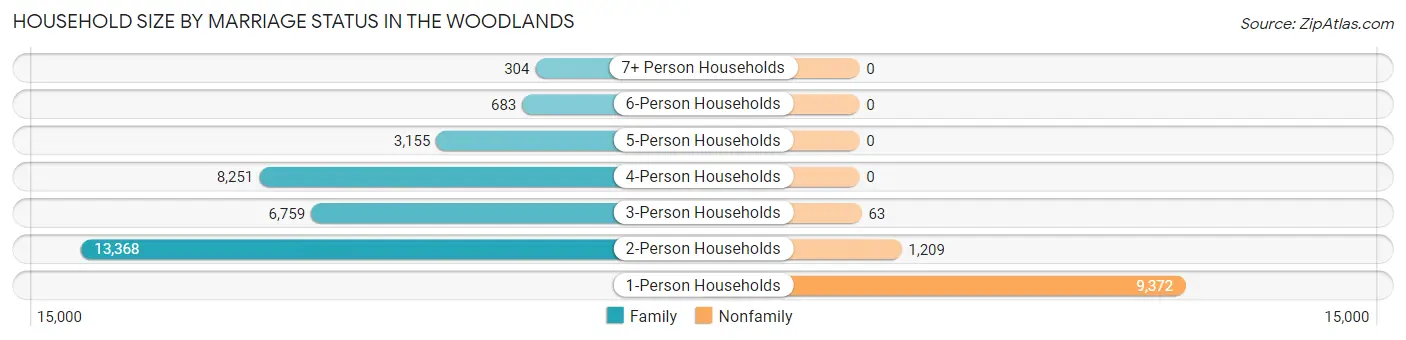
Out of a total of 43,164 households in The Woodlands, 32,520 (75.3%) are family households, while 10,644 (24.7%) are nonfamily households. The most numerous type of family households are 2-person households, comprising 13,368, and the most common type of nonfamily households are 1-person households, comprising 9,372.
| Household Size | Family Households | Nonfamily Households |
| 1-Person Households | - | 9,372 (21.7%) |
| 2-Person Households | 13,368 (31.0%) | 1,209 (2.8%) |
| 3-Person Households | 6,759 (15.7%) | 63 (0.2%) |
| 4-Person Households | 8,251 (19.1%) | 0 (0.0%) |
| 5-Person Households | 3,155 (7.3%) | 0 (0.0%) |
| 6-Person Households | 683 (1.6%) | 0 (0.0%) |
| 7+ Person Households | 304 (0.7%) | 0 (0.0%) |
| Total | 32,520 (75.3%) | 10,644 (24.7%) |
Female Fertility in The Woodlands
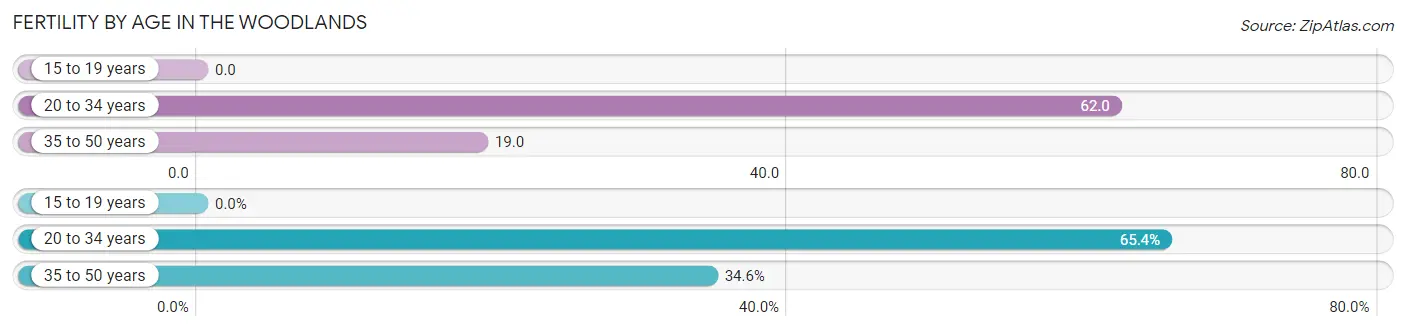
Fertility by Age in The Woodlands
Average fertility rate in The Woodlands is 29.0 births per 1,000 women. Women in the age bracket of 20 to 34 years have the highest fertility rate with 62.0 births per 1,000 women. Women in the age bracket of 20 to 34 years acount for 65.4% of all women with births.
| Age Bracket | Women with Births | Births / 1,000 Women |
| 15 to 19 years | 0 (0.0%) | 0.0 |
| 20 to 34 years | 520 (65.4%) | 62.0 |
| 35 to 50 years | 275 (34.6%) | 19.0 |
| Total | 795 (100.0%) | 29.0 |
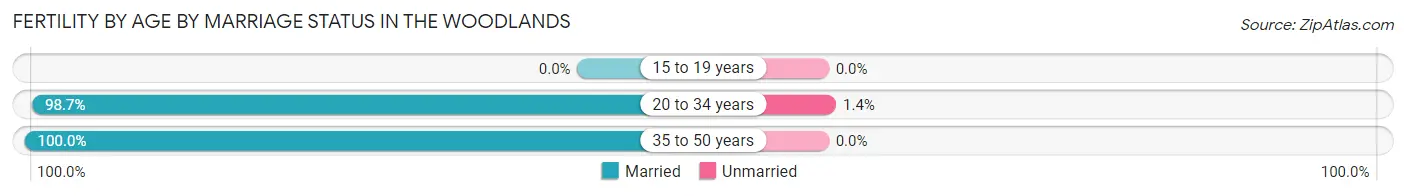
Fertility by Age by Marriage Status in The Woodlands
99.1% of women with births (795) in The Woodlands are married. The highest percentage of unmarried women with births falls into 20 to 34 years age bracket with 1.3% of them unmarried at the time of birth, while the lowest percentage of unmarried women with births belong to 35 to 50 years age bracket with 0.0% of them unmarried.
| Age Bracket | Married | Unmarried |
| 15 to 19 years | 0 (0.0%) | 0 (0.0%) |
| 20 to 34 years | 513 (98.7%) | 7 (1.3%) |
| 35 to 50 years | 275 (100.0%) | 0 (0.0%) |
| Total | 788 (99.1%) | 7 (0.9%) |
Fertility by Education in The Woodlands
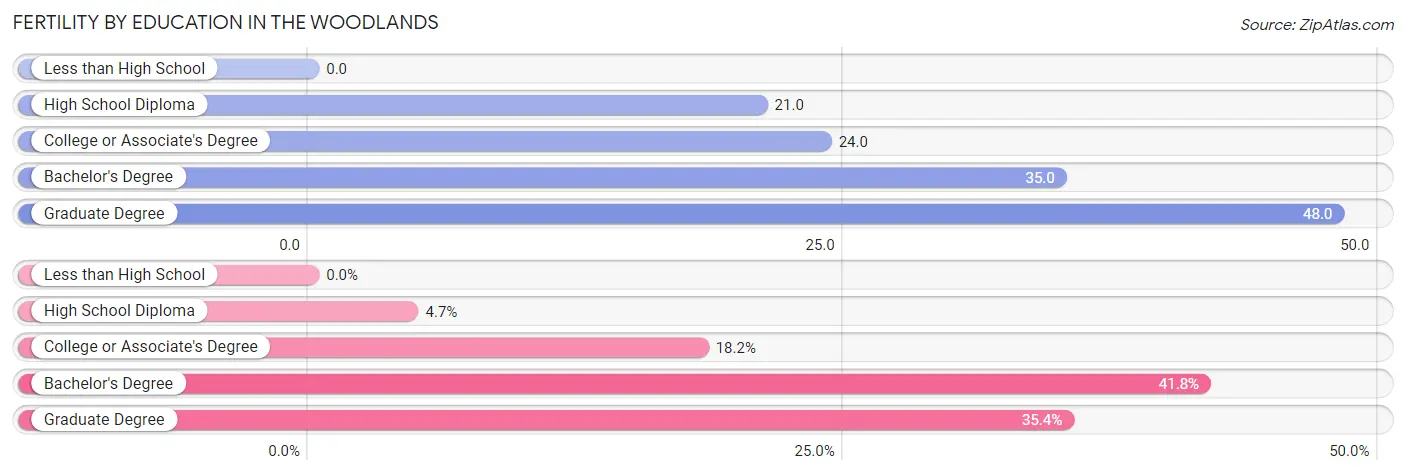
| Educational Attainment | Women with Births | Births / 1,000 Women |
| Less than High School | 0 (0.0%) | 0.0 |
| High School Diploma | 37 (4.6%) | 21.0 |
| College or Associate's Degree | 145 (18.2%) | 24.0 |
| Bachelor's Degree | 332 (41.8%) | 35.0 |
| Graduate Degree | 281 (35.3%) | 48.0 |
| Total | 795 (100.0%) | 29.0 |
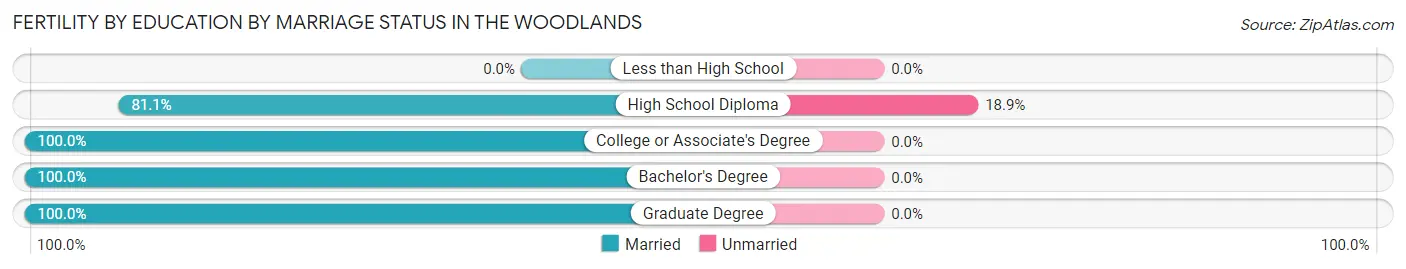
Fertility by Education by Marriage Status in The Woodlands
0.9% of women with births in The Woodlands are unmarried. Women with the educational attainment of college or associate's degree are most likely to be married with 100.0% of them married at childbirth, while women with the educational attainment of high school diploma are least likely to be married with 18.9% of them unmarried at childbirth.
| Educational Attainment | Married | Unmarried |
| Less than High School | 0 (0.0%) | 0 (0.0%) |
| High School Diploma | 30 (81.1%) | 7 (18.9%) |
| College or Associate's Degree | 145 (100.0%) | 0 (0.0%) |
| Bachelor's Degree | 332 (100.0%) | 0 (0.0%) |
| Graduate Degree | 281 (100.0%) | 0 (0.0%) |
| Total | 788 (99.1%) | 7 (0.9%) |
Employment Characteristics in The Woodlands
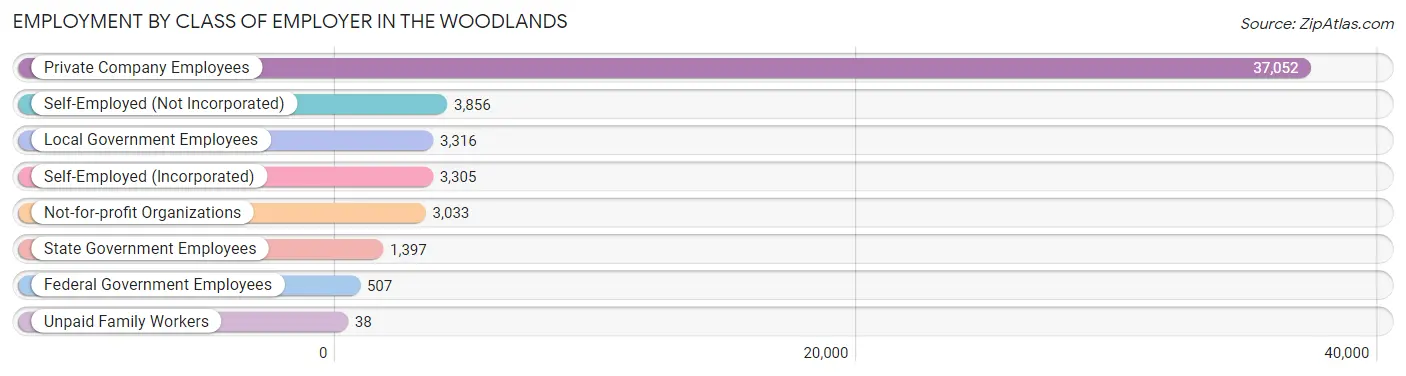
Employment by Class of Employer in The Woodlands
Among the 52,504 employed individuals in The Woodlands, private company employees (37,052 | 70.6%), self-employed (not incorporated) (3,856 | 7.3%), and local government employees (3,316 | 6.3%) make up the most common classes of employment.
| Employer Class | # Employees | % Employees |
| Private Company Employees | 37,052 | 70.6% |
| Self-Employed (Incorporated) | 3,305 | 6.3% |
| Self-Employed (Not Incorporated) | 3,856 | 7.3% |
| Not-for-profit Organizations | 3,033 | 5.8% |
| Local Government Employees | 3,316 | 6.3% |
| State Government Employees | 1,397 | 2.7% |
| Federal Government Employees | 507 | 1.0% |
| Unpaid Family Workers | 38 | 0.1% |
| Total | 52,504 | 100.0% |
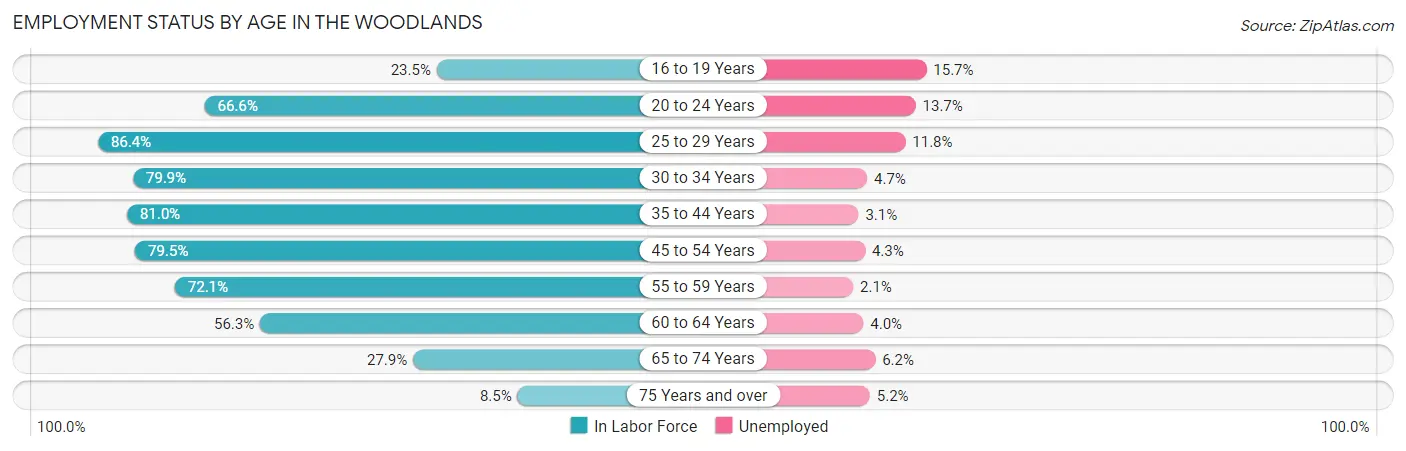
Employment Status by Age in The Woodlands
According to the labor force statistics for The Woodlands, out of the total population over 16 years of age (89,736), 62.5% or 56,085 individuals are in the labor force, with 5.3% or 2,973 of them unemployed. The age group with the highest labor force participation rate is 25 to 29 years, with 86.4% or 4,062 individuals in the labor force. Within the labor force, the 16 to 19 years age range has the highest percentage of unemployed individuals, with 15.7% or 235 of them being unemployed.
| Age Bracket | In Labor Force | Unemployed |
| 16 to 19 Years | 1,496 (23.5%) | 235 (15.7%) |
| 20 to 24 Years | 3,453 (66.6%) | 473 (13.7%) |
| 25 to 29 Years | 4,062 (86.4%) | 479 (11.8%) |
| 30 to 34 Years | 5,286 (79.9%) | 248 (4.7%) |
| 35 to 44 Years | 12,958 (81.0%) | 402 (3.1%) |
| 45 to 54 Years | 15,724 (79.5%) | 676 (4.3%) |
| 55 to 59 Years | 6,370 (72.1%) | 134 (2.1%) |
| 60 to 64 Years | 3,367 (56.3%) | 135 (4.0%) |
| 65 to 74 Years | 2,831 (27.9%) | 176 (6.2%) |
| 75 Years and over | 521 (8.5%) | 27 (5.2%) |
| Total | 56,085 (62.5%) | 2,973 (5.3%) |
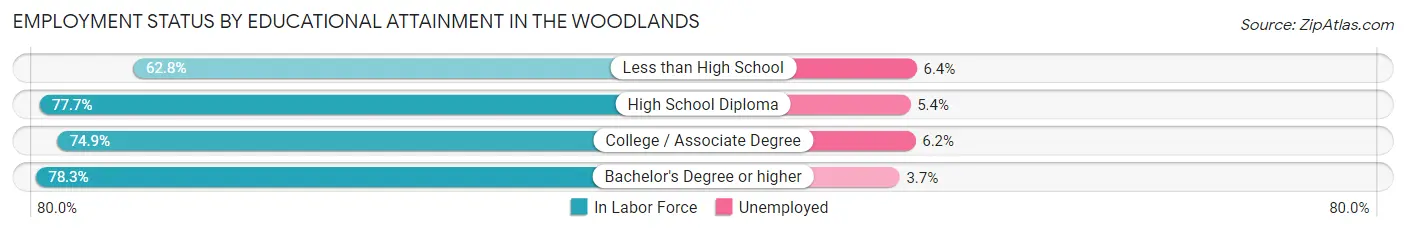
Employment Status by Educational Attainment in The Woodlands
According to labor force statistics for The Woodlands, 77.2% of individuals (47,794) out of the total population between 25 and 64 years of age (61,909) are in the labor force, with 4.3% or 2,055 of them being unemployed. The group with the highest labor force participation rate are those with the educational attainment of bachelor's degree or higher, with 78.3% or 33,902 individuals in the labor force. Within the labor force, individuals with less than high school education have the highest percentage of unemployment, with 6.4% or 64 of them being unemployed.
| Educational Attainment | In Labor Force | Unemployed |
| Less than High School | 999 (62.8%) | 102 (6.4%) |
| High School Diploma | 3,572 (77.7%) | 248 (5.4%) |
| College / Associate Degree | 9,306 (74.9%) | 770 (6.2%) |
| Bachelor's Degree or higher | 33,902 (78.3%) | 1,602 (3.7%) |
| Total | 47,794 (77.2%) | 2,662 (4.3%) |
Employment Occupations by Sex in The Woodlands
Management, Business, Science and Arts Occupations
The most common Management, Business, Science and Arts occupations in The Woodlands are Management (11,398 | 21.5%), Community & Social Service (7,347 | 13.9%), Computers, Engineering & Science (6,790 | 12.8%), Business & Financial (5,382 | 10.2%), and Education Instruction & Library (4,316 | 8.1%).
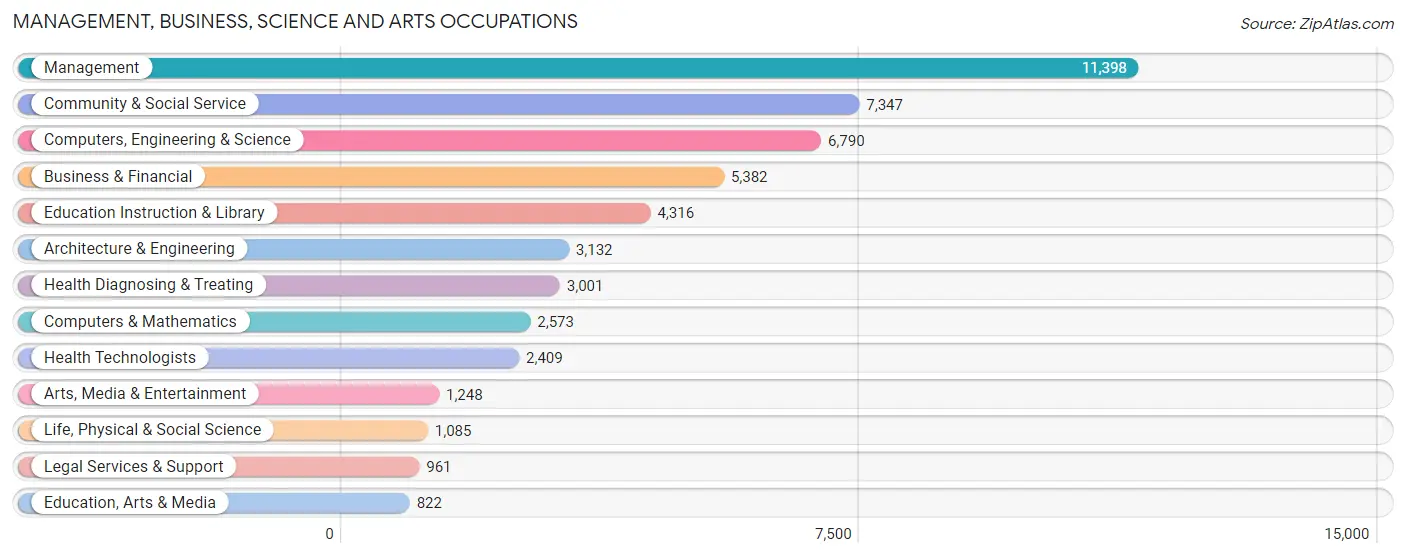
Management, Business, Science and Arts Occupations by Sex
Within the Management, Business, Science and Arts occupations in The Woodlands, the most male-oriented occupations are Architecture & Engineering (86.6%), Computers, Engineering & Science (80.6%), and Computers & Mathematics (80.2%), while the most female-oriented occupations are Education Instruction & Library (84.9%), Education, Arts & Media (78.8%), and Health Technologists (74.3%).
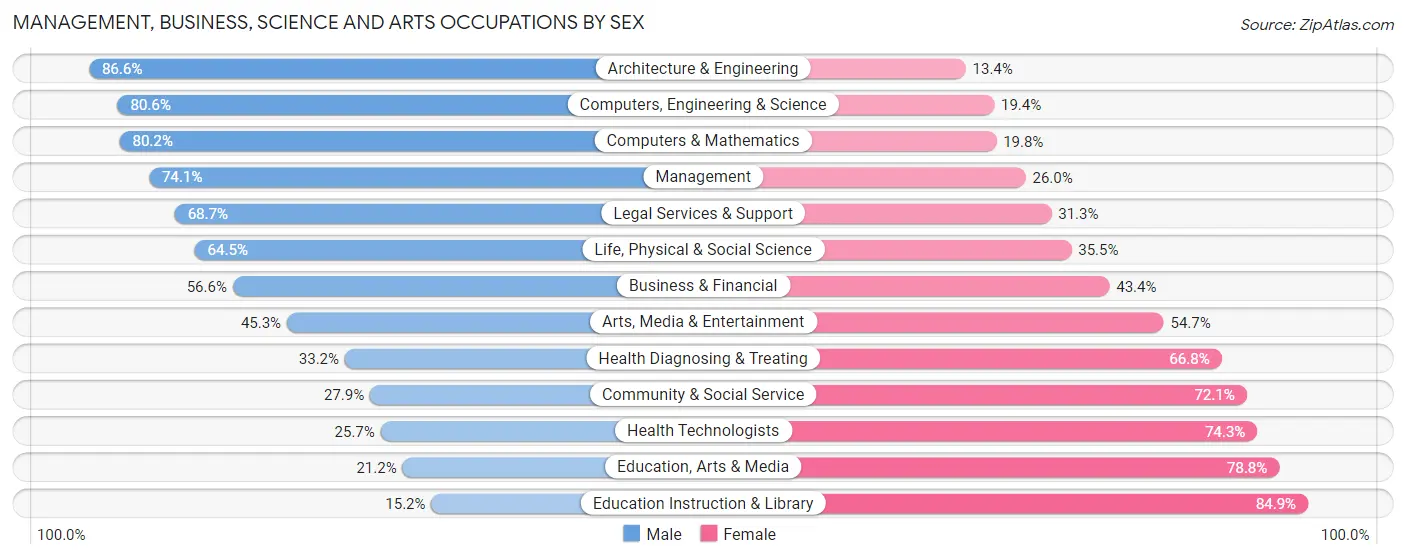
| Occupation | Male | Female |
| Management | 8,440 (74.1%) | 2,958 (26.0%) |
| Business & Financial | 3,045 (56.6%) | 2,337 (43.4%) |
| Computers, Engineering & Science | 5,474 (80.6%) | 1,316 (19.4%) |
| Computers & Mathematics | 2,063 (80.2%) | 510 (19.8%) |
| Architecture & Engineering | 2,711 (86.6%) | 421 (13.4%) |
| Life, Physical & Social Science | 700 (64.5%) | 385 (35.5%) |
| Community & Social Service | 2,053 (27.9%) | 5,294 (72.1%) |
| Education, Arts & Media | 174 (21.2%) | 648 (78.8%) |
| Legal Services & Support | 660 (68.7%) | 301 (31.3%) |
| Education Instruction & Library | 654 (15.1%) | 3,662 (84.9%) |
| Arts, Media & Entertainment | 565 (45.3%) | 683 (54.7%) |
| Health Diagnosing & Treating | 996 (33.2%) | 2,005 (66.8%) |
| Health Technologists | 620 (25.7%) | 1,789 (74.3%) |
| Total (Category) | 20,008 (59.0%) | 13,910 (41.0%) |
| Total (Overall) | 30,783 (58.0%) | 22,253 (42.0%) |
Services Occupations
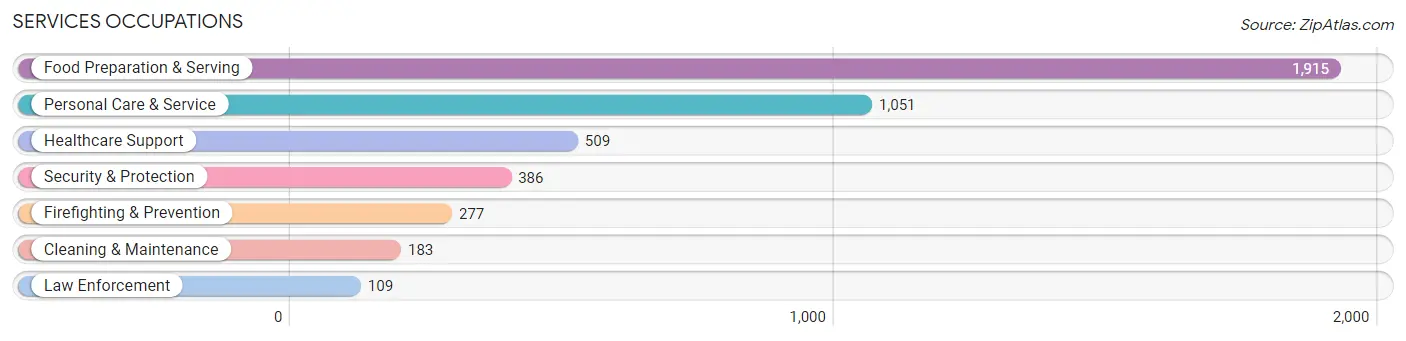
The most common Services occupations in The Woodlands are Food Preparation & Serving (1,915 | 3.6%), Personal Care & Service (1,051 | 2.0%), Healthcare Support (509 | 1.0%), Security & Protection (386 | 0.7%), and Firefighting & Prevention (277 | 0.5%).
Services Occupations by Sex
Within the Services occupations in The Woodlands, the most male-oriented occupations are Firefighting & Prevention (100.0%), Security & Protection (97.2%), and Law Enforcement (89.9%), while the most female-oriented occupations are Healthcare Support (78.6%), Personal Care & Service (70.7%), and Cleaning & Maintenance (61.8%).
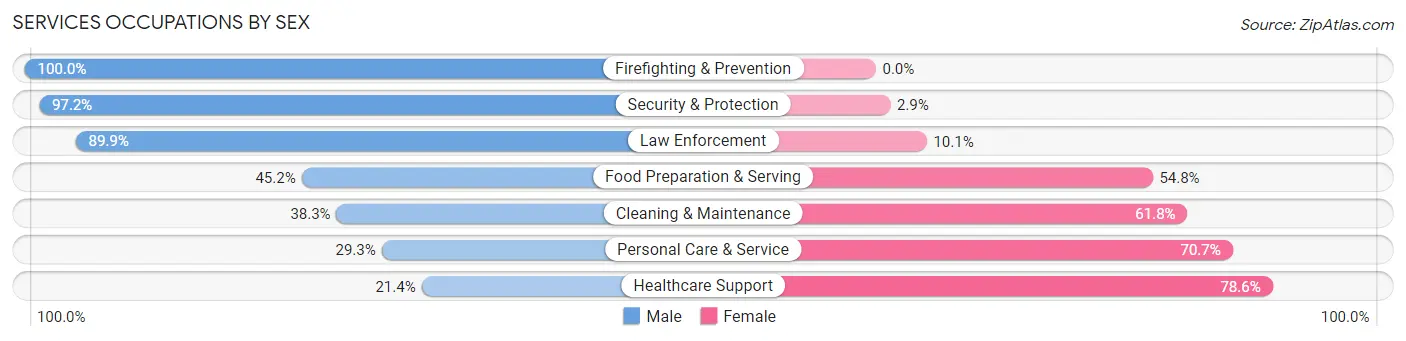
| Occupation | Male | Female |
| Healthcare Support | 109 (21.4%) | 400 (78.6%) |
| Security & Protection | 375 (97.2%) | 11 (2.9%) |
| Firefighting & Prevention | 277 (100.0%) | 0 (0.0%) |
| Law Enforcement | 98 (89.9%) | 11 (10.1%) |
| Food Preparation & Serving | 865 (45.2%) | 1,050 (54.8%) |
| Cleaning & Maintenance | 70 (38.3%) | 113 (61.8%) |
| Personal Care & Service | 308 (29.3%) | 743 (70.7%) |
| Total (Category) | 1,727 (42.7%) | 2,317 (57.3%) |
| Total (Overall) | 30,783 (58.0%) | 22,253 (42.0%) |
Sales and Office Occupations
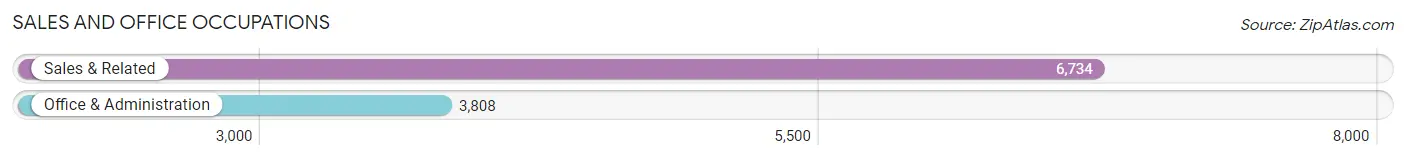
The most common Sales and Office occupations in The Woodlands are Sales & Related (6,734 | 12.7%), and Office & Administration (3,808 | 7.2%).
Sales and Office Occupations by Sex
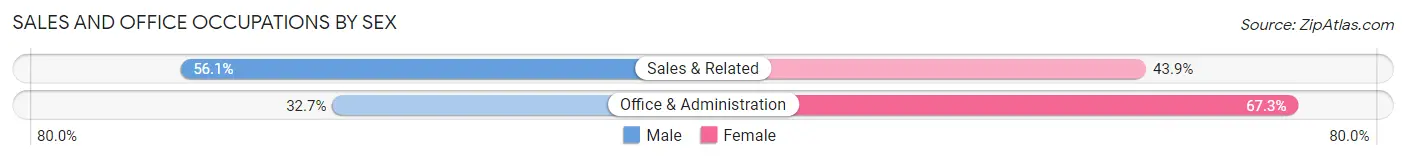
| Occupation | Male | Female |
| Sales & Related | 3,775 (56.1%) | 2,959 (43.9%) |
| Office & Administration | 1,244 (32.7%) | 2,564 (67.3%) |
| Total (Category) | 5,019 (47.6%) | 5,523 (52.4%) |
| Total (Overall) | 30,783 (58.0%) | 22,253 (42.0%) |
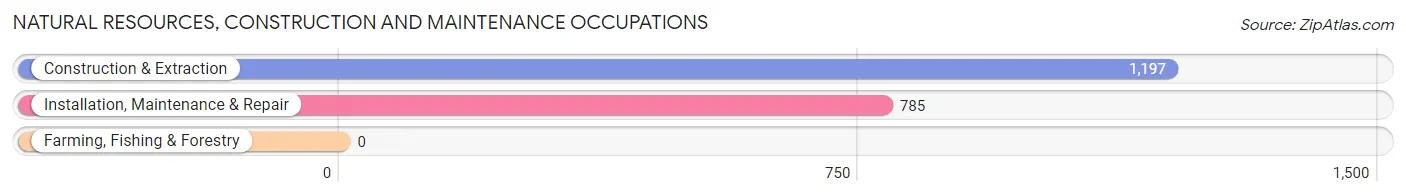
Natural Resources, Construction and Maintenance Occupations
The most common Natural Resources, Construction and Maintenance occupations in The Woodlands are Construction & Extraction (1,197 | 2.3%), and Installation, Maintenance & Repair (785 | 1.5%).
Natural Resources, Construction and Maintenance Occupations by Sex
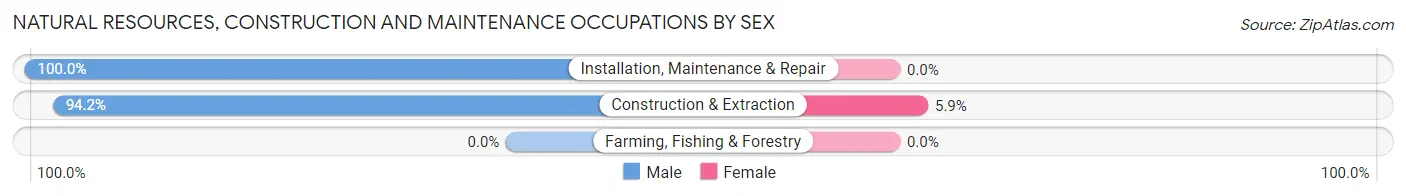
| Occupation | Male | Female |
| Farming, Fishing & Forestry | 0 (0.0%) | 0 (0.0%) |
| Construction & Extraction | 1,127 (94.2%) | 70 (5.9%) |
| Installation, Maintenance & Repair | 785 (100.0%) | 0 (0.0%) |
| Total (Category) | 1,912 (96.5%) | 70 (3.5%) |
| Total (Overall) | 30,783 (58.0%) | 22,253 (42.0%) |
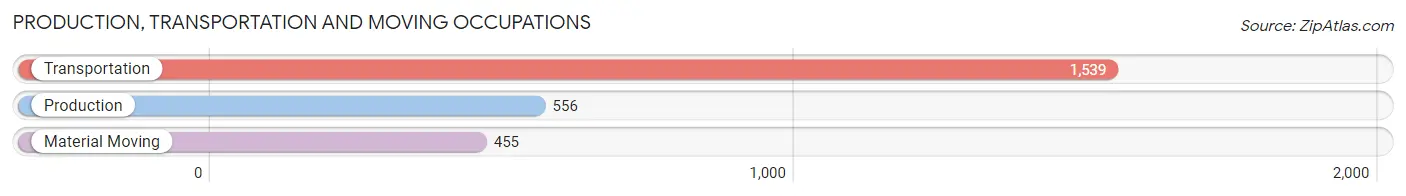
Production, Transportation and Moving Occupations
The most common Production, Transportation and Moving occupations in The Woodlands are Transportation (1,539 | 2.9%), Production (556 | 1.1%), and Material Moving (455 | 0.9%).
Production, Transportation and Moving Occupations by Sex
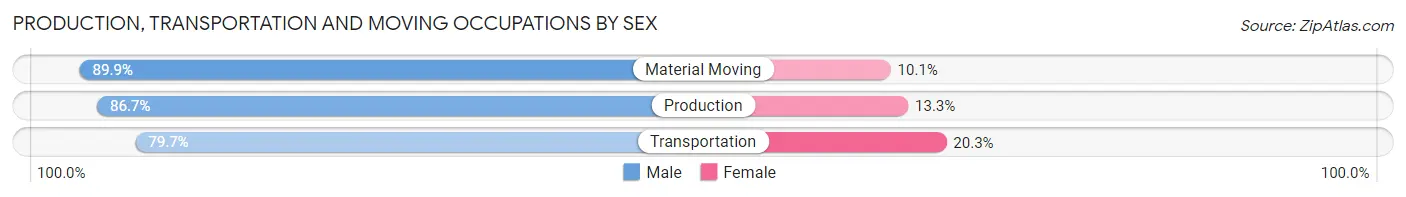
| Occupation | Male | Female |
| Production | 482 (86.7%) | 74 (13.3%) |
| Transportation | 1,226 (79.7%) | 313 (20.3%) |
| Material Moving | 409 (89.9%) | 46 (10.1%) |
| Total (Category) | 2,117 (83.0%) | 433 (17.0%) |
| Total (Overall) | 30,783 (58.0%) | 22,253 (42.0%) |
Employment Industries by Sex in The Woodlands
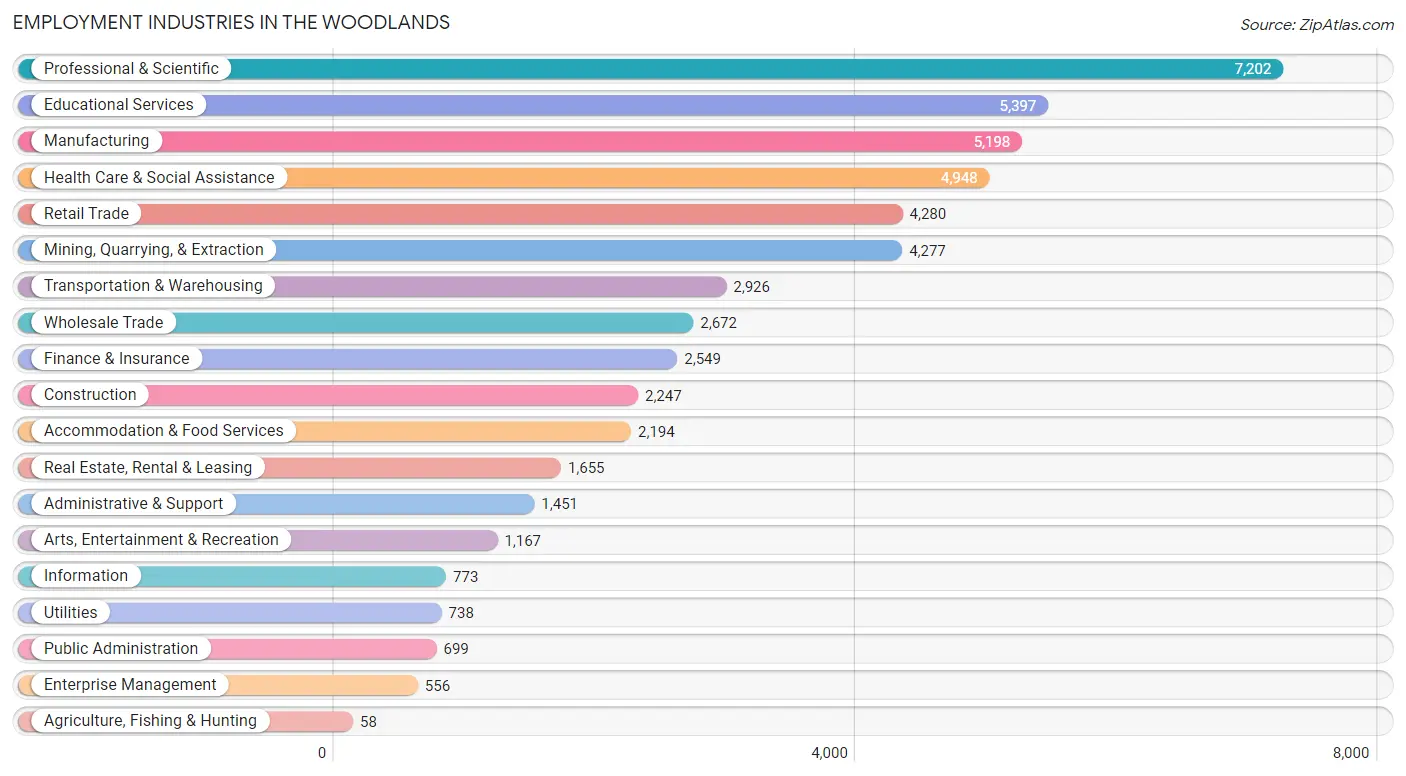
Employment Industries in The Woodlands
The major employment industries in The Woodlands include Professional & Scientific (7,202 | 13.6%), Educational Services (5,397 | 10.2%), Manufacturing (5,198 | 9.8%), Health Care & Social Assistance (4,948 | 9.3%), and Retail Trade (4,280 | 8.1%).
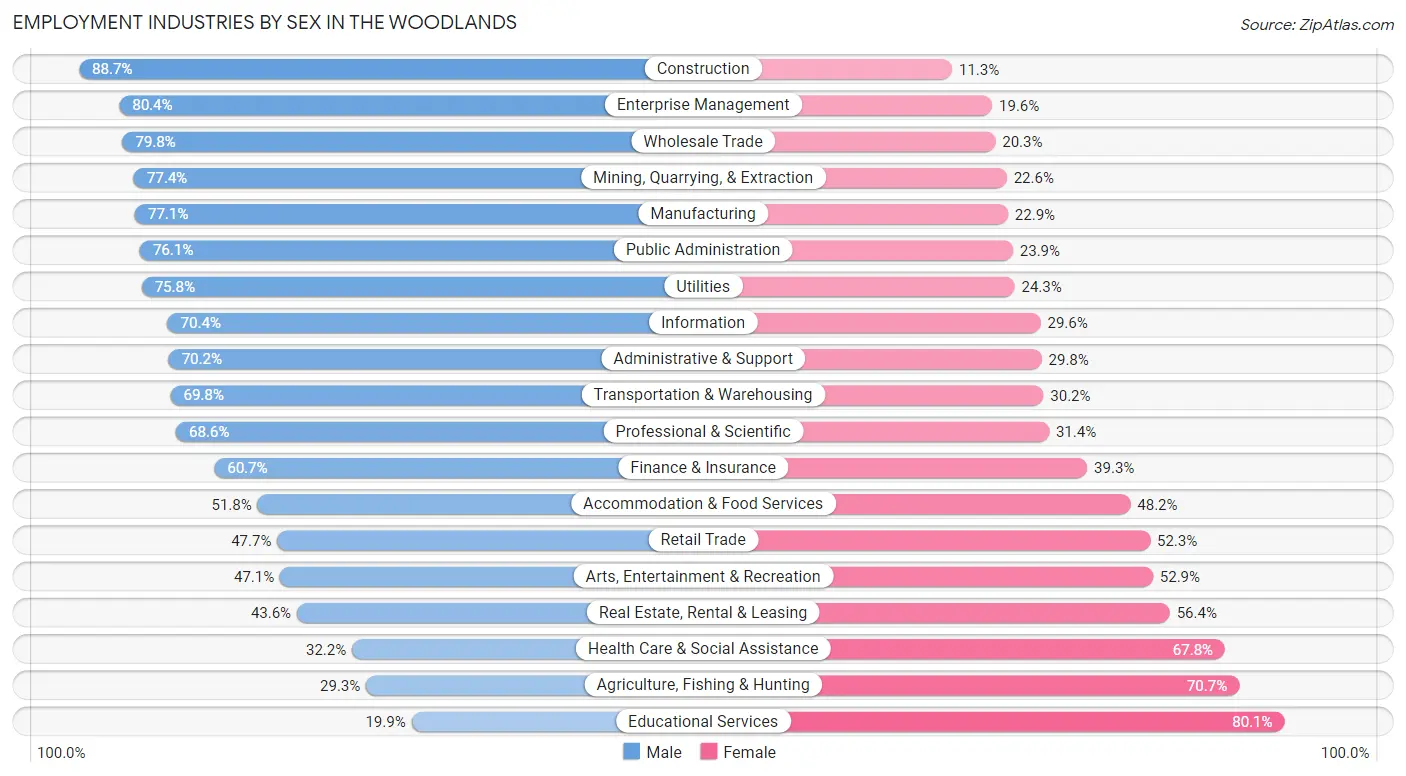
Employment Industries by Sex in The Woodlands
The The Woodlands industries that see more men than women are Construction (88.7%), Enterprise Management (80.4%), and Wholesale Trade (79.7%), whereas the industries that tend to have a higher number of women are Educational Services (80.1%), Agriculture, Fishing & Hunting (70.7%), and Health Care & Social Assistance (67.8%).
| Industry | Male | Female |
| Agriculture, Fishing & Hunting | 17 (29.3%) | 41 (70.7%) |
| Mining, Quarrying, & Extraction | 3,309 (77.4%) | 968 (22.6%) |
| Construction | 1,993 (88.7%) | 254 (11.3%) |
| Manufacturing | 4,009 (77.1%) | 1,189 (22.9%) |
| Wholesale Trade | 2,131 (79.7%) | 541 (20.3%) |
| Retail Trade | 2,042 (47.7%) | 2,238 (52.3%) |
| Transportation & Warehousing | 2,042 (69.8%) | 884 (30.2%) |
| Utilities | 559 (75.7%) | 179 (24.2%) |
| Information | 544 (70.4%) | 229 (29.6%) |
| Finance & Insurance | 1,548 (60.7%) | 1,001 (39.3%) |
| Real Estate, Rental & Leasing | 722 (43.6%) | 933 (56.4%) |
| Professional & Scientific | 4,943 (68.6%) | 2,259 (31.4%) |
| Enterprise Management | 447 (80.4%) | 109 (19.6%) |
| Administrative & Support | 1,018 (70.2%) | 433 (29.8%) |
| Educational Services | 1,075 (19.9%) | 4,322 (80.1%) |
| Health Care & Social Assistance | 1,594 (32.2%) | 3,354 (67.8%) |
| Arts, Entertainment & Recreation | 550 (47.1%) | 617 (52.9%) |
| Accommodation & Food Services | 1,136 (51.8%) | 1,058 (48.2%) |
| Public Administration | 532 (76.1%) | 167 (23.9%) |
| Total | 30,783 (58.0%) | 22,253 (42.0%) |
Education in The Woodlands
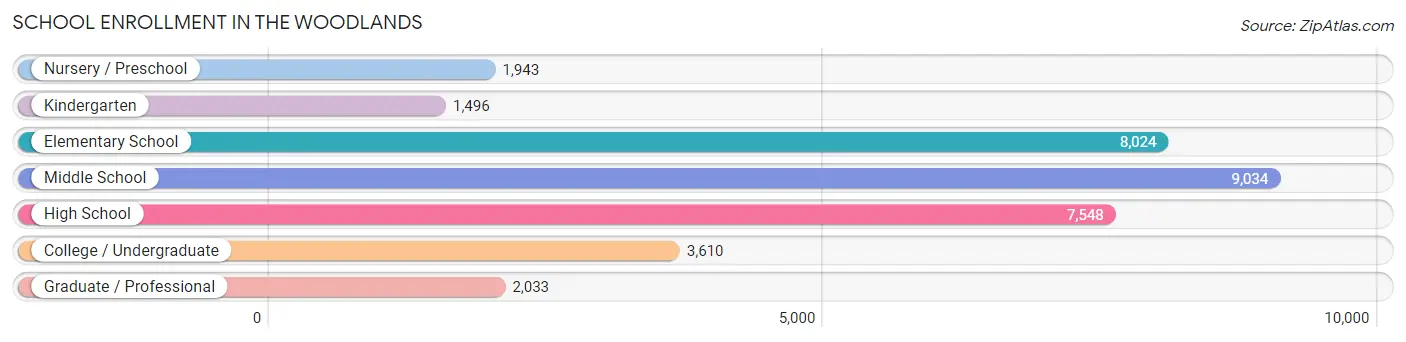
School Enrollment in The Woodlands
The most common levels of schooling among the 33,688 students in The Woodlands are middle school (9,034 | 26.8%), elementary school (8,024 | 23.8%), and high school (7,548 | 22.4%).
| School Level | # Students | % Students |
| Nursery / Preschool | 1,943 | 5.8% |
| Kindergarten | 1,496 | 4.4% |
| Elementary School | 8,024 | 23.8% |
| Middle School | 9,034 | 26.8% |
| High School | 7,548 | 22.4% |
| College / Undergraduate | 3,610 | 10.7% |
| Graduate / Professional | 2,033 | 6.0% |
| Total | 33,688 | 100.0% |
School Enrollment by Age by Funding Source in The Woodlands
Out of a total of 33,688 students who are enrolled in schools in The Woodlands, 5,828 (17.3%) attend a private institution, while the remaining 27,860 (82.7%) are enrolled in public schools. The age group of 3 to 4 year olds has the highest likelihood of being enrolled in private schools, with 1,220 (74.2% in the age bracket) enrolled. Conversely, the age group of 15 to 17 year olds has the lowest likelihood of being enrolled in a private school, with 5,100 (90.1% in the age bracket) attending a public institution.
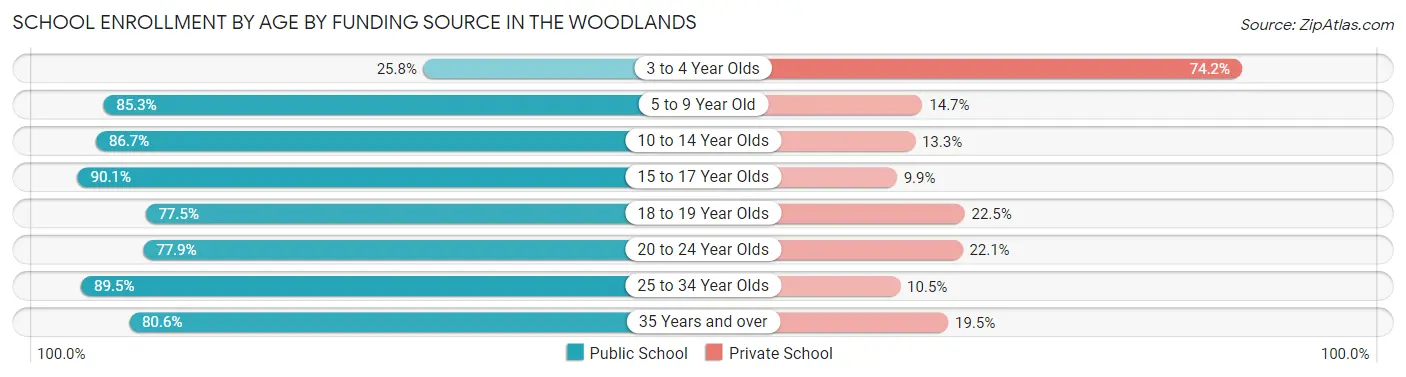
| Age Bracket | Public School | Private School |
| 3 to 4 Year Olds | 425 (25.8%) | 1,220 (74.2%) |
| 5 to 9 Year Old | 7,369 (85.3%) | 1,266 (14.7%) |
| 10 to 14 Year Olds | 9,504 (86.7%) | 1,456 (13.3%) |
| 15 to 17 Year Olds | 5,100 (90.1%) | 559 (9.9%) |
| 18 to 19 Year Olds | 1,201 (77.5%) | 349 (22.5%) |
| 20 to 24 Year Olds | 1,863 (77.9%) | 529 (22.1%) |
| 25 to 34 Year Olds | 1,089 (89.5%) | 128 (10.5%) |
| 35 Years and over | 1,313 (80.5%) | 317 (19.5%) |
| Total | 27,860 (82.7%) | 5,828 (17.3%) |
Educational Attainment by Field of Study in The Woodlands
Business (14,387 | 26.1%), engineering (9,087 | 16.5%), education (4,259 | 7.7%), science & technology (3,801 | 6.9%), and social sciences (3,220 | 5.8%) are the most common fields of study among 55,163 individuals in The Woodlands who have obtained a bachelor's degree or higher.
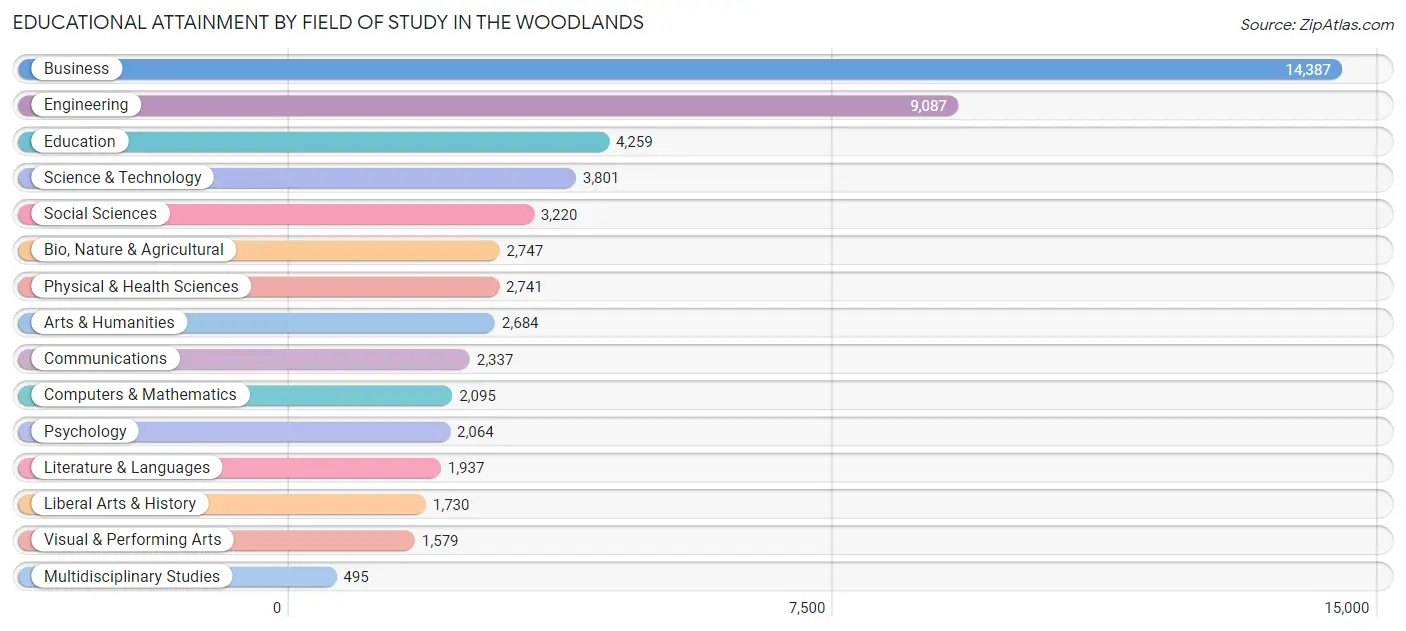
| Field of Study | # Graduates | % Graduates |
| Computers & Mathematics | 2,095 | 3.8% |
| Bio, Nature & Agricultural | 2,747 | 5.0% |
| Physical & Health Sciences | 2,741 | 5.0% |
| Psychology | 2,064 | 3.7% |
| Social Sciences | 3,220 | 5.8% |
| Engineering | 9,087 | 16.5% |
| Multidisciplinary Studies | 495 | 0.9% |
| Science & Technology | 3,801 | 6.9% |
| Business | 14,387 | 26.1% |
| Education | 4,259 | 7.7% |
| Literature & Languages | 1,937 | 3.5% |
| Liberal Arts & History | 1,730 | 3.1% |
| Visual & Performing Arts | 1,579 | 2.9% |
| Communications | 2,337 | 4.2% |
| Arts & Humanities | 2,684 | 4.9% |
| Total | 55,163 | 100.0% |
Transportation & Commute in The Woodlands
Vehicle Availability by Sex in The Woodlands
The most prevalent vehicle ownership categories in The Woodlands are males with 2 vehicles (16,580, accounting for 54.0%) and females with 2 vehicles (10,297, making up 76.1%).
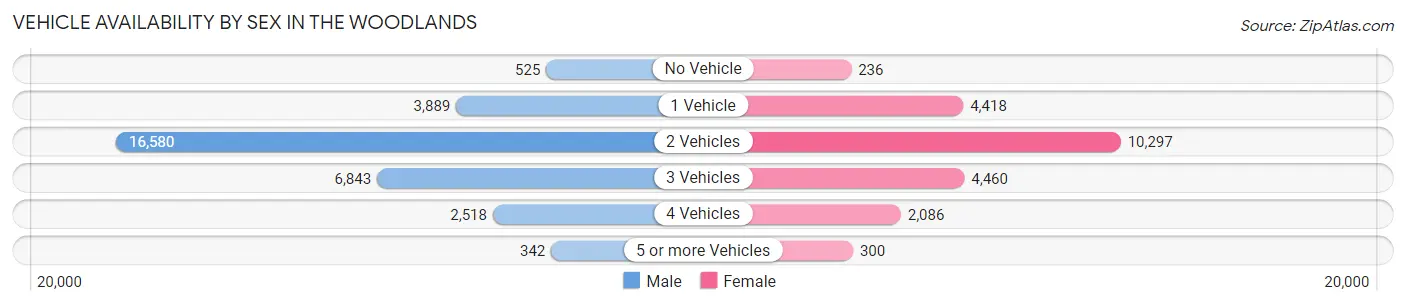
| Vehicles Available | Male | Female |
| No Vehicle | 525 (1.7%) | 236 (1.1%) |
| 1 Vehicle | 3,889 (12.7%) | 4,418 (20.3%) |
| 2 Vehicles | 16,580 (54.0%) | 10,297 (47.2%) |
| 3 Vehicles | 6,843 (22.3%) | 4,460 (20.5%) |
| 4 Vehicles | 2,518 (8.2%) | 2,086 (9.6%) |
| 5 or more Vehicles | 342 (1.1%) | 300 (1.4%) |
| Total | 30,697 (100.0%) | 21,797 (100.0%) |
Commute Time in The Woodlands
The most frequently occuring commute durations in The Woodlands are 15 to 19 minutes (7,061 commuters, 16.3%), 10 to 14 minutes (6,531 commuters, 15.1%), and 20 to 24 minutes (5,398 commuters, 12.5%).
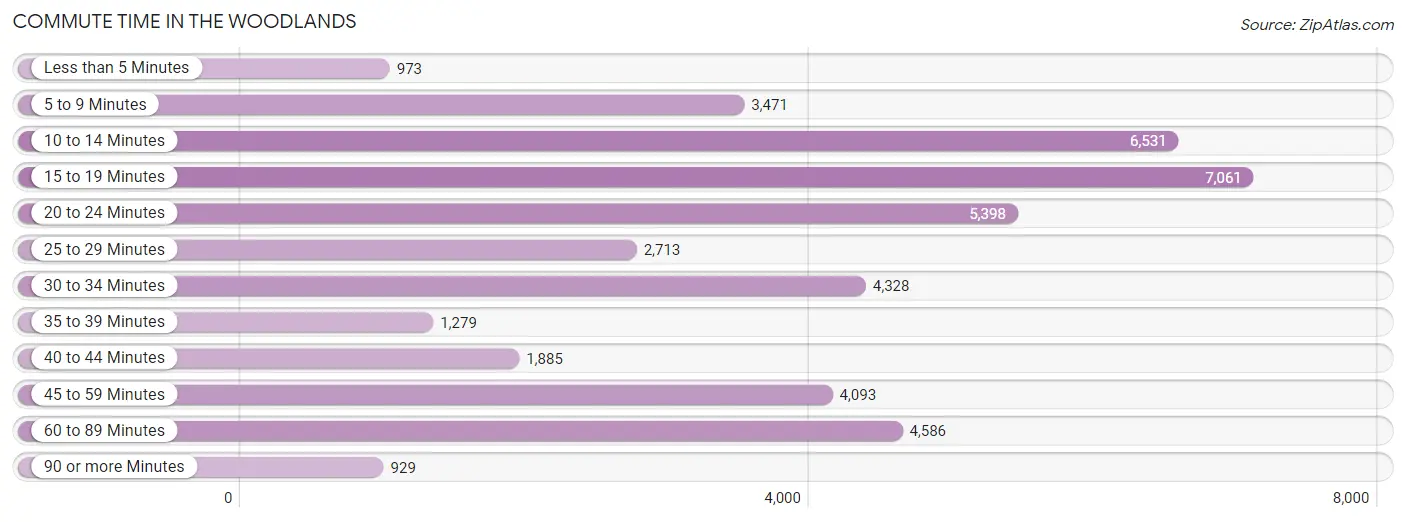
| Commute Time | # Commuters | % Commuters |
| Less than 5 Minutes | 973 | 2.2% |
| 5 to 9 Minutes | 3,471 | 8.0% |
| 10 to 14 Minutes | 6,531 | 15.1% |
| 15 to 19 Minutes | 7,061 | 16.3% |
| 20 to 24 Minutes | 5,398 | 12.5% |
| 25 to 29 Minutes | 2,713 | 6.3% |
| 30 to 34 Minutes | 4,328 | 10.0% |
| 35 to 39 Minutes | 1,279 | 3.0% |
| 40 to 44 Minutes | 1,885 | 4.4% |
| 45 to 59 Minutes | 4,093 | 9.5% |
| 60 to 89 Minutes | 4,586 | 10.6% |
| 90 or more Minutes | 929 | 2.1% |
Commute Time by Sex in The Woodlands
The most common commute times in The Woodlands are 10 to 14 minutes (3,787 commuters, 14.6%) for males and 15 to 19 minutes (3,428 commuters, 19.7%) for females.
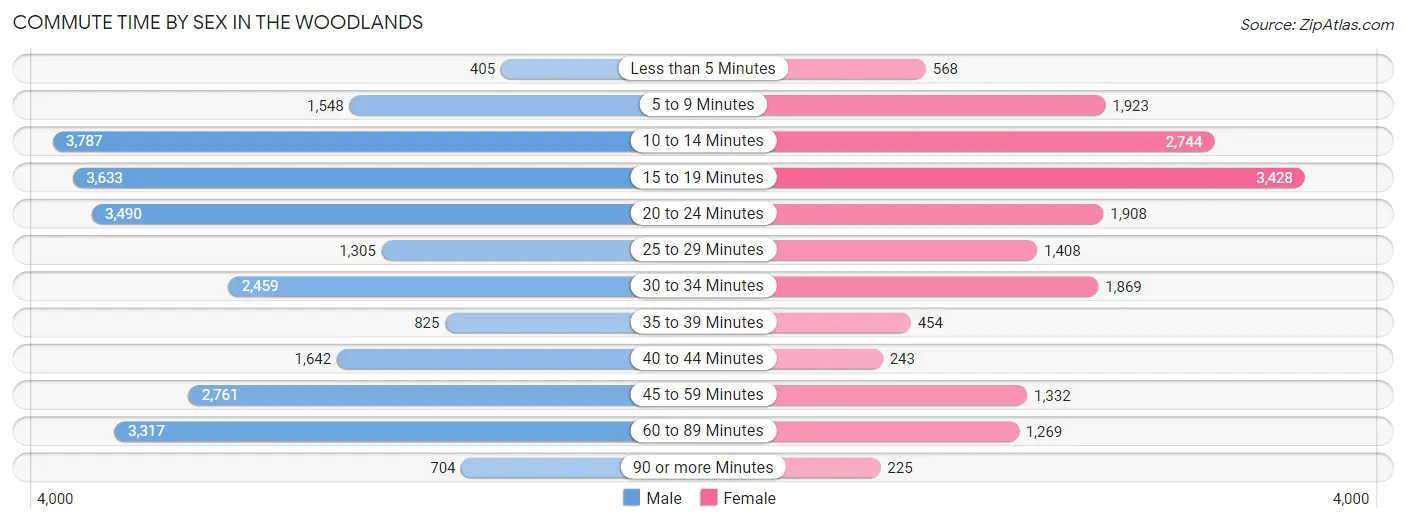
| Commute Time | Male | Female |
| Less than 5 Minutes | 405 (1.6%) | 568 (3.3%) |
| 5 to 9 Minutes | 1,548 (6.0%) | 1,923 (11.1%) |
| 10 to 14 Minutes | 3,787 (14.6%) | 2,744 (15.8%) |
| 15 to 19 Minutes | 3,633 (14.0%) | 3,428 (19.7%) |
| 20 to 24 Minutes | 3,490 (13.5%) | 1,908 (11.0%) |
| 25 to 29 Minutes | 1,305 (5.0%) | 1,408 (8.1%) |
| 30 to 34 Minutes | 2,459 (9.5%) | 1,869 (10.8%) |
| 35 to 39 Minutes | 825 (3.2%) | 454 (2.6%) |
| 40 to 44 Minutes | 1,642 (6.4%) | 243 (1.4%) |
| 45 to 59 Minutes | 2,761 (10.7%) | 1,332 (7.7%) |
| 60 to 89 Minutes | 3,317 (12.8%) | 1,269 (7.3%) |
| 90 or more Minutes | 704 (2.7%) | 225 (1.3%) |
Time of Departure to Work by Sex in The Woodlands
The most frequent times of departure to work in The Woodlands are 7:00 AM to 7:29 AM (4,888, 18.9%) for males and 7:30 AM to 7:59 AM (3,083, 17.7%) for females.
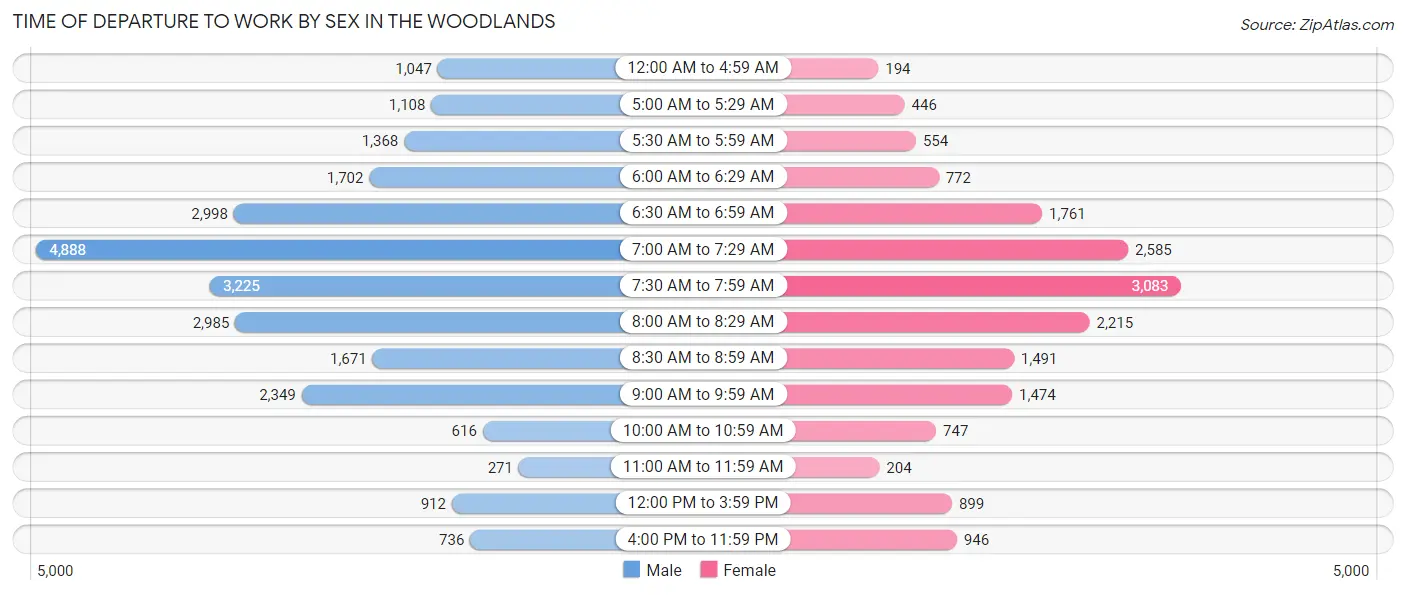
| Time of Departure | Male | Female |
| 12:00 AM to 4:59 AM | 1,047 (4.1%) | 194 (1.1%) |
| 5:00 AM to 5:29 AM | 1,108 (4.3%) | 446 (2.6%) |
| 5:30 AM to 5:59 AM | 1,368 (5.3%) | 554 (3.2%) |
| 6:00 AM to 6:29 AM | 1,702 (6.6%) | 772 (4.4%) |
| 6:30 AM to 6:59 AM | 2,998 (11.6%) | 1,761 (10.1%) |
| 7:00 AM to 7:29 AM | 4,888 (18.9%) | 2,585 (14.9%) |
| 7:30 AM to 7:59 AM | 3,225 (12.5%) | 3,083 (17.7%) |
| 8:00 AM to 8:29 AM | 2,985 (11.5%) | 2,215 (12.8%) |
| 8:30 AM to 8:59 AM | 1,671 (6.5%) | 1,491 (8.6%) |
| 9:00 AM to 9:59 AM | 2,349 (9.1%) | 1,474 (8.5%) |
| 10:00 AM to 10:59 AM | 616 (2.4%) | 747 (4.3%) |
| 11:00 AM to 11:59 AM | 271 (1.1%) | 204 (1.2%) |
| 12:00 PM to 3:59 PM | 912 (3.5%) | 899 (5.2%) |
| 4:00 PM to 11:59 PM | 736 (2.8%) | 946 (5.4%) |
| Total | 25,876 (100.0%) | 17,371 (100.0%) |
Housing Occupancy in The Woodlands
Occupancy by Ownership in The Woodlands
Of the total 43,164 dwellings in The Woodlands, owner-occupied units account for 31,338 (72.6%), while renter-occupied units make up 11,826 (27.4%).
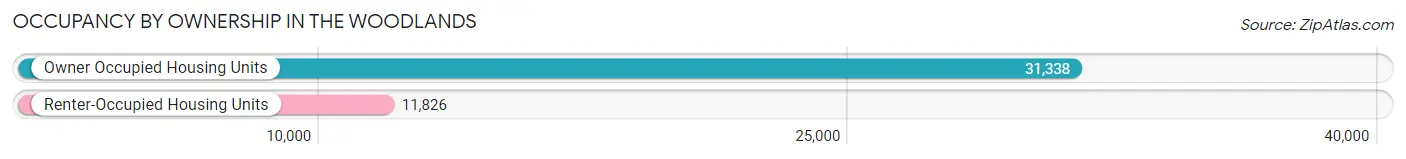
| Occupancy | # Housing Units | % Housing Units |
| Owner Occupied Housing Units | 31,338 | 72.6% |
| Renter-Occupied Housing Units | 11,826 | 27.4% |
| Total Occupied Housing Units | 43,164 | 100.0% |
Occupancy by Household Size in The Woodlands
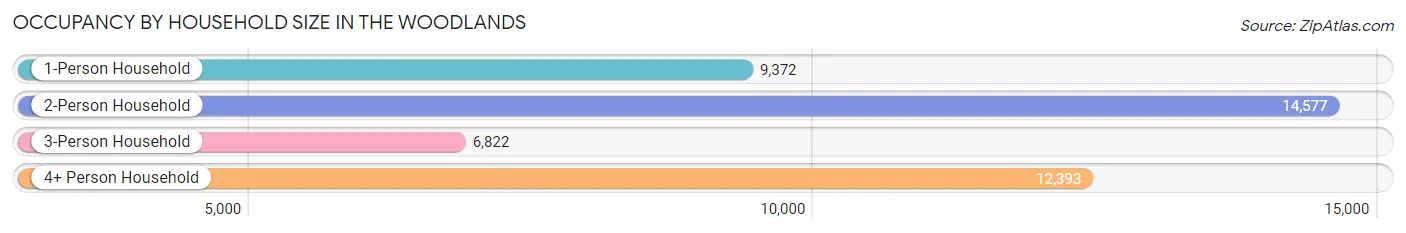
| Household Size | # Housing Units | % Housing Units |
| 1-Person Household | 9,372 | 21.7% |
| 2-Person Household | 14,577 | 33.8% |
| 3-Person Household | 6,822 | 15.8% |
| 4+ Person Household | 12,393 | 28.7% |
| Total Housing Units | 43,164 | 100.0% |
Occupancy by Ownership by Household Size in The Woodlands
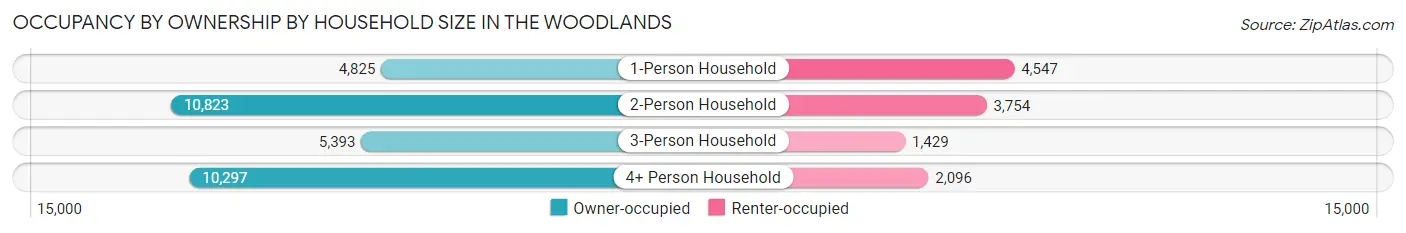
| Household Size | Owner-occupied | Renter-occupied |
| 1-Person Household | 4,825 (51.5%) | 4,547 (48.5%) |
| 2-Person Household | 10,823 (74.3%) | 3,754 (25.8%) |
| 3-Person Household | 5,393 (79.0%) | 1,429 (20.9%) |
| 4+ Person Household | 10,297 (83.1%) | 2,096 (16.9%) |
| Total Housing Units | 31,338 (72.6%) | 11,826 (27.4%) |
Occupancy by Educational Attainment in The Woodlands
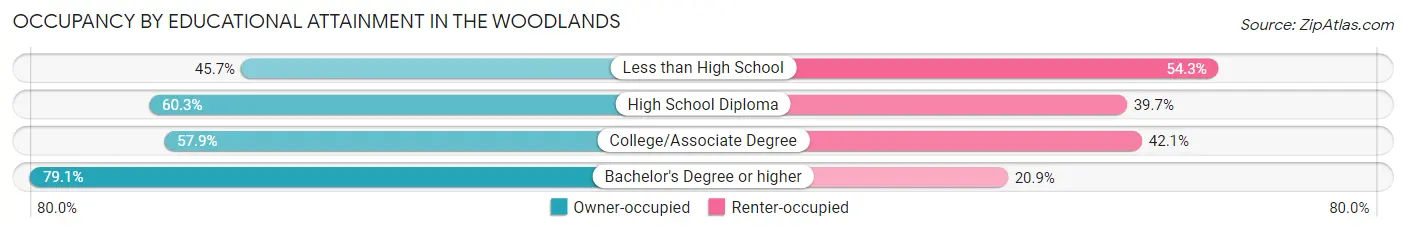
| Household Size | Owner-occupied | Renter-occupied |
| Less than High School | 360 (45.7%) | 428 (54.3%) |
| High School Diploma | 1,662 (60.3%) | 1,096 (39.7%) |
| College/Associate Degree | 5,541 (57.9%) | 4,036 (42.1%) |
| Bachelor's Degree or higher | 23,775 (79.1%) | 6,266 (20.9%) |
Occupancy by Age of Householder in The Woodlands
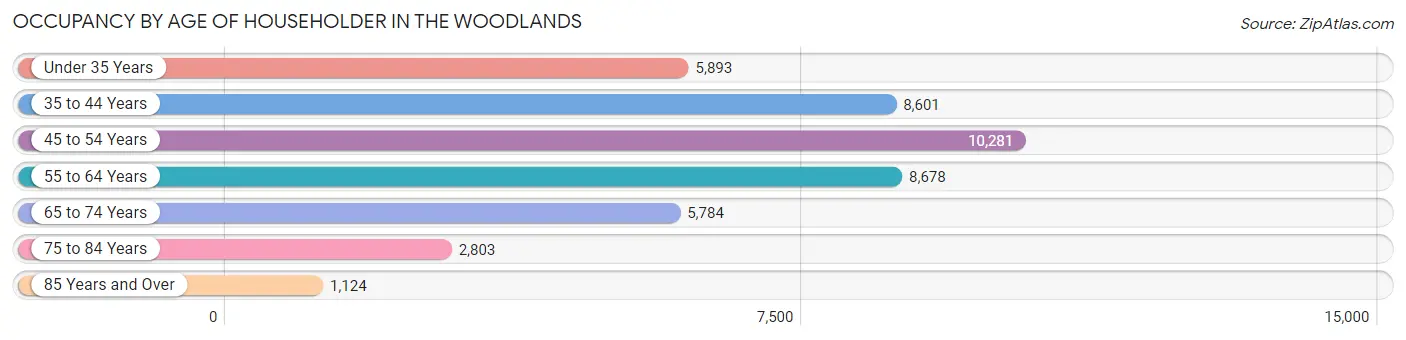
| Age Bracket | # Households | % Households |
| Under 35 Years | 5,893 | 13.7% |
| 35 to 44 Years | 8,601 | 19.9% |
| 45 to 54 Years | 10,281 | 23.8% |
| 55 to 64 Years | 8,678 | 20.1% |
| 65 to 74 Years | 5,784 | 13.4% |
| 75 to 84 Years | 2,803 | 6.5% |
| 85 Years and Over | 1,124 | 2.6% |
| Total | 43,164 | 100.0% |
Housing Finances in The Woodlands
Median Income by Occupancy in The Woodlands
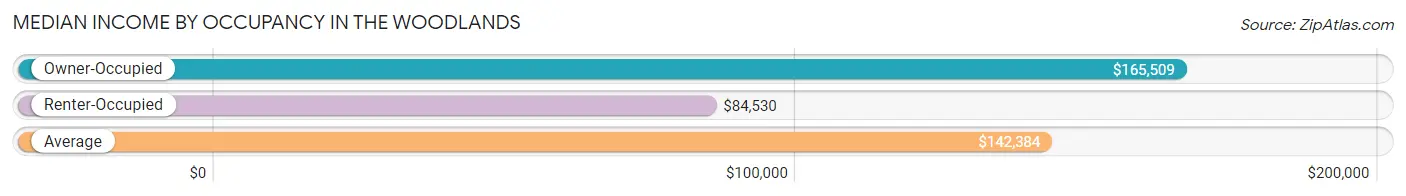
| Occupancy Type | # Households | Median Income |
| Owner-Occupied | 31,338 (72.6%) | $165,509 |
| Renter-Occupied | 11,826 (27.4%) | $84,530 |
| Average | 43,164 (100.0%) | $142,384 |
Occupancy by Householder Income Bracket in The Woodlands
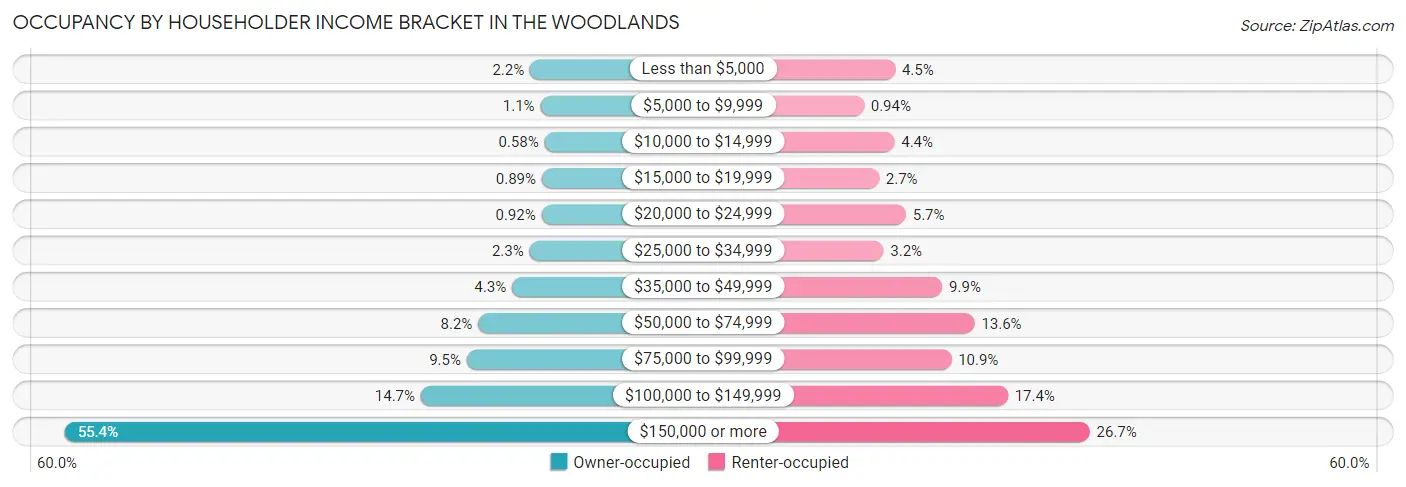
| Income Bracket | Owner-occupied | Renter-occupied |
| Less than $5,000 | 700 (2.2%) | 532 (4.5%) |
| $5,000 to $9,999 | 330 (1.1%) | 111 (0.9%) |
| $10,000 to $14,999 | 182 (0.6%) | 524 (4.4%) |
| $15,000 to $19,999 | 278 (0.9%) | 315 (2.7%) |
| $20,000 to $24,999 | 287 (0.9%) | 679 (5.7%) |
| $25,000 to $34,999 | 718 (2.3%) | 376 (3.2%) |
| $35,000 to $49,999 | 1,347 (4.3%) | 1,171 (9.9%) |
| $50,000 to $74,999 | 2,557 (8.2%) | 1,607 (13.6%) |
| $75,000 to $99,999 | 2,966 (9.5%) | 1,292 (10.9%) |
| $100,000 to $149,999 | 4,610 (14.7%) | 2,057 (17.4%) |
| $150,000 or more | 17,363 (55.4%) | 3,162 (26.7%) |
| Total | 31,338 (100.0%) | 11,826 (100.0%) |
Monthly Housing Cost Tiers in The Woodlands
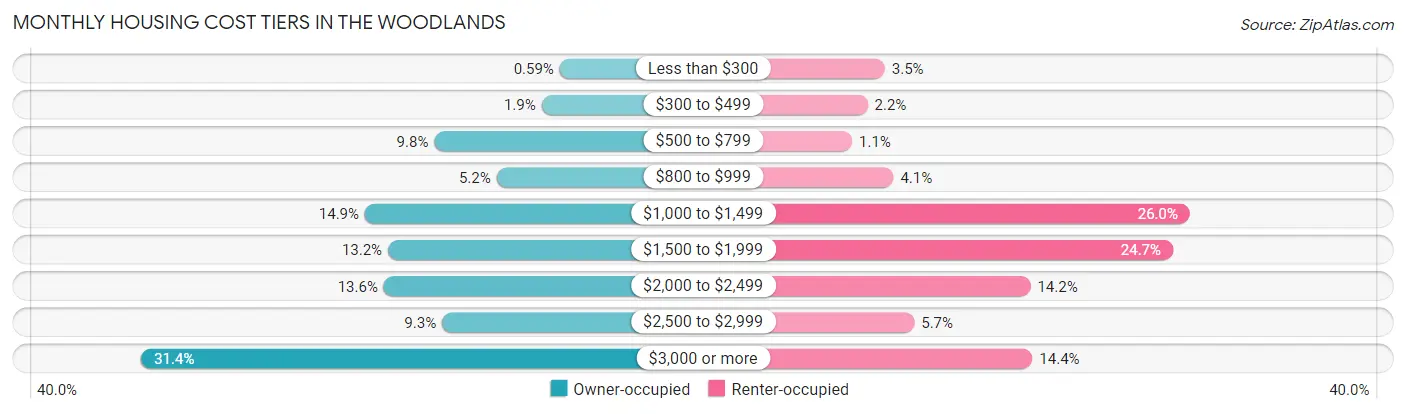
| Monthly Cost | Owner-occupied | Renter-occupied |
| Less than $300 | 186 (0.6%) | 413 (3.5%) |
| $300 to $499 | 605 (1.9%) | 263 (2.2%) |
| $500 to $799 | 3,079 (9.8%) | 128 (1.1%) |
| $800 to $999 | 1,643 (5.2%) | 489 (4.1%) |
| $1,000 to $1,499 | 4,682 (14.9%) | 3,069 (26.0%) |
| $1,500 to $1,999 | 4,150 (13.2%) | 2,921 (24.7%) |
| $2,000 to $2,499 | 4,245 (13.6%) | 1,682 (14.2%) |
| $2,500 to $2,999 | 2,902 (9.3%) | 669 (5.7%) |
| $3,000 or more | 9,846 (31.4%) | 1,698 (14.4%) |
| Total | 31,338 (100.0%) | 11,826 (100.0%) |
Physical Housing Characteristics in The Woodlands
Housing Structures in The Woodlands
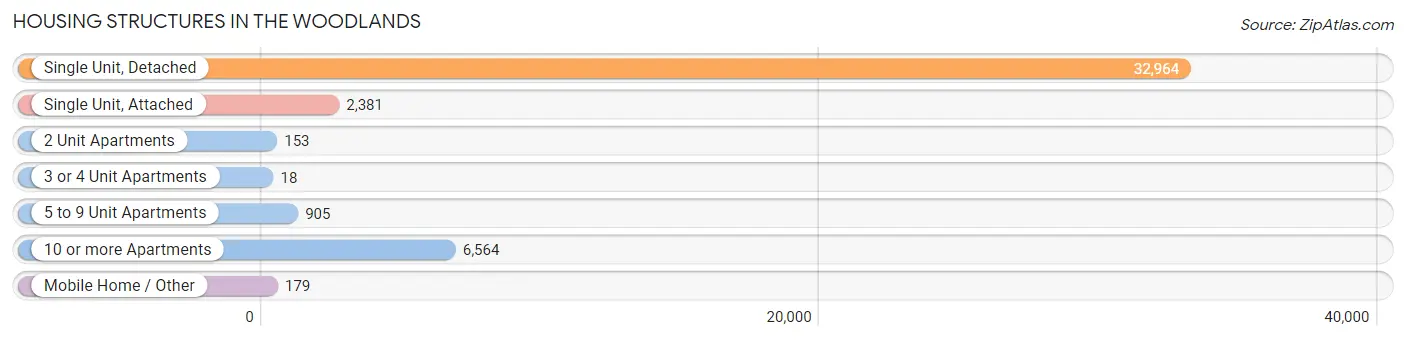
| Structure Type | # Housing Units | % Housing Units |
| Single Unit, Detached | 32,964 | 76.4% |
| Single Unit, Attached | 2,381 | 5.5% |
| 2 Unit Apartments | 153 | 0.4% |
| 3 or 4 Unit Apartments | 18 | 0.0% |
| 5 to 9 Unit Apartments | 905 | 2.1% |
| 10 or more Apartments | 6,564 | 15.2% |
| Mobile Home / Other | 179 | 0.4% |
| Total | 43,164 | 100.0% |
Housing Structures by Occupancy in The Woodlands
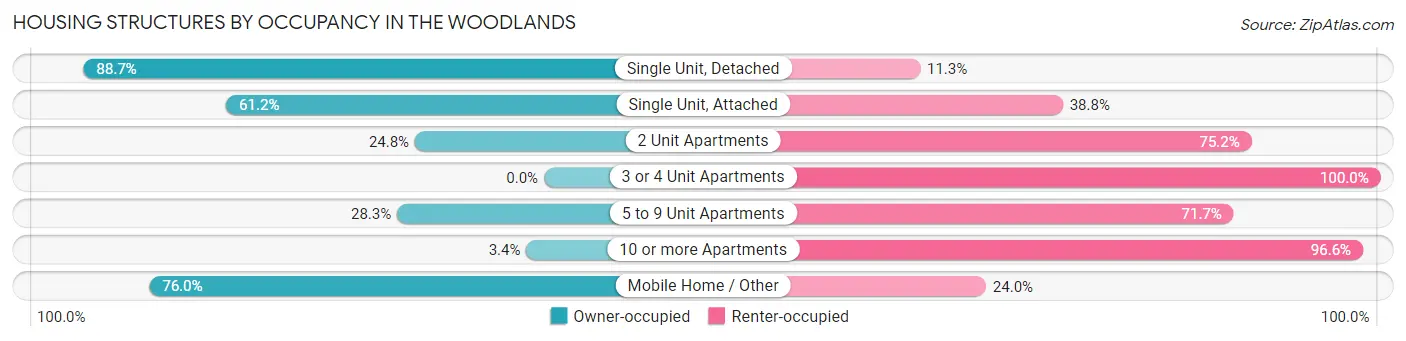
| Structure Type | Owner-occupied | Renter-occupied |
| Single Unit, Detached | 29,228 (88.7%) | 3,736 (11.3%) |
| Single Unit, Attached | 1,457 (61.2%) | 924 (38.8%) |
| 2 Unit Apartments | 38 (24.8%) | 115 (75.2%) |
| 3 or 4 Unit Apartments | 0 (0.0%) | 18 (100.0%) |
| 5 to 9 Unit Apartments | 256 (28.3%) | 649 (71.7%) |
| 10 or more Apartments | 223 (3.4%) | 6,341 (96.6%) |
| Mobile Home / Other | 136 (76.0%) | 43 (24.0%) |
| Total | 31,338 (72.6%) | 11,826 (27.4%) |
Housing Structures by Number of Rooms in The Woodlands
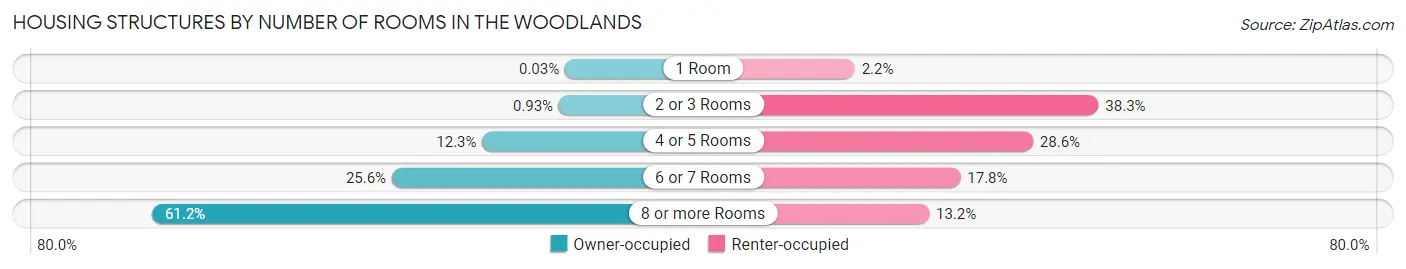
| Number of Rooms | Owner-occupied | Renter-occupied |
| 1 Room | 10 (0.0%) | 259 (2.2%) |
| 2 or 3 Rooms | 290 (0.9%) | 4,523 (38.3%) |
| 4 or 5 Rooms | 3,841 (12.3%) | 3,377 (28.6%) |
| 6 or 7 Rooms | 8,035 (25.6%) | 2,107 (17.8%) |
| 8 or more Rooms | 19,162 (61.2%) | 1,560 (13.2%) |
| Total | 31,338 (100.0%) | 11,826 (100.0%) |
Housing Structure by Heating Type in The Woodlands
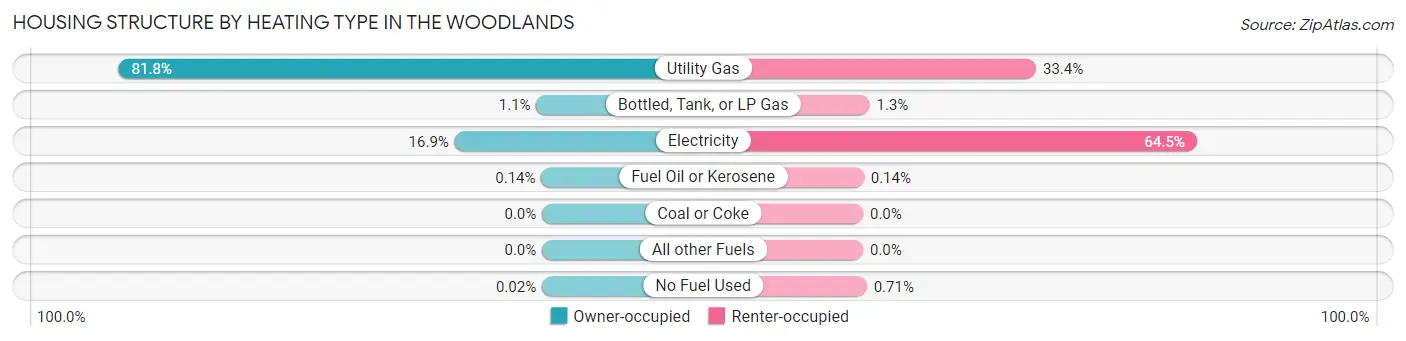
| Heating Type | Owner-occupied | Renter-occupied |
| Utility Gas | 25,644 (81.8%) | 3,953 (33.4%) |
| Bottled, Tank, or LP Gas | 345 (1.1%) | 150 (1.3%) |
| Electricity | 5,297 (16.9%) | 7,623 (64.5%) |
| Fuel Oil or Kerosene | 45 (0.1%) | 16 (0.1%) |
| Coal or Coke | 0 (0.0%) | 0 (0.0%) |
| All other Fuels | 0 (0.0%) | 0 (0.0%) |
| No Fuel Used | 7 (0.0%) | 84 (0.7%) |
| Total | 31,338 (100.0%) | 11,826 (100.0%) |
Household Vehicle Usage in The Woodlands

| Vehicles per Household | Owner-occupied | Renter-occupied |
| No Vehicle | 347 (1.1%) | 1,309 (11.1%) |
| 1 Vehicle | 6,244 (19.9%) | 5,066 (42.8%) |
| 2 Vehicles | 16,367 (52.2%) | 4,433 (37.5%) |
| 3 or more Vehicles | 8,380 (26.7%) | 1,018 (8.6%) |
| Total | 31,338 (100.0%) | 11,826 (100.0%) |
Real Estate & Mortgages in The Woodlands
Real Estate and Mortgage Overview in The Woodlands
| Characteristic | Without Mortgage | With Mortgage |
| Housing Units | 11,429 | 19,909 |
| Median Property Value | $439,000 | $466,800 |
| Median Household Income | $128,378 | $12,322 |
| Monthly Housing Costs | $1,060 | $9,224 |
| Real Estate Taxes | $6,780 | $313 |
Property Value by Mortgage Status in The Woodlands
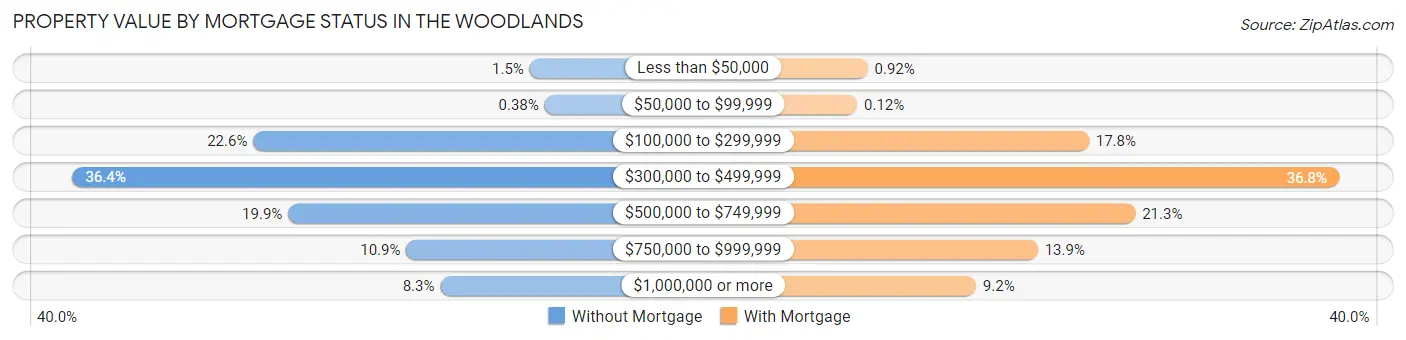
| Property Value | Without Mortgage | With Mortgage |
| Less than $50,000 | 174 (1.5%) | 184 (0.9%) |
| $50,000 to $99,999 | 43 (0.4%) | 24 (0.1%) |
| $100,000 to $299,999 | 2,581 (22.6%) | 3,538 (17.8%) |
| $300,000 to $499,999 | 4,154 (36.3%) | 7,330 (36.8%) |
| $500,000 to $749,999 | 2,277 (19.9%) | 4,243 (21.3%) |
| $750,000 to $999,999 | 1,248 (10.9%) | 2,764 (13.9%) |
| $1,000,000 or more | 952 (8.3%) | 1,826 (9.2%) |
| Total | 11,429 (100.0%) | 19,909 (100.0%) |
Household Income by Mortgage Status in The Woodlands
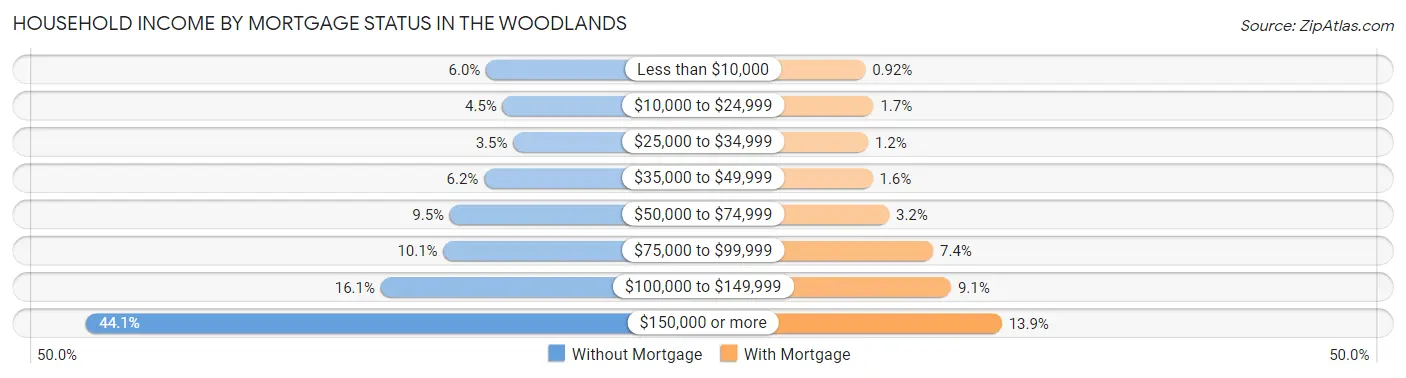
| Household Income | Without Mortgage | With Mortgage |
| Less than $10,000 | 690 (6.0%) | 183 (0.9%) |
| $10,000 to $24,999 | 511 (4.5%) | 340 (1.7%) |
| $25,000 to $34,999 | 396 (3.5%) | 236 (1.2%) |
| $35,000 to $49,999 | 712 (6.2%) | 322 (1.6%) |
| $50,000 to $74,999 | 1,085 (9.5%) | 635 (3.2%) |
| $75,000 to $99,999 | 1,156 (10.1%) | 1,472 (7.4%) |
| $100,000 to $149,999 | 1,838 (16.1%) | 1,810 (9.1%) |
| $150,000 or more | 5,041 (44.1%) | 2,772 (13.9%) |
| Total | 11,429 (100.0%) | 19,909 (100.0%) |
Property Value to Household Income Ratio in The Woodlands
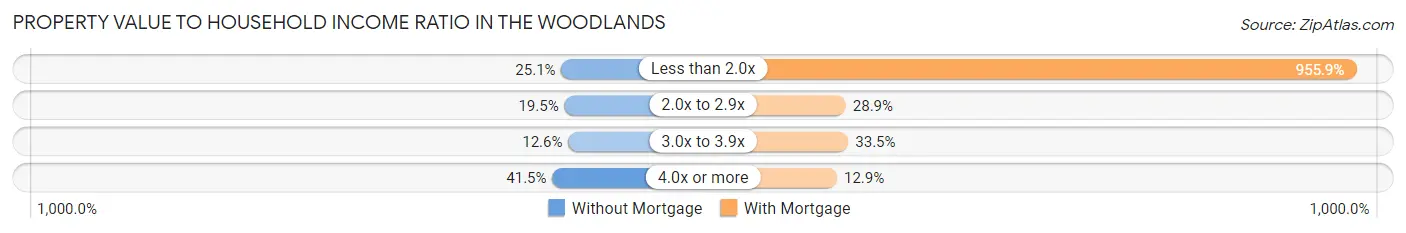
| Value-to-Income Ratio | Without Mortgage | With Mortgage |
| Less than 2.0x | 2,864 (25.1%) | 190,316 (955.9%) |
| 2.0x to 2.9x | 2,231 (19.5%) | 5,761 (28.9%) |
| 3.0x to 3.9x | 1,436 (12.6%) | 6,668 (33.5%) |
| 4.0x or more | 4,747 (41.5%) | 2,575 (12.9%) |
| Total | 11,429 (100.0%) | 19,909 (100.0%) |
Real Estate Taxes by Mortgage Status in The Woodlands
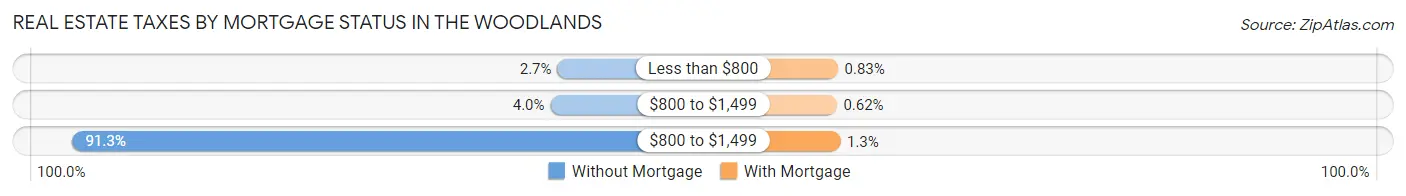
| Property Taxes | Without Mortgage | With Mortgage |
| Less than $800 | 308 (2.7%) | 165 (0.8%) |
| $800 to $1,499 | 454 (4.0%) | 124 (0.6%) |
| $800 to $1,499 | 10,429 (91.2%) | 253 (1.3%) |
| Total | 11,429 (100.0%) | 19,909 (100.0%) |
Health & Disability in The Woodlands
Health Insurance Coverage by Age in The Woodlands
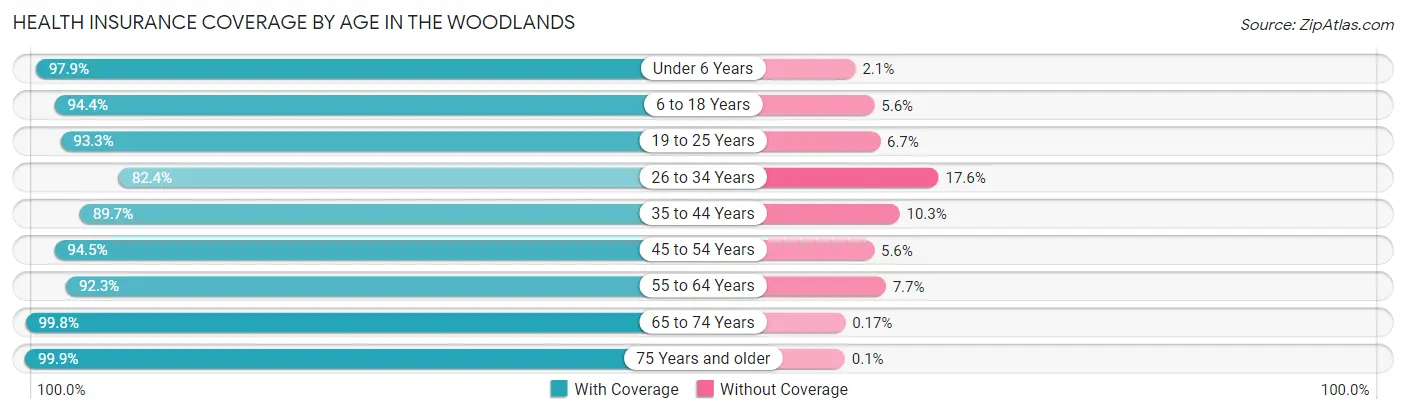
| Age Bracket | With Coverage | Without Coverage |
| Under 6 Years | 8,429 (97.9%) | 179 (2.1%) |
| 6 to 18 Years | 24,004 (94.4%) | 1,428 (5.6%) |
| 19 to 25 Years | 6,303 (93.3%) | 450 (6.7%) |
| 26 to 34 Years | 8,830 (82.4%) | 1,884 (17.6%) |
| 35 to 44 Years | 14,315 (89.7%) | 1,645 (10.3%) |
| 45 to 54 Years | 18,669 (94.5%) | 1,097 (5.6%) |
| 55 to 64 Years | 13,652 (92.3%) | 1,142 (7.7%) |
| 65 to 74 Years | 9,990 (99.8%) | 17 (0.2%) |
| 75 Years and older | 5,830 (99.9%) | 6 (0.1%) |
| Total | 110,022 (93.3%) | 7,848 (6.7%) |
Health Insurance Coverage by Citizenship Status in The Woodlands
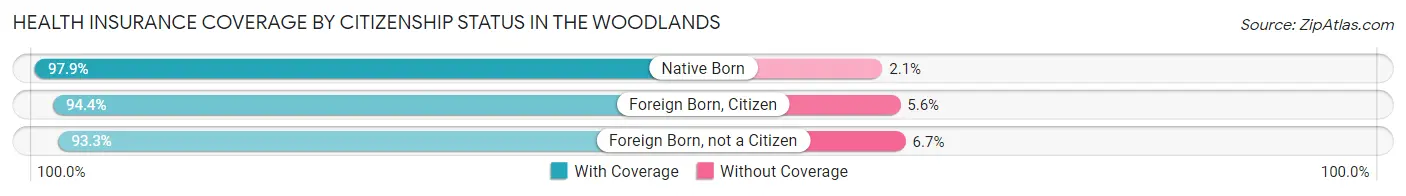
| Citizenship Status | With Coverage | Without Coverage |
| Native Born | 8,429 (97.9%) | 179 (2.1%) |
| Foreign Born, Citizen | 24,004 (94.4%) | 1,428 (5.6%) |
| Foreign Born, not a Citizen | 6,303 (93.3%) | 450 (6.7%) |
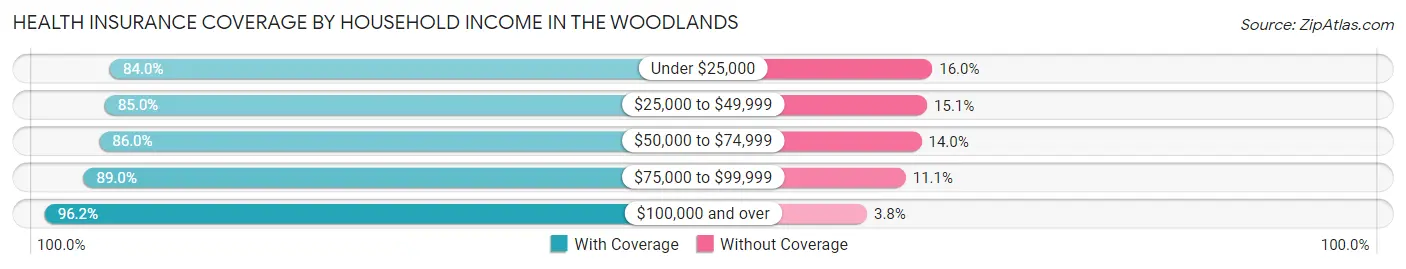
Health Insurance Coverage by Household Income in The Woodlands
| Household Income | With Coverage | Without Coverage |
| Under $25,000 | 6,358 (84.0%) | 1,213 (16.0%) |
| $25,000 to $49,999 | 5,786 (85.0%) | 1,025 (15.0%) |
| $50,000 to $74,999 | 8,025 (86.0%) | 1,308 (14.0%) |
| $75,000 to $99,999 | 8,501 (88.9%) | 1,056 (11.1%) |
| $100,000 and over | 81,277 (96.2%) | 3,204 (3.8%) |
Public vs Private Health Insurance Coverage by Age in The Woodlands
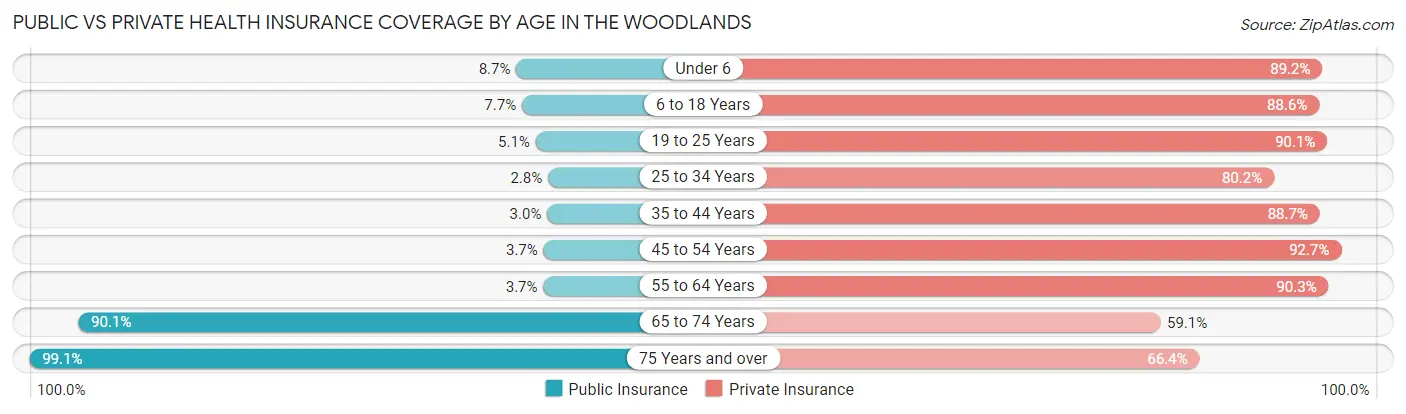
| Age Bracket | Public Insurance | Private Insurance |
| Under 6 | 752 (8.7%) | 7,677 (89.2%) |
| 6 to 18 Years | 1,954 (7.7%) | 22,533 (88.6%) |
| 19 to 25 Years | 347 (5.1%) | 6,084 (90.1%) |
| 25 to 34 Years | 304 (2.8%) | 8,595 (80.2%) |
| 35 to 44 Years | 478 (3.0%) | 14,156 (88.7%) |
| 45 to 54 Years | 724 (3.7%) | 18,323 (92.7%) |
| 55 to 64 Years | 549 (3.7%) | 13,363 (90.3%) |
| 65 to 74 Years | 9,012 (90.1%) | 5,911 (59.1%) |
| 75 Years and over | 5,786 (99.1%) | 3,875 (66.4%) |
| Total | 19,906 (16.9%) | 100,517 (85.3%) |
Disability Status by Sex by Age in The Woodlands
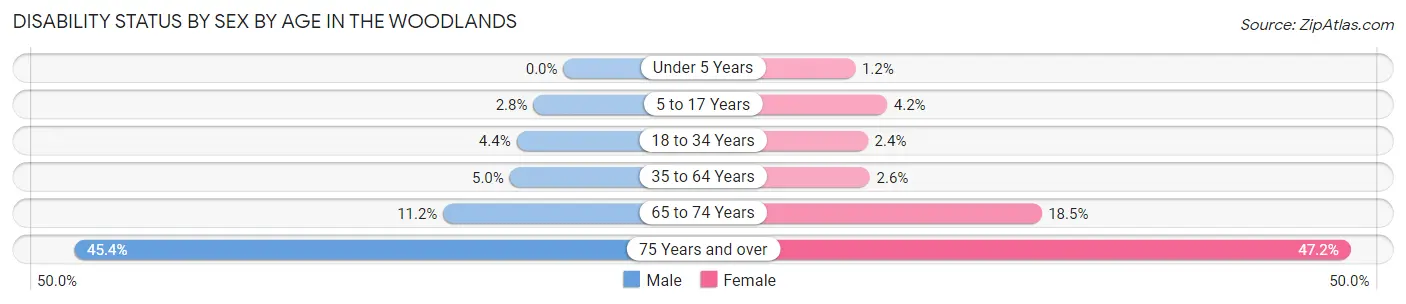
| Age Bracket | Male | Female |
| Under 5 Years | 0 (0.0%) | 39 (1.2%) |
| 5 to 17 Years | 361 (2.8%) | 543 (4.2%) |
| 18 to 34 Years | 395 (4.3%) | 230 (2.4%) |
| 35 to 64 Years | 1,244 (5.0%) | 660 (2.6%) |
| 65 to 74 Years | 533 (11.2%) | 967 (18.5%) |
| 75 Years and over | 1,136 (45.4%) | 1,574 (47.2%) |
Disability Class by Sex by Age in The Woodlands
Disability Class: Hearing Difficulty
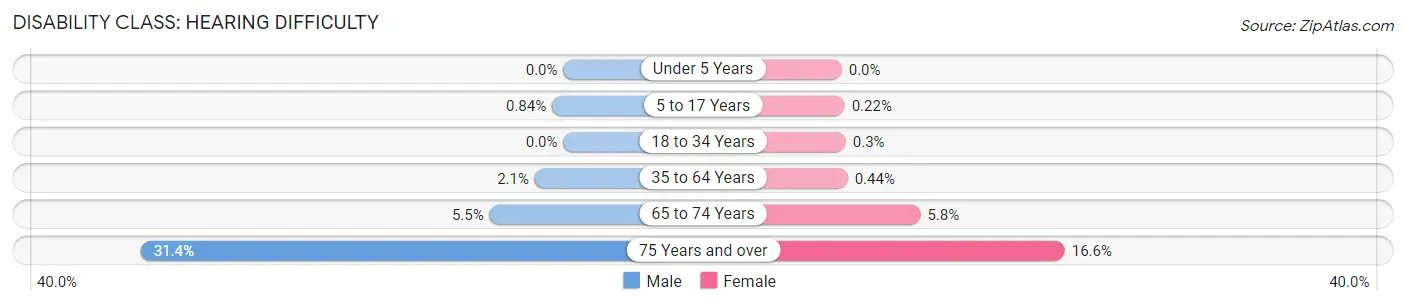
| Age Bracket | Male | Female |
| Under 5 Years | 0 (0.0%) | 0 (0.0%) |
| 5 to 17 Years | 109 (0.8%) | 29 (0.2%) |
| 18 to 34 Years | 0 (0.0%) | 29 (0.3%) |
| 35 to 64 Years | 529 (2.1%) | 112 (0.4%) |
| 65 to 74 Years | 262 (5.5%) | 305 (5.8%) |
| 75 Years and over | 785 (31.4%) | 552 (16.6%) |
Disability Class: Vision Difficulty
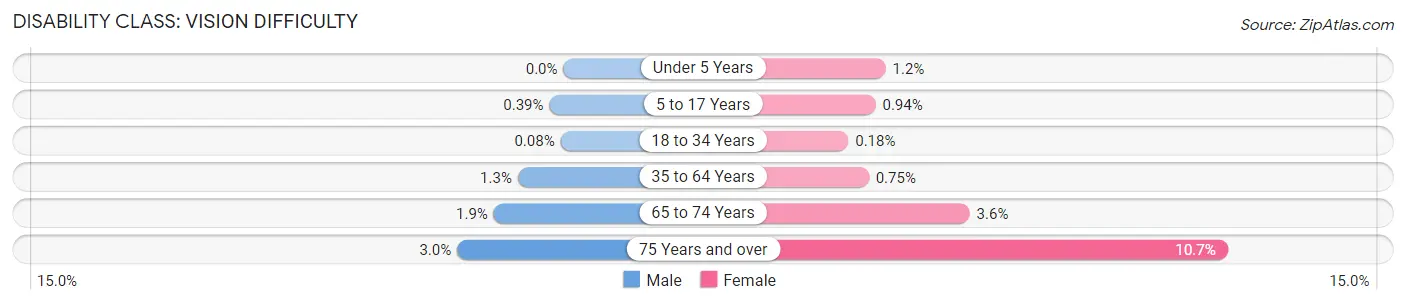
| Age Bracket | Male | Female |
| Under 5 Years | 0 (0.0%) | 39 (1.2%) |
| 5 to 17 Years | 50 (0.4%) | 122 (0.9%) |
| 18 to 34 Years | 7 (0.1%) | 17 (0.2%) |
| 35 to 64 Years | 316 (1.3%) | 191 (0.7%) |
| 65 to 74 Years | 93 (1.9%) | 186 (3.6%) |
| 75 Years and over | 74 (3.0%) | 358 (10.7%) |
Disability Class: Cognitive Difficulty
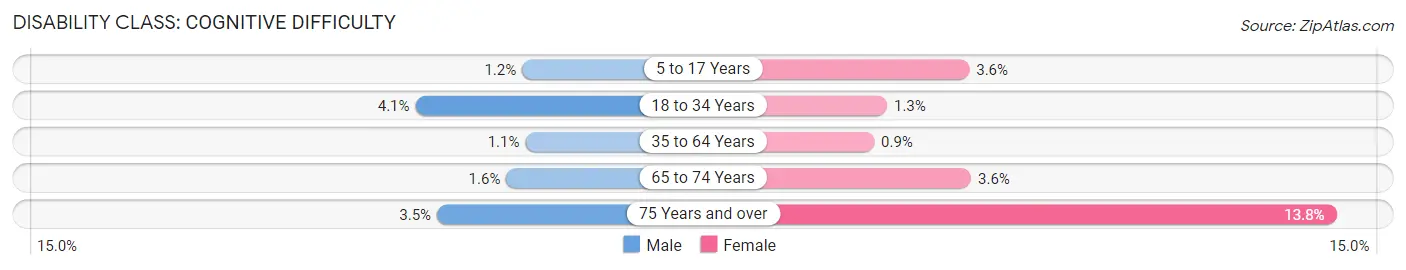
| Age Bracket | Male | Female |
| 5 to 17 Years | 149 (1.1%) | 461 (3.5%) |
| 18 to 34 Years | 374 (4.1%) | 121 (1.3%) |
| 35 to 64 Years | 264 (1.1%) | 231 (0.9%) |
| 65 to 74 Years | 76 (1.6%) | 188 (3.6%) |
| 75 Years and over | 88 (3.5%) | 459 (13.8%) |
Disability Class: Ambulatory Difficulty
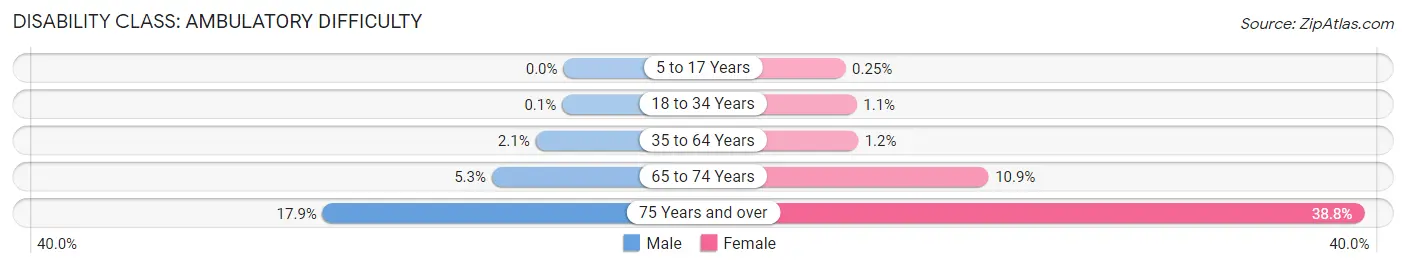
| Age Bracket | Male | Female |
| 5 to 17 Years | 0 (0.0%) | 32 (0.3%) |
| 18 to 34 Years | 9 (0.1%) | 104 (1.1%) |
| 35 to 64 Years | 516 (2.1%) | 303 (1.2%) |
| 65 to 74 Years | 254 (5.3%) | 568 (10.9%) |
| 75 Years and over | 447 (17.9%) | 1,293 (38.8%) |
Disability Class: Self-Care Difficulty
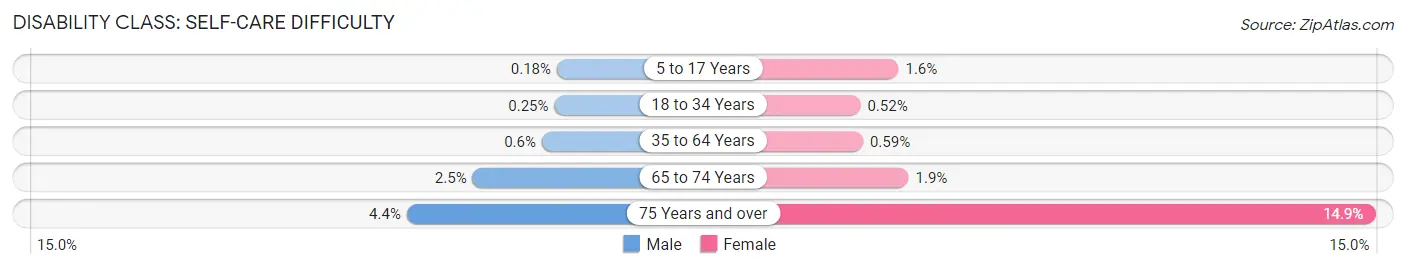
| Age Bracket | Male | Female |
| 5 to 17 Years | 23 (0.2%) | 206 (1.6%) |
| 18 to 34 Years | 23 (0.3%) | 50 (0.5%) |
| 35 to 64 Years | 150 (0.6%) | 151 (0.6%) |
| 65 to 74 Years | 121 (2.5%) | 97 (1.9%) |
| 75 Years and over | 109 (4.4%) | 495 (14.8%) |
Technology Access in The Woodlands
Computing Device Access in The Woodlands
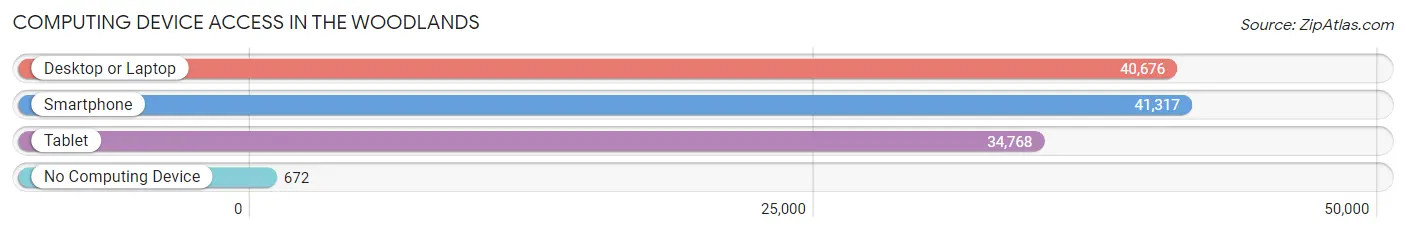
| Device Type | # Households | % Households |
| Desktop or Laptop | 40,676 | 94.2% |
| Smartphone | 41,317 | 95.7% |
| Tablet | 34,768 | 80.5% |
| No Computing Device | 672 | 1.6% |
| Total | 43,164 | 100.0% |
Internet Access in The Woodlands
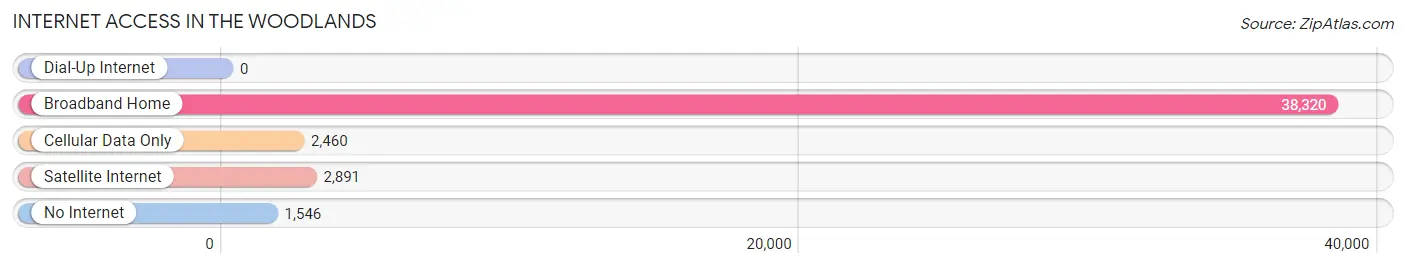
| Internet Type | # Households | % Households |
| Dial-Up Internet | 0 | 0.0% |
| Broadband Home | 38,320 | 88.8% |
| Cellular Data Only | 2,460 | 5.7% |
| Satellite Internet | 2,891 | 6.7% |
| No Internet | 1,546 | 3.6% |
| Total | 43,164 | 100.0% |
The Woodlands Summary
The Woodlands, Texas is a master-planned community located in Montgomery County, Texas, approximately 28 miles north of Houston. It is a census-designated place (CDP) and an unincorporated area. The Woodlands is one of the most affluent communities in the Houston metropolitan area and is home to many corporate headquarters, including Anadarko Petroleum Corporation, Chevron Phillips Chemical Company, Huntsman Corporation, and Woodforest National Bank.
History
The Woodlands was founded in 1974 by George P. Mitchell, a Houston oilman and real estate developer. Mitchell envisioned a self-sustaining community that would provide a high quality of life for its residents. He purchased the land that would become The Woodlands and began developing the area. The first homes were built in 1974 and the first shopping center opened in 1975.
The Woodlands was incorporated as a special-purpose district in 1977 and was designated as a township in 1981. The township was designed to be a self-governing entity, with its own elected officials and services. The Woodlands Township is governed by a seven-member Board of Directors, which is elected by the residents of The Woodlands.
Geography
The Woodlands is located in Montgomery County, Texas, approximately 28 miles north of Houston. It is situated in the southeastern corner of the county, near the border with Harris County. The Woodlands covers an area of approximately 43 square miles and is bordered by the cities of Conroe, Spring, and Shenandoah.
The Woodlands is divided into nine villages, each with its own distinct character and amenities. The villages are Alden Bridge, College Park, Creekside Park, Grogan’s Mill, Indian Springs, Panther Creek, Sterling Ridge, and The Woodlands Hills.
Economy
The Woodlands is home to many corporate headquarters, including Anadarko Petroleum Corporation, Chevron Phillips Chemical Company, Huntsman Corporation, and Woodforest National Bank. The Woodlands is also home to several major medical centers, including Memorial Hermann The Woodlands Hospital, Houston Methodist The Woodlands Hospital, and Texas Children’s Hospital The Woodlands.
The Woodlands is a major employment center for the Houston metropolitan area. The Woodlands is home to more than 1,000 businesses, including many Fortune 500 companies. The Woodlands is also home to several shopping centers, including The Woodlands Mall, Market Street, and The Woodlands Waterway.
Demographics
As of the 2010 census, The Woodlands had a population of 93,847. The racial makeup of The Woodlands was 79.2% White, 8.3% African American, 0.3% Native American, 5.2% Asian, 0.1% Pacific Islander, 4.2% from other races, and 2.7% from two or more races. Hispanic or Latino of any race were 11.3% of the population.
The median income for a household in The Woodlands was $95,867, and the median income for a family was $106,867. The per capita income for The Woodlands was $45,867. About 3.2% of families and 4.3% of the population were below the poverty line, including 5.2% of those under age 18 and 4.2% of those age 65 or over.
Common Questions
What is Per Capita Income in The Woodlands?
Per Capita income in The Woodlands is $72,214.
What is the Median Family Income in The Woodlands?
Median Family Income in The Woodlands is $167,650.
What is the Median Household income in The Woodlands?
Median Household Income in The Woodlands is $142,384.
What is Income or Wage Gap in The Woodlands?
Income or Wage Gap in The Woodlands is 59.5%.
Women in The Woodlands earn 40.5 cents for every dollar earned by a man.
What is Inequality or Gini Index in The Woodlands?
Inequality or Gini Index in The Woodlands is 0.48.
What is the Total Population of The Woodlands?
Total Population of The Woodlands is 118,402.
What is the Total Male Population of The Woodlands?
Total Male Population of The Woodlands is 58,206.
What is the Total Female Population of The Woodlands?
Total Female Population of The Woodlands is 60,196.
What is the Ratio of Males per 100 Females in The Woodlands?
There are 96.69 Males per 100 Females in The Woodlands.
What is the Ratio of Females per 100 Males in The Woodlands?
There are 103.42 Females per 100 Males in The Woodlands.
What is the Median Population Age in The Woodlands?
Median Population Age in The Woodlands is 40.7 Years.
What is the Average Family Size in The Woodlands
Average Family Size in The Woodlands is 3.2 People.
What is the Average Household Size in The Woodlands
Average Household Size in The Woodlands is 2.7 People.
How Large is the Labor Force in The Woodlands?
There are 56,085 People in the Labor Forcein in The Woodlands.
What is the Percentage of People in the Labor Force in The Woodlands?
62.5% of People are in the Labor Force in The Woodlands.
What is the Unemployment Rate in The Woodlands?
Unemployment Rate in The Woodlands is 5.3%.