Andover, MN Map & Demographics
Andover Map
Andover Overview
$49,978
PER CAPITA INCOME
$131,576
AVG FAMILY INCOME
$123,054
AVG HOUSEHOLD INCOME
29.7%
WAGE / INCOME GAP [ % ]
70.3¢/ $1
WAGE / INCOME GAP [ $ ]
0.36
INEQUALITY / GINI INDEX
32,639
TOTAL POPULATION
16,322
MALE POPULATION
16,317
FEMALE POPULATION
100.03
MALES / 100 FEMALES
99.97
FEMALES / 100 MALES
39.3
MEDIAN AGE
3.3
AVG FAMILY SIZE
3.0
AVG HOUSEHOLD SIZE
18,243
LABOR FORCE [ PEOPLE ]
72.3%
PERCENT IN LABOR FORCE
2.6%
UNEMPLOYMENT RATE
Andover Zip Codes
Andover Area Codes
Income in Andover
Income Overview in Andover
Per Capita Income in Andover is $49,978, while median incomes of families and households are $131,576 and $123,054 respectively.
| Characteristic | Number | Measure |
| Per Capita Income | 32,639 | $49,978 |
| Median Family Income | 9,112 | $131,576 |
| Mean Family Income | 9,112 | $156,707 |
| Median Household Income | 10,870 | $123,054 |
| Mean Household Income | 10,870 | $147,512 |
| Income Deficit | 9,112 | $0 |
| Wage / Income Gap (%) | 32,639 | 29.74% |
| Wage / Income Gap ($) | 32,639 | 70.26¢ per $1 |
| Gini / Inequality Index | 32,639 | 0.36 |
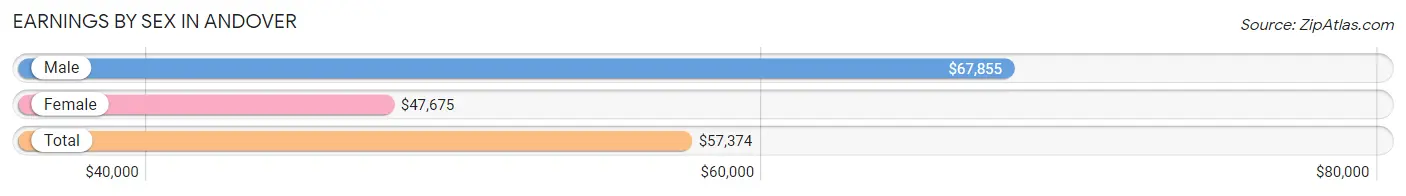
Earnings by Sex in Andover
Average Earnings in Andover are $57,374, $67,855 for men and $47,675 for women, a difference of 29.7%.
| Sex | Number | Average Earnings |
| Male | 9,929 (52.0%) | $67,855 |
| Female | 9,164 (48.0%) | $47,675 |
| Total | 19,093 (100.0%) | $57,374 |
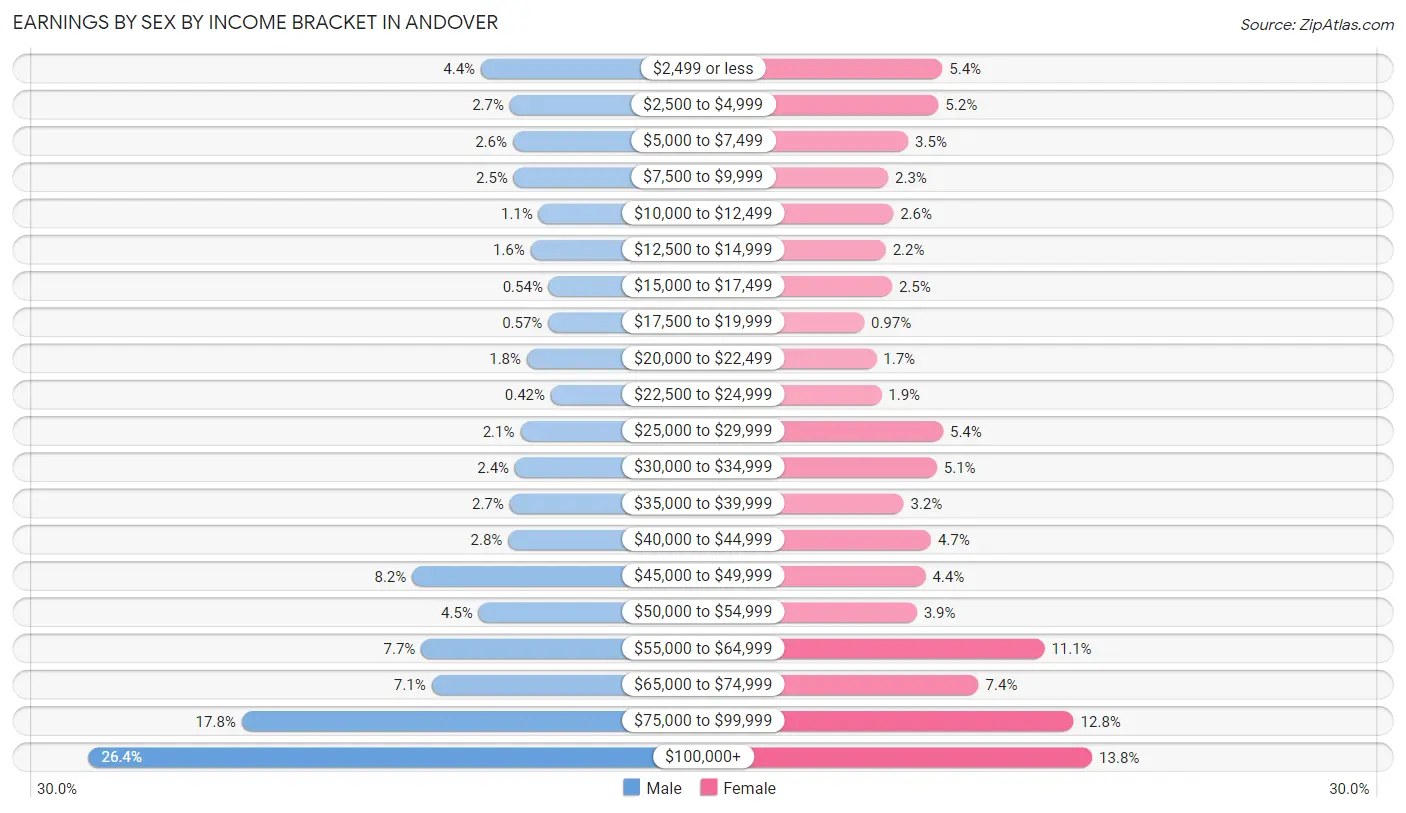
Earnings by Sex by Income Bracket in Andover
The most common earnings brackets in Andover are $100,000+ for men (2,621 | 26.4%) and $100,000+ for women (1,264 | 13.8%).
| Income | Male | Female |
| $2,499 or less | 432 (4.3%) | 492 (5.4%) |
| $2,500 to $4,999 | 271 (2.7%) | 472 (5.1%) |
| $5,000 to $7,499 | 254 (2.6%) | 316 (3.5%) |
| $7,500 to $9,999 | 249 (2.5%) | 213 (2.3%) |
| $10,000 to $12,499 | 110 (1.1%) | 239 (2.6%) |
| $12,500 to $14,999 | 155 (1.6%) | 201 (2.2%) |
| $15,000 to $17,499 | 54 (0.5%) | 233 (2.5%) |
| $17,500 to $19,999 | 57 (0.6%) | 89 (1.0%) |
| $20,000 to $22,499 | 176 (1.8%) | 152 (1.7%) |
| $22,500 to $24,999 | 42 (0.4%) | 178 (1.9%) |
| $25,000 to $29,999 | 212 (2.1%) | 496 (5.4%) |
| $30,000 to $34,999 | 242 (2.4%) | 464 (5.1%) |
| $35,000 to $39,999 | 272 (2.7%) | 292 (3.2%) |
| $40,000 to $44,999 | 280 (2.8%) | 433 (4.7%) |
| $45,000 to $49,999 | 816 (8.2%) | 405 (4.4%) |
| $50,000 to $54,999 | 445 (4.5%) | 360 (3.9%) |
| $55,000 to $64,999 | 766 (7.7%) | 1,018 (11.1%) |
| $65,000 to $74,999 | 708 (7.1%) | 679 (7.4%) |
| $75,000 to $99,999 | 1,767 (17.8%) | 1,168 (12.8%) |
| $100,000+ | 2,621 (26.4%) | 1,264 (13.8%) |
| Total | 9,929 (100.0%) | 9,164 (100.0%) |
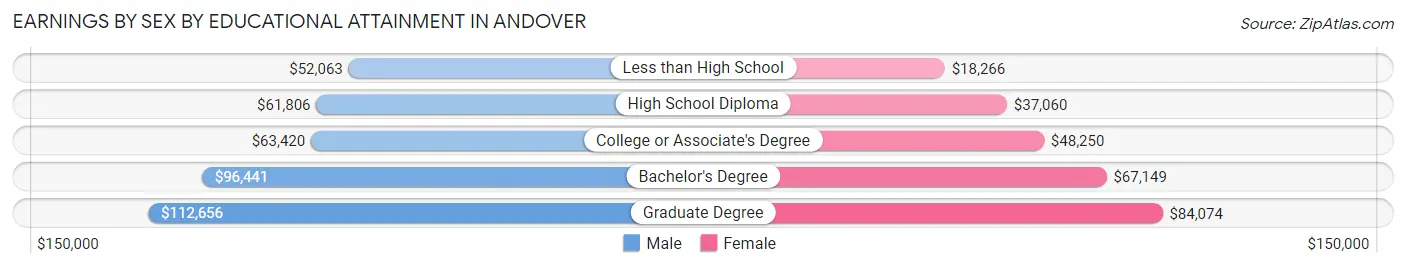
Earnings by Sex by Educational Attainment in Andover
Average earnings in Andover are $76,853 for men and $56,217 for women, a difference of 26.9%. Men with an educational attainment of graduate degree enjoy the highest average annual earnings of $112,656, while those with less than high school education earn the least with $52,063. Women with an educational attainment of graduate degree earn the most with the average annual earnings of $84,074, while those with less than high school education have the smallest earnings of $18,266.
| Educational Attainment | Male Income | Female Income |
| Less than High School | $52,063 | $18,266 |
| High School Diploma | $61,806 | $37,060 |
| College or Associate's Degree | $63,420 | $48,250 |
| Bachelor's Degree | $96,441 | $67,149 |
| Graduate Degree | $112,656 | $84,074 |
| Total | $76,853 | $56,217 |
Family Income in Andover
Family Income Brackets in Andover
According to the Andover family income data, there are 2,460 families falling into the $100,000 to $149,999 income range, which is the most common income bracket and makes up 27.0% of all families. Conversely, the $10,000 to $14,999 income bracket is the least frequent group with only 9 families (0.1%) belonging to this category.
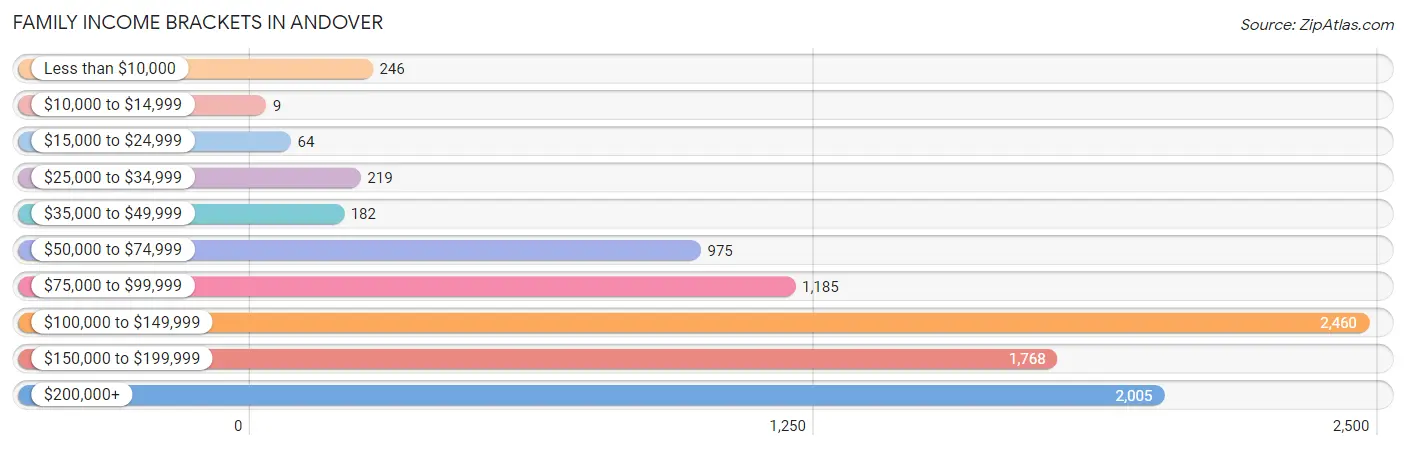
| Income Bracket | # Families | % Families |
| Less than $10,000 | 246 | 2.7% |
| $10,000 to $14,999 | 9 | 0.1% |
| $15,000 to $24,999 | 64 | 0.7% |
| $25,000 to $34,999 | 219 | 2.4% |
| $35,000 to $49,999 | 182 | 2.0% |
| $50,000 to $74,999 | 975 | 10.7% |
| $75,000 to $99,999 | 1,185 | 13.0% |
| $100,000 to $149,999 | 2,460 | 27.0% |
| $150,000 to $199,999 | 1,768 | 19.4% |
| $200,000+ | 2,005 | 22.0% |
Family Income by Famaliy Size in Andover
4-person families (2,131 | 23.4%) account for the highest median family income in Andover with $165,905 per family, while 2-person families (3,870 | 42.5%) have the highest median income of $53,906 per family member.
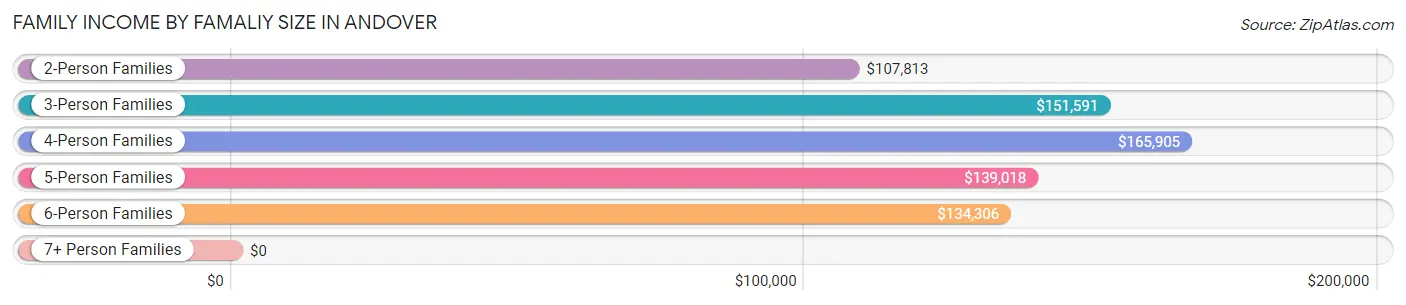
| Income Bracket | # Families | Median Income |
| 2-Person Families | 3,870 (42.5%) | $107,813 |
| 3-Person Families | 1,930 (21.2%) | $151,591 |
| 4-Person Families | 2,131 (23.4%) | $165,905 |
| 5-Person Families | 737 (8.1%) | $139,018 |
| 6-Person Families | 277 (3.0%) | $134,306 |
| 7+ Person Families | 167 (1.8%) | $0 |
| Total | 9,112 (100.0%) | $131,576 |
Family Income by Number of Earners in Andover
The median family income in Andover is $131,576, with families comprising 3+ earners (1,680) having the highest median family income of $179,811, while families with no earners (1,210) have the lowest median family income of $69,000, accounting for 18.4% and 13.3% of families, respectively.
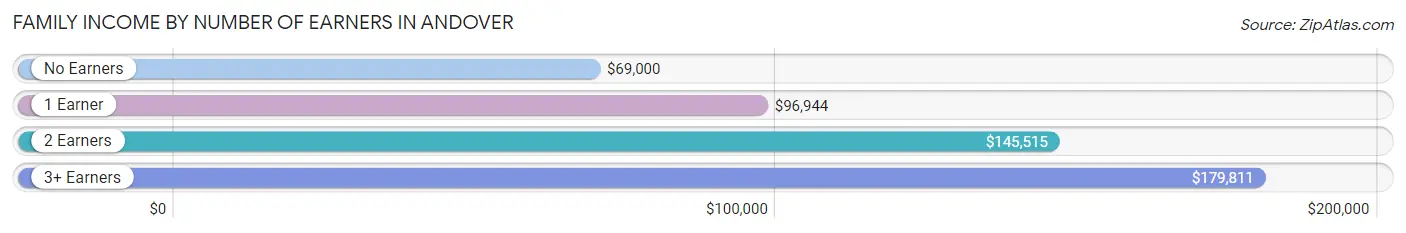
| Number of Earners | # Families | Median Income |
| No Earners | 1,210 (13.3%) | $69,000 |
| 1 Earner | 1,690 (18.5%) | $96,944 |
| 2 Earners | 4,532 (49.7%) | $145,515 |
| 3+ Earners | 1,680 (18.4%) | $179,811 |
| Total | 9,112 (100.0%) | $131,576 |
Household Income in Andover
Household Income Brackets in Andover
With 3,022 households falling in the category, the $100,000 to $149,999 income range is the most frequent in Andover, accounting for 27.8% of all households. In contrast, only 65 households (0.6%) fall into the $10,000 to $14,999 income bracket, making it the least populous group.
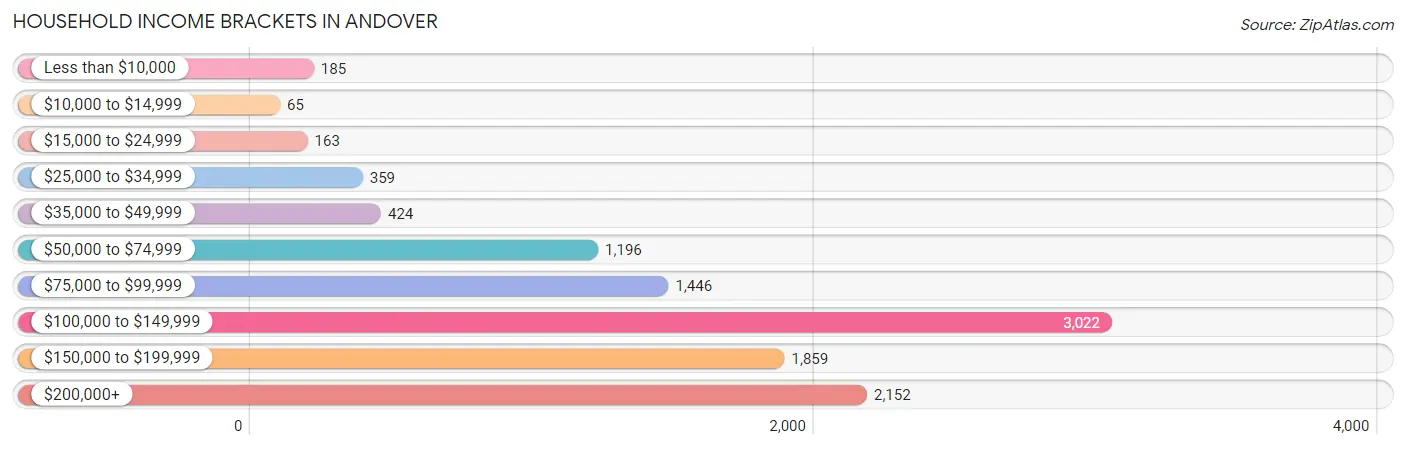
| Income Bracket | # Households | % Households |
| Less than $10,000 | 185 | 1.7% |
| $10,000 to $14,999 | 65 | 0.6% |
| $15,000 to $24,999 | 163 | 1.5% |
| $25,000 to $34,999 | 359 | 3.3% |
| $35,000 to $49,999 | 424 | 3.9% |
| $50,000 to $74,999 | 1,196 | 11.0% |
| $75,000 to $99,999 | 1,446 | 13.3% |
| $100,000 to $149,999 | 3,022 | 27.8% |
| $150,000 to $199,999 | 1,859 | 17.1% |
| $200,000+ | 2,152 | 19.8% |
Household Income by Householder Age in Andover
The median household income in Andover is $123,054, with the highest median household income of $149,422 found in the 45 to 64 years age bracket for the primary householder. A total of 4,817 households (44.3%) fall into this category. Meanwhile, the 65+ years age bracket for the primary householder has the lowest median household income of $80,507, with 2,410 households (22.2%) in this group.
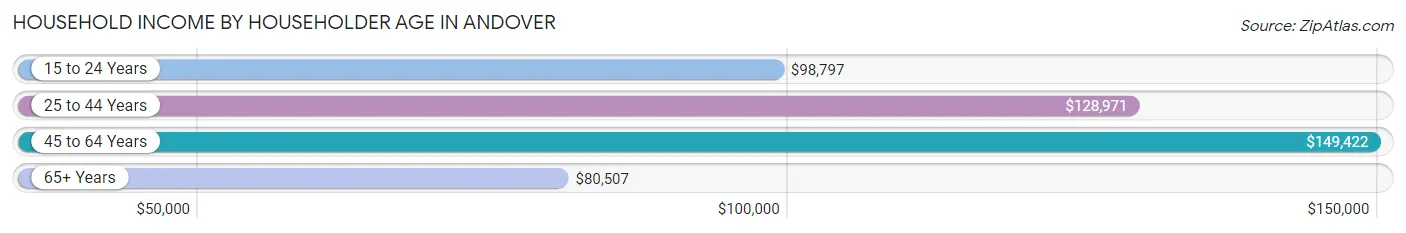
| Income Bracket | # Households | Median Income |
| 15 to 24 Years | 112 (1.0%) | $98,797 |
| 25 to 44 Years | 3,531 (32.5%) | $128,971 |
| 45 to 64 Years | 4,817 (44.3%) | $149,422 |
| 65+ Years | 2,410 (22.2%) | $80,507 |
| Total | 10,870 (100.0%) | $123,054 |
Poverty in Andover
Income Below Poverty by Sex and Age in Andover
With 2.5% poverty level for males and 4.1% for females among the residents of Andover, 45 to 54 year old males and 6 to 11 year old females are the most vulnerable to poverty, with 134 males (6.1%) and 156 females (10.4%) in their respective age groups living below the poverty level.
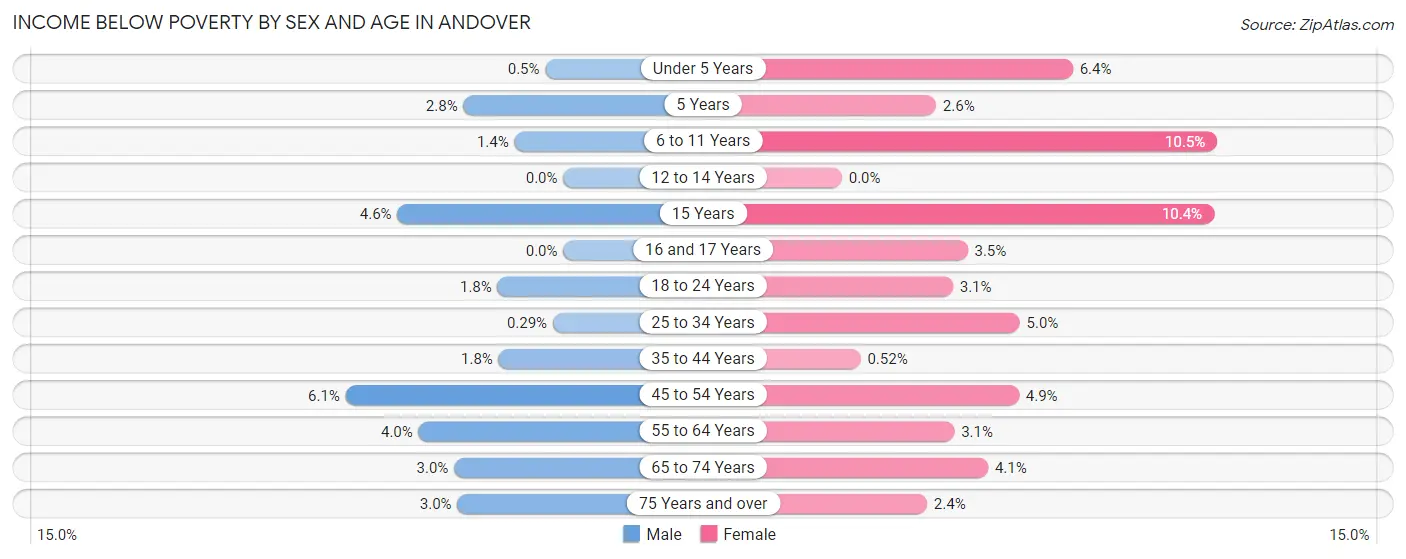
| Age Bracket | Male | Female |
| Under 5 Years | 6 (0.5%) | 67 (6.4%) |
| 5 Years | 8 (2.8%) | 5 (2.6%) |
| 6 to 11 Years | 16 (1.4%) | 156 (10.4%) |
| 12 to 14 Years | 0 (0.0%) | 0 (0.0%) |
| 15 Years | 11 (4.6%) | 29 (10.4%) |
| 16 and 17 Years | 0 (0.0%) | 19 (3.5%) |
| 18 to 24 Years | 23 (1.8%) | 37 (3.1%) |
| 25 to 34 Years | 5 (0.3%) | 80 (5.0%) |
| 35 to 44 Years | 43 (1.8%) | 12 (0.5%) |
| 45 to 54 Years | 134 (6.1%) | 111 (4.9%) |
| 55 to 64 Years | 95 (4.0%) | 69 (3.1%) |
| 65 to 74 Years | 40 (3.0%) | 55 (4.1%) |
| 75 Years and over | 23 (2.9%) | 25 (2.4%) |
| Total | 404 (2.5%) | 665 (4.1%) |
Income Above Poverty by Sex and Age in Andover
According to the poverty statistics in Andover, males aged 12 to 14 years and females aged 12 to 14 years are the age groups that are most secure financially, with 100.0% of males and 100.0% of females in these age groups living above the poverty line.
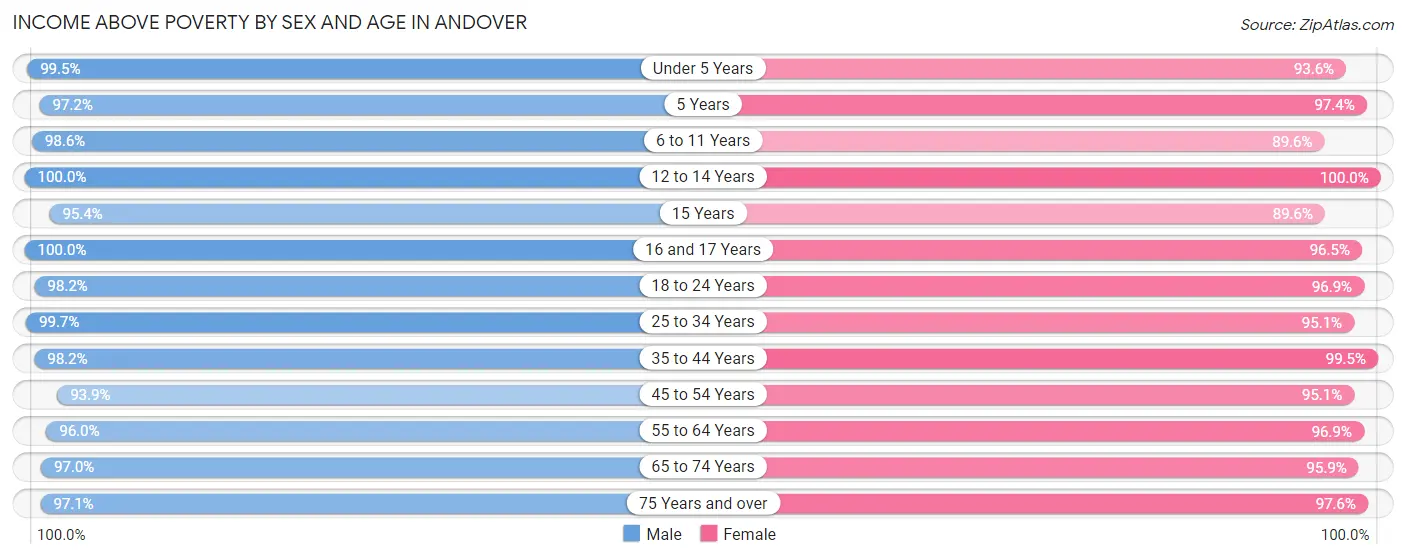
| Age Bracket | Male | Female |
| Under 5 Years | 1,193 (99.5%) | 975 (93.6%) |
| 5 Years | 280 (97.2%) | 186 (97.4%) |
| 6 to 11 Years | 1,163 (98.6%) | 1,337 (89.5%) |
| 12 to 14 Years | 713 (100.0%) | 776 (100.0%) |
| 15 Years | 227 (95.4%) | 251 (89.6%) |
| 16 and 17 Years | 634 (100.0%) | 524 (96.5%) |
| 18 to 24 Years | 1,237 (98.2%) | 1,160 (96.9%) |
| 25 to 34 Years | 1,722 (99.7%) | 1,536 (95.1%) |
| 35 to 44 Years | 2,351 (98.2%) | 2,299 (99.5%) |
| 45 to 54 Years | 2,079 (93.9%) | 2,140 (95.1%) |
| 55 to 64 Years | 2,265 (96.0%) | 2,135 (96.9%) |
| 65 to 74 Years | 1,277 (97.0%) | 1,296 (95.9%) |
| 75 Years and over | 756 (97.1%) | 1,028 (97.6%) |
| Total | 15,897 (97.5%) | 15,643 (95.9%) |
Income Below Poverty Among Married-Couple Families in Andover
The poverty statistics for married-couple families in Andover show that 0.9% or 66 of the total 7,741 families live below the poverty line. Families with 3 or 4 children have the highest poverty rate of 1.6%, comprising of 11 families. On the other hand, families with 5 or more children have the lowest poverty rate of 0.0%, which includes 0 families.
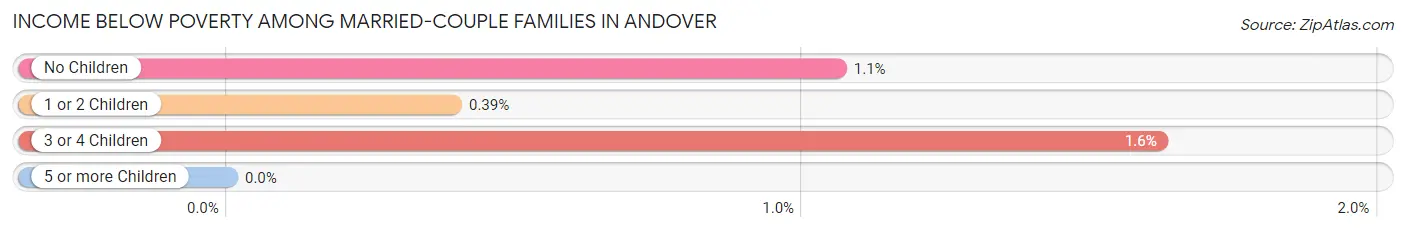
| Children | Above Poverty | Below Poverty |
| No Children | 4,105 (98.9%) | 44 (1.1%) |
| 1 or 2 Children | 2,808 (99.6%) | 11 (0.4%) |
| 3 or 4 Children | 670 (98.4%) | 11 (1.6%) |
| 5 or more Children | 92 (100.0%) | 0 (0.0%) |
| Total | 7,675 (99.2%) | 66 (0.9%) |
Income Below Poverty Among Single-Parent Households in Andover
According to the poverty data in Andover, 18.1% or 71 single-father households and 14.7% or 144 single-mother households are living below the poverty line. Among single-father households, those with 1 or 2 children have the highest poverty rate, with 41 households (19.8%) experiencing poverty. Likewise, among single-mother households, those with 1 or 2 children have the highest poverty rate, with 144 households (21.8%) falling below the poverty line.
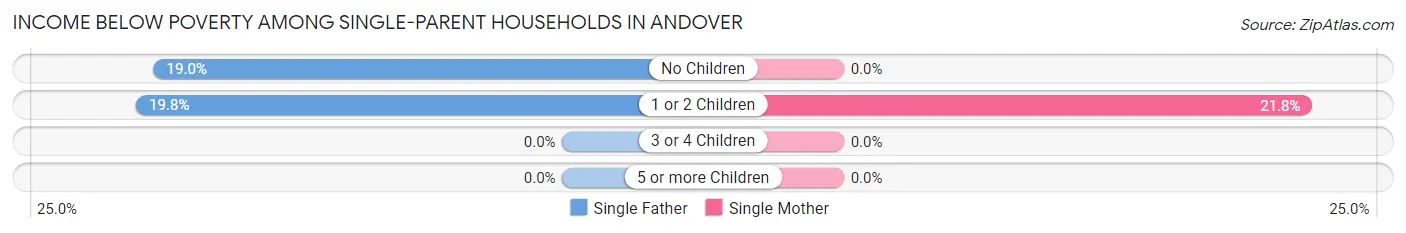
| Children | Single Father | Single Mother |
| No Children | 30 (19.0%) | 0 (0.0%) |
| 1 or 2 Children | 41 (19.8%) | 144 (21.8%) |
| 3 or 4 Children | 0 (0.0%) | 0 (0.0%) |
| 5 or more Children | 0 (0.0%) | 0 (0.0%) |
| Total | 71 (18.1%) | 144 (14.7%) |
Income Below Poverty Among Married-Couple vs Single-Parent Households in Andover
The poverty data for Andover shows that 66 of the married-couple family households (0.9%) and 215 of the single-parent households (15.7%) are living below the poverty level. Within the married-couple family households, those with 3 or 4 children have the highest poverty rate, with 11 households (1.6%) falling below the poverty line. Among the single-parent households, those with 1 or 2 children have the highest poverty rate, with 185 household (21.3%) living below poverty.
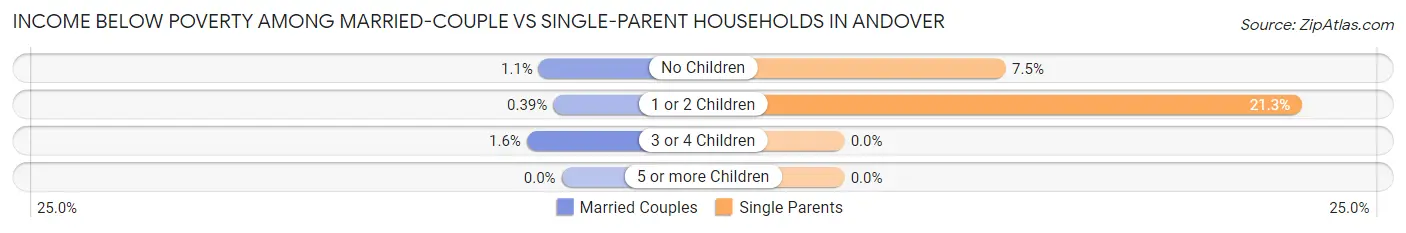
| Children | Married-Couple Families | Single-Parent Households |
| No Children | 44 (1.1%) | 30 (7.5%) |
| 1 or 2 Children | 11 (0.4%) | 185 (21.3%) |
| 3 or 4 Children | 11 (1.6%) | 0 (0.0%) |
| 5 or more Children | 0 (0.0%) | 0 (0.0%) |
| Total | 66 (0.9%) | 215 (15.7%) |
Race in Andover
The most populous races in Andover are White / Caucasian (28,542 | 87.5%), Black / African American (1,342 | 4.1%), and Asian (1,156 | 3.5%).
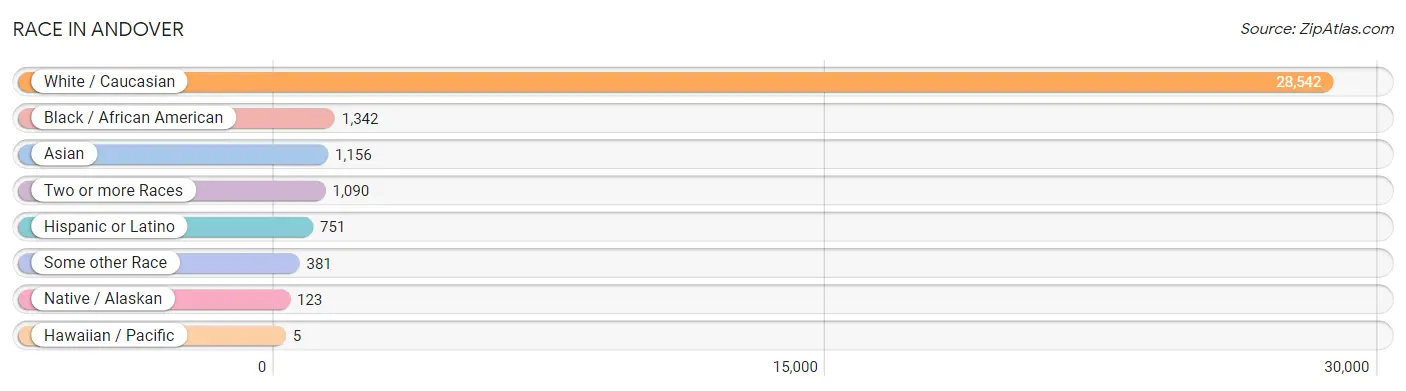
| Race | # Population | % Population |
| Asian | 1,156 | 3.5% |
| Black / African American | 1,342 | 4.1% |
| Hawaiian / Pacific | 5 | 0.0% |
| Hispanic or Latino | 751 | 2.3% |
| Native / Alaskan | 123 | 0.4% |
| White / Caucasian | 28,542 | 87.5% |
| Two or more Races | 1,090 | 3.3% |
| Some other Race | 381 | 1.2% |
| Total | 32,639 | 100.0% |
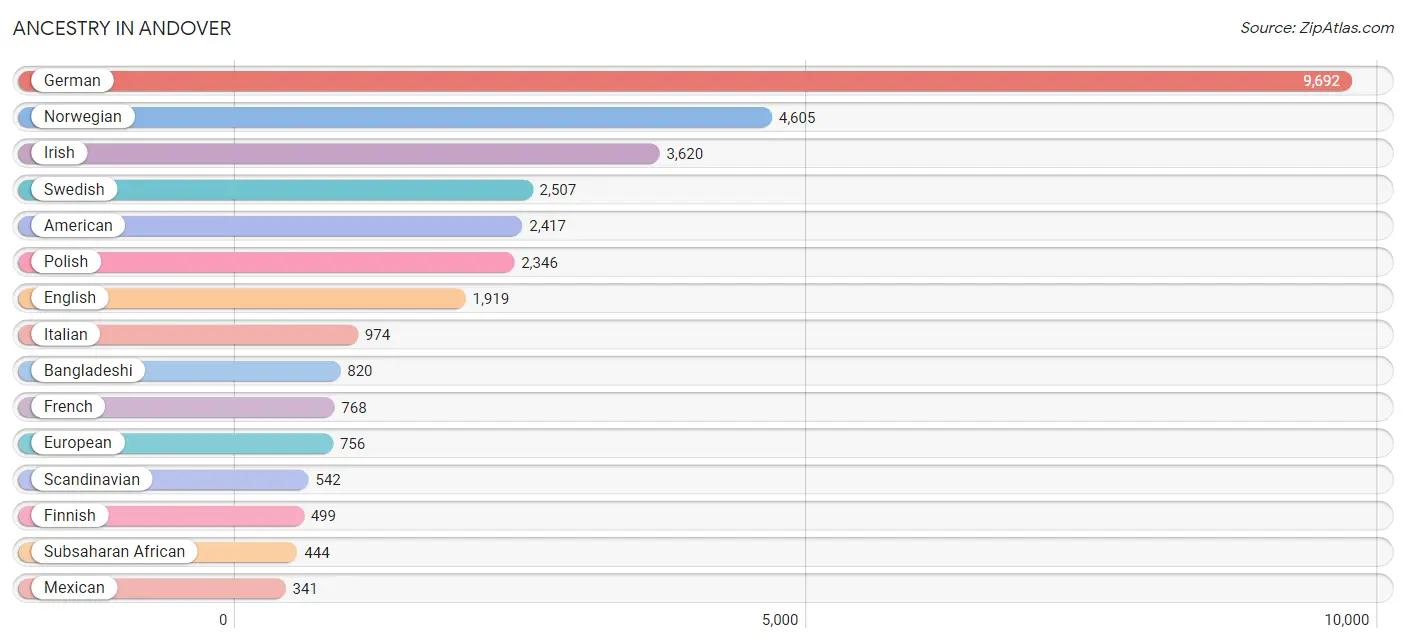
Ancestry in Andover
The most populous ancestries reported in Andover are German (9,692 | 29.7%), Norwegian (4,605 | 14.1%), Irish (3,620 | 11.1%), Swedish (2,507 | 7.7%), and American (2,417 | 7.4%), together accounting for 70.0% of all Andover residents.
| Ancestry | # Population | % Population |
| African | 68 | 0.2% |
| American | 2,417 | 7.4% |
| Arab | 114 | 0.4% |
| Austrian | 71 | 0.2% |
| Bangladeshi | 820 | 2.5% |
| Belgian | 15 | 0.1% |
| Bhutanese | 42 | 0.1% |
| Brazilian | 5 | 0.0% |
| British | 63 | 0.2% |
| Burmese | 308 | 0.9% |
| Canadian | 36 | 0.1% |
| Central American | 106 | 0.3% |
| Chilean | 44 | 0.1% |
| Chippewa | 182 | 0.6% |
| Colombian | 48 | 0.2% |
| Costa Rican | 34 | 0.1% |
| Croatian | 78 | 0.2% |
| Cuban | 26 | 0.1% |
| Czech | 311 | 0.9% |
| Czechoslovakian | 37 | 0.1% |
| Danish | 263 | 0.8% |
| Dutch | 200 | 0.6% |
| Eastern European | 142 | 0.4% |
| Egyptian | 51 | 0.2% |
| English | 1,919 | 5.9% |
| Ethiopian | 36 | 0.1% |
| European | 756 | 2.3% |
| Finnish | 499 | 1.5% |
| French | 768 | 2.4% |
| French American Indian | 81 | 0.3% |
| French Canadian | 273 | 0.8% |
| German | 9,692 | 29.7% |
| Greek | 108 | 0.3% |
| Guatemalan | 7 | 0.0% |
| Honduran | 56 | 0.2% |
| Hungarian | 69 | 0.2% |
| Indian (Asian) | 197 | 0.6% |
| Irish | 3,620 | 11.1% |
| Italian | 974 | 3.0% |
| Japanese | 9 | 0.0% |
| Kenyan | 18 | 0.1% |
| Korean | 35 | 0.1% |
| Lebanese | 13 | 0.0% |
| Liberian | 315 | 1.0% |
| Lithuanian | 42 | 0.1% |
| Luxembourger | 17 | 0.1% |
| Malaysian | 23 | 0.1% |
| Mexican | 341 | 1.0% |
| Native Hawaiian | 35 | 0.1% |
| Nigerian | 6 | 0.0% |
| Northern European | 95 | 0.3% |
| Norwegian | 4,605 | 14.1% |
| Panamanian | 9 | 0.0% |
| Peruvian | 24 | 0.1% |
| Polish | 2,346 | 7.2% |
| Portuguese | 86 | 0.3% |
| Puerto Rican | 108 | 0.3% |
| Romanian | 10 | 0.0% |
| Russian | 149 | 0.5% |
| Samoan | 35 | 0.1% |
| Scandinavian | 542 | 1.7% |
| Scotch-Irish | 103 | 0.3% |
| Scottish | 318 | 1.0% |
| Serbian | 12 | 0.0% |
| Slovak | 46 | 0.1% |
| Slovene | 36 | 0.1% |
| South American | 116 | 0.4% |
| Sri Lankan | 27 | 0.1% |
| Subsaharan African | 444 | 1.4% |
| Sudanese | 1 | 0.0% |
| Swedish | 2,507 | 7.7% |
| Swiss | 109 | 0.3% |
| Syrian | 9 | 0.0% |
| Thai | 68 | 0.2% |
| Tongan | 6 | 0.0% |
| Ukrainian | 126 | 0.4% |
| Welsh | 129 | 0.4% |
| Yugoslavian | 54 | 0.2% | View All 78 Rows |
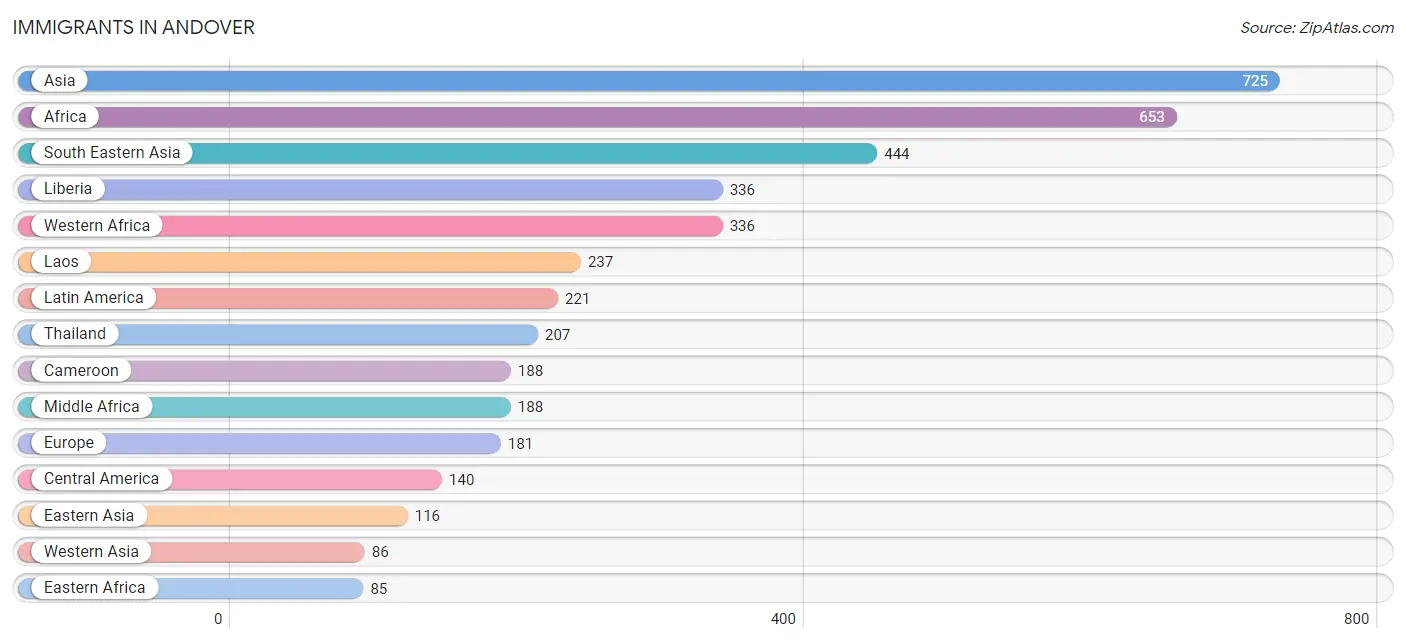
Immigrants in Andover
The most numerous immigrant groups reported in Andover came from Asia (725 | 2.2%), Africa (653 | 2.0%), South Eastern Asia (444 | 1.4%), Liberia (336 | 1.0%), and Western Africa (336 | 1.0%), together accounting for 7.6% of all Andover residents.
| Immigration Origin | # Population | % Population |
| Africa | 653 | 2.0% |
| Asia | 725 | 2.2% |
| Bosnia and Herzegovina | 16 | 0.1% |
| Cameroon | 188 | 0.6% |
| Canada | 12 | 0.0% |
| Central America | 140 | 0.4% |
| Chile | 22 | 0.1% |
| China | 50 | 0.2% |
| Colombia | 48 | 0.2% |
| Costa Rica | 10 | 0.0% |
| Eastern Africa | 85 | 0.3% |
| Eastern Asia | 116 | 0.4% |
| Eastern Europe | 31 | 0.1% |
| Egypt | 43 | 0.1% |
| England | 21 | 0.1% |
| Ethiopia | 29 | 0.1% |
| Europe | 181 | 0.5% |
| Germany | 78 | 0.2% |
| Guatemala | 7 | 0.0% |
| Honduras | 56 | 0.2% |
| Hong Kong | 26 | 0.1% |
| India | 79 | 0.2% |
| Iraq | 46 | 0.1% |
| Italy | 23 | 0.1% |
| Kenya | 56 | 0.2% |
| Korea | 66 | 0.2% |
| Laos | 237 | 0.7% |
| Latin America | 221 | 0.7% |
| Liberia | 336 | 1.0% |
| Mexico | 58 | 0.2% |
| Middle Africa | 188 | 0.6% |
| Northern Africa | 44 | 0.1% |
| Northern Europe | 49 | 0.2% |
| Panama | 9 | 0.0% |
| Peru | 11 | 0.0% |
| South America | 81 | 0.3% |
| South Central Asia | 79 | 0.2% |
| South Eastern Asia | 444 | 1.4% |
| Southern Europe | 23 | 0.1% |
| Sudan | 1 | 0.0% |
| Syria | 40 | 0.1% |
| Taiwan | 13 | 0.0% |
| Thailand | 207 | 0.6% |
| Ukraine | 15 | 0.1% |
| Western Africa | 336 | 1.0% |
| Western Asia | 86 | 0.3% |
| Western Europe | 78 | 0.2% | View All 47 Rows |
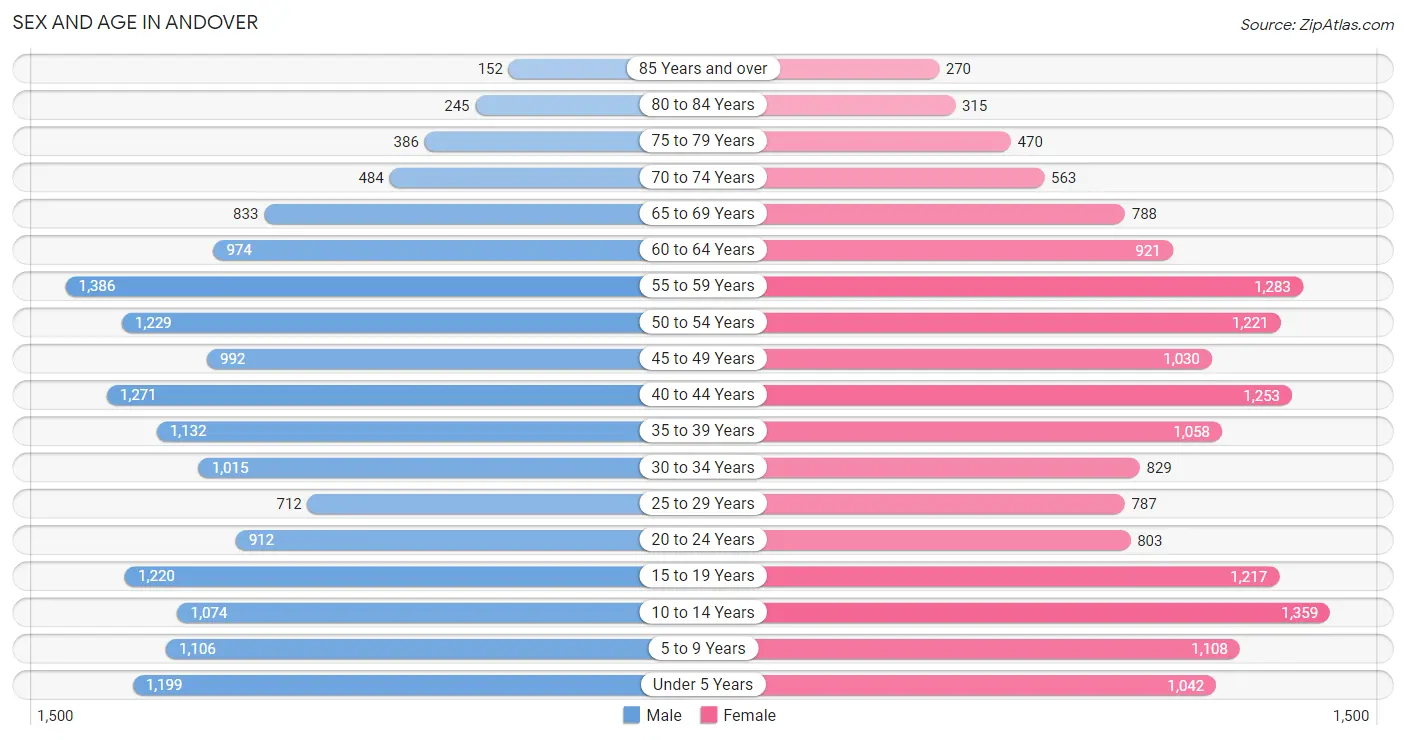
Sex and Age in Andover
Sex and Age in Andover
The most populous age groups in Andover are 55 to 59 Years (1,386 | 8.5%) for men and 10 to 14 Years (1,359 | 8.3%) for women.
| Age Bracket | Male | Female |
| Under 5 Years | 1,199 (7.3%) | 1,042 (6.4%) |
| 5 to 9 Years | 1,106 (6.8%) | 1,108 (6.8%) |
| 10 to 14 Years | 1,074 (6.6%) | 1,359 (8.3%) |
| 15 to 19 Years | 1,220 (7.5%) | 1,217 (7.5%) |
| 20 to 24 Years | 912 (5.6%) | 803 (4.9%) |
| 25 to 29 Years | 712 (4.4%) | 787 (4.8%) |
| 30 to 34 Years | 1,015 (6.2%) | 829 (5.1%) |
| 35 to 39 Years | 1,132 (6.9%) | 1,058 (6.5%) |
| 40 to 44 Years | 1,271 (7.8%) | 1,253 (7.7%) |
| 45 to 49 Years | 992 (6.1%) | 1,030 (6.3%) |
| 50 to 54 Years | 1,229 (7.5%) | 1,221 (7.5%) |
| 55 to 59 Years | 1,386 (8.5%) | 1,283 (7.9%) |
| 60 to 64 Years | 974 (6.0%) | 921 (5.6%) |
| 65 to 69 Years | 833 (5.1%) | 788 (4.8%) |
| 70 to 74 Years | 484 (3.0%) | 563 (3.5%) |
| 75 to 79 Years | 386 (2.4%) | 470 (2.9%) |
| 80 to 84 Years | 245 (1.5%) | 315 (1.9%) |
| 85 Years and over | 152 (0.9%) | 270 (1.7%) |
| Total | 16,322 (100.0%) | 16,317 (100.0%) |
Families and Households in Andover
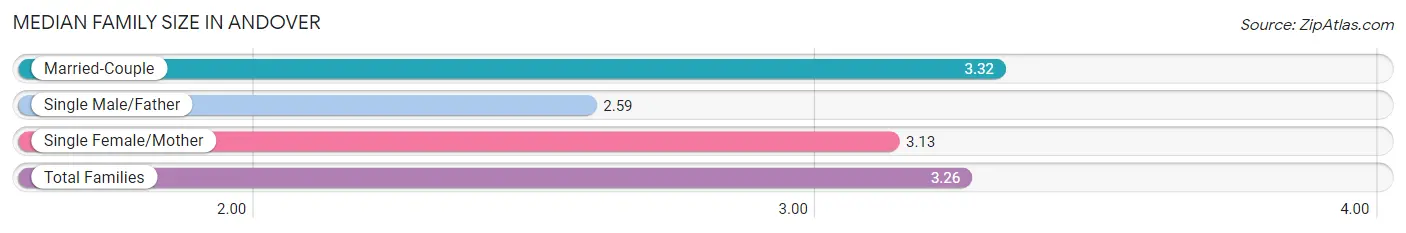
Median Family Size in Andover
The median family size in Andover is 3.26 persons per family, with married-couple families (7,741 | 85.0%) accounting for the largest median family size of 3.32 persons per family. On the other hand, single male/father families (393 | 4.3%) represent the smallest median family size with 2.59 persons per family.
| Family Type | # Families | Family Size |
| Married-Couple | 7,741 (85.0%) | 3.32 |
| Single Male/Father | 393 (4.3%) | 2.59 |
| Single Female/Mother | 978 (10.7%) | 3.13 |
| Total Families | 9,112 (100.0%) | 3.26 |
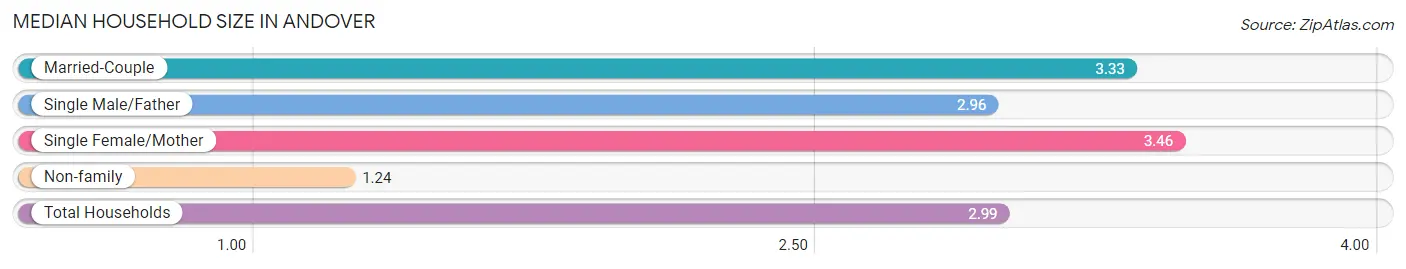
Median Household Size in Andover
The median household size in Andover is 2.99 persons per household, with single female/mother households (978 | 9.0%) accounting for the largest median household size of 3.46 persons per household. non-family households (1,758 | 16.2%) represent the smallest median household size with 1.24 persons per household.
| Household Type | # Households | Household Size |
| Married-Couple | 7,741 (71.2%) | 3.33 |
| Single Male/Father | 393 (3.6%) | 2.96 |
| Single Female/Mother | 978 (9.0%) | 3.46 |
| Non-family | 1,758 (16.2%) | 1.24 |
| Total Households | 10,870 (100.0%) | 2.99 |
Household Size by Marriage Status in Andover
Out of a total of 10,870 households in Andover, 9,112 (83.8%) are family households, while 1,758 (16.2%) are nonfamily households. The most numerous type of family households are 2-person households, comprising 3,471, and the most common type of nonfamily households are 1-person households, comprising 1,436.
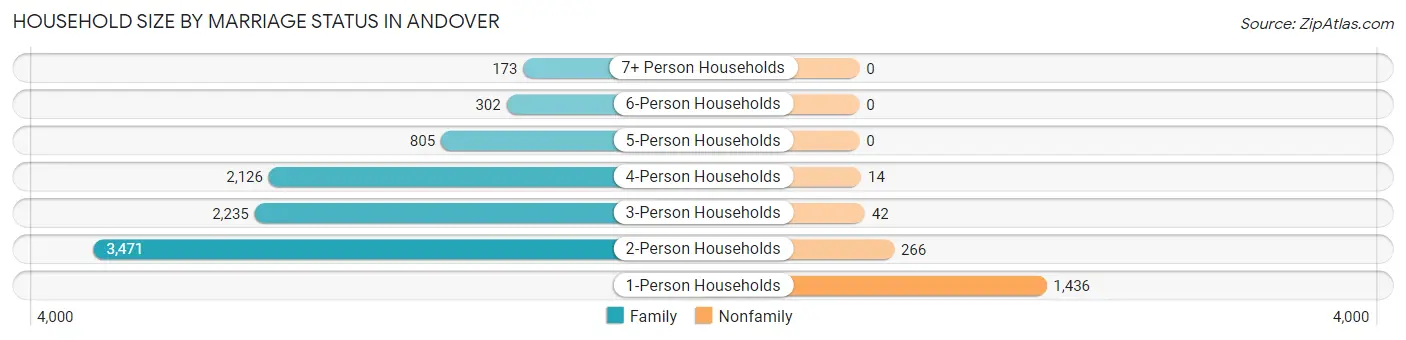
| Household Size | Family Households | Nonfamily Households |
| 1-Person Households | - | 1,436 (13.2%) |
| 2-Person Households | 3,471 (31.9%) | 266 (2.5%) |
| 3-Person Households | 2,235 (20.6%) | 42 (0.4%) |
| 4-Person Households | 2,126 (19.6%) | 14 (0.1%) |
| 5-Person Households | 805 (7.4%) | 0 (0.0%) |
| 6-Person Households | 302 (2.8%) | 0 (0.0%) |
| 7+ Person Households | 173 (1.6%) | 0 (0.0%) |
| Total | 9,112 (83.8%) | 1,758 (16.2%) |
Female Fertility in Andover
Fertility by Age in Andover
Average fertility rate in Andover is 42.0 births per 1,000 women. Women in the age bracket of 20 to 34 years have the highest fertility rate with 104.0 births per 1,000 women. Women in the age bracket of 20 to 34 years acount for 84.6% of all women with births.
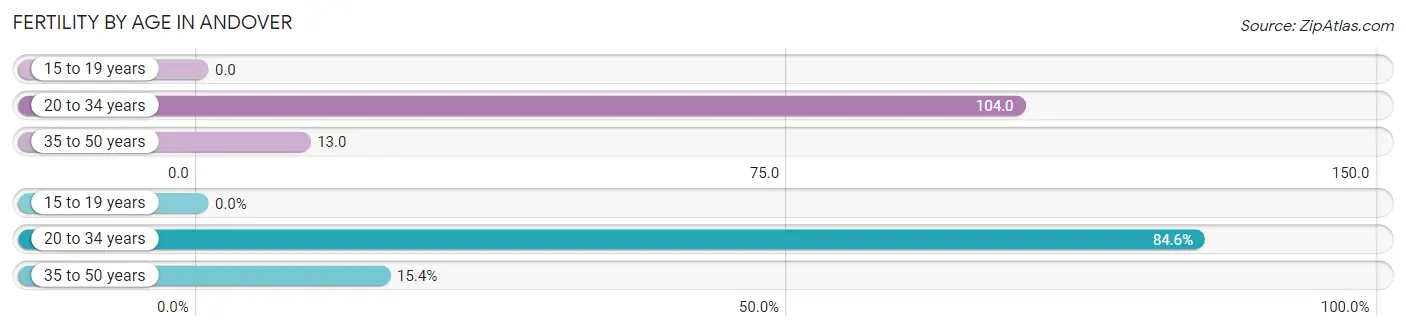
| Age Bracket | Women with Births | Births / 1,000 Women |
| 15 to 19 years | 0 (0.0%) | 0.0 |
| 20 to 34 years | 252 (84.6%) | 104.0 |
| 35 to 50 years | 46 (15.4%) | 13.0 |
| Total | 298 (100.0%) | 42.0 |
Fertility by Age by Marriage Status in Andover
99.7% of women with births (298) in Andover are married. The highest percentage of unmarried women with births falls into 20 to 34 years age bracket with 0.4% of them unmarried at the time of birth, while the lowest percentage of unmarried women with births belong to 35 to 50 years age bracket with 0.0% of them unmarried.
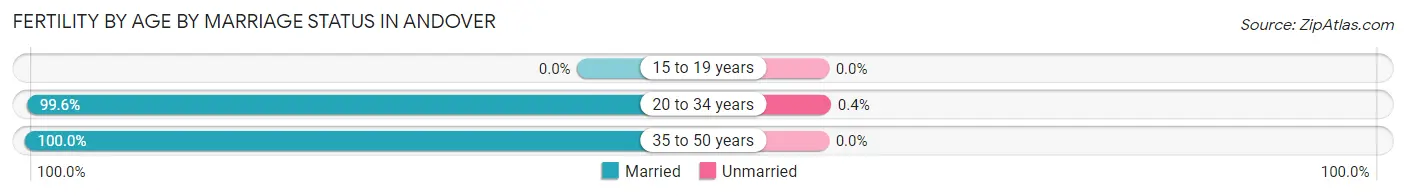
| Age Bracket | Married | Unmarried |
| 15 to 19 years | 0 (0.0%) | 0 (0.0%) |
| 20 to 34 years | 251 (99.6%) | 1 (0.4%) |
| 35 to 50 years | 46 (100.0%) | 0 (0.0%) |
| Total | 297 (99.7%) | 1 (0.3%) |
Fertility by Education in Andover
Average fertility rate in Andover is 42.0 births per 1,000 women. Women with the education attainment of bachelor's degree have the highest fertility rate of 86.0 births per 1,000 women, while women with the education attainment of graduate degree have the lowest fertility at 1.0 births per 1,000 women. Women with the education attainment of bachelor's degree represent 57.1% of all women with births.
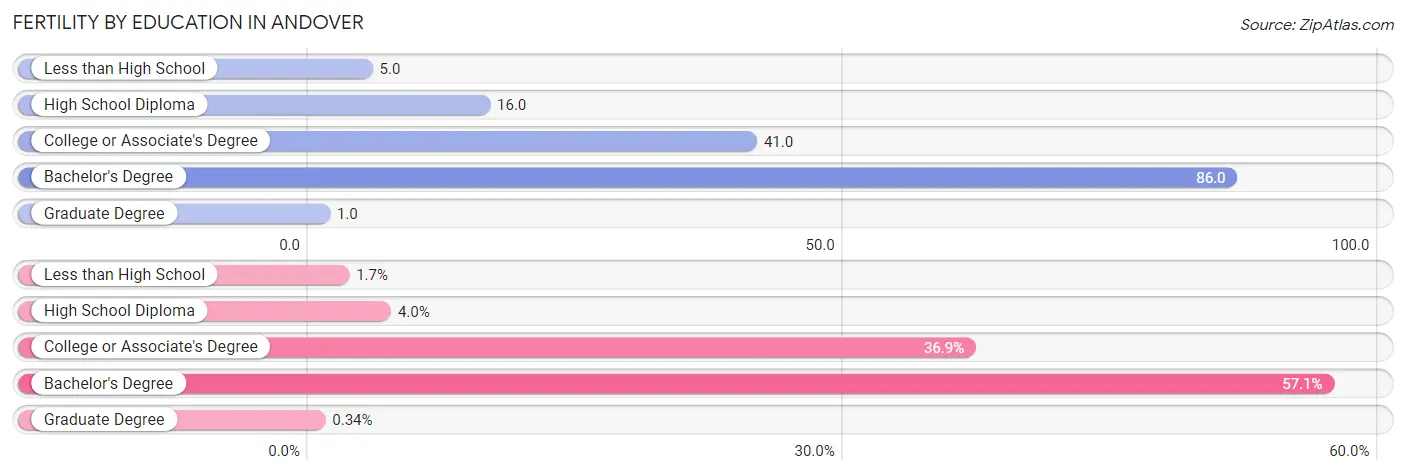
| Educational Attainment | Women with Births | Births / 1,000 Women |
| Less than High School | 5 (1.7%) | 5.0 |
| High School Diploma | 12 (4.0%) | 16.0 |
| College or Associate's Degree | 110 (36.9%) | 41.0 |
| Bachelor's Degree | 170 (57.1%) | 86.0 |
| Graduate Degree | 1 (0.3%) | 1.0 |
| Total | 298 (100.0%) | 42.0 |
Fertility by Education by Marriage Status in Andover
0.3% of women with births in Andover are unmarried. Women with the educational attainment of less than high school are most likely to be married with 100.0% of them married at childbirth, while women with the educational attainment of graduate degree are least likely to be married with 100.0% of them unmarried at childbirth.
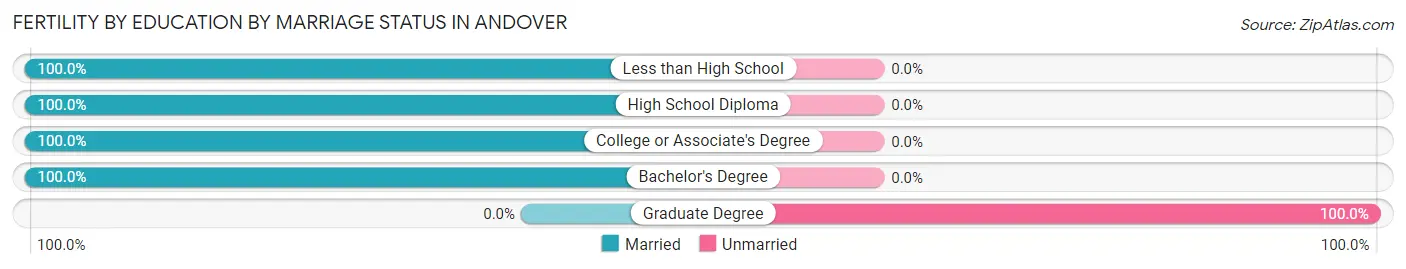
| Educational Attainment | Married | Unmarried |
| Less than High School | 5 (100.0%) | 0 (0.0%) |
| High School Diploma | 12 (100.0%) | 0 (0.0%) |
| College or Associate's Degree | 110 (100.0%) | 0 (0.0%) |
| Bachelor's Degree | 170 (100.0%) | 0 (0.0%) |
| Graduate Degree | 0 (0.0%) | 1 (100.0%) |
| Total | 297 (99.7%) | 1 (0.3%) |
Employment Characteristics in Andover
Employment by Class of Employer in Andover
Among the 17,491 employed individuals in Andover, private company employees (12,482 | 71.4%), local government employees (1,463 | 8.4%), and not-for-profit organizations (1,107 | 6.3%) make up the most common classes of employment.
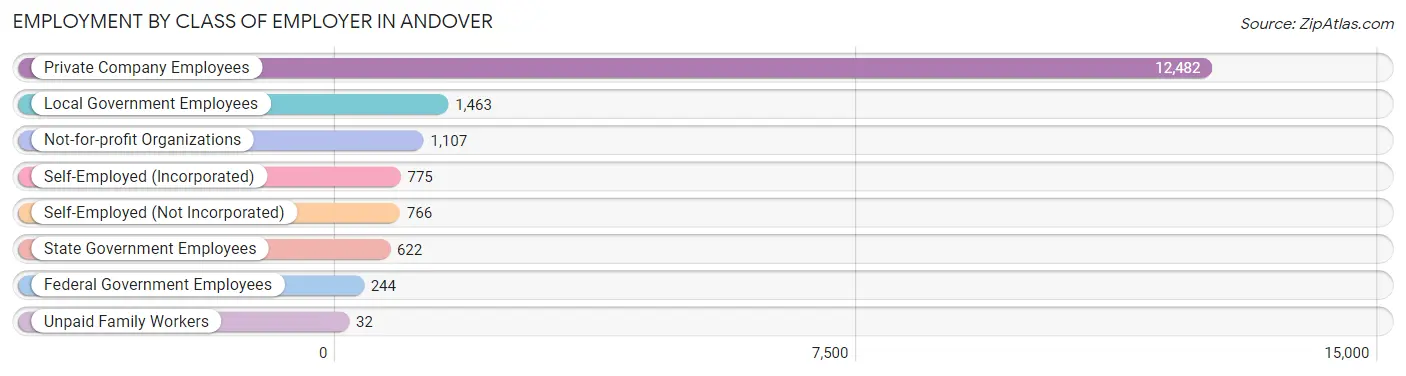
| Employer Class | # Employees | % Employees |
| Private Company Employees | 12,482 | 71.4% |
| Self-Employed (Incorporated) | 775 | 4.4% |
| Self-Employed (Not Incorporated) | 766 | 4.4% |
| Not-for-profit Organizations | 1,107 | 6.3% |
| Local Government Employees | 1,463 | 8.4% |
| State Government Employees | 622 | 3.6% |
| Federal Government Employees | 244 | 1.4% |
| Unpaid Family Workers | 32 | 0.2% |
| Total | 17,491 | 100.0% |
Employment Status by Age in Andover
According to the labor force statistics for Andover, out of the total population over 16 years of age (25,233), 72.3% or 18,243 individuals are in the labor force, with 2.6% or 474 of them unemployed. The age group with the highest labor force participation rate is 35 to 44 years, with 94.8% or 4,469 individuals in the labor force. Within the labor force, the 16 to 19 years age range has the highest percentage of unemployed individuals, with 5.4% or 52 of them being unemployed.
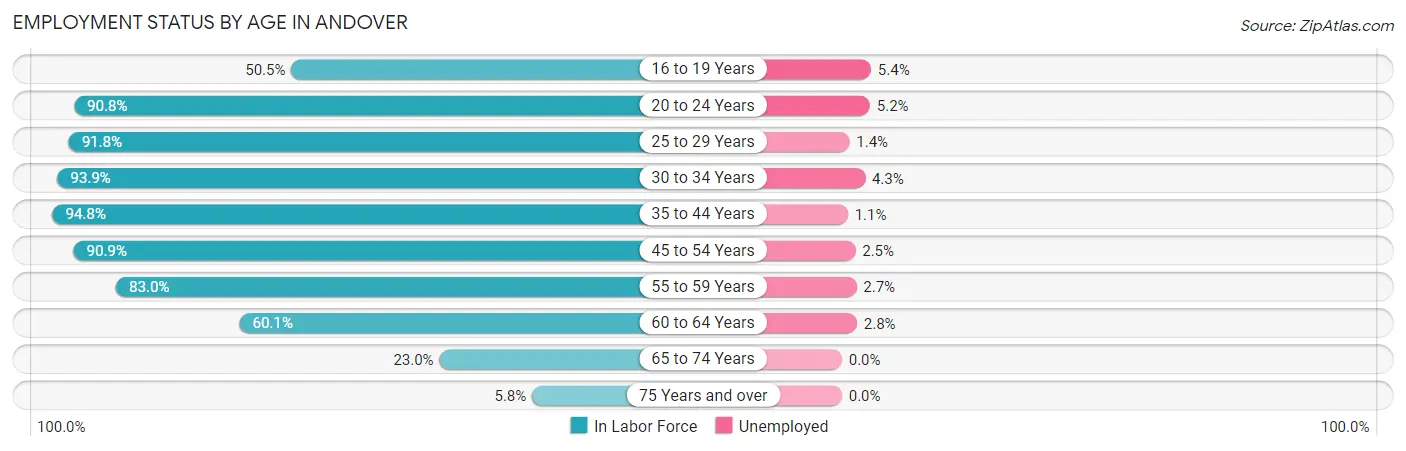
| Age Bracket | In Labor Force | Unemployed |
| 16 to 19 Years | 969 (50.5%) | 52 (5.4%) |
| 20 to 24 Years | 1,557 (90.8%) | 81 (5.2%) |
| 25 to 29 Years | 1,376 (91.8%) | 19 (1.4%) |
| 30 to 34 Years | 1,732 (93.9%) | 74 (4.3%) |
| 35 to 44 Years | 4,469 (94.8%) | 49 (1.1%) |
| 45 to 54 Years | 4,065 (90.9%) | 102 (2.5%) |
| 55 to 59 Years | 2,215 (83.0%) | 60 (2.7%) |
| 60 to 64 Years | 1,139 (60.1%) | 32 (2.8%) |
| 65 to 74 Years | 614 (23.0%) | 0 (0.0%) |
| 75 Years and over | 107 (5.8%) | 0 (0.0%) |
| Total | 18,243 (72.3%) | 474 (2.6%) |
Employment Status by Educational Attainment in Andover
According to labor force statistics for Andover, 87.7% of individuals (14,991) out of the total population between 25 and 64 years of age (17,093) are in the labor force, with 2.2% or 330 of them being unemployed. The group with the highest labor force participation rate are those with the educational attainment of bachelor's degree or higher, with 92.5% or 6,090 individuals in the labor force. Within the labor force, individuals with high school diploma education have the highest percentage of unemployment, with 2.5% or 53 of them being unemployed.
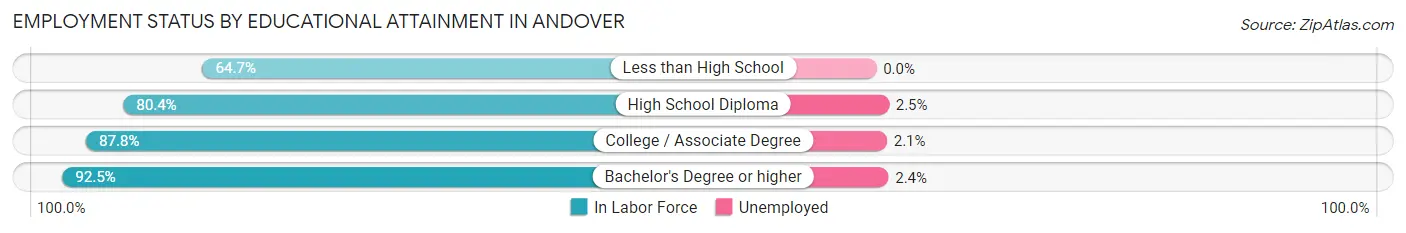
| Educational Attainment | In Labor Force | Unemployed |
| Less than High School | 353 (64.7%) | 0 (0.0%) |
| High School Diploma | 2,134 (80.4%) | 66 (2.5%) |
| College / Associate Degree | 6,417 (87.8%) | 153 (2.1%) |
| Bachelor's Degree or higher | 6,090 (92.5%) | 158 (2.4%) |
| Total | 14,991 (87.7%) | 376 (2.2%) |
Employment Occupations by Sex in Andover
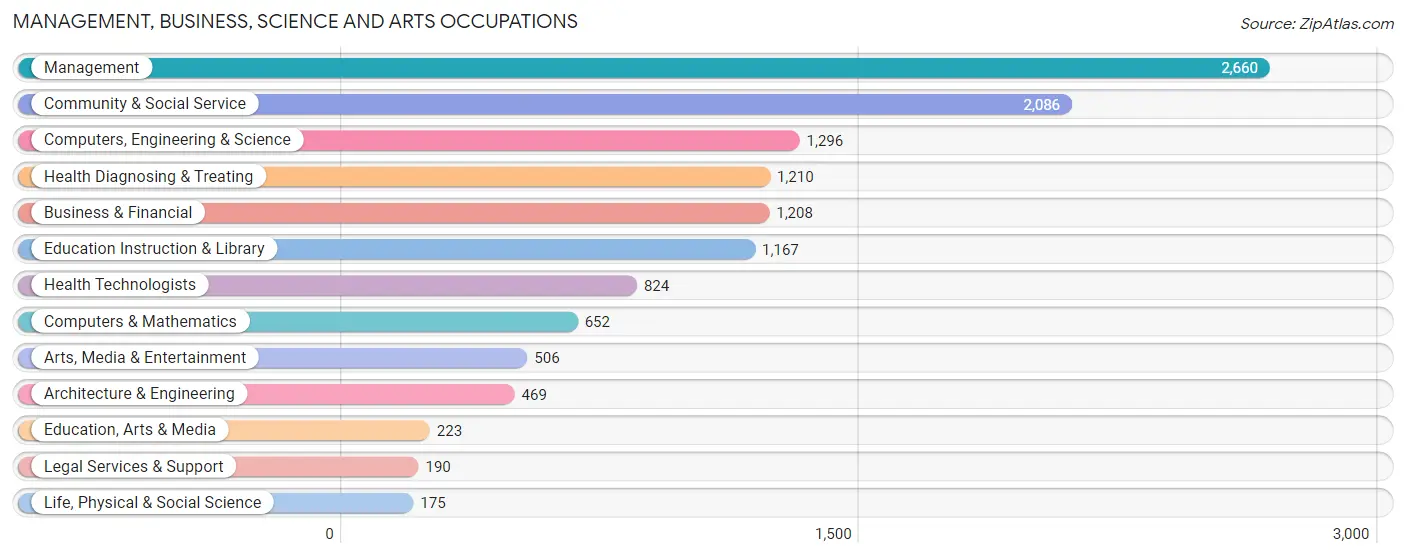
Management, Business, Science and Arts Occupations
The most common Management, Business, Science and Arts occupations in Andover are Management (2,660 | 15.0%), Community & Social Service (2,086 | 11.7%), Computers, Engineering & Science (1,296 | 7.3%), Health Diagnosing & Treating (1,210 | 6.8%), and Business & Financial (1,208 | 6.8%).
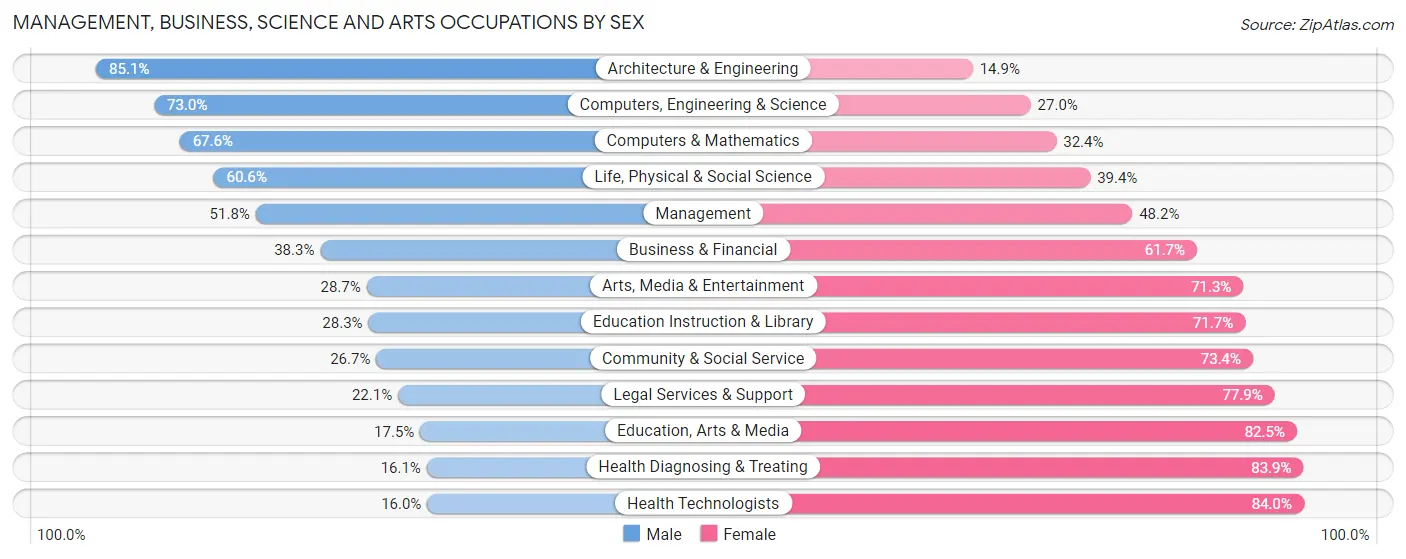
Management, Business, Science and Arts Occupations by Sex
Within the Management, Business, Science and Arts occupations in Andover, the most male-oriented occupations are Architecture & Engineering (85.1%), Computers, Engineering & Science (73.0%), and Computers & Mathematics (67.6%), while the most female-oriented occupations are Health Technologists (84.0%), Health Diagnosing & Treating (83.9%), and Education, Arts & Media (82.5%).
| Occupation | Male | Female |
| Management | 1,378 (51.8%) | 1,282 (48.2%) |
| Business & Financial | 463 (38.3%) | 745 (61.7%) |
| Computers, Engineering & Science | 946 (73.0%) | 350 (27.0%) |
| Computers & Mathematics | 441 (67.6%) | 211 (32.4%) |
| Architecture & Engineering | 399 (85.1%) | 70 (14.9%) |
| Life, Physical & Social Science | 106 (60.6%) | 69 (39.4%) |
| Community & Social Service | 556 (26.7%) | 1,530 (73.4%) |
| Education, Arts & Media | 39 (17.5%) | 184 (82.5%) |
| Legal Services & Support | 42 (22.1%) | 148 (77.9%) |
| Education Instruction & Library | 330 (28.3%) | 837 (71.7%) |
| Arts, Media & Entertainment | 145 (28.7%) | 361 (71.3%) |
| Health Diagnosing & Treating | 195 (16.1%) | 1,015 (83.9%) |
| Health Technologists | 132 (16.0%) | 692 (84.0%) |
| Total (Category) | 3,538 (41.8%) | 4,922 (58.2%) |
| Total (Overall) | 9,180 (51.6%) | 8,592 (48.3%) |
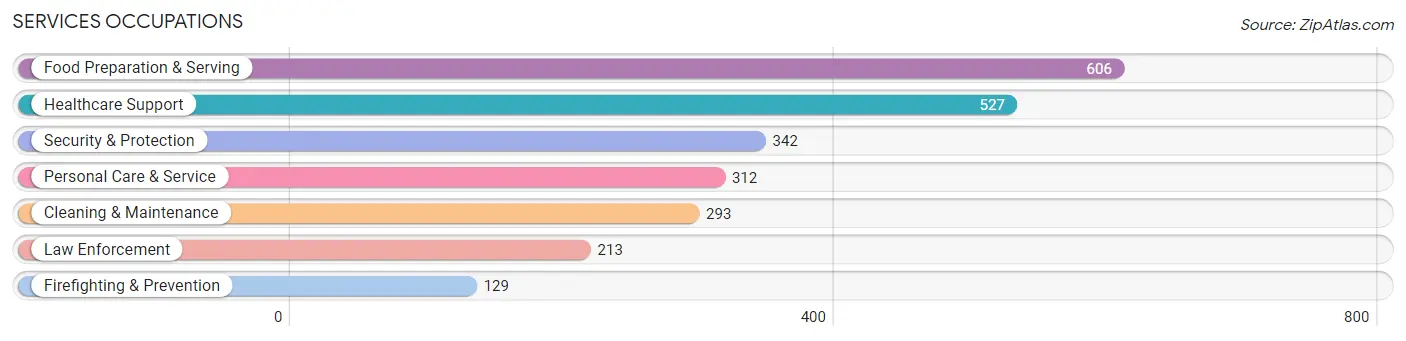
Services Occupations
The most common Services occupations in Andover are Food Preparation & Serving (606 | 3.4%), Healthcare Support (527 | 3.0%), Security & Protection (342 | 1.9%), Personal Care & Service (312 | 1.8%), and Cleaning & Maintenance (293 | 1.7%).
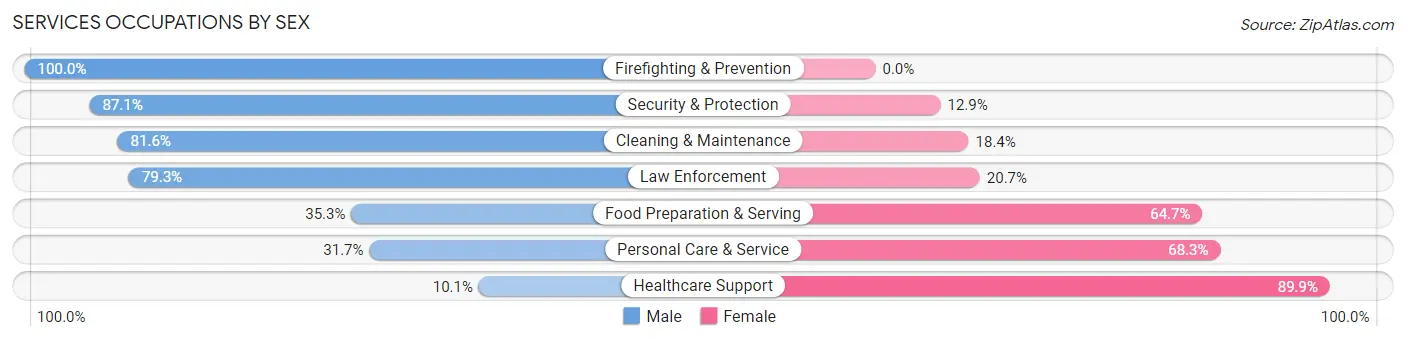
Services Occupations by Sex
Within the Services occupations in Andover, the most male-oriented occupations are Firefighting & Prevention (100.0%), Security & Protection (87.1%), and Cleaning & Maintenance (81.6%), while the most female-oriented occupations are Healthcare Support (89.9%), Personal Care & Service (68.3%), and Food Preparation & Serving (64.7%).
| Occupation | Male | Female |
| Healthcare Support | 53 (10.1%) | 474 (89.9%) |
| Security & Protection | 298 (87.1%) | 44 (12.9%) |
| Firefighting & Prevention | 129 (100.0%) | 0 (0.0%) |
| Law Enforcement | 169 (79.3%) | 44 (20.7%) |
| Food Preparation & Serving | 214 (35.3%) | 392 (64.7%) |
| Cleaning & Maintenance | 239 (81.6%) | 54 (18.4%) |
| Personal Care & Service | 99 (31.7%) | 213 (68.3%) |
| Total (Category) | 903 (43.4%) | 1,177 (56.6%) |
| Total (Overall) | 9,180 (51.6%) | 8,592 (48.3%) |
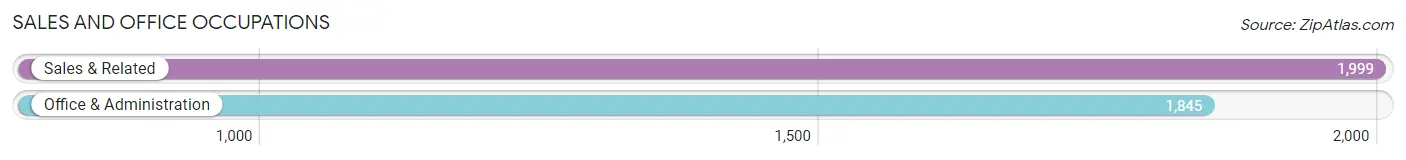
Sales and Office Occupations
The most common Sales and Office occupations in Andover are Sales & Related (1,999 | 11.3%), and Office & Administration (1,845 | 10.4%).
Sales and Office Occupations by Sex
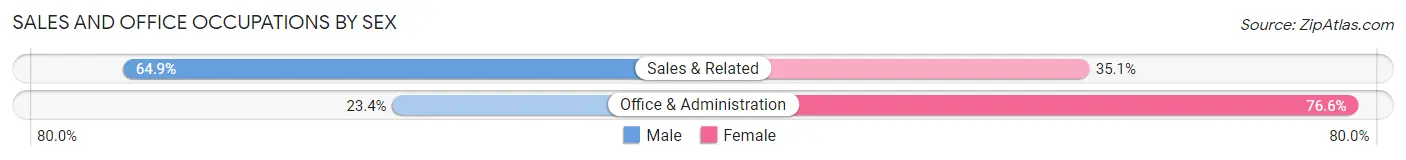
| Occupation | Male | Female |
| Sales & Related | 1,297 (64.9%) | 702 (35.1%) |
| Office & Administration | 432 (23.4%) | 1,413 (76.6%) |
| Total (Category) | 1,729 (45.0%) | 2,115 (55.0%) |
| Total (Overall) | 9,180 (51.6%) | 8,592 (48.3%) |
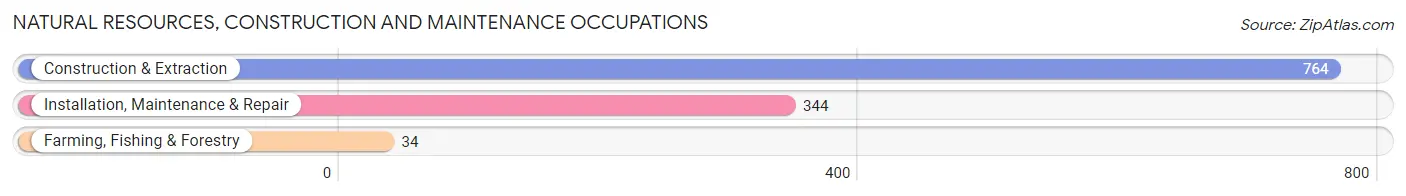
Natural Resources, Construction and Maintenance Occupations
The most common Natural Resources, Construction and Maintenance occupations in Andover are Construction & Extraction (764 | 4.3%), Installation, Maintenance & Repair (344 | 1.9%), and Farming, Fishing & Forestry (34 | 0.2%).
Natural Resources, Construction and Maintenance Occupations by Sex
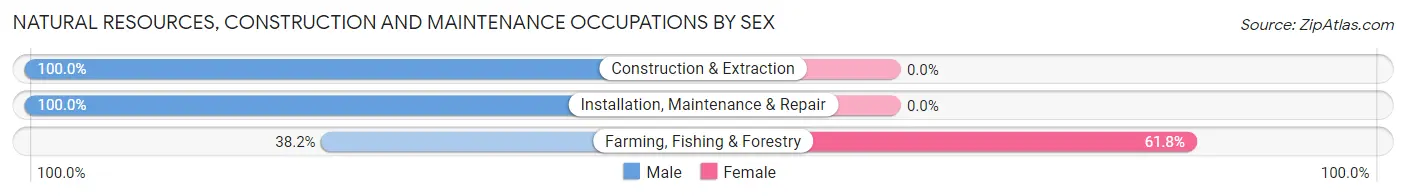
| Occupation | Male | Female |
| Farming, Fishing & Forestry | 13 (38.2%) | 21 (61.8%) |
| Construction & Extraction | 764 (100.0%) | 0 (0.0%) |
| Installation, Maintenance & Repair | 344 (100.0%) | 0 (0.0%) |
| Total (Category) | 1,121 (98.2%) | 21 (1.8%) |
| Total (Overall) | 9,180 (51.6%) | 8,592 (48.3%) |
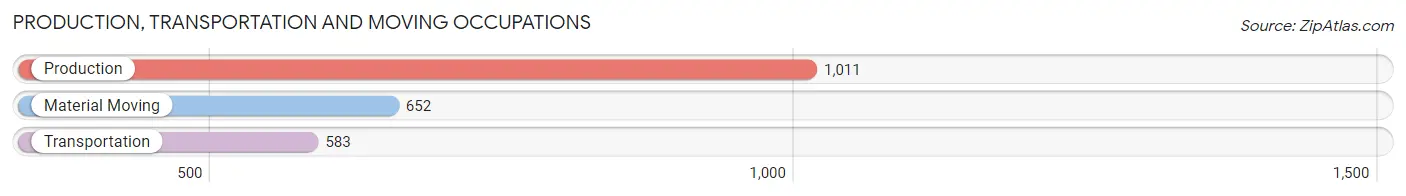
Production, Transportation and Moving Occupations
The most common Production, Transportation and Moving occupations in Andover are Production (1,011 | 5.7%), Material Moving (652 | 3.7%), and Transportation (583 | 3.3%).
Production, Transportation and Moving Occupations by Sex
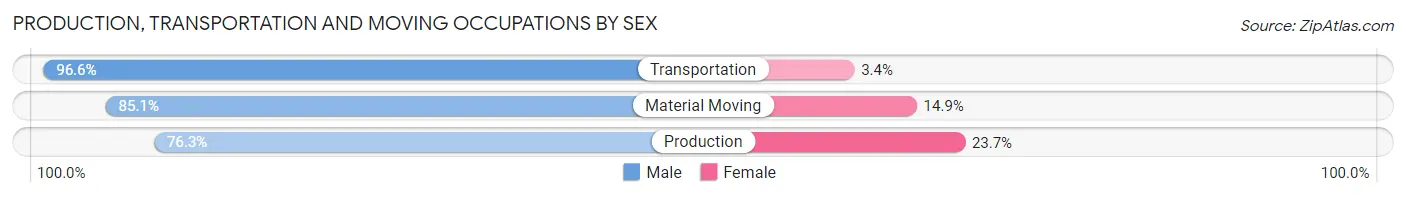
| Occupation | Male | Female |
| Production | 771 (76.3%) | 240 (23.7%) |
| Transportation | 563 (96.6%) | 20 (3.4%) |
| Material Moving | 555 (85.1%) | 97 (14.9%) |
| Total (Category) | 1,889 (84.1%) | 357 (15.9%) |
| Total (Overall) | 9,180 (51.6%) | 8,592 (48.3%) |
Employment Industries by Sex in Andover
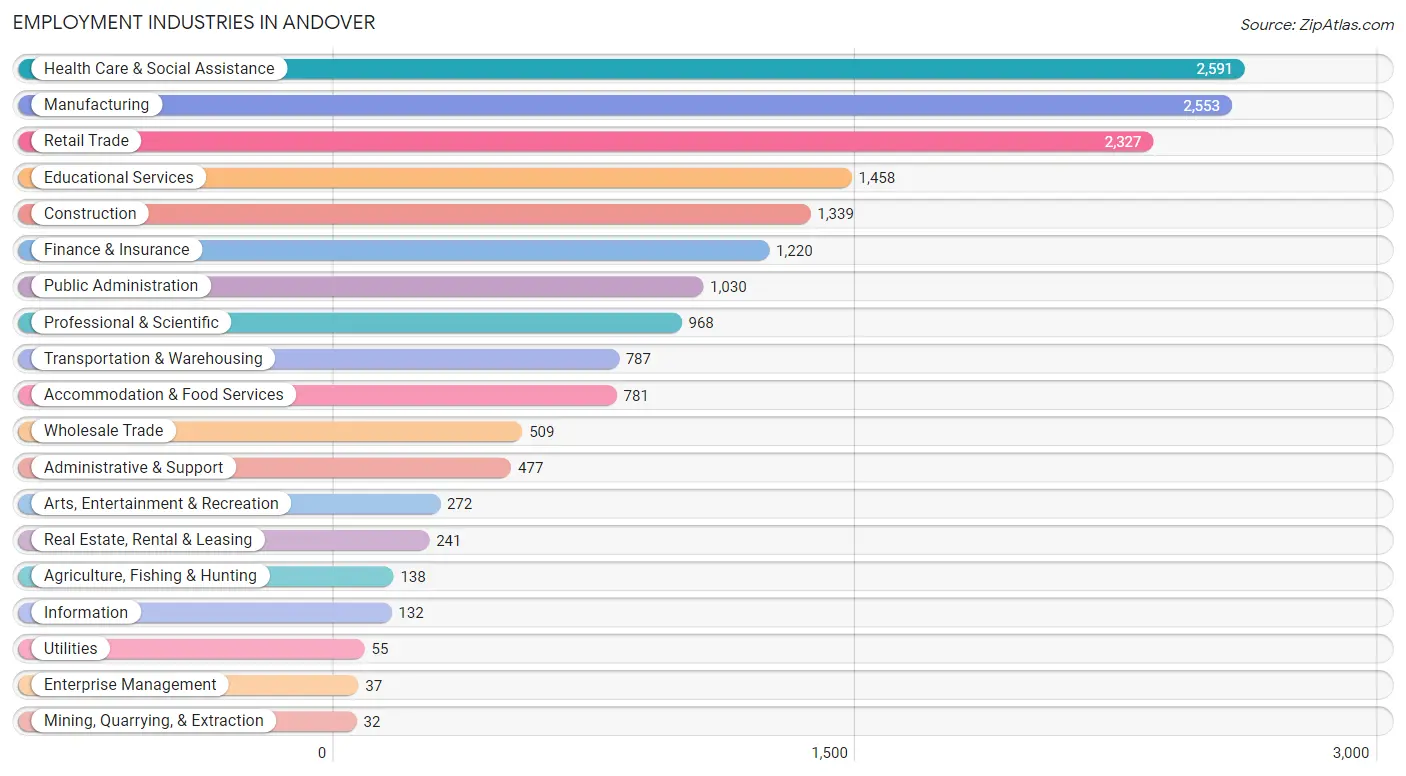
Employment Industries in Andover
The major employment industries in Andover include Health Care & Social Assistance (2,591 | 14.6%), Manufacturing (2,553 | 14.4%), Retail Trade (2,327 | 13.1%), Educational Services (1,458 | 8.2%), and Construction (1,339 | 7.5%).
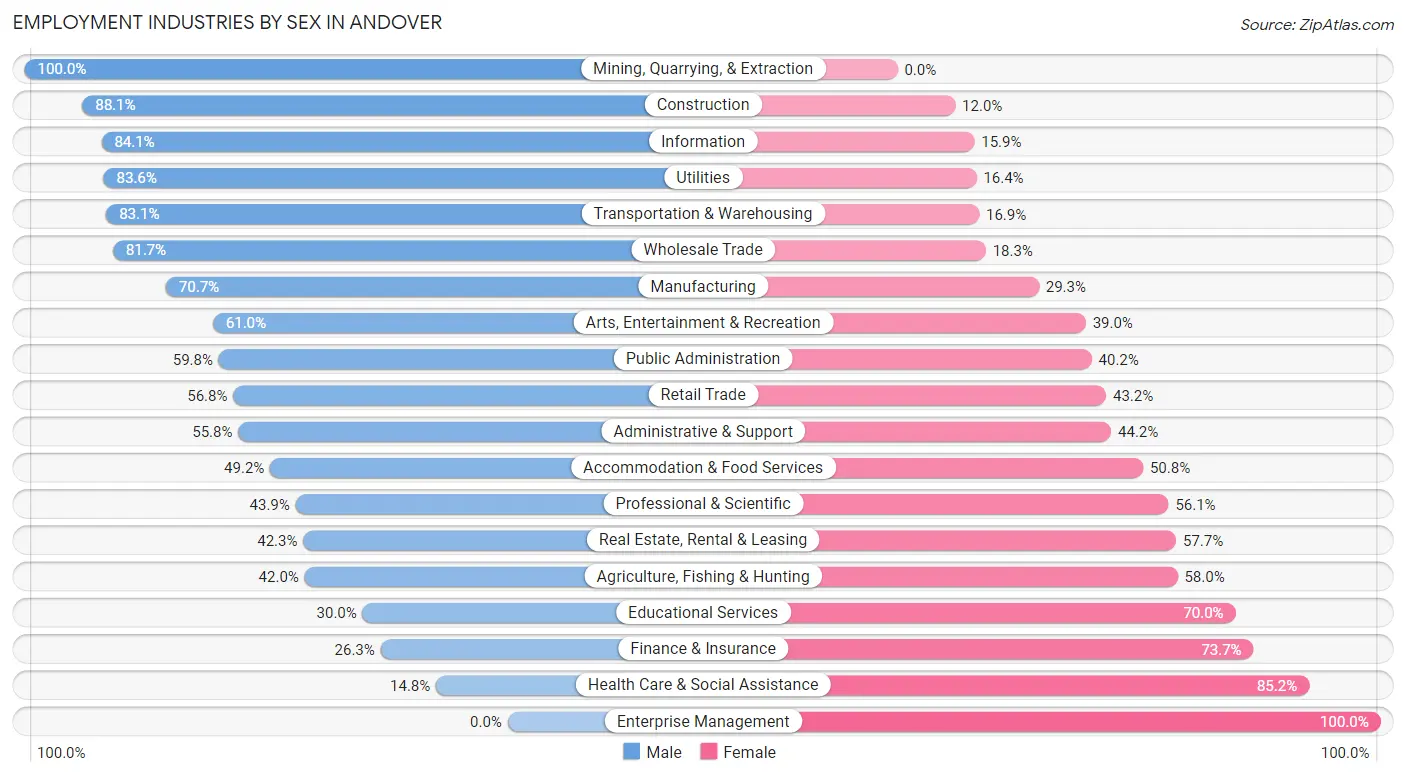
Employment Industries by Sex in Andover
The Andover industries that see more men than women are Mining, Quarrying, & Extraction (100.0%), Construction (88.0%), and Information (84.1%), whereas the industries that tend to have a higher number of women are Enterprise Management (100.0%), Health Care & Social Assistance (85.2%), and Finance & Insurance (73.7%).
| Industry | Male | Female |
| Agriculture, Fishing & Hunting | 58 (42.0%) | 80 (58.0%) |
| Mining, Quarrying, & Extraction | 32 (100.0%) | 0 (0.0%) |
| Construction | 1,179 (88.0%) | 160 (11.9%) |
| Manufacturing | 1,806 (70.7%) | 747 (29.3%) |
| Wholesale Trade | 416 (81.7%) | 93 (18.3%) |
| Retail Trade | 1,322 (56.8%) | 1,005 (43.2%) |
| Transportation & Warehousing | 654 (83.1%) | 133 (16.9%) |
| Utilities | 46 (83.6%) | 9 (16.4%) |
| Information | 111 (84.1%) | 21 (15.9%) |
| Finance & Insurance | 321 (26.3%) | 899 (73.7%) |
| Real Estate, Rental & Leasing | 102 (42.3%) | 139 (57.7%) |
| Professional & Scientific | 425 (43.9%) | 543 (56.1%) |
| Enterprise Management | 0 (0.0%) | 37 (100.0%) |
| Administrative & Support | 266 (55.8%) | 211 (44.2%) |
| Educational Services | 438 (30.0%) | 1,020 (70.0%) |
| Health Care & Social Assistance | 384 (14.8%) | 2,207 (85.2%) |
| Arts, Entertainment & Recreation | 166 (61.0%) | 106 (39.0%) |
| Accommodation & Food Services | 384 (49.2%) | 397 (50.8%) |
| Public Administration | 616 (59.8%) | 414 (40.2%) |
| Total | 9,180 (51.6%) | 8,592 (48.3%) |
Education in Andover
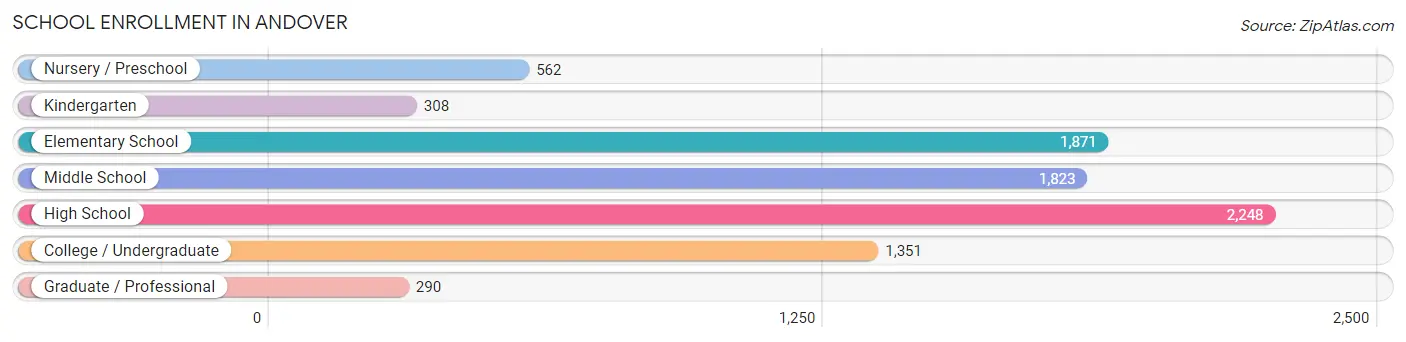
School Enrollment in Andover
The most common levels of schooling among the 8,453 students in Andover are high school (2,248 | 26.6%), elementary school (1,871 | 22.1%), and middle school (1,823 | 21.6%).
| School Level | # Students | % Students |
| Nursery / Preschool | 562 | 6.7% |
| Kindergarten | 308 | 3.6% |
| Elementary School | 1,871 | 22.1% |
| Middle School | 1,823 | 21.6% |
| High School | 2,248 | 26.6% |
| College / Undergraduate | 1,351 | 16.0% |
| Graduate / Professional | 290 | 3.4% |
| Total | 8,453 | 100.0% |
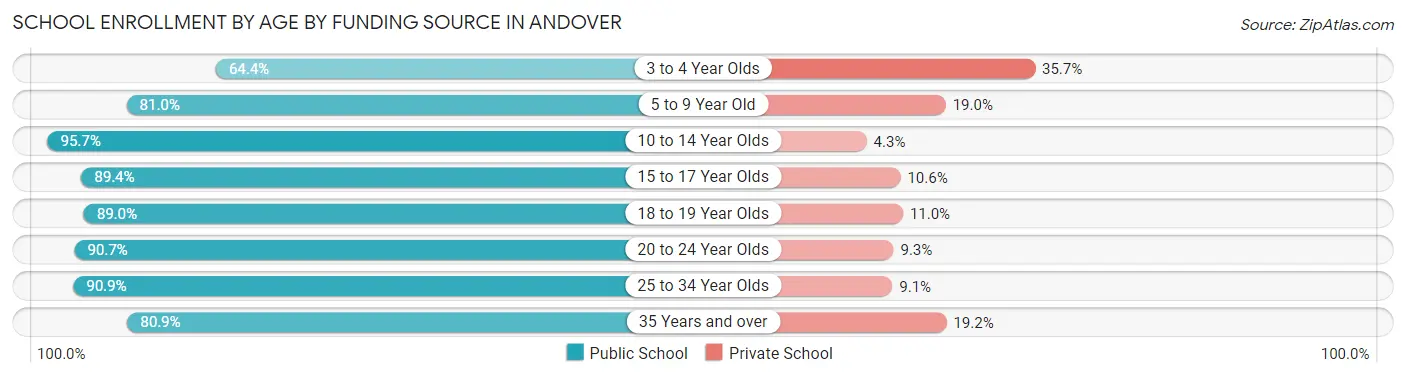
School Enrollment by Age by Funding Source in Andover
Out of a total of 8,453 students who are enrolled in schools in Andover, 1,014 (12.0%) attend a private institution, while the remaining 7,439 (88.0%) are enrolled in public schools. The age group of 3 to 4 year olds has the highest likelihood of being enrolled in private schools, with 128 (35.6% in the age bracket) enrolled. Conversely, the age group of 10 to 14 year olds has the lowest likelihood of being enrolled in a private school, with 2,303 (95.7% in the age bracket) attending a public institution.
| Age Bracket | Public School | Private School |
| 3 to 4 Year Olds | 231 (64.3%) | 128 (35.6%) |
| 5 to 9 Year Old | 1,713 (81.0%) | 402 (19.0%) |
| 10 to 14 Year Olds | 2,303 (95.7%) | 103 (4.3%) |
| 15 to 17 Year Olds | 1,445 (89.4%) | 171 (10.6%) |
| 18 to 19 Year Olds | 588 (89.0%) | 73 (11.0%) |
| 20 to 24 Year Olds | 635 (90.7%) | 65 (9.3%) |
| 25 to 34 Year Olds | 371 (90.9%) | 37 (9.1%) |
| 35 Years and over | 152 (80.8%) | 36 (19.2%) |
| Total | 7,439 (88.0%) | 1,014 (12.0%) |
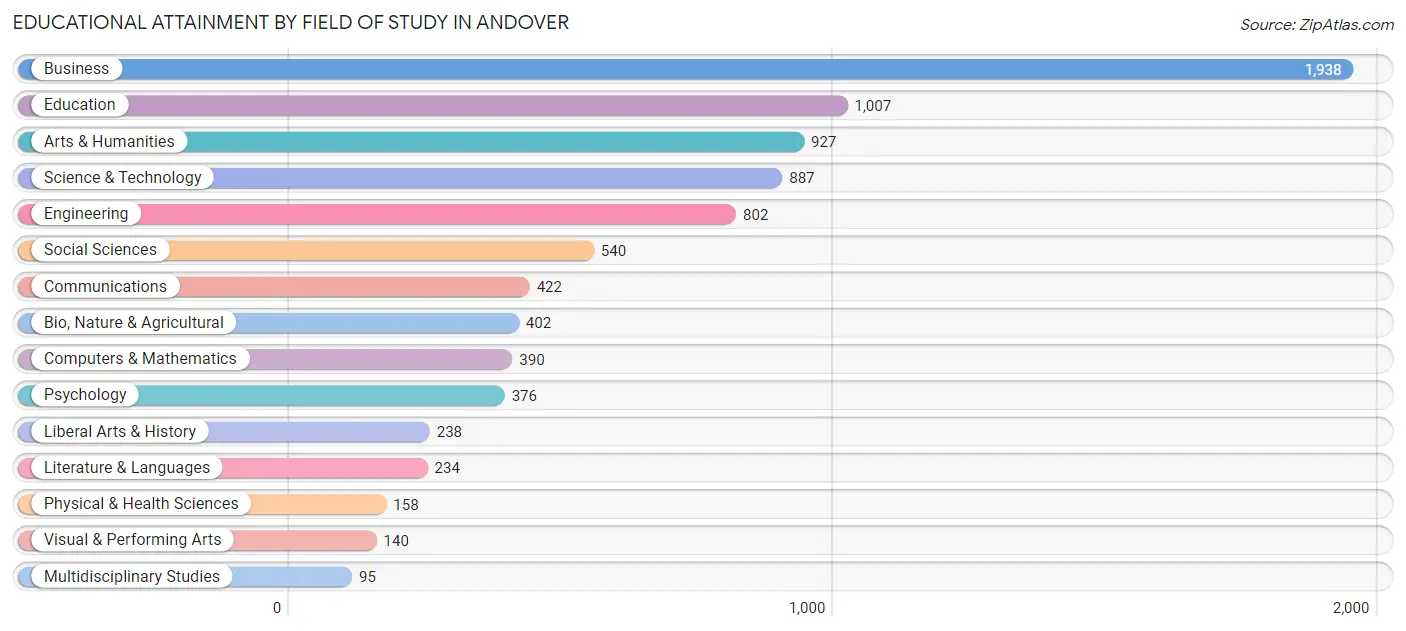
Educational Attainment by Field of Study in Andover
Business (1,938 | 22.7%), education (1,007 | 11.8%), arts & humanities (927 | 10.8%), science & technology (887 | 10.4%), and engineering (802 | 9.4%) are the most common fields of study among 8,556 individuals in Andover who have obtained a bachelor's degree or higher.
| Field of Study | # Graduates | % Graduates |
| Computers & Mathematics | 390 | 4.6% |
| Bio, Nature & Agricultural | 402 | 4.7% |
| Physical & Health Sciences | 158 | 1.8% |
| Psychology | 376 | 4.4% |
| Social Sciences | 540 | 6.3% |
| Engineering | 802 | 9.4% |
| Multidisciplinary Studies | 95 | 1.1% |
| Science & Technology | 887 | 10.4% |
| Business | 1,938 | 22.7% |
| Education | 1,007 | 11.8% |
| Literature & Languages | 234 | 2.7% |
| Liberal Arts & History | 238 | 2.8% |
| Visual & Performing Arts | 140 | 1.6% |
| Communications | 422 | 4.9% |
| Arts & Humanities | 927 | 10.8% |
| Total | 8,556 | 100.0% |
Transportation & Commute in Andover
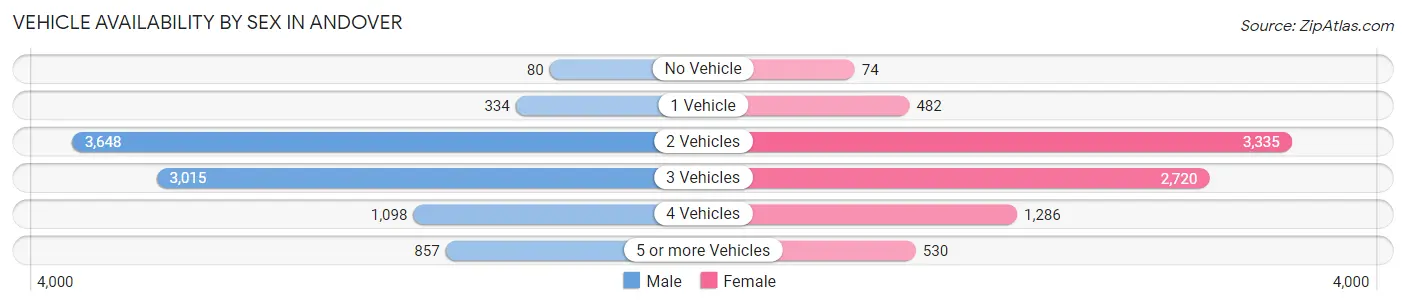
Vehicle Availability by Sex in Andover
The most prevalent vehicle ownership categories in Andover are males with 2 vehicles (3,648, accounting for 40.4%) and females with 2 vehicles (3,335, making up 43.3%).
| Vehicles Available | Male | Female |
| No Vehicle | 80 (0.9%) | 74 (0.9%) |
| 1 Vehicle | 334 (3.7%) | 482 (5.7%) |
| 2 Vehicles | 3,648 (40.4%) | 3,335 (39.6%) |
| 3 Vehicles | 3,015 (33.4%) | 2,720 (32.3%) |
| 4 Vehicles | 1,098 (12.2%) | 1,286 (15.3%) |
| 5 or more Vehicles | 857 (9.5%) | 530 (6.3%) |
| Total | 9,032 (100.0%) | 8,427 (100.0%) |
Commute Time in Andover
The most frequently occuring commute durations in Andover are 30 to 34 minutes (2,209 commuters, 14.6%), 15 to 19 minutes (2,076 commuters, 13.8%), and 20 to 24 minutes (2,007 commuters, 13.3%).
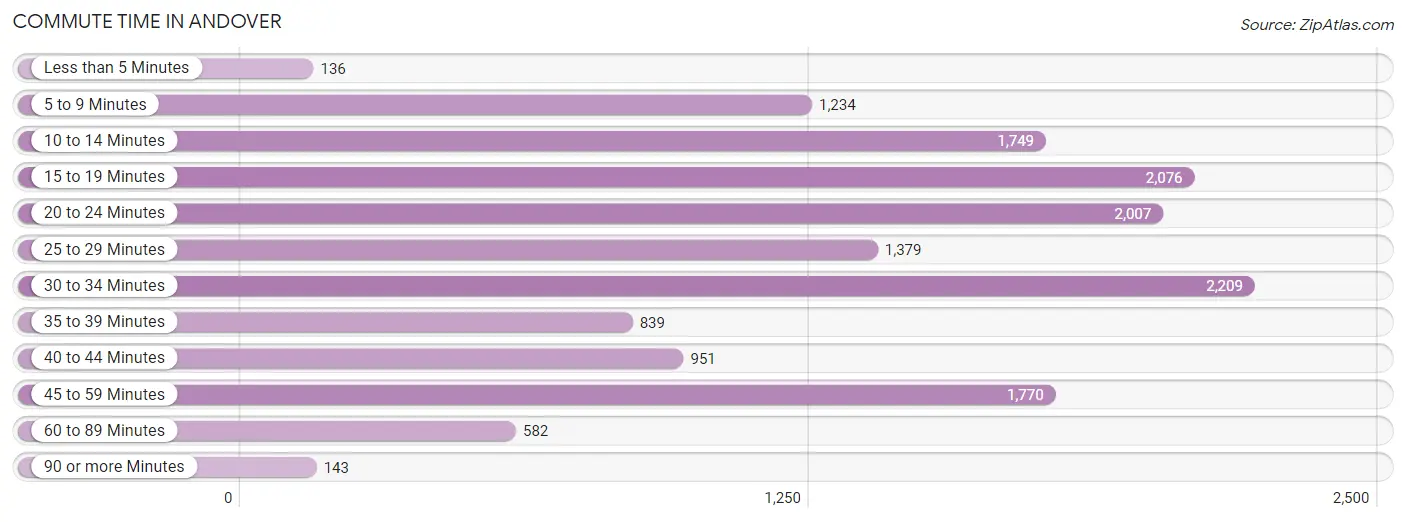
| Commute Time | # Commuters | % Commuters |
| Less than 5 Minutes | 136 | 0.9% |
| 5 to 9 Minutes | 1,234 | 8.2% |
| 10 to 14 Minutes | 1,749 | 11.6% |
| 15 to 19 Minutes | 2,076 | 13.8% |
| 20 to 24 Minutes | 2,007 | 13.3% |
| 25 to 29 Minutes | 1,379 | 9.1% |
| 30 to 34 Minutes | 2,209 | 14.6% |
| 35 to 39 Minutes | 839 | 5.6% |
| 40 to 44 Minutes | 951 | 6.3% |
| 45 to 59 Minutes | 1,770 | 11.7% |
| 60 to 89 Minutes | 582 | 3.9% |
| 90 or more Minutes | 143 | 0.9% |
Commute Time by Sex in Andover
The most common commute times in Andover are 20 to 24 minutes (1,240 commuters, 15.2%) for males and 15 to 19 minutes (1,097 commuters, 15.8%) for females.
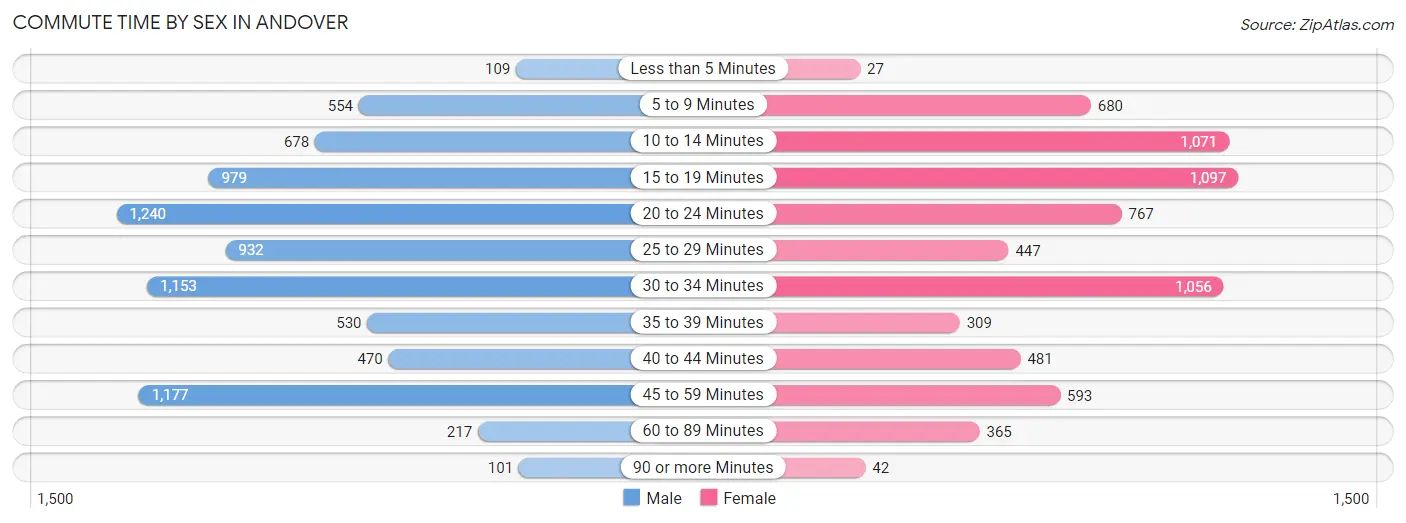
| Commute Time | Male | Female |
| Less than 5 Minutes | 109 (1.3%) | 27 (0.4%) |
| 5 to 9 Minutes | 554 (6.8%) | 680 (9.8%) |
| 10 to 14 Minutes | 678 (8.3%) | 1,071 (15.4%) |
| 15 to 19 Minutes | 979 (12.0%) | 1,097 (15.8%) |
| 20 to 24 Minutes | 1,240 (15.2%) | 767 (11.1%) |
| 25 to 29 Minutes | 932 (11.5%) | 447 (6.5%) |
| 30 to 34 Minutes | 1,153 (14.2%) | 1,056 (15.2%) |
| 35 to 39 Minutes | 530 (6.5%) | 309 (4.5%) |
| 40 to 44 Minutes | 470 (5.8%) | 481 (6.9%) |
| 45 to 59 Minutes | 1,177 (14.5%) | 593 (8.6%) |
| 60 to 89 Minutes | 217 (2.7%) | 365 (5.3%) |
| 90 or more Minutes | 101 (1.2%) | 42 (0.6%) |
Time of Departure to Work by Sex in Andover
The most frequent times of departure to work in Andover are 7:00 AM to 7:29 AM (1,355, 16.7%) for males and 7:00 AM to 7:29 AM (1,199, 17.3%) for females.
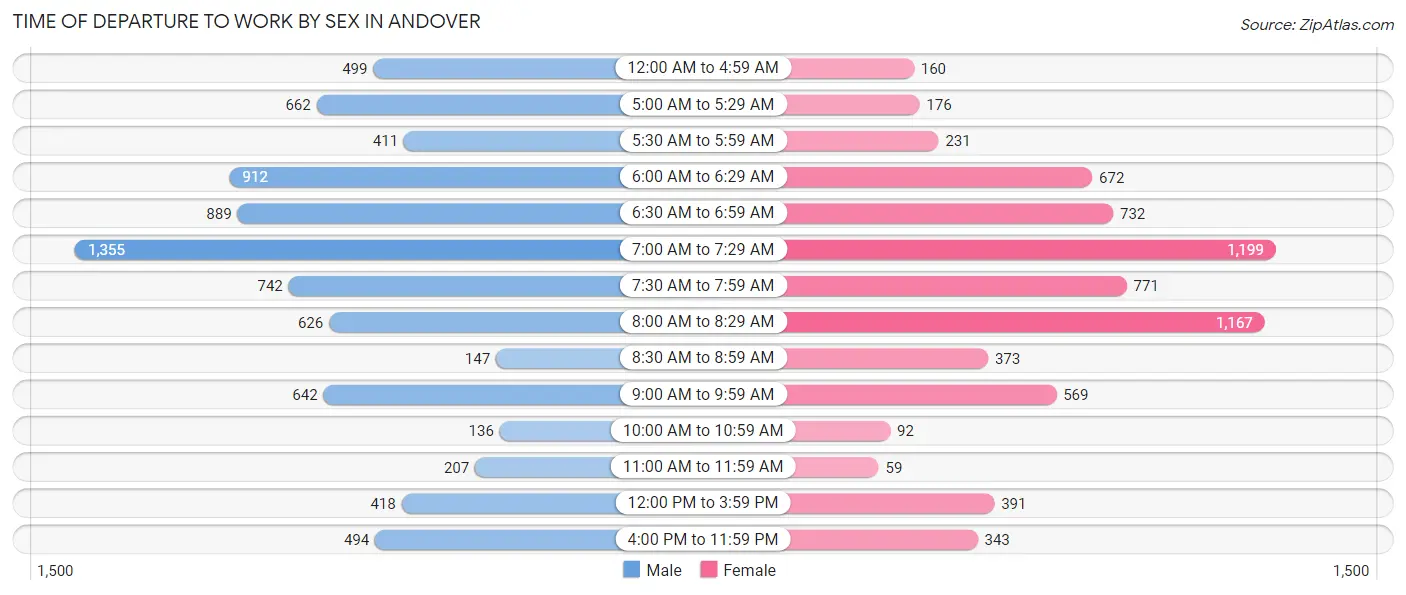
| Time of Departure | Male | Female |
| 12:00 AM to 4:59 AM | 499 (6.1%) | 160 (2.3%) |
| 5:00 AM to 5:29 AM | 662 (8.1%) | 176 (2.5%) |
| 5:30 AM to 5:59 AM | 411 (5.1%) | 231 (3.3%) |
| 6:00 AM to 6:29 AM | 912 (11.2%) | 672 (9.7%) |
| 6:30 AM to 6:59 AM | 889 (10.9%) | 732 (10.6%) |
| 7:00 AM to 7:29 AM | 1,355 (16.7%) | 1,199 (17.3%) |
| 7:30 AM to 7:59 AM | 742 (9.1%) | 771 (11.1%) |
| 8:00 AM to 8:29 AM | 626 (7.7%) | 1,167 (16.8%) |
| 8:30 AM to 8:59 AM | 147 (1.8%) | 373 (5.4%) |
| 9:00 AM to 9:59 AM | 642 (7.9%) | 569 (8.2%) |
| 10:00 AM to 10:59 AM | 136 (1.7%) | 92 (1.3%) |
| 11:00 AM to 11:59 AM | 207 (2.5%) | 59 (0.9%) |
| 12:00 PM to 3:59 PM | 418 (5.1%) | 391 (5.6%) |
| 4:00 PM to 11:59 PM | 494 (6.1%) | 343 (5.0%) |
| Total | 8,140 (100.0%) | 6,935 (100.0%) |
Housing Occupancy in Andover
Occupancy by Ownership in Andover
Of the total 10,870 dwellings in Andover, owner-occupied units account for 10,181 (93.7%), while renter-occupied units make up 689 (6.3%).
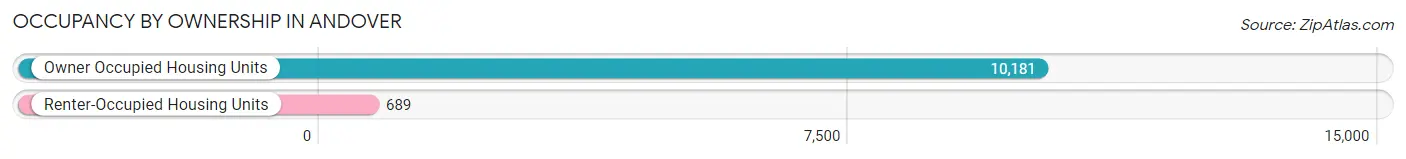
| Occupancy | # Housing Units | % Housing Units |
| Owner Occupied Housing Units | 10,181 | 93.7% |
| Renter-Occupied Housing Units | 689 | 6.3% |
| Total Occupied Housing Units | 10,870 | 100.0% |
Occupancy by Household Size in Andover
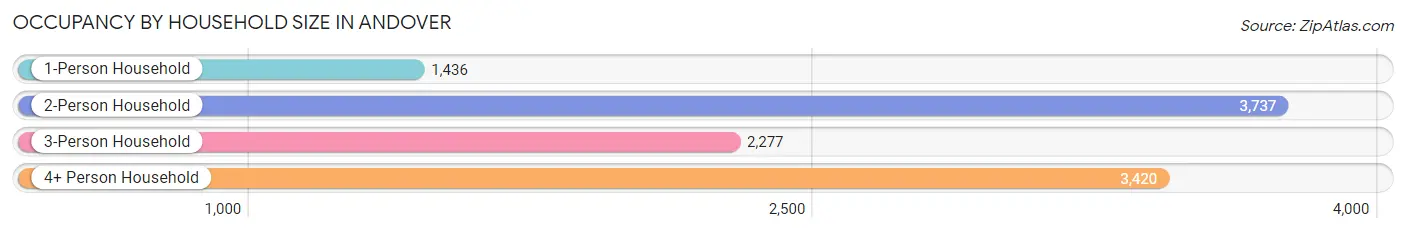
| Household Size | # Housing Units | % Housing Units |
| 1-Person Household | 1,436 | 13.2% |
| 2-Person Household | 3,737 | 34.4% |
| 3-Person Household | 2,277 | 20.9% |
| 4+ Person Household | 3,420 | 31.5% |
| Total Housing Units | 10,870 | 100.0% |
Occupancy by Ownership by Household Size in Andover
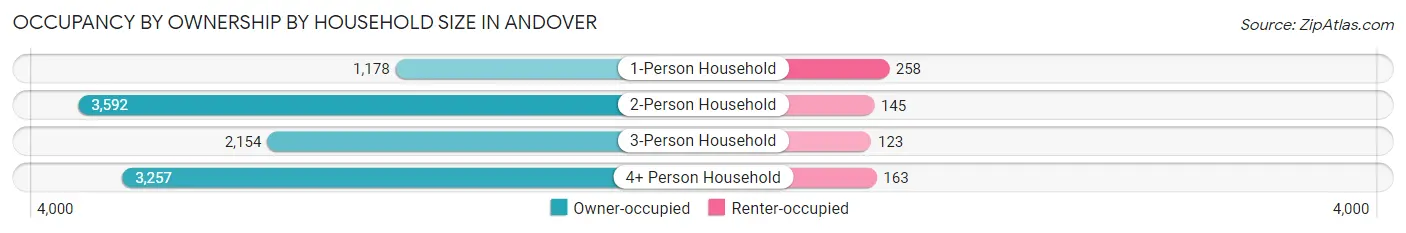
| Household Size | Owner-occupied | Renter-occupied |
| 1-Person Household | 1,178 (82.0%) | 258 (18.0%) |
| 2-Person Household | 3,592 (96.1%) | 145 (3.9%) |
| 3-Person Household | 2,154 (94.6%) | 123 (5.4%) |
| 4+ Person Household | 3,257 (95.2%) | 163 (4.8%) |
| Total Housing Units | 10,181 (93.7%) | 689 (6.3%) |
Occupancy by Educational Attainment in Andover
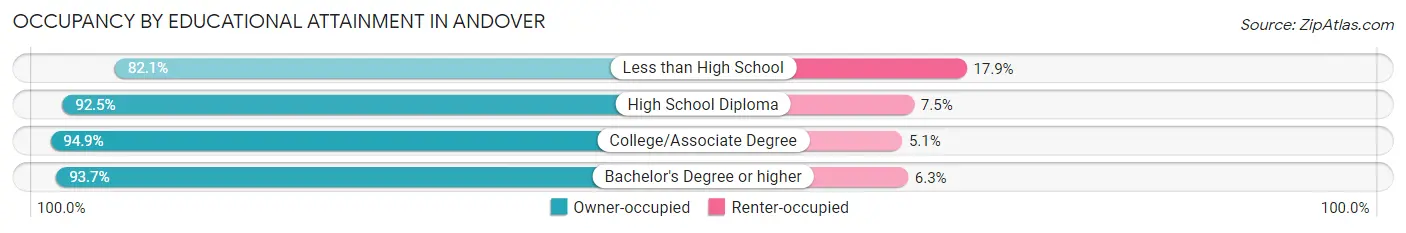
| Household Size | Owner-occupied | Renter-occupied |
| Less than High School | 266 (82.1%) | 58 (17.9%) |
| High School Diploma | 1,583 (92.5%) | 128 (7.5%) |
| College/Associate Degree | 4,231 (94.9%) | 228 (5.1%) |
| Bachelor's Degree or higher | 4,101 (93.7%) | 275 (6.3%) |
Occupancy by Age of Householder in Andover
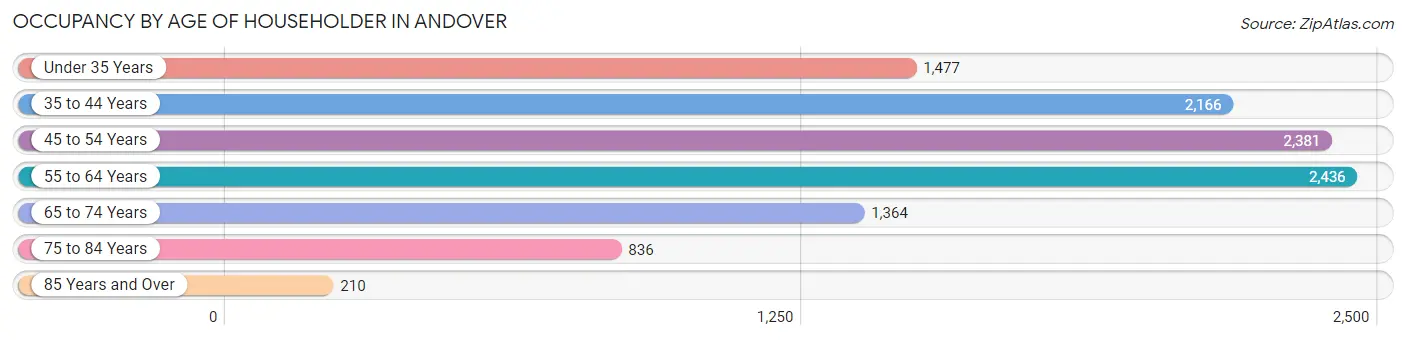
| Age Bracket | # Households | % Households |
| Under 35 Years | 1,477 | 13.6% |
| 35 to 44 Years | 2,166 | 19.9% |
| 45 to 54 Years | 2,381 | 21.9% |
| 55 to 64 Years | 2,436 | 22.4% |
| 65 to 74 Years | 1,364 | 12.6% |
| 75 to 84 Years | 836 | 7.7% |
| 85 Years and Over | 210 | 1.9% |
| Total | 10,870 | 100.0% |
Housing Finances in Andover
Median Income by Occupancy in Andover
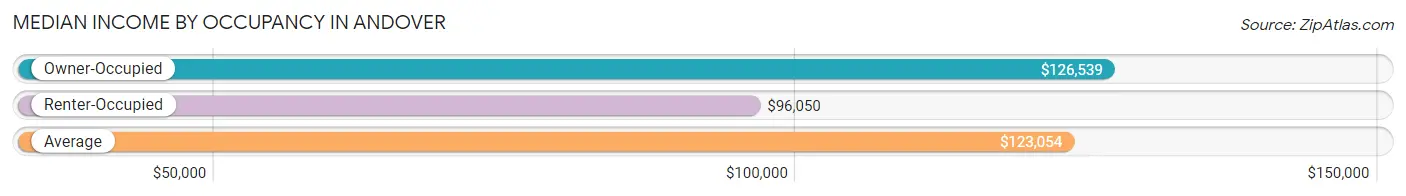
| Occupancy Type | # Households | Median Income |
| Owner-Occupied | 10,181 (93.7%) | $126,539 |
| Renter-Occupied | 689 (6.3%) | $96,050 |
| Average | 10,870 (100.0%) | $123,054 |
Occupancy by Householder Income Bracket in Andover
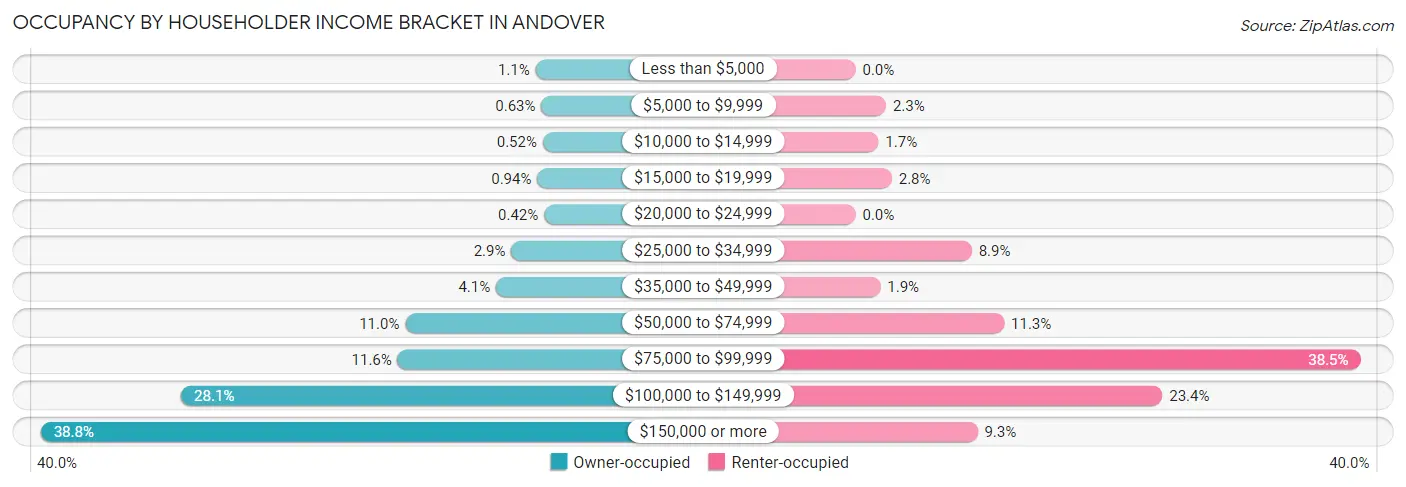
| Income Bracket | Owner-occupied | Renter-occupied |
| Less than $5,000 | 109 (1.1%) | 0 (0.0%) |
| $5,000 to $9,999 | 64 (0.6%) | 16 (2.3%) |
| $10,000 to $14,999 | 53 (0.5%) | 12 (1.7%) |
| $15,000 to $19,999 | 96 (0.9%) | 19 (2.8%) |
| $20,000 to $24,999 | 43 (0.4%) | 0 (0.0%) |
| $25,000 to $34,999 | 297 (2.9%) | 61 (8.8%) |
| $35,000 to $49,999 | 415 (4.1%) | 13 (1.9%) |
| $50,000 to $74,999 | 1,120 (11.0%) | 78 (11.3%) |
| $75,000 to $99,999 | 1,179 (11.6%) | 265 (38.5%) |
| $100,000 to $149,999 | 2,858 (28.1%) | 161 (23.4%) |
| $150,000 or more | 3,947 (38.8%) | 64 (9.3%) |
| Total | 10,181 (100.0%) | 689 (100.0%) |
Monthly Housing Cost Tiers in Andover
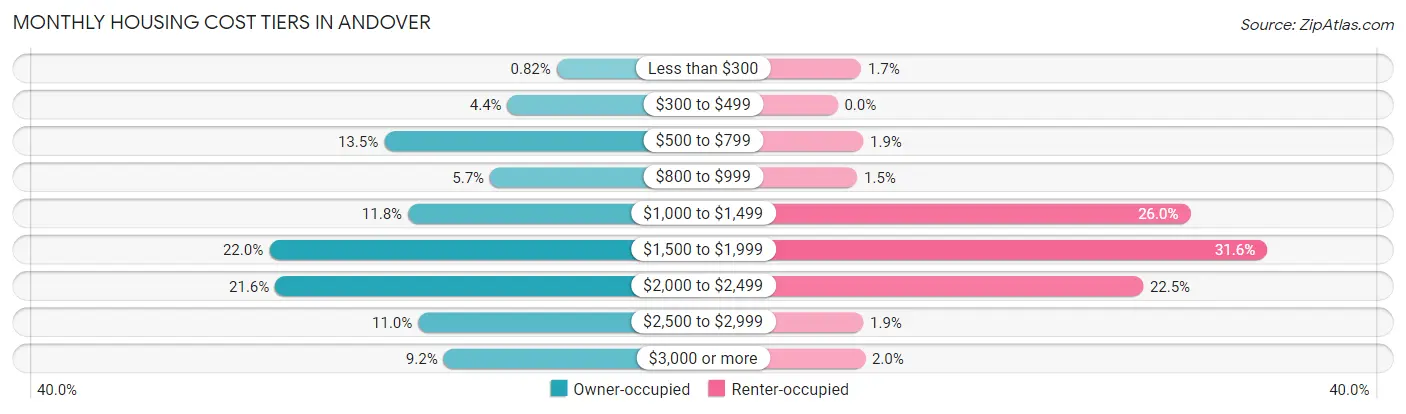
| Monthly Cost | Owner-occupied | Renter-occupied |
| Less than $300 | 83 (0.8%) | 12 (1.7%) |
| $300 to $499 | 452 (4.4%) | 0 (0.0%) |
| $500 to $799 | 1,377 (13.5%) | 13 (1.9%) |
| $800 to $999 | 583 (5.7%) | 10 (1.5%) |
| $1,000 to $1,499 | 1,198 (11.8%) | 179 (26.0%) |
| $1,500 to $1,999 | 2,240 (22.0%) | 218 (31.6%) |
| $2,000 to $2,499 | 2,194 (21.5%) | 155 (22.5%) |
| $2,500 to $2,999 | 1,122 (11.0%) | 13 (1.9%) |
| $3,000 or more | 932 (9.1%) | 14 (2.0%) |
| Total | 10,181 (100.0%) | 689 (100.0%) |
Physical Housing Characteristics in Andover
Housing Structures in Andover
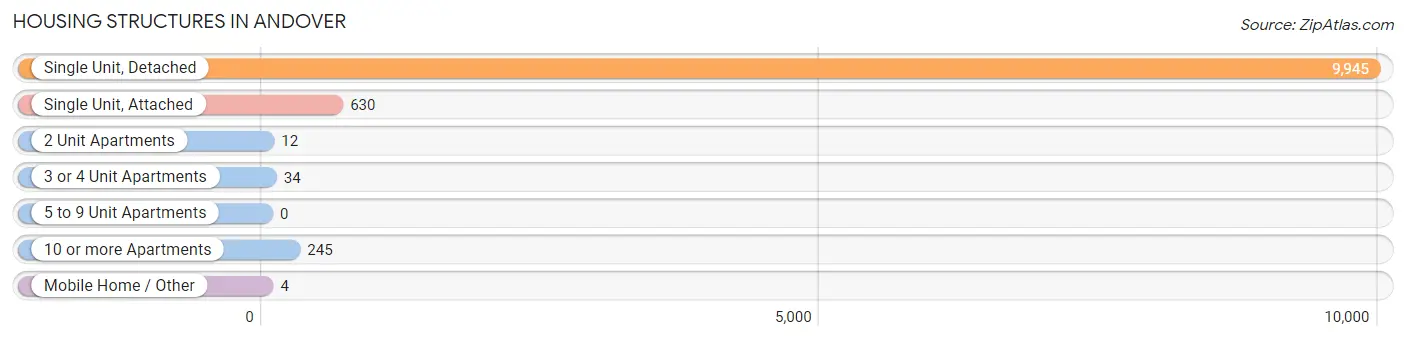
| Structure Type | # Housing Units | % Housing Units |
| Single Unit, Detached | 9,945 | 91.5% |
| Single Unit, Attached | 630 | 5.8% |
| 2 Unit Apartments | 12 | 0.1% |
| 3 or 4 Unit Apartments | 34 | 0.3% |
| 5 to 9 Unit Apartments | 0 | 0.0% |
| 10 or more Apartments | 245 | 2.2% |
| Mobile Home / Other | 4 | 0.0% |
| Total | 10,870 | 100.0% |
Housing Structures by Occupancy in Andover
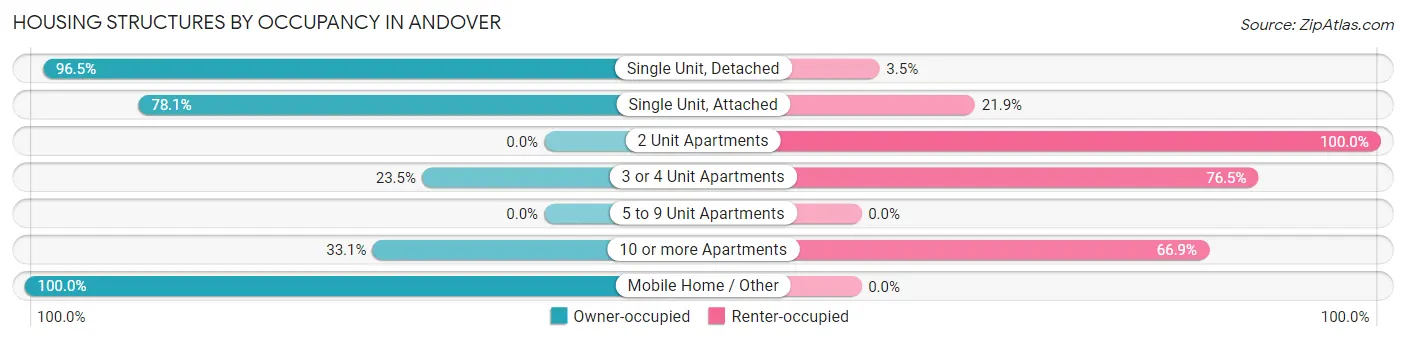
| Structure Type | Owner-occupied | Renter-occupied |
| Single Unit, Detached | 9,596 (96.5%) | 349 (3.5%) |
| Single Unit, Attached | 492 (78.1%) | 138 (21.9%) |
| 2 Unit Apartments | 0 (0.0%) | 12 (100.0%) |
| 3 or 4 Unit Apartments | 8 (23.5%) | 26 (76.5%) |
| 5 to 9 Unit Apartments | 0 (0.0%) | 0 (0.0%) |
| 10 or more Apartments | 81 (33.1%) | 164 (66.9%) |
| Mobile Home / Other | 4 (100.0%) | 0 (0.0%) |
| Total | 10,181 (93.7%) | 689 (6.3%) |
Housing Structures by Number of Rooms in Andover
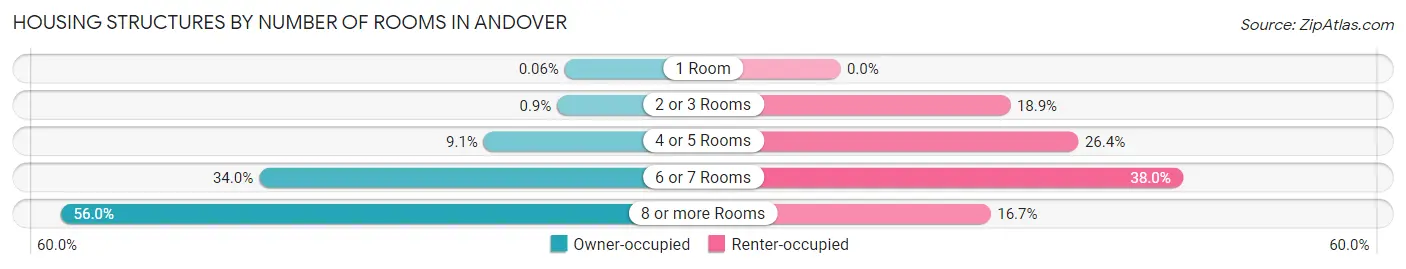
| Number of Rooms | Owner-occupied | Renter-occupied |
| 1 Room | 6 (0.1%) | 0 (0.0%) |
| 2 or 3 Rooms | 92 (0.9%) | 130 (18.9%) |
| 4 or 5 Rooms | 921 (9.0%) | 182 (26.4%) |
| 6 or 7 Rooms | 3,461 (34.0%) | 262 (38.0%) |
| 8 or more Rooms | 5,701 (56.0%) | 115 (16.7%) |
| Total | 10,181 (100.0%) | 689 (100.0%) |
Housing Structure by Heating Type in Andover
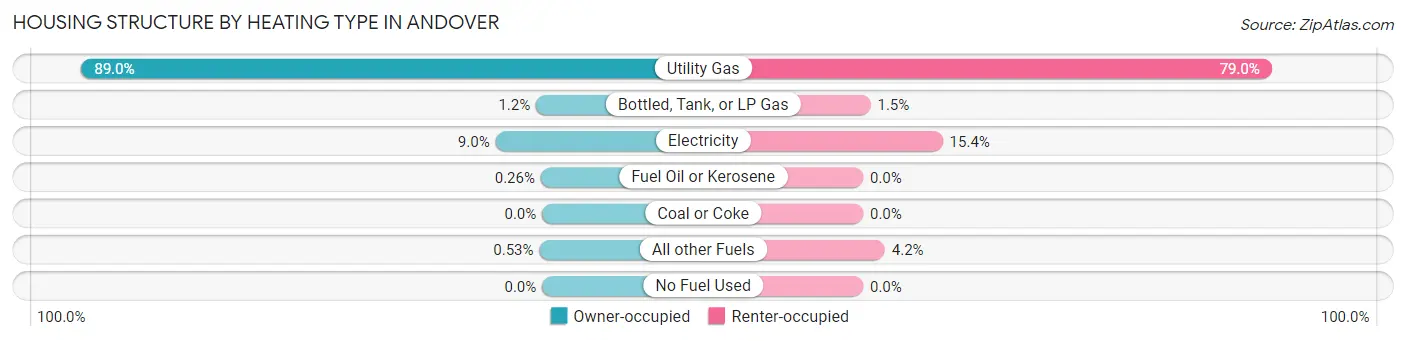
| Heating Type | Owner-occupied | Renter-occupied |
| Utility Gas | 9,065 (89.0%) | 544 (79.0%) |
| Bottled, Tank, or LP Gas | 119 (1.2%) | 10 (1.5%) |
| Electricity | 917 (9.0%) | 106 (15.4%) |
| Fuel Oil or Kerosene | 26 (0.3%) | 0 (0.0%) |
| Coal or Coke | 0 (0.0%) | 0 (0.0%) |
| All other Fuels | 54 (0.5%) | 29 (4.2%) |
| No Fuel Used | 0 (0.0%) | 0 (0.0%) |
| Total | 10,181 (100.0%) | 689 (100.0%) |
Household Vehicle Usage in Andover
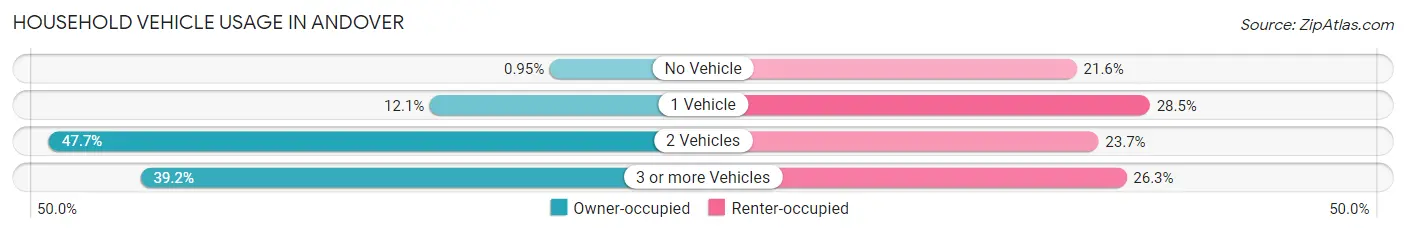
| Vehicles per Household | Owner-occupied | Renter-occupied |
| No Vehicle | 97 (0.9%) | 149 (21.6%) |
| 1 Vehicle | 1,236 (12.1%) | 196 (28.4%) |
| 2 Vehicles | 4,859 (47.7%) | 163 (23.7%) |
| 3 or more Vehicles | 3,989 (39.2%) | 181 (26.3%) |
| Total | 10,181 (100.0%) | 689 (100.0%) |
Real Estate & Mortgages in Andover
Real Estate and Mortgage Overview in Andover
| Characteristic | Without Mortgage | With Mortgage |
| Housing Units | 2,563 | 7,618 |
| Median Property Value | $345,200 | $377,200 |
| Median Household Income | $102,096 | $3,277 |
| Monthly Housing Costs | $663 | $932 |
| Real Estate Taxes | $3,351 | $55 |
Property Value by Mortgage Status in Andover
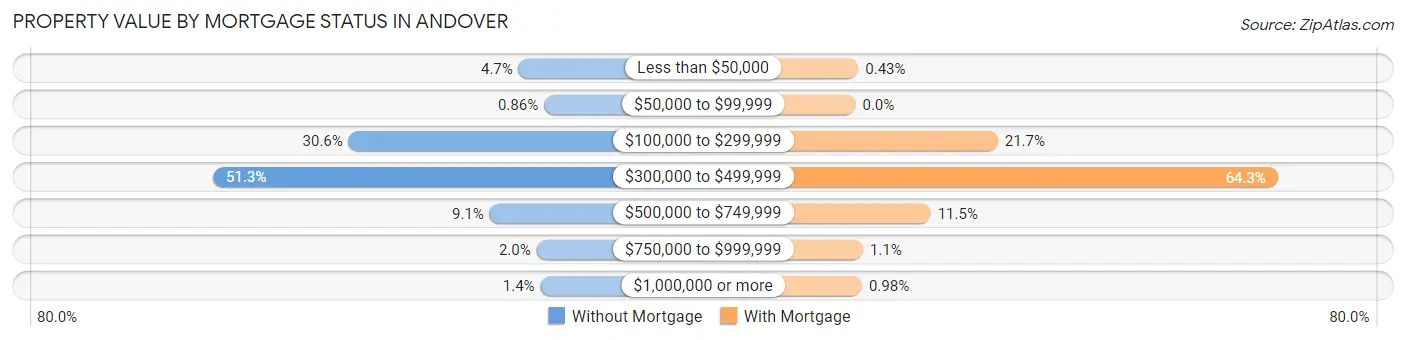
| Property Value | Without Mortgage | With Mortgage |
| Less than $50,000 | 121 (4.7%) | 33 (0.4%) |
| $50,000 to $99,999 | 22 (0.9%) | 0 (0.0%) |
| $100,000 to $299,999 | 785 (30.6%) | 1,651 (21.7%) |
| $300,000 to $499,999 | 1,314 (51.3%) | 4,900 (64.3%) |
| $500,000 to $749,999 | 234 (9.1%) | 873 (11.5%) |
| $750,000 to $999,999 | 51 (2.0%) | 86 (1.1%) |
| $1,000,000 or more | 36 (1.4%) | 75 (1.0%) |
| Total | 2,563 (100.0%) | 7,618 (100.0%) |
Household Income by Mortgage Status in Andover
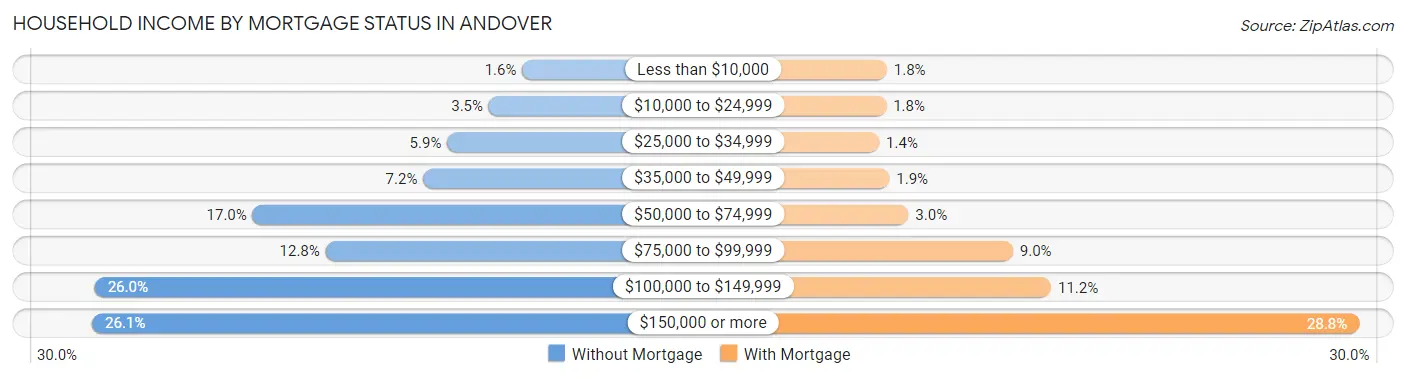
| Household Income | Without Mortgage | With Mortgage |
| Less than $10,000 | 40 (1.6%) | 136 (1.8%) |
| $10,000 to $24,999 | 89 (3.5%) | 133 (1.8%) |
| $25,000 to $34,999 | 150 (5.9%) | 103 (1.3%) |
| $35,000 to $49,999 | 185 (7.2%) | 147 (1.9%) |
| $50,000 to $74,999 | 435 (17.0%) | 230 (3.0%) |
| $75,000 to $99,999 | 328 (12.8%) | 685 (9.0%) |
| $100,000 to $149,999 | 666 (26.0%) | 851 (11.2%) |
| $150,000 or more | 670 (26.1%) | 2,192 (28.8%) |
| Total | 2,563 (100.0%) | 7,618 (100.0%) |
Property Value to Household Income Ratio in Andover
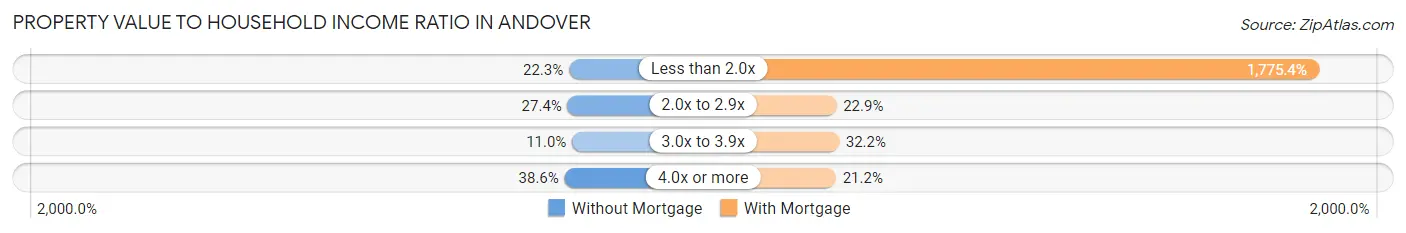
| Value-to-Income Ratio | Without Mortgage | With Mortgage |
| Less than 2.0x | 571 (22.3%) | 135,250 (1,775.4%) |
| 2.0x to 2.9x | 703 (27.4%) | 1,745 (22.9%) |
| 3.0x to 3.9x | 283 (11.0%) | 2,456 (32.2%) |
| 4.0x or more | 989 (38.6%) | 1,613 (21.2%) |
| Total | 2,563 (100.0%) | 7,618 (100.0%) |
Real Estate Taxes by Mortgage Status in Andover
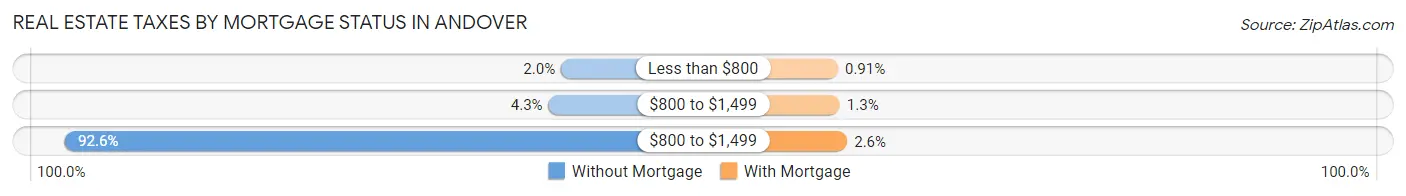
| Property Taxes | Without Mortgage | With Mortgage |
| Less than $800 | 52 (2.0%) | 69 (0.9%) |
| $800 to $1,499 | 111 (4.3%) | 95 (1.3%) |
| $800 to $1,499 | 2,373 (92.6%) | 198 (2.6%) |
| Total | 2,563 (100.0%) | 7,618 (100.0%) |
Health & Disability in Andover
Health Insurance Coverage by Age in Andover
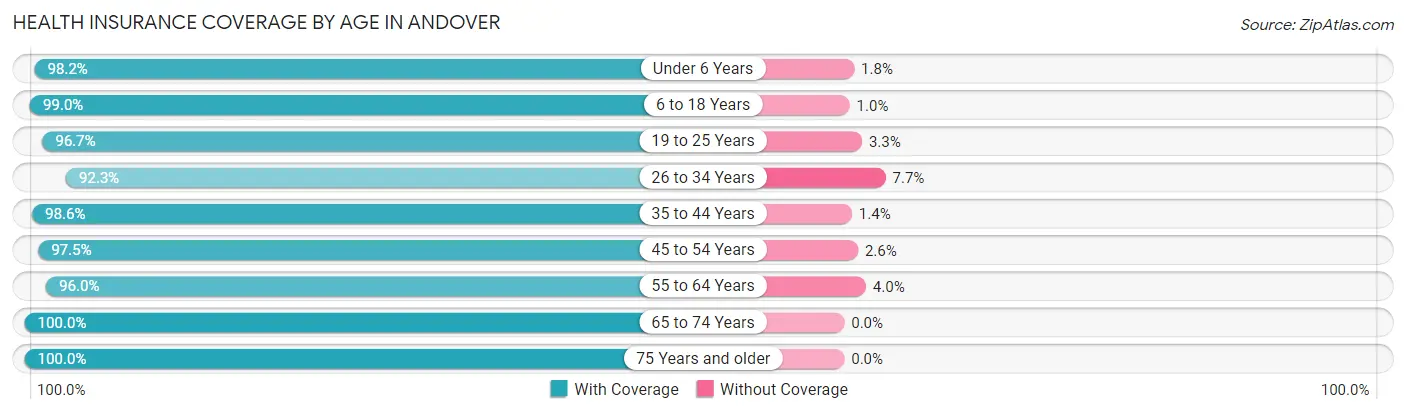
| Age Bracket | With Coverage | Without Coverage |
| Under 6 Years | 2,670 (98.2%) | 50 (1.8%) |
| 6 to 18 Years | 6,259 (99.0%) | 63 (1.0%) |
| 19 to 25 Years | 2,167 (96.7%) | 74 (3.3%) |
| 26 to 34 Years | 2,861 (92.3%) | 239 (7.7%) |
| 35 to 44 Years | 4,638 (98.6%) | 67 (1.4%) |
| 45 to 54 Years | 4,350 (97.5%) | 114 (2.5%) |
| 55 to 64 Years | 4,380 (96.0%) | 184 (4.0%) |
| 65 to 74 Years | 2,668 (100.0%) | 0 (0.0%) |
| 75 Years and older | 1,832 (100.0%) | 0 (0.0%) |
| Total | 31,825 (97.6%) | 791 (2.4%) |
Health Insurance Coverage by Citizenship Status in Andover
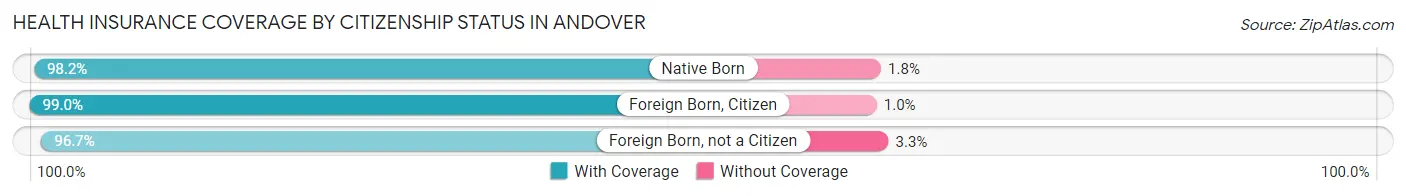
| Citizenship Status | With Coverage | Without Coverage |
| Native Born | 2,670 (98.2%) | 50 (1.8%) |
| Foreign Born, Citizen | 6,259 (99.0%) | 63 (1.0%) |
| Foreign Born, not a Citizen | 2,167 (96.7%) | 74 (3.3%) |
Health Insurance Coverage by Household Income in Andover
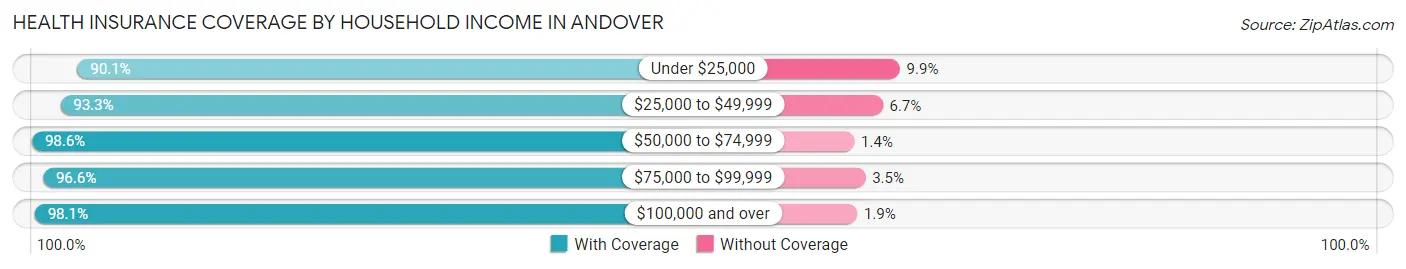
| Household Income | With Coverage | Without Coverage |
| Under $25,000 | 701 (90.1%) | 77 (9.9%) |
| $25,000 to $49,999 | 1,199 (93.3%) | 86 (6.7%) |
| $50,000 to $74,999 | 2,778 (98.6%) | 39 (1.4%) |
| $75,000 to $99,999 | 3,750 (96.6%) | 134 (3.5%) |
| $100,000 and over | 23,309 (98.1%) | 455 (1.9%) |
Public vs Private Health Insurance Coverage by Age in Andover
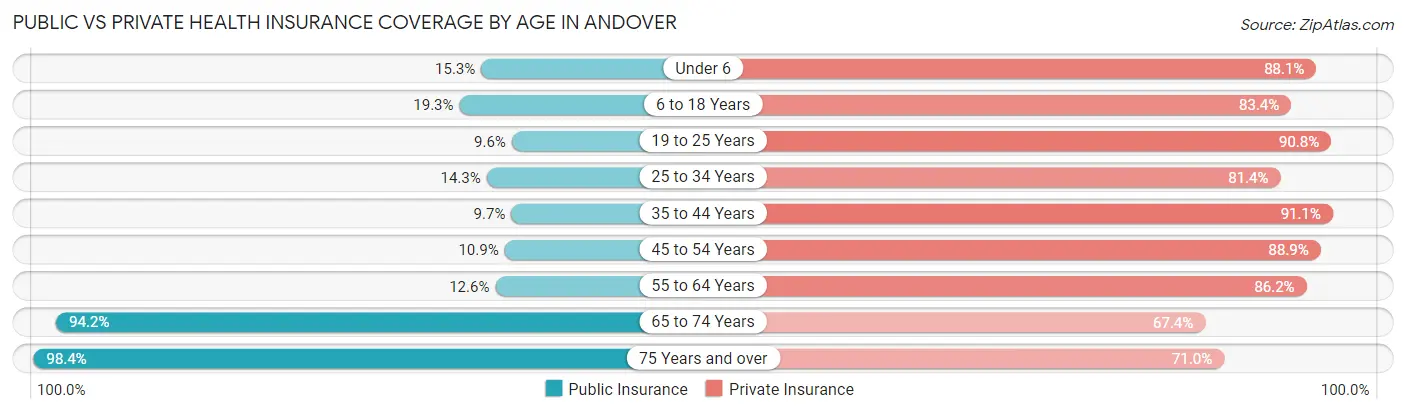
| Age Bracket | Public Insurance | Private Insurance |
| Under 6 | 415 (15.3%) | 2,395 (88.0%) |
| 6 to 18 Years | 1,220 (19.3%) | 5,272 (83.4%) |
| 19 to 25 Years | 215 (9.6%) | 2,035 (90.8%) |
| 25 to 34 Years | 442 (14.3%) | 2,523 (81.4%) |
| 35 to 44 Years | 455 (9.7%) | 4,287 (91.1%) |
| 45 to 54 Years | 488 (10.9%) | 3,967 (88.9%) |
| 55 to 64 Years | 577 (12.6%) | 3,936 (86.2%) |
| 65 to 74 Years | 2,512 (94.2%) | 1,799 (67.4%) |
| 75 Years and over | 1,802 (98.4%) | 1,300 (71.0%) |
| Total | 8,126 (24.9%) | 27,514 (84.4%) |
Disability Status by Sex by Age in Andover
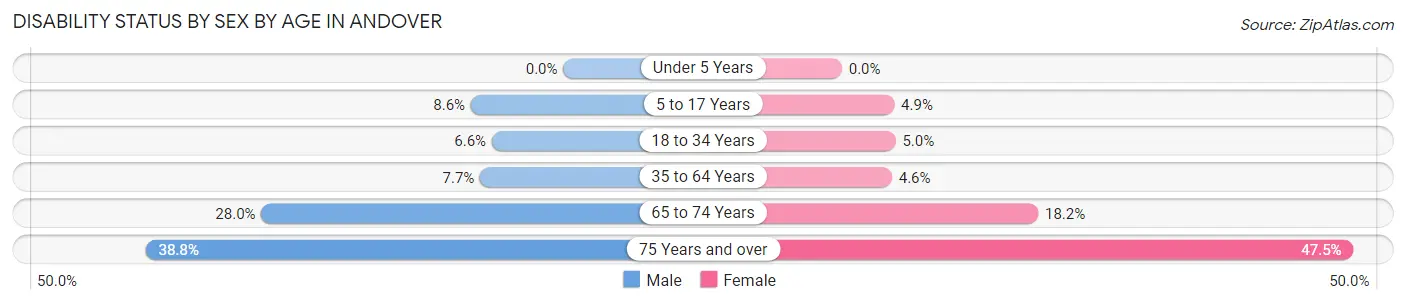
| Age Bracket | Male | Female |
| Under 5 Years | 0 (0.0%) | 0 (0.0%) |
| 5 to 17 Years | 262 (8.6%) | 160 (4.9%) |
| 18 to 34 Years | 198 (6.6%) | 140 (5.0%) |
| 35 to 64 Years | 538 (7.7%) | 314 (4.6%) |
| 65 to 74 Years | 369 (28.0%) | 246 (18.2%) |
| 75 Years and over | 302 (38.8%) | 500 (47.5%) |
Disability Class by Sex by Age in Andover
Disability Class: Hearing Difficulty
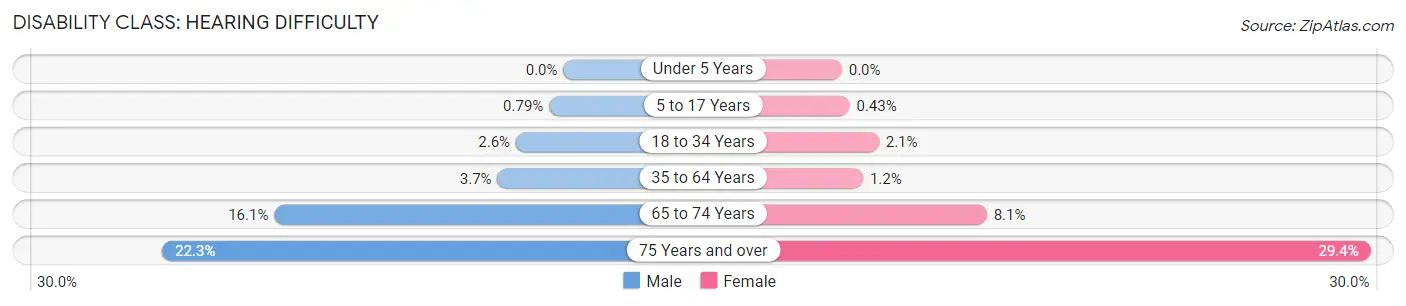
| Age Bracket | Male | Female |
| Under 5 Years | 0 (0.0%) | 0 (0.0%) |
| 5 to 17 Years | 24 (0.8%) | 14 (0.4%) |
| 18 to 34 Years | 79 (2.6%) | 58 (2.1%) |
| 35 to 64 Years | 256 (3.7%) | 80 (1.2%) |
| 65 to 74 Years | 212 (16.1%) | 109 (8.1%) |
| 75 Years and over | 174 (22.3%) | 310 (29.4%) |
Disability Class: Vision Difficulty
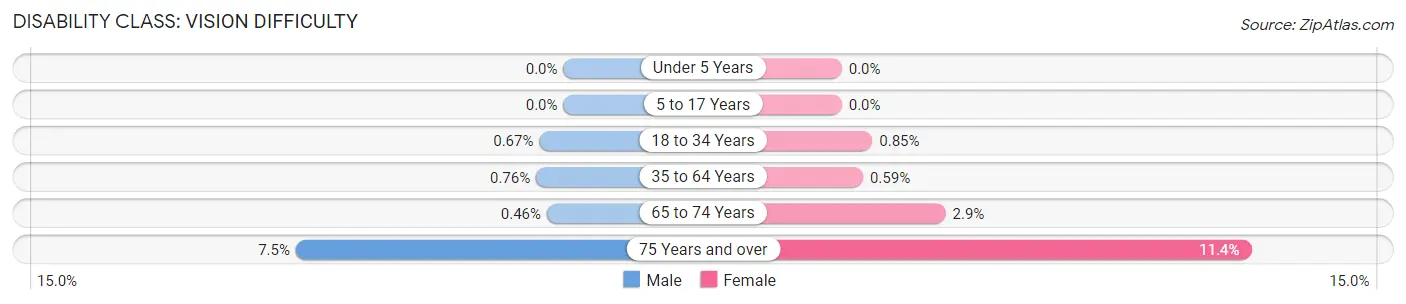
| Age Bracket | Male | Female |
| Under 5 Years | 0 (0.0%) | 0 (0.0%) |
| 5 to 17 Years | 0 (0.0%) | 0 (0.0%) |
| 18 to 34 Years | 20 (0.7%) | 24 (0.9%) |
| 35 to 64 Years | 53 (0.8%) | 40 (0.6%) |
| 65 to 74 Years | 6 (0.5%) | 39 (2.9%) |
| 75 Years and over | 58 (7.4%) | 120 (11.4%) |
Disability Class: Cognitive Difficulty
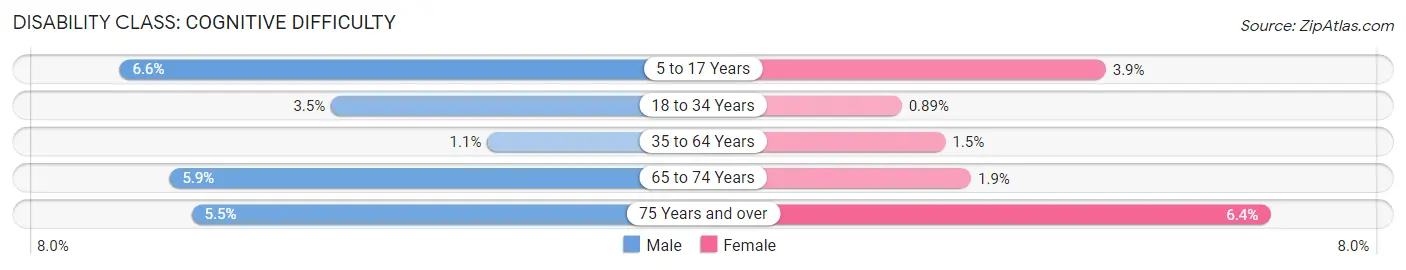
| Age Bracket | Male | Female |
| 5 to 17 Years | 201 (6.6%) | 129 (3.9%) |
| 18 to 34 Years | 103 (3.5%) | 25 (0.9%) |
| 35 to 64 Years | 79 (1.1%) | 104 (1.5%) |
| 65 to 74 Years | 77 (5.9%) | 26 (1.9%) |
| 75 Years and over | 43 (5.5%) | 67 (6.4%) |
Disability Class: Ambulatory Difficulty
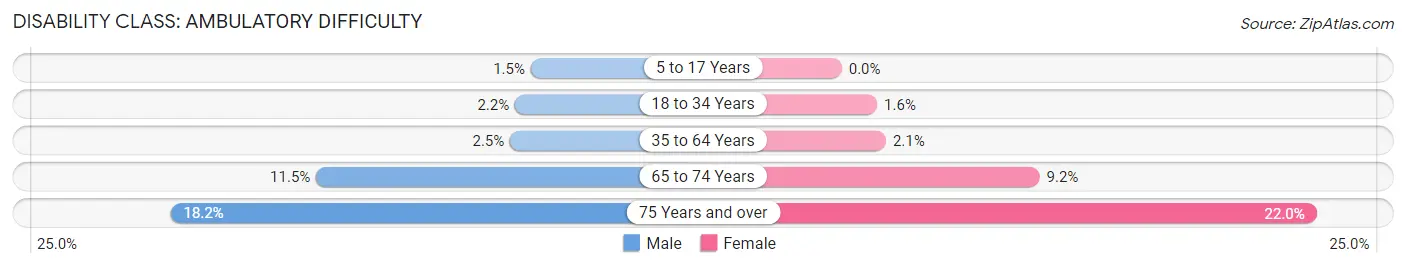
| Age Bracket | Male | Female |
| 5 to 17 Years | 46 (1.5%) | 0 (0.0%) |
| 18 to 34 Years | 67 (2.2%) | 46 (1.6%) |
| 35 to 64 Years | 172 (2.5%) | 139 (2.1%) |
| 65 to 74 Years | 151 (11.5%) | 124 (9.2%) |
| 75 Years and over | 142 (18.2%) | 232 (22.0%) |
Disability Class: Self-Care Difficulty
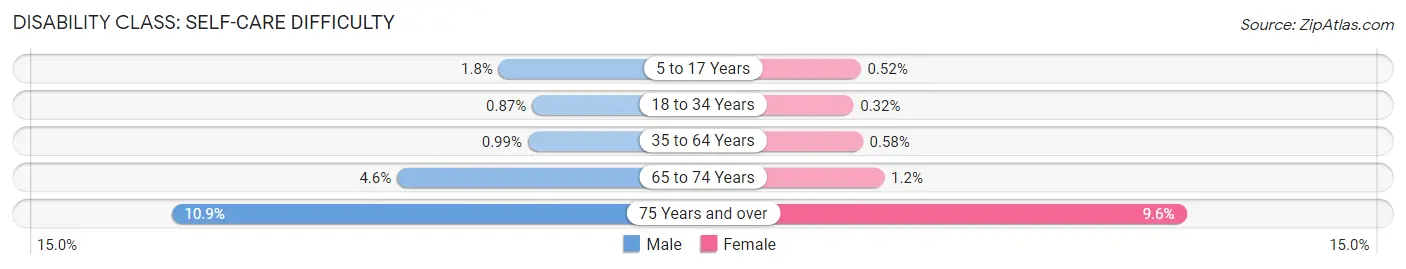
| Age Bracket | Male | Female |
| 5 to 17 Years | 55 (1.8%) | 17 (0.5%) |
| 18 to 34 Years | 26 (0.9%) | 9 (0.3%) |
| 35 to 64 Years | 69 (1.0%) | 39 (0.6%) |
| 65 to 74 Years | 61 (4.6%) | 16 (1.2%) |
| 75 Years and over | 85 (10.9%) | 101 (9.6%) |
Technology Access in Andover
Computing Device Access in Andover
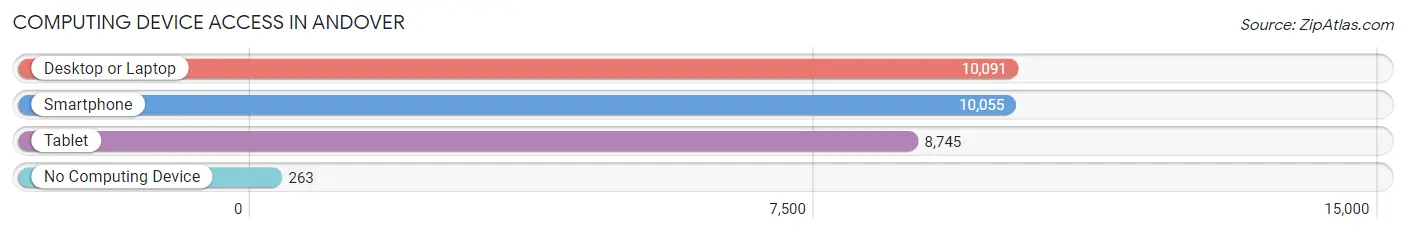
| Device Type | # Households | % Households |
| Desktop or Laptop | 10,091 | 92.8% |
| Smartphone | 10,055 | 92.5% |
| Tablet | 8,745 | 80.4% |
| No Computing Device | 263 | 2.4% |
| Total | 10,870 | 100.0% |
Internet Access in Andover
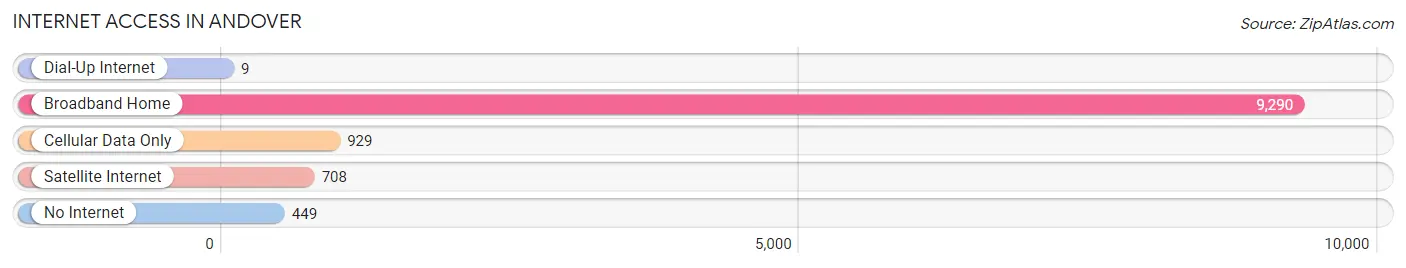
| Internet Type | # Households | % Households |
| Dial-Up Internet | 9 | 0.1% |
| Broadband Home | 9,290 | 85.5% |
| Cellular Data Only | 929 | 8.6% |
| Satellite Internet | 708 | 6.5% |
| No Internet | 449 | 4.1% |
| Total | 10,870 | 100.0% |
Andover Summary
Andover, Minnesota is a city located in Anoka County, Minnesota, United States. The city is located on the northern edge of the Twin Cities metropolitan area, and is part of the larger Minneapolis-St. Paul-Bloomington metropolitan statistical area. As of the 2010 census, the city had a population of 30,598.
History
The area that is now Andover was first settled in the late 1850s. The first settlers were mostly of German and Scandinavian descent. The area was originally known as "Round Lake Township" and was part of Anoka County. In 1857, the first post office was established in the area, and the name was changed to "Andover" in honor of Andover, Massachusetts.
In the late 19th century, the area began to grow rapidly as the railroad was extended into the area. The city was officially incorporated in 1972.
Geography
Andover is located in Anoka County, Minnesota, at the intersection of U.S. Route 10 and Minnesota State Highway 65. The city is located on the northern edge of the Twin Cities metropolitan area, and is part of the larger Minneapolis-St. Paul-Bloomington metropolitan statistical area.
The city has a total area of 22.2 square miles, of which 21.9 square miles is land and 0.3 square miles is water. The city is located on the Rum River, which flows through the city.
Economy
Andover is a growing city with a diverse economy. The city is home to a variety of businesses, including manufacturing, retail, and service industries. The city is also home to several large employers, including Target Corporation, Medtronic, and the Anoka County government.
Demographics
As of the 2010 census, there were 30,598 people, 10,945 households, and 8,072 families residing in the city. The population density was 1,387.2 people per square mile. The racial makeup of the city was 87.2% White, 4.3% African American, 0.5% Native American, 3.2% Asian, 2.2% from other races, and 2.6% from two or more races. Hispanic or Latino of any race were 5.2% of the population.
The median income for a household in the city was $72,845, and the median income for a family was $90,945. The per capita income for the city was $31,945. About 3.2% of families and 4.7% of the population were below the poverty line, including 5.3% of those under age 18 and 4.2% of those age 65 or over.
Common Questions
What is Per Capita Income in Andover?
Per Capita income in Andover is $49,978.
What is the Median Family Income in Andover?
Median Family Income in Andover is $131,576.
What is the Median Household income in Andover?
Median Household Income in Andover is $123,054.
What is Income or Wage Gap in Andover?
Income or Wage Gap in Andover is 29.7%.
Women in Andover earn 70.3 cents for every dollar earned by a man.
What is Inequality or Gini Index in Andover?
Inequality or Gini Index in Andover is 0.36.
What is the Total Population of Andover?
Total Population of Andover is 32,639.
What is the Total Male Population of Andover?
Total Male Population of Andover is 16,322.
What is the Total Female Population of Andover?
Total Female Population of Andover is 16,317.
What is the Ratio of Males per 100 Females in Andover?
There are 100.03 Males per 100 Females in Andover.
What is the Ratio of Females per 100 Males in Andover?
There are 99.97 Females per 100 Males in Andover.
What is the Median Population Age in Andover?
Median Population Age in Andover is 39.3 Years.
What is the Average Family Size in Andover
Average Family Size in Andover is 3.3 People.
What is the Average Household Size in Andover
Average Household Size in Andover is 3.0 People.
How Large is the Labor Force in Andover?
There are 18,243 People in the Labor Forcein in Andover.
What is the Percentage of People in the Labor Force in Andover?
72.3% of People are in the Labor Force in Andover.
What is the Unemployment Rate in Andover?
Unemployment Rate in Andover is 2.6%.