Calhoun, GA Map & Demographics
Calhoun Map
Calhoun Overview
$29,064
PER CAPITA INCOME
$65,966
AVG FAMILY INCOME
$54,927
AVG HOUSEHOLD INCOME
23.6%
WAGE / INCOME GAP [ % ]
76.4¢/ $1
WAGE / INCOME GAP [ $ ]
0.48
INEQUALITY / GINI INDEX
17,184
TOTAL POPULATION
8,460
MALE POPULATION
8,724
FEMALE POPULATION
96.97
MALES / 100 FEMALES
103.12
FEMALES / 100 MALES
34.3
MEDIAN AGE
3.3
AVG FAMILY SIZE
2.8
AVG HOUSEHOLD SIZE
7,962
LABOR FORCE [ PEOPLE ]
61.5%
PERCENT IN LABOR FORCE
2.4%
UNEMPLOYMENT RATE
Calhoun Zip Codes
Income in Calhoun
Income Overview in Calhoun
Per Capita Income in Calhoun is $29,064, while median incomes of families and households are $65,966 and $54,927 respectively.
| Characteristic | Number | Measure |
| Per Capita Income | 17,184 | $29,064 |
| Median Family Income | 4,211 | $65,966 |
| Mean Family Income | 4,211 | $88,215 |
| Median Household Income | 6,121 | $54,927 |
| Mean Household Income | 6,121 | $77,628 |
| Income Deficit | 4,211 | $0 |
| Wage / Income Gap (%) | 17,184 | 23.62% |
| Wage / Income Gap ($) | 17,184 | 76.38¢ per $1 |
| Gini / Inequality Index | 17,184 | 0.48 |
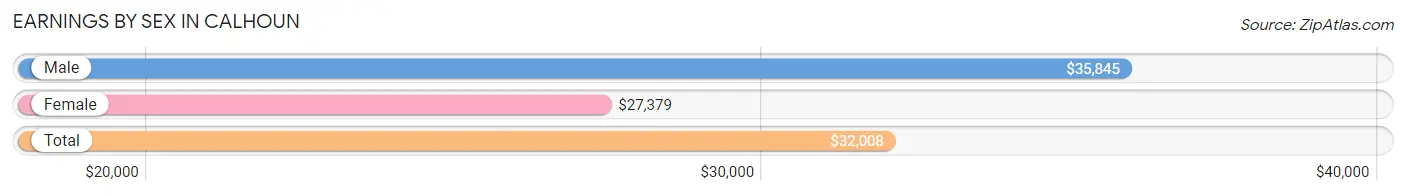
Earnings by Sex in Calhoun
Average Earnings in Calhoun are $32,008, $35,845 for men and $27,379 for women, a difference of 23.6%.
| Sex | Number | Average Earnings |
| Male | 4,833 (57.0%) | $35,845 |
| Female | 3,646 (43.0%) | $27,379 |
| Total | 8,479 (100.0%) | $32,008 |
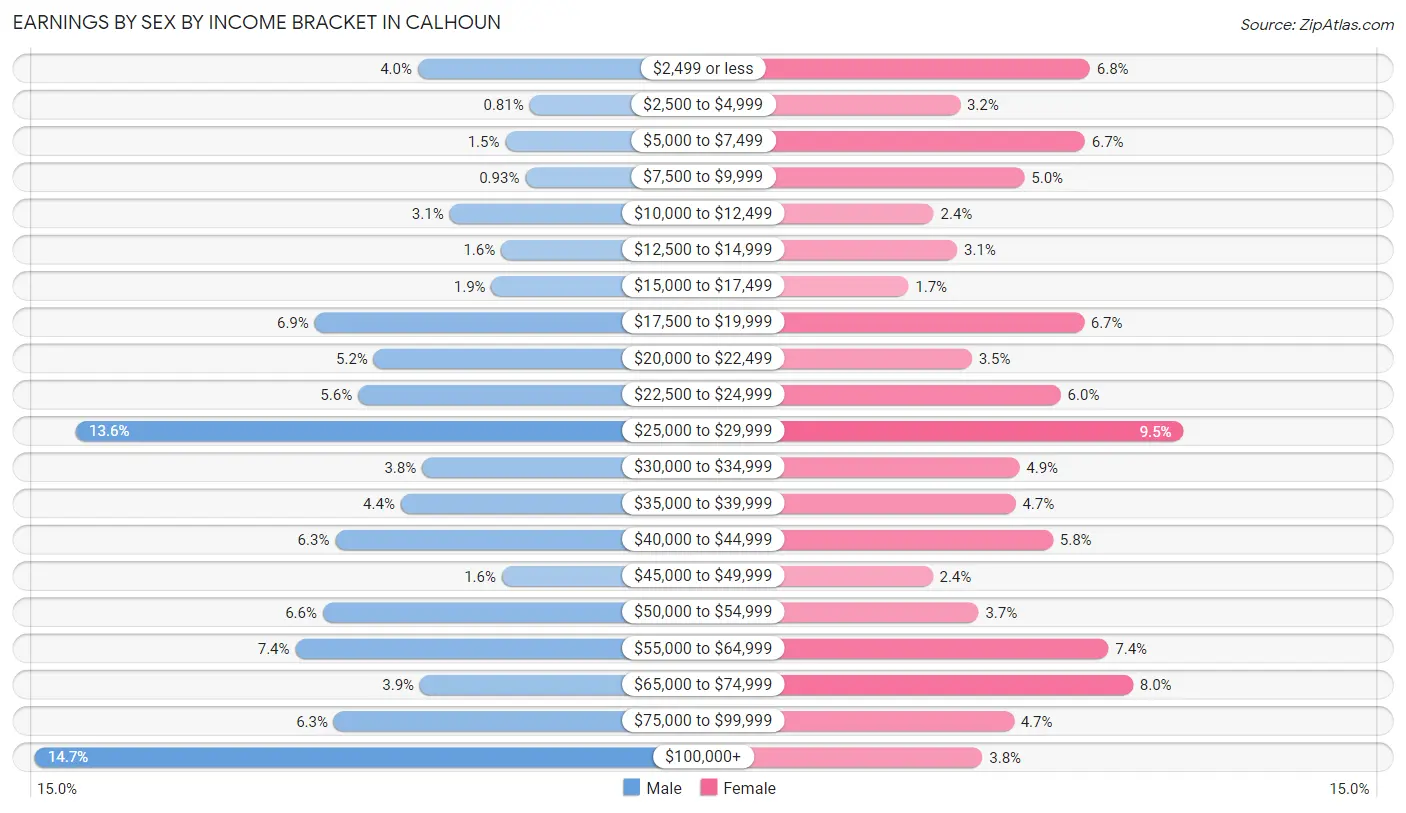
Earnings by Sex by Income Bracket in Calhoun
The most common earnings brackets in Calhoun are $100,000+ for men (711 | 14.7%) and $25,000 to $29,999 for women (345 | 9.5%).
| Income | Male | Female |
| $2,499 or less | 191 (4.0%) | 249 (6.8%) |
| $2,500 to $4,999 | 39 (0.8%) | 116 (3.2%) |
| $5,000 to $7,499 | 72 (1.5%) | 244 (6.7%) |
| $7,500 to $9,999 | 45 (0.9%) | 182 (5.0%) |
| $10,000 to $12,499 | 148 (3.1%) | 89 (2.4%) |
| $12,500 to $14,999 | 78 (1.6%) | 113 (3.1%) |
| $15,000 to $17,499 | 91 (1.9%) | 63 (1.7%) |
| $17,500 to $19,999 | 331 (6.9%) | 243 (6.7%) |
| $20,000 to $22,499 | 251 (5.2%) | 128 (3.5%) |
| $22,500 to $24,999 | 272 (5.6%) | 219 (6.0%) |
| $25,000 to $29,999 | 655 (13.6%) | 345 (9.5%) |
| $30,000 to $34,999 | 185 (3.8%) | 177 (4.9%) |
| $35,000 to $39,999 | 214 (4.4%) | 173 (4.7%) |
| $40,000 to $44,999 | 303 (6.3%) | 211 (5.8%) |
| $45,000 to $49,999 | 77 (1.6%) | 88 (2.4%) |
| $50,000 to $54,999 | 320 (6.6%) | 135 (3.7%) |
| $55,000 to $64,999 | 357 (7.4%) | 268 (7.3%) |
| $65,000 to $74,999 | 188 (3.9%) | 293 (8.0%) |
| $75,000 to $99,999 | 305 (6.3%) | 171 (4.7%) |
| $100,000+ | 711 (14.7%) | 139 (3.8%) |
| Total | 4,833 (100.0%) | 3,646 (100.0%) |
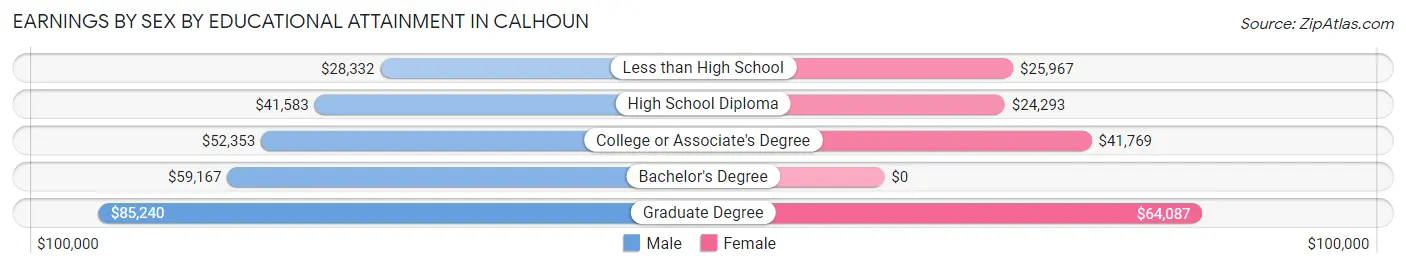
Earnings by Sex by Educational Attainment in Calhoun
Average earnings in Calhoun are $41,345 for men and $29,363 for women, a difference of 29.0%. Men with an educational attainment of graduate degree enjoy the highest average annual earnings of $85,240, while those with less than high school education earn the least with $28,332. Women with an educational attainment of graduate degree earn the most with the average annual earnings of $64,087, while those with high school diploma education have the smallest earnings of $24,293.
| Educational Attainment | Male Income | Female Income |
| Less than High School | $28,332 | $25,967 |
| High School Diploma | $41,583 | $24,293 |
| College or Associate's Degree | $52,353 | $41,769 |
| Bachelor's Degree | $59,167 | $0 |
| Graduate Degree | $85,240 | $64,087 |
| Total | $41,345 | $29,363 |
Family Income in Calhoun
Family Income Brackets in Calhoun
According to the Calhoun family income data, there are 703 families falling into the $25,000 to $34,999 income range, which is the most common income bracket and makes up 16.7% of all families. Conversely, the $10,000 to $14,999 income bracket is the least frequent group with only 46 families (1.1%) belonging to this category.
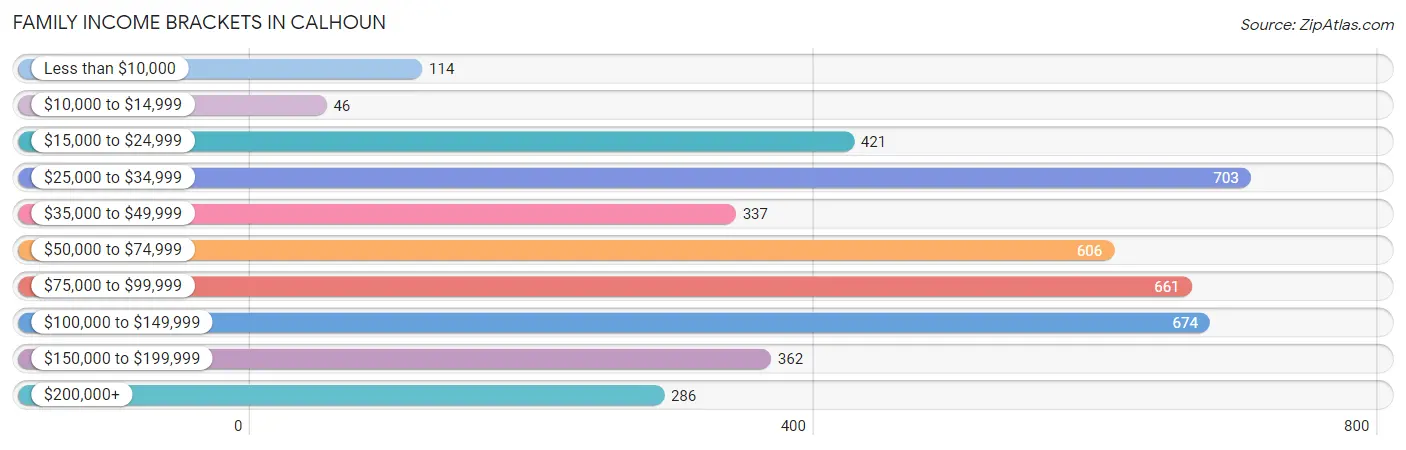
| Income Bracket | # Families | % Families |
| Less than $10,000 | 114 | 2.7% |
| $10,000 to $14,999 | 46 | 1.1% |
| $15,000 to $24,999 | 421 | 10.0% |
| $25,000 to $34,999 | 703 | 16.7% |
| $35,000 to $49,999 | 337 | 8.0% |
| $50,000 to $74,999 | 606 | 14.4% |
| $75,000 to $99,999 | 661 | 15.7% |
| $100,000 to $149,999 | 674 | 16.0% |
| $150,000 to $199,999 | 362 | 8.6% |
| $200,000+ | 286 | 6.8% |
Family Income by Famaliy Size in Calhoun
6-person families (95 | 2.3%) account for the highest median family income in Calhoun with $106,027 per family, while 2-person families (1,686 | 40.0%) have the highest median income of $33,450 per family member.
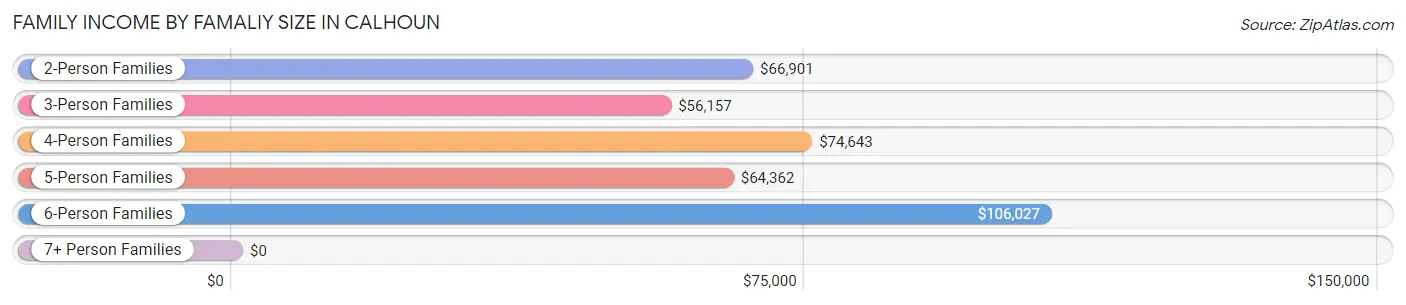
| Income Bracket | # Families | Median Income |
| 2-Person Families | 1,686 (40.0%) | $66,901 |
| 3-Person Families | 977 (23.2%) | $56,157 |
| 4-Person Families | 1,048 (24.9%) | $74,643 |
| 5-Person Families | 341 (8.1%) | $64,362 |
| 6-Person Families | 95 (2.3%) | $106,027 |
| 7+ Person Families | 64 (1.5%) | $0 |
| Total | 4,211 (100.0%) | $65,966 |
Family Income by Number of Earners in Calhoun
The median family income in Calhoun is $65,966, with families comprising 3+ earners (503) having the highest median family income of $107,316, while families with no earners (547) have the lowest median family income of $27,335, accounting for 11.9% and 13.0% of families, respectively.
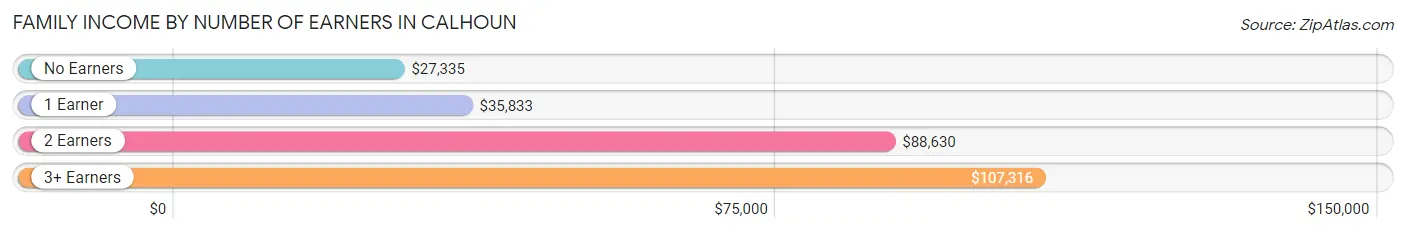
| Number of Earners | # Families | Median Income |
| No Earners | 547 (13.0%) | $27,335 |
| 1 Earner | 1,736 (41.2%) | $35,833 |
| 2 Earners | 1,425 (33.8%) | $88,630 |
| 3+ Earners | 503 (11.9%) | $107,316 |
| Total | 4,211 (100.0%) | $65,966 |
Household Income in Calhoun
Household Income Brackets in Calhoun
With 943 households falling in the category, the $25,000 to $34,999 income range is the most frequent in Calhoun, accounting for 15.4% of all households. In contrast, only 288 households (4.7%) fall into the less than $10,000 income bracket, making it the least populous group.
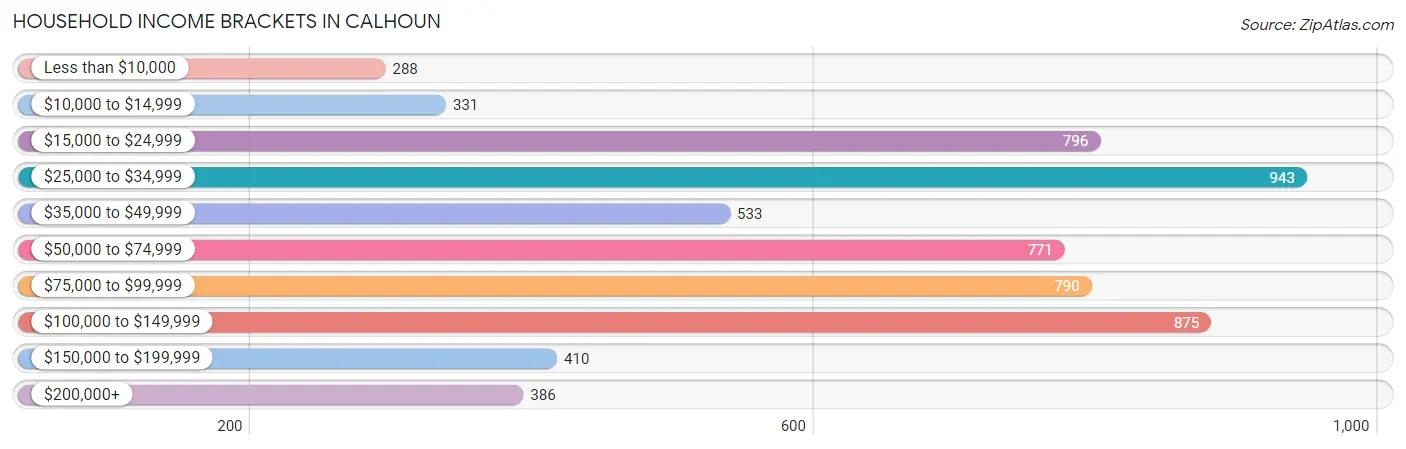
| Income Bracket | # Households | % Households |
| Less than $10,000 | 288 | 4.7% |
| $10,000 to $14,999 | 331 | 5.4% |
| $15,000 to $24,999 | 796 | 13.0% |
| $25,000 to $34,999 | 943 | 15.4% |
| $35,000 to $49,999 | 533 | 8.7% |
| $50,000 to $74,999 | 771 | 12.6% |
| $75,000 to $99,999 | 790 | 12.9% |
| $100,000 to $149,999 | 875 | 14.3% |
| $150,000 to $199,999 | 410 | 6.7% |
| $200,000+ | 386 | 6.3% |
Household Income by Householder Age in Calhoun
The median household income in Calhoun is $54,927, with the highest median household income of $76,568 found in the 45 to 64 years age bracket for the primary householder. A total of 2,322 households (37.9%) fall into this category. Meanwhile, the 65+ years age bracket for the primary householder has the lowest median household income of $28,625, with 1,319 households (21.5%) in this group.
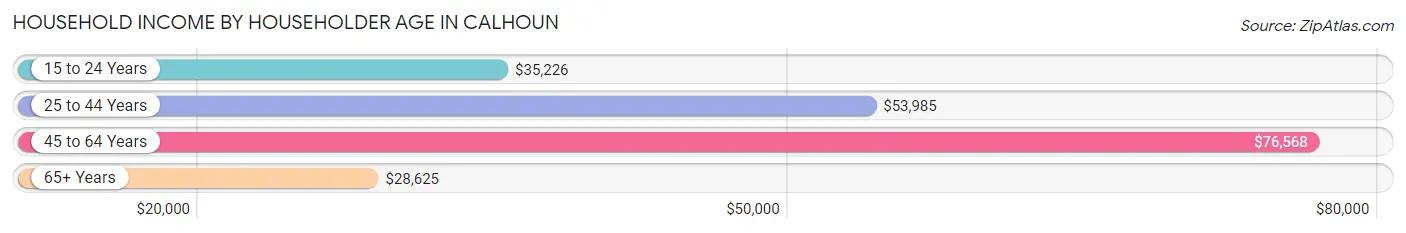
| Income Bracket | # Households | Median Income |
| 15 to 24 Years | 251 (4.1%) | $35,226 |
| 25 to 44 Years | 2,229 (36.4%) | $53,985 |
| 45 to 64 Years | 2,322 (37.9%) | $76,568 |
| 65+ Years | 1,319 (21.5%) | $28,625 |
| Total | 6,121 (100.0%) | $54,927 |
Poverty in Calhoun
Income Below Poverty by Sex and Age in Calhoun
With 15.4% poverty level for males and 22.1% for females among the residents of Calhoun, 5 year old males and 15 year old females are the most vulnerable to poverty, with 101 males (100.0%) and 172 females (47.2%) in their respective age groups living below the poverty level.
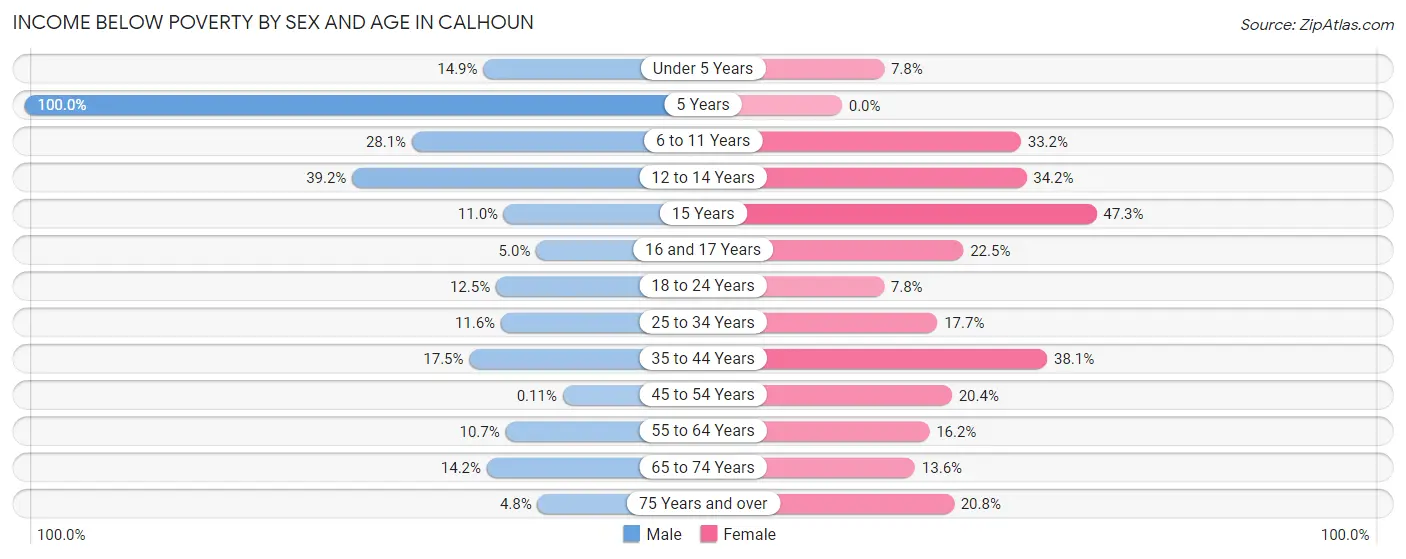
| Age Bracket | Male | Female |
| Under 5 Years | 94 (14.8%) | 48 (7.8%) |
| 5 Years | 101 (100.0%) | 0 (0.0%) |
| 6 to 11 Years | 136 (28.1%) | 199 (33.2%) |
| 12 to 14 Years | 270 (39.2%) | 139 (34.2%) |
| 15 Years | 16 (11.0%) | 172 (47.2%) |
| 16 and 17 Years | 8 (5.0%) | 55 (22.5%) |
| 18 to 24 Years | 117 (12.5%) | 49 (7.8%) |
| 25 to 34 Years | 158 (11.6%) | 202 (17.7%) |
| 35 to 44 Years | 216 (17.4%) | 434 (38.1%) |
| 45 to 54 Years | 1 (0.1%) | 251 (20.4%) |
| 55 to 64 Years | 87 (10.7%) | 158 (16.2%) |
| 65 to 74 Years | 71 (14.2%) | 57 (13.6%) |
| 75 Years and over | 21 (4.8%) | 128 (20.8%) |
| Total | 1,296 (15.4%) | 1,892 (22.1%) |
Income Above Poverty by Sex and Age in Calhoun
According to the poverty statistics in Calhoun, males aged 45 to 54 years and females aged 5 years are the age groups that are most secure financially, with 99.9% of males and 100.0% of females in these age groups living above the poverty line.
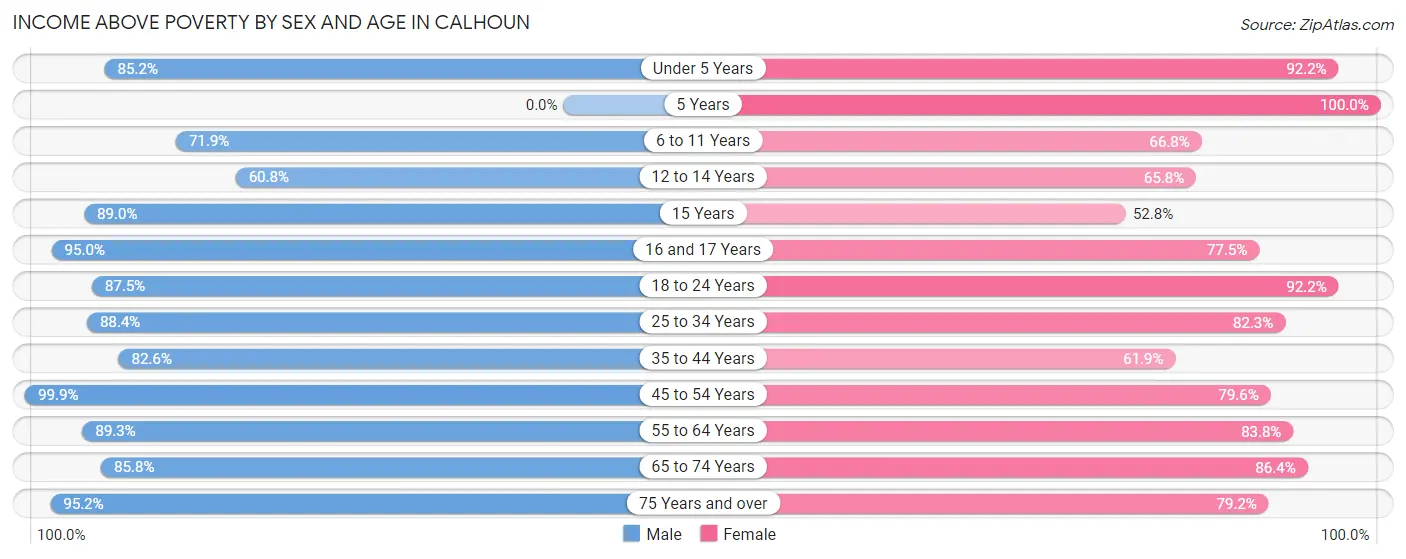
| Age Bracket | Male | Female |
| Under 5 Years | 539 (85.2%) | 566 (92.2%) |
| 5 Years | 0 (0.0%) | 202 (100.0%) |
| 6 to 11 Years | 348 (71.9%) | 400 (66.8%) |
| 12 to 14 Years | 419 (60.8%) | 267 (65.8%) |
| 15 Years | 129 (89.0%) | 192 (52.7%) |
| 16 and 17 Years | 151 (95.0%) | 189 (77.5%) |
| 18 to 24 Years | 819 (87.5%) | 579 (92.2%) |
| 25 to 34 Years | 1,206 (88.4%) | 938 (82.3%) |
| 35 to 44 Years | 1,022 (82.6%) | 705 (61.9%) |
| 45 to 54 Years | 890 (99.9%) | 979 (79.6%) |
| 55 to 64 Years | 724 (89.3%) | 816 (83.8%) |
| 65 to 74 Years | 429 (85.8%) | 363 (86.4%) |
| 75 Years and over | 417 (95.2%) | 488 (79.2%) |
| Total | 7,093 (84.6%) | 6,684 (77.9%) |
Income Below Poverty Among Married-Couple Families in Calhoun
The poverty statistics for married-couple families in Calhoun show that 9.5% or 273 of the total 2,889 families live below the poverty line. Families with 3 or 4 children have the highest poverty rate of 32.3%, comprising of 96 families. On the other hand, families with 5 or more children have the lowest poverty rate of 0.0%, which includes 0 families.
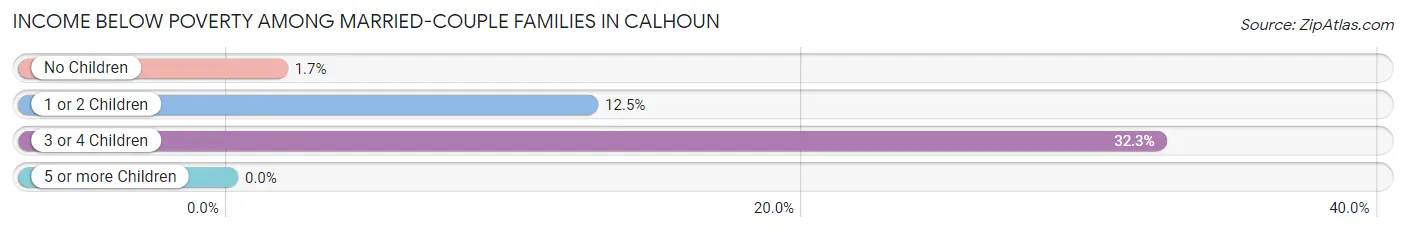
| Children | Above Poverty | Below Poverty |
| No Children | 1,303 (98.3%) | 23 (1.7%) |
| 1 or 2 Children | 1,074 (87.5%) | 154 (12.5%) |
| 3 or 4 Children | 201 (67.7%) | 96 (32.3%) |
| 5 or more Children | 38 (100.0%) | 0 (0.0%) |
| Total | 2,616 (90.5%) | 273 (9.5%) |
Income Below Poverty Among Single-Parent Households in Calhoun
According to the poverty data in Calhoun, 5.5% or 27 single-father households and 27.1% or 226 single-mother households are living below the poverty line. Among single-father households, those with 1 or 2 children have the highest poverty rate, with 27 households (7.2%) experiencing poverty. Likewise, among single-mother households, those with 3 or 4 children have the highest poverty rate, with 56 households (76.7%) falling below the poverty line.
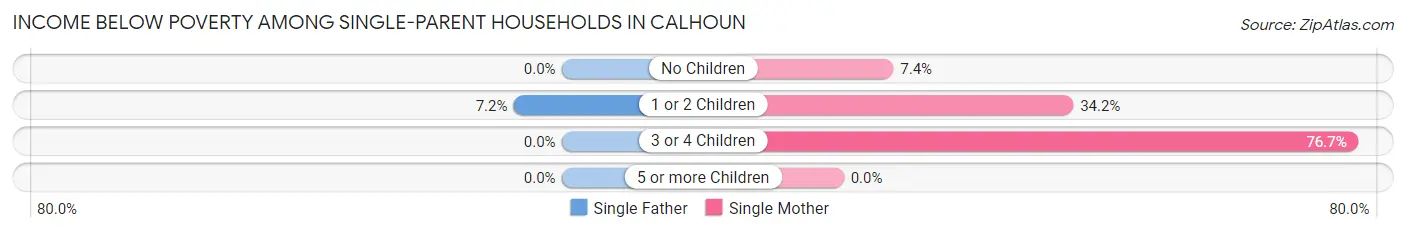
| Children | Single Father | Single Mother |
| No Children | 0 (0.0%) | 25 (7.4%) |
| 1 or 2 Children | 27 (7.2%) | 145 (34.2%) |
| 3 or 4 Children | 0 (0.0%) | 56 (76.7%) |
| 5 or more Children | 0 (0.0%) | 0 (0.0%) |
| Total | 27 (5.5%) | 226 (27.1%) |
Income Below Poverty Among Married-Couple vs Single-Parent Households in Calhoun
The poverty data for Calhoun shows that 273 of the married-couple family households (9.5%) and 253 of the single-parent households (19.1%) are living below the poverty level. Within the married-couple family households, those with 3 or 4 children have the highest poverty rate, with 96 households (32.3%) falling below the poverty line. Among the single-parent households, those with 3 or 4 children have the highest poverty rate, with 56 household (76.7%) living below poverty.
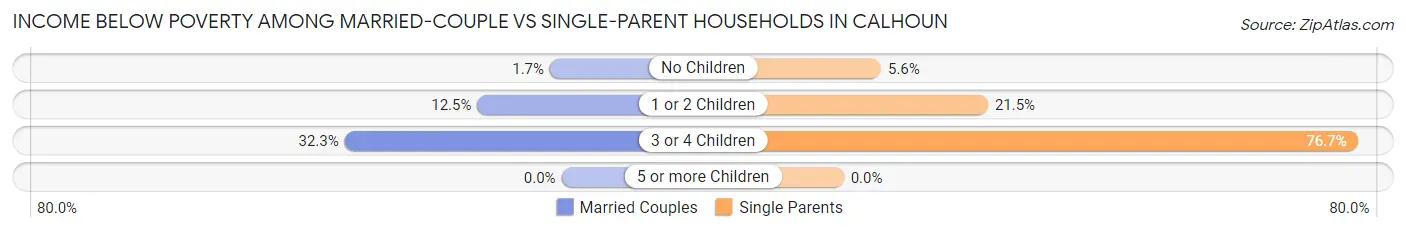
| Children | Married-Couple Families | Single-Parent Households |
| No Children | 23 (1.7%) | 25 (5.6%) |
| 1 or 2 Children | 154 (12.5%) | 172 (21.5%) |
| 3 or 4 Children | 96 (32.3%) | 56 (76.7%) |
| 5 or more Children | 0 (0.0%) | 0 (0.0%) |
| Total | 273 (9.5%) | 253 (19.1%) |
Race in Calhoun
The most populous races in Calhoun are White / Caucasian (12,148 | 70.7%), Hispanic or Latino (4,691 | 27.3%), and Some other Race (1,470 | 8.6%).
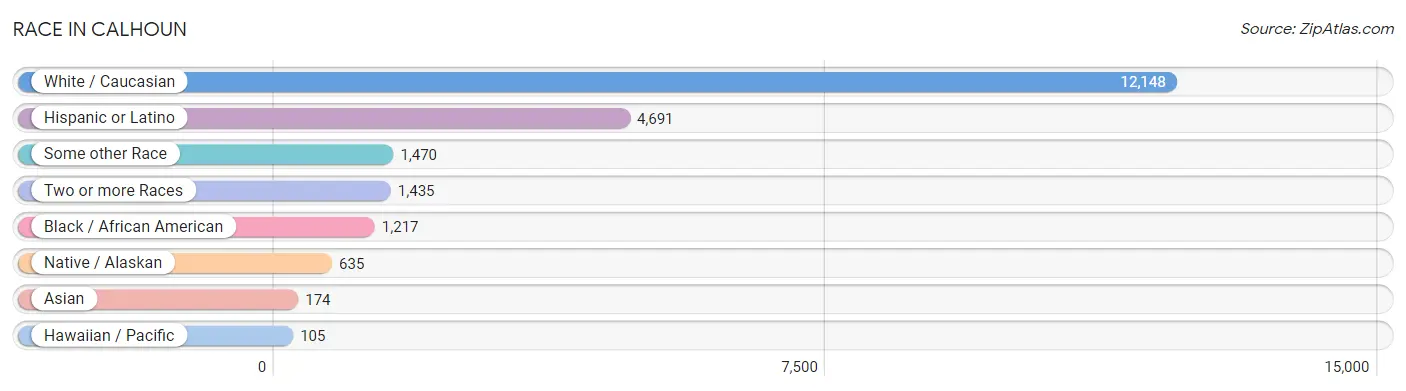
| Race | # Population | % Population |
| Asian | 174 | 1.0% |
| Black / African American | 1,217 | 7.1% |
| Hawaiian / Pacific | 105 | 0.6% |
| Hispanic or Latino | 4,691 | 27.3% |
| Native / Alaskan | 635 | 3.7% |
| White / Caucasian | 12,148 | 70.7% |
| Two or more Races | 1,435 | 8.4% |
| Some other Race | 1,470 | 8.6% |
| Total | 17,184 | 100.0% |
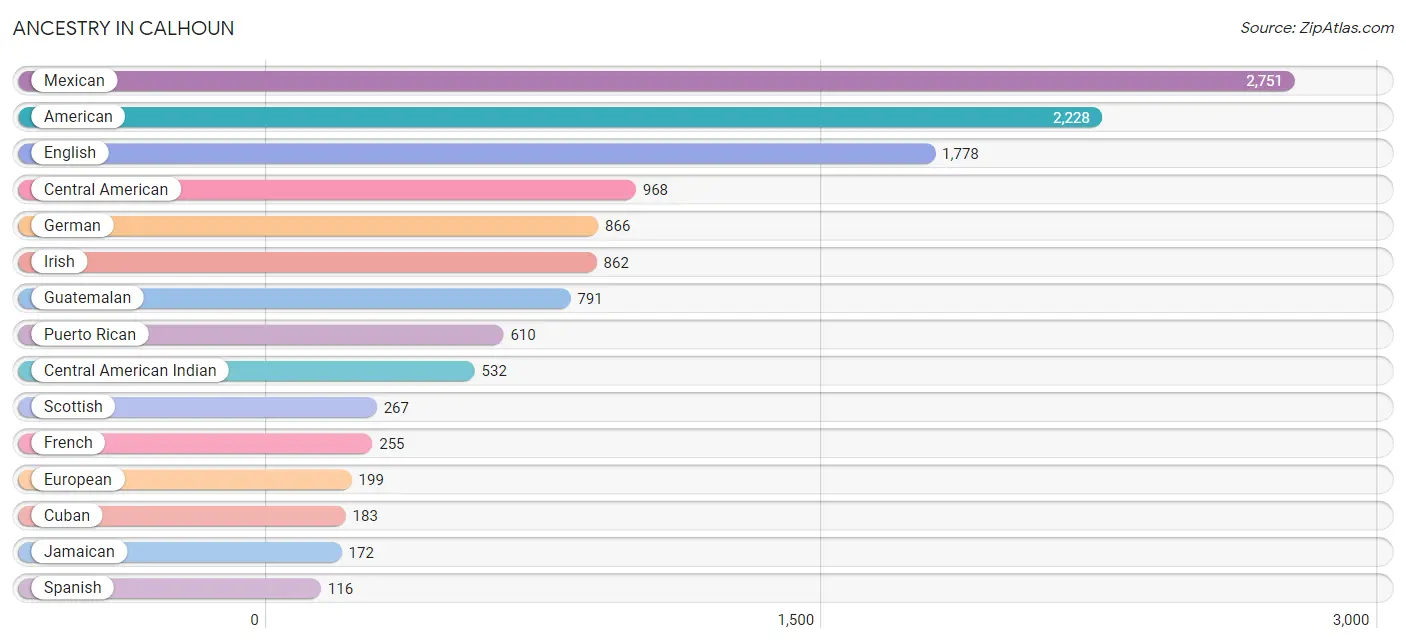
Ancestry in Calhoun
The most populous ancestries reported in Calhoun are Mexican (2,751 | 16.0%), American (2,228 | 13.0%), English (1,778 | 10.3%), Central American (968 | 5.6%), and German (866 | 5.0%), together accounting for 50.0% of all Calhoun residents.
| Ancestry | # Population | % Population |
| American | 2,228 | 13.0% |
| Bahamian | 13 | 0.1% |
| Brazilian | 22 | 0.1% |
| British | 102 | 0.6% |
| Burmese | 14 | 0.1% |
| Cajun | 16 | 0.1% |
| Central American | 968 | 5.6% |
| Central American Indian | 532 | 3.1% |
| Cherokee | 38 | 0.2% |
| Cuban | 183 | 1.1% |
| Czech | 57 | 0.3% |
| Czechoslovakian | 12 | 0.1% |
| Danish | 10 | 0.1% |
| Dominican | 28 | 0.2% |
| Dutch | 51 | 0.3% |
| Ecuadorian | 7 | 0.0% |
| English | 1,778 | 10.3% |
| European | 199 | 1.2% |
| Finnish | 15 | 0.1% |
| French | 255 | 1.5% |
| German | 866 | 5.0% |
| Guatemalan | 791 | 4.6% |
| Honduran | 55 | 0.3% |
| Indian (Asian) | 43 | 0.3% |
| Irish | 862 | 5.0% |
| Italian | 86 | 0.5% |
| Jamaican | 172 | 1.0% |
| Korean | 49 | 0.3% |
| Lithuanian | 8 | 0.1% |
| Mexican | 2,751 | 16.0% |
| Native Hawaiian | 57 | 0.3% |
| Northern European | 50 | 0.3% |
| Norwegian | 27 | 0.2% |
| Panamanian | 11 | 0.1% |
| Polish | 15 | 0.1% |
| Portuguese | 22 | 0.1% |
| Puerto Rican | 610 | 3.5% |
| Salvadoran | 111 | 0.6% |
| Samoan | 48 | 0.3% |
| Scandinavian | 17 | 0.1% |
| Scotch-Irish | 93 | 0.5% |
| Scottish | 267 | 1.5% |
| South American | 7 | 0.0% |
| Spaniard | 28 | 0.2% |
| Spanish | 116 | 0.7% |
| Sri Lankan | 26 | 0.2% |
| Swedish | 31 | 0.2% |
| Thai | 37 | 0.2% |
| Ukrainian | 34 | 0.2% |
| Welsh | 21 | 0.1% | View All 50 Rows |
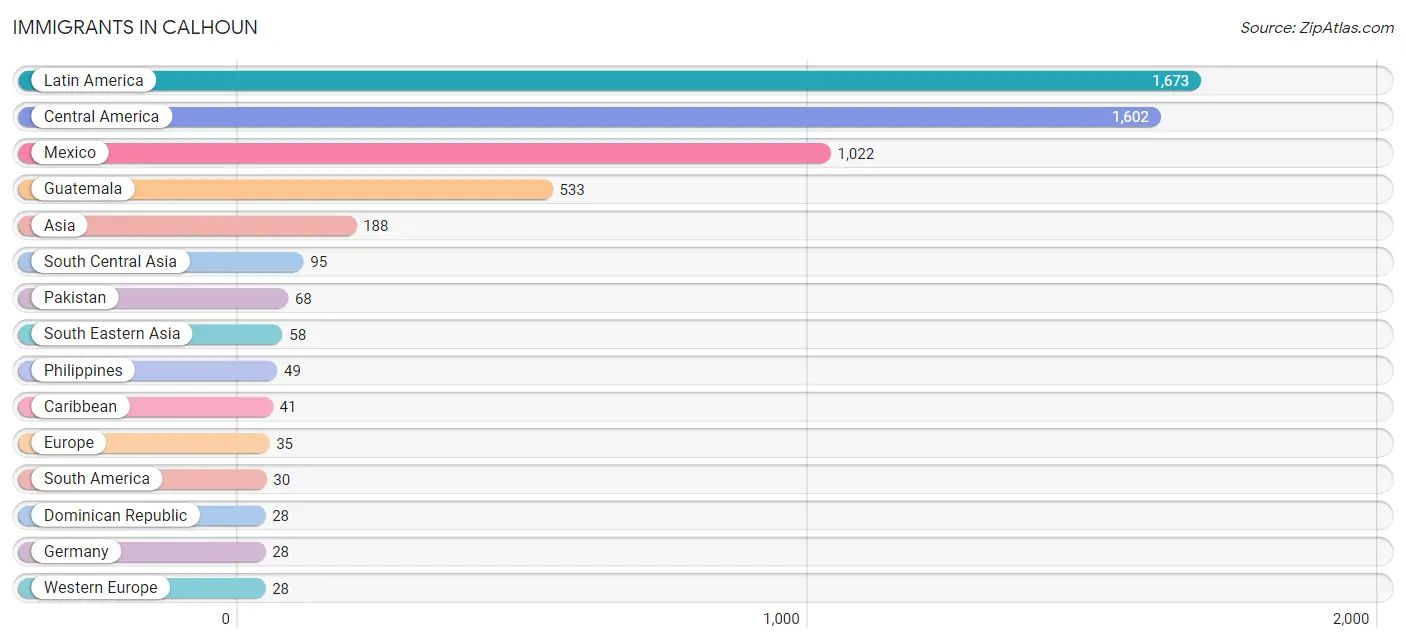
Immigrants in Calhoun
The most numerous immigrant groups reported in Calhoun came from Latin America (1,673 | 9.7%), Central America (1,602 | 9.3%), Mexico (1,022 | 5.9%), Guatemala (533 | 3.1%), and Asia (188 | 1.1%), together accounting for 29.2% of all Calhoun residents.
| Immigration Origin | # Population | % Population |
| Asia | 188 | 1.1% |
| Bahamas | 13 | 0.1% |
| Brazil | 23 | 0.1% |
| Canada | 17 | 0.1% |
| Caribbean | 41 | 0.2% |
| Central America | 1,602 | 9.3% |
| China | 25 | 0.2% |
| Dominican Republic | 28 | 0.2% |
| Eastern Asia | 25 | 0.2% |
| Ecuador | 7 | 0.0% |
| El Salvador | 26 | 0.2% |
| Europe | 35 | 0.2% |
| Germany | 28 | 0.2% |
| Guatemala | 533 | 3.1% |
| Honduras | 21 | 0.1% |
| India | 27 | 0.2% |
| Latin America | 1,673 | 9.7% |
| Mexico | 1,022 | 5.9% |
| Northern Europe | 7 | 0.0% |
| Pakistan | 68 | 0.4% |
| Philippines | 49 | 0.3% |
| South America | 30 | 0.2% |
| South Central Asia | 95 | 0.5% |
| South Eastern Asia | 58 | 0.3% |
| Vietnam | 9 | 0.1% |
| Western Asia | 10 | 0.1% |
| Western Europe | 28 | 0.2% | View All 27 Rows |
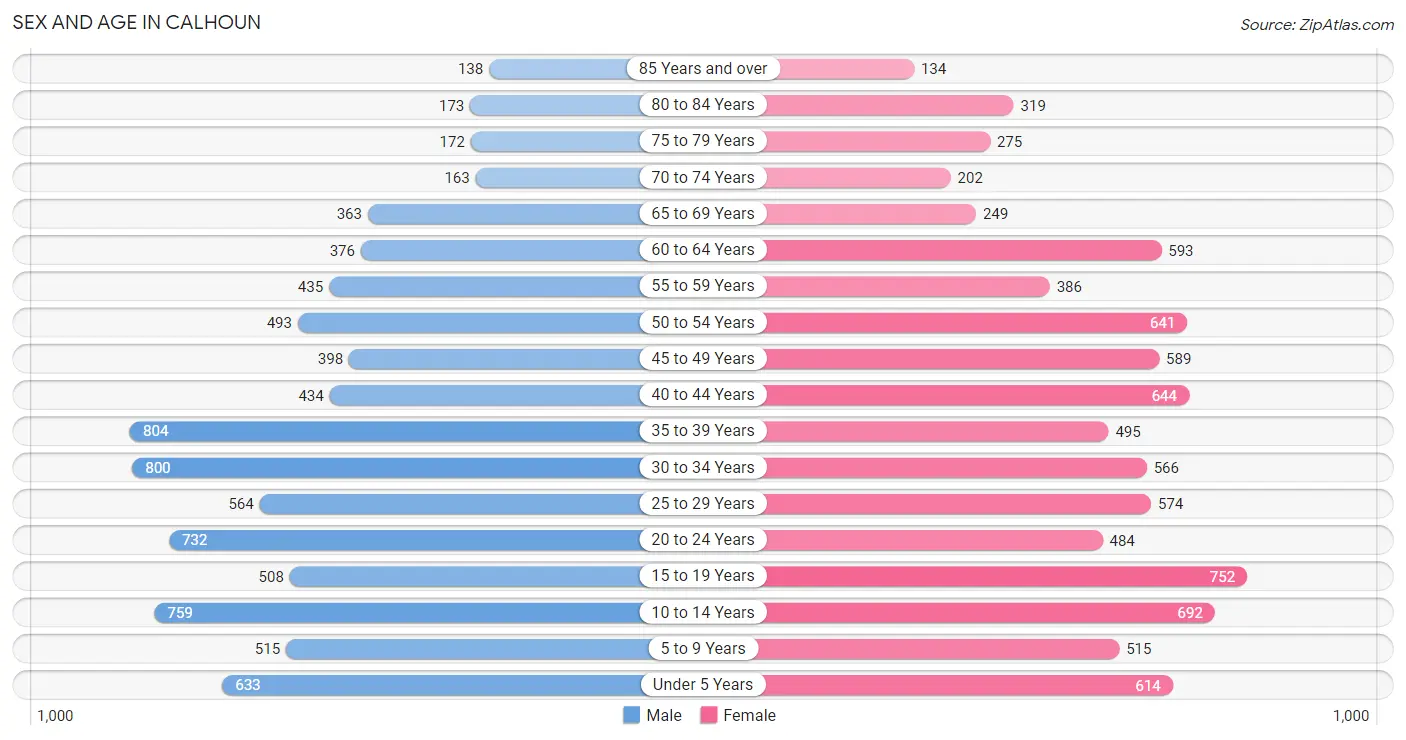
Sex and Age in Calhoun
Sex and Age in Calhoun
The most populous age groups in Calhoun are 35 to 39 Years (804 | 9.5%) for men and 15 to 19 Years (752 | 8.6%) for women.
| Age Bracket | Male | Female |
| Under 5 Years | 633 (7.5%) | 614 (7.0%) |
| 5 to 9 Years | 515 (6.1%) | 515 (5.9%) |
| 10 to 14 Years | 759 (9.0%) | 692 (7.9%) |
| 15 to 19 Years | 508 (6.0%) | 752 (8.6%) |
| 20 to 24 Years | 732 (8.6%) | 484 (5.6%) |
| 25 to 29 Years | 564 (6.7%) | 574 (6.6%) |
| 30 to 34 Years | 800 (9.5%) | 566 (6.5%) |
| 35 to 39 Years | 804 (9.5%) | 495 (5.7%) |
| 40 to 44 Years | 434 (5.1%) | 644 (7.4%) |
| 45 to 49 Years | 398 (4.7%) | 589 (6.8%) |
| 50 to 54 Years | 493 (5.8%) | 641 (7.3%) |
| 55 to 59 Years | 435 (5.1%) | 386 (4.4%) |
| 60 to 64 Years | 376 (4.4%) | 593 (6.8%) |
| 65 to 69 Years | 363 (4.3%) | 249 (2.9%) |
| 70 to 74 Years | 163 (1.9%) | 202 (2.3%) |
| 75 to 79 Years | 172 (2.0%) | 275 (3.2%) |
| 80 to 84 Years | 173 (2.0%) | 319 (3.7%) |
| 85 Years and over | 138 (1.6%) | 134 (1.5%) |
| Total | 8,460 (100.0%) | 8,724 (100.0%) |
Families and Households in Calhoun
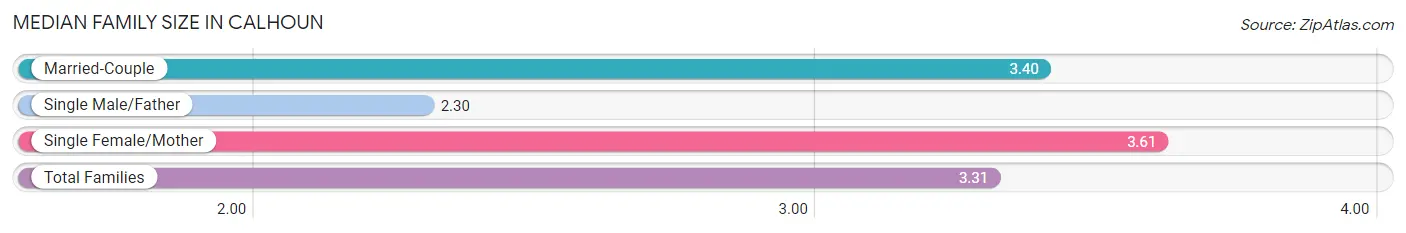
Median Family Size in Calhoun
The median family size in Calhoun is 3.31 persons per family, with single female/mother families (835 | 19.8%) accounting for the largest median family size of 3.61 persons per family. On the other hand, single male/father families (487 | 11.6%) represent the smallest median family size with 2.30 persons per family.
| Family Type | # Families | Family Size |
| Married-Couple | 2,889 (68.6%) | 3.40 |
| Single Male/Father | 487 (11.6%) | 2.30 |
| Single Female/Mother | 835 (19.8%) | 3.61 |
| Total Families | 4,211 (100.0%) | 3.31 |
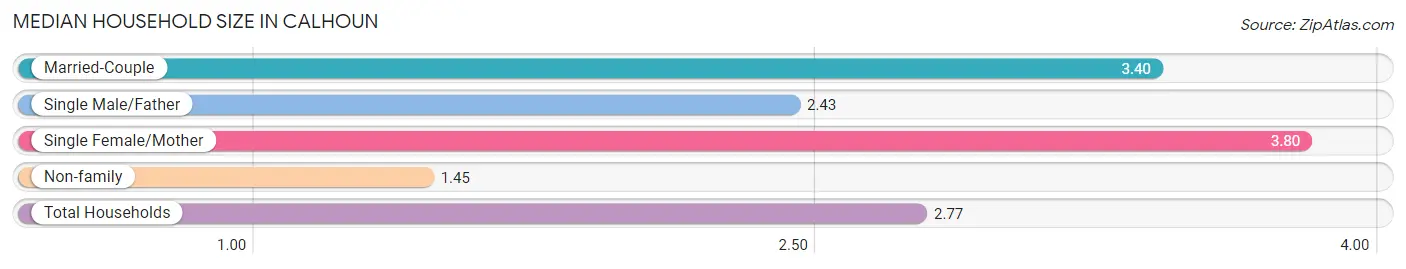
Median Household Size in Calhoun
The median household size in Calhoun is 2.77 persons per household, with single female/mother households (835 | 13.6%) accounting for the largest median household size of 3.8 persons per household. non-family households (1,910 | 31.2%) represent the smallest median household size with 1.45 persons per household.
| Household Type | # Households | Household Size |
| Married-Couple | 2,889 (47.2%) | 3.40 |
| Single Male/Father | 487 (8.0%) | 2.43 |
| Single Female/Mother | 835 (13.6%) | 3.80 |
| Non-family | 1,910 (31.2%) | 1.45 |
| Total Households | 6,121 (100.0%) | 2.77 |
Household Size by Marriage Status in Calhoun
Out of a total of 6,121 households in Calhoun, 4,211 (68.8%) are family households, while 1,910 (31.2%) are nonfamily households. The most numerous type of family households are 2-person households, comprising 1,612, and the most common type of nonfamily households are 1-person households, comprising 1,462.
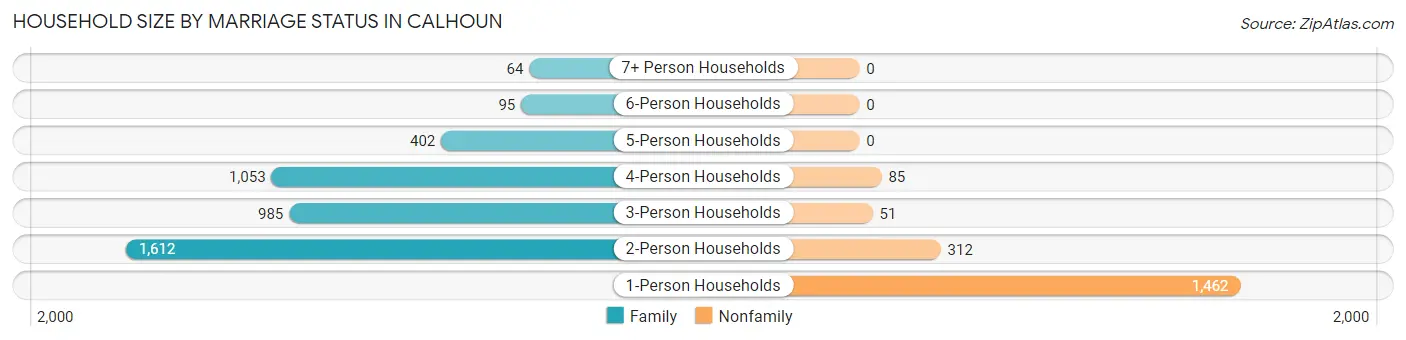
| Household Size | Family Households | Nonfamily Households |
| 1-Person Households | - | 1,462 (23.9%) |
| 2-Person Households | 1,612 (26.3%) | 312 (5.1%) |
| 3-Person Households | 985 (16.1%) | 51 (0.8%) |
| 4-Person Households | 1,053 (17.2%) | 85 (1.4%) |
| 5-Person Households | 402 (6.6%) | 0 (0.0%) |
| 6-Person Households | 95 (1.5%) | 0 (0.0%) |
| 7+ Person Households | 64 (1.1%) | 0 (0.0%) |
| Total | 4,211 (68.8%) | 1,910 (31.2%) |
Female Fertility in Calhoun
Fertility by Age in Calhoun
Average fertility rate in Calhoun is 47.0 births per 1,000 women. Women in the age bracket of 20 to 34 years have the highest fertility rate with 99.0 births per 1,000 women. Women in the age bracket of 20 to 34 years acount for 80.8% of all women with births.
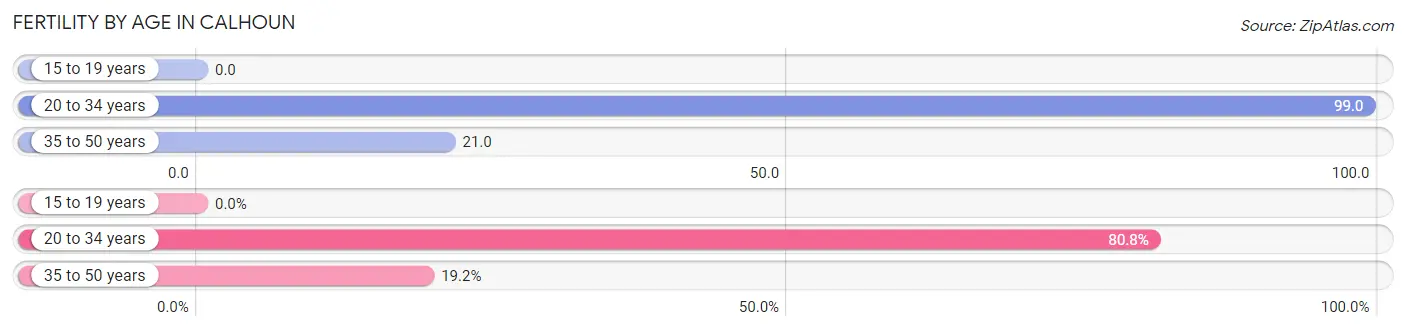
| Age Bracket | Women with Births | Births / 1,000 Women |
| 15 to 19 years | 0 (0.0%) | 0.0 |
| 20 to 34 years | 160 (80.8%) | 99.0 |
| 35 to 50 years | 38 (19.2%) | 21.0 |
| Total | 198 (100.0%) | 47.0 |
Fertility by Age by Marriage Status in Calhoun
53.0% of women with births (198) in Calhoun are married. The highest percentage of unmarried women with births falls into 35 to 50 years age bracket with 65.8% of them unmarried at the time of birth, while the lowest percentage of unmarried women with births belong to 20 to 34 years age bracket with 42.5% of them unmarried.
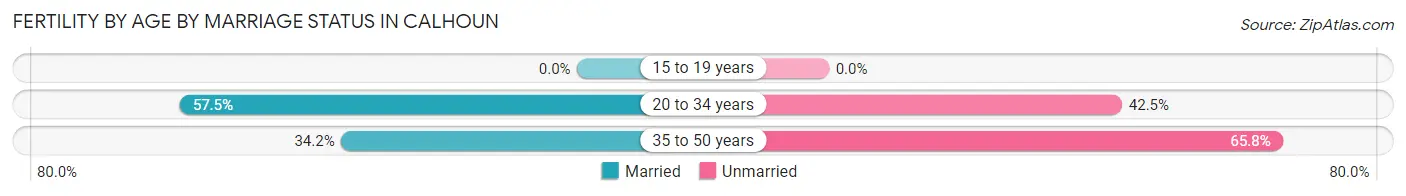
| Age Bracket | Married | Unmarried |
| 15 to 19 years | 0 (0.0%) | 0 (0.0%) |
| 20 to 34 years | 92 (57.5%) | 68 (42.5%) |
| 35 to 50 years | 13 (34.2%) | 25 (65.8%) |
| Total | 105 (53.0%) | 93 (47.0%) |
Fertility by Education in Calhoun
Average fertility rate in Calhoun is 47.0 births per 1,000 women. Women with the education attainment of graduate degree have the highest fertility rate of 98.0 births per 1,000 women, while women with the education attainment of less than high school have the lowest fertility at 23.0 births per 1,000 women. Women with the education attainment of college or associate's degree represent 48.5% of all women with births.
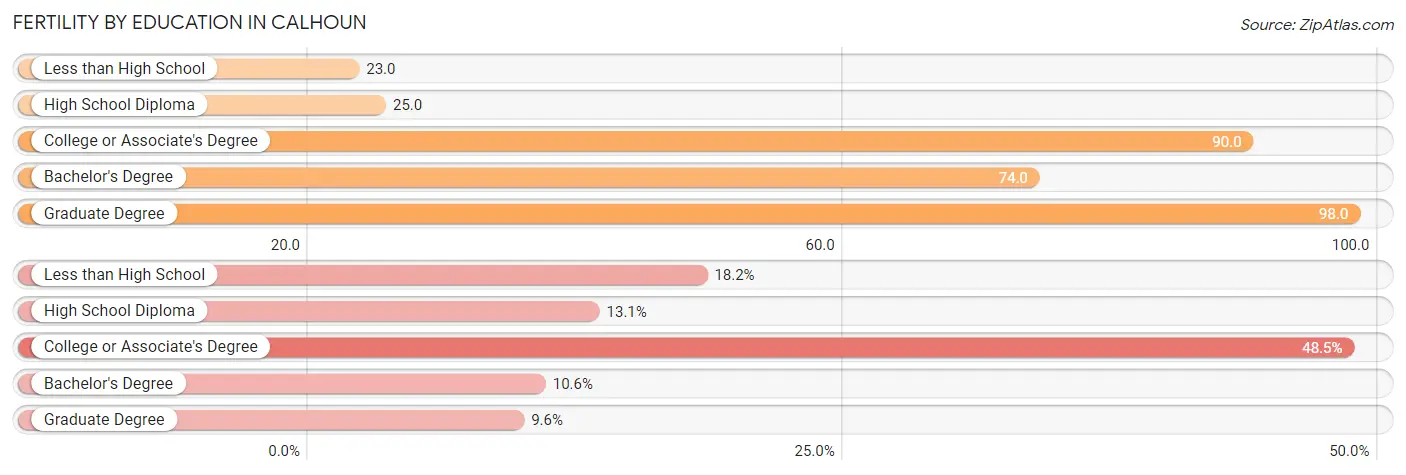
| Educational Attainment | Women with Births | Births / 1,000 Women |
| Less than High School | 36 (18.2%) | 23.0 |
| High School Diploma | 26 (13.1%) | 25.0 |
| College or Associate's Degree | 96 (48.5%) | 90.0 |
| Bachelor's Degree | 21 (10.6%) | 74.0 |
| Graduate Degree | 19 (9.6%) | 98.0 |
| Total | 198 (100.0%) | 47.0 |
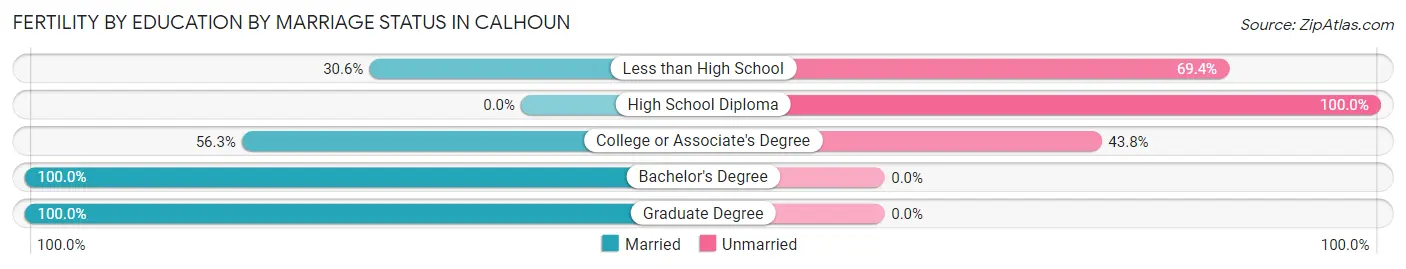
Fertility by Education by Marriage Status in Calhoun
47.0% of women with births in Calhoun are unmarried. Women with the educational attainment of bachelor's degree are most likely to be married with 100.0% of them married at childbirth, while women with the educational attainment of high school diploma are least likely to be married with 100.0% of them unmarried at childbirth.
| Educational Attainment | Married | Unmarried |
| Less than High School | 11 (30.6%) | 25 (69.4%) |
| High School Diploma | 0 (0.0%) | 26 (100.0%) |
| College or Associate's Degree | 54 (56.2%) | 42 (43.8%) |
| Bachelor's Degree | 21 (100.0%) | 0 (0.0%) |
| Graduate Degree | 19 (100.0%) | 0 (0.0%) |
| Total | 105 (53.0%) | 93 (47.0%) |
Employment Characteristics in Calhoun
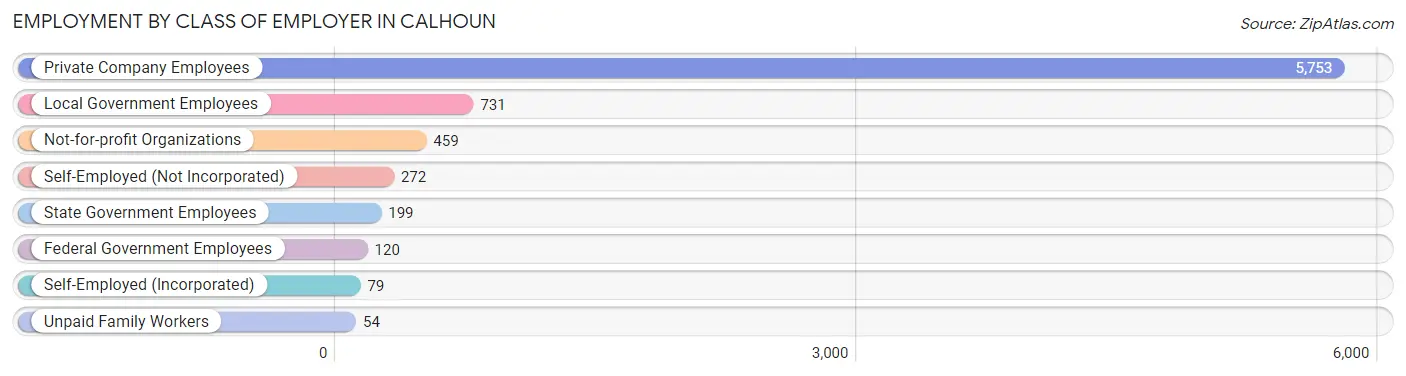
Employment by Class of Employer in Calhoun
Among the 7,667 employed individuals in Calhoun, private company employees (5,753 | 75.0%), local government employees (731 | 9.5%), and not-for-profit organizations (459 | 6.0%) make up the most common classes of employment.
| Employer Class | # Employees | % Employees |
| Private Company Employees | 5,753 | 75.0% |
| Self-Employed (Incorporated) | 79 | 1.0% |
| Self-Employed (Not Incorporated) | 272 | 3.5% |
| Not-for-profit Organizations | 459 | 6.0% |
| Local Government Employees | 731 | 9.5% |
| State Government Employees | 199 | 2.6% |
| Federal Government Employees | 120 | 1.6% |
| Unpaid Family Workers | 54 | 0.7% |
| Total | 7,667 | 100.0% |
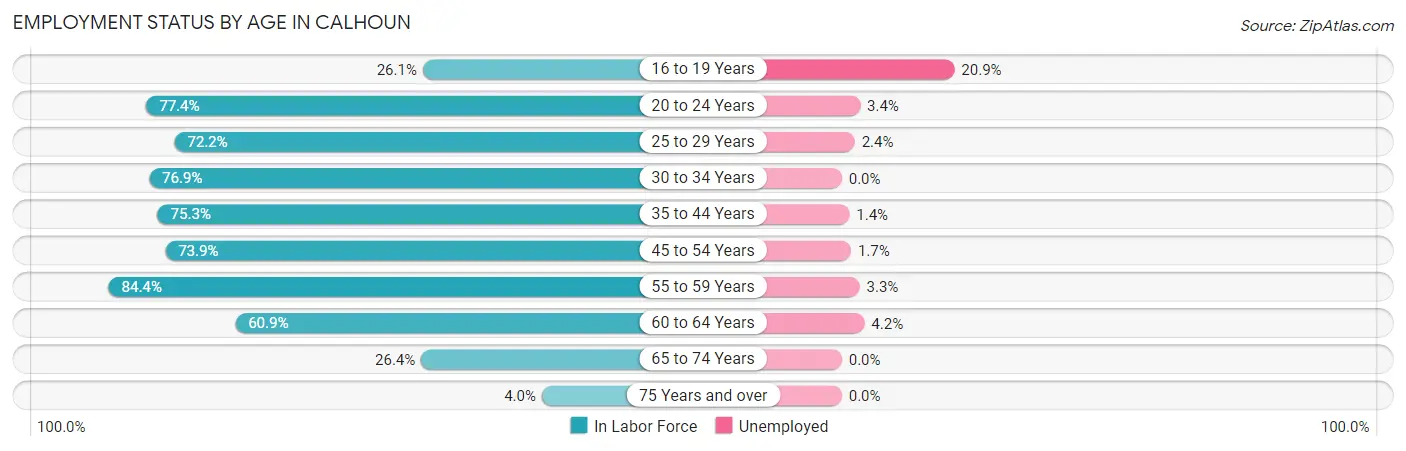
Employment Status by Age in Calhoun
According to the labor force statistics for Calhoun, out of the total population over 16 years of age (12,947), 61.5% or 7,962 individuals are in the labor force, with 2.4% or 191 of them unemployed. The age group with the highest labor force participation rate is 55 to 59 years, with 84.4% or 693 individuals in the labor force. Within the labor force, the 16 to 19 years age range has the highest percentage of unemployed individuals, with 20.9% or 41 of them being unemployed.
| Age Bracket | In Labor Force | Unemployed |
| 16 to 19 Years | 196 (26.1%) | 41 (20.9%) |
| 20 to 24 Years | 941 (77.4%) | 32 (3.4%) |
| 25 to 29 Years | 822 (72.2%) | 20 (2.4%) |
| 30 to 34 Years | 1,050 (76.9%) | 0 (0.0%) |
| 35 to 44 Years | 1,790 (75.3%) | 25 (1.4%) |
| 45 to 54 Years | 1,567 (73.9%) | 27 (1.7%) |
| 55 to 59 Years | 693 (84.4%) | 23 (3.3%) |
| 60 to 64 Years | 590 (60.9%) | 25 (4.2%) |
| 65 to 74 Years | 258 (26.4%) | 0 (0.0%) |
| 75 Years and over | 48 (4.0%) | 0 (0.0%) |
| Total | 7,962 (61.5%) | 191 (2.4%) |
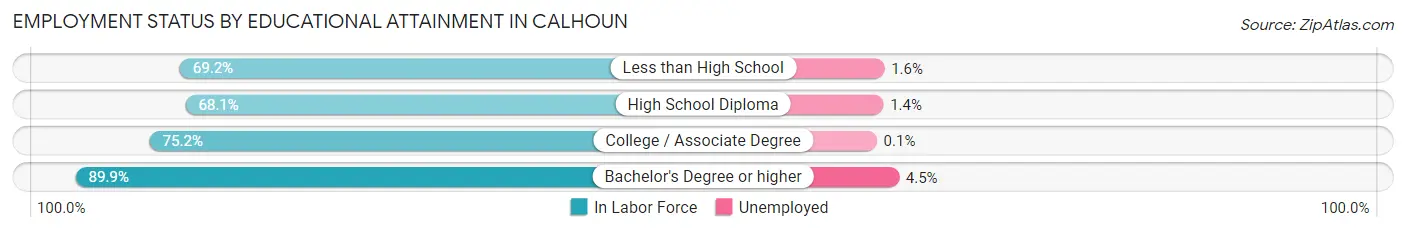
Employment Status by Educational Attainment in Calhoun
According to labor force statistics for Calhoun, 74.1% of individuals (6,515) out of the total population between 25 and 64 years of age (8,792) are in the labor force, with 1.8% or 117 of them being unemployed. The group with the highest labor force participation rate are those with the educational attainment of bachelor's degree or higher, with 89.9% or 1,453 individuals in the labor force. Within the labor force, individuals with bachelor's degree or higher education have the highest percentage of unemployment, with 4.5% or 65 of them being unemployed.
| Educational Attainment | In Labor Force | Unemployed |
| Less than High School | 1,648 (69.2%) | 38 (1.6%) |
| High School Diploma | 1,812 (68.1%) | 37 (1.4%) |
| College / Associate Degree | 1,605 (75.2%) | 2 (0.1%) |
| Bachelor's Degree or higher | 1,453 (89.9%) | 73 (4.5%) |
| Total | 6,515 (74.1%) | 158 (1.8%) |
Employment Occupations by Sex in Calhoun
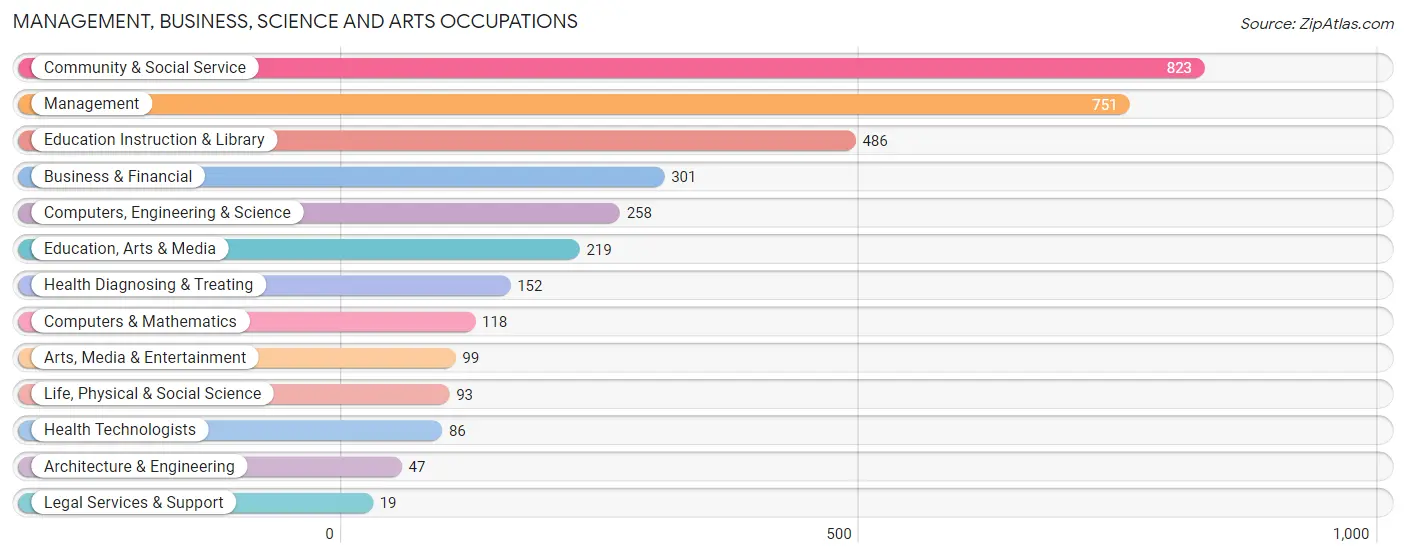
Management, Business, Science and Arts Occupations
The most common Management, Business, Science and Arts occupations in Calhoun are Community & Social Service (823 | 10.6%), Management (751 | 9.7%), Education Instruction & Library (486 | 6.3%), Business & Financial (301 | 3.9%), and Computers, Engineering & Science (258 | 3.3%).
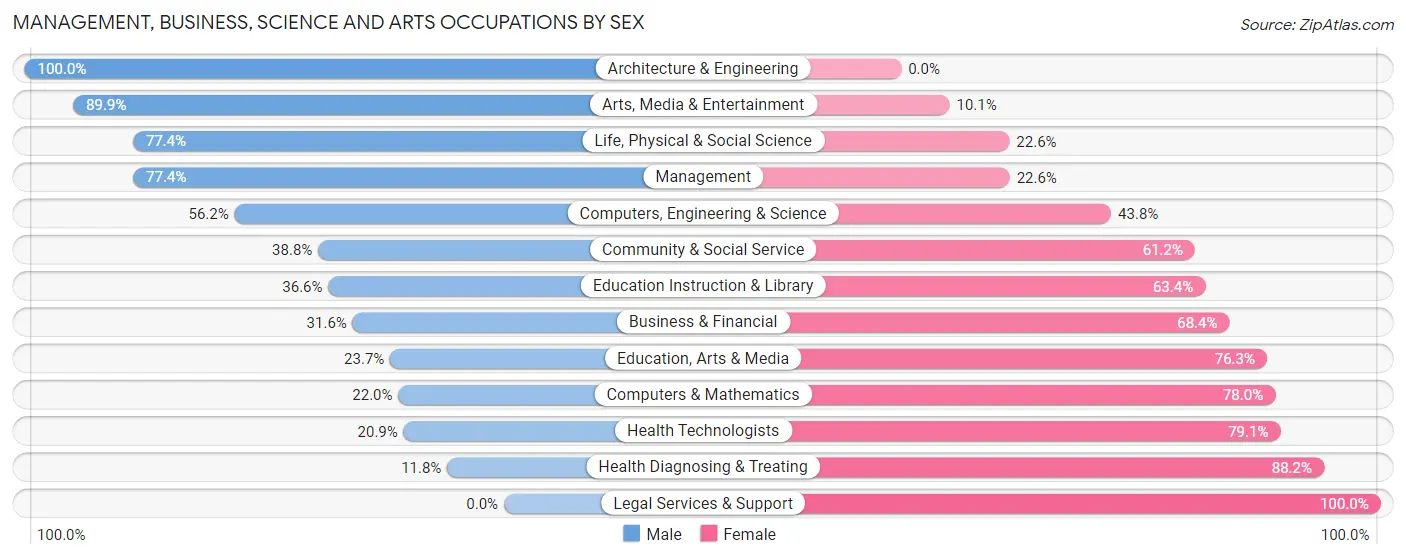
Management, Business, Science and Arts Occupations by Sex
Within the Management, Business, Science and Arts occupations in Calhoun, the most male-oriented occupations are Architecture & Engineering (100.0%), Arts, Media & Entertainment (89.9%), and Life, Physical & Social Science (77.4%), while the most female-oriented occupations are Legal Services & Support (100.0%), Health Diagnosing & Treating (88.2%), and Health Technologists (79.1%).
| Occupation | Male | Female |
| Management | 581 (77.4%) | 170 (22.6%) |
| Business & Financial | 95 (31.6%) | 206 (68.4%) |
| Computers, Engineering & Science | 145 (56.2%) | 113 (43.8%) |
| Computers & Mathematics | 26 (22.0%) | 92 (78.0%) |
| Architecture & Engineering | 47 (100.0%) | 0 (0.0%) |
| Life, Physical & Social Science | 72 (77.4%) | 21 (22.6%) |
| Community & Social Service | 319 (38.8%) | 504 (61.2%) |
| Education, Arts & Media | 52 (23.7%) | 167 (76.3%) |
| Legal Services & Support | 0 (0.0%) | 19 (100.0%) |
| Education Instruction & Library | 178 (36.6%) | 308 (63.4%) |
| Arts, Media & Entertainment | 89 (89.9%) | 10 (10.1%) |
| Health Diagnosing & Treating | 18 (11.8%) | 134 (88.2%) |
| Health Technologists | 18 (20.9%) | 68 (79.1%) |
| Total (Category) | 1,158 (50.7%) | 1,127 (49.3%) |
| Total (Overall) | 4,565 (58.8%) | 3,202 (41.2%) |
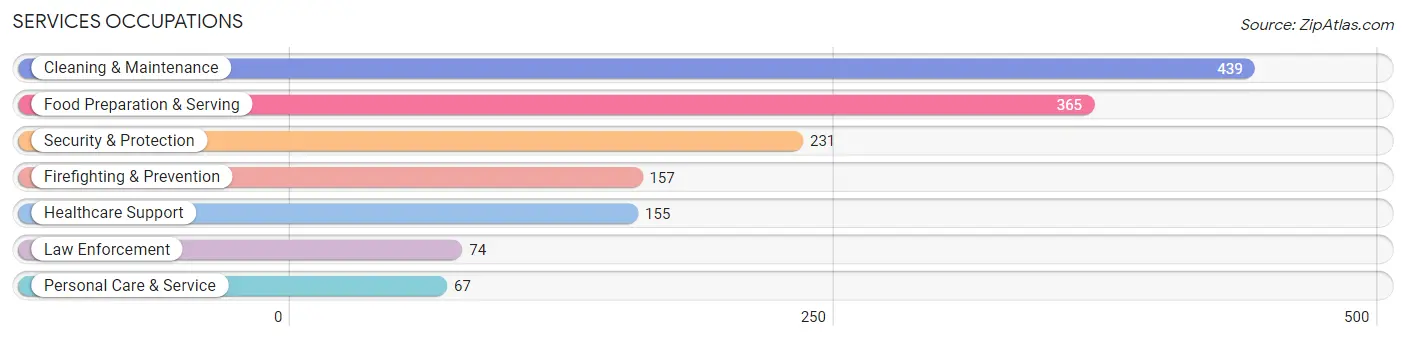
Services Occupations
The most common Services occupations in Calhoun are Cleaning & Maintenance (439 | 5.7%), Food Preparation & Serving (365 | 4.7%), Security & Protection (231 | 3.0%), Firefighting & Prevention (157 | 2.0%), and Healthcare Support (155 | 2.0%).
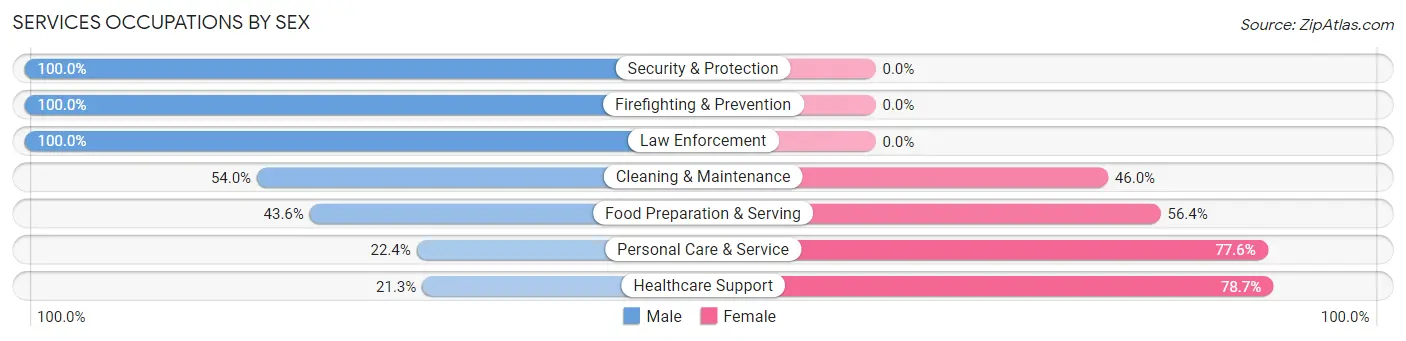
Services Occupations by Sex
Within the Services occupations in Calhoun, the most male-oriented occupations are Security & Protection (100.0%), Firefighting & Prevention (100.0%), and Law Enforcement (100.0%), while the most female-oriented occupations are Healthcare Support (78.7%), Personal Care & Service (77.6%), and Food Preparation & Serving (56.4%).
| Occupation | Male | Female |
| Healthcare Support | 33 (21.3%) | 122 (78.7%) |
| Security & Protection | 231 (100.0%) | 0 (0.0%) |
| Firefighting & Prevention | 157 (100.0%) | 0 (0.0%) |
| Law Enforcement | 74 (100.0%) | 0 (0.0%) |
| Food Preparation & Serving | 159 (43.6%) | 206 (56.4%) |
| Cleaning & Maintenance | 237 (54.0%) | 202 (46.0%) |
| Personal Care & Service | 15 (22.4%) | 52 (77.6%) |
| Total (Category) | 675 (53.7%) | 582 (46.3%) |
| Total (Overall) | 4,565 (58.8%) | 3,202 (41.2%) |
Sales and Office Occupations
The most common Sales and Office occupations in Calhoun are Office & Administration (956 | 12.3%), and Sales & Related (617 | 7.9%).

Sales and Office Occupations by Sex

| Occupation | Male | Female |
| Sales & Related | 343 (55.6%) | 274 (44.4%) |
| Office & Administration | 293 (30.6%) | 663 (69.4%) |
| Total (Category) | 636 (40.4%) | 937 (59.6%) |
| Total (Overall) | 4,565 (58.8%) | 3,202 (41.2%) |
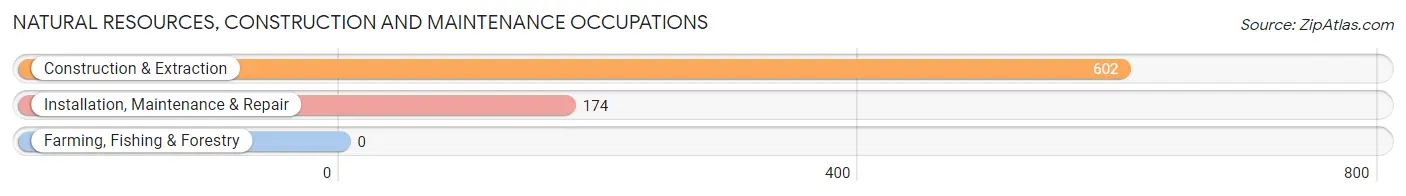
Natural Resources, Construction and Maintenance Occupations
The most common Natural Resources, Construction and Maintenance occupations in Calhoun are Construction & Extraction (602 | 7.7%), and Installation, Maintenance & Repair (174 | 2.2%).
Natural Resources, Construction and Maintenance Occupations by Sex
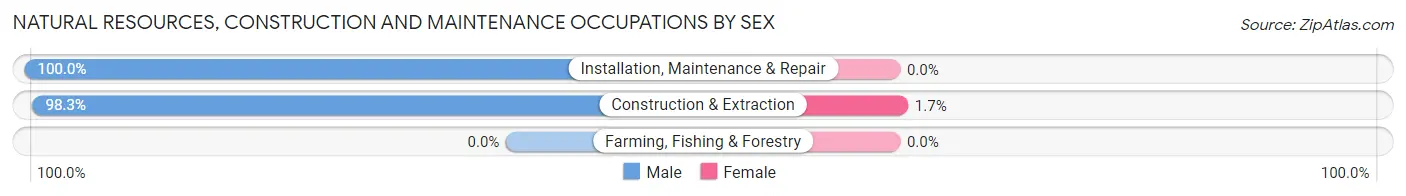
| Occupation | Male | Female |
| Farming, Fishing & Forestry | 0 (0.0%) | 0 (0.0%) |
| Construction & Extraction | 592 (98.3%) | 10 (1.7%) |
| Installation, Maintenance & Repair | 174 (100.0%) | 0 (0.0%) |
| Total (Category) | 766 (98.7%) | 10 (1.3%) |
| Total (Overall) | 4,565 (58.8%) | 3,202 (41.2%) |
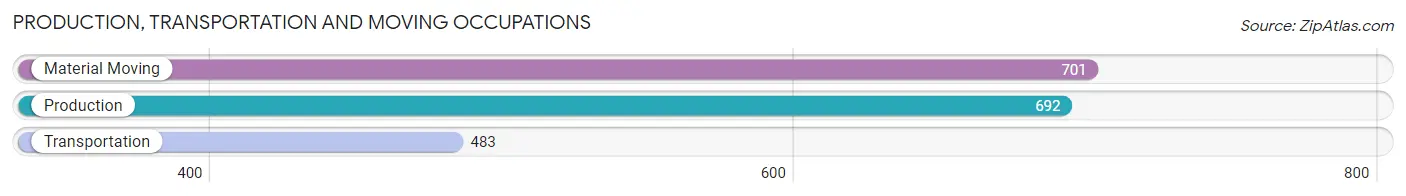
Production, Transportation and Moving Occupations
The most common Production, Transportation and Moving occupations in Calhoun are Material Moving (701 | 9.0%), Production (692 | 8.9%), and Transportation (483 | 6.2%).
Production, Transportation and Moving Occupations by Sex
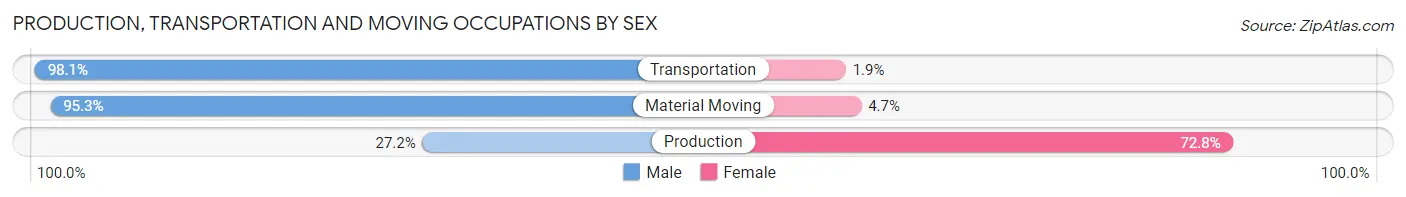
| Occupation | Male | Female |
| Production | 188 (27.2%) | 504 (72.8%) |
| Transportation | 474 (98.1%) | 9 (1.9%) |
| Material Moving | 668 (95.3%) | 33 (4.7%) |
| Total (Category) | 1,330 (70.9%) | 546 (29.1%) |
| Total (Overall) | 4,565 (58.8%) | 3,202 (41.2%) |
Employment Industries by Sex in Calhoun
Employment Industries in Calhoun
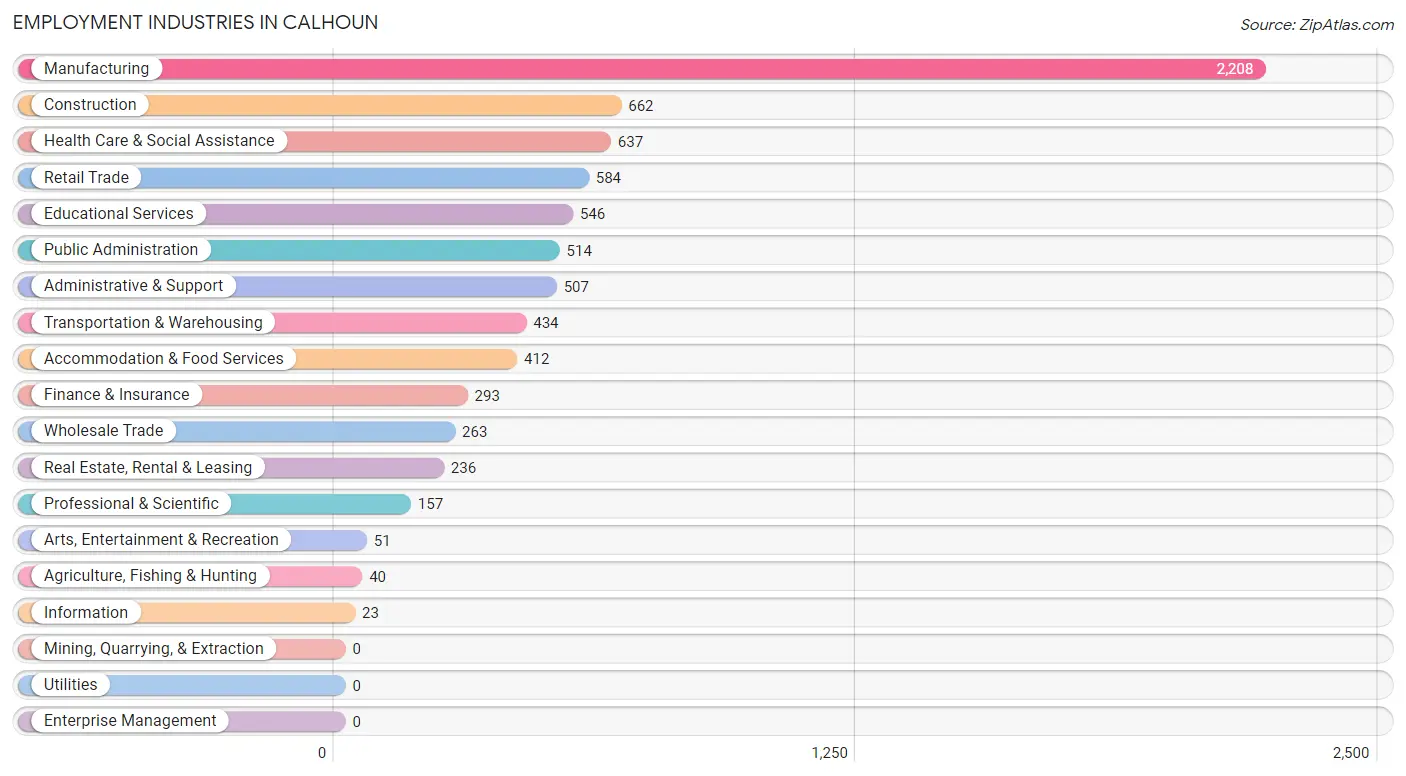
The major employment industries in Calhoun include Manufacturing (2,208 | 28.4%), Construction (662 | 8.5%), Health Care & Social Assistance (637 | 8.2%), Retail Trade (584 | 7.5%), and Educational Services (546 | 7.0%).
Employment Industries by Sex in Calhoun
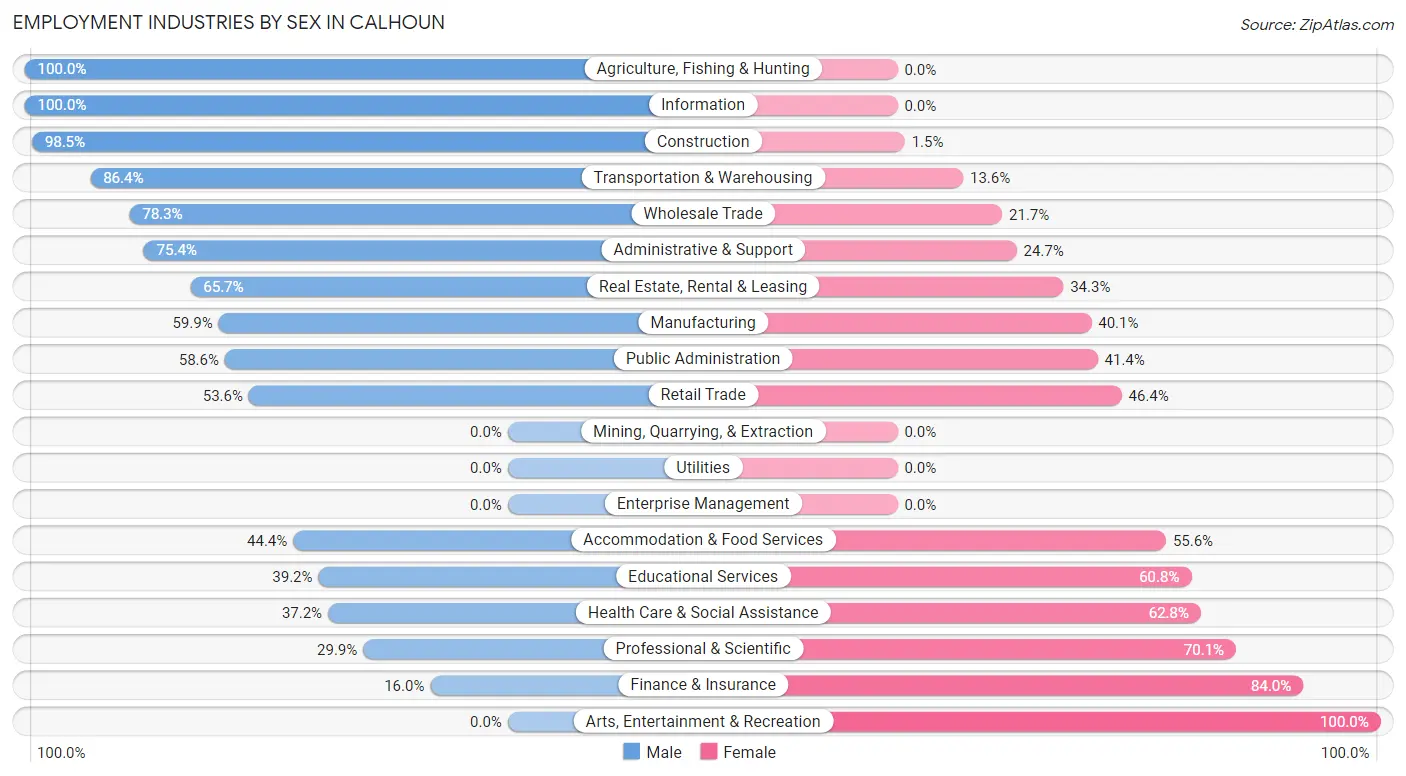
The Calhoun industries that see more men than women are Agriculture, Fishing & Hunting (100.0%), Information (100.0%), and Construction (98.5%), whereas the industries that tend to have a higher number of women are Arts, Entertainment & Recreation (100.0%), Finance & Insurance (84.0%), and Professional & Scientific (70.1%).
| Industry | Male | Female |
| Agriculture, Fishing & Hunting | 40 (100.0%) | 0 (0.0%) |
| Mining, Quarrying, & Extraction | 0 (0.0%) | 0 (0.0%) |
| Construction | 652 (98.5%) | 10 (1.5%) |
| Manufacturing | 1,322 (59.9%) | 886 (40.1%) |
| Wholesale Trade | 206 (78.3%) | 57 (21.7%) |
| Retail Trade | 313 (53.6%) | 271 (46.4%) |
| Transportation & Warehousing | 375 (86.4%) | 59 (13.6%) |
| Utilities | 0 (0.0%) | 0 (0.0%) |
| Information | 23 (100.0%) | 0 (0.0%) |
| Finance & Insurance | 47 (16.0%) | 246 (84.0%) |
| Real Estate, Rental & Leasing | 155 (65.7%) | 81 (34.3%) |
| Professional & Scientific | 47 (29.9%) | 110 (70.1%) |
| Enterprise Management | 0 (0.0%) | 0 (0.0%) |
| Administrative & Support | 382 (75.3%) | 125 (24.6%) |
| Educational Services | 214 (39.2%) | 332 (60.8%) |
| Health Care & Social Assistance | 237 (37.2%) | 400 (62.8%) |
| Arts, Entertainment & Recreation | 0 (0.0%) | 51 (100.0%) |
| Accommodation & Food Services | 183 (44.4%) | 229 (55.6%) |
| Public Administration | 301 (58.6%) | 213 (41.4%) |
| Total | 4,565 (58.8%) | 3,202 (41.2%) |
Education in Calhoun
School Enrollment in Calhoun
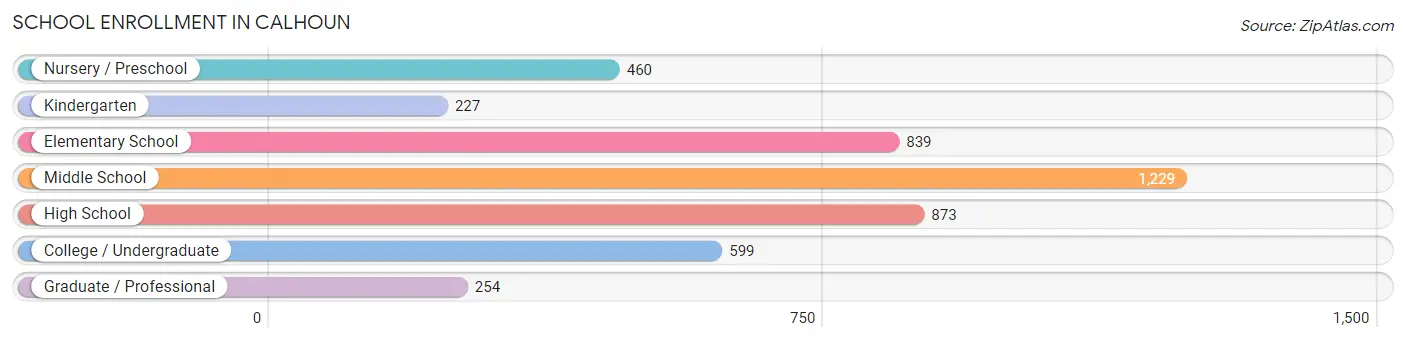
The most common levels of schooling among the 4,481 students in Calhoun are middle school (1,229 | 27.4%), high school (873 | 19.5%), and elementary school (839 | 18.7%).
| School Level | # Students | % Students |
| Nursery / Preschool | 460 | 10.3% |
| Kindergarten | 227 | 5.1% |
| Elementary School | 839 | 18.7% |
| Middle School | 1,229 | 27.4% |
| High School | 873 | 19.5% |
| College / Undergraduate | 599 | 13.4% |
| Graduate / Professional | 254 | 5.7% |
| Total | 4,481 | 100.0% |
School Enrollment by Age by Funding Source in Calhoun
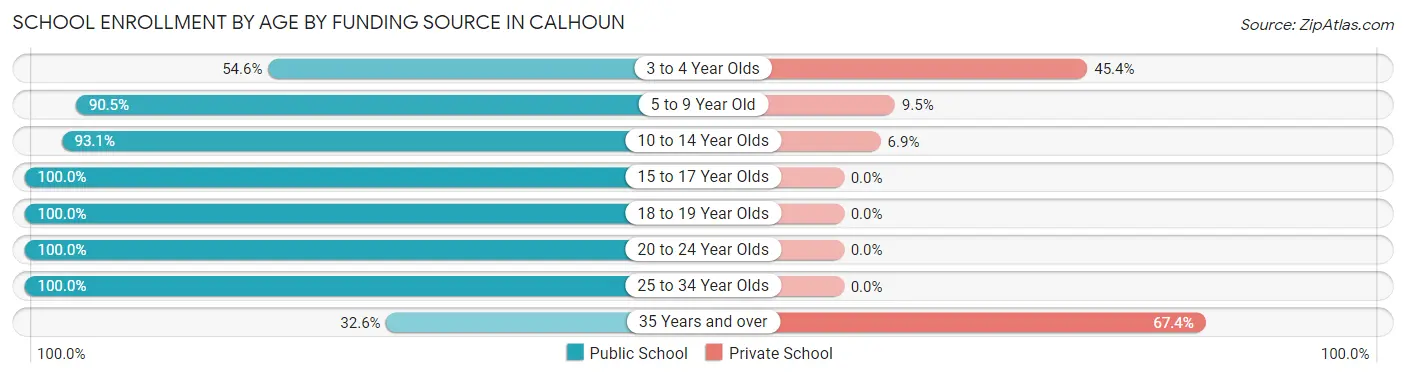
Out of a total of 4,481 students who are enrolled in schools in Calhoun, 524 (11.7%) attend a private institution, while the remaining 3,957 (88.3%) are enrolled in public schools. The age group of 35 years and over has the highest likelihood of being enrolled in private schools, with 155 (67.4% in the age bracket) enrolled. Conversely, the age group of 15 to 17 year olds has the lowest likelihood of being enrolled in a private school, with 716 (100.0% in the age bracket) attending a public institution.
| Age Bracket | Public School | Private School |
| 3 to 4 Year Olds | 213 (54.6%) | 177 (45.4%) |
| 5 to 9 Year Old | 872 (90.5%) | 92 (9.5%) |
| 10 to 14 Year Olds | 1,351 (93.1%) | 100 (6.9%) |
| 15 to 17 Year Olds | 716 (100.0%) | 0 (0.0%) |
| 18 to 19 Year Olds | 140 (100.0%) | 0 (0.0%) |
| 20 to 24 Year Olds | 269 (100.0%) | 0 (0.0%) |
| 25 to 34 Year Olds | 321 (100.0%) | 0 (0.0%) |
| 35 Years and over | 75 (32.6%) | 155 (67.4%) |
| Total | 3,957 (88.3%) | 524 (11.7%) |
Educational Attainment by Field of Study in Calhoun
Education (500 | 21.6%), business (427 | 18.4%), engineering (251 | 10.8%), social sciences (187 | 8.1%), and liberal arts & history (182 | 7.9%) are the most common fields of study among 2,316 individuals in Calhoun who have obtained a bachelor's degree or higher.
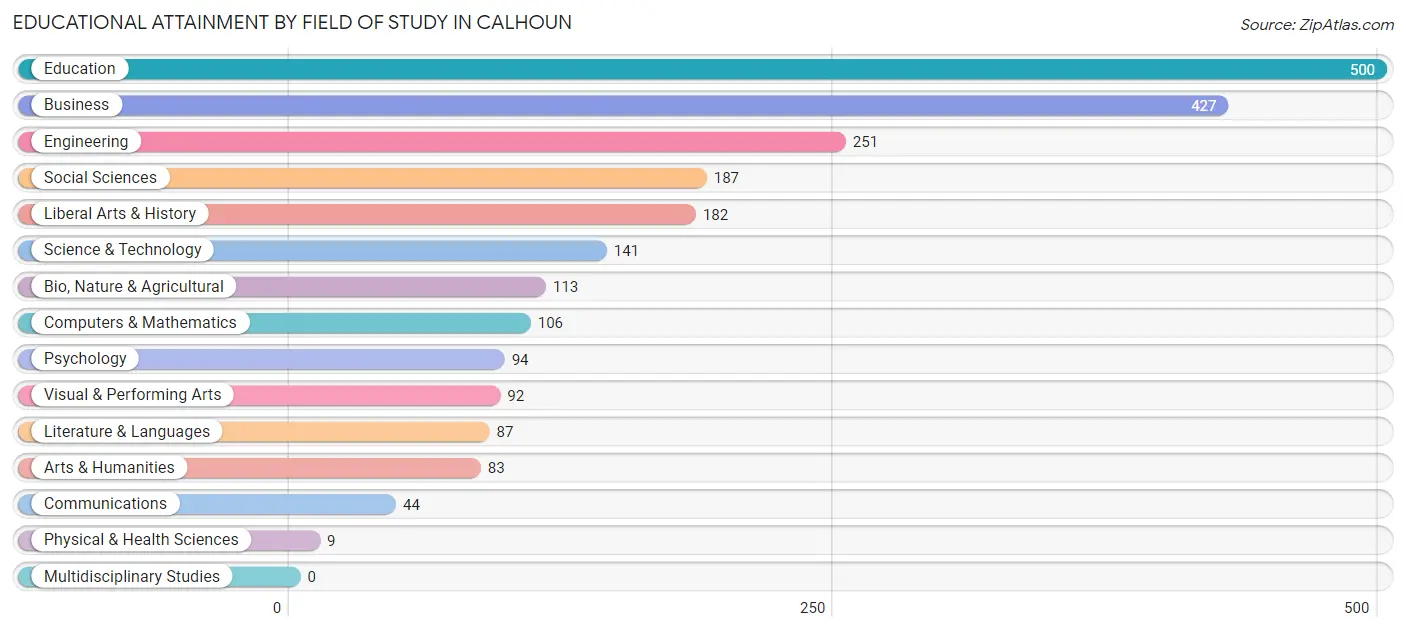
| Field of Study | # Graduates | % Graduates |
| Computers & Mathematics | 106 | 4.6% |
| Bio, Nature & Agricultural | 113 | 4.9% |
| Physical & Health Sciences | 9 | 0.4% |
| Psychology | 94 | 4.1% |
| Social Sciences | 187 | 8.1% |
| Engineering | 251 | 10.8% |
| Multidisciplinary Studies | 0 | 0.0% |
| Science & Technology | 141 | 6.1% |
| Business | 427 | 18.4% |
| Education | 500 | 21.6% |
| Literature & Languages | 87 | 3.8% |
| Liberal Arts & History | 182 | 7.9% |
| Visual & Performing Arts | 92 | 4.0% |
| Communications | 44 | 1.9% |
| Arts & Humanities | 83 | 3.6% |
| Total | 2,316 | 100.0% |
Transportation & Commute in Calhoun
Vehicle Availability by Sex in Calhoun
The most prevalent vehicle ownership categories in Calhoun are males with 2 vehicles (1,862, accounting for 41.2%) and females with 2 vehicles (1,417, making up 59.2%).
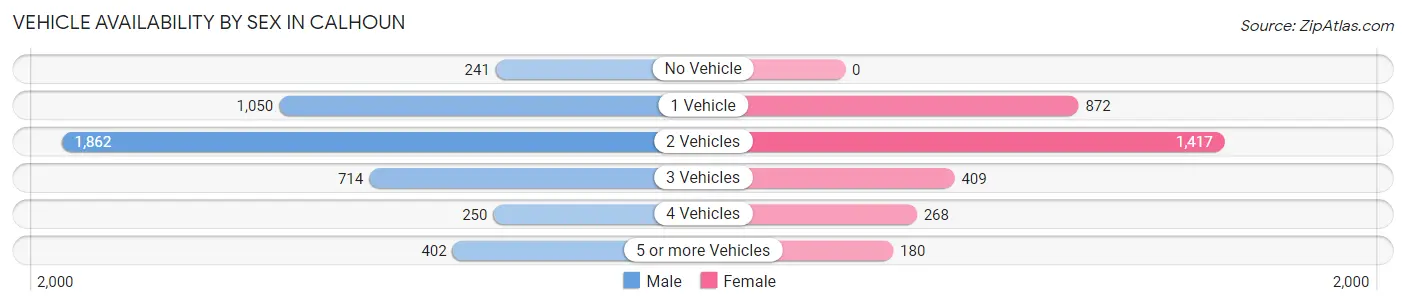
| Vehicles Available | Male | Female |
| No Vehicle | 241 (5.3%) | 0 (0.0%) |
| 1 Vehicle | 1,050 (23.2%) | 872 (27.7%) |
| 2 Vehicles | 1,862 (41.2%) | 1,417 (45.0%) |
| 3 Vehicles | 714 (15.8%) | 409 (13.0%) |
| 4 Vehicles | 250 (5.5%) | 268 (8.5%) |
| 5 or more Vehicles | 402 (8.9%) | 180 (5.7%) |
| Total | 4,519 (100.0%) | 3,146 (100.0%) |
Commute Time in Calhoun
The most frequently occuring commute durations in Calhoun are 15 to 19 minutes (1,788 commuters, 25.1%), 10 to 14 minutes (1,405 commuters, 19.8%), and 5 to 9 minutes (925 commuters, 13.0%).
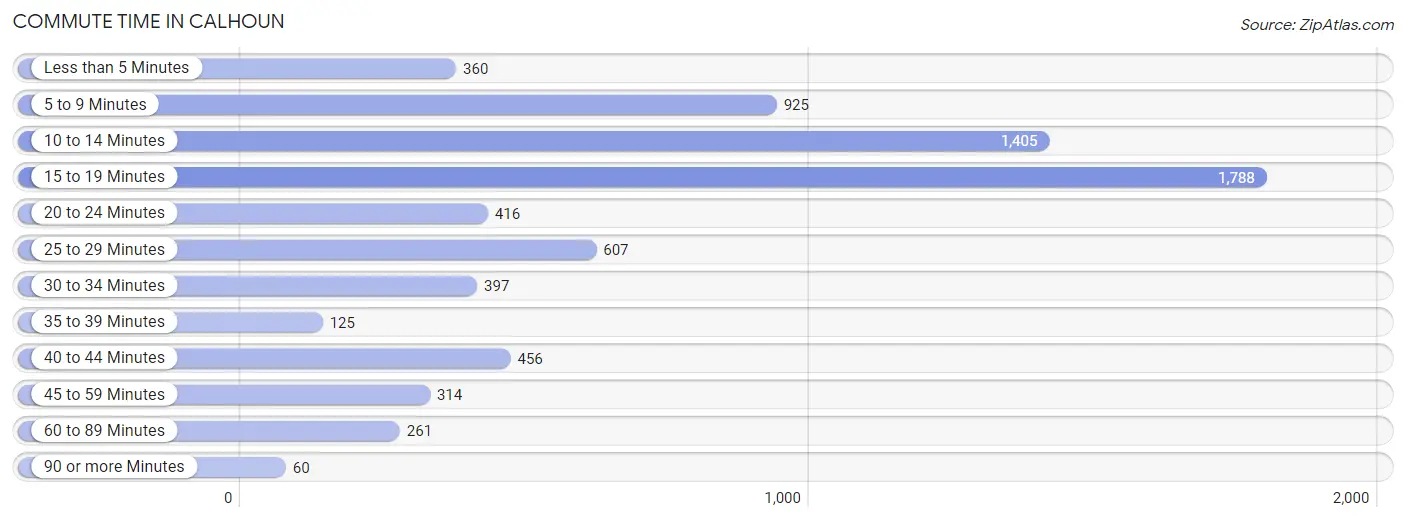
| Commute Time | # Commuters | % Commuters |
| Less than 5 Minutes | 360 | 5.1% |
| 5 to 9 Minutes | 925 | 13.0% |
| 10 to 14 Minutes | 1,405 | 19.8% |
| 15 to 19 Minutes | 1,788 | 25.1% |
| 20 to 24 Minutes | 416 | 5.9% |
| 25 to 29 Minutes | 607 | 8.5% |
| 30 to 34 Minutes | 397 | 5.6% |
| 35 to 39 Minutes | 125 | 1.8% |
| 40 to 44 Minutes | 456 | 6.4% |
| 45 to 59 Minutes | 314 | 4.4% |
| 60 to 89 Minutes | 261 | 3.7% |
| 90 or more Minutes | 60 | 0.8% |
Commute Time by Sex in Calhoun
The most common commute times in Calhoun are 15 to 19 minutes (1,060 commuters, 25.1%) for males and 15 to 19 minutes (728 commuters, 25.2%) for females.
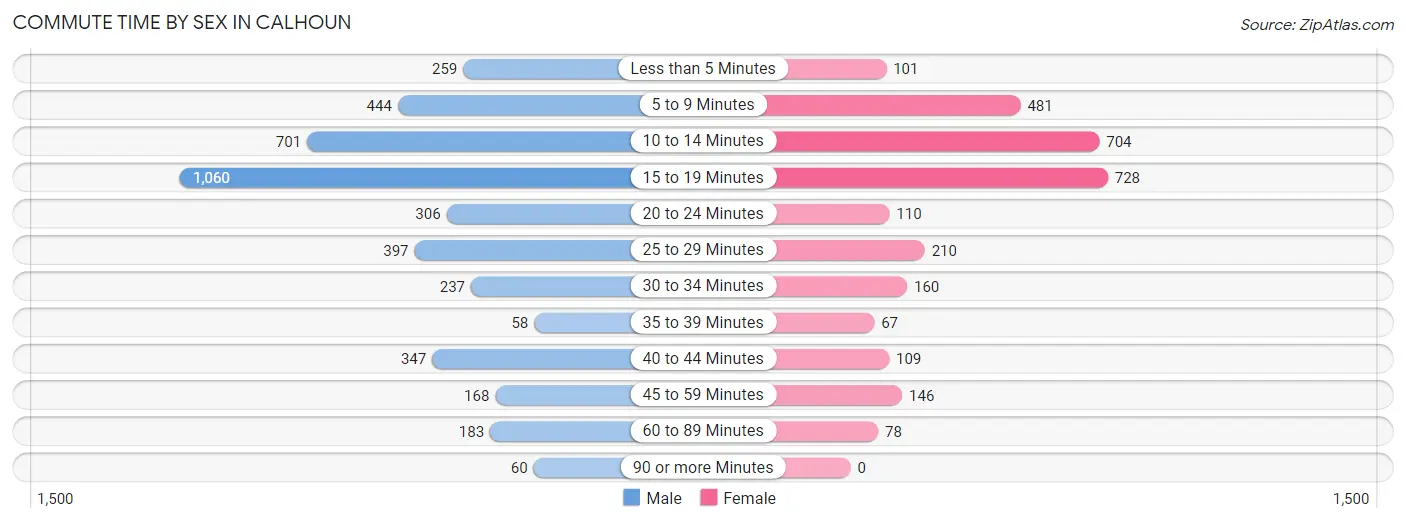
| Commute Time | Male | Female |
| Less than 5 Minutes | 259 (6.1%) | 101 (3.5%) |
| 5 to 9 Minutes | 444 (10.5%) | 481 (16.6%) |
| 10 to 14 Minutes | 701 (16.6%) | 704 (24.3%) |
| 15 to 19 Minutes | 1,060 (25.1%) | 728 (25.2%) |
| 20 to 24 Minutes | 306 (7.2%) | 110 (3.8%) |
| 25 to 29 Minutes | 397 (9.4%) | 210 (7.3%) |
| 30 to 34 Minutes | 237 (5.6%) | 160 (5.5%) |
| 35 to 39 Minutes | 58 (1.4%) | 67 (2.3%) |
| 40 to 44 Minutes | 347 (8.2%) | 109 (3.8%) |
| 45 to 59 Minutes | 168 (4.0%) | 146 (5.0%) |
| 60 to 89 Minutes | 183 (4.3%) | 78 (2.7%) |
| 90 or more Minutes | 60 (1.4%) | 0 (0.0%) |
Time of Departure to Work by Sex in Calhoun
The most frequent times of departure to work in Calhoun are 7:00 AM to 7:29 AM (1,185, 28.1%) for males and 7:00 AM to 7:29 AM (683, 23.6%) for females.
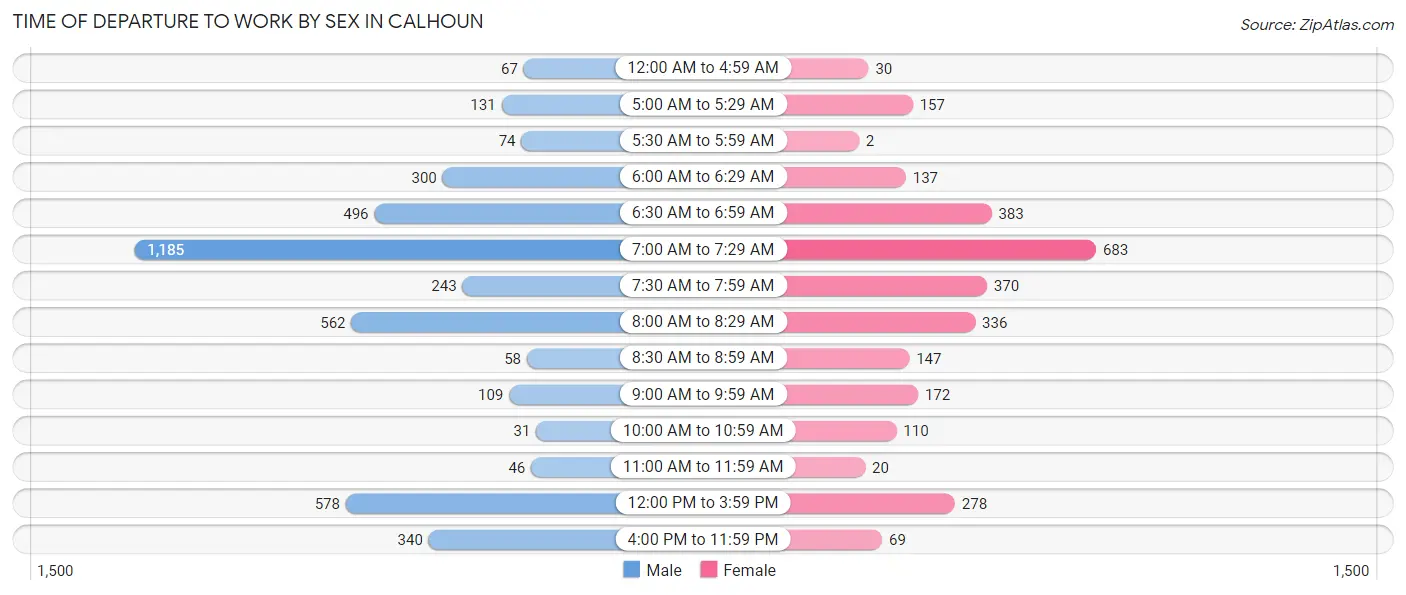
| Time of Departure | Male | Female |
| 12:00 AM to 4:59 AM | 67 (1.6%) | 30 (1.0%) |
| 5:00 AM to 5:29 AM | 131 (3.1%) | 157 (5.4%) |
| 5:30 AM to 5:59 AM | 74 (1.8%) | 2 (0.1%) |
| 6:00 AM to 6:29 AM | 300 (7.1%) | 137 (4.7%) |
| 6:30 AM to 6:59 AM | 496 (11.7%) | 383 (13.2%) |
| 7:00 AM to 7:29 AM | 1,185 (28.1%) | 683 (23.6%) |
| 7:30 AM to 7:59 AM | 243 (5.8%) | 370 (12.8%) |
| 8:00 AM to 8:29 AM | 562 (13.3%) | 336 (11.6%) |
| 8:30 AM to 8:59 AM | 58 (1.4%) | 147 (5.1%) |
| 9:00 AM to 9:59 AM | 109 (2.6%) | 172 (5.9%) |
| 10:00 AM to 10:59 AM | 31 (0.7%) | 110 (3.8%) |
| 11:00 AM to 11:59 AM | 46 (1.1%) | 20 (0.7%) |
| 12:00 PM to 3:59 PM | 578 (13.7%) | 278 (9.6%) |
| 4:00 PM to 11:59 PM | 340 (8.1%) | 69 (2.4%) |
| Total | 4,220 (100.0%) | 2,894 (100.0%) |
Housing Occupancy in Calhoun
Occupancy by Ownership in Calhoun
Of the total 6,121 dwellings in Calhoun, owner-occupied units account for 3,159 (51.6%), while renter-occupied units make up 2,962 (48.4%).
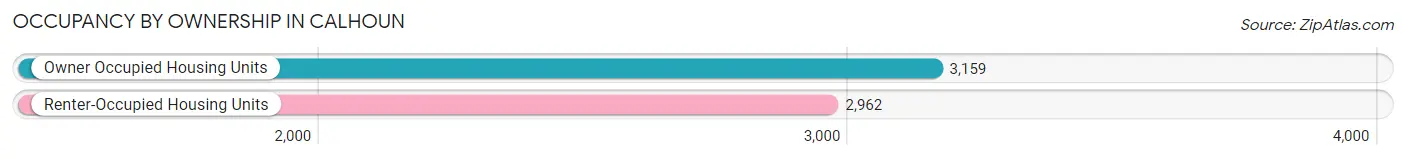
| Occupancy | # Housing Units | % Housing Units |
| Owner Occupied Housing Units | 3,159 | 51.6% |
| Renter-Occupied Housing Units | 2,962 | 48.4% |
| Total Occupied Housing Units | 6,121 | 100.0% |
Occupancy by Household Size in Calhoun
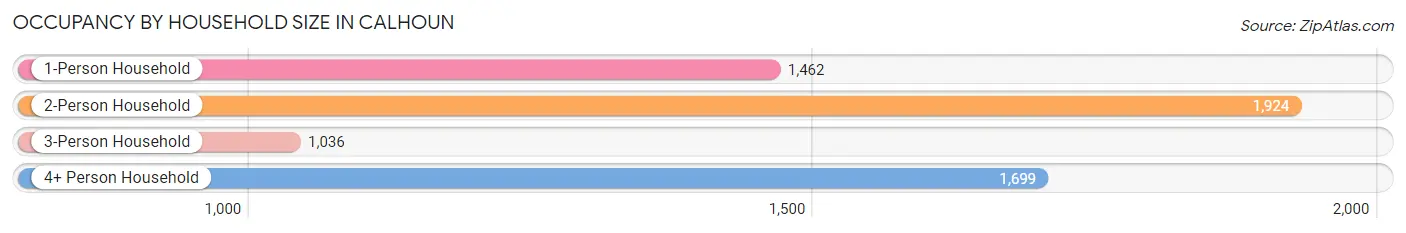
| Household Size | # Housing Units | % Housing Units |
| 1-Person Household | 1,462 | 23.9% |
| 2-Person Household | 1,924 | 31.4% |
| 3-Person Household | 1,036 | 16.9% |
| 4+ Person Household | 1,699 | 27.8% |
| Total Housing Units | 6,121 | 100.0% |
Occupancy by Ownership by Household Size in Calhoun
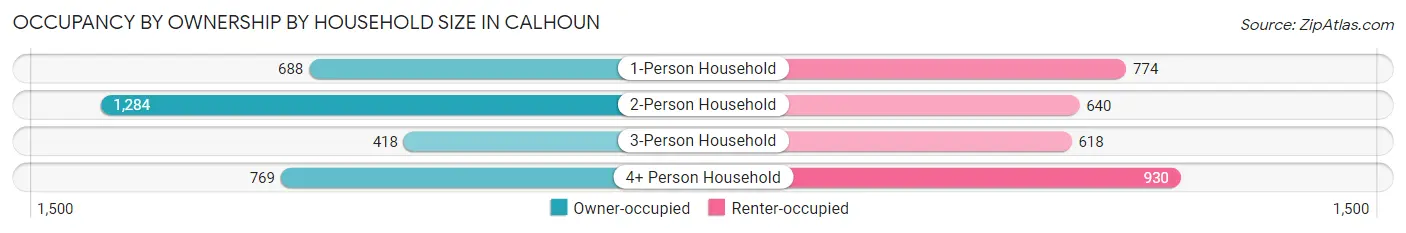
| Household Size | Owner-occupied | Renter-occupied |
| 1-Person Household | 688 (47.1%) | 774 (52.9%) |
| 2-Person Household | 1,284 (66.7%) | 640 (33.3%) |
| 3-Person Household | 418 (40.4%) | 618 (59.7%) |
| 4+ Person Household | 769 (45.3%) | 930 (54.7%) |
| Total Housing Units | 3,159 (51.6%) | 2,962 (48.4%) |
Occupancy by Educational Attainment in Calhoun
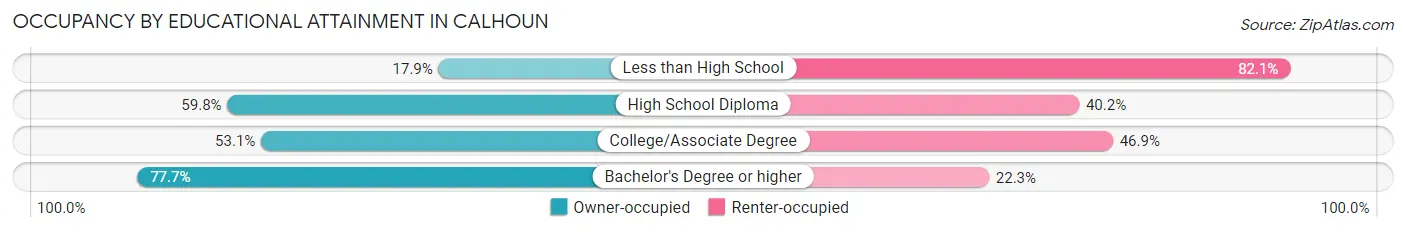
| Household Size | Owner-occupied | Renter-occupied |
| Less than High School | 272 (17.9%) | 1,246 (82.1%) |
| High School Diploma | 989 (59.8%) | 665 (40.2%) |
| College/Associate Degree | 848 (53.1%) | 749 (46.9%) |
| Bachelor's Degree or higher | 1,050 (77.7%) | 302 (22.3%) |
Occupancy by Age of Householder in Calhoun
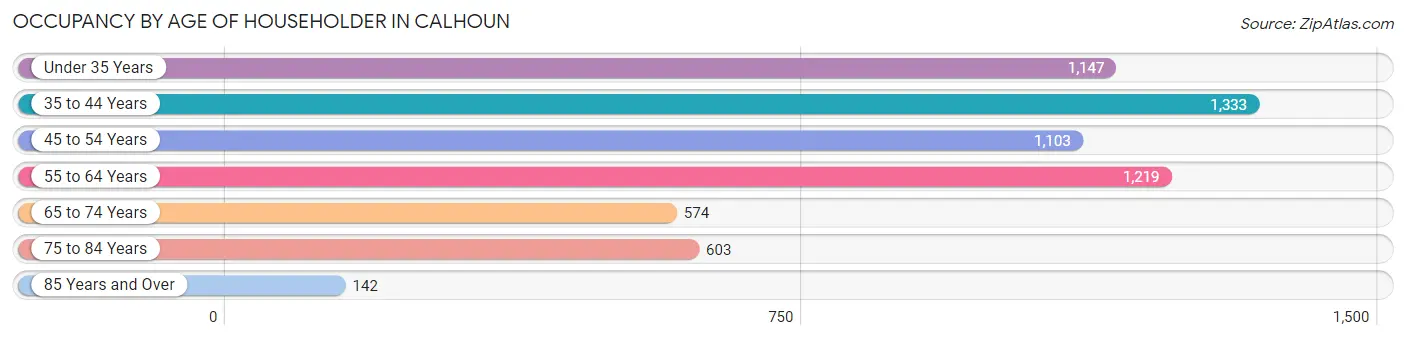
| Age Bracket | # Households | % Households |
| Under 35 Years | 1,147 | 18.7% |
| 35 to 44 Years | 1,333 | 21.8% |
| 45 to 54 Years | 1,103 | 18.0% |
| 55 to 64 Years | 1,219 | 19.9% |
| 65 to 74 Years | 574 | 9.4% |
| 75 to 84 Years | 603 | 9.9% |
| 85 Years and Over | 142 | 2.3% |
| Total | 6,121 | 100.0% |
Housing Finances in Calhoun
Median Income by Occupancy in Calhoun
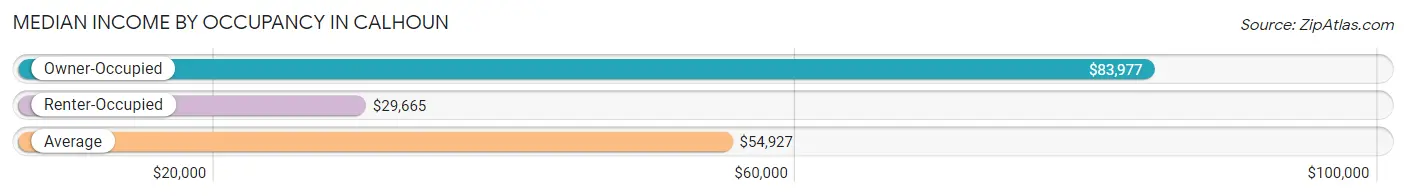
| Occupancy Type | # Households | Median Income |
| Owner-Occupied | 3,159 (51.6%) | $83,977 |
| Renter-Occupied | 2,962 (48.4%) | $29,665 |
| Average | 6,121 (100.0%) | $54,927 |
Occupancy by Householder Income Bracket in Calhoun
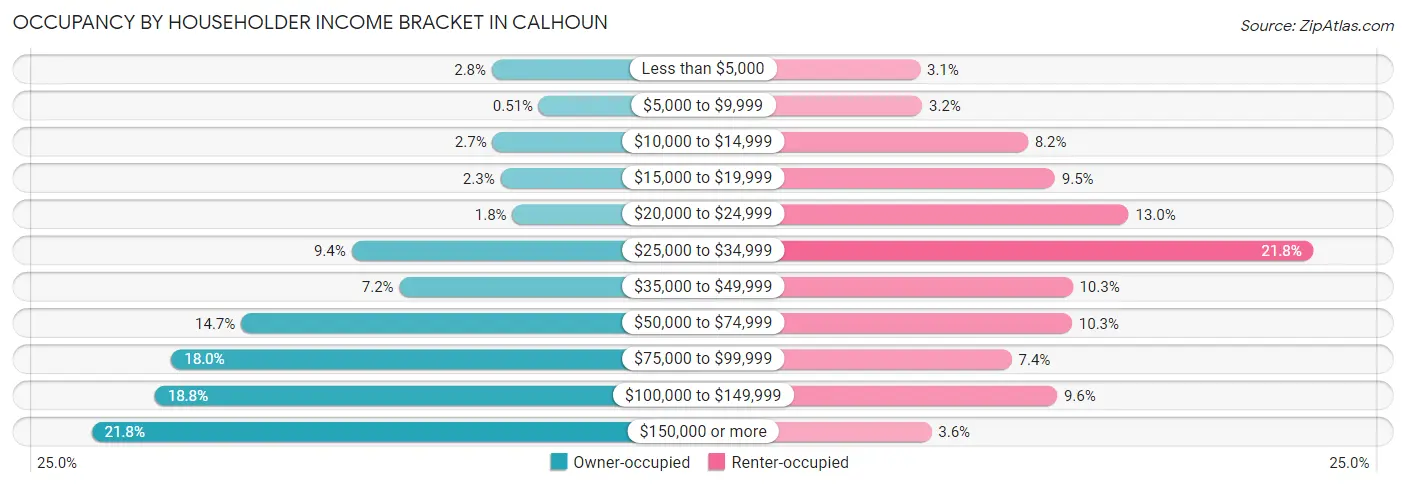
| Income Bracket | Owner-occupied | Renter-occupied |
| Less than $5,000 | 87 (2.8%) | 91 (3.1%) |
| $5,000 to $9,999 | 16 (0.5%) | 94 (3.2%) |
| $10,000 to $14,999 | 86 (2.7%) | 243 (8.2%) |
| $15,000 to $19,999 | 74 (2.3%) | 281 (9.5%) |
| $20,000 to $24,999 | 56 (1.8%) | 385 (13.0%) |
| $25,000 to $34,999 | 298 (9.4%) | 646 (21.8%) |
| $35,000 to $49,999 | 226 (7.1%) | 306 (10.3%) |
| $50,000 to $74,999 | 464 (14.7%) | 305 (10.3%) |
| $75,000 to $99,999 | 569 (18.0%) | 220 (7.4%) |
| $100,000 to $149,999 | 594 (18.8%) | 284 (9.6%) |
| $150,000 or more | 689 (21.8%) | 107 (3.6%) |
| Total | 3,159 (100.0%) | 2,962 (100.0%) |
Monthly Housing Cost Tiers in Calhoun
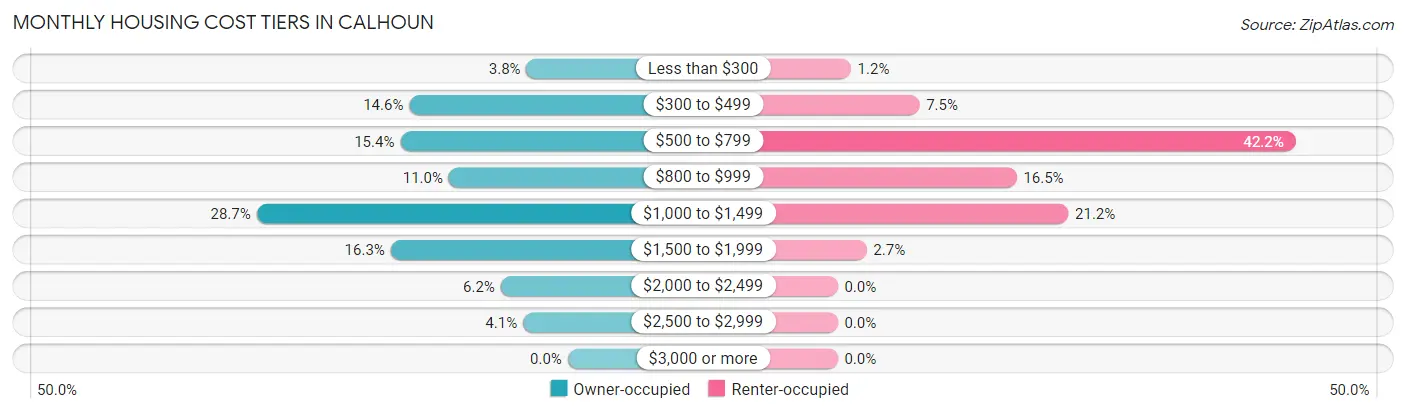
| Monthly Cost | Owner-occupied | Renter-occupied |
| Less than $300 | 120 (3.8%) | 36 (1.2%) |
| $300 to $499 | 461 (14.6%) | 223 (7.5%) |
| $500 to $799 | 487 (15.4%) | 1,249 (42.2%) |
| $800 to $999 | 346 (11.0%) | 488 (16.5%) |
| $1,000 to $1,499 | 905 (28.6%) | 629 (21.2%) |
| $1,500 to $1,999 | 515 (16.3%) | 79 (2.7%) |
| $2,000 to $2,499 | 195 (6.2%) | 0 (0.0%) |
| $2,500 to $2,999 | 130 (4.1%) | 0 (0.0%) |
| $3,000 or more | 0 (0.0%) | 0 (0.0%) |
| Total | 3,159 (100.0%) | 2,962 (100.0%) |
Physical Housing Characteristics in Calhoun
Housing Structures in Calhoun
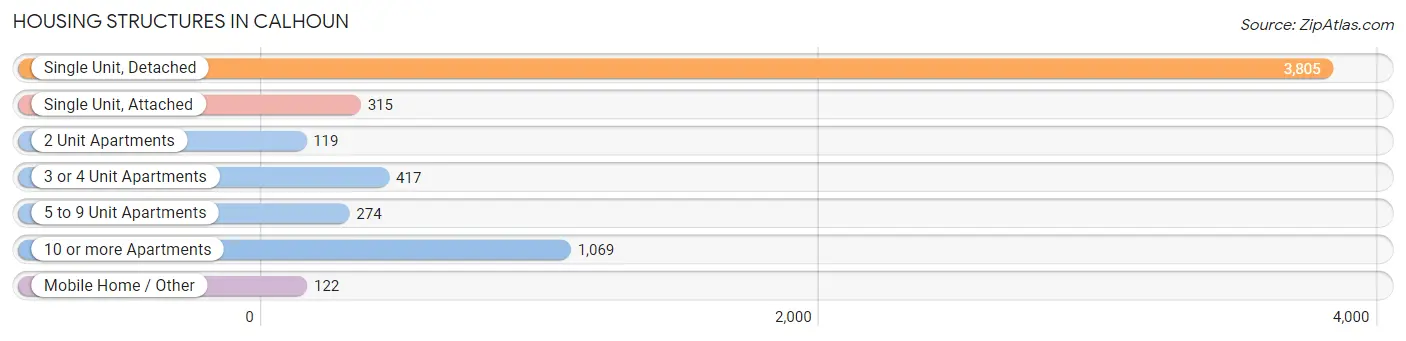
| Structure Type | # Housing Units | % Housing Units |
| Single Unit, Detached | 3,805 | 62.2% |
| Single Unit, Attached | 315 | 5.1% |
| 2 Unit Apartments | 119 | 1.9% |
| 3 or 4 Unit Apartments | 417 | 6.8% |
| 5 to 9 Unit Apartments | 274 | 4.5% |
| 10 or more Apartments | 1,069 | 17.5% |
| Mobile Home / Other | 122 | 2.0% |
| Total | 6,121 | 100.0% |
Housing Structures by Occupancy in Calhoun
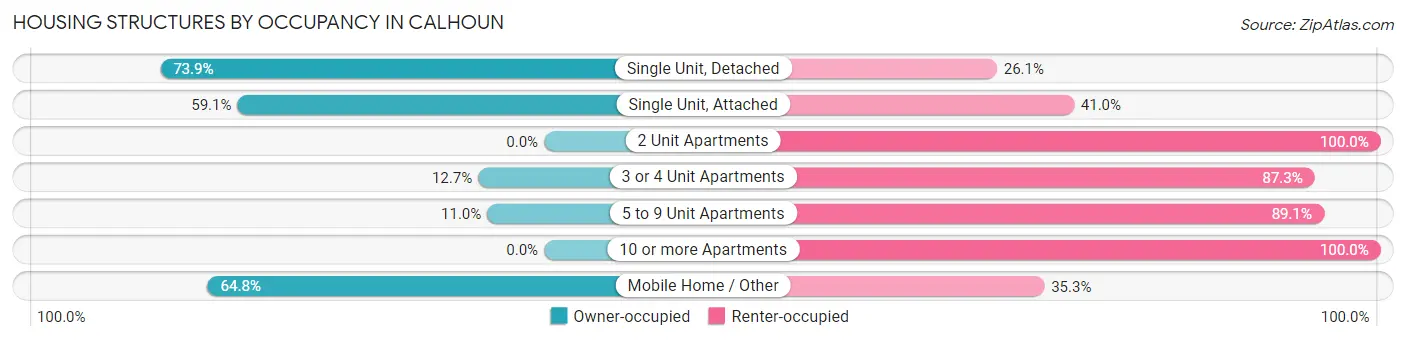
| Structure Type | Owner-occupied | Renter-occupied |
| Single Unit, Detached | 2,811 (73.9%) | 994 (26.1%) |
| Single Unit, Attached | 186 (59.1%) | 129 (40.9%) |
| 2 Unit Apartments | 0 (0.0%) | 119 (100.0%) |
| 3 or 4 Unit Apartments | 53 (12.7%) | 364 (87.3%) |
| 5 to 9 Unit Apartments | 30 (11.0%) | 244 (89.0%) |
| 10 or more Apartments | 0 (0.0%) | 1,069 (100.0%) |
| Mobile Home / Other | 79 (64.7%) | 43 (35.2%) |
| Total | 3,159 (51.6%) | 2,962 (48.4%) |
Housing Structures by Number of Rooms in Calhoun
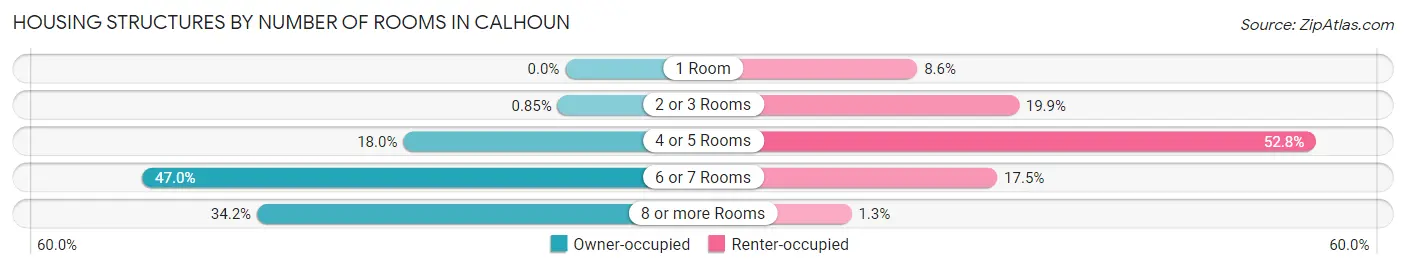
| Number of Rooms | Owner-occupied | Renter-occupied |
| 1 Room | 0 (0.0%) | 254 (8.6%) |
| 2 or 3 Rooms | 27 (0.9%) | 588 (19.9%) |
| 4 or 5 Rooms | 568 (18.0%) | 1,565 (52.8%) |
| 6 or 7 Rooms | 1,483 (46.9%) | 517 (17.4%) |
| 8 or more Rooms | 1,081 (34.2%) | 38 (1.3%) |
| Total | 3,159 (100.0%) | 2,962 (100.0%) |
Housing Structure by Heating Type in Calhoun
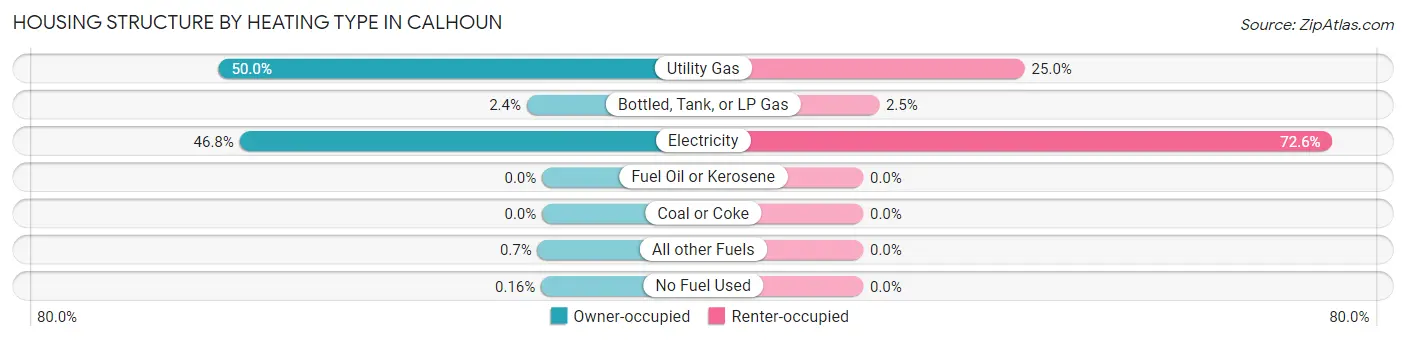
| Heating Type | Owner-occupied | Renter-occupied |
| Utility Gas | 1,580 (50.0%) | 740 (25.0%) |
| Bottled, Tank, or LP Gas | 75 (2.4%) | 73 (2.5%) |
| Electricity | 1,477 (46.8%) | 2,149 (72.6%) |
| Fuel Oil or Kerosene | 0 (0.0%) | 0 (0.0%) |
| Coal or Coke | 0 (0.0%) | 0 (0.0%) |
| All other Fuels | 22 (0.7%) | 0 (0.0%) |
| No Fuel Used | 5 (0.2%) | 0 (0.0%) |
| Total | 3,159 (100.0%) | 2,962 (100.0%) |
Household Vehicle Usage in Calhoun
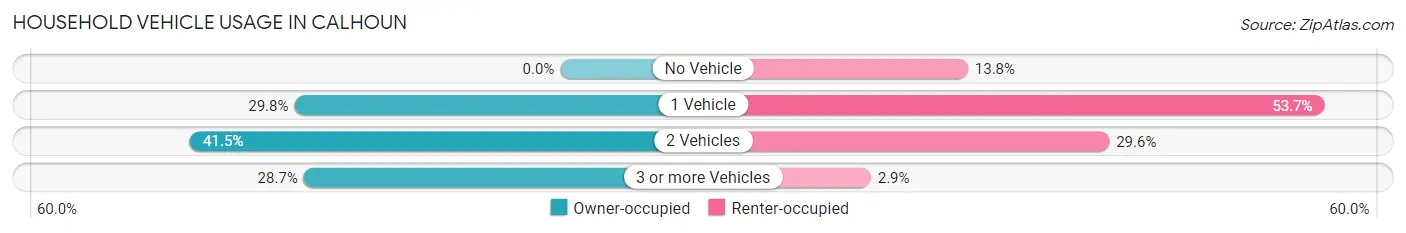
| Vehicles per Household | Owner-occupied | Renter-occupied |
| No Vehicle | 0 (0.0%) | 408 (13.8%) |
| 1 Vehicle | 941 (29.8%) | 1,591 (53.7%) |
| 2 Vehicles | 1,310 (41.5%) | 877 (29.6%) |
| 3 or more Vehicles | 908 (28.7%) | 86 (2.9%) |
| Total | 3,159 (100.0%) | 2,962 (100.0%) |
Real Estate & Mortgages in Calhoun
Real Estate and Mortgage Overview in Calhoun
| Characteristic | Without Mortgage | With Mortgage |
| Housing Units | 1,043 | 2,116 |
| Median Property Value | $216,600 | $208,900 |
| Median Household Income | $64,306 | $515 |
| Monthly Housing Costs | $488 | $0 |
| Real Estate Taxes | $1,350 | $59 |
Property Value by Mortgage Status in Calhoun
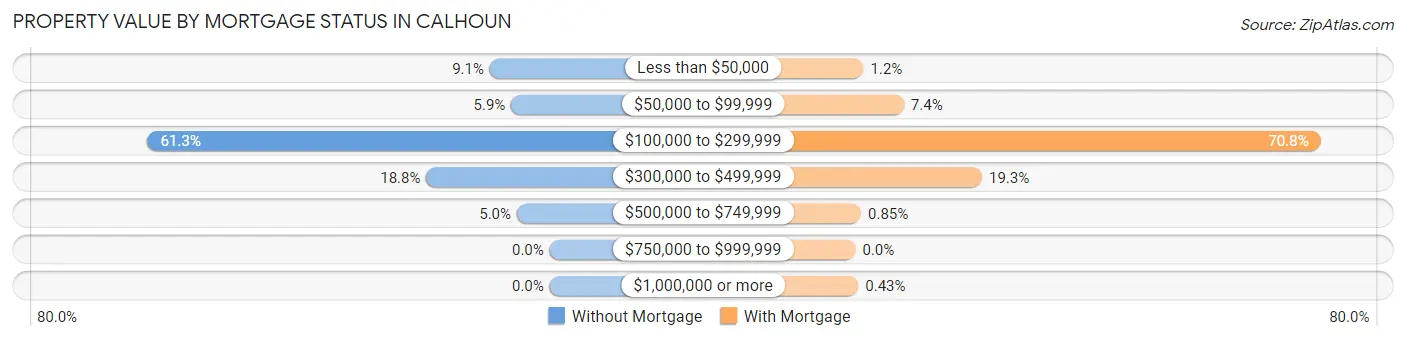
| Property Value | Without Mortgage | With Mortgage |
| Less than $50,000 | 95 (9.1%) | 26 (1.2%) |
| $50,000 to $99,999 | 61 (5.9%) | 156 (7.4%) |
| $100,000 to $299,999 | 639 (61.3%) | 1,499 (70.8%) |
| $300,000 to $499,999 | 196 (18.8%) | 408 (19.3%) |
| $500,000 to $749,999 | 52 (5.0%) | 18 (0.9%) |
| $750,000 to $999,999 | 0 (0.0%) | 0 (0.0%) |
| $1,000,000 or more | 0 (0.0%) | 9 (0.4%) |
| Total | 1,043 (100.0%) | 2,116 (100.0%) |
Household Income by Mortgage Status in Calhoun
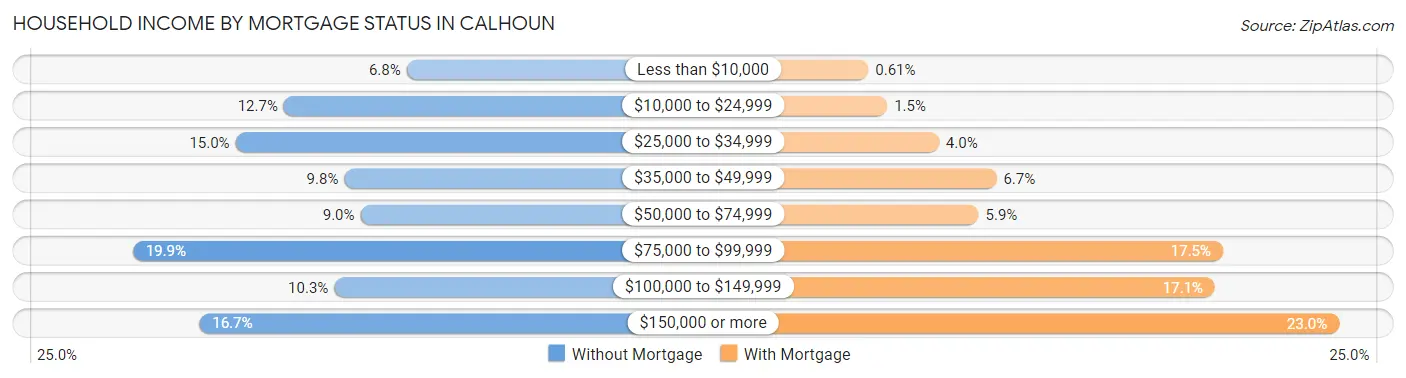
| Household Income | Without Mortgage | With Mortgage |
| Less than $10,000 | 71 (6.8%) | 13 (0.6%) |
| $10,000 to $24,999 | 132 (12.7%) | 32 (1.5%) |
| $25,000 to $34,999 | 156 (15.0%) | 84 (4.0%) |
| $35,000 to $49,999 | 102 (9.8%) | 142 (6.7%) |
| $50,000 to $74,999 | 94 (9.0%) | 124 (5.9%) |
| $75,000 to $99,999 | 207 (19.9%) | 370 (17.5%) |
| $100,000 to $149,999 | 107 (10.3%) | 362 (17.1%) |
| $150,000 or more | 174 (16.7%) | 487 (23.0%) |
| Total | 1,043 (100.0%) | 2,116 (100.0%) |
Property Value to Household Income Ratio in Calhoun
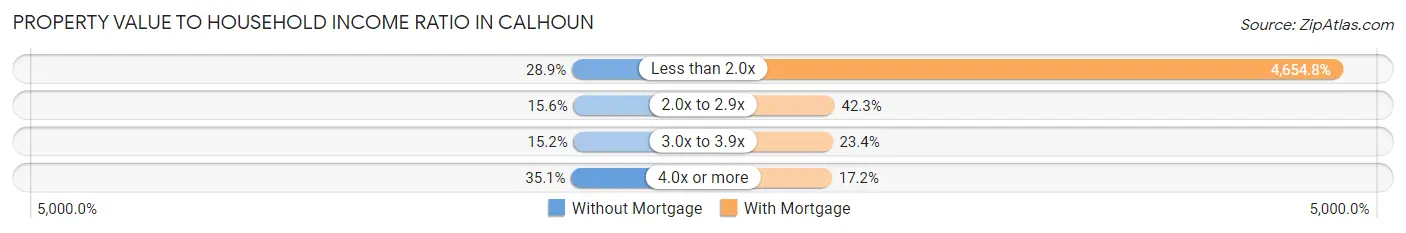
| Value-to-Income Ratio | Without Mortgage | With Mortgage |
| Less than 2.0x | 301 (28.9%) | 98,495 (4,654.8%) |
| 2.0x to 2.9x | 163 (15.6%) | 895 (42.3%) |
| 3.0x to 3.9x | 158 (15.1%) | 495 (23.4%) |
| 4.0x or more | 366 (35.1%) | 364 (17.2%) |
| Total | 1,043 (100.0%) | 2,116 (100.0%) |
Real Estate Taxes by Mortgage Status in Calhoun
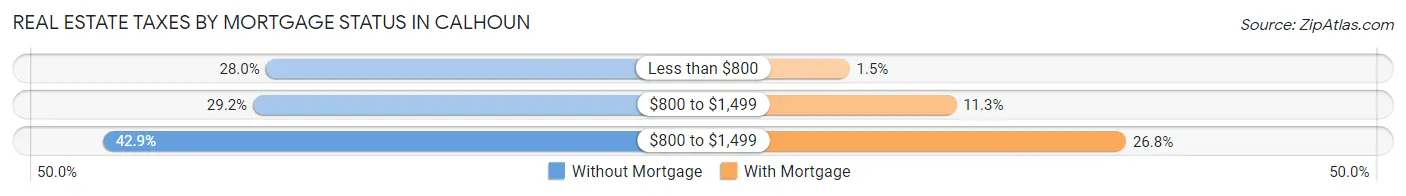
| Property Taxes | Without Mortgage | With Mortgage |
| Less than $800 | 292 (28.0%) | 32 (1.5%) |
| $800 to $1,499 | 304 (29.1%) | 238 (11.3%) |
| $800 to $1,499 | 447 (42.9%) | 566 (26.8%) |
| Total | 1,043 (100.0%) | 2,116 (100.0%) |
Health & Disability in Calhoun
Health Insurance Coverage by Age in Calhoun
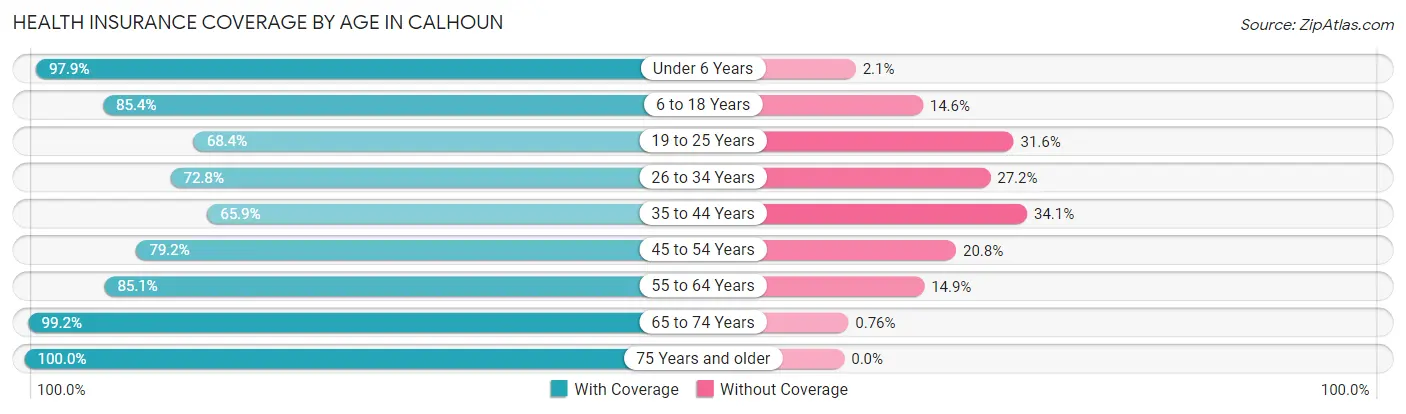
| Age Bracket | With Coverage | Without Coverage |
| Under 6 Years | 1,517 (97.9%) | 33 (2.1%) |
| 6 to 18 Years | 2,693 (85.4%) | 462 (14.6%) |
| 19 to 25 Years | 1,206 (68.4%) | 556 (31.6%) |
| 26 to 34 Years | 1,631 (72.8%) | 610 (27.2%) |
| 35 to 44 Years | 1,567 (65.9%) | 810 (34.1%) |
| 45 to 54 Years | 1,679 (79.2%) | 442 (20.8%) |
| 55 to 64 Years | 1,519 (85.1%) | 266 (14.9%) |
| 65 to 74 Years | 913 (99.2%) | 7 (0.8%) |
| 75 Years and older | 1,054 (100.0%) | 0 (0.0%) |
| Total | 13,779 (81.2%) | 3,186 (18.8%) |
Health Insurance Coverage by Citizenship Status in Calhoun
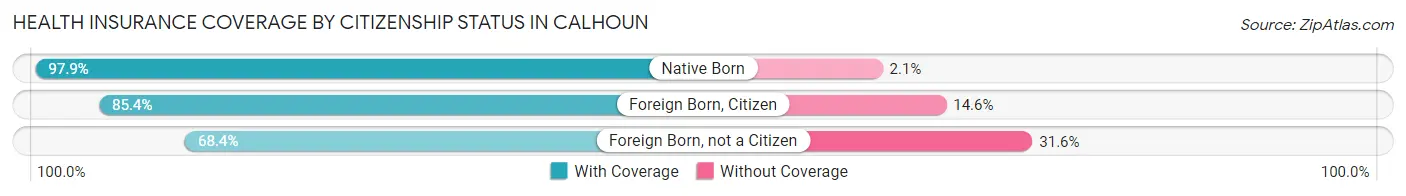
| Citizenship Status | With Coverage | Without Coverage |
| Native Born | 1,517 (97.9%) | 33 (2.1%) |
| Foreign Born, Citizen | 2,693 (85.4%) | 462 (14.6%) |
| Foreign Born, not a Citizen | 1,206 (68.4%) | 556 (31.6%) |
Health Insurance Coverage by Household Income in Calhoun
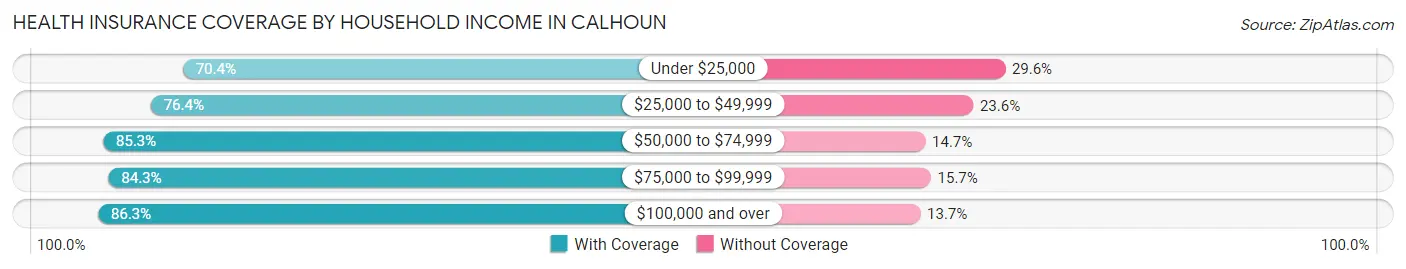
| Household Income | With Coverage | Without Coverage |
| Under $25,000 | 1,831 (70.4%) | 771 (29.6%) |
| $25,000 to $49,999 | 2,885 (76.4%) | 893 (23.6%) |
| $50,000 to $74,999 | 2,228 (85.3%) | 383 (14.7%) |
| $75,000 to $99,999 | 1,793 (84.3%) | 334 (15.7%) |
| $100,000 and over | 5,034 (86.3%) | 801 (13.7%) |
Public vs Private Health Insurance Coverage by Age in Calhoun
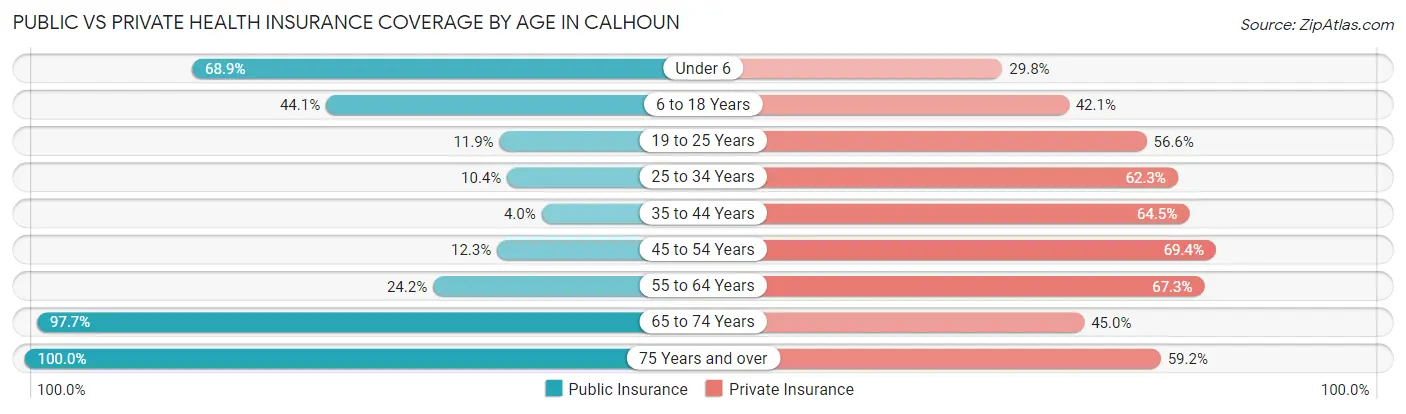
| Age Bracket | Public Insurance | Private Insurance |
| Under 6 | 1,068 (68.9%) | 462 (29.8%) |
| 6 to 18 Years | 1,390 (44.1%) | 1,329 (42.1%) |
| 19 to 25 Years | 209 (11.9%) | 997 (56.6%) |
| 25 to 34 Years | 234 (10.4%) | 1,397 (62.3%) |
| 35 to 44 Years | 96 (4.0%) | 1,532 (64.4%) |
| 45 to 54 Years | 261 (12.3%) | 1,472 (69.4%) |
| 55 to 64 Years | 432 (24.2%) | 1,201 (67.3%) |
| 65 to 74 Years | 899 (97.7%) | 414 (45.0%) |
| 75 Years and over | 1,054 (100.0%) | 624 (59.2%) |
| Total | 5,643 (33.3%) | 9,428 (55.6%) |
Disability Status by Sex by Age in Calhoun
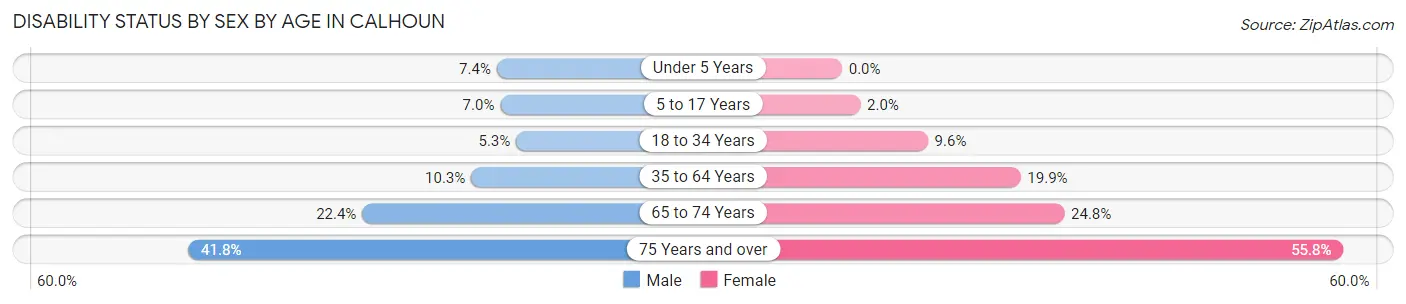
| Age Bracket | Male | Female |
| Under 5 Years | 47 (7.4%) | 0 (0.0%) |
| 5 to 17 Years | 111 (7.0%) | 37 (2.0%) |
| 18 to 34 Years | 121 (5.3%) | 169 (9.6%) |
| 35 to 64 Years | 302 (10.3%) | 665 (19.9%) |
| 65 to 74 Years | 112 (22.4%) | 104 (24.8%) |
| 75 Years and over | 183 (41.8%) | 344 (55.8%) |
Disability Class by Sex by Age in Calhoun
Disability Class: Hearing Difficulty
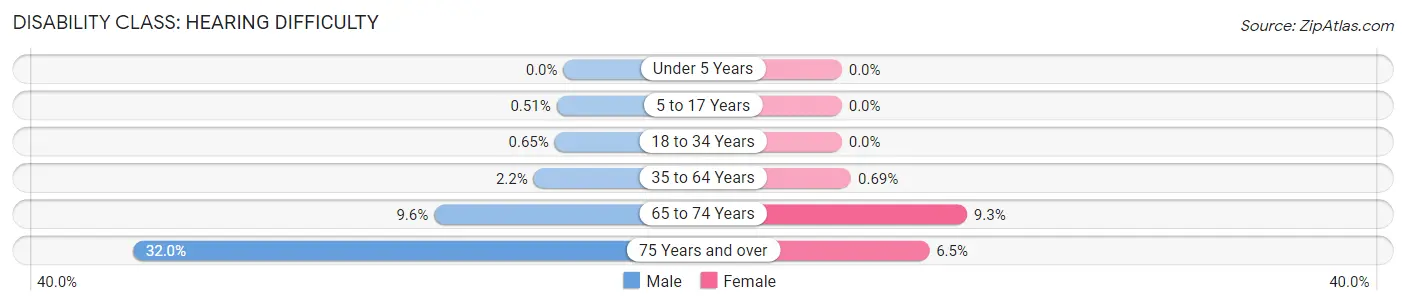
| Age Bracket | Male | Female |
| Under 5 Years | 0 (0.0%) | 0 (0.0%) |
| 5 to 17 Years | 8 (0.5%) | 0 (0.0%) |
| 18 to 34 Years | 15 (0.6%) | 0 (0.0%) |
| 35 to 64 Years | 65 (2.2%) | 23 (0.7%) |
| 65 to 74 Years | 48 (9.6%) | 39 (9.3%) |
| 75 Years and over | 140 (32.0%) | 40 (6.5%) |
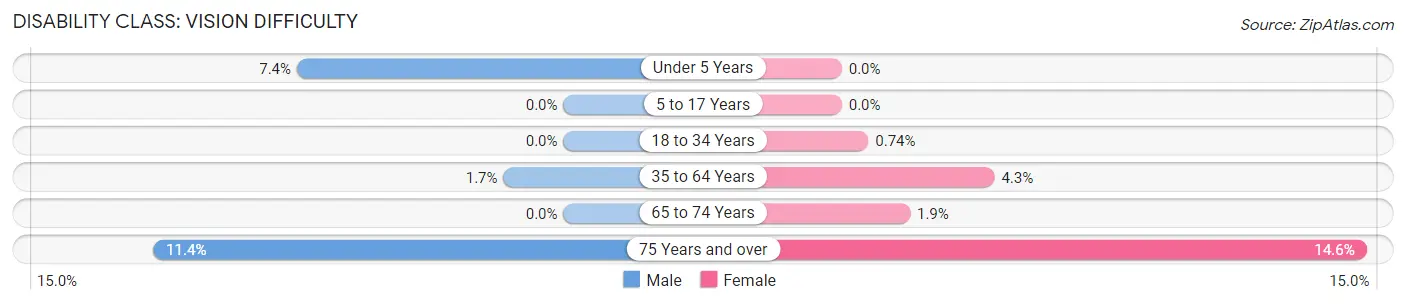
Disability Class: Vision Difficulty
| Age Bracket | Male | Female |
| Under 5 Years | 47 (7.4%) | 0 (0.0%) |
| 5 to 17 Years | 0 (0.0%) | 0 (0.0%) |
| 18 to 34 Years | 0 (0.0%) | 13 (0.7%) |
| 35 to 64 Years | 49 (1.7%) | 142 (4.3%) |
| 65 to 74 Years | 0 (0.0%) | 8 (1.9%) |
| 75 Years and over | 50 (11.4%) | 90 (14.6%) |
Disability Class: Cognitive Difficulty
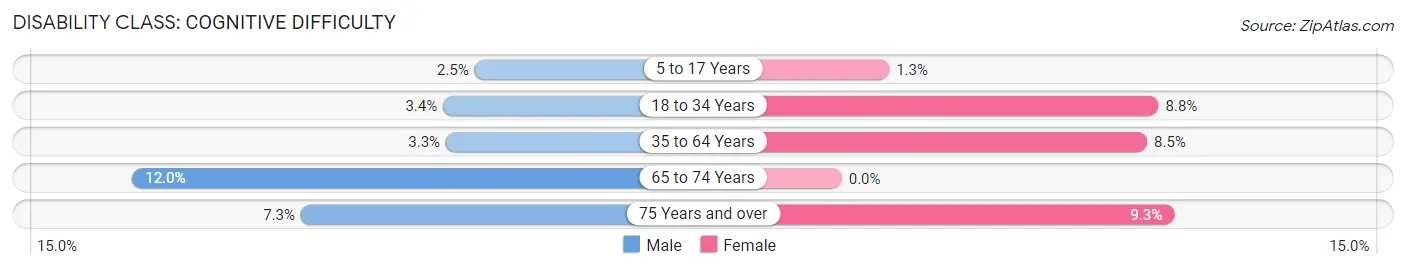
| Age Bracket | Male | Female |
| 5 to 17 Years | 39 (2.5%) | 24 (1.3%) |
| 18 to 34 Years | 77 (3.4%) | 156 (8.8%) |
| 35 to 64 Years | 96 (3.3%) | 284 (8.5%) |
| 65 to 74 Years | 60 (12.0%) | 0 (0.0%) |
| 75 Years and over | 32 (7.3%) | 57 (9.2%) |
Disability Class: Ambulatory Difficulty
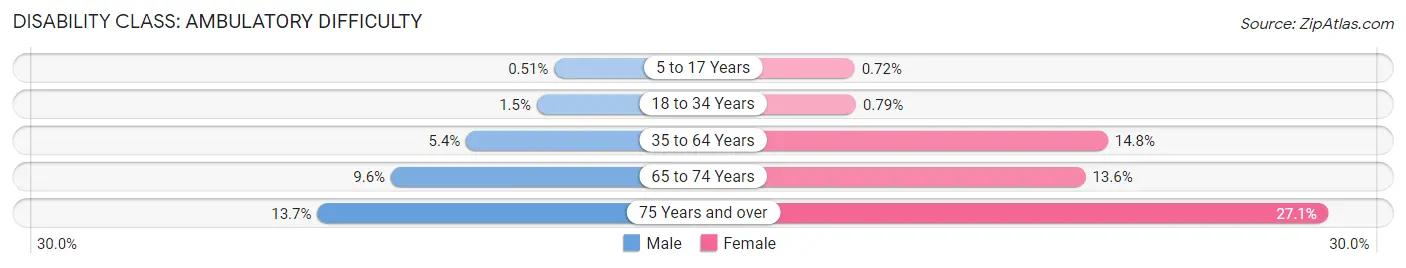
| Age Bracket | Male | Female |
| 5 to 17 Years | 8 (0.5%) | 13 (0.7%) |
| 18 to 34 Years | 34 (1.5%) | 14 (0.8%) |
| 35 to 64 Years | 159 (5.4%) | 495 (14.8%) |
| 65 to 74 Years | 48 (9.6%) | 57 (13.6%) |
| 75 Years and over | 60 (13.7%) | 167 (27.1%) |
Disability Class: Self-Care Difficulty
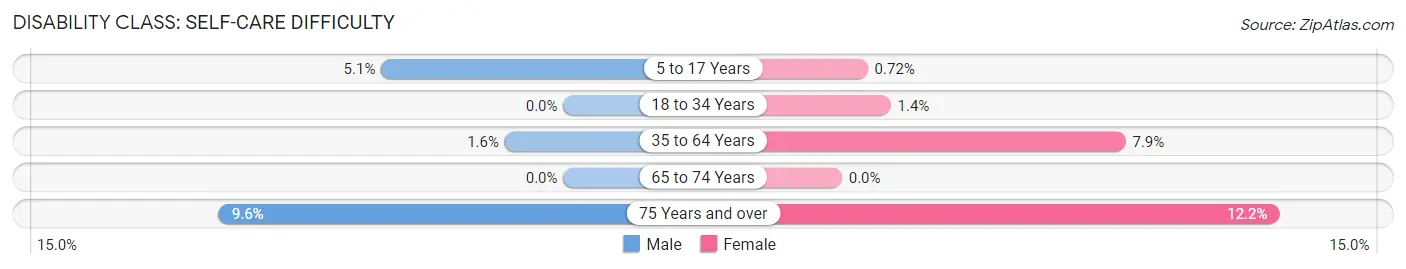
| Age Bracket | Male | Female |
| 5 to 17 Years | 80 (5.1%) | 13 (0.7%) |
| 18 to 34 Years | 0 (0.0%) | 24 (1.4%) |
| 35 to 64 Years | 48 (1.6%) | 264 (7.9%) |
| 65 to 74 Years | 0 (0.0%) | 0 (0.0%) |
| 75 Years and over | 42 (9.6%) | 75 (12.2%) |
Technology Access in Calhoun
Computing Device Access in Calhoun
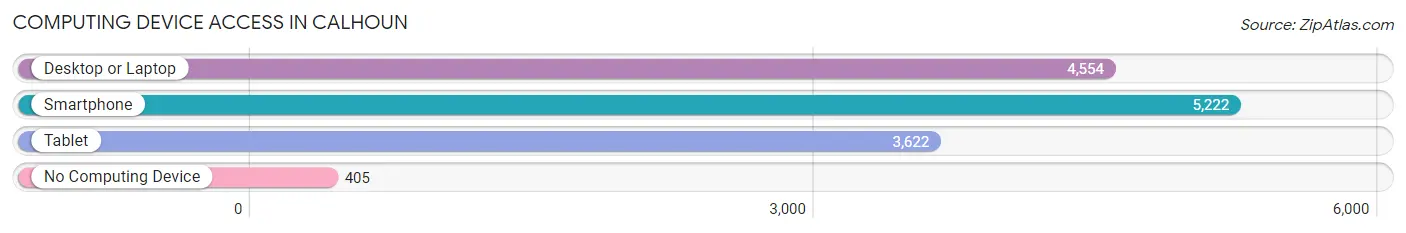
| Device Type | # Households | % Households |
| Desktop or Laptop | 4,554 | 74.4% |
| Smartphone | 5,222 | 85.3% |
| Tablet | 3,622 | 59.2% |
| No Computing Device | 405 | 6.6% |
| Total | 6,121 | 100.0% |
Internet Access in Calhoun
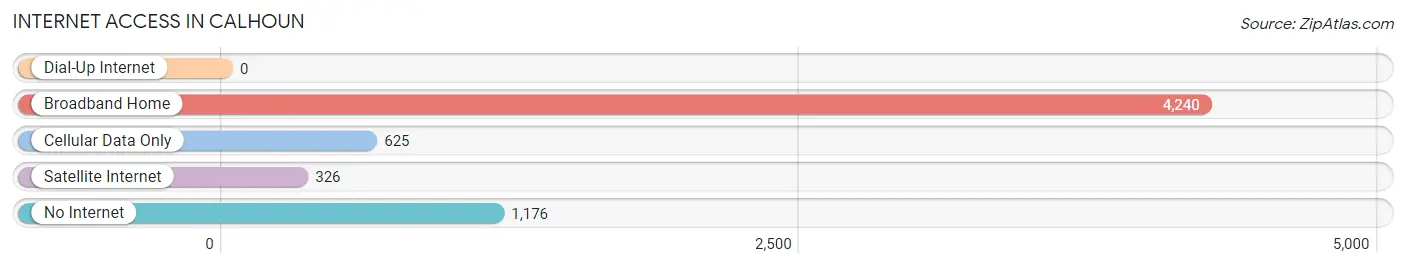
| Internet Type | # Households | % Households |
| Dial-Up Internet | 0 | 0.0% |
| Broadband Home | 4,240 | 69.3% |
| Cellular Data Only | 625 | 10.2% |
| Satellite Internet | 326 | 5.3% |
| No Internet | 1,176 | 19.2% |
| Total | 6,121 | 100.0% |
Calhoun Summary
Calhoun, Georgia is a city located in Gordon County, in the northwestern part of the state. It is the county seat of Gordon County and is part of the Chattanooga, TN-GA Metropolitan Statistical Area. The city was founded in 1835 and named after John C. Calhoun, a prominent politician and statesman from South Carolina. As of the 2010 census, the city had a population of 15,650.
Geography
Calhoun is located at 34°30'25" North, 84°56'45" West (34.506944, -84.945556). It is situated in the foothills of the Appalachian Mountains, about 60 miles northwest of Atlanta. The city is located along the Oostanaula River, which flows through the city and is a tributary of the Coosa River. The city has a total area of 8.3 square miles, all of which is land.
Climate
Calhoun has a humid subtropical climate, with hot, humid summers and mild winters. The average annual temperature is 61°F, with an average high of 79°F in July and an average low of 43°F in January. The average annual precipitation is 51.2 inches, with an average of 4.7 inches of snowfall per year.
Demographics
As of the 2010 census, there were 15,650 people, 6,072 households, and 4,072 families residing in the city. The population density was 1,890.3 people per square mile. The racial makeup of the city was 79.2% White, 16.2% African American, 0.4% Native American, 0.7% Asian, 0.1% Pacific Islander, 1.7% from other races, and 1.7% from two or more races. Hispanic or Latino of any race were 4.2% of the population.
The median income for a household in the city was $33,945, and the median income for a family was $41,945. The per capita income for the city was $17,845. About 17.2% of families and 20.7% of the population were below the poverty line, including 28.2% of those under age 18 and 16.2% of those age 65 or over.
Economy
Calhoun's economy is largely based on manufacturing and agriculture. The city is home to several manufacturing plants, including a carpet mill, a paper mill, and a furniture factory. The city is also home to several agricultural businesses, including a poultry processing plant, a dairy farm, and a cotton gin.
The city is also home to several retail stores, restaurants, and other businesses. The city is served by the Calhoun-Gordon County Airport, which offers general aviation services.
Education
Calhoun is served by the Gordon County School District, which operates several elementary, middle, and high schools in the city. The city is also home to Gordon State College, a public two-year college.
Conclusion
Calhoun, Georgia is a city located in Gordon County, in the northwestern part of the state. It is the county seat of Gordon County and is part of the Chattanooga, TN-GA Metropolitan Statistical Area. The city was founded in 1835 and named after John C. Calhoun, a prominent politician and statesman from South Carolina. As of the 2010 census, the city had a population of 15,650. Calhoun has a humid subtropical climate, with hot, humid summers and mild winters. The city's economy is largely based on manufacturing and agriculture, and it is served by the Gordon County School District and Gordon State College.
Common Questions
What is Per Capita Income in Calhoun?
Per Capita income in Calhoun is $29,064.
What is the Median Family Income in Calhoun?
Median Family Income in Calhoun is $65,966.
What is the Median Household income in Calhoun?
Median Household Income in Calhoun is $54,927.
What is Income or Wage Gap in Calhoun?
Income or Wage Gap in Calhoun is 23.6%.
Women in Calhoun earn 76.4 cents for every dollar earned by a man.
What is Inequality or Gini Index in Calhoun?
Inequality or Gini Index in Calhoun is 0.48.
What is the Total Population of Calhoun?
Total Population of Calhoun is 17,184.
What is the Total Male Population of Calhoun?
Total Male Population of Calhoun is 8,460.
What is the Total Female Population of Calhoun?
Total Female Population of Calhoun is 8,724.
What is the Ratio of Males per 100 Females in Calhoun?
There are 96.97 Males per 100 Females in Calhoun.
What is the Ratio of Females per 100 Males in Calhoun?
There are 103.12 Females per 100 Males in Calhoun.
What is the Median Population Age in Calhoun?
Median Population Age in Calhoun is 34.3 Years.
What is the Average Family Size in Calhoun
Average Family Size in Calhoun is 3.3 People.
What is the Average Household Size in Calhoun
Average Household Size in Calhoun is 2.8 People.
How Large is the Labor Force in Calhoun?
There are 7,962 People in the Labor Forcein in Calhoun.
What is the Percentage of People in the Labor Force in Calhoun?
61.5% of People are in the Labor Force in Calhoun.
What is the Unemployment Rate in Calhoun?
Unemployment Rate in Calhoun is 2.4%.