Luyando, PR Map & Demographics
Luyando Map
Luyando Overview
$10,005
PER CAPITA INCOME
$25,395
AVG FAMILY INCOME
$20,423
AVG HOUSEHOLD INCOME
32.1%
WAGE / INCOME GAP [ % ]
67.9¢/ $1
WAGE / INCOME GAP [ $ ]
$7,344
FAMILY INCOME DEFICIT
0.44
INEQUALITY / GINI INDEX
2,658
TOTAL POPULATION
1,185
MALE POPULATION
1,473
FEMALE POPULATION
80.45
MALES / 100 FEMALES
124.30
FEMALES / 100 MALES
42.4
MEDIAN AGE
4.2
AVG FAMILY SIZE
3.3
AVG HOUSEHOLD SIZE
782
LABOR FORCE [ PEOPLE ]
34.9%
PERCENT IN LABOR FORCE
6.5%
UNEMPLOYMENT RATE
Income in Luyando
Income Overview in Luyando
Per Capita Income in Luyando is $10,005, while median incomes of families and households are $25,395 and $20,423 respectively.
| Characteristic | Number | Measure |
| Per Capita Income | 2,658 | $10,005 |
| Median Family Income | 562 | $25,395 |
| Mean Family Income | 562 | $32,969 |
| Median Household Income | 803 | $20,423 |
| Mean Household Income | 803 | $28,446 |
| Income Deficit | 562 | $7,344 |
| Wage / Income Gap (%) | 2,658 | 32.06% |
| Wage / Income Gap ($) | 2,658 | 67.94¢ per $1 |
| Gini / Inequality Index | 2,658 | 0.44 |
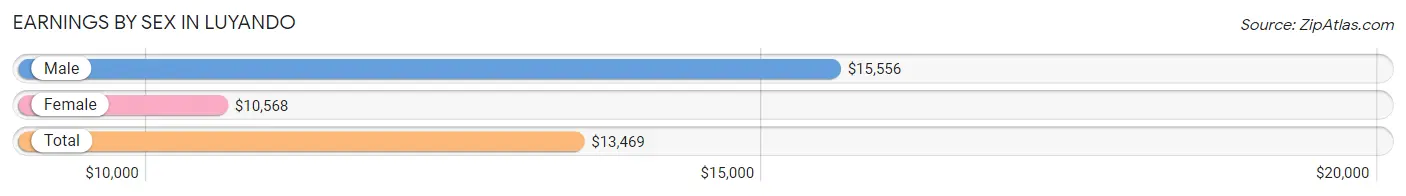
Earnings by Sex in Luyando
Average Earnings in Luyando are $13,469, $15,556 for men and $10,568 for women, a difference of 32.1%.
| Sex | Number | Average Earnings |
| Male | 500 (60.0%) | $15,556 |
| Female | 333 (40.0%) | $10,568 |
| Total | 833 (100.0%) | $13,469 |
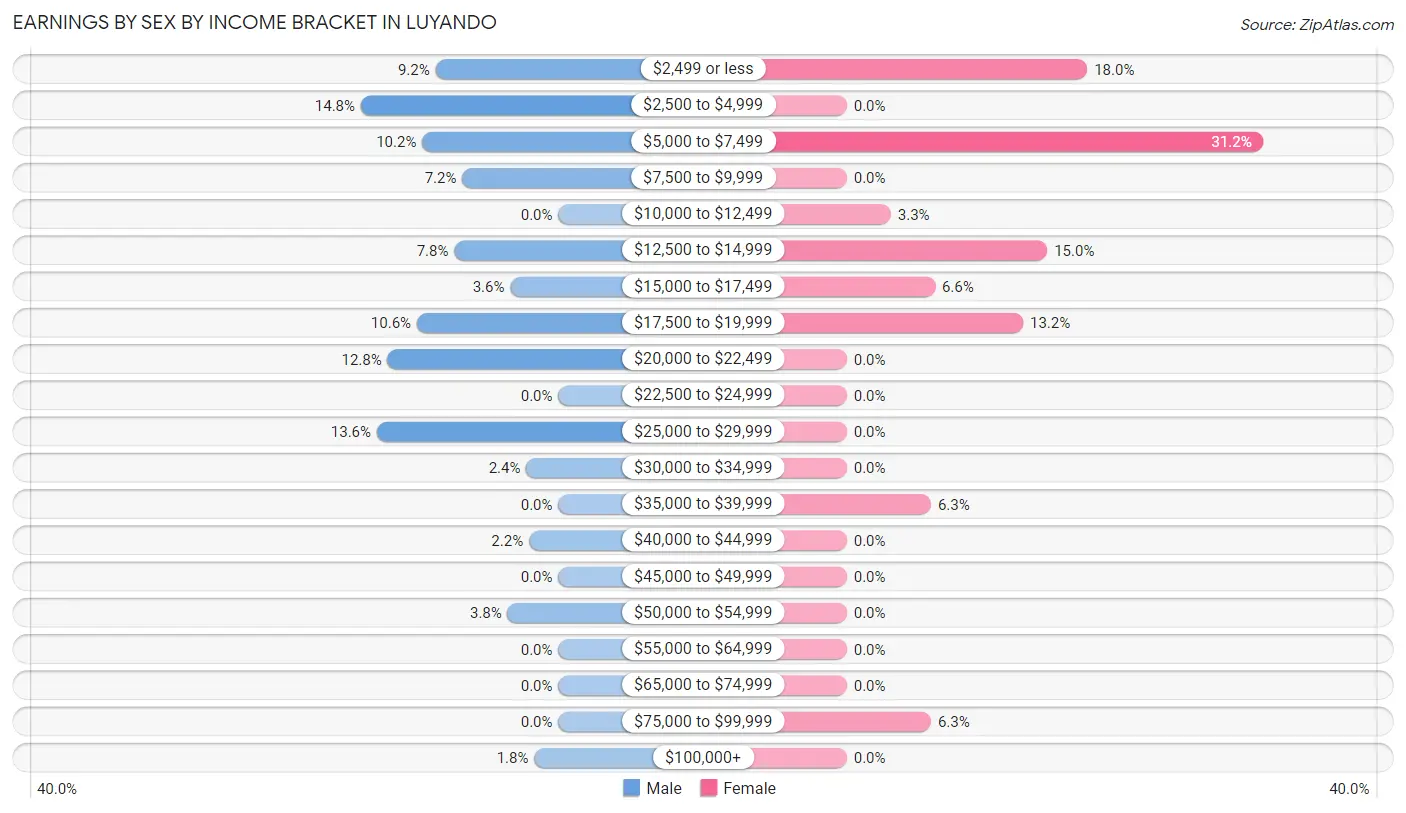
Earnings by Sex by Income Bracket in Luyando
The most common earnings brackets in Luyando are $2,500 to $4,999 for men (74 | 14.8%) and $5,000 to $7,499 for women (104 | 31.2%).
| Income | Male | Female |
| $2,499 or less | 46 (9.2%) | 60 (18.0%) |
| $2,500 to $4,999 | 74 (14.8%) | 0 (0.0%) |
| $5,000 to $7,499 | 51 (10.2%) | 104 (31.2%) |
| $7,500 to $9,999 | 36 (7.2%) | 0 (0.0%) |
| $10,000 to $12,499 | 0 (0.0%) | 11 (3.3%) |
| $12,500 to $14,999 | 39 (7.8%) | 50 (15.0%) |
| $15,000 to $17,499 | 18 (3.6%) | 22 (6.6%) |
| $17,500 to $19,999 | 53 (10.6%) | 44 (13.2%) |
| $20,000 to $22,499 | 64 (12.8%) | 0 (0.0%) |
| $22,500 to $24,999 | 0 (0.0%) | 0 (0.0%) |
| $25,000 to $29,999 | 68 (13.6%) | 0 (0.0%) |
| $30,000 to $34,999 | 12 (2.4%) | 0 (0.0%) |
| $35,000 to $39,999 | 0 (0.0%) | 21 (6.3%) |
| $40,000 to $44,999 | 11 (2.2%) | 0 (0.0%) |
| $45,000 to $49,999 | 0 (0.0%) | 0 (0.0%) |
| $50,000 to $54,999 | 19 (3.8%) | 0 (0.0%) |
| $55,000 to $64,999 | 0 (0.0%) | 0 (0.0%) |
| $65,000 to $74,999 | 0 (0.0%) | 0 (0.0%) |
| $75,000 to $99,999 | 0 (0.0%) | 21 (6.3%) |
| $100,000+ | 9 (1.8%) | 0 (0.0%) |
| Total | 500 (100.0%) | 333 (100.0%) |
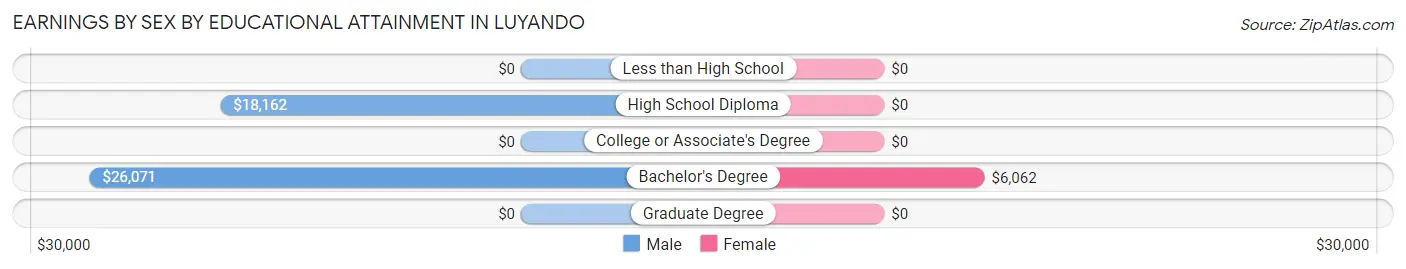
Earnings by Sex by Educational Attainment in Luyando
Average earnings in Luyando are $17,153 for men and $10,909 for women, a difference of 36.4%. Men with an educational attainment of bachelor's degree enjoy the highest average annual earnings of $26,071, while those with high school diploma education earn the least with $18,162. Women with an educational attainment of bachelor's degree earn the most with the average annual earnings of $6,062, while those with bachelor's degree education have the smallest earnings of $6,062.
| Educational Attainment | Male Income | Female Income |
| Less than High School | - | - |
| High School Diploma | $18,162 | $0 |
| College or Associate's Degree | - | - |
| Bachelor's Degree | $26,071 | $6,062 |
| Graduate Degree | - | - |
| Total | $17,153 | $10,909 |
Family Income in Luyando
Family Income Brackets in Luyando
According to the Luyando family income data, there are 137 families falling into the $15,000 to $24,999 income range, which is the most common income bracket and makes up 24.4% of all families.
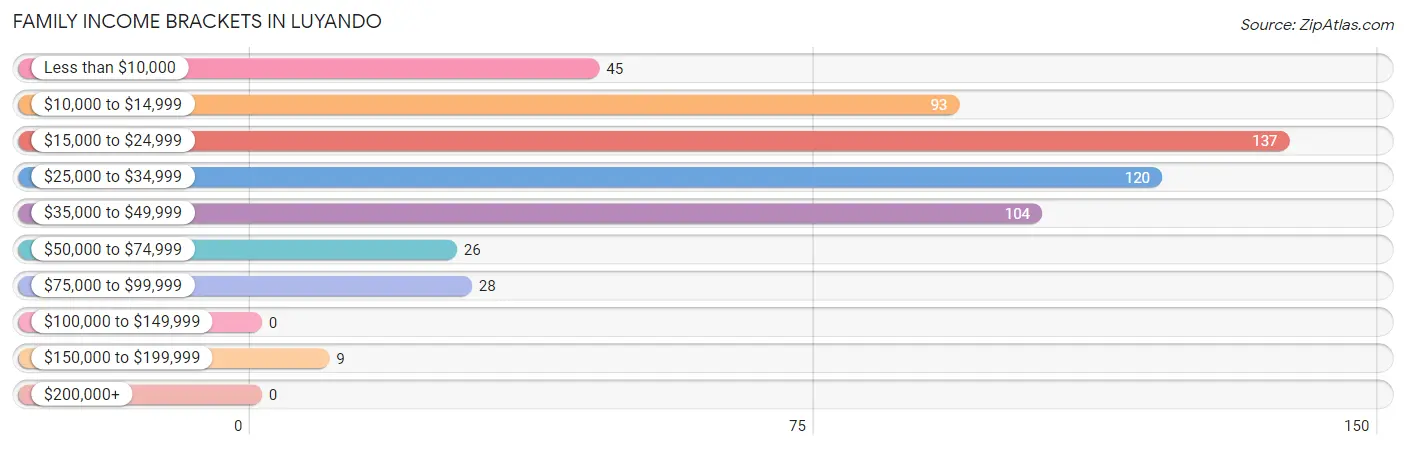
| Income Bracket | # Families | % Families |
| Less than $10,000 | 45 | 8.0% |
| $10,000 to $14,999 | 93 | 16.5% |
| $15,000 to $24,999 | 137 | 24.4% |
| $25,000 to $34,999 | 120 | 21.4% |
| $35,000 to $49,999 | 104 | 18.5% |
| $50,000 to $74,999 | 26 | 4.6% |
| $75,000 to $99,999 | 28 | 5.0% |
| $100,000 to $149,999 | 0 | 0.0% |
| $150,000 to $199,999 | 9 | 1.6% |
| $200,000+ | 0 | 0.0% |
Family Income by Famaliy Size in Luyando
4-person families (110 | 19.6%) account for the highest median family income in Luyando with $33,889 per family, while 3-person families (194 | 34.5%) have the highest median income of $8,684 per family member.
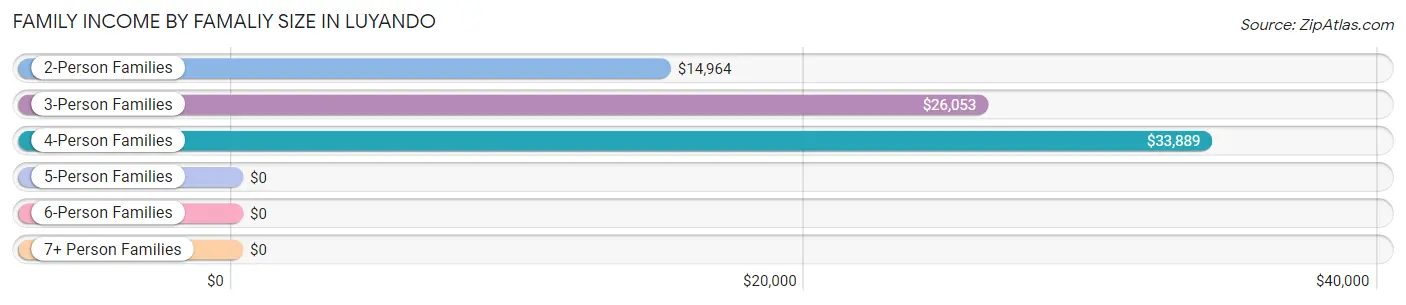
| Income Bracket | # Families | Median Income |
| 2-Person Families | 184 (32.7%) | $14,964 |
| 3-Person Families | 194 (34.5%) | $26,053 |
| 4-Person Families | 110 (19.6%) | $33,889 |
| 5-Person Families | 63 (11.2%) | $0 |
| 6-Person Families | 11 (2.0%) | $0 |
| 7+ Person Families | 0 (0.0%) | $0 |
| Total | 562 (100.0%) | $25,395 |
Family Income by Number of Earners in Luyando
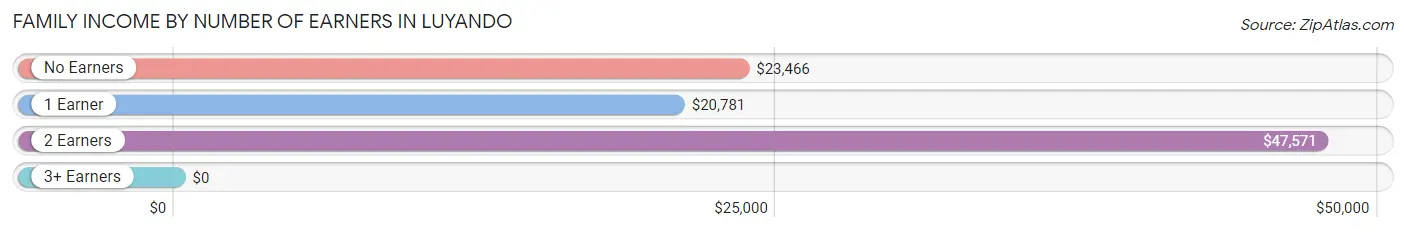
| Number of Earners | # Families | Median Income |
| No Earners | 215 (38.3%) | $23,466 |
| 1 Earner | 164 (29.2%) | $20,781 |
| 2 Earners | 154 (27.4%) | $47,571 |
| 3+ Earners | 29 (5.2%) | $0 |
| Total | 562 (100.0%) | $25,395 |
Household Income in Luyando
Household Income Brackets in Luyando
With 189 households falling in the category, the $10,000 to $14,999 income range is the most frequent in Luyando, accounting for 23.5% of all households.
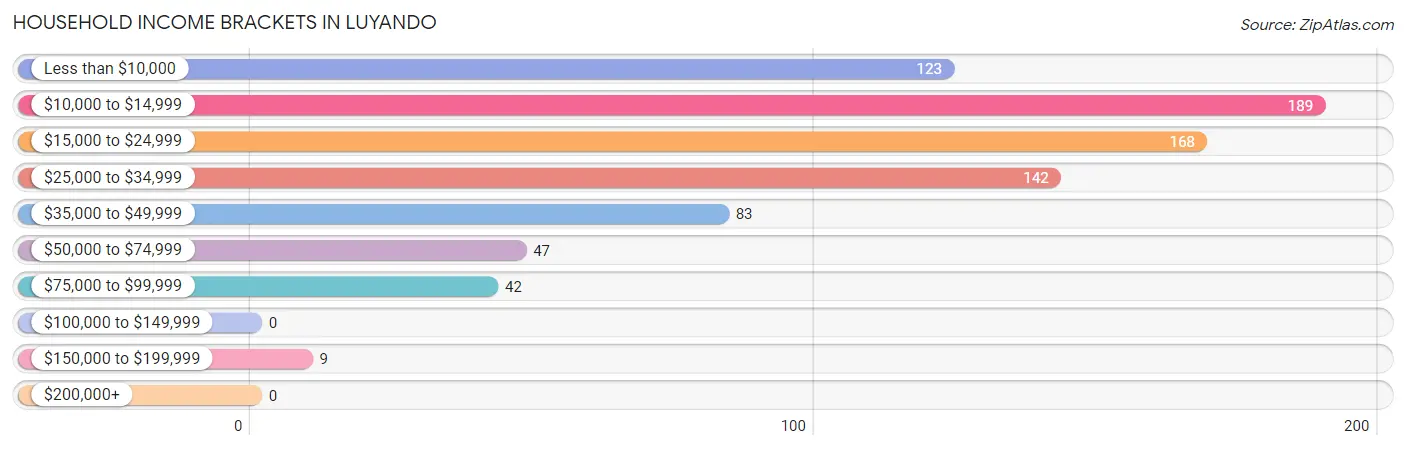
| Income Bracket | # Households | % Households |
| Less than $10,000 | 123 | 15.3% |
| $10,000 to $14,999 | 189 | 23.5% |
| $15,000 to $24,999 | 168 | 20.9% |
| $25,000 to $34,999 | 142 | 17.7% |
| $35,000 to $49,999 | 83 | 10.3% |
| $50,000 to $74,999 | 47 | 5.9% |
| $75,000 to $99,999 | 42 | 5.2% |
| $100,000 to $149,999 | 0 | 0.0% |
| $150,000 to $199,999 | 9 | 1.1% |
| $200,000+ | 0 | 0.0% |
Household Income by Householder Age in Luyando
The median household income in Luyando is $20,423, with the highest median household income of $21,591 found in the 45 to 64 years age bracket for the primary householder. A total of 306 households (38.1%) fall into this category. Meanwhile, the 15 to 24 years age bracket for the primary householder has the lowest median household income of $0, with 11 households (1.4%) in this group.
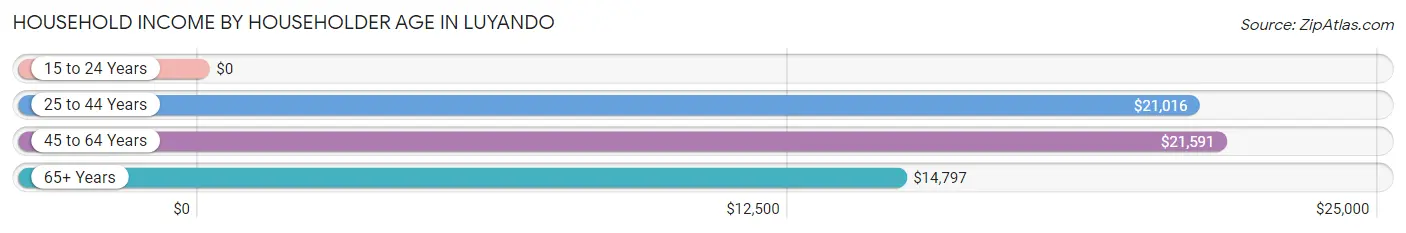
| Income Bracket | # Households | Median Income |
| 15 to 24 Years | 11 (1.4%) | $0 |
| 25 to 44 Years | 162 (20.2%) | $21,016 |
| 45 to 64 Years | 306 (38.1%) | $21,591 |
| 65+ Years | 324 (40.4%) | $14,797 |
| Total | 803 (100.0%) | $20,423 |
Poverty in Luyando
Income Below Poverty by Sex and Age in Luyando
With 41.2% poverty level for males and 51.7% for females among the residents of Luyando, 5 year old males and 65 to 74 year old females are the most vulnerable to poverty, with 26 males (100.0%) and 121 females (70.8%) in their respective age groups living below the poverty level.
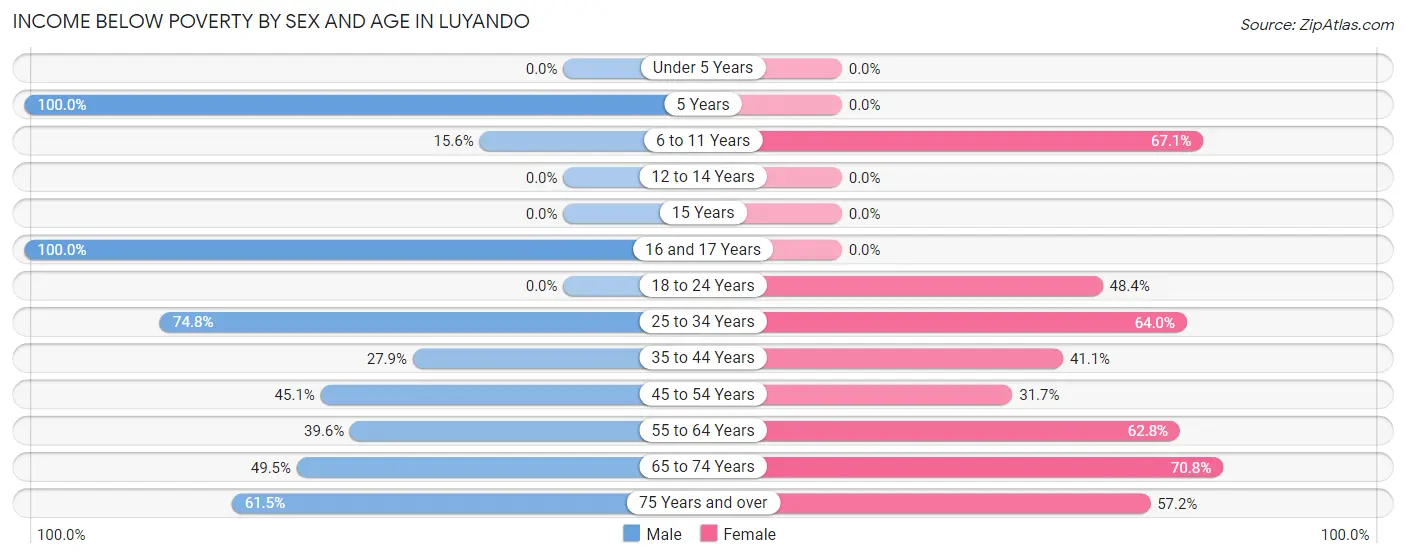
| Age Bracket | Male | Female |
| Under 5 Years | 0 (0.0%) | 0 (0.0%) |
| 5 Years | 26 (100.0%) | 0 (0.0%) |
| 6 to 11 Years | 14 (15.6%) | 112 (67.1%) |
| 12 to 14 Years | 0 (0.0%) | 0 (0.0%) |
| 15 Years | 0 (0.0%) | 0 (0.0%) |
| 16 and 17 Years | 20 (100.0%) | 0 (0.0%) |
| 18 to 24 Years | 0 (0.0%) | 91 (48.4%) |
| 25 to 34 Years | 107 (74.8%) | 130 (64.0%) |
| 35 to 44 Years | 57 (27.9%) | 78 (41.0%) |
| 45 to 54 Years | 123 (45.1%) | 50 (31.7%) |
| 55 to 64 Years | 19 (39.6%) | 96 (62.7%) |
| 65 to 74 Years | 94 (49.5%) | 121 (70.8%) |
| 75 Years and over | 24 (61.5%) | 83 (57.2%) |
| Total | 484 (41.2%) | 761 (51.7%) |
Income Above Poverty by Sex and Age in Luyando
According to the poverty statistics in Luyando, males aged 12 to 14 years and females aged under 5 years are the age groups that are most secure financially, with 100.0% of males and 100.0% of females in these age groups living above the poverty line.
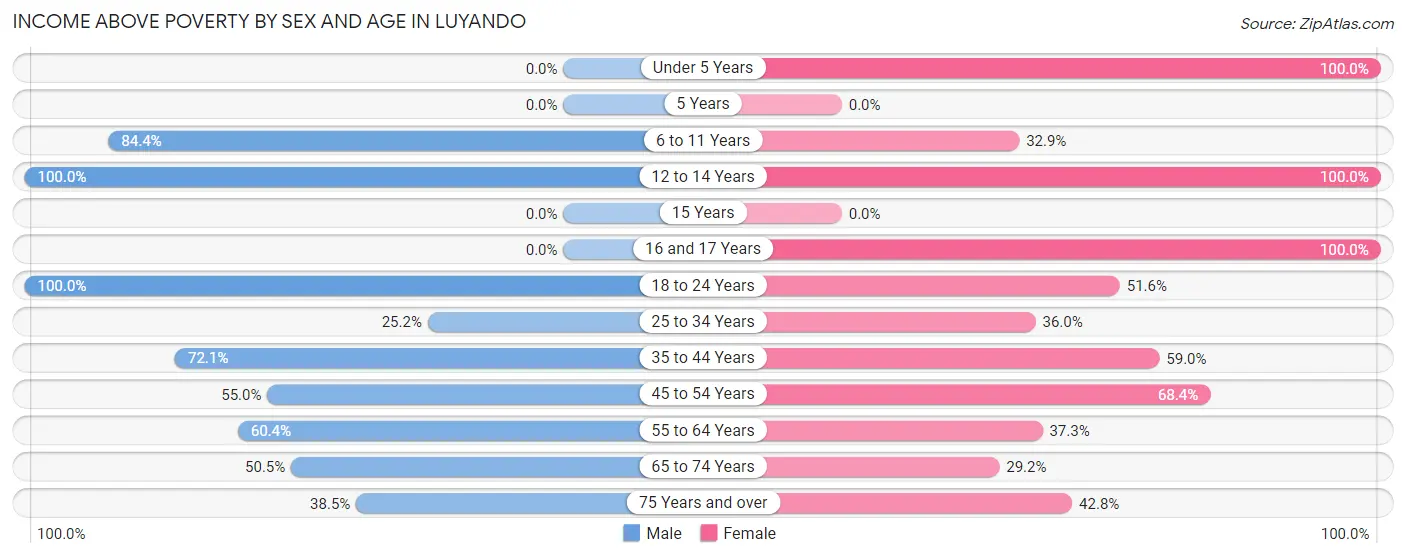
| Age Bracket | Male | Female |
| Under 5 Years | 0 (0.0%) | 30 (100.0%) |
| 5 Years | 0 (0.0%) | 0 (0.0%) |
| 6 to 11 Years | 76 (84.4%) | 55 (32.9%) |
| 12 to 14 Years | 79 (100.0%) | 25 (100.0%) |
| 15 Years | 0 (0.0%) | 0 (0.0%) |
| 16 and 17 Years | 0 (0.0%) | 43 (100.0%) |
| 18 to 24 Years | 63 (100.0%) | 97 (51.6%) |
| 25 to 34 Years | 36 (25.2%) | 73 (36.0%) |
| 35 to 44 Years | 147 (72.1%) | 112 (59.0%) |
| 45 to 54 Years | 150 (54.9%) | 108 (68.3%) |
| 55 to 64 Years | 29 (60.4%) | 57 (37.2%) |
| 65 to 74 Years | 96 (50.5%) | 50 (29.2%) |
| 75 Years and over | 15 (38.5%) | 62 (42.8%) |
| Total | 691 (58.8%) | 712 (48.3%) |
Income Below Poverty Among Married-Couple Families in Luyando
The poverty statistics for married-couple families in Luyando show that 38.0% or 167 of the total 440 families live below the poverty line. Families with no children have the highest poverty rate of 43.8%, comprising of 126 families. On the other hand, families with 1 or 2 children have the lowest poverty rate of 27.0%, which includes 41 families.
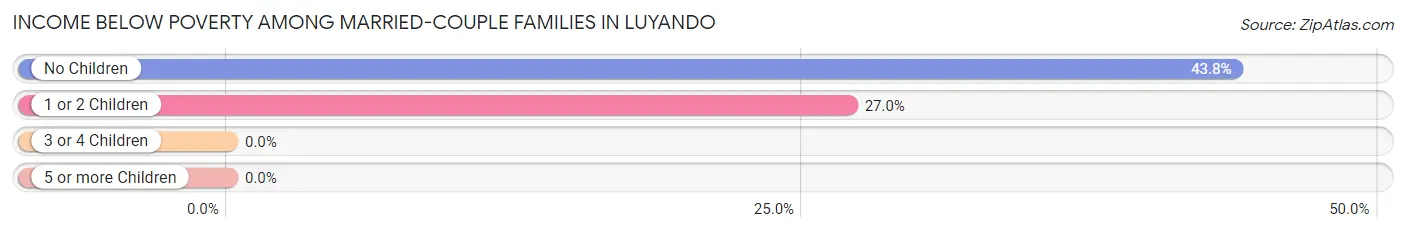
| Children | Above Poverty | Below Poverty |
| No Children | 162 (56.2%) | 126 (43.8%) |
| 1 or 2 Children | 111 (73.0%) | 41 (27.0%) |
| 3 or 4 Children | 0 (0.0%) | 0 (0.0%) |
| 5 or more Children | 0 (0.0%) | 0 (0.0%) |
| Total | 273 (62.1%) | 167 (38.0%) |
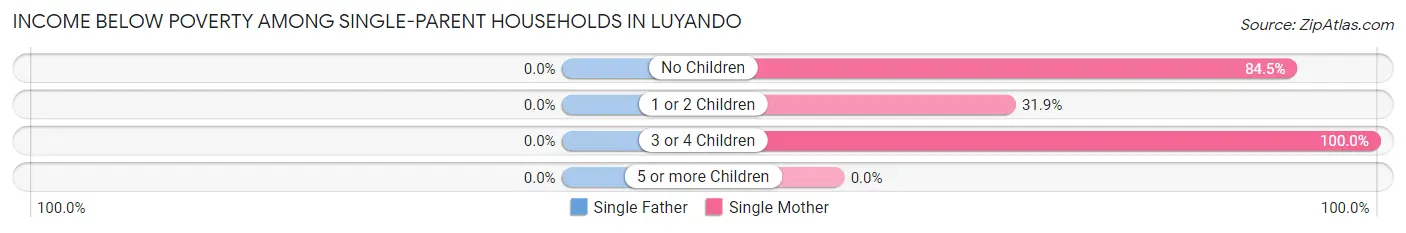
Income Below Poverty Among Single-Parent Households in Luyando
| Children | Single Father | Single Mother |
| No Children | 0 (0.0%) | 49 (84.5%) |
| 1 or 2 Children | 0 (0.0%) | 15 (31.9%) |
| 3 or 4 Children | 0 (0.0%) | 17 (100.0%) |
| 5 or more Children | 0 (0.0%) | 0 (0.0%) |
| Total | 0 (0.0%) | 81 (66.4%) |
Income Below Poverty Among Married-Couple vs Single-Parent Households in Luyando
The poverty data for Luyando shows that 167 of the married-couple family households (38.0%) and 81 of the single-parent households (66.4%) are living below the poverty level. Within the married-couple family households, those with no children have the highest poverty rate, with 126 households (43.8%) falling below the poverty line. Among the single-parent households, those with 3 or 4 children have the highest poverty rate, with 17 household (100.0%) living below poverty.
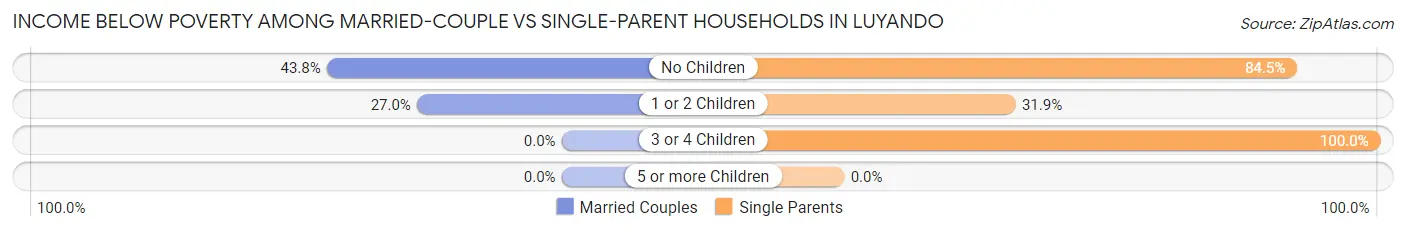
| Children | Married-Couple Families | Single-Parent Households |
| No Children | 126 (43.8%) | 49 (84.5%) |
| 1 or 2 Children | 41 (27.0%) | 15 (31.9%) |
| 3 or 4 Children | 0 (0.0%) | 17 (100.0%) |
| 5 or more Children | 0 (0.0%) | 0 (0.0%) |
| Total | 167 (38.0%) | 81 (66.4%) |
Race in Luyando
The most populous races in Luyando are Hispanic or Latino (2,555 | 96.1%), White / Caucasian (1,463 | 55.0%), and Two or more Races (983 | 37.0%).
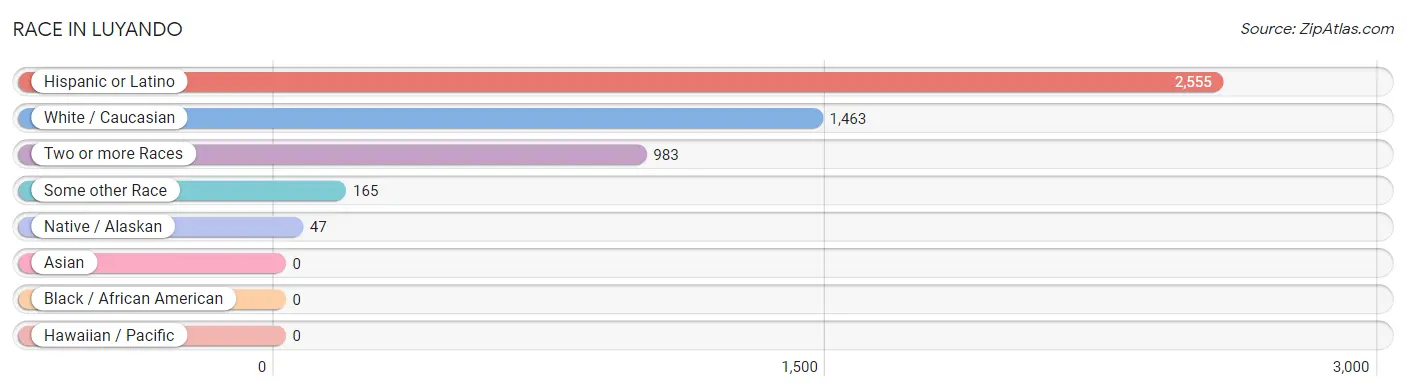
| Race | # Population | % Population |
| Asian | 0 | 0.0% |
| Black / African American | 0 | 0.0% |
| Hawaiian / Pacific | 0 | 0.0% |
| Hispanic or Latino | 2,555 | 96.1% |
| Native / Alaskan | 47 | 1.8% |
| White / Caucasian | 1,463 | 55.0% |
| Two or more Races | 983 | 37.0% |
| Some other Race | 165 | 6.2% |
| Total | 2,658 | 100.0% |
Ancestry in Luyando
The most populous ancestries reported in Luyando are Puerto Rican (2,341 | 88.1%), Central American Indian (775 | 29.2%), American (188 | 7.1%), Spaniard (181 | 6.8%), and Mexican (18 | 0.7%), together accounting for 131.8% of all Luyando residents.
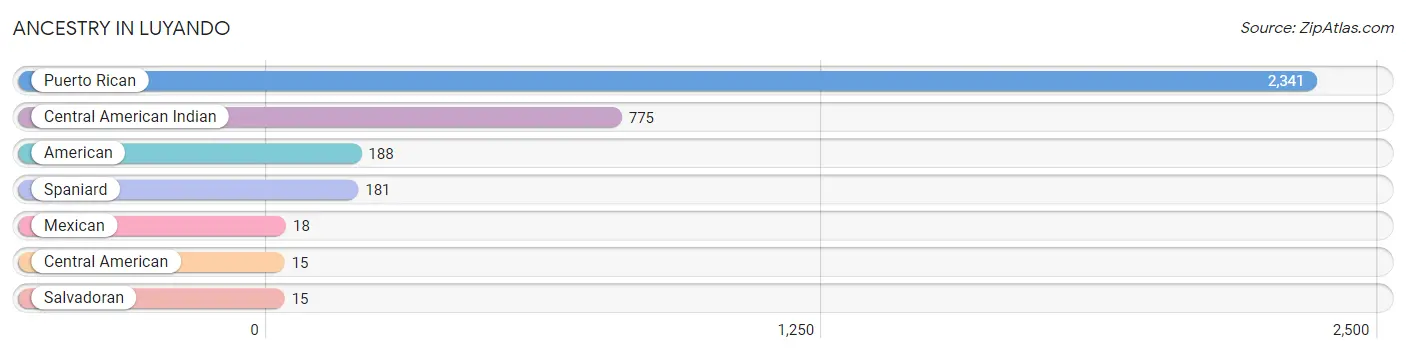
| Ancestry | # Population | % Population |
| American | 188 | 7.1% |
| Central American | 15 | 0.6% |
| Central American Indian | 775 | 29.2% |
| Mexican | 18 | 0.7% |
| Puerto Rican | 2,341 | 88.1% |
| Salvadoran | 15 | 0.6% |
| Spaniard | 181 | 6.8% | View All 7 Rows |
Immigrants in Luyando

| Immigration Origin | # Population | % Population | View All 0 Rows |
Sex and Age in Luyando
Sex and Age in Luyando
The most populous age groups in Luyando are 50 to 54 Years (156 | 13.2%) for men and 45 to 49 Years (147 | 10.0%) for women.
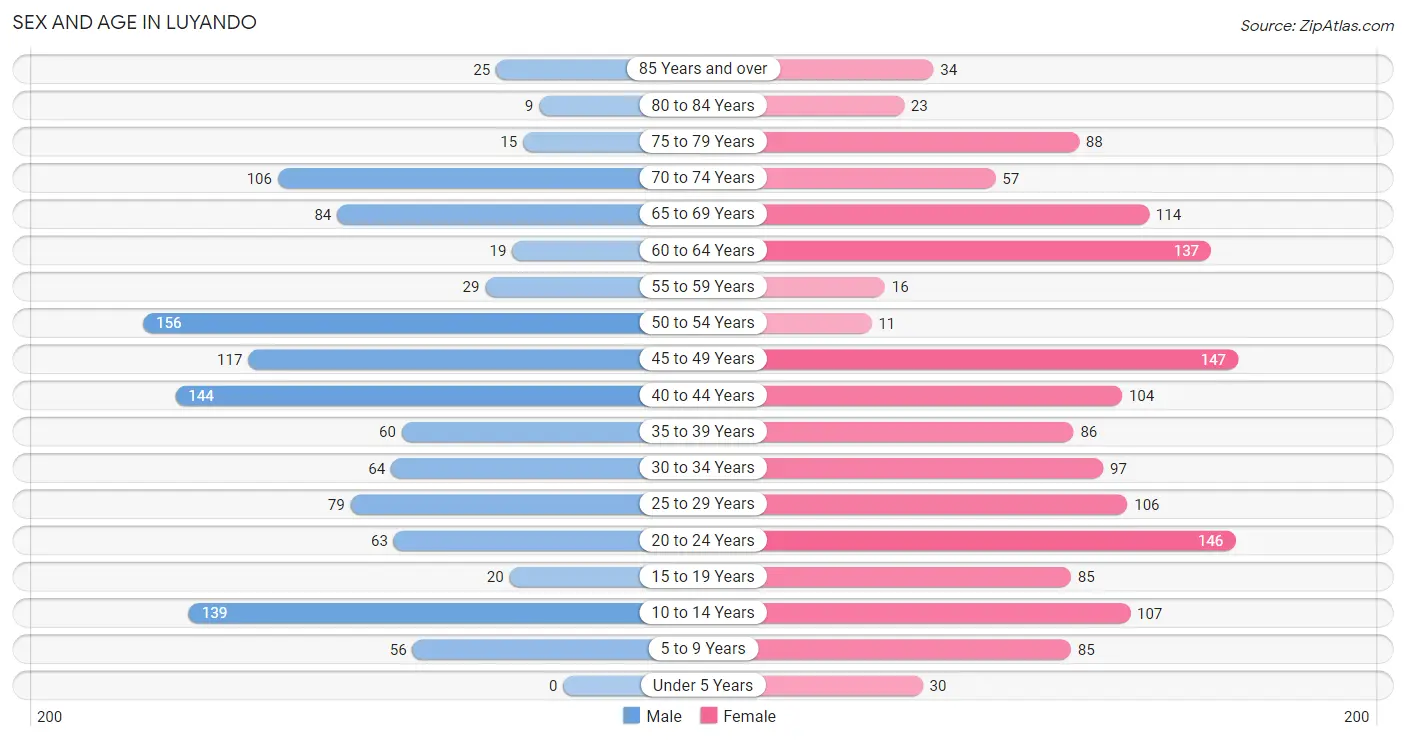
| Age Bracket | Male | Female |
| Under 5 Years | 0 (0.0%) | 30 (2.0%) |
| 5 to 9 Years | 56 (4.7%) | 85 (5.8%) |
| 10 to 14 Years | 139 (11.7%) | 107 (7.3%) |
| 15 to 19 Years | 20 (1.7%) | 85 (5.8%) |
| 20 to 24 Years | 63 (5.3%) | 146 (9.9%) |
| 25 to 29 Years | 79 (6.7%) | 106 (7.2%) |
| 30 to 34 Years | 64 (5.4%) | 97 (6.6%) |
| 35 to 39 Years | 60 (5.1%) | 86 (5.8%) |
| 40 to 44 Years | 144 (12.1%) | 104 (7.1%) |
| 45 to 49 Years | 117 (9.9%) | 147 (10.0%) |
| 50 to 54 Years | 156 (13.2%) | 11 (0.7%) |
| 55 to 59 Years | 29 (2.5%) | 16 (1.1%) |
| 60 to 64 Years | 19 (1.6%) | 137 (9.3%) |
| 65 to 69 Years | 84 (7.1%) | 114 (7.7%) |
| 70 to 74 Years | 106 (8.9%) | 57 (3.9%) |
| 75 to 79 Years | 15 (1.3%) | 88 (6.0%) |
| 80 to 84 Years | 9 (0.8%) | 23 (1.6%) |
| 85 Years and over | 25 (2.1%) | 34 (2.3%) |
| Total | 1,185 (100.0%) | 1,473 (100.0%) |
Families and Households in Luyando
Median Family Size in Luyando
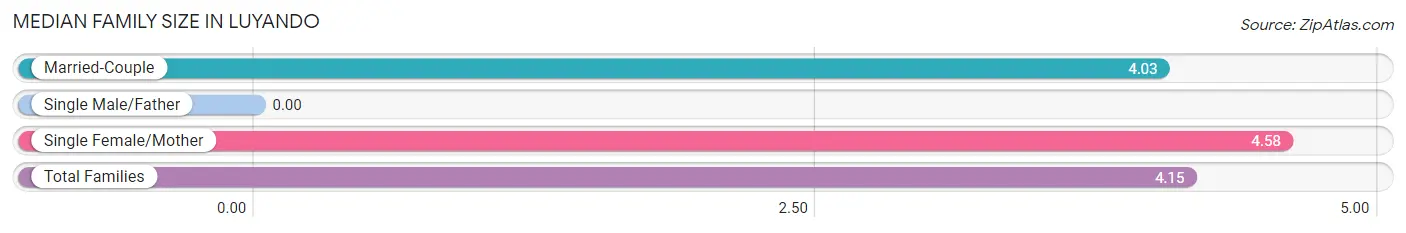
| Family Type | # Families | Family Size |
| Married-Couple | 440 (78.3%) | 4.03 |
| Single Male/Father | 0 (0.0%) | - |
| Single Female/Mother | 122 (21.7%) | 4.58 |
| Total Families | 562 (100.0%) | 4.15 |
Median Household Size in Luyando
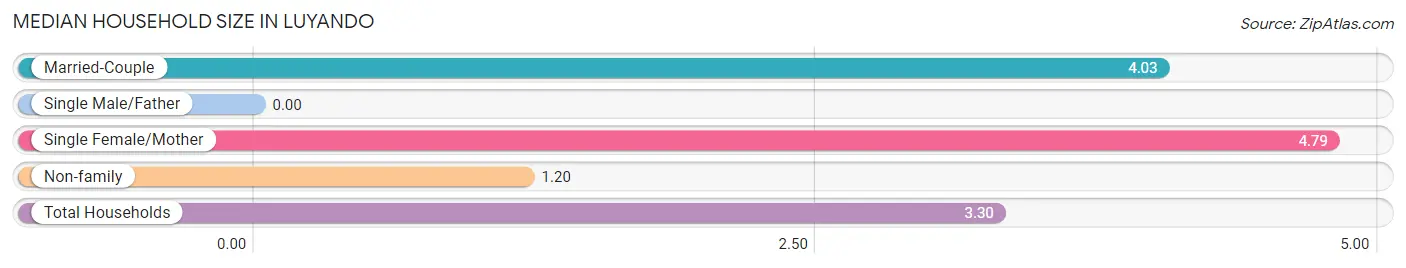
| Household Type | # Households | Household Size |
| Married-Couple | 440 (54.8%) | 4.03 |
| Single Male/Father | 0 (0.0%) | - |
| Single Female/Mother | 122 (15.2%) | 4.79 |
| Non-family | 241 (30.0%) | 1.20 |
| Total Households | 803 (100.0%) | 3.30 |
Household Size by Marriage Status in Luyando
Out of a total of 803 households in Luyando, 562 (70.0%) are family households, while 241 (30.0%) are nonfamily households. The most numerous type of family households are 2-person households, comprising 184, and the most common type of nonfamily households are 1-person households, comprising 199.
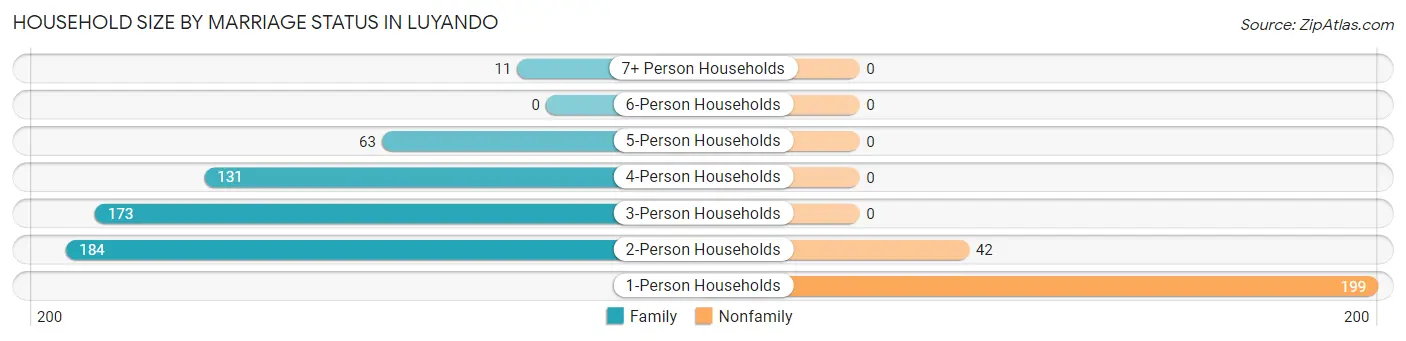
| Household Size | Family Households | Nonfamily Households |
| 1-Person Households | - | 199 (24.8%) |
| 2-Person Households | 184 (22.9%) | 42 (5.2%) |
| 3-Person Households | 173 (21.5%) | 0 (0.0%) |
| 4-Person Households | 131 (16.3%) | 0 (0.0%) |
| 5-Person Households | 63 (7.9%) | 0 (0.0%) |
| 6-Person Households | 0 (0.0%) | 0 (0.0%) |
| 7+ Person Households | 11 (1.4%) | 0 (0.0%) |
| Total | 562 (70.0%) | 241 (30.0%) |
Female Fertility in Luyando
Fertility by Age in Luyando
| Age Bracket | Women with Births | Births / 1,000 Women |
| 15 to 19 years | 0 (0.0%) | 0.0 |
| 20 to 34 years | 0 (0.0%) | 0.0 |
| 35 to 50 years | 0 (0.0%) | 0.0 |
| Total | 0 (0.0%) | 0.0 |
Fertility by Age by Marriage Status in Luyando
| Age Bracket | Married | Unmarried |
| 15 to 19 years | 0 (0.0%) | 0 (0.0%) |
| 20 to 34 years | 0 (0.0%) | 0 (0.0%) |
| 35 to 50 years | 0 (0.0%) | 0 (0.0%) |
| Total | 0 (0.0%) | 0 (0.0%) |
Fertility by Education in Luyando
| Educational Attainment | Women with Births | Births / 1,000 Women |
| Less than High School | 0 (0.0%) | 0.0 |
| High School Diploma | 0 (0.0%) | 0.0 |
| College or Associate's Degree | 0 (0.0%) | 0.0 |
| Bachelor's Degree | 0 (0.0%) | 0.0 |
| Graduate Degree | 0 (0.0%) | 0.0 |
| Total | 0 (0.0%) | 0.0 |
Fertility by Education by Marriage Status in Luyando
| Educational Attainment | Married | Unmarried |
| Less than High School | 0 (0.0%) | 0 (0.0%) |
| High School Diploma | 0 (0.0%) | 0 (0.0%) |
| College or Associate's Degree | 0 (0.0%) | 0 (0.0%) |
| Bachelor's Degree | 0 (0.0%) | 0 (0.0%) |
| Graduate Degree | 0 (0.0%) | 0 (0.0%) |
| Total | 0 (0.0%) | 0 (0.0%) |
Employment Characteristics in Luyando
Employment by Class of Employer in Luyando
Among the 732 employed individuals in Luyando, private company employees (461 | 63.0%), self-employed (not incorporated) (117 | 16.0%), and state government employees (66 | 9.0%) make up the most common classes of employment.
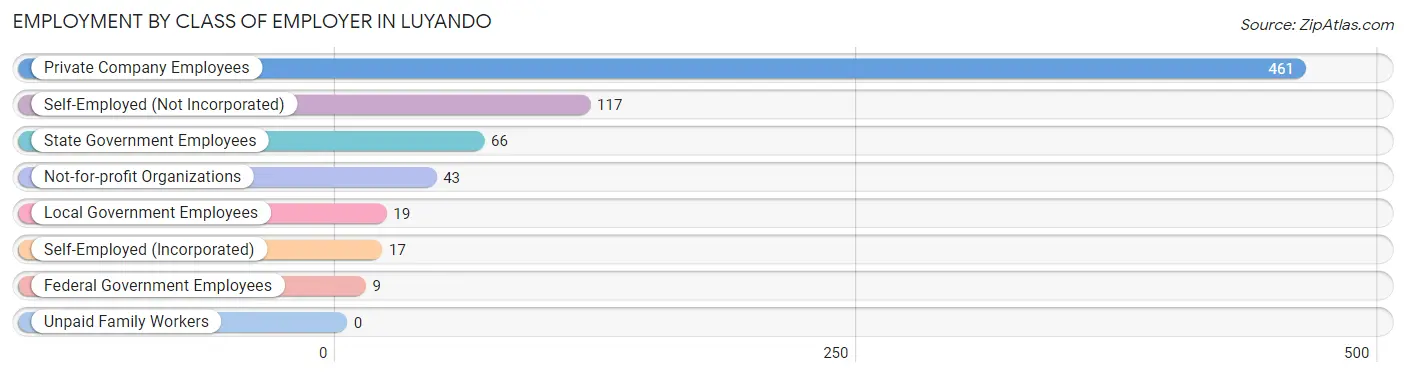
| Employer Class | # Employees | % Employees |
| Private Company Employees | 461 | 63.0% |
| Self-Employed (Incorporated) | 17 | 2.3% |
| Self-Employed (Not Incorporated) | 117 | 16.0% |
| Not-for-profit Organizations | 43 | 5.9% |
| Local Government Employees | 19 | 2.6% |
| State Government Employees | 66 | 9.0% |
| Federal Government Employees | 9 | 1.2% |
| Unpaid Family Workers | 0 | 0.0% |
| Total | 732 | 100.0% |
Employment Status by Age in Luyando
According to the labor force statistics for Luyando, out of the total population over 16 years of age (2,241), 34.9% or 782 individuals are in the labor force, with 6.5% or 51 of them unemployed. The age group with the highest labor force participation rate is 30 to 34 years, with 100.0% or 161 individuals in the labor force. Within the labor force, the 55 to 59 years age range has the highest percentage of unemployed individuals, with 62.1% or 18 of them being unemployed.
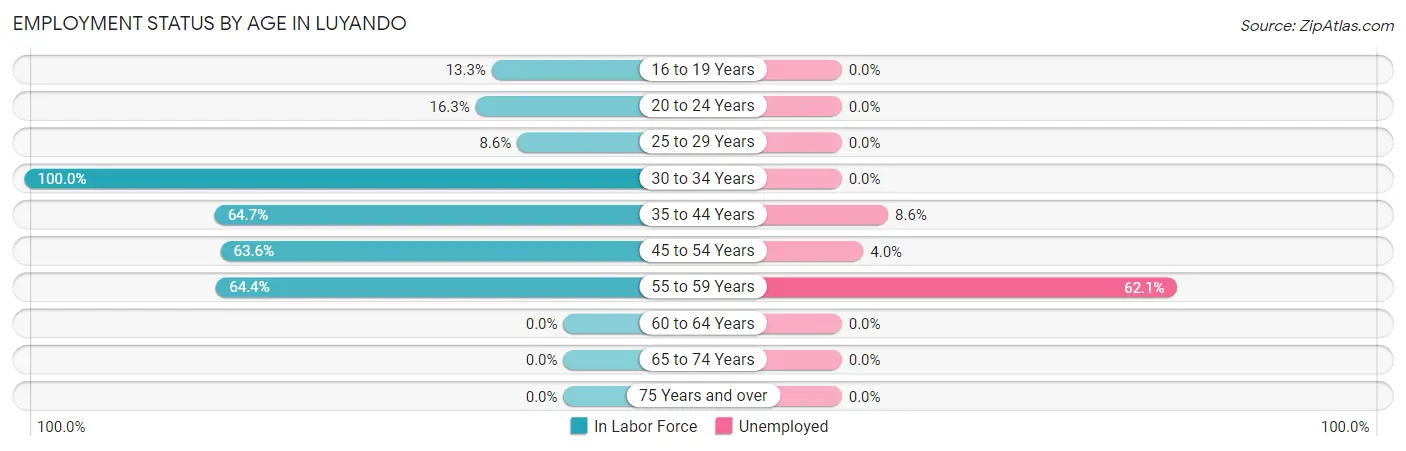
| Age Bracket | In Labor Force | Unemployed |
| 16 to 19 Years | 14 (13.3%) | 0 (0.0%) |
| 20 to 24 Years | 34 (16.3%) | 0 (0.0%) |
| 25 to 29 Years | 16 (8.6%) | 0 (0.0%) |
| 30 to 34 Years | 161 (100.0%) | 0 (0.0%) |
| 35 to 44 Years | 255 (64.7%) | 22 (8.6%) |
| 45 to 54 Years | 274 (63.6%) | 11 (4.0%) |
| 55 to 59 Years | 29 (64.4%) | 18 (62.1%) |
| 60 to 64 Years | 0 (0.0%) | 0 (0.0%) |
| 65 to 74 Years | 0 (0.0%) | 0 (0.0%) |
| 75 Years and over | 0 (0.0%) | 0 (0.0%) |
| Total | 782 (34.9%) | 51 (6.5%) |
Employment Status by Educational Attainment in Luyando
According to labor force statistics for Luyando, 53.6% of individuals (735) out of the total population between 25 and 64 years of age (1,372) are in the labor force, with 6.9% or 51 of them being unemployed. The group with the highest labor force participation rate are those with the educational attainment of less than high school, with 66.8% or 147 individuals in the labor force. Within the labor force, individuals with less than high school education have the highest percentage of unemployment, with 12.2% or 18 of them being unemployed.
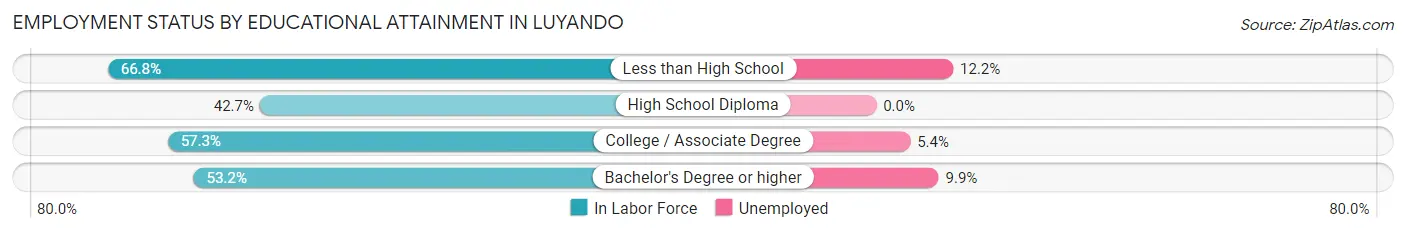
| Educational Attainment | In Labor Force | Unemployed |
| Less than High School | 147 (66.8%) | 27 (12.2%) |
| High School Diploma | 161 (42.7%) | 0 (0.0%) |
| College / Associate Degree | 204 (57.3%) | 19 (5.4%) |
| Bachelor's Degree or higher | 223 (53.2%) | 41 (9.9%) |
| Total | 735 (53.6%) | 95 (6.9%) |
Employment Occupations by Sex in Luyando
Management, Business, Science and Arts Occupations
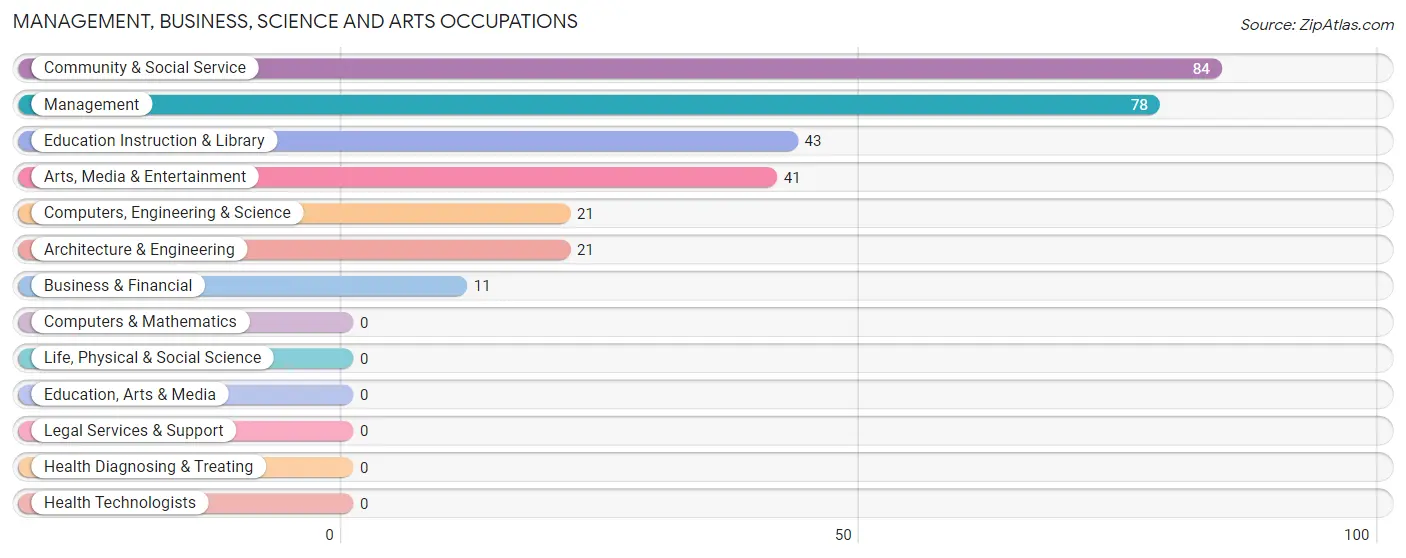
The most common Management, Business, Science and Arts occupations in Luyando are Community & Social Service (84 | 11.5%), Management (78 | 10.7%), Education Instruction & Library (43 | 5.9%), Arts, Media & Entertainment (41 | 5.6%), and Computers, Engineering & Science (21 | 2.9%).
Management, Business, Science and Arts Occupations by Sex
Within the Management, Business, Science and Arts occupations in Luyando, the most male-oriented occupations are Arts, Media & Entertainment (100.0%), Community & Social Service (82.1%), and Management (73.1%), while the most female-oriented occupations are Business & Financial (100.0%), Computers, Engineering & Science (100.0%), and Architecture & Engineering (100.0%).
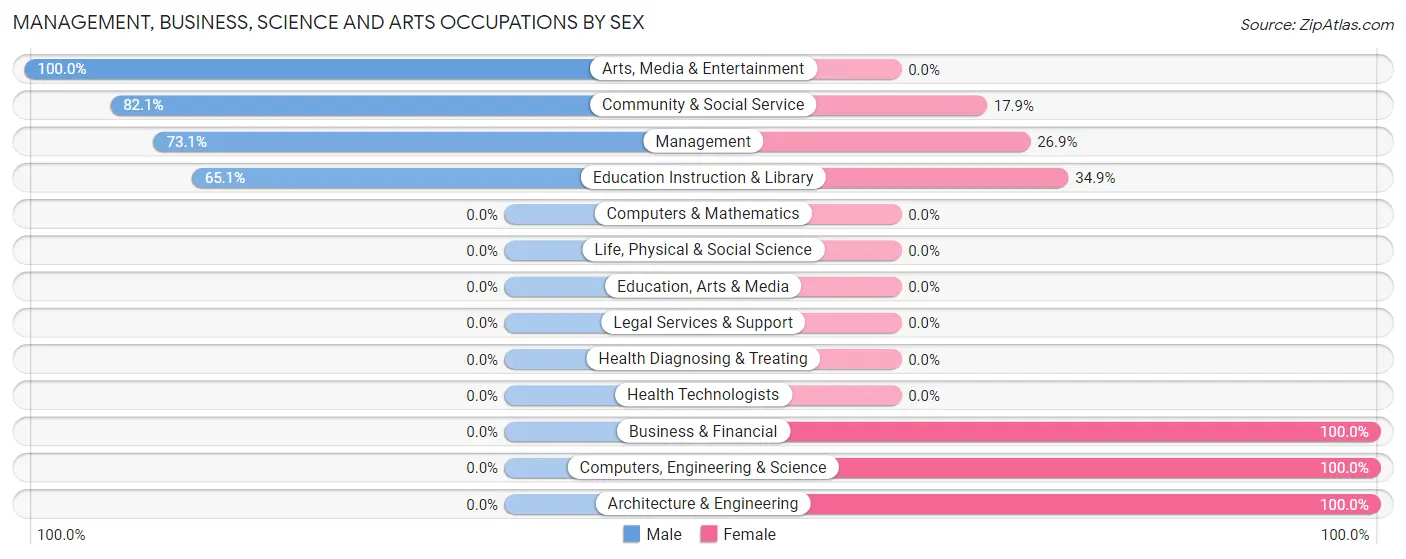
| Occupation | Male | Female |
| Management | 57 (73.1%) | 21 (26.9%) |
| Business & Financial | 0 (0.0%) | 11 (100.0%) |
| Computers, Engineering & Science | 0 (0.0%) | 21 (100.0%) |
| Computers & Mathematics | 0 (0.0%) | 0 (0.0%) |
| Architecture & Engineering | 0 (0.0%) | 21 (100.0%) |
| Life, Physical & Social Science | 0 (0.0%) | 0 (0.0%) |
| Community & Social Service | 69 (82.1%) | 15 (17.9%) |
| Education, Arts & Media | 0 (0.0%) | 0 (0.0%) |
| Legal Services & Support | 0 (0.0%) | 0 (0.0%) |
| Education Instruction & Library | 28 (65.1%) | 15 (34.9%) |
| Arts, Media & Entertainment | 41 (100.0%) | 0 (0.0%) |
| Health Diagnosing & Treating | 0 (0.0%) | 0 (0.0%) |
| Health Technologists | 0 (0.0%) | 0 (0.0%) |
| Total (Category) | 126 (64.9%) | 68 (35.0%) |
| Total (Overall) | 436 (59.6%) | 296 (40.4%) |
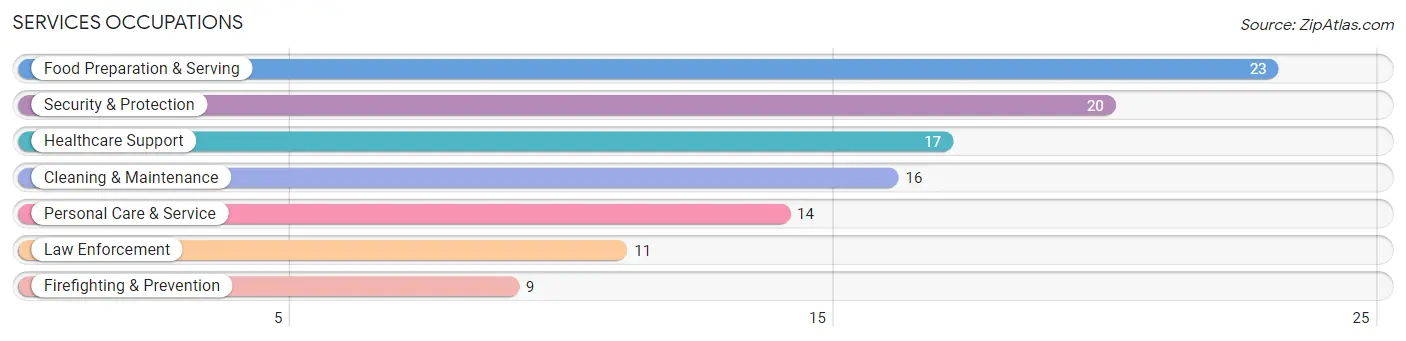
Services Occupations
The most common Services occupations in Luyando are Food Preparation & Serving (23 | 3.1%), Security & Protection (20 | 2.7%), Healthcare Support (17 | 2.3%), Cleaning & Maintenance (16 | 2.2%), and Personal Care & Service (14 | 1.9%).
Services Occupations by Sex
Within the Services occupations in Luyando, the most male-oriented occupations are Security & Protection (100.0%), Firefighting & Prevention (100.0%), and Law Enforcement (100.0%), while the most female-oriented occupations are Healthcare Support (100.0%), and Personal Care & Service (100.0%).
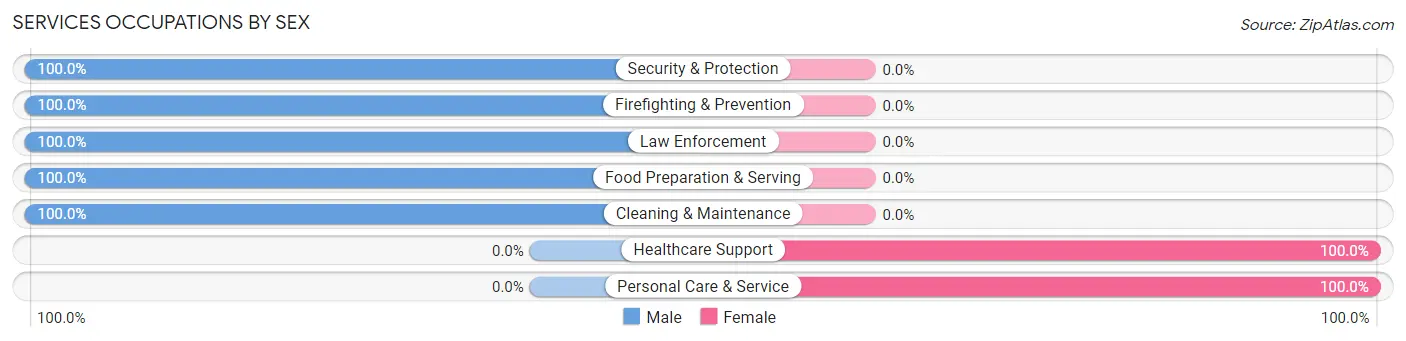
| Occupation | Male | Female |
| Healthcare Support | 0 (0.0%) | 17 (100.0%) |
| Security & Protection | 20 (100.0%) | 0 (0.0%) |
| Firefighting & Prevention | 9 (100.0%) | 0 (0.0%) |
| Law Enforcement | 11 (100.0%) | 0 (0.0%) |
| Food Preparation & Serving | 23 (100.0%) | 0 (0.0%) |
| Cleaning & Maintenance | 16 (100.0%) | 0 (0.0%) |
| Personal Care & Service | 0 (0.0%) | 14 (100.0%) |
| Total (Category) | 59 (65.6%) | 31 (34.4%) |
| Total (Overall) | 436 (59.6%) | 296 (40.4%) |
Sales and Office Occupations
The most common Sales and Office occupations in Luyando are Office & Administration (98 | 13.4%), and Sales & Related (45 | 6.1%).

Sales and Office Occupations by Sex

| Occupation | Male | Female |
| Sales & Related | 0 (0.0%) | 45 (100.0%) |
| Office & Administration | 19 (19.4%) | 79 (80.6%) |
| Total (Category) | 19 (13.3%) | 124 (86.7%) |
| Total (Overall) | 436 (59.6%) | 296 (40.4%) |
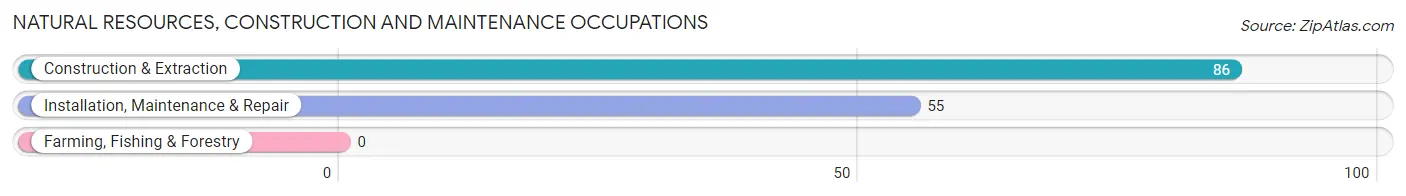
Natural Resources, Construction and Maintenance Occupations
The most common Natural Resources, Construction and Maintenance occupations in Luyando are Construction & Extraction (86 | 11.7%), and Installation, Maintenance & Repair (55 | 7.5%).
Natural Resources, Construction and Maintenance Occupations by Sex
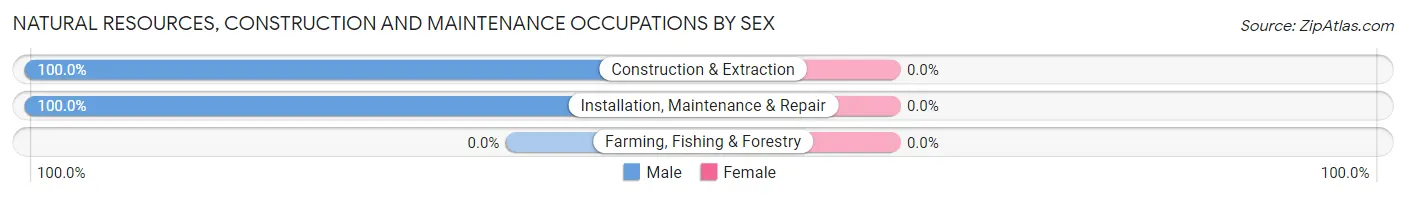
| Occupation | Male | Female |
| Farming, Fishing & Forestry | 0 (0.0%) | 0 (0.0%) |
| Construction & Extraction | 86 (100.0%) | 0 (0.0%) |
| Installation, Maintenance & Repair | 55 (100.0%) | 0 (0.0%) |
| Total (Category) | 141 (100.0%) | 0 (0.0%) |
| Total (Overall) | 436 (59.6%) | 296 (40.4%) |
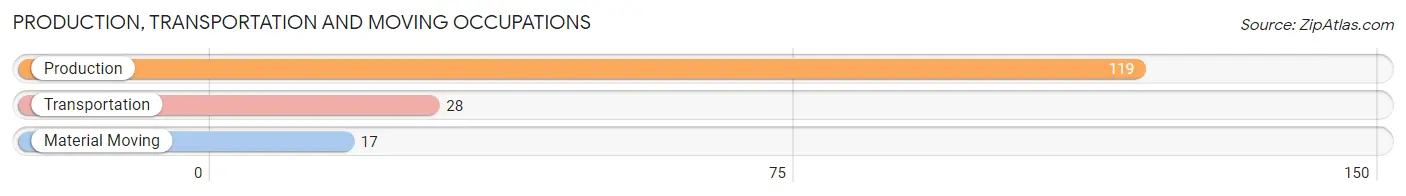
Production, Transportation and Moving Occupations
The most common Production, Transportation and Moving occupations in Luyando are Production (119 | 16.3%), Transportation (28 | 3.8%), and Material Moving (17 | 2.3%).
Production, Transportation and Moving Occupations by Sex
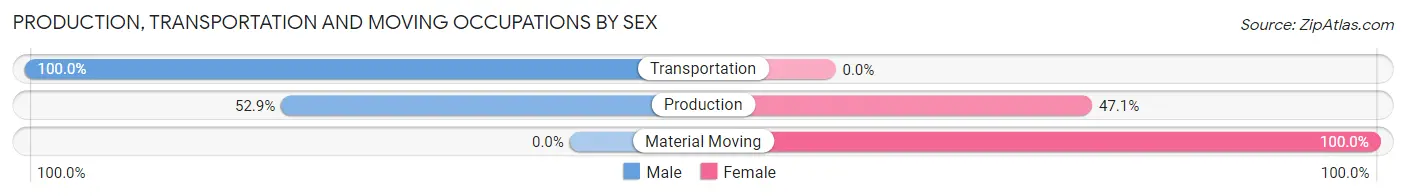
| Occupation | Male | Female |
| Production | 63 (52.9%) | 56 (47.1%) |
| Transportation | 28 (100.0%) | 0 (0.0%) |
| Material Moving | 0 (0.0%) | 17 (100.0%) |
| Total (Category) | 91 (55.5%) | 73 (44.5%) |
| Total (Overall) | 436 (59.6%) | 296 (40.4%) |
Employment Industries by Sex in Luyando
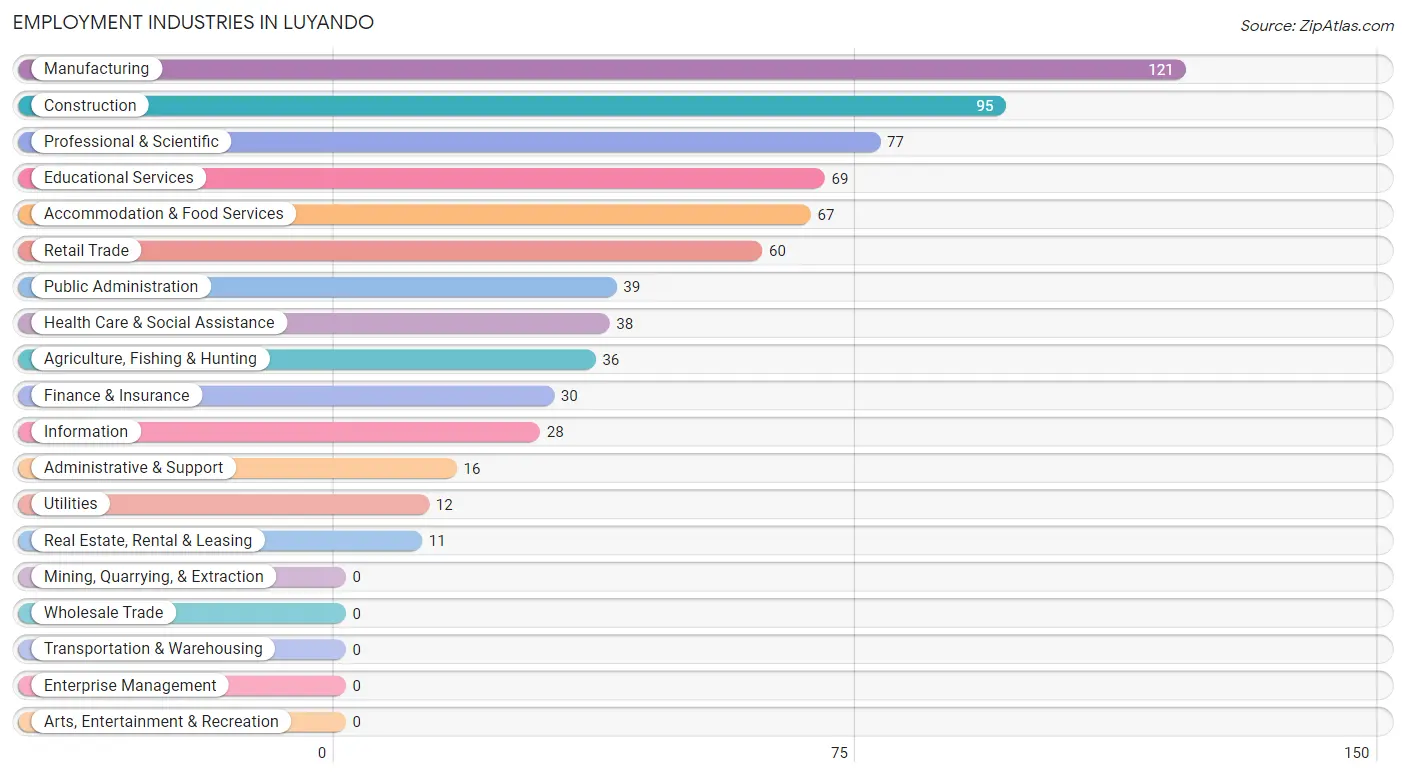
Employment Industries in Luyando
The major employment industries in Luyando include Manufacturing (121 | 16.5%), Construction (95 | 13.0%), Professional & Scientific (77 | 10.5%), Educational Services (69 | 9.4%), and Accommodation & Food Services (67 | 9.1%).
Employment Industries by Sex in Luyando
The Luyando industries that see more men than women are Agriculture, Fishing & Hunting (100.0%), Utilities (100.0%), and Information (100.0%), whereas the industries that tend to have a higher number of women are Retail Trade (100.0%), Finance & Insurance (100.0%), and Real Estate, Rental & Leasing (100.0%).
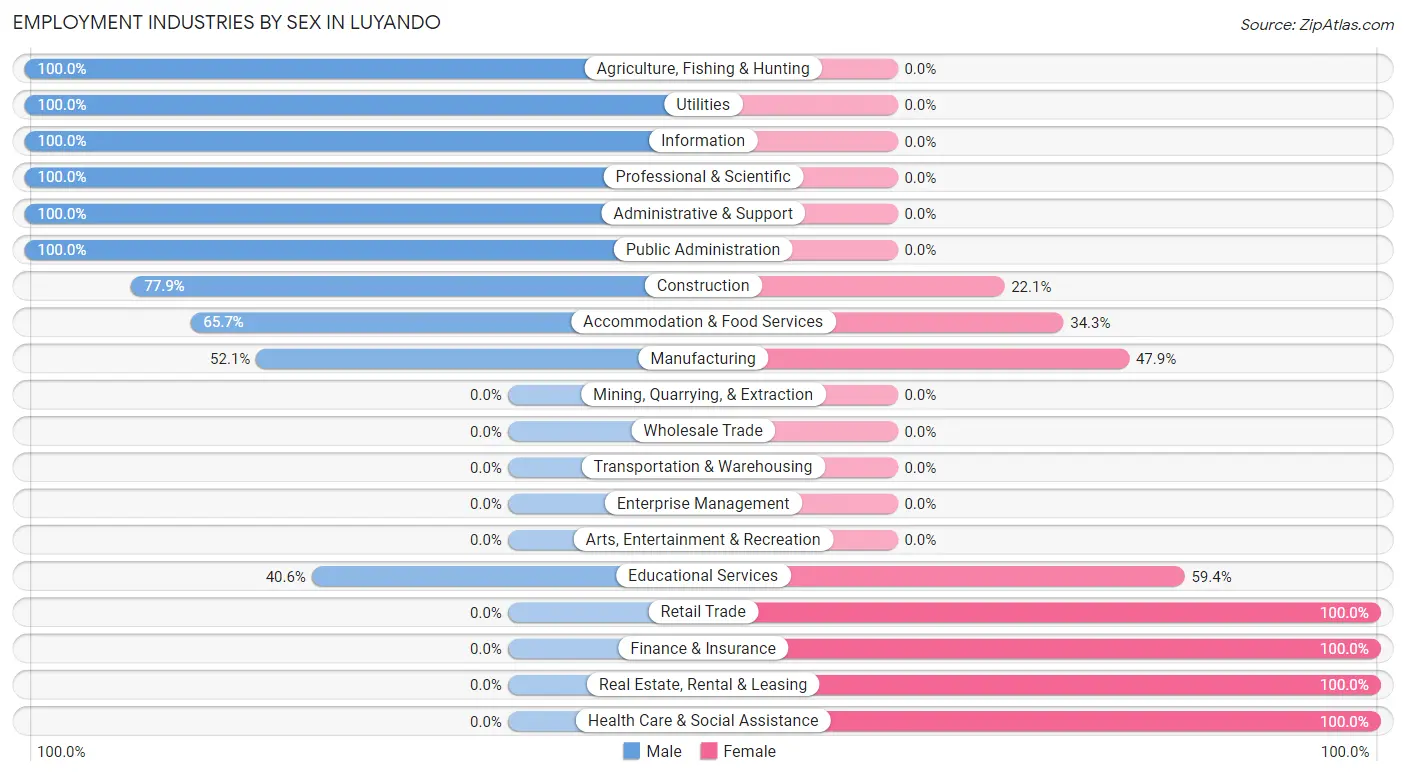
| Industry | Male | Female |
| Agriculture, Fishing & Hunting | 36 (100.0%) | 0 (0.0%) |
| Mining, Quarrying, & Extraction | 0 (0.0%) | 0 (0.0%) |
| Construction | 74 (77.9%) | 21 (22.1%) |
| Manufacturing | 63 (52.1%) | 58 (47.9%) |
| Wholesale Trade | 0 (0.0%) | 0 (0.0%) |
| Retail Trade | 0 (0.0%) | 60 (100.0%) |
| Transportation & Warehousing | 0 (0.0%) | 0 (0.0%) |
| Utilities | 12 (100.0%) | 0 (0.0%) |
| Information | 28 (100.0%) | 0 (0.0%) |
| Finance & Insurance | 0 (0.0%) | 30 (100.0%) |
| Real Estate, Rental & Leasing | 0 (0.0%) | 11 (100.0%) |
| Professional & Scientific | 77 (100.0%) | 0 (0.0%) |
| Enterprise Management | 0 (0.0%) | 0 (0.0%) |
| Administrative & Support | 16 (100.0%) | 0 (0.0%) |
| Educational Services | 28 (40.6%) | 41 (59.4%) |
| Health Care & Social Assistance | 0 (0.0%) | 38 (100.0%) |
| Arts, Entertainment & Recreation | 0 (0.0%) | 0 (0.0%) |
| Accommodation & Food Services | 44 (65.7%) | 23 (34.3%) |
| Public Administration | 39 (100.0%) | 0 (0.0%) |
| Total | 436 (59.6%) | 296 (40.4%) |
Education in Luyando
School Enrollment in Luyando
The most common levels of schooling among the 675 students in Luyando are college / undergraduate (207 | 30.7%), middle school (166 | 24.6%), and high school (104 | 15.4%).
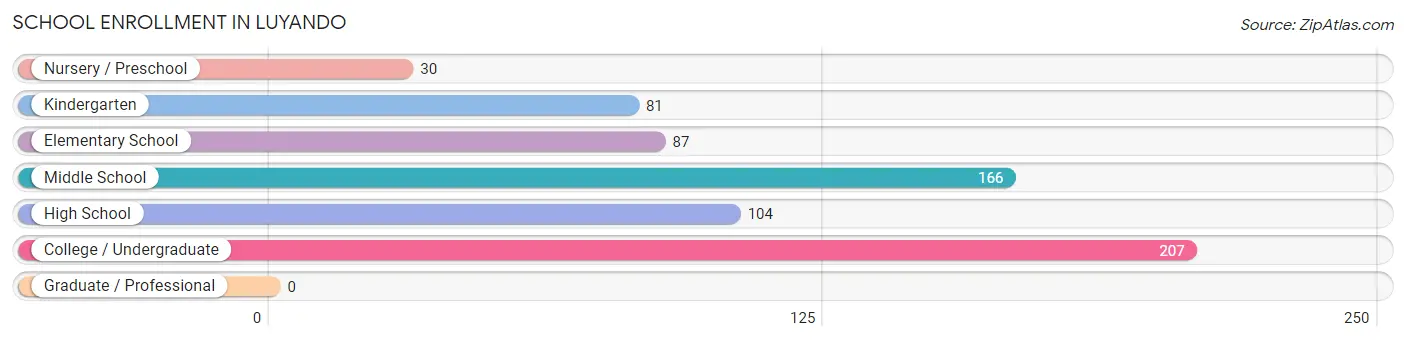
| School Level | # Students | % Students |
| Nursery / Preschool | 30 | 4.4% |
| Kindergarten | 81 | 12.0% |
| Elementary School | 87 | 12.9% |
| Middle School | 166 | 24.6% |
| High School | 104 | 15.4% |
| College / Undergraduate | 207 | 30.7% |
| Graduate / Professional | 0 | 0.0% |
| Total | 675 | 100.0% |
School Enrollment by Age by Funding Source in Luyando
Out of a total of 675 students who are enrolled in schools in Luyando, 202 (29.9%) attend a private institution, while the remaining 473 (70.1%) are enrolled in public schools. The age group of 25 to 34 year olds has the highest likelihood of being enrolled in private schools, with 15 (100.0% in the age bracket) enrolled. Conversely, the age group of 3 to 4 year olds has the lowest likelihood of being enrolled in a private school, with 30 (100.0% in the age bracket) attending a public institution.
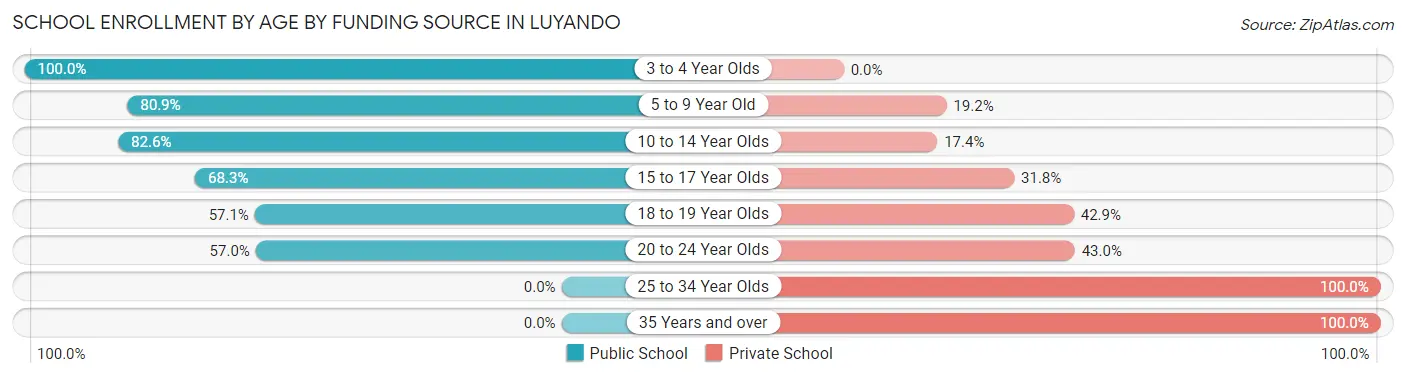
| Age Bracket | Public School | Private School |
| 3 to 4 Year Olds | 30 (100.0%) | 0 (0.0%) |
| 5 to 9 Year Old | 114 (80.8%) | 27 (19.2%) |
| 10 to 14 Year Olds | 180 (82.6%) | 38 (17.4%) |
| 15 to 17 Year Olds | 43 (68.2%) | 20 (31.8%) |
| 18 to 19 Year Olds | 16 (57.1%) | 12 (42.9%) |
| 20 to 24 Year Olds | 90 (57.0%) | 68 (43.0%) |
| 25 to 34 Year Olds | 0 (0.0%) | 15 (100.0%) |
| 35 Years and over | 0 (0.0%) | 22 (100.0%) |
| Total | 473 (70.1%) | 202 (29.9%) |
Educational Attainment by Field of Study in Luyando
Science & technology (157 | 33.3%), education (126 | 26.7%), business (80 | 17.0%), computers & mathematics (36 | 7.6%), and arts & humanities (28 | 5.9%) are the most common fields of study among 472 individuals in Luyando who have obtained a bachelor's degree or higher.
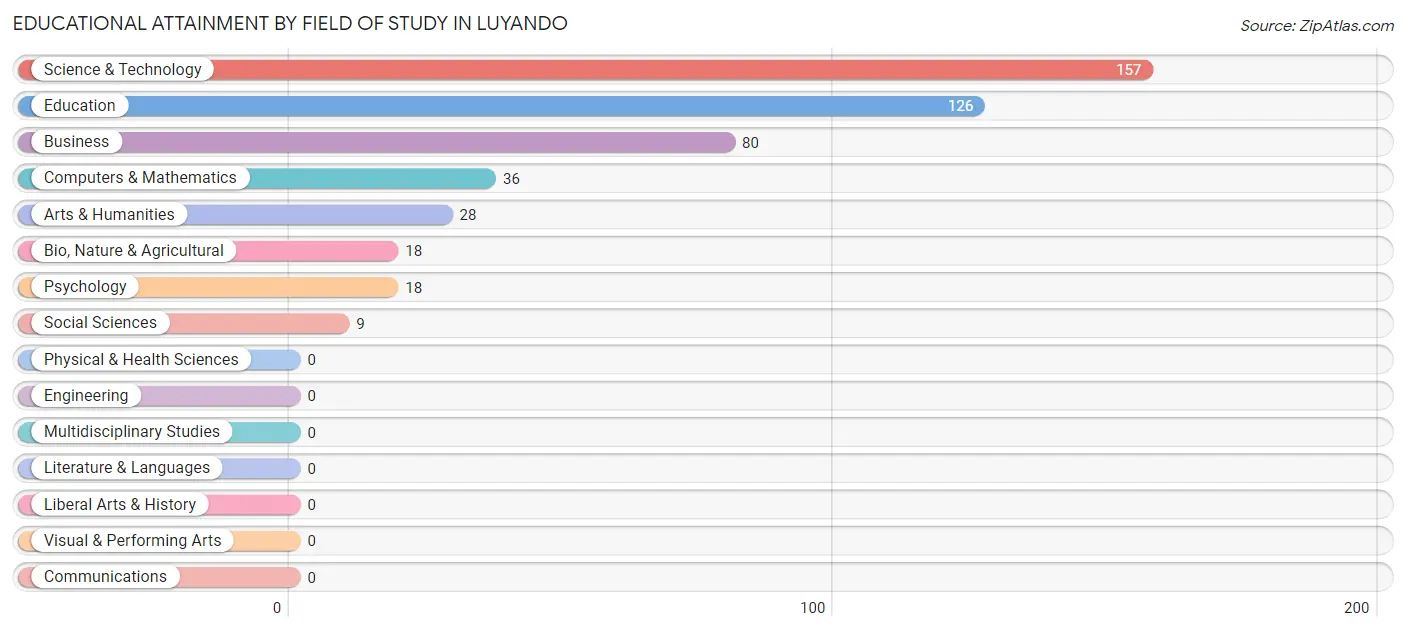
| Field of Study | # Graduates | % Graduates |
| Computers & Mathematics | 36 | 7.6% |
| Bio, Nature & Agricultural | 18 | 3.8% |
| Physical & Health Sciences | 0 | 0.0% |
| Psychology | 18 | 3.8% |
| Social Sciences | 9 | 1.9% |
| Engineering | 0 | 0.0% |
| Multidisciplinary Studies | 0 | 0.0% |
| Science & Technology | 157 | 33.3% |
| Business | 80 | 17.0% |
| Education | 126 | 26.7% |
| Literature & Languages | 0 | 0.0% |
| Liberal Arts & History | 0 | 0.0% |
| Visual & Performing Arts | 0 | 0.0% |
| Communications | 0 | 0.0% |
| Arts & Humanities | 28 | 5.9% |
| Total | 472 | 100.0% |
Transportation & Commute in Luyando
Vehicle Availability by Sex in Luyando
The most prevalent vehicle ownership categories in Luyando are males with 1 vehicle (152, accounting for 34.9%) and females with 1 vehicle (94, making up 51.3%).
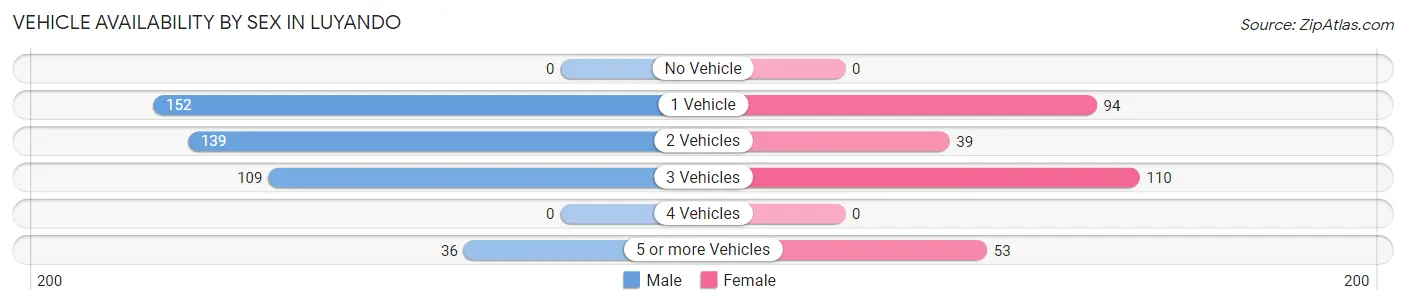
| Vehicles Available | Male | Female |
| No Vehicle | 0 (0.0%) | 0 (0.0%) |
| 1 Vehicle | 152 (34.9%) | 94 (31.8%) |
| 2 Vehicles | 139 (31.9%) | 39 (13.2%) |
| 3 Vehicles | 109 (25.0%) | 110 (37.2%) |
| 4 Vehicles | 0 (0.0%) | 0 (0.0%) |
| 5 or more Vehicles | 36 (8.3%) | 53 (17.9%) |
| Total | 436 (100.0%) | 296 (100.0%) |
Commute Time in Luyando
The most frequently occuring commute durations in Luyando are 15 to 19 minutes (159 commuters, 25.9%), 5 to 9 minutes (123 commuters, 20.0%), and 20 to 24 minutes (85 commuters, 13.8%).
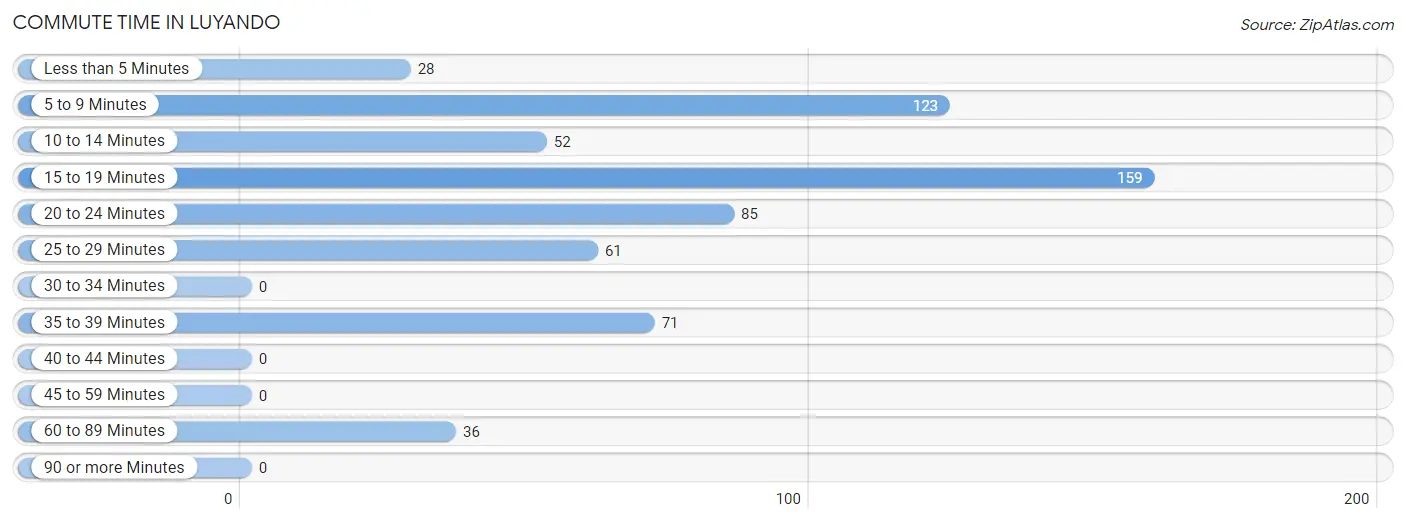
| Commute Time | # Commuters | % Commuters |
| Less than 5 Minutes | 28 | 4.5% |
| 5 to 9 Minutes | 123 | 20.0% |
| 10 to 14 Minutes | 52 | 8.5% |
| 15 to 19 Minutes | 159 | 25.9% |
| 20 to 24 Minutes | 85 | 13.8% |
| 25 to 29 Minutes | 61 | 9.9% |
| 30 to 34 Minutes | 0 | 0.0% |
| 35 to 39 Minutes | 71 | 11.5% |
| 40 to 44 Minutes | 0 | 0.0% |
| 45 to 59 Minutes | 0 | 0.0% |
| 60 to 89 Minutes | 36 | 5.9% |
| 90 or more Minutes | 0 | 0.0% |
Commute Time by Sex in Luyando
The most common commute times in Luyando are 15 to 19 minutes (101 commuters, 27.8%) for males and 20 to 24 minutes (74 commuters, 29.4%) for females.
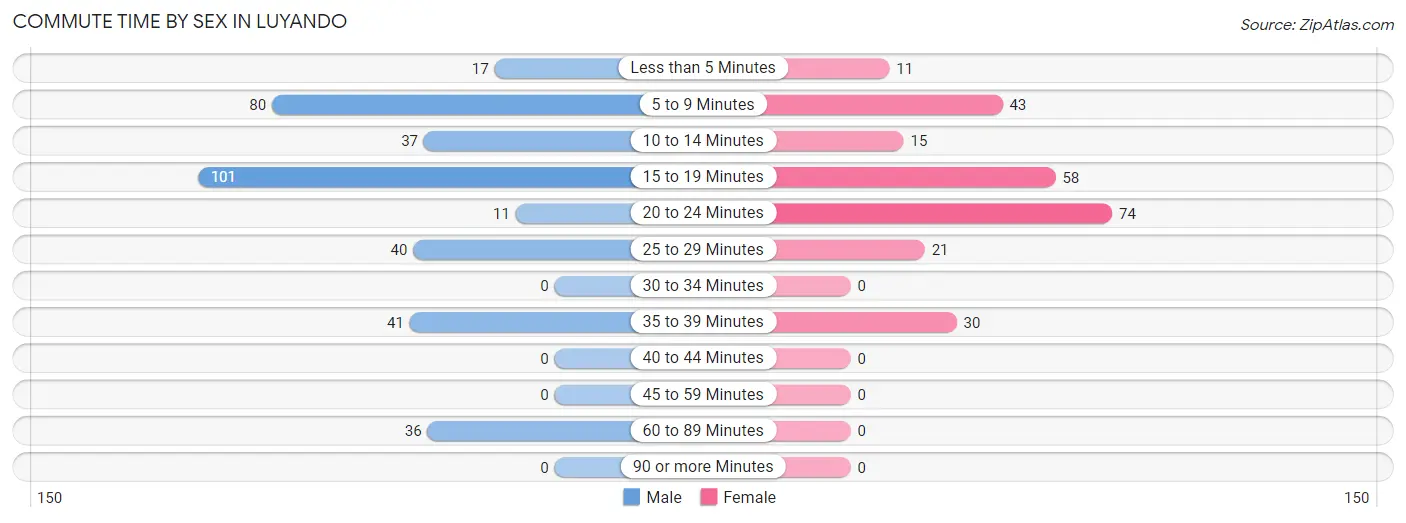
| Commute Time | Male | Female |
| Less than 5 Minutes | 17 (4.7%) | 11 (4.4%) |
| 5 to 9 Minutes | 80 (22.0%) | 43 (17.1%) |
| 10 to 14 Minutes | 37 (10.2%) | 15 (5.9%) |
| 15 to 19 Minutes | 101 (27.8%) | 58 (23.0%) |
| 20 to 24 Minutes | 11 (3.0%) | 74 (29.4%) |
| 25 to 29 Minutes | 40 (11.0%) | 21 (8.3%) |
| 30 to 34 Minutes | 0 (0.0%) | 0 (0.0%) |
| 35 to 39 Minutes | 41 (11.3%) | 30 (11.9%) |
| 40 to 44 Minutes | 0 (0.0%) | 0 (0.0%) |
| 45 to 59 Minutes | 0 (0.0%) | 0 (0.0%) |
| 60 to 89 Minutes | 36 (9.9%) | 0 (0.0%) |
| 90 or more Minutes | 0 (0.0%) | 0 (0.0%) |
Time of Departure to Work by Sex in Luyando
The most frequent times of departure to work in Luyando are 7:00 AM to 7:29 AM (99, 27.3%) for males and 7:00 AM to 7:29 AM (158, 62.7%) for females.
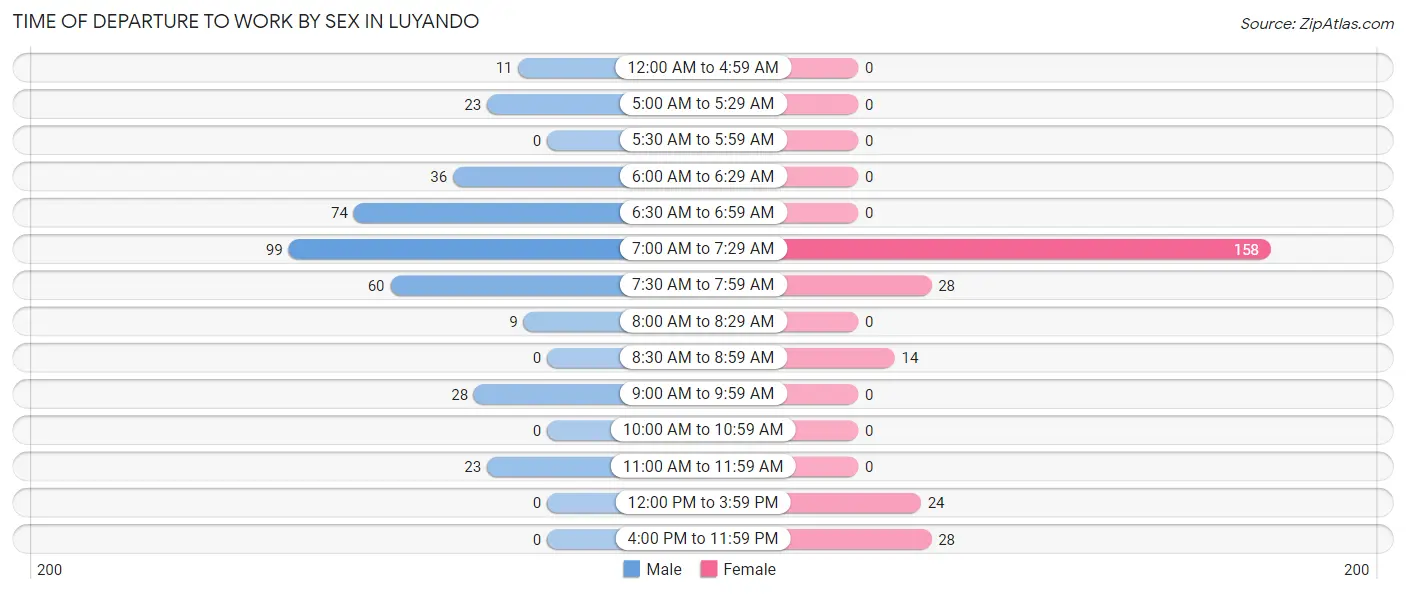
| Time of Departure | Male | Female |
| 12:00 AM to 4:59 AM | 11 (3.0%) | 0 (0.0%) |
| 5:00 AM to 5:29 AM | 23 (6.3%) | 0 (0.0%) |
| 5:30 AM to 5:59 AM | 0 (0.0%) | 0 (0.0%) |
| 6:00 AM to 6:29 AM | 36 (9.9%) | 0 (0.0%) |
| 6:30 AM to 6:59 AM | 74 (20.4%) | 0 (0.0%) |
| 7:00 AM to 7:29 AM | 99 (27.3%) | 158 (62.7%) |
| 7:30 AM to 7:59 AM | 60 (16.5%) | 28 (11.1%) |
| 8:00 AM to 8:29 AM | 9 (2.5%) | 0 (0.0%) |
| 8:30 AM to 8:59 AM | 0 (0.0%) | 14 (5.6%) |
| 9:00 AM to 9:59 AM | 28 (7.7%) | 0 (0.0%) |
| 10:00 AM to 10:59 AM | 0 (0.0%) | 0 (0.0%) |
| 11:00 AM to 11:59 AM | 23 (6.3%) | 0 (0.0%) |
| 12:00 PM to 3:59 PM | 0 (0.0%) | 24 (9.5%) |
| 4:00 PM to 11:59 PM | 0 (0.0%) | 28 (11.1%) |
| Total | 363 (100.0%) | 252 (100.0%) |
Housing Occupancy in Luyando
Occupancy by Ownership in Luyando
Of the total 803 dwellings in Luyando, owner-occupied units account for 661 (82.3%), while renter-occupied units make up 142 (17.7%).
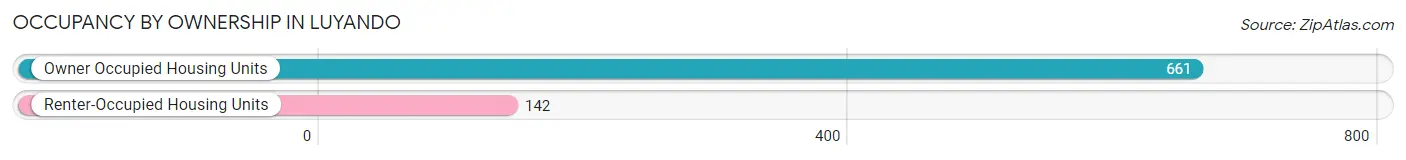
| Occupancy | # Housing Units | % Housing Units |
| Owner Occupied Housing Units | 661 | 82.3% |
| Renter-Occupied Housing Units | 142 | 17.7% |
| Total Occupied Housing Units | 803 | 100.0% |
Occupancy by Household Size in Luyando
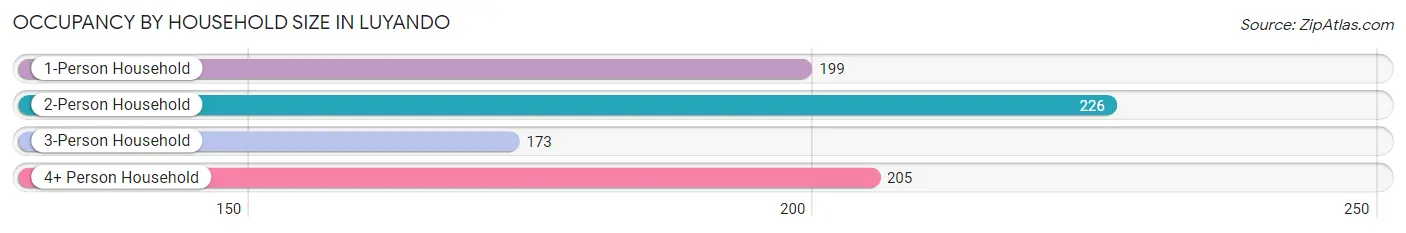
| Household Size | # Housing Units | % Housing Units |
| 1-Person Household | 199 | 24.8% |
| 2-Person Household | 226 | 28.1% |
| 3-Person Household | 173 | 21.5% |
| 4+ Person Household | 205 | 25.5% |
| Total Housing Units | 803 | 100.0% |
Occupancy by Ownership by Household Size in Luyando
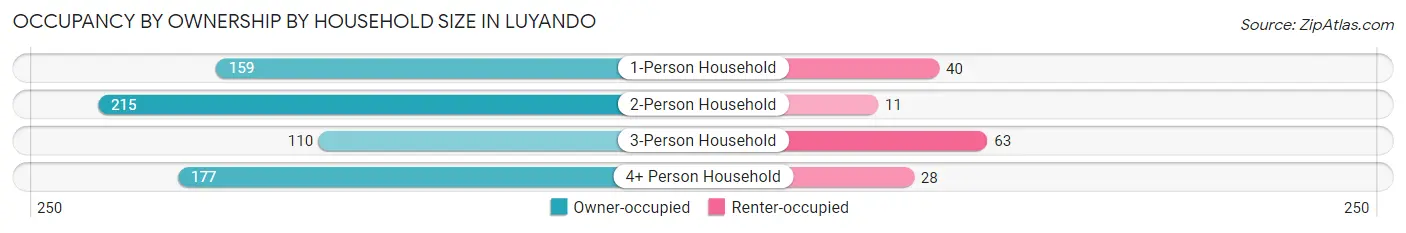
| Household Size | Owner-occupied | Renter-occupied |
| 1-Person Household | 159 (79.9%) | 40 (20.1%) |
| 2-Person Household | 215 (95.1%) | 11 (4.9%) |
| 3-Person Household | 110 (63.6%) | 63 (36.4%) |
| 4+ Person Household | 177 (86.3%) | 28 (13.7%) |
| Total Housing Units | 661 (82.3%) | 142 (17.7%) |
Occupancy by Educational Attainment in Luyando
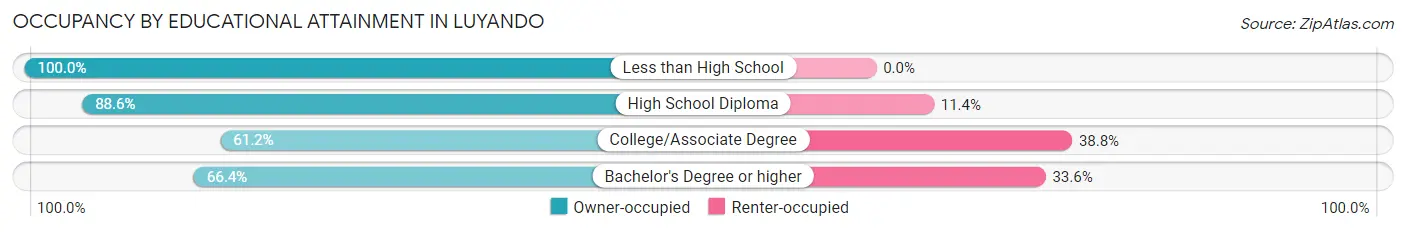
| Household Size | Owner-occupied | Renter-occupied |
| Less than High School | 245 (100.0%) | 0 (0.0%) |
| High School Diploma | 217 (88.6%) | 28 (11.4%) |
| College/Associate Degree | 104 (61.2%) | 66 (38.8%) |
| Bachelor's Degree or higher | 95 (66.4%) | 48 (33.6%) |
Occupancy by Age of Householder in Luyando
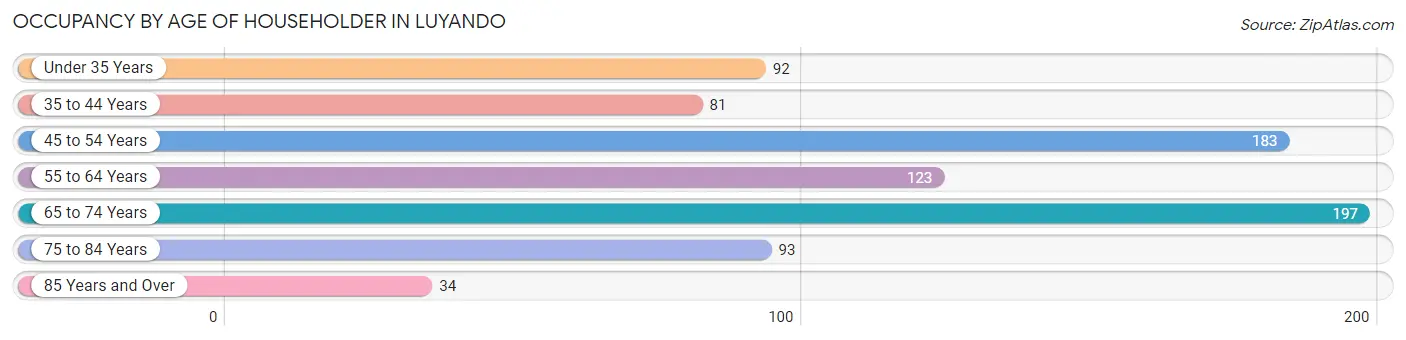
| Age Bracket | # Households | % Households |
| Under 35 Years | 92 | 11.5% |
| 35 to 44 Years | 81 | 10.1% |
| 45 to 54 Years | 183 | 22.8% |
| 55 to 64 Years | 123 | 15.3% |
| 65 to 74 Years | 197 | 24.5% |
| 75 to 84 Years | 93 | 11.6% |
| 85 Years and Over | 34 | 4.2% |
| Total | 803 | 100.0% |
Housing Finances in Luyando
Median Income by Occupancy in Luyando
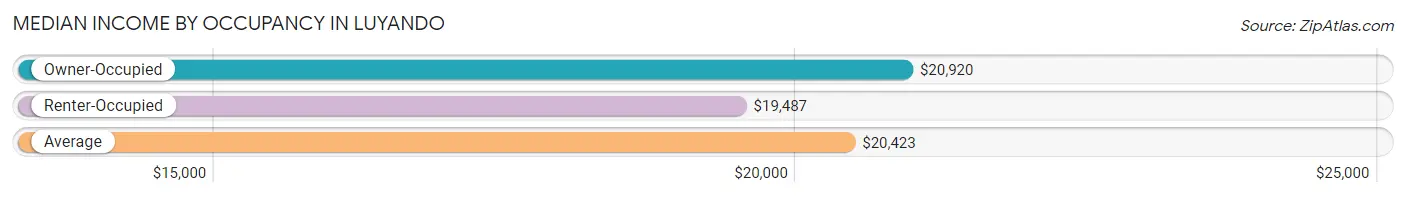
| Occupancy Type | # Households | Median Income |
| Owner-Occupied | 661 (82.3%) | $20,920 |
| Renter-Occupied | 142 (17.7%) | $19,487 |
| Average | 803 (100.0%) | $20,423 |
Occupancy by Householder Income Bracket in Luyando
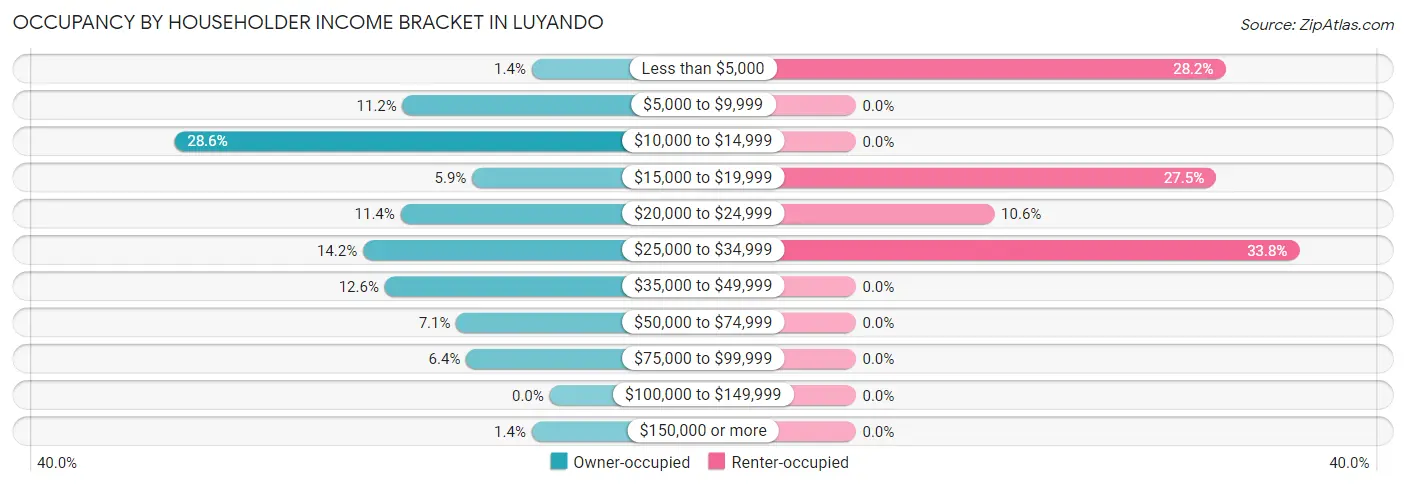
| Income Bracket | Owner-occupied | Renter-occupied |
| Less than $5,000 | 9 (1.4%) | 40 (28.2%) |
| $5,000 to $9,999 | 74 (11.2%) | 0 (0.0%) |
| $10,000 to $14,999 | 189 (28.6%) | 0 (0.0%) |
| $15,000 to $19,999 | 39 (5.9%) | 39 (27.5%) |
| $20,000 to $24,999 | 75 (11.4%) | 15 (10.6%) |
| $25,000 to $34,999 | 94 (14.2%) | 48 (33.8%) |
| $35,000 to $49,999 | 83 (12.6%) | 0 (0.0%) |
| $50,000 to $74,999 | 47 (7.1%) | 0 (0.0%) |
| $75,000 to $99,999 | 42 (6.4%) | 0 (0.0%) |
| $100,000 to $149,999 | 0 (0.0%) | 0 (0.0%) |
| $150,000 or more | 9 (1.4%) | 0 (0.0%) |
| Total | 661 (100.0%) | 142 (100.0%) |
Monthly Housing Cost Tiers in Luyando
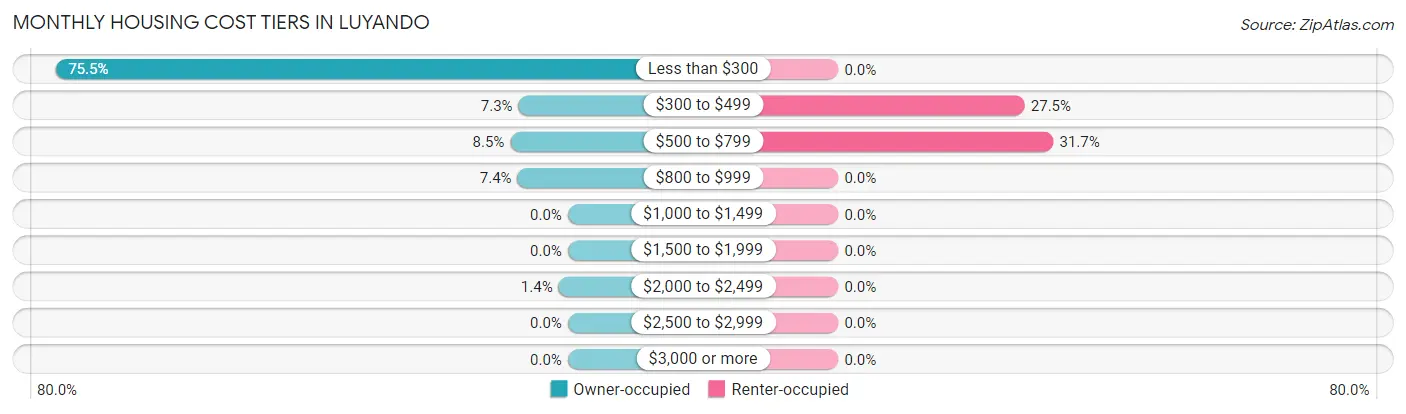
| Monthly Cost | Owner-occupied | Renter-occupied |
| Less than $300 | 499 (75.5%) | 0 (0.0%) |
| $300 to $499 | 48 (7.3%) | 39 (27.5%) |
| $500 to $799 | 56 (8.5%) | 45 (31.7%) |
| $800 to $999 | 49 (7.4%) | 0 (0.0%) |
| $1,000 to $1,499 | 0 (0.0%) | 0 (0.0%) |
| $1,500 to $1,999 | 0 (0.0%) | 0 (0.0%) |
| $2,000 to $2,499 | 9 (1.4%) | 0 (0.0%) |
| $2,500 to $2,999 | 0 (0.0%) | 0 (0.0%) |
| $3,000 or more | 0 (0.0%) | 0 (0.0%) |
| Total | 661 (100.0%) | 142 (100.0%) |
Physical Housing Characteristics in Luyando
Housing Structures in Luyando
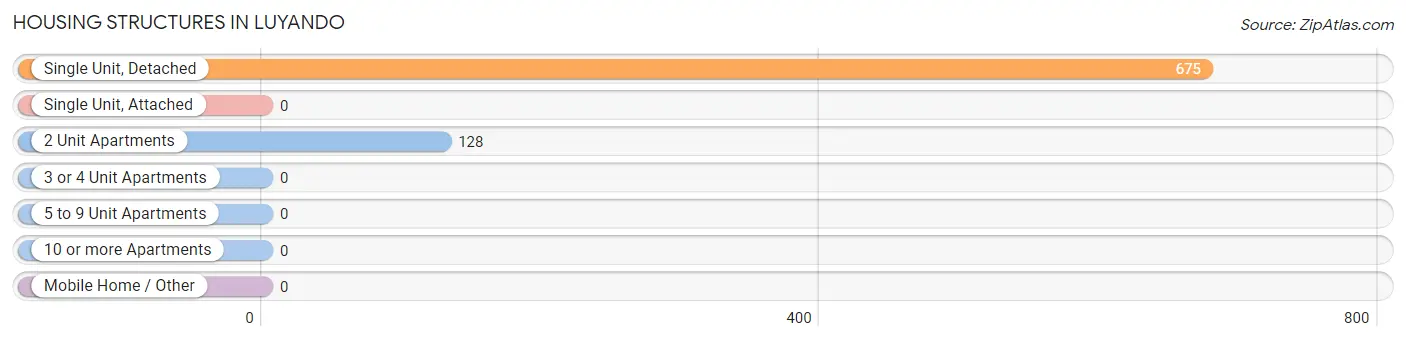
| Structure Type | # Housing Units | % Housing Units |
| Single Unit, Detached | 675 | 84.1% |
| Single Unit, Attached | 0 | 0.0% |
| 2 Unit Apartments | 128 | 15.9% |
| 3 or 4 Unit Apartments | 0 | 0.0% |
| 5 to 9 Unit Apartments | 0 | 0.0% |
| 10 or more Apartments | 0 | 0.0% |
| Mobile Home / Other | 0 | 0.0% |
| Total | 803 | 100.0% |
Housing Structures by Occupancy in Luyando
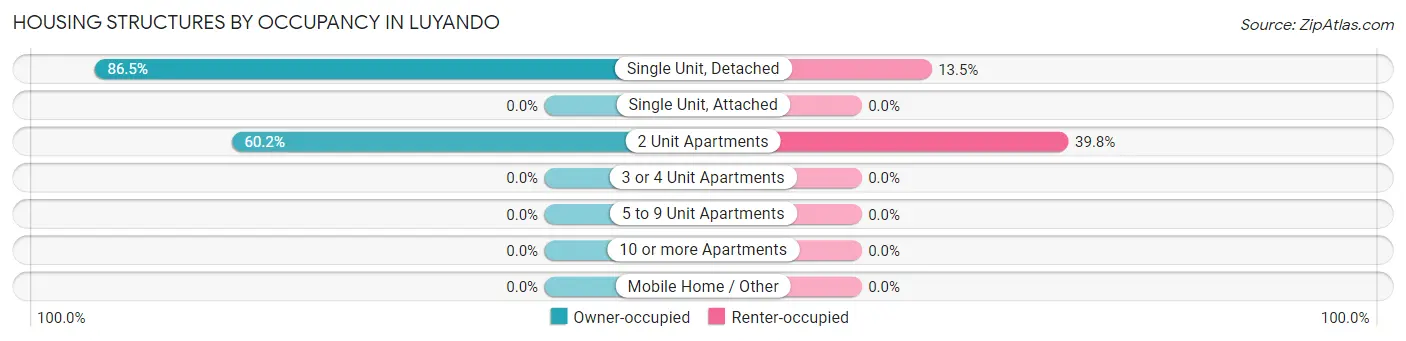
| Structure Type | Owner-occupied | Renter-occupied |
| Single Unit, Detached | 584 (86.5%) | 91 (13.5%) |
| Single Unit, Attached | 0 (0.0%) | 0 (0.0%) |
| 2 Unit Apartments | 77 (60.2%) | 51 (39.8%) |
| 3 or 4 Unit Apartments | 0 (0.0%) | 0 (0.0%) |
| 5 to 9 Unit Apartments | 0 (0.0%) | 0 (0.0%) |
| 10 or more Apartments | 0 (0.0%) | 0 (0.0%) |
| Mobile Home / Other | 0 (0.0%) | 0 (0.0%) |
| Total | 661 (82.3%) | 142 (17.7%) |
Housing Structures by Number of Rooms in Luyando
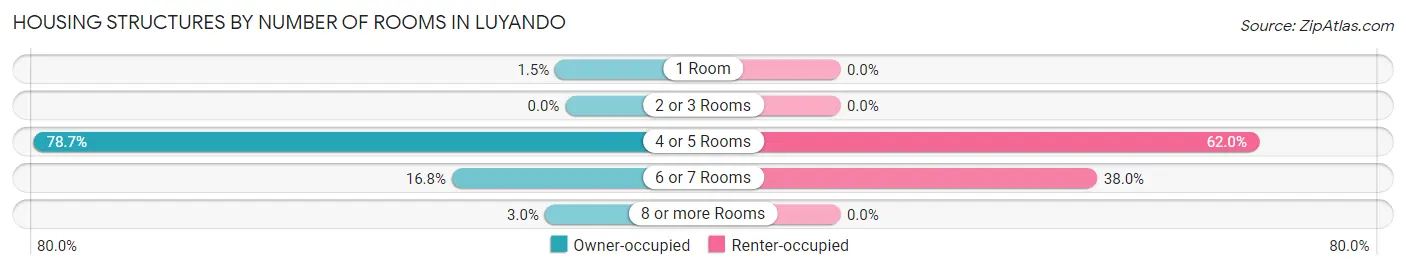
| Number of Rooms | Owner-occupied | Renter-occupied |
| 1 Room | 10 (1.5%) | 0 (0.0%) |
| 2 or 3 Rooms | 0 (0.0%) | 0 (0.0%) |
| 4 or 5 Rooms | 520 (78.7%) | 88 (62.0%) |
| 6 or 7 Rooms | 111 (16.8%) | 54 (38.0%) |
| 8 or more Rooms | 20 (3.0%) | 0 (0.0%) |
| Total | 661 (100.0%) | 142 (100.0%) |
Housing Structure by Heating Type in Luyando
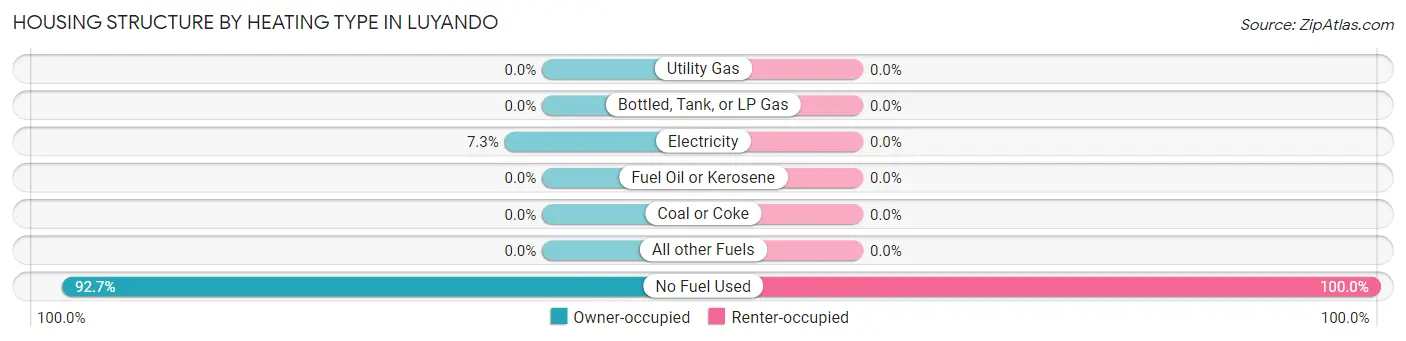
| Heating Type | Owner-occupied | Renter-occupied |
| Utility Gas | 0 (0.0%) | 0 (0.0%) |
| Bottled, Tank, or LP Gas | 0 (0.0%) | 0 (0.0%) |
| Electricity | 48 (7.3%) | 0 (0.0%) |
| Fuel Oil or Kerosene | 0 (0.0%) | 0 (0.0%) |
| Coal or Coke | 0 (0.0%) | 0 (0.0%) |
| All other Fuels | 0 (0.0%) | 0 (0.0%) |
| No Fuel Used | 613 (92.7%) | 142 (100.0%) |
| Total | 661 (100.0%) | 142 (100.0%) |
Household Vehicle Usage in Luyando
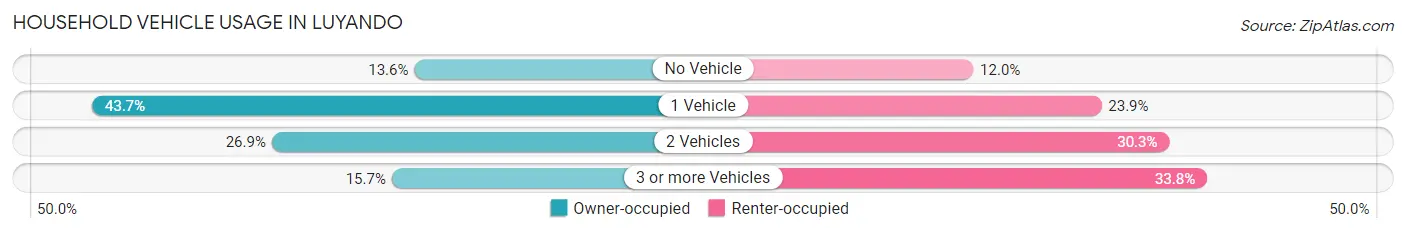
| Vehicles per Household | Owner-occupied | Renter-occupied |
| No Vehicle | 90 (13.6%) | 17 (12.0%) |
| 1 Vehicle | 289 (43.7%) | 34 (23.9%) |
| 2 Vehicles | 178 (26.9%) | 43 (30.3%) |
| 3 or more Vehicles | 104 (15.7%) | 48 (33.8%) |
| Total | 661 (100.0%) | 142 (100.0%) |
Real Estate & Mortgages in Luyando
Real Estate and Mortgage Overview in Luyando
| Characteristic | Without Mortgage | With Mortgage |
| Housing Units | 547 | 114 |
| Median Property Value | $88,200 | $126,200 |
| Median Household Income | $17,468 | $9 |
| Monthly Housing Costs | $136 | $0 |
| Real Estate Taxes | - | - |
Property Value by Mortgage Status in Luyando
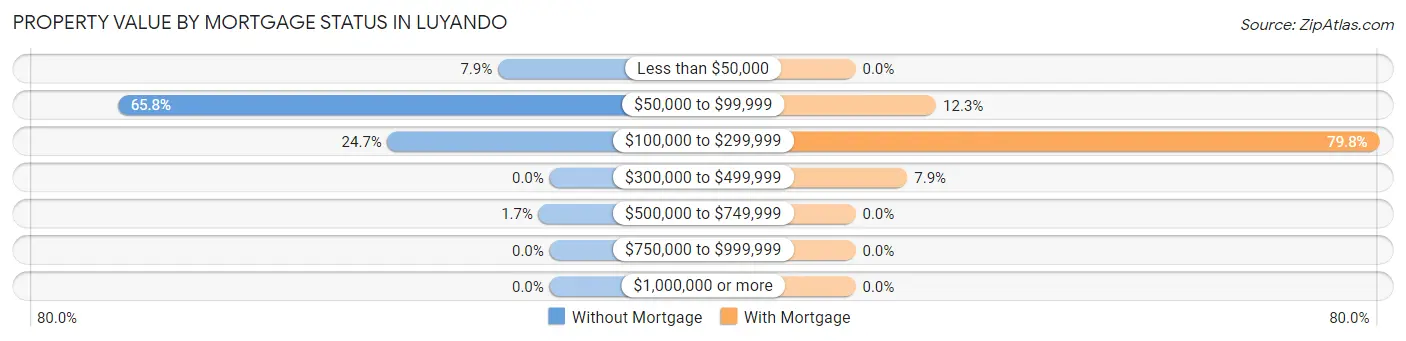
| Property Value | Without Mortgage | With Mortgage |
| Less than $50,000 | 43 (7.9%) | 0 (0.0%) |
| $50,000 to $99,999 | 360 (65.8%) | 14 (12.3%) |
| $100,000 to $299,999 | 135 (24.7%) | 91 (79.8%) |
| $300,000 to $499,999 | 0 (0.0%) | 9 (7.9%) |
| $500,000 to $749,999 | 9 (1.7%) | 0 (0.0%) |
| $750,000 to $999,999 | 0 (0.0%) | 0 (0.0%) |
| $1,000,000 or more | 0 (0.0%) | 0 (0.0%) |
| Total | 547 (100.0%) | 114 (100.0%) |
Household Income by Mortgage Status in Luyando
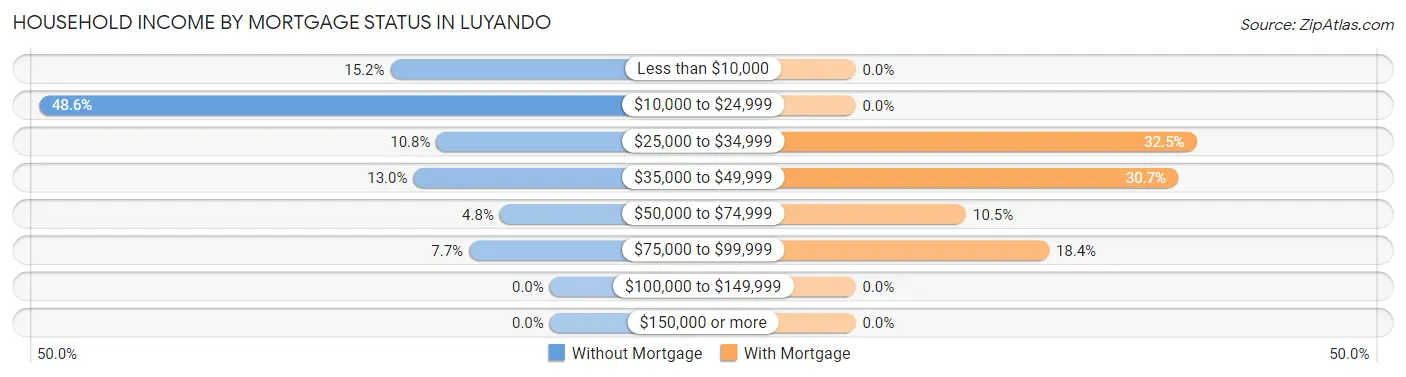
| Household Income | Without Mortgage | With Mortgage |
| Less than $10,000 | 83 (15.2%) | 0 (0.0%) |
| $10,000 to $24,999 | 266 (48.6%) | 0 (0.0%) |
| $25,000 to $34,999 | 59 (10.8%) | 37 (32.5%) |
| $35,000 to $49,999 | 71 (13.0%) | 35 (30.7%) |
| $50,000 to $74,999 | 26 (4.8%) | 12 (10.5%) |
| $75,000 to $99,999 | 42 (7.7%) | 21 (18.4%) |
| $100,000 to $149,999 | 0 (0.0%) | 0 (0.0%) |
| $150,000 or more | 0 (0.0%) | 0 (0.0%) |
| Total | 547 (100.0%) | 114 (100.0%) |
Property Value to Household Income Ratio in Luyando
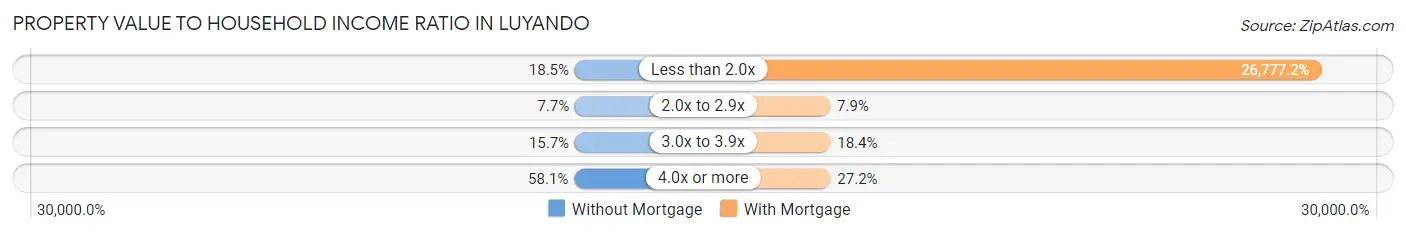
| Value-to-Income Ratio | Without Mortgage | With Mortgage |
| Less than 2.0x | 101 (18.5%) | 30,526 (26,777.2%) |
| 2.0x to 2.9x | 42 (7.7%) | 9 (7.9%) |
| 3.0x to 3.9x | 86 (15.7%) | 21 (18.4%) |
| 4.0x or more | 318 (58.1%) | 31 (27.2%) |
| Total | 547 (100.0%) | 114 (100.0%) |
Real Estate Taxes by Mortgage Status in Luyando
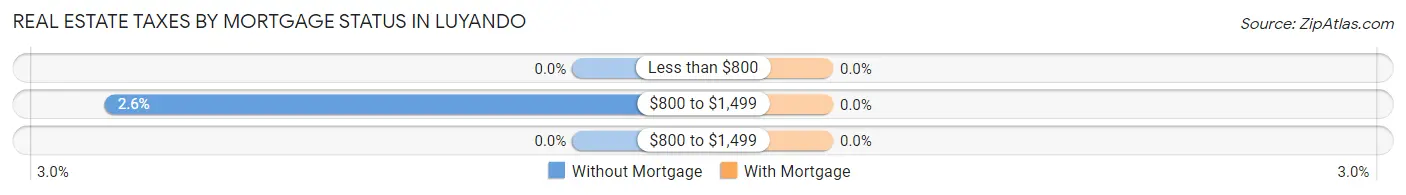
| Property Taxes | Without Mortgage | With Mortgage |
| Less than $800 | 0 (0.0%) | 0 (0.0%) |
| $800 to $1,499 | 14 (2.6%) | 0 (0.0%) |
| $800 to $1,499 | 0 (0.0%) | 0 (0.0%) |
| Total | 547 (100.0%) | 114 (100.0%) |
Health & Disability in Luyando
Health Insurance Coverage by Age in Luyando
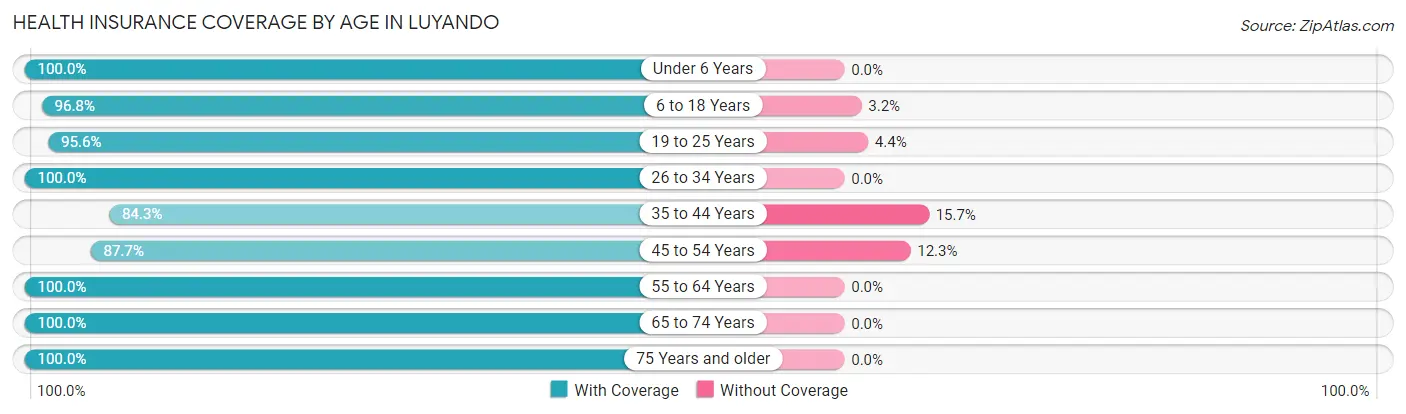
| Age Bracket | With Coverage | Without Coverage |
| Under 6 Years | 56 (100.0%) | 0 (0.0%) |
| 6 to 18 Years | 426 (96.8%) | 14 (3.2%) |
| 19 to 25 Years | 326 (95.6%) | 15 (4.4%) |
| 26 to 34 Years | 240 (100.0%) | 0 (0.0%) |
| 35 to 44 Years | 332 (84.3%) | 62 (15.7%) |
| 45 to 54 Years | 378 (87.7%) | 53 (12.3%) |
| 55 to 64 Years | 201 (100.0%) | 0 (0.0%) |
| 65 to 74 Years | 361 (100.0%) | 0 (0.0%) |
| 75 Years and older | 184 (100.0%) | 0 (0.0%) |
| Total | 2,504 (94.6%) | 144 (5.4%) |
Health Insurance Coverage by Citizenship Status in Luyando
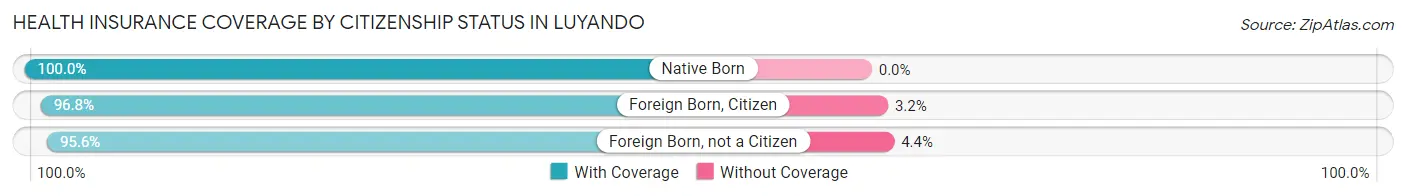
| Citizenship Status | With Coverage | Without Coverage |
| Native Born | 56 (100.0%) | 0 (0.0%) |
| Foreign Born, Citizen | 426 (96.8%) | 14 (3.2%) |
| Foreign Born, not a Citizen | 326 (95.6%) | 15 (4.4%) |
Health Insurance Coverage by Household Income in Luyando
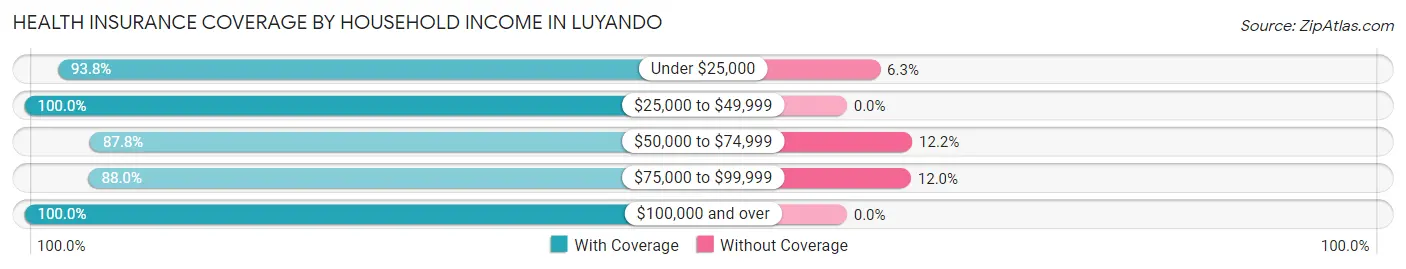
| Household Income | With Coverage | Without Coverage |
| Under $25,000 | 1,231 (93.8%) | 82 (6.2%) |
| $25,000 to $49,999 | 767 (100.0%) | 0 (0.0%) |
| $50,000 to $74,999 | 294 (87.8%) | 41 (12.2%) |
| $75,000 to $99,999 | 154 (88.0%) | 21 (12.0%) |
| $100,000 and over | 58 (100.0%) | 0 (0.0%) |
Public vs Private Health Insurance Coverage by Age in Luyando
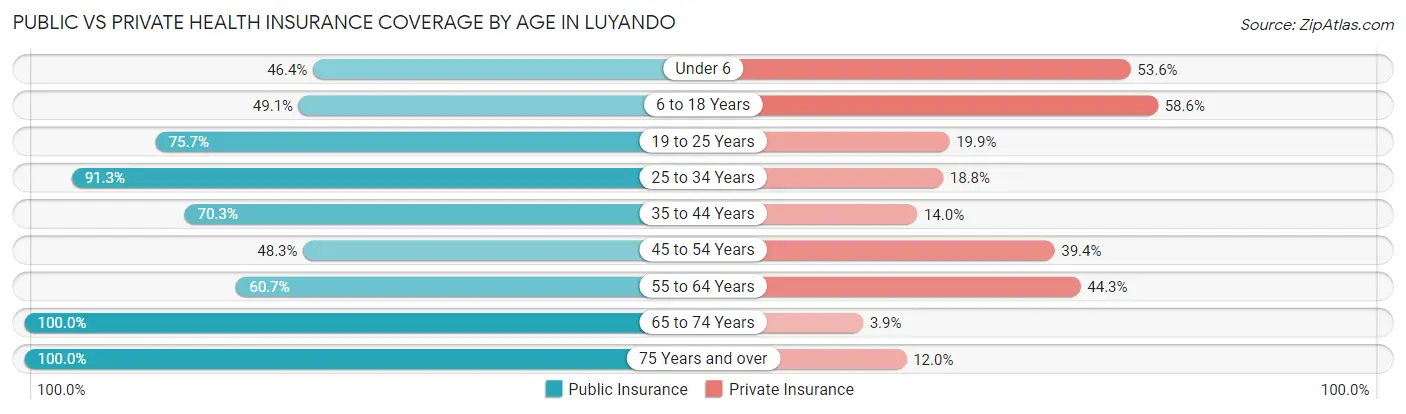
| Age Bracket | Public Insurance | Private Insurance |
| Under 6 | 26 (46.4%) | 30 (53.6%) |
| 6 to 18 Years | 216 (49.1%) | 258 (58.6%) |
| 19 to 25 Years | 258 (75.7%) | 68 (19.9%) |
| 25 to 34 Years | 219 (91.2%) | 45 (18.8%) |
| 35 to 44 Years | 277 (70.3%) | 55 (14.0%) |
| 45 to 54 Years | 208 (48.3%) | 170 (39.4%) |
| 55 to 64 Years | 122 (60.7%) | 89 (44.3%) |
| 65 to 74 Years | 361 (100.0%) | 14 (3.9%) |
| 75 Years and over | 184 (100.0%) | 22 (12.0%) |
| Total | 1,871 (70.7%) | 751 (28.4%) |
Disability Status by Sex by Age in Luyando
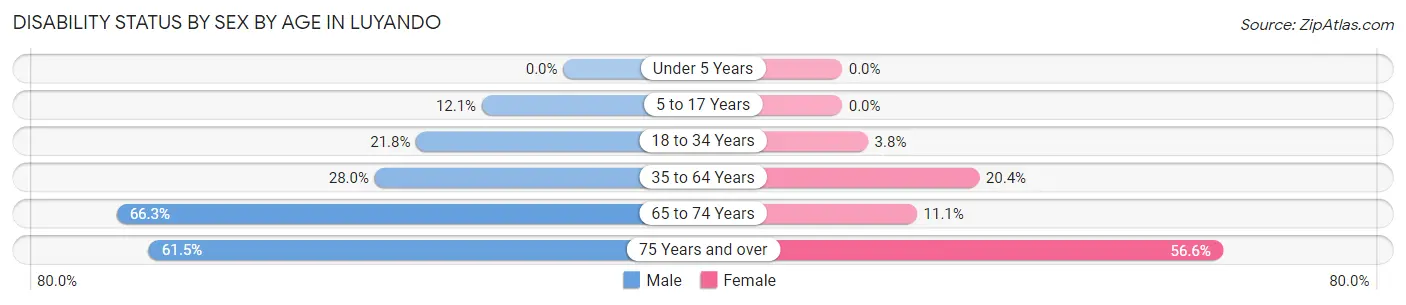
| Age Bracket | Male | Female |
| Under 5 Years | 0 (0.0%) | 0 (0.0%) |
| 5 to 17 Years | 26 (12.1%) | 0 (0.0%) |
| 18 to 34 Years | 45 (21.8%) | 15 (3.8%) |
| 35 to 64 Years | 147 (28.0%) | 102 (20.4%) |
| 65 to 74 Years | 126 (66.3%) | 19 (11.1%) |
| 75 Years and over | 24 (61.5%) | 82 (56.6%) |
Disability Class by Sex by Age in Luyando
Disability Class: Hearing Difficulty
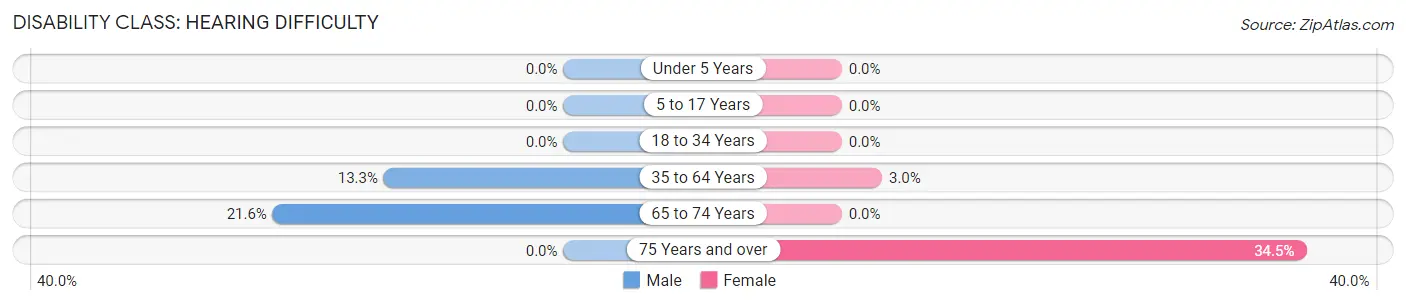
| Age Bracket | Male | Female |
| Under 5 Years | 0 (0.0%) | 0 (0.0%) |
| 5 to 17 Years | 0 (0.0%) | 0 (0.0%) |
| 18 to 34 Years | 0 (0.0%) | 0 (0.0%) |
| 35 to 64 Years | 70 (13.3%) | 15 (3.0%) |
| 65 to 74 Years | 41 (21.6%) | 0 (0.0%) |
| 75 Years and over | 0 (0.0%) | 50 (34.5%) |
Disability Class: Vision Difficulty
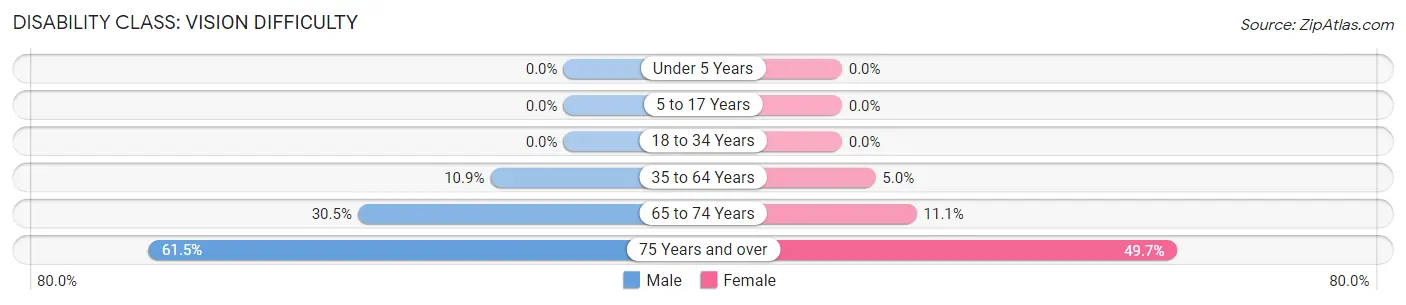
| Age Bracket | Male | Female |
| Under 5 Years | 0 (0.0%) | 0 (0.0%) |
| 5 to 17 Years | 0 (0.0%) | 0 (0.0%) |
| 18 to 34 Years | 0 (0.0%) | 0 (0.0%) |
| 35 to 64 Years | 57 (10.9%) | 25 (5.0%) |
| 65 to 74 Years | 58 (30.5%) | 19 (11.1%) |
| 75 Years and over | 24 (61.5%) | 72 (49.7%) |
Disability Class: Cognitive Difficulty
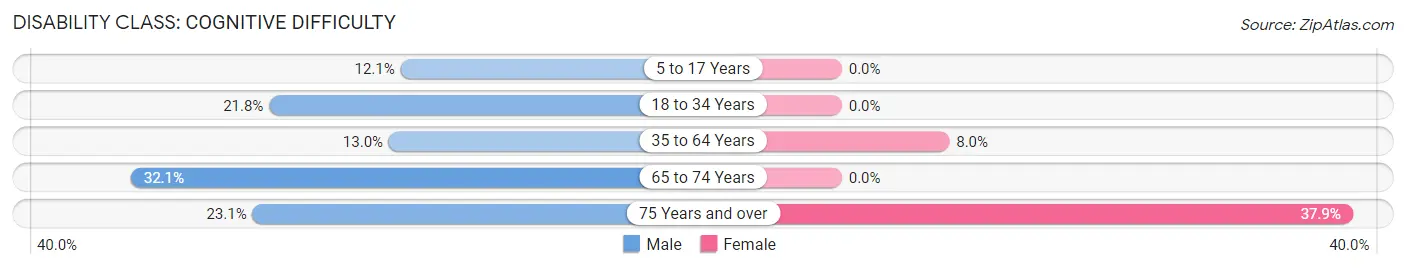
| Age Bracket | Male | Female |
| 5 to 17 Years | 26 (12.1%) | 0 (0.0%) |
| 18 to 34 Years | 45 (21.8%) | 0 (0.0%) |
| 35 to 64 Years | 68 (13.0%) | 40 (8.0%) |
| 65 to 74 Years | 61 (32.1%) | 0 (0.0%) |
| 75 Years and over | 9 (23.1%) | 55 (37.9%) |
Disability Class: Ambulatory Difficulty
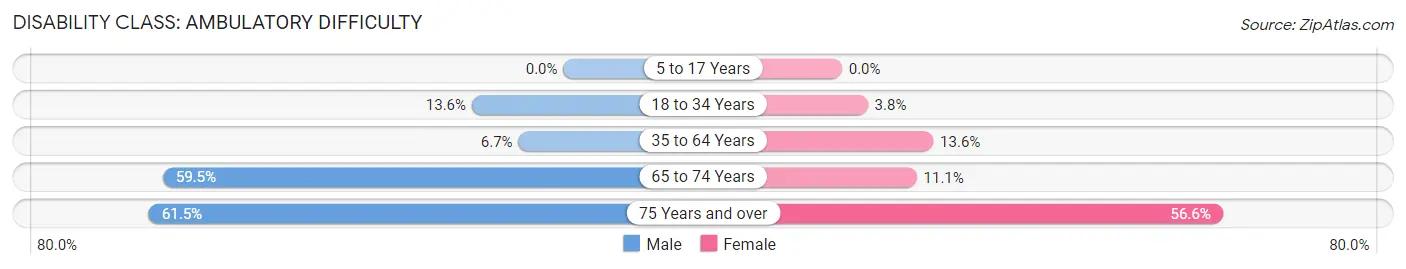
| Age Bracket | Male | Female |
| 5 to 17 Years | 0 (0.0%) | 0 (0.0%) |
| 18 to 34 Years | 28 (13.6%) | 15 (3.8%) |
| 35 to 64 Years | 35 (6.7%) | 68 (13.6%) |
| 65 to 74 Years | 113 (59.5%) | 19 (11.1%) |
| 75 Years and over | 24 (61.5%) | 82 (56.6%) |
Disability Class: Self-Care Difficulty
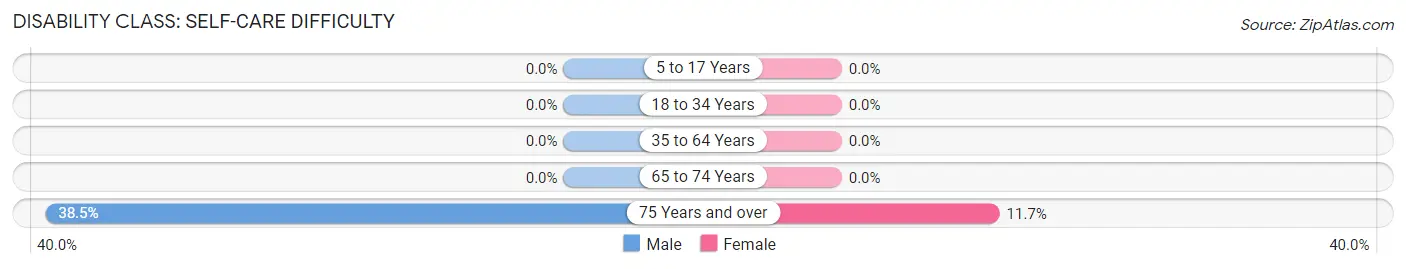
| Age Bracket | Male | Female |
| 5 to 17 Years | 0 (0.0%) | 0 (0.0%) |
| 18 to 34 Years | 0 (0.0%) | 0 (0.0%) |
| 35 to 64 Years | 0 (0.0%) | 0 (0.0%) |
| 65 to 74 Years | 0 (0.0%) | 0 (0.0%) |
| 75 Years and over | 15 (38.5%) | 17 (11.7%) |
Technology Access in Luyando
Computing Device Access in Luyando
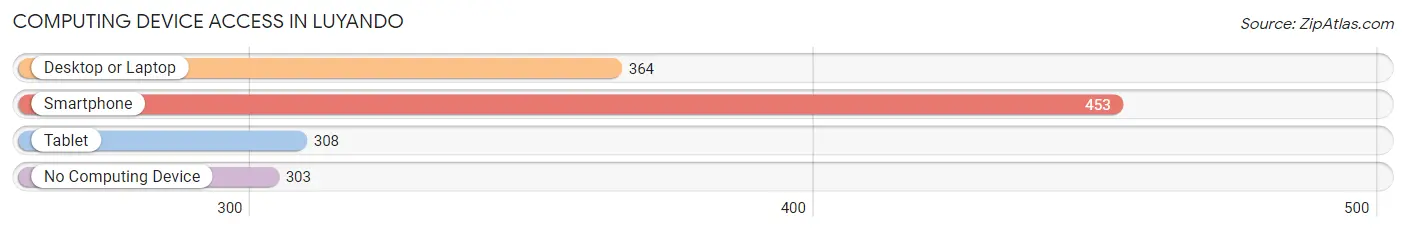
| Device Type | # Households | % Households |
| Desktop or Laptop | 364 | 45.3% |
| Smartphone | 453 | 56.4% |
| Tablet | 308 | 38.4% |
| No Computing Device | 303 | 37.7% |
| Total | 803 | 100.0% |
Internet Access in Luyando
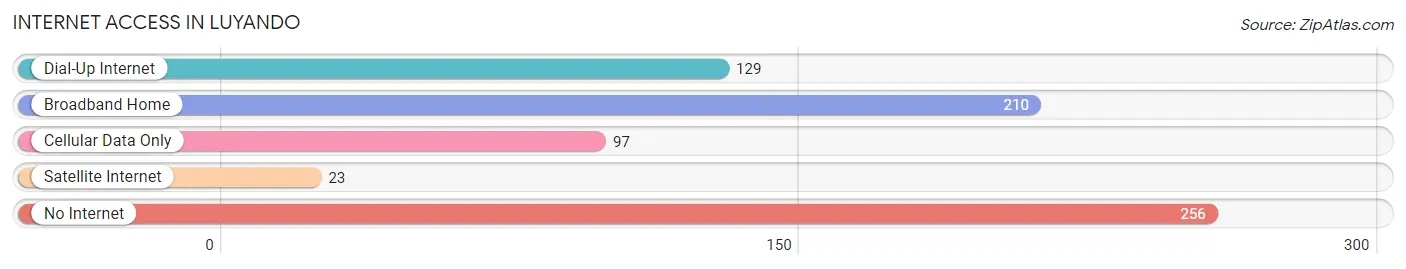
| Internet Type | # Households | % Households |
| Dial-Up Internet | 129 | 16.1% |
| Broadband Home | 210 | 26.2% |
| Cellular Data Only | 97 | 12.1% |
| Satellite Internet | 23 | 2.9% |
| No Internet | 256 | 31.9% |
| Total | 803 | 100.0% |
Luyando Summary
Luyando is a small town located in the province of Córdoba, Argentina. It is situated in the foothills of the Sierras de Córdoba, about 25 kilometers from the provincial capital. The town has a population of approximately 2,000 people and is known for its agricultural production, particularly of olives and olive oil.
History
Luyando was founded in the late 19th century by a group of Italian immigrants who were looking for a place to settle and start a new life. The town was named after the Luyando River, which runs through the area. The first settlers were mainly farmers and ranchers, and the town quickly grew to become an important agricultural center.
In the early 20th century, Luyando was a thriving community with a population of over 5,000 people. The town was home to several factories, including a tannery, a brick factory, and a flour mill. The town also had a railway station, which connected it to the provincial capital and other nearby towns.
In the mid-20th century, the population of Luyando began to decline as people moved away to larger cities in search of better economic opportunities. By the late 20th century, the population had dropped to around 2,000 people.
Geography
Luyando is located in the foothills of the Sierras de Córdoba, about 25 kilometers from the provincial capital. The town is situated in a valley surrounded by hills and mountains. The climate is temperate, with hot summers and cold winters.
The town is crossed by the Luyando River, which is a tributary of the Suquía River. The river is used for irrigation and provides water for the town’s agricultural production.
Economy
Luyando’s economy is mainly based on agriculture. The town is known for its production of olives and olive oil, which are exported to other parts of Argentina and abroad. Other crops grown in the area include wheat, corn, and potatoes.
The town also has a small manufacturing sector, which produces furniture, leather goods, and other items. There are also several small businesses in the town, including restaurants, shops, and hotels.
Demographics
As of 2020, the population of Luyando is estimated to be around 2,000 people. The majority of the population is of Italian descent, with a small percentage of Spanish and other European immigrants. The town also has a small indigenous population.
The town’s population is mostly Roman Catholic, with a small percentage of other Christian denominations. The town also has a small Jewish community.
Conclusion
Luyando is a small town located in the province of Córdoba, Argentina. It is situated in the foothills of the Sierras de Córdoba, about 25 kilometers from the provincial capital. The town has a population of approximately 2,000 people and is known for its agricultural production, particularly of olives and olive oil. The town’s economy is mainly based on agriculture, with a small manufacturing sector and several small businesses. The majority of the population is of Italian descent, with a small percentage of Spanish and other European immigrants. The town also has a small indigenous population and a small Jewish community.
Common Questions
What is Per Capita Income in Luyando?
Per Capita income in Luyando is $10,005.
What is the Median Family Income in Luyando?
Median Family Income in Luyando is $25,395.
What is the Median Household income in Luyando?
Median Household Income in Luyando is $20,423.
What is Income or Wage Gap in Luyando?
Income or Wage Gap in Luyando is 32.1%.
Women in Luyando earn 67.9 cents for every dollar earned by a man.
What is Family Income Deficit in Luyando?
Family Income Deficit in Luyando is $7,344.
Families that are below poverty line in Luyando earn $7,344 less on average than the poverty threshold level.
What is Inequality or Gini Index in Luyando?
Inequality or Gini Index in Luyando is 0.44.
What is the Total Population of Luyando?
Total Population of Luyando is 2,658.
What is the Total Male Population of Luyando?
Total Male Population of Luyando is 1,185.
What is the Total Female Population of Luyando?
Total Female Population of Luyando is 1,473.
What is the Ratio of Males per 100 Females in Luyando?
There are 80.45 Males per 100 Females in Luyando.
What is the Ratio of Females per 100 Males in Luyando?
There are 124.30 Females per 100 Males in Luyando.
What is the Median Population Age in Luyando?
Median Population Age in Luyando is 42.4 Years.
What is the Average Family Size in Luyando
Average Family Size in Luyando is 4.2 People.
What is the Average Household Size in Luyando
Average Household Size in Luyando is 3.3 People.
How Large is the Labor Force in Luyando?
There are 782 People in the Labor Forcein in Luyando.
What is the Percentage of People in the Labor Force in Luyando?
34.9% of People are in the Labor Force in Luyando.
What is the Unemployment Rate in Luyando?
Unemployment Rate in Luyando is 6.5%.