Killeen, TX Map & Demographics
Killeen Map
Killeen Overview
$28,002
PER CAPITA INCOME
$65,669
AVG FAMILY INCOME
$57,086
AVG HOUSEHOLD INCOME
27.0%
WAGE / INCOME GAP [ % ]
73.0¢/ $1
WAGE / INCOME GAP [ $ ]
$12,477
FAMILY INCOME DEFICIT
0.42
INEQUALITY / GINI INDEX
153,708
TOTAL POPULATION
76,288
MALE POPULATION
77,420
FEMALE POPULATION
98.54
MALES / 100 FEMALES
101.48
FEMALES / 100 MALES
29.7
MEDIAN AGE
3.3
AVG FAMILY SIZE
2.7
AVG HOUSEHOLD SIZE
77,648
LABOR FORCE [ PEOPLE ]
68.5%
PERCENT IN LABOR FORCE
10.9%
UNEMPLOYMENT RATE
Killeen Area Codes
Income in Killeen
Income Overview in Killeen
Per Capita Income in Killeen is $28,002, while median incomes of families and households are $65,669 and $57,086 respectively.
| Characteristic | Number | Measure |
| Per Capita Income | 153,708 | $28,002 |
| Median Family Income | 37,536 | $65,669 |
| Mean Family Income | 37,536 | $80,428 |
| Median Household Income | 57,570 | $57,086 |
| Mean Household Income | 57,570 | $71,359 |
| Income Deficit | 37,536 | $12,477 |
| Wage / Income Gap (%) | 153,708 | 27.04% |
| Wage / Income Gap ($) | 153,708 | 72.96¢ per $1 |
| Gini / Inequality Index | 153,708 | 0.42 |
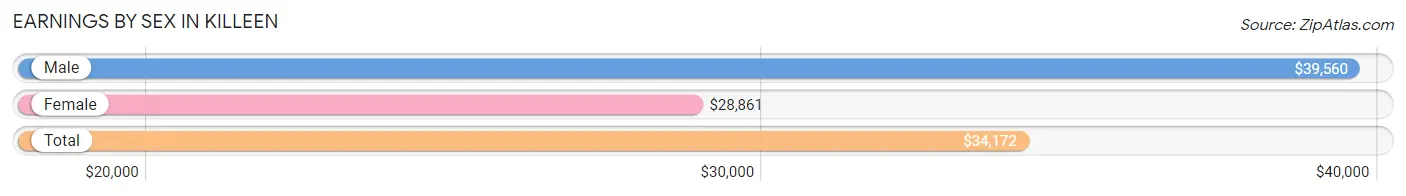
Earnings by Sex in Killeen
Average Earnings in Killeen are $34,172, $39,560 for men and $28,861 for women, a difference of 27.0%.
| Sex | Number | Average Earnings |
| Male | 40,458 (51.2%) | $39,560 |
| Female | 38,520 (48.8%) | $28,861 |
| Total | 78,978 (100.0%) | $34,172 |
Earnings by Sex by Income Bracket in Killeen
The most common earnings brackets in Killeen are $55,000 to $64,999 for men (3,863 | 9.6%) and $25,000 to $29,999 for women (3,010 | 7.8%).
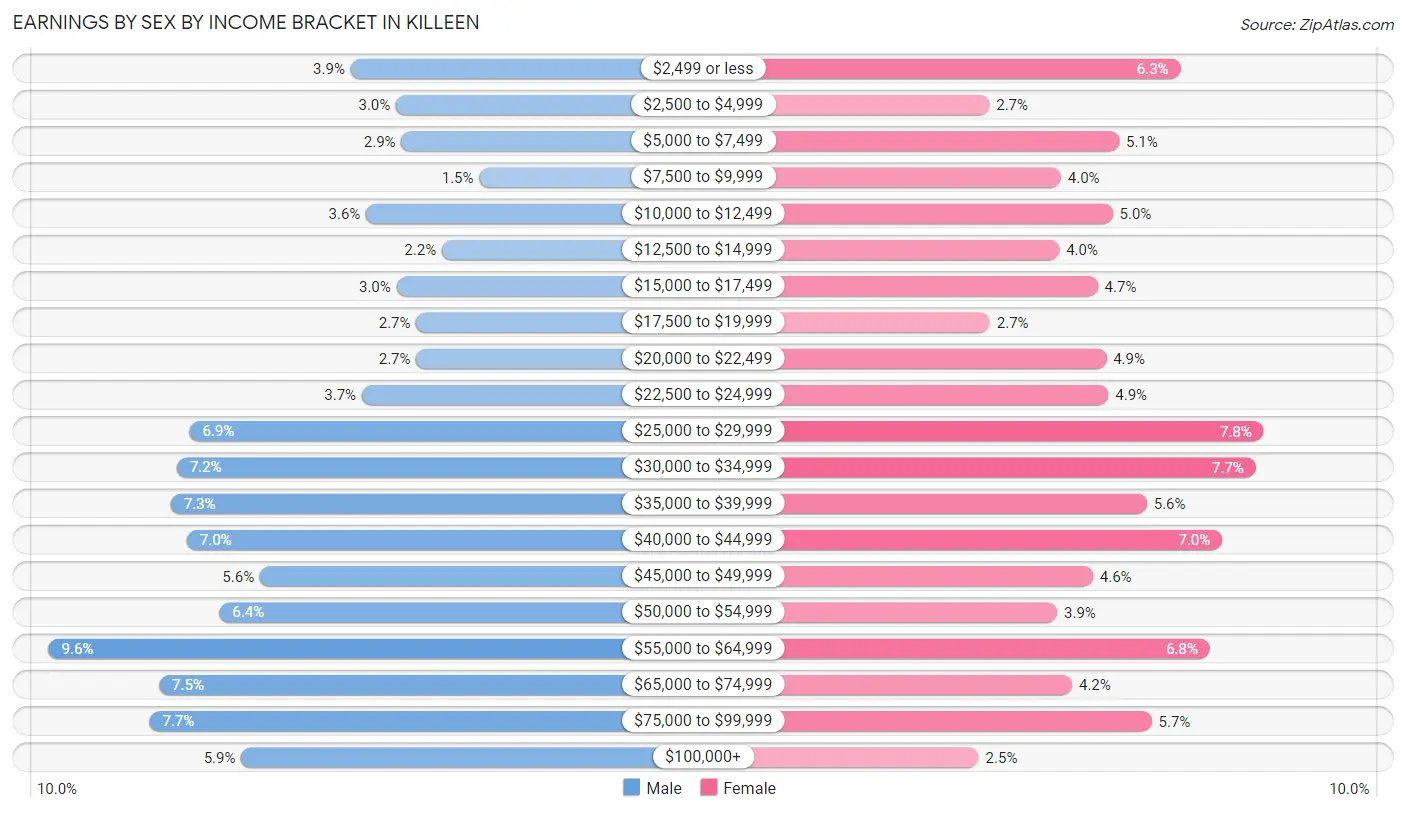
| Income | Male | Female |
| $2,499 or less | 1,572 (3.9%) | 2,408 (6.2%) |
| $2,500 to $4,999 | 1,228 (3.0%) | 1,028 (2.7%) |
| $5,000 to $7,499 | 1,191 (2.9%) | 1,963 (5.1%) |
| $7,500 to $9,999 | 599 (1.5%) | 1,544 (4.0%) |
| $10,000 to $12,499 | 1,457 (3.6%) | 1,918 (5.0%) |
| $12,500 to $14,999 | 882 (2.2%) | 1,532 (4.0%) |
| $15,000 to $17,499 | 1,227 (3.0%) | 1,809 (4.7%) |
| $17,500 to $19,999 | 1,075 (2.7%) | 1,032 (2.7%) |
| $20,000 to $22,499 | 1,076 (2.7%) | 1,873 (4.9%) |
| $22,500 to $24,999 | 1,487 (3.7%) | 1,889 (4.9%) |
| $25,000 to $29,999 | 2,796 (6.9%) | 3,010 (7.8%) |
| $30,000 to $34,999 | 2,891 (7.1%) | 2,951 (7.7%) |
| $35,000 to $39,999 | 2,938 (7.3%) | 2,166 (5.6%) |
| $40,000 to $44,999 | 2,817 (7.0%) | 2,708 (7.0%) |
| $45,000 to $49,999 | 2,262 (5.6%) | 1,774 (4.6%) |
| $50,000 to $54,999 | 2,569 (6.4%) | 1,518 (3.9%) |
| $55,000 to $64,999 | 3,863 (9.6%) | 2,619 (6.8%) |
| $65,000 to $74,999 | 3,025 (7.5%) | 1,626 (4.2%) |
| $75,000 to $99,999 | 3,100 (7.7%) | 2,200 (5.7%) |
| $100,000+ | 2,403 (5.9%) | 952 (2.5%) |
| Total | 40,458 (100.0%) | 38,520 (100.0%) |
Earnings by Sex by Educational Attainment in Killeen
Average earnings in Killeen are $44,596 for men and $33,171 for women, a difference of 25.6%. Men with an educational attainment of graduate degree enjoy the highest average annual earnings of $67,424, while those with less than high school education earn the least with $28,484. Women with an educational attainment of graduate degree earn the most with the average annual earnings of $57,400, while those with less than high school education have the smallest earnings of $22,550.
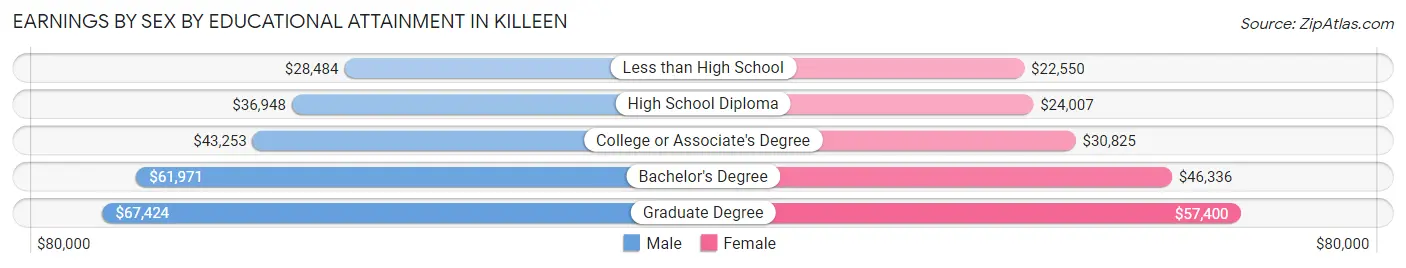
| Educational Attainment | Male Income | Female Income |
| Less than High School | $28,484 | $22,550 |
| High School Diploma | $36,948 | $24,007 |
| College or Associate's Degree | $43,253 | $30,825 |
| Bachelor's Degree | $61,971 | $46,336 |
| Graduate Degree | $67,424 | $57,400 |
| Total | $44,596 | $33,171 |
Family Income in Killeen
Family Income Brackets in Killeen
According to the Killeen family income data, there are 7,995 families falling into the $50,000 to $74,999 income range, which is the most common income bracket and makes up 21.3% of all families. Conversely, the $10,000 to $14,999 income bracket is the least frequent group with only 1,164 families (3.1%) belonging to this category.
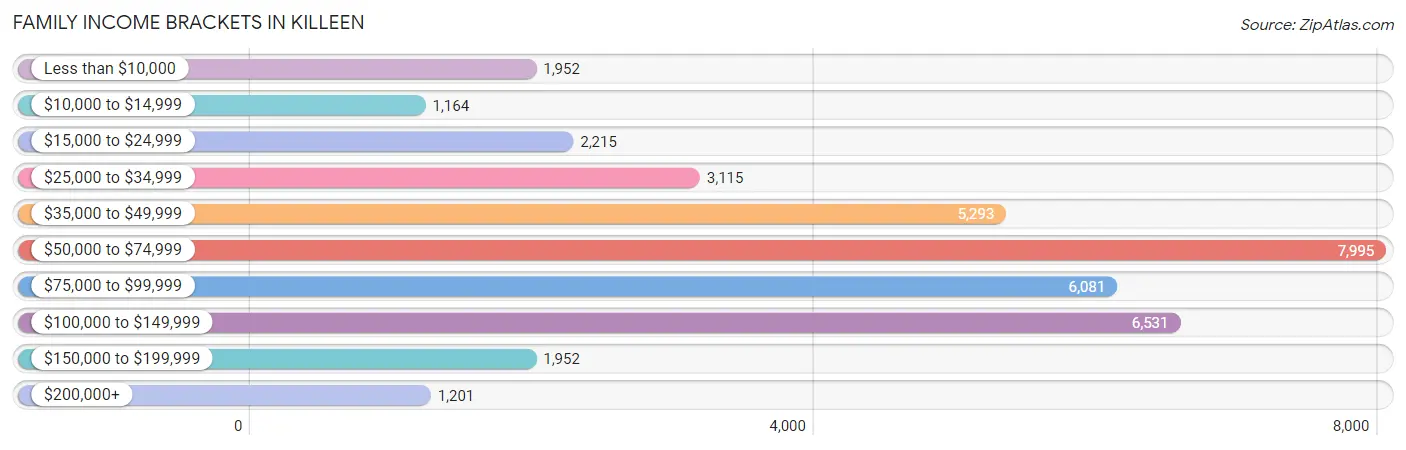
| Income Bracket | # Families | % Families |
| Less than $10,000 | 1,952 | 5.2% |
| $10,000 to $14,999 | 1,164 | 3.1% |
| $15,000 to $24,999 | 2,215 | 5.9% |
| $25,000 to $34,999 | 3,115 | 8.3% |
| $35,000 to $49,999 | 5,293 | 14.1% |
| $50,000 to $74,999 | 7,995 | 21.3% |
| $75,000 to $99,999 | 6,081 | 16.2% |
| $100,000 to $149,999 | 6,531 | 17.4% |
| $150,000 to $199,999 | 1,952 | 5.2% |
| $200,000+ | 1,201 | 3.2% |
Family Income by Famaliy Size in Killeen
6-person families (1,446 | 3.8%) account for the highest median family income in Killeen with $83,325 per family, while 2-person families (15,797 | 42.1%) have the highest median income of $30,656 per family member.
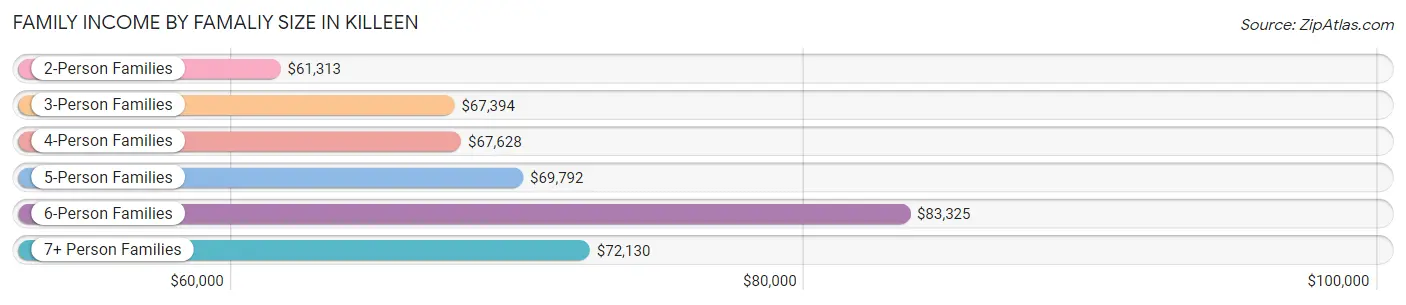
| Income Bracket | # Families | Median Income |
| 2-Person Families | 15,797 (42.1%) | $61,313 |
| 3-Person Families | 9,657 (25.7%) | $67,394 |
| 4-Person Families | 6,746 (18.0%) | $67,628 |
| 5-Person Families | 3,294 (8.8%) | $69,792 |
| 6-Person Families | 1,446 (3.8%) | $83,325 |
| 7+ Person Families | 596 (1.6%) | $72,130 |
| Total | 37,536 (100.0%) | $65,669 |
Family Income by Number of Earners in Killeen
The median family income in Killeen is $65,669, with families comprising 3+ earners (2,686) having the highest median family income of $135,308, while families with no earners (4,246) have the lowest median family income of $36,607, accounting for 7.2% and 11.3% of families, respectively.
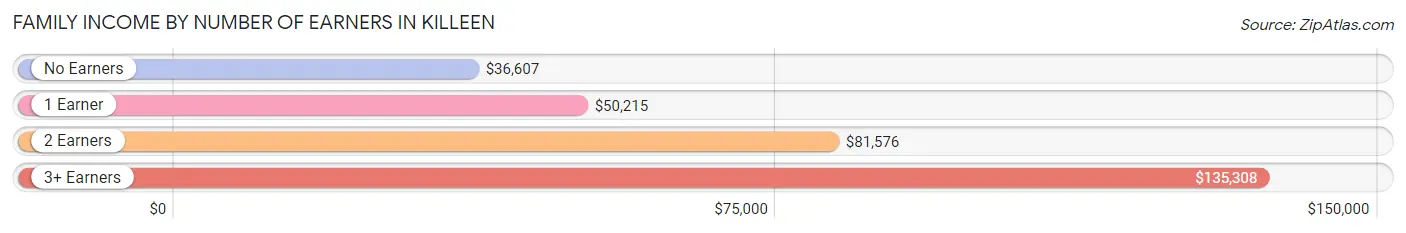
| Number of Earners | # Families | Median Income |
| No Earners | 4,246 (11.3%) | $36,607 |
| 1 Earner | 14,968 (39.9%) | $50,215 |
| 2 Earners | 15,636 (41.7%) | $81,576 |
| 3+ Earners | 2,686 (7.2%) | $135,308 |
| Total | 37,536 (100.0%) | $65,669 |
Household Income in Killeen
Household Income Brackets in Killeen
With 12,435 households falling in the category, the $50,000 to $74,999 income range is the most frequent in Killeen, accounting for 21.6% of all households. In contrast, only 1,439 households (2.5%) fall into the $200,000+ income bracket, making it the least populous group.
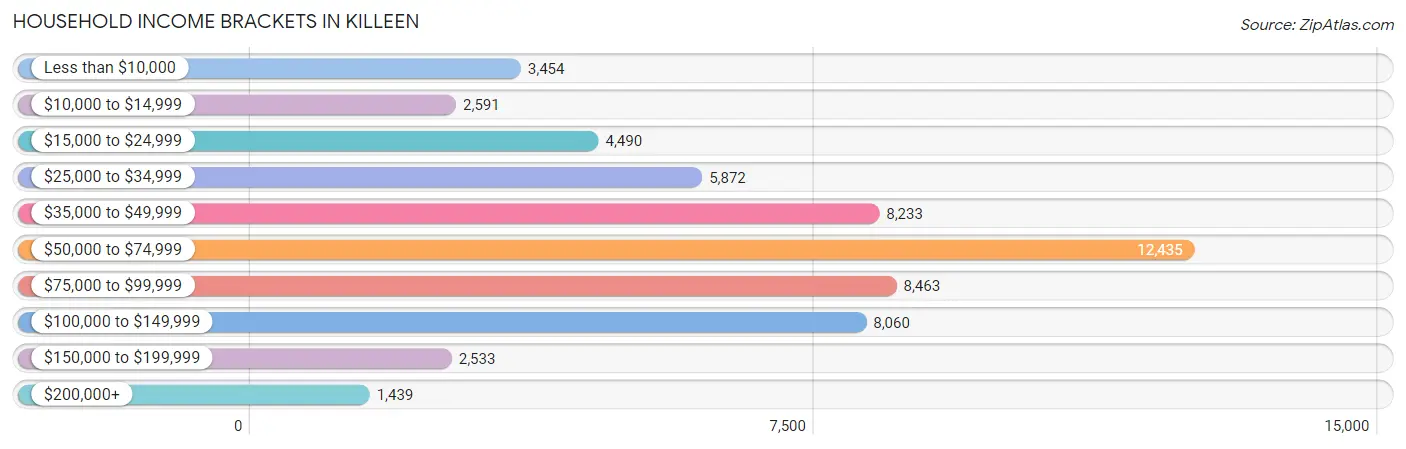
| Income Bracket | # Households | % Households |
| Less than $10,000 | 3,454 | 6.0% |
| $10,000 to $14,999 | 2,591 | 4.5% |
| $15,000 to $24,999 | 4,490 | 7.8% |
| $25,000 to $34,999 | 5,872 | 10.2% |
| $35,000 to $49,999 | 8,233 | 14.3% |
| $50,000 to $74,999 | 12,435 | 21.6% |
| $75,000 to $99,999 | 8,463 | 14.7% |
| $100,000 to $149,999 | 8,060 | 14.0% |
| $150,000 to $199,999 | 2,533 | 4.4% |
| $200,000+ | 1,439 | 2.5% |
Household Income by Householder Age in Killeen
The median household income in Killeen is $57,086, with the highest median household income of $70,628 found in the 45 to 64 years age bracket for the primary householder. A total of 17,274 households (30.0%) fall into this category. Meanwhile, the 65+ years age bracket for the primary householder has the lowest median household income of $44,124, with 7,002 households (12.2%) in this group.
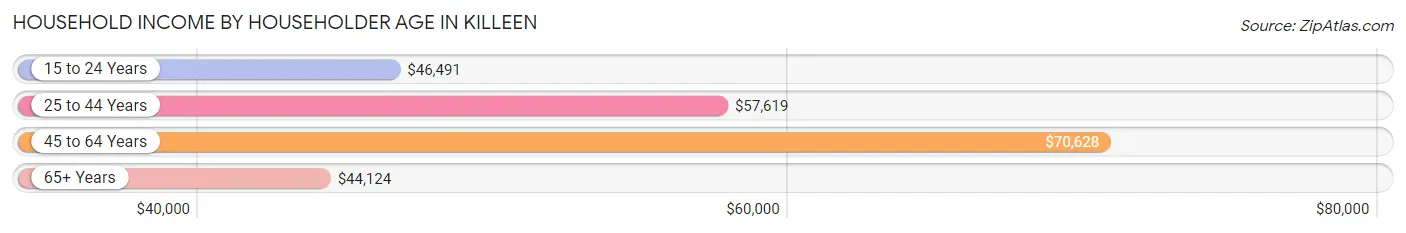
| Income Bracket | # Households | Median Income |
| 15 to 24 Years | 5,139 (8.9%) | $46,491 |
| 25 to 44 Years | 28,155 (48.9%) | $57,619 |
| 45 to 64 Years | 17,274 (30.0%) | $70,628 |
| 65+ Years | 7,002 (12.2%) | $44,124 |
| Total | 57,570 (100.0%) | $57,086 |
Poverty in Killeen
Income Below Poverty by Sex and Age in Killeen
With 14.0% poverty level for males and 18.0% for females among the residents of Killeen, 15 year old males and 6 to 11 year old females are the most vulnerable to poverty, with 349 males (30.2%) and 1,662 females (26.7%) in their respective age groups living below the poverty level.
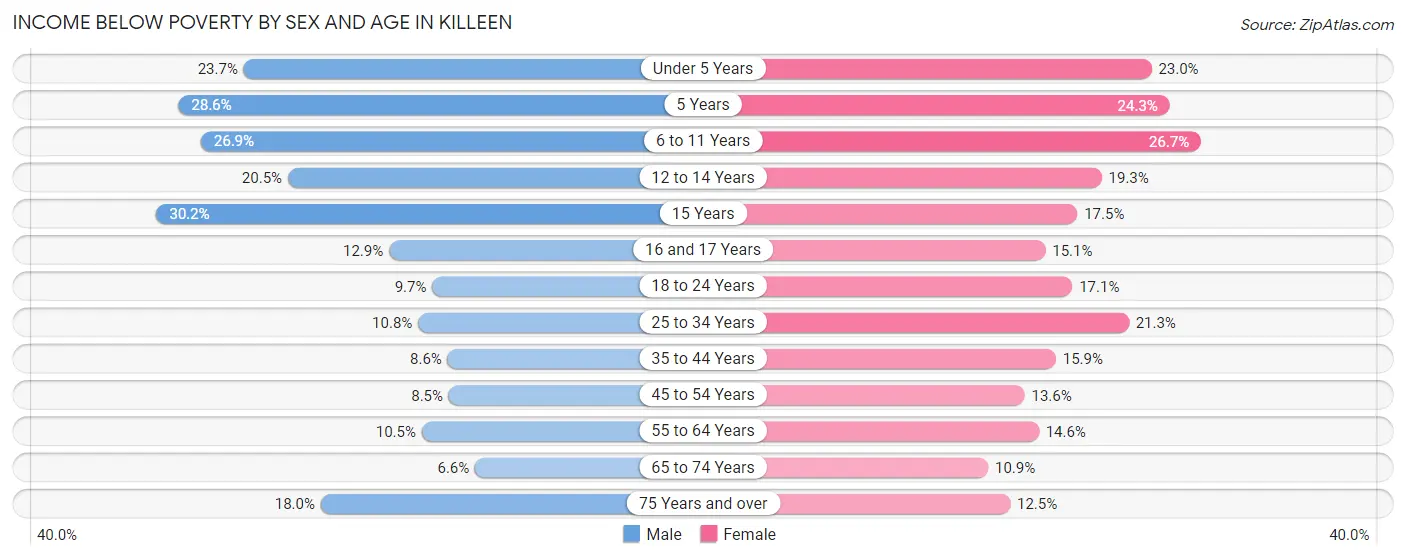
| Age Bracket | Male | Female |
| Under 5 Years | 1,714 (23.7%) | 1,647 (23.0%) |
| 5 Years | 427 (28.6%) | 231 (24.3%) |
| 6 to 11 Years | 1,848 (26.9%) | 1,662 (26.7%) |
| 12 to 14 Years | 860 (20.4%) | 697 (19.3%) |
| 15 Years | 349 (30.2%) | 161 (17.5%) |
| 16 and 17 Years | 280 (12.9%) | 350 (15.1%) |
| 18 to 24 Years | 889 (9.7%) | 1,404 (17.1%) |
| 25 to 34 Years | 1,595 (10.8%) | 3,047 (21.3%) |
| 35 to 44 Years | 869 (8.6%) | 1,740 (15.9%) |
| 45 to 54 Years | 644 (8.5%) | 1,194 (13.6%) |
| 55 to 64 Years | 659 (10.5%) | 1,061 (14.6%) |
| 65 to 74 Years | 226 (6.6%) | 462 (10.9%) |
| 75 Years and over | 248 (18.0%) | 289 (12.5%) |
| Total | 10,608 (14.0%) | 13,945 (18.0%) |
Income Above Poverty by Sex and Age in Killeen
According to the poverty statistics in Killeen, males aged 65 to 74 years and females aged 65 to 74 years are the age groups that are most secure financially, with 93.4% of males and 89.1% of females in these age groups living above the poverty line.
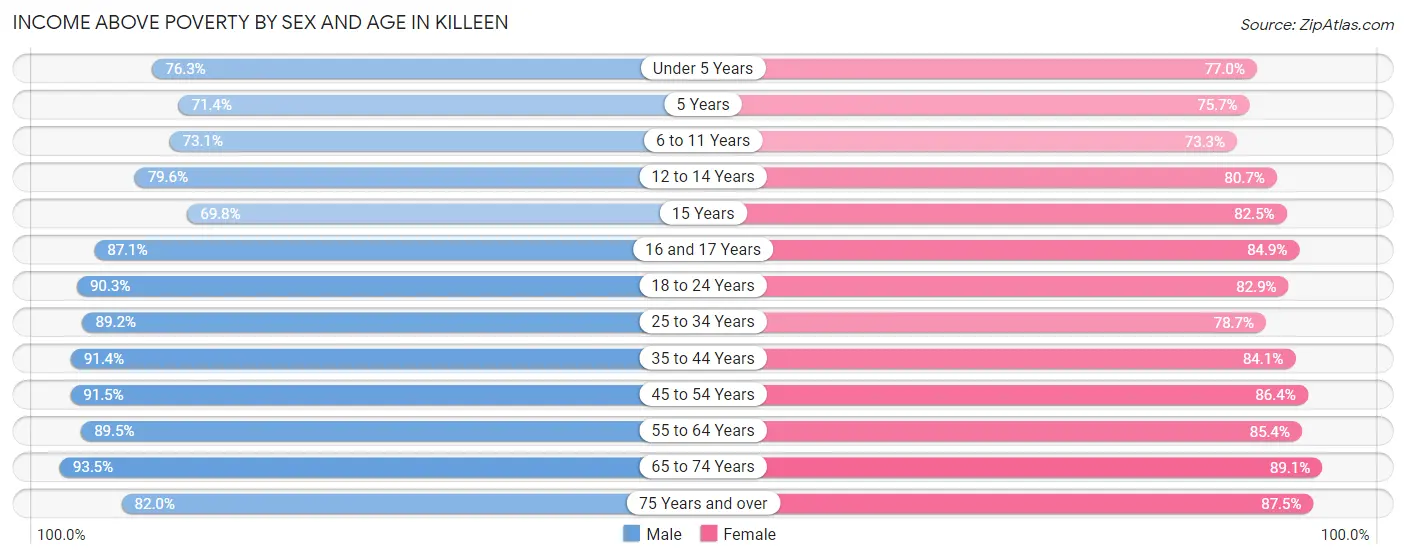
| Age Bracket | Male | Female |
| Under 5 Years | 5,508 (76.3%) | 5,518 (77.0%) |
| 5 Years | 1,067 (71.4%) | 718 (75.7%) |
| 6 to 11 Years | 5,019 (73.1%) | 4,567 (73.3%) |
| 12 to 14 Years | 3,345 (79.5%) | 2,917 (80.7%) |
| 15 Years | 806 (69.8%) | 760 (82.5%) |
| 16 and 17 Years | 1,883 (87.1%) | 1,966 (84.9%) |
| 18 to 24 Years | 8,246 (90.3%) | 6,803 (82.9%) |
| 25 to 34 Years | 13,198 (89.2%) | 11,255 (78.7%) |
| 35 to 44 Years | 9,242 (91.4%) | 9,208 (84.1%) |
| 45 to 54 Years | 6,933 (91.5%) | 7,603 (86.4%) |
| 55 to 64 Years | 5,610 (89.5%) | 6,198 (85.4%) |
| 65 to 74 Years | 3,223 (93.4%) | 3,792 (89.1%) |
| 75 Years and over | 1,129 (82.0%) | 2,024 (87.5%) |
| Total | 65,209 (86.0%) | 63,329 (82.0%) |
Income Below Poverty Among Married-Couple Families in Killeen
The poverty statistics for married-couple families in Killeen show that 7.0% or 1,681 of the total 24,058 families live below the poverty line. Families with 5 or more children have the highest poverty rate of 28.4%, comprising of 62 families. On the other hand, families with no children have the lowest poverty rate of 4.3%, which includes 527 families.
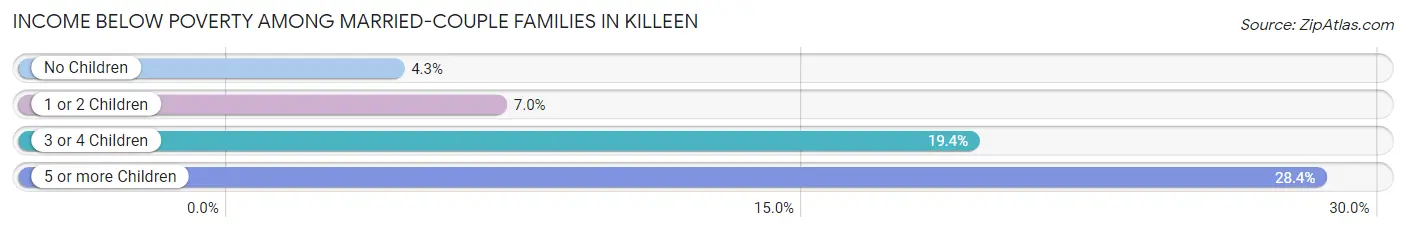
| Children | Above Poverty | Below Poverty |
| No Children | 11,624 (95.7%) | 527 (4.3%) |
| 1 or 2 Children | 8,828 (93.0%) | 667 (7.0%) |
| 3 or 4 Children | 1,769 (80.6%) | 425 (19.4%) |
| 5 or more Children | 156 (71.6%) | 62 (28.4%) |
| Total | 22,377 (93.0%) | 1,681 (7.0%) |
Income Below Poverty Among Single-Parent Households in Killeen
According to the poverty data in Killeen, 10.9% or 324 single-father households and 28.9% or 3,039 single-mother households are living below the poverty line. Among single-father households, those with no children have the highest poverty rate, with 122 households (13.2%) experiencing poverty. Likewise, among single-mother households, those with 3 or 4 children have the highest poverty rate, with 767 households (49.4%) falling below the poverty line.
| Children | Single Father | Single Mother |
| No Children | 122 (13.2%) | 304 (10.6%) |
| 1 or 2 Children | 183 (10.6%) | 1,906 (32.3%) |
| 3 or 4 Children | 19 (5.9%) | 767 (49.4%) |
| 5 or more Children | 0 (0.0%) | 62 (32.3%) |
| Total | 324 (10.9%) | 3,039 (28.9%) |
Income Below Poverty Among Married-Couple vs Single-Parent Households in Killeen
The poverty data for Killeen shows that 1,681 of the married-couple family households (7.0%) and 3,363 of the single-parent households (24.9%) are living below the poverty level. Within the married-couple family households, those with 5 or more children have the highest poverty rate, with 62 households (28.4%) falling below the poverty line. Among the single-parent households, those with 3 or 4 children have the highest poverty rate, with 786 household (41.9%) living below poverty.
| Children | Married-Couple Families | Single-Parent Households |
| No Children | 527 (4.3%) | 426 (11.3%) |
| 1 or 2 Children | 667 (7.0%) | 2,089 (27.4%) |
| 3 or 4 Children | 425 (19.4%) | 786 (41.9%) |
| 5 or more Children | 62 (28.4%) | 62 (32.3%) |
| Total | 1,681 (7.0%) | 3,363 (24.9%) |
Race in Killeen
The most populous races in Killeen are Black / African American (59,811 | 38.9%), White / Caucasian (56,463 | 36.7%), and Hispanic or Latino (42,635 | 27.7%).
| Race | # Population | % Population |
| Asian | 5,931 | 3.9% |
| Black / African American | 59,811 | 38.9% |
| Hawaiian / Pacific | 1,367 | 0.9% |
| Hispanic or Latino | 42,635 | 27.7% |
| Native / Alaskan | 881 | 0.6% |
| White / Caucasian | 56,463 | 36.7% |
| Two or more Races | 19,303 | 12.6% |
| Some other Race | 9,952 | 6.5% |
| Total | 153,708 | 100.0% |
Ancestry in Killeen
The most populous ancestries reported in Killeen are Mexican (21,503 | 14.0%), Puerto Rican (14,596 | 9.5%), American (11,873 | 7.7%), German (10,090 | 6.6%), and Irish (6,128 | 4.0%), together accounting for 41.8% of all Killeen residents.
| Ancestry | # Population | % Population |
| African | 1,706 | 1.1% |
| Albanian | 40 | 0.0% |
| American | 11,873 | 7.7% |
| Apache | 45 | 0.0% |
| Arab | 980 | 0.6% |
| Argentinean | 259 | 0.2% |
| Armenian | 49 | 0.0% |
| Australian | 119 | 0.1% |
| Austrian | 51 | 0.0% |
| Bahamian | 114 | 0.1% |
| Bangladeshi | 45 | 0.0% |
| Barbadian | 129 | 0.1% |
| Belizean | 48 | 0.0% |
| Bermudan | 11 | 0.0% |
| Bhutanese | 549 | 0.4% |
| Blackfeet | 164 | 0.1% |
| Bolivian | 10 | 0.0% |
| Brazilian | 100 | 0.1% |
| British | 705 | 0.5% |
| British West Indian | 89 | 0.1% |
| Burmese | 2,540 | 1.7% |
| Cajun | 9 | 0.0% |
| Canadian | 149 | 0.1% |
| Cape Verdean | 20 | 0.0% |
| Celtic | 26 | 0.0% |
| Central American | 2,220 | 1.4% |
| Central American Indian | 522 | 0.3% |
| Cherokee | 388 | 0.3% |
| Chickasaw | 141 | 0.1% |
| Chinese | 30 | 0.0% |
| Choctaw | 350 | 0.2% |
| Colombian | 516 | 0.3% |
| Comanche | 14 | 0.0% |
| Costa Rican | 25 | 0.0% |
| Creek | 48 | 0.0% |
| Croatian | 108 | 0.1% |
| Cuban | 358 | 0.2% |
| Czech | 130 | 0.1% |
| Czechoslovakian | 40 | 0.0% |
| Danish | 226 | 0.2% |
| Dominican | 1,513 | 1.0% |
| Dutch | 658 | 0.4% |
| Dutch West Indian | 18 | 0.0% |
| Eastern European | 11 | 0.0% |
| Ecuadorian | 69 | 0.0% |
| Egyptian | 1 | 0.0% |
| English | 4,357 | 2.8% |
| European | 2,384 | 1.5% |
| Finnish | 38 | 0.0% |
| French | 2,138 | 1.4% |
| French Canadian | 102 | 0.1% |
| German | 10,090 | 6.6% |
| Ghanaian | 367 | 0.2% |
| Greek | 67 | 0.0% |
| Guamanian / Chamorro | 1,090 | 0.7% |
| Guatemalan | 389 | 0.3% |
| Haitian | 223 | 0.2% |
| Honduran | 7 | 0.0% |
| Hungarian | 177 | 0.1% |
| Indian (Asian) | 617 | 0.4% |
| Iranian | 1 | 0.0% |
| Iraqi | 70 | 0.1% |
| Irish | 6,128 | 4.0% |
| Iroquois | 38 | 0.0% |
| Israeli | 22 | 0.0% |
| Italian | 2,678 | 1.7% |
| Jamaican | 1,046 | 0.7% |
| Japanese | 389 | 0.3% |
| Jordanian | 38 | 0.0% |
| Kenyan | 8 | 0.0% |
| Korean | 2,862 | 1.9% |
| Lebanese | 418 | 0.3% |
| Liberian | 12 | 0.0% |
| Lithuanian | 33 | 0.0% |
| Lumbee | 7 | 0.0% |
| Malaysian | 141 | 0.1% |
| Marshallese | 53 | 0.0% |
| Mexican | 21,503 | 14.0% |
| Mexican American Indian | 348 | 0.2% |
| Native Hawaiian | 587 | 0.4% |
| Navajo | 175 | 0.1% |
| Nicaraguan | 94 | 0.1% |
| Nigerian | 650 | 0.4% |
| Northern European | 34 | 0.0% |
| Norwegian | 697 | 0.4% |
| Pakistani | 187 | 0.1% |
| Panamanian | 958 | 0.6% |
| Pennsylvania German | 3 | 0.0% |
| Peruvian | 291 | 0.2% |
| Polish | 1,034 | 0.7% |
| Portuguese | 287 | 0.2% |
| Pueblo | 318 | 0.2% |
| Puerto Rican | 14,596 | 9.5% |
| Romanian | 16 | 0.0% |
| Russian | 647 | 0.4% |
| Salvadoran | 747 | 0.5% |
| Samoan | 376 | 0.2% |
| Scandinavian | 114 | 0.1% |
| Scotch-Irish | 504 | 0.3% |
| Scottish | 1,008 | 0.7% |
| Serbian | 28 | 0.0% |
| Sierra Leonean | 24 | 0.0% |
| Sioux | 4 | 0.0% |
| Slavic | 1 | 0.0% |
| Slovak | 74 | 0.1% |
| Slovene | 14 | 0.0% |
| South American | 1,214 | 0.8% |
| Spaniard | 605 | 0.4% |
| Spanish | 73 | 0.1% |
| Spanish American Indian | 22 | 0.0% |
| Sri Lankan | 805 | 0.5% |
| Subsaharan African | 2,991 | 1.9% |
| Swedish | 362 | 0.2% |
| Swiss | 100 | 0.1% |
| Syrian | 3 | 0.0% |
| Thai | 92 | 0.1% |
| Tongan | 10 | 0.0% |
| Trinidadian and Tobagonian | 234 | 0.2% |
| Turkish | 47 | 0.0% |
| U.S. Virgin Islander | 88 | 0.1% |
| Ukrainian | 12 | 0.0% |
| Venezuelan | 62 | 0.0% |
| Welsh | 436 | 0.3% |
| West Indian | 90 | 0.1% |
| Yugoslavian | 81 | 0.1% | View All 125 Rows |
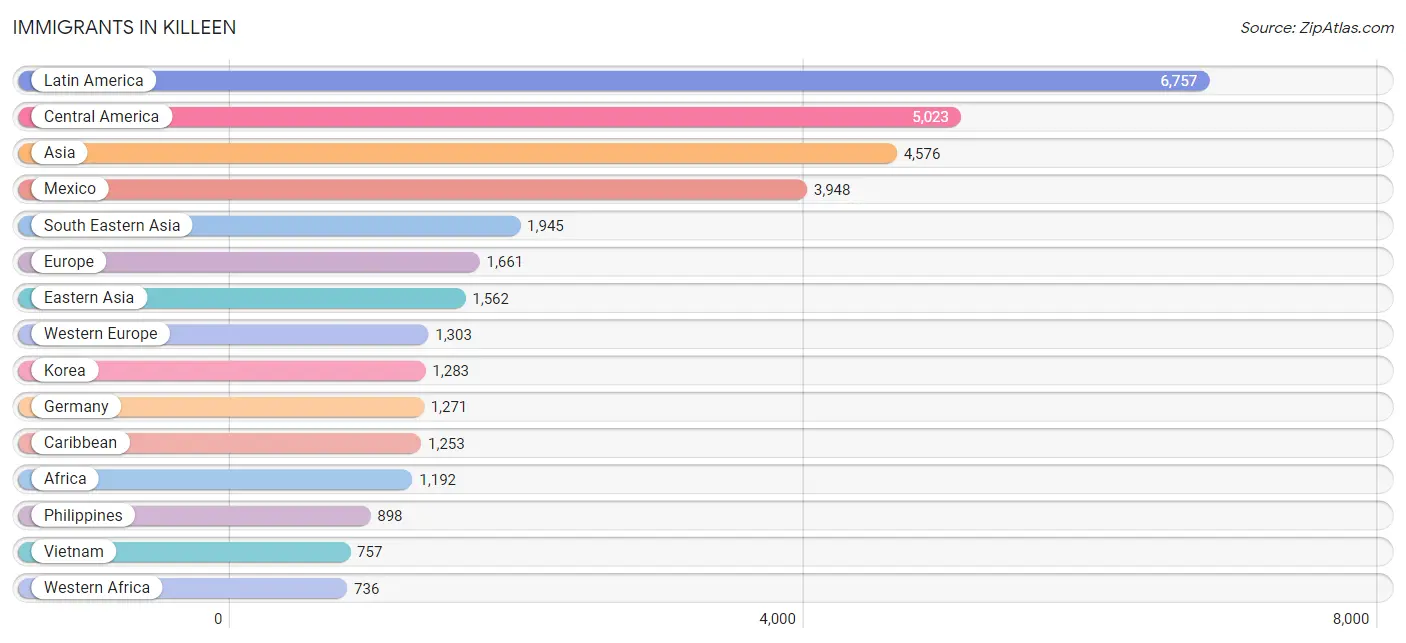
Immigrants in Killeen
The most numerous immigrant groups reported in Killeen came from Latin America (6,757 | 4.4%), Central America (5,023 | 3.3%), Asia (4,576 | 3.0%), Mexico (3,948 | 2.6%), and South Eastern Asia (1,945 | 1.3%), together accounting for 14.5% of all Killeen residents.
| Immigration Origin | # Population | % Population |
| Africa | 1,192 | 0.8% |
| Argentina | 22 | 0.0% |
| Asia | 4,576 | 3.0% |
| Bahamas | 74 | 0.1% |
| Barbados | 10 | 0.0% |
| Belize | 45 | 0.0% |
| Bolivia | 31 | 0.0% |
| Bosnia and Herzegovina | 25 | 0.0% |
| Brazil | 39 | 0.0% |
| Cambodia | 161 | 0.1% |
| Canada | 114 | 0.1% |
| Caribbean | 1,253 | 0.8% |
| Central America | 5,023 | 3.3% |
| China | 176 | 0.1% |
| Colombia | 155 | 0.1% |
| Czechoslovakia | 15 | 0.0% |
| Dominican Republic | 405 | 0.3% |
| Eastern Africa | 286 | 0.2% |
| Eastern Asia | 1,562 | 1.0% |
| Eastern Europe | 97 | 0.1% |
| Ecuador | 27 | 0.0% |
| Egypt | 49 | 0.0% |
| El Salvador | 317 | 0.2% |
| England | 109 | 0.1% |
| Eritrea | 98 | 0.1% |
| Ethiopia | 29 | 0.0% |
| Europe | 1,661 | 1.1% |
| France | 9 | 0.0% |
| Germany | 1,271 | 0.8% |
| Ghana | 218 | 0.1% |
| Guatemala | 75 | 0.1% |
| Haiti | 99 | 0.1% |
| Honduras | 12 | 0.0% |
| Hong Kong | 45 | 0.0% |
| India | 21 | 0.0% |
| Iraq | 166 | 0.1% |
| Jamaica | 367 | 0.2% |
| Japan | 103 | 0.1% |
| Jordan | 20 | 0.0% |
| Kenya | 140 | 0.1% |
| Korea | 1,283 | 0.8% |
| Kuwait | 18 | 0.0% |
| Latin America | 6,757 | 4.4% |
| Lebanon | 4 | 0.0% |
| Liberia | 47 | 0.0% |
| Mexico | 3,948 | 2.6% |
| Micronesia | 17 | 0.0% |
| Nepal | 588 | 0.4% |
| Netherlands | 23 | 0.0% |
| Nicaragua | 18 | 0.0% |
| Nigeria | 196 | 0.1% |
| Northern Africa | 142 | 0.1% |
| Northern Europe | 162 | 0.1% |
| Oceania | 135 | 0.1% |
| Pakistan | 15 | 0.0% |
| Panama | 608 | 0.4% |
| Peru | 145 | 0.1% |
| Philippines | 898 | 0.6% |
| Romania | 16 | 0.0% |
| Russia | 36 | 0.0% |
| Saudi Arabia | 195 | 0.1% |
| Scotland | 13 | 0.0% |
| Sierra Leone | 162 | 0.1% |
| South Africa | 7 | 0.0% |
| South America | 481 | 0.3% |
| South Central Asia | 624 | 0.4% |
| South Eastern Asia | 1,945 | 1.3% |
| Southern Europe | 54 | 0.0% |
| Spain | 54 | 0.0% |
| Syria | 42 | 0.0% |
| Taiwan | 86 | 0.1% |
| Thailand | 129 | 0.1% |
| Trinidad and Tobago | 170 | 0.1% |
| Ukraine | 5 | 0.0% |
| Venezuela | 62 | 0.0% |
| Vietnam | 757 | 0.5% |
| Western Africa | 736 | 0.5% |
| Western Asia | 445 | 0.3% |
| Western Europe | 1,303 | 0.9% | View All 79 Rows |
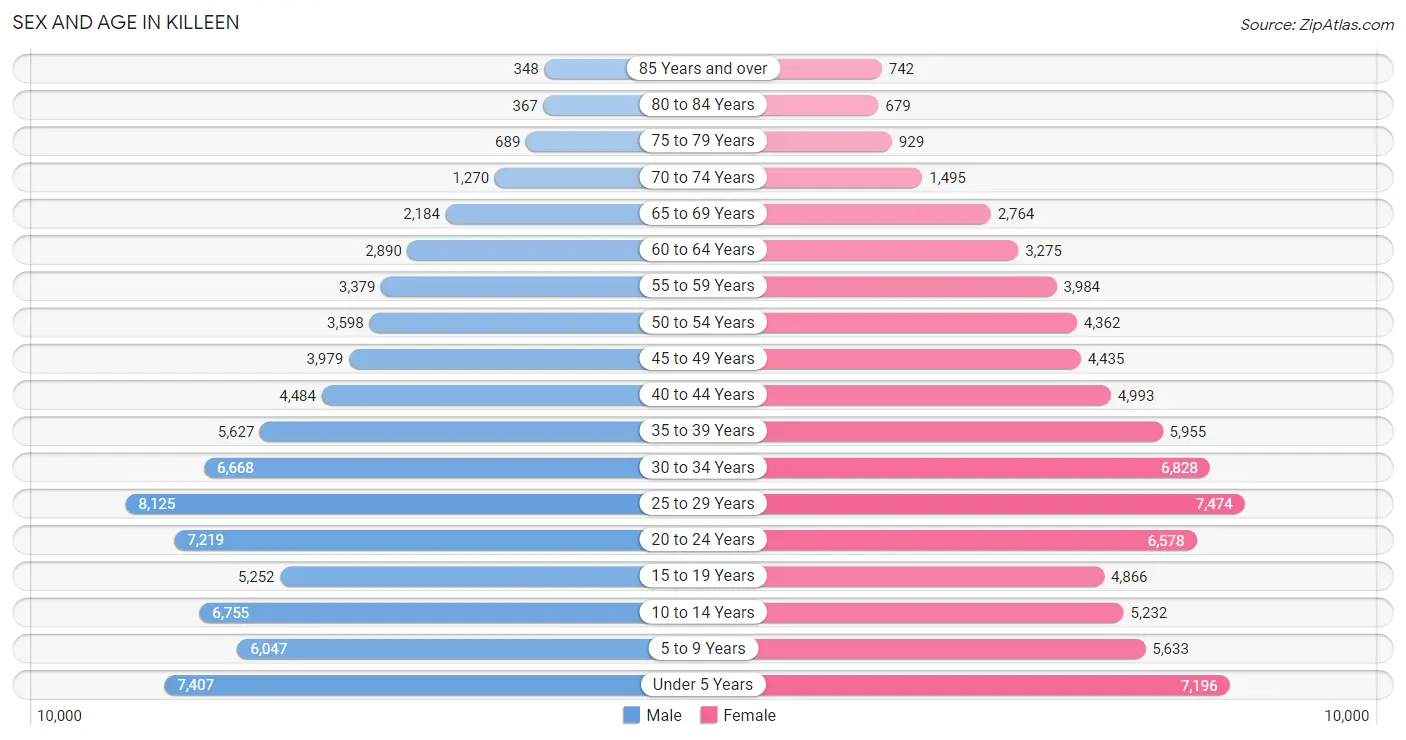
Sex and Age in Killeen
Sex and Age in Killeen
The most populous age groups in Killeen are 25 to 29 Years (8,125 | 10.6%) for men and 25 to 29 Years (7,474 | 9.7%) for women.
| Age Bracket | Male | Female |
| Under 5 Years | 7,407 (9.7%) | 7,196 (9.3%) |
| 5 to 9 Years | 6,047 (7.9%) | 5,633 (7.3%) |
| 10 to 14 Years | 6,755 (8.8%) | 5,232 (6.8%) |
| 15 to 19 Years | 5,252 (6.9%) | 4,866 (6.3%) |
| 20 to 24 Years | 7,219 (9.5%) | 6,578 (8.5%) |
| 25 to 29 Years | 8,125 (10.6%) | 7,474 (9.7%) |
| 30 to 34 Years | 6,668 (8.7%) | 6,828 (8.8%) |
| 35 to 39 Years | 5,627 (7.4%) | 5,955 (7.7%) |
| 40 to 44 Years | 4,484 (5.9%) | 4,993 (6.5%) |
| 45 to 49 Years | 3,979 (5.2%) | 4,435 (5.7%) |
| 50 to 54 Years | 3,598 (4.7%) | 4,362 (5.6%) |
| 55 to 59 Years | 3,379 (4.4%) | 3,984 (5.1%) |
| 60 to 64 Years | 2,890 (3.8%) | 3,275 (4.2%) |
| 65 to 69 Years | 2,184 (2.9%) | 2,764 (3.6%) |
| 70 to 74 Years | 1,270 (1.7%) | 1,495 (1.9%) |
| 75 to 79 Years | 689 (0.9%) | 929 (1.2%) |
| 80 to 84 Years | 367 (0.5%) | 679 (0.9%) |
| 85 Years and over | 348 (0.5%) | 742 (1.0%) |
| Total | 76,288 (100.0%) | 77,420 (100.0%) |
Families and Households in Killeen
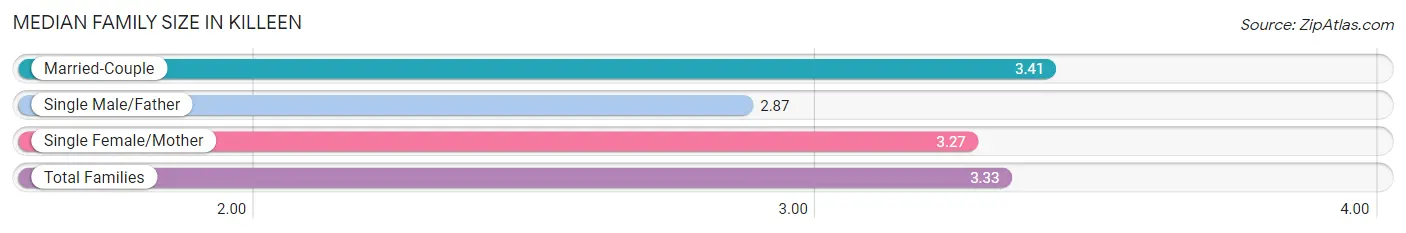
Median Family Size in Killeen
The median family size in Killeen is 3.33 persons per family, with married-couple families (24,058 | 64.1%) accounting for the largest median family size of 3.41 persons per family. On the other hand, single male/father families (2,963 | 7.9%) represent the smallest median family size with 2.87 persons per family.
| Family Type | # Families | Family Size |
| Married-Couple | 24,058 (64.1%) | 3.41 |
| Single Male/Father | 2,963 (7.9%) | 2.87 |
| Single Female/Mother | 10,515 (28.0%) | 3.27 |
| Total Families | 37,536 (100.0%) | 3.33 |
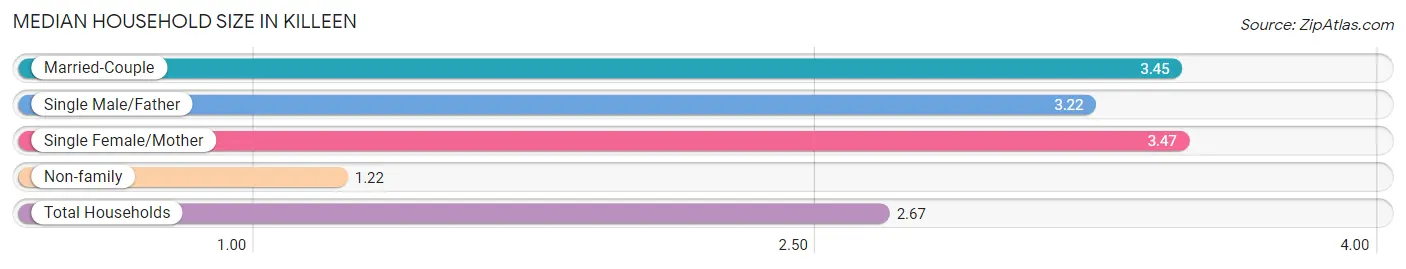
Median Household Size in Killeen
The median household size in Killeen is 2.67 persons per household, with single female/mother households (10,515 | 18.3%) accounting for the largest median household size of 3.47 persons per household. non-family households (20,034 | 34.8%) represent the smallest median household size with 1.22 persons per household.
| Household Type | # Households | Household Size |
| Married-Couple | 24,058 (41.8%) | 3.45 |
| Single Male/Father | 2,963 (5.1%) | 3.22 |
| Single Female/Mother | 10,515 (18.3%) | 3.47 |
| Non-family | 20,034 (34.8%) | 1.22 |
| Total Households | 57,570 (100.0%) | 2.67 |
Household Size by Marriage Status in Killeen
Out of a total of 57,570 households in Killeen, 37,536 (65.2%) are family households, while 20,034 (34.8%) are nonfamily households. The most numerous type of family households are 2-person households, comprising 14,804, and the most common type of nonfamily households are 1-person households, comprising 16,699.
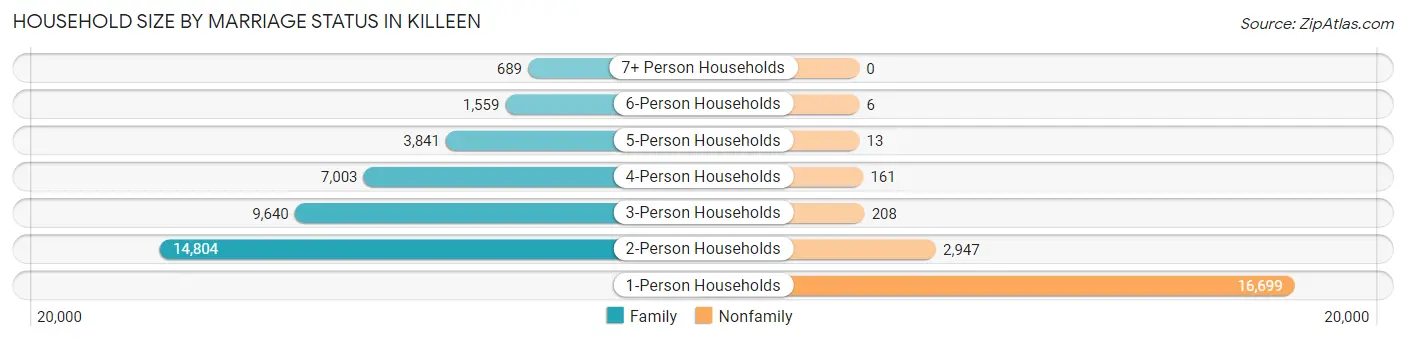
| Household Size | Family Households | Nonfamily Households |
| 1-Person Households | - | 16,699 (29.0%) |
| 2-Person Households | 14,804 (25.7%) | 2,947 (5.1%) |
| 3-Person Households | 9,640 (16.7%) | 208 (0.4%) |
| 4-Person Households | 7,003 (12.2%) | 161 (0.3%) |
| 5-Person Households | 3,841 (6.7%) | 13 (0.0%) |
| 6-Person Households | 1,559 (2.7%) | 6 (0.0%) |
| 7+ Person Households | 689 (1.2%) | 0 (0.0%) |
| Total | 37,536 (65.2%) | 20,034 (34.8%) |
Female Fertility in Killeen
Fertility by Age in Killeen
Average fertility rate in Killeen is 86.0 births per 1,000 women. Women in the age bracket of 20 to 34 years have the highest fertility rate with 134.0 births per 1,000 women. Women in the age bracket of 20 to 34 years acount for 78.0% of all women with births.
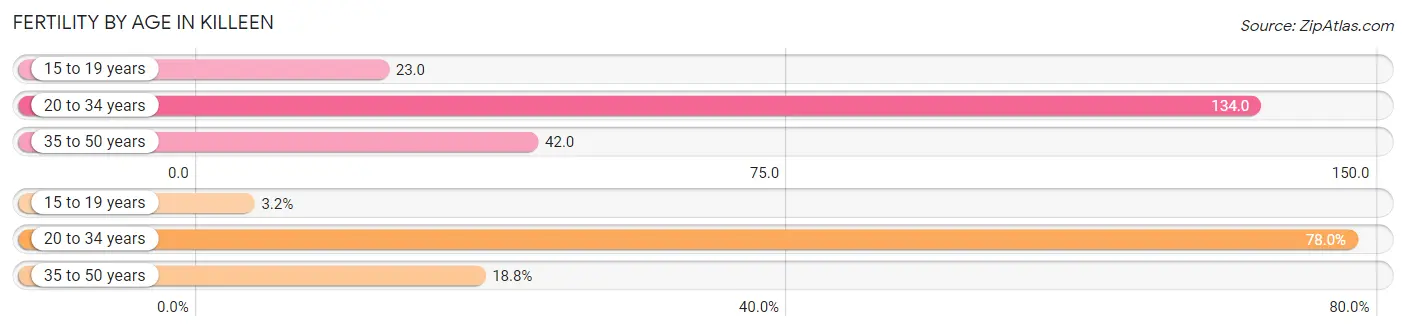
| Age Bracket | Women with Births | Births / 1,000 Women |
| 15 to 19 years | 113 (3.2%) | 23.0 |
| 20 to 34 years | 2,801 (78.0%) | 134.0 |
| 35 to 50 years | 675 (18.8%) | 42.0 |
| Total | 3,589 (100.0%) | 86.0 |
Fertility by Age by Marriage Status in Killeen
69.0% of women with births (3,589) in Killeen are married. The highest percentage of unmarried women with births falls into 15 to 19 years age bracket with 78.8% of them unmarried at the time of birth, while the lowest percentage of unmarried women with births belong to 20 to 34 years age bracket with 29.1% of them unmarried.
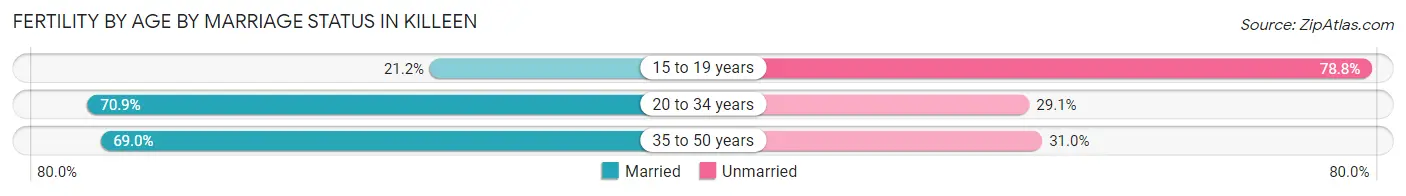
| Age Bracket | Married | Unmarried |
| 15 to 19 years | 24 (21.2%) | 89 (78.8%) |
| 20 to 34 years | 1,986 (70.9%) | 815 (29.1%) |
| 35 to 50 years | 466 (69.0%) | 209 (31.0%) |
| Total | 2,476 (69.0%) | 1,113 (31.0%) |
Fertility by Education in Killeen
Average fertility rate in Killeen is 86.0 births per 1,000 women. Women with the education attainment of college or associate's degree have the highest fertility rate of 106.0 births per 1,000 women, while women with the education attainment of graduate degree have the lowest fertility at 40.0 births per 1,000 women. Women with the education attainment of college or associate's degree represent 54.4% of all women with births.
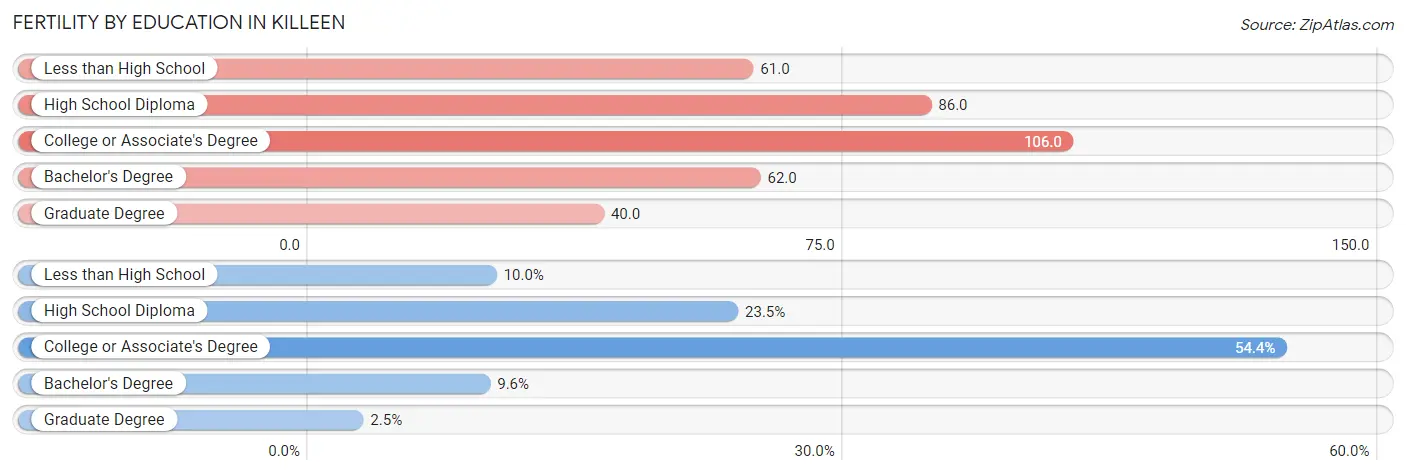
| Educational Attainment | Women with Births | Births / 1,000 Women |
| Less than High School | 358 (10.0%) | 61.0 |
| High School Diploma | 845 (23.5%) | 86.0 |
| College or Associate's Degree | 1,952 (54.4%) | 106.0 |
| Bachelor's Degree | 345 (9.6%) | 62.0 |
| Graduate Degree | 89 (2.5%) | 40.0 |
| Total | 3,589 (100.0%) | 86.0 |
Fertility by Education by Marriage Status in Killeen
31.0% of women with births in Killeen are unmarried. Women with the educational attainment of high school diploma are most likely to be married with 82.1% of them married at childbirth, while women with the educational attainment of less than high school are least likely to be married with 55.3% of them unmarried at childbirth.
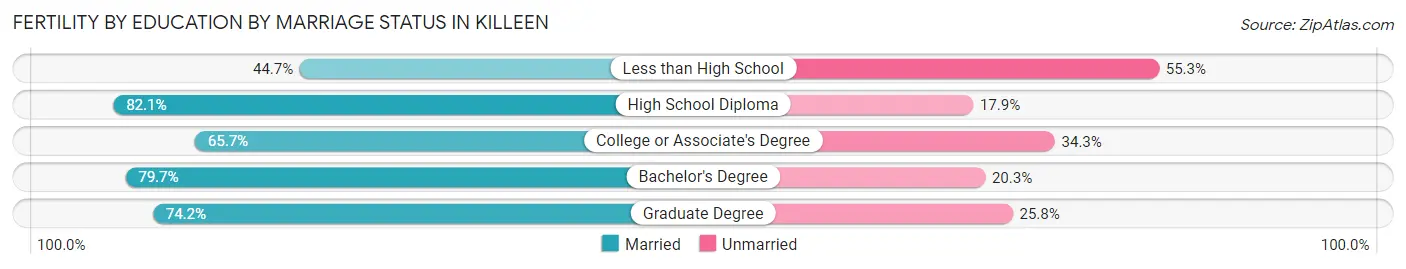
| Educational Attainment | Married | Unmarried |
| Less than High School | 160 (44.7%) | 198 (55.3%) |
| High School Diploma | 694 (82.1%) | 151 (17.9%) |
| College or Associate's Degree | 1,282 (65.7%) | 670 (34.3%) |
| Bachelor's Degree | 275 (79.7%) | 70 (20.3%) |
| Graduate Degree | 66 (74.2%) | 23 (25.8%) |
| Total | 2,476 (69.0%) | 1,113 (31.0%) |
Employment Characteristics in Killeen
Employment by Class of Employer in Killeen
Among the 68,893 employed individuals in Killeen, private company employees (38,171 | 55.4%), federal government employees (17,463 | 25.4%), and local government employees (5,024 | 7.3%) make up the most common classes of employment.
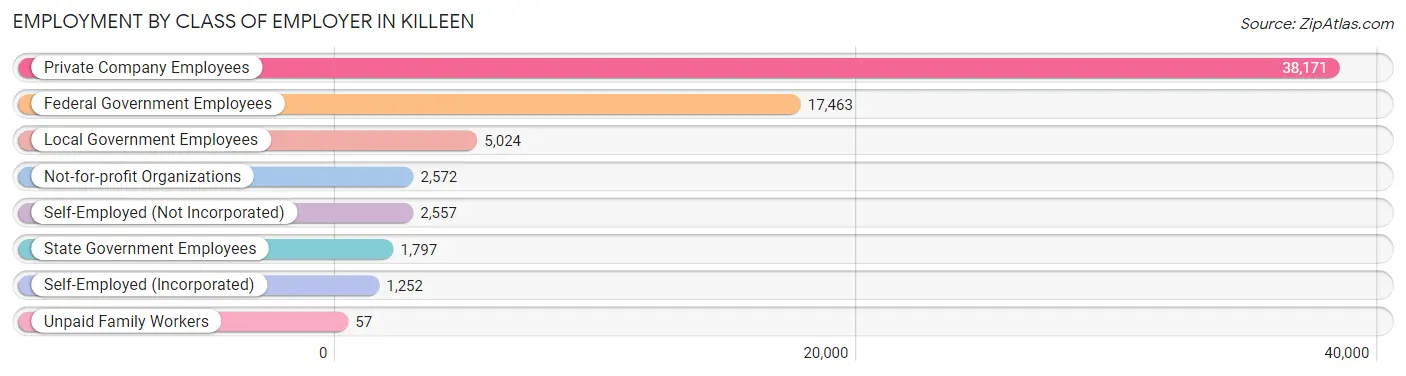
| Employer Class | # Employees | % Employees |
| Private Company Employees | 38,171 | 55.4% |
| Self-Employed (Incorporated) | 1,252 | 1.8% |
| Self-Employed (Not Incorporated) | 2,557 | 3.7% |
| Not-for-profit Organizations | 2,572 | 3.7% |
| Local Government Employees | 5,024 | 7.3% |
| State Government Employees | 1,797 | 2.6% |
| Federal Government Employees | 17,463 | 25.4% |
| Unpaid Family Workers | 57 | 0.1% |
| Total | 68,893 | 100.0% |
Employment Status by Age in Killeen
According to the labor force statistics for Killeen, out of the total population over 16 years of age (113,355), 68.5% or 77,648 individuals are in the labor force, with 10.9% or 8,464 of them unemployed. The age group with the highest labor force participation rate is 25 to 29 years, with 83.9% or 13,088 individuals in the labor force. Within the labor force, the 16 to 19 years age range has the highest percentage of unemployed individuals, with 25.2% or 828 of them being unemployed.
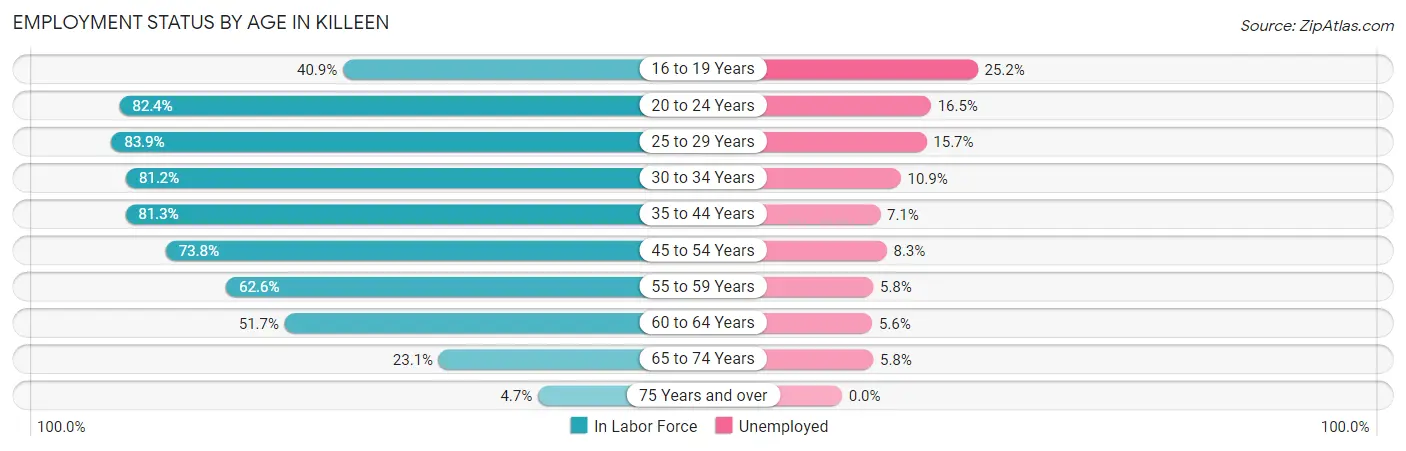
| Age Bracket | In Labor Force | Unemployed |
| 16 to 19 Years | 3,286 (40.9%) | 828 (25.2%) |
| 20 to 24 Years | 11,369 (82.4%) | 1,876 (16.5%) |
| 25 to 29 Years | 13,088 (83.9%) | 2,055 (15.7%) |
| 30 to 34 Years | 10,959 (81.2%) | 1,195 (10.9%) |
| 35 to 44 Years | 17,121 (81.3%) | 1,216 (7.1%) |
| 45 to 54 Years | 12,084 (73.8%) | 1,003 (8.3%) |
| 55 to 59 Years | 4,609 (62.6%) | 267 (5.8%) |
| 60 to 64 Years | 3,187 (51.7%) | 178 (5.6%) |
| 65 to 74 Years | 1,782 (23.1%) | 103 (5.8%) |
| 75 Years and over | 176 (4.7%) | 0 (0.0%) |
| Total | 77,648 (68.5%) | 8,464 (10.9%) |
Employment Status by Educational Attainment in Killeen
According to labor force statistics for Killeen, 76.2% of individuals (61,003) out of the total population between 25 and 64 years of age (80,056) are in the labor force, with 9.4% or 5,734 of them being unemployed. The group with the highest labor force participation rate are those with the educational attainment of bachelor's degree or higher, with 83.2% or 15,151 individuals in the labor force. Within the labor force, individuals with less than high school education have the highest percentage of unemployment, with 16.8% or 625 of them being unemployed.
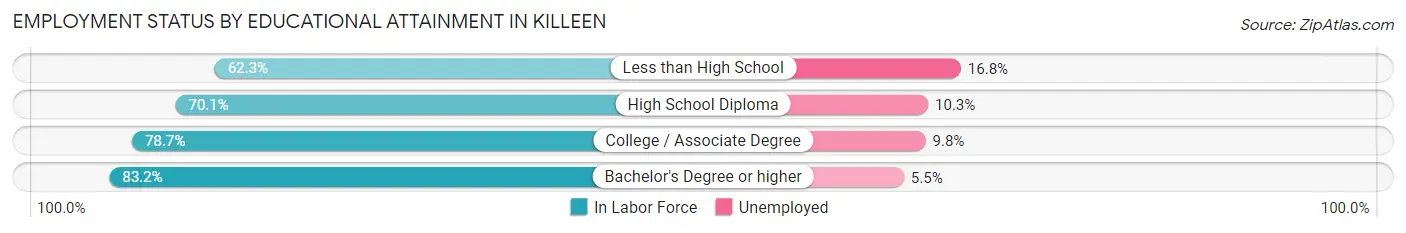
| Educational Attainment | In Labor Force | Unemployed |
| Less than High School | 3,719 (62.3%) | 1,003 (16.8%) |
| High School Diploma | 14,586 (70.1%) | 2,143 (10.3%) |
| College / Associate Degree | 27,600 (78.7%) | 3,437 (9.8%) |
| Bachelor's Degree or higher | 15,151 (83.2%) | 1,002 (5.5%) |
| Total | 61,003 (76.2%) | 7,525 (9.4%) |
Employment Occupations by Sex in Killeen
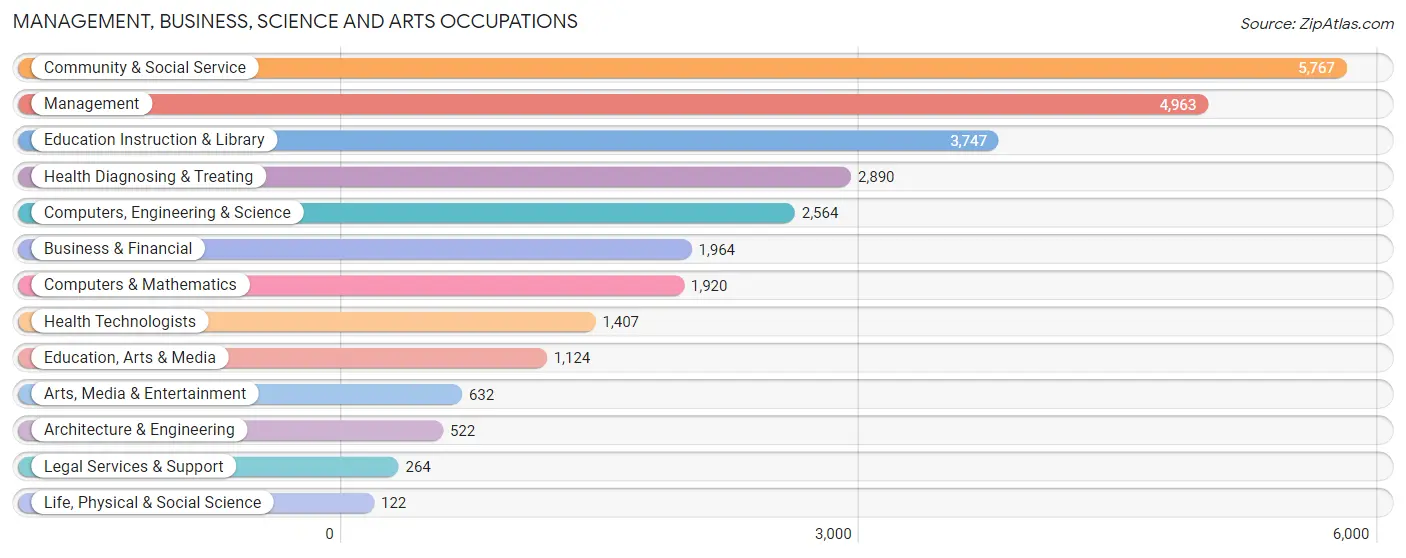
Management, Business, Science and Arts Occupations
The most common Management, Business, Science and Arts occupations in Killeen are Community & Social Service (5,767 | 9.6%), Management (4,963 | 8.3%), Education Instruction & Library (3,747 | 6.2%), Health Diagnosing & Treating (2,890 | 4.8%), and Computers, Engineering & Science (2,564 | 4.3%).
Management, Business, Science and Arts Occupations by Sex
Within the Management, Business, Science and Arts occupations in Killeen, the most male-oriented occupations are Architecture & Engineering (79.7%), Computers, Engineering & Science (66.5%), and Computers & Mathematics (65.4%), while the most female-oriented occupations are Education, Arts & Media (82.5%), Health Diagnosing & Treating (82.2%), and Health Technologists (81.6%).
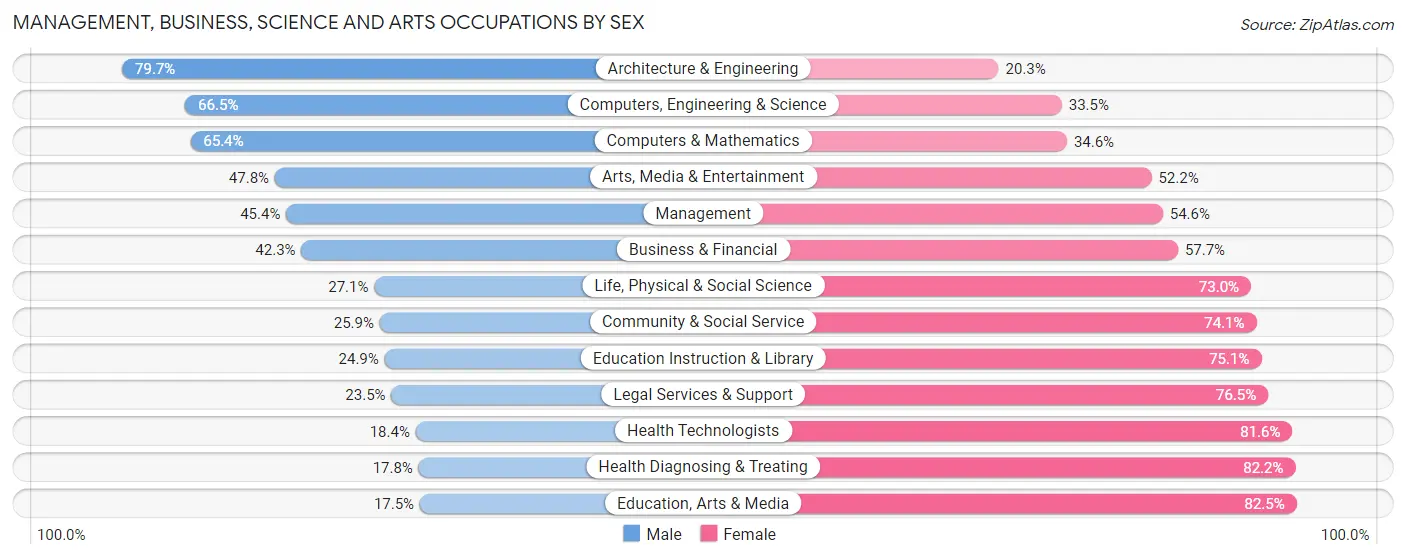
| Occupation | Male | Female |
| Management | 2,254 (45.4%) | 2,709 (54.6%) |
| Business & Financial | 830 (42.3%) | 1,134 (57.7%) |
| Computers, Engineering & Science | 1,705 (66.5%) | 859 (33.5%) |
| Computers & Mathematics | 1,256 (65.4%) | 664 (34.6%) |
| Architecture & Engineering | 416 (79.7%) | 106 (20.3%) |
| Life, Physical & Social Science | 33 (27.1%) | 89 (73.0%) |
| Community & Social Service | 1,494 (25.9%) | 4,273 (74.1%) |
| Education, Arts & Media | 197 (17.5%) | 927 (82.5%) |
| Legal Services & Support | 62 (23.5%) | 202 (76.5%) |
| Education Instruction & Library | 933 (24.9%) | 2,814 (75.1%) |
| Arts, Media & Entertainment | 302 (47.8%) | 330 (52.2%) |
| Health Diagnosing & Treating | 514 (17.8%) | 2,376 (82.2%) |
| Health Technologists | 259 (18.4%) | 1,148 (81.6%) |
| Total (Category) | 6,797 (37.4%) | 11,351 (62.5%) |
| Total (Overall) | 28,468 (47.4%) | 31,591 (52.6%) |
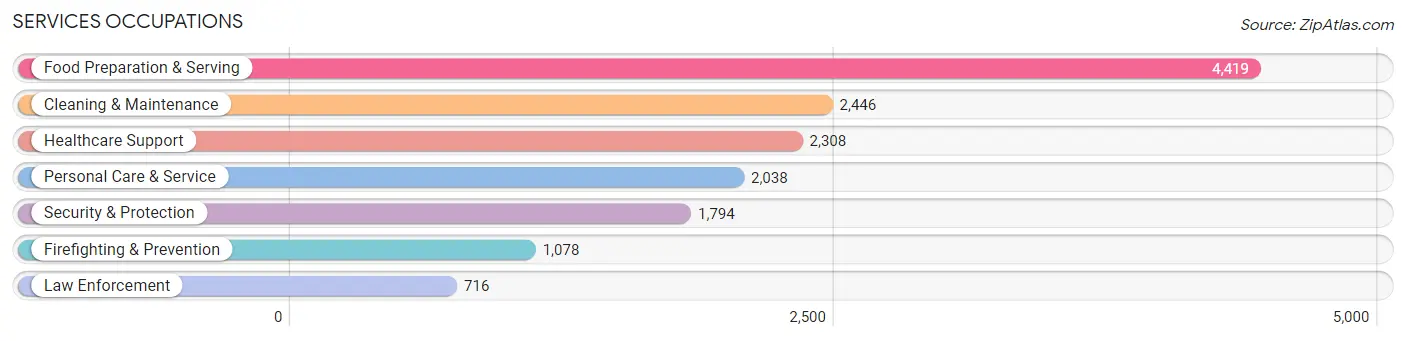
Services Occupations
The most common Services occupations in Killeen are Food Preparation & Serving (4,419 | 7.4%), Cleaning & Maintenance (2,446 | 4.1%), Healthcare Support (2,308 | 3.8%), Personal Care & Service (2,038 | 3.4%), and Security & Protection (1,794 | 3.0%).
Services Occupations by Sex
Within the Services occupations in Killeen, the most male-oriented occupations are Firefighting & Prevention (66.0%), Security & Protection (64.8%), and Law Enforcement (63.0%), while the most female-oriented occupations are Healthcare Support (93.9%), Personal Care & Service (71.1%), and Food Preparation & Serving (65.4%).
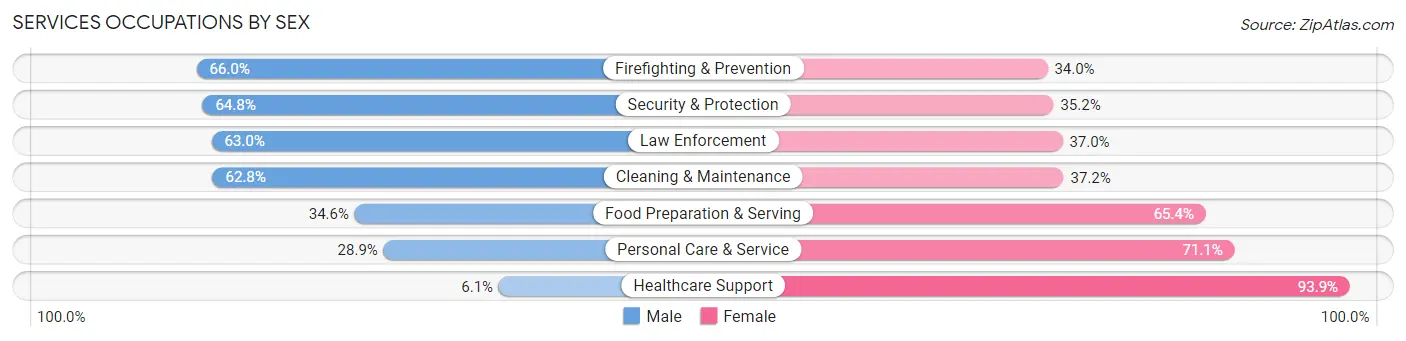
| Occupation | Male | Female |
| Healthcare Support | 140 (6.1%) | 2,168 (93.9%) |
| Security & Protection | 1,162 (64.8%) | 632 (35.2%) |
| Firefighting & Prevention | 711 (66.0%) | 367 (34.0%) |
| Law Enforcement | 451 (63.0%) | 265 (37.0%) |
| Food Preparation & Serving | 1,530 (34.6%) | 2,889 (65.4%) |
| Cleaning & Maintenance | 1,535 (62.8%) | 911 (37.2%) |
| Personal Care & Service | 589 (28.9%) | 1,449 (71.1%) |
| Total (Category) | 4,956 (38.1%) | 8,049 (61.9%) |
| Total (Overall) | 28,468 (47.4%) | 31,591 (52.6%) |
Sales and Office Occupations
The most common Sales and Office occupations in Killeen are Office & Administration (8,245 | 13.7%), and Sales & Related (6,349 | 10.6%).
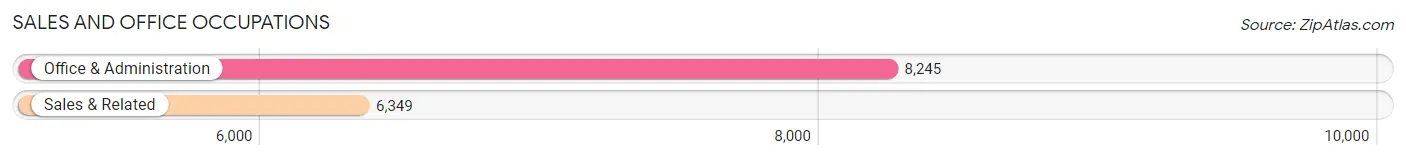
Sales and Office Occupations by Sex
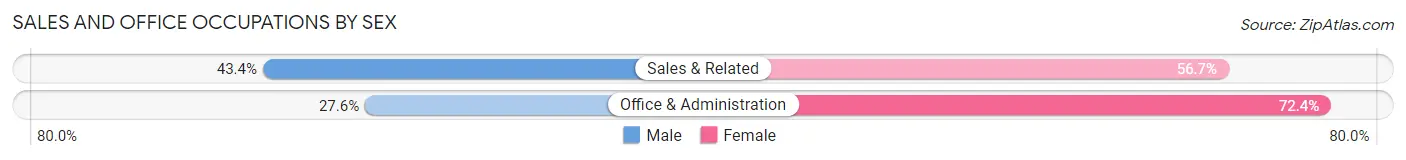
| Occupation | Male | Female |
| Sales & Related | 2,752 (43.3%) | 3,597 (56.7%) |
| Office & Administration | 2,278 (27.6%) | 5,967 (72.4%) |
| Total (Category) | 5,030 (34.5%) | 9,564 (65.5%) |
| Total (Overall) | 28,468 (47.4%) | 31,591 (52.6%) |
Natural Resources, Construction and Maintenance Occupations
The most common Natural Resources, Construction and Maintenance occupations in Killeen are Construction & Extraction (3,519 | 5.9%), Installation, Maintenance & Repair (2,633 | 4.4%), and Farming, Fishing & Forestry (113 | 0.2%).
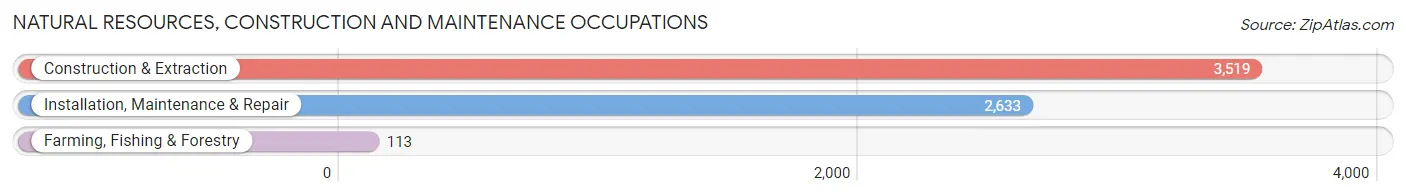
Natural Resources, Construction and Maintenance Occupations by Sex
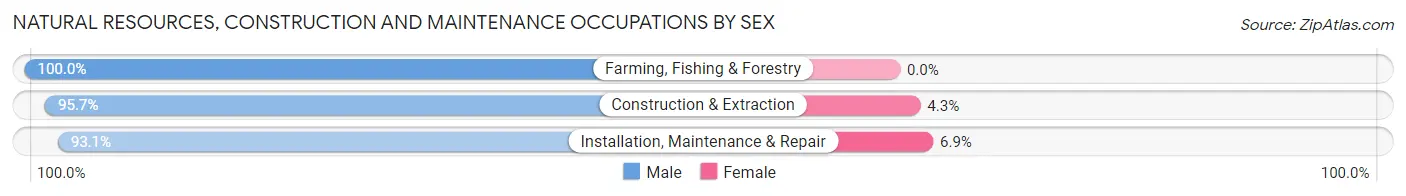
| Occupation | Male | Female |
| Farming, Fishing & Forestry | 113 (100.0%) | 0 (0.0%) |
| Construction & Extraction | 3,369 (95.7%) | 150 (4.3%) |
| Installation, Maintenance & Repair | 2,451 (93.1%) | 182 (6.9%) |
| Total (Category) | 5,933 (94.7%) | 332 (5.3%) |
| Total (Overall) | 28,468 (47.4%) | 31,591 (52.6%) |
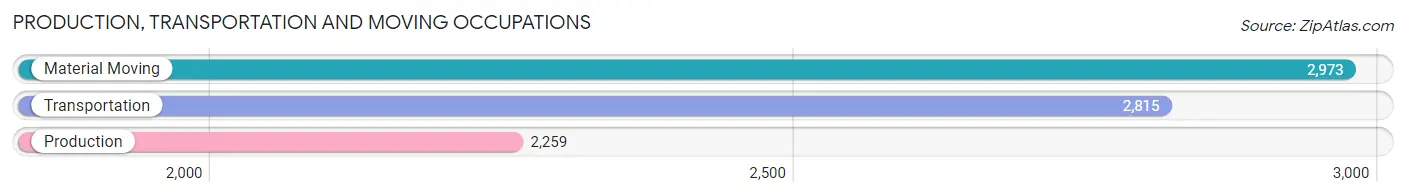
Production, Transportation and Moving Occupations
The most common Production, Transportation and Moving occupations in Killeen are Material Moving (2,973 | 5.0%), Transportation (2,815 | 4.7%), and Production (2,259 | 3.8%).
Production, Transportation and Moving Occupations by Sex
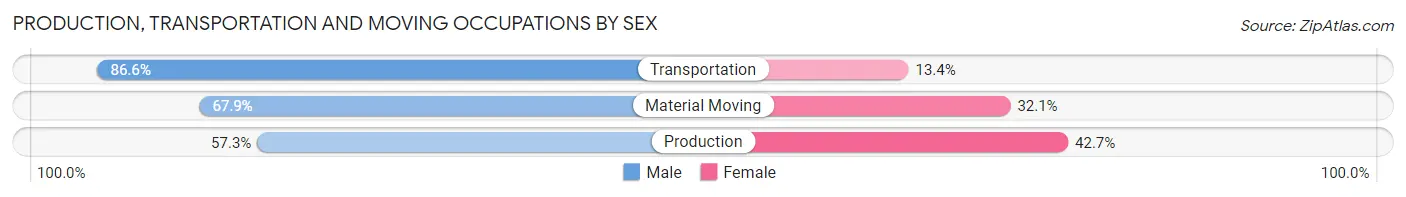
| Occupation | Male | Female |
| Production | 1,295 (57.3%) | 964 (42.7%) |
| Transportation | 2,438 (86.6%) | 377 (13.4%) |
| Material Moving | 2,019 (67.9%) | 954 (32.1%) |
| Total (Category) | 5,752 (71.5%) | 2,295 (28.5%) |
| Total (Overall) | 28,468 (47.4%) | 31,591 (52.6%) |
Employment Industries by Sex in Killeen
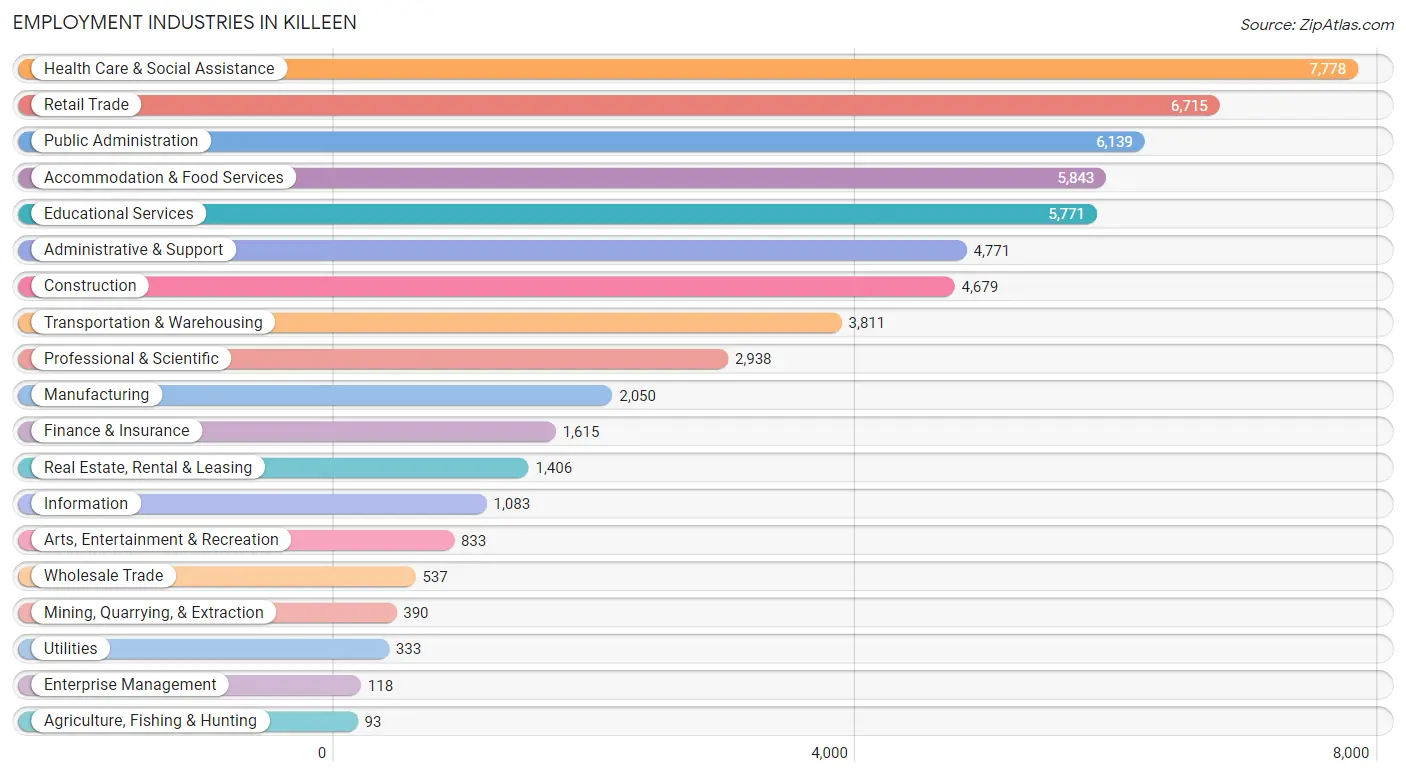
Employment Industries in Killeen
The major employment industries in Killeen include Health Care & Social Assistance (7,778 | 13.0%), Retail Trade (6,715 | 11.2%), Public Administration (6,139 | 10.2%), Accommodation & Food Services (5,843 | 9.7%), and Educational Services (5,771 | 9.6%).
Employment Industries by Sex in Killeen
The Killeen industries that see more men than women are Construction (92.7%), Agriculture, Fishing & Hunting (87.1%), and Utilities (80.5%), whereas the industries that tend to have a higher number of women are Finance & Insurance (87.5%), Health Care & Social Assistance (80.2%), and Educational Services (74.6%).
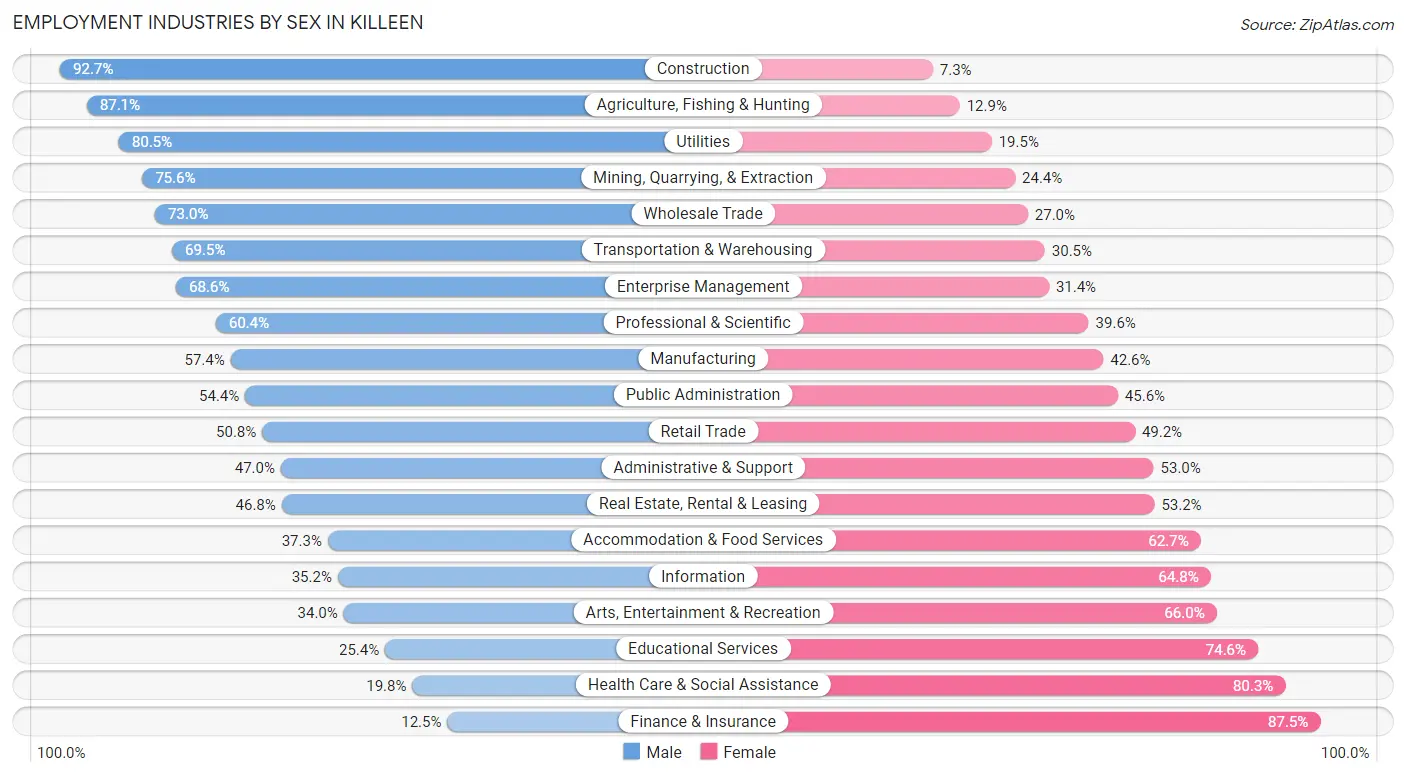
| Industry | Male | Female |
| Agriculture, Fishing & Hunting | 81 (87.1%) | 12 (12.9%) |
| Mining, Quarrying, & Extraction | 295 (75.6%) | 95 (24.4%) |
| Construction | 4,336 (92.7%) | 343 (7.3%) |
| Manufacturing | 1,176 (57.4%) | 874 (42.6%) |
| Wholesale Trade | 392 (73.0%) | 145 (27.0%) |
| Retail Trade | 3,414 (50.8%) | 3,301 (49.2%) |
| Transportation & Warehousing | 2,648 (69.5%) | 1,163 (30.5%) |
| Utilities | 268 (80.5%) | 65 (19.5%) |
| Information | 381 (35.2%) | 702 (64.8%) |
| Finance & Insurance | 202 (12.5%) | 1,413 (87.5%) |
| Real Estate, Rental & Leasing | 658 (46.8%) | 748 (53.2%) |
| Professional & Scientific | 1,775 (60.4%) | 1,163 (39.6%) |
| Enterprise Management | 81 (68.6%) | 37 (31.4%) |
| Administrative & Support | 2,241 (47.0%) | 2,530 (53.0%) |
| Educational Services | 1,466 (25.4%) | 4,305 (74.6%) |
| Health Care & Social Assistance | 1,536 (19.8%) | 6,242 (80.2%) |
| Arts, Entertainment & Recreation | 283 (34.0%) | 550 (66.0%) |
| Accommodation & Food Services | 2,177 (37.3%) | 3,666 (62.7%) |
| Public Administration | 3,337 (54.4%) | 2,802 (45.6%) |
| Total | 28,468 (47.4%) | 31,591 (52.6%) |
Education in Killeen
School Enrollment in Killeen
The most common levels of schooling among the 44,136 students in Killeen are college / undergraduate (11,160 | 25.3%), middle school (9,610 | 21.8%), and high school (8,541 | 19.4%).
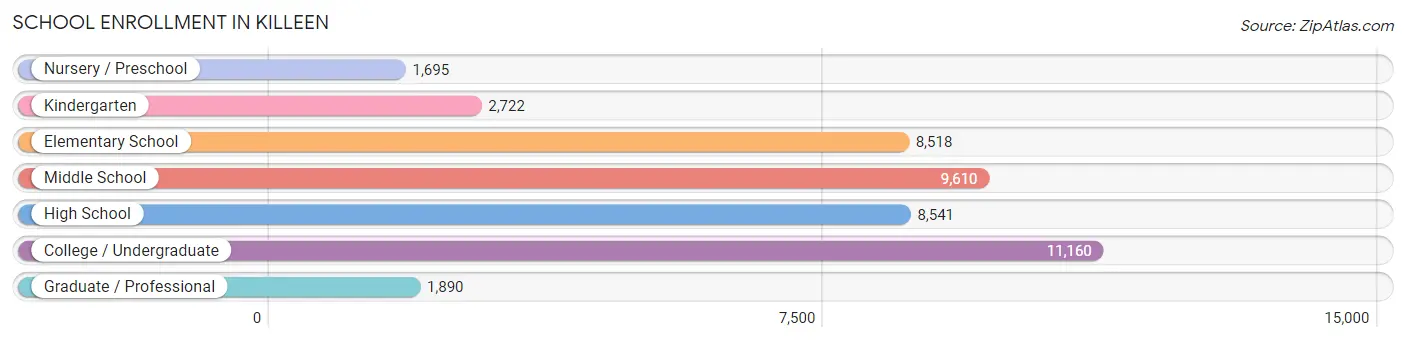
| School Level | # Students | % Students |
| Nursery / Preschool | 1,695 | 3.8% |
| Kindergarten | 2,722 | 6.2% |
| Elementary School | 8,518 | 19.3% |
| Middle School | 9,610 | 21.8% |
| High School | 8,541 | 19.4% |
| College / Undergraduate | 11,160 | 25.3% |
| Graduate / Professional | 1,890 | 4.3% |
| Total | 44,136 | 100.0% |
School Enrollment by Age by Funding Source in Killeen
Out of a total of 44,136 students who are enrolled in schools in Killeen, 4,105 (9.3%) attend a private institution, while the remaining 40,031 (90.7%) are enrolled in public schools. The age group of 3 to 4 year olds has the highest likelihood of being enrolled in private schools, with 312 (20.8% in the age bracket) enrolled. Conversely, the age group of 18 to 19 year olds has the lowest likelihood of being enrolled in a private school, with 1,857 (96.0% in the age bracket) attending a public institution.
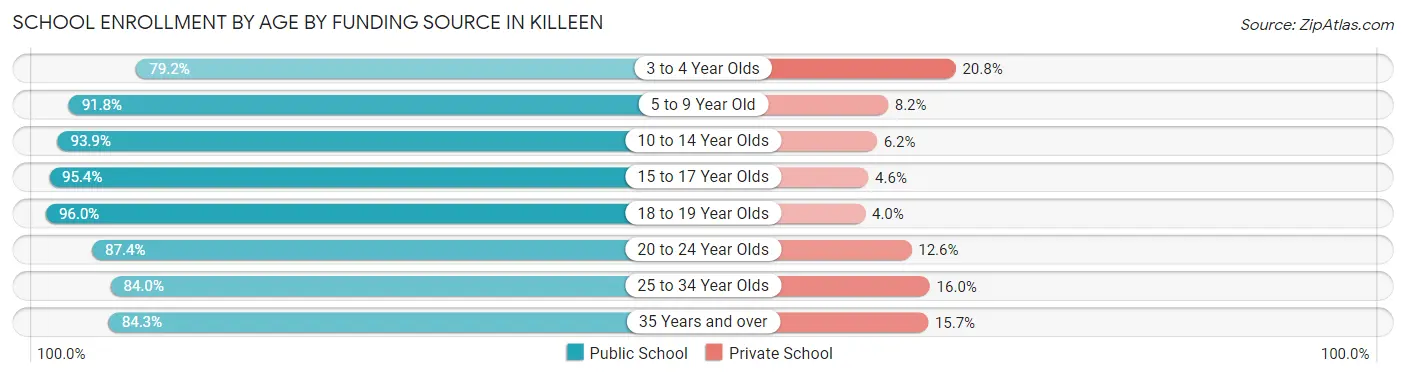
| Age Bracket | Public School | Private School |
| 3 to 4 Year Olds | 1,186 (79.2%) | 312 (20.8%) |
| 5 to 9 Year Old | 9,539 (91.8%) | 854 (8.2%) |
| 10 to 14 Year Olds | 10,819 (93.9%) | 709 (6.1%) |
| 15 to 17 Year Olds | 5,921 (95.4%) | 283 (4.6%) |
| 18 to 19 Year Olds | 1,857 (96.0%) | 77 (4.0%) |
| 20 to 24 Year Olds | 3,417 (87.4%) | 492 (12.6%) |
| 25 to 34 Year Olds | 4,051 (84.0%) | 773 (16.0%) |
| 35 Years and over | 3,242 (84.3%) | 604 (15.7%) |
| Total | 40,031 (90.7%) | 4,105 (9.3%) |
Educational Attainment by Field of Study in Killeen
Business (4,859 | 22.9%), arts & humanities (3,066 | 14.4%), education (2,689 | 12.7%), science & technology (1,912 | 9.0%), and computers & mathematics (1,573 | 7.4%) are the most common fields of study among 21,223 individuals in Killeen who have obtained a bachelor's degree or higher.
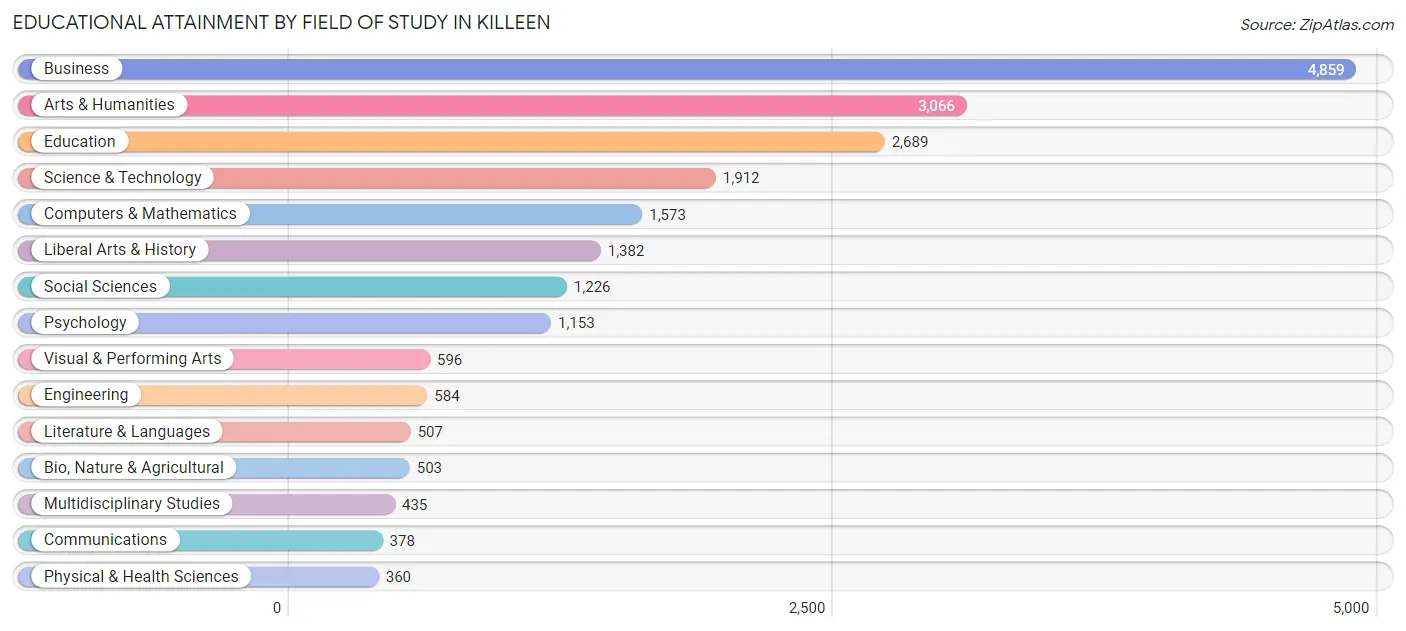
| Field of Study | # Graduates | % Graduates |
| Computers & Mathematics | 1,573 | 7.4% |
| Bio, Nature & Agricultural | 503 | 2.4% |
| Physical & Health Sciences | 360 | 1.7% |
| Psychology | 1,153 | 5.4% |
| Social Sciences | 1,226 | 5.8% |
| Engineering | 584 | 2.8% |
| Multidisciplinary Studies | 435 | 2.1% |
| Science & Technology | 1,912 | 9.0% |
| Business | 4,859 | 22.9% |
| Education | 2,689 | 12.7% |
| Literature & Languages | 507 | 2.4% |
| Liberal Arts & History | 1,382 | 6.5% |
| Visual & Performing Arts | 596 | 2.8% |
| Communications | 378 | 1.8% |
| Arts & Humanities | 3,066 | 14.4% |
| Total | 21,223 | 100.0% |
Transportation & Commute in Killeen
Vehicle Availability by Sex in Killeen
The most prevalent vehicle ownership categories in Killeen are males with 2 vehicles (15,583, accounting for 42.7%) and females with 2 vehicles (12,693, making up 48.0%).
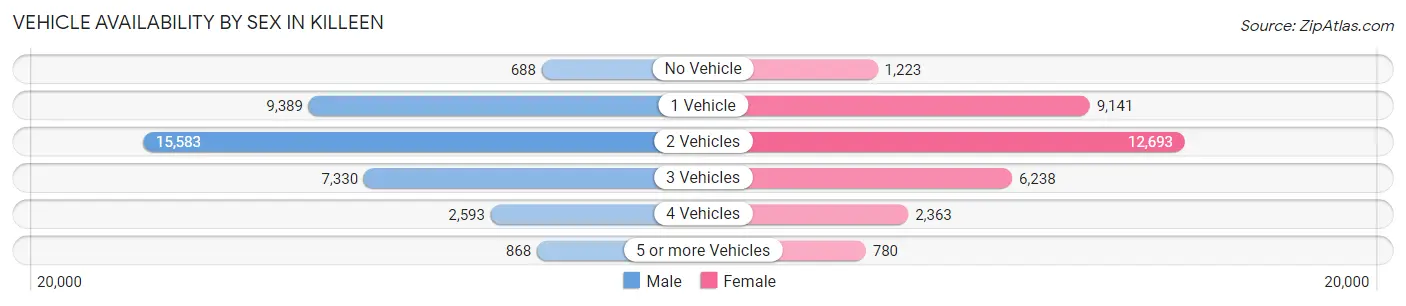
| Vehicles Available | Male | Female |
| No Vehicle | 688 (1.9%) | 1,223 (3.8%) |
| 1 Vehicle | 9,389 (25.8%) | 9,141 (28.2%) |
| 2 Vehicles | 15,583 (42.7%) | 12,693 (39.1%) |
| 3 Vehicles | 7,330 (20.1%) | 6,238 (19.2%) |
| 4 Vehicles | 2,593 (7.1%) | 2,363 (7.3%) |
| 5 or more Vehicles | 868 (2.4%) | 780 (2.4%) |
| Total | 36,451 (100.0%) | 32,438 (100.0%) |
Commute Time in Killeen
The most frequently occuring commute durations in Killeen are 15 to 19 minutes (14,923 commuters, 23.1%), 10 to 14 minutes (11,960 commuters, 18.5%), and 20 to 24 minutes (9,114 commuters, 14.1%).
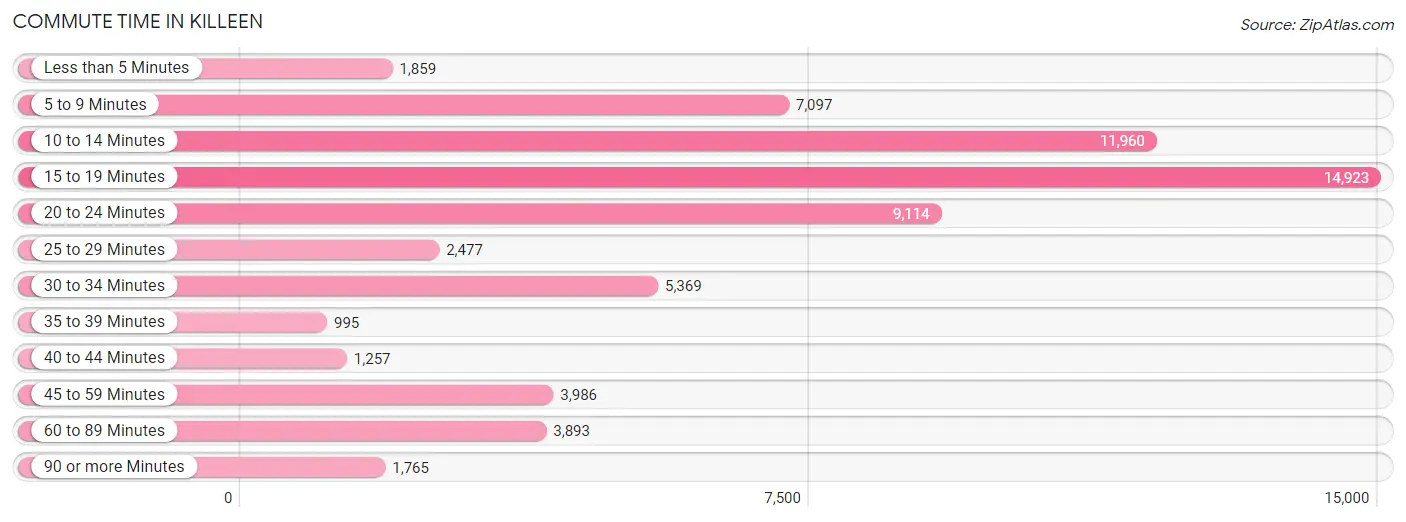
| Commute Time | # Commuters | % Commuters |
| Less than 5 Minutes | 1,859 | 2.9% |
| 5 to 9 Minutes | 7,097 | 11.0% |
| 10 to 14 Minutes | 11,960 | 18.5% |
| 15 to 19 Minutes | 14,923 | 23.1% |
| 20 to 24 Minutes | 9,114 | 14.1% |
| 25 to 29 Minutes | 2,477 | 3.8% |
| 30 to 34 Minutes | 5,369 | 8.3% |
| 35 to 39 Minutes | 995 | 1.5% |
| 40 to 44 Minutes | 1,257 | 1.9% |
| 45 to 59 Minutes | 3,986 | 6.2% |
| 60 to 89 Minutes | 3,893 | 6.0% |
| 90 or more Minutes | 1,765 | 2.7% |
Commute Time by Sex in Killeen
The most common commute times in Killeen are 15 to 19 minutes (7,353 commuters, 21.1%) for males and 15 to 19 minutes (7,570 commuters, 25.4%) for females.
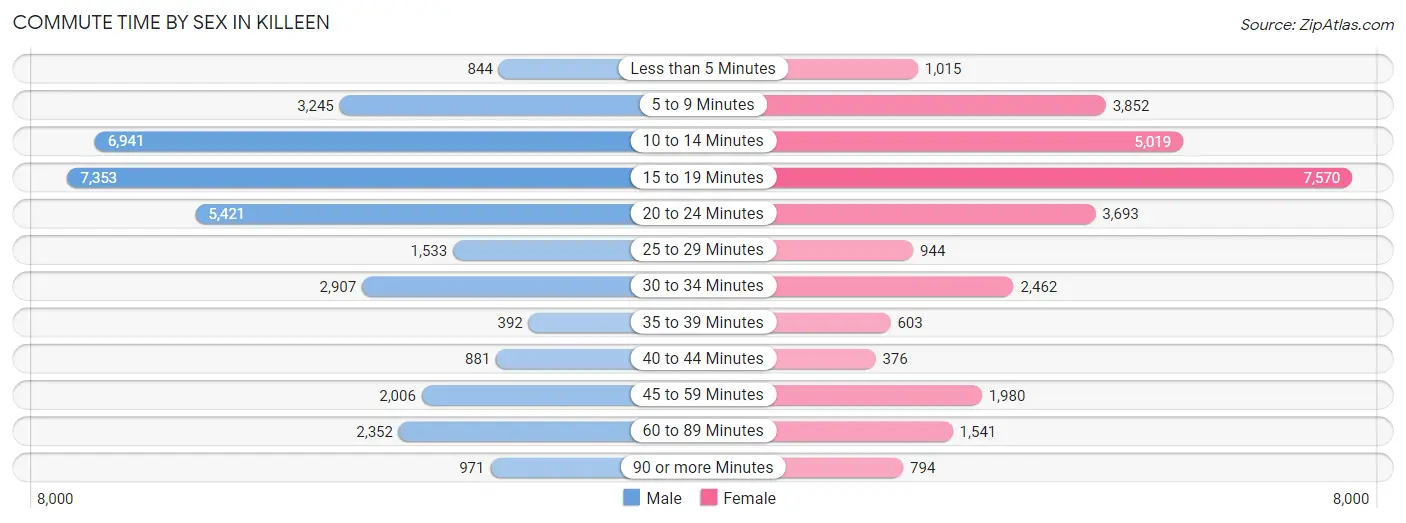
| Commute Time | Male | Female |
| Less than 5 Minutes | 844 (2.4%) | 1,015 (3.4%) |
| 5 to 9 Minutes | 3,245 (9.3%) | 3,852 (12.9%) |
| 10 to 14 Minutes | 6,941 (19.9%) | 5,019 (16.8%) |
| 15 to 19 Minutes | 7,353 (21.1%) | 7,570 (25.4%) |
| 20 to 24 Minutes | 5,421 (15.6%) | 3,693 (12.4%) |
| 25 to 29 Minutes | 1,533 (4.4%) | 944 (3.2%) |
| 30 to 34 Minutes | 2,907 (8.3%) | 2,462 (8.3%) |
| 35 to 39 Minutes | 392 (1.1%) | 603 (2.0%) |
| 40 to 44 Minutes | 881 (2.5%) | 376 (1.3%) |
| 45 to 59 Minutes | 2,006 (5.8%) | 1,980 (6.6%) |
| 60 to 89 Minutes | 2,352 (6.8%) | 1,541 (5.2%) |
| 90 or more Minutes | 971 (2.8%) | 794 (2.7%) |
Time of Departure to Work by Sex in Killeen
The most frequent times of departure to work in Killeen are 5:30 AM to 5:59 AM (5,086, 14.6%) for males and 7:00 AM to 7:29 AM (3,945, 13.2%) for females.
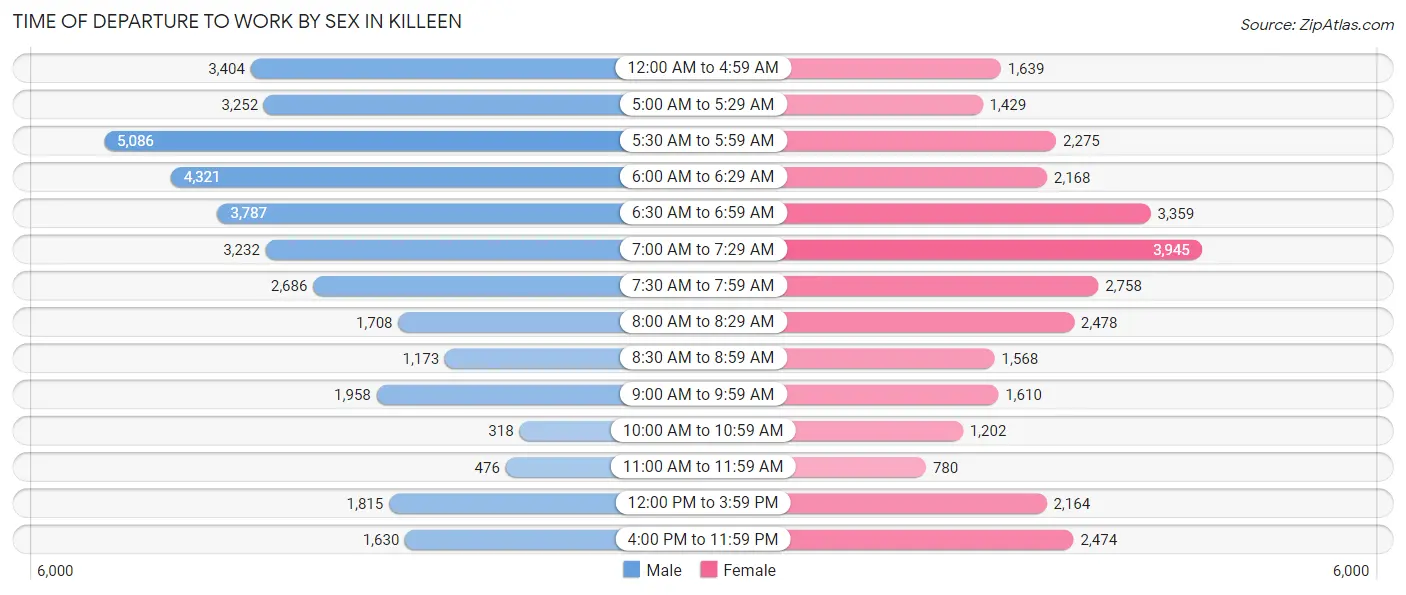
| Time of Departure | Male | Female |
| 12:00 AM to 4:59 AM | 3,404 (9.8%) | 1,639 (5.5%) |
| 5:00 AM to 5:29 AM | 3,252 (9.3%) | 1,429 (4.8%) |
| 5:30 AM to 5:59 AM | 5,086 (14.6%) | 2,275 (7.6%) |
| 6:00 AM to 6:29 AM | 4,321 (12.4%) | 2,168 (7.3%) |
| 6:30 AM to 6:59 AM | 3,787 (10.9%) | 3,359 (11.3%) |
| 7:00 AM to 7:29 AM | 3,232 (9.3%) | 3,945 (13.2%) |
| 7:30 AM to 7:59 AM | 2,686 (7.7%) | 2,758 (9.2%) |
| 8:00 AM to 8:29 AM | 1,708 (4.9%) | 2,478 (8.3%) |
| 8:30 AM to 8:59 AM | 1,173 (3.4%) | 1,568 (5.2%) |
| 9:00 AM to 9:59 AM | 1,958 (5.6%) | 1,610 (5.4%) |
| 10:00 AM to 10:59 AM | 318 (0.9%) | 1,202 (4.0%) |
| 11:00 AM to 11:59 AM | 476 (1.4%) | 780 (2.6%) |
| 12:00 PM to 3:59 PM | 1,815 (5.2%) | 2,164 (7.2%) |
| 4:00 PM to 11:59 PM | 1,630 (4.7%) | 2,474 (8.3%) |
| Total | 34,846 (100.0%) | 29,849 (100.0%) |
Housing Occupancy in Killeen
Occupancy by Ownership in Killeen
Of the total 57,570 dwellings in Killeen, owner-occupied units account for 26,629 (46.3%), while renter-occupied units make up 30,941 (53.7%).
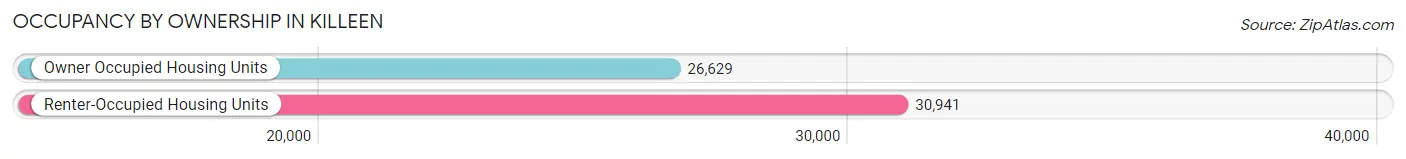
| Occupancy | # Housing Units | % Housing Units |
| Owner Occupied Housing Units | 26,629 | 46.3% |
| Renter-Occupied Housing Units | 30,941 | 53.7% |
| Total Occupied Housing Units | 57,570 | 100.0% |
Occupancy by Household Size in Killeen
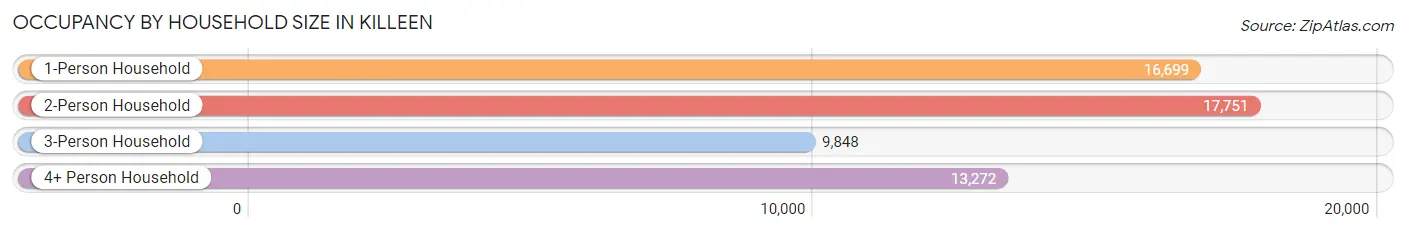
| Household Size | # Housing Units | % Housing Units |
| 1-Person Household | 16,699 | 29.0% |
| 2-Person Household | 17,751 | 30.8% |
| 3-Person Household | 9,848 | 17.1% |
| 4+ Person Household | 13,272 | 23.1% |
| Total Housing Units | 57,570 | 100.0% |
Occupancy by Ownership by Household Size in Killeen
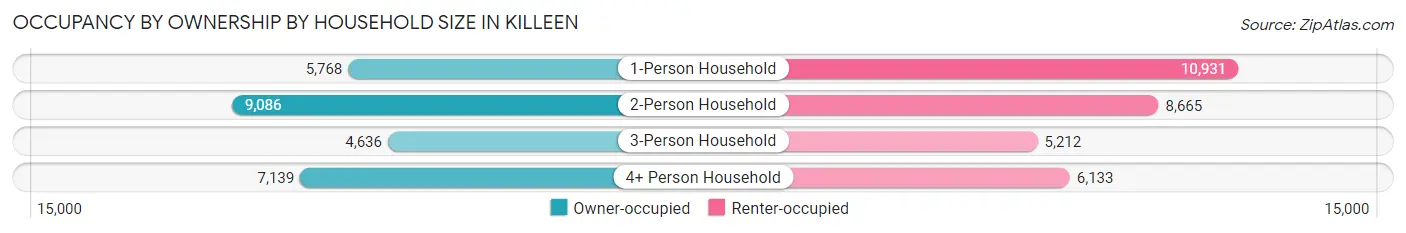
| Household Size | Owner-occupied | Renter-occupied |
| 1-Person Household | 5,768 (34.5%) | 10,931 (65.5%) |
| 2-Person Household | 9,086 (51.2%) | 8,665 (48.8%) |
| 3-Person Household | 4,636 (47.1%) | 5,212 (52.9%) |
| 4+ Person Household | 7,139 (53.8%) | 6,133 (46.2%) |
| Total Housing Units | 26,629 (46.3%) | 30,941 (53.7%) |
Occupancy by Educational Attainment in Killeen
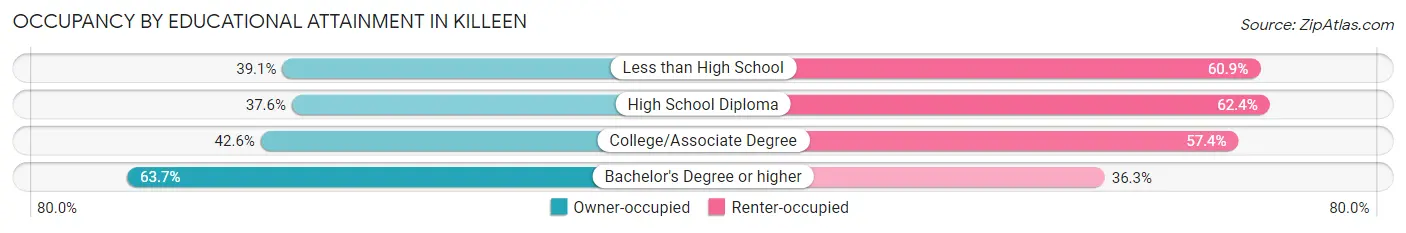
| Household Size | Owner-occupied | Renter-occupied |
| Less than High School | 1,456 (39.1%) | 2,265 (60.9%) |
| High School Diploma | 4,828 (37.6%) | 8,004 (62.4%) |
| College/Associate Degree | 11,653 (42.6%) | 15,726 (57.4%) |
| Bachelor's Degree or higher | 8,692 (63.7%) | 4,946 (36.3%) |
Occupancy by Age of Householder in Killeen
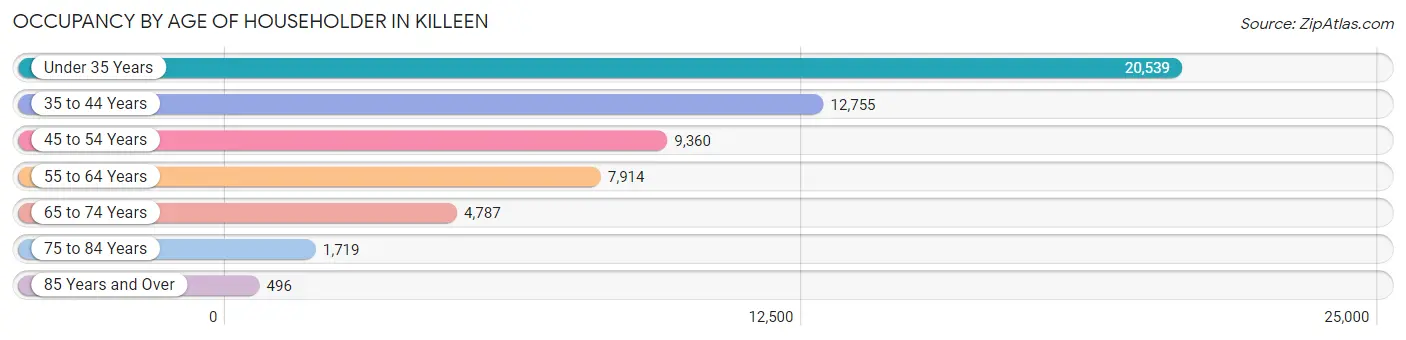
| Age Bracket | # Households | % Households |
| Under 35 Years | 20,539 | 35.7% |
| 35 to 44 Years | 12,755 | 22.2% |
| 45 to 54 Years | 9,360 | 16.3% |
| 55 to 64 Years | 7,914 | 13.8% |
| 65 to 74 Years | 4,787 | 8.3% |
| 75 to 84 Years | 1,719 | 3.0% |
| 85 Years and Over | 496 | 0.9% |
| Total | 57,570 | 100.0% |
Housing Finances in Killeen
Median Income by Occupancy in Killeen
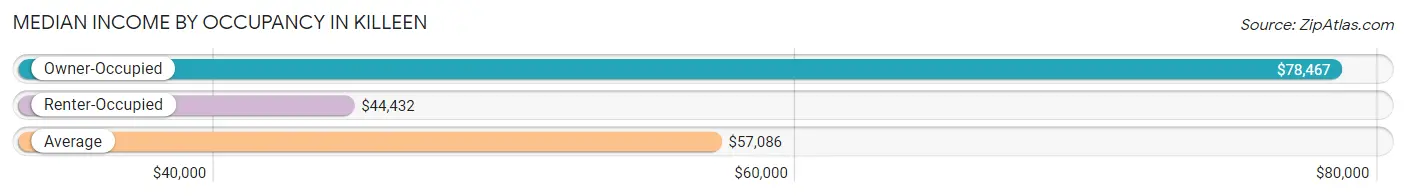
| Occupancy Type | # Households | Median Income |
| Owner-Occupied | 26,629 (46.3%) | $78,467 |
| Renter-Occupied | 30,941 (53.7%) | $44,432 |
| Average | 57,570 (100.0%) | $57,086 |
Occupancy by Householder Income Bracket in Killeen
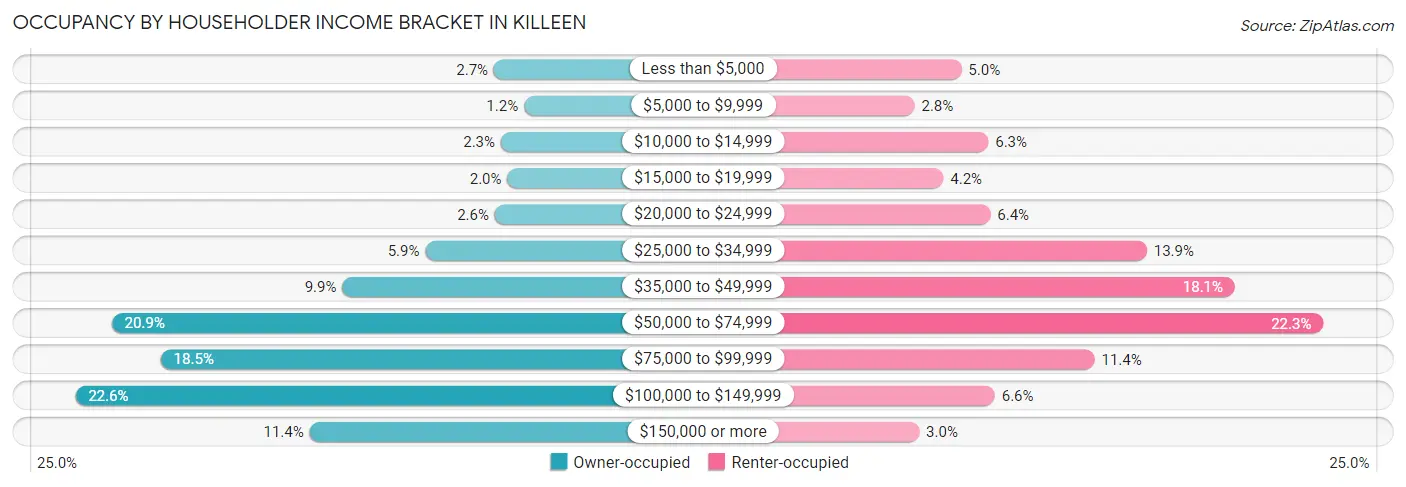
| Income Bracket | Owner-occupied | Renter-occupied |
| Less than $5,000 | 705 (2.6%) | 1,560 (5.0%) |
| $5,000 to $9,999 | 325 (1.2%) | 868 (2.8%) |
| $10,000 to $14,999 | 618 (2.3%) | 1,954 (6.3%) |
| $15,000 to $19,999 | 535 (2.0%) | 1,292 (4.2%) |
| $20,000 to $24,999 | 696 (2.6%) | 1,986 (6.4%) |
| $25,000 to $34,999 | 1,577 (5.9%) | 4,292 (13.9%) |
| $35,000 to $49,999 | 2,628 (9.9%) | 5,589 (18.1%) |
| $50,000 to $74,999 | 5,554 (20.9%) | 6,892 (22.3%) |
| $75,000 to $99,999 | 4,931 (18.5%) | 3,522 (11.4%) |
| $100,000 to $149,999 | 6,015 (22.6%) | 2,050 (6.6%) |
| $150,000 or more | 3,045 (11.4%) | 936 (3.0%) |
| Total | 26,629 (100.0%) | 30,941 (100.0%) |
Monthly Housing Cost Tiers in Killeen
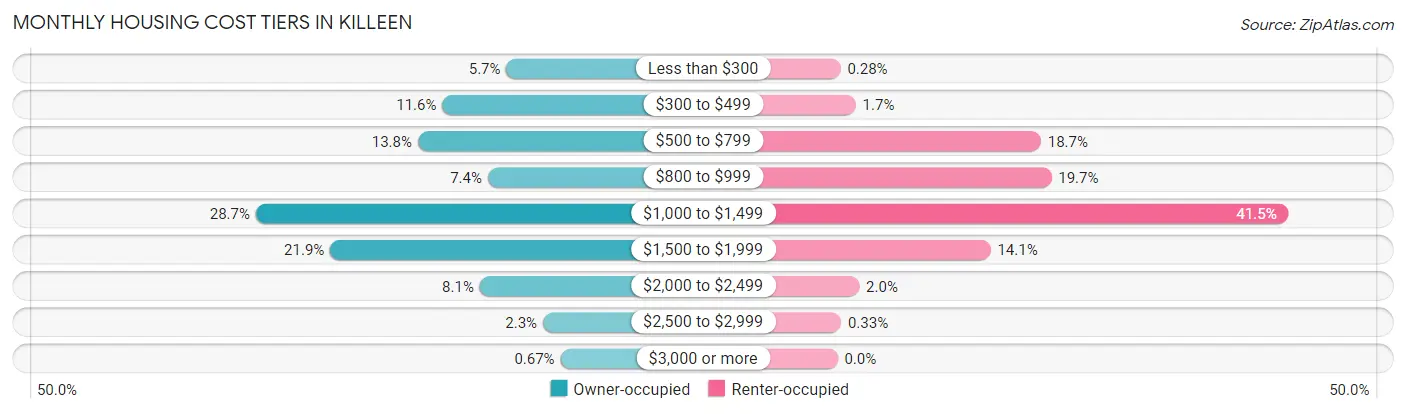
| Monthly Cost | Owner-occupied | Renter-occupied |
| Less than $300 | 1,504 (5.7%) | 87 (0.3%) |
| $300 to $499 | 3,076 (11.6%) | 519 (1.7%) |
| $500 to $799 | 3,674 (13.8%) | 5,791 (18.7%) |
| $800 to $999 | 1,959 (7.4%) | 6,092 (19.7%) |
| $1,000 to $1,499 | 7,648 (28.7%) | 12,851 (41.5%) |
| $1,500 to $1,999 | 5,824 (21.9%) | 4,359 (14.1%) |
| $2,000 to $2,499 | 2,157 (8.1%) | 619 (2.0%) |
| $2,500 to $2,999 | 608 (2.3%) | 102 (0.3%) |
| $3,000 or more | 179 (0.7%) | 0 (0.0%) |
| Total | 26,629 (100.0%) | 30,941 (100.0%) |
Physical Housing Characteristics in Killeen
Housing Structures in Killeen
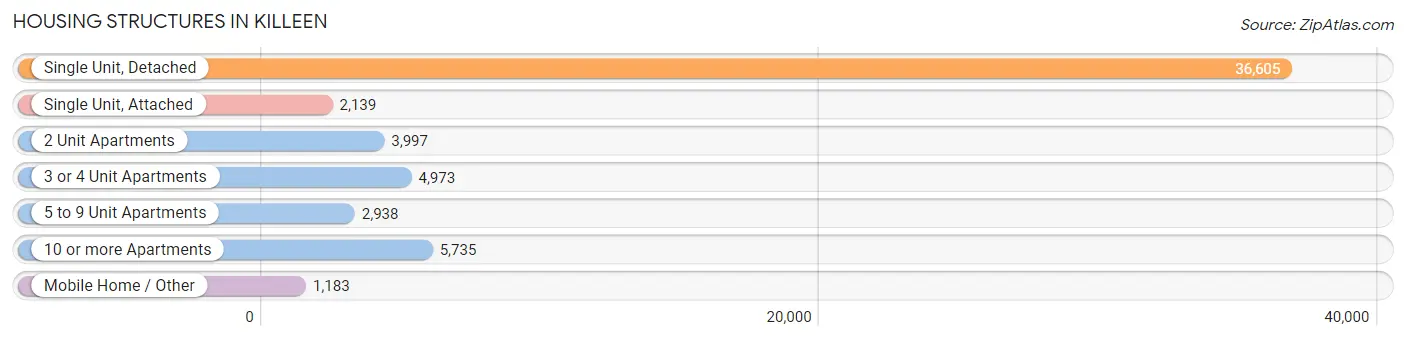
| Structure Type | # Housing Units | % Housing Units |
| Single Unit, Detached | 36,605 | 63.6% |
| Single Unit, Attached | 2,139 | 3.7% |
| 2 Unit Apartments | 3,997 | 6.9% |
| 3 or 4 Unit Apartments | 4,973 | 8.6% |
| 5 to 9 Unit Apartments | 2,938 | 5.1% |
| 10 or more Apartments | 5,735 | 10.0% |
| Mobile Home / Other | 1,183 | 2.1% |
| Total | 57,570 | 100.0% |
Housing Structures by Occupancy in Killeen
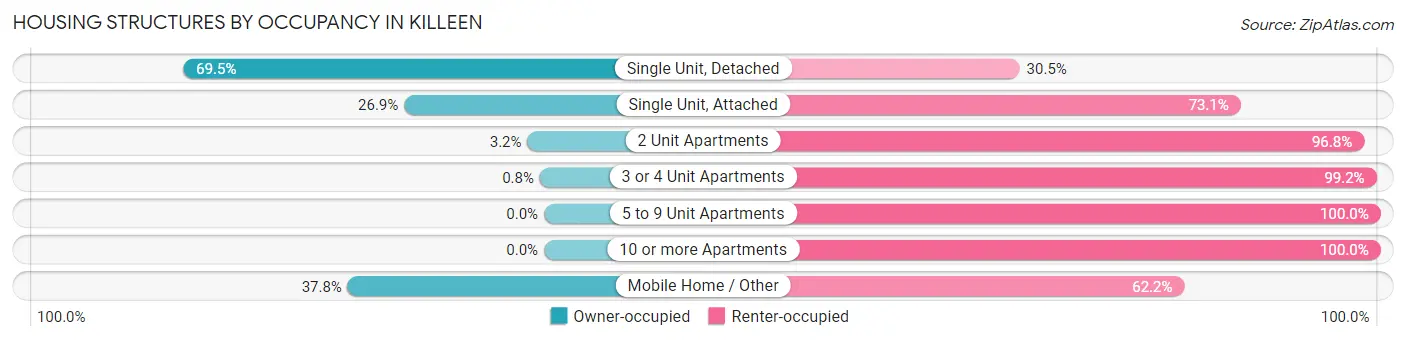
| Structure Type | Owner-occupied | Renter-occupied |
| Single Unit, Detached | 25,438 (69.5%) | 11,167 (30.5%) |
| Single Unit, Attached | 576 (26.9%) | 1,563 (73.1%) |
| 2 Unit Apartments | 128 (3.2%) | 3,869 (96.8%) |
| 3 or 4 Unit Apartments | 40 (0.8%) | 4,933 (99.2%) |
| 5 to 9 Unit Apartments | 0 (0.0%) | 2,938 (100.0%) |
| 10 or more Apartments | 0 (0.0%) | 5,735 (100.0%) |
| Mobile Home / Other | 447 (37.8%) | 736 (62.2%) |
| Total | 26,629 (46.3%) | 30,941 (53.7%) |
Housing Structures by Number of Rooms in Killeen
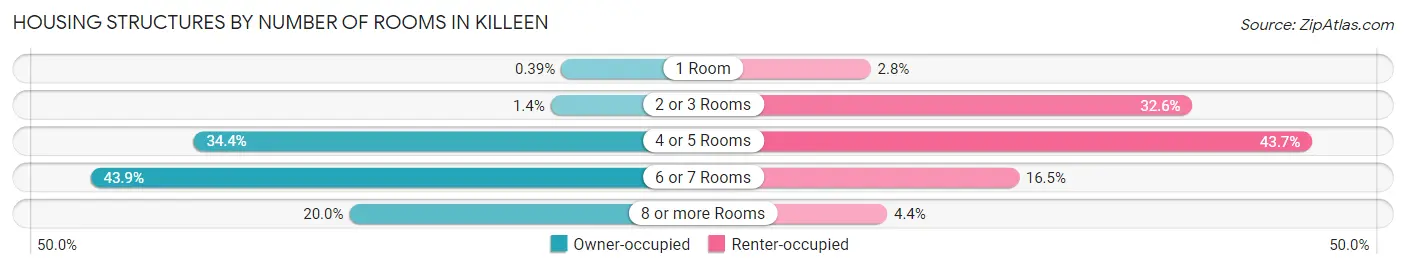
| Number of Rooms | Owner-occupied | Renter-occupied |
| 1 Room | 105 (0.4%) | 878 (2.8%) |
| 2 or 3 Rooms | 362 (1.4%) | 10,086 (32.6%) |
| 4 or 5 Rooms | 9,154 (34.4%) | 13,512 (43.7%) |
| 6 or 7 Rooms | 11,689 (43.9%) | 5,117 (16.5%) |
| 8 or more Rooms | 5,319 (20.0%) | 1,348 (4.4%) |
| Total | 26,629 (100.0%) | 30,941 (100.0%) |
Housing Structure by Heating Type in Killeen
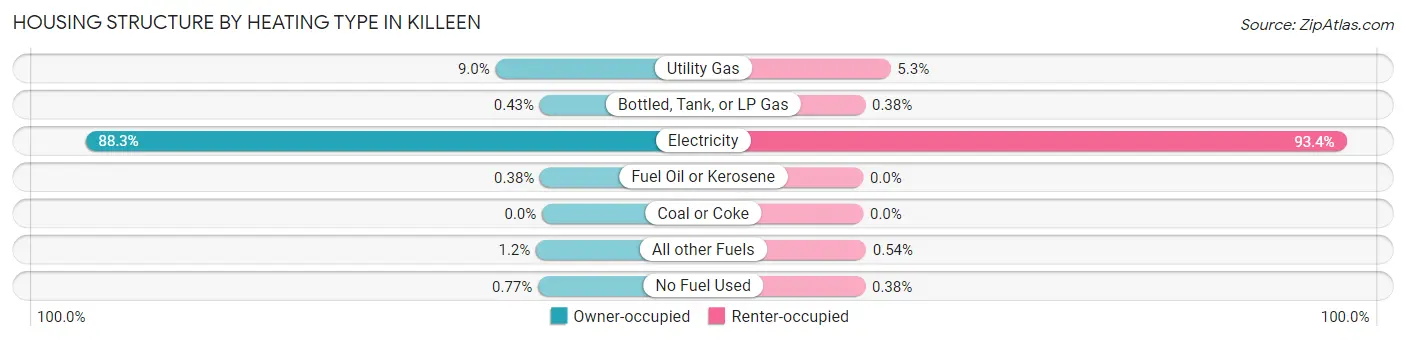
| Heating Type | Owner-occupied | Renter-occupied |
| Utility Gas | 2,396 (9.0%) | 1,638 (5.3%) |
| Bottled, Tank, or LP Gas | 115 (0.4%) | 119 (0.4%) |
| Electricity | 23,501 (88.2%) | 28,898 (93.4%) |
| Fuel Oil or Kerosene | 102 (0.4%) | 0 (0.0%) |
| Coal or Coke | 0 (0.0%) | 0 (0.0%) |
| All other Fuels | 309 (1.2%) | 168 (0.5%) |
| No Fuel Used | 206 (0.8%) | 118 (0.4%) |
| Total | 26,629 (100.0%) | 30,941 (100.0%) |
Household Vehicle Usage in Killeen
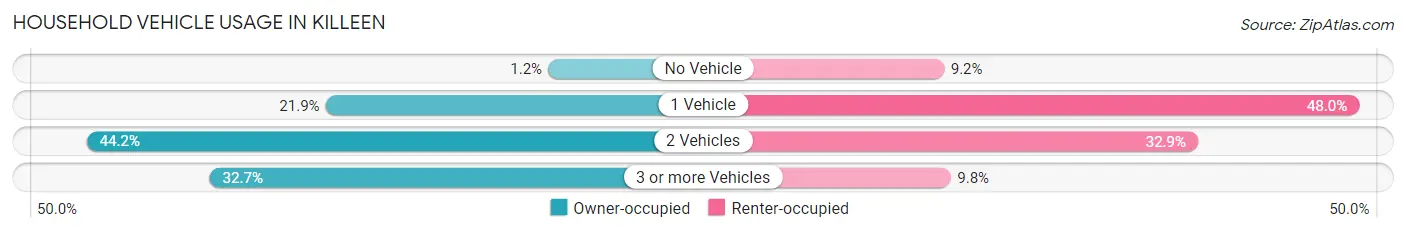
| Vehicles per Household | Owner-occupied | Renter-occupied |
| No Vehicle | 307 (1.1%) | 2,855 (9.2%) |
| 1 Vehicle | 5,837 (21.9%) | 14,849 (48.0%) |
| 2 Vehicles | 11,772 (44.2%) | 10,191 (32.9%) |
| 3 or more Vehicles | 8,713 (32.7%) | 3,046 (9.8%) |
| Total | 26,629 (100.0%) | 30,941 (100.0%) |
Real Estate & Mortgages in Killeen
Real Estate and Mortgage Overview in Killeen
| Characteristic | Without Mortgage | With Mortgage |
| Housing Units | 8,495 | 18,134 |
| Median Property Value | $139,800 | $190,000 |
| Median Household Income | $66,921 | $2,385 |
| Monthly Housing Costs | $490 | $129 |
| Real Estate Taxes | $2,218 | $4,022 |
Property Value by Mortgage Status in Killeen
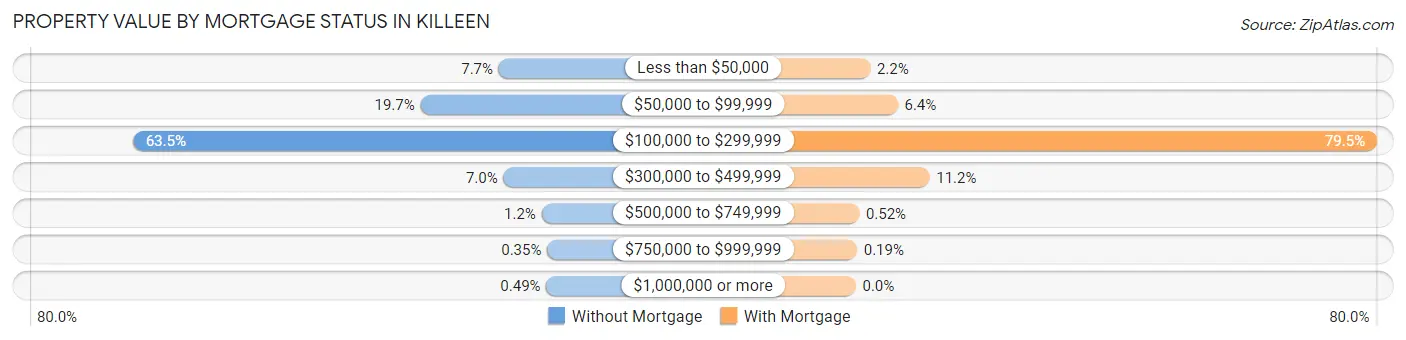
| Property Value | Without Mortgage | With Mortgage |
| Less than $50,000 | 657 (7.7%) | 399 (2.2%) |
| $50,000 to $99,999 | 1,671 (19.7%) | 1,160 (6.4%) |
| $100,000 to $299,999 | 5,396 (63.5%) | 14,407 (79.4%) |
| $300,000 to $499,999 | 596 (7.0%) | 2,039 (11.2%) |
| $500,000 to $749,999 | 103 (1.2%) | 95 (0.5%) |
| $750,000 to $999,999 | 30 (0.4%) | 34 (0.2%) |
| $1,000,000 or more | 42 (0.5%) | 0 (0.0%) |
| Total | 8,495 (100.0%) | 18,134 (100.0%) |
Household Income by Mortgage Status in Killeen
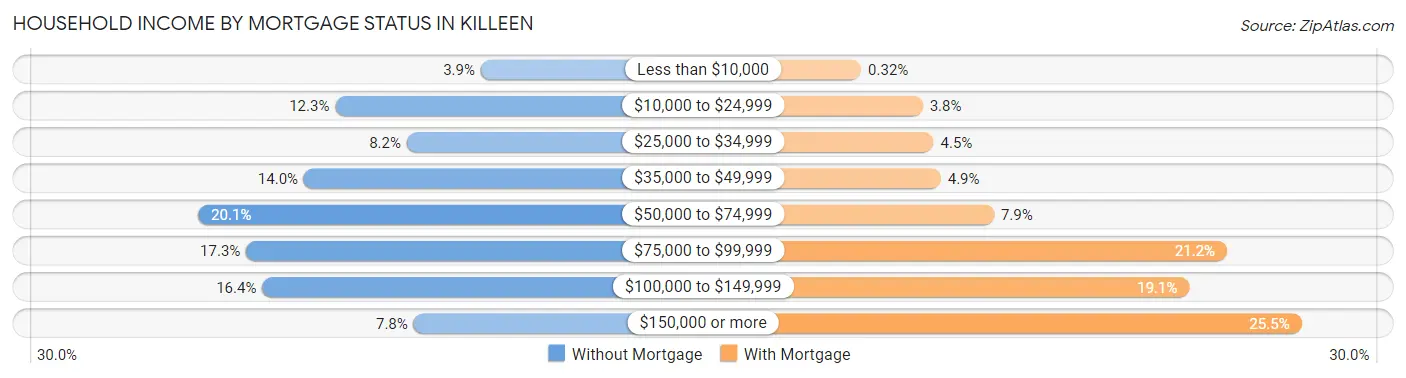
| Household Income | Without Mortgage | With Mortgage |
| Less than $10,000 | 334 (3.9%) | 58 (0.3%) |
| $10,000 to $24,999 | 1,041 (12.2%) | 696 (3.8%) |
| $25,000 to $34,999 | 693 (8.2%) | 808 (4.5%) |
| $35,000 to $49,999 | 1,193 (14.0%) | 884 (4.9%) |
| $50,000 to $74,999 | 1,706 (20.1%) | 1,435 (7.9%) |
| $75,000 to $99,999 | 1,473 (17.3%) | 3,848 (21.2%) |
| $100,000 to $149,999 | 1,395 (16.4%) | 3,458 (19.1%) |
| $150,000 or more | 660 (7.8%) | 4,620 (25.5%) |
| Total | 8,495 (100.0%) | 18,134 (100.0%) |
Property Value to Household Income Ratio in Killeen
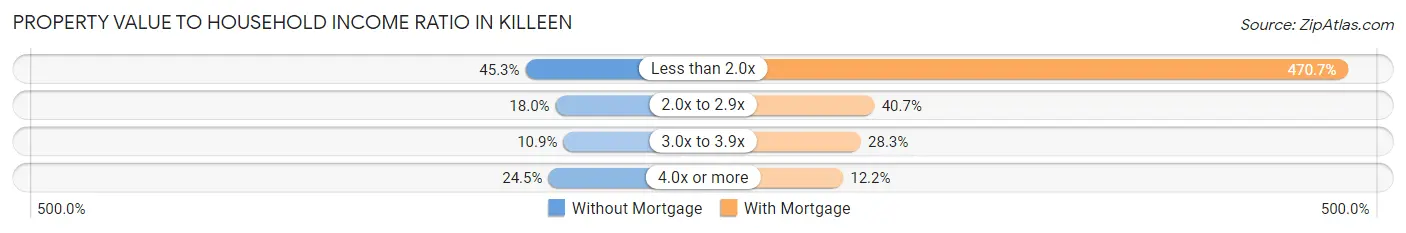
| Value-to-Income Ratio | Without Mortgage | With Mortgage |
| Less than 2.0x | 3,846 (45.3%) | 85,353 (470.7%) |
| 2.0x to 2.9x | 1,528 (18.0%) | 7,378 (40.7%) |
| 3.0x to 3.9x | 926 (10.9%) | 5,134 (28.3%) |
| 4.0x or more | 2,078 (24.5%) | 2,206 (12.2%) |
| Total | 8,495 (100.0%) | 18,134 (100.0%) |
Real Estate Taxes by Mortgage Status in Killeen
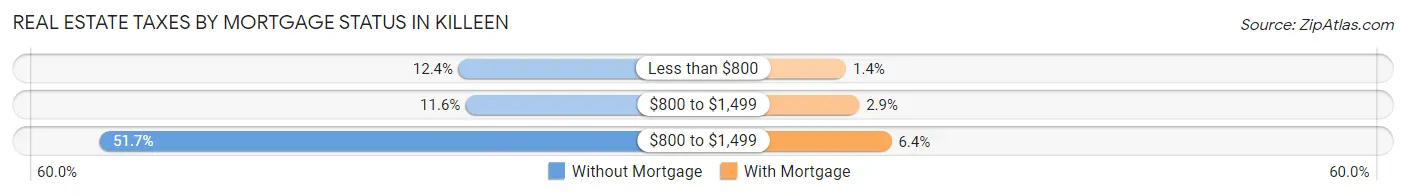
| Property Taxes | Without Mortgage | With Mortgage |
| Less than $800 | 1,054 (12.4%) | 259 (1.4%) |
| $800 to $1,499 | 986 (11.6%) | 520 (2.9%) |
| $800 to $1,499 | 4,394 (51.7%) | 1,160 (6.4%) |
| Total | 8,495 (100.0%) | 18,134 (100.0%) |
Health & Disability in Killeen
Health Insurance Coverage by Age in Killeen
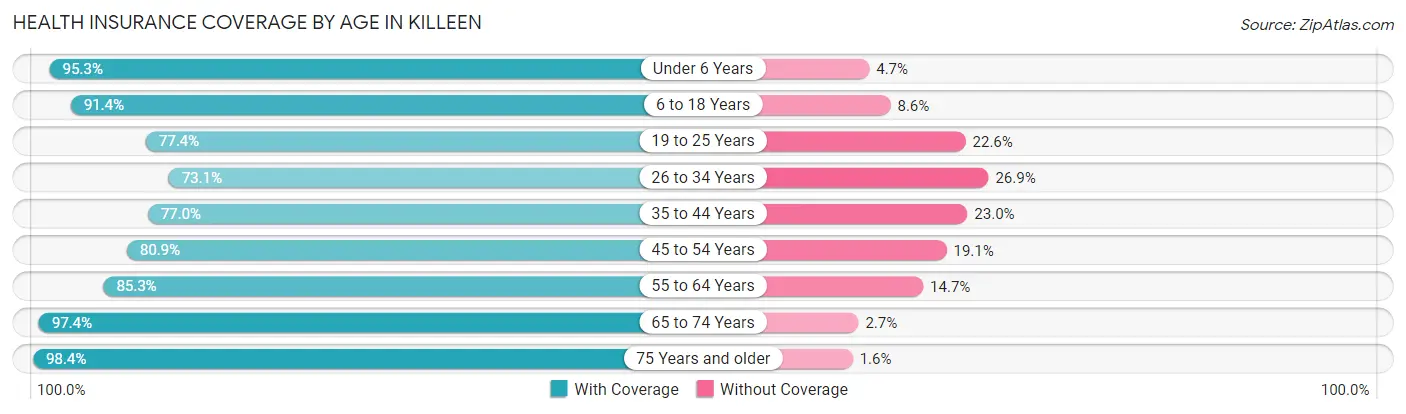
| Age Bracket | With Coverage | Without Coverage |
| Under 6 Years | 16,257 (95.3%) | 794 (4.7%) |
| 6 to 18 Years | 27,129 (91.4%) | 2,558 (8.6%) |
| 19 to 25 Years | 11,296 (77.4%) | 3,302 (22.6%) |
| 26 to 34 Years | 16,146 (73.1%) | 5,939 (26.9%) |
| 35 to 44 Years | 14,952 (77.0%) | 4,457 (23.0%) |
| 45 to 54 Years | 12,715 (80.9%) | 2,996 (19.1%) |
| 55 to 64 Years | 11,450 (85.3%) | 1,974 (14.7%) |
| 65 to 74 Years | 7,499 (97.4%) | 204 (2.6%) |
| 75 Years and older | 3,632 (98.4%) | 58 (1.6%) |
| Total | 121,076 (84.5%) | 22,282 (15.5%) |
Health Insurance Coverage by Citizenship Status in Killeen
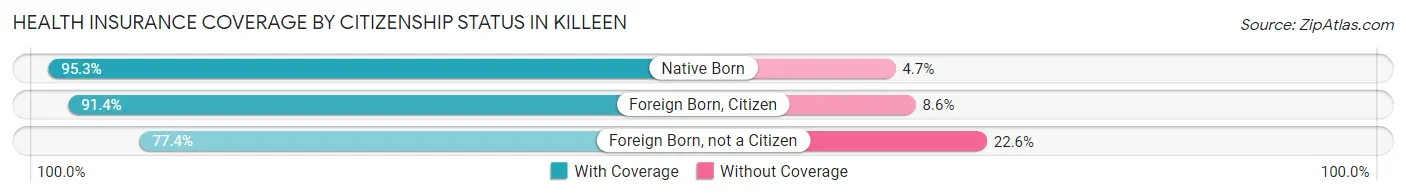
| Citizenship Status | With Coverage | Without Coverage |
| Native Born | 16,257 (95.3%) | 794 (4.7%) |
| Foreign Born, Citizen | 27,129 (91.4%) | 2,558 (8.6%) |
| Foreign Born, not a Citizen | 11,296 (77.4%) | 3,302 (22.6%) |
Health Insurance Coverage by Household Income in Killeen
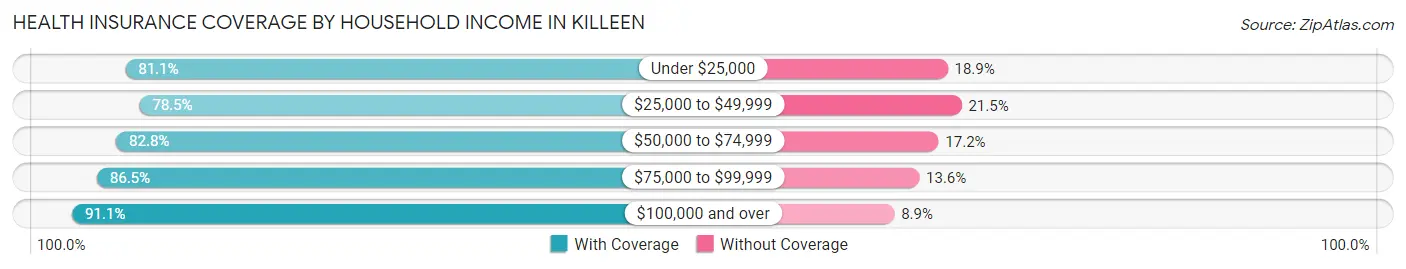
| Household Income | With Coverage | Without Coverage |
| Under $25,000 | 17,298 (81.1%) | 4,024 (18.9%) |
| $25,000 to $49,999 | 24,779 (78.5%) | 6,782 (21.5%) |
| $50,000 to $74,999 | 23,723 (82.8%) | 4,914 (17.2%) |
| $75,000 to $99,999 | 19,531 (86.5%) | 3,060 (13.6%) |
| $100,000 and over | 35,713 (91.1%) | 3,484 (8.9%) |
Public vs Private Health Insurance Coverage by Age in Killeen
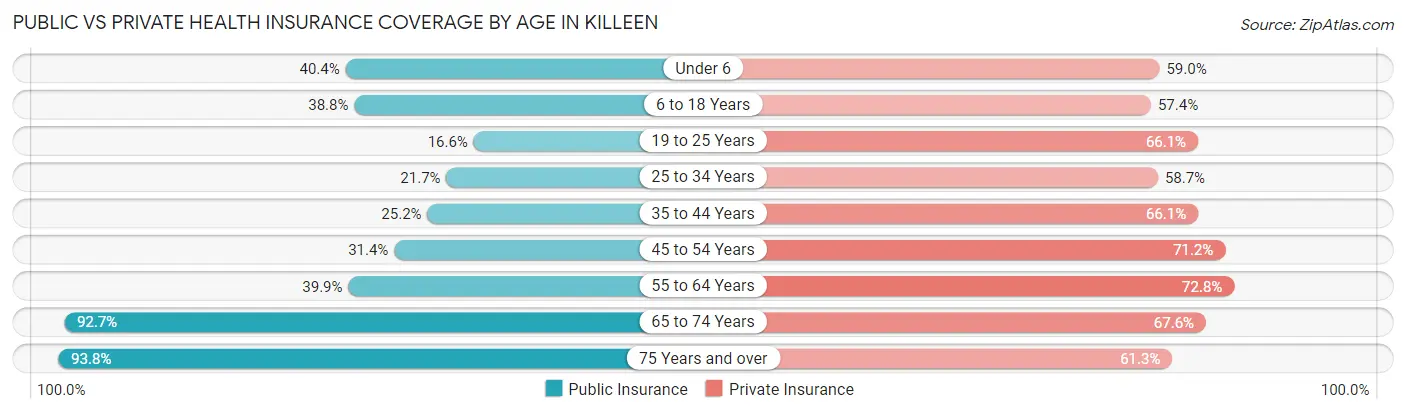
| Age Bracket | Public Insurance | Private Insurance |
| Under 6 | 6,894 (40.4%) | 10,055 (59.0%) |
| 6 to 18 Years | 11,522 (38.8%) | 17,036 (57.4%) |
| 19 to 25 Years | 2,429 (16.6%) | 9,649 (66.1%) |
| 25 to 34 Years | 4,794 (21.7%) | 12,960 (58.7%) |
| 35 to 44 Years | 4,896 (25.2%) | 12,834 (66.1%) |
| 45 to 54 Years | 4,934 (31.4%) | 11,180 (71.2%) |
| 55 to 64 Years | 5,358 (39.9%) | 9,776 (72.8%) |
| 65 to 74 Years | 7,140 (92.7%) | 5,206 (67.6%) |
| 75 Years and over | 3,461 (93.8%) | 2,263 (61.3%) |
| Total | 51,428 (35.9%) | 90,959 (63.4%) |
Disability Status by Sex by Age in Killeen
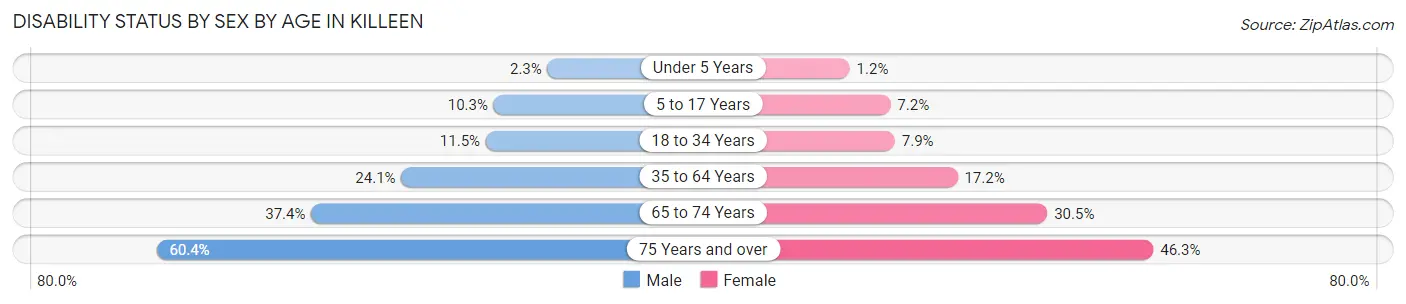
| Age Bracket | Male | Female |
| Under 5 Years | 173 (2.3%) | 84 (1.2%) |
| 5 to 17 Years | 1,665 (10.3%) | 1,018 (7.2%) |
| 18 to 34 Years | 2,016 (11.5%) | 1,660 (7.9%) |
| 35 to 64 Years | 5,277 (24.0%) | 4,569 (17.2%) |
| 65 to 74 Years | 1,291 (37.4%) | 1,298 (30.5%) |
| 75 Years and over | 832 (60.4%) | 1,070 (46.3%) |
Disability Class by Sex by Age in Killeen
Disability Class: Hearing Difficulty
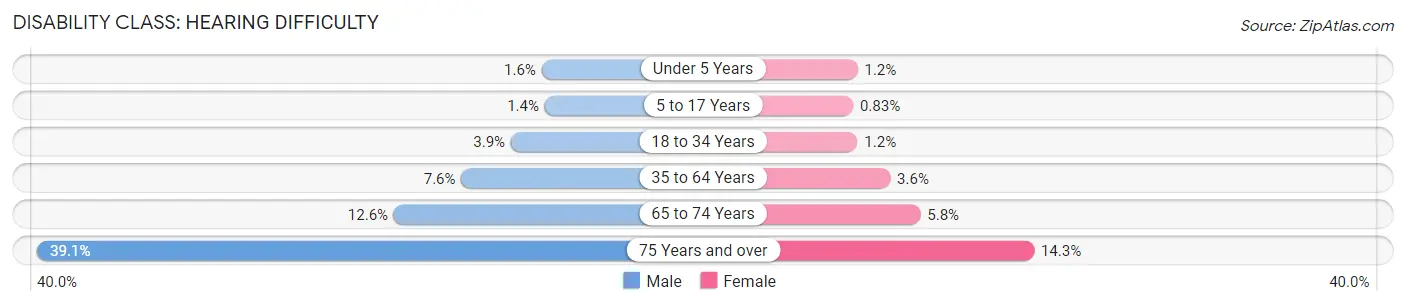
| Age Bracket | Male | Female |
| Under 5 Years | 119 (1.6%) | 84 (1.2%) |
| 5 to 17 Years | 222 (1.4%) | 117 (0.8%) |
| 18 to 34 Years | 683 (3.9%) | 245 (1.2%) |
| 35 to 64 Years | 1,661 (7.6%) | 954 (3.6%) |
| 65 to 74 Years | 434 (12.6%) | 248 (5.8%) |
| 75 Years and over | 538 (39.1%) | 330 (14.3%) |
Disability Class: Vision Difficulty
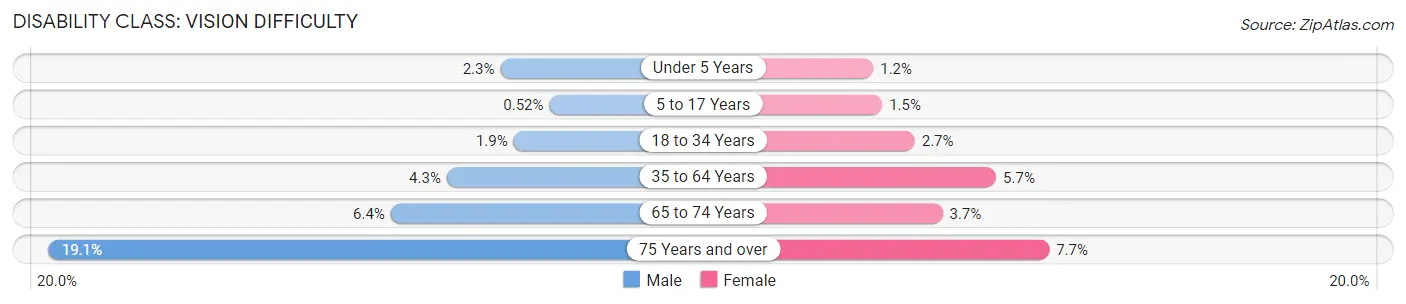
| Age Bracket | Male | Female |
| Under 5 Years | 173 (2.3%) | 84 (1.2%) |
| 5 to 17 Years | 83 (0.5%) | 211 (1.5%) |
| 18 to 34 Years | 325 (1.8%) | 571 (2.7%) |
| 35 to 64 Years | 951 (4.3%) | 1,524 (5.7%) |
| 65 to 74 Years | 221 (6.4%) | 159 (3.7%) |
| 75 Years and over | 263 (19.1%) | 178 (7.7%) |
Disability Class: Cognitive Difficulty
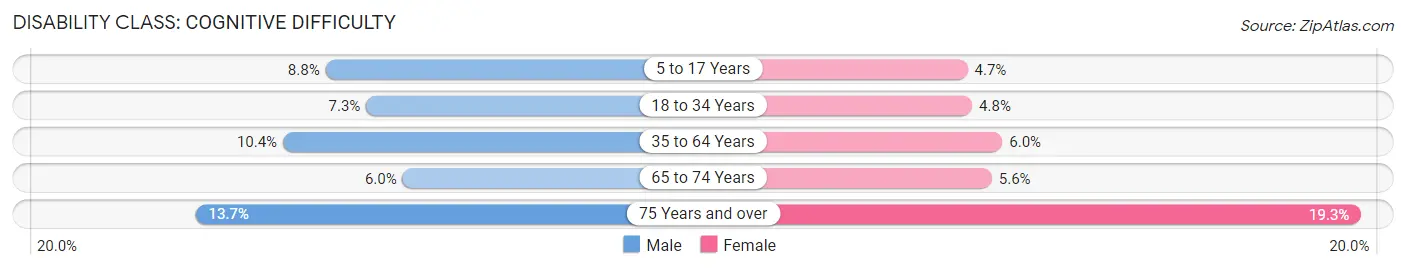
| Age Bracket | Male | Female |
| 5 to 17 Years | 1,423 (8.8%) | 659 (4.7%) |
| 18 to 34 Years | 1,283 (7.3%) | 1,020 (4.8%) |
| 35 to 64 Years | 2,284 (10.4%) | 1,585 (6.0%) |
| 65 to 74 Years | 206 (6.0%) | 237 (5.6%) |
| 75 Years and over | 188 (13.7%) | 446 (19.3%) |
Disability Class: Ambulatory Difficulty
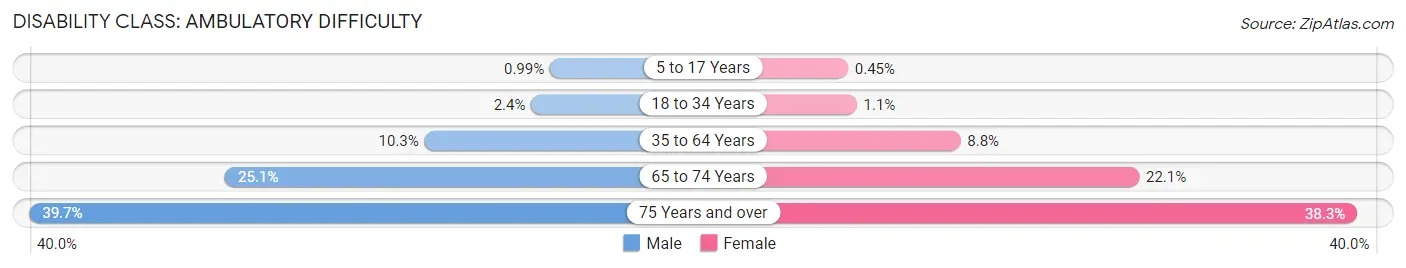
| Age Bracket | Male | Female |
| 5 to 17 Years | 159 (1.0%) | 63 (0.4%) |
| 18 to 34 Years | 417 (2.4%) | 232 (1.1%) |
| 35 to 64 Years | 2,259 (10.3%) | 2,342 (8.8%) |
| 65 to 74 Years | 866 (25.1%) | 939 (22.1%) |
| 75 Years and over | 546 (39.7%) | 885 (38.3%) |
Disability Class: Self-Care Difficulty
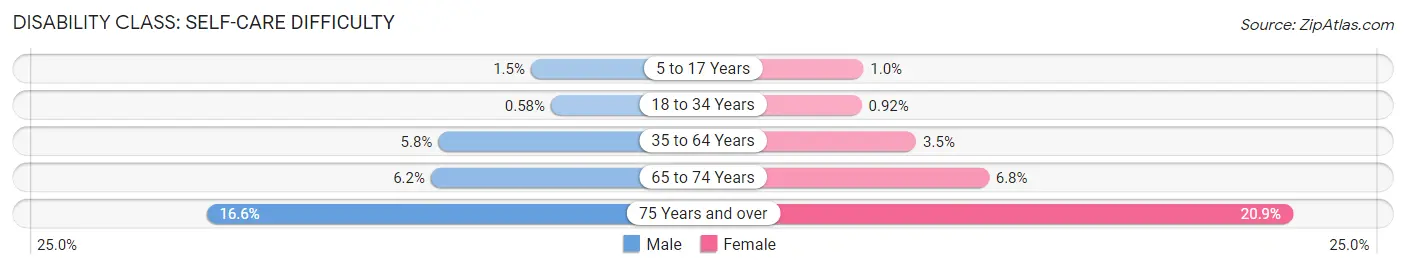
| Age Bracket | Male | Female |
| 5 to 17 Years | 244 (1.5%) | 141 (1.0%) |
| 18 to 34 Years | 102 (0.6%) | 194 (0.9%) |
| 35 to 64 Years | 1,275 (5.8%) | 918 (3.5%) |
| 65 to 74 Years | 212 (6.1%) | 290 (6.8%) |
| 75 Years and over | 228 (16.6%) | 484 (20.9%) |
Technology Access in Killeen
Computing Device Access in Killeen
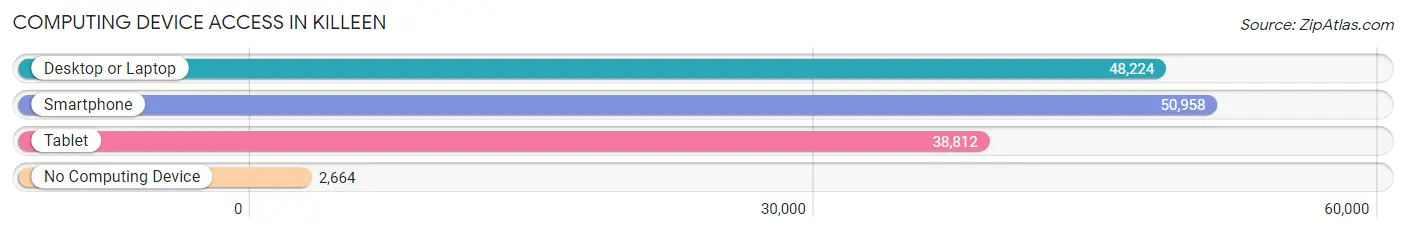
| Device Type | # Households | % Households |
| Desktop or Laptop | 48,224 | 83.8% |
| Smartphone | 50,958 | 88.5% |
| Tablet | 38,812 | 67.4% |
| No Computing Device | 2,664 | 4.6% |
| Total | 57,570 | 100.0% |
Internet Access in Killeen
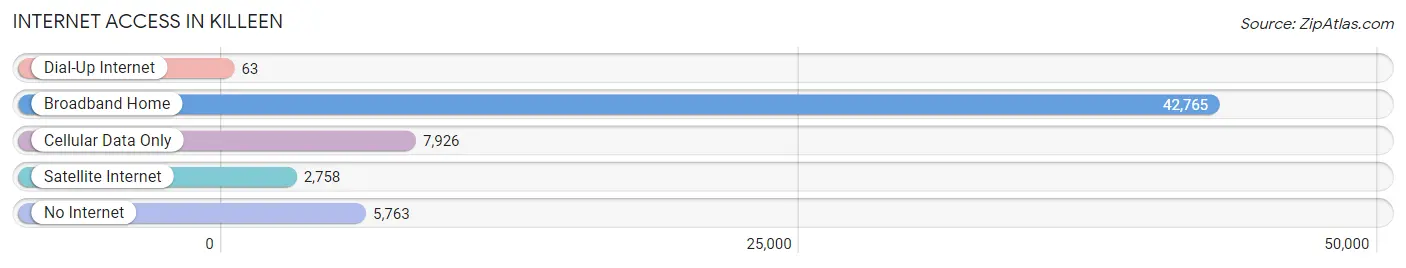
| Internet Type | # Households | % Households |
| Dial-Up Internet | 63 | 0.1% |
| Broadband Home | 42,765 | 74.3% |
| Cellular Data Only | 7,926 | 13.8% |
| Satellite Internet | 2,758 | 4.8% |
| No Internet | 5,763 | 10.0% |
| Total | 57,570 | 100.0% |
Killeen Summary
Killeen, Texas is a city located in Bell County, Texas, United States. It is the principal city of the Killeen–Temple–Fort Hood Metropolitan Statistical Area. As of the 2010 census, its population was 127,921, making it the 21st most populous city in Texas. It is the largest city in Bell County.
History
Killeen was founded in 1882 as a small farming community on the banks of the Lampasas River. The city was named after Frank P. Killeen, a vice president of the Gulf, Colorado and Santa Fe Railway. The city was incorporated in 1884 and grew rapidly as a center for the cotton and grain industries.
In the early 1900s, Killeen was a bustling town with a population of over 1,000. The city was home to several businesses, including a cotton gin, a blacksmith shop, a livery stable, a general store, and a hotel.
In 1942, Camp Hood was established in the area, and the city's population exploded. The camp was renamed Fort Hood in 1950, and it remains the largest military installation in the world.
Geography
Killeen is located in Central Texas, about 60 miles north of Austin and 90 miles south of Dallas. The city is situated in the rolling hills of Bell County, with an elevation of 745 feet. The Lampasas River runs through the city, and the city is surrounded by several lakes, including Stillhouse Hollow Lake, Belton Lake, and Lake Belton.
Killeen has a humid subtropical climate, with hot summers and mild winters. The average annual temperature is 68°F, and the average annual precipitation is 33 inches.
Economy
Killeen's economy is largely driven by Fort Hood, which is the largest single employer in the city. Other major employers include the Killeen Independent School District, Metroplex Health System, and the Killeen-Fort Hood Regional Airport.
Killeen is also home to several major retail centers, including the Killeen Mall, the Killeen Town Center, and the Killeen Marketplace. The city is also home to several industrial parks, including the Killeen Industrial Park and the Killeen Business Park.
Demographics
As of the 2010 census, Killeen had a population of 127,921. The racial makeup of the city was 57.2% White, 25.2% African American, 0.7% Native American, 3.3% Asian, 0.2% Pacific Islander, 11.3% from other races, and 2.3% from two or more races. Hispanic or Latino of any race were 24.2% of the population.
Killeen is home to a diverse population, with a variety of religious backgrounds. The largest religious group is Christianity, with 44.3% of the population identifying as Christian. Other religious groups include Islam (2.2%), Judaism (0.3%), Buddhism (0.2%), and Hinduism (0.1%).
Killeen is served by the Killeen Independent School District, which includes 24 elementary schools, seven middle schools, and four high schools. The city is also home to Central Texas College, a two-year community college.
Common Questions
What is Per Capita Income in Killeen?
Per Capita income in Killeen is $28,002.
What is the Median Family Income in Killeen?
Median Family Income in Killeen is $65,669.
What is the Median Household income in Killeen?
Median Household Income in Killeen is $57,086.
What is Income or Wage Gap in Killeen?
Income or Wage Gap in Killeen is 27.0%.
Women in Killeen earn 73.0 cents for every dollar earned by a man.
What is Family Income Deficit in Killeen?
Family Income Deficit in Killeen is $12,477.
Families that are below poverty line in Killeen earn $12,477 less on average than the poverty threshold level.
What is Inequality or Gini Index in Killeen?
Inequality or Gini Index in Killeen is 0.42.
What is the Total Population of Killeen?
Total Population of Killeen is 153,708.
What is the Total Male Population of Killeen?
Total Male Population of Killeen is 76,288.
What is the Total Female Population of Killeen?
Total Female Population of Killeen is 77,420.
What is the Ratio of Males per 100 Females in Killeen?
There are 98.54 Males per 100 Females in Killeen.
What is the Ratio of Females per 100 Males in Killeen?
There are 101.48 Females per 100 Males in Killeen.
What is the Median Population Age in Killeen?
Median Population Age in Killeen is 29.7 Years.
What is the Average Family Size in Killeen
Average Family Size in Killeen is 3.3 People.
What is the Average Household Size in Killeen
Average Household Size in Killeen is 2.7 People.
How Large is the Labor Force in Killeen?
There are 77,648 People in the Labor Forcein in Killeen.
What is the Percentage of People in the Labor Force in Killeen?
68.5% of People are in the Labor Force in Killeen.
What is the Unemployment Rate in Killeen?
Unemployment Rate in Killeen is 10.9%.