Seminole Manor, FL Map & Demographics
Seminole Manor Map
Seminole Manor Overview
$27,227
PER CAPITA INCOME
$91,667
AVG FAMILY INCOME
$90,635
AVG HOUSEHOLD INCOME
14.1%
WAGE / INCOME GAP [ % ]
85.9¢/ $1
WAGE / INCOME GAP [ $ ]
0.27
INEQUALITY / GINI INDEX
2,232
TOTAL POPULATION
1,300
MALE POPULATION
932
FEMALE POPULATION
139.48
MALES / 100 FEMALES
71.69
FEMALES / 100 MALES
41.2
MEDIAN AGE
3.5
AVG FAMILY SIZE
3.0
AVG HOUSEHOLD SIZE
1,657
LABOR FORCE [ PEOPLE ]
82.2%
PERCENT IN LABOR FORCE
12.2%
UNEMPLOYMENT RATE
Income in Seminole Manor
Income Overview in Seminole Manor
Per Capita Income in Seminole Manor is $27,227, while median incomes of families and households are $91,667 and $90,635 respectively.
| Characteristic | Number | Measure |
| Per Capita Income | 2,232 | $27,227 |
| Median Family Income | 566 | $91,667 |
| Mean Family Income | 566 | $77,502 |
| Median Household Income | 734 | $90,635 |
| Mean Household Income | 734 | $76,350 |
| Income Deficit | 566 | $0 |
| Wage / Income Gap (%) | 2,232 | 14.13% |
| Wage / Income Gap ($) | 2,232 | 85.87¢ per $1 |
| Gini / Inequality Index | 2,232 | 0.27 |
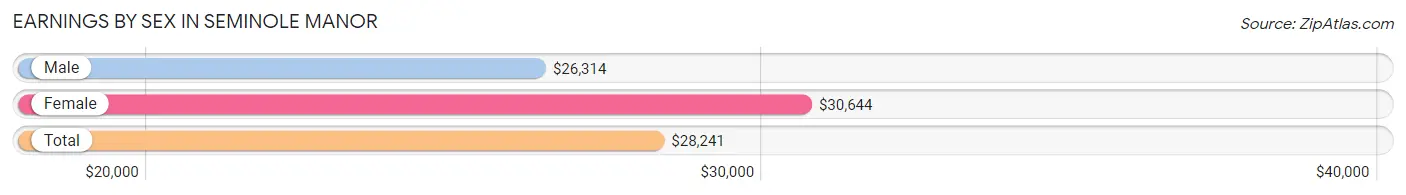
Earnings by Sex in Seminole Manor
Average Earnings in Seminole Manor are $28,241, $26,314 for men and $30,644 for women, a difference of 14.1%.
| Sex | Number | Average Earnings |
| Male | 979 (58.7%) | $26,314 |
| Female | 689 (41.3%) | $30,644 |
| Total | 1,668 (100.0%) | $28,241 |
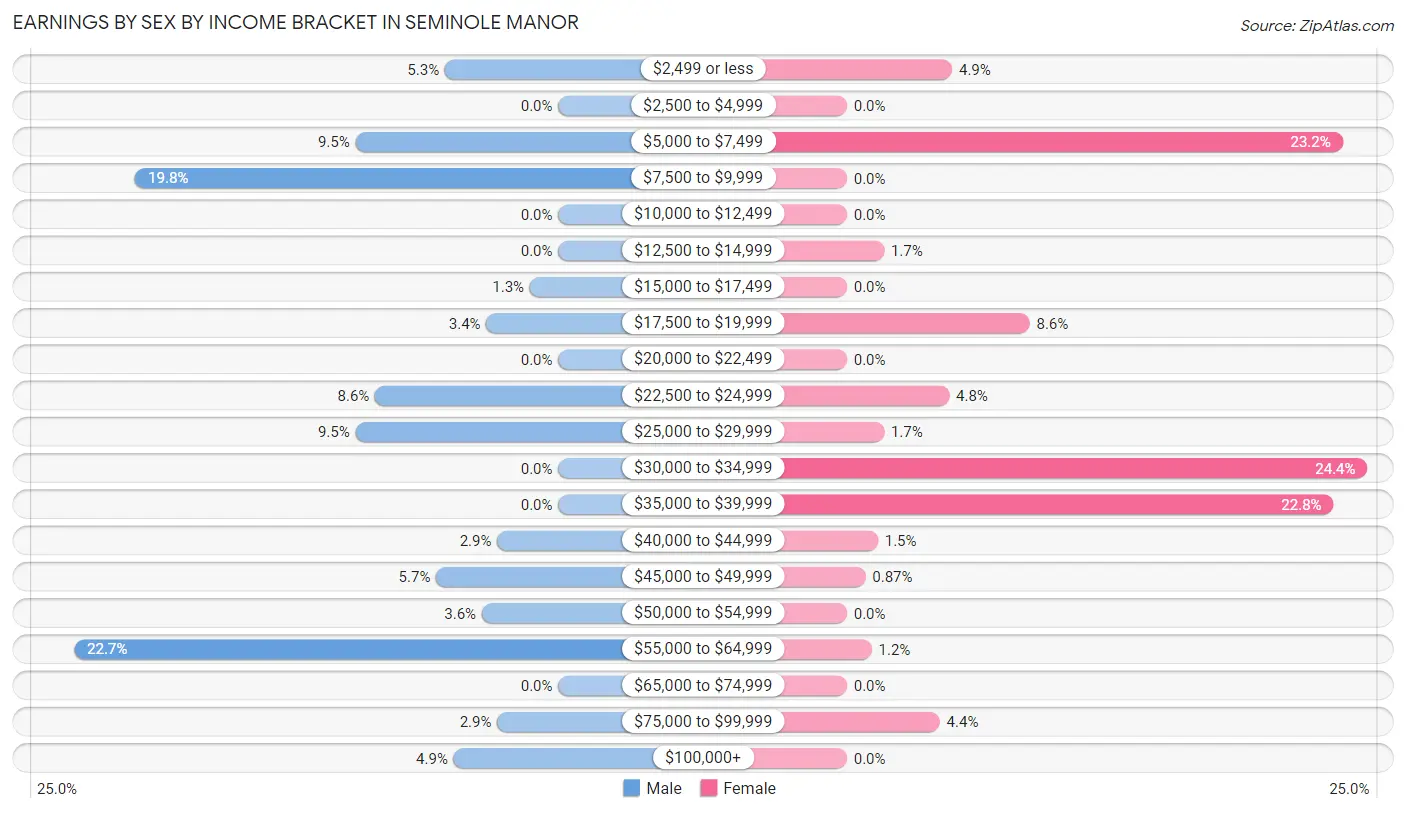
Earnings by Sex by Income Bracket in Seminole Manor
The most common earnings brackets in Seminole Manor are $55,000 to $64,999 for men (222 | 22.7%) and $30,000 to $34,999 for women (168 | 24.4%).
| Income | Male | Female |
| $2,499 or less | 52 (5.3%) | 34 (4.9%) |
| $2,500 to $4,999 | 0 (0.0%) | 0 (0.0%) |
| $5,000 to $7,499 | 93 (9.5%) | 160 (23.2%) |
| $7,500 to $9,999 | 194 (19.8%) | 0 (0.0%) |
| $10,000 to $12,499 | 0 (0.0%) | 0 (0.0%) |
| $12,500 to $14,999 | 0 (0.0%) | 12 (1.7%) |
| $15,000 to $17,499 | 13 (1.3%) | 0 (0.0%) |
| $17,500 to $19,999 | 33 (3.4%) | 59 (8.6%) |
| $20,000 to $22,499 | 0 (0.0%) | 0 (0.0%) |
| $22,500 to $24,999 | 84 (8.6%) | 33 (4.8%) |
| $25,000 to $29,999 | 93 (9.5%) | 12 (1.7%) |
| $30,000 to $34,999 | 0 (0.0%) | 168 (24.4%) |
| $35,000 to $39,999 | 0 (0.0%) | 157 (22.8%) |
| $40,000 to $44,999 | 28 (2.9%) | 10 (1.5%) |
| $45,000 to $49,999 | 56 (5.7%) | 6 (0.9%) |
| $50,000 to $54,999 | 35 (3.6%) | 0 (0.0%) |
| $55,000 to $64,999 | 222 (22.7%) | 8 (1.2%) |
| $65,000 to $74,999 | 0 (0.0%) | 0 (0.0%) |
| $75,000 to $99,999 | 28 (2.9%) | 30 (4.3%) |
| $100,000+ | 48 (4.9%) | 0 (0.0%) |
| Total | 979 (100.0%) | 689 (100.0%) |
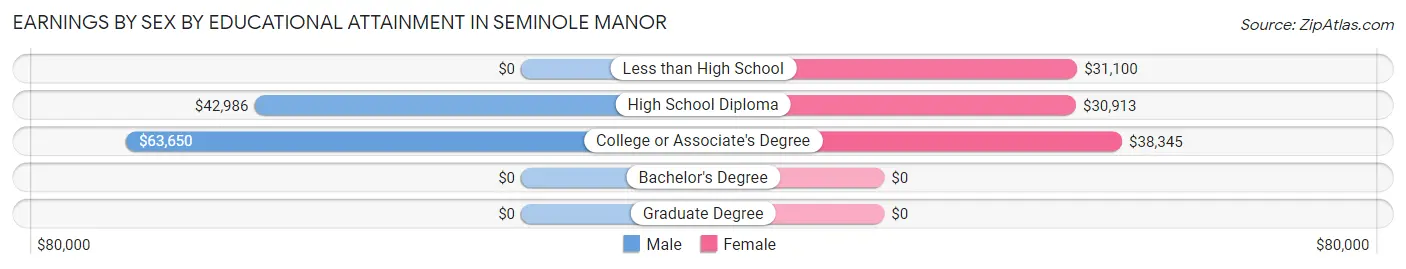
Earnings by Sex by Educational Attainment in Seminole Manor
Average earnings in Seminole Manor are $50,750 for men and $32,155 for women, a difference of 36.6%. Men with an educational attainment of college or associate's degree enjoy the highest average annual earnings of $63,650, while those with high school diploma education earn the least with $42,986. Women with an educational attainment of college or associate's degree earn the most with the average annual earnings of $38,345, while those with high school diploma education have the smallest earnings of $30,913.
| Educational Attainment | Male Income | Female Income |
| Less than High School | - | - |
| High School Diploma | $42,986 | $30,913 |
| College or Associate's Degree | $63,650 | $38,345 |
| Bachelor's Degree | - | - |
| Graduate Degree | - | - |
| Total | $50,750 | $32,155 |
Family Income in Seminole Manor
Family Income Brackets in Seminole Manor
According to the Seminole Manor family income data, there are 221 families falling into the $75,000 to $99,999 income range, which is the most common income bracket and makes up 39.1% of all families.
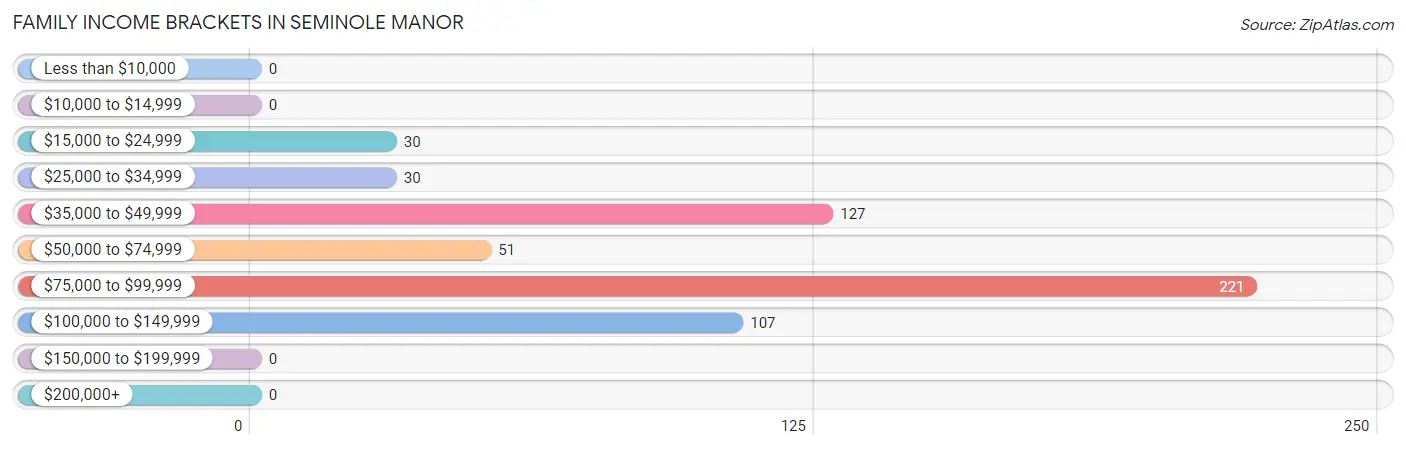
| Income Bracket | # Families | % Families |
| Less than $10,000 | 0 | 0.0% |
| $10,000 to $14,999 | 0 | 0.0% |
| $15,000 to $24,999 | 30 | 5.3% |
| $25,000 to $34,999 | 30 | 5.3% |
| $35,000 to $49,999 | 127 | 22.4% |
| $50,000 to $74,999 | 51 | 9.0% |
| $75,000 to $99,999 | 221 | 39.0% |
| $100,000 to $149,999 | 107 | 18.9% |
| $150,000 to $199,999 | 0 | 0.0% |
| $200,000+ | 0 | 0.0% |
Family Income by Famaliy Size in Seminole Manor
5-person families (75 | 13.3%) account for the highest median family income in Seminole Manor with $99,321 per family, while 3-person families (286 | 50.5%) have the highest median income of $31,992 per family member.
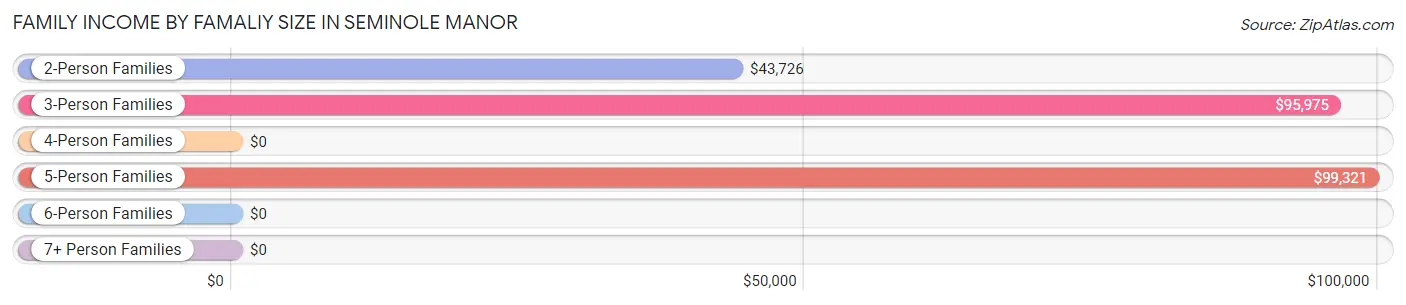
| Income Bracket | # Families | Median Income |
| 2-Person Families | 179 (31.6%) | $43,726 |
| 3-Person Families | 286 (50.5%) | $95,975 |
| 4-Person Families | 8 (1.4%) | $0 |
| 5-Person Families | 75 (13.3%) | $99,321 |
| 6-Person Families | 18 (3.2%) | $0 |
| 7+ Person Families | 0 (0.0%) | $0 |
| Total | 566 (100.0%) | $91,667 |
Family Income by Number of Earners in Seminole Manor
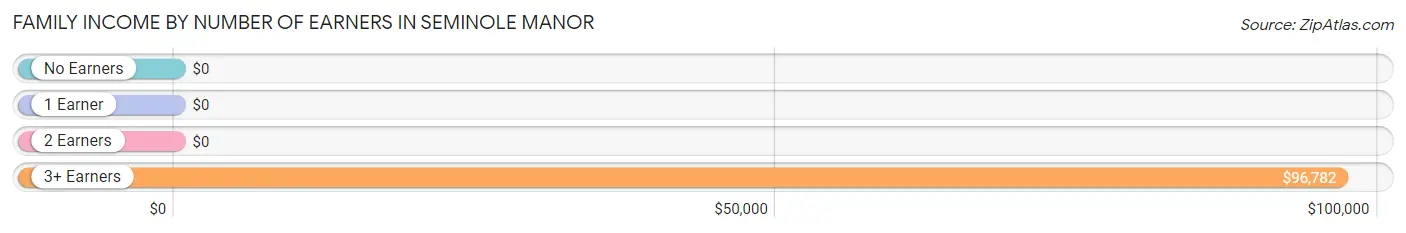
| Number of Earners | # Families | Median Income |
| No Earners | 28 (5.0%) | $0 |
| 1 Earner | 85 (15.0%) | $0 |
| 2 Earners | 217 (38.3%) | $0 |
| 3+ Earners | 236 (41.7%) | $96,782 |
| Total | 566 (100.0%) | $91,667 |
Household Income in Seminole Manor
Household Income Brackets in Seminole Manor
With 251 households falling in the category, the $75,000 to $99,999 income range is the most frequent in Seminole Manor, accounting for 34.2% of all households.
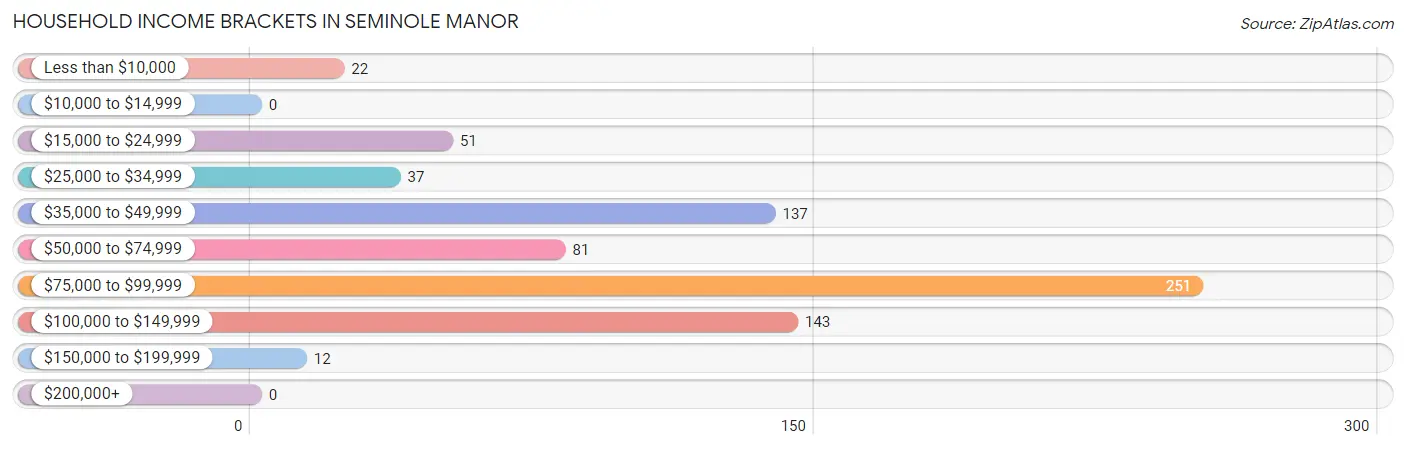
| Income Bracket | # Households | % Households |
| Less than $10,000 | 22 | 3.0% |
| $10,000 to $14,999 | 0 | 0.0% |
| $15,000 to $24,999 | 51 | 6.9% |
| $25,000 to $34,999 | 37 | 5.0% |
| $35,000 to $49,999 | 137 | 18.7% |
| $50,000 to $74,999 | 81 | 11.0% |
| $75,000 to $99,999 | 251 | 34.2% |
| $100,000 to $149,999 | 143 | 19.5% |
| $150,000 to $199,999 | 12 | 1.6% |
| $200,000+ | 0 | 0.0% |
Household Income by Householder Age in Seminole Manor
The median household income in Seminole Manor is $90,635, with the highest median household income of $95,012 found in the 45 to 64 years age bracket for the primary householder. A total of 463 households (63.1%) fall into this category.
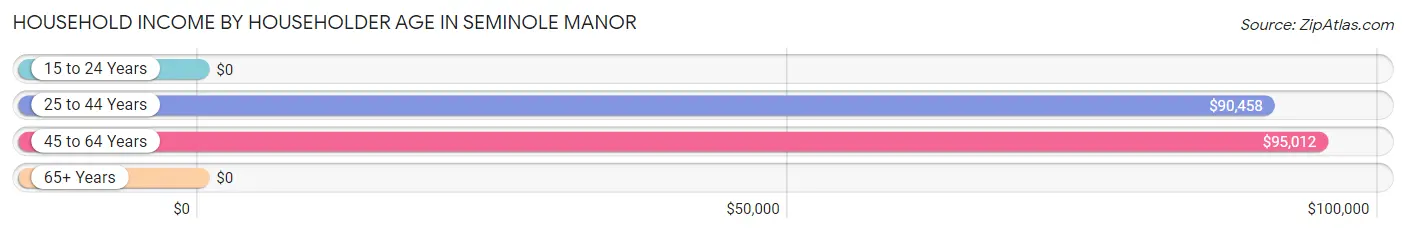
| Income Bracket | # Households | Median Income |
| 15 to 24 Years | 0 (0.0%) | $0 |
| 25 to 44 Years | 153 (20.8%) | $90,458 |
| 45 to 64 Years | 463 (63.1%) | $95,012 |
| 65+ Years | 118 (16.1%) | $0 |
| Total | 734 (100.0%) | $90,635 |
Poverty in Seminole Manor
Income Below Poverty by Sex and Age in Seminole Manor
With 5.7% poverty level for males and 10.1% for females among the residents of Seminole Manor, 6 to 11 year old males and 5 year old females are the most vulnerable to poverty, with 26 males (68.4%) and 26 females (100.0%) in their respective age groups living below the poverty level.
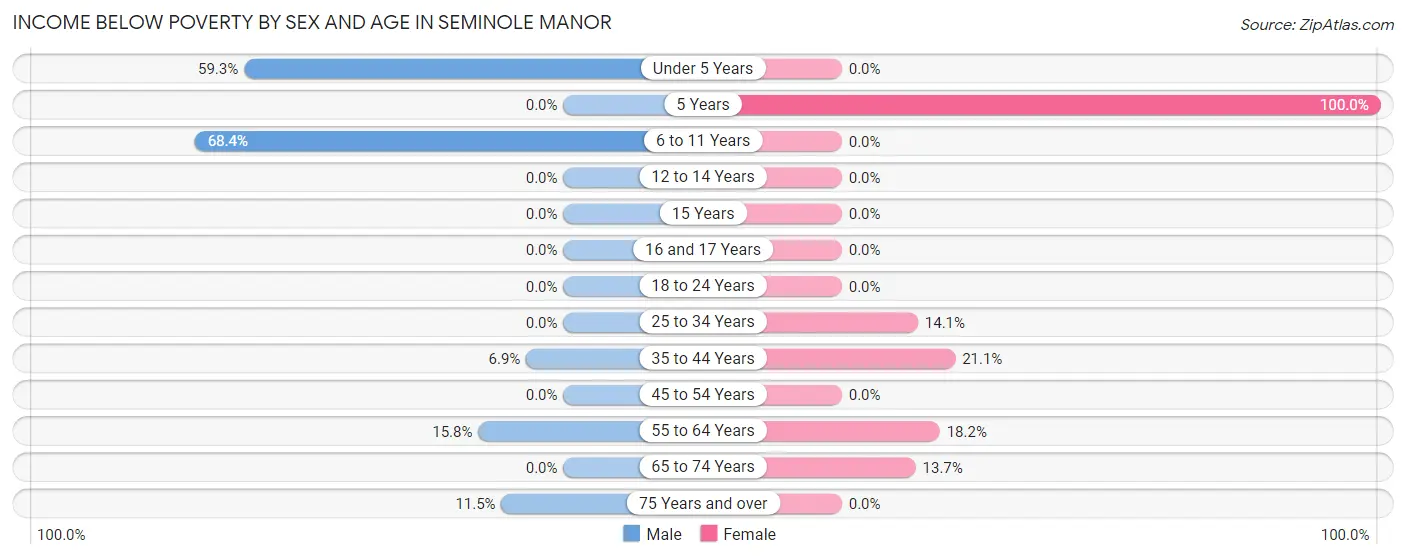
| Age Bracket | Male | Female |
| Under 5 Years | 16 (59.3%) | 0 (0.0%) |
| 5 Years | 0 (0.0%) | 26 (100.0%) |
| 6 to 11 Years | 26 (68.4%) | 0 (0.0%) |
| 12 to 14 Years | 0 (0.0%) | 0 (0.0%) |
| 15 Years | 0 (0.0%) | 0 (0.0%) |
| 16 and 17 Years | 0 (0.0%) | 0 (0.0%) |
| 18 to 24 Years | 0 (0.0%) | 0 (0.0%) |
| 25 to 34 Years | 0 (0.0%) | 12 (14.1%) |
| 35 to 44 Years | 10 (6.9%) | 12 (21.0%) |
| 45 to 54 Years | 0 (0.0%) | 0 (0.0%) |
| 55 to 64 Years | 12 (15.8%) | 34 (18.2%) |
| 65 to 74 Years | 0 (0.0%) | 10 (13.7%) |
| 75 Years and over | 10 (11.5%) | 0 (0.0%) |
| Total | 74 (5.7%) | 94 (10.1%) |
Income Above Poverty by Sex and Age in Seminole Manor
According to the poverty statistics in Seminole Manor, males aged 12 to 14 years and females aged under 5 years are the age groups that are most secure financially, with 100.0% of males and 100.0% of females in these age groups living above the poverty line.
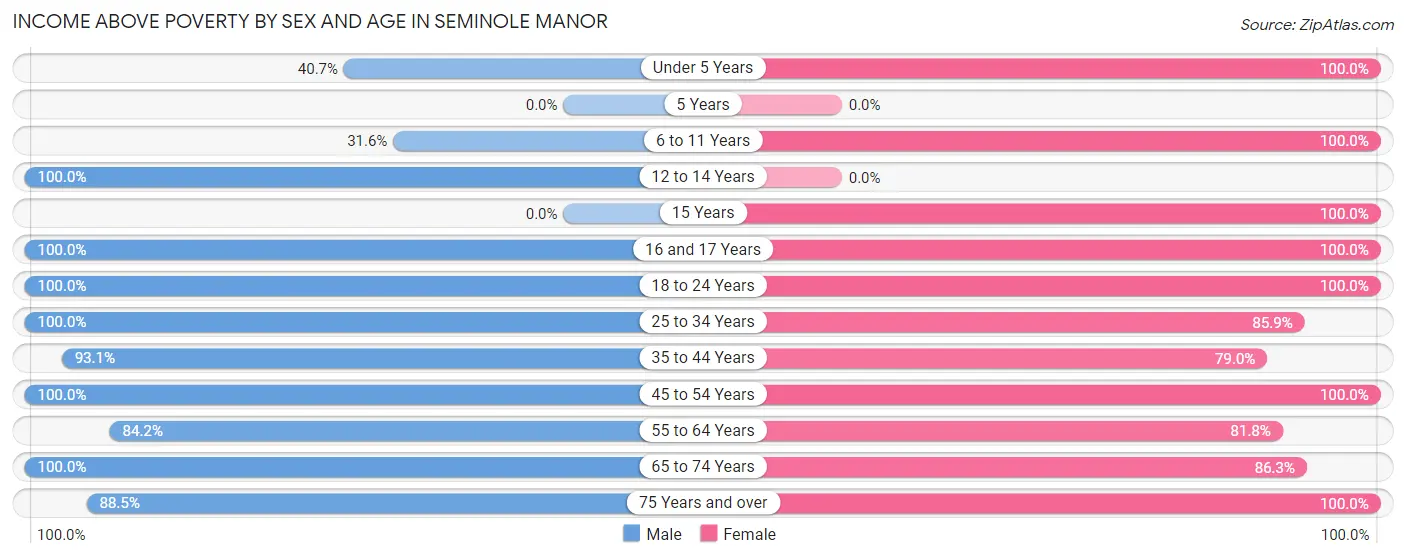
| Age Bracket | Male | Female |
| Under 5 Years | 11 (40.7%) | 44 (100.0%) |
| 5 Years | 0 (0.0%) | 0 (0.0%) |
| 6 to 11 Years | 12 (31.6%) | 16 (100.0%) |
| 12 to 14 Years | 51 (100.0%) | 0 (0.0%) |
| 15 Years | 0 (0.0%) | 14 (100.0%) |
| 16 and 17 Years | 27 (100.0%) | 9 (100.0%) |
| 18 to 24 Years | 342 (100.0%) | 153 (100.0%) |
| 25 to 34 Years | 157 (100.0%) | 73 (85.9%) |
| 35 to 44 Years | 135 (93.1%) | 45 (78.9%) |
| 45 to 54 Years | 323 (100.0%) | 187 (100.0%) |
| 55 to 64 Years | 64 (84.2%) | 153 (81.8%) |
| 65 to 74 Years | 27 (100.0%) | 63 (86.3%) |
| 75 Years and over | 77 (88.5%) | 81 (100.0%) |
| Total | 1,226 (94.3%) | 838 (89.9%) |
Income Below Poverty Among Married-Couple Families in Seminole Manor
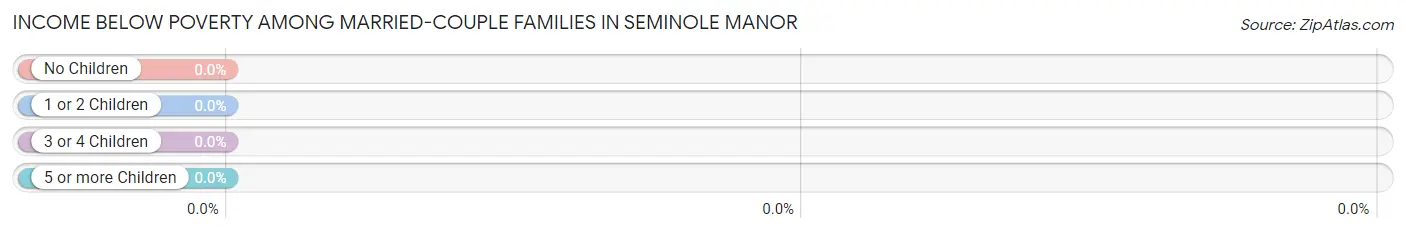
| Children | Above Poverty | Below Poverty |
| No Children | 209 (100.0%) | 0 (0.0%) |
| 1 or 2 Children | 59 (100.0%) | 0 (0.0%) |
| 3 or 4 Children | 18 (100.0%) | 0 (0.0%) |
| 5 or more Children | 0 (0.0%) | 0 (0.0%) |
| Total | 286 (100.0%) | 0 (0.0%) |
Income Below Poverty Among Single-Parent Households in Seminole Manor
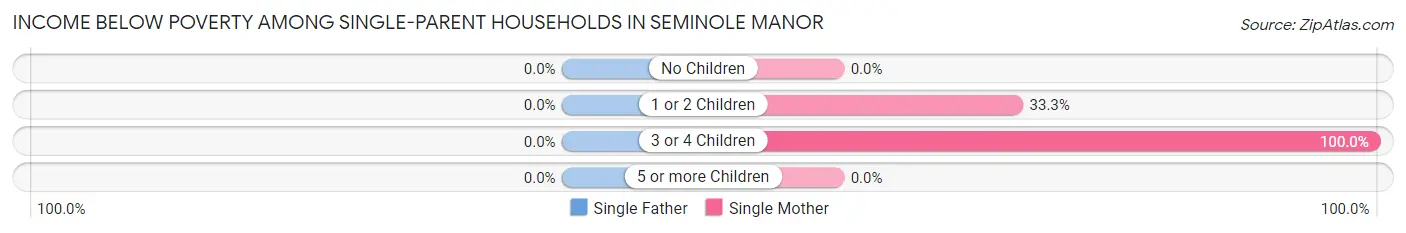
| Children | Single Father | Single Mother |
| No Children | 0 (0.0%) | 0 (0.0%) |
| 1 or 2 Children | 0 (0.0%) | 12 (33.3%) |
| 3 or 4 Children | 0 (0.0%) | 12 (100.0%) |
| 5 or more Children | 0 (0.0%) | 0 (0.0%) |
| Total | 0 (0.0%) | 24 (12.4%) |
Income Below Poverty Among Married-Couple vs Single-Parent Households in Seminole Manor
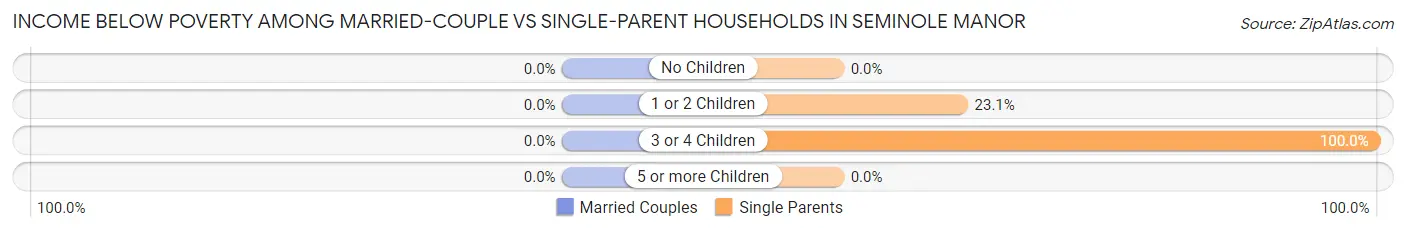
| Children | Married-Couple Families | Single-Parent Households |
| No Children | 0 (0.0%) | 0 (0.0%) |
| 1 or 2 Children | 0 (0.0%) | 12 (23.1%) |
| 3 or 4 Children | 0 (0.0%) | 12 (100.0%) |
| 5 or more Children | 0 (0.0%) | 0 (0.0%) |
| Total | 0 (0.0%) | 24 (8.6%) |
Race in Seminole Manor
The most populous races in Seminole Manor are Hispanic or Latino (1,425 | 63.8%), White / Caucasian (884 | 39.6%), and Two or more Races (603 | 27.0%).
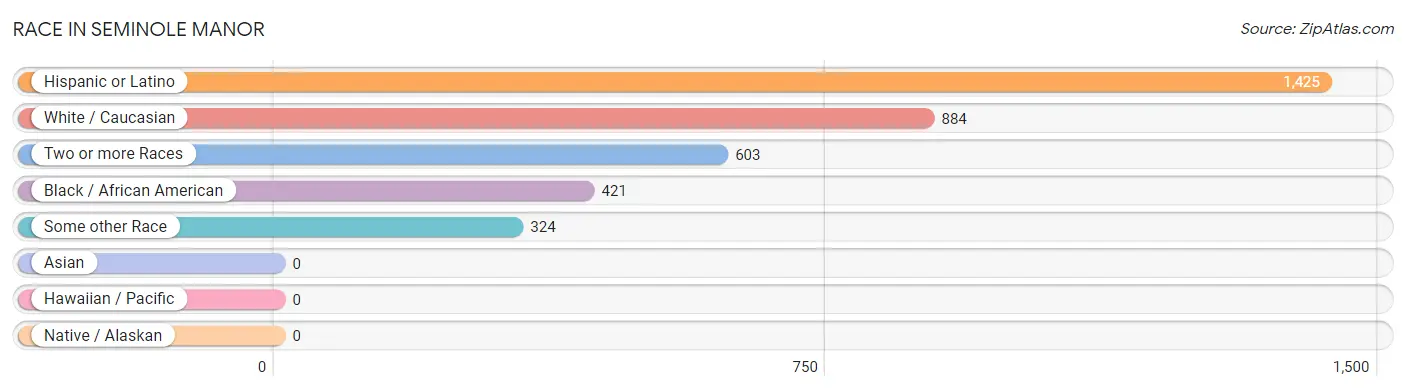
| Race | # Population | % Population |
| Asian | 0 | 0.0% |
| Black / African American | 421 | 18.9% |
| Hawaiian / Pacific | 0 | 0.0% |
| Hispanic or Latino | 1,425 | 63.8% |
| Native / Alaskan | 0 | 0.0% |
| White / Caucasian | 884 | 39.6% |
| Two or more Races | 603 | 27.0% |
| Some other Race | 324 | 14.5% |
| Total | 2,232 | 100.0% |
Ancestry in Seminole Manor
The most populous ancestries reported in Seminole Manor are Mexican (747 | 33.5%), Puerto Rican (278 | 12.5%), Jamaican (246 | 11.0%), Cuban (190 | 8.5%), and South American (141 | 6.3%), together accounting for 71.8% of all Seminole Manor residents.
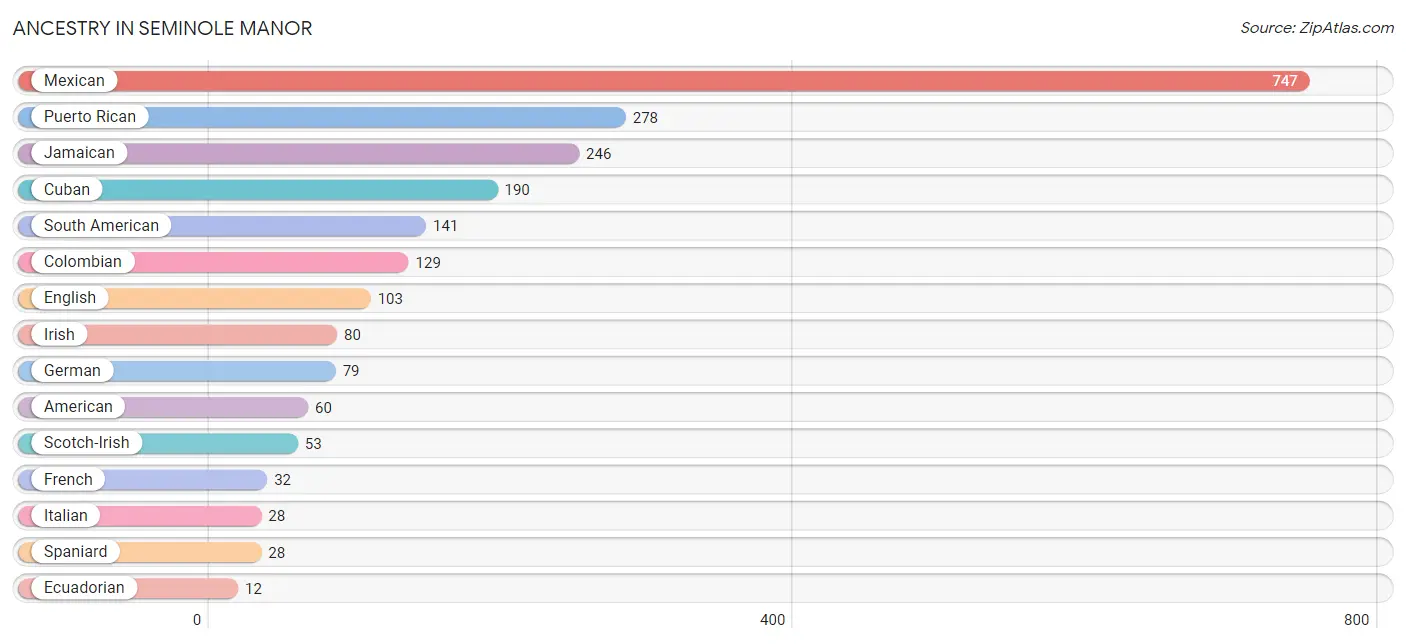
| Ancestry | # Population | % Population |
| American | 60 | 2.7% |
| Colombian | 129 | 5.8% |
| Cuban | 190 | 8.5% |
| Ecuadorian | 12 | 0.5% |
| English | 103 | 4.6% |
| French | 32 | 1.4% |
| German | 79 | 3.5% |
| Irish | 80 | 3.6% |
| Italian | 28 | 1.3% |
| Jamaican | 246 | 11.0% |
| Mexican | 747 | 33.5% |
| Norwegian | 8 | 0.4% |
| Polish | 8 | 0.4% |
| Puerto Rican | 278 | 12.5% |
| Scotch-Irish | 53 | 2.4% |
| South American | 141 | 6.3% |
| Spaniard | 28 | 1.3% |
| Turkish | 12 | 0.5% | View All 18 Rows |
Immigrants in Seminole Manor
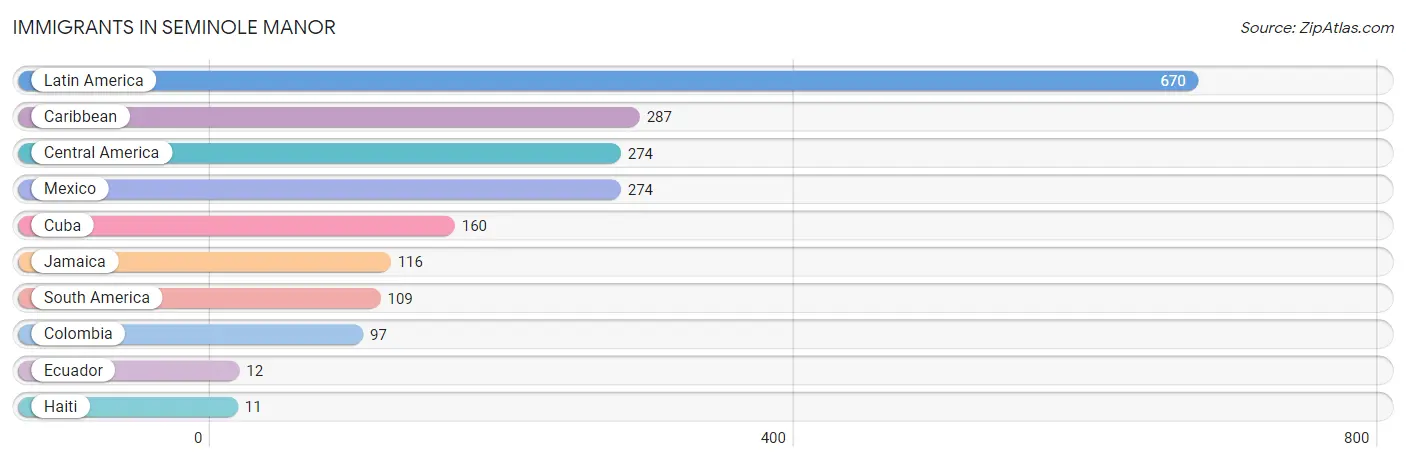
The most numerous immigrant groups reported in Seminole Manor came from Latin America (670 | 30.0%), Caribbean (287 | 12.9%), Central America (274 | 12.3%), Mexico (274 | 12.3%), and Cuba (160 | 7.2%), together accounting for 74.6% of all Seminole Manor residents.
| Immigration Origin | # Population | % Population |
| Caribbean | 287 | 12.9% |
| Central America | 274 | 12.3% |
| Colombia | 97 | 4.3% |
| Cuba | 160 | 7.2% |
| Ecuador | 12 | 0.5% |
| Haiti | 11 | 0.5% |
| Jamaica | 116 | 5.2% |
| Latin America | 670 | 30.0% |
| Mexico | 274 | 12.3% |
| South America | 109 | 4.9% | View All 10 Rows |
Sex and Age in Seminole Manor
Sex and Age in Seminole Manor
The most populous age groups in Seminole Manor are 20 to 24 Years (307 | 23.6%) for men and 55 to 59 Years (187 | 20.1%) for women.
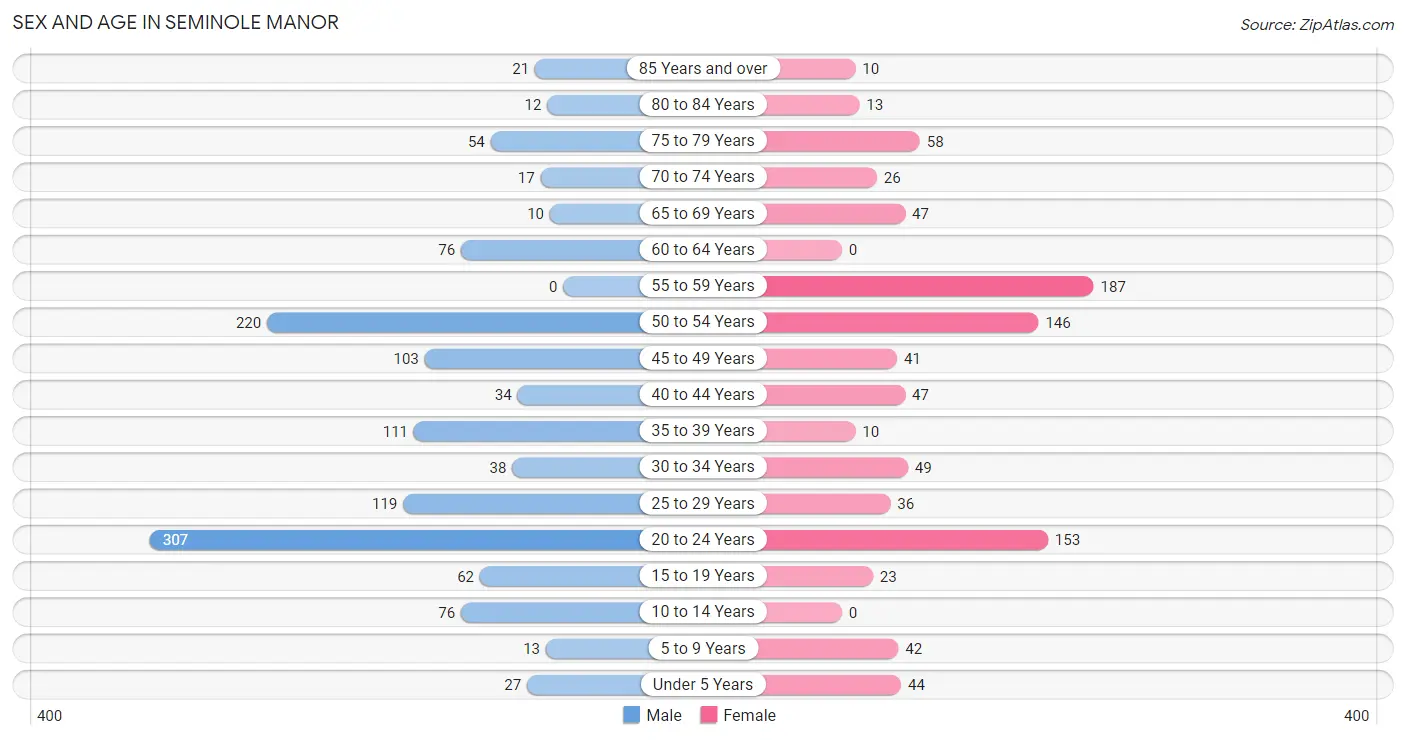
| Age Bracket | Male | Female |
| Under 5 Years | 27 (2.1%) | 44 (4.7%) |
| 5 to 9 Years | 13 (1.0%) | 42 (4.5%) |
| 10 to 14 Years | 76 (5.9%) | 0 (0.0%) |
| 15 to 19 Years | 62 (4.8%) | 23 (2.5%) |
| 20 to 24 Years | 307 (23.6%) | 153 (16.4%) |
| 25 to 29 Years | 119 (9.1%) | 36 (3.9%) |
| 30 to 34 Years | 38 (2.9%) | 49 (5.3%) |
| 35 to 39 Years | 111 (8.5%) | 10 (1.1%) |
| 40 to 44 Years | 34 (2.6%) | 47 (5.0%) |
| 45 to 49 Years | 103 (7.9%) | 41 (4.4%) |
| 50 to 54 Years | 220 (16.9%) | 146 (15.7%) |
| 55 to 59 Years | 0 (0.0%) | 187 (20.1%) |
| 60 to 64 Years | 76 (5.9%) | 0 (0.0%) |
| 65 to 69 Years | 10 (0.8%) | 47 (5.0%) |
| 70 to 74 Years | 17 (1.3%) | 26 (2.8%) |
| 75 to 79 Years | 54 (4.2%) | 58 (6.2%) |
| 80 to 84 Years | 12 (0.9%) | 13 (1.4%) |
| 85 Years and over | 21 (1.6%) | 10 (1.1%) |
| Total | 1,300 (100.0%) | 932 (100.0%) |
Families and Households in Seminole Manor
Median Family Size in Seminole Manor
The median family size in Seminole Manor is 3.50 persons per family, with married-couple families (286 | 50.5%) accounting for the largest median family size of 4.15 persons per family. On the other hand, single female/mother families (194 | 34.3%) represent the smallest median family size with 2.81 persons per family.
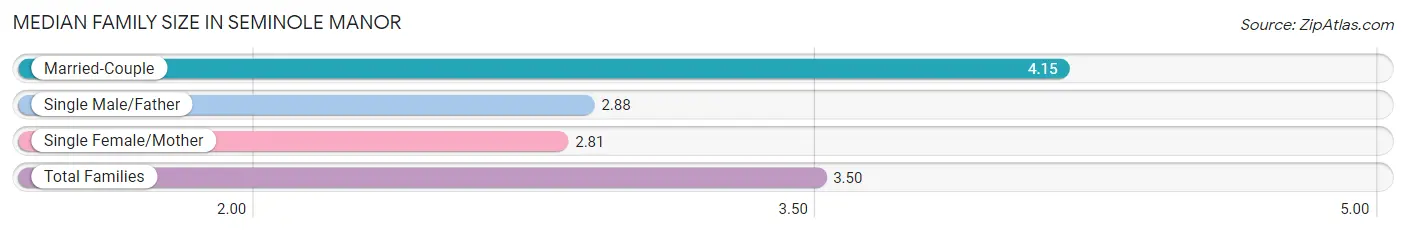
| Family Type | # Families | Family Size |
| Married-Couple | 286 (50.5%) | 4.15 |
| Single Male/Father | 86 (15.2%) | 2.88 |
| Single Female/Mother | 194 (34.3%) | 2.81 |
| Total Families | 566 (100.0%) | 3.50 |
Median Household Size in Seminole Manor
The median household size in Seminole Manor is 3.04 persons per household, with married-couple households (286 | 39.0%) accounting for the largest median household size of 4.15 persons per household. non-family households (168 | 22.9%) represent the smallest median household size with 1.08 persons per household.
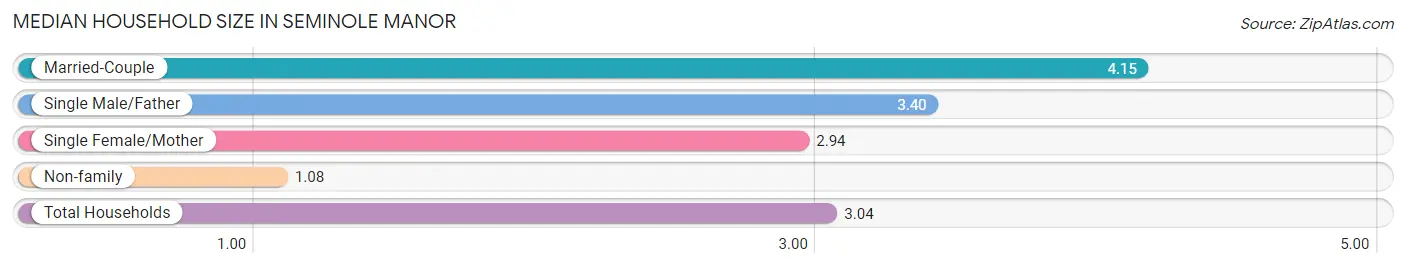
| Household Type | # Households | Household Size |
| Married-Couple | 286 (39.0%) | 4.15 |
| Single Male/Father | 86 (11.7%) | 3.40 |
| Single Female/Mother | 194 (26.4%) | 2.94 |
| Non-family | 168 (22.9%) | 1.08 |
| Total Households | 734 (100.0%) | 3.04 |
Household Size by Marriage Status in Seminole Manor
Out of a total of 734 households in Seminole Manor, 566 (77.1%) are family households, while 168 (22.9%) are nonfamily households. The most numerous type of family households are 3-person households, comprising 228, and the most common type of nonfamily households are 1-person households, comprising 160.
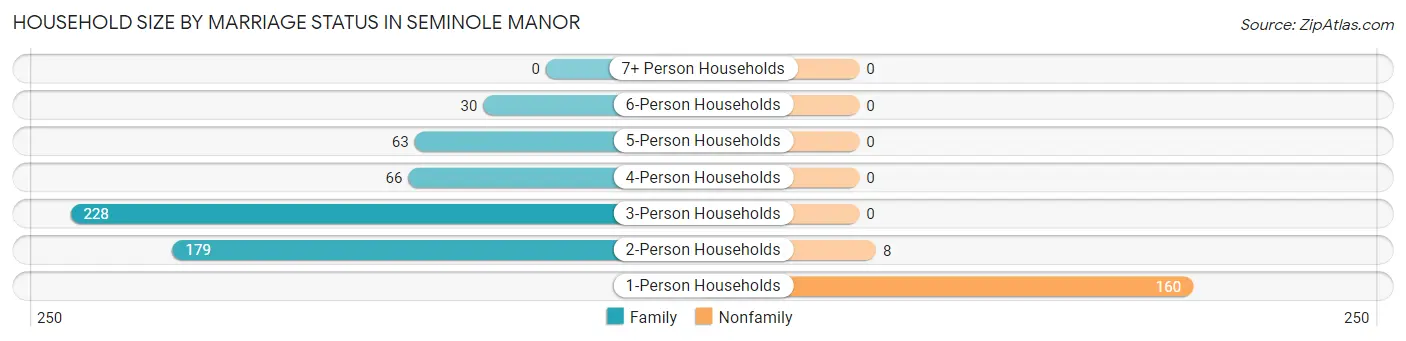
| Household Size | Family Households | Nonfamily Households |
| 1-Person Households | - | 160 (21.8%) |
| 2-Person Households | 179 (24.4%) | 8 (1.1%) |
| 3-Person Households | 228 (31.1%) | 0 (0.0%) |
| 4-Person Households | 66 (9.0%) | 0 (0.0%) |
| 5-Person Households | 63 (8.6%) | 0 (0.0%) |
| 6-Person Households | 30 (4.1%) | 0 (0.0%) |
| 7+ Person Households | 0 (0.0%) | 0 (0.0%) |
| Total | 566 (77.1%) | 168 (22.9%) |
Female Fertility in Seminole Manor
Fertility by Age in Seminole Manor
Average fertility rate in Seminole Manor is 27.0 births per 1,000 women. Women in the age bracket of 20 to 34 years have the highest fertility rate with 42.0 births per 1,000 women. Women in the age bracket of 20 to 34 years acount for 100.0% of all women with births.
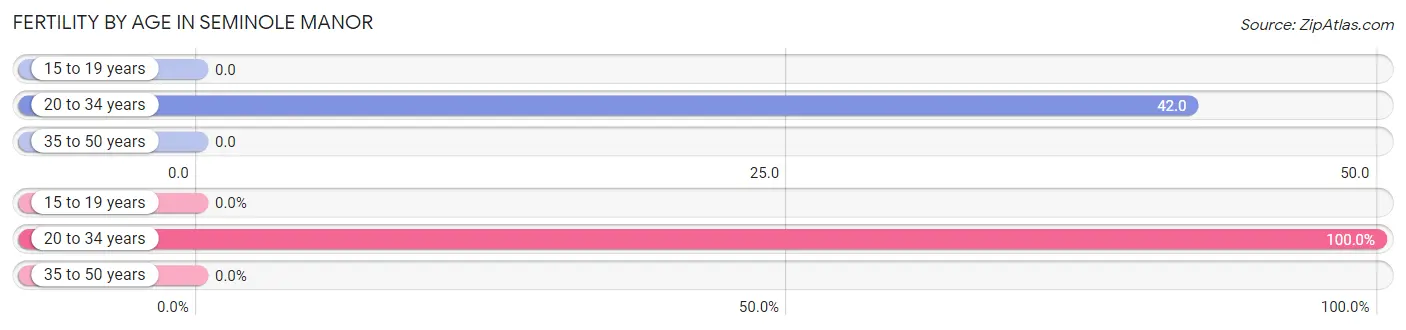
| Age Bracket | Women with Births | Births / 1,000 Women |
| 15 to 19 years | 0 (0.0%) | 0.0 |
| 20 to 34 years | 10 (100.0%) | 42.0 |
| 35 to 50 years | 0 (0.0%) | 0.0 |
| Total | 10 (100.0%) | 27.0 |
Fertility by Age by Marriage Status in Seminole Manor
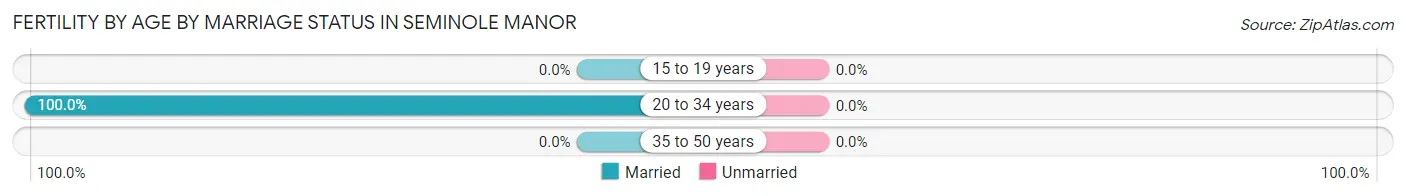
| Age Bracket | Married | Unmarried |
| 15 to 19 years | 0 (0.0%) | 0 (0.0%) |
| 20 to 34 years | 10 (100.0%) | 0 (0.0%) |
| 35 to 50 years | 0 (0.0%) | 0 (0.0%) |
| Total | 10 (100.0%) | 0 (0.0%) |
Fertility by Education in Seminole Manor
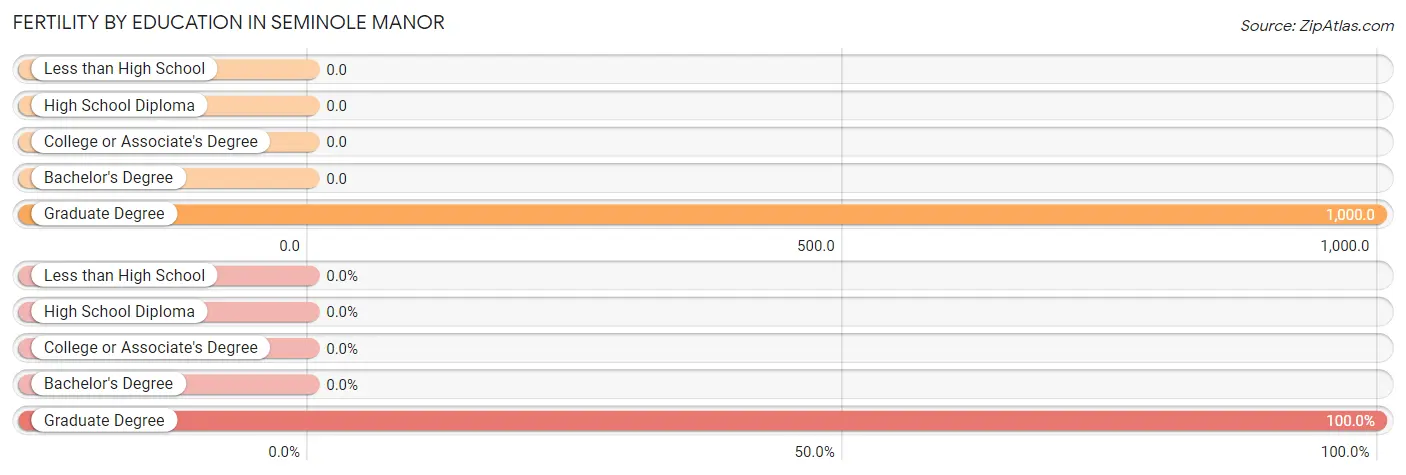
| Educational Attainment | Women with Births | Births / 1,000 Women |
| Less than High School | 0 (0.0%) | 0.0 |
| High School Diploma | 0 (0.0%) | 0.0 |
| College or Associate's Degree | 0 (0.0%) | 0.0 |
| Bachelor's Degree | 0 (0.0%) | 0.0 |
| Graduate Degree | 10 (100.0%) | 1,000.0 |
| Total | 10 (100.0%) | 27.0 |
Fertility by Education by Marriage Status in Seminole Manor
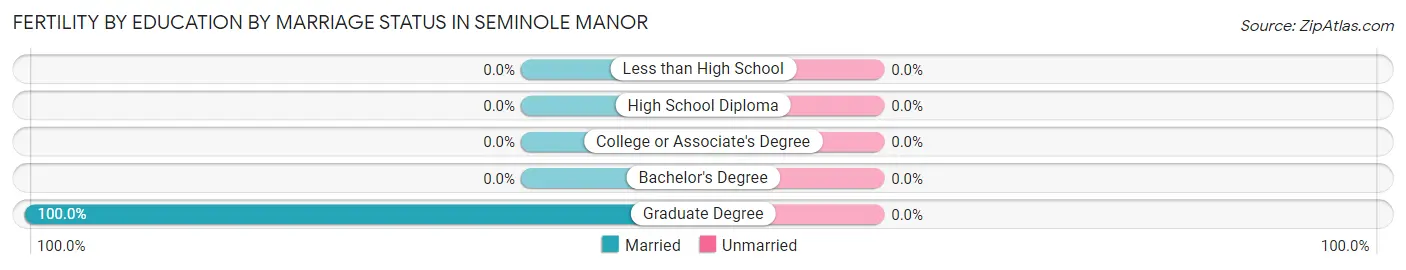
| Educational Attainment | Married | Unmarried |
| Less than High School | 0 (0.0%) | 0 (0.0%) |
| High School Diploma | 0 (0.0%) | 0 (0.0%) |
| College or Associate's Degree | 0 (0.0%) | 0 (0.0%) |
| Bachelor's Degree | 0 (0.0%) | 0 (0.0%) |
| Graduate Degree | 10 (100.0%) | 0 (0.0%) |
| Total | 10 (100.0%) | 0 (0.0%) |
Employment Characteristics in Seminole Manor
Employment by Class of Employer in Seminole Manor
Among the 1,394 employed individuals in Seminole Manor, private company employees (928 | 66.6%), not-for-profit organizations (144 | 10.3%), and unpaid family workers (126 | 9.0%) make up the most common classes of employment.
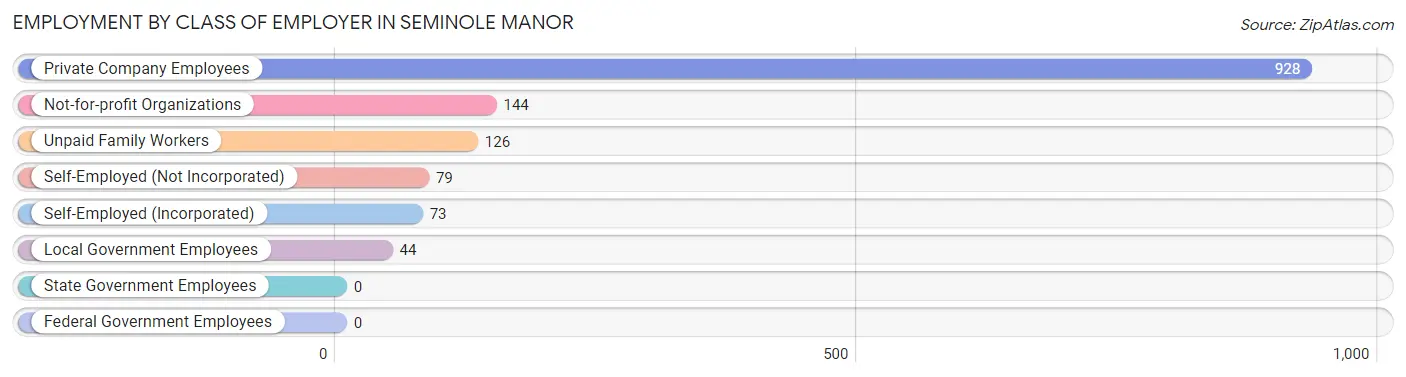
| Employer Class | # Employees | % Employees |
| Private Company Employees | 928 | 66.6% |
| Self-Employed (Incorporated) | 73 | 5.2% |
| Self-Employed (Not Incorporated) | 79 | 5.7% |
| Not-for-profit Organizations | 144 | 10.3% |
| Local Government Employees | 44 | 3.2% |
| State Government Employees | 0 | 0.0% |
| Federal Government Employees | 0 | 0.0% |
| Unpaid Family Workers | 126 | 9.0% |
| Total | 1,394 | 100.0% |
Employment Status by Age in Seminole Manor
According to the labor force statistics for Seminole Manor, out of the total population over 16 years of age (2,016), 82.2% or 1,657 individuals are in the labor force, with 12.2% or 202 of them unemployed. The age group with the highest labor force participation rate is 20 to 24 years, with 100.0% or 460 individuals in the labor force. Within the labor force, the 75 years and over age range has the highest percentage of unemployed individuals, with 38.3% or 18 of them being unemployed.
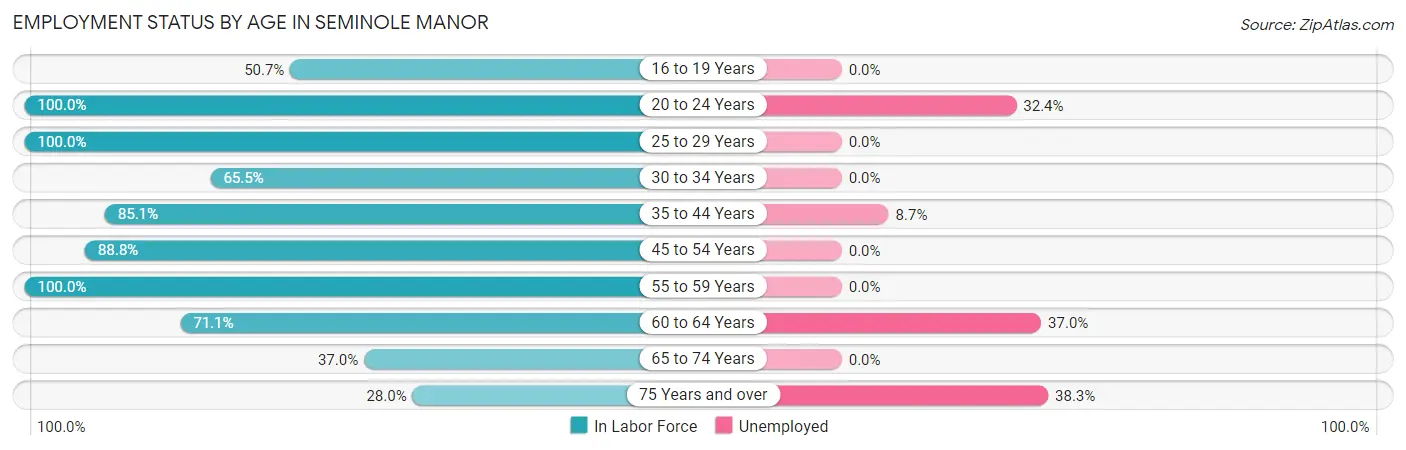
| Age Bracket | In Labor Force | Unemployed |
| 16 to 19 Years | 36 (50.7%) | 0 (0.0%) |
| 20 to 24 Years | 460 (100.0%) | 149 (32.4%) |
| 25 to 29 Years | 155 (100.0%) | 0 (0.0%) |
| 30 to 34 Years | 57 (65.5%) | 0 (0.0%) |
| 35 to 44 Years | 172 (85.1%) | 15 (8.7%) |
| 45 to 54 Years | 453 (88.8%) | 0 (0.0%) |
| 55 to 59 Years | 187 (100.0%) | 0 (0.0%) |
| 60 to 64 Years | 54 (71.1%) | 20 (37.0%) |
| 65 to 74 Years | 37 (37.0%) | 0 (0.0%) |
| 75 Years and over | 47 (28.0%) | 18 (38.3%) |
| Total | 1,657 (82.2%) | 202 (12.2%) |
Employment Status by Educational Attainment in Seminole Manor
According to labor force statistics for Seminole Manor, 88.6% of individuals (1,078) out of the total population between 25 and 64 years of age (1,217) are in the labor force, with 3.2% or 34 of them being unemployed. The group with the highest labor force participation rate are those with the educational attainment of less than high school, with 96.6% or 399 individuals in the labor force. Within the labor force, individuals with less than high school education have the highest percentage of unemployment, with 5.0% or 20 of them being unemployed.
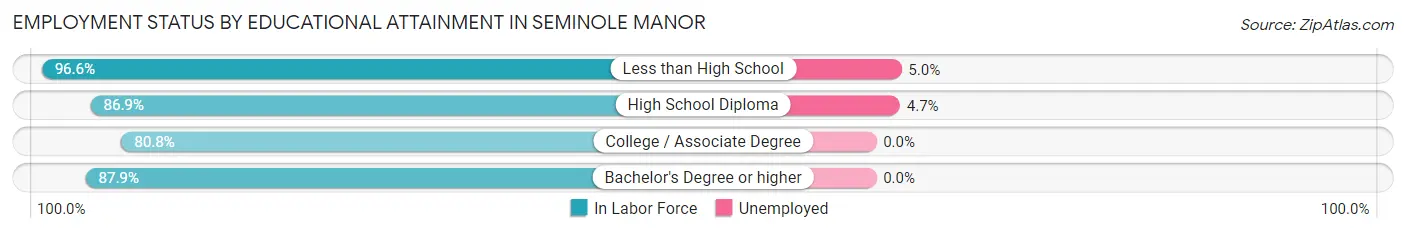
| Educational Attainment | In Labor Force | Unemployed |
| Less than High School | 399 (96.6%) | 21 (5.0%) |
| High School Diploma | 319 (86.9%) | 17 (4.7%) |
| College / Associate Degree | 273 (80.8%) | 0 (0.0%) |
| Bachelor's Degree or higher | 87 (87.9%) | 0 (0.0%) |
| Total | 1,078 (88.6%) | 39 (3.2%) |
Employment Occupations by Sex in Seminole Manor
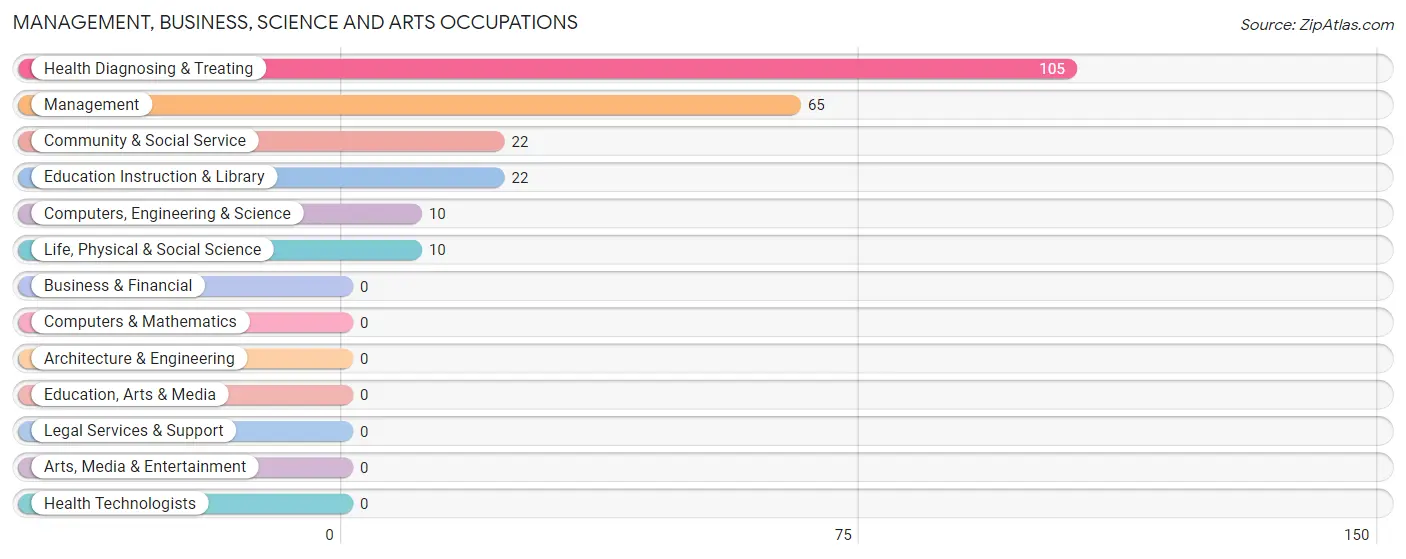
Management, Business, Science and Arts Occupations
The most common Management, Business, Science and Arts occupations in Seminole Manor are Health Diagnosing & Treating (105 | 7.2%), Management (65 | 4.5%), Community & Social Service (22 | 1.5%), Education Instruction & Library (22 | 1.5%), and Computers, Engineering & Science (10 | 0.7%).
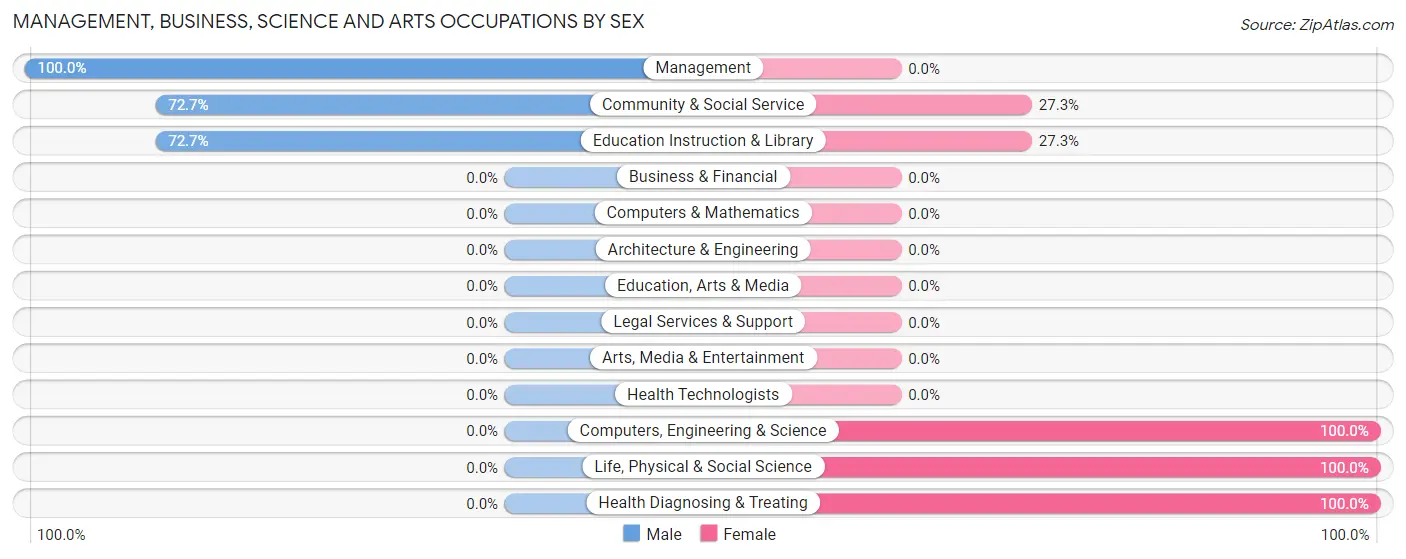
Management, Business, Science and Arts Occupations by Sex
Within the Management, Business, Science and Arts occupations in Seminole Manor, the most male-oriented occupations are Management (100.0%), Community & Social Service (72.7%), and Education Instruction & Library (72.7%), while the most female-oriented occupations are Computers, Engineering & Science (100.0%), Life, Physical & Social Science (100.0%), and Health Diagnosing & Treating (100.0%).
| Occupation | Male | Female |
| Management | 65 (100.0%) | 0 (0.0%) |
| Business & Financial | 0 (0.0%) | 0 (0.0%) |
| Computers, Engineering & Science | 0 (0.0%) | 10 (100.0%) |
| Computers & Mathematics | 0 (0.0%) | 0 (0.0%) |
| Architecture & Engineering | 0 (0.0%) | 0 (0.0%) |
| Life, Physical & Social Science | 0 (0.0%) | 10 (100.0%) |
| Community & Social Service | 16 (72.7%) | 6 (27.3%) |
| Education, Arts & Media | 0 (0.0%) | 0 (0.0%) |
| Legal Services & Support | 0 (0.0%) | 0 (0.0%) |
| Education Instruction & Library | 16 (72.7%) | 6 (27.3%) |
| Arts, Media & Entertainment | 0 (0.0%) | 0 (0.0%) |
| Health Diagnosing & Treating | 0 (0.0%) | 105 (100.0%) |
| Health Technologists | 0 (0.0%) | 0 (0.0%) |
| Total (Category) | 81 (40.1%) | 121 (59.9%) |
| Total (Overall) | 777 (53.4%) | 679 (46.6%) |
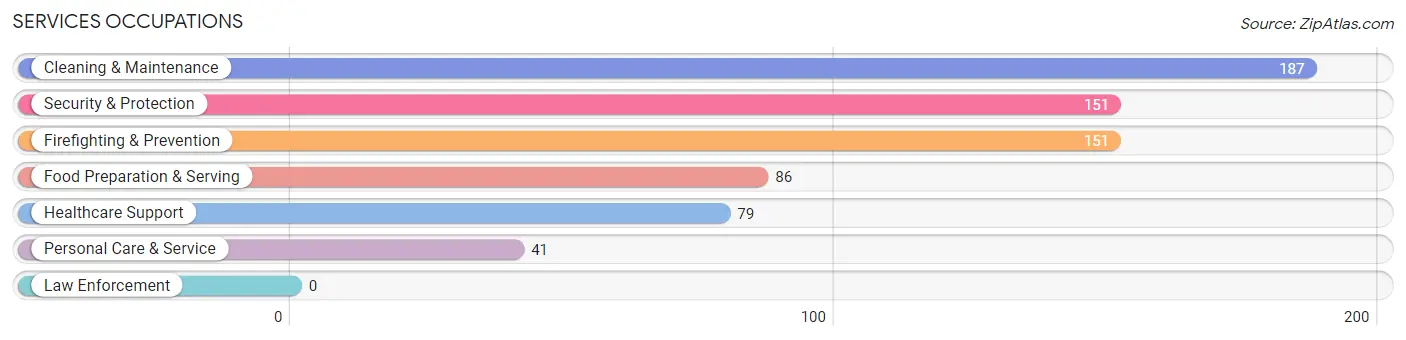
Services Occupations
The most common Services occupations in Seminole Manor are Cleaning & Maintenance (187 | 12.8%), Security & Protection (151 | 10.4%), Firefighting & Prevention (151 | 10.4%), Food Preparation & Serving (86 | 5.9%), and Healthcare Support (79 | 5.4%).
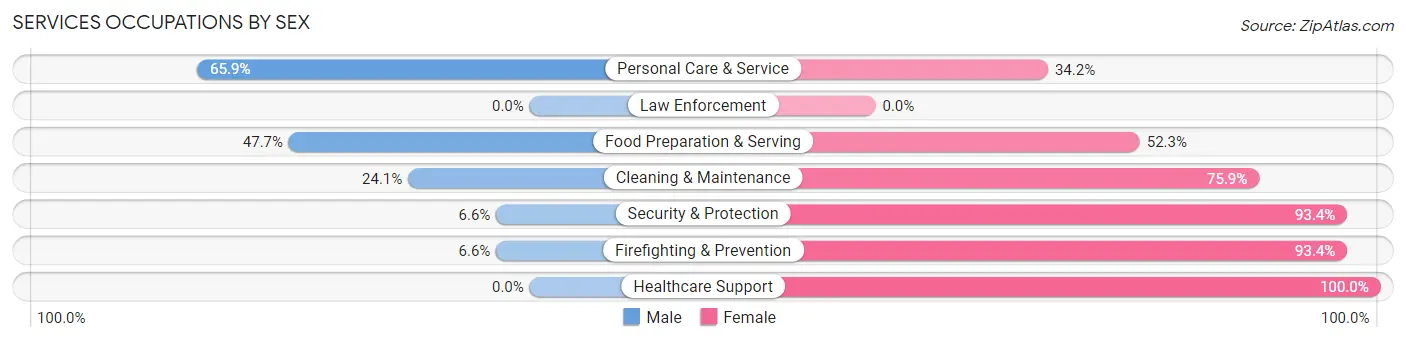
Services Occupations by Sex
Within the Services occupations in Seminole Manor, the most male-oriented occupations are Personal Care & Service (65.8%), Food Preparation & Serving (47.7%), and Cleaning & Maintenance (24.1%), while the most female-oriented occupations are Healthcare Support (100.0%), Security & Protection (93.4%), and Firefighting & Prevention (93.4%).
| Occupation | Male | Female |
| Healthcare Support | 0 (0.0%) | 79 (100.0%) |
| Security & Protection | 10 (6.6%) | 141 (93.4%) |
| Firefighting & Prevention | 10 (6.6%) | 141 (93.4%) |
| Law Enforcement | 0 (0.0%) | 0 (0.0%) |
| Food Preparation & Serving | 41 (47.7%) | 45 (52.3%) |
| Cleaning & Maintenance | 45 (24.1%) | 142 (75.9%) |
| Personal Care & Service | 27 (65.8%) | 14 (34.2%) |
| Total (Category) | 123 (22.6%) | 421 (77.4%) |
| Total (Overall) | 777 (53.4%) | 679 (46.6%) |
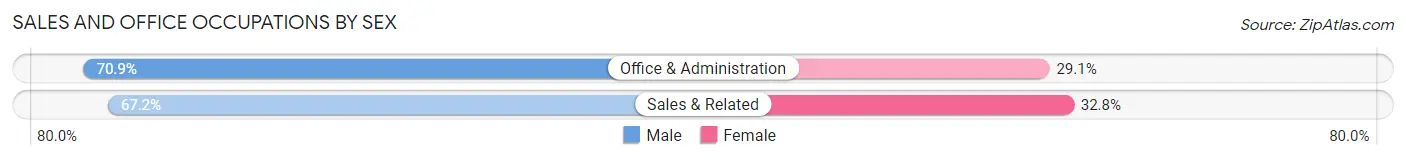
Sales and Office Occupations
The most common Sales and Office occupations in Seminole Manor are Office & Administration (172 | 11.8%), and Sales & Related (128 | 8.8%).

Sales and Office Occupations by Sex
| Occupation | Male | Female |
| Sales & Related | 86 (67.2%) | 42 (32.8%) |
| Office & Administration | 122 (70.9%) | 50 (29.1%) |
| Total (Category) | 208 (69.3%) | 92 (30.7%) |
| Total (Overall) | 777 (53.4%) | 679 (46.6%) |
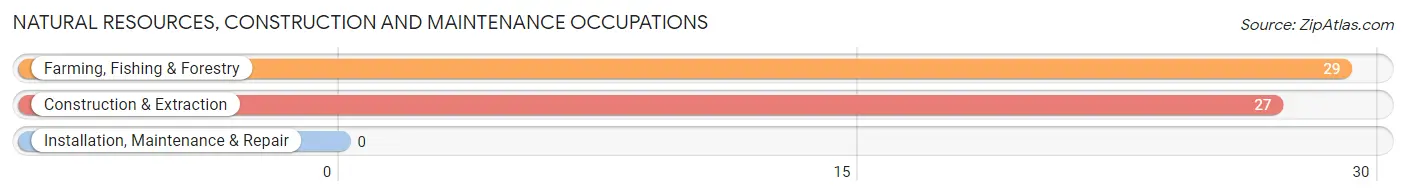
Natural Resources, Construction and Maintenance Occupations
The most common Natural Resources, Construction and Maintenance occupations in Seminole Manor are Farming, Fishing & Forestry (29 | 2.0%), and Construction & Extraction (27 | 1.8%).
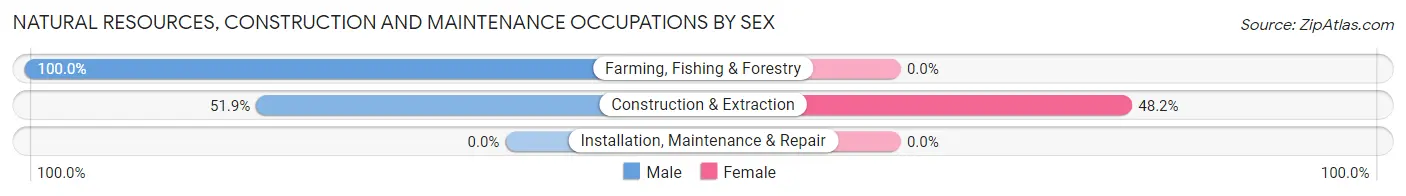
Natural Resources, Construction and Maintenance Occupations by Sex
| Occupation | Male | Female |
| Farming, Fishing & Forestry | 29 (100.0%) | 0 (0.0%) |
| Construction & Extraction | 14 (51.8%) | 13 (48.1%) |
| Installation, Maintenance & Repair | 0 (0.0%) | 0 (0.0%) |
| Total (Category) | 43 (76.8%) | 13 (23.2%) |
| Total (Overall) | 777 (53.4%) | 679 (46.6%) |
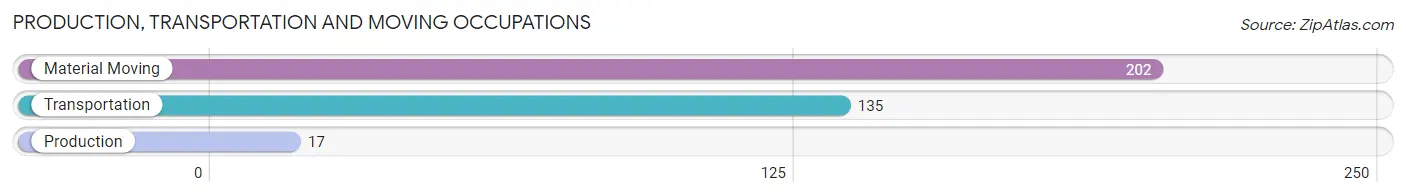
Production, Transportation and Moving Occupations
The most common Production, Transportation and Moving occupations in Seminole Manor are Material Moving (202 | 13.9%), Transportation (135 | 9.3%), and Production (17 | 1.2%).
Production, Transportation and Moving Occupations by Sex
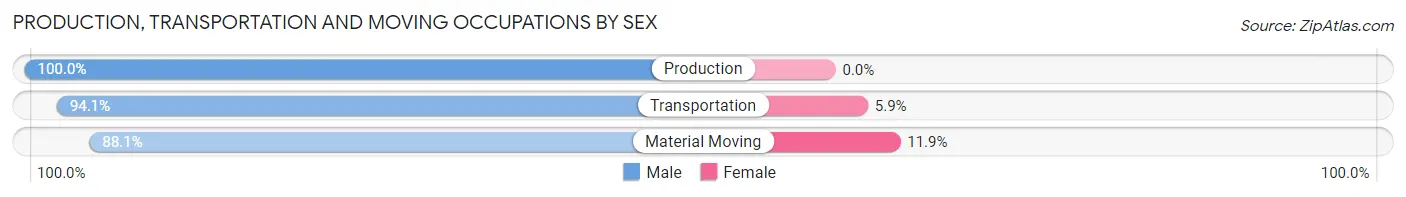
| Occupation | Male | Female |
| Production | 17 (100.0%) | 0 (0.0%) |
| Transportation | 127 (94.1%) | 8 (5.9%) |
| Material Moving | 178 (88.1%) | 24 (11.9%) |
| Total (Category) | 322 (91.0%) | 32 (9.0%) |
| Total (Overall) | 777 (53.4%) | 679 (46.6%) |
Employment Industries by Sex in Seminole Manor
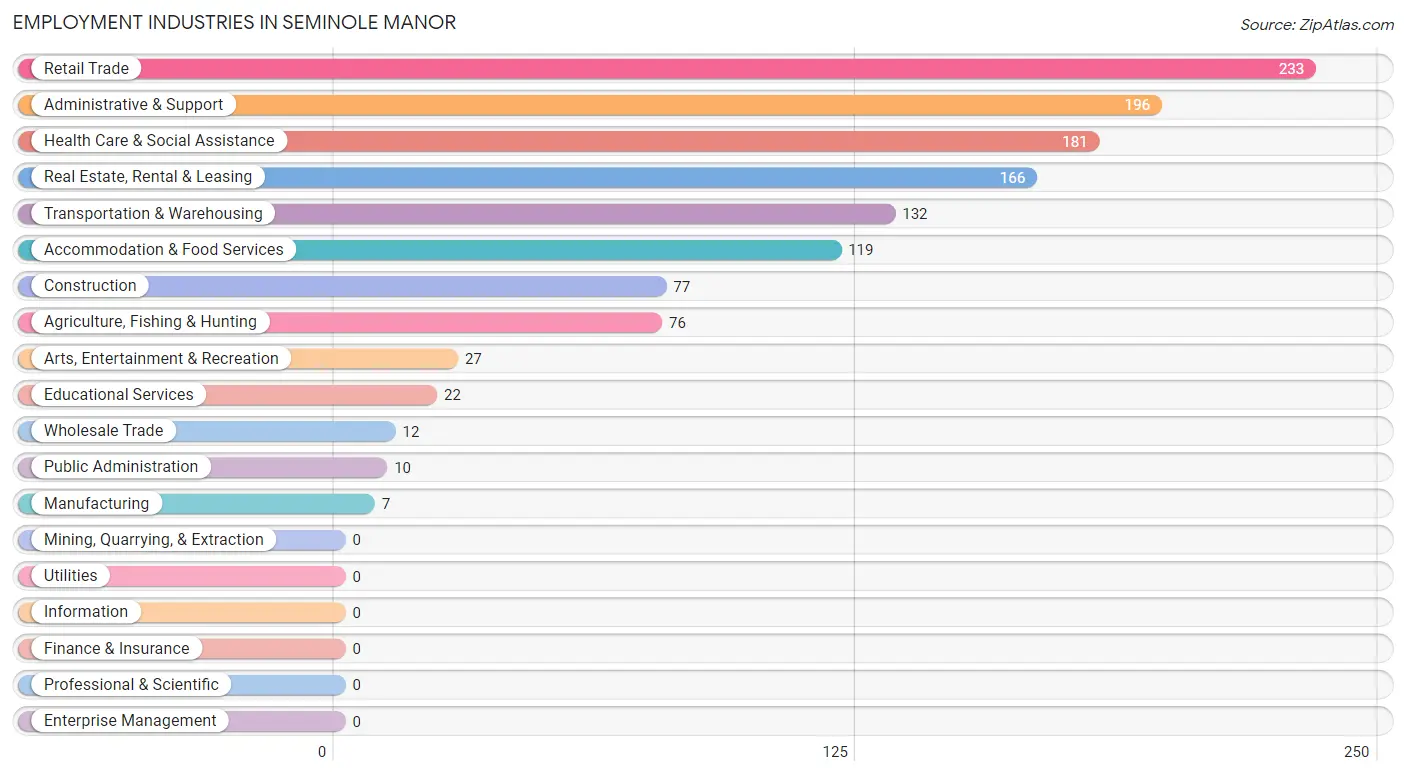
Employment Industries in Seminole Manor
The major employment industries in Seminole Manor include Retail Trade (233 | 16.0%), Administrative & Support (196 | 13.5%), Health Care & Social Assistance (181 | 12.4%), Real Estate, Rental & Leasing (166 | 11.4%), and Transportation & Warehousing (132 | 9.1%).
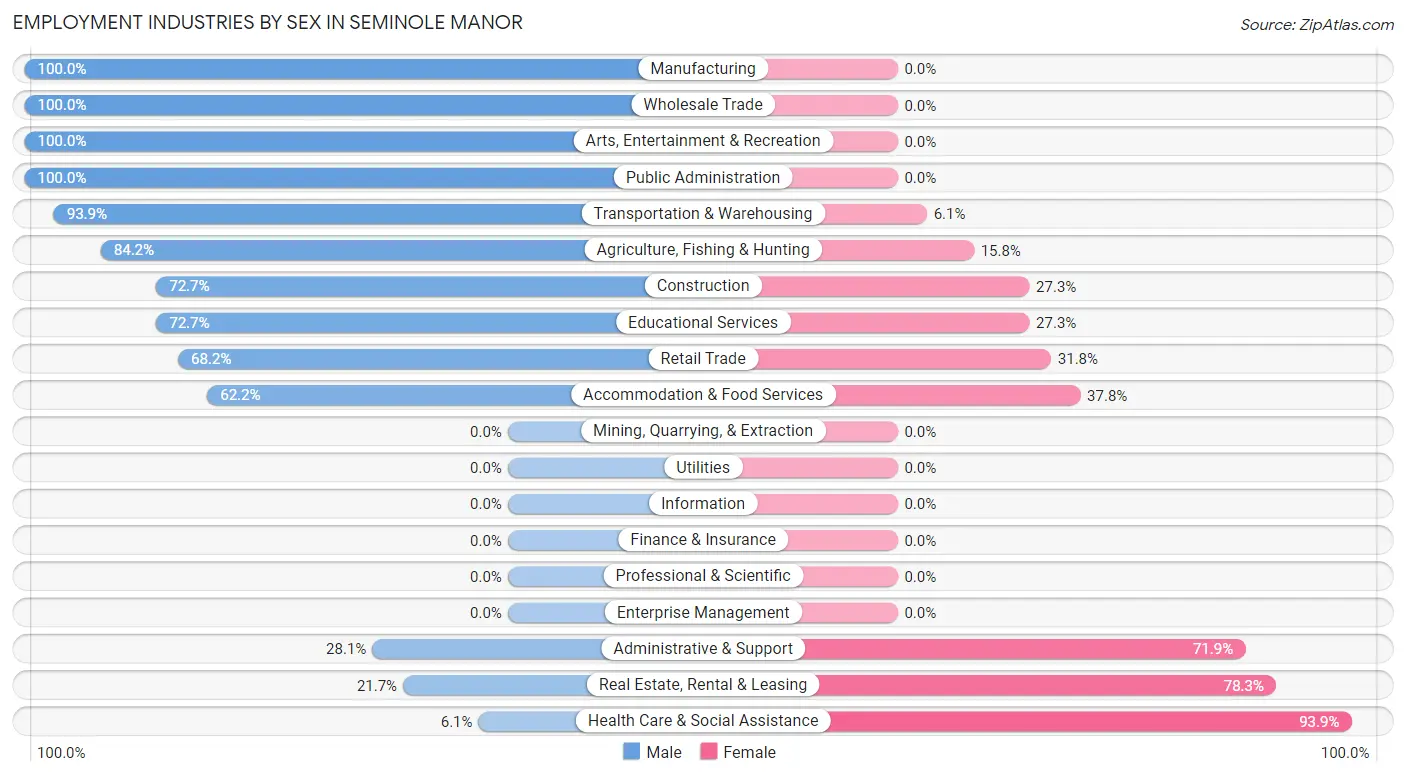
Employment Industries by Sex in Seminole Manor
The Seminole Manor industries that see more men than women are Manufacturing (100.0%), Wholesale Trade (100.0%), and Arts, Entertainment & Recreation (100.0%), whereas the industries that tend to have a higher number of women are Health Care & Social Assistance (93.9%), Real Estate, Rental & Leasing (78.3%), and Administrative & Support (71.9%).
| Industry | Male | Female |
| Agriculture, Fishing & Hunting | 64 (84.2%) | 12 (15.8%) |
| Mining, Quarrying, & Extraction | 0 (0.0%) | 0 (0.0%) |
| Construction | 56 (72.7%) | 21 (27.3%) |
| Manufacturing | 7 (100.0%) | 0 (0.0%) |
| Wholesale Trade | 12 (100.0%) | 0 (0.0%) |
| Retail Trade | 159 (68.2%) | 74 (31.8%) |
| Transportation & Warehousing | 124 (93.9%) | 8 (6.1%) |
| Utilities | 0 (0.0%) | 0 (0.0%) |
| Information | 0 (0.0%) | 0 (0.0%) |
| Finance & Insurance | 0 (0.0%) | 0 (0.0%) |
| Real Estate, Rental & Leasing | 36 (21.7%) | 130 (78.3%) |
| Professional & Scientific | 0 (0.0%) | 0 (0.0%) |
| Enterprise Management | 0 (0.0%) | 0 (0.0%) |
| Administrative & Support | 55 (28.1%) | 141 (71.9%) |
| Educational Services | 16 (72.7%) | 6 (27.3%) |
| Health Care & Social Assistance | 11 (6.1%) | 170 (93.9%) |
| Arts, Entertainment & Recreation | 27 (100.0%) | 0 (0.0%) |
| Accommodation & Food Services | 74 (62.2%) | 45 (37.8%) |
| Public Administration | 10 (100.0%) | 0 (0.0%) |
| Total | 777 (53.4%) | 679 (46.6%) |
Education in Seminole Manor
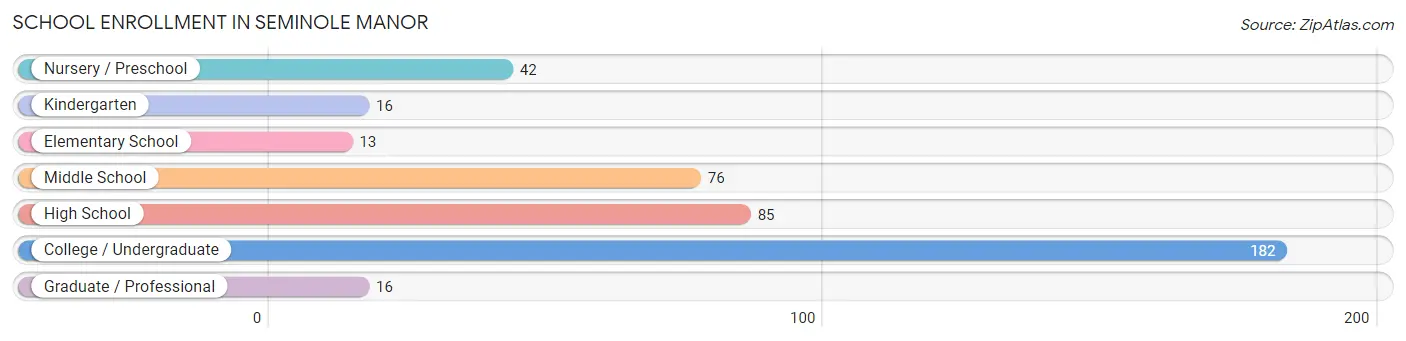
School Enrollment in Seminole Manor
The most common levels of schooling among the 430 students in Seminole Manor are college / undergraduate (182 | 42.3%), high school (85 | 19.8%), and middle school (76 | 17.7%).
| School Level | # Students | % Students |
| Nursery / Preschool | 42 | 9.8% |
| Kindergarten | 16 | 3.7% |
| Elementary School | 13 | 3.0% |
| Middle School | 76 | 17.7% |
| High School | 85 | 19.8% |
| College / Undergraduate | 182 | 42.3% |
| Graduate / Professional | 16 | 3.7% |
| Total | 430 | 100.0% |
School Enrollment by Age by Funding Source in Seminole Manor
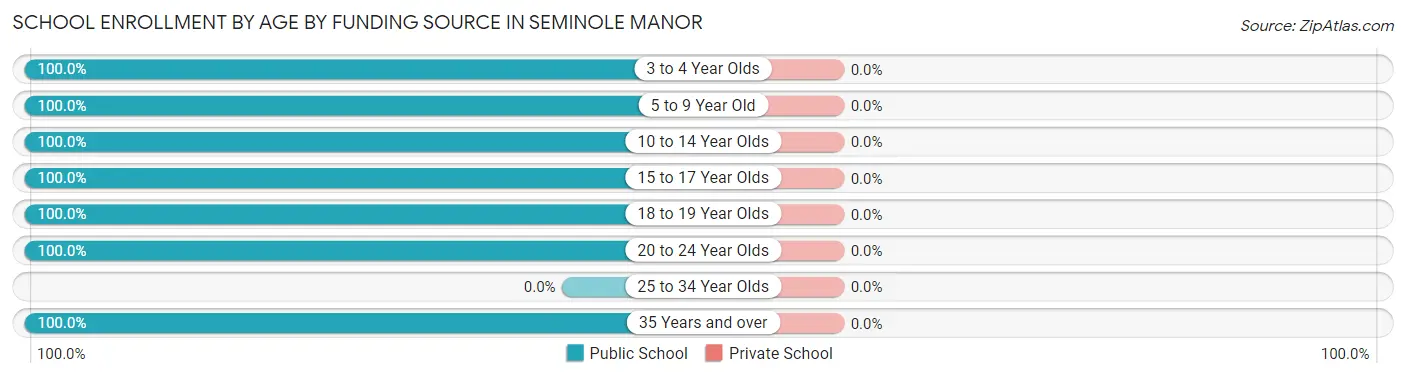
| Age Bracket | Public School | Private School |
| 3 to 4 Year Olds | 16 (100.0%) | 0 (0.0%) |
| 5 to 9 Year Old | 55 (100.0%) | 0 (0.0%) |
| 10 to 14 Year Olds | 76 (100.0%) | 0 (0.0%) |
| 15 to 17 Year Olds | 50 (100.0%) | 0 (0.0%) |
| 18 to 19 Year Olds | 35 (100.0%) | 0 (0.0%) |
| 20 to 24 Year Olds | 182 (100.0%) | 0 (0.0%) |
| 25 to 34 Year Olds | 0 (0.0%) | 0 (0.0%) |
| 35 Years and over | 16 (100.0%) | 0 (0.0%) |
| Total | 430 (100.0%) | 0 (0.0%) |
Educational Attainment by Field of Study in Seminole Manor
Communications (47 | 43.1%), science & technology (16 | 14.7%), multidisciplinary studies (12 | 11.0%), psychology (10 | 9.2%), and social sciences (10 | 9.2%) are the most common fields of study among 109 individuals in Seminole Manor who have obtained a bachelor's degree or higher.
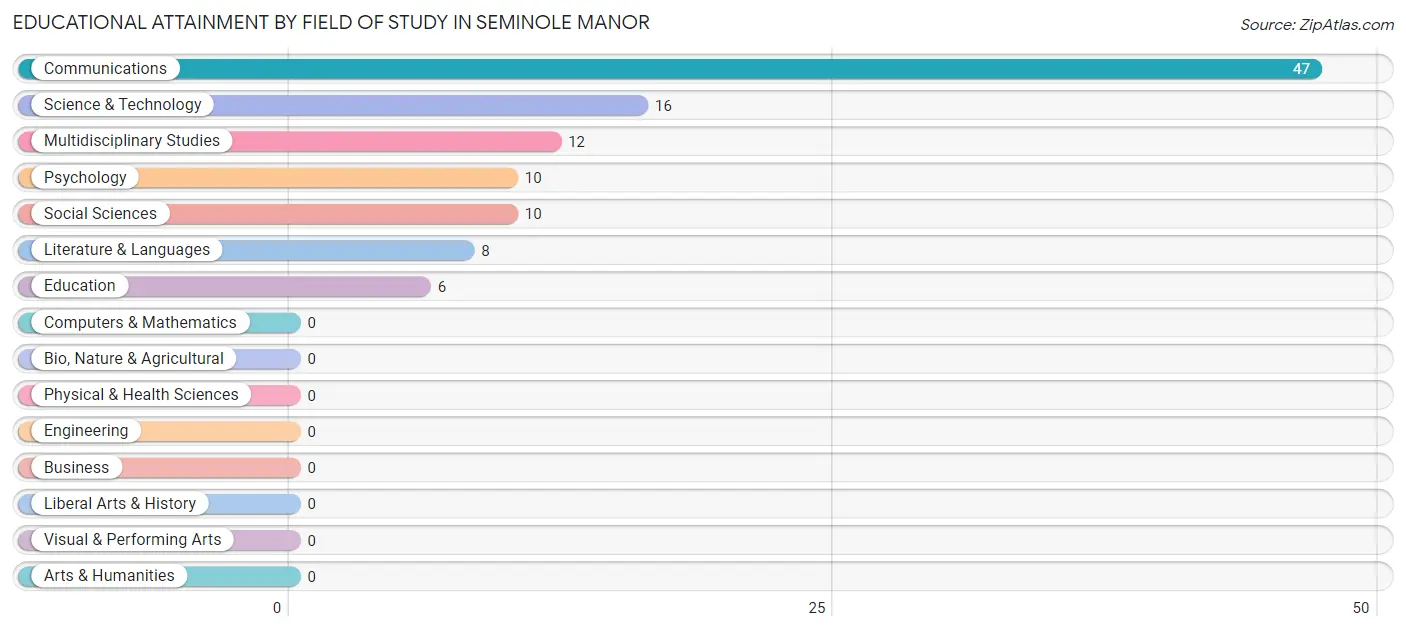
| Field of Study | # Graduates | % Graduates |
| Computers & Mathematics | 0 | 0.0% |
| Bio, Nature & Agricultural | 0 | 0.0% |
| Physical & Health Sciences | 0 | 0.0% |
| Psychology | 10 | 9.2% |
| Social Sciences | 10 | 9.2% |
| Engineering | 0 | 0.0% |
| Multidisciplinary Studies | 12 | 11.0% |
| Science & Technology | 16 | 14.7% |
| Business | 0 | 0.0% |
| Education | 6 | 5.5% |
| Literature & Languages | 8 | 7.3% |
| Liberal Arts & History | 0 | 0.0% |
| Visual & Performing Arts | 0 | 0.0% |
| Communications | 47 | 43.1% |
| Arts & Humanities | 0 | 0.0% |
| Total | 109 | 100.0% |
Transportation & Commute in Seminole Manor
Vehicle Availability by Sex in Seminole Manor
The most prevalent vehicle ownership categories in Seminole Manor are males with 3 vehicles (482, accounting for 66.3%) and females with 3 vehicles (252, making up 72.3%).
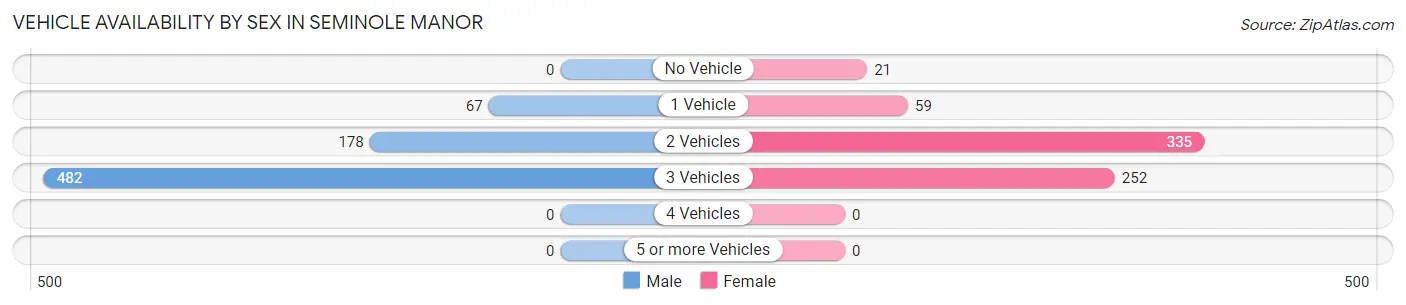
| Vehicles Available | Male | Female |
| No Vehicle | 0 (0.0%) | 21 (3.2%) |
| 1 Vehicle | 67 (9.2%) | 59 (8.8%) |
| 2 Vehicles | 178 (24.5%) | 335 (50.2%) |
| 3 Vehicles | 482 (66.3%) | 252 (37.8%) |
| 4 Vehicles | 0 (0.0%) | 0 (0.0%) |
| 5 or more Vehicles | 0 (0.0%) | 0 (0.0%) |
| Total | 727 (100.0%) | 667 (100.0%) |
Commute Time in Seminole Manor
The most frequently occuring commute durations in Seminole Manor are 15 to 19 minutes (329 commuters, 24.1%), 45 to 59 minutes (289 commuters, 21.1%), and 10 to 14 minutes (182 commuters, 13.3%).
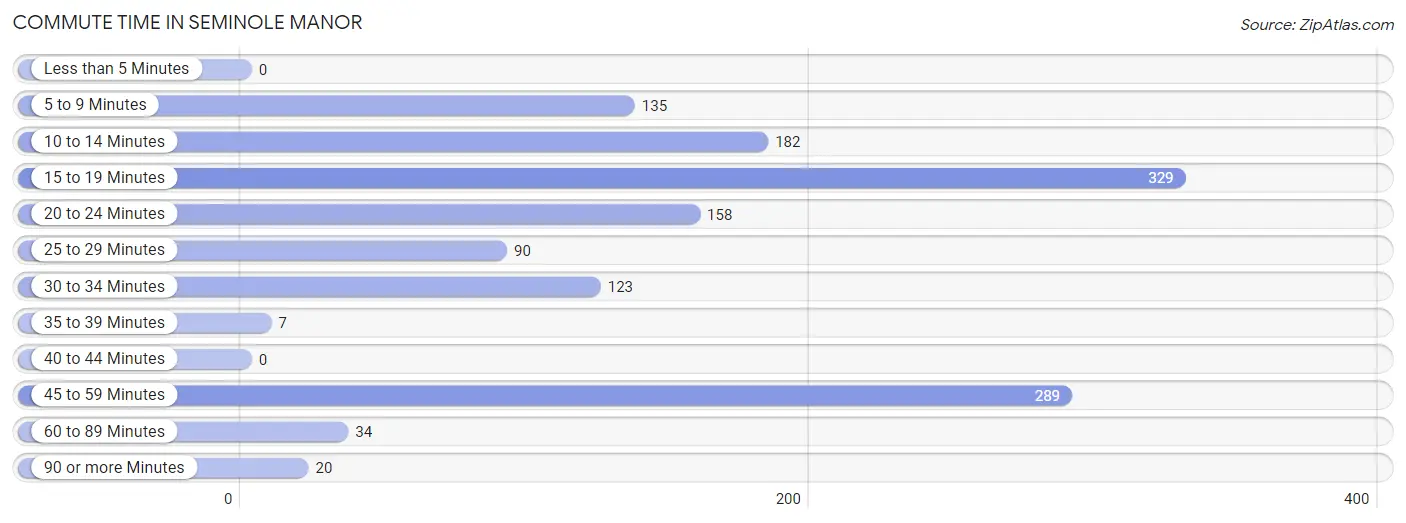
| Commute Time | # Commuters | % Commuters |
| Less than 5 Minutes | 0 | 0.0% |
| 5 to 9 Minutes | 135 | 9.9% |
| 10 to 14 Minutes | 182 | 13.3% |
| 15 to 19 Minutes | 329 | 24.1% |
| 20 to 24 Minutes | 158 | 11.6% |
| 25 to 29 Minutes | 90 | 6.6% |
| 30 to 34 Minutes | 123 | 9.0% |
| 35 to 39 Minutes | 7 | 0.5% |
| 40 to 44 Minutes | 0 | 0.0% |
| 45 to 59 Minutes | 289 | 21.1% |
| 60 to 89 Minutes | 34 | 2.5% |
| 90 or more Minutes | 20 | 1.5% |
Commute Time by Sex in Seminole Manor
The most common commute times in Seminole Manor are 15 to 19 minutes (301 commuters, 43.0%) for males and 45 to 59 minutes (174 commuters, 26.1%) for females.
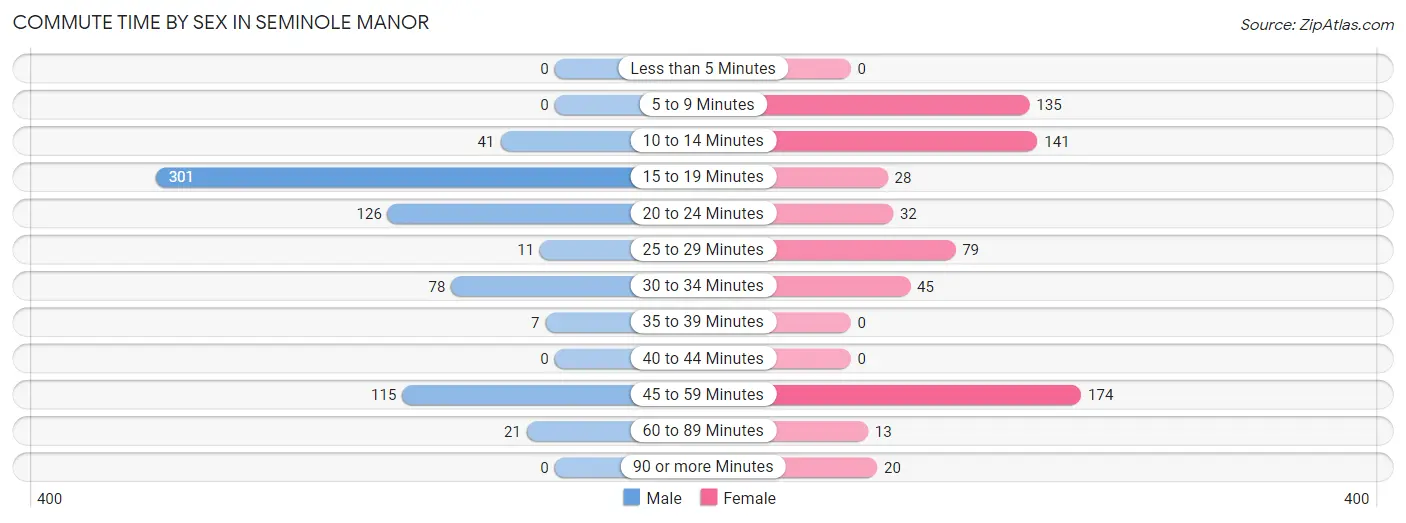
| Commute Time | Male | Female |
| Less than 5 Minutes | 0 (0.0%) | 0 (0.0%) |
| 5 to 9 Minutes | 0 (0.0%) | 135 (20.2%) |
| 10 to 14 Minutes | 41 (5.9%) | 141 (21.1%) |
| 15 to 19 Minutes | 301 (43.0%) | 28 (4.2%) |
| 20 to 24 Minutes | 126 (18.0%) | 32 (4.8%) |
| 25 to 29 Minutes | 11 (1.6%) | 79 (11.8%) |
| 30 to 34 Minutes | 78 (11.1%) | 45 (6.8%) |
| 35 to 39 Minutes | 7 (1.0%) | 0 (0.0%) |
| 40 to 44 Minutes | 0 (0.0%) | 0 (0.0%) |
| 45 to 59 Minutes | 115 (16.4%) | 174 (26.1%) |
| 60 to 89 Minutes | 21 (3.0%) | 13 (1.9%) |
| 90 or more Minutes | 0 (0.0%) | 20 (3.0%) |
Time of Departure to Work by Sex in Seminole Manor
The most frequent times of departure to work in Seminole Manor are 8:30 AM to 8:59 AM (126, 18.0%) for males and 4:00 PM to 11:59 PM (161, 24.1%) for females.
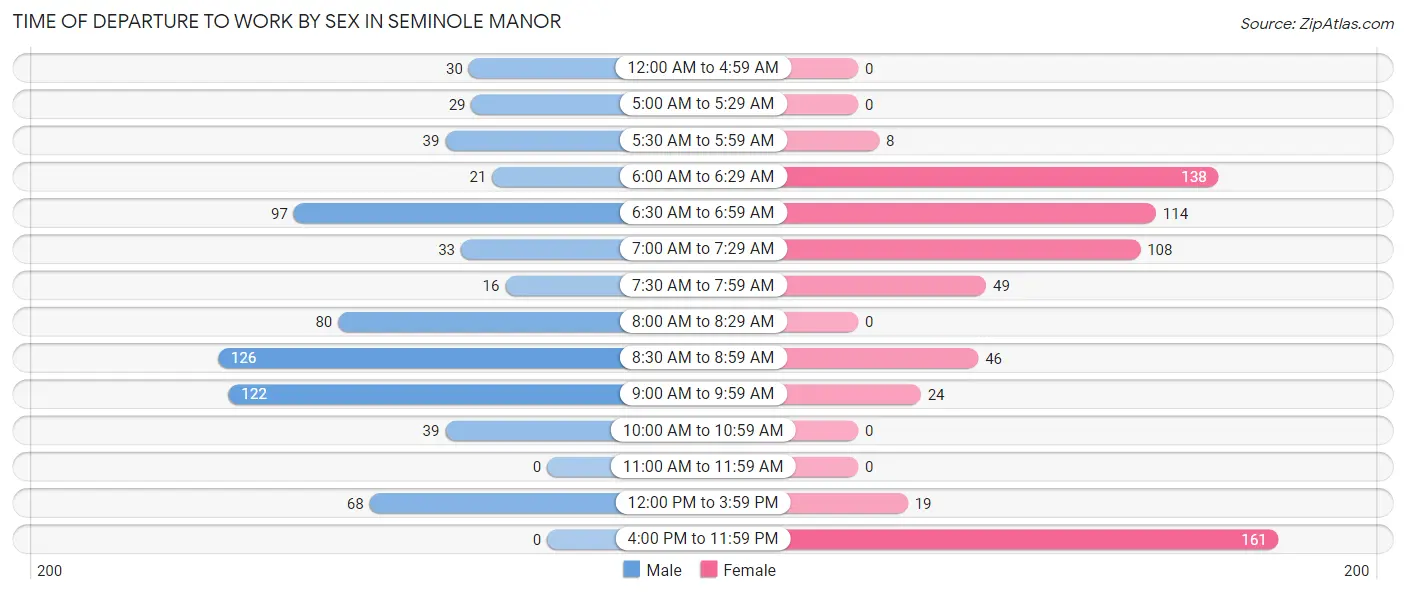
| Time of Departure | Male | Female |
| 12:00 AM to 4:59 AM | 30 (4.3%) | 0 (0.0%) |
| 5:00 AM to 5:29 AM | 29 (4.1%) | 0 (0.0%) |
| 5:30 AM to 5:59 AM | 39 (5.6%) | 8 (1.2%) |
| 6:00 AM to 6:29 AM | 21 (3.0%) | 138 (20.7%) |
| 6:30 AM to 6:59 AM | 97 (13.9%) | 114 (17.1%) |
| 7:00 AM to 7:29 AM | 33 (4.7%) | 108 (16.2%) |
| 7:30 AM to 7:59 AM | 16 (2.3%) | 49 (7.3%) |
| 8:00 AM to 8:29 AM | 80 (11.4%) | 0 (0.0%) |
| 8:30 AM to 8:59 AM | 126 (18.0%) | 46 (6.9%) |
| 9:00 AM to 9:59 AM | 122 (17.4%) | 24 (3.6%) |
| 10:00 AM to 10:59 AM | 39 (5.6%) | 0 (0.0%) |
| 11:00 AM to 11:59 AM | 0 (0.0%) | 0 (0.0%) |
| 12:00 PM to 3:59 PM | 68 (9.7%) | 19 (2.9%) |
| 4:00 PM to 11:59 PM | 0 (0.0%) | 161 (24.1%) |
| Total | 700 (100.0%) | 667 (100.0%) |
Housing Occupancy in Seminole Manor
Occupancy by Ownership in Seminole Manor
Of the total 734 dwellings in Seminole Manor, owner-occupied units account for 623 (84.9%), while renter-occupied units make up 111 (15.1%).
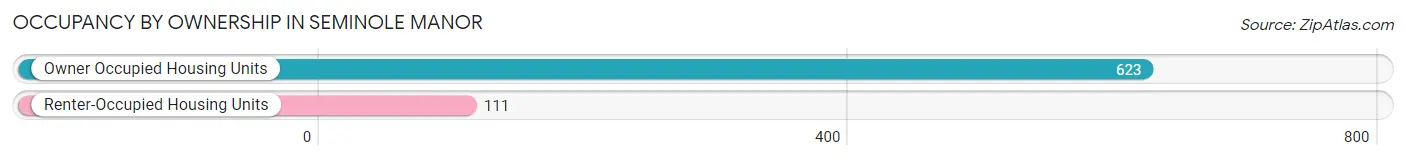
| Occupancy | # Housing Units | % Housing Units |
| Owner Occupied Housing Units | 623 | 84.9% |
| Renter-Occupied Housing Units | 111 | 15.1% |
| Total Occupied Housing Units | 734 | 100.0% |
Occupancy by Household Size in Seminole Manor
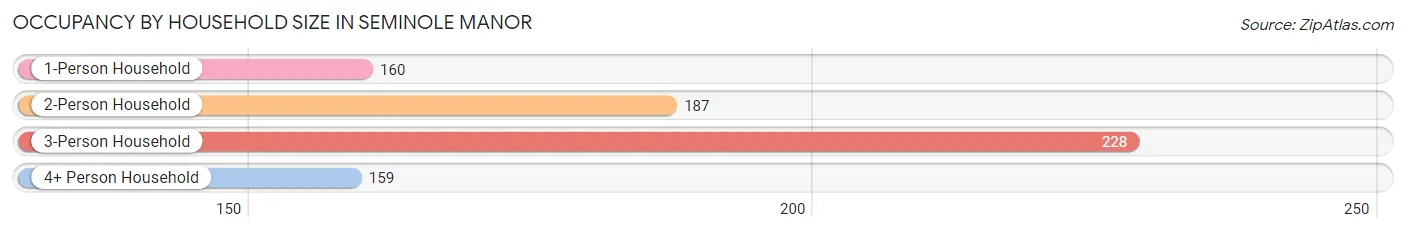
| Household Size | # Housing Units | % Housing Units |
| 1-Person Household | 160 | 21.8% |
| 2-Person Household | 187 | 25.5% |
| 3-Person Household | 228 | 31.1% |
| 4+ Person Household | 159 | 21.7% |
| Total Housing Units | 734 | 100.0% |
Occupancy by Ownership by Household Size in Seminole Manor
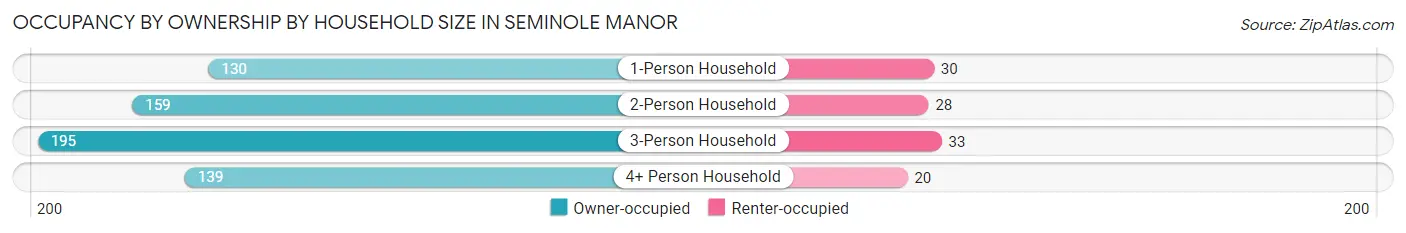
| Household Size | Owner-occupied | Renter-occupied |
| 1-Person Household | 130 (81.2%) | 30 (18.8%) |
| 2-Person Household | 159 (85.0%) | 28 (15.0%) |
| 3-Person Household | 195 (85.5%) | 33 (14.5%) |
| 4+ Person Household | 139 (87.4%) | 20 (12.6%) |
| Total Housing Units | 623 (84.9%) | 111 (15.1%) |
Occupancy by Educational Attainment in Seminole Manor
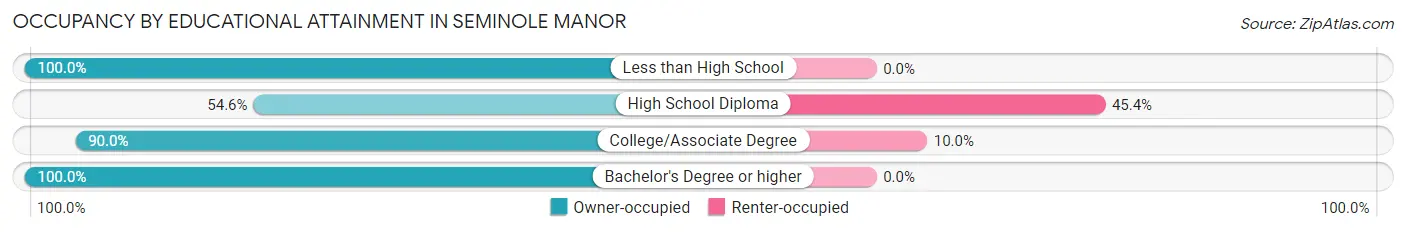
| Household Size | Owner-occupied | Renter-occupied |
| Less than High School | 200 (100.0%) | 0 (0.0%) |
| High School Diploma | 100 (54.6%) | 83 (45.4%) |
| College/Associate Degree | 251 (90.0%) | 28 (10.0%) |
| Bachelor's Degree or higher | 72 (100.0%) | 0 (0.0%) |
Occupancy by Age of Householder in Seminole Manor
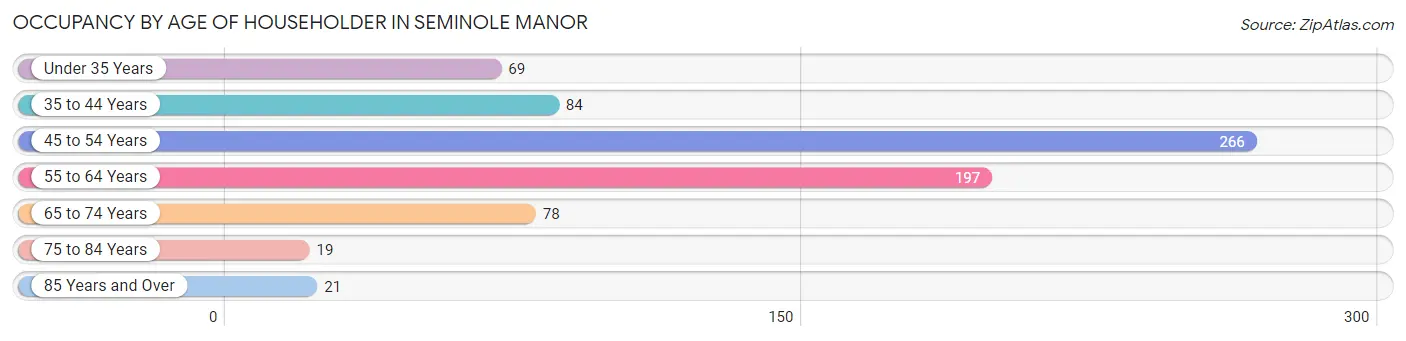
| Age Bracket | # Households | % Households |
| Under 35 Years | 69 | 9.4% |
| 35 to 44 Years | 84 | 11.4% |
| 45 to 54 Years | 266 | 36.2% |
| 55 to 64 Years | 197 | 26.8% |
| 65 to 74 Years | 78 | 10.6% |
| 75 to 84 Years | 19 | 2.6% |
| 85 Years and Over | 21 | 2.9% |
| Total | 734 | 100.0% |
Housing Finances in Seminole Manor
Median Income by Occupancy in Seminole Manor
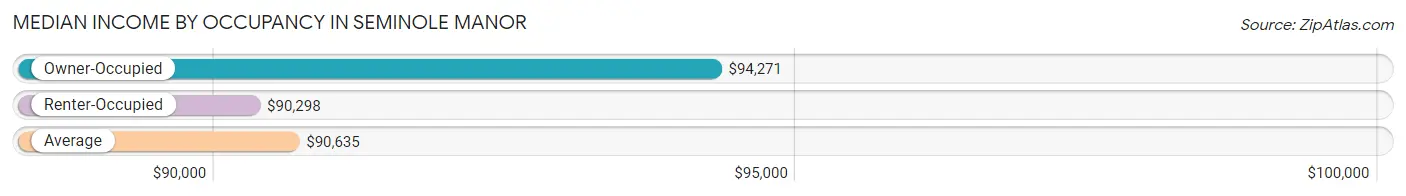
| Occupancy Type | # Households | Median Income |
| Owner-Occupied | 623 (84.9%) | $94,271 |
| Renter-Occupied | 111 (15.1%) | $90,298 |
| Average | 734 (100.0%) | $90,635 |
Occupancy by Householder Income Bracket in Seminole Manor
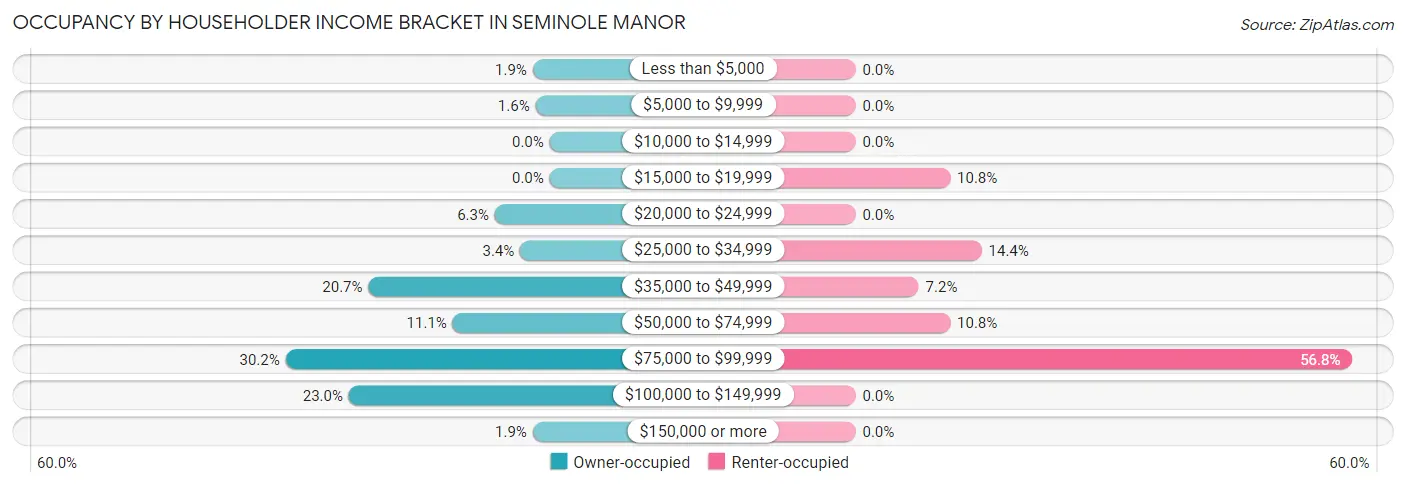
| Income Bracket | Owner-occupied | Renter-occupied |
| Less than $5,000 | 12 (1.9%) | 0 (0.0%) |
| $5,000 to $9,999 | 10 (1.6%) | 0 (0.0%) |
| $10,000 to $14,999 | 0 (0.0%) | 0 (0.0%) |
| $15,000 to $19,999 | 0 (0.0%) | 12 (10.8%) |
| $20,000 to $24,999 | 39 (6.3%) | 0 (0.0%) |
| $25,000 to $34,999 | 21 (3.4%) | 16 (14.4%) |
| $35,000 to $49,999 | 129 (20.7%) | 8 (7.2%) |
| $50,000 to $74,999 | 69 (11.1%) | 12 (10.8%) |
| $75,000 to $99,999 | 188 (30.2%) | 63 (56.8%) |
| $100,000 to $149,999 | 143 (23.0%) | 0 (0.0%) |
| $150,000 or more | 12 (1.9%) | 0 (0.0%) |
| Total | 623 (100.0%) | 111 (100.0%) |
Monthly Housing Cost Tiers in Seminole Manor
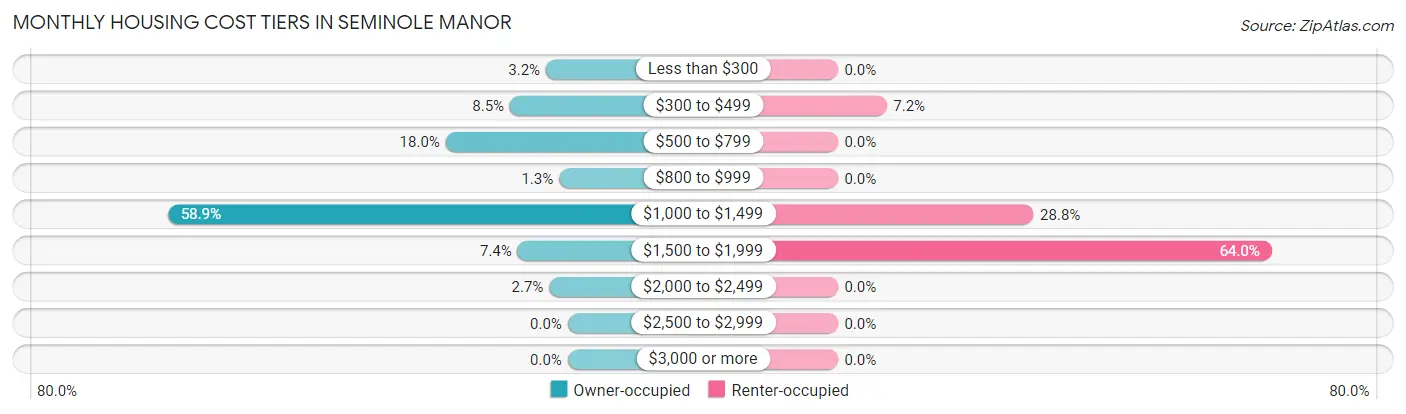
| Monthly Cost | Owner-occupied | Renter-occupied |
| Less than $300 | 20 (3.2%) | 0 (0.0%) |
| $300 to $499 | 53 (8.5%) | 8 (7.2%) |
| $500 to $799 | 112 (18.0%) | 0 (0.0%) |
| $800 to $999 | 8 (1.3%) | 0 (0.0%) |
| $1,000 to $1,499 | 367 (58.9%) | 32 (28.8%) |
| $1,500 to $1,999 | 46 (7.4%) | 71 (64.0%) |
| $2,000 to $2,499 | 17 (2.7%) | 0 (0.0%) |
| $2,500 to $2,999 | 0 (0.0%) | 0 (0.0%) |
| $3,000 or more | 0 (0.0%) | 0 (0.0%) |
| Total | 623 (100.0%) | 111 (100.0%) |
Physical Housing Characteristics in Seminole Manor
Housing Structures in Seminole Manor
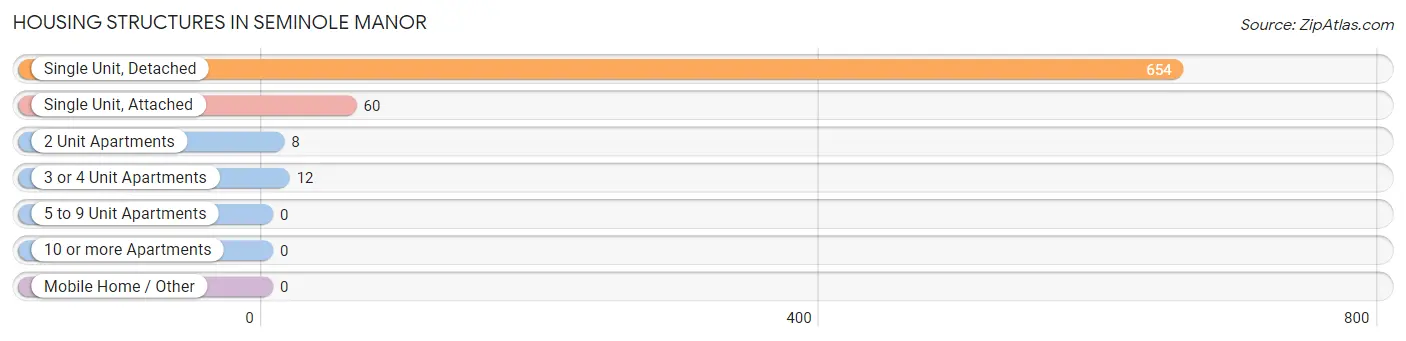
| Structure Type | # Housing Units | % Housing Units |
| Single Unit, Detached | 654 | 89.1% |
| Single Unit, Attached | 60 | 8.2% |
| 2 Unit Apartments | 8 | 1.1% |
| 3 or 4 Unit Apartments | 12 | 1.6% |
| 5 to 9 Unit Apartments | 0 | 0.0% |
| 10 or more Apartments | 0 | 0.0% |
| Mobile Home / Other | 0 | 0.0% |
| Total | 734 | 100.0% |
Housing Structures by Occupancy in Seminole Manor
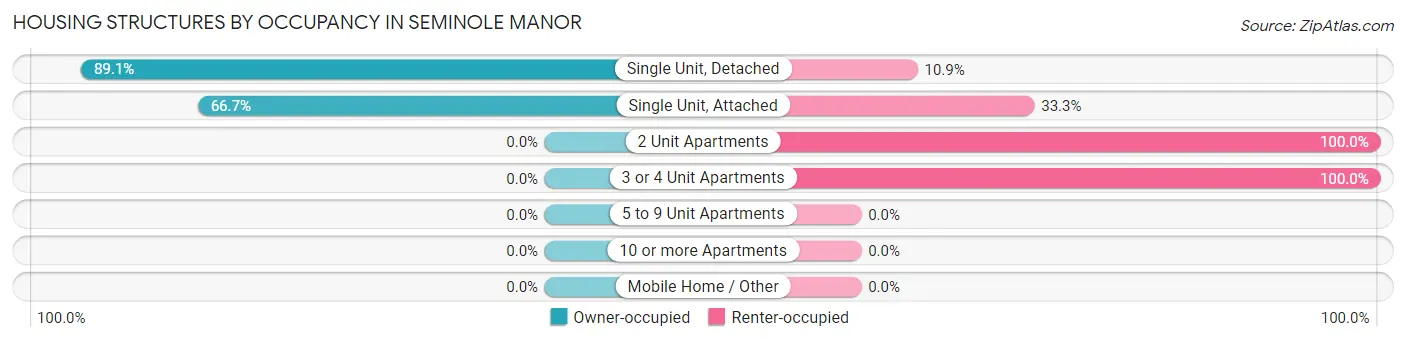
| Structure Type | Owner-occupied | Renter-occupied |
| Single Unit, Detached | 583 (89.1%) | 71 (10.9%) |
| Single Unit, Attached | 40 (66.7%) | 20 (33.3%) |
| 2 Unit Apartments | 0 (0.0%) | 8 (100.0%) |
| 3 or 4 Unit Apartments | 0 (0.0%) | 12 (100.0%) |
| 5 to 9 Unit Apartments | 0 (0.0%) | 0 (0.0%) |
| 10 or more Apartments | 0 (0.0%) | 0 (0.0%) |
| Mobile Home / Other | 0 (0.0%) | 0 (0.0%) |
| Total | 623 (84.9%) | 111 (15.1%) |
Housing Structures by Number of Rooms in Seminole Manor
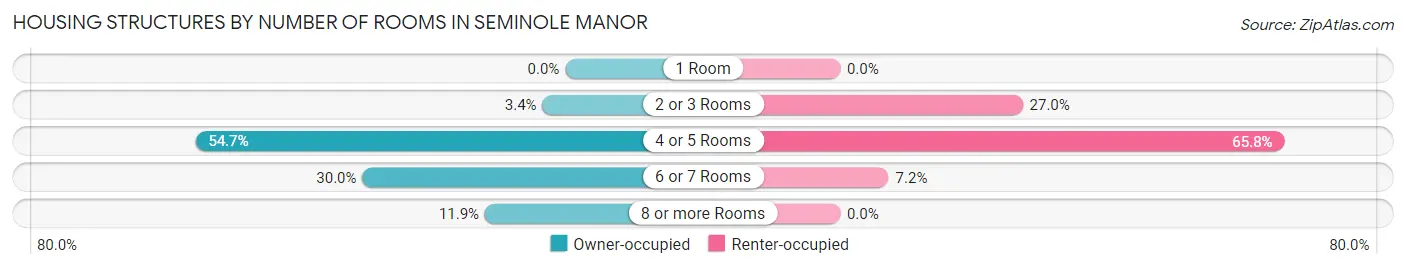
| Number of Rooms | Owner-occupied | Renter-occupied |
| 1 Room | 0 (0.0%) | 0 (0.0%) |
| 2 or 3 Rooms | 21 (3.4%) | 30 (27.0%) |
| 4 or 5 Rooms | 341 (54.7%) | 73 (65.8%) |
| 6 or 7 Rooms | 187 (30.0%) | 8 (7.2%) |
| 8 or more Rooms | 74 (11.9%) | 0 (0.0%) |
| Total | 623 (100.0%) | 111 (100.0%) |
Housing Structure by Heating Type in Seminole Manor
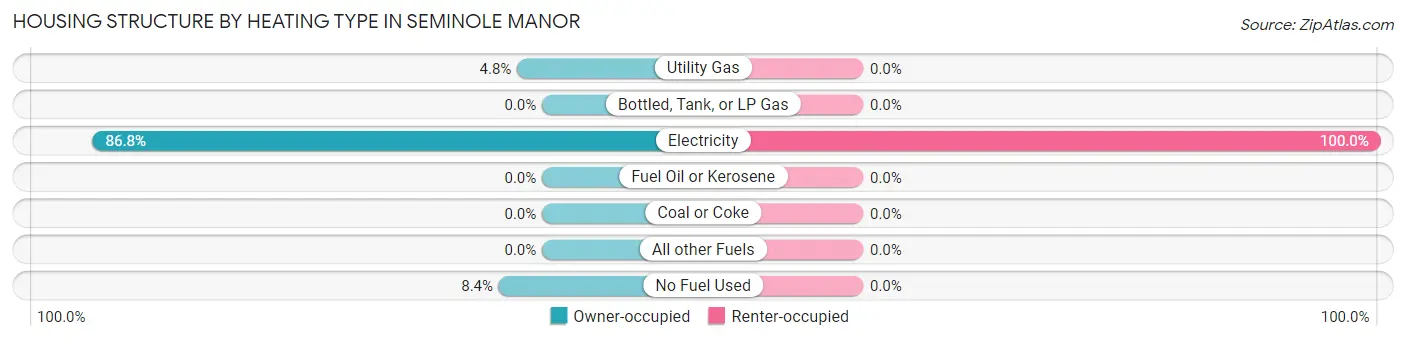
| Heating Type | Owner-occupied | Renter-occupied |
| Utility Gas | 30 (4.8%) | 0 (0.0%) |
| Bottled, Tank, or LP Gas | 0 (0.0%) | 0 (0.0%) |
| Electricity | 541 (86.8%) | 111 (100.0%) |
| Fuel Oil or Kerosene | 0 (0.0%) | 0 (0.0%) |
| Coal or Coke | 0 (0.0%) | 0 (0.0%) |
| All other Fuels | 0 (0.0%) | 0 (0.0%) |
| No Fuel Used | 52 (8.4%) | 0 (0.0%) |
| Total | 623 (100.0%) | 111 (100.0%) |
Household Vehicle Usage in Seminole Manor
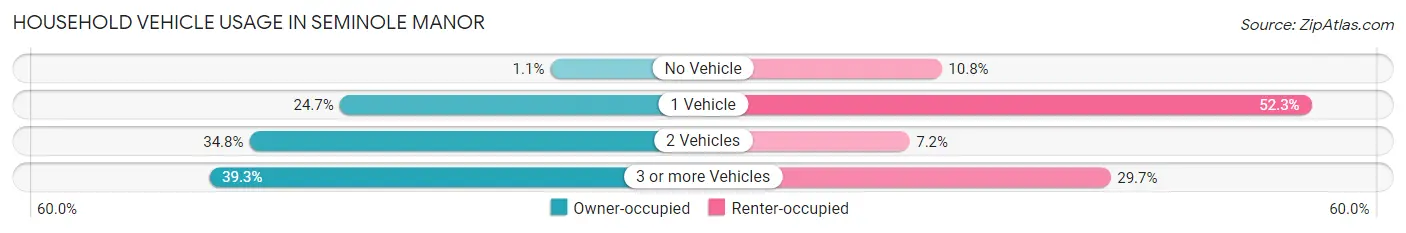
| Vehicles per Household | Owner-occupied | Renter-occupied |
| No Vehicle | 7 (1.1%) | 12 (10.8%) |
| 1 Vehicle | 154 (24.7%) | 58 (52.2%) |
| 2 Vehicles | 217 (34.8%) | 8 (7.2%) |
| 3 or more Vehicles | 245 (39.3%) | 33 (29.7%) |
| Total | 623 (100.0%) | 111 (100.0%) |
Real Estate & Mortgages in Seminole Manor
Real Estate and Mortgage Overview in Seminole Manor
| Characteristic | Without Mortgage | With Mortgage |
| Housing Units | 163 | 460 |
| Median Property Value | $210,500 | $244,800 |
| Median Household Income | $65,924 | $12 |
| Monthly Housing Costs | $514 | $0 |
| Real Estate Taxes | $1,551 | $0 |
Property Value by Mortgage Status in Seminole Manor
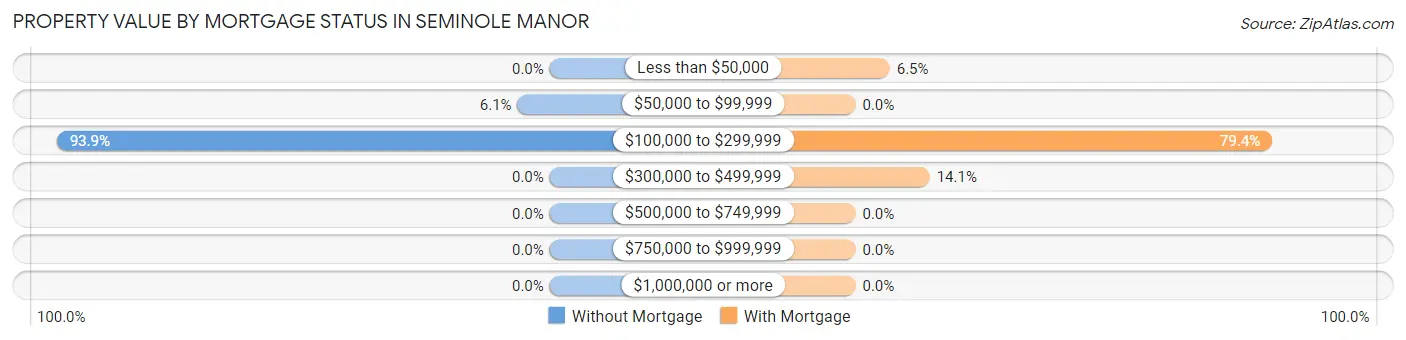
| Property Value | Without Mortgage | With Mortgage |
| Less than $50,000 | 0 (0.0%) | 30 (6.5%) |
| $50,000 to $99,999 | 10 (6.1%) | 0 (0.0%) |
| $100,000 to $299,999 | 153 (93.9%) | 365 (79.3%) |
| $300,000 to $499,999 | 0 (0.0%) | 65 (14.1%) |
| $500,000 to $749,999 | 0 (0.0%) | 0 (0.0%) |
| $750,000 to $999,999 | 0 (0.0%) | 0 (0.0%) |
| $1,000,000 or more | 0 (0.0%) | 0 (0.0%) |
| Total | 163 (100.0%) | 460 (100.0%) |
Household Income by Mortgage Status in Seminole Manor
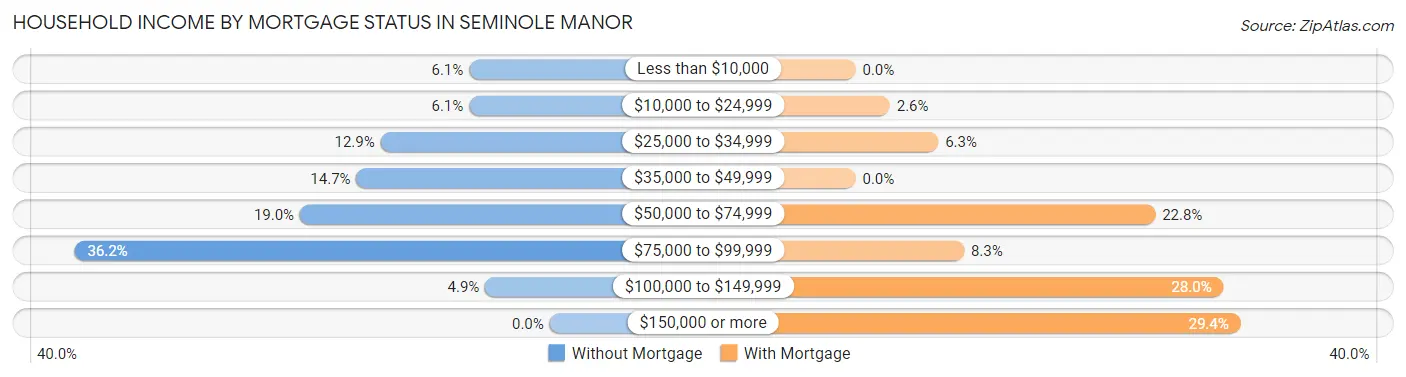
| Household Income | Without Mortgage | With Mortgage |
| Less than $10,000 | 10 (6.1%) | 0 (0.0%) |
| $10,000 to $24,999 | 10 (6.1%) | 12 (2.6%) |
| $25,000 to $34,999 | 21 (12.9%) | 29 (6.3%) |
| $35,000 to $49,999 | 24 (14.7%) | 0 (0.0%) |
| $50,000 to $74,999 | 31 (19.0%) | 105 (22.8%) |
| $75,000 to $99,999 | 59 (36.2%) | 38 (8.3%) |
| $100,000 to $149,999 | 8 (4.9%) | 129 (28.0%) |
| $150,000 or more | 0 (0.0%) | 135 (29.3%) |
| Total | 163 (100.0%) | 460 (100.0%) |
Property Value to Household Income Ratio in Seminole Manor
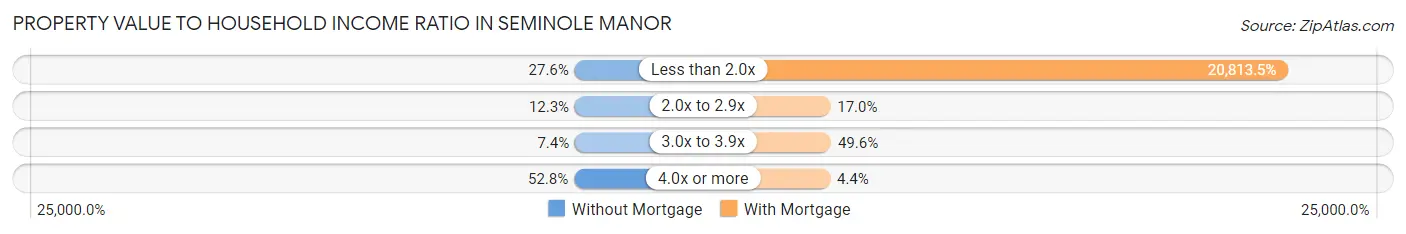
| Value-to-Income Ratio | Without Mortgage | With Mortgage |
| Less than 2.0x | 45 (27.6%) | 95,742 (20,813.5%) |
| 2.0x to 2.9x | 20 (12.3%) | 78 (17.0%) |
| 3.0x to 3.9x | 12 (7.4%) | 228 (49.6%) |
| 4.0x or more | 86 (52.8%) | 20 (4.3%) |
| Total | 163 (100.0%) | 460 (100.0%) |
Real Estate Taxes by Mortgage Status in Seminole Manor
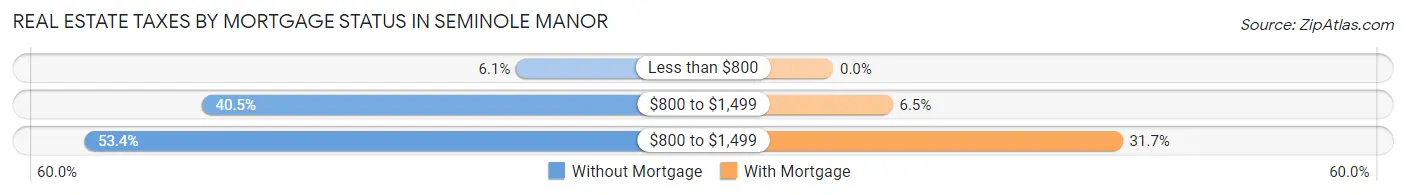
| Property Taxes | Without Mortgage | With Mortgage |
| Less than $800 | 10 (6.1%) | 0 (0.0%) |
| $800 to $1,499 | 66 (40.5%) | 30 (6.5%) |
| $800 to $1,499 | 87 (53.4%) | 146 (31.7%) |
| Total | 163 (100.0%) | 460 (100.0%) |
Health & Disability in Seminole Manor
Health Insurance Coverage by Age in Seminole Manor
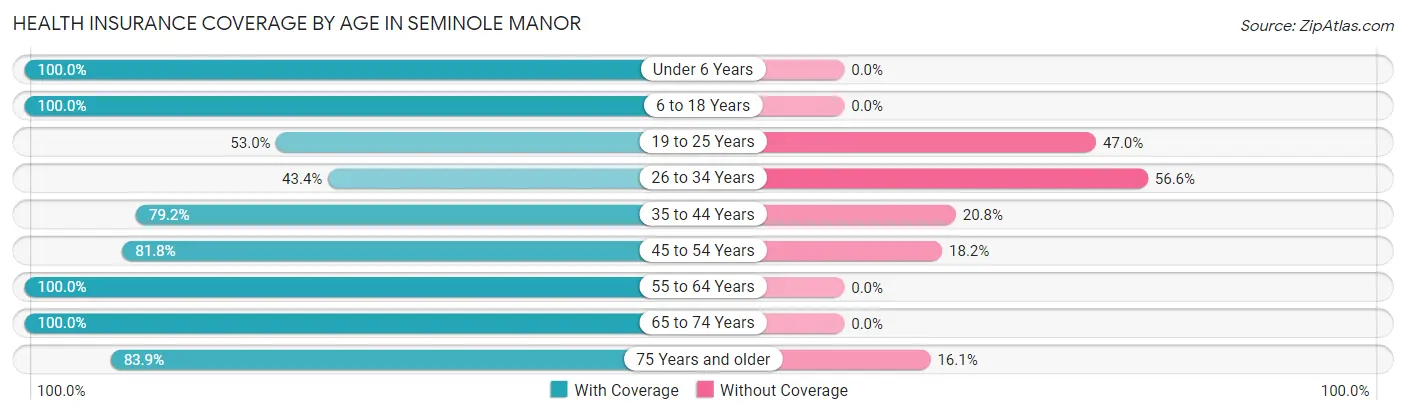
| Age Bracket | With Coverage | Without Coverage |
| Under 6 Years | 97 (100.0%) | 0 (0.0%) |
| 6 to 18 Years | 190 (100.0%) | 0 (0.0%) |
| 19 to 25 Years | 244 (53.0%) | 216 (47.0%) |
| 26 to 34 Years | 105 (43.4%) | 137 (56.6%) |
| 35 to 44 Years | 160 (79.2%) | 42 (20.8%) |
| 45 to 54 Years | 417 (81.8%) | 93 (18.2%) |
| 55 to 64 Years | 263 (100.0%) | 0 (0.0%) |
| 65 to 74 Years | 100 (100.0%) | 0 (0.0%) |
| 75 Years and older | 141 (83.9%) | 27 (16.1%) |
| Total | 1,717 (76.9%) | 515 (23.1%) |
Health Insurance Coverage by Citizenship Status in Seminole Manor
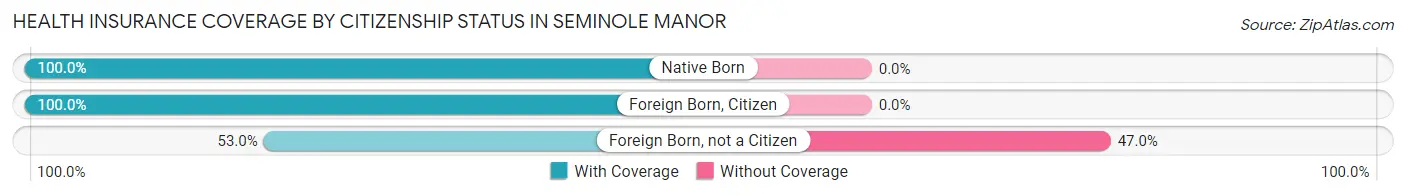
| Citizenship Status | With Coverage | Without Coverage |
| Native Born | 97 (100.0%) | 0 (0.0%) |
| Foreign Born, Citizen | 190 (100.0%) | 0 (0.0%) |
| Foreign Born, not a Citizen | 244 (53.0%) | 216 (47.0%) |
Health Insurance Coverage by Household Income in Seminole Manor
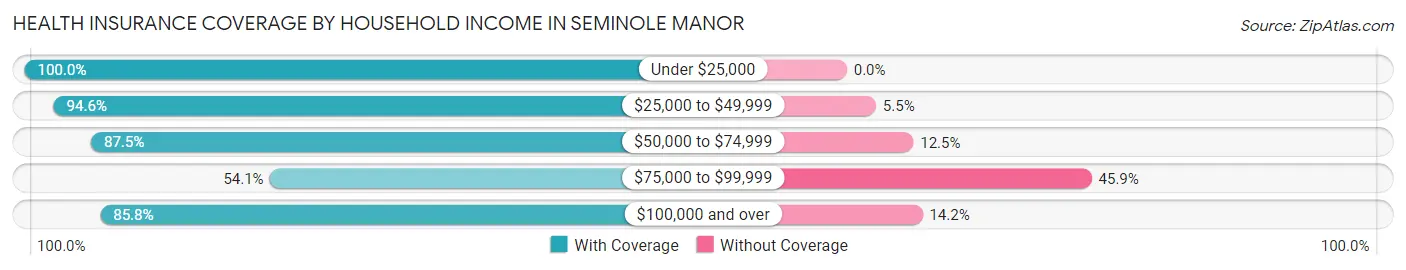
| Household Income | With Coverage | Without Coverage |
| Under $25,000 | 104 (100.0%) | 0 (0.0%) |
| $25,000 to $49,999 | 416 (94.6%) | 24 (5.4%) |
| $50,000 to $74,999 | 274 (87.5%) | 39 (12.5%) |
| $75,000 to $99,999 | 439 (54.1%) | 372 (45.9%) |
| $100,000 and over | 484 (85.8%) | 80 (14.2%) |
Public vs Private Health Insurance Coverage by Age in Seminole Manor
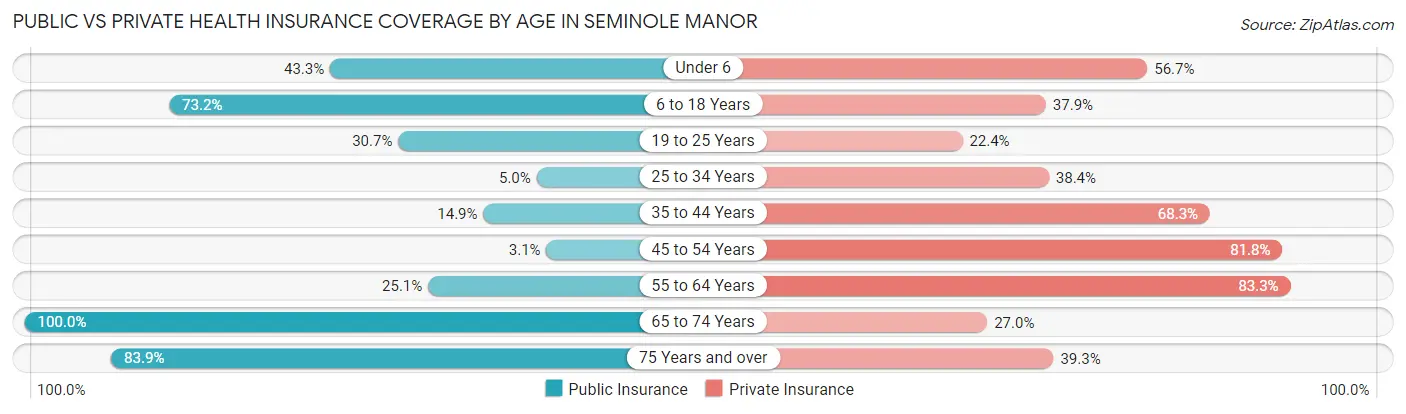
| Age Bracket | Public Insurance | Private Insurance |
| Under 6 | 42 (43.3%) | 55 (56.7%) |
| 6 to 18 Years | 139 (73.2%) | 72 (37.9%) |
| 19 to 25 Years | 141 (30.6%) | 103 (22.4%) |
| 25 to 34 Years | 12 (5.0%) | 93 (38.4%) |
| 35 to 44 Years | 30 (14.8%) | 138 (68.3%) |
| 45 to 54 Years | 16 (3.1%) | 417 (81.8%) |
| 55 to 64 Years | 66 (25.1%) | 219 (83.3%) |
| 65 to 74 Years | 100 (100.0%) | 27 (27.0%) |
| 75 Years and over | 141 (83.9%) | 66 (39.3%) |
| Total | 687 (30.8%) | 1,190 (53.3%) |
Disability Status by Sex by Age in Seminole Manor
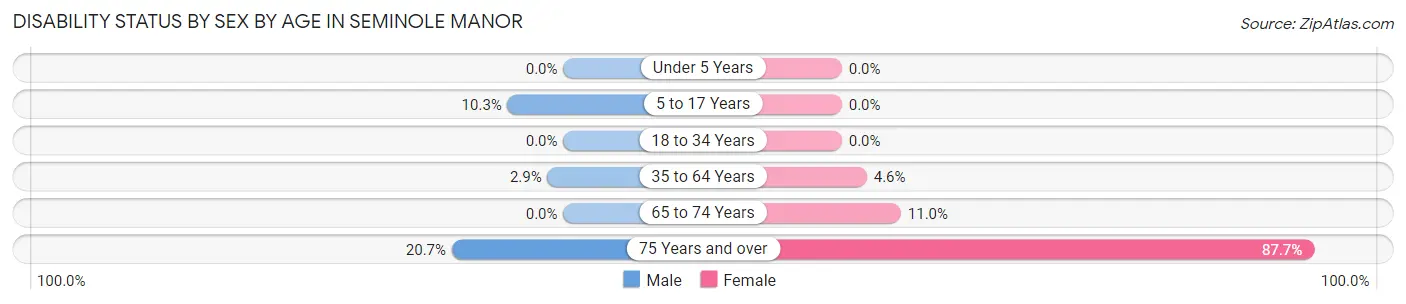
| Age Bracket | Male | Female |
| Under 5 Years | 0 (0.0%) | 0 (0.0%) |
| 5 to 17 Years | 12 (10.3%) | 0 (0.0%) |
| 18 to 34 Years | 0 (0.0%) | 0 (0.0%) |
| 35 to 64 Years | 16 (2.9%) | 20 (4.6%) |
| 65 to 74 Years | 0 (0.0%) | 8 (11.0%) |
| 75 Years and over | 18 (20.7%) | 71 (87.6%) |
Disability Class by Sex by Age in Seminole Manor
Disability Class: Hearing Difficulty
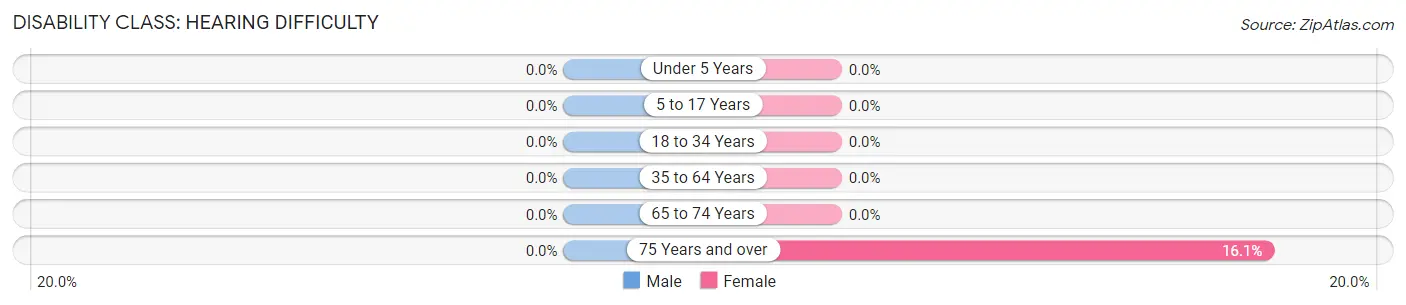
| Age Bracket | Male | Female |
| Under 5 Years | 0 (0.0%) | 0 (0.0%) |
| 5 to 17 Years | 0 (0.0%) | 0 (0.0%) |
| 18 to 34 Years | 0 (0.0%) | 0 (0.0%) |
| 35 to 64 Years | 0 (0.0%) | 0 (0.0%) |
| 65 to 74 Years | 0 (0.0%) | 0 (0.0%) |
| 75 Years and over | 0 (0.0%) | 13 (16.1%) |
Disability Class: Vision Difficulty
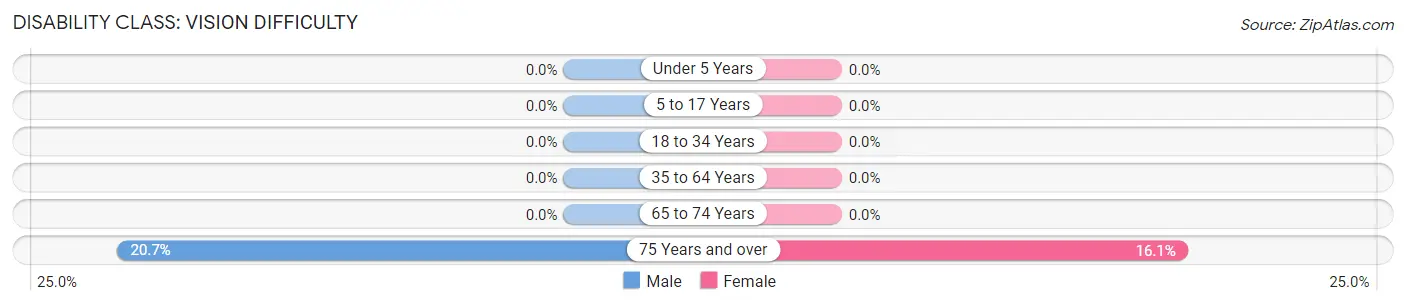
| Age Bracket | Male | Female |
| Under 5 Years | 0 (0.0%) | 0 (0.0%) |
| 5 to 17 Years | 0 (0.0%) | 0 (0.0%) |
| 18 to 34 Years | 0 (0.0%) | 0 (0.0%) |
| 35 to 64 Years | 0 (0.0%) | 0 (0.0%) |
| 65 to 74 Years | 0 (0.0%) | 0 (0.0%) |
| 75 Years and over | 18 (20.7%) | 13 (16.1%) |
Disability Class: Cognitive Difficulty
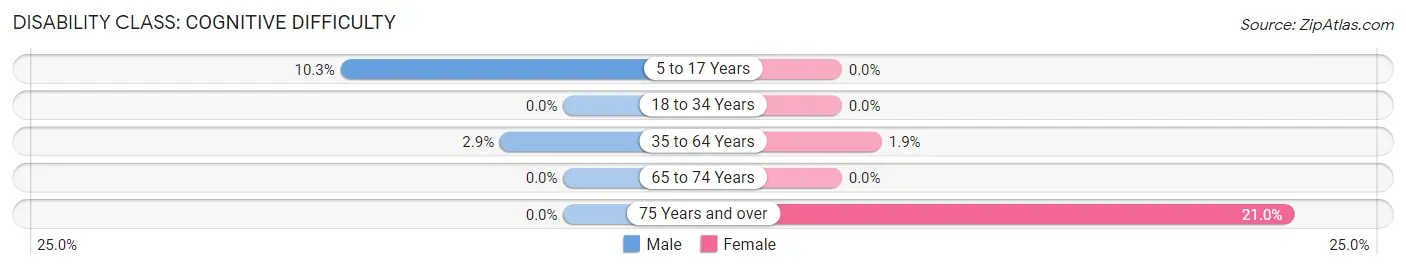
| Age Bracket | Male | Female |
| 5 to 17 Years | 12 (10.3%) | 0 (0.0%) |
| 18 to 34 Years | 0 (0.0%) | 0 (0.0%) |
| 35 to 64 Years | 16 (2.9%) | 8 (1.9%) |
| 65 to 74 Years | 0 (0.0%) | 0 (0.0%) |
| 75 Years and over | 0 (0.0%) | 17 (21.0%) |
Disability Class: Ambulatory Difficulty
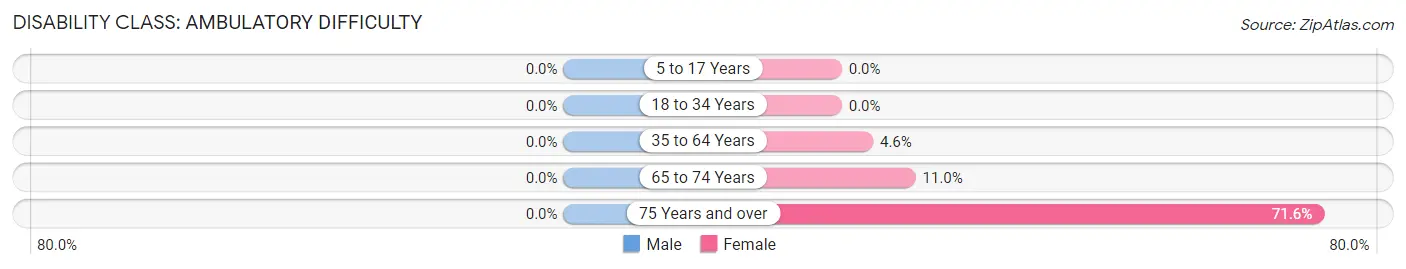
| Age Bracket | Male | Female |
| 5 to 17 Years | 0 (0.0%) | 0 (0.0%) |
| 18 to 34 Years | 0 (0.0%) | 0 (0.0%) |
| 35 to 64 Years | 0 (0.0%) | 20 (4.6%) |
| 65 to 74 Years | 0 (0.0%) | 8 (11.0%) |
| 75 Years and over | 0 (0.0%) | 58 (71.6%) |
Disability Class: Self-Care Difficulty
| Age Bracket | Male | Female |
| 5 to 17 Years | 0 (0.0%) | 0 (0.0%) |
| 18 to 34 Years | 0 (0.0%) | 0 (0.0%) |
| 35 to 64 Years | 0 (0.0%) | 0 (0.0%) |
| 65 to 74 Years | 0 (0.0%) | 0 (0.0%) |
| 75 Years and over | 0 (0.0%) | 0 (0.0%) |
Technology Access in Seminole Manor
Computing Device Access in Seminole Manor
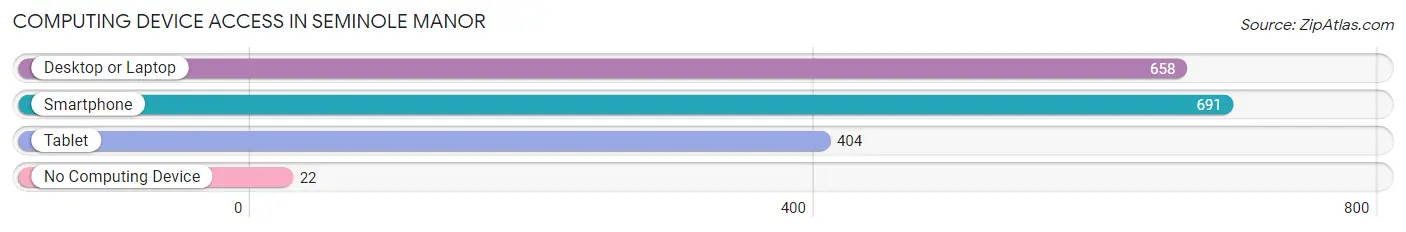
| Device Type | # Households | % Households |
| Desktop or Laptop | 658 | 89.6% |
| Smartphone | 691 | 94.1% |
| Tablet | 404 | 55.0% |
| No Computing Device | 22 | 3.0% |
| Total | 734 | 100.0% |
Internet Access in Seminole Manor
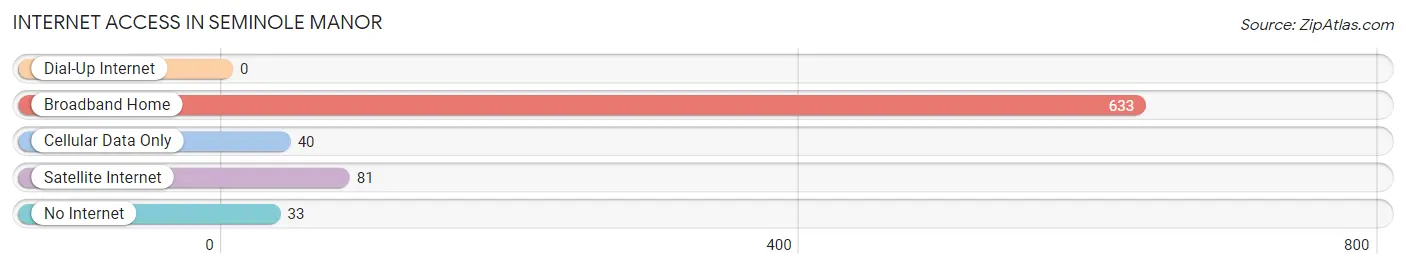
| Internet Type | # Households | % Households |
| Dial-Up Internet | 0 | 0.0% |
| Broadband Home | 633 | 86.2% |
| Cellular Data Only | 40 | 5.4% |
| Satellite Internet | 81 | 11.0% |
| No Internet | 33 | 4.5% |
| Total | 734 | 100.0% |
Seminole Manor Summary
Seminole Manor is a small unincorporated community located in Palm Beach County, Florida. It is situated between the cities of West Palm Beach and Lake Worth, and is part of the Miami metropolitan area. The population of Seminole Manor was estimated to be 1,845 in 2019.
History
Seminole Manor was founded in the early 1900s by a group of Seminole Indians who had been relocated from their ancestral lands in the Everglades. The community was originally known as “Seminole Town” and was located on the south side of the Loxahatchee River. The Seminoles built a trading post and a school, and the community grew to include a post office, a general store, and a church.
In the 1920s, the Seminoles began to sell their land to white settlers, and the community was renamed Seminole Manor. The new settlers built homes and businesses, and the community grew to include a school, a library, and a movie theater.
Geography
Seminole Manor is located in southeastern Palm Beach County, Florida. It is situated between the cities of West Palm Beach and Lake Worth, and is part of the Miami metropolitan area. The community is bordered by the Loxahatchee River to the north, the Atlantic Ocean to the east, and the Everglades to the south and west.
The terrain of Seminole Manor is mostly flat, with some areas of low-lying wetlands. The climate is subtropical, with hot, humid summers and mild, dry winters.
Economy
The economy of Seminole Manor is largely based on agriculture and tourism. The community is home to several farms, which produce a variety of crops, including citrus fruits, vegetables, and sugar cane. The area is also popular with tourists, who come to enjoy the beaches, fishing, and other outdoor activities.
In addition to agriculture and tourism, Seminole Manor is home to a number of small businesses, including restaurants, retail stores, and service providers. The community is also home to a number of manufacturing companies, which produce a variety of products, including furniture, clothing, and electronics.
Demographics
As of 2019, the population of Seminole Manor was estimated to be 1,845. The racial makeup of the community was 79.3% White, 11.2% African American, 4.2% Hispanic or Latino, and 5.3% other. The median household income was $45,945, and the median home value was $179,000.
The majority of the population (63.3%) was born in the United States, while the remaining 36.7% were foreign-born. The most common countries of origin were Haiti (14.2%), Cuba (10.2%), and Mexico (7.2%). The primary language spoken in Seminole Manor was English (90.2%), followed by Spanish (7.2%) and French (2.6%).
Conclusion
Seminole Manor is a small unincorporated community located in Palm Beach County, Florida. It was founded in the early 1900s by a group of Seminole Indians, and has since grown to include a variety of businesses and industries. The population of Seminole Manor was estimated to be 1,845 in 2019, and the majority of the population was born in the United States. The economy of Seminole Manor is largely based on agriculture and tourism, and the community is home to a number of small businesses, manufacturing companies, and service providers.
Common Questions
What is Per Capita Income in Seminole Manor?
Per Capita income in Seminole Manor is $27,227.
What is the Median Family Income in Seminole Manor?
Median Family Income in Seminole Manor is $91,667.
What is the Median Household income in Seminole Manor?
Median Household Income in Seminole Manor is $90,635.
What is Income or Wage Gap in Seminole Manor?
Income or Wage Gap in Seminole Manor is 14.1%.
Women in Seminole Manor earn 85.9 cents for every dollar earned by a man.
What is Inequality or Gini Index in Seminole Manor?
Inequality or Gini Index in Seminole Manor is 0.27.
What is the Total Population of Seminole Manor?
Total Population of Seminole Manor is 2,232.
What is the Total Male Population of Seminole Manor?
Total Male Population of Seminole Manor is 1,300.
What is the Total Female Population of Seminole Manor?
Total Female Population of Seminole Manor is 932.
What is the Ratio of Males per 100 Females in Seminole Manor?
There are 139.48 Males per 100 Females in Seminole Manor.
What is the Ratio of Females per 100 Males in Seminole Manor?
There are 71.69 Females per 100 Males in Seminole Manor.
What is the Median Population Age in Seminole Manor?
Median Population Age in Seminole Manor is 41.2 Years.
What is the Average Family Size in Seminole Manor
Average Family Size in Seminole Manor is 3.5 People.
What is the Average Household Size in Seminole Manor
Average Household Size in Seminole Manor is 3.0 People.
How Large is the Labor Force in Seminole Manor?
There are 1,657 People in the Labor Forcein in Seminole Manor.
What is the Percentage of People in the Labor Force in Seminole Manor?
82.2% of People are in the Labor Force in Seminole Manor.
What is the Unemployment Rate in Seminole Manor?
Unemployment Rate in Seminole Manor is 12.2%.