Pioneer, FL Map & Demographics
Pioneer Map
Pioneer Overview
$18,201
PER CAPITA INCOME
$42,750
AVG HOUSEHOLD INCOME
0.42
INEQUALITY / GINI INDEX
419
TOTAL POPULATION
232
MALE POPULATION
187
FEMALE POPULATION
124.06
MALES / 100 FEMALES
80.60
FEMALES / 100 MALES
56.0
MEDIAN AGE
2.5
AVG FAMILY SIZE
2.4
AVG HOUSEHOLD SIZE
107
LABOR FORCE [ PEOPLE ]
31.1%
PERCENT IN LABOR FORCE
Income in Pioneer
Income Overview in Pioneer
| Characteristic | Number | Measure |
| Per Capita Income | 419 | $18,201 |
| Median Family Income | 138 | $0 |
| Mean Family Income | 138 | $42,058 |
| Median Household Income | 174 | $42,750 |
| Mean Household Income | 174 | $42,448 |
| Income Deficit | 138 | $0 |
| Wage / Income Gap (%) | 419 | 0.00% |
| Wage / Income Gap ($) | 419 | 100.00¢ per $1 |
| Gini / Inequality Index | 419 | 0.42 |
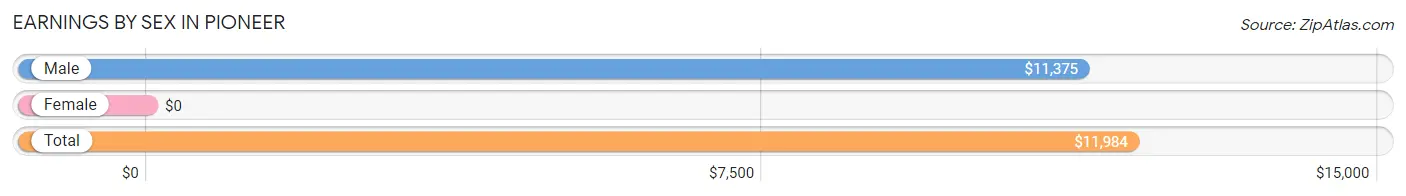
Earnings by Sex in Pioneer
| Sex | Number | Average Earnings |
| Male | 116 (74.8%) | $11,375 |
| Female | 39 (25.2%) | $0 |
| Total | 155 (100.0%) | $11,984 |
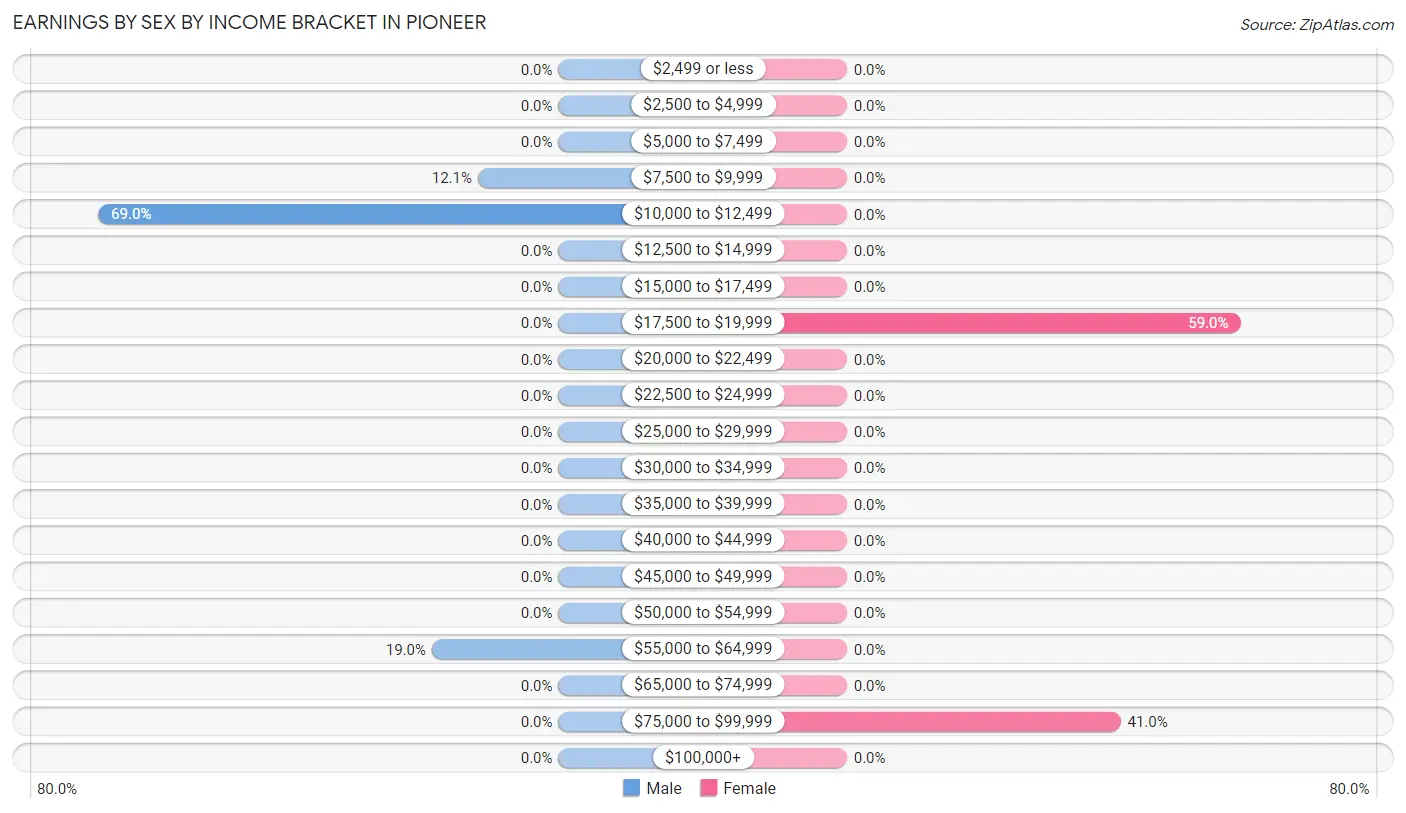
Earnings by Sex by Income Bracket in Pioneer
The most common earnings brackets in Pioneer are $10,000 to $12,499 for men (80 | 69.0%) and $17,500 to $19,999 for women (23 | 59.0%).
| Income | Male | Female |
| $2,499 or less | 0 (0.0%) | 0 (0.0%) |
| $2,500 to $4,999 | 0 (0.0%) | 0 (0.0%) |
| $5,000 to $7,499 | 0 (0.0%) | 0 (0.0%) |
| $7,500 to $9,999 | 14 (12.1%) | 0 (0.0%) |
| $10,000 to $12,499 | 80 (69.0%) | 0 (0.0%) |
| $12,500 to $14,999 | 0 (0.0%) | 0 (0.0%) |
| $15,000 to $17,499 | 0 (0.0%) | 0 (0.0%) |
| $17,500 to $19,999 | 0 (0.0%) | 23 (59.0%) |
| $20,000 to $22,499 | 0 (0.0%) | 0 (0.0%) |
| $22,500 to $24,999 | 0 (0.0%) | 0 (0.0%) |
| $25,000 to $29,999 | 0 (0.0%) | 0 (0.0%) |
| $30,000 to $34,999 | 0 (0.0%) | 0 (0.0%) |
| $35,000 to $39,999 | 0 (0.0%) | 0 (0.0%) |
| $40,000 to $44,999 | 0 (0.0%) | 0 (0.0%) |
| $45,000 to $49,999 | 0 (0.0%) | 0 (0.0%) |
| $50,000 to $54,999 | 0 (0.0%) | 0 (0.0%) |
| $55,000 to $64,999 | 22 (19.0%) | 0 (0.0%) |
| $65,000 to $74,999 | 0 (0.0%) | 0 (0.0%) |
| $75,000 to $99,999 | 0 (0.0%) | 16 (41.0%) |
| $100,000+ | 0 (0.0%) | 0 (0.0%) |
| Total | 116 (100.0%) | 39 (100.0%) |
Earnings by Sex by Educational Attainment in Pioneer
| Educational Attainment | Male Income | Female Income |
| Less than High School | - | - |
| High School Diploma | - | - |
| College or Associate's Degree | - | - |
| Bachelor's Degree | - | - |
| Graduate Degree | - | - |
| Total | $11,375 | $0 |
Family Income in Pioneer
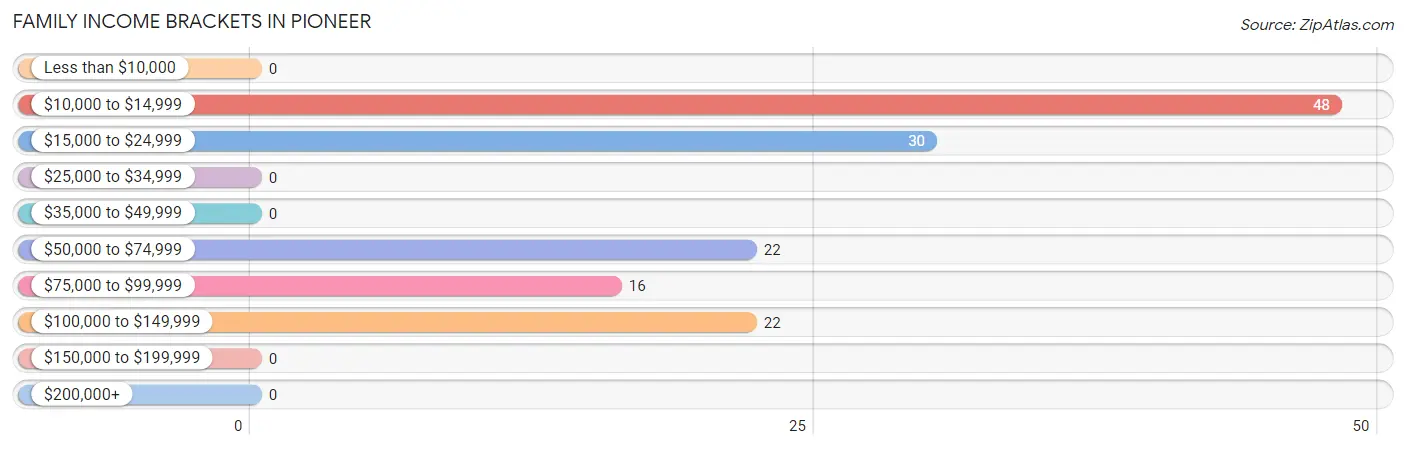
Family Income Brackets in Pioneer
According to the Pioneer family income data, there are 48 families falling into the $10,000 to $14,999 income range, which is the most common income bracket and makes up 34.8% of all families.
| Income Bracket | # Families | % Families |
| Less than $10,000 | 0 | 0.0% |
| $10,000 to $14,999 | 48 | 34.8% |
| $15,000 to $24,999 | 30 | 21.7% |
| $25,000 to $34,999 | 0 | 0.0% |
| $35,000 to $49,999 | 0 | 0.0% |
| $50,000 to $74,999 | 22 | 15.9% |
| $75,000 to $99,999 | 16 | 11.6% |
| $100,000 to $149,999 | 22 | 15.9% |
| $150,000 to $199,999 | 0 | 0.0% |
| $200,000+ | 0 | 0.0% |
Family Income by Famaliy Size in Pioneer
| Income Bracket | # Families | Median Income |
| 2-Person Families | 116 (84.1%) | $0 |
| 3-Person Families | 22 (15.9%) | $0 |
| 4-Person Families | 0 (0.0%) | $0 |
| 5-Person Families | 0 (0.0%) | $0 |
| 6-Person Families | 0 (0.0%) | $0 |
| 7+ Person Families | 0 (0.0%) | $0 |
| Total | 138 (100.0%) | $0 |
Family Income by Number of Earners in Pioneer
| Number of Earners | # Families | Median Income |
| No Earners | 52 (37.7%) | $0 |
| 1 Earner | 64 (46.4%) | $0 |
| 2 Earners | 22 (15.9%) | $0 |
| 3+ Earners | 0 (0.0%) | $0 |
| Total | 138 (100.0%) | $0 |
Household Income in Pioneer
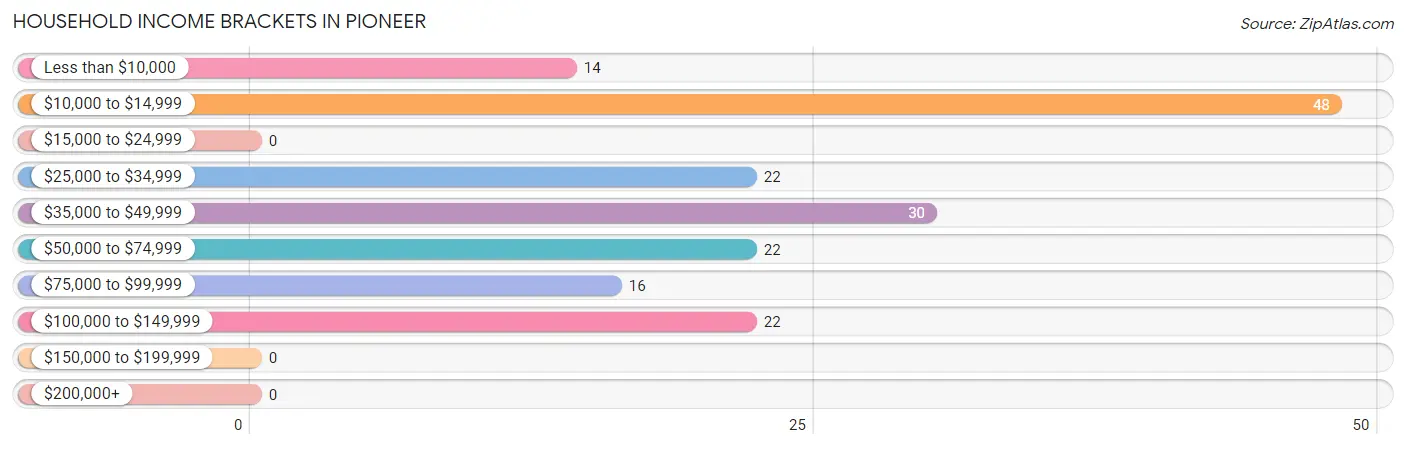
Household Income Brackets in Pioneer
With 48 households falling in the category, the $10,000 to $14,999 income range is the most frequent in Pioneer, accounting for 27.6% of all households.
| Income Bracket | # Households | % Households |
| Less than $10,000 | 14 | 8.0% |
| $10,000 to $14,999 | 48 | 27.6% |
| $15,000 to $24,999 | 0 | 0.0% |
| $25,000 to $34,999 | 22 | 12.6% |
| $35,000 to $49,999 | 30 | 17.2% |
| $50,000 to $74,999 | 22 | 12.6% |
| $75,000 to $99,999 | 16 | 9.2% |
| $100,000 to $149,999 | 22 | 12.6% |
| $150,000 to $199,999 | 0 | 0.0% |
| $200,000+ | 0 | 0.0% |
Household Income by Householder Age in Pioneer
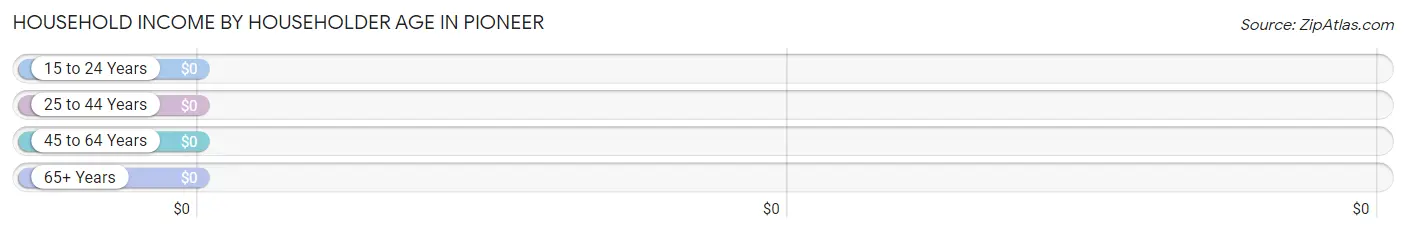
| Income Bracket | # Households | Median Income |
| 15 to 24 Years | 0 (0.0%) | $0 |
| 25 to 44 Years | 44 (25.3%) | $0 |
| 45 to 64 Years | 130 (74.7%) | $0 |
| 65+ Years | 0 (0.0%) | $0 |
| Total | 174 (100.0%) | $42,750 |
Poverty in Pioneer
Income Below Poverty by Sex and Age in Pioneer
With 59.1% poverty level for males and 47.1% for females among the residents of Pioneer, 6 to 11 year old males and 35 to 44 year old females are the most vulnerable to poverty, with 75 males (100.0%) and 30 females (100.0%) in their respective age groups living below the poverty level.
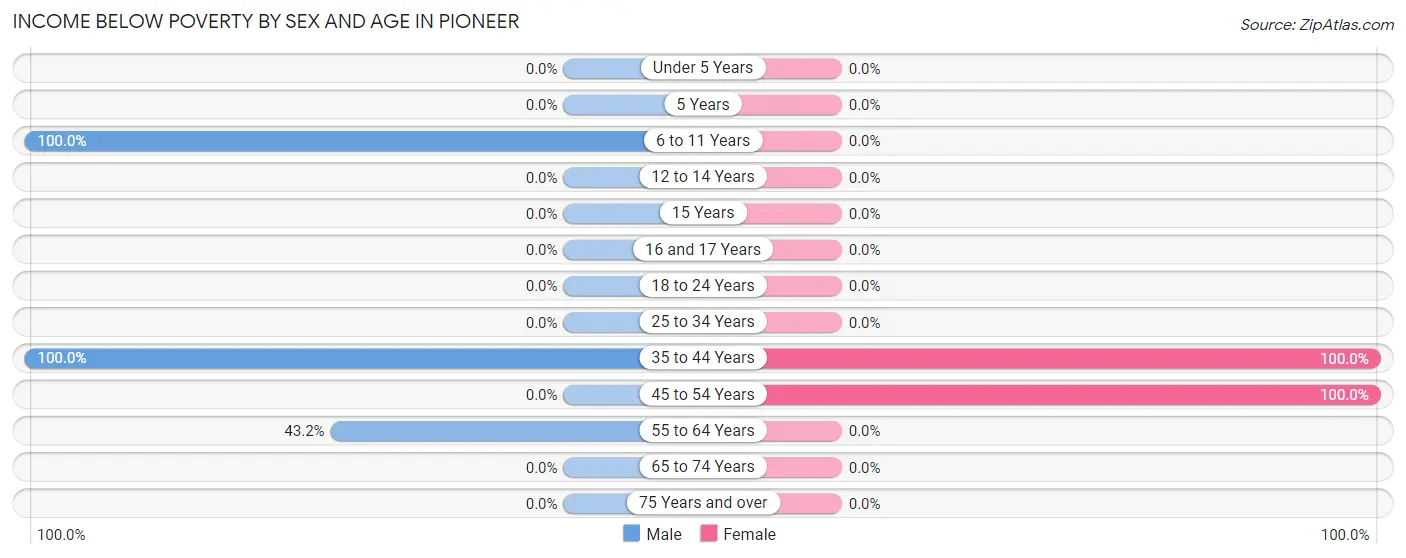
| Age Bracket | Male | Female |
| Under 5 Years | 0 (0.0%) | 0 (0.0%) |
| 5 Years | 0 (0.0%) | 0 (0.0%) |
| 6 to 11 Years | 75 (100.0%) | 0 (0.0%) |
| 12 to 14 Years | 0 (0.0%) | 0 (0.0%) |
| 15 Years | 0 (0.0%) | 0 (0.0%) |
| 16 and 17 Years | 0 (0.0%) | 0 (0.0%) |
| 18 to 24 Years | 0 (0.0%) | 0 (0.0%) |
| 25 to 34 Years | 0 (0.0%) | 0 (0.0%) |
| 35 to 44 Years | 14 (100.0%) | 30 (100.0%) |
| 45 to 54 Years | 0 (0.0%) | 58 (100.0%) |
| 55 to 64 Years | 48 (43.2%) | 0 (0.0%) |
| 65 to 74 Years | 0 (0.0%) | 0 (0.0%) |
| 75 Years and over | 0 (0.0%) | 0 (0.0%) |
| Total | 137 (59.1%) | 88 (47.1%) |
Income Above Poverty by Sex and Age in Pioneer
According to the poverty statistics in Pioneer, males aged 45 to 54 years and females aged 55 to 64 years are the age groups that are most secure financially, with 100.0% of males and 100.0% of females in these age groups living above the poverty line.
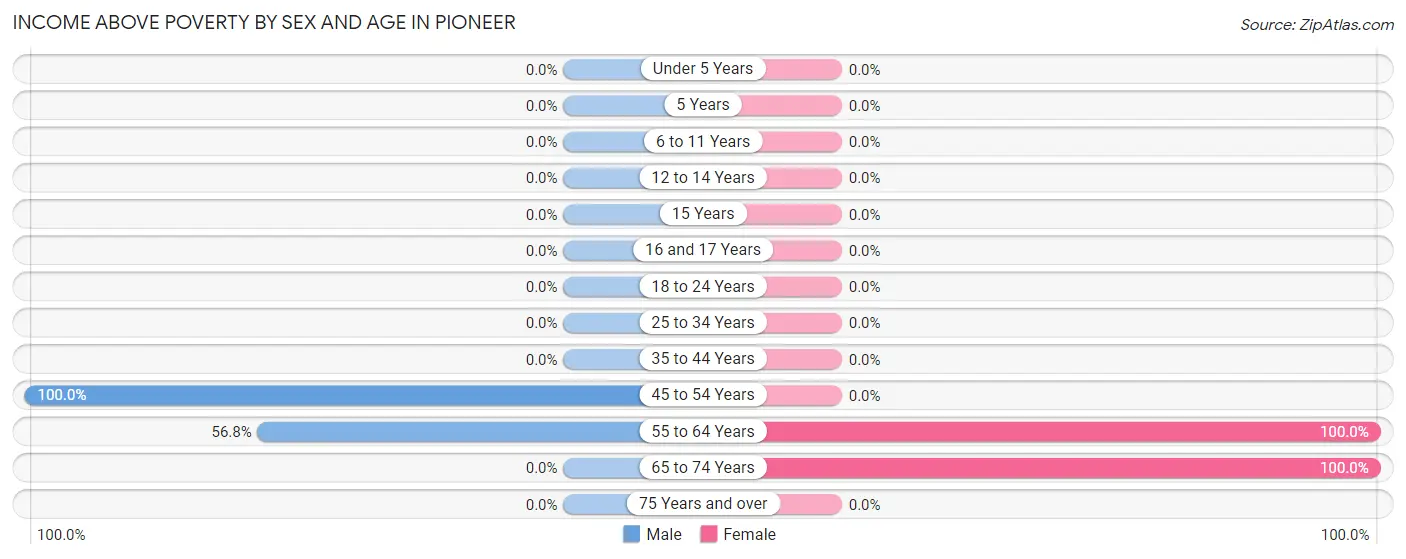
| Age Bracket | Male | Female |
| Under 5 Years | 0 (0.0%) | 0 (0.0%) |
| 5 Years | 0 (0.0%) | 0 (0.0%) |
| 6 to 11 Years | 0 (0.0%) | 0 (0.0%) |
| 12 to 14 Years | 0 (0.0%) | 0 (0.0%) |
| 15 Years | 0 (0.0%) | 0 (0.0%) |
| 16 and 17 Years | 0 (0.0%) | 0 (0.0%) |
| 18 to 24 Years | 0 (0.0%) | 0 (0.0%) |
| 25 to 34 Years | 0 (0.0%) | 0 (0.0%) |
| 35 to 44 Years | 0 (0.0%) | 0 (0.0%) |
| 45 to 54 Years | 32 (100.0%) | 0 (0.0%) |
| 55 to 64 Years | 63 (56.8%) | 83 (100.0%) |
| 65 to 74 Years | 0 (0.0%) | 16 (100.0%) |
| 75 Years and over | 0 (0.0%) | 0 (0.0%) |
| Total | 95 (40.9%) | 99 (52.9%) |
Income Below Poverty Among Married-Couple Families in Pioneer
The poverty statistics for married-couple families in Pioneer show that 44.4% or 48 of the total 108 families live below the poverty line. Families with no children have the highest poverty rate of 44.4%, comprising of 48 families. On the other hand, families with no children have the lowest poverty rate of 44.4%, which includes 48 families.
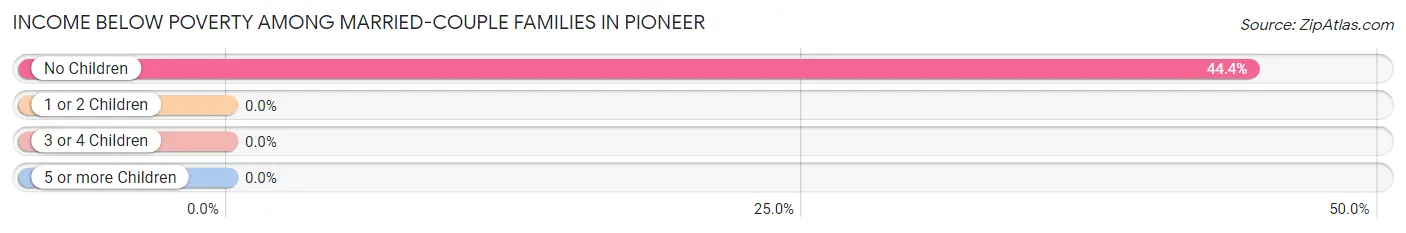
| Children | Above Poverty | Below Poverty |
| No Children | 60 (55.6%) | 48 (44.4%) |
| 1 or 2 Children | 0 (0.0%) | 0 (0.0%) |
| 3 or 4 Children | 0 (0.0%) | 0 (0.0%) |
| 5 or more Children | 0 (0.0%) | 0 (0.0%) |
| Total | 60 (55.6%) | 48 (44.4%) |
Income Below Poverty Among Single-Parent Households in Pioneer
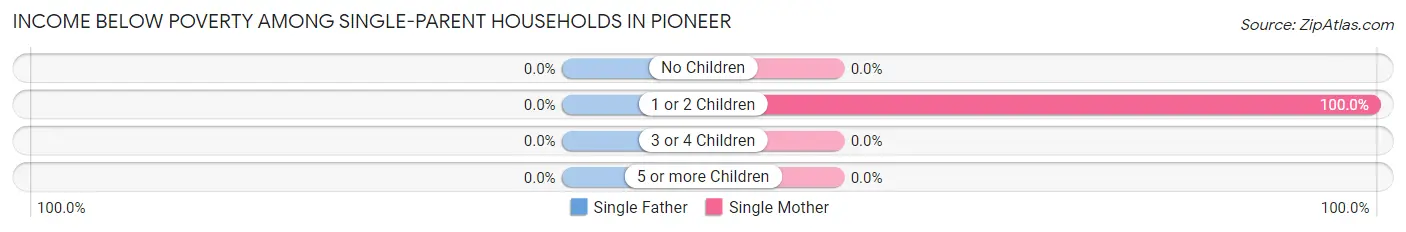
| Children | Single Father | Single Mother |
| No Children | 0 (0.0%) | 0 (0.0%) |
| 1 or 2 Children | 0 (0.0%) | 30 (100.0%) |
| 3 or 4 Children | 0 (0.0%) | 0 (0.0%) |
| 5 or more Children | 0 (0.0%) | 0 (0.0%) |
| Total | 0 (0.0%) | 30 (100.0%) |
Income Below Poverty Among Married-Couple vs Single-Parent Households in Pioneer
The poverty data for Pioneer shows that 48 of the married-couple family households (44.4%) and 30 of the single-parent households (100.0%) are living below the poverty level. Within the married-couple family households, those with no children have the highest poverty rate, with 48 households (44.4%) falling below the poverty line. Among the single-parent households, those with 1 or 2 children have the highest poverty rate, with 30 household (100.0%) living below poverty.
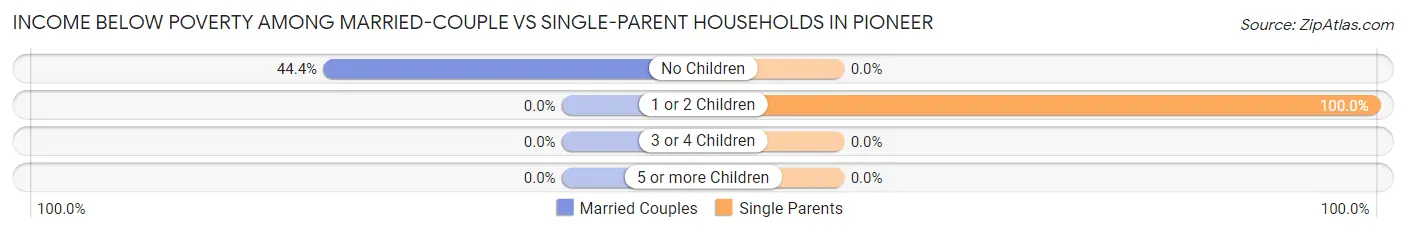
| Children | Married-Couple Families | Single-Parent Households |
| No Children | 48 (44.4%) | 0 (0.0%) |
| 1 or 2 Children | 0 (0.0%) | 30 (100.0%) |
| 3 or 4 Children | 0 (0.0%) | 0 (0.0%) |
| 5 or more Children | 0 (0.0%) | 0 (0.0%) |
| Total | 48 (44.4%) | 30 (100.0%) |
Race in Pioneer
The most populous races in Pioneer are White / Caucasian (390 | 93.1%), Hispanic or Latino (227 | 54.2%), and Two or more Races (29 | 6.9%).
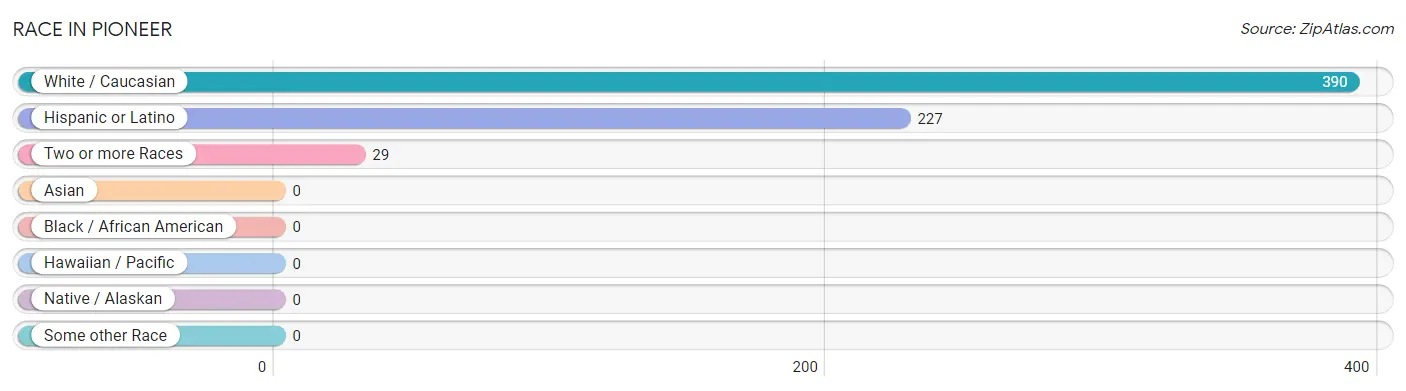
| Race | # Population | % Population |
| Asian | 0 | 0.0% |
| Black / African American | 0 | 0.0% |
| Hawaiian / Pacific | 0 | 0.0% |
| Hispanic or Latino | 227 | 54.2% |
| Native / Alaskan | 0 | 0.0% |
| White / Caucasian | 390 | 93.1% |
| Two or more Races | 29 | 6.9% |
| Some other Race | 0 | 0.0% |
| Total | 419 | 100.0% |
Ancestry in Pioneer
The most populous ancestries reported in Pioneer are American (106 | 25.3%), Cuban (84 | 20.1%), Mexican (29 | 6.9%), and Scotch-Irish (22 | 5.2%), together accounting for 57.5% of all Pioneer residents.
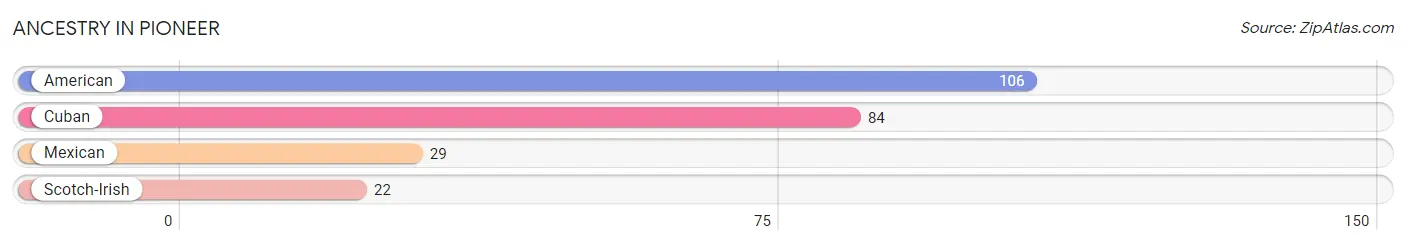
| Ancestry | # Population | % Population |
| American | 106 | 25.3% |
| Cuban | 84 | 20.1% |
| Mexican | 29 | 6.9% |
| Scotch-Irish | 22 | 5.2% | View All 4 Rows |
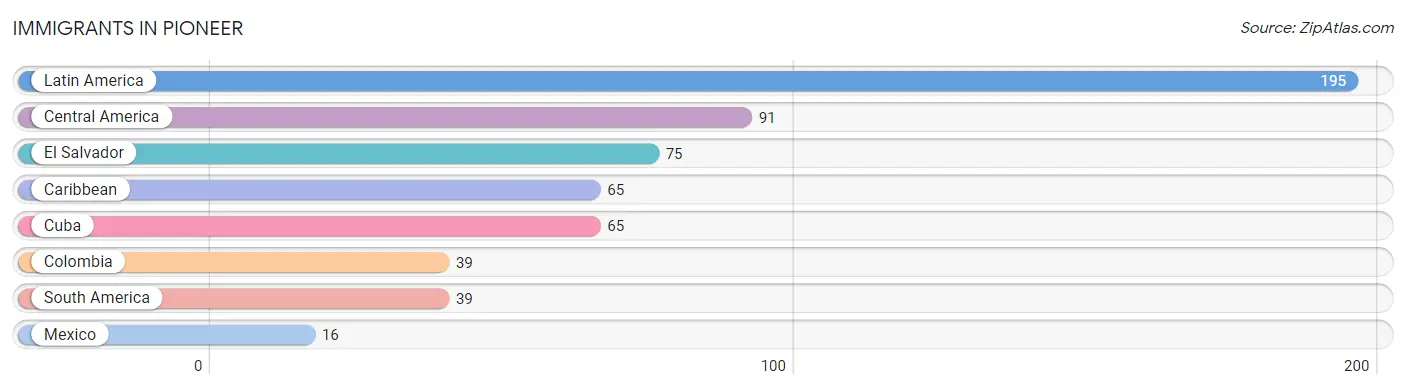
Immigrants in Pioneer
The most numerous immigrant groups reported in Pioneer came from Latin America (195 | 46.5%), Central America (91 | 21.7%), El Salvador (75 | 17.9%), Caribbean (65 | 15.5%), and Cuba (65 | 15.5%), together accounting for 117.2% of all Pioneer residents.
| Immigration Origin | # Population | % Population |
| Caribbean | 65 | 15.5% |
| Central America | 91 | 21.7% |
| Colombia | 39 | 9.3% |
| Cuba | 65 | 15.5% |
| El Salvador | 75 | 17.9% |
| Latin America | 195 | 46.5% |
| Mexico | 16 | 3.8% |
| South America | 39 | 9.3% | View All 8 Rows |
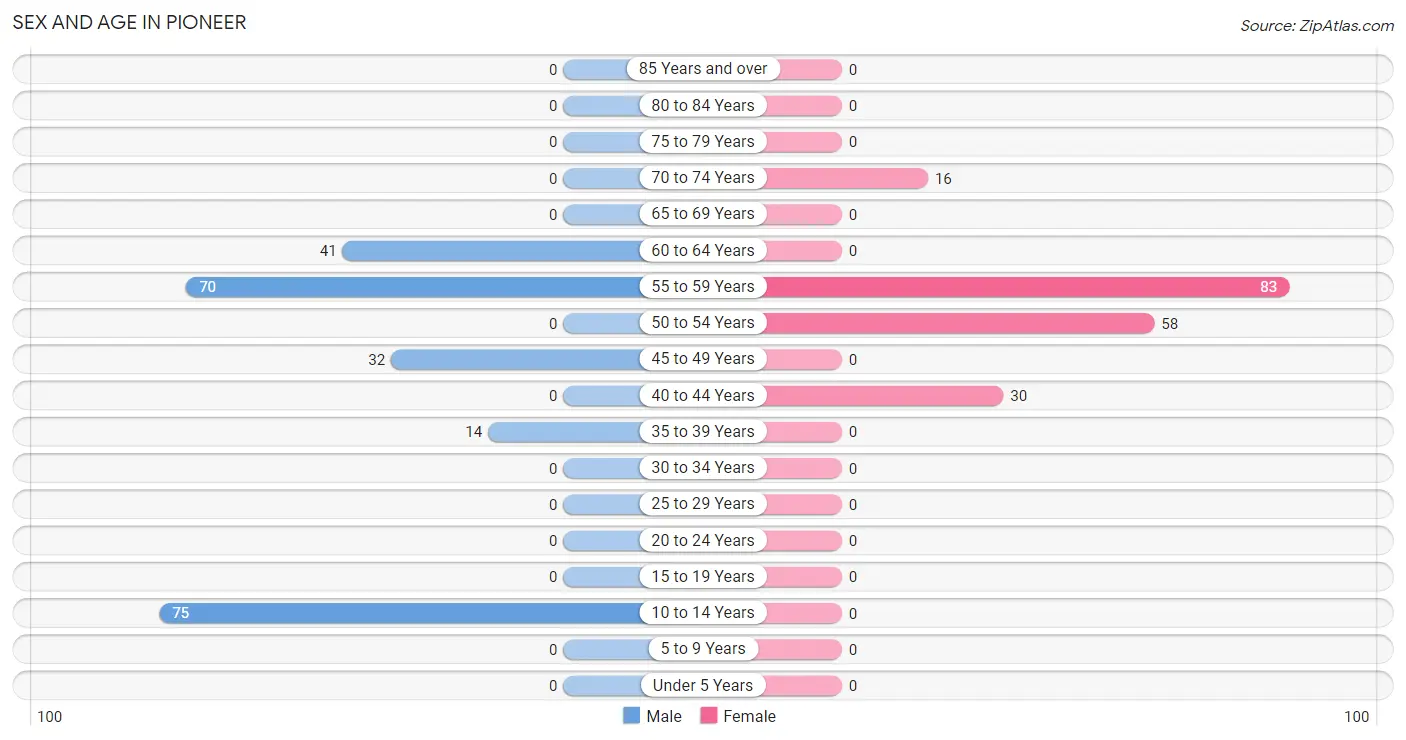
Sex and Age in Pioneer
Sex and Age in Pioneer
The most populous age groups in Pioneer are 10 to 14 Years (75 | 32.3%) for men and 55 to 59 Years (83 | 44.4%) for women.
| Age Bracket | Male | Female |
| Under 5 Years | 0 (0.0%) | 0 (0.0%) |
| 5 to 9 Years | 0 (0.0%) | 0 (0.0%) |
| 10 to 14 Years | 75 (32.3%) | 0 (0.0%) |
| 15 to 19 Years | 0 (0.0%) | 0 (0.0%) |
| 20 to 24 Years | 0 (0.0%) | 0 (0.0%) |
| 25 to 29 Years | 0 (0.0%) | 0 (0.0%) |
| 30 to 34 Years | 0 (0.0%) | 0 (0.0%) |
| 35 to 39 Years | 14 (6.0%) | 0 (0.0%) |
| 40 to 44 Years | 0 (0.0%) | 30 (16.0%) |
| 45 to 49 Years | 32 (13.8%) | 0 (0.0%) |
| 50 to 54 Years | 0 (0.0%) | 58 (31.0%) |
| 55 to 59 Years | 70 (30.2%) | 83 (44.4%) |
| 60 to 64 Years | 41 (17.7%) | 0 (0.0%) |
| 65 to 69 Years | 0 (0.0%) | 0 (0.0%) |
| 70 to 74 Years | 0 (0.0%) | 16 (8.6%) |
| 75 to 79 Years | 0 (0.0%) | 0 (0.0%) |
| 80 to 84 Years | 0 (0.0%) | 0 (0.0%) |
| 85 Years and over | 0 (0.0%) | 0 (0.0%) |
| Total | 232 (100.0%) | 187 (100.0%) |
Families and Households in Pioneer
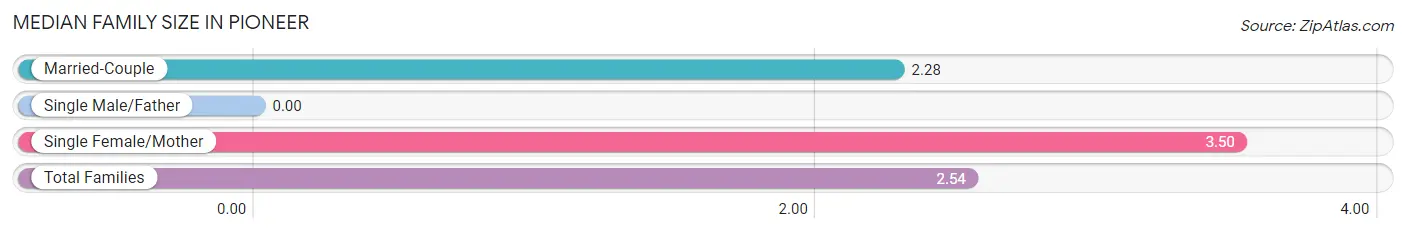
Median Family Size in Pioneer
| Family Type | # Families | Family Size |
| Married-Couple | 108 (78.3%) | 2.28 |
| Single Male/Father | 0 (0.0%) | - |
| Single Female/Mother | 30 (21.7%) | 3.50 |
| Total Families | 138 (100.0%) | 2.54 |
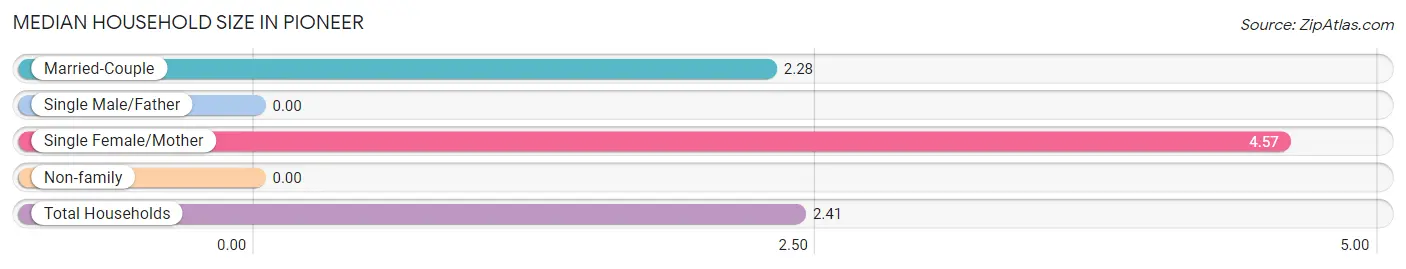
Median Household Size in Pioneer
| Household Type | # Households | Household Size |
| Married-Couple | 108 (62.1%) | 2.28 |
| Single Male/Father | 0 (0.0%) | - |
| Single Female/Mother | 30 (17.2%) | 4.57 |
| Non-family | 36 (20.7%) | - |
| Total Households | 174 (100.0%) | 2.41 |
Household Size by Marriage Status in Pioneer
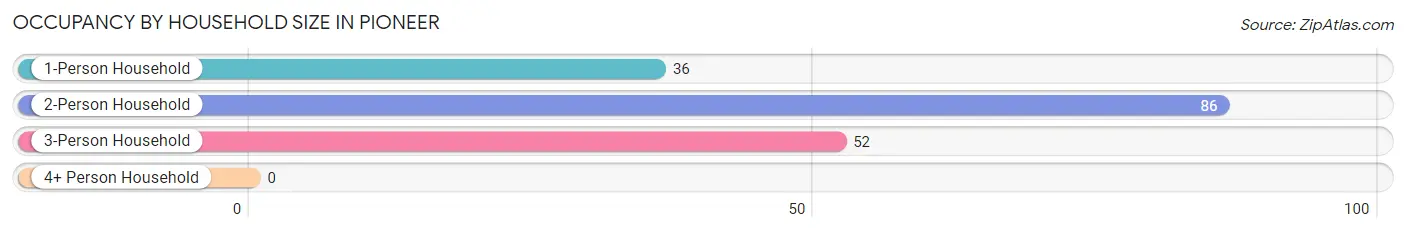
Out of a total of 174 households in Pioneer, 138 (79.3%) are family households, while 36 (20.7%) are nonfamily households. The most numerous type of family households are 2-person households, comprising 86, and the most common type of nonfamily households are 1-person households, comprising 36.
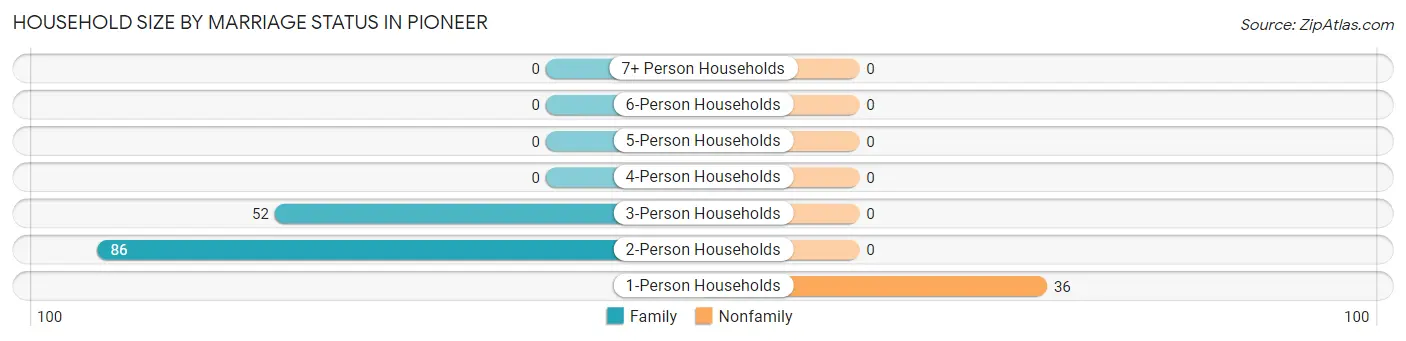
| Household Size | Family Households | Nonfamily Households |
| 1-Person Households | - | 36 (20.7%) |
| 2-Person Households | 86 (49.4%) | 0 (0.0%) |
| 3-Person Households | 52 (29.9%) | 0 (0.0%) |
| 4-Person Households | 0 (0.0%) | 0 (0.0%) |
| 5-Person Households | 0 (0.0%) | 0 (0.0%) |
| 6-Person Households | 0 (0.0%) | 0 (0.0%) |
| 7+ Person Households | 0 (0.0%) | 0 (0.0%) |
| Total | 138 (79.3%) | 36 (20.7%) |
Female Fertility in Pioneer
Fertility by Age in Pioneer
| Age Bracket | Women with Births | Births / 1,000 Women |
| 15 to 19 years | 0 (0.0%) | 0.0 |
| 20 to 34 years | 0 (0.0%) | 0.0 |
| 35 to 50 years | 0 (0.0%) | 0.0 |
| Total | 0 (0.0%) | 0.0 |
Fertility by Age by Marriage Status in Pioneer
| Age Bracket | Married | Unmarried |
| 15 to 19 years | 0 (0.0%) | 0 (0.0%) |
| 20 to 34 years | 0 (0.0%) | 0 (0.0%) |
| 35 to 50 years | 0 (0.0%) | 0 (0.0%) |
| Total | 0 (0.0%) | 0 (0.0%) |
Fertility by Education in Pioneer
| Educational Attainment | Women with Births | Births / 1,000 Women |
| Less than High School | 0 (0.0%) | 0.0 |
| High School Diploma | 0 (0.0%) | 0.0 |
| College or Associate's Degree | 0 (0.0%) | 0.0 |
| Bachelor's Degree | 0 (0.0%) | 0.0 |
| Graduate Degree | 0 (0.0%) | 0.0 |
| Total | 0 (0.0%) | 0.0 |
Fertility by Education by Marriage Status in Pioneer
| Educational Attainment | Married | Unmarried |
| Less than High School | 0 (0.0%) | 0 (0.0%) |
| High School Diploma | 0 (0.0%) | 0 (0.0%) |
| College or Associate's Degree | 0 (0.0%) | 0 (0.0%) |
| Bachelor's Degree | 0 (0.0%) | 0 (0.0%) |
| Graduate Degree | 0 (0.0%) | 0 (0.0%) |
| Total | 0 (0.0%) | 0 (0.0%) |
Employment Characteristics in Pioneer
Employment by Class of Employer in Pioneer
Among the 107 employed individuals in Pioneer, private company employees (75 | 70.1%), and federal government employees (32 | 29.9%) make up the most common classes of employment.
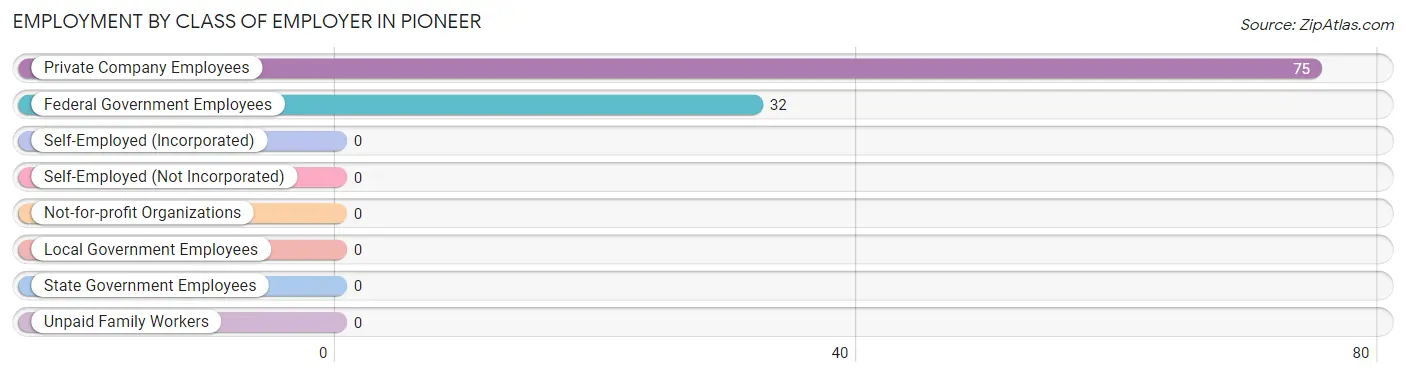
| Employer Class | # Employees | % Employees |
| Private Company Employees | 75 | 70.1% |
| Self-Employed (Incorporated) | 0 | 0.0% |
| Self-Employed (Not Incorporated) | 0 | 0.0% |
| Not-for-profit Organizations | 0 | 0.0% |
| Local Government Employees | 0 | 0.0% |
| State Government Employees | 0 | 0.0% |
| Federal Government Employees | 32 | 29.9% |
| Unpaid Family Workers | 0 | 0.0% |
| Total | 107 | 100.0% |
Employment Status by Age in Pioneer
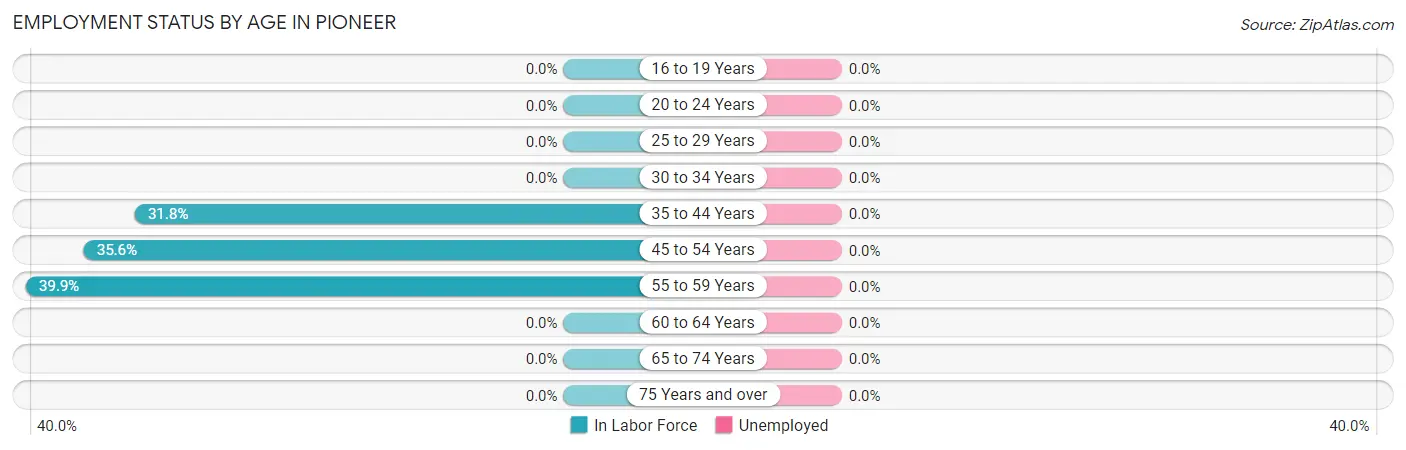
| Age Bracket | In Labor Force | Unemployed |
| 16 to 19 Years | 0 (0.0%) | 0 (0.0%) |
| 20 to 24 Years | 0 (0.0%) | 0 (0.0%) |
| 25 to 29 Years | 0 (0.0%) | 0 (0.0%) |
| 30 to 34 Years | 0 (0.0%) | 0 (0.0%) |
| 35 to 44 Years | 14 (31.8%) | 0 (0.0%) |
| 45 to 54 Years | 32 (35.6%) | 0 (0.0%) |
| 55 to 59 Years | 61 (39.9%) | 0 (0.0%) |
| 60 to 64 Years | 0 (0.0%) | 0 (0.0%) |
| 65 to 74 Years | 0 (0.0%) | 0 (0.0%) |
| 75 Years and over | 0 (0.0%) | 0 (0.0%) |
| Total | 107 (31.1%) | 0 (0.0%) |
Employment Status by Educational Attainment in Pioneer
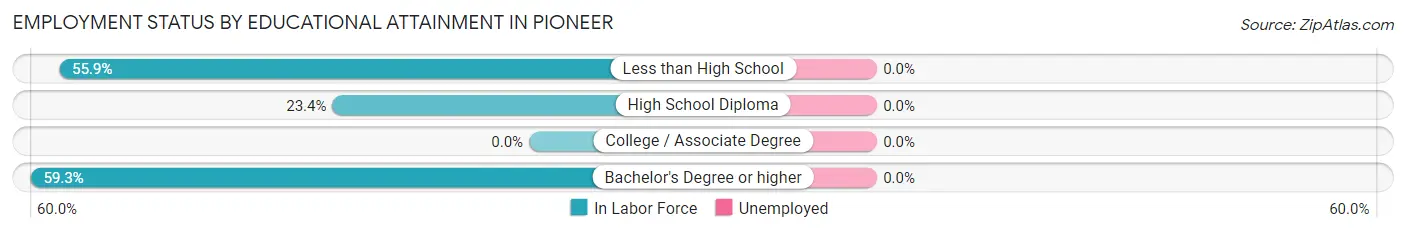
| Educational Attainment | In Labor Force | Unemployed |
| Less than High School | 38 (55.9%) | 0 (0.0%) |
| High School Diploma | 37 (23.4%) | 0 (0.0%) |
| College / Associate Degree | 0 (0.0%) | 0 (0.0%) |
| Bachelor's Degree or higher | 32 (59.3%) | 0 (0.0%) |
| Total | 107 (32.6%) | 0 (0.0%) |
Employment Occupations by Sex in Pioneer
Management, Business, Science and Arts Occupations
Management, Business, Science and Arts Occupations by Sex
| Occupation | Male | Female |
| Management | 0 (0.0%) | 0 (0.0%) |
| Business & Financial | 0 (0.0%) | 0 (0.0%) |
| Computers, Engineering & Science | 0 (0.0%) | 0 (0.0%) |
| Computers & Mathematics | 0 (0.0%) | 0 (0.0%) |
| Architecture & Engineering | 0 (0.0%) | 0 (0.0%) |
| Life, Physical & Social Science | 0 (0.0%) | 0 (0.0%) |
| Community & Social Service | 0 (0.0%) | 0 (0.0%) |
| Education, Arts & Media | 0 (0.0%) | 0 (0.0%) |
| Legal Services & Support | 0 (0.0%) | 0 (0.0%) |
| Education Instruction & Library | 0 (0.0%) | 0 (0.0%) |
| Arts, Media & Entertainment | 0 (0.0%) | 0 (0.0%) |
| Health Diagnosing & Treating | 0 (0.0%) | 0 (0.0%) |
| Health Technologists | 0 (0.0%) | 0 (0.0%) |
| Total (Category) | 0 (0.0%) | 0 (0.0%) |
| Total (Overall) | 68 (63.5%) | 39 (36.4%) |
Services Occupations
Services Occupations by Sex
| Occupation | Male | Female |
| Healthcare Support | 0 (0.0%) | 0 (0.0%) |
| Security & Protection | 0 (0.0%) | 0 (0.0%) |
| Firefighting & Prevention | 0 (0.0%) | 0 (0.0%) |
| Law Enforcement | 0 (0.0%) | 0 (0.0%) |
| Food Preparation & Serving | 0 (0.0%) | 0 (0.0%) |
| Cleaning & Maintenance | 0 (0.0%) | 0 (0.0%) |
| Personal Care & Service | 0 (0.0%) | 0 (0.0%) |
| Total (Category) | 0 (0.0%) | 0 (0.0%) |
| Total (Overall) | 68 (63.5%) | 39 (36.4%) |
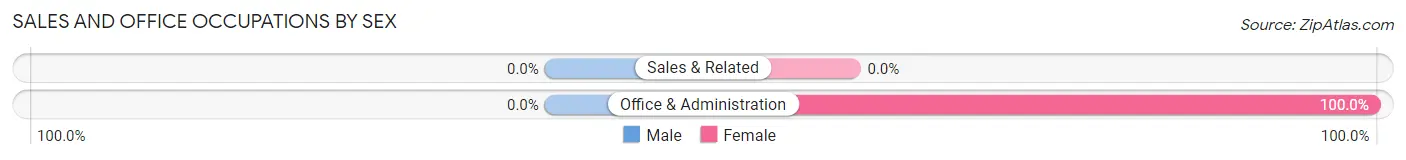
Sales and Office Occupations
The most common Sales and Office occupations in Pioneer are , and Office & Administration (16 | 14.9%).
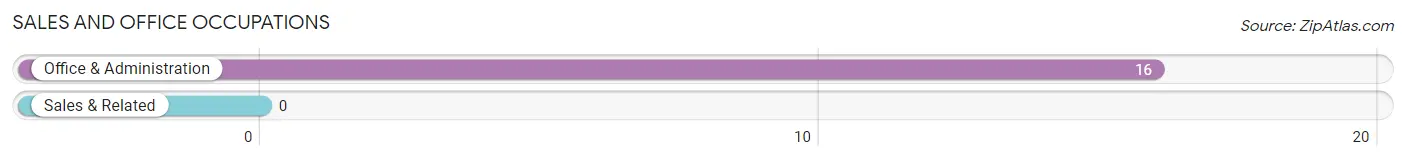
Sales and Office Occupations by Sex
| Occupation | Male | Female |
| Sales & Related | 0 (0.0%) | 0 (0.0%) |
| Office & Administration | 0 (0.0%) | 16 (100.0%) |
| Total (Category) | 0 (0.0%) | 16 (100.0%) |
| Total (Overall) | 68 (63.5%) | 39 (36.4%) |
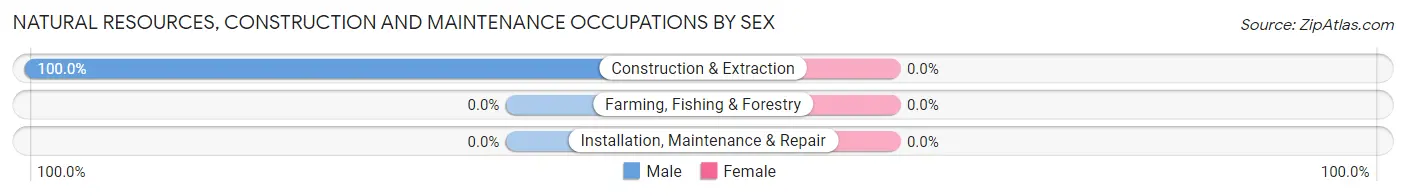
Natural Resources, Construction and Maintenance Occupations
The most common Natural Resources, Construction and Maintenance occupations in Pioneer are , and Construction & Extraction (22 | 20.6%).
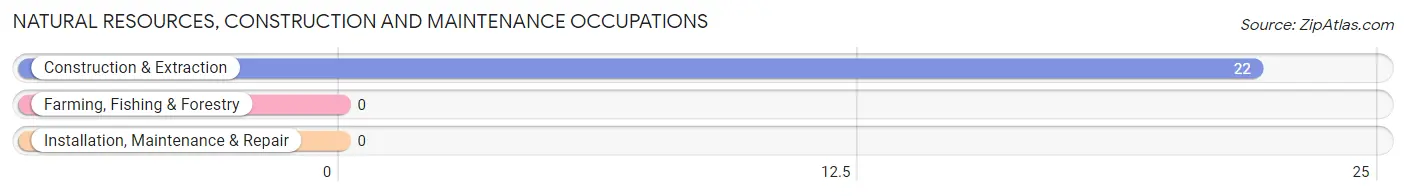
Natural Resources, Construction and Maintenance Occupations by Sex
| Occupation | Male | Female |
| Farming, Fishing & Forestry | 0 (0.0%) | 0 (0.0%) |
| Construction & Extraction | 22 (100.0%) | 0 (0.0%) |
| Installation, Maintenance & Repair | 0 (0.0%) | 0 (0.0%) |
| Total (Category) | 22 (100.0%) | 0 (0.0%) |
| Total (Overall) | 68 (63.5%) | 39 (36.4%) |
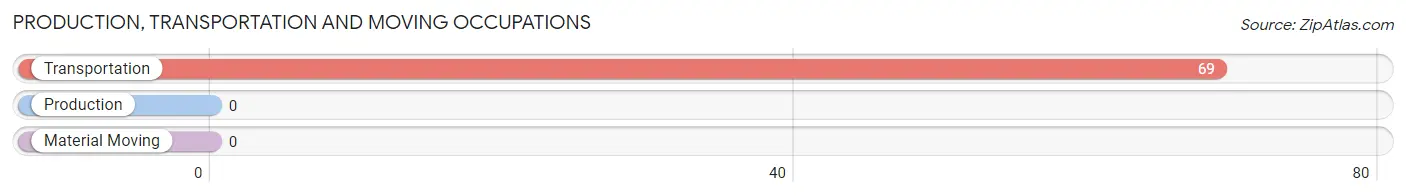
Production, Transportation and Moving Occupations
The most common Production, Transportation and Moving occupations in Pioneer are , and Transportation (69 | 64.5%).
Production, Transportation and Moving Occupations by Sex
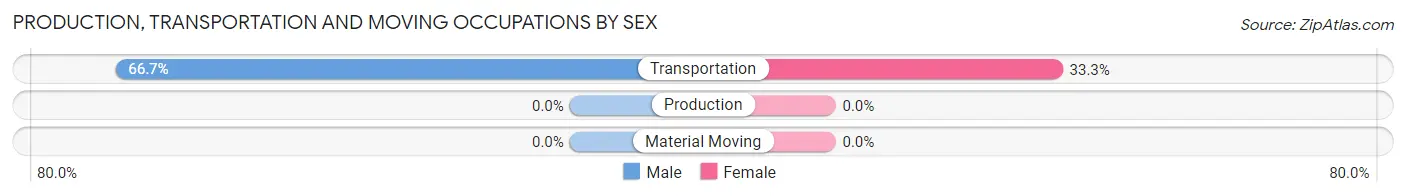
| Occupation | Male | Female |
| Production | 0 (0.0%) | 0 (0.0%) |
| Transportation | 46 (66.7%) | 23 (33.3%) |
| Material Moving | 0 (0.0%) | 0 (0.0%) |
| Total (Category) | 46 (66.7%) | 23 (33.3%) |
| Total (Overall) | 68 (63.5%) | 39 (36.4%) |
Employment Industries by Sex in Pioneer
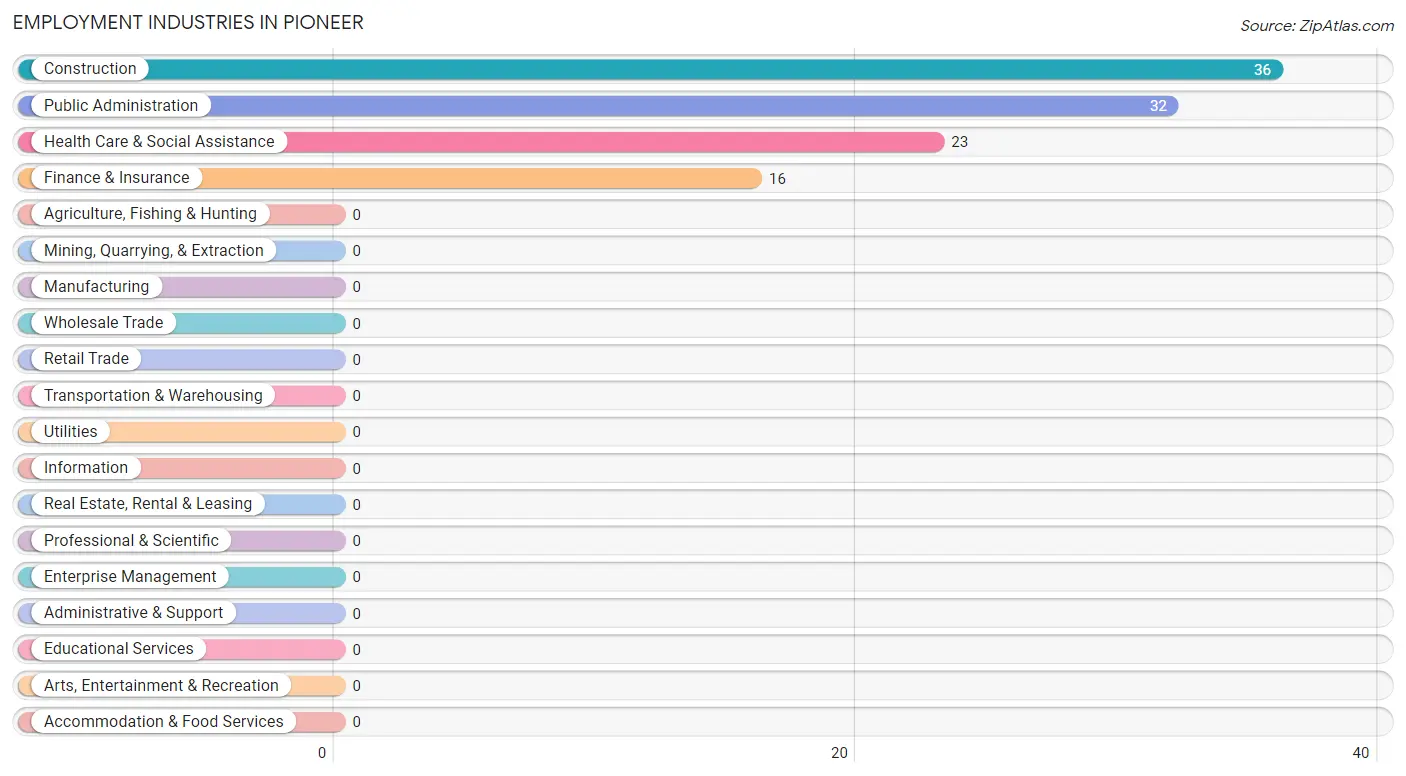
Employment Industries in Pioneer
The major employment industries in Pioneer include Construction (36 | 33.6%), Public Administration (32 | 29.9%), Health Care & Social Assistance (23 | 21.5%), and Finance & Insurance (16 | 14.9%).
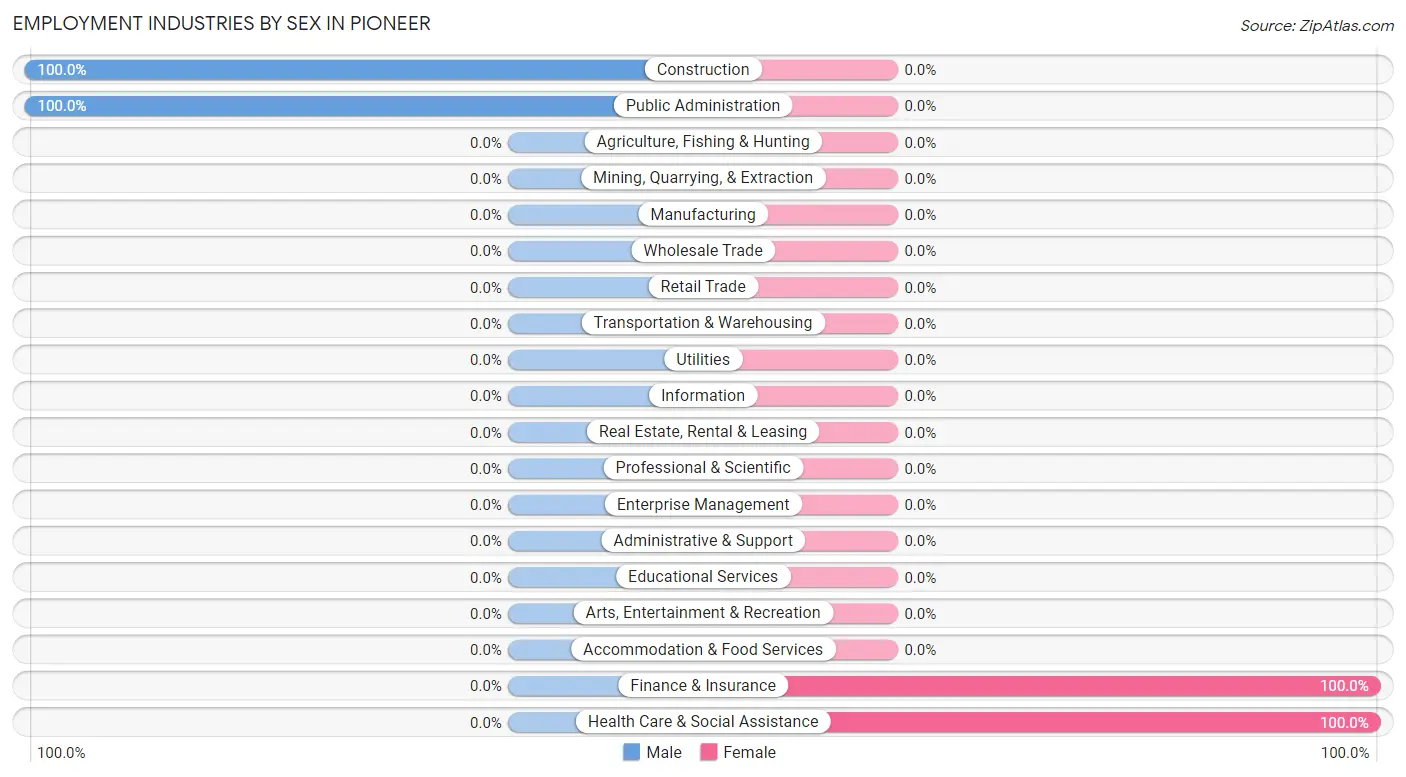
Employment Industries by Sex in Pioneer
The Pioneer industries that see more men than women are Construction (100.0%), and Public Administration (100.0%), whereas the industries that tend to have a higher number of women are Finance & Insurance (100.0%), and Health Care & Social Assistance (100.0%).
| Industry | Male | Female |
| Agriculture, Fishing & Hunting | 0 (0.0%) | 0 (0.0%) |
| Mining, Quarrying, & Extraction | 0 (0.0%) | 0 (0.0%) |
| Construction | 36 (100.0%) | 0 (0.0%) |
| Manufacturing | 0 (0.0%) | 0 (0.0%) |
| Wholesale Trade | 0 (0.0%) | 0 (0.0%) |
| Retail Trade | 0 (0.0%) | 0 (0.0%) |
| Transportation & Warehousing | 0 (0.0%) | 0 (0.0%) |
| Utilities | 0 (0.0%) | 0 (0.0%) |
| Information | 0 (0.0%) | 0 (0.0%) |
| Finance & Insurance | 0 (0.0%) | 16 (100.0%) |
| Real Estate, Rental & Leasing | 0 (0.0%) | 0 (0.0%) |
| Professional & Scientific | 0 (0.0%) | 0 (0.0%) |
| Enterprise Management | 0 (0.0%) | 0 (0.0%) |
| Administrative & Support | 0 (0.0%) | 0 (0.0%) |
| Educational Services | 0 (0.0%) | 0 (0.0%) |
| Health Care & Social Assistance | 0 (0.0%) | 23 (100.0%) |
| Arts, Entertainment & Recreation | 0 (0.0%) | 0 (0.0%) |
| Accommodation & Food Services | 0 (0.0%) | 0 (0.0%) |
| Public Administration | 32 (100.0%) | 0 (0.0%) |
| Total | 68 (63.5%) | 39 (36.4%) |
Education in Pioneer
School Enrollment in Pioneer
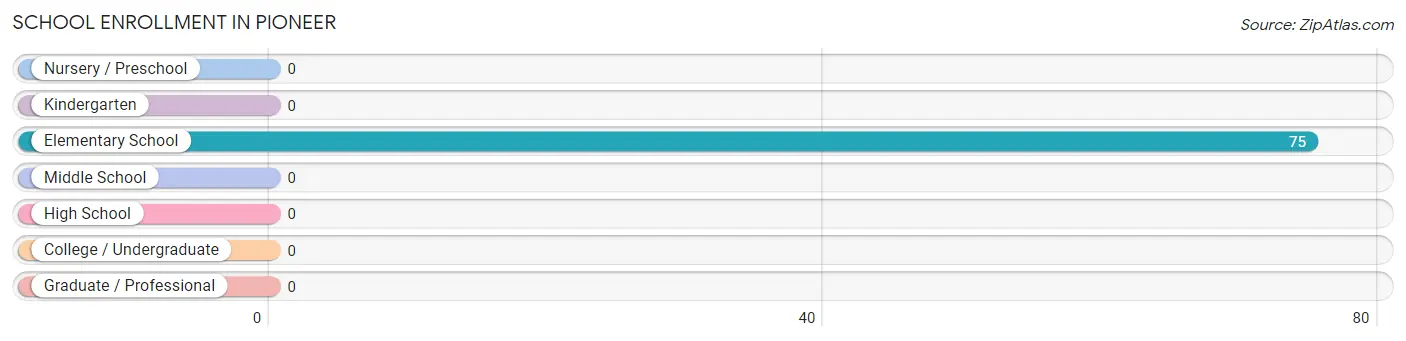
| School Level | # Students | % Students |
| Nursery / Preschool | 0 | 0.0% |
| Kindergarten | 0 | 0.0% |
| Elementary School | 75 | 100.0% |
| Middle School | 0 | 0.0% |
| High School | 0 | 0.0% |
| College / Undergraduate | 0 | 0.0% |
| Graduate / Professional | 0 | 0.0% |
| Total | 75 | 100.0% |
School Enrollment by Age by Funding Source in Pioneer
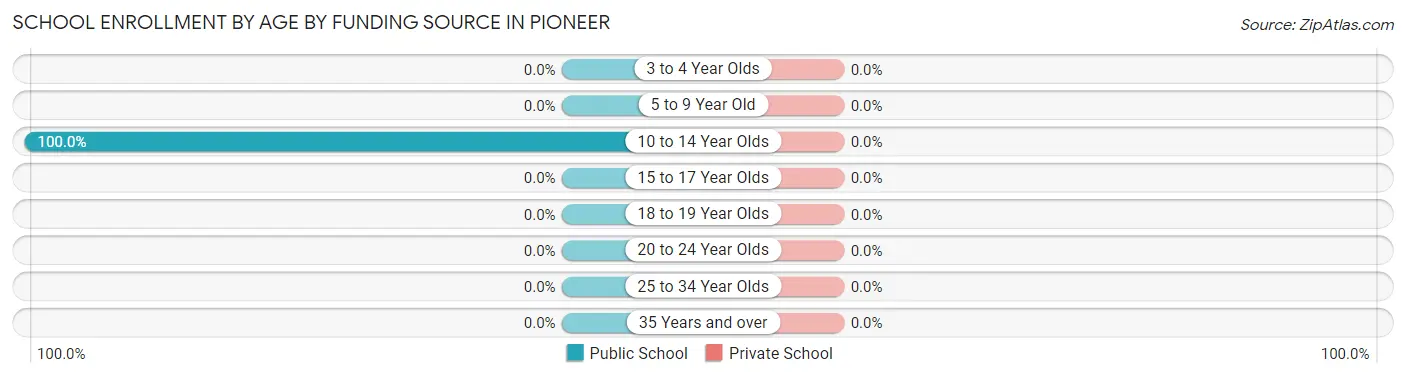
| Age Bracket | Public School | Private School |
| 3 to 4 Year Olds | 0 (0.0%) | 0 (0.0%) |
| 5 to 9 Year Old | 0 (0.0%) | 0 (0.0%) |
| 10 to 14 Year Olds | 75 (100.0%) | 0 (0.0%) |
| 15 to 17 Year Olds | 0 (0.0%) | 0 (0.0%) |
| 18 to 19 Year Olds | 0 (0.0%) | 0 (0.0%) |
| 20 to 24 Year Olds | 0 (0.0%) | 0 (0.0%) |
| 25 to 34 Year Olds | 0 (0.0%) | 0 (0.0%) |
| 35 Years and over | 0 (0.0%) | 0 (0.0%) |
| Total | 75 (100.0%) | 0 (0.0%) |
Educational Attainment by Field of Study in Pioneer
Bio, nature & agricultural (32 | 59.3%), and arts & humanities (22 | 40.7%) are the most common fields of study among 54 individuals in Pioneer who have obtained a bachelor's degree or higher.
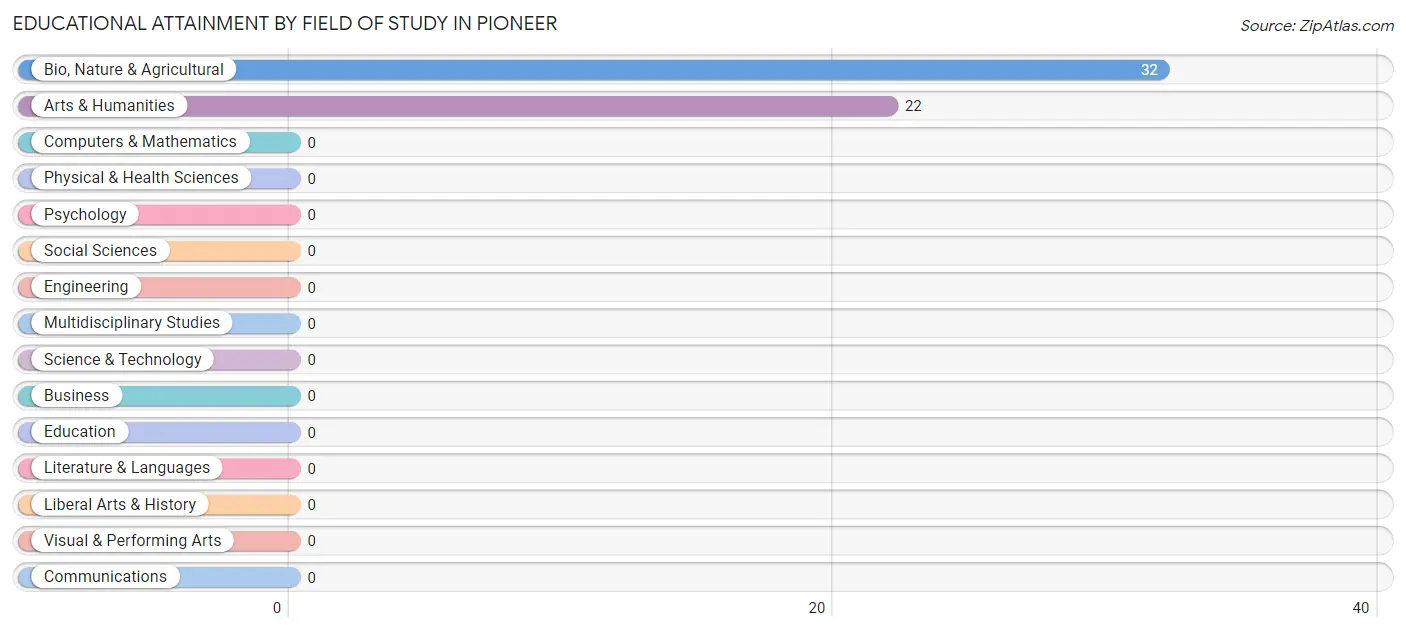
| Field of Study | # Graduates | % Graduates |
| Computers & Mathematics | 0 | 0.0% |
| Bio, Nature & Agricultural | 32 | 59.3% |
| Physical & Health Sciences | 0 | 0.0% |
| Psychology | 0 | 0.0% |
| Social Sciences | 0 | 0.0% |
| Engineering | 0 | 0.0% |
| Multidisciplinary Studies | 0 | 0.0% |
| Science & Technology | 0 | 0.0% |
| Business | 0 | 0.0% |
| Education | 0 | 0.0% |
| Literature & Languages | 0 | 0.0% |
| Liberal Arts & History | 0 | 0.0% |
| Visual & Performing Arts | 0 | 0.0% |
| Communications | 0 | 0.0% |
| Arts & Humanities | 22 | 40.7% |
| Total | 54 | 100.0% |
Transportation & Commute in Pioneer
Vehicle Availability by Sex in Pioneer
The most prevalent vehicle ownership categories in Pioneer are males with 2 vehicles (54, accounting for 79.4%) and females with 2 vehicles (23, making up 138.5%).
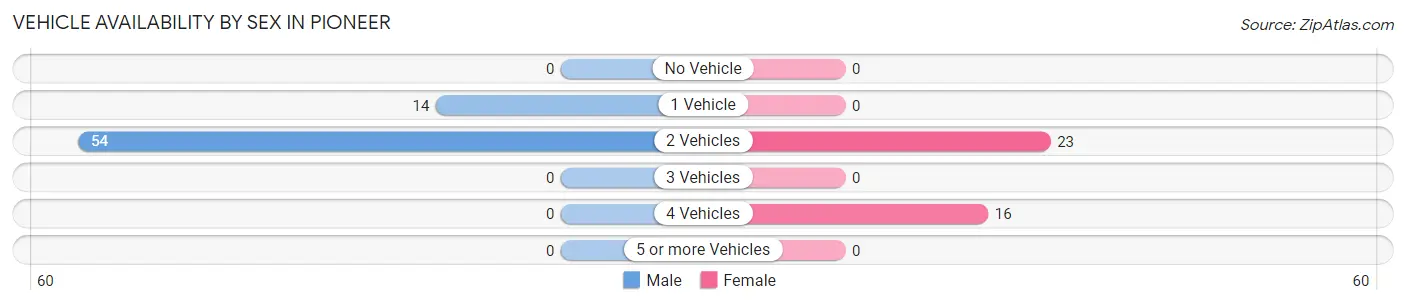
| Vehicles Available | Male | Female |
| No Vehicle | 0 (0.0%) | 0 (0.0%) |
| 1 Vehicle | 14 (20.6%) | 0 (0.0%) |
| 2 Vehicles | 54 (79.4%) | 23 (59.0%) |
| 3 Vehicles | 0 (0.0%) | 0 (0.0%) |
| 4 Vehicles | 0 (0.0%) | 16 (41.0%) |
| 5 or more Vehicles | 0 (0.0%) | 0 (0.0%) |
| Total | 68 (100.0%) | 39 (100.0%) |
Commute Time in Pioneer
The most frequently occuring commute durations in Pioneer are 15 to 19 minutes (46 commuters, 43.0%), 25 to 29 minutes (23 commuters, 21.5%), and 60 to 89 minutes (22 commuters, 20.6%).
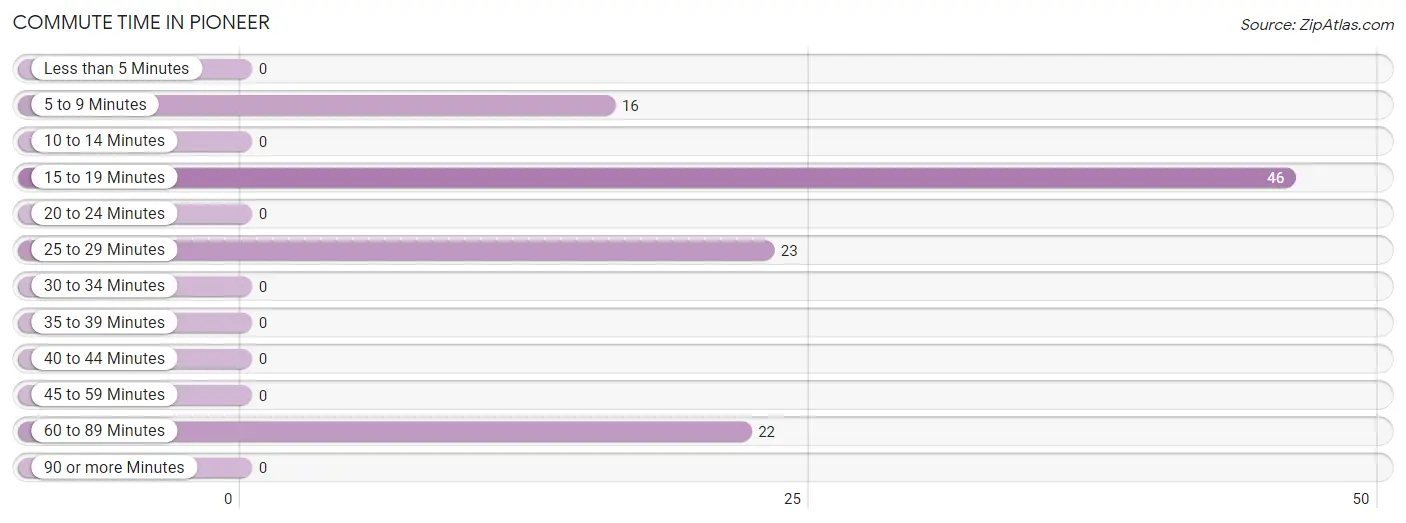
| Commute Time | # Commuters | % Commuters |
| Less than 5 Minutes | 0 | 0.0% |
| 5 to 9 Minutes | 16 | 14.9% |
| 10 to 14 Minutes | 0 | 0.0% |
| 15 to 19 Minutes | 46 | 43.0% |
| 20 to 24 Minutes | 0 | 0.0% |
| 25 to 29 Minutes | 23 | 21.5% |
| 30 to 34 Minutes | 0 | 0.0% |
| 35 to 39 Minutes | 0 | 0.0% |
| 40 to 44 Minutes | 0 | 0.0% |
| 45 to 59 Minutes | 0 | 0.0% |
| 60 to 89 Minutes | 22 | 20.6% |
| 90 or more Minutes | 0 | 0.0% |
Commute Time by Sex in Pioneer
The most common commute times in Pioneer are 15 to 19 minutes (46 commuters, 67.6%) for males and 25 to 29 minutes (23 commuters, 59.0%) for females.
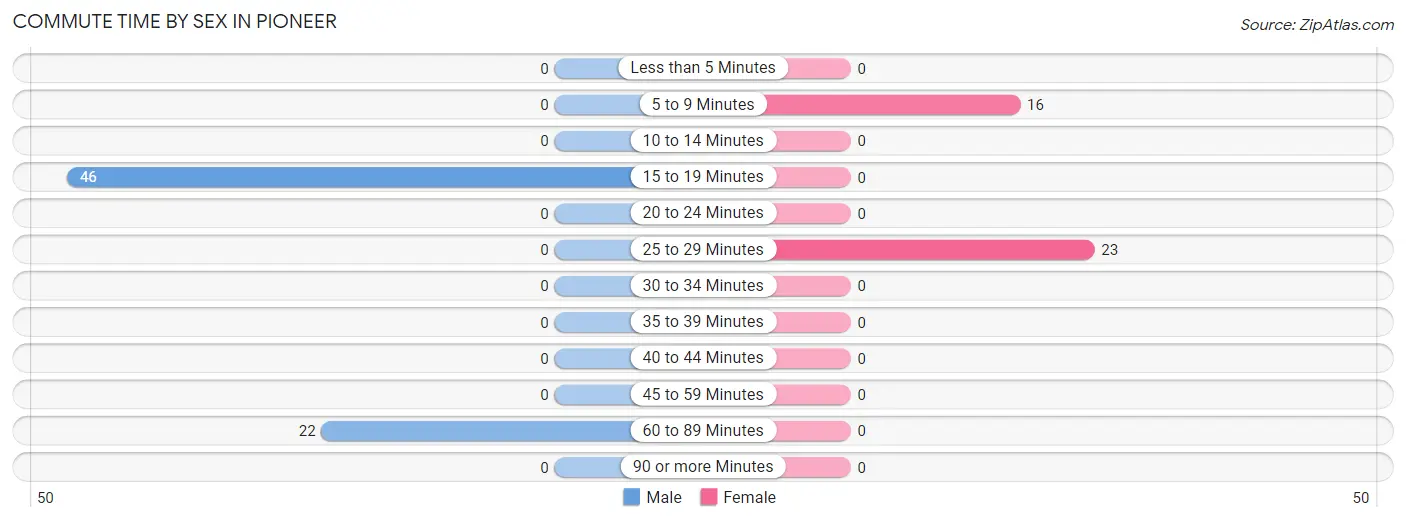
| Commute Time | Male | Female |
| Less than 5 Minutes | 0 (0.0%) | 0 (0.0%) |
| 5 to 9 Minutes | 0 (0.0%) | 16 (41.0%) |
| 10 to 14 Minutes | 0 (0.0%) | 0 (0.0%) |
| 15 to 19 Minutes | 46 (67.6%) | 0 (0.0%) |
| 20 to 24 Minutes | 0 (0.0%) | 0 (0.0%) |
| 25 to 29 Minutes | 0 (0.0%) | 23 (59.0%) |
| 30 to 34 Minutes | 0 (0.0%) | 0 (0.0%) |
| 35 to 39 Minutes | 0 (0.0%) | 0 (0.0%) |
| 40 to 44 Minutes | 0 (0.0%) | 0 (0.0%) |
| 45 to 59 Minutes | 0 (0.0%) | 0 (0.0%) |
| 60 to 89 Minutes | 22 (32.4%) | 0 (0.0%) |
| 90 or more Minutes | 0 (0.0%) | 0 (0.0%) |
Time of Departure to Work by Sex in Pioneer
The most frequent times of departure to work in Pioneer are 5:30 AM to 5:59 AM (32, 47.1%) for males and 10:00 AM to 10:59 AM (23, 59.0%) for females.
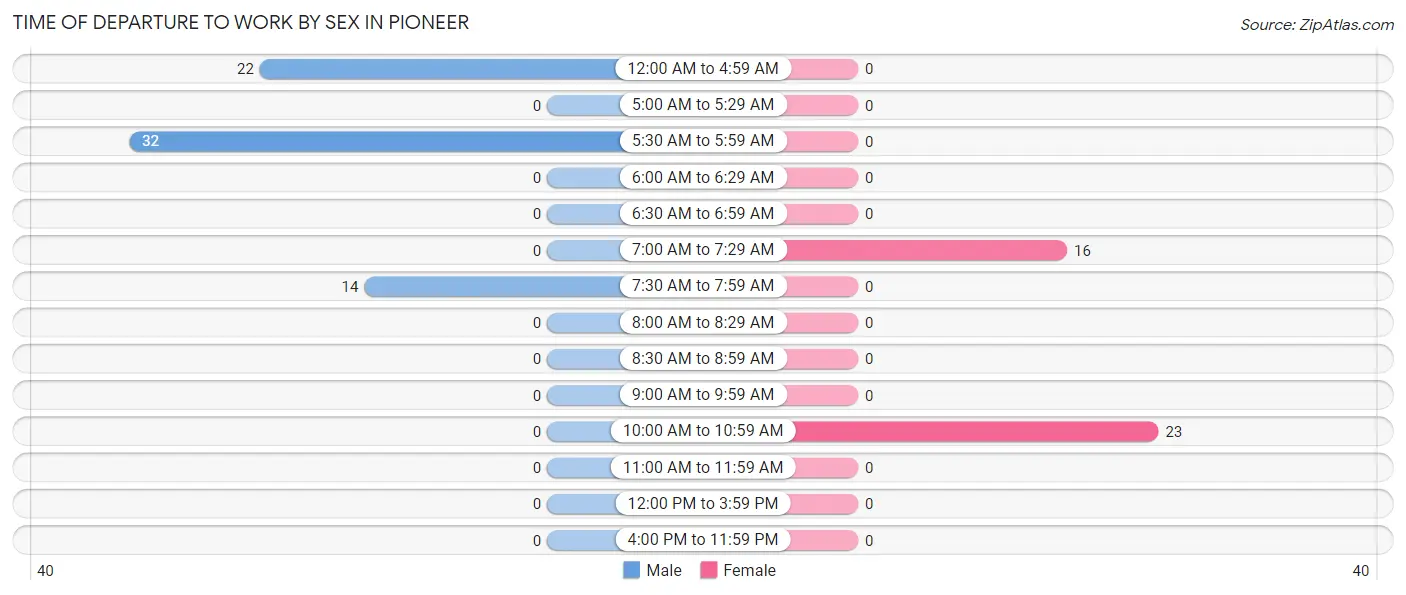
| Time of Departure | Male | Female |
| 12:00 AM to 4:59 AM | 22 (32.4%) | 0 (0.0%) |
| 5:00 AM to 5:29 AM | 0 (0.0%) | 0 (0.0%) |
| 5:30 AM to 5:59 AM | 32 (47.1%) | 0 (0.0%) |
| 6:00 AM to 6:29 AM | 0 (0.0%) | 0 (0.0%) |
| 6:30 AM to 6:59 AM | 0 (0.0%) | 0 (0.0%) |
| 7:00 AM to 7:29 AM | 0 (0.0%) | 16 (41.0%) |
| 7:30 AM to 7:59 AM | 14 (20.6%) | 0 (0.0%) |
| 8:00 AM to 8:29 AM | 0 (0.0%) | 0 (0.0%) |
| 8:30 AM to 8:59 AM | 0 (0.0%) | 0 (0.0%) |
| 9:00 AM to 9:59 AM | 0 (0.0%) | 0 (0.0%) |
| 10:00 AM to 10:59 AM | 0 (0.0%) | 23 (59.0%) |
| 11:00 AM to 11:59 AM | 0 (0.0%) | 0 (0.0%) |
| 12:00 PM to 3:59 PM | 0 (0.0%) | 0 (0.0%) |
| 4:00 PM to 11:59 PM | 0 (0.0%) | 0 (0.0%) |
| Total | 68 (100.0%) | 39 (100.0%) |
Housing Occupancy in Pioneer
Occupancy by Ownership in Pioneer
Of the total 174 dwellings in Pioneer, owner-occupied units account for 174 (100.0%), while renter-occupied units make up 0 (0.0%).
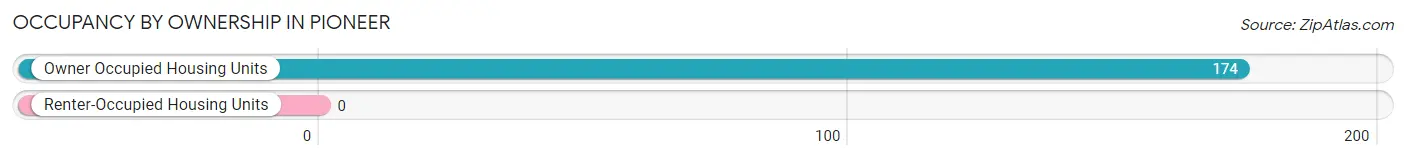
| Occupancy | # Housing Units | % Housing Units |
| Owner Occupied Housing Units | 174 | 100.0% |
| Renter-Occupied Housing Units | 0 | 0.0% |
| Total Occupied Housing Units | 174 | 100.0% |
Occupancy by Household Size in Pioneer
| Household Size | # Housing Units | % Housing Units |
| 1-Person Household | 36 | 20.7% |
| 2-Person Household | 86 | 49.4% |
| 3-Person Household | 52 | 29.9% |
| 4+ Person Household | 0 | 0.0% |
| Total Housing Units | 174 | 100.0% |
Occupancy by Ownership by Household Size in Pioneer
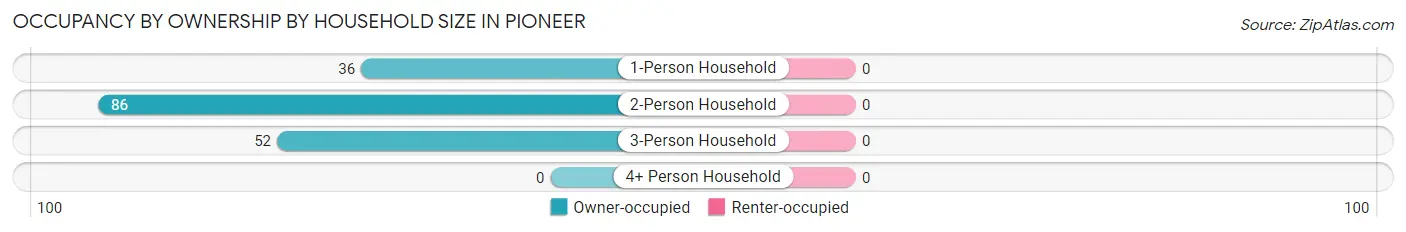
| Household Size | Owner-occupied | Renter-occupied |
| 1-Person Household | 36 (100.0%) | 0 (0.0%) |
| 2-Person Household | 86 (100.0%) | 0 (0.0%) |
| 3-Person Household | 52 (100.0%) | 0 (0.0%) |
| 4+ Person Household | 0 (0.0%) | 0 (0.0%) |
| Total Housing Units | 174 (100.0%) | 0 (0.0%) |
Occupancy by Educational Attainment in Pioneer
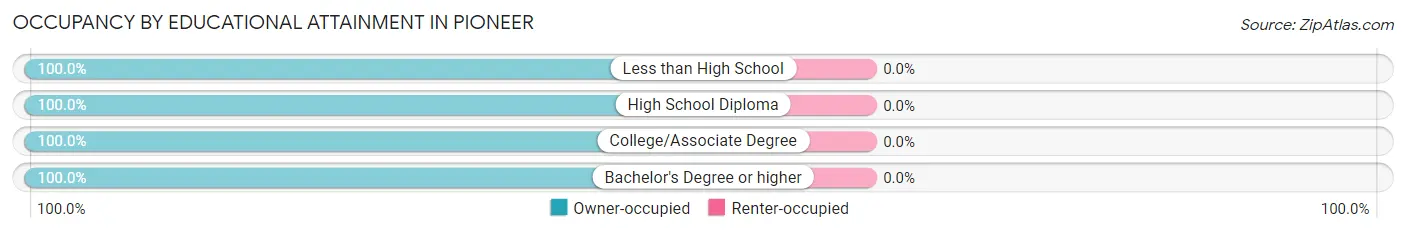
| Household Size | Owner-occupied | Renter-occupied |
| Less than High School | 68 (100.0%) | 0 (0.0%) |
| High School Diploma | 36 (100.0%) | 0 (0.0%) |
| College/Associate Degree | 48 (100.0%) | 0 (0.0%) |
| Bachelor's Degree or higher | 22 (100.0%) | 0 (0.0%) |
Occupancy by Age of Householder in Pioneer
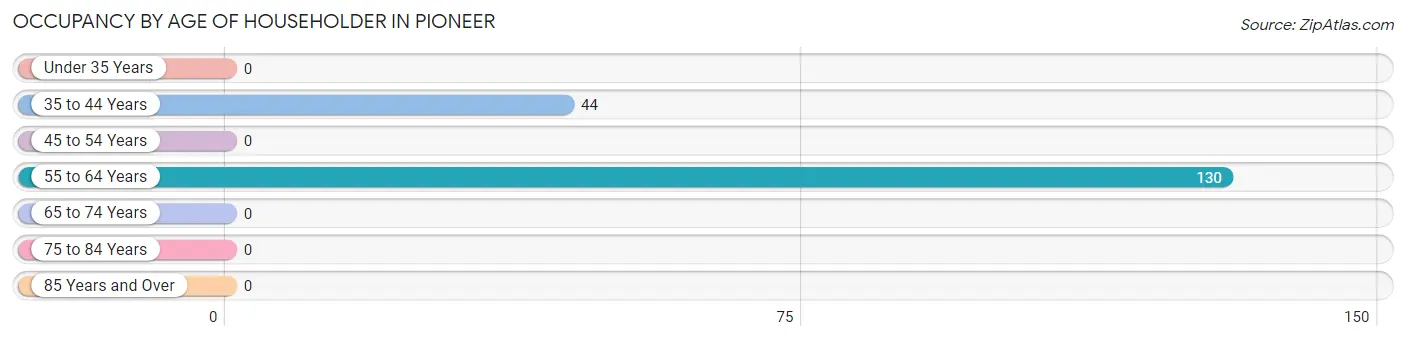
| Age Bracket | # Households | % Households |
| Under 35 Years | 0 | 0.0% |
| 35 to 44 Years | 44 | 25.3% |
| 45 to 54 Years | 0 | 0.0% |
| 55 to 64 Years | 130 | 74.7% |
| 65 to 74 Years | 0 | 0.0% |
| 75 to 84 Years | 0 | 0.0% |
| 85 Years and Over | 0 | 0.0% |
| Total | 174 | 100.0% |
Housing Finances in Pioneer
Median Income by Occupancy in Pioneer
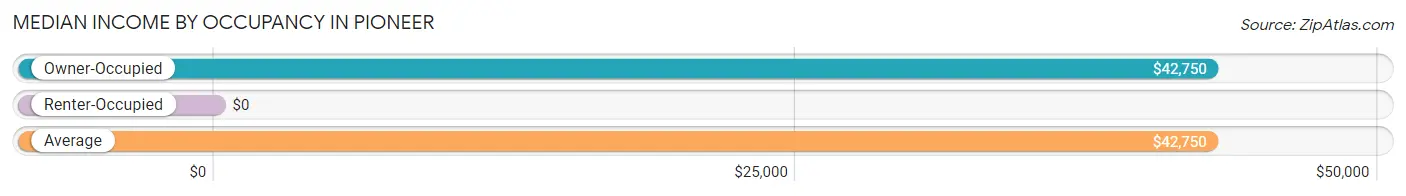
| Occupancy Type | # Households | Median Income |
| Owner-Occupied | 174 (100.0%) | $42,750 |
| Renter-Occupied | 0 (0.0%) | $0 |
| Average | 174 (100.0%) | $42,750 |
Occupancy by Householder Income Bracket in Pioneer
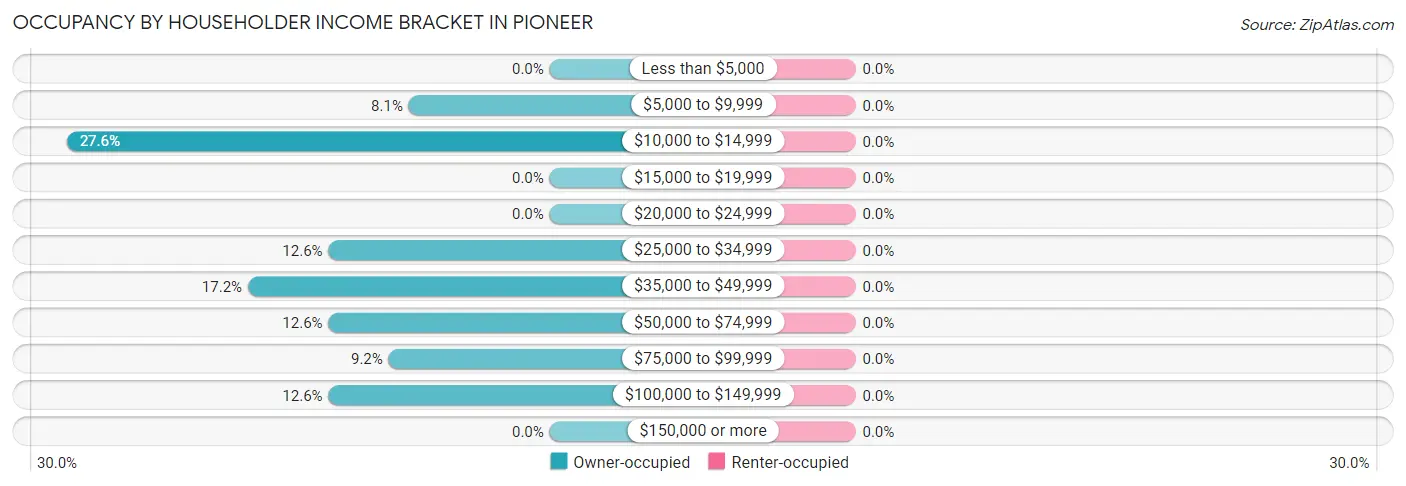
| Income Bracket | Owner-occupied | Renter-occupied |
| Less than $5,000 | 0 (0.0%) | 0 (0.0%) |
| $5,000 to $9,999 | 14 (8.1%) | 0 (0.0%) |
| $10,000 to $14,999 | 48 (27.6%) | 0 (0.0%) |
| $15,000 to $19,999 | 0 (0.0%) | 0 (0.0%) |
| $20,000 to $24,999 | 0 (0.0%) | 0 (0.0%) |
| $25,000 to $34,999 | 22 (12.6%) | 0 (0.0%) |
| $35,000 to $49,999 | 30 (17.2%) | 0 (0.0%) |
| $50,000 to $74,999 | 22 (12.6%) | 0 (0.0%) |
| $75,000 to $99,999 | 16 (9.2%) | 0 (0.0%) |
| $100,000 to $149,999 | 22 (12.6%) | 0 (0.0%) |
| $150,000 or more | 0 (0.0%) | 0 (0.0%) |
| Total | 174 (100.0%) | 0 (0.0%) |
Monthly Housing Cost Tiers in Pioneer
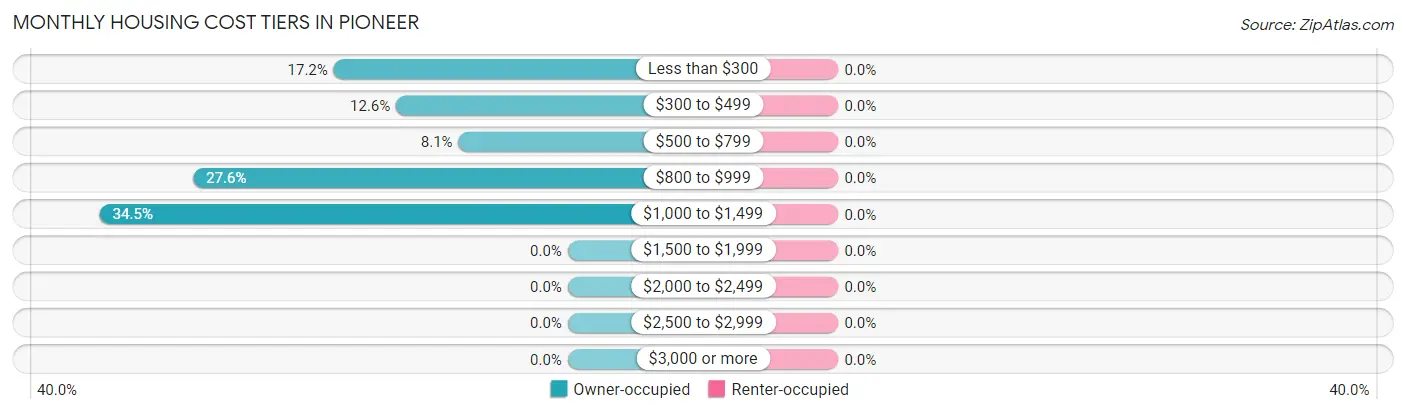
| Monthly Cost | Owner-occupied | Renter-occupied |
| Less than $300 | 30 (17.2%) | 0 (0.0%) |
| $300 to $499 | 22 (12.6%) | 0 (0.0%) |
| $500 to $799 | 14 (8.1%) | 0 (0.0%) |
| $800 to $999 | 48 (27.6%) | 0 (0.0%) |
| $1,000 to $1,499 | 60 (34.5%) | 0 (0.0%) |
| $1,500 to $1,999 | 0 (0.0%) | 0 (0.0%) |
| $2,000 to $2,499 | 0 (0.0%) | 0 (0.0%) |
| $2,500 to $2,999 | 0 (0.0%) | 0 (0.0%) |
| $3,000 or more | 0 (0.0%) | 0 (0.0%) |
| Total | 174 (100.0%) | 0 (0.0%) |
Physical Housing Characteristics in Pioneer
Housing Structures in Pioneer
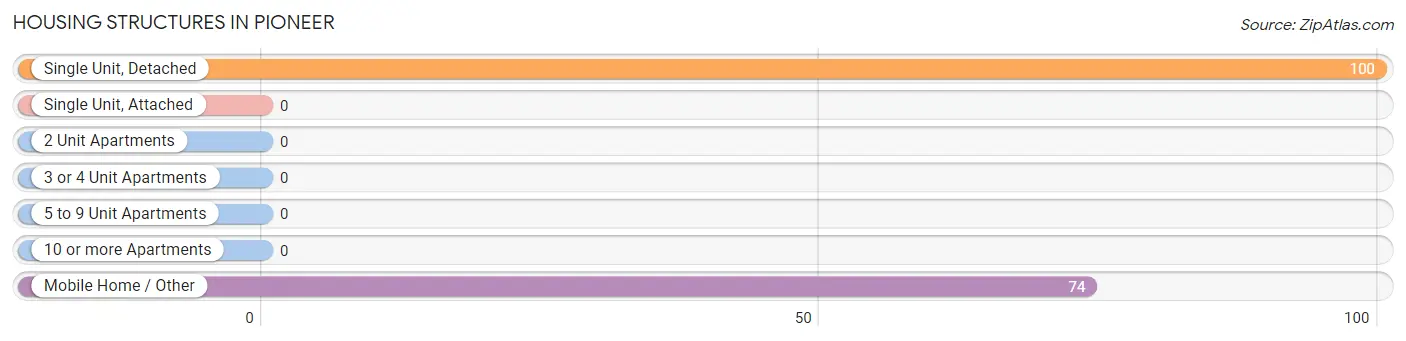
| Structure Type | # Housing Units | % Housing Units |
| Single Unit, Detached | 100 | 57.5% |
| Single Unit, Attached | 0 | 0.0% |
| 2 Unit Apartments | 0 | 0.0% |
| 3 or 4 Unit Apartments | 0 | 0.0% |
| 5 to 9 Unit Apartments | 0 | 0.0% |
| 10 or more Apartments | 0 | 0.0% |
| Mobile Home / Other | 74 | 42.5% |
| Total | 174 | 100.0% |
Housing Structures by Occupancy in Pioneer
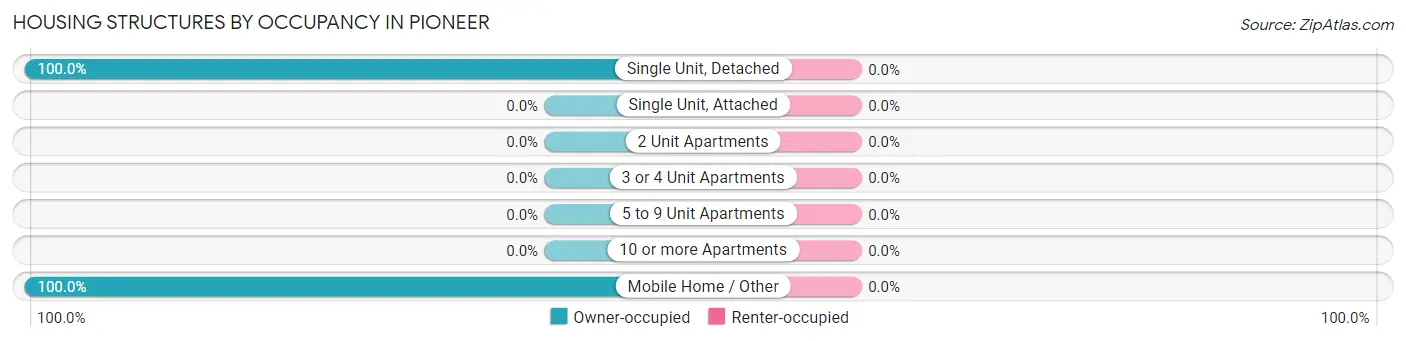
| Structure Type | Owner-occupied | Renter-occupied |
| Single Unit, Detached | 100 (100.0%) | 0 (0.0%) |
| Single Unit, Attached | 0 (0.0%) | 0 (0.0%) |
| 2 Unit Apartments | 0 (0.0%) | 0 (0.0%) |
| 3 or 4 Unit Apartments | 0 (0.0%) | 0 (0.0%) |
| 5 to 9 Unit Apartments | 0 (0.0%) | 0 (0.0%) |
| 10 or more Apartments | 0 (0.0%) | 0 (0.0%) |
| Mobile Home / Other | 74 (100.0%) | 0 (0.0%) |
| Total | 174 (100.0%) | 0 (0.0%) |
Housing Structures by Number of Rooms in Pioneer
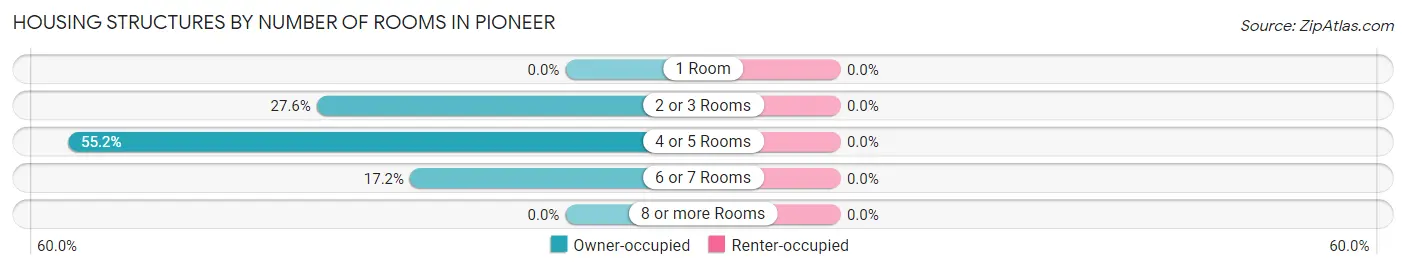
| Number of Rooms | Owner-occupied | Renter-occupied |
| 1 Room | 0 (0.0%) | 0 (0.0%) |
| 2 or 3 Rooms | 48 (27.6%) | 0 (0.0%) |
| 4 or 5 Rooms | 96 (55.2%) | 0 (0.0%) |
| 6 or 7 Rooms | 30 (17.2%) | 0 (0.0%) |
| 8 or more Rooms | 0 (0.0%) | 0 (0.0%) |
| Total | 174 (100.0%) | 0 (0.0%) |
Housing Structure by Heating Type in Pioneer
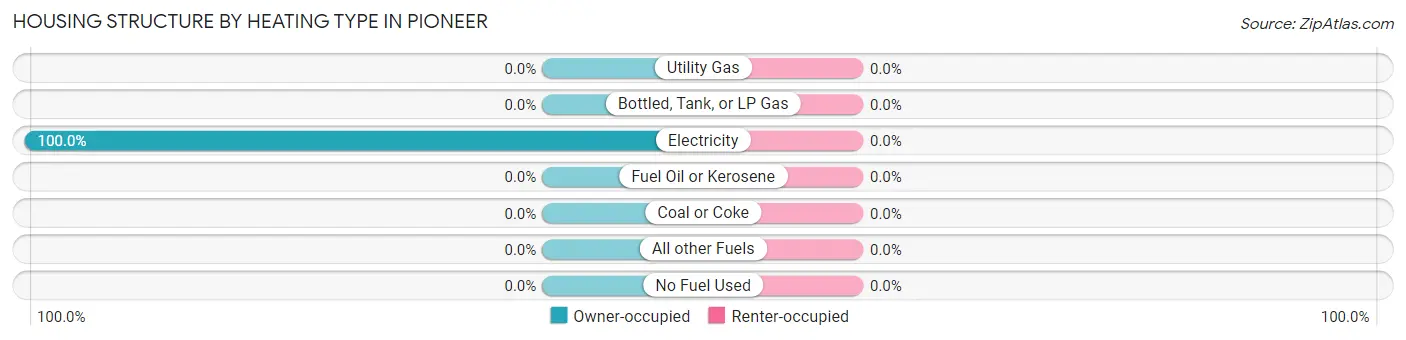
| Heating Type | Owner-occupied | Renter-occupied |
| Utility Gas | 0 (0.0%) | 0 (0.0%) |
| Bottled, Tank, or LP Gas | 0 (0.0%) | 0 (0.0%) |
| Electricity | 174 (100.0%) | 0 (0.0%) |
| Fuel Oil or Kerosene | 0 (0.0%) | 0 (0.0%) |
| Coal or Coke | 0 (0.0%) | 0 (0.0%) |
| All other Fuels | 0 (0.0%) | 0 (0.0%) |
| No Fuel Used | 0 (0.0%) | 0 (0.0%) |
| Total | 174 (100.0%) | 0 (0.0%) |
Household Vehicle Usage in Pioneer
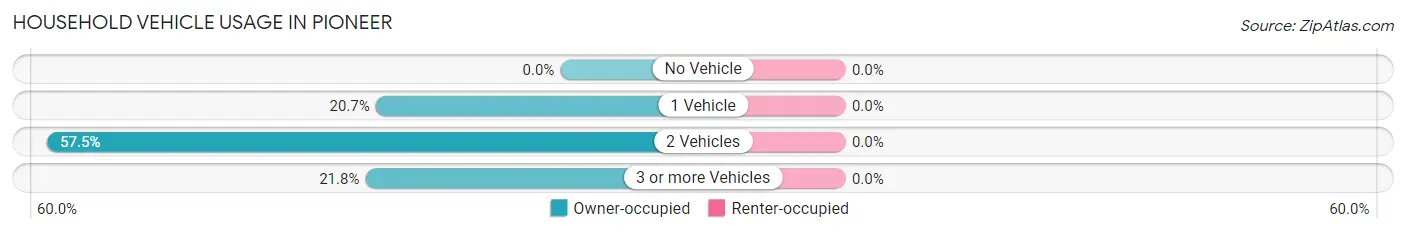
| Vehicles per Household | Owner-occupied | Renter-occupied |
| No Vehicle | 0 (0.0%) | 0 (0.0%) |
| 1 Vehicle | 36 (20.7%) | 0 (0.0%) |
| 2 Vehicles | 100 (57.5%) | 0 (0.0%) |
| 3 or more Vehicles | 38 (21.8%) | 0 (0.0%) |
| Total | 174 (100.0%) | 0 (0.0%) |
Real Estate & Mortgages in Pioneer
Real Estate and Mortgage Overview in Pioneer
| Characteristic | Without Mortgage | With Mortgage |
| Housing Units | 66 | 108 |
| Median Property Value | - | - |
| Median Household Income | $29,659 | $0 |
| Monthly Housing Costs | $414 | $0 |
| Real Estate Taxes | - | - |
Property Value by Mortgage Status in Pioneer
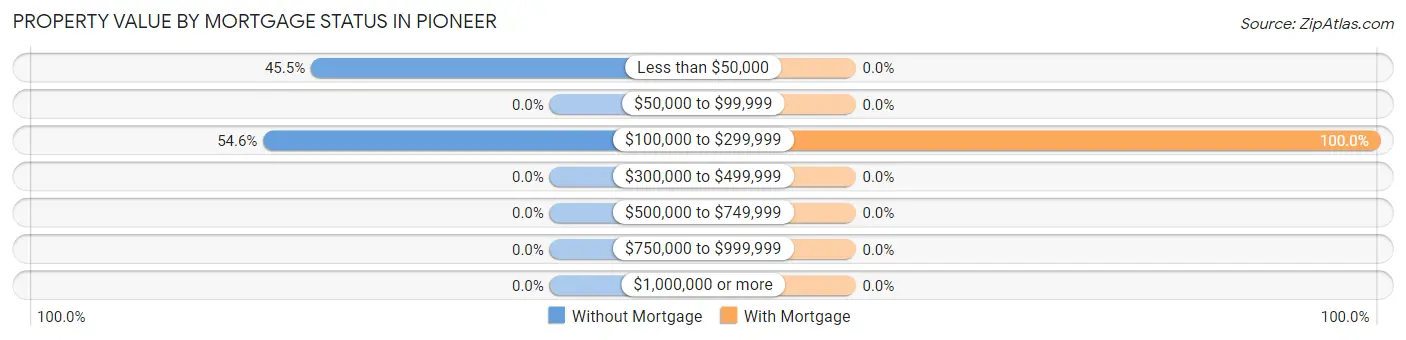
| Property Value | Without Mortgage | With Mortgage |
| Less than $50,000 | 30 (45.5%) | 0 (0.0%) |
| $50,000 to $99,999 | 0 (0.0%) | 0 (0.0%) |
| $100,000 to $299,999 | 36 (54.5%) | 108 (100.0%) |
| $300,000 to $499,999 | 0 (0.0%) | 0 (0.0%) |
| $500,000 to $749,999 | 0 (0.0%) | 0 (0.0%) |
| $750,000 to $999,999 | 0 (0.0%) | 0 (0.0%) |
| $1,000,000 or more | 0 (0.0%) | 0 (0.0%) |
| Total | 66 (100.0%) | 108 (100.0%) |
Household Income by Mortgage Status in Pioneer
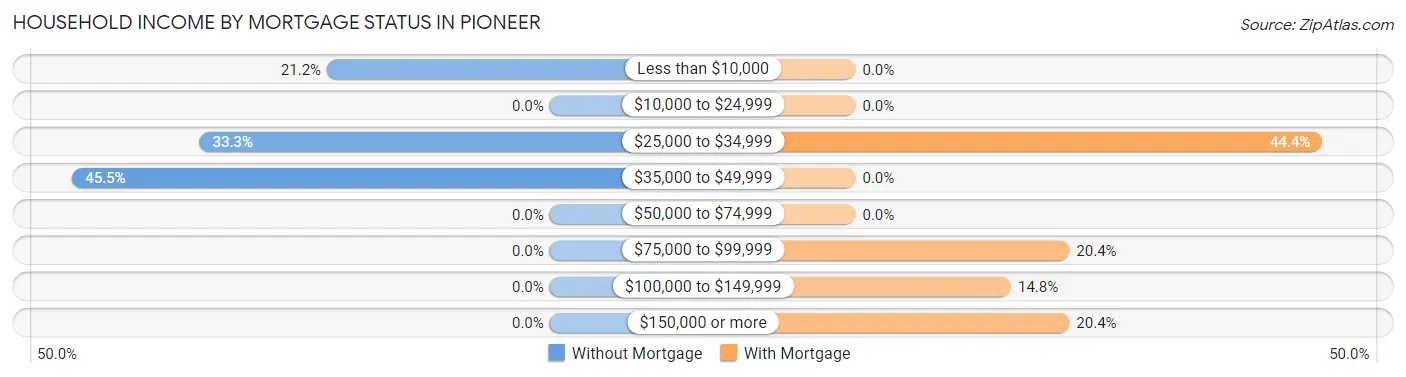
| Household Income | Without Mortgage | With Mortgage |
| Less than $10,000 | 14 (21.2%) | 0 (0.0%) |
| $10,000 to $24,999 | 0 (0.0%) | 0 (0.0%) |
| $25,000 to $34,999 | 22 (33.3%) | 48 (44.4%) |
| $35,000 to $49,999 | 30 (45.5%) | 0 (0.0%) |
| $50,000 to $74,999 | 0 (0.0%) | 0 (0.0%) |
| $75,000 to $99,999 | 0 (0.0%) | 22 (20.4%) |
| $100,000 to $149,999 | 0 (0.0%) | 16 (14.8%) |
| $150,000 or more | 0 (0.0%) | 22 (20.4%) |
| Total | 66 (100.0%) | 108 (100.0%) |
Property Value to Household Income Ratio in Pioneer
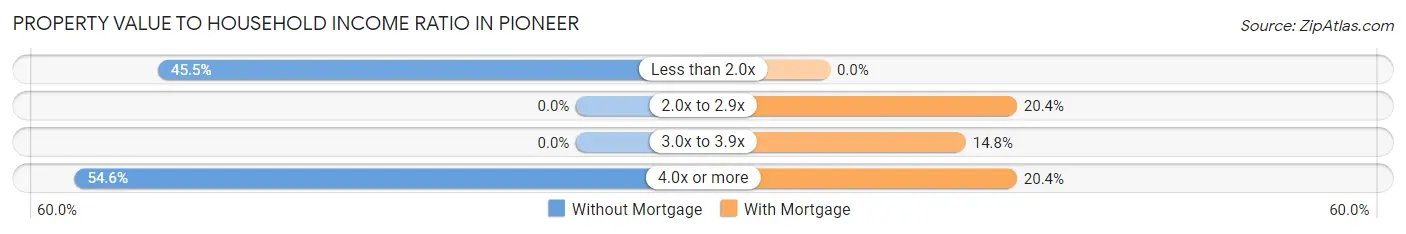
| Value-to-Income Ratio | Without Mortgage | With Mortgage |
| Less than 2.0x | 30 (45.5%) | 0 (0.0%) |
| 2.0x to 2.9x | 0 (0.0%) | 22 (20.4%) |
| 3.0x to 3.9x | 0 (0.0%) | 16 (14.8%) |
| 4.0x or more | 36 (54.5%) | 22 (20.4%) |
| Total | 66 (100.0%) | 108 (100.0%) |
Real Estate Taxes by Mortgage Status in Pioneer
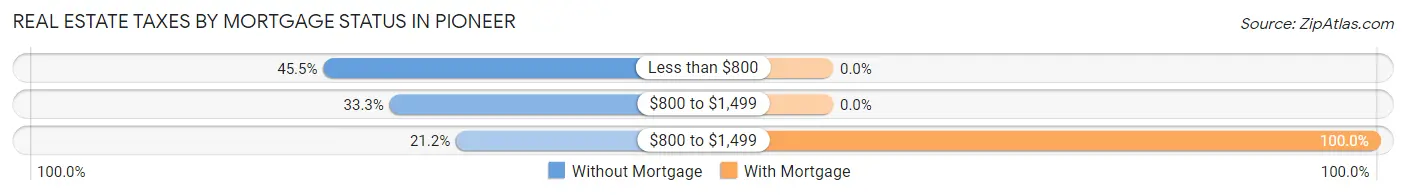
| Property Taxes | Without Mortgage | With Mortgage |
| Less than $800 | 30 (45.5%) | 0 (0.0%) |
| $800 to $1,499 | 22 (33.3%) | 0 (0.0%) |
| $800 to $1,499 | 14 (21.2%) | 108 (100.0%) |
| Total | 66 (100.0%) | 108 (100.0%) |
Health & Disability in Pioneer
Health Insurance Coverage by Age in Pioneer
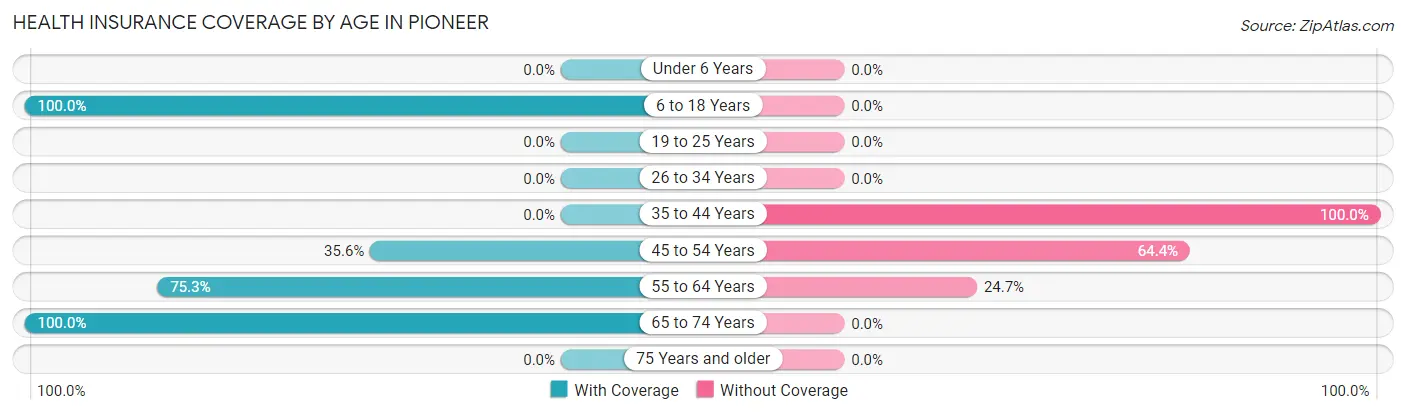
| Age Bracket | With Coverage | Without Coverage |
| Under 6 Years | 0 (0.0%) | 0 (0.0%) |
| 6 to 18 Years | 75 (100.0%) | 0 (0.0%) |
| 19 to 25 Years | 0 (0.0%) | 0 (0.0%) |
| 26 to 34 Years | 0 (0.0%) | 0 (0.0%) |
| 35 to 44 Years | 0 (0.0%) | 44 (100.0%) |
| 45 to 54 Years | 32 (35.6%) | 58 (64.4%) |
| 55 to 64 Years | 146 (75.3%) | 48 (24.7%) |
| 65 to 74 Years | 16 (100.0%) | 0 (0.0%) |
| 75 Years and older | 0 (0.0%) | 0 (0.0%) |
| Total | 269 (64.2%) | 150 (35.8%) |
Health Insurance Coverage by Citizenship Status in Pioneer
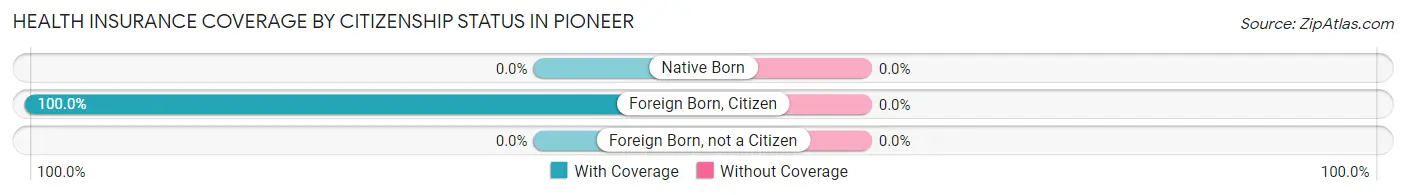
| Citizenship Status | With Coverage | Without Coverage |
| Native Born | 0 (0.0%) | 0 (0.0%) |
| Foreign Born, Citizen | 75 (100.0%) | 0 (0.0%) |
| Foreign Born, not a Citizen | 0 (0.0%) | 0 (0.0%) |
Health Insurance Coverage by Household Income in Pioneer
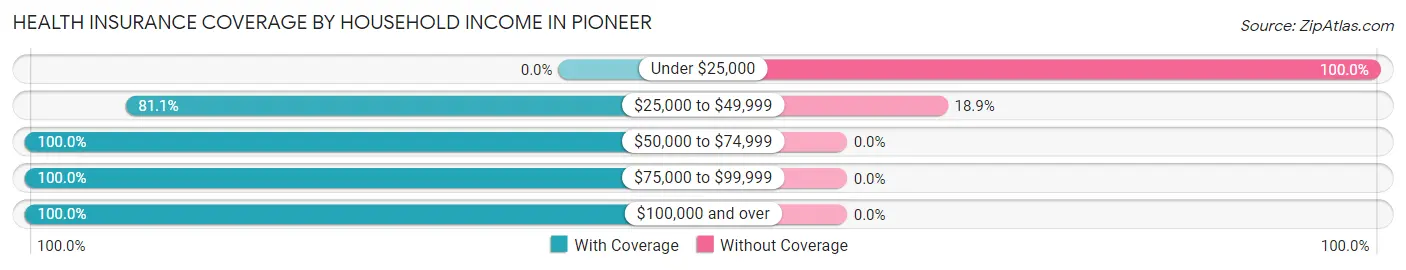
| Household Income | With Coverage | Without Coverage |
| Under $25,000 | 0 (0.0%) | 120 (100.0%) |
| $25,000 to $49,999 | 129 (81.1%) | 30 (18.9%) |
| $50,000 to $74,999 | 50 (100.0%) | 0 (0.0%) |
| $75,000 to $99,999 | 29 (100.0%) | 0 (0.0%) |
| $100,000 and over | 61 (100.0%) | 0 (0.0%) |
Public vs Private Health Insurance Coverage by Age in Pioneer
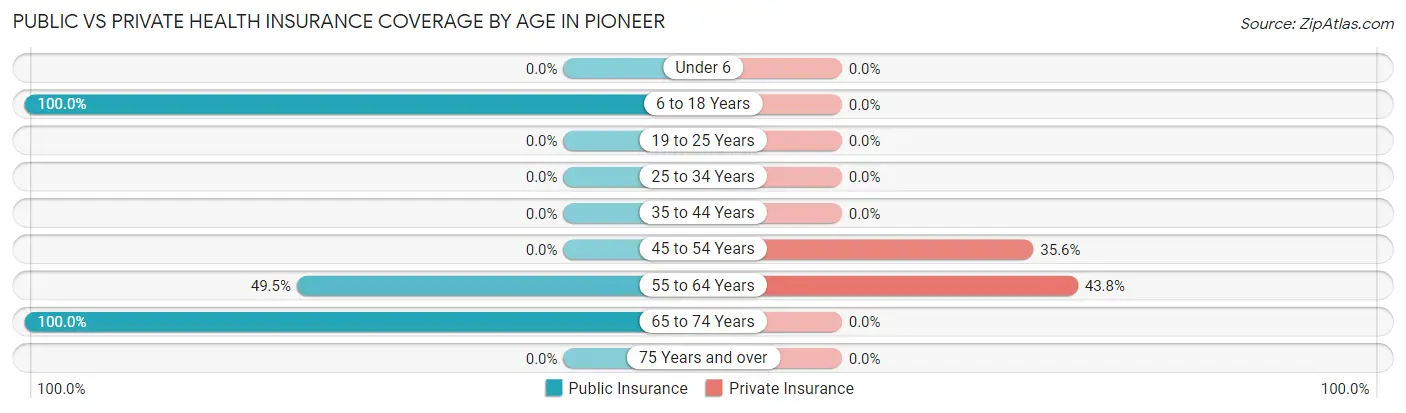
| Age Bracket | Public Insurance | Private Insurance |
| Under 6 | 0 (0.0%) | 0 (0.0%) |
| 6 to 18 Years | 75 (100.0%) | 0 (0.0%) |
| 19 to 25 Years | 0 (0.0%) | 0 (0.0%) |
| 25 to 34 Years | 0 (0.0%) | 0 (0.0%) |
| 35 to 44 Years | 0 (0.0%) | 0 (0.0%) |
| 45 to 54 Years | 0 (0.0%) | 32 (35.6%) |
| 55 to 64 Years | 96 (49.5%) | 85 (43.8%) |
| 65 to 74 Years | 16 (100.0%) | 0 (0.0%) |
| 75 Years and over | 0 (0.0%) | 0 (0.0%) |
| Total | 187 (44.6%) | 117 (27.9%) |
Disability Status by Sex by Age in Pioneer
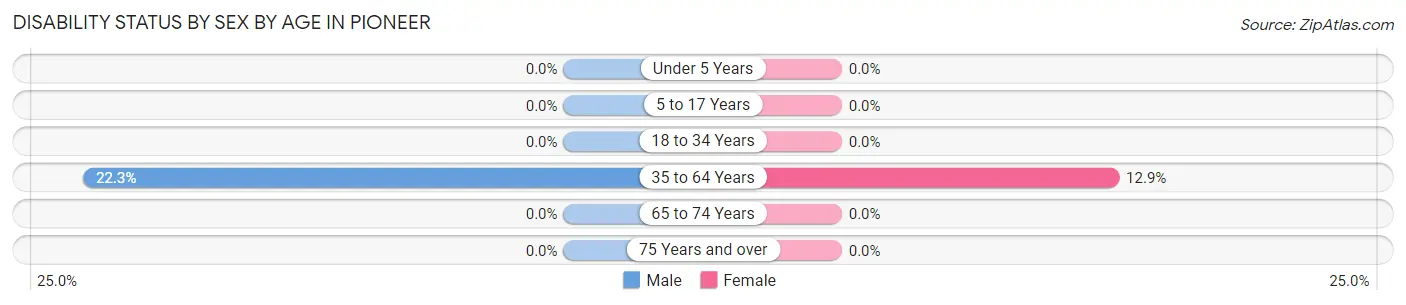
| Age Bracket | Male | Female |
| Under 5 Years | 0 (0.0%) | 0 (0.0%) |
| 5 to 17 Years | 0 (0.0%) | 0 (0.0%) |
| 18 to 34 Years | 0 (0.0%) | 0 (0.0%) |
| 35 to 64 Years | 35 (22.3%) | 22 (12.9%) |
| 65 to 74 Years | 0 (0.0%) | 0 (0.0%) |
| 75 Years and over | 0 (0.0%) | 0 (0.0%) |
Disability Class by Sex by Age in Pioneer
Disability Class: Hearing Difficulty
| Age Bracket | Male | Female |
| Under 5 Years | 0 (0.0%) | 0 (0.0%) |
| 5 to 17 Years | 0 (0.0%) | 0 (0.0%) |
| 18 to 34 Years | 0 (0.0%) | 0 (0.0%) |
| 35 to 64 Years | 0 (0.0%) | 0 (0.0%) |
| 65 to 74 Years | 0 (0.0%) | 0 (0.0%) |
| 75 Years and over | 0 (0.0%) | 0 (0.0%) |
Disability Class: Vision Difficulty
| Age Bracket | Male | Female |
| Under 5 Years | 0 (0.0%) | 0 (0.0%) |
| 5 to 17 Years | 0 (0.0%) | 0 (0.0%) |
| 18 to 34 Years | 0 (0.0%) | 0 (0.0%) |
| 35 to 64 Years | 0 (0.0%) | 0 (0.0%) |
| 65 to 74 Years | 0 (0.0%) | 0 (0.0%) |
| 75 Years and over | 0 (0.0%) | 0 (0.0%) |
Disability Class: Cognitive Difficulty
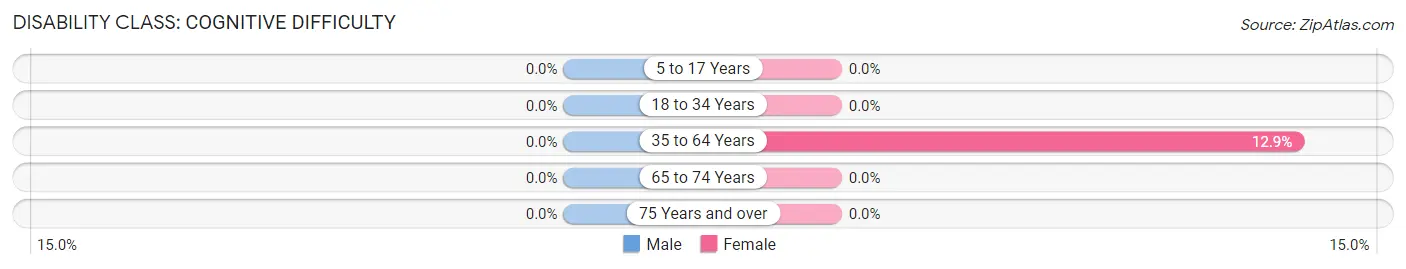
| Age Bracket | Male | Female |
| 5 to 17 Years | 0 (0.0%) | 0 (0.0%) |
| 18 to 34 Years | 0 (0.0%) | 0 (0.0%) |
| 35 to 64 Years | 0 (0.0%) | 22 (12.9%) |
| 65 to 74 Years | 0 (0.0%) | 0 (0.0%) |
| 75 Years and over | 0 (0.0%) | 0 (0.0%) |
Disability Class: Ambulatory Difficulty
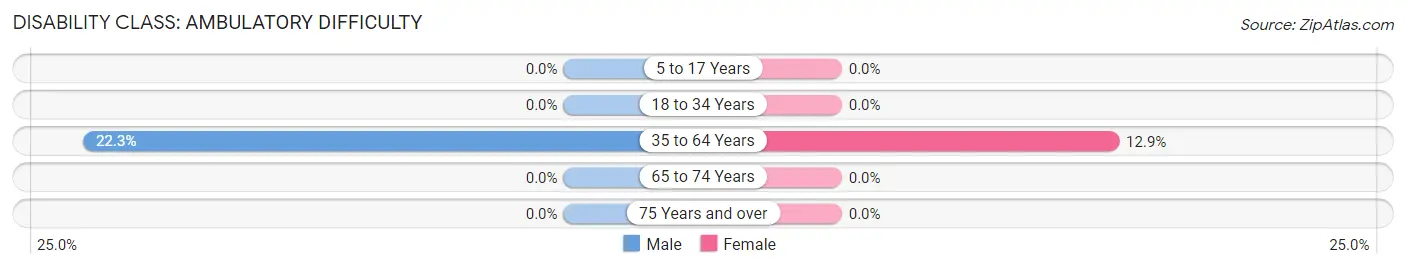
| Age Bracket | Male | Female |
| 5 to 17 Years | 0 (0.0%) | 0 (0.0%) |
| 18 to 34 Years | 0 (0.0%) | 0 (0.0%) |
| 35 to 64 Years | 35 (22.3%) | 22 (12.9%) |
| 65 to 74 Years | 0 (0.0%) | 0 (0.0%) |
| 75 Years and over | 0 (0.0%) | 0 (0.0%) |
Disability Class: Self-Care Difficulty
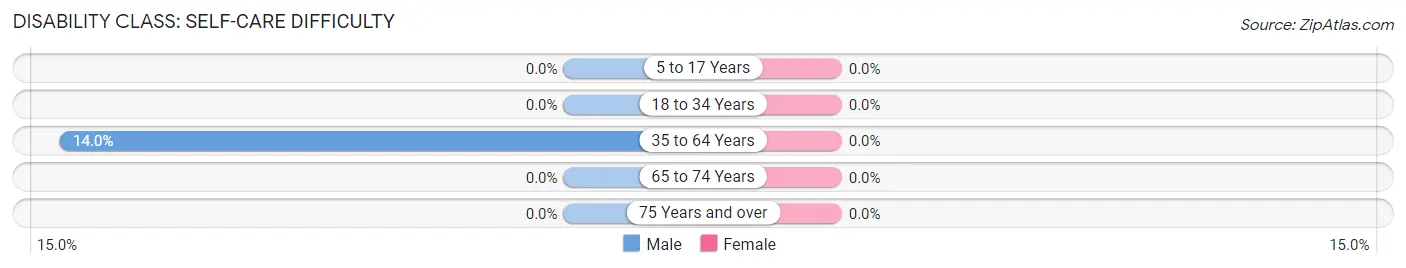
| Age Bracket | Male | Female |
| 5 to 17 Years | 0 (0.0%) | 0 (0.0%) |
| 18 to 34 Years | 0 (0.0%) | 0 (0.0%) |
| 35 to 64 Years | 22 (14.0%) | 0 (0.0%) |
| 65 to 74 Years | 0 (0.0%) | 0 (0.0%) |
| 75 Years and over | 0 (0.0%) | 0 (0.0%) |
Technology Access in Pioneer
Computing Device Access in Pioneer
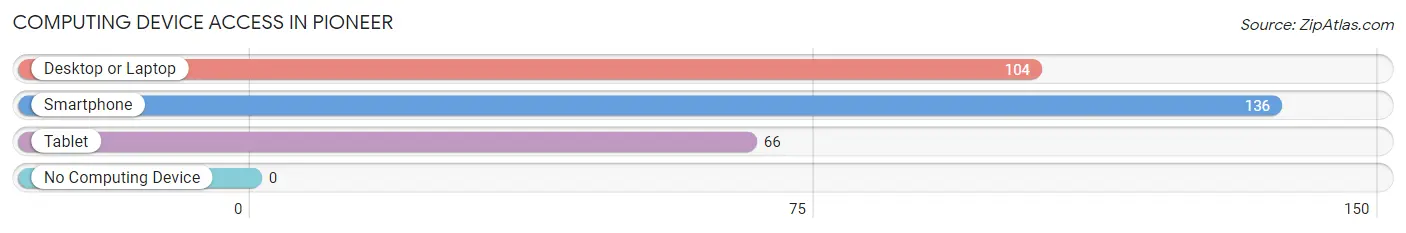
| Device Type | # Households | % Households |
| Desktop or Laptop | 104 | 59.8% |
| Smartphone | 136 | 78.2% |
| Tablet | 66 | 37.9% |
| No Computing Device | 0 | 0.0% |
| Total | 174 | 100.0% |
Internet Access in Pioneer
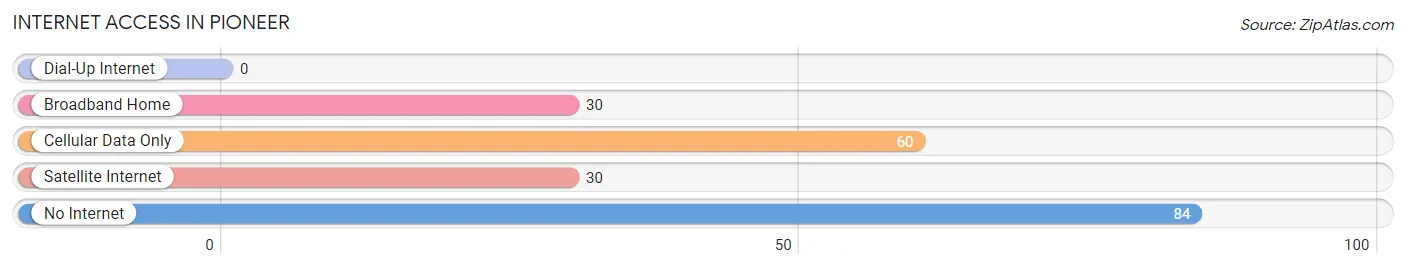
| Internet Type | # Households | % Households |
| Dial-Up Internet | 0 | 0.0% |
| Broadband Home | 30 | 17.2% |
| Cellular Data Only | 60 | 34.5% |
| Satellite Internet | 30 | 17.2% |
| No Internet | 84 | 48.3% |
| Total | 174 | 100.0% |
Pioneer Summary
Pioneer is a small unincorporated community located in the western part of Levy County, Florida. It is situated on the banks of the Suwannee River, approximately 20 miles south of Chiefland and 25 miles north of Cedar Key. The population of Pioneer was estimated to be around 1,000 people in 2000.
History
The area that is now Pioneer was first settled in the late 1800s by settlers from Georgia and Alabama. The town was originally known as “Pioneer Settlement” and was established in 1883. The town was named after the first settler, William H. Pioneer, who was a former Confederate soldier.
The town grew slowly but steadily over the years, and by the early 1900s, it had become a thriving community. The town was home to several businesses, including a general store, a sawmill, a grist mill, and a cotton gin. The town also had a post office, a school, and a church.
In the 1920s, the town began to decline as the timber industry in the area began to decline. The Great Depression also had a negative impact on the town, and by the 1940s, the population had dropped to around 500 people.
Geography
Pioneer is located in the western part of Levy County, Florida. It is situated on the banks of the Suwannee River, approximately 20 miles south of Chiefland and 25 miles north of Cedar Key. The town is surrounded by forests and swamps, and is home to several small lakes.
The climate in Pioneer is subtropical, with hot, humid summers and mild winters. The average temperature in the summer is around 90 degrees Fahrenheit, and the average temperature in the winter is around 60 degrees Fahrenheit.
Economy
The economy of Pioneer is largely based on agriculture and forestry. The town is home to several farms, which produce a variety of crops, including corn, soybeans, and cotton. The town is also home to several timber companies, which harvest timber from the surrounding forests.
In addition to agriculture and forestry, Pioneer is also home to several small businesses, including restaurants, convenience stores, and gas stations. The town is also home to several tourist attractions, including the Suwannee River State Park and the Manatee Springs State Park.
Demographics
As of the 2000 census, the population of Pioneer was estimated to be around 1,000 people. The racial makeup of the town was 97.2% White, 0.7% African American, 0.3% Native American, 0.3% Asian, and 1.5% from other races. The median household income in Pioneer was $25,000, and the median family income was $30,000. The per capita income in Pioneer was $14,000.
Common Questions
What is Per Capita Income in Pioneer?
Per Capita income in Pioneer is $18,201.
What is the Median Household income in Pioneer?
Median Household Income in Pioneer is $42,750.
What is Inequality or Gini Index in Pioneer?
Inequality or Gini Index in Pioneer is 0.42.
What is the Total Population of Pioneer?
Total Population of Pioneer is 419.
What is the Total Male Population of Pioneer?
Total Male Population of Pioneer is 232.
What is the Total Female Population of Pioneer?
Total Female Population of Pioneer is 187.
What is the Ratio of Males per 100 Females in Pioneer?
There are 124.06 Males per 100 Females in Pioneer.
What is the Ratio of Females per 100 Males in Pioneer?
There are 80.60 Females per 100 Males in Pioneer.
What is the Median Population Age in Pioneer?
Median Population Age in Pioneer is 56.0 Years.
What is the Average Family Size in Pioneer
Average Family Size in Pioneer is 2.5 People.
What is the Average Household Size in Pioneer
Average Household Size in Pioneer is 2.4 People.
How Large is the Labor Force in Pioneer?
There are 107 People in the Labor Forcein in Pioneer.
What is the Percentage of People in the Labor Force in Pioneer?
31.1% of People are in the Labor Force in Pioneer.