El Portal, FL Map & Demographics
El Portal Map
El Portal Overview
$48,799
PER CAPITA INCOME
$103,631
AVG FAMILY INCOME
$102,614
AVG HOUSEHOLD INCOME
36.7%
WAGE / INCOME GAP [ % ]
63.3¢/ $1
WAGE / INCOME GAP [ $ ]
0.38
INEQUALITY / GINI INDEX
1,904
TOTAL POPULATION
1,011
MALE POPULATION
893
FEMALE POPULATION
113.21
MALES / 100 FEMALES
88.33
FEMALES / 100 MALES
40.5
MEDIAN AGE
3.1
AVG FAMILY SIZE
2.4
AVG HOUSEHOLD SIZE
1,176
LABOR FORCE [ PEOPLE ]
77.9%
PERCENT IN LABOR FORCE
2.0%
UNEMPLOYMENT RATE
Income in El Portal
Income Overview in El Portal
Per Capita Income in El Portal is $48,799, while median incomes of families and households are $103,631 and $102,614 respectively.
| Characteristic | Number | Measure |
| Per Capita Income | 1,904 | $48,799 |
| Median Family Income | 469 | $103,631 |
| Mean Family Income | 469 | $125,353 |
| Median Household Income | 807 | $102,614 |
| Mean Household Income | 807 | $120,154 |
| Income Deficit | 469 | $0 |
| Wage / Income Gap (%) | 1,904 | 36.66% |
| Wage / Income Gap ($) | 1,904 | 63.34¢ per $1 |
| Gini / Inequality Index | 1,904 | 0.38 |
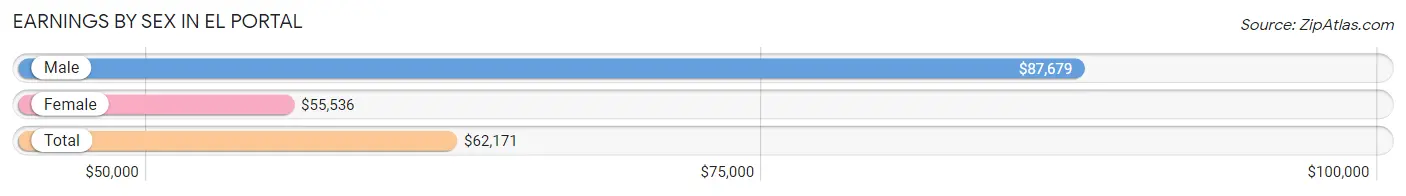
Earnings by Sex in El Portal
Average Earnings in El Portal are $62,171, $87,679 for men and $55,536 for women, a difference of 36.7%.
| Sex | Number | Average Earnings |
| Male | 636 (53.6%) | $87,679 |
| Female | 551 (46.4%) | $55,536 |
| Total | 1,187 (100.0%) | $62,171 |
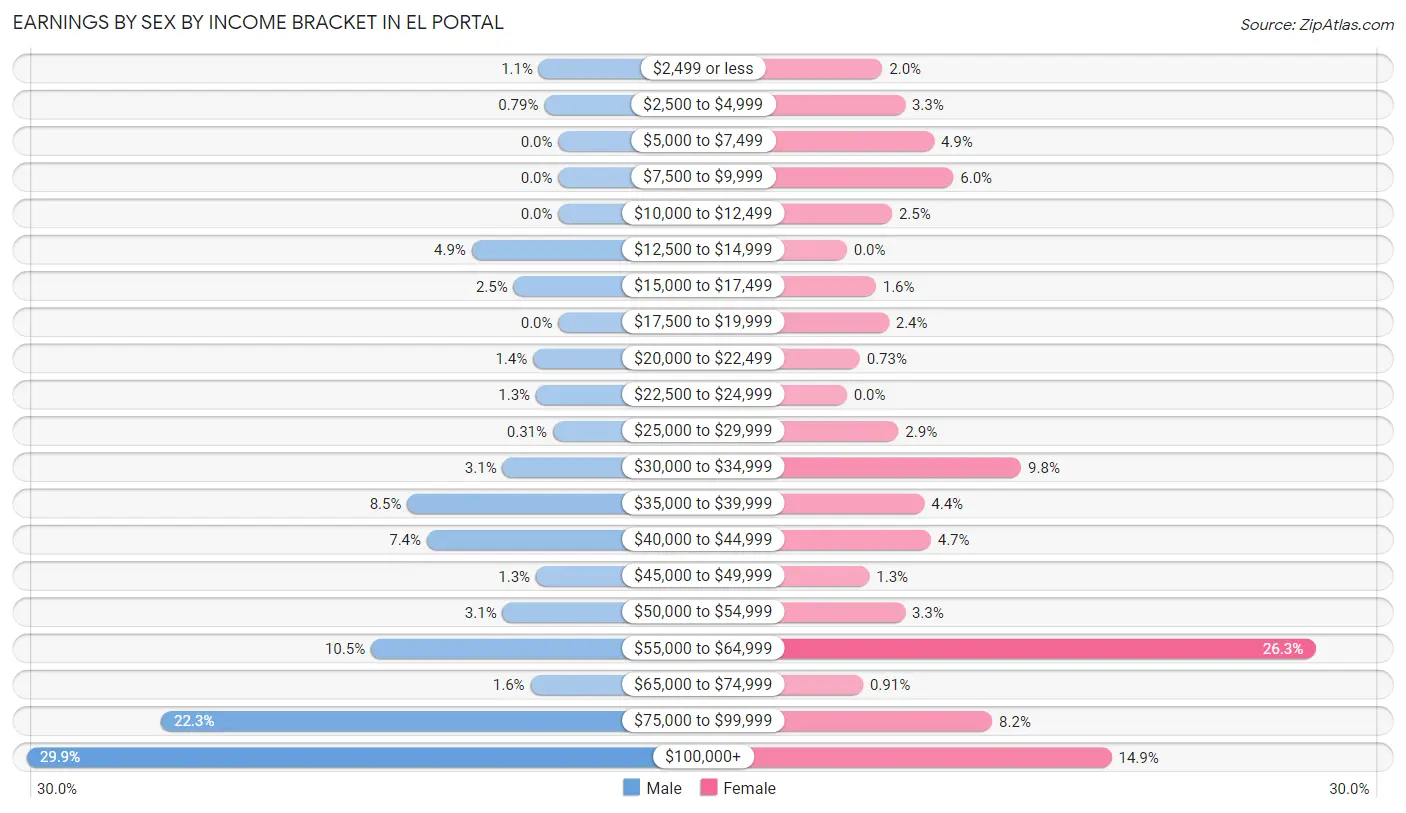
Earnings by Sex by Income Bracket in El Portal
The most common earnings brackets in El Portal are $100,000+ for men (190 | 29.9%) and $55,000 to $64,999 for women (145 | 26.3%).
| Income | Male | Female |
| $2,499 or less | 7 (1.1%) | 11 (2.0%) |
| $2,500 to $4,999 | 5 (0.8%) | 18 (3.3%) |
| $5,000 to $7,499 | 0 (0.0%) | 27 (4.9%) |
| $7,500 to $9,999 | 0 (0.0%) | 33 (6.0%) |
| $10,000 to $12,499 | 0 (0.0%) | 14 (2.5%) |
| $12,500 to $14,999 | 31 (4.9%) | 0 (0.0%) |
| $15,000 to $17,499 | 16 (2.5%) | 9 (1.6%) |
| $17,500 to $19,999 | 0 (0.0%) | 13 (2.4%) |
| $20,000 to $22,499 | 9 (1.4%) | 4 (0.7%) |
| $22,500 to $24,999 | 8 (1.3%) | 0 (0.0%) |
| $25,000 to $29,999 | 2 (0.3%) | 16 (2.9%) |
| $30,000 to $34,999 | 20 (3.1%) | 54 (9.8%) |
| $35,000 to $39,999 | 54 (8.5%) | 24 (4.4%) |
| $40,000 to $44,999 | 47 (7.4%) | 26 (4.7%) |
| $45,000 to $49,999 | 8 (1.3%) | 7 (1.3%) |
| $50,000 to $54,999 | 20 (3.1%) | 18 (3.3%) |
| $55,000 to $64,999 | 67 (10.5%) | 145 (26.3%) |
| $65,000 to $74,999 | 10 (1.6%) | 5 (0.9%) |
| $75,000 to $99,999 | 142 (22.3%) | 45 (8.2%) |
| $100,000+ | 190 (29.9%) | 82 (14.9%) |
| Total | 636 (100.0%) | 551 (100.0%) |
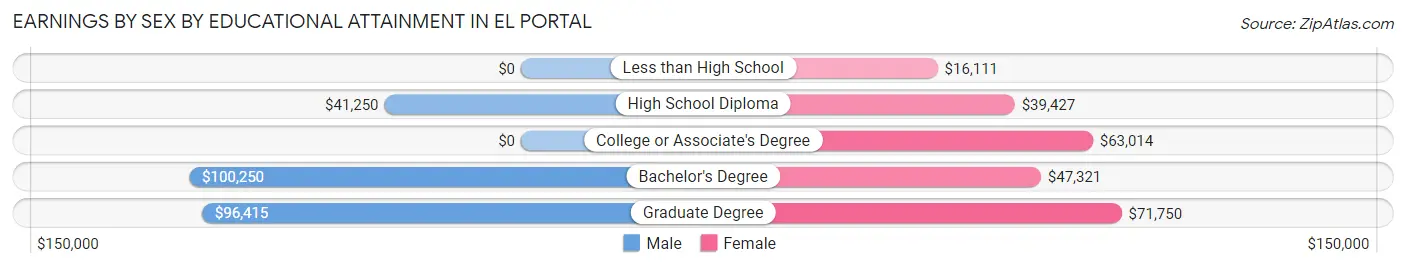
Earnings by Sex by Educational Attainment in El Portal
Average earnings in El Portal are $90,708 for men and $59,464 for women, a difference of 34.4%. Men with an educational attainment of bachelor's degree enjoy the highest average annual earnings of $100,250, while those with high school diploma education earn the least with $41,250. Women with an educational attainment of graduate degree earn the most with the average annual earnings of $71,750, while those with less than high school education have the smallest earnings of $16,111.
| Educational Attainment | Male Income | Female Income |
| Less than High School | - | - |
| High School Diploma | $41,250 | $39,427 |
| College or Associate's Degree | - | - |
| Bachelor's Degree | $100,250 | $47,321 |
| Graduate Degree | $96,415 | $71,750 |
| Total | $90,708 | $59,464 |
Family Income in El Portal
Family Income Brackets in El Portal
According to the El Portal family income data, there are 96 families falling into the $150,000 to $199,999 income range, which is the most common income bracket and makes up 20.5% of all families.
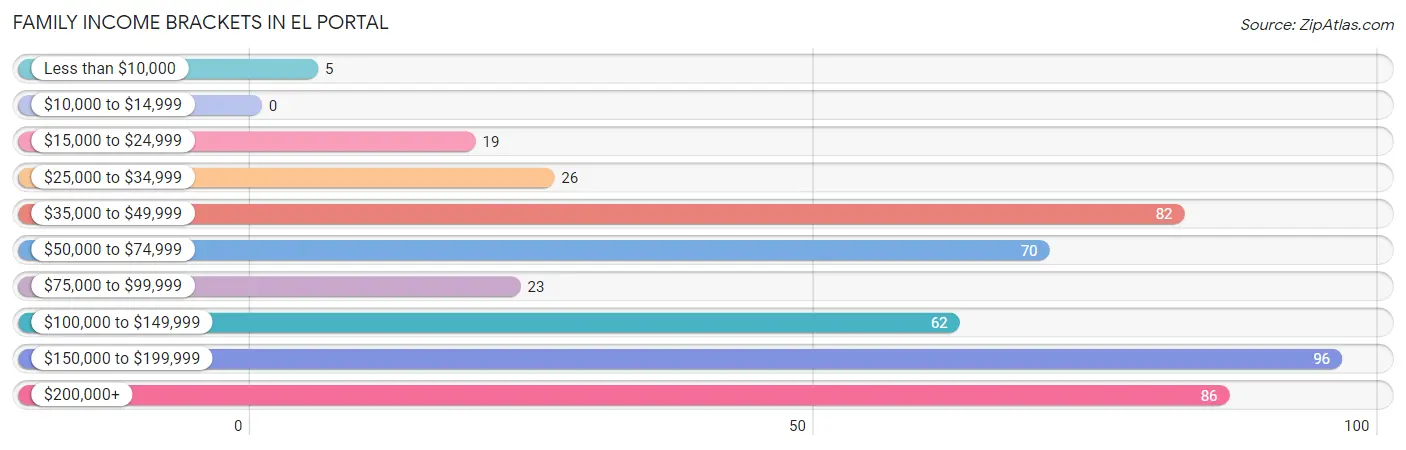
| Income Bracket | # Families | % Families |
| Less than $10,000 | 5 | 1.1% |
| $10,000 to $14,999 | 0 | 0.0% |
| $15,000 to $24,999 | 19 | 4.1% |
| $25,000 to $34,999 | 26 | 5.5% |
| $35,000 to $49,999 | 82 | 17.5% |
| $50,000 to $74,999 | 70 | 14.9% |
| $75,000 to $99,999 | 23 | 4.9% |
| $100,000 to $149,999 | 62 | 13.2% |
| $150,000 to $199,999 | 96 | 20.5% |
| $200,000+ | 86 | 18.3% |
Family Income by Famaliy Size in El Portal
4-person families (73 | 15.6%) account for the highest median family income in El Portal with $184,861 per family, while 4-person families (73 | 15.6%) have the highest median income of $46,215 per family member.
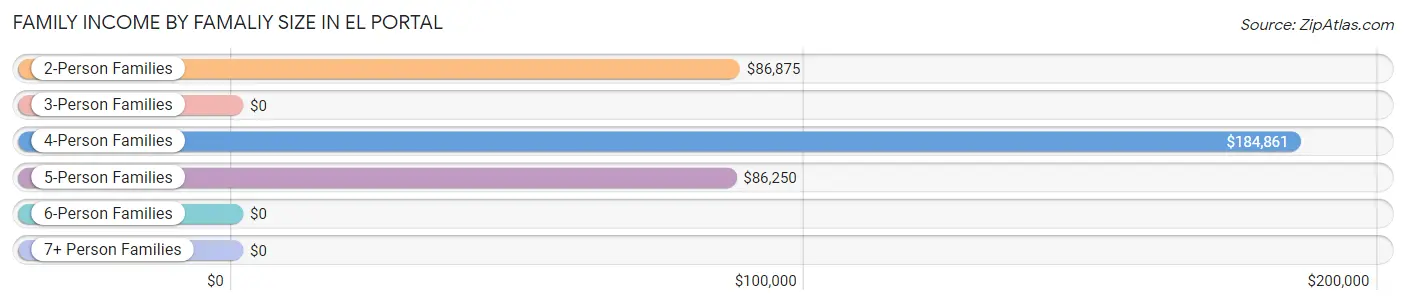
| Income Bracket | # Families | Median Income |
| 2-Person Families | 225 (48.0%) | $86,875 |
| 3-Person Families | 143 (30.5%) | $0 |
| 4-Person Families | 73 (15.6%) | $184,861 |
| 5-Person Families | 28 (6.0%) | $86,250 |
| 6-Person Families | 0 (0.0%) | $0 |
| 7+ Person Families | 0 (0.0%) | $0 |
| Total | 469 (100.0%) | $103,631 |
Family Income by Number of Earners in El Portal
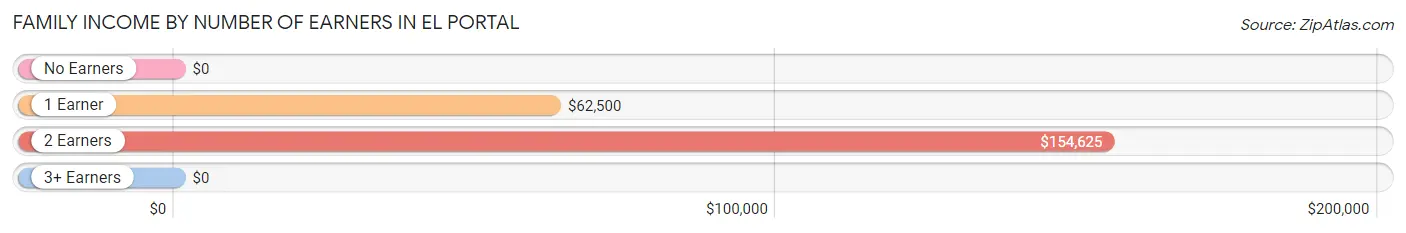
| Number of Earners | # Families | Median Income |
| No Earners | 27 (5.8%) | $0 |
| 1 Earner | 174 (37.1%) | $62,500 |
| 2 Earners | 233 (49.7%) | $154,625 |
| 3+ Earners | 35 (7.5%) | $0 |
| Total | 469 (100.0%) | $103,631 |
Household Income in El Portal
Household Income Brackets in El Portal
With 209 households falling in the category, the $150,000 to $199,999 income range is the most frequent in El Portal, accounting for 25.9% of all households.
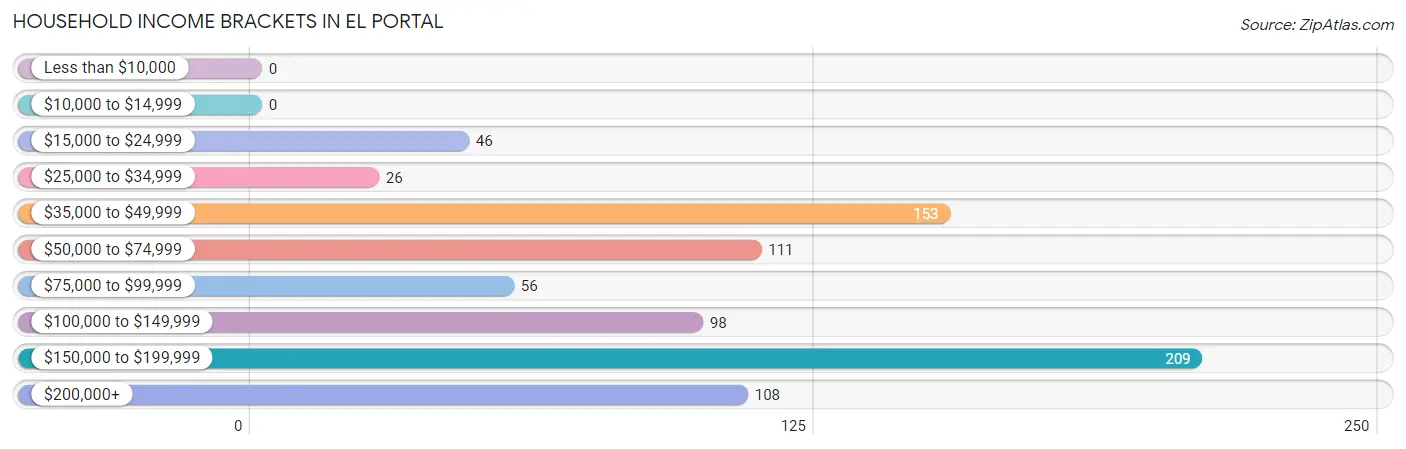
| Income Bracket | # Households | % Households |
| Less than $10,000 | 0 | 0.0% |
| $10,000 to $14,999 | 0 | 0.0% |
| $15,000 to $24,999 | 46 | 5.7% |
| $25,000 to $34,999 | 26 | 3.2% |
| $35,000 to $49,999 | 153 | 19.0% |
| $50,000 to $74,999 | 111 | 13.8% |
| $75,000 to $99,999 | 56 | 6.9% |
| $100,000 to $149,999 | 98 | 12.1% |
| $150,000 to $199,999 | 209 | 25.9% |
| $200,000+ | 108 | 13.4% |
Household Income by Householder Age in El Portal
The median household income in El Portal is $102,614, with the highest median household income of $104,856 found in the 45 to 64 years age bracket for the primary householder. A total of 385 households (47.7%) fall into this category.
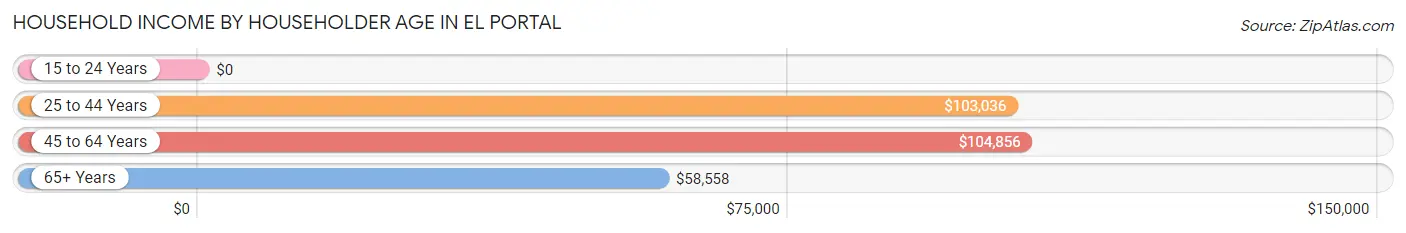
| Income Bracket | # Households | Median Income |
| 15 to 24 Years | 0 (0.0%) | $0 |
| 25 to 44 Years | 321 (39.8%) | $103,036 |
| 45 to 64 Years | 385 (47.7%) | $104,856 |
| 65+ Years | 101 (12.5%) | $58,558 |
| Total | 807 (100.0%) | $102,614 |
Poverty in El Portal
Income Below Poverty by Sex and Age in El Portal
With 4.0% poverty level for males and 2.6% for females among the residents of El Portal, 65 to 74 year old males and 75 year old and over females are the most vulnerable to poverty, with 4 males (13.8%) and 14 females (23.3%) in their respective age groups living below the poverty level.
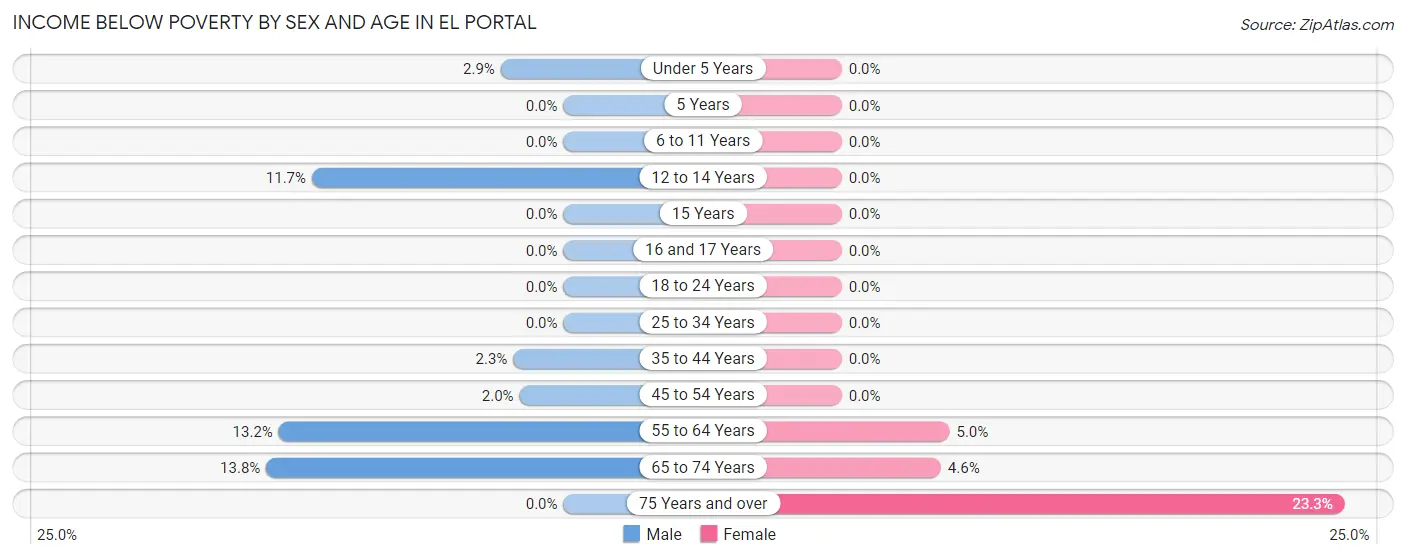
| Age Bracket | Male | Female |
| Under 5 Years | 5 (2.9%) | 0 (0.0%) |
| 5 Years | 0 (0.0%) | 0 (0.0%) |
| 6 to 11 Years | 0 (0.0%) | 0 (0.0%) |
| 12 to 14 Years | 7 (11.7%) | 0 (0.0%) |
| 15 Years | 0 (0.0%) | 0 (0.0%) |
| 16 and 17 Years | 0 (0.0%) | 0 (0.0%) |
| 18 to 24 Years | 0 (0.0%) | 0 (0.0%) |
| 25 to 34 Years | 0 (0.0%) | 0 (0.0%) |
| 35 to 44 Years | 6 (2.3%) | 0 (0.0%) |
| 45 to 54 Years | 4 (2.0%) | 0 (0.0%) |
| 55 to 64 Years | 14 (13.2%) | 5 (5.0%) |
| 65 to 74 Years | 4 (13.8%) | 4 (4.6%) |
| 75 Years and over | 0 (0.0%) | 14 (23.3%) |
| Total | 40 (4.0%) | 23 (2.6%) |
Income Above Poverty by Sex and Age in El Portal
According to the poverty statistics in El Portal, males aged 5 years and females aged under 5 years are the age groups that are most secure financially, with 100.0% of males and 100.0% of females in these age groups living above the poverty line.
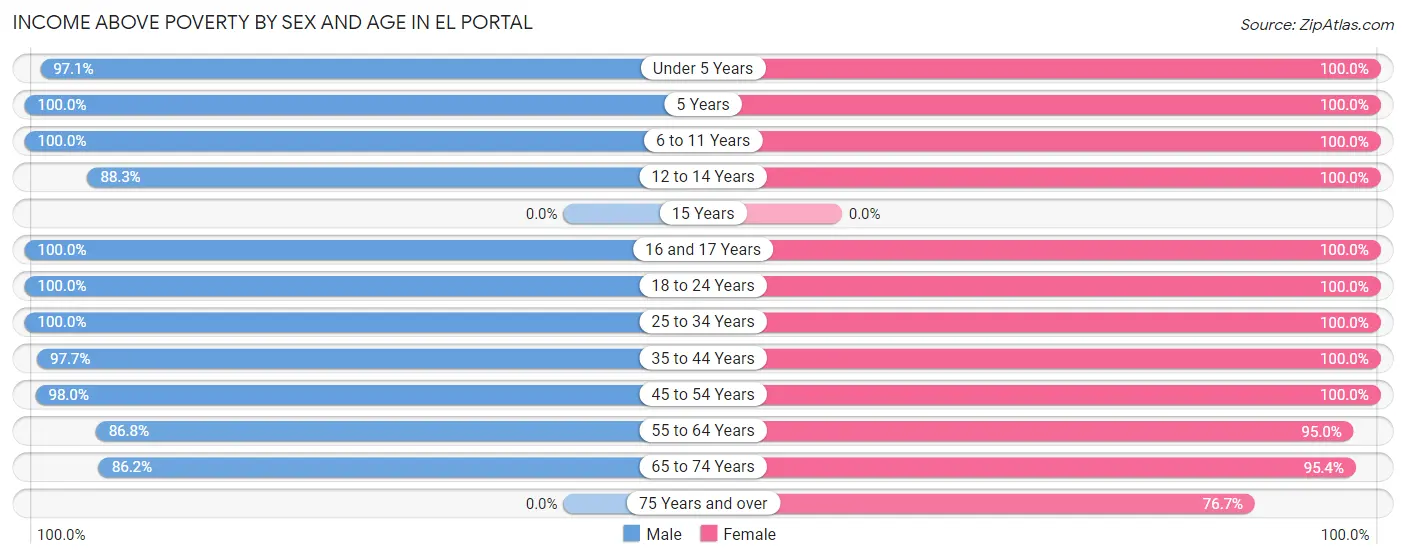
| Age Bracket | Male | Female |
| Under 5 Years | 167 (97.1%) | 46 (100.0%) |
| 5 Years | 23 (100.0%) | 12 (100.0%) |
| 6 to 11 Years | 29 (100.0%) | 28 (100.0%) |
| 12 to 14 Years | 53 (88.3%) | 24 (100.0%) |
| 15 Years | 0 (0.0%) | 0 (0.0%) |
| 16 and 17 Years | 34 (100.0%) | 61 (100.0%) |
| 18 to 24 Years | 38 (100.0%) | 5 (100.0%) |
| 25 to 34 Years | 66 (100.0%) | 92 (100.0%) |
| 35 to 44 Years | 252 (97.7%) | 182 (100.0%) |
| 45 to 54 Years | 192 (98.0%) | 196 (100.0%) |
| 55 to 64 Years | 92 (86.8%) | 95 (95.0%) |
| 65 to 74 Years | 25 (86.2%) | 83 (95.4%) |
| 75 Years and over | 0 (0.0%) | 46 (76.7%) |
| Total | 971 (96.0%) | 870 (97.4%) |
Income Below Poverty Among Married-Couple Families in El Portal
The poverty statistics for married-couple families in El Portal show that 1.3% or 4 of the total 302 families live below the poverty line. Families with 1 or 2 children have the highest poverty rate of 2.6%, comprising of 4 families. On the other hand, families with no children have the lowest poverty rate of 0.0%, which includes 0 families.
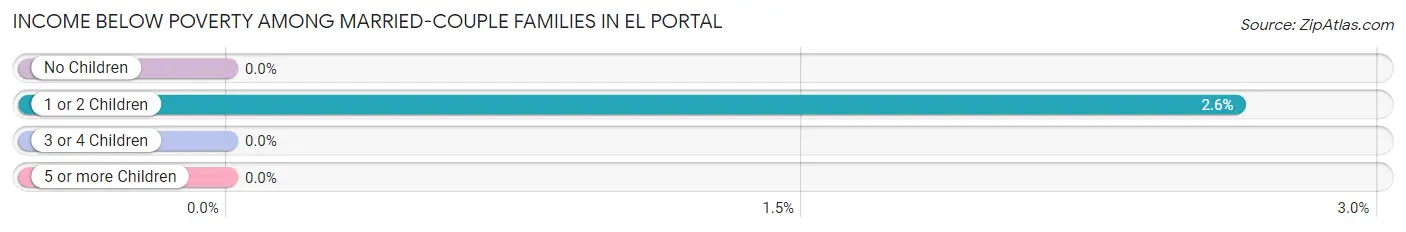
| Children | Above Poverty | Below Poverty |
| No Children | 127 (100.0%) | 0 (0.0%) |
| 1 or 2 Children | 148 (97.4%) | 4 (2.6%) |
| 3 or 4 Children | 23 (100.0%) | 0 (0.0%) |
| 5 or more Children | 0 (0.0%) | 0 (0.0%) |
| Total | 298 (98.7%) | 4 (1.3%) |
Income Below Poverty Among Single-Parent Households in El Portal
According to the poverty data in El Portal, 42.4% or 14 single-father households and 3.7% or 5 single-mother households are living below the poverty line. Among single-father households, those with no children have the highest poverty rate, with 14 households (48.3%) experiencing poverty. Likewise, among single-mother households, those with 1 or 2 children have the highest poverty rate, with 5 households (5.9%) falling below the poverty line.
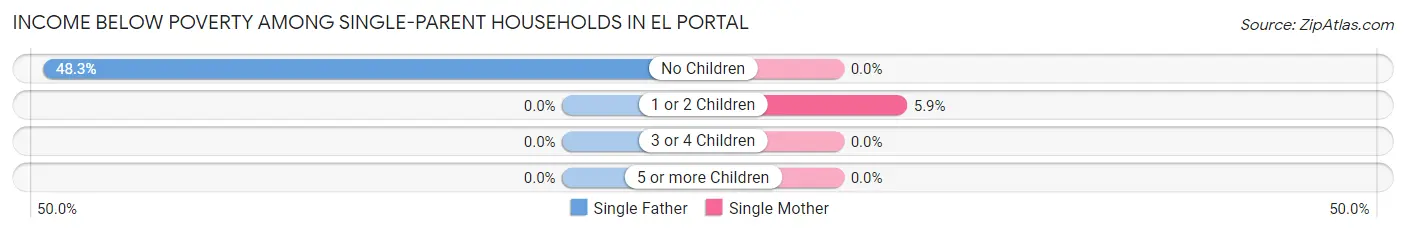
| Children | Single Father | Single Mother |
| No Children | 14 (48.3%) | 0 (0.0%) |
| 1 or 2 Children | 0 (0.0%) | 5 (5.9%) |
| 3 or 4 Children | 0 (0.0%) | 0 (0.0%) |
| 5 or more Children | 0 (0.0%) | 0 (0.0%) |
| Total | 14 (42.4%) | 5 (3.7%) |
Income Below Poverty Among Married-Couple vs Single-Parent Households in El Portal
The poverty data for El Portal shows that 4 of the married-couple family households (1.3%) and 19 of the single-parent households (11.4%) are living below the poverty level. Within the married-couple family households, those with 1 or 2 children have the highest poverty rate, with 4 households (2.6%) falling below the poverty line. Among the single-parent households, those with no children have the highest poverty rate, with 14 household (17.9%) living below poverty.
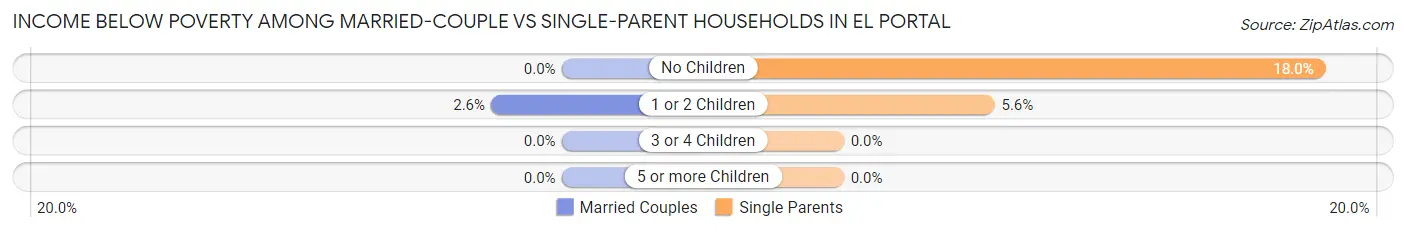
| Children | Married-Couple Families | Single-Parent Households |
| No Children | 0 (0.0%) | 14 (17.9%) |
| 1 or 2 Children | 4 (2.6%) | 5 (5.6%) |
| 3 or 4 Children | 0 (0.0%) | 0 (0.0%) |
| 5 or more Children | 0 (0.0%) | 0 (0.0%) |
| Total | 4 (1.3%) | 19 (11.4%) |
Race in El Portal
The most populous races in El Portal are White / Caucasian (765 | 40.2%), Hispanic or Latino (656 | 34.4%), and Black / African American (606 | 31.8%).
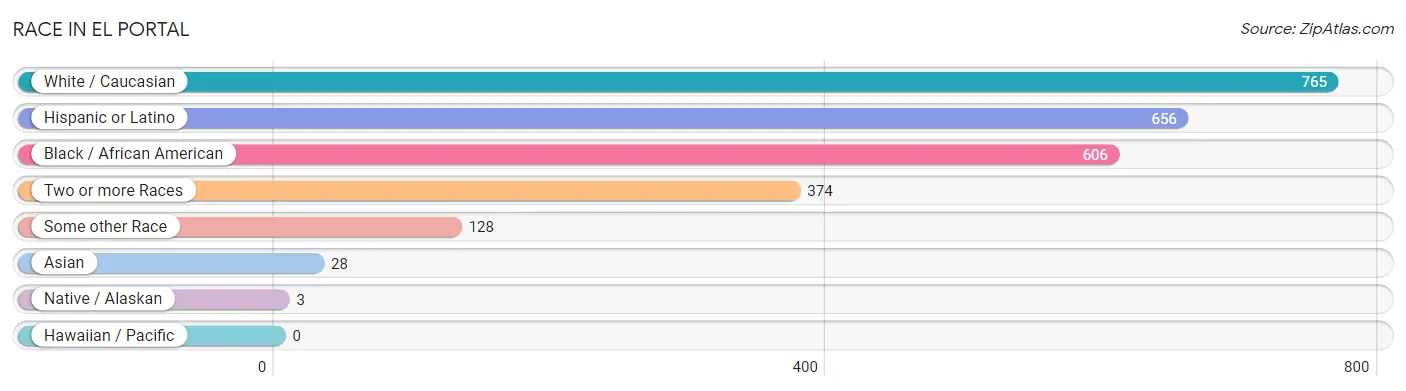
| Race | # Population | % Population |
| Asian | 28 | 1.5% |
| Black / African American | 606 | 31.8% |
| Hawaiian / Pacific | 0 | 0.0% |
| Hispanic or Latino | 656 | 34.4% |
| Native / Alaskan | 3 | 0.2% |
| White / Caucasian | 765 | 40.2% |
| Two or more Races | 374 | 19.6% |
| Some other Race | 128 | 6.7% |
| Total | 1,904 | 100.0% |
Ancestry in El Portal
The most populous ancestries reported in El Portal are South American (266 | 14.0%), Haitian (248 | 13.0%), American (135 | 7.1%), Chilean (114 | 6.0%), and Cuban (114 | 6.0%), together accounting for 46.1% of all El Portal residents.
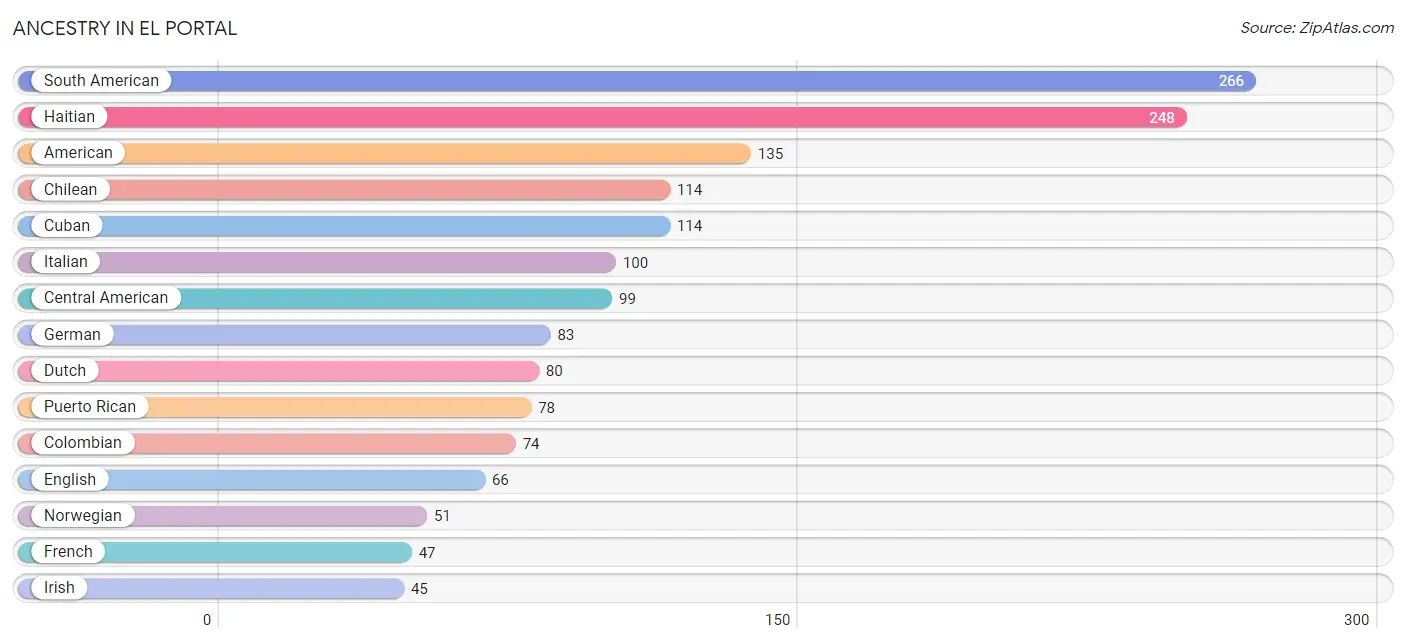
| Ancestry | # Population | % Population |
| American | 135 | 7.1% |
| Argentinean | 26 | 1.4% |
| Bahamian | 19 | 1.0% |
| Brazilian | 3 | 0.2% |
| British | 9 | 0.5% |
| British West Indian | 4 | 0.2% |
| Burmese | 12 | 0.6% |
| Central American | 99 | 5.2% |
| Cheyenne | 3 | 0.2% |
| Chilean | 114 | 6.0% |
| Colombian | 74 | 3.9% |
| Costa Rican | 28 | 1.5% |
| Cuban | 114 | 6.0% |
| Czech | 10 | 0.5% |
| Czechoslovakian | 7 | 0.4% |
| Danish | 9 | 0.5% |
| Dominican | 12 | 0.6% |
| Dutch | 80 | 4.2% |
| Eastern European | 4 | 0.2% |
| Ecuadorian | 1 | 0.1% |
| English | 66 | 3.5% |
| Ethiopian | 7 | 0.4% |
| European | 4 | 0.2% |
| Finnish | 4 | 0.2% |
| French | 47 | 2.5% |
| French Canadian | 6 | 0.3% |
| German | 83 | 4.4% |
| Greek | 14 | 0.7% |
| Guatemalan | 14 | 0.7% |
| Haitian | 248 | 13.0% |
| Honduran | 20 | 1.1% |
| Hungarian | 12 | 0.6% |
| Icelander | 6 | 0.3% |
| Indonesian | 13 | 0.7% |
| Irish | 45 | 2.4% |
| Italian | 100 | 5.2% |
| Mexican | 27 | 1.4% |
| New Zealander | 7 | 0.4% |
| Nicaraguan | 6 | 0.3% |
| Norwegian | 51 | 2.7% |
| Panamanian | 17 | 0.9% |
| Peruvian | 28 | 1.5% |
| Polish | 18 | 0.9% |
| Puerto Rican | 78 | 4.1% |
| Salvadoran | 14 | 0.7% |
| Scotch-Irish | 3 | 0.2% |
| Scottish | 9 | 0.5% |
| South American | 266 | 14.0% |
| Spaniard | 21 | 1.1% |
| Spanish | 35 | 1.8% |
| Subsaharan African | 7 | 0.4% |
| Swedish | 13 | 0.7% |
| Thai | 34 | 1.8% |
| Turkish | 1 | 0.1% |
| Venezuelan | 23 | 1.2% |
| West Indian | 5 | 0.3% | View All 56 Rows |
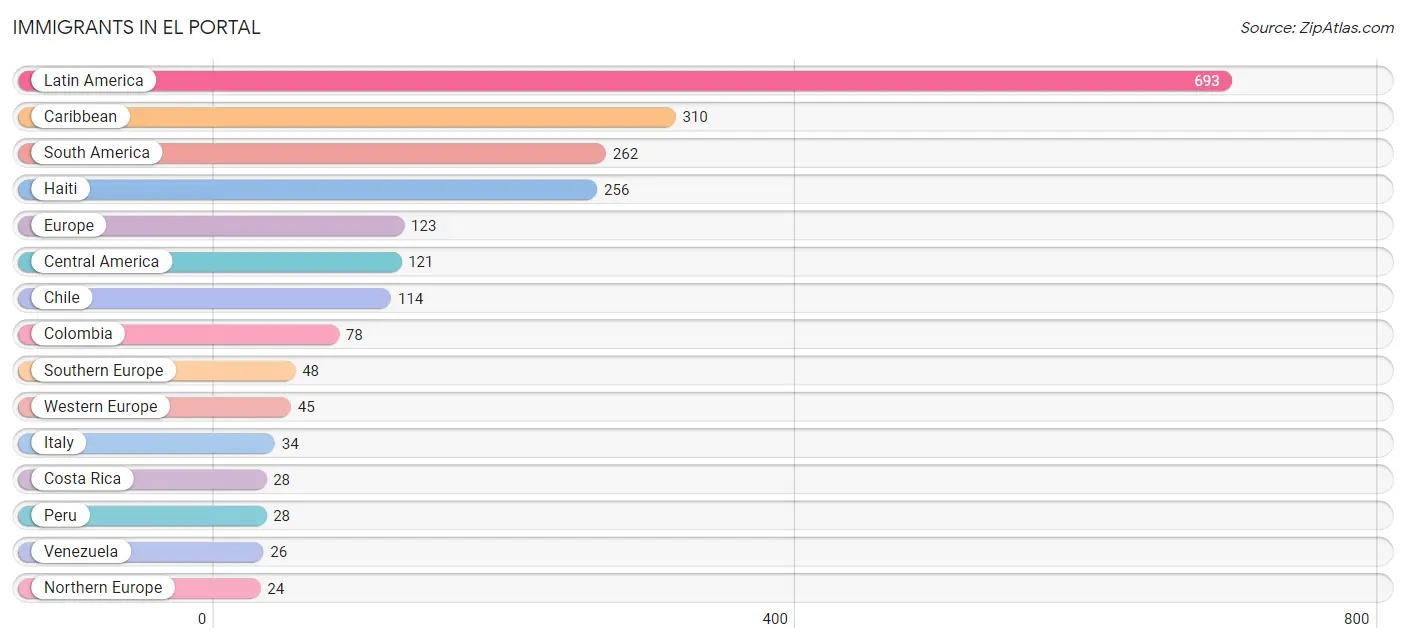
Immigrants in El Portal
The most numerous immigrant groups reported in El Portal came from Latin America (693 | 36.4%), Caribbean (310 | 16.3%), South America (262 | 13.8%), Haiti (256 | 13.5%), and Europe (123 | 6.5%), together accounting for 86.3% of all El Portal residents.
| Immigration Origin | # Population | % Population |
| Argentina | 7 | 0.4% |
| Asia | 10 | 0.5% |
| Australia | 6 | 0.3% |
| Bahamas | 13 | 0.7% |
| Brazil | 3 | 0.2% |
| Caribbean | 310 | 16.3% |
| Central America | 121 | 6.4% |
| Chile | 114 | 6.0% |
| Colombia | 78 | 4.1% |
| Costa Rica | 28 | 1.5% |
| Cuba | 23 | 1.2% |
| Czechoslovakia | 6 | 0.3% |
| Dominican Republic | 4 | 0.2% |
| Eastern Asia | 6 | 0.3% |
| Eastern Europe | 6 | 0.3% |
| Ecuador | 1 | 0.1% |
| El Salvador | 17 | 0.9% |
| England | 9 | 0.5% |
| Europe | 123 | 6.5% |
| France | 11 | 0.6% |
| Germany | 19 | 1.0% |
| Greece | 14 | 0.7% |
| Guatemala | 9 | 0.5% |
| Haiti | 256 | 13.5% |
| Honduras | 20 | 1.1% |
| Italy | 34 | 1.8% |
| Korea | 6 | 0.3% |
| Latin America | 693 | 36.4% |
| Mexico | 17 | 0.9% |
| Netherlands | 15 | 0.8% |
| Nicaragua | 7 | 0.4% |
| Northern Europe | 24 | 1.3% |
| Oceania | 15 | 0.8% |
| Panama | 23 | 1.2% |
| Peru | 28 | 1.5% |
| South America | 262 | 13.8% |
| South Eastern Asia | 3 | 0.2% |
| Southern Europe | 48 | 2.5% |
| Trinidad and Tobago | 10 | 0.5% |
| Turkey | 1 | 0.1% |
| Uruguay | 5 | 0.3% |
| Venezuela | 26 | 1.4% |
| Western Asia | 1 | 0.1% |
| Western Europe | 45 | 2.4% | View All 44 Rows |
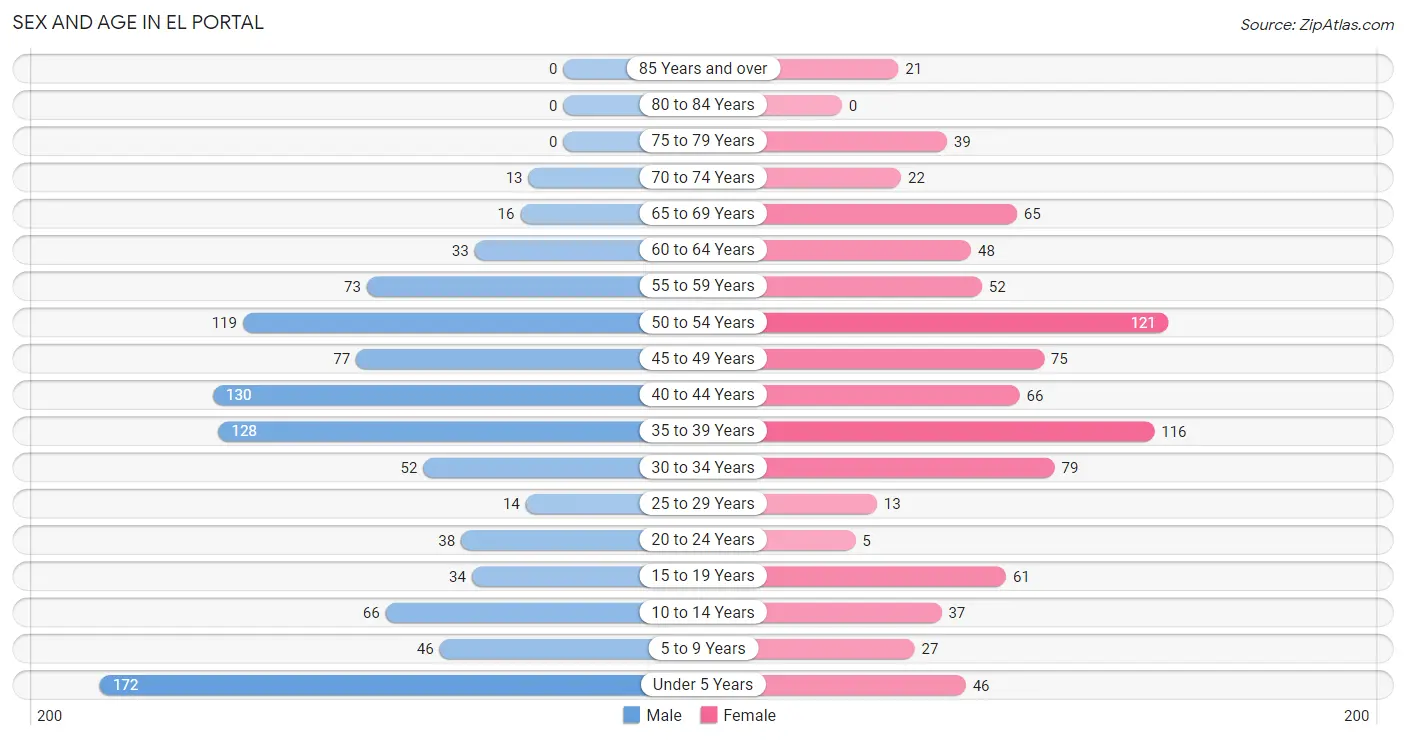
Sex and Age in El Portal
Sex and Age in El Portal
The most populous age groups in El Portal are Under 5 Years (172 | 17.0%) for men and 50 to 54 Years (121 | 13.6%) for women.
| Age Bracket | Male | Female |
| Under 5 Years | 172 (17.0%) | 46 (5.1%) |
| 5 to 9 Years | 46 (4.5%) | 27 (3.0%) |
| 10 to 14 Years | 66 (6.5%) | 37 (4.1%) |
| 15 to 19 Years | 34 (3.4%) | 61 (6.8%) |
| 20 to 24 Years | 38 (3.8%) | 5 (0.6%) |
| 25 to 29 Years | 14 (1.4%) | 13 (1.5%) |
| 30 to 34 Years | 52 (5.1%) | 79 (8.8%) |
| 35 to 39 Years | 128 (12.7%) | 116 (13.0%) |
| 40 to 44 Years | 130 (12.9%) | 66 (7.4%) |
| 45 to 49 Years | 77 (7.6%) | 75 (8.4%) |
| 50 to 54 Years | 119 (11.8%) | 121 (13.6%) |
| 55 to 59 Years | 73 (7.2%) | 52 (5.8%) |
| 60 to 64 Years | 33 (3.3%) | 48 (5.4%) |
| 65 to 69 Years | 16 (1.6%) | 65 (7.3%) |
| 70 to 74 Years | 13 (1.3%) | 22 (2.5%) |
| 75 to 79 Years | 0 (0.0%) | 39 (4.4%) |
| 80 to 84 Years | 0 (0.0%) | 0 (0.0%) |
| 85 Years and over | 0 (0.0%) | 21 (2.4%) |
| Total | 1,011 (100.0%) | 893 (100.0%) |
Families and Households in El Portal
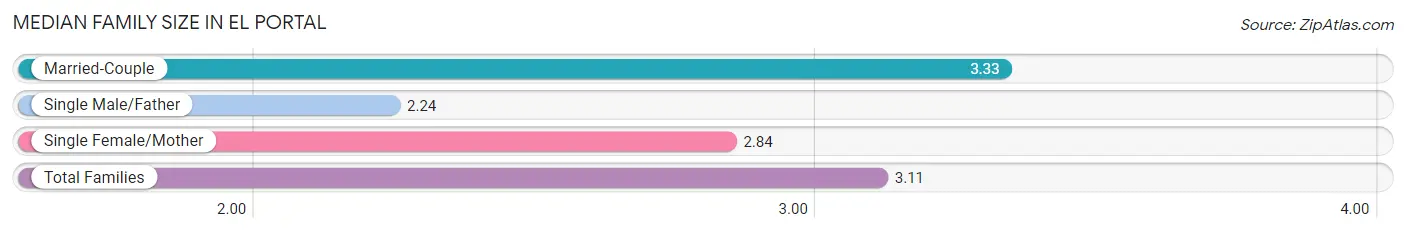
Median Family Size in El Portal
The median family size in El Portal is 3.11 persons per family, with married-couple families (302 | 64.4%) accounting for the largest median family size of 3.33 persons per family. On the other hand, single male/father families (33 | 7.0%) represent the smallest median family size with 2.24 persons per family.
| Family Type | # Families | Family Size |
| Married-Couple | 302 (64.4%) | 3.33 |
| Single Male/Father | 33 (7.0%) | 2.24 |
| Single Female/Mother | 134 (28.6%) | 2.84 |
| Total Families | 469 (100.0%) | 3.11 |
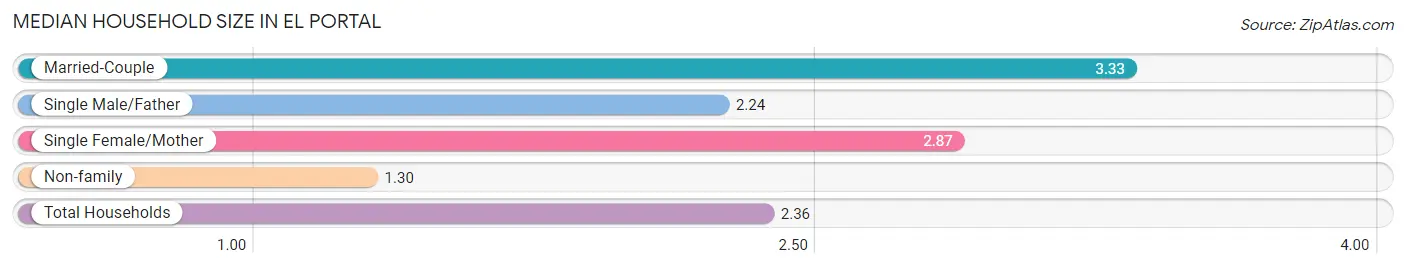
Median Household Size in El Portal
The median household size in El Portal is 2.36 persons per household, with married-couple households (302 | 37.4%) accounting for the largest median household size of 3.33 persons per household. non-family households (338 | 41.9%) represent the smallest median household size with 1.30 persons per household.
| Household Type | # Households | Household Size |
| Married-Couple | 302 (37.4%) | 3.33 |
| Single Male/Father | 33 (4.1%) | 2.24 |
| Single Female/Mother | 134 (16.6%) | 2.87 |
| Non-family | 338 (41.9%) | 1.30 |
| Total Households | 807 (100.0%) | 2.36 |
Household Size by Marriage Status in El Portal
Out of a total of 807 households in El Portal, 469 (58.1%) are family households, while 338 (41.9%) are nonfamily households. The most numerous type of family households are 2-person households, comprising 220, and the most common type of nonfamily households are 1-person households, comprising 187.
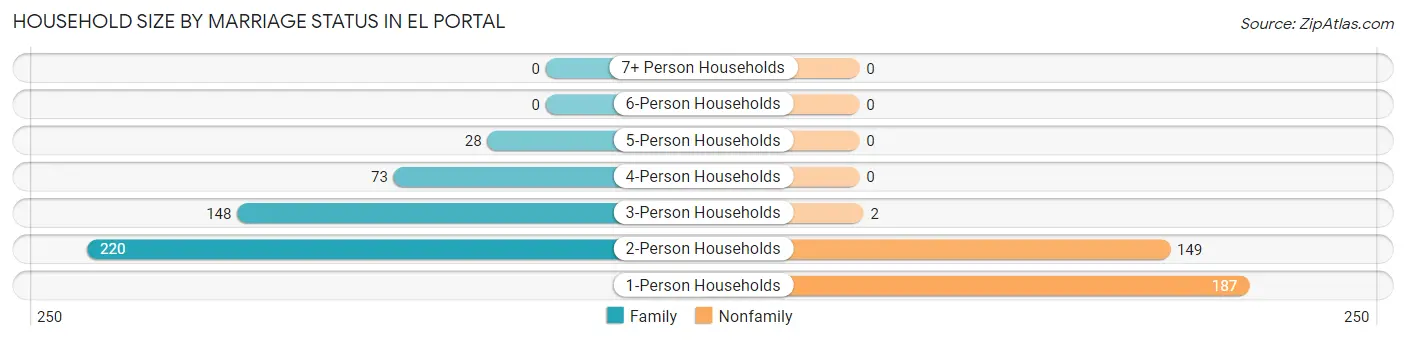
| Household Size | Family Households | Nonfamily Households |
| 1-Person Households | - | 187 (23.2%) |
| 2-Person Households | 220 (27.3%) | 149 (18.5%) |
| 3-Person Households | 148 (18.3%) | 2 (0.3%) |
| 4-Person Households | 73 (9.0%) | 0 (0.0%) |
| 5-Person Households | 28 (3.5%) | 0 (0.0%) |
| 6-Person Households | 0 (0.0%) | 0 (0.0%) |
| 7+ Person Households | 0 (0.0%) | 0 (0.0%) |
| Total | 469 (58.1%) | 338 (41.9%) |
Female Fertility in El Portal
Fertility by Age in El Portal
Average fertility rate in El Portal is 77.0 births per 1,000 women. Women in the age bracket of 20 to 34 years have the highest fertility rate with 289.0 births per 1,000 women. Women in the age bracket of 20 to 34 years acount for 84.9% of all women with births.
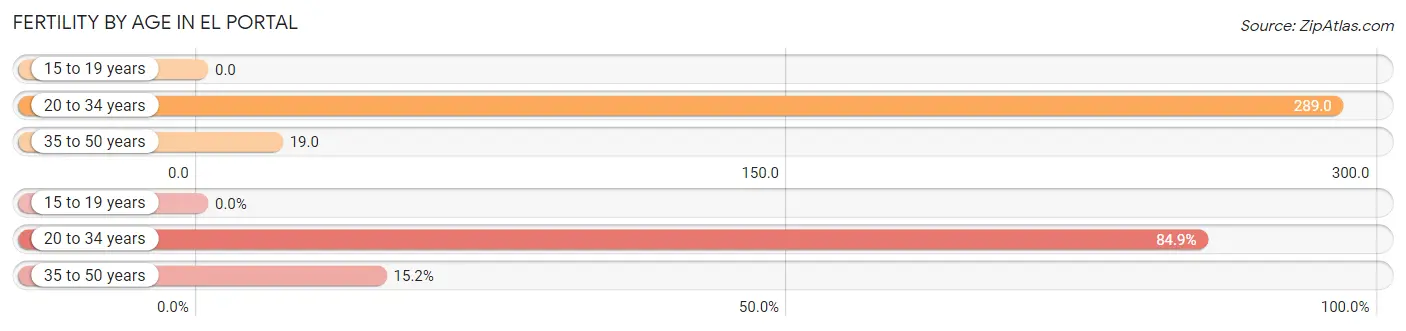
| Age Bracket | Women with Births | Births / 1,000 Women |
| 15 to 19 years | 0 (0.0%) | 0.0 |
| 20 to 34 years | 28 (84.9%) | 289.0 |
| 35 to 50 years | 5 (15.1%) | 19.0 |
| Total | 33 (100.0%) | 77.0 |
Fertility by Age by Marriage Status in El Portal
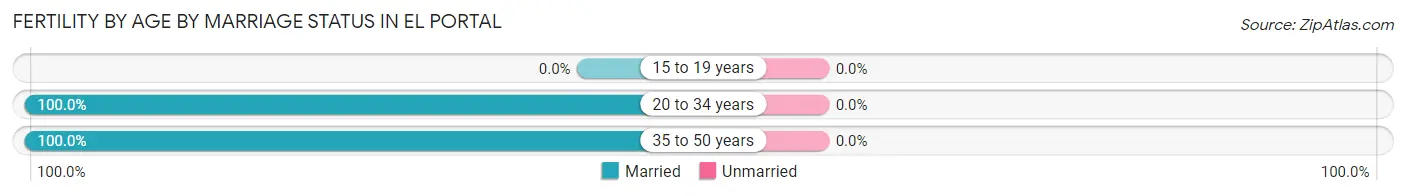
| Age Bracket | Married | Unmarried |
| 15 to 19 years | 0 (0.0%) | 0 (0.0%) |
| 20 to 34 years | 28 (100.0%) | 0 (0.0%) |
| 35 to 50 years | 5 (100.0%) | 0 (0.0%) |
| Total | 33 (100.0%) | 0 (0.0%) |
Fertility by Education in El Portal
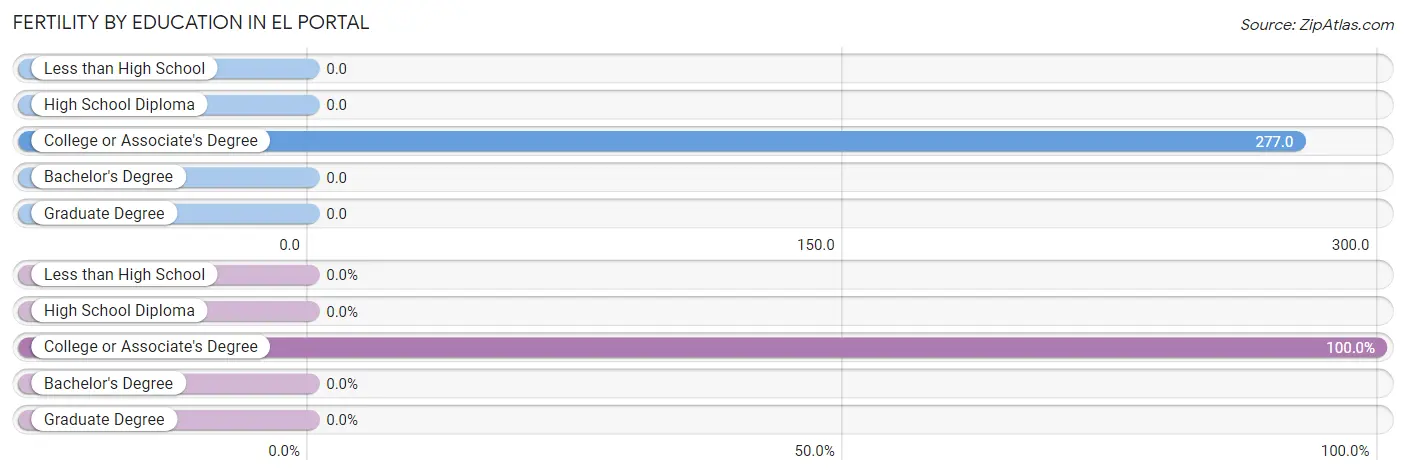
| Educational Attainment | Women with Births | Births / 1,000 Women |
| Less than High School | 0 (0.0%) | 0.0 |
| High School Diploma | 0 (0.0%) | 0.0 |
| College or Associate's Degree | 33 (100.0%) | 277.0 |
| Bachelor's Degree | 0 (0.0%) | 0.0 |
| Graduate Degree | 0 (0.0%) | 0.0 |
| Total | 33 (100.0%) | 77.0 |
Fertility by Education by Marriage Status in El Portal
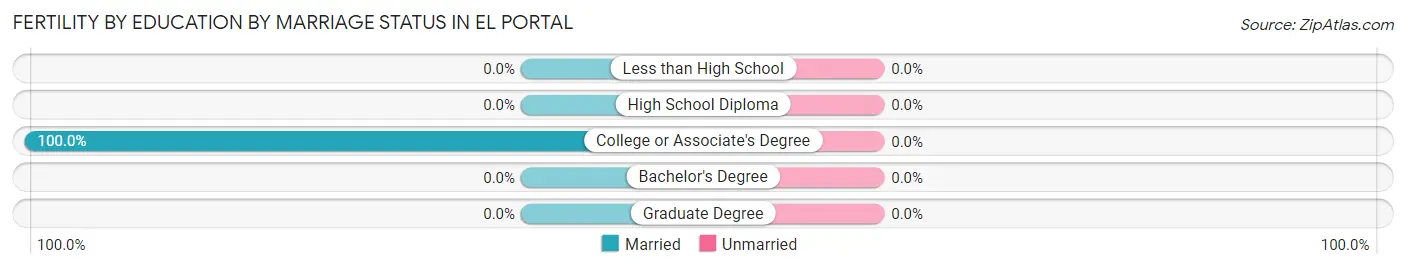
| Educational Attainment | Married | Unmarried |
| Less than High School | 0 (0.0%) | 0 (0.0%) |
| High School Diploma | 0 (0.0%) | 0 (0.0%) |
| College or Associate's Degree | 33 (100.0%) | 0 (0.0%) |
| Bachelor's Degree | 0 (0.0%) | 0 (0.0%) |
| Graduate Degree | 0 (0.0%) | 0 (0.0%) |
| Total | 33 (100.0%) | 0 (0.0%) |
Employment Characteristics in El Portal
Employment by Class of Employer in El Portal
Among the 1,153 employed individuals in El Portal, private company employees (869 | 75.4%), self-employed (incorporated) (104 | 9.0%), and self-employed (not incorporated) (57 | 4.9%) make up the most common classes of employment.
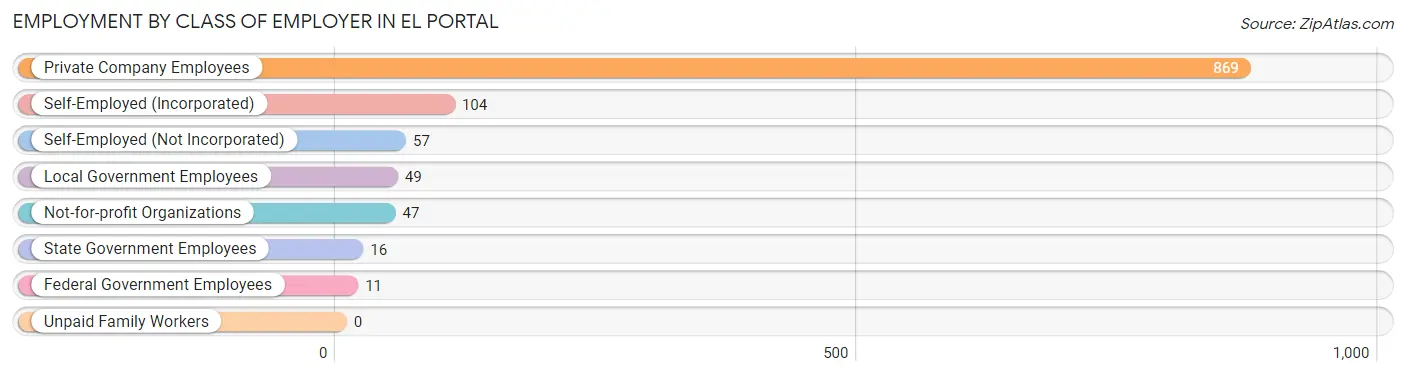
| Employer Class | # Employees | % Employees |
| Private Company Employees | 869 | 75.4% |
| Self-Employed (Incorporated) | 104 | 9.0% |
| Self-Employed (Not Incorporated) | 57 | 4.9% |
| Not-for-profit Organizations | 47 | 4.1% |
| Local Government Employees | 49 | 4.3% |
| State Government Employees | 16 | 1.4% |
| Federal Government Employees | 11 | 0.9% |
| Unpaid Family Workers | 0 | 0.0% |
| Total | 1,153 | 100.0% |
Employment Status by Age in El Portal
According to the labor force statistics for El Portal, out of the total population over 16 years of age (1,510), 77.9% or 1,176 individuals are in the labor force, with 2.0% or 24 of them unemployed. The age group with the highest labor force participation rate is 20 to 24 years, with 100.0% or 43 individuals in the labor force. Within the labor force, the 20 to 24 years age range has the highest percentage of unemployed individuals, with 11.6% or 5 of them being unemployed.
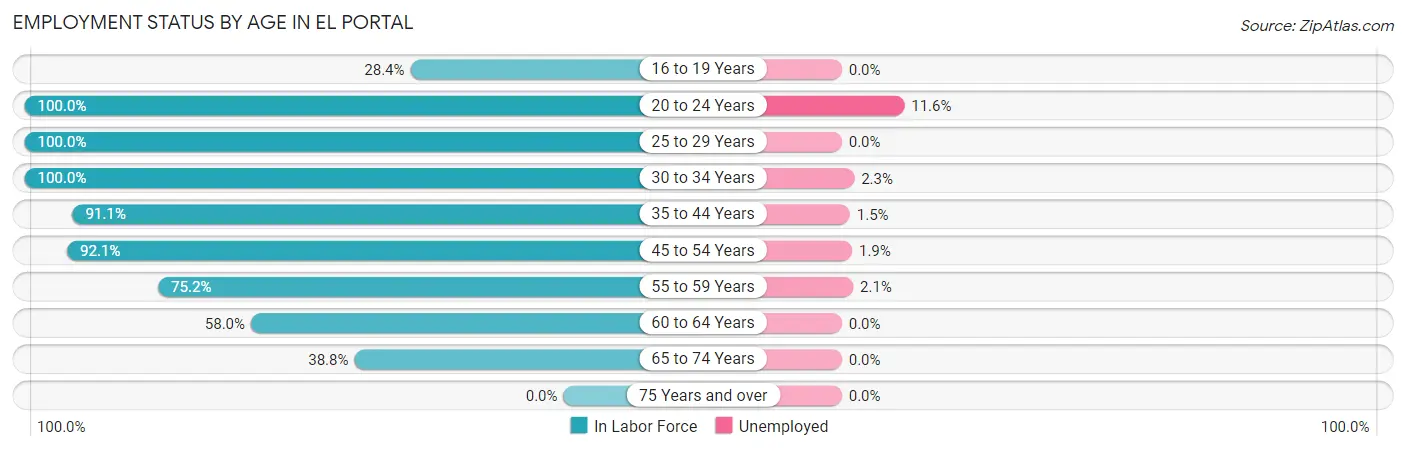
| Age Bracket | In Labor Force | Unemployed |
| 16 to 19 Years | 27 (28.4%) | 0 (0.0%) |
| 20 to 24 Years | 43 (100.0%) | 5 (11.6%) |
| 25 to 29 Years | 27 (100.0%) | 0 (0.0%) |
| 30 to 34 Years | 131 (100.0%) | 3 (2.3%) |
| 35 to 44 Years | 401 (91.1%) | 6 (1.5%) |
| 45 to 54 Years | 361 (92.1%) | 7 (1.9%) |
| 55 to 59 Years | 94 (75.2%) | 2 (2.1%) |
| 60 to 64 Years | 47 (58.0%) | 0 (0.0%) |
| 65 to 74 Years | 45 (38.8%) | 0 (0.0%) |
| 75 Years and over | 0 (0.0%) | 0 (0.0%) |
| Total | 1,176 (77.9%) | 24 (2.0%) |
Employment Status by Educational Attainment in El Portal
According to labor force statistics for El Portal, 88.7% of individuals (1,061) out of the total population between 25 and 64 years of age (1,196) are in the labor force, with 1.7% or 18 of them being unemployed. The group with the highest labor force participation rate are those with the educational attainment of bachelor's degree or higher, with 92.7% or 510 individuals in the labor force. Within the labor force, individuals with college / associate degree education have the highest percentage of unemployment, with 2.2% or 8 of them being unemployed.
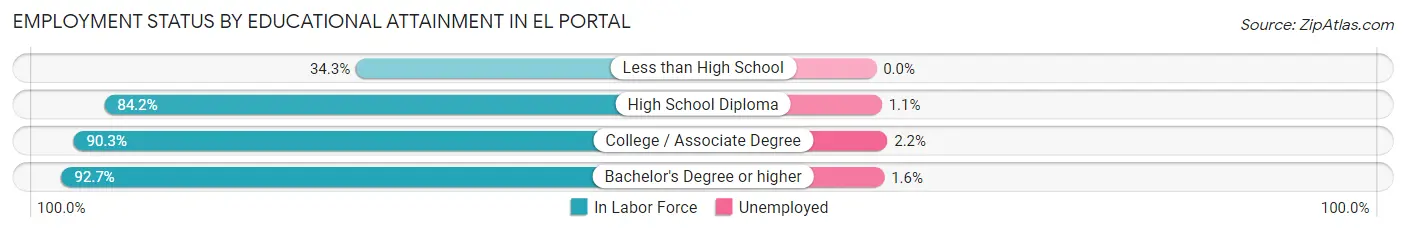
| Educational Attainment | In Labor Force | Unemployed |
| Less than High School | 12 (34.3%) | 0 (0.0%) |
| High School Diploma | 176 (84.2%) | 2 (1.1%) |
| College / Associate Degree | 363 (90.3%) | 9 (2.2%) |
| Bachelor's Degree or higher | 510 (92.7%) | 9 (1.6%) |
| Total | 1,061 (88.7%) | 20 (1.7%) |
Employment Occupations by Sex in El Portal
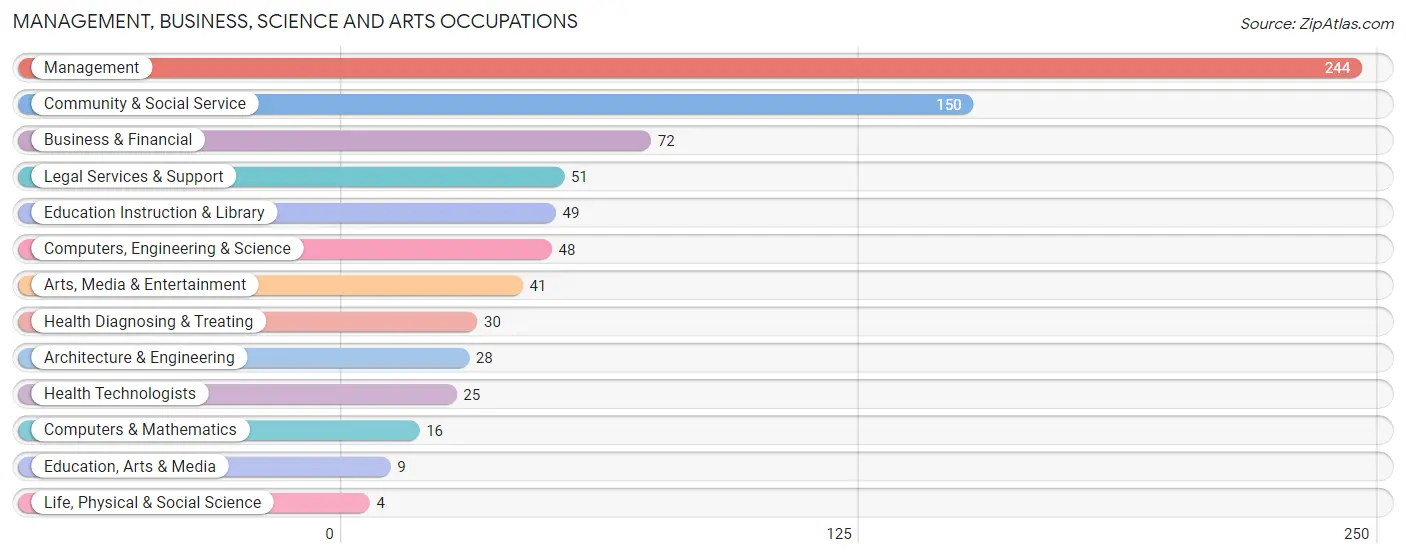
Management, Business, Science and Arts Occupations
The most common Management, Business, Science and Arts occupations in El Portal are Management (244 | 21.2%), Community & Social Service (150 | 13.0%), Business & Financial (72 | 6.2%), Legal Services & Support (51 | 4.4%), and Education Instruction & Library (49 | 4.3%).
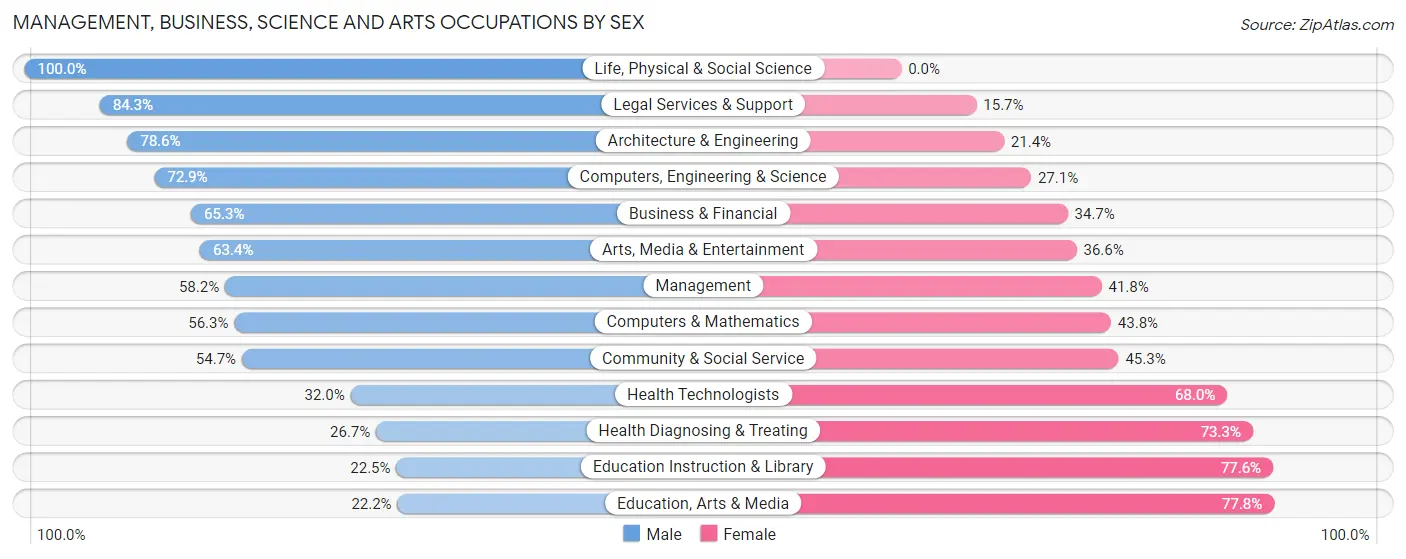
Management, Business, Science and Arts Occupations by Sex
Within the Management, Business, Science and Arts occupations in El Portal, the most male-oriented occupations are Life, Physical & Social Science (100.0%), Legal Services & Support (84.3%), and Architecture & Engineering (78.6%), while the most female-oriented occupations are Education, Arts & Media (77.8%), Education Instruction & Library (77.5%), and Health Diagnosing & Treating (73.3%).
| Occupation | Male | Female |
| Management | 142 (58.2%) | 102 (41.8%) |
| Business & Financial | 47 (65.3%) | 25 (34.7%) |
| Computers, Engineering & Science | 35 (72.9%) | 13 (27.1%) |
| Computers & Mathematics | 9 (56.2%) | 7 (43.8%) |
| Architecture & Engineering | 22 (78.6%) | 6 (21.4%) |
| Life, Physical & Social Science | 4 (100.0%) | 0 (0.0%) |
| Community & Social Service | 82 (54.7%) | 68 (45.3%) |
| Education, Arts & Media | 2 (22.2%) | 7 (77.8%) |
| Legal Services & Support | 43 (84.3%) | 8 (15.7%) |
| Education Instruction & Library | 11 (22.5%) | 38 (77.5%) |
| Arts, Media & Entertainment | 26 (63.4%) | 15 (36.6%) |
| Health Diagnosing & Treating | 8 (26.7%) | 22 (73.3%) |
| Health Technologists | 8 (32.0%) | 17 (68.0%) |
| Total (Category) | 314 (57.7%) | 230 (42.3%) |
| Total (Overall) | 629 (54.5%) | 524 (45.5%) |
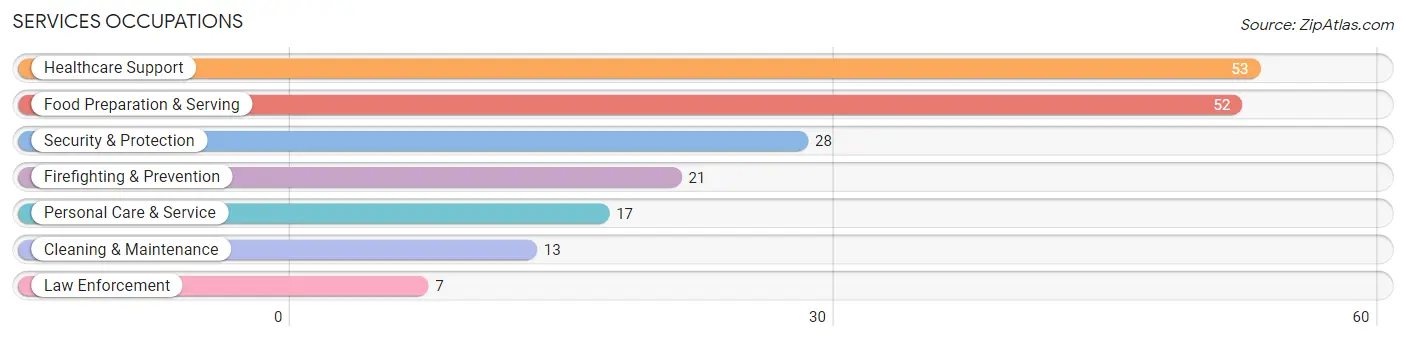
Services Occupations
The most common Services occupations in El Portal are Healthcare Support (53 | 4.6%), Food Preparation & Serving (52 | 4.5%), Security & Protection (28 | 2.4%), Firefighting & Prevention (21 | 1.8%), and Personal Care & Service (17 | 1.5%).
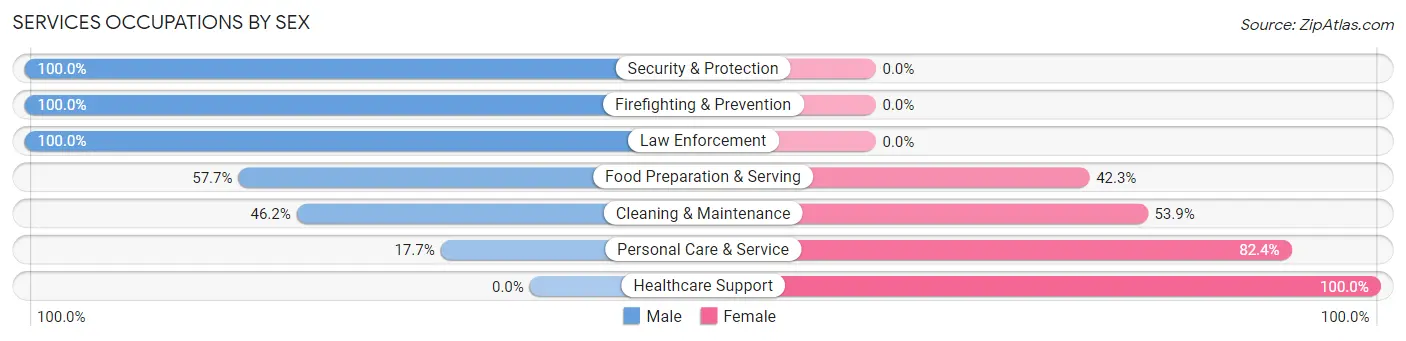
Services Occupations by Sex
Within the Services occupations in El Portal, the most male-oriented occupations are Security & Protection (100.0%), Firefighting & Prevention (100.0%), and Law Enforcement (100.0%), while the most female-oriented occupations are Healthcare Support (100.0%), Personal Care & Service (82.4%), and Cleaning & Maintenance (53.8%).
| Occupation | Male | Female |
| Healthcare Support | 0 (0.0%) | 53 (100.0%) |
| Security & Protection | 28 (100.0%) | 0 (0.0%) |
| Firefighting & Prevention | 21 (100.0%) | 0 (0.0%) |
| Law Enforcement | 7 (100.0%) | 0 (0.0%) |
| Food Preparation & Serving | 30 (57.7%) | 22 (42.3%) |
| Cleaning & Maintenance | 6 (46.2%) | 7 (53.8%) |
| Personal Care & Service | 3 (17.6%) | 14 (82.4%) |
| Total (Category) | 67 (41.1%) | 96 (58.9%) |
| Total (Overall) | 629 (54.5%) | 524 (45.5%) |
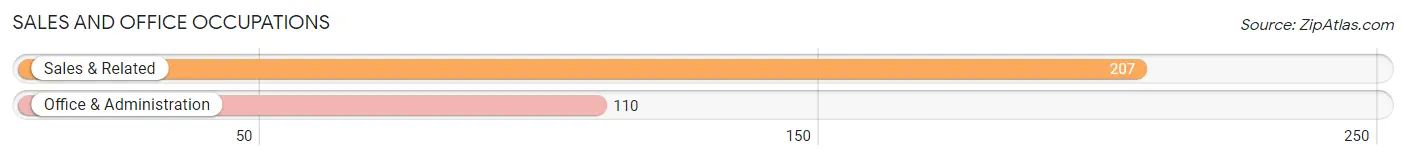
Sales and Office Occupations
The most common Sales and Office occupations in El Portal are Sales & Related (207 | 17.9%), and Office & Administration (110 | 9.5%).
Sales and Office Occupations by Sex
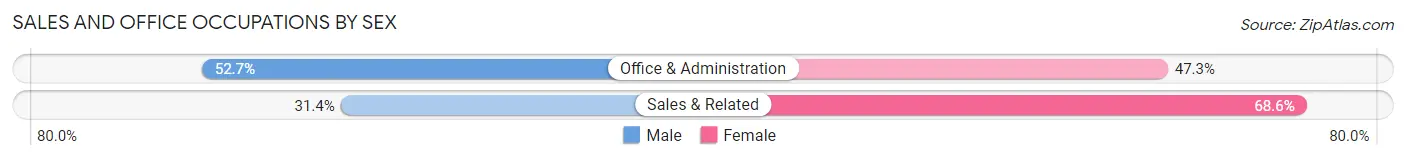
| Occupation | Male | Female |
| Sales & Related | 65 (31.4%) | 142 (68.6%) |
| Office & Administration | 58 (52.7%) | 52 (47.3%) |
| Total (Category) | 123 (38.8%) | 194 (61.2%) |
| Total (Overall) | 629 (54.5%) | 524 (45.5%) |
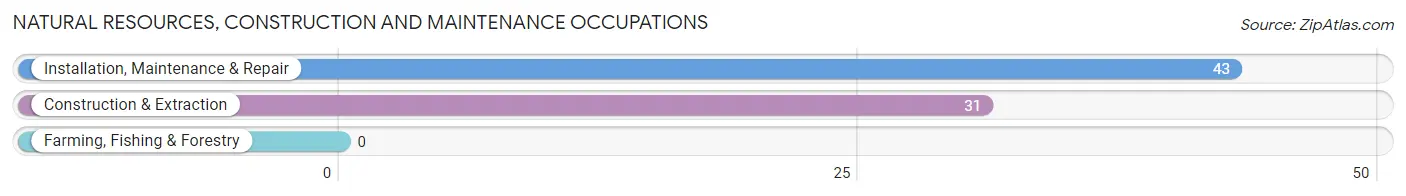
Natural Resources, Construction and Maintenance Occupations
The most common Natural Resources, Construction and Maintenance occupations in El Portal are Installation, Maintenance & Repair (43 | 3.7%), and Construction & Extraction (31 | 2.7%).
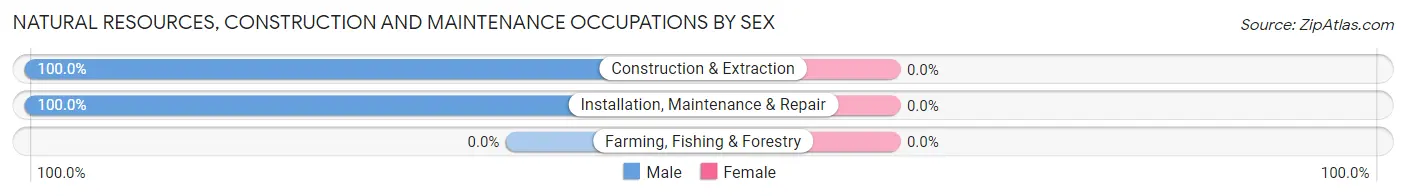
Natural Resources, Construction and Maintenance Occupations by Sex
| Occupation | Male | Female |
| Farming, Fishing & Forestry | 0 (0.0%) | 0 (0.0%) |
| Construction & Extraction | 31 (100.0%) | 0 (0.0%) |
| Installation, Maintenance & Repair | 43 (100.0%) | 0 (0.0%) |
| Total (Category) | 74 (100.0%) | 0 (0.0%) |
| Total (Overall) | 629 (54.5%) | 524 (45.5%) |
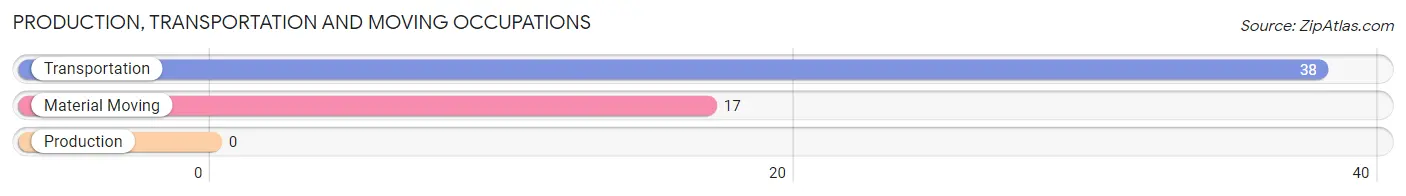
Production, Transportation and Moving Occupations
The most common Production, Transportation and Moving occupations in El Portal are Transportation (38 | 3.3%), and Material Moving (17 | 1.5%).
Production, Transportation and Moving Occupations by Sex
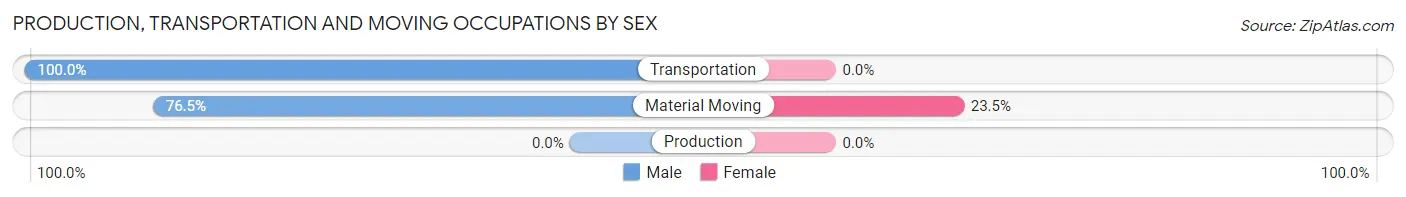
| Occupation | Male | Female |
| Production | 0 (0.0%) | 0 (0.0%) |
| Transportation | 38 (100.0%) | 0 (0.0%) |
| Material Moving | 13 (76.5%) | 4 (23.5%) |
| Total (Category) | 51 (92.7%) | 4 (7.3%) |
| Total (Overall) | 629 (54.5%) | 524 (45.5%) |
Employment Industries by Sex in El Portal
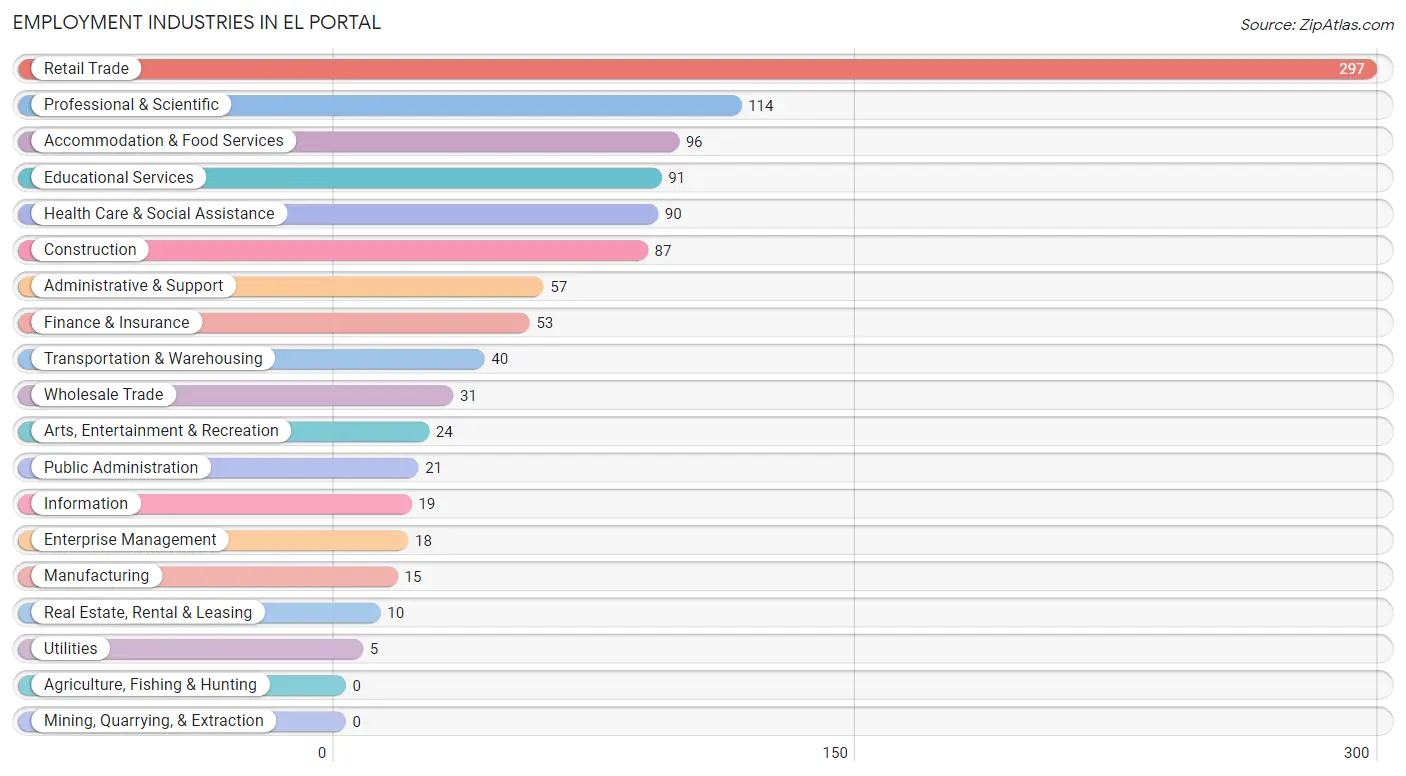
Employment Industries in El Portal
The major employment industries in El Portal include Retail Trade (297 | 25.8%), Professional & Scientific (114 | 9.9%), Accommodation & Food Services (96 | 8.3%), Educational Services (91 | 7.9%), and Health Care & Social Assistance (90 | 7.8%).
Employment Industries by Sex in El Portal
The El Portal industries that see more men than women are Manufacturing (100.0%), Wholesale Trade (100.0%), and Utilities (100.0%), whereas the industries that tend to have a higher number of women are Finance & Insurance (79.2%), Educational Services (79.1%), and Health Care & Social Assistance (77.8%).
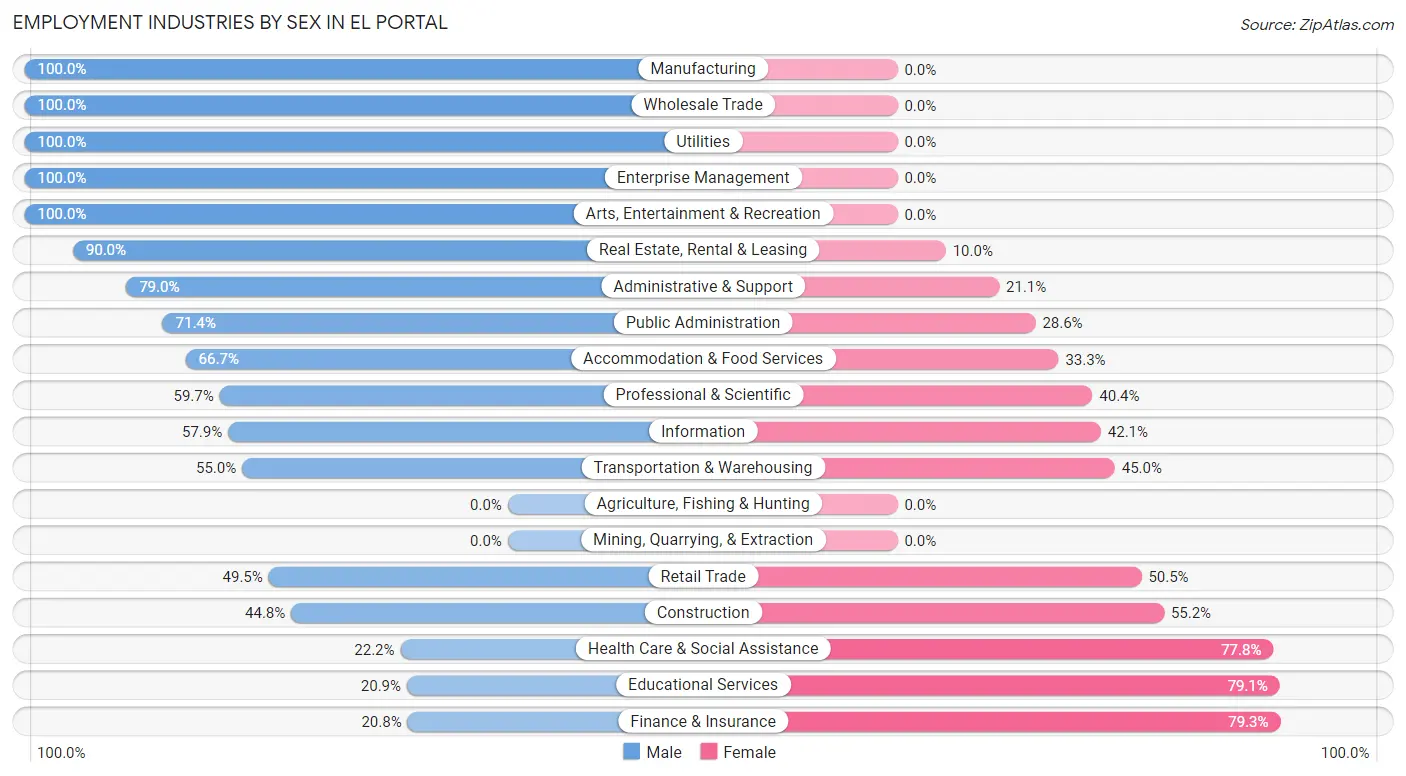
| Industry | Male | Female |
| Agriculture, Fishing & Hunting | 0 (0.0%) | 0 (0.0%) |
| Mining, Quarrying, & Extraction | 0 (0.0%) | 0 (0.0%) |
| Construction | 39 (44.8%) | 48 (55.2%) |
| Manufacturing | 15 (100.0%) | 0 (0.0%) |
| Wholesale Trade | 31 (100.0%) | 0 (0.0%) |
| Retail Trade | 147 (49.5%) | 150 (50.5%) |
| Transportation & Warehousing | 22 (55.0%) | 18 (45.0%) |
| Utilities | 5 (100.0%) | 0 (0.0%) |
| Information | 11 (57.9%) | 8 (42.1%) |
| Finance & Insurance | 11 (20.7%) | 42 (79.2%) |
| Real Estate, Rental & Leasing | 9 (90.0%) | 1 (10.0%) |
| Professional & Scientific | 68 (59.7%) | 46 (40.4%) |
| Enterprise Management | 18 (100.0%) | 0 (0.0%) |
| Administrative & Support | 45 (78.9%) | 12 (21.0%) |
| Educational Services | 19 (20.9%) | 72 (79.1%) |
| Health Care & Social Assistance | 20 (22.2%) | 70 (77.8%) |
| Arts, Entertainment & Recreation | 24 (100.0%) | 0 (0.0%) |
| Accommodation & Food Services | 64 (66.7%) | 32 (33.3%) |
| Public Administration | 15 (71.4%) | 6 (28.6%) |
| Total | 629 (54.5%) | 524 (45.5%) |
Education in El Portal
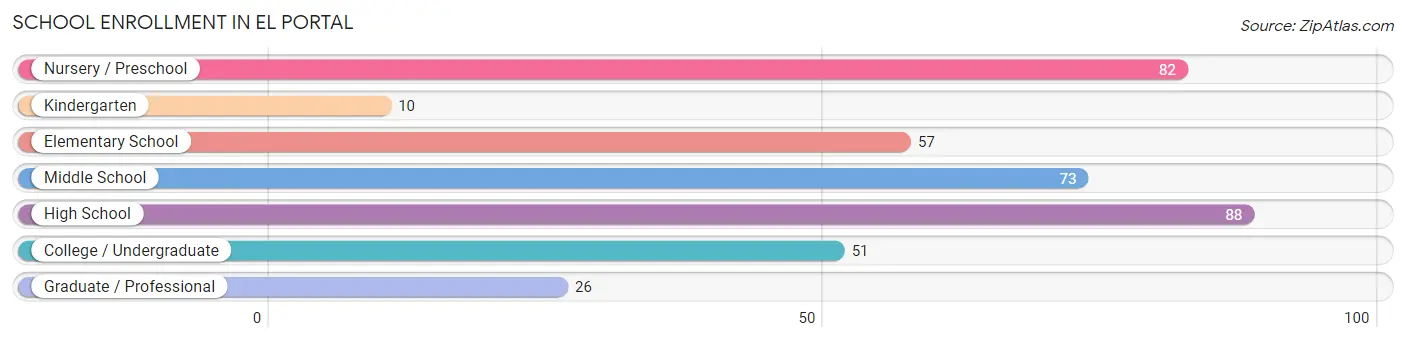
School Enrollment in El Portal
The most common levels of schooling among the 387 students in El Portal are high school (88 | 22.7%), nursery / preschool (82 | 21.2%), and middle school (73 | 18.9%).
| School Level | # Students | % Students |
| Nursery / Preschool | 82 | 21.2% |
| Kindergarten | 10 | 2.6% |
| Elementary School | 57 | 14.7% |
| Middle School | 73 | 18.9% |
| High School | 88 | 22.7% |
| College / Undergraduate | 51 | 13.2% |
| Graduate / Professional | 26 | 6.7% |
| Total | 387 | 100.0% |
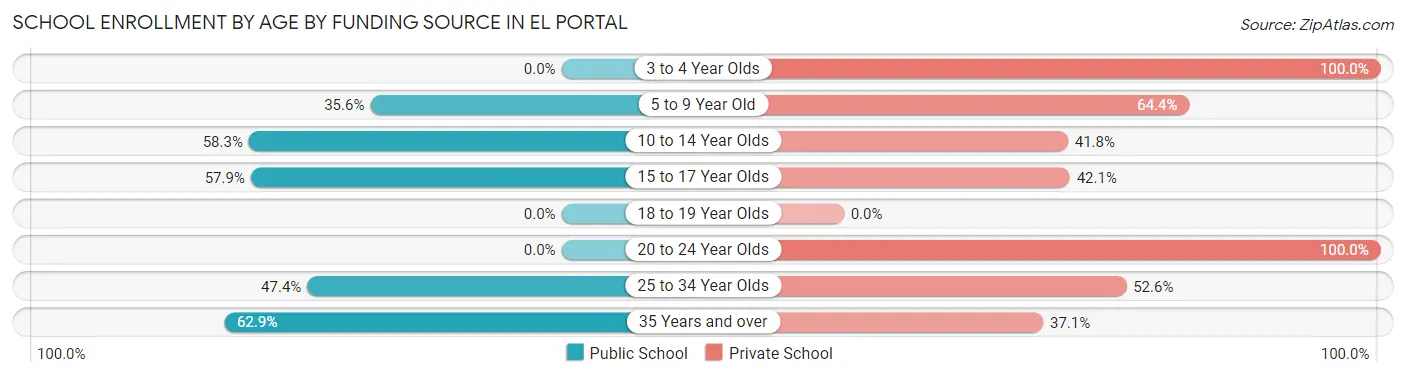
School Enrollment by Age by Funding Source in El Portal
Out of a total of 387 students who are enrolled in schools in El Portal, 215 (55.6%) attend a private institution, while the remaining 172 (44.4%) are enrolled in public schools. The age group of 3 to 4 year olds has the highest likelihood of being enrolled in private schools, with 57 (100.0% in the age bracket) enrolled. Conversely, the age group of 35 years and over has the lowest likelihood of being enrolled in a private school, with 22 (62.9% in the age bracket) attending a public institution.
| Age Bracket | Public School | Private School |
| 3 to 4 Year Olds | 0 (0.0%) | 57 (100.0%) |
| 5 to 9 Year Old | 26 (35.6%) | 47 (64.4%) |
| 10 to 14 Year Olds | 60 (58.3%) | 43 (41.7%) |
| 15 to 17 Year Olds | 55 (57.9%) | 40 (42.1%) |
| 18 to 19 Year Olds | 0 (0.0%) | 0 (0.0%) |
| 20 to 24 Year Olds | 0 (0.0%) | 5 (100.0%) |
| 25 to 34 Year Olds | 9 (47.4%) | 10 (52.6%) |
| 35 Years and over | 22 (62.9%) | 13 (37.1%) |
| Total | 172 (44.4%) | 215 (55.6%) |
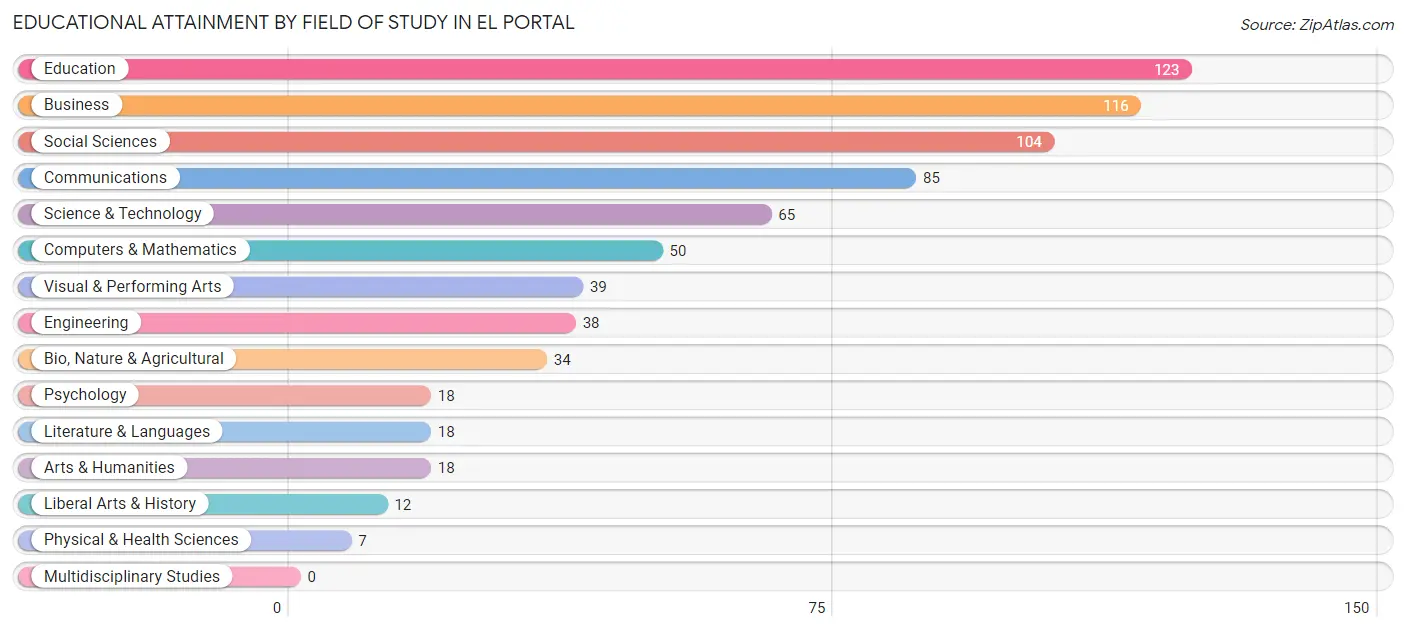
Educational Attainment by Field of Study in El Portal
Education (123 | 16.9%), business (116 | 16.0%), social sciences (104 | 14.3%), communications (85 | 11.7%), and science & technology (65 | 8.9%) are the most common fields of study among 727 individuals in El Portal who have obtained a bachelor's degree or higher.
| Field of Study | # Graduates | % Graduates |
| Computers & Mathematics | 50 | 6.9% |
| Bio, Nature & Agricultural | 34 | 4.7% |
| Physical & Health Sciences | 7 | 1.0% |
| Psychology | 18 | 2.5% |
| Social Sciences | 104 | 14.3% |
| Engineering | 38 | 5.2% |
| Multidisciplinary Studies | 0 | 0.0% |
| Science & Technology | 65 | 8.9% |
| Business | 116 | 16.0% |
| Education | 123 | 16.9% |
| Literature & Languages | 18 | 2.5% |
| Liberal Arts & History | 12 | 1.7% |
| Visual & Performing Arts | 39 | 5.4% |
| Communications | 85 | 11.7% |
| Arts & Humanities | 18 | 2.5% |
| Total | 727 | 100.0% |
Transportation & Commute in El Portal
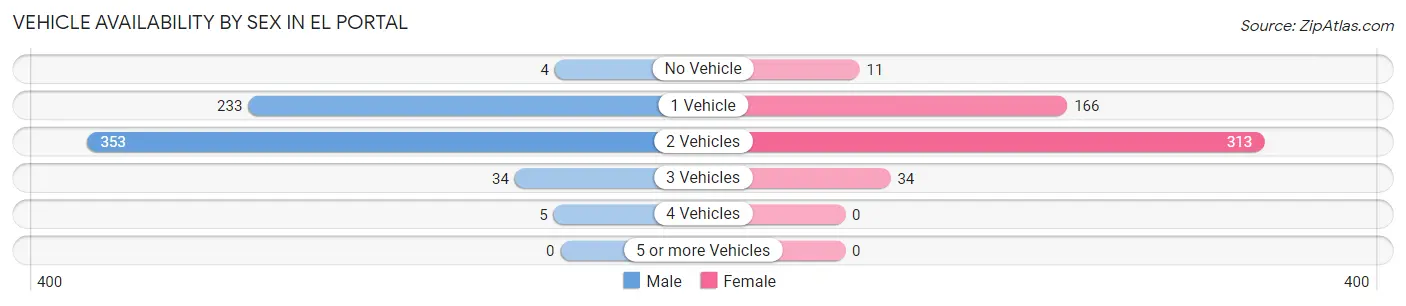
Vehicle Availability by Sex in El Portal
The most prevalent vehicle ownership categories in El Portal are males with 2 vehicles (353, accounting for 56.1%) and females with 2 vehicles (313, making up 67.4%).
| Vehicles Available | Male | Female |
| No Vehicle | 4 (0.6%) | 11 (2.1%) |
| 1 Vehicle | 233 (37.0%) | 166 (31.7%) |
| 2 Vehicles | 353 (56.1%) | 313 (59.7%) |
| 3 Vehicles | 34 (5.4%) | 34 (6.5%) |
| 4 Vehicles | 5 (0.8%) | 0 (0.0%) |
| 5 or more Vehicles | 0 (0.0%) | 0 (0.0%) |
| Total | 629 (100.0%) | 524 (100.0%) |
Commute Time in El Portal
The most frequently occuring commute durations in El Portal are 5 to 9 minutes (157 commuters, 15.9%), 30 to 34 minutes (155 commuters, 15.7%), and 15 to 19 minutes (131 commuters, 13.3%).
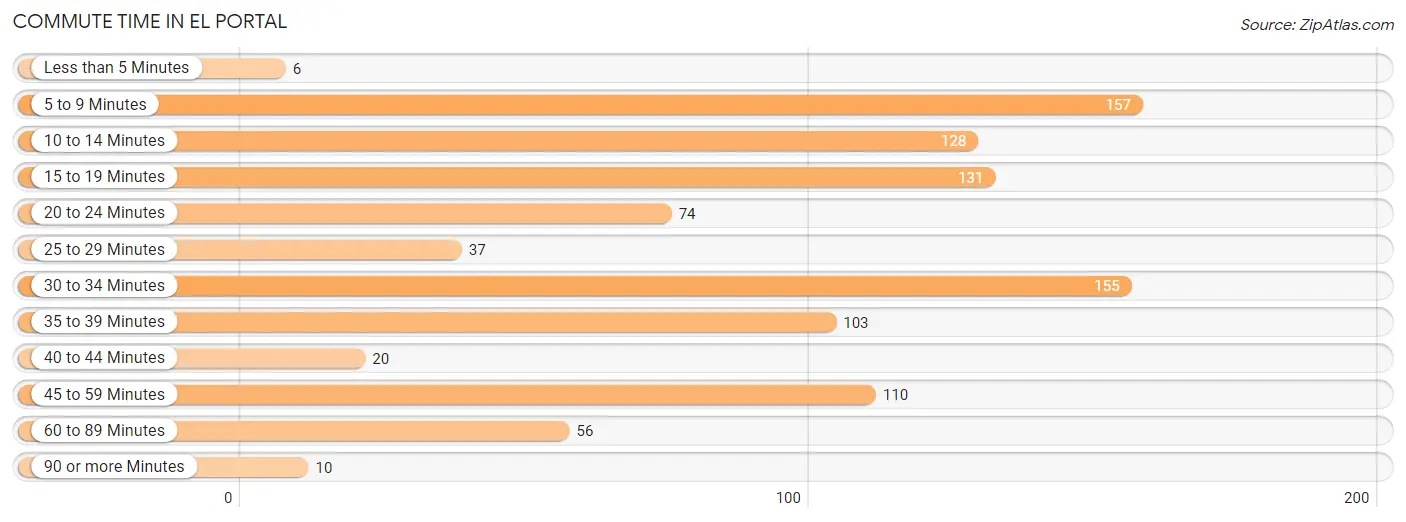
| Commute Time | # Commuters | % Commuters |
| Less than 5 Minutes | 6 | 0.6% |
| 5 to 9 Minutes | 157 | 15.9% |
| 10 to 14 Minutes | 128 | 13.0% |
| 15 to 19 Minutes | 131 | 13.3% |
| 20 to 24 Minutes | 74 | 7.5% |
| 25 to 29 Minutes | 37 | 3.7% |
| 30 to 34 Minutes | 155 | 15.7% |
| 35 to 39 Minutes | 103 | 10.4% |
| 40 to 44 Minutes | 20 | 2.0% |
| 45 to 59 Minutes | 110 | 11.1% |
| 60 to 89 Minutes | 56 | 5.7% |
| 90 or more Minutes | 10 | 1.0% |
Commute Time by Sex in El Portal
The most common commute times in El Portal are 30 to 34 minutes (111 commuters, 21.0%) for males and 5 to 9 minutes (133 commuters, 29.0%) for females.
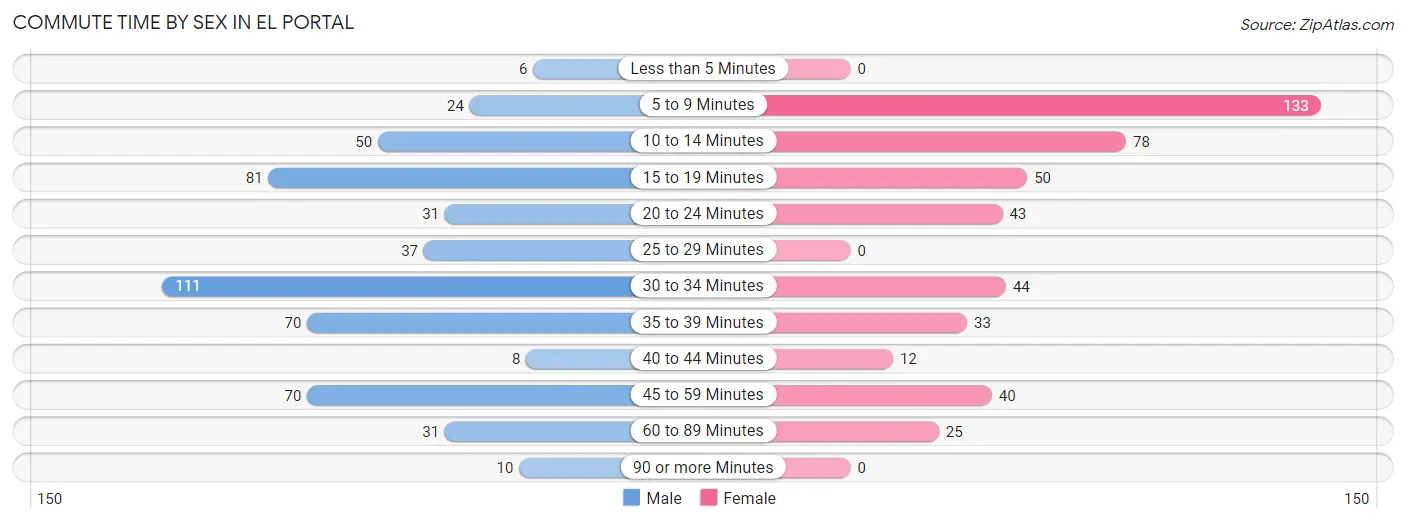
| Commute Time | Male | Female |
| Less than 5 Minutes | 6 (1.1%) | 0 (0.0%) |
| 5 to 9 Minutes | 24 (4.5%) | 133 (29.0%) |
| 10 to 14 Minutes | 50 (9.5%) | 78 (17.0%) |
| 15 to 19 Minutes | 81 (15.3%) | 50 (10.9%) |
| 20 to 24 Minutes | 31 (5.9%) | 43 (9.4%) |
| 25 to 29 Minutes | 37 (7.0%) | 0 (0.0%) |
| 30 to 34 Minutes | 111 (21.0%) | 44 (9.6%) |
| 35 to 39 Minutes | 70 (13.2%) | 33 (7.2%) |
| 40 to 44 Minutes | 8 (1.5%) | 12 (2.6%) |
| 45 to 59 Minutes | 70 (13.2%) | 40 (8.7%) |
| 60 to 89 Minutes | 31 (5.9%) | 25 (5.5%) |
| 90 or more Minutes | 10 (1.9%) | 0 (0.0%) |
Time of Departure to Work by Sex in El Portal
The most frequent times of departure to work in El Portal are 9:00 AM to 9:59 AM (121, 22.9%) for males and 8:30 AM to 8:59 AM (125, 27.3%) for females.
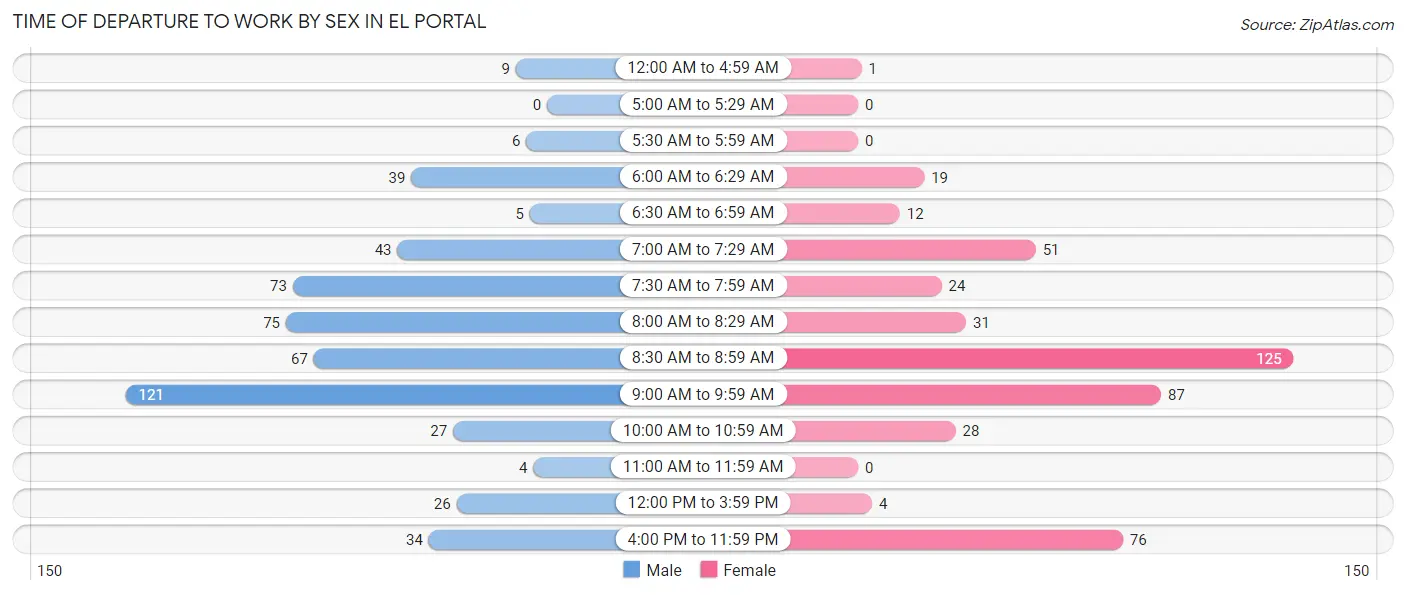
| Time of Departure | Male | Female |
| 12:00 AM to 4:59 AM | 9 (1.7%) | 1 (0.2%) |
| 5:00 AM to 5:29 AM | 0 (0.0%) | 0 (0.0%) |
| 5:30 AM to 5:59 AM | 6 (1.1%) | 0 (0.0%) |
| 6:00 AM to 6:29 AM | 39 (7.4%) | 19 (4.2%) |
| 6:30 AM to 6:59 AM | 5 (0.9%) | 12 (2.6%) |
| 7:00 AM to 7:29 AM | 43 (8.1%) | 51 (11.1%) |
| 7:30 AM to 7:59 AM | 73 (13.8%) | 24 (5.2%) |
| 8:00 AM to 8:29 AM | 75 (14.2%) | 31 (6.8%) |
| 8:30 AM to 8:59 AM | 67 (12.7%) | 125 (27.3%) |
| 9:00 AM to 9:59 AM | 121 (22.9%) | 87 (19.0%) |
| 10:00 AM to 10:59 AM | 27 (5.1%) | 28 (6.1%) |
| 11:00 AM to 11:59 AM | 4 (0.8%) | 0 (0.0%) |
| 12:00 PM to 3:59 PM | 26 (4.9%) | 4 (0.9%) |
| 4:00 PM to 11:59 PM | 34 (6.4%) | 76 (16.6%) |
| Total | 529 (100.0%) | 458 (100.0%) |
Housing Occupancy in El Portal
Occupancy by Ownership in El Portal
Of the total 807 dwellings in El Portal, owner-occupied units account for 700 (86.7%), while renter-occupied units make up 107 (13.3%).
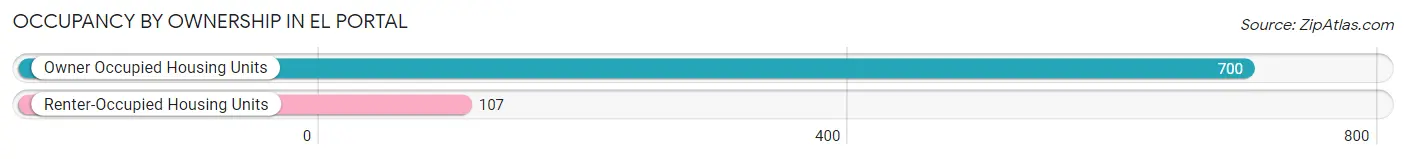
| Occupancy | # Housing Units | % Housing Units |
| Owner Occupied Housing Units | 700 | 86.7% |
| Renter-Occupied Housing Units | 107 | 13.3% |
| Total Occupied Housing Units | 807 | 100.0% |
Occupancy by Household Size in El Portal
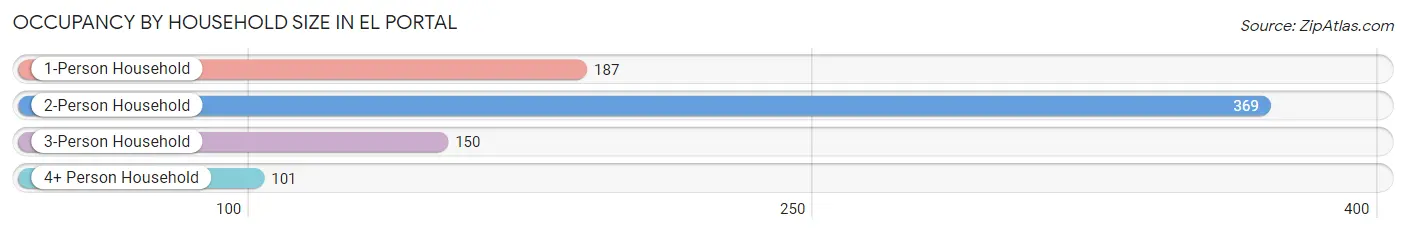
| Household Size | # Housing Units | % Housing Units |
| 1-Person Household | 187 | 23.2% |
| 2-Person Household | 369 | 45.7% |
| 3-Person Household | 150 | 18.6% |
| 4+ Person Household | 101 | 12.5% |
| Total Housing Units | 807 | 100.0% |
Occupancy by Ownership by Household Size in El Portal
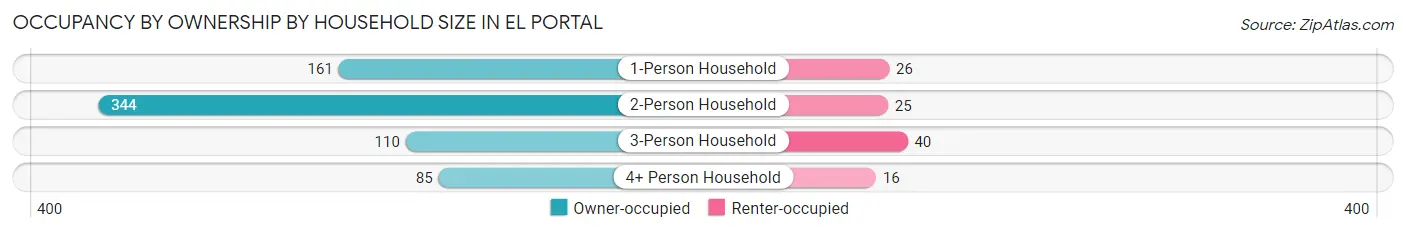
| Household Size | Owner-occupied | Renter-occupied |
| 1-Person Household | 161 (86.1%) | 26 (13.9%) |
| 2-Person Household | 344 (93.2%) | 25 (6.8%) |
| 3-Person Household | 110 (73.3%) | 40 (26.7%) |
| 4+ Person Household | 85 (84.2%) | 16 (15.8%) |
| Total Housing Units | 700 (86.7%) | 107 (13.3%) |
Occupancy by Educational Attainment in El Portal
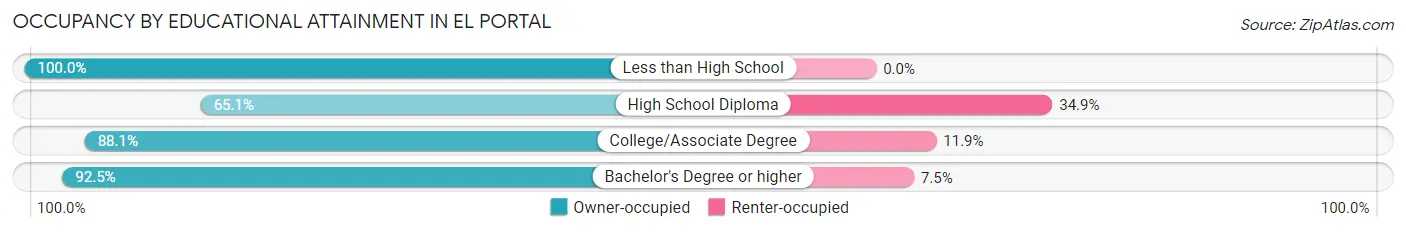
| Household Size | Owner-occupied | Renter-occupied |
| Less than High School | 34 (100.0%) | 0 (0.0%) |
| High School Diploma | 82 (65.1%) | 44 (34.9%) |
| College/Associate Degree | 288 (88.1%) | 39 (11.9%) |
| Bachelor's Degree or higher | 296 (92.5%) | 24 (7.5%) |
Occupancy by Age of Householder in El Portal
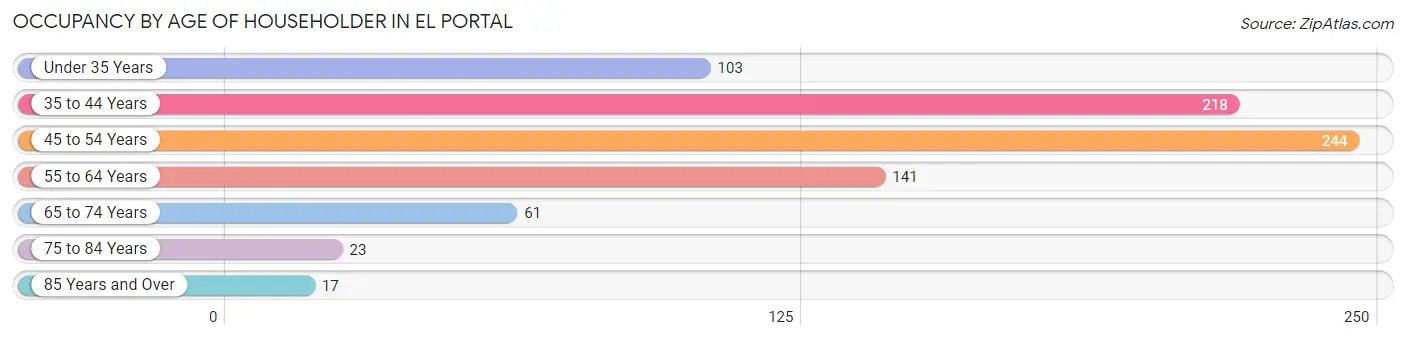
| Age Bracket | # Households | % Households |
| Under 35 Years | 103 | 12.8% |
| 35 to 44 Years | 218 | 27.0% |
| 45 to 54 Years | 244 | 30.2% |
| 55 to 64 Years | 141 | 17.5% |
| 65 to 74 Years | 61 | 7.6% |
| 75 to 84 Years | 23 | 2.9% |
| 85 Years and Over | 17 | 2.1% |
| Total | 807 | 100.0% |
Housing Finances in El Portal
Median Income by Occupancy in El Portal
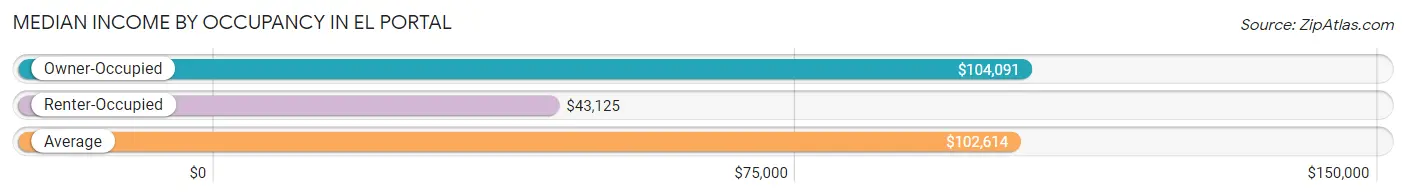
| Occupancy Type | # Households | Median Income |
| Owner-Occupied | 700 (86.7%) | $104,091 |
| Renter-Occupied | 107 (13.3%) | $43,125 |
| Average | 807 (100.0%) | $102,614 |
Occupancy by Householder Income Bracket in El Portal
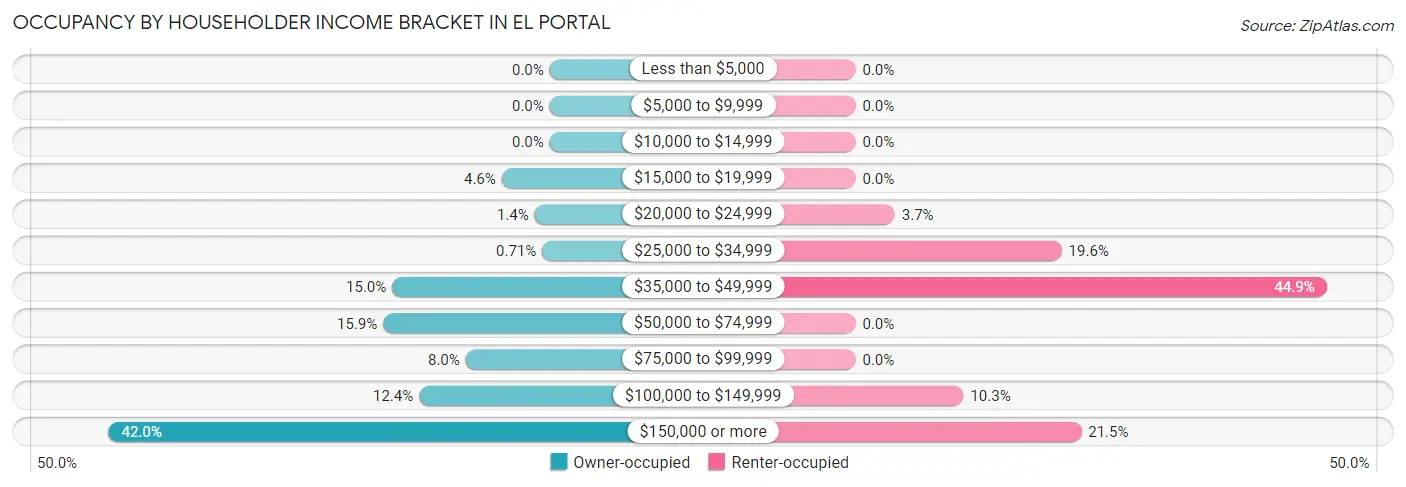
| Income Bracket | Owner-occupied | Renter-occupied |
| Less than $5,000 | 0 (0.0%) | 0 (0.0%) |
| $5,000 to $9,999 | 0 (0.0%) | 0 (0.0%) |
| $10,000 to $14,999 | 0 (0.0%) | 0 (0.0%) |
| $15,000 to $19,999 | 32 (4.6%) | 0 (0.0%) |
| $20,000 to $24,999 | 10 (1.4%) | 4 (3.7%) |
| $25,000 to $34,999 | 5 (0.7%) | 21 (19.6%) |
| $35,000 to $49,999 | 105 (15.0%) | 48 (44.9%) |
| $50,000 to $74,999 | 111 (15.9%) | 0 (0.0%) |
| $75,000 to $99,999 | 56 (8.0%) | 0 (0.0%) |
| $100,000 to $149,999 | 87 (12.4%) | 11 (10.3%) |
| $150,000 or more | 294 (42.0%) | 23 (21.5%) |
| Total | 700 (100.0%) | 107 (100.0%) |
Monthly Housing Cost Tiers in El Portal
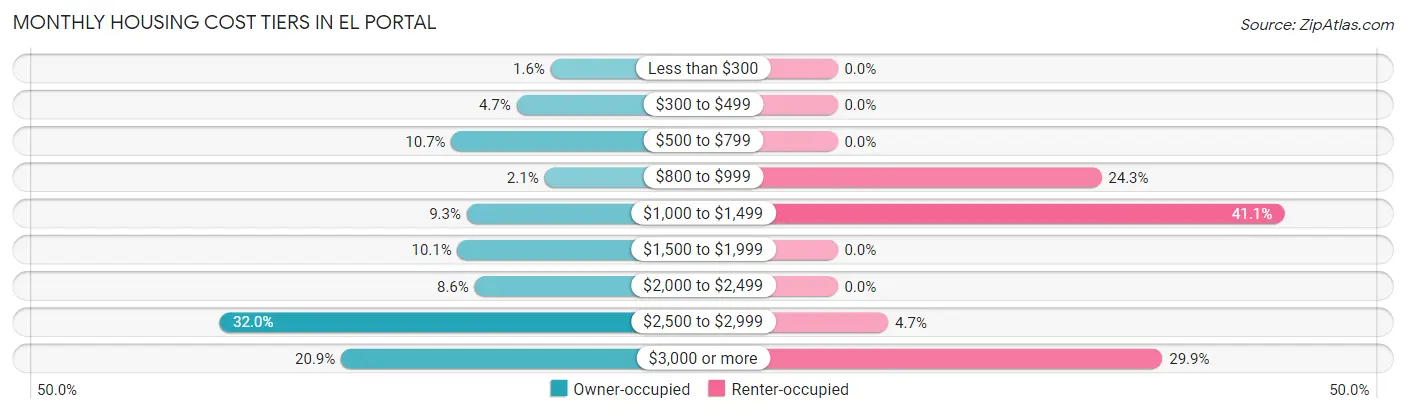
| Monthly Cost | Owner-occupied | Renter-occupied |
| Less than $300 | 11 (1.6%) | 0 (0.0%) |
| $300 to $499 | 33 (4.7%) | 0 (0.0%) |
| $500 to $799 | 75 (10.7%) | 0 (0.0%) |
| $800 to $999 | 15 (2.1%) | 26 (24.3%) |
| $1,000 to $1,499 | 65 (9.3%) | 44 (41.1%) |
| $1,500 to $1,999 | 71 (10.1%) | 0 (0.0%) |
| $2,000 to $2,499 | 60 (8.6%) | 0 (0.0%) |
| $2,500 to $2,999 | 224 (32.0%) | 5 (4.7%) |
| $3,000 or more | 146 (20.9%) | 32 (29.9%) |
| Total | 700 (100.0%) | 107 (100.0%) |
Physical Housing Characteristics in El Portal
Housing Structures in El Portal
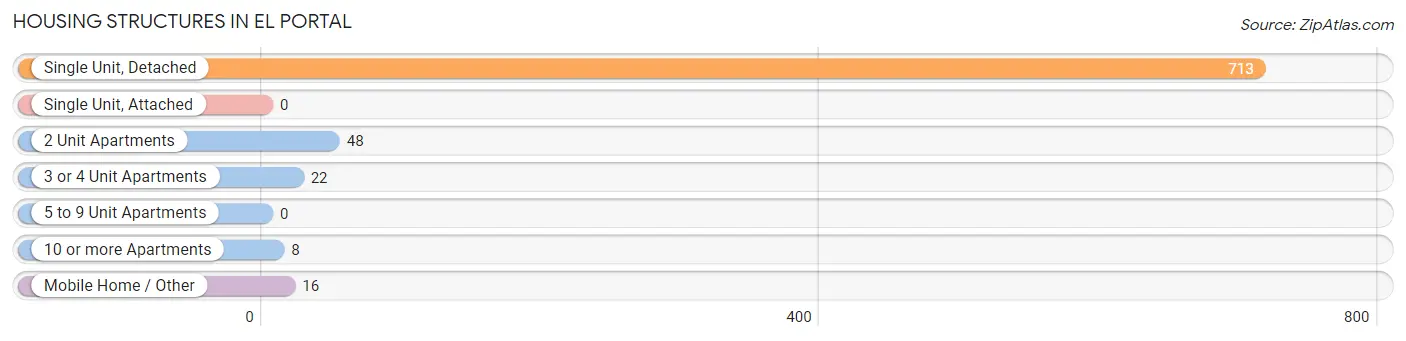
| Structure Type | # Housing Units | % Housing Units |
| Single Unit, Detached | 713 | 88.3% |
| Single Unit, Attached | 0 | 0.0% |
| 2 Unit Apartments | 48 | 5.9% |
| 3 or 4 Unit Apartments | 22 | 2.7% |
| 5 to 9 Unit Apartments | 0 | 0.0% |
| 10 or more Apartments | 8 | 1.0% |
| Mobile Home / Other | 16 | 2.0% |
| Total | 807 | 100.0% |
Housing Structures by Occupancy in El Portal
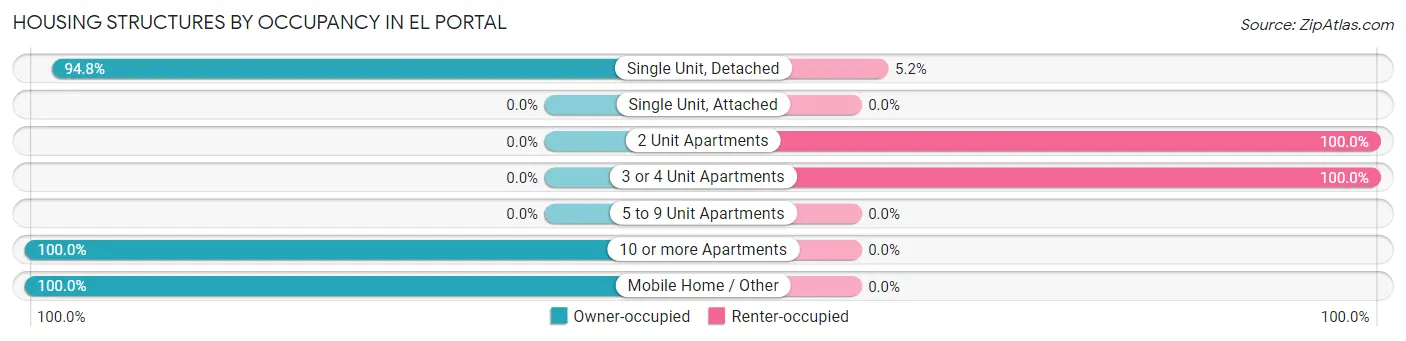
| Structure Type | Owner-occupied | Renter-occupied |
| Single Unit, Detached | 676 (94.8%) | 37 (5.2%) |
| Single Unit, Attached | 0 (0.0%) | 0 (0.0%) |
| 2 Unit Apartments | 0 (0.0%) | 48 (100.0%) |
| 3 or 4 Unit Apartments | 0 (0.0%) | 22 (100.0%) |
| 5 to 9 Unit Apartments | 0 (0.0%) | 0 (0.0%) |
| 10 or more Apartments | 8 (100.0%) | 0 (0.0%) |
| Mobile Home / Other | 16 (100.0%) | 0 (0.0%) |
| Total | 700 (86.7%) | 107 (13.3%) |
Housing Structures by Number of Rooms in El Portal
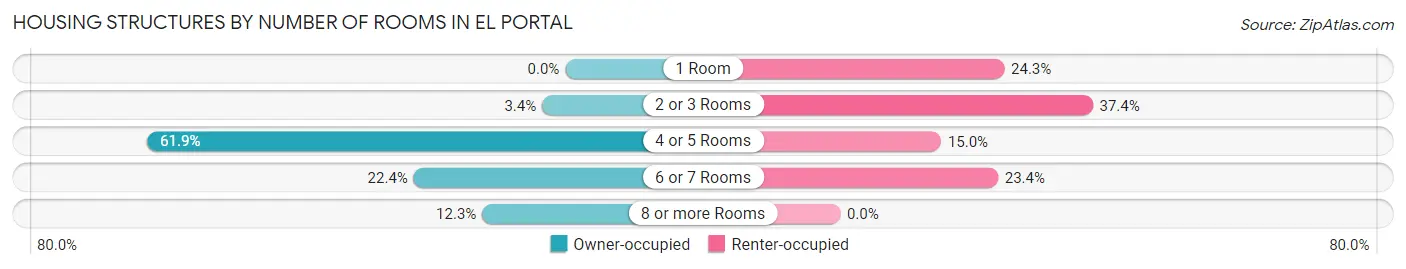
| Number of Rooms | Owner-occupied | Renter-occupied |
| 1 Room | 0 (0.0%) | 26 (24.3%) |
| 2 or 3 Rooms | 24 (3.4%) | 40 (37.4%) |
| 4 or 5 Rooms | 433 (61.9%) | 16 (14.9%) |
| 6 or 7 Rooms | 157 (22.4%) | 25 (23.4%) |
| 8 or more Rooms | 86 (12.3%) | 0 (0.0%) |
| Total | 700 (100.0%) | 107 (100.0%) |
Housing Structure by Heating Type in El Portal
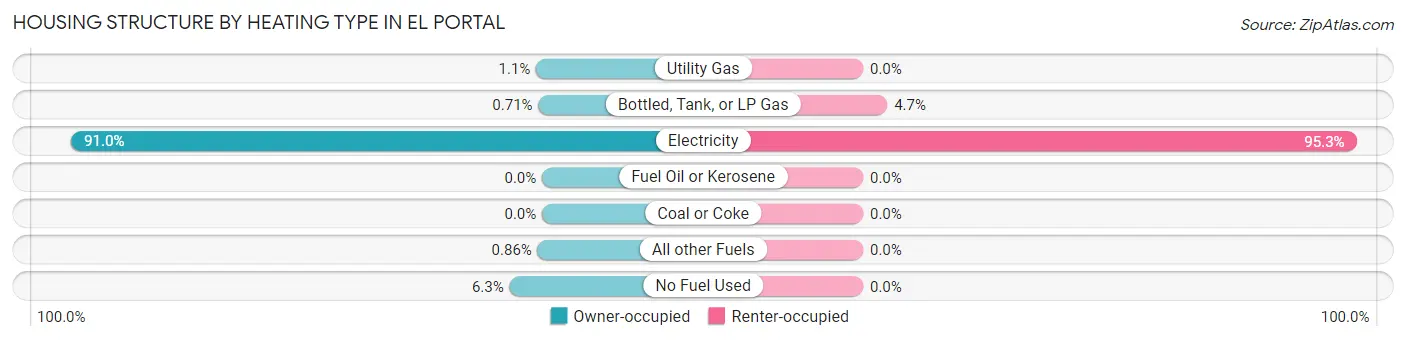
| Heating Type | Owner-occupied | Renter-occupied |
| Utility Gas | 8 (1.1%) | 0 (0.0%) |
| Bottled, Tank, or LP Gas | 5 (0.7%) | 5 (4.7%) |
| Electricity | 637 (91.0%) | 102 (95.3%) |
| Fuel Oil or Kerosene | 0 (0.0%) | 0 (0.0%) |
| Coal or Coke | 0 (0.0%) | 0 (0.0%) |
| All other Fuels | 6 (0.9%) | 0 (0.0%) |
| No Fuel Used | 44 (6.3%) | 0 (0.0%) |
| Total | 700 (100.0%) | 107 (100.0%) |
Household Vehicle Usage in El Portal
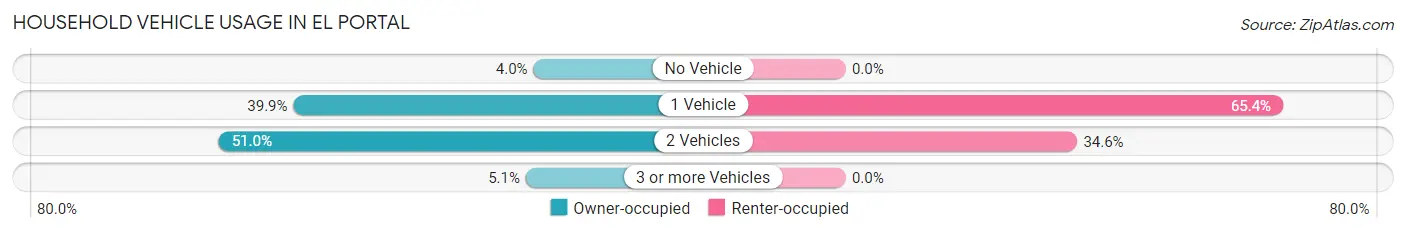
| Vehicles per Household | Owner-occupied | Renter-occupied |
| No Vehicle | 28 (4.0%) | 0 (0.0%) |
| 1 Vehicle | 279 (39.9%) | 70 (65.4%) |
| 2 Vehicles | 357 (51.0%) | 37 (34.6%) |
| 3 or more Vehicles | 36 (5.1%) | 0 (0.0%) |
| Total | 700 (100.0%) | 107 (100.0%) |
Real Estate & Mortgages in El Portal
Real Estate and Mortgage Overview in El Portal
| Characteristic | Without Mortgage | With Mortgage |
| Housing Units | 172 | 528 |
| Median Property Value | $392,500 | $636,500 |
| Median Household Income | $46,053 | $269 |
| Monthly Housing Costs | $571 | $136 |
| Real Estate Taxes | $3,045 | $0 |
Property Value by Mortgage Status in El Portal
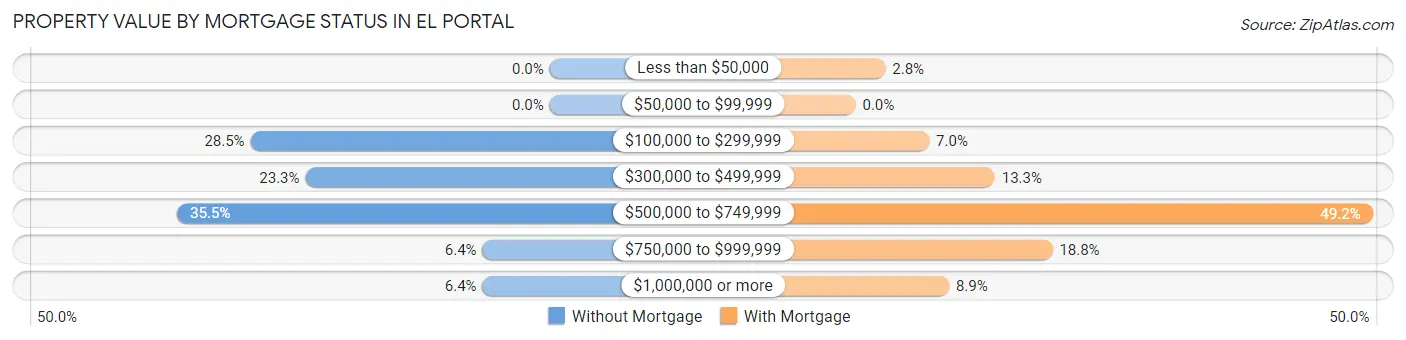
| Property Value | Without Mortgage | With Mortgage |
| Less than $50,000 | 0 (0.0%) | 15 (2.8%) |
| $50,000 to $99,999 | 0 (0.0%) | 0 (0.0%) |
| $100,000 to $299,999 | 49 (28.5%) | 37 (7.0%) |
| $300,000 to $499,999 | 40 (23.3%) | 70 (13.3%) |
| $500,000 to $749,999 | 61 (35.5%) | 260 (49.2%) |
| $750,000 to $999,999 | 11 (6.4%) | 99 (18.8%) |
| $1,000,000 or more | 11 (6.4%) | 47 (8.9%) |
| Total | 172 (100.0%) | 528 (100.0%) |
Household Income by Mortgage Status in El Portal
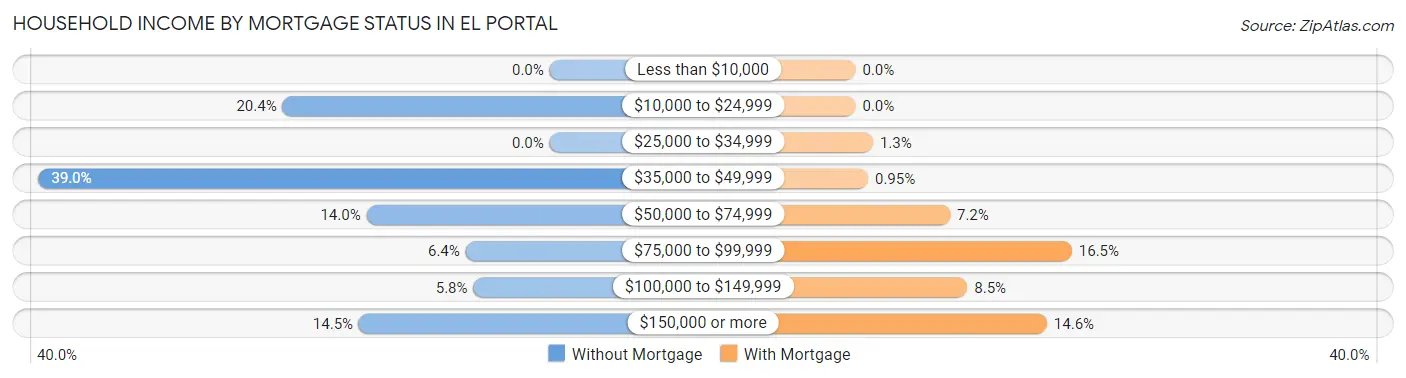
| Household Income | Without Mortgage | With Mortgage |
| Less than $10,000 | 0 (0.0%) | 0 (0.0%) |
| $10,000 to $24,999 | 35 (20.3%) | 0 (0.0%) |
| $25,000 to $34,999 | 0 (0.0%) | 7 (1.3%) |
| $35,000 to $49,999 | 67 (39.0%) | 5 (0.9%) |
| $50,000 to $74,999 | 24 (14.0%) | 38 (7.2%) |
| $75,000 to $99,999 | 11 (6.4%) | 87 (16.5%) |
| $100,000 to $149,999 | 10 (5.8%) | 45 (8.5%) |
| $150,000 or more | 25 (14.5%) | 77 (14.6%) |
| Total | 172 (100.0%) | 528 (100.0%) |
Property Value to Household Income Ratio in El Portal
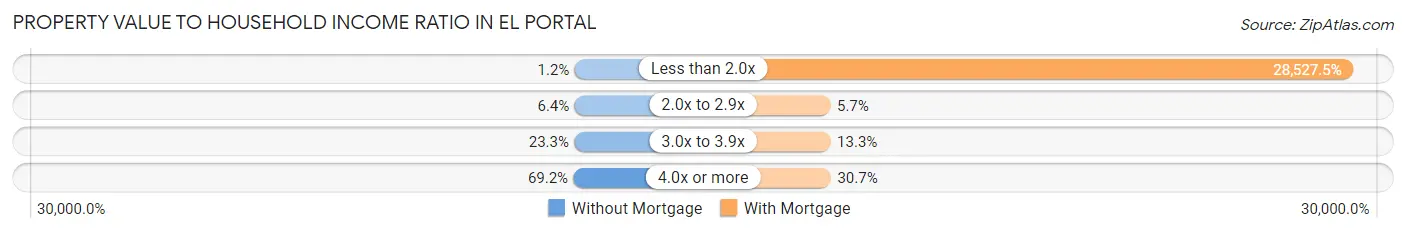
| Value-to-Income Ratio | Without Mortgage | With Mortgage |
| Less than 2.0x | 2 (1.2%) | 150,625 (28,527.5%) |
| 2.0x to 2.9x | 11 (6.4%) | 30 (5.7%) |
| 3.0x to 3.9x | 40 (23.3%) | 70 (13.3%) |
| 4.0x or more | 119 (69.2%) | 162 (30.7%) |
| Total | 172 (100.0%) | 528 (100.0%) |
Real Estate Taxes by Mortgage Status in El Portal
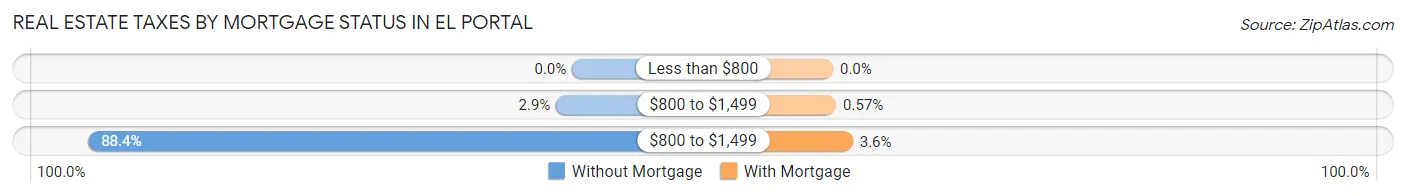
| Property Taxes | Without Mortgage | With Mortgage |
| Less than $800 | 0 (0.0%) | 0 (0.0%) |
| $800 to $1,499 | 5 (2.9%) | 3 (0.6%) |
| $800 to $1,499 | 152 (88.4%) | 19 (3.6%) |
| Total | 172 (100.0%) | 528 (100.0%) |
Health & Disability in El Portal
Health Insurance Coverage by Age in El Portal
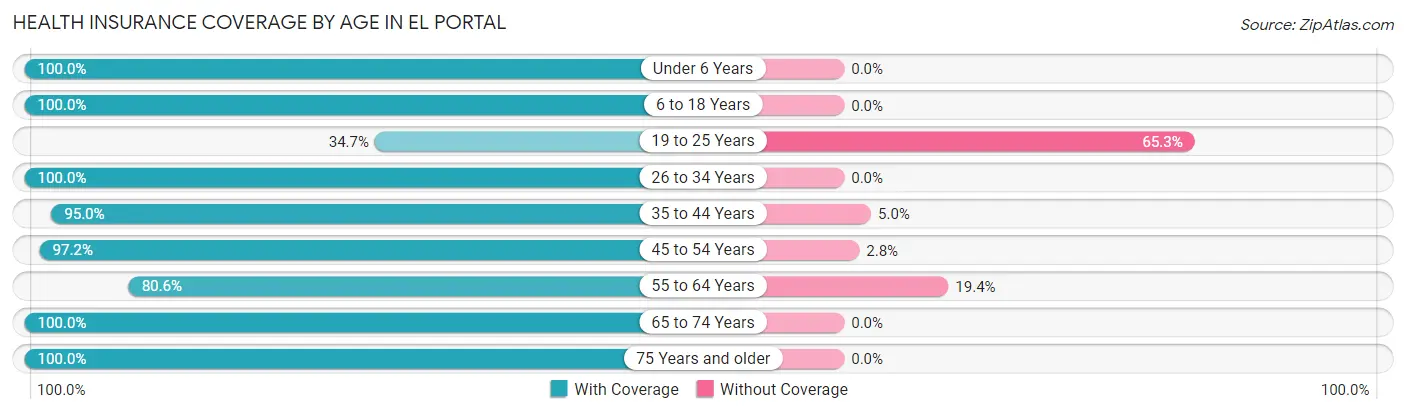
| Age Bracket | With Coverage | Without Coverage |
| Under 6 Years | 253 (100.0%) | 0 (0.0%) |
| 6 to 18 Years | 236 (100.0%) | 0 (0.0%) |
| 19 to 25 Years | 17 (34.7%) | 32 (65.3%) |
| 26 to 34 Years | 152 (100.0%) | 0 (0.0%) |
| 35 to 44 Years | 418 (95.0%) | 22 (5.0%) |
| 45 to 54 Years | 381 (97.2%) | 11 (2.8%) |
| 55 to 64 Years | 166 (80.6%) | 40 (19.4%) |
| 65 to 74 Years | 116 (100.0%) | 0 (0.0%) |
| 75 Years and older | 60 (100.0%) | 0 (0.0%) |
| Total | 1,799 (94.5%) | 105 (5.5%) |
Health Insurance Coverage by Citizenship Status in El Portal
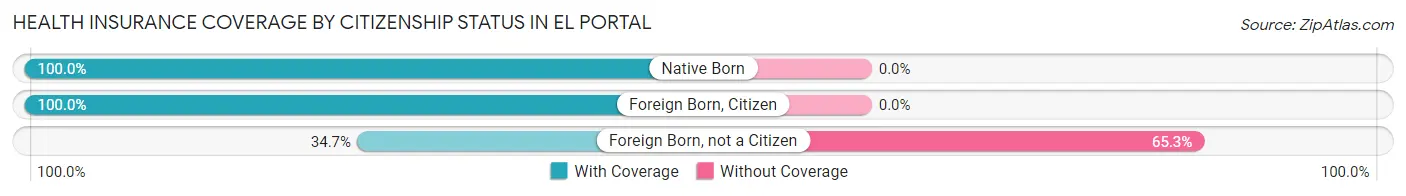
| Citizenship Status | With Coverage | Without Coverage |
| Native Born | 253 (100.0%) | 0 (0.0%) |
| Foreign Born, Citizen | 236 (100.0%) | 0 (0.0%) |
| Foreign Born, not a Citizen | 17 (34.7%) | 32 (65.3%) |
Health Insurance Coverage by Household Income in El Portal
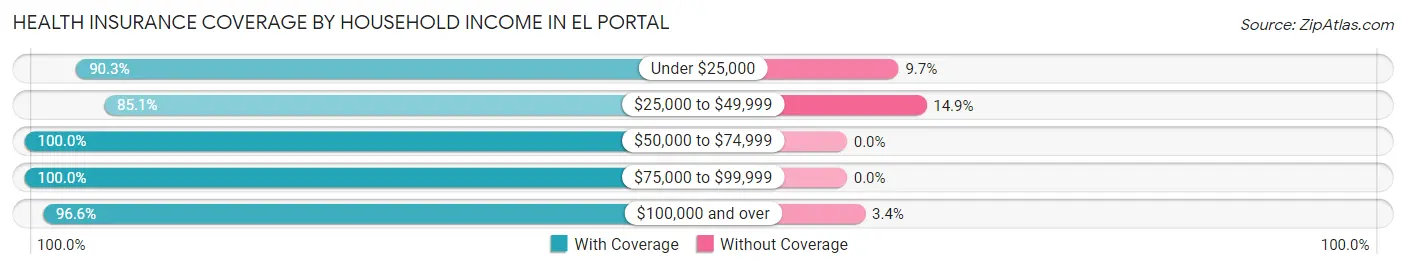
| Household Income | With Coverage | Without Coverage |
| Under $25,000 | 84 (90.3%) | 9 (9.7%) |
| $25,000 to $49,999 | 343 (85.1%) | 60 (14.9%) |
| $50,000 to $74,999 | 242 (100.0%) | 0 (0.0%) |
| $75,000 to $99,999 | 116 (100.0%) | 0 (0.0%) |
| $100,000 and over | 1,014 (96.6%) | 36 (3.4%) |
Public vs Private Health Insurance Coverage by Age in El Portal
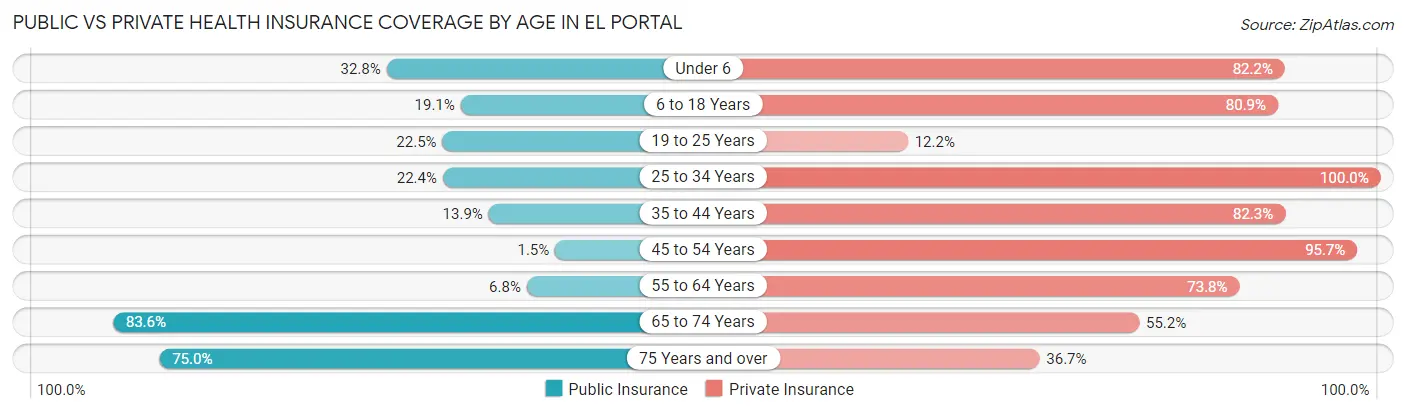
| Age Bracket | Public Insurance | Private Insurance |
| Under 6 | 83 (32.8%) | 208 (82.2%) |
| 6 to 18 Years | 45 (19.1%) | 191 (80.9%) |
| 19 to 25 Years | 11 (22.5%) | 6 (12.2%) |
| 25 to 34 Years | 34 (22.4%) | 152 (100.0%) |
| 35 to 44 Years | 61 (13.9%) | 362 (82.3%) |
| 45 to 54 Years | 6 (1.5%) | 375 (95.7%) |
| 55 to 64 Years | 14 (6.8%) | 152 (73.8%) |
| 65 to 74 Years | 97 (83.6%) | 64 (55.2%) |
| 75 Years and over | 45 (75.0%) | 22 (36.7%) |
| Total | 396 (20.8%) | 1,532 (80.5%) |
Disability Status by Sex by Age in El Portal
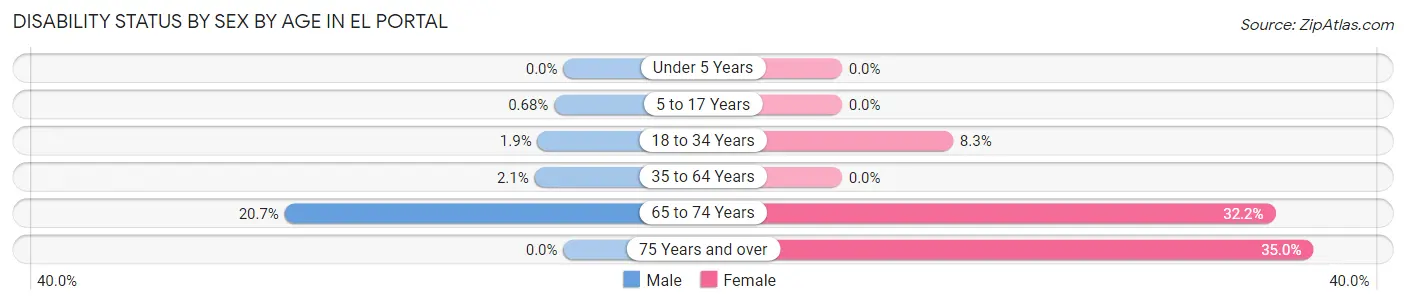
| Age Bracket | Male | Female |
| Under 5 Years | 0 (0.0%) | 0 (0.0%) |
| 5 to 17 Years | 1 (0.7%) | 0 (0.0%) |
| 18 to 34 Years | 2 (1.9%) | 8 (8.3%) |
| 35 to 64 Years | 12 (2.1%) | 0 (0.0%) |
| 65 to 74 Years | 6 (20.7%) | 28 (32.2%) |
| 75 Years and over | 0 (0.0%) | 21 (35.0%) |
Disability Class by Sex by Age in El Portal
Disability Class: Hearing Difficulty
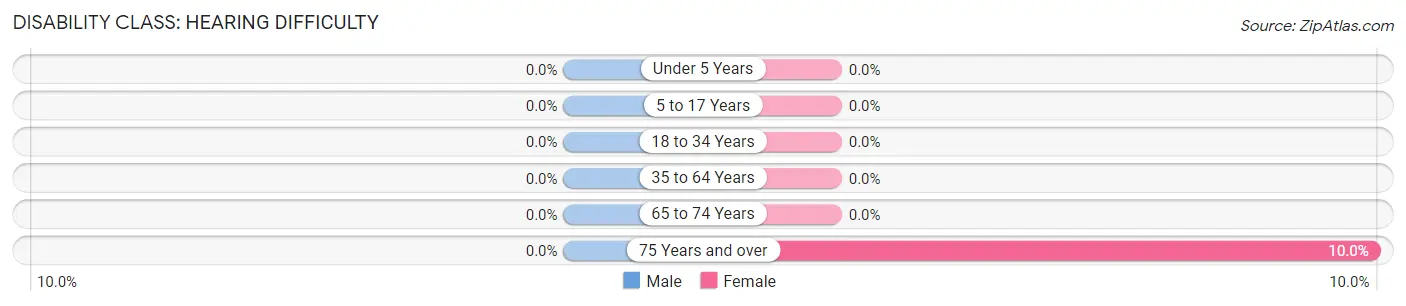
| Age Bracket | Male | Female |
| Under 5 Years | 0 (0.0%) | 0 (0.0%) |
| 5 to 17 Years | 0 (0.0%) | 0 (0.0%) |
| 18 to 34 Years | 0 (0.0%) | 0 (0.0%) |
| 35 to 64 Years | 0 (0.0%) | 0 (0.0%) |
| 65 to 74 Years | 0 (0.0%) | 0 (0.0%) |
| 75 Years and over | 0 (0.0%) | 6 (10.0%) |
Disability Class: Vision Difficulty
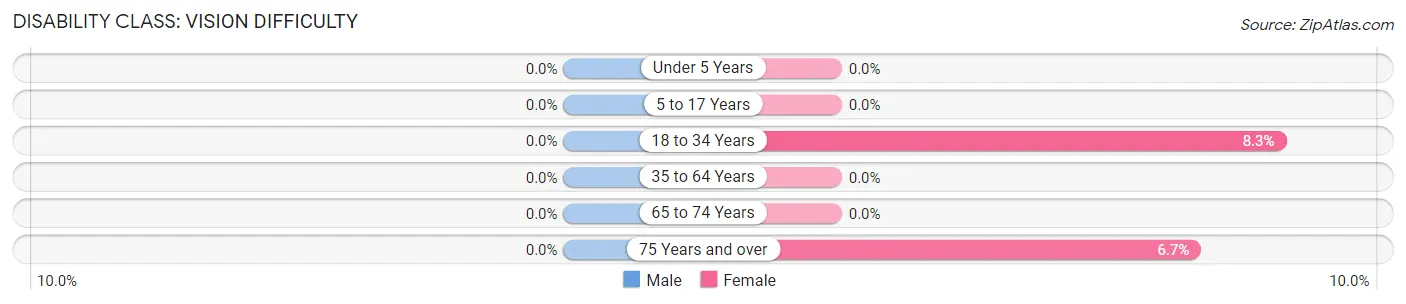
| Age Bracket | Male | Female |
| Under 5 Years | 0 (0.0%) | 0 (0.0%) |
| 5 to 17 Years | 0 (0.0%) | 0 (0.0%) |
| 18 to 34 Years | 0 (0.0%) | 8 (8.3%) |
| 35 to 64 Years | 0 (0.0%) | 0 (0.0%) |
| 65 to 74 Years | 0 (0.0%) | 0 (0.0%) |
| 75 Years and over | 0 (0.0%) | 4 (6.7%) |
Disability Class: Cognitive Difficulty
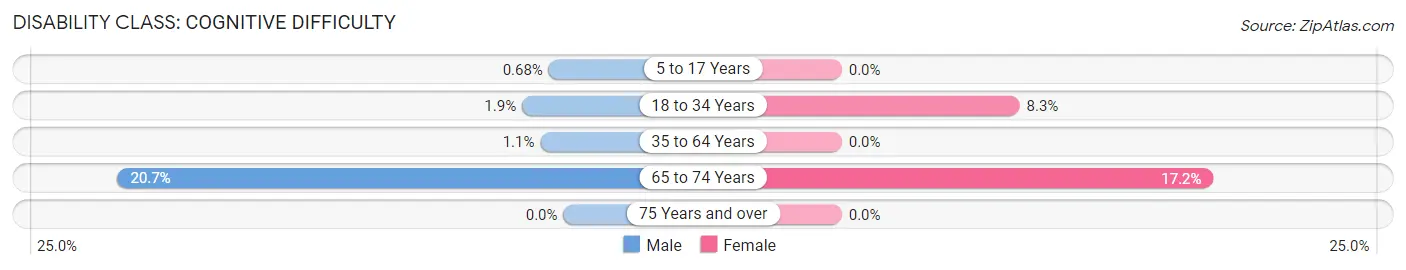
| Age Bracket | Male | Female |
| 5 to 17 Years | 1 (0.7%) | 0 (0.0%) |
| 18 to 34 Years | 2 (1.9%) | 8 (8.3%) |
| 35 to 64 Years | 6 (1.1%) | 0 (0.0%) |
| 65 to 74 Years | 6 (20.7%) | 15 (17.2%) |
| 75 Years and over | 0 (0.0%) | 0 (0.0%) |
Disability Class: Ambulatory Difficulty
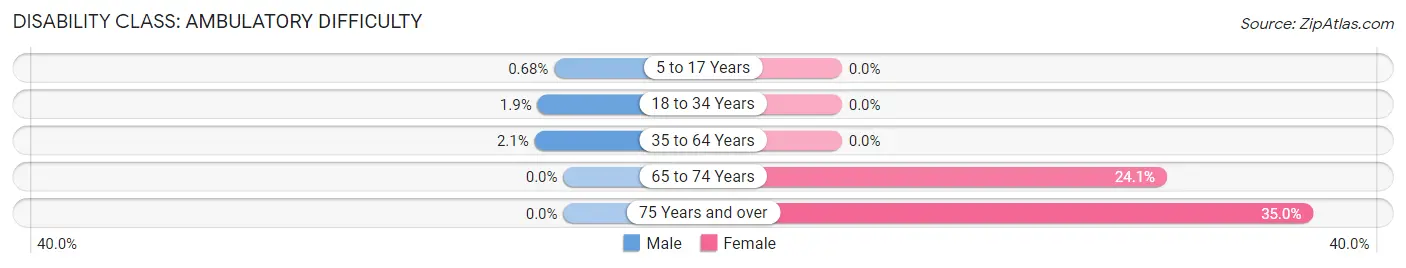
| Age Bracket | Male | Female |
| 5 to 17 Years | 1 (0.7%) | 0 (0.0%) |
| 18 to 34 Years | 2 (1.9%) | 0 (0.0%) |
| 35 to 64 Years | 12 (2.1%) | 0 (0.0%) |
| 65 to 74 Years | 0 (0.0%) | 21 (24.1%) |
| 75 Years and over | 0 (0.0%) | 21 (35.0%) |
Disability Class: Self-Care Difficulty
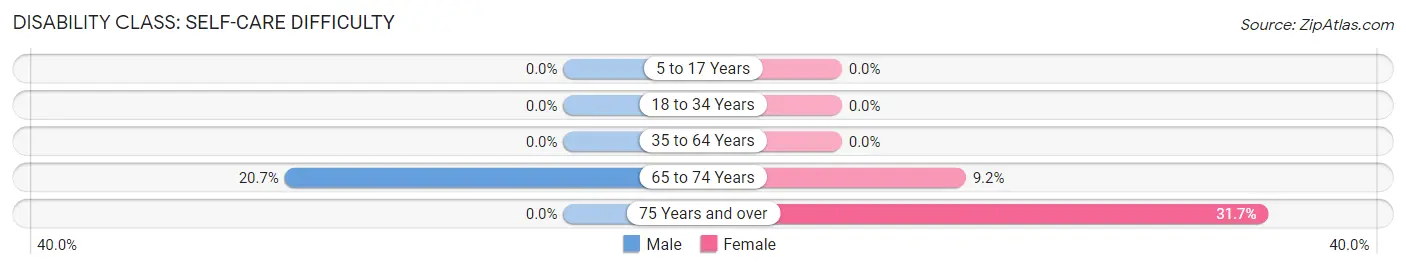
| Age Bracket | Male | Female |
| 5 to 17 Years | 0 (0.0%) | 0 (0.0%) |
| 18 to 34 Years | 0 (0.0%) | 0 (0.0%) |
| 35 to 64 Years | 0 (0.0%) | 0 (0.0%) |
| 65 to 74 Years | 6 (20.7%) | 8 (9.2%) |
| 75 Years and over | 0 (0.0%) | 19 (31.7%) |
Technology Access in El Portal
Computing Device Access in El Portal
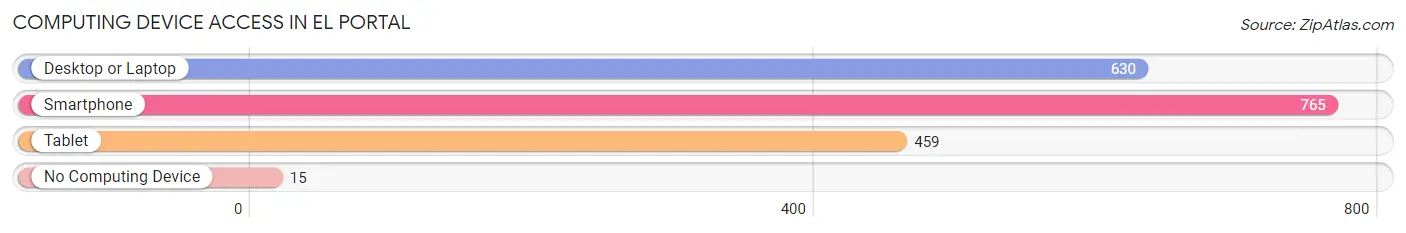
| Device Type | # Households | % Households |
| Desktop or Laptop | 630 | 78.1% |
| Smartphone | 765 | 94.8% |
| Tablet | 459 | 56.9% |
| No Computing Device | 15 | 1.9% |
| Total | 807 | 100.0% |
Internet Access in El Portal
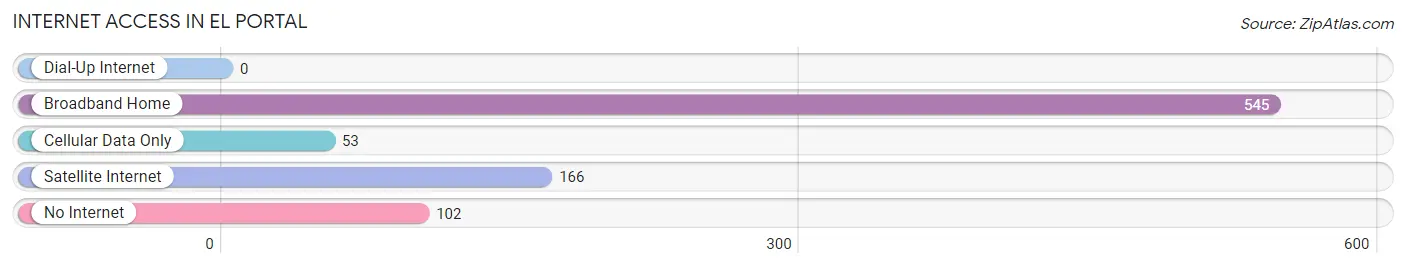
| Internet Type | # Households | % Households |
| Dial-Up Internet | 0 | 0.0% |
| Broadband Home | 545 | 67.5% |
| Cellular Data Only | 53 | 6.6% |
| Satellite Internet | 166 | 20.6% |
| No Internet | 102 | 12.6% |
| Total | 807 | 100.0% |
El Portal Summary
History
El Portal is a small village located in Miami-Dade County, Florida. It is situated between the cities of Miami and Miami Beach, and is bordered by the Miami River to the east and the Little River to the west. The village was incorporated in 1925 and is one of the oldest municipalities in Miami-Dade County.
The area that is now El Portal was originally inhabited by the Tequesta Indians, who were the first Native American tribe to inhabit the area. The Tequesta Indians were a peaceful tribe that lived off the land and were known for their fishing and hunting skills. The Tequesta Indians were eventually displaced by the Seminole Indians, who were forced to move to the area after the Seminole Wars.
The first European settlers to the area were William and Mary Brickell, who arrived in 1871. The Brickells purchased land in the area and built a trading post, which became the first permanent settlement in the area. The Brickells named the settlement “El Portal”, which means “the gateway” in Spanish.
In the early 1900s, the area began to grow as more settlers moved to the area. The village was officially incorporated in 1925 and the first mayor was elected in 1926. The village was primarily a farming community, with many of the residents growing citrus fruits, vegetables, and other crops.
In the 1950s, the village began to experience a population boom as more people moved to the area. The population of El Portal grew from 1,000 in 1950 to over 5,000 in 1960. This growth was largely due to the influx of Cuban immigrants who were fleeing the Cuban Revolution.
Geography
El Portal is located in Miami-Dade County, Florida. It is situated between the cities of Miami and Miami Beach, and is bordered by the Miami River to the east and the Little River to the west. The village is located in a tropical climate, with temperatures ranging from the mid-70s in the winter to the mid-90s in the summer.
The village is located on a flat coastal plain, with an elevation of just 6 feet above sea level. The area is mostly residential, with a few small businesses located in the village. The village is also home to several parks, including El Portal Park, which features a playground, basketball court, and picnic area.
Economy
The economy of El Portal is largely based on tourism and service industries. The village is home to several hotels and restaurants, as well as a few small businesses. The village is also home to a number of art galleries and antique shops.
The village is also home to a number of manufacturing companies, including a furniture factory and a printing company. The village is also home to a number of government offices, including the Miami-Dade County Courthouse and the Miami-Dade County Public Library.
Demographics
As of the 2010 census, the population of El Portal was 5,945. The population is primarily Hispanic, with over 90% of the population identifying as Hispanic or Latino. The median household income in the village is $37,945, and the median age is 39.
The village is also home to a large number of immigrants, with over 40% of the population being foreign-born. The majority of the foreign-born population is from Cuba, with other countries of origin including Mexico, Colombia, and the Dominican Republic.
Conclusion
El Portal is a small village located in Miami-Dade County, Florida. It is situated between the cities of Miami and Miami Beach, and is bordered by the Miami River to the east and the Little River to the west. The village was incorporated in 1925 and is one of the oldest municipalities in Miami-Dade County. The village is primarily residential, with a few small businesses located in the village. The economy of El Portal is largely based on tourism and service industries. The population of El Portal is primarily Hispanic, with over 90% of the population identifying as Hispanic or Latino. The village is also home to a large number of immigrants, with over 40% of the population being foreign-born.
Common Questions
What is Per Capita Income in El Portal?
Per Capita income in El Portal is $48,799.
What is the Median Family Income in El Portal?
Median Family Income in El Portal is $103,631.
What is the Median Household income in El Portal?
Median Household Income in El Portal is $102,614.
What is Income or Wage Gap in El Portal?
Income or Wage Gap in El Portal is 36.7%.
Women in El Portal earn 63.3 cents for every dollar earned by a man.
What is Inequality or Gini Index in El Portal?
Inequality or Gini Index in El Portal is 0.38.
What is the Total Population of El Portal?
Total Population of El Portal is 1,904.
What is the Total Male Population of El Portal?
Total Male Population of El Portal is 1,011.
What is the Total Female Population of El Portal?
Total Female Population of El Portal is 893.
What is the Ratio of Males per 100 Females in El Portal?
There are 113.21 Males per 100 Females in El Portal.
What is the Ratio of Females per 100 Males in El Portal?
There are 88.33 Females per 100 Males in El Portal.
What is the Median Population Age in El Portal?
Median Population Age in El Portal is 40.5 Years.
What is the Average Family Size in El Portal
Average Family Size in El Portal is 3.1 People.
What is the Average Household Size in El Portal
Average Household Size in El Portal is 2.4 People.
How Large is the Labor Force in El Portal?
There are 1,176 People in the Labor Forcein in El Portal.
What is the Percentage of People in the Labor Force in El Portal?
77.9% of People are in the Labor Force in El Portal.
What is the Unemployment Rate in El Portal?
Unemployment Rate in El Portal is 2.0%.