West Miami, FL Map & Demographics
West Miami Map
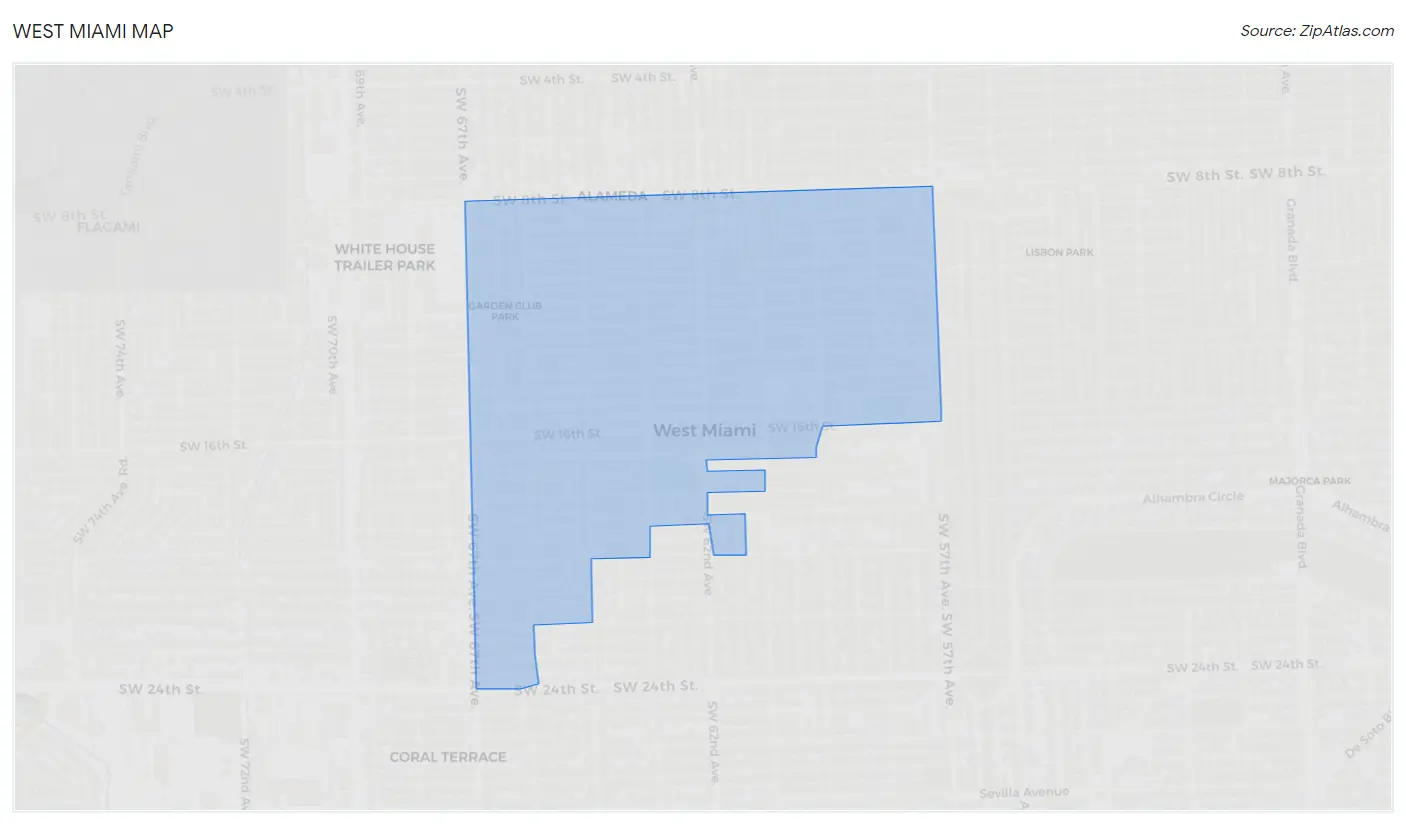
West Miami Overview
$38,156
PER CAPITA INCOME
$97,396
AVG FAMILY INCOME
$73,525
AVG HOUSEHOLD INCOME
18.6%
WAGE / INCOME GAP [ % ]
81.4¢/ $1
WAGE / INCOME GAP [ $ ]
0.45
INEQUALITY / GINI INDEX
7,104
TOTAL POPULATION
3,421
MALE POPULATION
3,683
FEMALE POPULATION
92.89
MALES / 100 FEMALES
107.66
FEMALES / 100 MALES
41.6
MEDIAN AGE
3.0
AVG FAMILY SIZE
2.6
AVG HOUSEHOLD SIZE
3,953
LABOR FORCE [ PEOPLE ]
65.0%
PERCENT IN LABOR FORCE
3.7%
UNEMPLOYMENT RATE
Income in West Miami
Income Overview in West Miami
Per Capita Income in West Miami is $38,156, while median incomes of families and households are $97,396 and $73,525 respectively.
| Characteristic | Number | Measure |
| Per Capita Income | 7,104 | $38,156 |
| Median Family Income | 1,889 | $97,396 |
| Mean Family Income | 1,889 | $110,479 |
| Median Household Income | 2,695 | $73,525 |
| Mean Household Income | 2,695 | $96,888 |
| Income Deficit | 1,889 | $0 |
| Wage / Income Gap (%) | 7,104 | 18.62% |
| Wage / Income Gap ($) | 7,104 | 81.38¢ per $1 |
| Gini / Inequality Index | 7,104 | 0.45 |
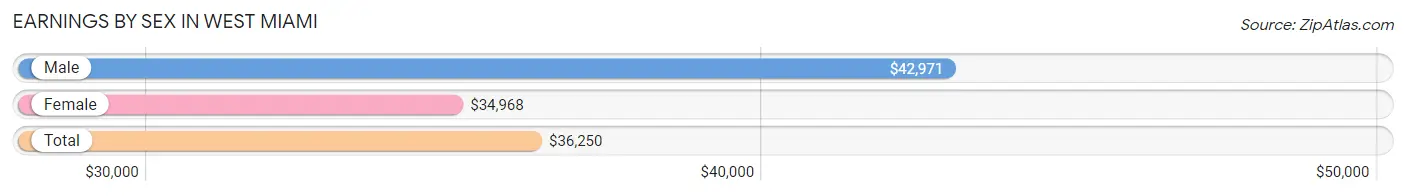
Earnings by Sex in West Miami
Average Earnings in West Miami are $36,250, $42,971 for men and $34,968 for women, a difference of 18.6%.
| Sex | Number | Average Earnings |
| Male | 2,255 (54.6%) | $42,971 |
| Female | 1,876 (45.4%) | $34,968 |
| Total | 4,131 (100.0%) | $36,250 |
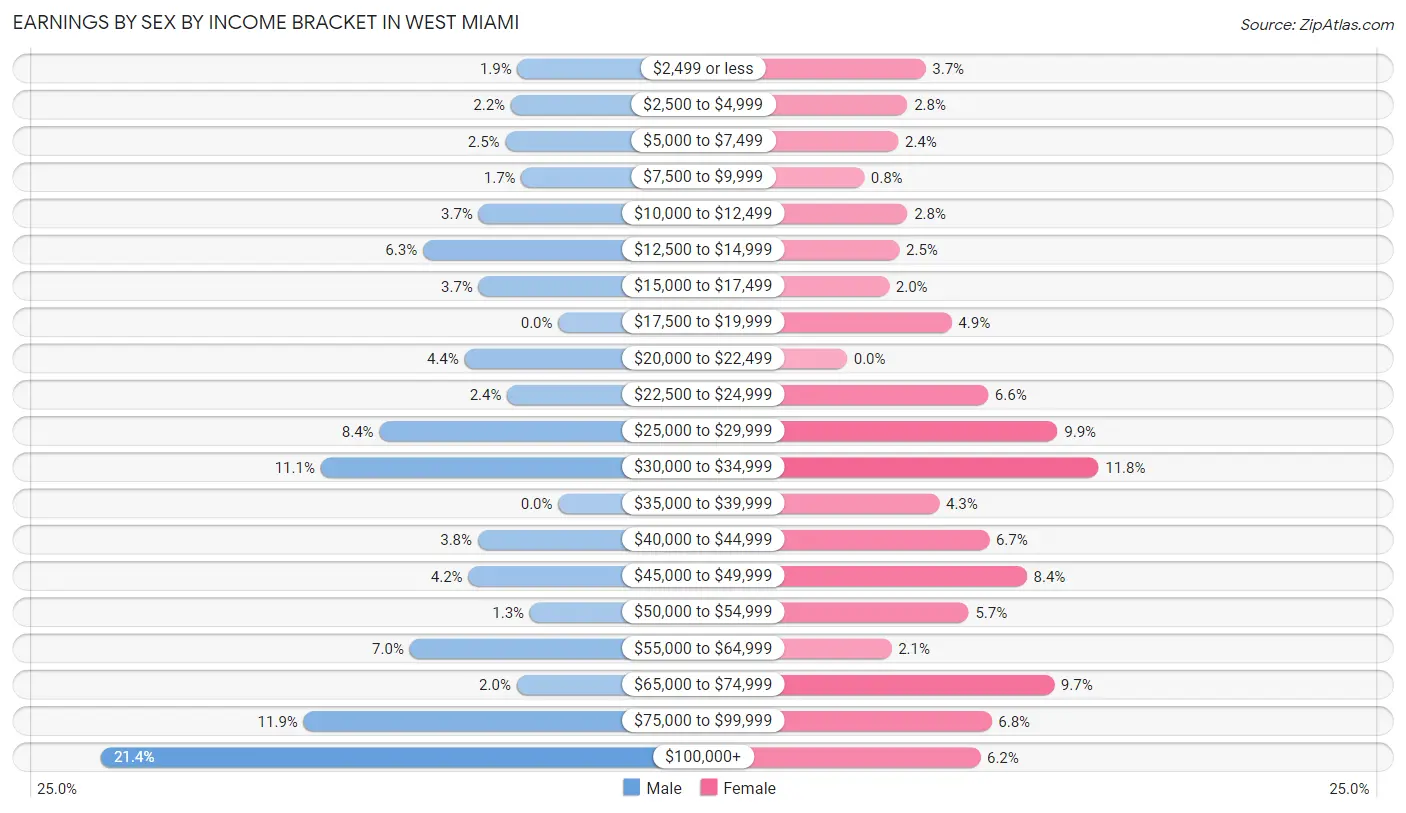
Earnings by Sex by Income Bracket in West Miami
The most common earnings brackets in West Miami are $100,000+ for men (483 | 21.4%) and $30,000 to $34,999 for women (221 | 11.8%).
| Income | Male | Female |
| $2,499 or less | 43 (1.9%) | 69 (3.7%) |
| $2,500 to $4,999 | 50 (2.2%) | 53 (2.8%) |
| $5,000 to $7,499 | 56 (2.5%) | 45 (2.4%) |
| $7,500 to $9,999 | 39 (1.7%) | 15 (0.8%) |
| $10,000 to $12,499 | 84 (3.7%) | 53 (2.8%) |
| $12,500 to $14,999 | 143 (6.3%) | 46 (2.5%) |
| $15,000 to $17,499 | 84 (3.7%) | 37 (2.0%) |
| $17,500 to $19,999 | 0 (0.0%) | 92 (4.9%) |
| $20,000 to $22,499 | 99 (4.4%) | 0 (0.0%) |
| $22,500 to $24,999 | 54 (2.4%) | 124 (6.6%) |
| $25,000 to $29,999 | 189 (8.4%) | 185 (9.9%) |
| $30,000 to $34,999 | 251 (11.1%) | 221 (11.8%) |
| $35,000 to $39,999 | 0 (0.0%) | 81 (4.3%) |
| $40,000 to $44,999 | 85 (3.8%) | 125 (6.7%) |
| $45,000 to $49,999 | 95 (4.2%) | 158 (8.4%) |
| $50,000 to $54,999 | 30 (1.3%) | 107 (5.7%) |
| $55,000 to $64,999 | 157 (7.0%) | 39 (2.1%) |
| $65,000 to $74,999 | 44 (1.9%) | 182 (9.7%) |
| $75,000 to $99,999 | 269 (11.9%) | 127 (6.8%) |
| $100,000+ | 483 (21.4%) | 117 (6.2%) |
| Total | 2,255 (100.0%) | 1,876 (100.0%) |
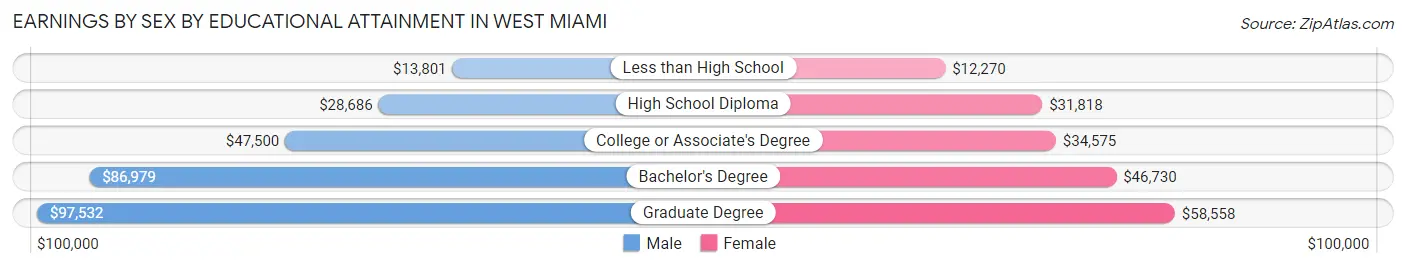
Earnings by Sex by Educational Attainment in West Miami
Average earnings in West Miami are $46,168 for men and $42,740 for women, a difference of 7.4%. Men with an educational attainment of graduate degree enjoy the highest average annual earnings of $97,532, while those with less than high school education earn the least with $13,801. Women with an educational attainment of graduate degree earn the most with the average annual earnings of $58,558, while those with less than high school education have the smallest earnings of $12,270.
| Educational Attainment | Male Income | Female Income |
| Less than High School | $13,801 | $12,270 |
| High School Diploma | $28,686 | $31,818 |
| College or Associate's Degree | $47,500 | $34,575 |
| Bachelor's Degree | $86,979 | $46,730 |
| Graduate Degree | $97,532 | $58,558 |
| Total | $46,168 | $42,740 |
Family Income in West Miami
Family Income Brackets in West Miami
According to the West Miami family income data, there are 448 families falling into the $100,000 to $149,999 income range, which is the most common income bracket and makes up 23.7% of all families. Conversely, the $10,000 to $14,999 income bracket is the least frequent group with only 36 families (1.9%) belonging to this category.
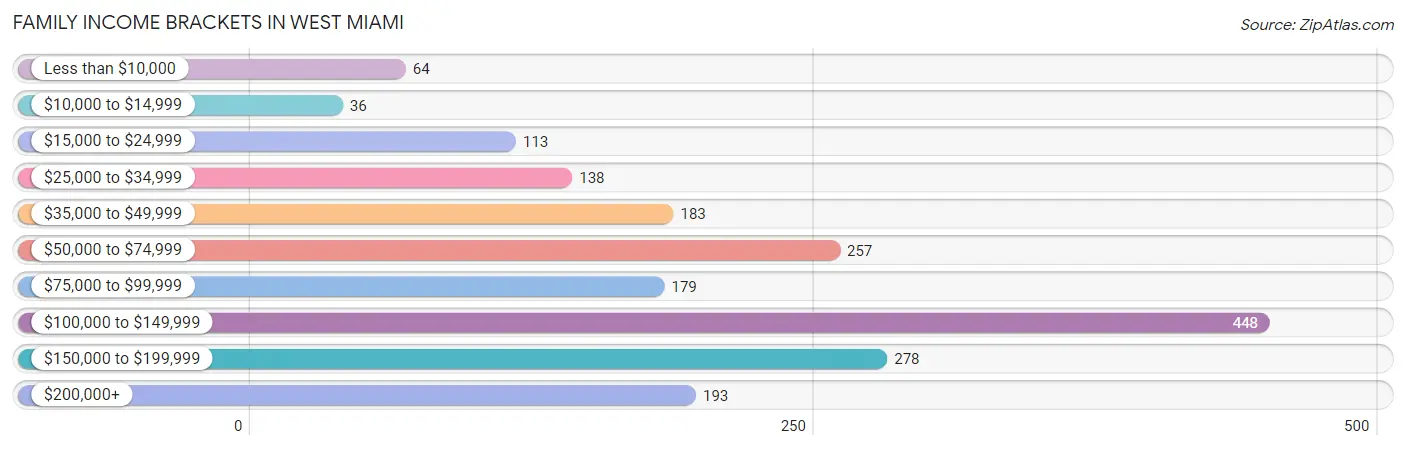
| Income Bracket | # Families | % Families |
| Less than $10,000 | 64 | 3.4% |
| $10,000 to $14,999 | 36 | 1.9% |
| $15,000 to $24,999 | 113 | 6.0% |
| $25,000 to $34,999 | 138 | 7.3% |
| $35,000 to $49,999 | 183 | 9.7% |
| $50,000 to $74,999 | 257 | 13.6% |
| $75,000 to $99,999 | 179 | 9.5% |
| $100,000 to $149,999 | 448 | 23.7% |
| $150,000 to $199,999 | 278 | 14.7% |
| $200,000+ | 193 | 10.2% |
Family Income by Famaliy Size in West Miami
4-person families (281 | 14.9%) account for the highest median family income in West Miami with $159,464 per family, while 4-person families (281 | 14.9%) have the highest median income of $39,866 per family member.
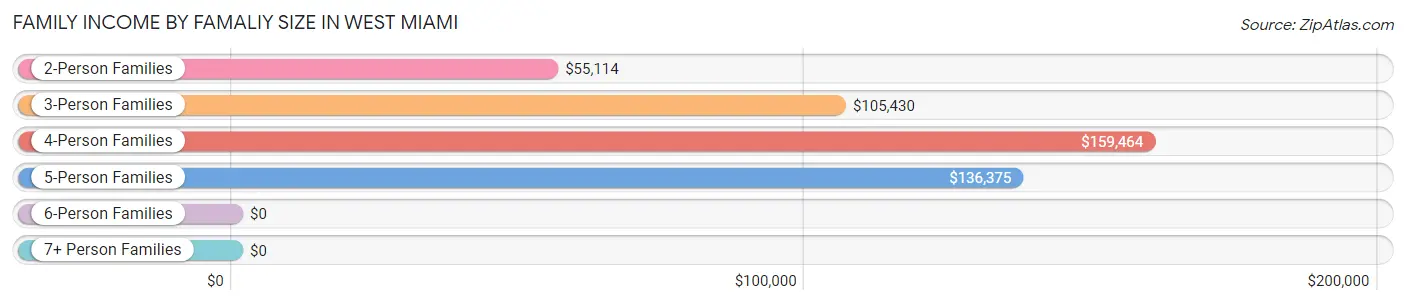
| Income Bracket | # Families | Median Income |
| 2-Person Families | 869 (46.0%) | $55,114 |
| 3-Person Families | 531 (28.1%) | $105,430 |
| 4-Person Families | 281 (14.9%) | $159,464 |
| 5-Person Families | 182 (9.6%) | $136,375 |
| 6-Person Families | 0 (0.0%) | $0 |
| 7+ Person Families | 26 (1.4%) | $0 |
| Total | 1,889 (100.0%) | $97,396 |
Family Income by Number of Earners in West Miami
The median family income in West Miami is $97,396, with families comprising 3+ earners (362) having the highest median family income of $168,000, while families with no earners (345) have the lowest median family income of $30,768, accounting for 19.2% and 18.3% of families, respectively.
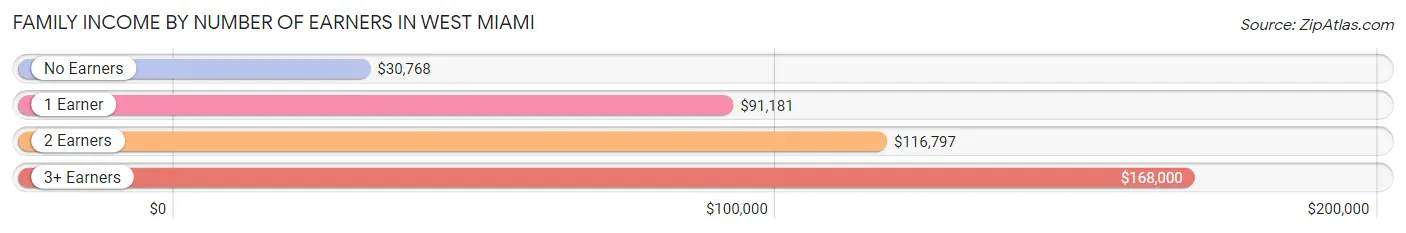
| Number of Earners | # Families | Median Income |
| No Earners | 345 (18.3%) | $30,768 |
| 1 Earner | 471 (24.9%) | $91,181 |
| 2 Earners | 711 (37.6%) | $116,797 |
| 3+ Earners | 362 (19.2%) | $168,000 |
| Total | 1,889 (100.0%) | $97,396 |
Household Income in West Miami
Household Income Brackets in West Miami
With 526 households falling in the category, the $100,000 to $149,999 income range is the most frequent in West Miami, accounting for 19.5% of all households. In contrast, only 59 households (2.2%) fall into the less than $10,000 income bracket, making it the least populous group.
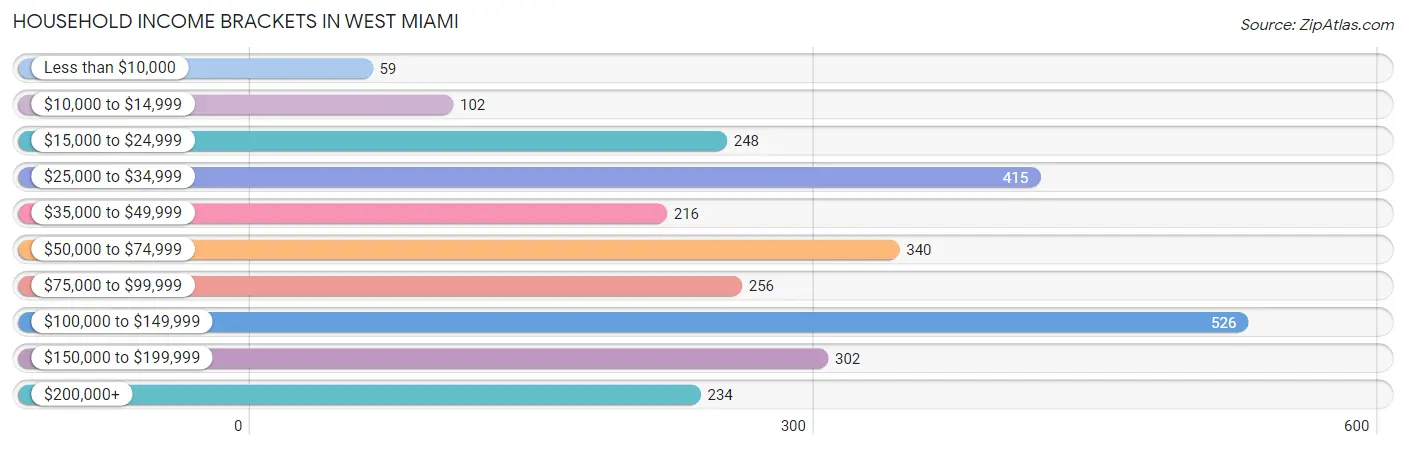
| Income Bracket | # Households | % Households |
| Less than $10,000 | 59 | 2.2% |
| $10,000 to $14,999 | 102 | 3.8% |
| $15,000 to $24,999 | 248 | 9.2% |
| $25,000 to $34,999 | 415 | 15.4% |
| $35,000 to $49,999 | 216 | 8.0% |
| $50,000 to $74,999 | 340 | 12.6% |
| $75,000 to $99,999 | 256 | 9.5% |
| $100,000 to $149,999 | 526 | 19.5% |
| $150,000 to $199,999 | 302 | 11.2% |
| $200,000+ | 234 | 8.7% |
Household Income by Householder Age in West Miami
The median household income in West Miami is $73,525, with the highest median household income of $111,677 found in the 45 to 64 years age bracket for the primary householder. A total of 1,023 households (38.0%) fall into this category. Meanwhile, the 65+ years age bracket for the primary householder has the lowest median household income of $33,386, with 776 households (28.8%) in this group.
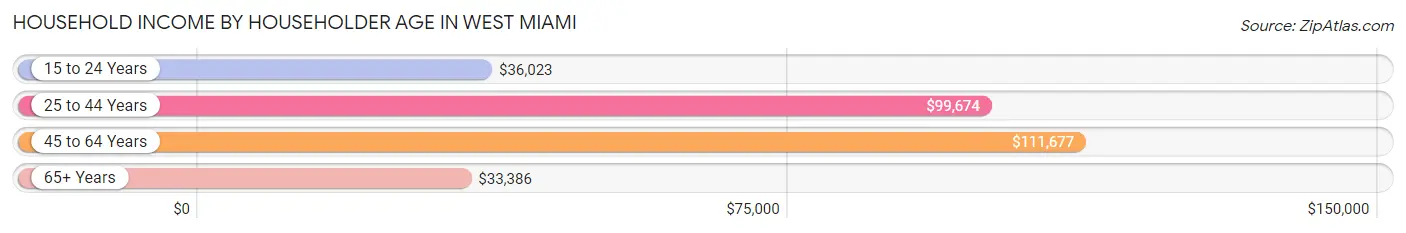
| Income Bracket | # Households | Median Income |
| 15 to 24 Years | 92 (3.4%) | $36,023 |
| 25 to 44 Years | 804 (29.8%) | $99,674 |
| 45 to 64 Years | 1,023 (38.0%) | $111,677 |
| 65+ Years | 776 (28.8%) | $33,386 |
| Total | 2,695 (100.0%) | $73,525 |
Poverty in West Miami
Income Below Poverty by Sex and Age in West Miami
With 12.7% poverty level for males and 11.9% for females among the residents of West Miami, 5 year old males and 75 year old and over females are the most vulnerable to poverty, with 11 males (100.0%) and 80 females (20.1%) in their respective age groups living below the poverty level.
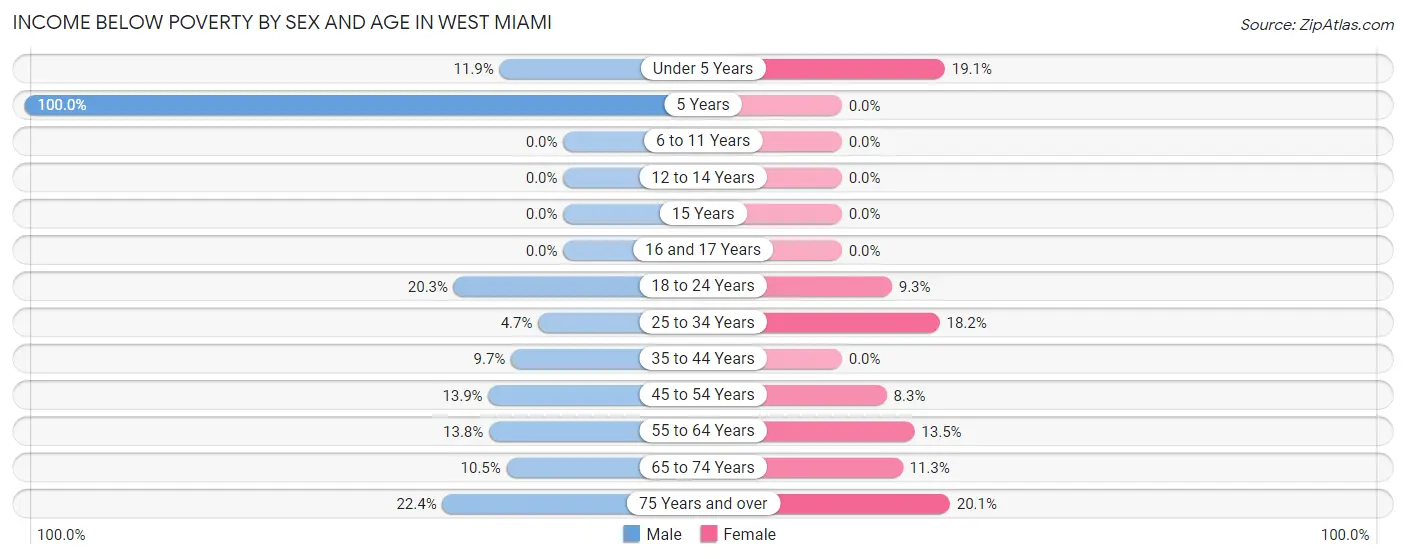
| Age Bracket | Male | Female |
| Under 5 Years | 25 (11.8%) | 87 (19.1%) |
| 5 Years | 11 (100.0%) | 0 (0.0%) |
| 6 to 11 Years | 0 (0.0%) | 0 (0.0%) |
| 12 to 14 Years | 0 (0.0%) | 0 (0.0%) |
| 15 Years | 0 (0.0%) | 0 (0.0%) |
| 16 and 17 Years | 0 (0.0%) | 0 (0.0%) |
| 18 to 24 Years | 76 (20.3%) | 27 (9.3%) |
| 25 to 34 Years | 21 (4.6%) | 92 (18.1%) |
| 35 to 44 Years | 57 (9.7%) | 0 (0.0%) |
| 45 to 54 Years | 73 (13.9%) | 40 (8.3%) |
| 55 to 64 Years | 66 (13.8%) | 81 (13.5%) |
| 65 to 74 Years | 32 (10.5%) | 30 (11.3%) |
| 75 Years and over | 72 (22.4%) | 80 (20.1%) |
| Total | 433 (12.7%) | 437 (11.9%) |
Income Above Poverty by Sex and Age in West Miami
According to the poverty statistics in West Miami, males aged 6 to 11 years and females aged 5 years are the age groups that are most secure financially, with 100.0% of males and 100.0% of females in these age groups living above the poverty line.
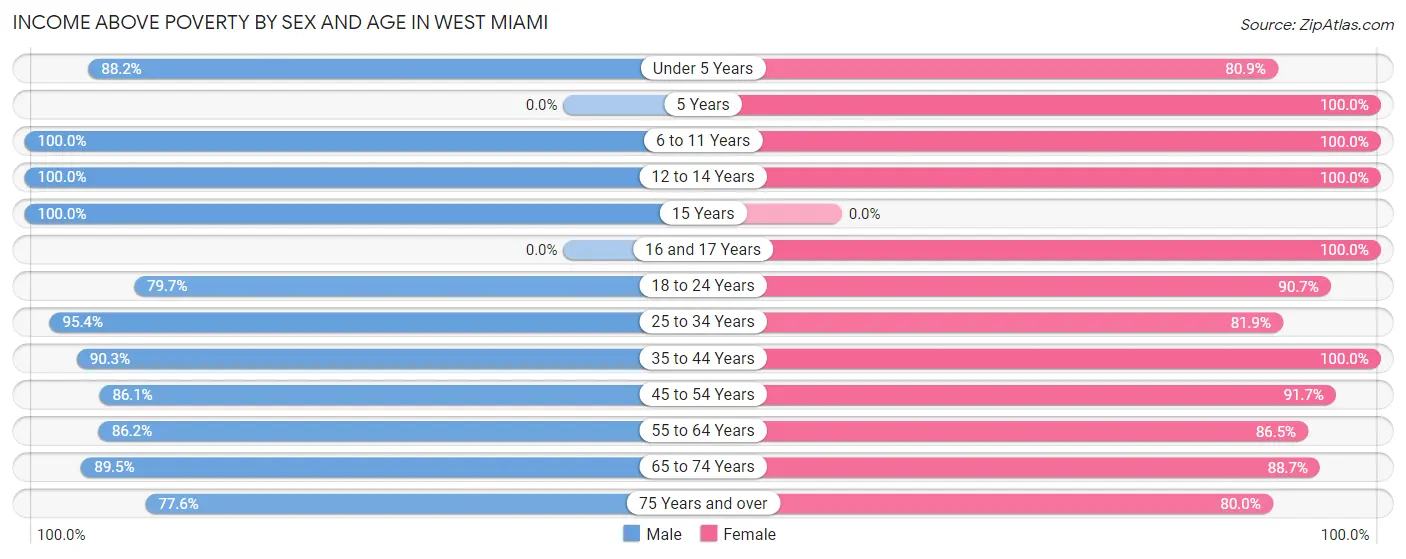
| Age Bracket | Male | Female |
| Under 5 Years | 186 (88.1%) | 368 (80.9%) |
| 5 Years | 0 (0.0%) | 45 (100.0%) |
| 6 to 11 Years | 77 (100.0%) | 53 (100.0%) |
| 12 to 14 Years | 65 (100.0%) | 91 (100.0%) |
| 15 Years | 14 (100.0%) | 0 (0.0%) |
| 16 and 17 Years | 0 (0.0%) | 33 (100.0%) |
| 18 to 24 Years | 298 (79.7%) | 264 (90.7%) |
| 25 to 34 Years | 431 (95.4%) | 415 (81.9%) |
| 35 to 44 Years | 531 (90.3%) | 462 (100.0%) |
| 45 to 54 Years | 452 (86.1%) | 440 (91.7%) |
| 55 to 64 Years | 413 (86.2%) | 520 (86.5%) |
| 65 to 74 Years | 272 (89.5%) | 236 (88.7%) |
| 75 Years and over | 249 (77.6%) | 319 (79.9%) |
| Total | 2,988 (87.3%) | 3,246 (88.1%) |
Income Below Poverty Among Married-Couple Families in West Miami
The poverty statistics for married-couple families in West Miami show that 9.2% or 109 of the total 1,181 families live below the poverty line. Families with no children have the highest poverty rate of 11.0%, comprising of 97 families. On the other hand, families with 3 or 4 children have the lowest poverty rate of 0.0%, which includes 0 families.
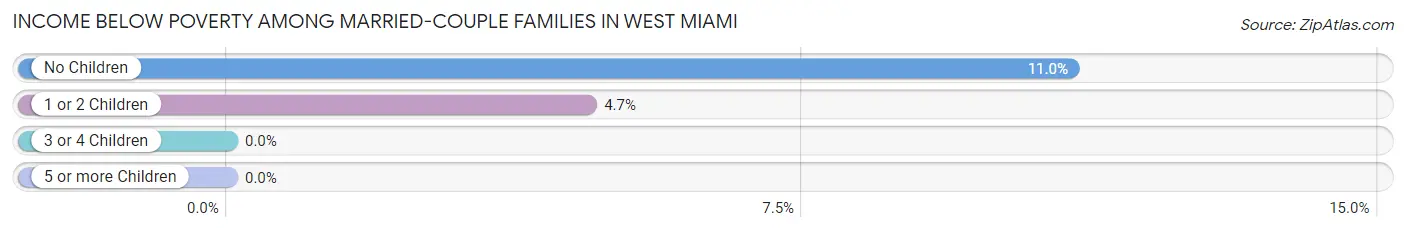
| Children | Above Poverty | Below Poverty |
| No Children | 786 (89.0%) | 97 (11.0%) |
| 1 or 2 Children | 244 (95.3%) | 12 (4.7%) |
| 3 or 4 Children | 42 (100.0%) | 0 (0.0%) |
| 5 or more Children | 0 (0.0%) | 0 (0.0%) |
| Total | 1,072 (90.8%) | 109 (9.2%) |
Income Below Poverty Among Single-Parent Households in West Miami
According to the poverty data in West Miami, 11.8% or 24 single-father households and 8.5% or 43 single-mother households are living below the poverty line. Among single-father households, those with no children have the highest poverty rate, with 24 households (17.5%) experiencing poverty. Likewise, among single-mother households, those with 1 or 2 children have the highest poverty rate, with 43 households (14.1%) falling below the poverty line.
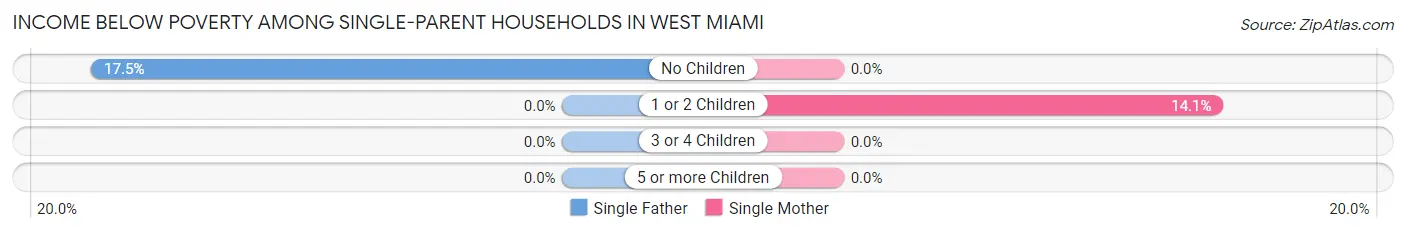
| Children | Single Father | Single Mother |
| No Children | 24 (17.5%) | 0 (0.0%) |
| 1 or 2 Children | 0 (0.0%) | 43 (14.1%) |
| 3 or 4 Children | 0 (0.0%) | 0 (0.0%) |
| 5 or more Children | 0 (0.0%) | 0 (0.0%) |
| Total | 24 (11.8%) | 43 (8.5%) |
Income Below Poverty Among Married-Couple vs Single-Parent Households in West Miami
The poverty data for West Miami shows that 109 of the married-couple family households (9.2%) and 67 of the single-parent households (9.5%) are living below the poverty level. Within the married-couple family households, those with no children have the highest poverty rate, with 97 households (11.0%) falling below the poverty line. Among the single-parent households, those with 1 or 2 children have the highest poverty rate, with 43 household (11.6%) living below poverty.
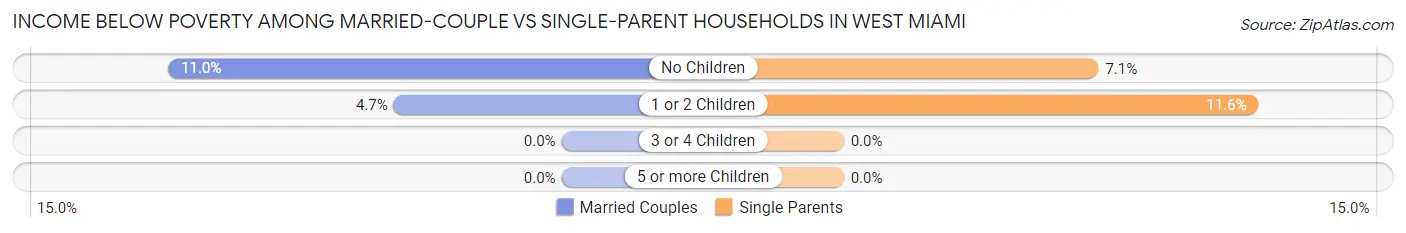
| Children | Married-Couple Families | Single-Parent Households |
| No Children | 97 (11.0%) | 24 (7.1%) |
| 1 or 2 Children | 12 (4.7%) | 43 (11.6%) |
| 3 or 4 Children | 0 (0.0%) | 0 (0.0%) |
| 5 or more Children | 0 (0.0%) | 0 (0.0%) |
| Total | 109 (9.2%) | 67 (9.5%) |
Race in West Miami
The most populous races in West Miami are Hispanic or Latino (5,981 | 84.2%), White / Caucasian (3,604 | 50.7%), and Two or more Races (2,462 | 34.7%).
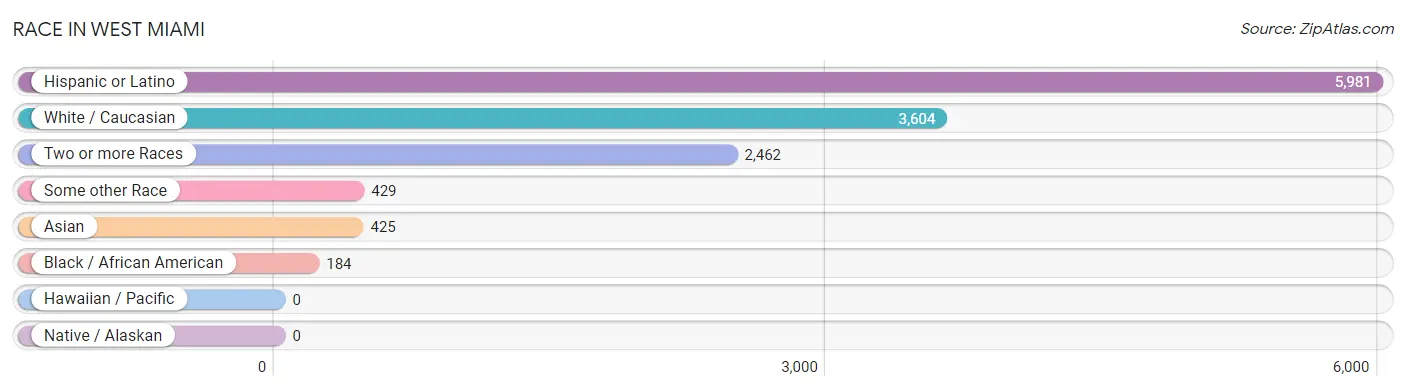
| Race | # Population | % Population |
| Asian | 425 | 6.0% |
| Black / African American | 184 | 2.6% |
| Hawaiian / Pacific | 0 | 0.0% |
| Hispanic or Latino | 5,981 | 84.2% |
| Native / Alaskan | 0 | 0.0% |
| White / Caucasian | 3,604 | 50.7% |
| Two or more Races | 2,462 | 34.7% |
| Some other Race | 429 | 6.0% |
| Total | 7,104 | 100.0% |
Ancestry in West Miami
The most populous ancestries reported in West Miami are Cuban (3,825 | 53.8%), South American (1,318 | 18.5%), Venezuelan (584 | 8.2%), Colombian (393 | 5.5%), and Central American (361 | 5.1%), together accounting for 91.2% of all West Miami residents.
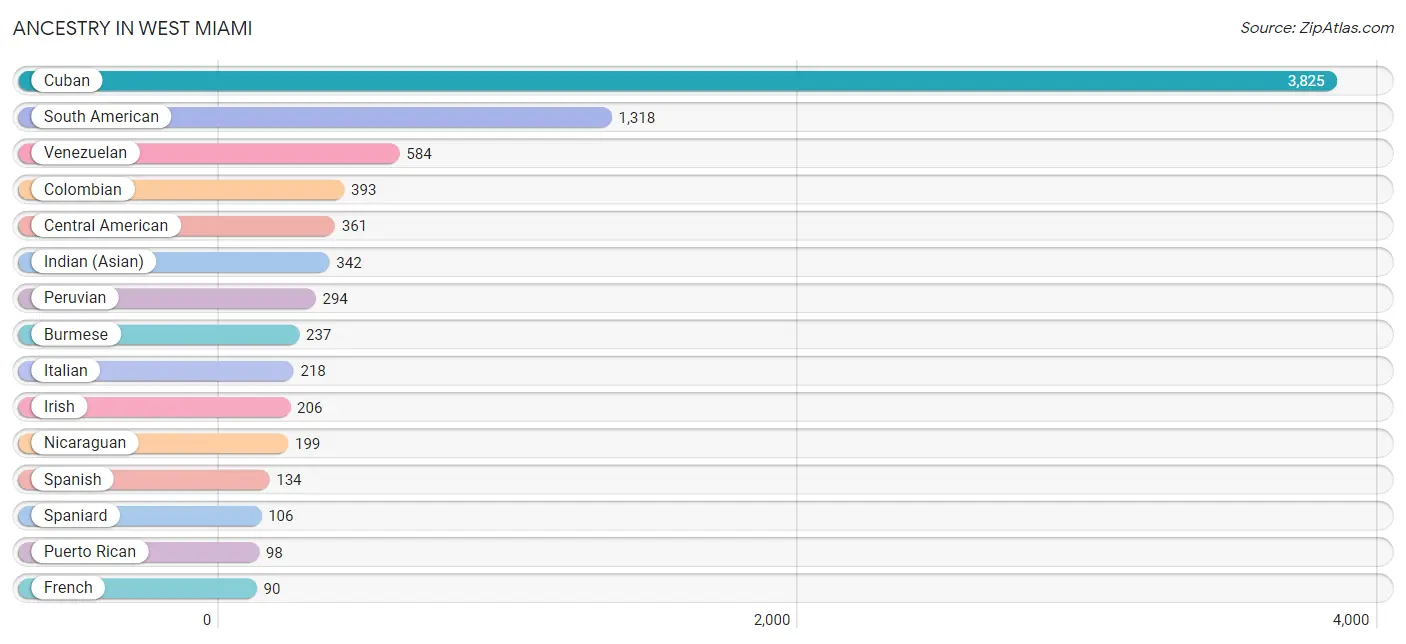
| Ancestry | # Population | % Population |
| American | 71 | 1.0% |
| Arab | 22 | 0.3% |
| Argentinean | 39 | 0.5% |
| Austrian | 26 | 0.4% |
| Basque | 23 | 0.3% |
| Belgian | 74 | 1.0% |
| Brazilian | 13 | 0.2% |
| British | 17 | 0.2% |
| Burmese | 237 | 3.3% |
| Central American | 361 | 5.1% |
| Chilean | 8 | 0.1% |
| Colombian | 393 | 5.5% |
| Cuban | 3,825 | 53.8% |
| Dominican | 45 | 0.6% |
| Eastern European | 8 | 0.1% |
| English | 62 | 0.9% |
| Finnish | 11 | 0.2% |
| French | 90 | 1.3% |
| German | 88 | 1.2% |
| Guatemalan | 53 | 0.7% |
| Honduran | 80 | 1.1% |
| Indian (Asian) | 342 | 4.8% |
| Irish | 206 | 2.9% |
| Italian | 218 | 3.1% |
| Korean | 77 | 1.1% |
| Lebanese | 22 | 0.3% |
| Mexican | 77 | 1.1% |
| Nicaraguan | 199 | 2.8% |
| Peruvian | 294 | 4.1% |
| Polish | 86 | 1.2% |
| Puerto Rican | 98 | 1.4% |
| Russian | 12 | 0.2% |
| Salvadoran | 29 | 0.4% |
| Scottish | 12 | 0.2% |
| South American | 1,318 | 18.5% |
| Spaniard | 106 | 1.5% |
| Spanish | 134 | 1.9% |
| Sri Lankan | 11 | 0.2% |
| Thai | 20 | 0.3% |
| Ukrainian | 23 | 0.3% |
| Venezuelan | 584 | 8.2% |
| Vietnamese | 52 | 0.7% | View All 42 Rows |
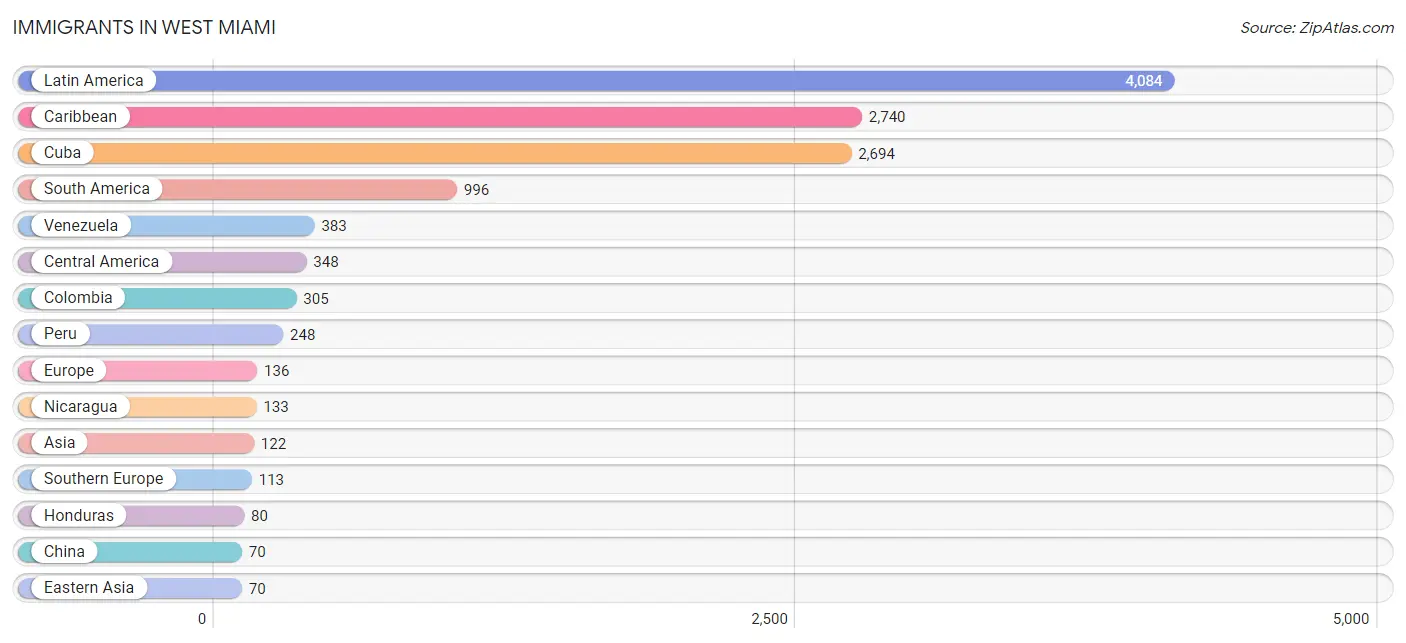
Immigrants in West Miami
The most numerous immigrant groups reported in West Miami came from Latin America (4,084 | 57.5%), Caribbean (2,740 | 38.6%), Cuba (2,694 | 37.9%), South America (996 | 14.0%), and Venezuela (383 | 5.4%), together accounting for 153.4% of all West Miami residents.
| Immigration Origin | # Population | % Population |
| Argentina | 39 | 0.5% |
| Asia | 122 | 1.7% |
| Bangladesh | 52 | 0.7% |
| Brazil | 13 | 0.2% |
| Canada | 23 | 0.3% |
| Caribbean | 2,740 | 38.6% |
| Central America | 348 | 4.9% |
| Chile | 8 | 0.1% |
| China | 70 | 1.0% |
| Colombia | 305 | 4.3% |
| Cuba | 2,694 | 37.9% |
| Dominican Republic | 46 | 0.6% |
| Eastern Asia | 70 | 1.0% |
| Eastern Europe | 23 | 0.3% |
| El Salvador | 19 | 0.3% |
| Europe | 136 | 1.9% |
| Guatemala | 53 | 0.7% |
| Honduras | 80 | 1.1% |
| Italy | 46 | 0.6% |
| Latin America | 4,084 | 57.5% |
| Mexico | 63 | 0.9% |
| Nicaragua | 133 | 1.9% |
| Peru | 248 | 3.5% |
| South America | 996 | 14.0% |
| South Central Asia | 52 | 0.7% |
| Southern Europe | 113 | 1.6% |
| Spain | 67 | 0.9% |
| Ukraine | 23 | 0.3% |
| Venezuela | 383 | 5.4% | View All 29 Rows |
Sex and Age in West Miami
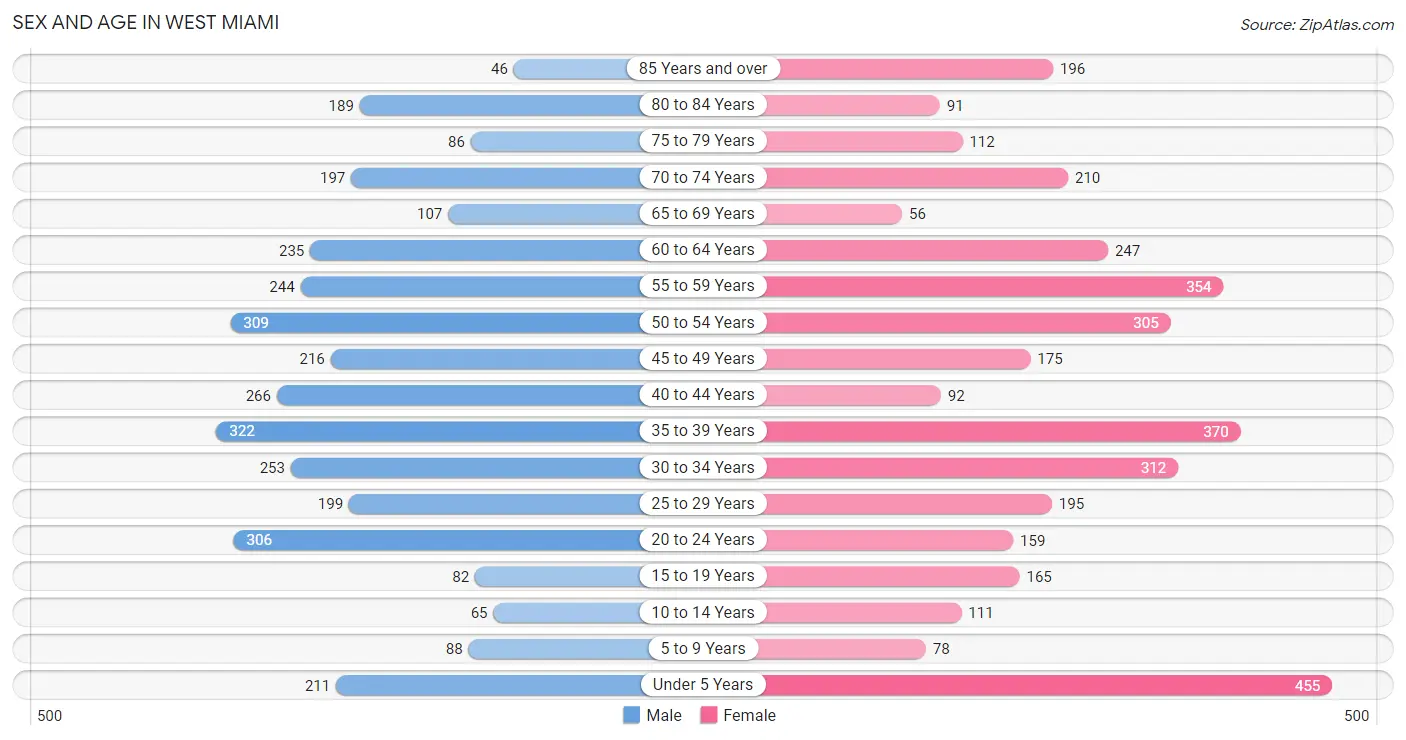
Sex and Age in West Miami
The most populous age groups in West Miami are 35 to 39 Years (322 | 9.4%) for men and Under 5 Years (455 | 12.3%) for women.
| Age Bracket | Male | Female |
| Under 5 Years | 211 (6.2%) | 455 (12.3%) |
| 5 to 9 Years | 88 (2.6%) | 78 (2.1%) |
| 10 to 14 Years | 65 (1.9%) | 111 (3.0%) |
| 15 to 19 Years | 82 (2.4%) | 165 (4.5%) |
| 20 to 24 Years | 306 (8.9%) | 159 (4.3%) |
| 25 to 29 Years | 199 (5.8%) | 195 (5.3%) |
| 30 to 34 Years | 253 (7.4%) | 312 (8.5%) |
| 35 to 39 Years | 322 (9.4%) | 370 (10.1%) |
| 40 to 44 Years | 266 (7.8%) | 92 (2.5%) |
| 45 to 49 Years | 216 (6.3%) | 175 (4.8%) |
| 50 to 54 Years | 309 (9.0%) | 305 (8.3%) |
| 55 to 59 Years | 244 (7.1%) | 354 (9.6%) |
| 60 to 64 Years | 235 (6.9%) | 247 (6.7%) |
| 65 to 69 Years | 107 (3.1%) | 56 (1.5%) |
| 70 to 74 Years | 197 (5.8%) | 210 (5.7%) |
| 75 to 79 Years | 86 (2.5%) | 112 (3.0%) |
| 80 to 84 Years | 189 (5.5%) | 91 (2.5%) |
| 85 Years and over | 46 (1.3%) | 196 (5.3%) |
| Total | 3,421 (100.0%) | 3,683 (100.0%) |
Families and Households in West Miami
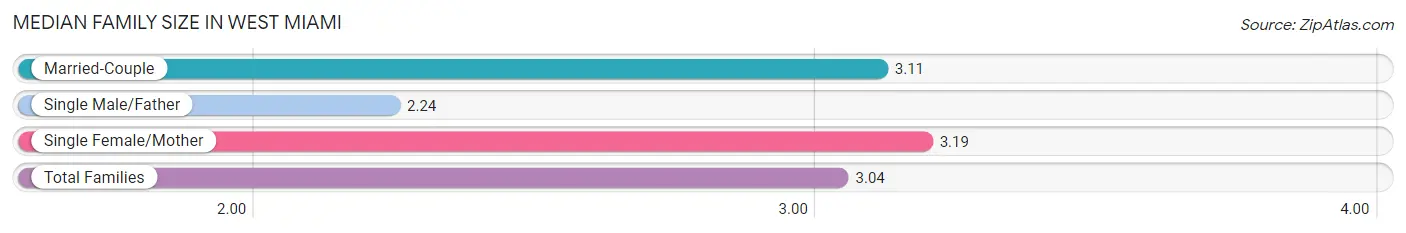
Median Family Size in West Miami
The median family size in West Miami is 3.04 persons per family, with single female/mother families (504 | 26.7%) accounting for the largest median family size of 3.19 persons per family. On the other hand, single male/father families (204 | 10.8%) represent the smallest median family size with 2.24 persons per family.
| Family Type | # Families | Family Size |
| Married-Couple | 1,181 (62.5%) | 3.11 |
| Single Male/Father | 204 (10.8%) | 2.24 |
| Single Female/Mother | 504 (26.7%) | 3.19 |
| Total Families | 1,889 (100.0%) | 3.04 |
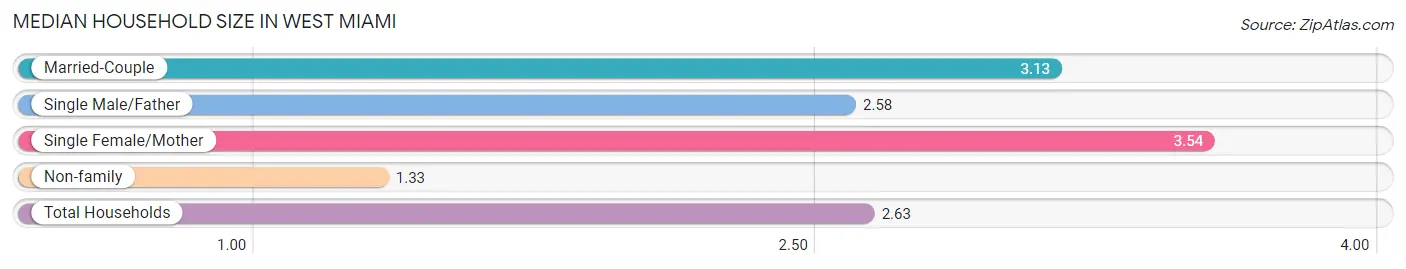
Median Household Size in West Miami
The median household size in West Miami is 2.63 persons per household, with single female/mother households (504 | 18.7%) accounting for the largest median household size of 3.54 persons per household. non-family households (806 | 29.9%) represent the smallest median household size with 1.33 persons per household.
| Household Type | # Households | Household Size |
| Married-Couple | 1,181 (43.8%) | 3.13 |
| Single Male/Father | 204 (7.6%) | 2.58 |
| Single Female/Mother | 504 (18.7%) | 3.54 |
| Non-family | 806 (29.9%) | 1.33 |
| Total Households | 2,695 (100.0%) | 2.63 |
Household Size by Marriage Status in West Miami
Out of a total of 2,695 households in West Miami, 1,889 (70.1%) are family households, while 806 (29.9%) are nonfamily households. The most numerous type of family households are 2-person households, comprising 738, and the most common type of nonfamily households are 1-person households, comprising 572.
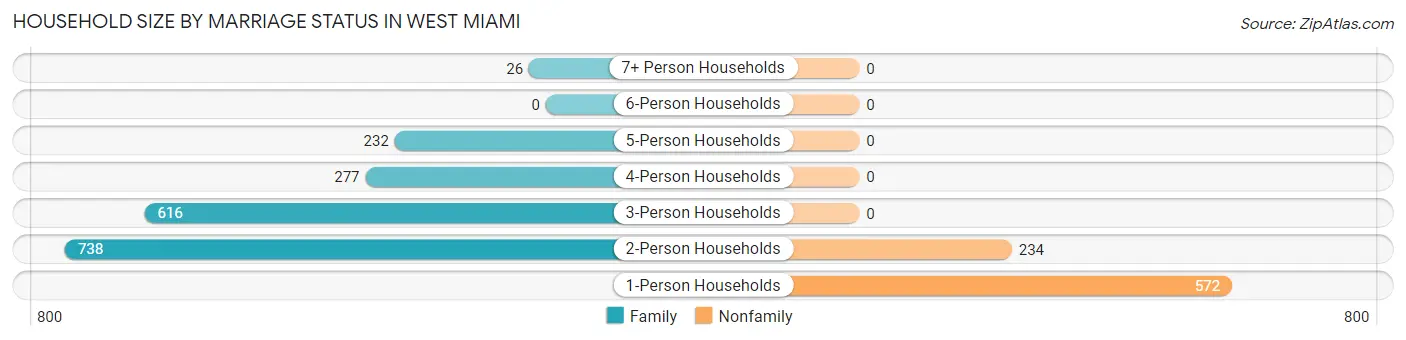
| Household Size | Family Households | Nonfamily Households |
| 1-Person Households | - | 572 (21.2%) |
| 2-Person Households | 738 (27.4%) | 234 (8.7%) |
| 3-Person Households | 616 (22.9%) | 0 (0.0%) |
| 4-Person Households | 277 (10.3%) | 0 (0.0%) |
| 5-Person Households | 232 (8.6%) | 0 (0.0%) |
| 6-Person Households | 0 (0.0%) | 0 (0.0%) |
| 7+ Person Households | 26 (1.0%) | 0 (0.0%) |
| Total | 1,889 (70.1%) | 806 (29.9%) |
Female Fertility in West Miami
Fertility by Age in West Miami
Average fertility rate in West Miami is 122.0 births per 1,000 women. Women in the age bracket of 35 to 50 years have the highest fertility rate with 233.0 births per 1,000 women. Women in the age bracket of 35 to 50 years acount for 84.0% of all women with births.
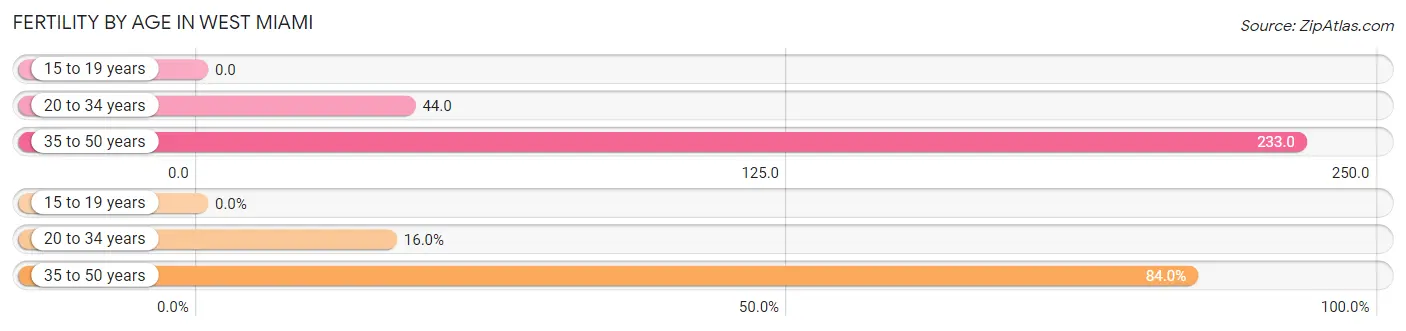
| Age Bracket | Women with Births | Births / 1,000 Women |
| 15 to 19 years | 0 (0.0%) | 0.0 |
| 20 to 34 years | 29 (16.0%) | 44.0 |
| 35 to 50 years | 152 (84.0%) | 233.0 |
| Total | 181 (100.0%) | 122.0 |
Fertility by Age by Marriage Status in West Miami
38.7% of women with births (181) in West Miami are married. The highest percentage of unmarried women with births falls into 20 to 34 years age bracket with 100.0% of them unmarried at the time of birth, while the lowest percentage of unmarried women with births belong to 35 to 50 years age bracket with 53.9% of them unmarried.
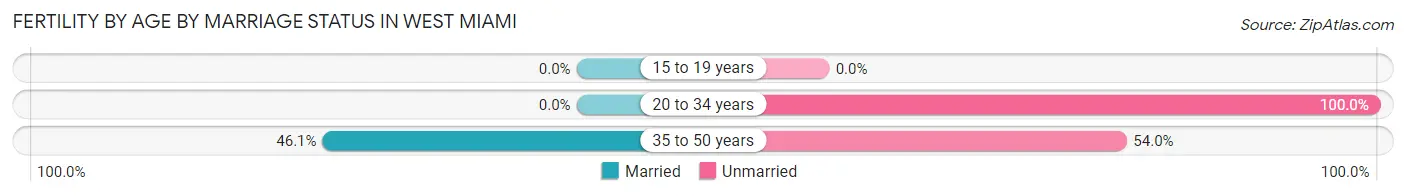
| Age Bracket | Married | Unmarried |
| 15 to 19 years | 0 (0.0%) | 0 (0.0%) |
| 20 to 34 years | 0 (0.0%) | 29 (100.0%) |
| 35 to 50 years | 70 (46.1%) | 82 (53.9%) |
| Total | 70 (38.7%) | 111 (61.3%) |
Fertility by Education in West Miami
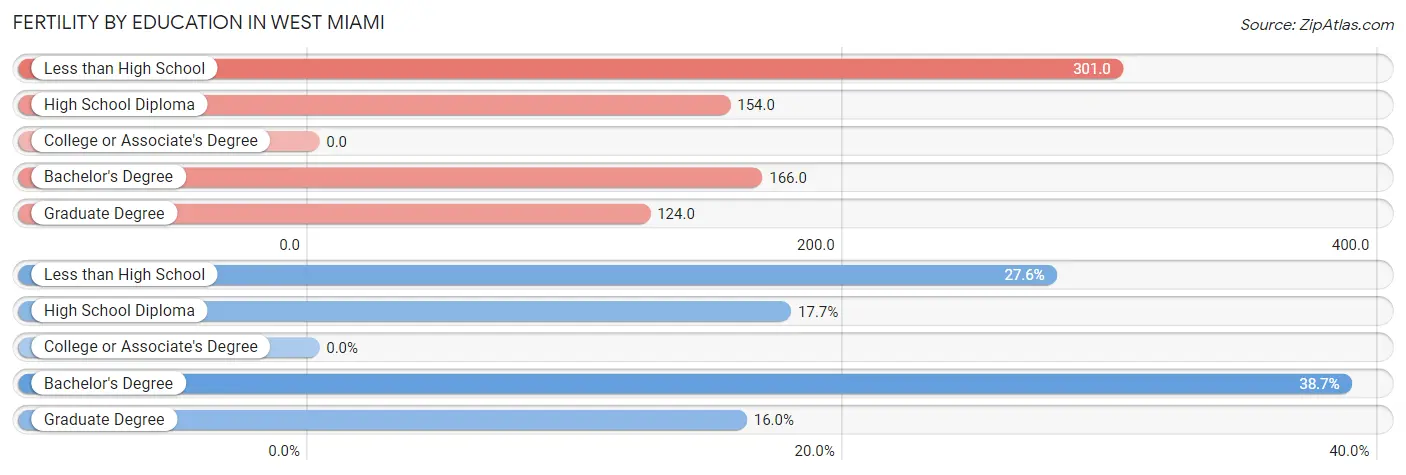
| Educational Attainment | Women with Births | Births / 1,000 Women |
| Less than High School | 50 (27.6%) | 301.0 |
| High School Diploma | 32 (17.7%) | 154.0 |
| College or Associate's Degree | 0 (0.0%) | 0.0 |
| Bachelor's Degree | 70 (38.7%) | 166.0 |
| Graduate Degree | 29 (16.0%) | 124.0 |
| Total | 181 (100.0%) | 122.0 |
Fertility by Education by Marriage Status in West Miami
61.3% of women with births in West Miami are unmarried. Women with the educational attainment of bachelor's degree are most likely to be married with 100.0% of them married at childbirth, while women with the educational attainment of less than high school are least likely to be married with 100.0% of them unmarried at childbirth.
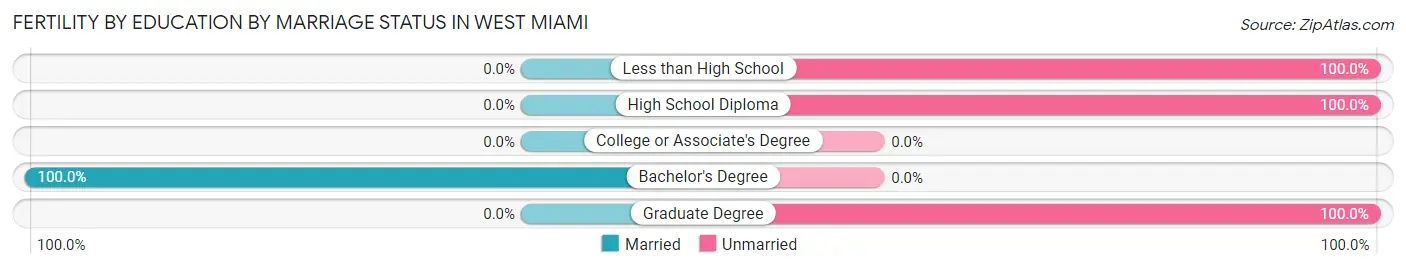
| Educational Attainment | Married | Unmarried |
| Less than High School | 0 (0.0%) | 50 (100.0%) |
| High School Diploma | 0 (0.0%) | 32 (100.0%) |
| College or Associate's Degree | 0 (0.0%) | 0 (0.0%) |
| Bachelor's Degree | 70 (100.0%) | 0 (0.0%) |
| Graduate Degree | 0 (0.0%) | 29 (100.0%) |
| Total | 70 (38.7%) | 111 (61.3%) |
Employment Characteristics in West Miami
Employment by Class of Employer in West Miami
Among the 3,551 employed individuals in West Miami, private company employees (2,475 | 69.7%), not-for-profit organizations (247 | 7.0%), and local government employees (227 | 6.4%) make up the most common classes of employment.
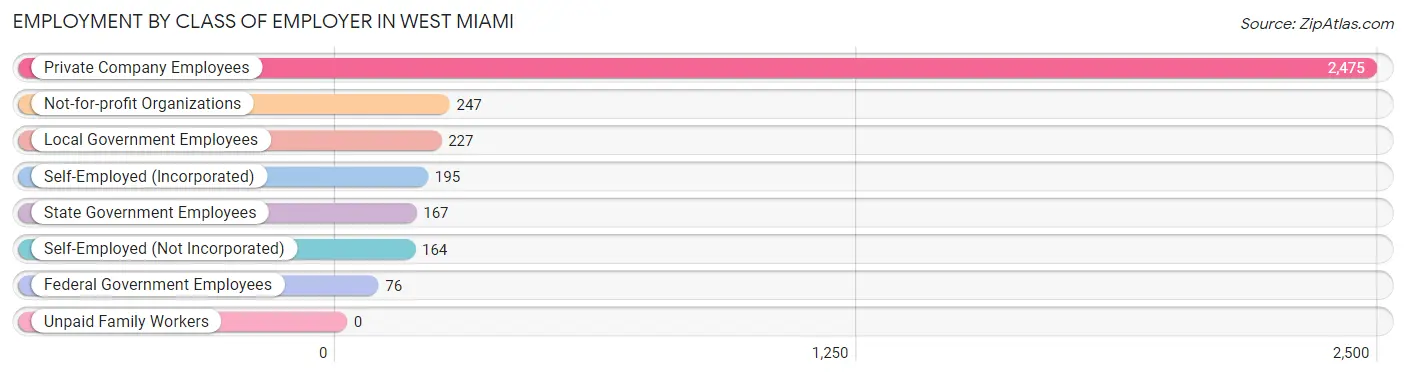
| Employer Class | # Employees | % Employees |
| Private Company Employees | 2,475 | 69.7% |
| Self-Employed (Incorporated) | 195 | 5.5% |
| Self-Employed (Not Incorporated) | 164 | 4.6% |
| Not-for-profit Organizations | 247 | 7.0% |
| Local Government Employees | 227 | 6.4% |
| State Government Employees | 167 | 4.7% |
| Federal Government Employees | 76 | 2.1% |
| Unpaid Family Workers | 0 | 0.0% |
| Total | 3,551 | 100.0% |
Employment Status by Age in West Miami
According to the labor force statistics for West Miami, out of the total population over 16 years of age (6,082), 65.0% or 3,953 individuals are in the labor force, with 3.7% or 146 of them unemployed. The age group with the highest labor force participation rate is 55 to 59 years, with 90.6% or 542 individuals in the labor force. Within the labor force, the 16 to 19 years age range has the highest percentage of unemployed individuals, with 12.2% or 10 of them being unemployed.
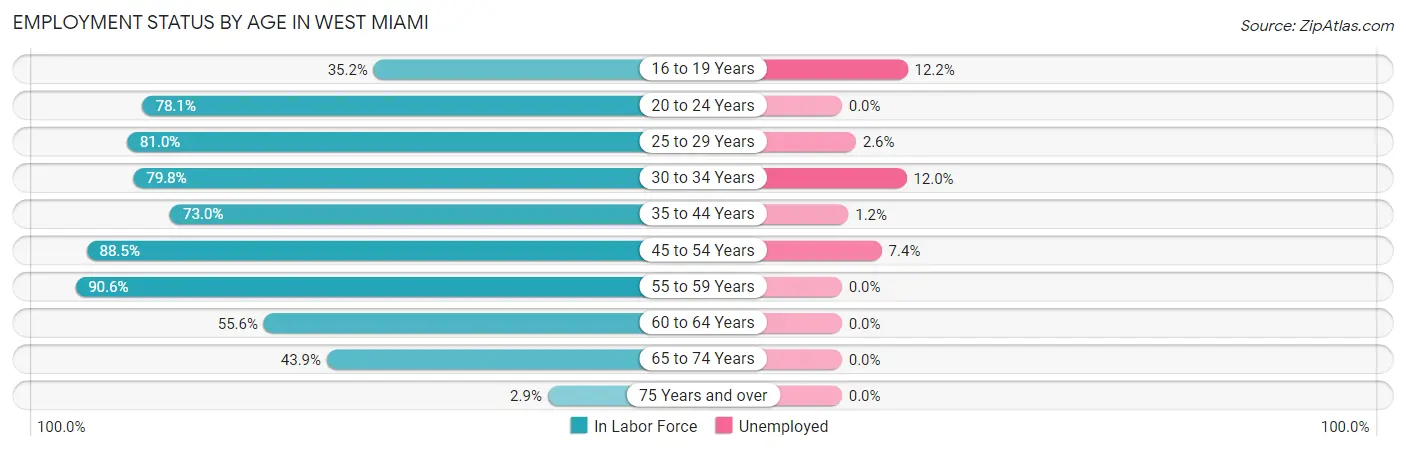
| Age Bracket | In Labor Force | Unemployed |
| 16 to 19 Years | 82 (35.2%) | 10 (12.2%) |
| 20 to 24 Years | 363 (78.1%) | 0 (0.0%) |
| 25 to 29 Years | 319 (81.0%) | 8 (2.6%) |
| 30 to 34 Years | 451 (79.8%) | 54 (12.0%) |
| 35 to 44 Years | 766 (73.0%) | 9 (1.2%) |
| 45 to 54 Years | 889 (88.5%) | 66 (7.4%) |
| 55 to 59 Years | 542 (90.6%) | 0 (0.0%) |
| 60 to 64 Years | 268 (55.6%) | 0 (0.0%) |
| 65 to 74 Years | 250 (43.9%) | 0 (0.0%) |
| 75 Years and over | 21 (2.9%) | 0 (0.0%) |
| Total | 3,953 (65.0%) | 146 (3.7%) |
Employment Status by Educational Attainment in West Miami
According to labor force statistics for West Miami, 79.0% of individuals (3,234) out of the total population between 25 and 64 years of age (4,094) are in the labor force, with 4.2% or 136 of them being unemployed. The group with the highest labor force participation rate are those with the educational attainment of college / associate degree, with 85.6% or 1,043 individuals in the labor force. Within the labor force, individuals with high school diploma education have the highest percentage of unemployment, with 6.9% or 42 of them being unemployed.
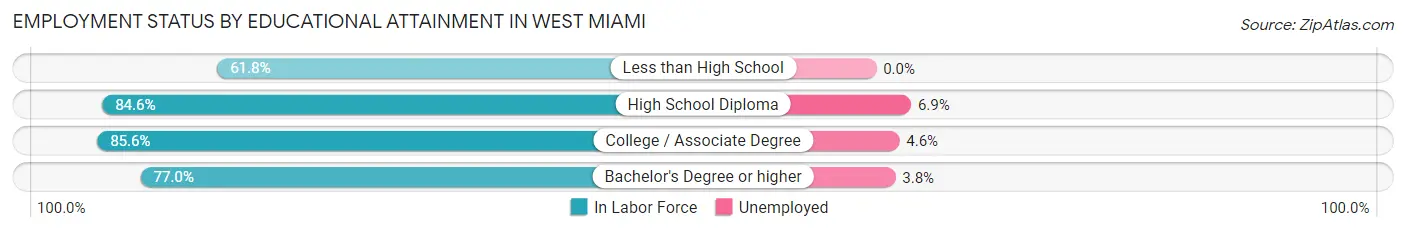
| Educational Attainment | In Labor Force | Unemployed |
| Less than High School | 314 (61.8%) | 0 (0.0%) |
| High School Diploma | 613 (84.6%) | 50 (6.9%) |
| College / Associate Degree | 1,043 (85.6%) | 56 (4.6%) |
| Bachelor's Degree or higher | 1,265 (77.0%) | 62 (3.8%) |
| Total | 3,234 (79.0%) | 172 (4.2%) |
Employment Occupations by Sex in West Miami
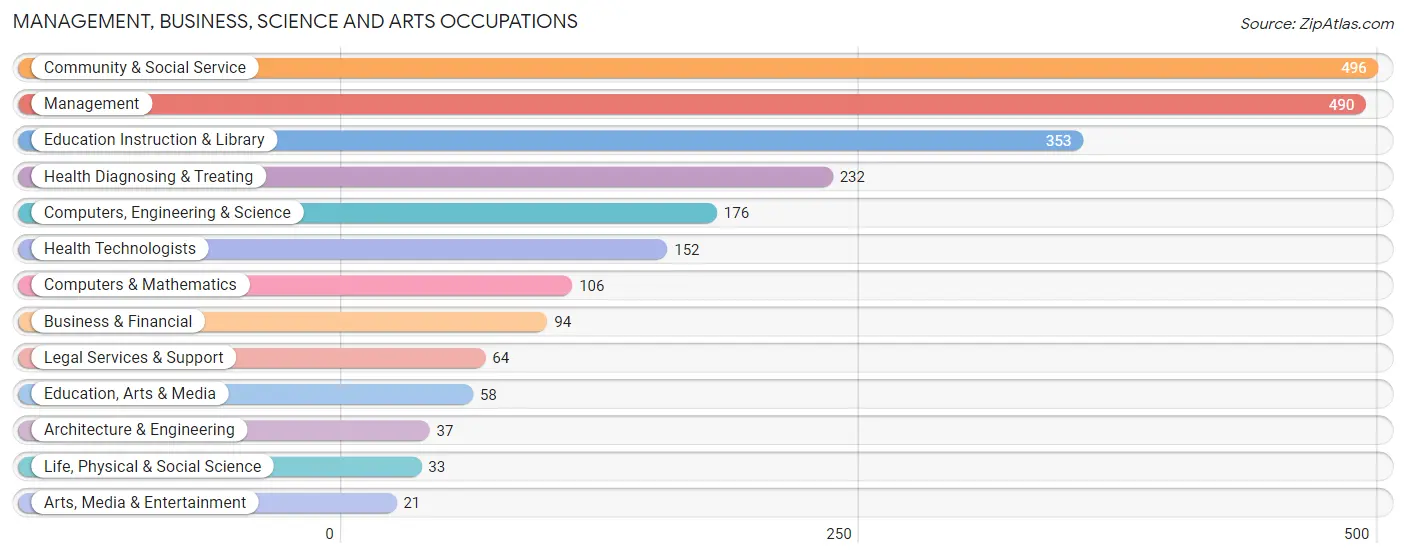
Management, Business, Science and Arts Occupations
The most common Management, Business, Science and Arts occupations in West Miami are Community & Social Service (496 | 13.2%), Management (490 | 13.1%), Education Instruction & Library (353 | 9.4%), Health Diagnosing & Treating (232 | 6.2%), and Computers, Engineering & Science (176 | 4.7%).
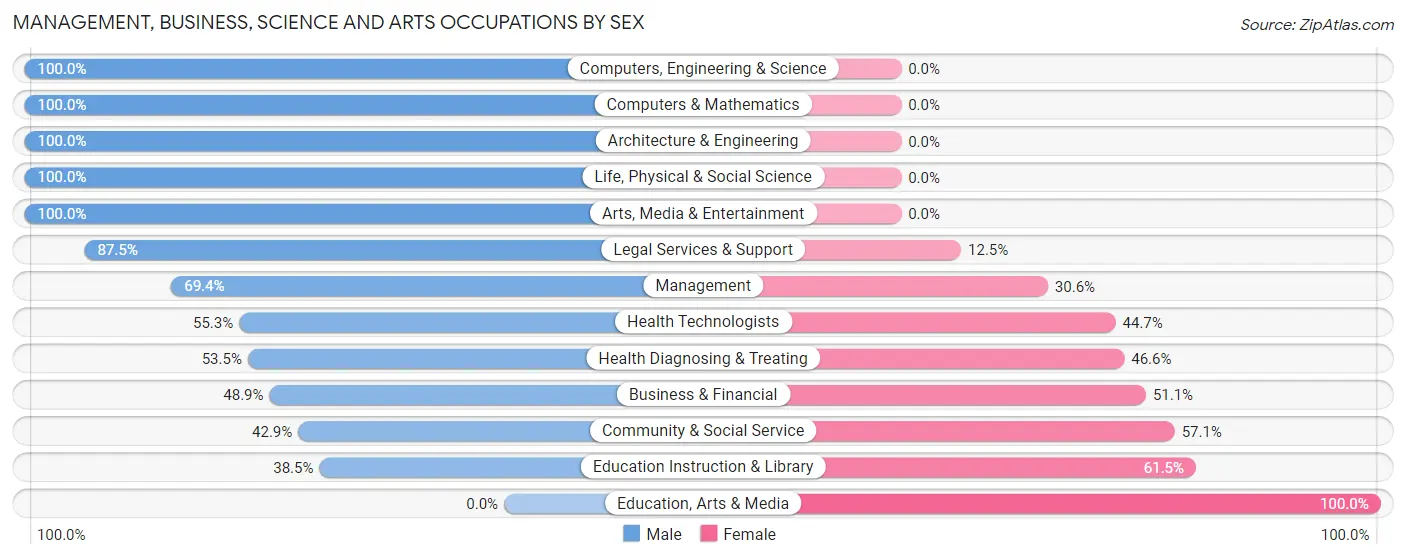
Management, Business, Science and Arts Occupations by Sex
Within the Management, Business, Science and Arts occupations in West Miami, the most male-oriented occupations are Computers, Engineering & Science (100.0%), Computers & Mathematics (100.0%), and Architecture & Engineering (100.0%), while the most female-oriented occupations are Education, Arts & Media (100.0%), Education Instruction & Library (61.5%), and Community & Social Service (57.1%).
| Occupation | Male | Female |
| Management | 340 (69.4%) | 150 (30.6%) |
| Business & Financial | 46 (48.9%) | 48 (51.1%) |
| Computers, Engineering & Science | 176 (100.0%) | 0 (0.0%) |
| Computers & Mathematics | 106 (100.0%) | 0 (0.0%) |
| Architecture & Engineering | 37 (100.0%) | 0 (0.0%) |
| Life, Physical & Social Science | 33 (100.0%) | 0 (0.0%) |
| Community & Social Service | 213 (42.9%) | 283 (57.1%) |
| Education, Arts & Media | 0 (0.0%) | 58 (100.0%) |
| Legal Services & Support | 56 (87.5%) | 8 (12.5%) |
| Education Instruction & Library | 136 (38.5%) | 217 (61.5%) |
| Arts, Media & Entertainment | 21 (100.0%) | 0 (0.0%) |
| Health Diagnosing & Treating | 124 (53.4%) | 108 (46.6%) |
| Health Technologists | 84 (55.3%) | 68 (44.7%) |
| Total (Category) | 899 (60.4%) | 589 (39.6%) |
| Total (Overall) | 2,094 (55.8%) | 1,657 (44.2%) |
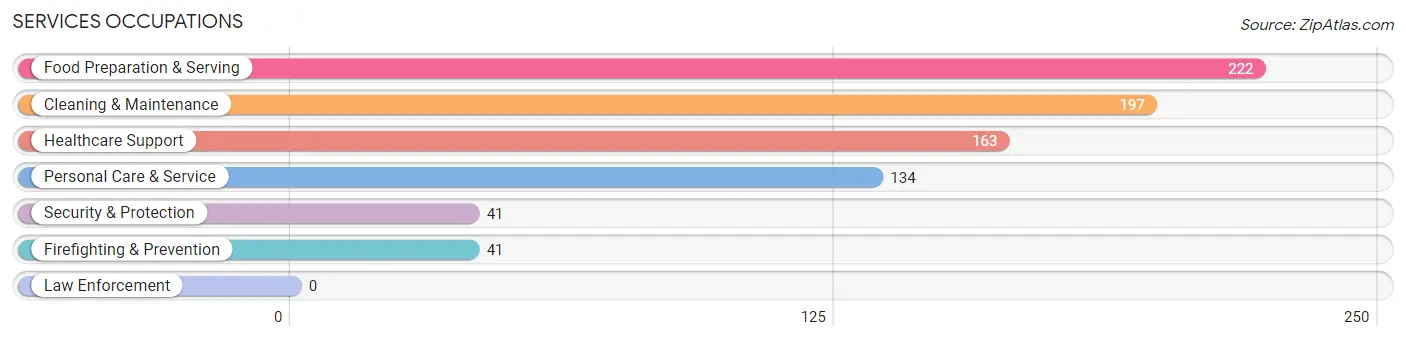
Services Occupations
The most common Services occupations in West Miami are Food Preparation & Serving (222 | 5.9%), Cleaning & Maintenance (197 | 5.2%), Healthcare Support (163 | 4.3%), Personal Care & Service (134 | 3.6%), and Security & Protection (41 | 1.1%).
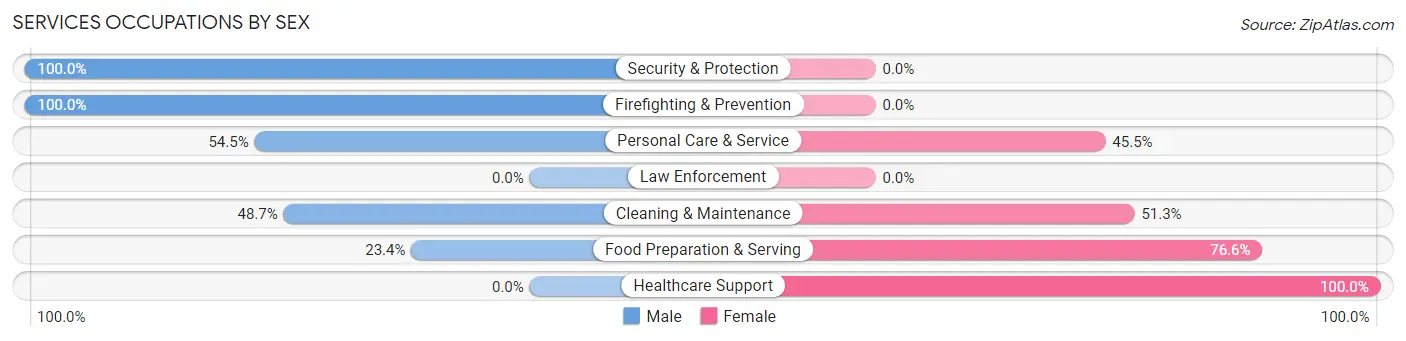
Services Occupations by Sex
Within the Services occupations in West Miami, the most male-oriented occupations are Security & Protection (100.0%), Firefighting & Prevention (100.0%), and Personal Care & Service (54.5%), while the most female-oriented occupations are Healthcare Support (100.0%), Food Preparation & Serving (76.6%), and Cleaning & Maintenance (51.3%).
| Occupation | Male | Female |
| Healthcare Support | 0 (0.0%) | 163 (100.0%) |
| Security & Protection | 41 (100.0%) | 0 (0.0%) |
| Firefighting & Prevention | 41 (100.0%) | 0 (0.0%) |
| Law Enforcement | 0 (0.0%) | 0 (0.0%) |
| Food Preparation & Serving | 52 (23.4%) | 170 (76.6%) |
| Cleaning & Maintenance | 96 (48.7%) | 101 (51.3%) |
| Personal Care & Service | 73 (54.5%) | 61 (45.5%) |
| Total (Category) | 262 (34.6%) | 495 (65.4%) |
| Total (Overall) | 2,094 (55.8%) | 1,657 (44.2%) |
Sales and Office Occupations
The most common Sales and Office occupations in West Miami are Office & Administration (552 | 14.7%), and Sales & Related (400 | 10.7%).

Sales and Office Occupations by Sex
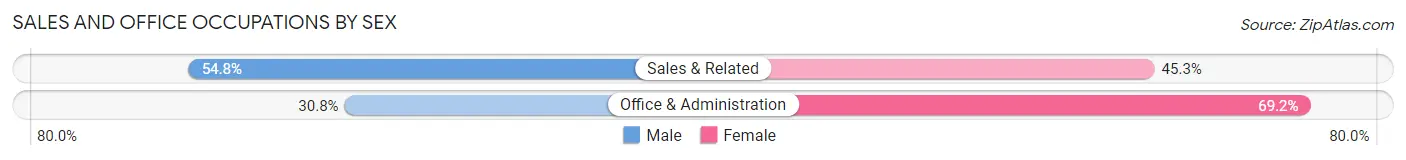
| Occupation | Male | Female |
| Sales & Related | 219 (54.7%) | 181 (45.3%) |
| Office & Administration | 170 (30.8%) | 382 (69.2%) |
| Total (Category) | 389 (40.9%) | 563 (59.1%) |
| Total (Overall) | 2,094 (55.8%) | 1,657 (44.2%) |
Natural Resources, Construction and Maintenance Occupations
The most common Natural Resources, Construction and Maintenance occupations in West Miami are Installation, Maintenance & Repair (116 | 3.1%), Construction & Extraction (113 | 3.0%), and Farming, Fishing & Forestry (42 | 1.1%).

Natural Resources, Construction and Maintenance Occupations by Sex
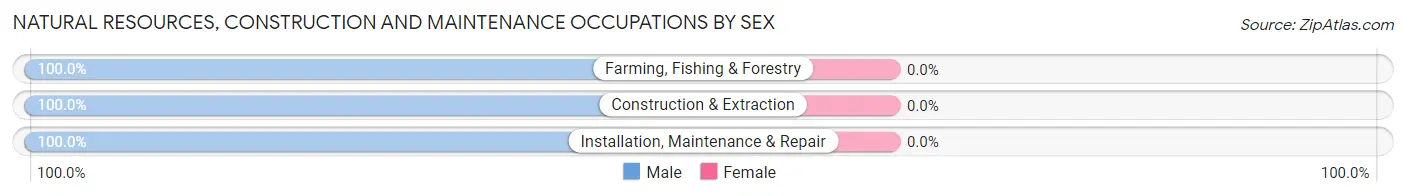
| Occupation | Male | Female |
| Farming, Fishing & Forestry | 42 (100.0%) | 0 (0.0%) |
| Construction & Extraction | 113 (100.0%) | 0 (0.0%) |
| Installation, Maintenance & Repair | 116 (100.0%) | 0 (0.0%) |
| Total (Category) | 271 (100.0%) | 0 (0.0%) |
| Total (Overall) | 2,094 (55.8%) | 1,657 (44.2%) |
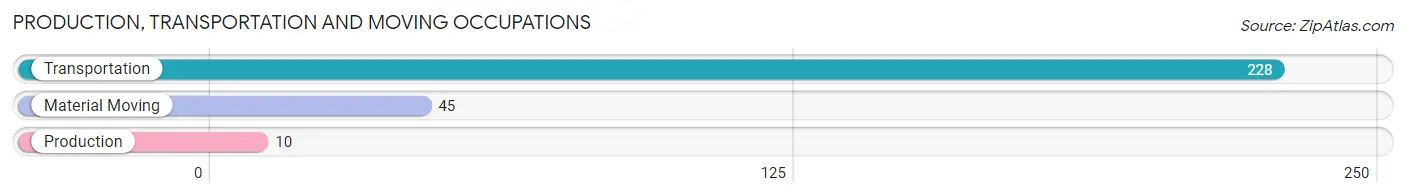
Production, Transportation and Moving Occupations
The most common Production, Transportation and Moving occupations in West Miami are Transportation (228 | 6.1%), Material Moving (45 | 1.2%), and Production (10 | 0.3%).
Production, Transportation and Moving Occupations by Sex
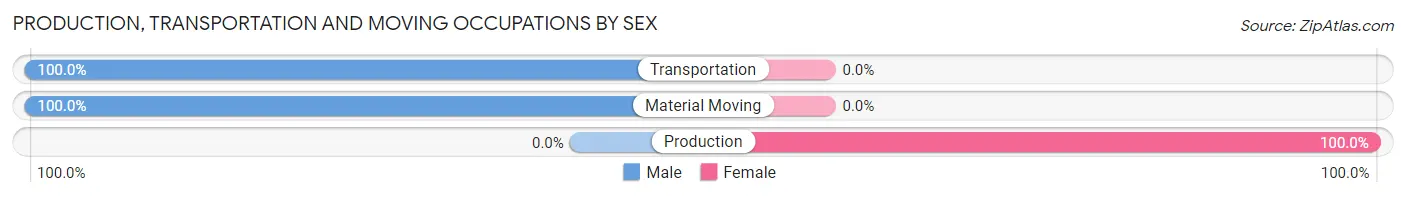
| Occupation | Male | Female |
| Production | 0 (0.0%) | 10 (100.0%) |
| Transportation | 228 (100.0%) | 0 (0.0%) |
| Material Moving | 45 (100.0%) | 0 (0.0%) |
| Total (Category) | 273 (96.5%) | 10 (3.5%) |
| Total (Overall) | 2,094 (55.8%) | 1,657 (44.2%) |
Employment Industries by Sex in West Miami
Employment Industries in West Miami
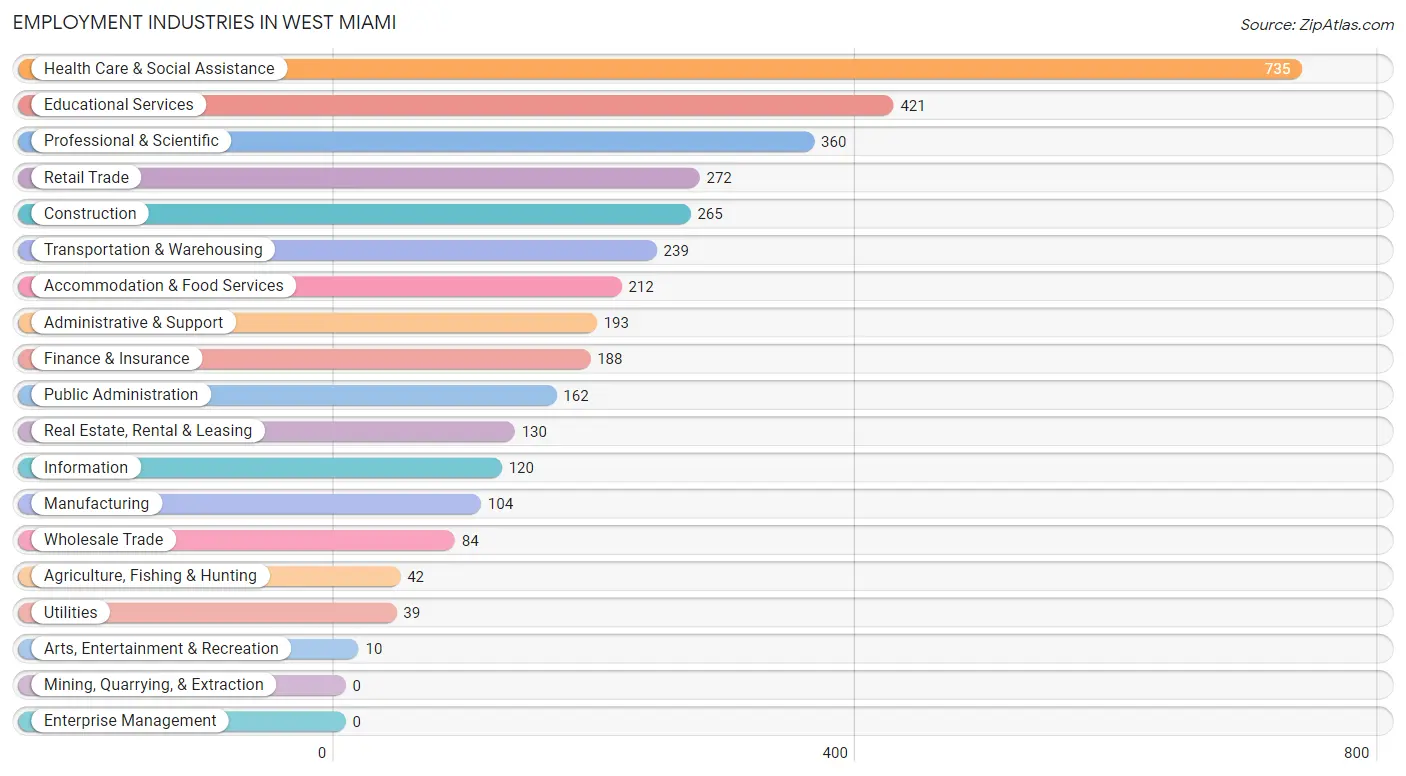
The major employment industries in West Miami include Health Care & Social Assistance (735 | 19.6%), Educational Services (421 | 11.2%), Professional & Scientific (360 | 9.6%), Retail Trade (272 | 7.2%), and Construction (265 | 7.1%).
Employment Industries by Sex in West Miami
The West Miami industries that see more men than women are Agriculture, Fishing & Hunting (100.0%), Transportation & Warehousing (100.0%), and Utilities (100.0%), whereas the industries that tend to have a higher number of women are Accommodation & Food Services (75.5%), Real Estate, Rental & Leasing (73.1%), and Wholesale Trade (71.4%).
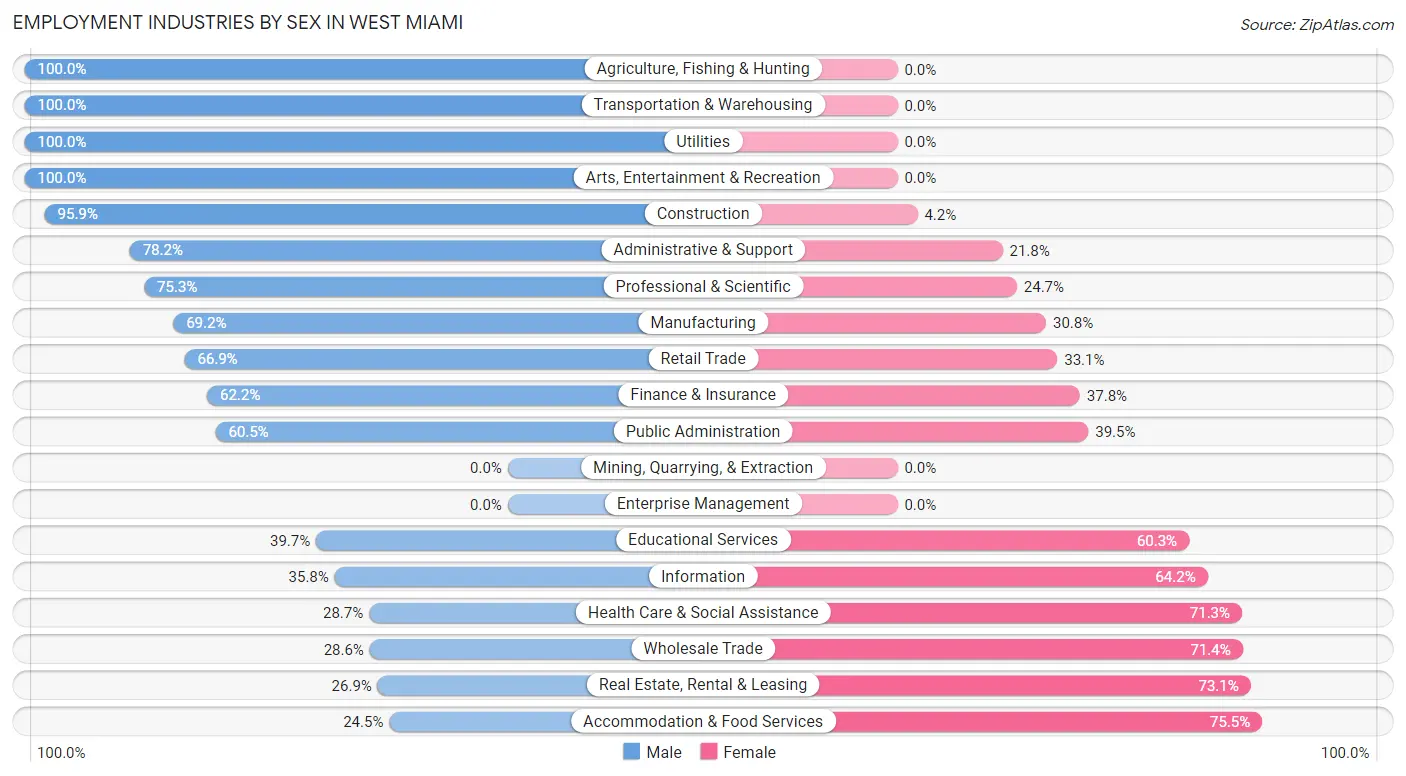
| Industry | Male | Female |
| Agriculture, Fishing & Hunting | 42 (100.0%) | 0 (0.0%) |
| Mining, Quarrying, & Extraction | 0 (0.0%) | 0 (0.0%) |
| Construction | 254 (95.9%) | 11 (4.2%) |
| Manufacturing | 72 (69.2%) | 32 (30.8%) |
| Wholesale Trade | 24 (28.6%) | 60 (71.4%) |
| Retail Trade | 182 (66.9%) | 90 (33.1%) |
| Transportation & Warehousing | 239 (100.0%) | 0 (0.0%) |
| Utilities | 39 (100.0%) | 0 (0.0%) |
| Information | 43 (35.8%) | 77 (64.2%) |
| Finance & Insurance | 117 (62.2%) | 71 (37.8%) |
| Real Estate, Rental & Leasing | 35 (26.9%) | 95 (73.1%) |
| Professional & Scientific | 271 (75.3%) | 89 (24.7%) |
| Enterprise Management | 0 (0.0%) | 0 (0.0%) |
| Administrative & Support | 151 (78.2%) | 42 (21.8%) |
| Educational Services | 167 (39.7%) | 254 (60.3%) |
| Health Care & Social Assistance | 211 (28.7%) | 524 (71.3%) |
| Arts, Entertainment & Recreation | 10 (100.0%) | 0 (0.0%) |
| Accommodation & Food Services | 52 (24.5%) | 160 (75.5%) |
| Public Administration | 98 (60.5%) | 64 (39.5%) |
| Total | 2,094 (55.8%) | 1,657 (44.2%) |
Education in West Miami
School Enrollment in West Miami
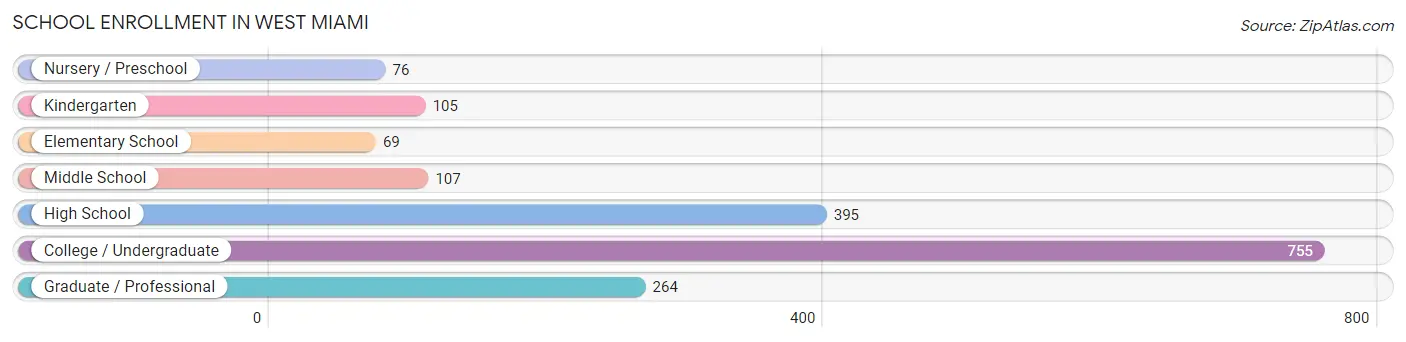
The most common levels of schooling among the 1,771 students in West Miami are college / undergraduate (755 | 42.6%), high school (395 | 22.3%), and graduate / professional (264 | 14.9%).
| School Level | # Students | % Students |
| Nursery / Preschool | 76 | 4.3% |
| Kindergarten | 105 | 5.9% |
| Elementary School | 69 | 3.9% |
| Middle School | 107 | 6.0% |
| High School | 395 | 22.3% |
| College / Undergraduate | 755 | 42.6% |
| Graduate / Professional | 264 | 14.9% |
| Total | 1,771 | 100.0% |
School Enrollment by Age by Funding Source in West Miami
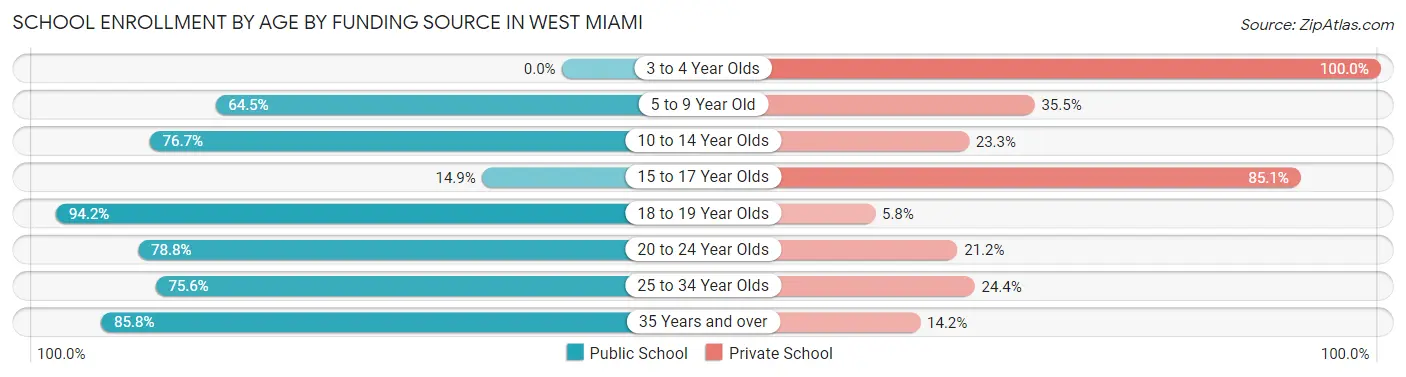
Out of a total of 1,771 students who are enrolled in schools in West Miami, 434 (24.5%) attend a private institution, while the remaining 1,337 (75.5%) are enrolled in public schools. The age group of 3 to 4 year olds has the highest likelihood of being enrolled in private schools, with 72 (100.0% in the age bracket) enrolled. Conversely, the age group of 18 to 19 year olds has the lowest likelihood of being enrolled in a private school, with 145 (94.2% in the age bracket) attending a public institution.
| Age Bracket | Public School | Private School |
| 3 to 4 Year Olds | 0 (0.0%) | 72 (100.0%) |
| 5 to 9 Year Old | 107 (64.5%) | 59 (35.5%) |
| 10 to 14 Year Olds | 135 (76.7%) | 41 (23.3%) |
| 15 to 17 Year Olds | 7 (14.9%) | 40 (85.1%) |
| 18 to 19 Year Olds | 145 (94.2%) | 9 (5.8%) |
| 20 to 24 Year Olds | 272 (78.8%) | 73 (21.2%) |
| 25 to 34 Year Olds | 183 (75.6%) | 59 (24.4%) |
| 35 Years and over | 488 (85.8%) | 81 (14.2%) |
| Total | 1,337 (75.5%) | 434 (24.5%) |
Educational Attainment by Field of Study in West Miami
Science & technology (347 | 17.9%), education (268 | 13.8%), business (256 | 13.2%), social sciences (234 | 12.1%), and engineering (144 | 7.4%) are the most common fields of study among 1,936 individuals in West Miami who have obtained a bachelor's degree or higher.
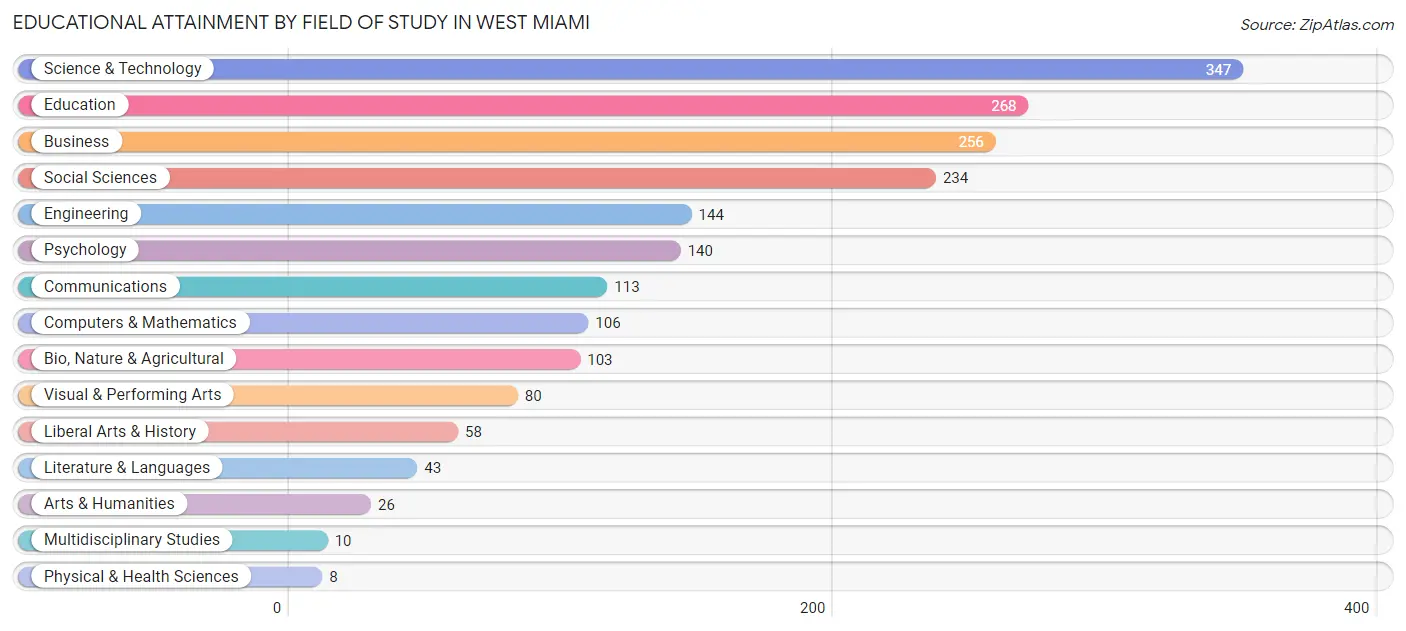
| Field of Study | # Graduates | % Graduates |
| Computers & Mathematics | 106 | 5.5% |
| Bio, Nature & Agricultural | 103 | 5.3% |
| Physical & Health Sciences | 8 | 0.4% |
| Psychology | 140 | 7.2% |
| Social Sciences | 234 | 12.1% |
| Engineering | 144 | 7.4% |
| Multidisciplinary Studies | 10 | 0.5% |
| Science & Technology | 347 | 17.9% |
| Business | 256 | 13.2% |
| Education | 268 | 13.8% |
| Literature & Languages | 43 | 2.2% |
| Liberal Arts & History | 58 | 3.0% |
| Visual & Performing Arts | 80 | 4.1% |
| Communications | 113 | 5.8% |
| Arts & Humanities | 26 | 1.3% |
| Total | 1,936 | 100.0% |
Transportation & Commute in West Miami
Vehicle Availability by Sex in West Miami
The most prevalent vehicle ownership categories in West Miami are males with 2 vehicles (778, accounting for 39.6%) and females with 2 vehicles (821, making up 49.0%).
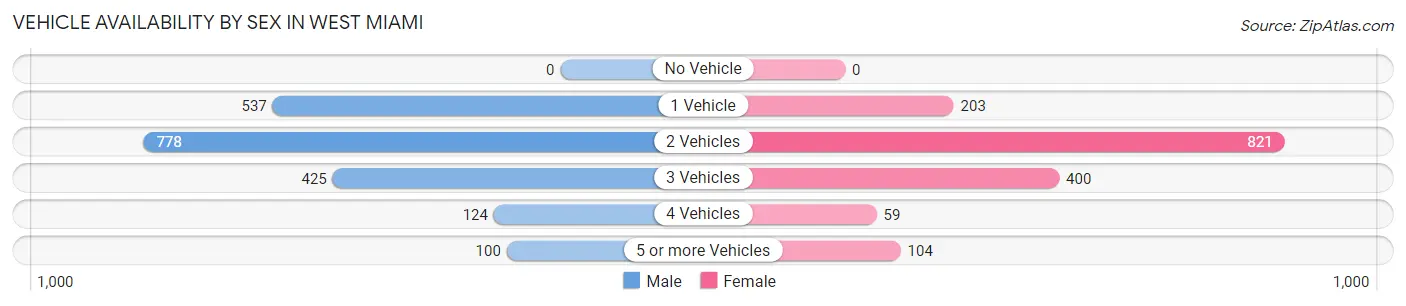
| Vehicles Available | Male | Female |
| No Vehicle | 0 (0.0%) | 0 (0.0%) |
| 1 Vehicle | 537 (27.3%) | 203 (12.8%) |
| 2 Vehicles | 778 (39.6%) | 821 (51.7%) |
| 3 Vehicles | 425 (21.6%) | 400 (25.2%) |
| 4 Vehicles | 124 (6.3%) | 59 (3.7%) |
| 5 or more Vehicles | 100 (5.1%) | 104 (6.6%) |
| Total | 1,964 (100.0%) | 1,587 (100.0%) |
Commute Time in West Miami
The most frequently occuring commute durations in West Miami are 30 to 34 minutes (704 commuters, 23.0%), 15 to 19 minutes (608 commuters, 19.9%), and 20 to 24 minutes (558 commuters, 18.2%).
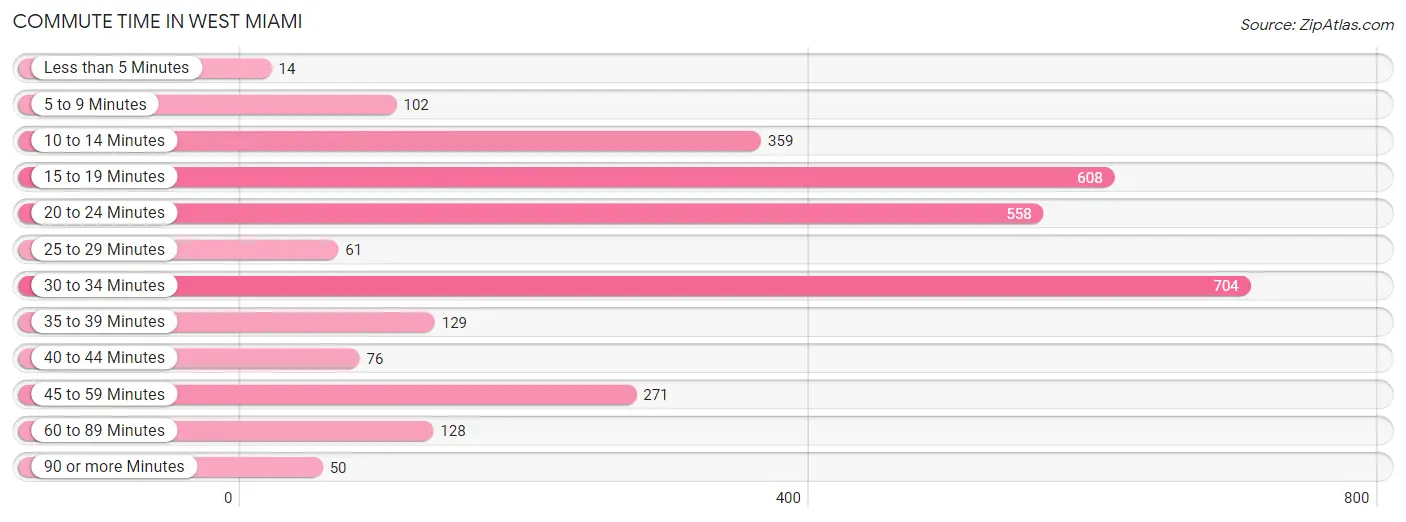
| Commute Time | # Commuters | % Commuters |
| Less than 5 Minutes | 14 | 0.5% |
| 5 to 9 Minutes | 102 | 3.3% |
| 10 to 14 Minutes | 359 | 11.7% |
| 15 to 19 Minutes | 608 | 19.9% |
| 20 to 24 Minutes | 558 | 18.2% |
| 25 to 29 Minutes | 61 | 2.0% |
| 30 to 34 Minutes | 704 | 23.0% |
| 35 to 39 Minutes | 129 | 4.2% |
| 40 to 44 Minutes | 76 | 2.5% |
| 45 to 59 Minutes | 271 | 8.9% |
| 60 to 89 Minutes | 128 | 4.2% |
| 90 or more Minutes | 50 | 1.6% |
Commute Time by Sex in West Miami
The most common commute times in West Miami are 15 to 19 minutes (404 commuters, 24.5%) for males and 30 to 34 minutes (323 commuters, 22.9%) for females.
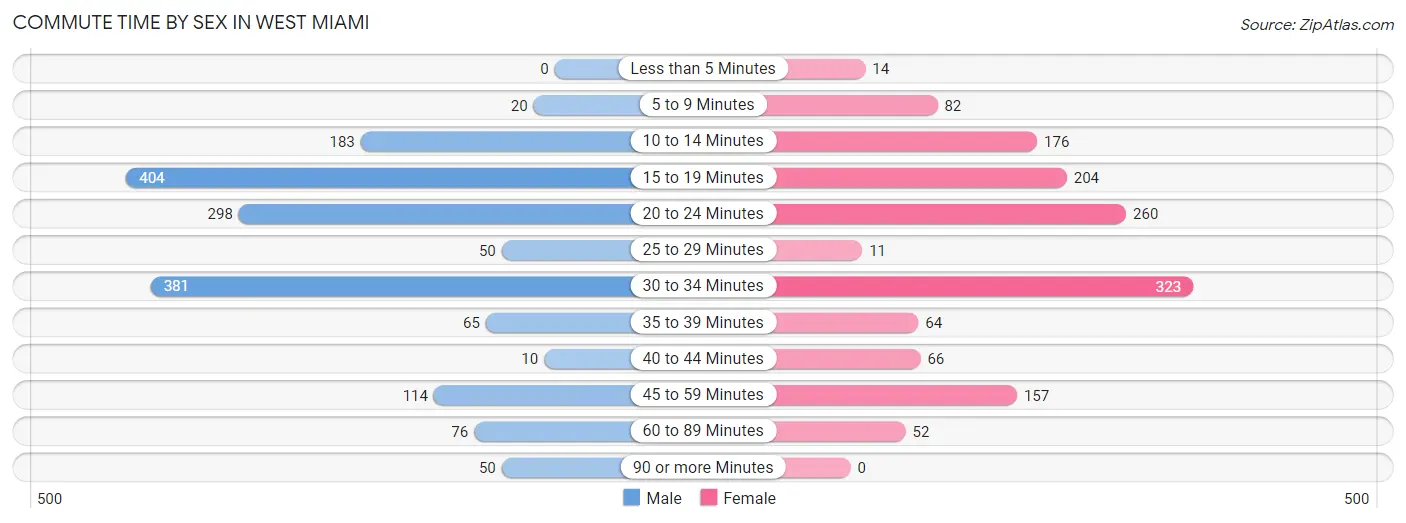
| Commute Time | Male | Female |
| Less than 5 Minutes | 0 (0.0%) | 14 (1.0%) |
| 5 to 9 Minutes | 20 (1.2%) | 82 (5.8%) |
| 10 to 14 Minutes | 183 (11.1%) | 176 (12.5%) |
| 15 to 19 Minutes | 404 (24.5%) | 204 (14.5%) |
| 20 to 24 Minutes | 298 (18.0%) | 260 (18.4%) |
| 25 to 29 Minutes | 50 (3.0%) | 11 (0.8%) |
| 30 to 34 Minutes | 381 (23.1%) | 323 (22.9%) |
| 35 to 39 Minutes | 65 (3.9%) | 64 (4.5%) |
| 40 to 44 Minutes | 10 (0.6%) | 66 (4.7%) |
| 45 to 59 Minutes | 114 (6.9%) | 157 (11.1%) |
| 60 to 89 Minutes | 76 (4.6%) | 52 (3.7%) |
| 90 or more Minutes | 50 (3.0%) | 0 (0.0%) |
Time of Departure to Work by Sex in West Miami
The most frequent times of departure to work in West Miami are 8:00 AM to 8:29 AM (374, 22.7%) for males and 7:30 AM to 7:59 AM (309, 21.9%) for females.
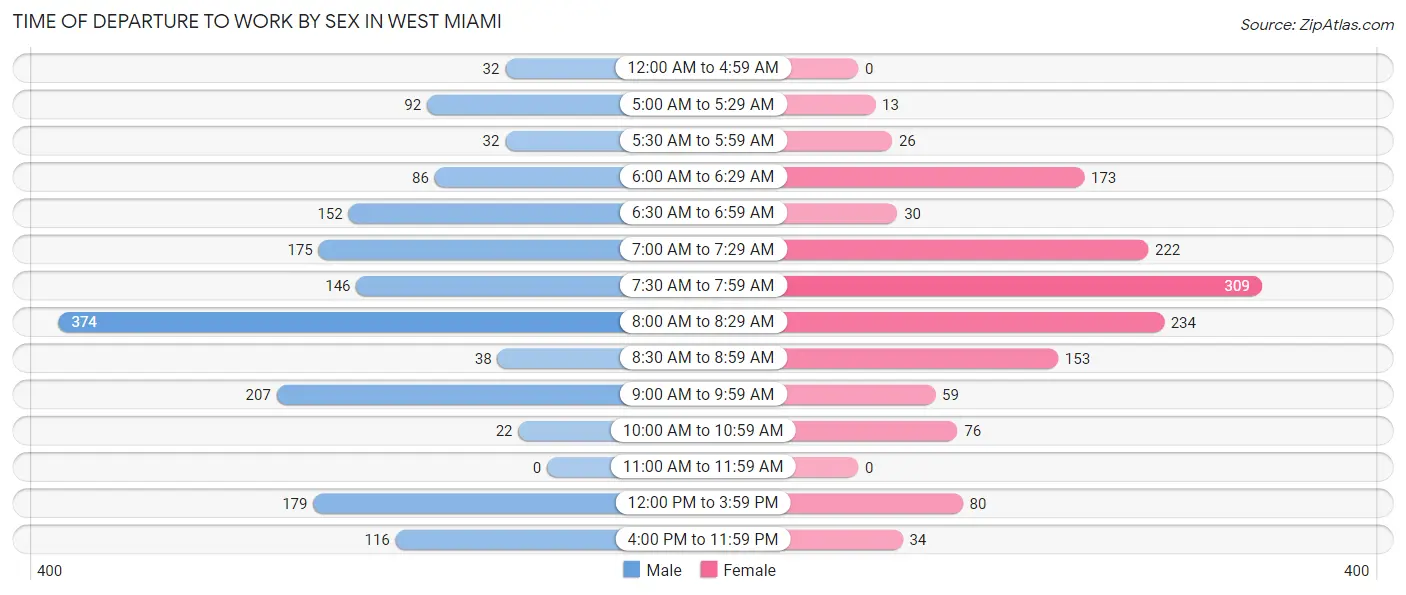
| Time of Departure | Male | Female |
| 12:00 AM to 4:59 AM | 32 (1.9%) | 0 (0.0%) |
| 5:00 AM to 5:29 AM | 92 (5.6%) | 13 (0.9%) |
| 5:30 AM to 5:59 AM | 32 (1.9%) | 26 (1.8%) |
| 6:00 AM to 6:29 AM | 86 (5.2%) | 173 (12.3%) |
| 6:30 AM to 6:59 AM | 152 (9.2%) | 30 (2.1%) |
| 7:00 AM to 7:29 AM | 175 (10.6%) | 222 (15.8%) |
| 7:30 AM to 7:59 AM | 146 (8.8%) | 309 (21.9%) |
| 8:00 AM to 8:29 AM | 374 (22.7%) | 234 (16.6%) |
| 8:30 AM to 8:59 AM | 38 (2.3%) | 153 (10.9%) |
| 9:00 AM to 9:59 AM | 207 (12.5%) | 59 (4.2%) |
| 10:00 AM to 10:59 AM | 22 (1.3%) | 76 (5.4%) |
| 11:00 AM to 11:59 AM | 0 (0.0%) | 0 (0.0%) |
| 12:00 PM to 3:59 PM | 179 (10.8%) | 80 (5.7%) |
| 4:00 PM to 11:59 PM | 116 (7.0%) | 34 (2.4%) |
| Total | 1,651 (100.0%) | 1,409 (100.0%) |
Housing Occupancy in West Miami
Occupancy by Ownership in West Miami
Of the total 2,695 dwellings in West Miami, owner-occupied units account for 1,542 (57.2%), while renter-occupied units make up 1,153 (42.8%).
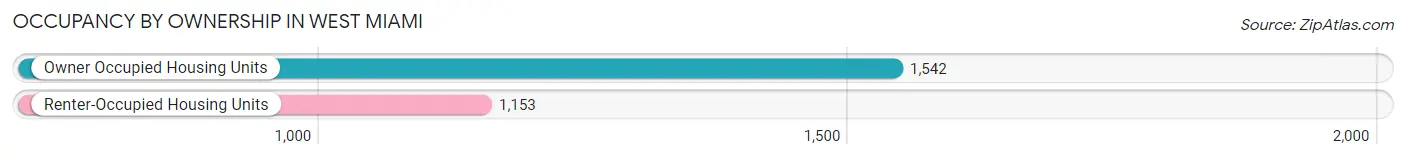
| Occupancy | # Housing Units | % Housing Units |
| Owner Occupied Housing Units | 1,542 | 57.2% |
| Renter-Occupied Housing Units | 1,153 | 42.8% |
| Total Occupied Housing Units | 2,695 | 100.0% |
Occupancy by Household Size in West Miami
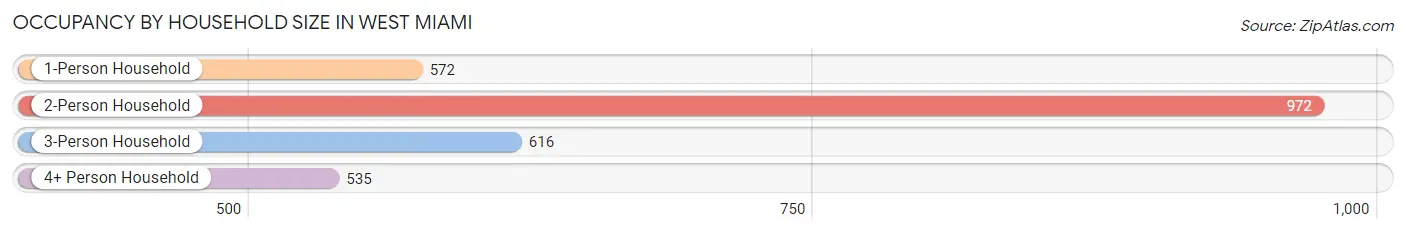
| Household Size | # Housing Units | % Housing Units |
| 1-Person Household | 572 | 21.2% |
| 2-Person Household | 972 | 36.1% |
| 3-Person Household | 616 | 22.9% |
| 4+ Person Household | 535 | 19.9% |
| Total Housing Units | 2,695 | 100.0% |
Occupancy by Ownership by Household Size in West Miami
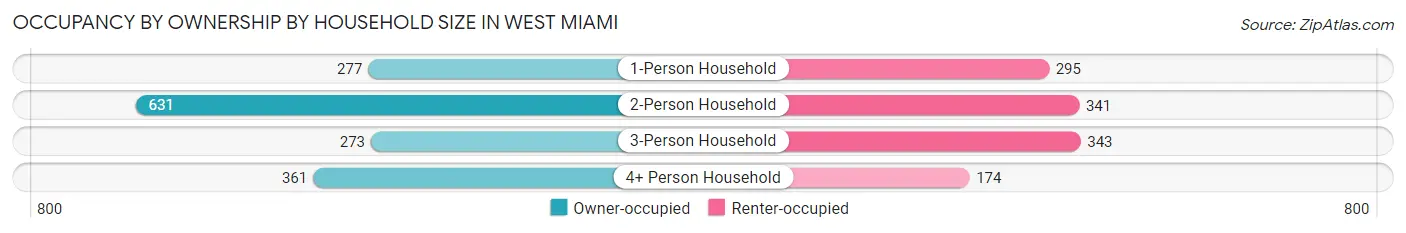
| Household Size | Owner-occupied | Renter-occupied |
| 1-Person Household | 277 (48.4%) | 295 (51.6%) |
| 2-Person Household | 631 (64.9%) | 341 (35.1%) |
| 3-Person Household | 273 (44.3%) | 343 (55.7%) |
| 4+ Person Household | 361 (67.5%) | 174 (32.5%) |
| Total Housing Units | 1,542 (57.2%) | 1,153 (42.8%) |
Occupancy by Educational Attainment in West Miami
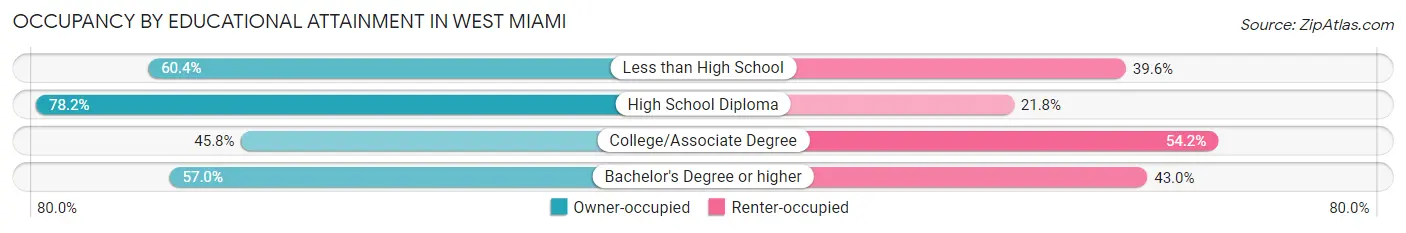
| Household Size | Owner-occupied | Renter-occupied |
| Less than High School | 218 (60.4%) | 143 (39.6%) |
| High School Diploma | 340 (78.2%) | 95 (21.8%) |
| College/Associate Degree | 401 (45.8%) | 475 (54.2%) |
| Bachelor's Degree or higher | 583 (57.0%) | 440 (43.0%) |
Occupancy by Age of Householder in West Miami
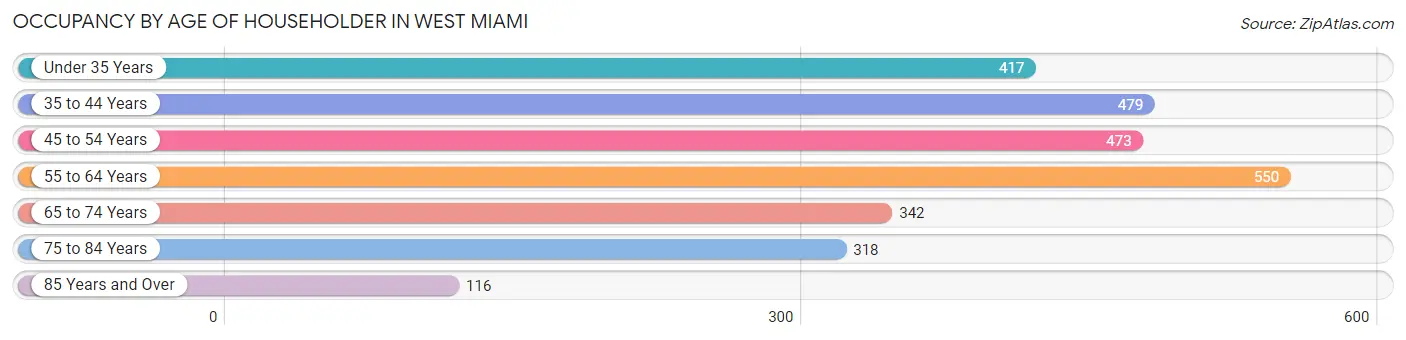
| Age Bracket | # Households | % Households |
| Under 35 Years | 417 | 15.5% |
| 35 to 44 Years | 479 | 17.8% |
| 45 to 54 Years | 473 | 17.5% |
| 55 to 64 Years | 550 | 20.4% |
| 65 to 74 Years | 342 | 12.7% |
| 75 to 84 Years | 318 | 11.8% |
| 85 Years and Over | 116 | 4.3% |
| Total | 2,695 | 100.0% |
Housing Finances in West Miami
Median Income by Occupancy in West Miami
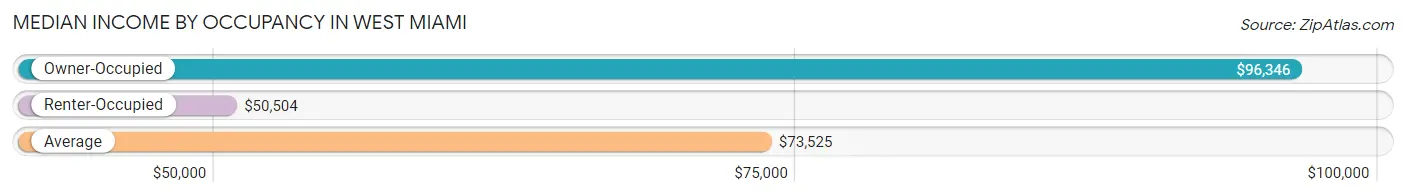
| Occupancy Type | # Households | Median Income |
| Owner-Occupied | 1,542 (57.2%) | $96,346 |
| Renter-Occupied | 1,153 (42.8%) | $50,504 |
| Average | 2,695 (100.0%) | $73,525 |
Occupancy by Householder Income Bracket in West Miami
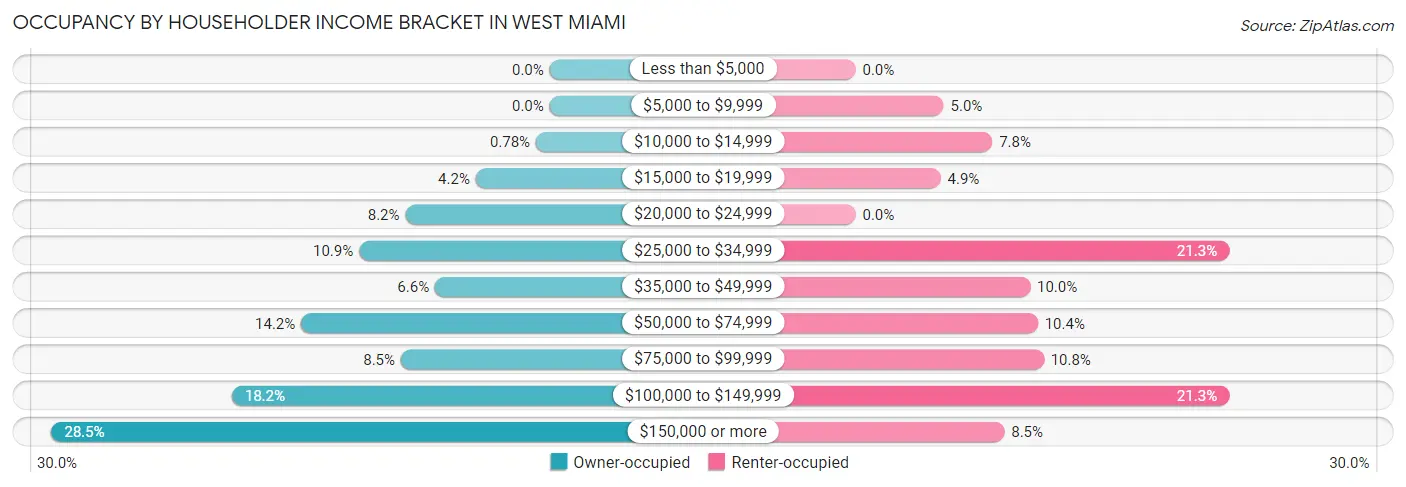
| Income Bracket | Owner-occupied | Renter-occupied |
| Less than $5,000 | 0 (0.0%) | 0 (0.0%) |
| $5,000 to $9,999 | 0 (0.0%) | 58 (5.0%) |
| $10,000 to $14,999 | 12 (0.8%) | 90 (7.8%) |
| $15,000 to $19,999 | 65 (4.2%) | 56 (4.9%) |
| $20,000 to $24,999 | 127 (8.2%) | 0 (0.0%) |
| $25,000 to $34,999 | 168 (10.9%) | 246 (21.3%) |
| $35,000 to $49,999 | 101 (6.6%) | 115 (10.0%) |
| $50,000 to $74,999 | 219 (14.2%) | 120 (10.4%) |
| $75,000 to $99,999 | 131 (8.5%) | 124 (10.7%) |
| $100,000 to $149,999 | 280 (18.2%) | 246 (21.3%) |
| $150,000 or more | 439 (28.5%) | 98 (8.5%) |
| Total | 1,542 (100.0%) | 1,153 (100.0%) |
Monthly Housing Cost Tiers in West Miami
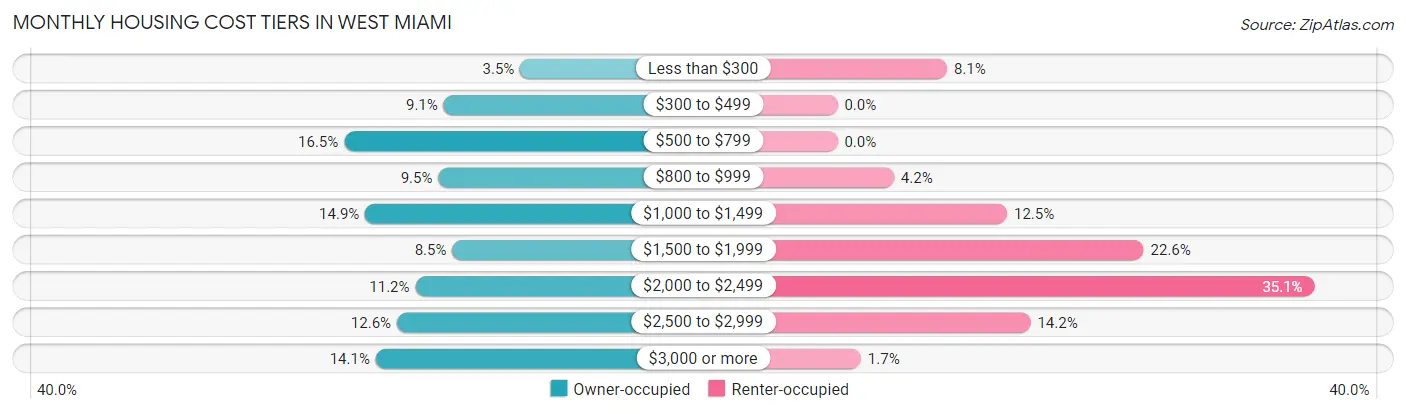
| Monthly Cost | Owner-occupied | Renter-occupied |
| Less than $300 | 54 (3.5%) | 93 (8.1%) |
| $300 to $499 | 141 (9.1%) | 0 (0.0%) |
| $500 to $799 | 254 (16.5%) | 0 (0.0%) |
| $800 to $999 | 147 (9.5%) | 48 (4.2%) |
| $1,000 to $1,499 | 230 (14.9%) | 144 (12.5%) |
| $1,500 to $1,999 | 131 (8.5%) | 260 (22.6%) |
| $2,000 to $2,499 | 173 (11.2%) | 405 (35.1%) |
| $2,500 to $2,999 | 194 (12.6%) | 164 (14.2%) |
| $3,000 or more | 218 (14.1%) | 20 (1.7%) |
| Total | 1,542 (100.0%) | 1,153 (100.0%) |
Physical Housing Characteristics in West Miami
Housing Structures in West Miami
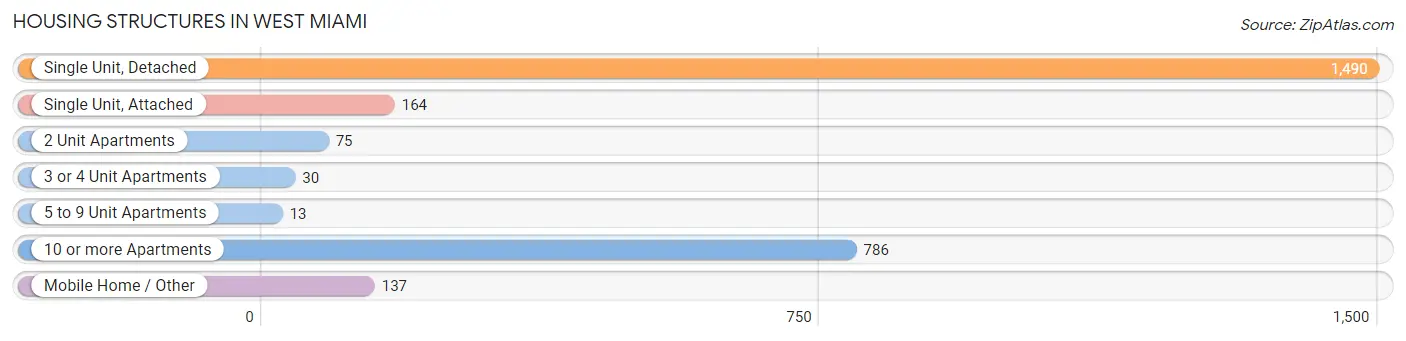
| Structure Type | # Housing Units | % Housing Units |
| Single Unit, Detached | 1,490 | 55.3% |
| Single Unit, Attached | 164 | 6.1% |
| 2 Unit Apartments | 75 | 2.8% |
| 3 or 4 Unit Apartments | 30 | 1.1% |
| 5 to 9 Unit Apartments | 13 | 0.5% |
| 10 or more Apartments | 786 | 29.2% |
| Mobile Home / Other | 137 | 5.1% |
| Total | 2,695 | 100.0% |
Housing Structures by Occupancy in West Miami
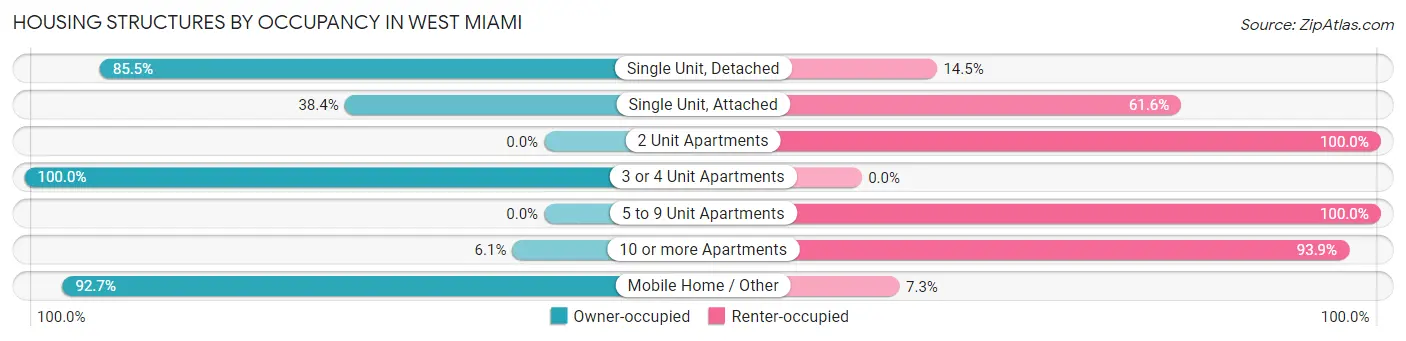
| Structure Type | Owner-occupied | Renter-occupied |
| Single Unit, Detached | 1,274 (85.5%) | 216 (14.5%) |
| Single Unit, Attached | 63 (38.4%) | 101 (61.6%) |
| 2 Unit Apartments | 0 (0.0%) | 75 (100.0%) |
| 3 or 4 Unit Apartments | 30 (100.0%) | 0 (0.0%) |
| 5 to 9 Unit Apartments | 0 (0.0%) | 13 (100.0%) |
| 10 or more Apartments | 48 (6.1%) | 738 (93.9%) |
| Mobile Home / Other | 127 (92.7%) | 10 (7.3%) |
| Total | 1,542 (57.2%) | 1,153 (42.8%) |
Housing Structures by Number of Rooms in West Miami
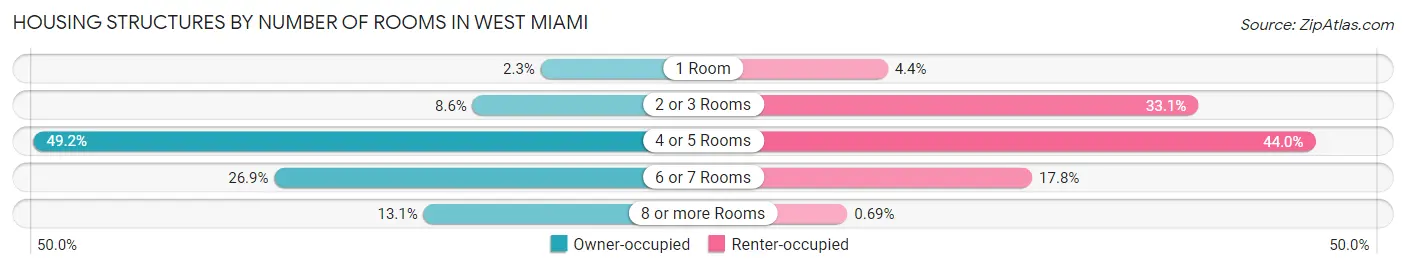
| Number of Rooms | Owner-occupied | Renter-occupied |
| 1 Room | 35 (2.3%) | 51 (4.4%) |
| 2 or 3 Rooms | 132 (8.6%) | 382 (33.1%) |
| 4 or 5 Rooms | 758 (49.2%) | 507 (44.0%) |
| 6 or 7 Rooms | 415 (26.9%) | 205 (17.8%) |
| 8 or more Rooms | 202 (13.1%) | 8 (0.7%) |
| Total | 1,542 (100.0%) | 1,153 (100.0%) |
Housing Structure by Heating Type in West Miami
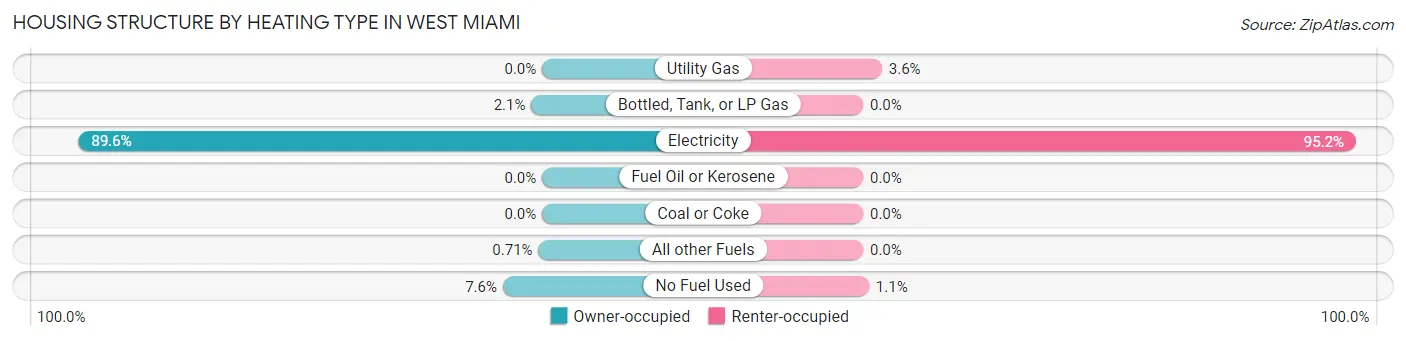
| Heating Type | Owner-occupied | Renter-occupied |
| Utility Gas | 0 (0.0%) | 42 (3.6%) |
| Bottled, Tank, or LP Gas | 32 (2.1%) | 0 (0.0%) |
| Electricity | 1,382 (89.6%) | 1,098 (95.2%) |
| Fuel Oil or Kerosene | 0 (0.0%) | 0 (0.0%) |
| Coal or Coke | 0 (0.0%) | 0 (0.0%) |
| All other Fuels | 11 (0.7%) | 0 (0.0%) |
| No Fuel Used | 117 (7.6%) | 13 (1.1%) |
| Total | 1,542 (100.0%) | 1,153 (100.0%) |
Household Vehicle Usage in West Miami
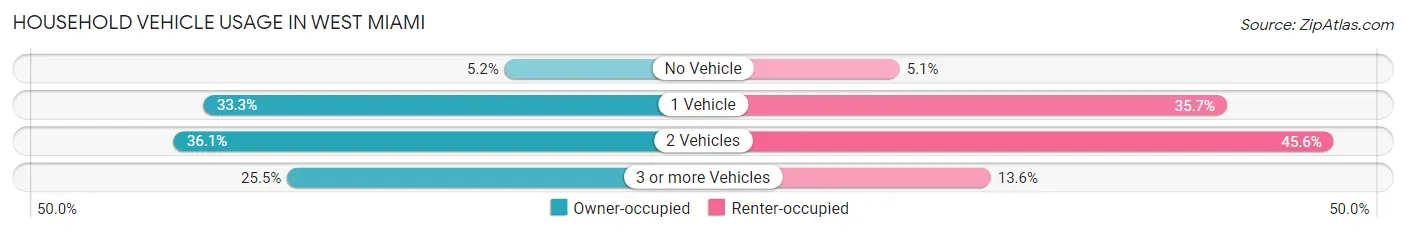
| Vehicles per Household | Owner-occupied | Renter-occupied |
| No Vehicle | 80 (5.2%) | 59 (5.1%) |
| 1 Vehicle | 513 (33.3%) | 411 (35.6%) |
| 2 Vehicles | 556 (36.1%) | 526 (45.6%) |
| 3 or more Vehicles | 393 (25.5%) | 157 (13.6%) |
| Total | 1,542 (100.0%) | 1,153 (100.0%) |
Real Estate & Mortgages in West Miami
Real Estate and Mortgage Overview in West Miami
| Characteristic | Without Mortgage | With Mortgage |
| Housing Units | 638 | 904 |
| Median Property Value | $334,200 | $463,000 |
| Median Household Income | $53,080 | $381 |
| Monthly Housing Costs | $734 | $218 |
| Real Estate Taxes | $2,564 | $40 |
Property Value by Mortgage Status in West Miami
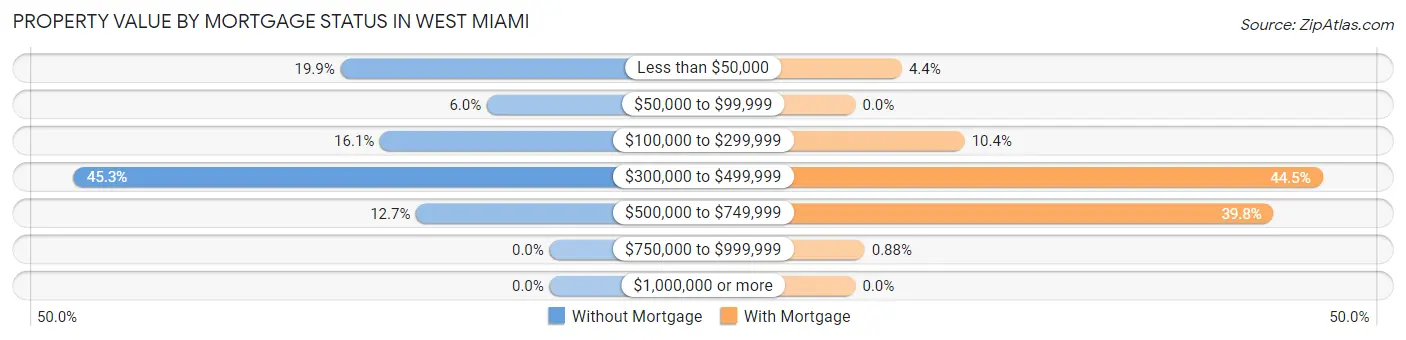
| Property Value | Without Mortgage | With Mortgage |
| Less than $50,000 | 127 (19.9%) | 40 (4.4%) |
| $50,000 to $99,999 | 38 (6.0%) | 0 (0.0%) |
| $100,000 to $299,999 | 103 (16.1%) | 94 (10.4%) |
| $300,000 to $499,999 | 289 (45.3%) | 402 (44.5%) |
| $500,000 to $749,999 | 81 (12.7%) | 360 (39.8%) |
| $750,000 to $999,999 | 0 (0.0%) | 8 (0.9%) |
| $1,000,000 or more | 0 (0.0%) | 0 (0.0%) |
| Total | 638 (100.0%) | 904 (100.0%) |
Household Income by Mortgage Status in West Miami
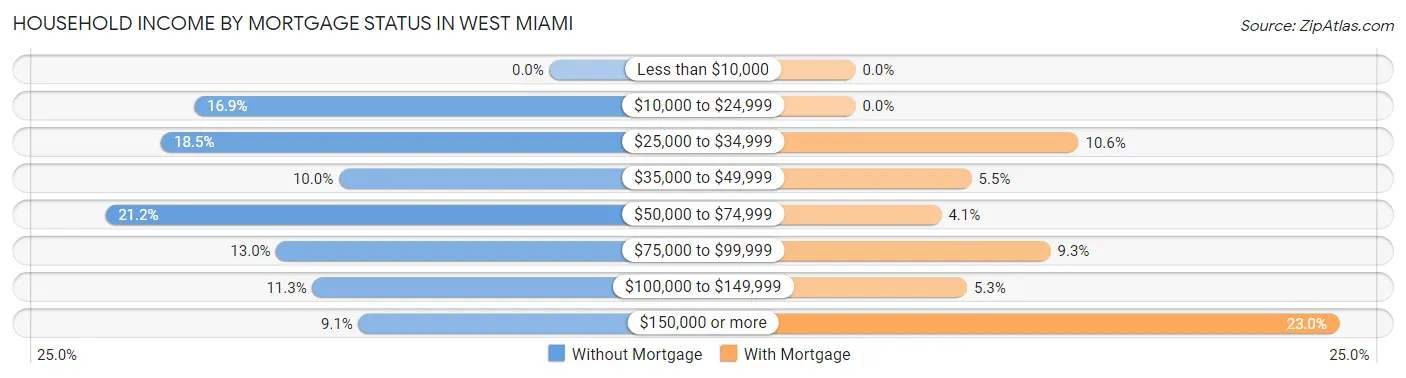
| Household Income | Without Mortgage | With Mortgage |
| Less than $10,000 | 0 (0.0%) | 0 (0.0%) |
| $10,000 to $24,999 | 108 (16.9%) | 0 (0.0%) |
| $25,000 to $34,999 | 118 (18.5%) | 96 (10.6%) |
| $35,000 to $49,999 | 64 (10.0%) | 50 (5.5%) |
| $50,000 to $74,999 | 135 (21.2%) | 37 (4.1%) |
| $75,000 to $99,999 | 83 (13.0%) | 84 (9.3%) |
| $100,000 to $149,999 | 72 (11.3%) | 48 (5.3%) |
| $150,000 or more | 58 (9.1%) | 208 (23.0%) |
| Total | 638 (100.0%) | 904 (100.0%) |
Property Value to Household Income Ratio in West Miami
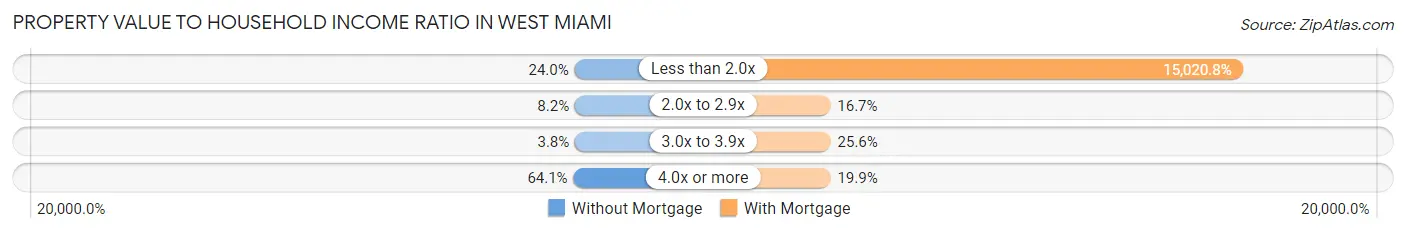
| Value-to-Income Ratio | Without Mortgage | With Mortgage |
| Less than 2.0x | 153 (24.0%) | 135,788 (15,020.8%) |
| 2.0x to 2.9x | 52 (8.2%) | 151 (16.7%) |
| 3.0x to 3.9x | 24 (3.8%) | 231 (25.6%) |
| 4.0x or more | 409 (64.1%) | 180 (19.9%) |
| Total | 638 (100.0%) | 904 (100.0%) |
Real Estate Taxes by Mortgage Status in West Miami
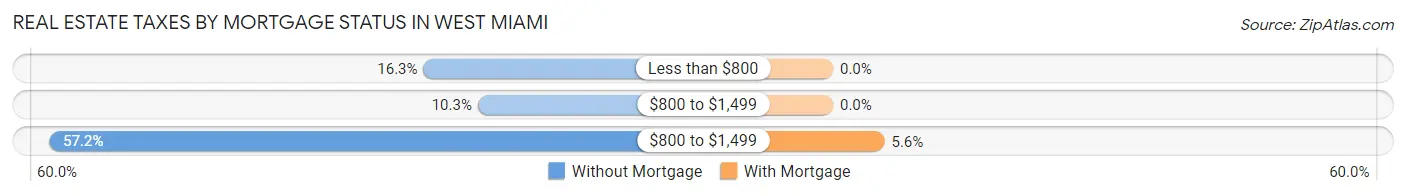
| Property Taxes | Without Mortgage | With Mortgage |
| Less than $800 | 104 (16.3%) | 0 (0.0%) |
| $800 to $1,499 | 66 (10.3%) | 0 (0.0%) |
| $800 to $1,499 | 365 (57.2%) | 51 (5.6%) |
| Total | 638 (100.0%) | 904 (100.0%) |
Health & Disability in West Miami
Health Insurance Coverage by Age in West Miami
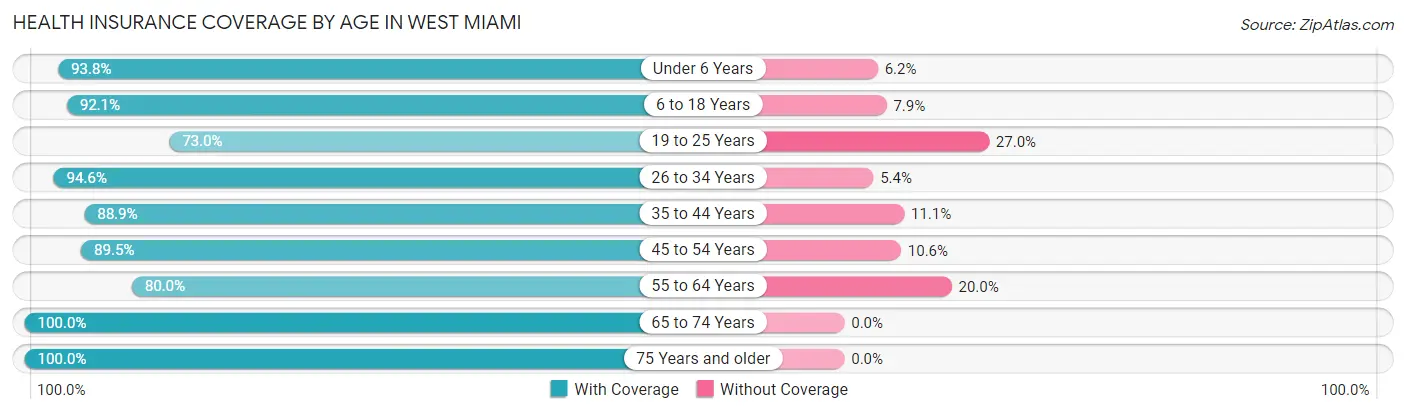
| Age Bracket | With Coverage | Without Coverage |
| Under 6 Years | 677 (93.8%) | 45 (6.2%) |
| 6 to 18 Years | 410 (92.1%) | 35 (7.9%) |
| 19 to 25 Years | 482 (73.0%) | 178 (27.0%) |
| 26 to 34 Years | 754 (94.6%) | 43 (5.4%) |
| 35 to 44 Years | 933 (88.9%) | 117 (11.1%) |
| 45 to 54 Years | 899 (89.4%) | 106 (10.5%) |
| 55 to 64 Years | 864 (80.0%) | 216 (20.0%) |
| 65 to 74 Years | 570 (100.0%) | 0 (0.0%) |
| 75 Years and older | 720 (100.0%) | 0 (0.0%) |
| Total | 6,309 (89.5%) | 740 (10.5%) |
Health Insurance Coverage by Citizenship Status in West Miami
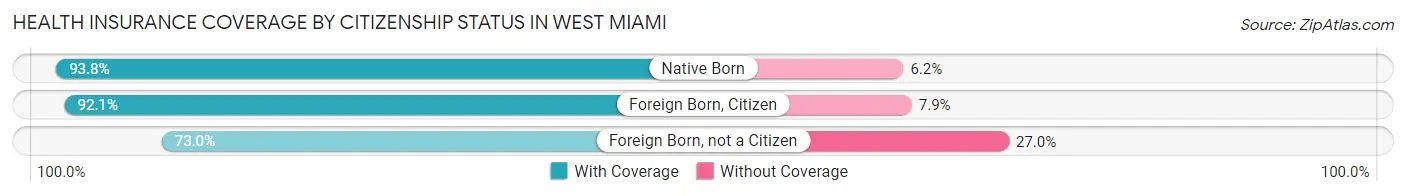
| Citizenship Status | With Coverage | Without Coverage |
| Native Born | 677 (93.8%) | 45 (6.2%) |
| Foreign Born, Citizen | 410 (92.1%) | 35 (7.9%) |
| Foreign Born, not a Citizen | 482 (73.0%) | 178 (27.0%) |
Health Insurance Coverage by Household Income in West Miami
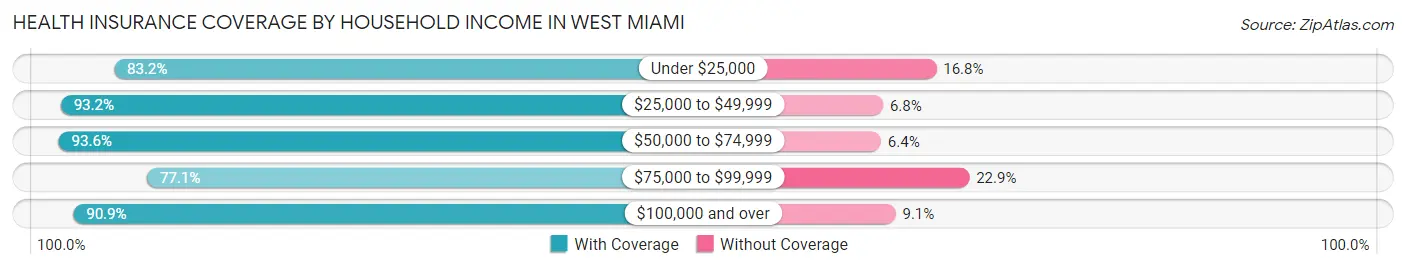
| Household Income | With Coverage | Without Coverage |
| Under $25,000 | 680 (83.2%) | 137 (16.8%) |
| $25,000 to $49,999 | 1,127 (93.2%) | 82 (6.8%) |
| $50,000 to $74,999 | 791 (93.6%) | 54 (6.4%) |
| $75,000 to $99,999 | 487 (77.1%) | 145 (22.9%) |
| $100,000 and over | 3,204 (90.9%) | 322 (9.1%) |
Public vs Private Health Insurance Coverage by Age in West Miami
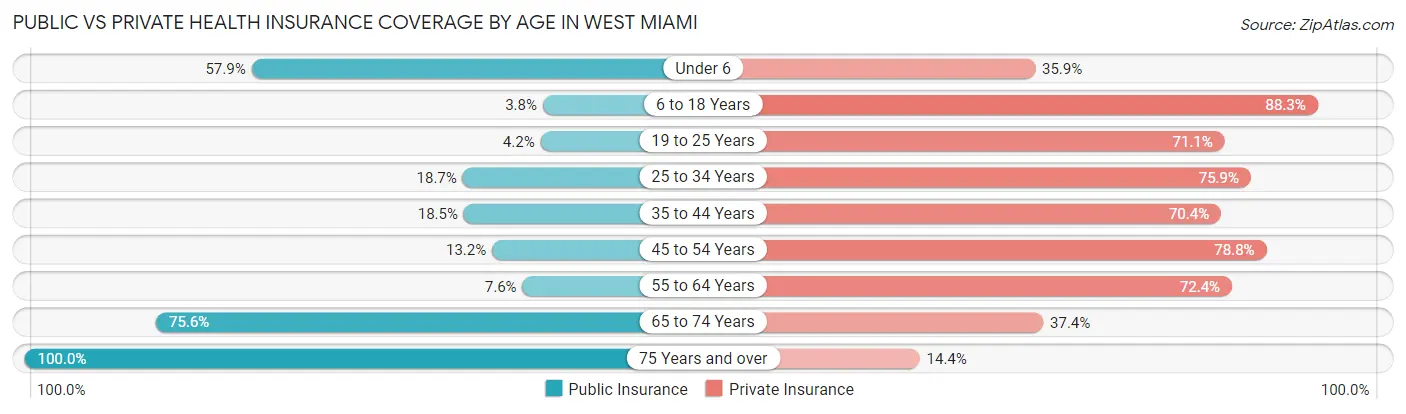
| Age Bracket | Public Insurance | Private Insurance |
| Under 6 | 418 (57.9%) | 259 (35.9%) |
| 6 to 18 Years | 17 (3.8%) | 393 (88.3%) |
| 19 to 25 Years | 28 (4.2%) | 469 (71.1%) |
| 25 to 34 Years | 149 (18.7%) | 605 (75.9%) |
| 35 to 44 Years | 194 (18.5%) | 739 (70.4%) |
| 45 to 54 Years | 133 (13.2%) | 792 (78.8%) |
| 55 to 64 Years | 82 (7.6%) | 782 (72.4%) |
| 65 to 74 Years | 431 (75.6%) | 213 (37.4%) |
| 75 Years and over | 720 (100.0%) | 104 (14.4%) |
| Total | 2,172 (30.8%) | 4,356 (61.8%) |
Disability Status by Sex by Age in West Miami
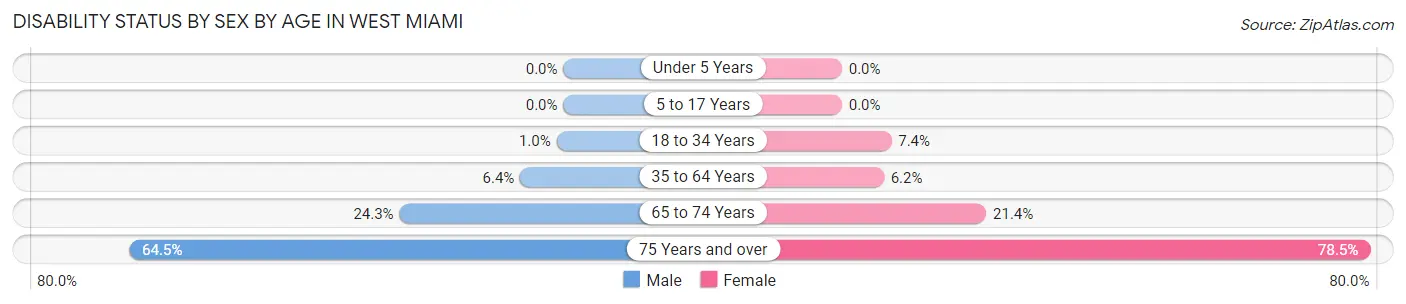
| Age Bracket | Male | Female |
| Under 5 Years | 0 (0.0%) | 0 (0.0%) |
| 5 to 17 Years | 0 (0.0%) | 0 (0.0%) |
| 18 to 34 Years | 8 (1.0%) | 57 (7.3%) |
| 35 to 64 Years | 102 (6.4%) | 96 (6.2%) |
| 65 to 74 Years | 74 (24.3%) | 57 (21.4%) |
| 75 Years and over | 207 (64.5%) | 313 (78.4%) |
Disability Class by Sex by Age in West Miami
Disability Class: Hearing Difficulty
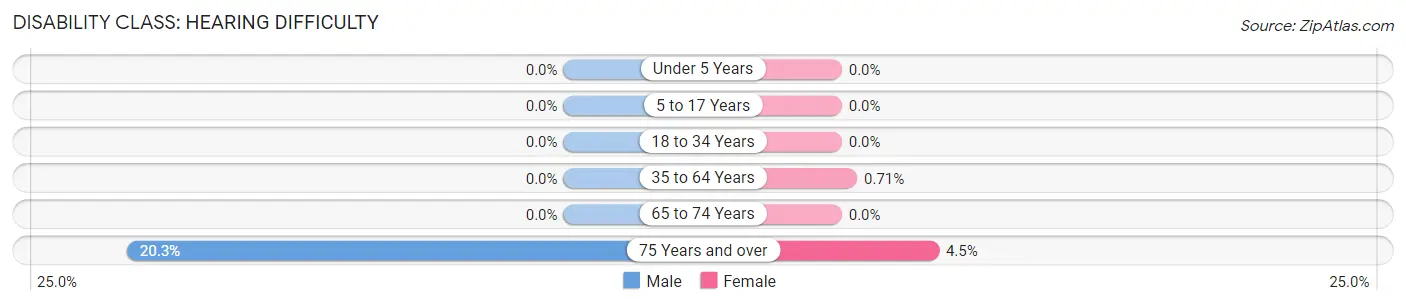
| Age Bracket | Male | Female |
| Under 5 Years | 0 (0.0%) | 0 (0.0%) |
| 5 to 17 Years | 0 (0.0%) | 0 (0.0%) |
| 18 to 34 Years | 0 (0.0%) | 0 (0.0%) |
| 35 to 64 Years | 0 (0.0%) | 11 (0.7%) |
| 65 to 74 Years | 0 (0.0%) | 0 (0.0%) |
| 75 Years and over | 65 (20.3%) | 18 (4.5%) |
Disability Class: Vision Difficulty
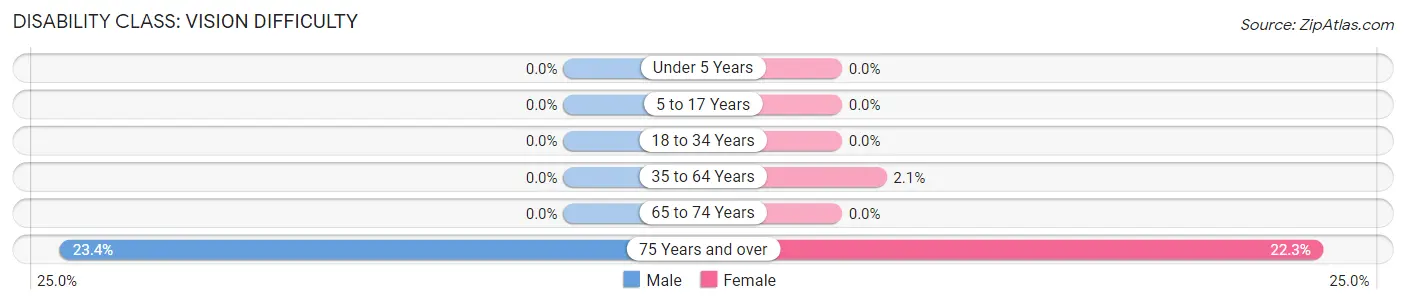
| Age Bracket | Male | Female |
| Under 5 Years | 0 (0.0%) | 0 (0.0%) |
| 5 to 17 Years | 0 (0.0%) | 0 (0.0%) |
| 18 to 34 Years | 0 (0.0%) | 0 (0.0%) |
| 35 to 64 Years | 0 (0.0%) | 32 (2.1%) |
| 65 to 74 Years | 0 (0.0%) | 0 (0.0%) |
| 75 Years and over | 75 (23.4%) | 89 (22.3%) |
Disability Class: Cognitive Difficulty
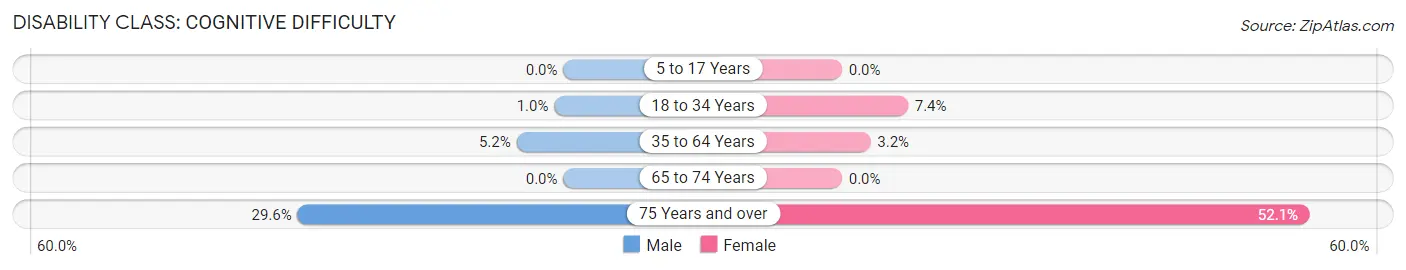
| Age Bracket | Male | Female |
| 5 to 17 Years | 0 (0.0%) | 0 (0.0%) |
| 18 to 34 Years | 8 (1.0%) | 57 (7.3%) |
| 35 to 64 Years | 83 (5.2%) | 49 (3.2%) |
| 65 to 74 Years | 0 (0.0%) | 0 (0.0%) |
| 75 Years and over | 95 (29.6%) | 208 (52.1%) |
Disability Class: Ambulatory Difficulty
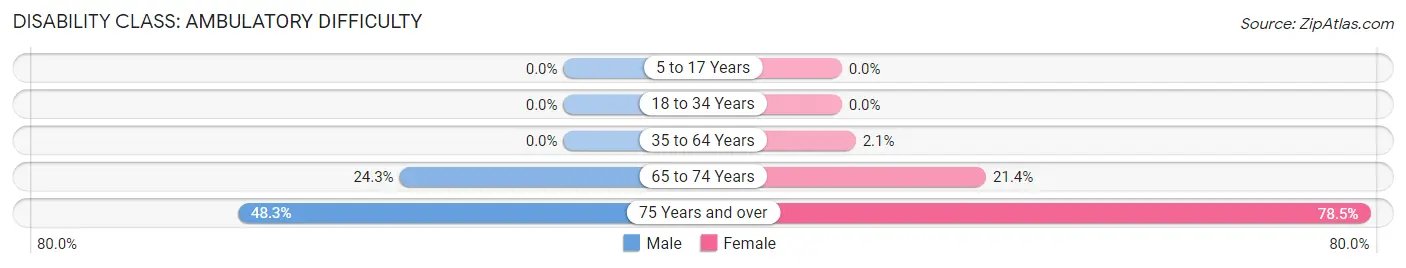
| Age Bracket | Male | Female |
| 5 to 17 Years | 0 (0.0%) | 0 (0.0%) |
| 18 to 34 Years | 0 (0.0%) | 0 (0.0%) |
| 35 to 64 Years | 0 (0.0%) | 32 (2.1%) |
| 65 to 74 Years | 74 (24.3%) | 57 (21.4%) |
| 75 Years and over | 155 (48.3%) | 313 (78.4%) |
Disability Class: Self-Care Difficulty
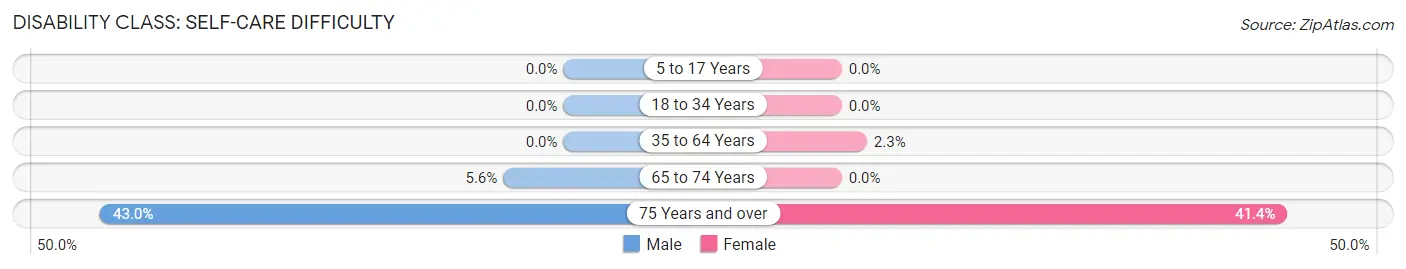
| Age Bracket | Male | Female |
| 5 to 17 Years | 0 (0.0%) | 0 (0.0%) |
| 18 to 34 Years | 0 (0.0%) | 0 (0.0%) |
| 35 to 64 Years | 0 (0.0%) | 36 (2.3%) |
| 65 to 74 Years | 17 (5.6%) | 0 (0.0%) |
| 75 Years and over | 138 (43.0%) | 165 (41.3%) |
Technology Access in West Miami
Computing Device Access in West Miami
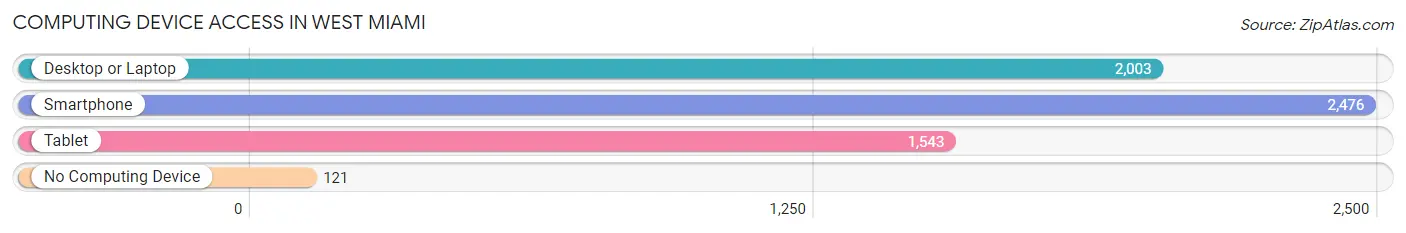
| Device Type | # Households | % Households |
| Desktop or Laptop | 2,003 | 74.3% |
| Smartphone | 2,476 | 91.9% |
| Tablet | 1,543 | 57.3% |
| No Computing Device | 121 | 4.5% |
| Total | 2,695 | 100.0% |
Internet Access in West Miami
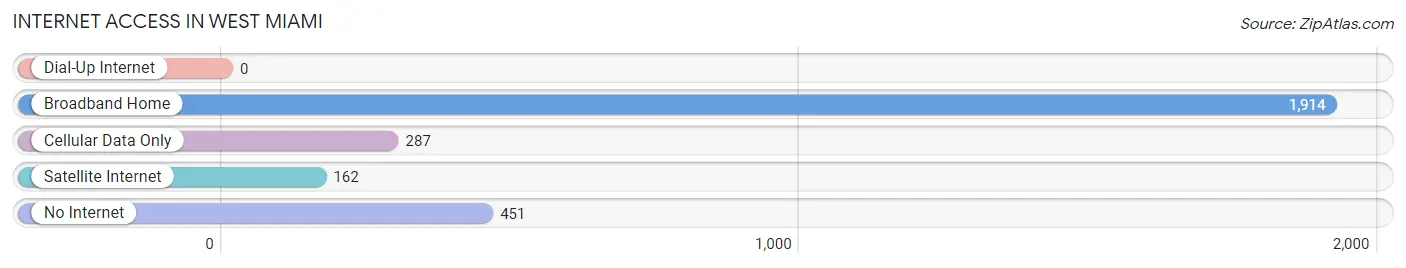
| Internet Type | # Households | % Households |
| Dial-Up Internet | 0 | 0.0% |
| Broadband Home | 1,914 | 71.0% |
| Cellular Data Only | 287 | 10.6% |
| Satellite Internet | 162 | 6.0% |
| No Internet | 451 | 16.7% |
| Total | 2,695 | 100.0% |
West Miami Summary
Miami, Florida is a vibrant city located in the southeastern United States. It is the largest city in the state of Florida and the second-largest metropolitan area in the United States. Miami is a major center for finance, commerce, culture, media, entertainment, the arts, and international trade. It is also home to a diverse population of people from all over the world.
West Miami is a city located in Miami-Dade County, Florida. It is a suburb of Miami and is located just west of the city. West Miami is a small city with a population of just over 6,000 people. The city is known for its diverse population, with people from all over the world living in the area.
History
West Miami was founded in 1925 by a group of developers who wanted to create a residential community in the area. The city was incorporated in 1947 and has since grown to become a vibrant and diverse community.
The city has a rich history and has been home to many famous people, including former President Richard Nixon, who lived in West Miami for a time. The city has also been home to many famous musicians, including Gloria Estefan and Pitbull.
Geography
West Miami is located in Miami-Dade County, Florida. It is located just west of the city of Miami and is bordered by the cities of Coral Gables, South Miami, and Pinecrest. The city is located on the Miami River and is just a few miles from the Atlantic Ocean.
The city has a total area of 1.3 square miles, all of which is land. The city has a tropical climate with hot and humid summers and mild winters.
Economy
West Miami has a strong economy that is driven by tourism, retail, and real estate. The city is home to many businesses, including restaurants, hotels, and shopping centers. The city also has a thriving arts and culture scene, with many galleries, museums, and theaters.
The city is also home to many educational institutions, including Miami Dade College and the University of Miami.
Demographics
West Miami has a population of just over 6,000 people. The city has a diverse population, with people from all over the world living in the area. The city has a median household income of $45,000 and a median home value of $250,000.
The city is home to many different ethnicities, including Hispanic, African American, and Caucasian. The city also has a large population of immigrants, with people from Cuba, Haiti, and other countries living in the area.
Conclusion
West Miami is a vibrant and diverse city located in Miami-Dade County, Florida. The city has a rich history and a strong economy that is driven by tourism, retail, and real estate. The city is home to a diverse population of people from all over the world. West Miami is a great place to live and work and is a great place to visit.
Common Questions
What is Per Capita Income in West Miami?
Per Capita income in West Miami is $38,156.
What is the Median Family Income in West Miami?
Median Family Income in West Miami is $97,396.
What is the Median Household income in West Miami?
Median Household Income in West Miami is $73,525.
What is Income or Wage Gap in West Miami?
Income or Wage Gap in West Miami is 18.6%.
Women in West Miami earn 81.4 cents for every dollar earned by a man.
What is Inequality or Gini Index in West Miami?
Inequality or Gini Index in West Miami is 0.45.
What is the Total Population of West Miami?
Total Population of West Miami is 7,104.
What is the Total Male Population of West Miami?
Total Male Population of West Miami is 3,421.
What is the Total Female Population of West Miami?
Total Female Population of West Miami is 3,683.
What is the Ratio of Males per 100 Females in West Miami?
There are 92.89 Males per 100 Females in West Miami.
What is the Ratio of Females per 100 Males in West Miami?
There are 107.66 Females per 100 Males in West Miami.
What is the Median Population Age in West Miami?
Median Population Age in West Miami is 41.6 Years.
What is the Average Family Size in West Miami
Average Family Size in West Miami is 3.0 People.
What is the Average Household Size in West Miami
Average Household Size in West Miami is 2.6 People.
How Large is the Labor Force in West Miami?
There are 3,953 People in the Labor Forcein in West Miami.
What is the Percentage of People in the Labor Force in West Miami?
65.0% of People are in the Labor Force in West Miami.
What is the Unemployment Rate in West Miami?
Unemployment Rate in West Miami is 3.7%.