Salem, GA Map & Demographics
Salem Map
Salem Overview
$27,086
PER CAPITA INCOME
$82,500
AVG FAMILY INCOME
$36,618
AVG HOUSEHOLD INCOME
2.6%
WAGE / INCOME GAP [ % ]
97.4¢/ $1
WAGE / INCOME GAP [ $ ]
0.43
INEQUALITY / GINI INDEX
377
TOTAL POPULATION
216
MALE POPULATION
161
FEMALE POPULATION
134.16
MALES / 100 FEMALES
74.54
FEMALES / 100 MALES
58.0
MEDIAN AGE
3.2
AVG FAMILY SIZE
2.1
AVG HOUSEHOLD SIZE
170
LABOR FORCE [ PEOPLE ]
53.0%
PERCENT IN LABOR FORCE
Income in Salem
Income Overview in Salem
Per Capita Income in Salem is $27,086, while median incomes of families and households are $82,500 and $36,618 respectively.
| Characteristic | Number | Measure |
| Per Capita Income | 377 | $27,086 |
| Median Family Income | 88 | $82,500 |
| Mean Family Income | 88 | $77,149 |
| Median Household Income | 176 | $36,618 |
| Mean Household Income | 176 | $51,770 |
| Income Deficit | 88 | $0 |
| Wage / Income Gap (%) | 377 | 2.64% |
| Wage / Income Gap ($) | 377 | 97.36¢ per $1 |
| Gini / Inequality Index | 377 | 0.43 |
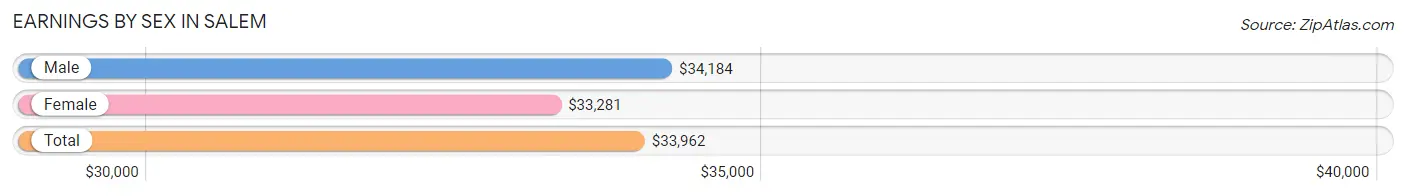
Earnings by Sex in Salem
Average Earnings in Salem are $33,962, $34,184 for men and $33,281 for women, a difference of 2.6%.
| Sex | Number | Average Earnings |
| Male | 66 (38.8%) | $34,184 |
| Female | 104 (61.2%) | $33,281 |
| Total | 170 (100.0%) | $33,962 |
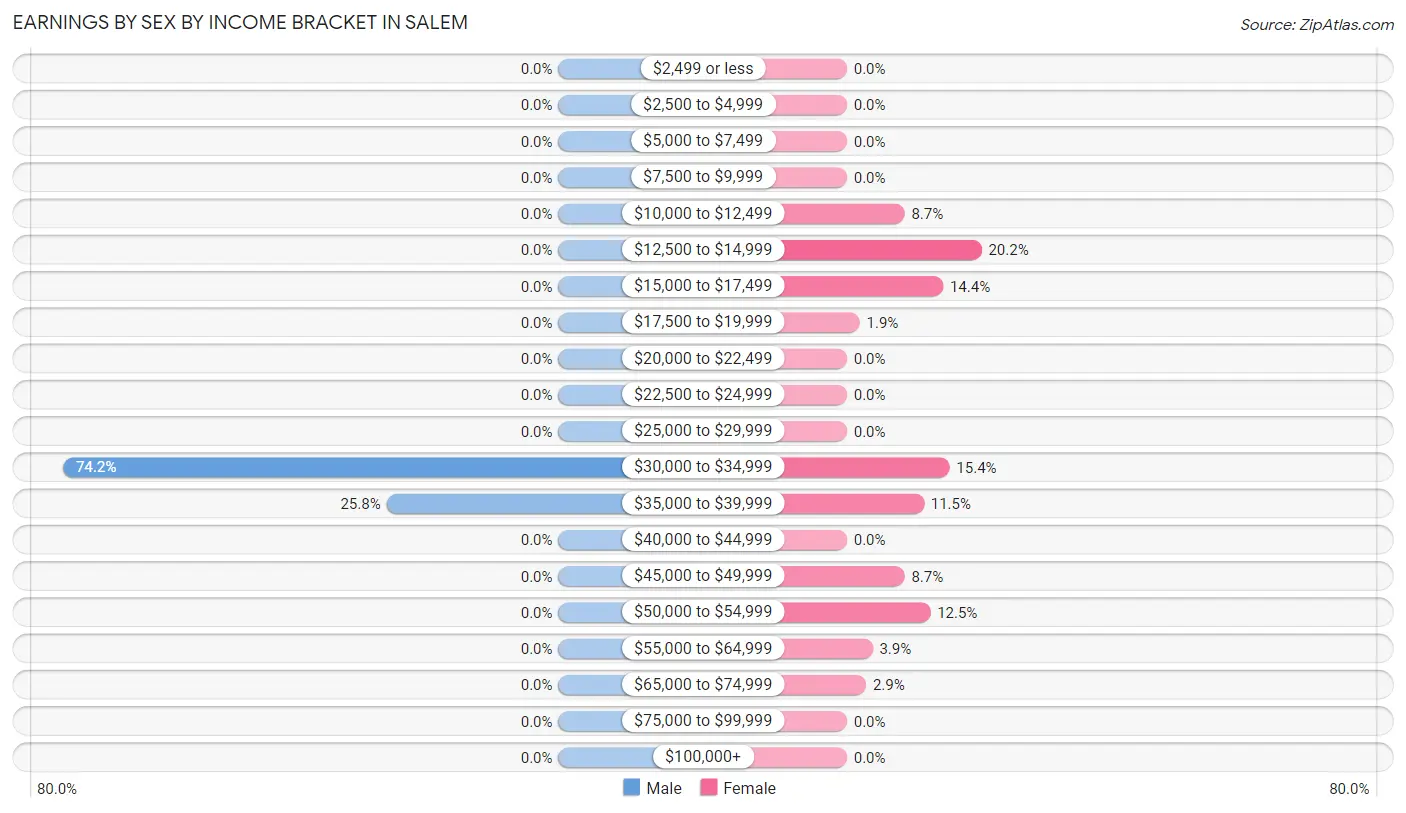
Earnings by Sex by Income Bracket in Salem
The most common earnings brackets in Salem are $30,000 to $34,999 for men (49 | 74.2%) and $12,500 to $14,999 for women (21 | 20.2%).
| Income | Male | Female |
| $2,499 or less | 0 (0.0%) | 0 (0.0%) |
| $2,500 to $4,999 | 0 (0.0%) | 0 (0.0%) |
| $5,000 to $7,499 | 0 (0.0%) | 0 (0.0%) |
| $7,500 to $9,999 | 0 (0.0%) | 0 (0.0%) |
| $10,000 to $12,499 | 0 (0.0%) | 9 (8.6%) |
| $12,500 to $14,999 | 0 (0.0%) | 21 (20.2%) |
| $15,000 to $17,499 | 0 (0.0%) | 15 (14.4%) |
| $17,500 to $19,999 | 0 (0.0%) | 2 (1.9%) |
| $20,000 to $22,499 | 0 (0.0%) | 0 (0.0%) |
| $22,500 to $24,999 | 0 (0.0%) | 0 (0.0%) |
| $25,000 to $29,999 | 0 (0.0%) | 0 (0.0%) |
| $30,000 to $34,999 | 49 (74.2%) | 16 (15.4%) |
| $35,000 to $39,999 | 17 (25.8%) | 12 (11.5%) |
| $40,000 to $44,999 | 0 (0.0%) | 0 (0.0%) |
| $45,000 to $49,999 | 0 (0.0%) | 9 (8.6%) |
| $50,000 to $54,999 | 0 (0.0%) | 13 (12.5%) |
| $55,000 to $64,999 | 0 (0.0%) | 4 (3.8%) |
| $65,000 to $74,999 | 0 (0.0%) | 3 (2.9%) |
| $75,000 to $99,999 | 0 (0.0%) | 0 (0.0%) |
| $100,000+ | 0 (0.0%) | 0 (0.0%) |
| Total | 66 (100.0%) | 104 (100.0%) |
Earnings by Sex by Educational Attainment in Salem
| Educational Attainment | Male Income | Female Income |
| Less than High School | - | - |
| High School Diploma | - | - |
| College or Associate's Degree | - | - |
| Bachelor's Degree | - | - |
| Graduate Degree | - | - |
| Total | $34,184 | $34,922 |
Family Income in Salem
Family Income Brackets in Salem
According to the Salem family income data, there are 33 families falling into the $35,000 to $49,999 income range, which is the most common income bracket and makes up 37.5% of all families.
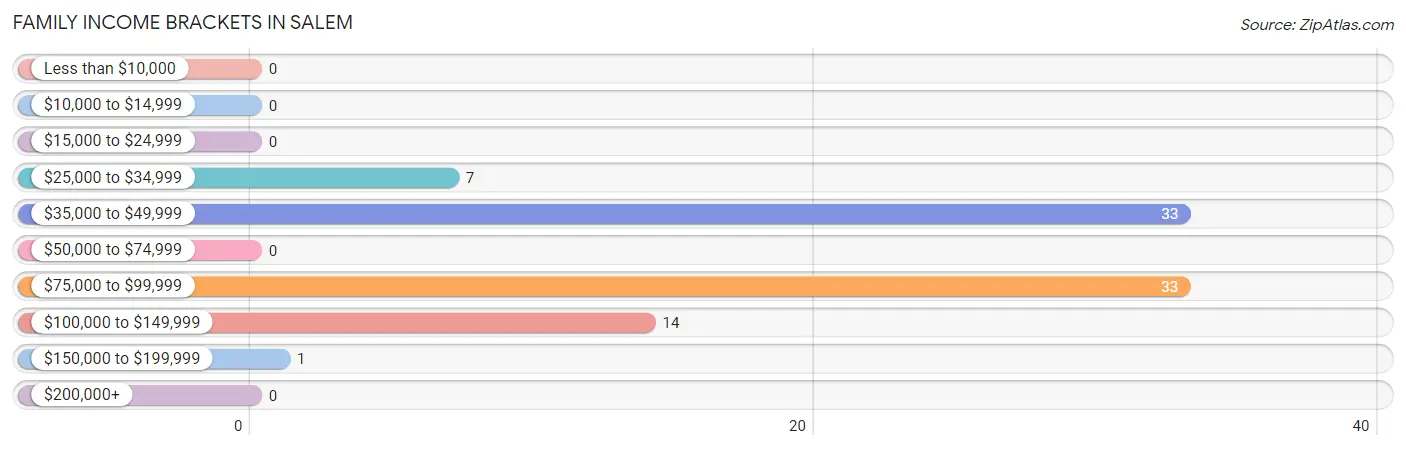
| Income Bracket | # Families | % Families |
| Less than $10,000 | 0 | 0.0% |
| $10,000 to $14,999 | 0 | 0.0% |
| $15,000 to $24,999 | 0 | 0.0% |
| $25,000 to $34,999 | 7 | 8.0% |
| $35,000 to $49,999 | 33 | 37.5% |
| $50,000 to $74,999 | 0 | 0.0% |
| $75,000 to $99,999 | 33 | 37.5% |
| $100,000 to $149,999 | 14 | 15.9% |
| $150,000 to $199,999 | 1 | 1.1% |
| $200,000+ | 0 | 0.0% |
Family Income by Famaliy Size in Salem
2-person families (57 | 64.8%) account for the highest median family income in Salem with $93,657 per family, while 2-person families (57 | 64.8%) have the highest median income of $46,828 per family member.
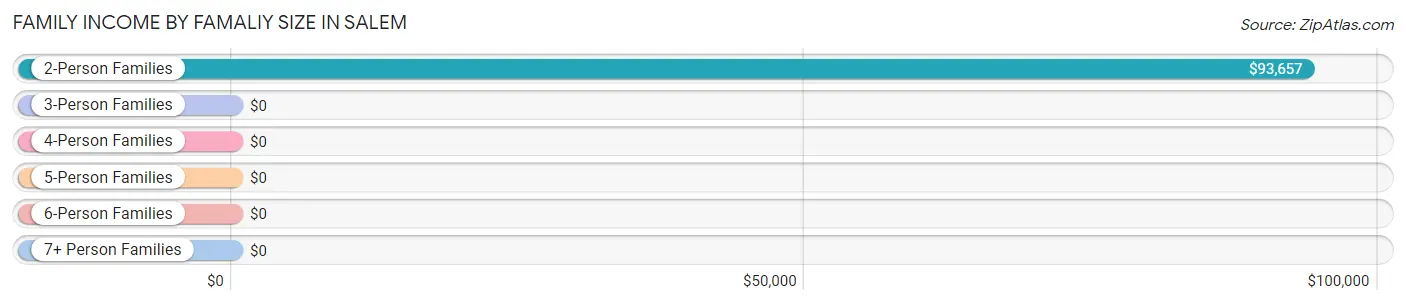
| Income Bracket | # Families | Median Income |
| 2-Person Families | 57 (64.8%) | $93,657 |
| 3-Person Families | 15 (17.1%) | $0 |
| 4-Person Families | 16 (18.2%) | $0 |
| 5-Person Families | 0 (0.0%) | $0 |
| 6-Person Families | 0 (0.0%) | $0 |
| 7+ Person Families | 0 (0.0%) | $0 |
| Total | 88 (100.0%) | $82,500 |
Family Income by Number of Earners in Salem
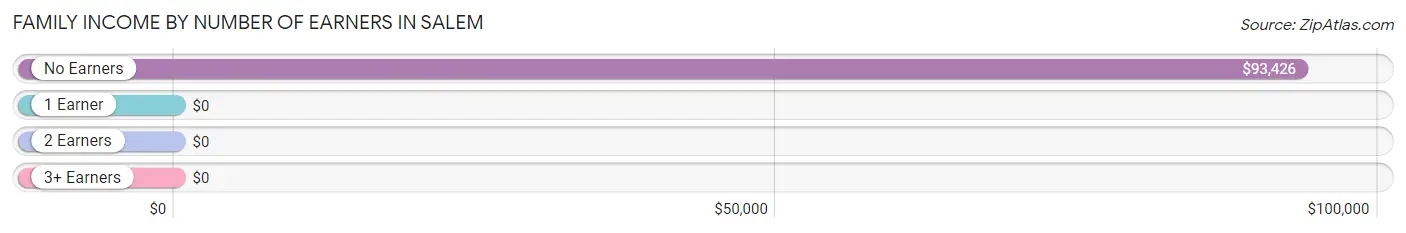
| Number of Earners | # Families | Median Income |
| No Earners | 34 (38.6%) | $93,426 |
| 1 Earner | 38 (43.2%) | $0 |
| 2 Earners | 16 (18.2%) | $0 |
| 3+ Earners | 0 (0.0%) | $0 |
| Total | 88 (100.0%) | $82,500 |
Household Income in Salem
Household Income Brackets in Salem
With 47 households falling in the category, the $35,000 to $49,999 income range is the most frequent in Salem, accounting for 26.7% of all households.
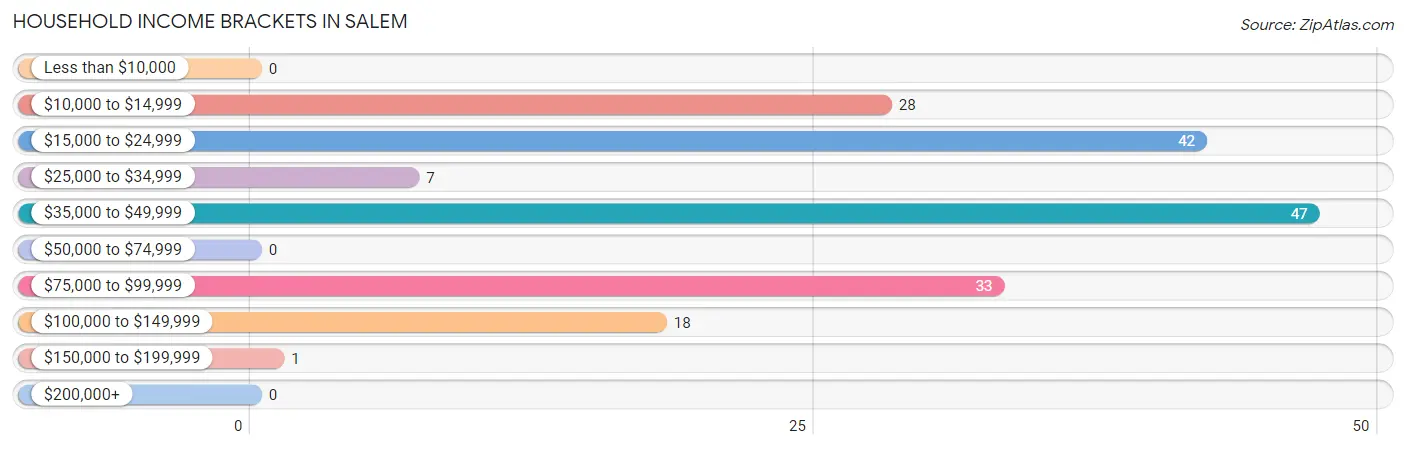
| Income Bracket | # Households | % Households |
| Less than $10,000 | 0 | 0.0% |
| $10,000 to $14,999 | 28 | 15.9% |
| $15,000 to $24,999 | 42 | 23.9% |
| $25,000 to $34,999 | 7 | 4.0% |
| $35,000 to $49,999 | 47 | 26.7% |
| $50,000 to $74,999 | 0 | 0.0% |
| $75,000 to $99,999 | 33 | 18.8% |
| $100,000 to $149,999 | 18 | 10.2% |
| $150,000 to $199,999 | 1 | 0.6% |
| $200,000+ | 0 | 0.0% |
Household Income by Householder Age in Salem
The median household income in Salem is $36,618, with the highest median household income of $36,979 found in the 25 to 44 years age bracket for the primary householder. A total of 37 households (21.0%) fall into this category.
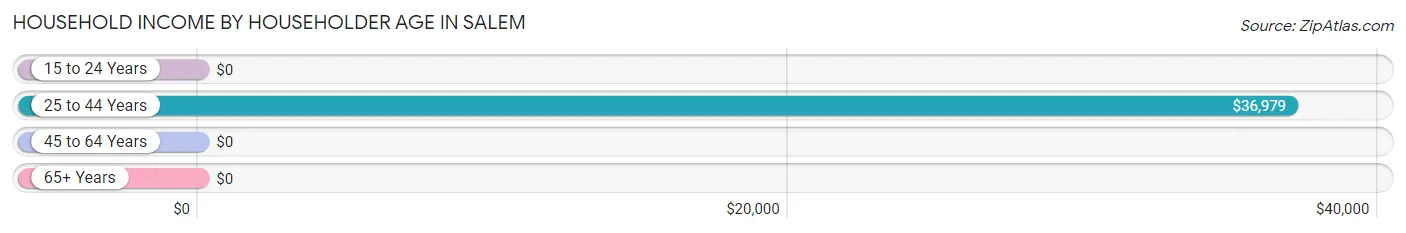
| Income Bracket | # Households | Median Income |
| 15 to 24 Years | 0 (0.0%) | $0 |
| 25 to 44 Years | 37 (21.0%) | $36,979 |
| 45 to 64 Years | 74 (42.0%) | $0 |
| 65+ Years | 65 (36.9%) | $0 |
| Total | 176 (100.0%) | $36,618 |
Poverty in Salem
Income Below Poverty by Sex and Age in Salem
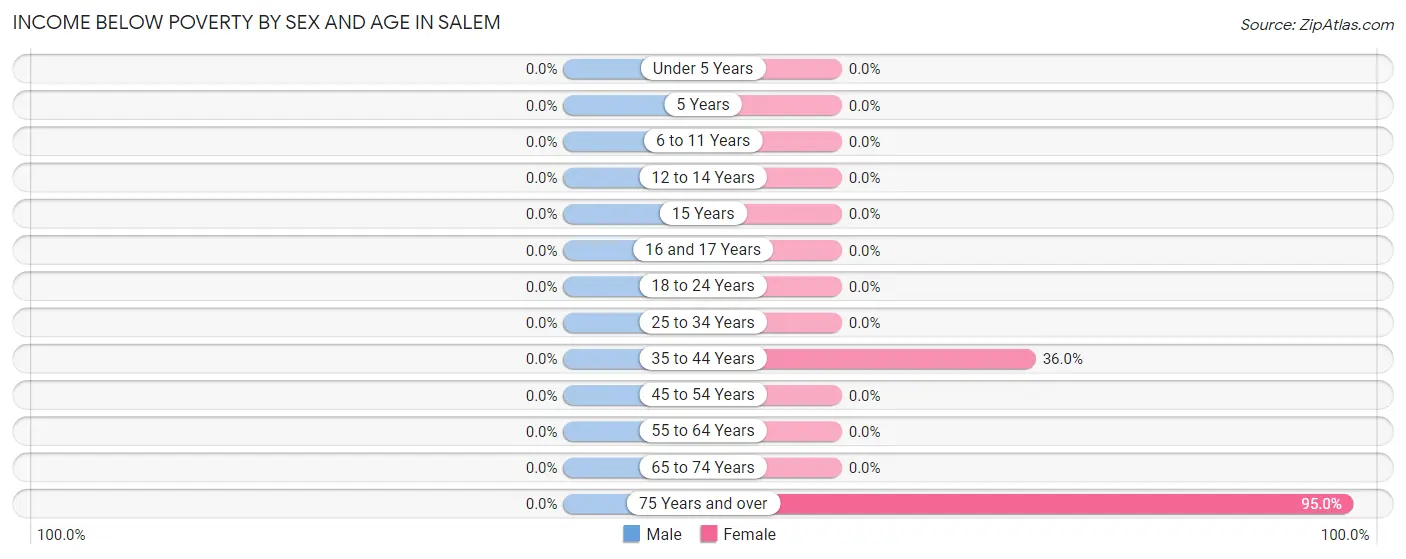
| Age Bracket | Male | Female |
| Under 5 Years | 0 (0.0%) | 0 (0.0%) |
| 5 Years | 0 (0.0%) | 0 (0.0%) |
| 6 to 11 Years | 0 (0.0%) | 0 (0.0%) |
| 12 to 14 Years | 0 (0.0%) | 0 (0.0%) |
| 15 Years | 0 (0.0%) | 0 (0.0%) |
| 16 and 17 Years | 0 (0.0%) | 0 (0.0%) |
| 18 to 24 Years | 0 (0.0%) | 0 (0.0%) |
| 25 to 34 Years | 0 (0.0%) | 0 (0.0%) |
| 35 to 44 Years | 0 (0.0%) | 9 (36.0%) |
| 45 to 54 Years | 0 (0.0%) | 0 (0.0%) |
| 55 to 64 Years | 0 (0.0%) | 0 (0.0%) |
| 65 to 74 Years | 0 (0.0%) | 0 (0.0%) |
| 75 Years and over | 0 (0.0%) | 19 (95.0%) |
| Total | 0 (0.0%) | 28 (17.4%) |
Income Above Poverty by Sex and Age in Salem
According to the poverty statistics in Salem, males aged under 5 years and females aged 18 to 24 years are the age groups that are most secure financially, with 100.0% of males and 100.0% of females in these age groups living above the poverty line.
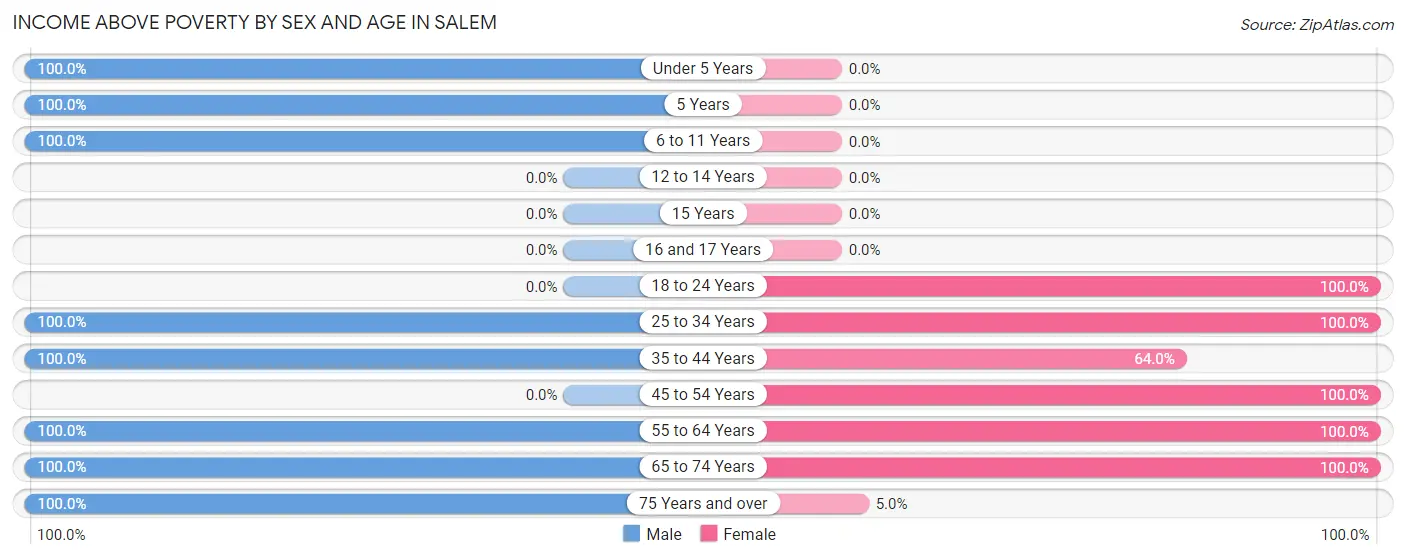
| Age Bracket | Male | Female |
| Under 5 Years | 22 (100.0%) | 0 (0.0%) |
| 5 Years | 17 (100.0%) | 0 (0.0%) |
| 6 to 11 Years | 17 (100.0%) | 0 (0.0%) |
| 12 to 14 Years | 0 (0.0%) | 0 (0.0%) |
| 15 Years | 0 (0.0%) | 0 (0.0%) |
| 16 and 17 Years | 0 (0.0%) | 0 (0.0%) |
| 18 to 24 Years | 0 (0.0%) | 21 (100.0%) |
| 25 to 34 Years | 13 (100.0%) | 12 (100.0%) |
| 35 to 44 Years | 6 (100.0%) | 16 (64.0%) |
| 45 to 54 Years | 0 (0.0%) | 7 (100.0%) |
| 55 to 64 Years | 97 (100.0%) | 48 (100.0%) |
| 65 to 74 Years | 34 (100.0%) | 28 (100.0%) |
| 75 Years and over | 10 (100.0%) | 1 (5.0%) |
| Total | 216 (100.0%) | 133 (82.6%) |
Income Below Poverty Among Married-Couple Families in Salem
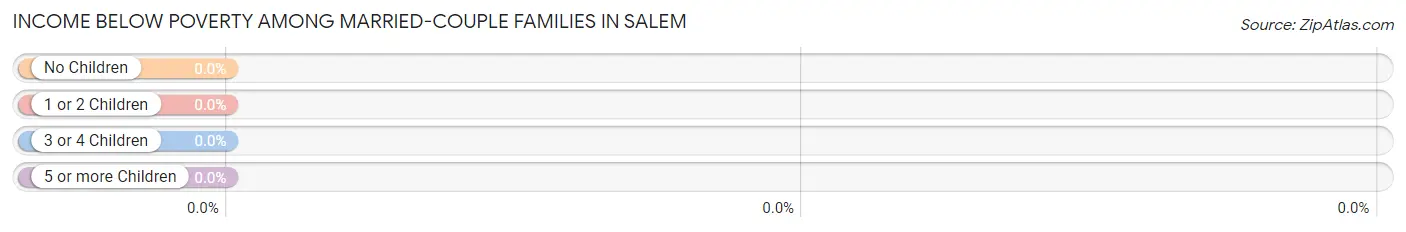
| Children | Above Poverty | Below Poverty |
| No Children | 53 (100.0%) | 0 (0.0%) |
| 1 or 2 Children | 16 (100.0%) | 0 (0.0%) |
| 3 or 4 Children | 0 (0.0%) | 0 (0.0%) |
| 5 or more Children | 0 (0.0%) | 0 (0.0%) |
| Total | 69 (100.0%) | 0 (0.0%) |
Income Below Poverty Among Single-Parent Households in Salem
| Children | Single Father | Single Mother |
| No Children | 0 (0.0%) | 0 (0.0%) |
| 1 or 2 Children | 0 (0.0%) | 0 (0.0%) |
| 3 or 4 Children | 0 (0.0%) | 0 (0.0%) |
| 5 or more Children | 0 (0.0%) | 0 (0.0%) |
| Total | 0 (0.0%) | 0 (0.0%) |
Income Below Poverty Among Married-Couple vs Single-Parent Households in Salem
| Children | Married-Couple Families | Single-Parent Households |
| No Children | 0 (0.0%) | 0 (0.0%) |
| 1 or 2 Children | 0 (0.0%) | 0 (0.0%) |
| 3 or 4 Children | 0 (0.0%) | 0 (0.0%) |
| 5 or more Children | 0 (0.0%) | 0 (0.0%) |
| Total | 0 (0.0%) | 0 (0.0%) |
Race in Salem
The most populous races in Salem are Black / African American (347 | 92.0%), Hispanic or Latino (15 | 4.0%), and White / Caucasian (15 | 4.0%).
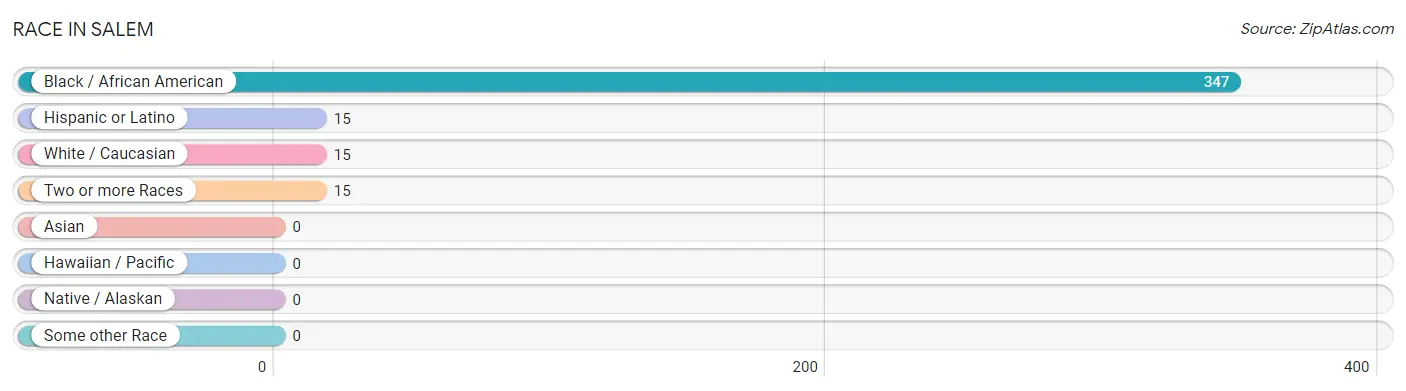
| Race | # Population | % Population |
| Asian | 0 | 0.0% |
| Black / African American | 347 | 92.0% |
| Hawaiian / Pacific | 0 | 0.0% |
| Hispanic or Latino | 15 | 4.0% |
| Native / Alaskan | 0 | 0.0% |
| White / Caucasian | 15 | 4.0% |
| Two or more Races | 15 | 4.0% |
| Some other Race | 0 | 0.0% |
| Total | 377 | 100.0% |
Ancestry in Salem
The most populous ancestries reported in Salem are Colombian (15 | 4.0%), South American (15 | 4.0%), and American (3 | 0.8%), together accounting for 8.8% of all Salem residents.
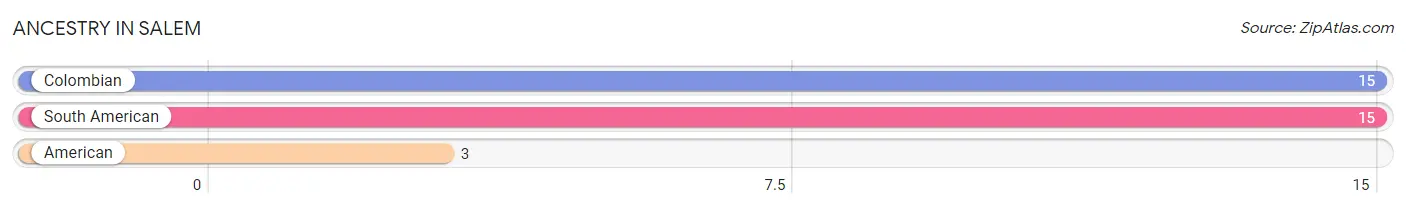
| Ancestry | # Population | % Population |
| American | 3 | 0.8% |
| Colombian | 15 | 4.0% |
| South American | 15 | 4.0% | View All 3 Rows |
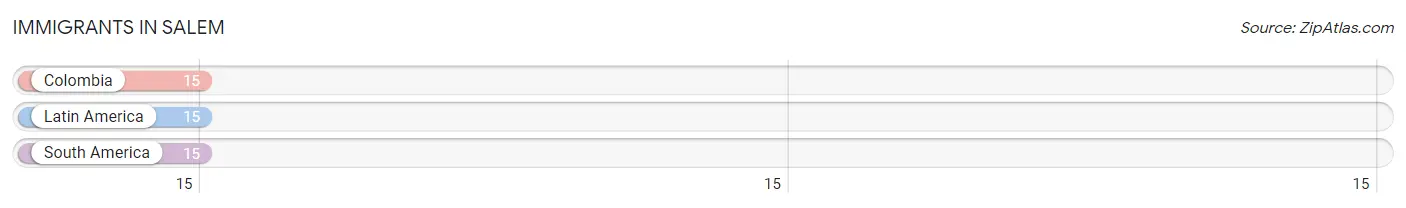
Immigrants in Salem
The most numerous immigrant groups reported in Salem came from Colombia (15 | 4.0%), Latin America (15 | 4.0%), and South America (15 | 4.0%), together accounting for 11.9% of all Salem residents.
| Immigration Origin | # Population | % Population |
| Colombia | 15 | 4.0% |
| Latin America | 15 | 4.0% |
| South America | 15 | 4.0% | View All 3 Rows |
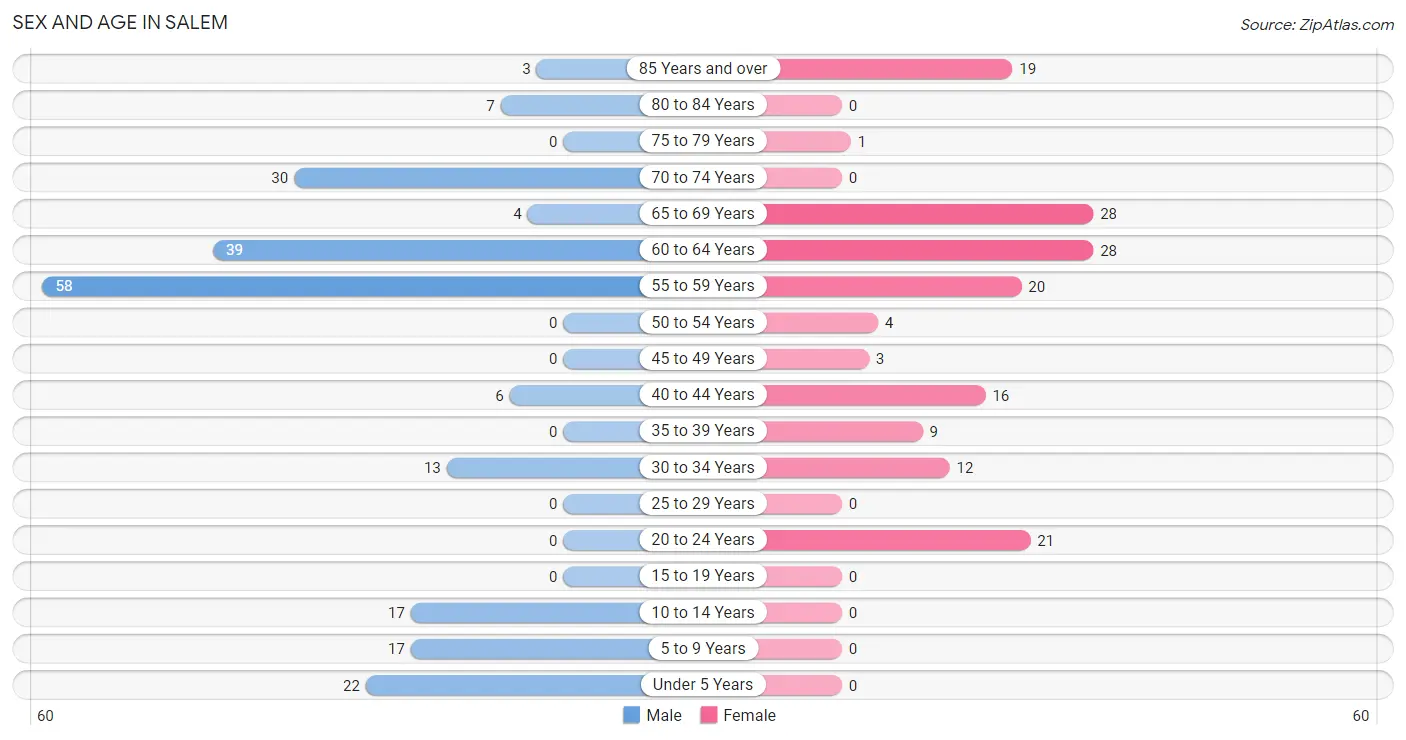
Sex and Age in Salem
Sex and Age in Salem
The most populous age groups in Salem are 55 to 59 Years (58 | 26.9%) for men and 60 to 64 Years (28 | 17.4%) for women.
| Age Bracket | Male | Female |
| Under 5 Years | 22 (10.2%) | 0 (0.0%) |
| 5 to 9 Years | 17 (7.9%) | 0 (0.0%) |
| 10 to 14 Years | 17 (7.9%) | 0 (0.0%) |
| 15 to 19 Years | 0 (0.0%) | 0 (0.0%) |
| 20 to 24 Years | 0 (0.0%) | 21 (13.0%) |
| 25 to 29 Years | 0 (0.0%) | 0 (0.0%) |
| 30 to 34 Years | 13 (6.0%) | 12 (7.4%) |
| 35 to 39 Years | 0 (0.0%) | 9 (5.6%) |
| 40 to 44 Years | 6 (2.8%) | 16 (9.9%) |
| 45 to 49 Years | 0 (0.0%) | 3 (1.9%) |
| 50 to 54 Years | 0 (0.0%) | 4 (2.5%) |
| 55 to 59 Years | 58 (26.9%) | 20 (12.4%) |
| 60 to 64 Years | 39 (18.1%) | 28 (17.4%) |
| 65 to 69 Years | 4 (1.8%) | 28 (17.4%) |
| 70 to 74 Years | 30 (13.9%) | 0 (0.0%) |
| 75 to 79 Years | 0 (0.0%) | 1 (0.6%) |
| 80 to 84 Years | 7 (3.2%) | 0 (0.0%) |
| 85 Years and over | 3 (1.4%) | 19 (11.8%) |
| Total | 216 (100.0%) | 161 (100.0%) |
Families and Households in Salem
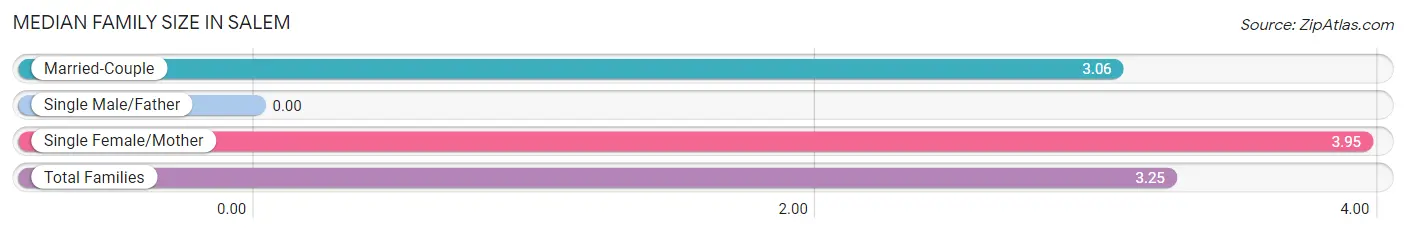
Median Family Size in Salem
| Family Type | # Families | Family Size |
| Married-Couple | 69 (78.4%) | 3.06 |
| Single Male/Father | 0 (0.0%) | - |
| Single Female/Mother | 19 (21.6%) | 3.95 |
| Total Families | 88 (100.0%) | 3.25 |
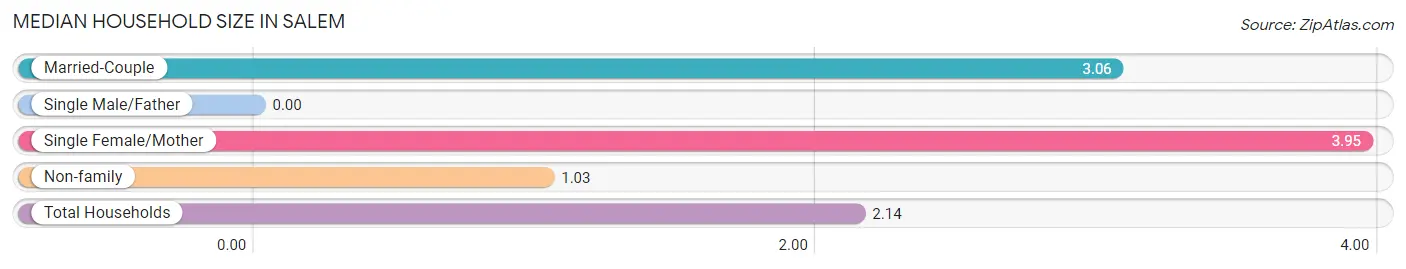
Median Household Size in Salem
| Household Type | # Households | Household Size |
| Married-Couple | 69 (39.2%) | 3.06 |
| Single Male/Father | 0 (0.0%) | - |
| Single Female/Mother | 19 (10.8%) | 3.95 |
| Non-family | 88 (50.0%) | 1.03 |
| Total Households | 176 (100.0%) | 2.14 |
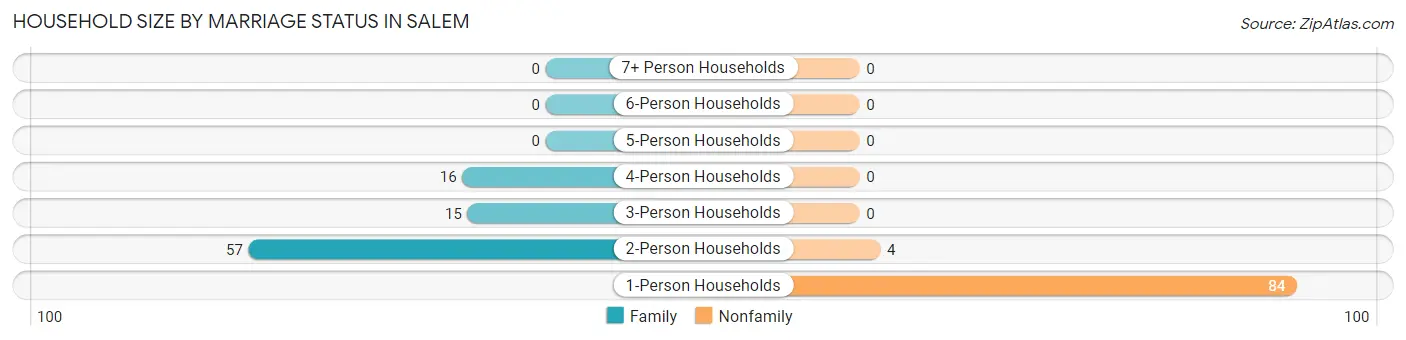
Household Size by Marriage Status in Salem
Out of a total of 176 households in Salem, 88 (50.0%) are family households, while 88 (50.0%) are nonfamily households. The most numerous type of family households are 2-person households, comprising 57, and the most common type of nonfamily households are 1-person households, comprising 84.
| Household Size | Family Households | Nonfamily Households |
| 1-Person Households | - | 84 (47.7%) |
| 2-Person Households | 57 (32.4%) | 4 (2.3%) |
| 3-Person Households | 15 (8.5%) | 0 (0.0%) |
| 4-Person Households | 16 (9.1%) | 0 (0.0%) |
| 5-Person Households | 0 (0.0%) | 0 (0.0%) |
| 6-Person Households | 0 (0.0%) | 0 (0.0%) |
| 7+ Person Households | 0 (0.0%) | 0 (0.0%) |
| Total | 88 (50.0%) | 88 (50.0%) |
Female Fertility in Salem
Fertility by Age in Salem
| Age Bracket | Women with Births | Births / 1,000 Women |
| 15 to 19 years | 0 (0.0%) | 0.0 |
| 20 to 34 years | 0 (0.0%) | 0.0 |
| 35 to 50 years | 0 (0.0%) | 0.0 |
| Total | 0 (0.0%) | 0.0 |
Fertility by Age by Marriage Status in Salem
| Age Bracket | Married | Unmarried |
| 15 to 19 years | 0 (0.0%) | 0 (0.0%) |
| 20 to 34 years | 0 (0.0%) | 0 (0.0%) |
| 35 to 50 years | 0 (0.0%) | 0 (0.0%) |
| Total | 0 (0.0%) | 0 (0.0%) |
Fertility by Education in Salem
| Educational Attainment | Women with Births | Births / 1,000 Women |
| Less than High School | 0 (0.0%) | 0.0 |
| High School Diploma | 0 (0.0%) | 0.0 |
| College or Associate's Degree | 0 (0.0%) | 0.0 |
| Bachelor's Degree | 0 (0.0%) | 0.0 |
| Graduate Degree | 0 (0.0%) | 0.0 |
| Total | 0 (0.0%) | 0.0 |
Fertility by Education by Marriage Status in Salem
| Educational Attainment | Married | Unmarried |
| Less than High School | 0 (0.0%) | 0 (0.0%) |
| High School Diploma | 0 (0.0%) | 0 (0.0%) |
| College or Associate's Degree | 0 (0.0%) | 0 (0.0%) |
| Bachelor's Degree | 0 (0.0%) | 0 (0.0%) |
| Graduate Degree | 0 (0.0%) | 0 (0.0%) |
| Total | 0 (0.0%) | 0 (0.0%) |
Employment Characteristics in Salem
Employment by Class of Employer in Salem
Among the 157 employed individuals in Salem, local government employees (53 | 33.8%), private company employees (52 | 33.1%), and federal government employees (37 | 23.6%) make up the most common classes of employment.
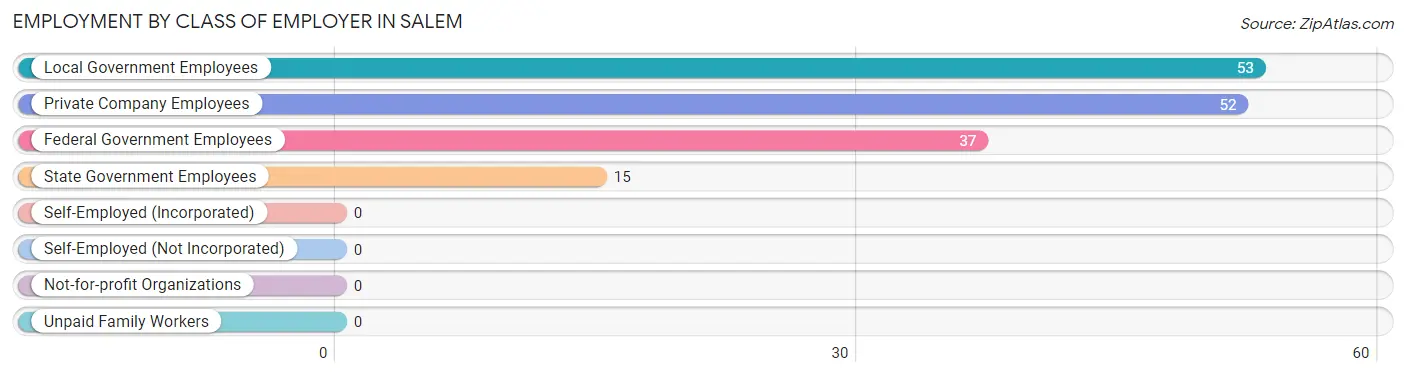
| Employer Class | # Employees | % Employees |
| Private Company Employees | 52 | 33.1% |
| Self-Employed (Incorporated) | 0 | 0.0% |
| Self-Employed (Not Incorporated) | 0 | 0.0% |
| Not-for-profit Organizations | 0 | 0.0% |
| Local Government Employees | 53 | 33.8% |
| State Government Employees | 15 | 9.6% |
| Federal Government Employees | 37 | 23.6% |
| Unpaid Family Workers | 0 | 0.0% |
| Total | 157 | 100.0% |
Employment Status by Age in Salem
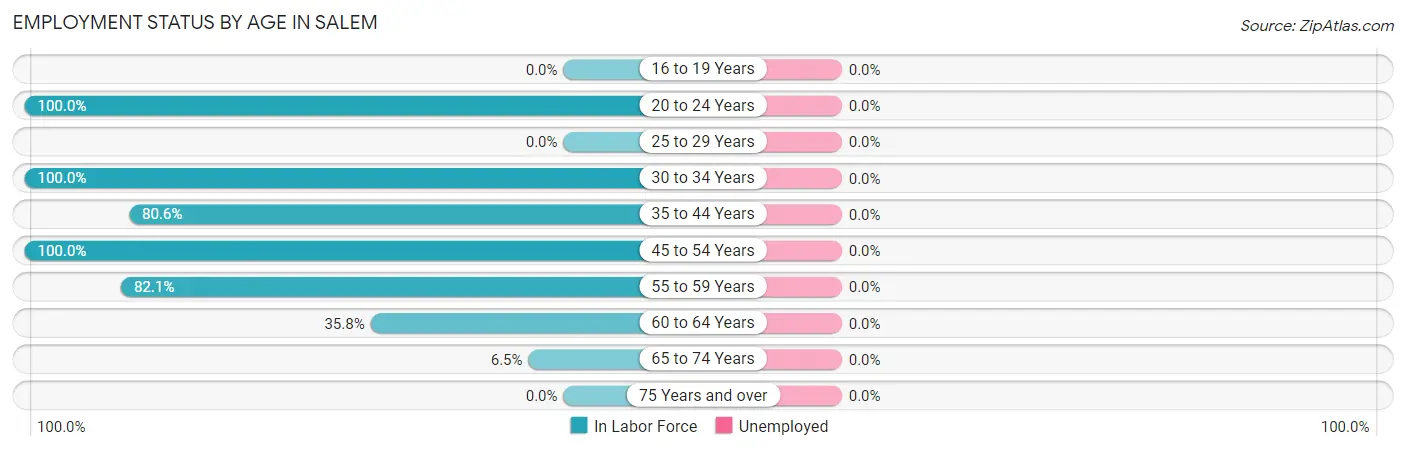
| Age Bracket | In Labor Force | Unemployed |
| 16 to 19 Years | 0 (0.0%) | 0 (0.0%) |
| 20 to 24 Years | 21 (100.0%) | 0 (0.0%) |
| 25 to 29 Years | 0 (0.0%) | 0 (0.0%) |
| 30 to 34 Years | 25 (100.0%) | 0 (0.0%) |
| 35 to 44 Years | 25 (80.6%) | 0 (0.0%) |
| 45 to 54 Years | 7 (100.0%) | 0 (0.0%) |
| 55 to 59 Years | 64 (82.1%) | 0 (0.0%) |
| 60 to 64 Years | 24 (35.8%) | 0 (0.0%) |
| 65 to 74 Years | 4 (6.5%) | 0 (0.0%) |
| 75 Years and over | 0 (0.0%) | 0 (0.0%) |
| Total | 170 (53.0%) | 0 (0.0%) |
Employment Status by Educational Attainment in Salem
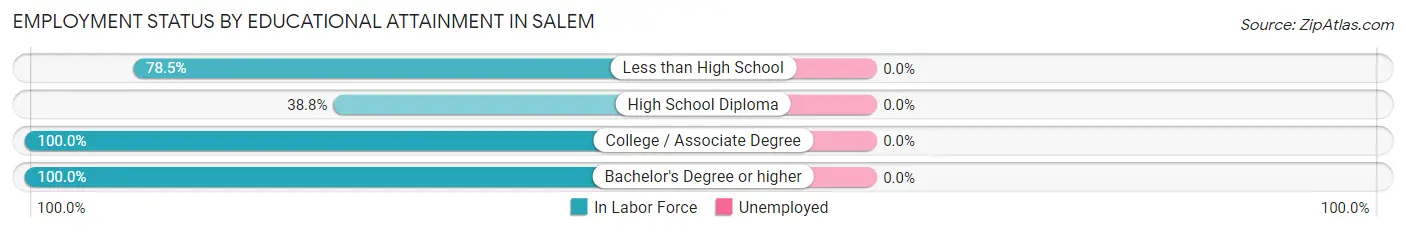
| Educational Attainment | In Labor Force | Unemployed |
| Less than High School | 51 (78.5%) | 0 (0.0%) |
| High School Diploma | 31 (38.8%) | 0 (0.0%) |
| College / Associate Degree | 28 (100.0%) | 0 (0.0%) |
| Bachelor's Degree or higher | 35 (100.0%) | 0 (0.0%) |
| Total | 145 (69.7%) | 0 (0.0%) |
Employment Occupations by Sex in Salem
Management, Business, Science and Arts Occupations
The most common Management, Business, Science and Arts occupations in Salem are Health Diagnosing & Treating (13 | 7.6%), Community & Social Service (7 | 4.1%), and Education Instruction & Library (7 | 4.1%).
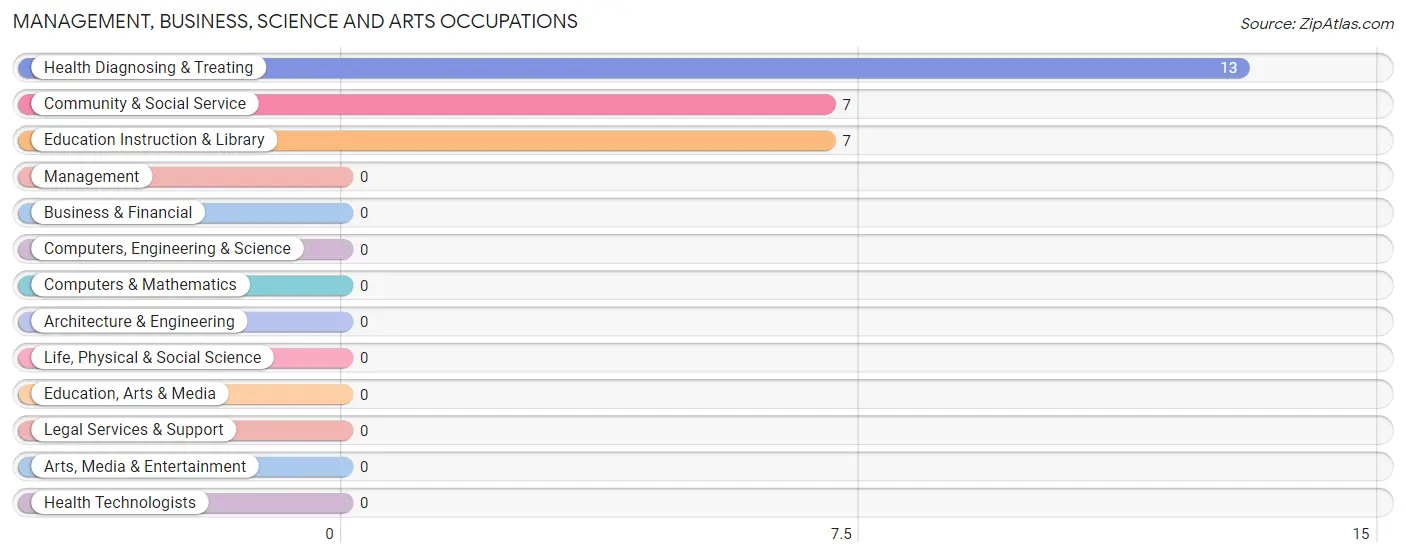
Management, Business, Science and Arts Occupations by Sex
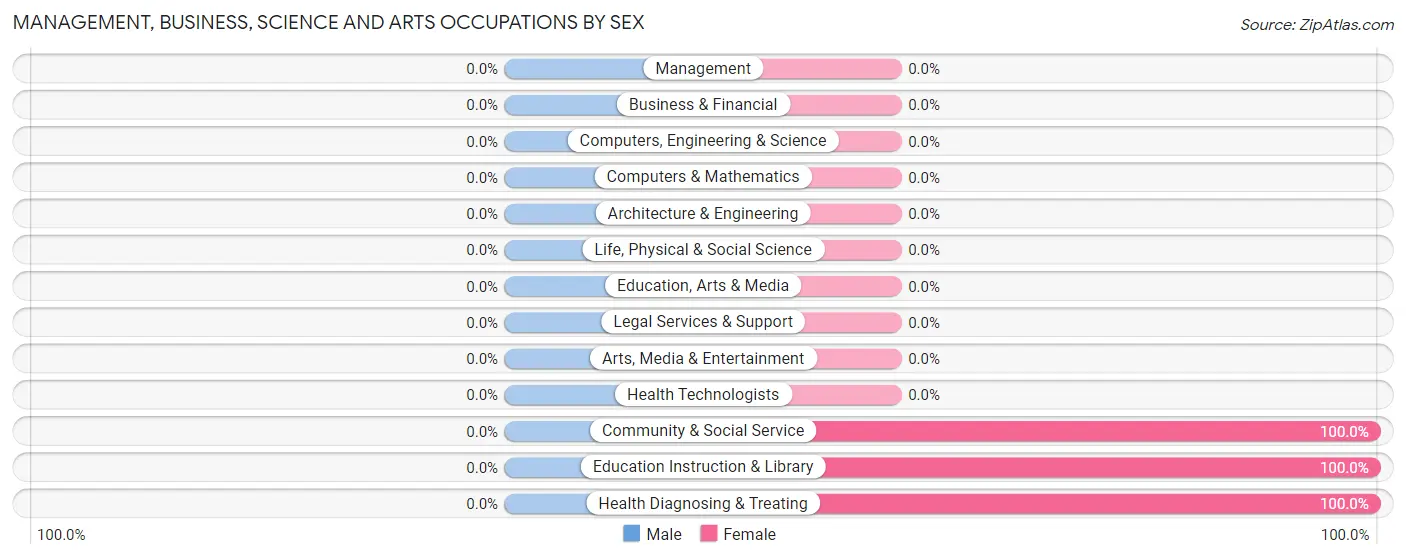
| Occupation | Male | Female |
| Management | 0 (0.0%) | 0 (0.0%) |
| Business & Financial | 0 (0.0%) | 0 (0.0%) |
| Computers, Engineering & Science | 0 (0.0%) | 0 (0.0%) |
| Computers & Mathematics | 0 (0.0%) | 0 (0.0%) |
| Architecture & Engineering | 0 (0.0%) | 0 (0.0%) |
| Life, Physical & Social Science | 0 (0.0%) | 0 (0.0%) |
| Community & Social Service | 0 (0.0%) | 7 (100.0%) |
| Education, Arts & Media | 0 (0.0%) | 0 (0.0%) |
| Legal Services & Support | 0 (0.0%) | 0 (0.0%) |
| Education Instruction & Library | 0 (0.0%) | 7 (100.0%) |
| Arts, Media & Entertainment | 0 (0.0%) | 0 (0.0%) |
| Health Diagnosing & Treating | 0 (0.0%) | 13 (100.0%) |
| Health Technologists | 0 (0.0%) | 0 (0.0%) |
| Total (Category) | 0 (0.0%) | 20 (100.0%) |
| Total (Overall) | 66 (38.8%) | 104 (61.2%) |
Services Occupations
The most common Services occupations in Salem are Personal Care & Service (15 | 8.8%), and Cleaning & Maintenance (11 | 6.5%).
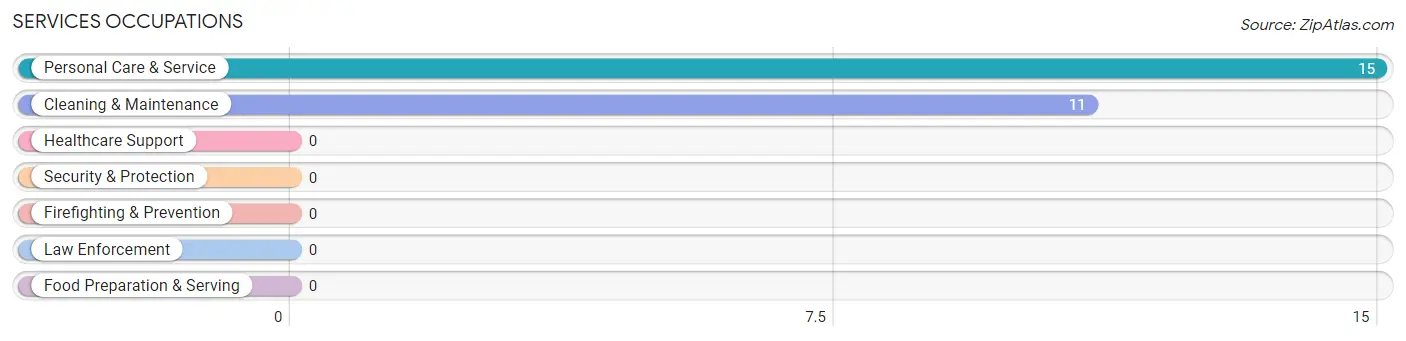
Services Occupations by Sex
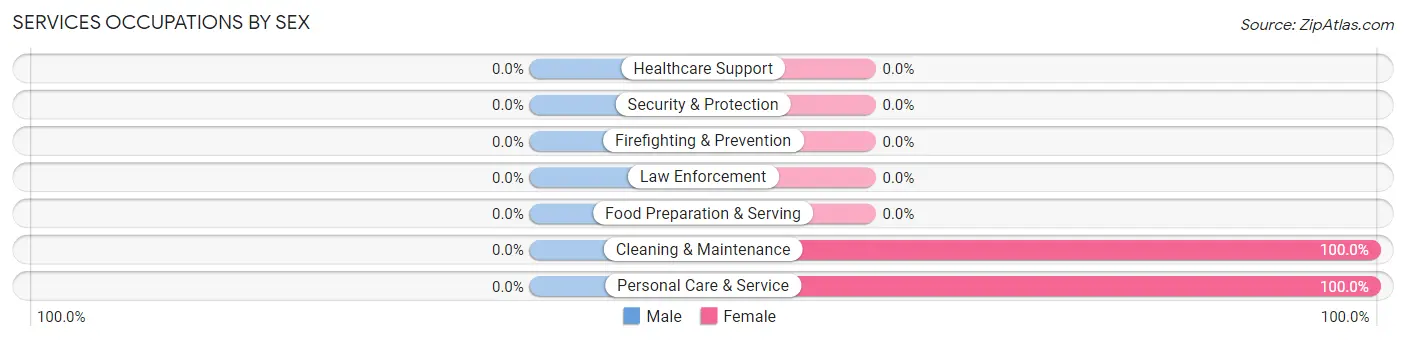
| Occupation | Male | Female |
| Healthcare Support | 0 (0.0%) | 0 (0.0%) |
| Security & Protection | 0 (0.0%) | 0 (0.0%) |
| Firefighting & Prevention | 0 (0.0%) | 0 (0.0%) |
| Law Enforcement | 0 (0.0%) | 0 (0.0%) |
| Food Preparation & Serving | 0 (0.0%) | 0 (0.0%) |
| Cleaning & Maintenance | 0 (0.0%) | 11 (100.0%) |
| Personal Care & Service | 0 (0.0%) | 15 (100.0%) |
| Total (Category) | 0 (0.0%) | 26 (100.0%) |
| Total (Overall) | 66 (38.8%) | 104 (61.2%) |
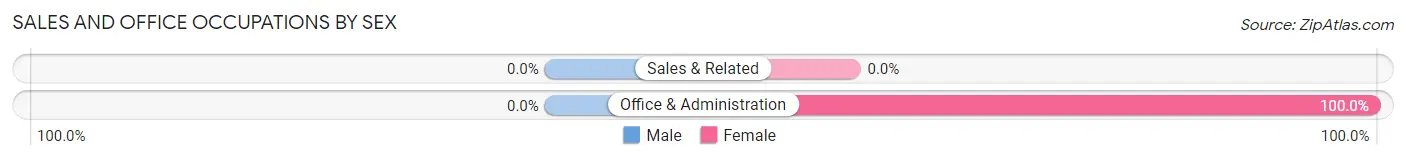
Sales and Office Occupations
The most common Sales and Office occupations in Salem are , and Office & Administration (49 | 28.8%).
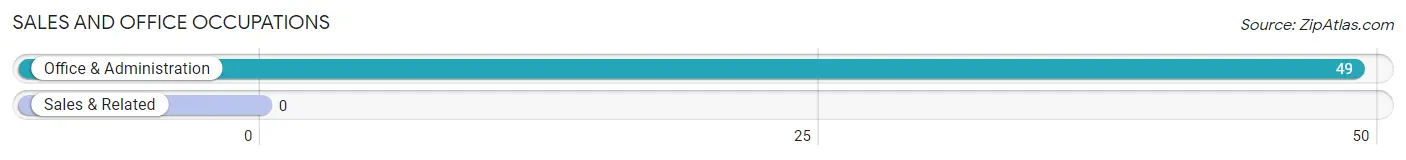
Sales and Office Occupations by Sex
| Occupation | Male | Female |
| Sales & Related | 0 (0.0%) | 0 (0.0%) |
| Office & Administration | 0 (0.0%) | 49 (100.0%) |
| Total (Category) | 0 (0.0%) | 49 (100.0%) |
| Total (Overall) | 66 (38.8%) | 104 (61.2%) |
Natural Resources, Construction and Maintenance Occupations
The most common Natural Resources, Construction and Maintenance occupations in Salem are , and Installation, Maintenance & Repair (53 | 31.2%).
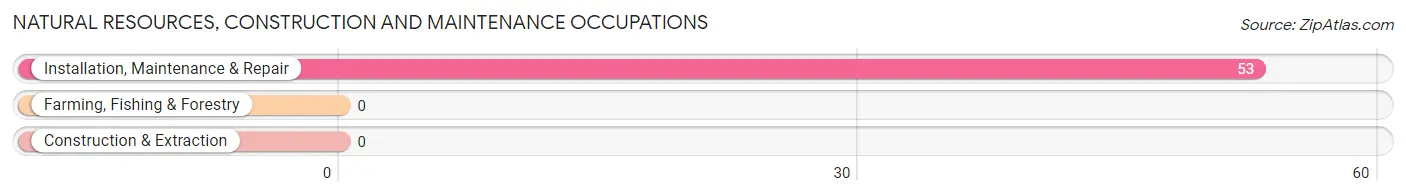
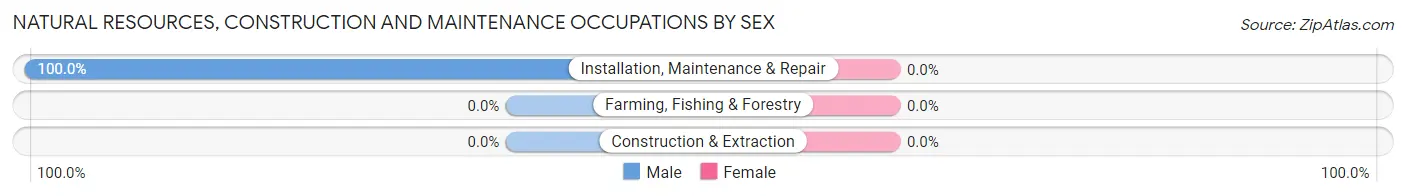
Natural Resources, Construction and Maintenance Occupations by Sex
| Occupation | Male | Female |
| Farming, Fishing & Forestry | 0 (0.0%) | 0 (0.0%) |
| Construction & Extraction | 0 (0.0%) | 0 (0.0%) |
| Installation, Maintenance & Repair | 53 (100.0%) | 0 (0.0%) |
| Total (Category) | 53 (100.0%) | 0 (0.0%) |
| Total (Overall) | 66 (38.8%) | 104 (61.2%) |
Production, Transportation and Moving Occupations
The most common Production, Transportation and Moving occupations in Salem are , and Production (22 | 12.9%).
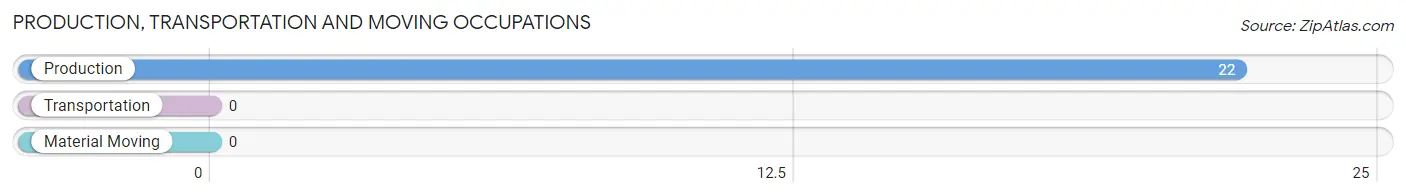
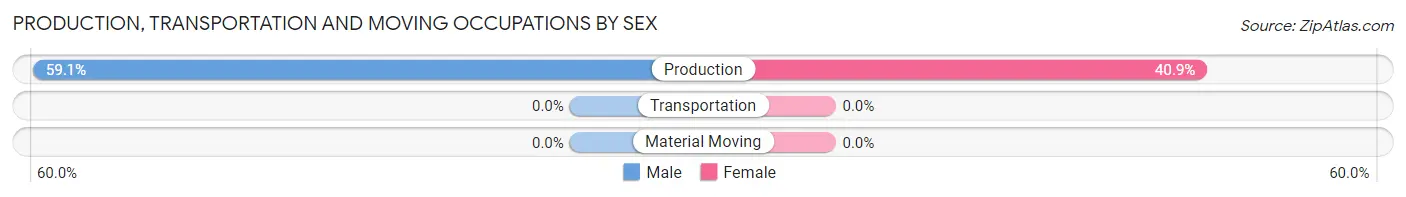
Production, Transportation and Moving Occupations by Sex
| Occupation | Male | Female |
| Production | 13 (59.1%) | 9 (40.9%) |
| Transportation | 0 (0.0%) | 0 (0.0%) |
| Material Moving | 0 (0.0%) | 0 (0.0%) |
| Total (Category) | 13 (59.1%) | 9 (40.9%) |
| Total (Overall) | 66 (38.8%) | 104 (61.2%) |
Employment Industries by Sex in Salem
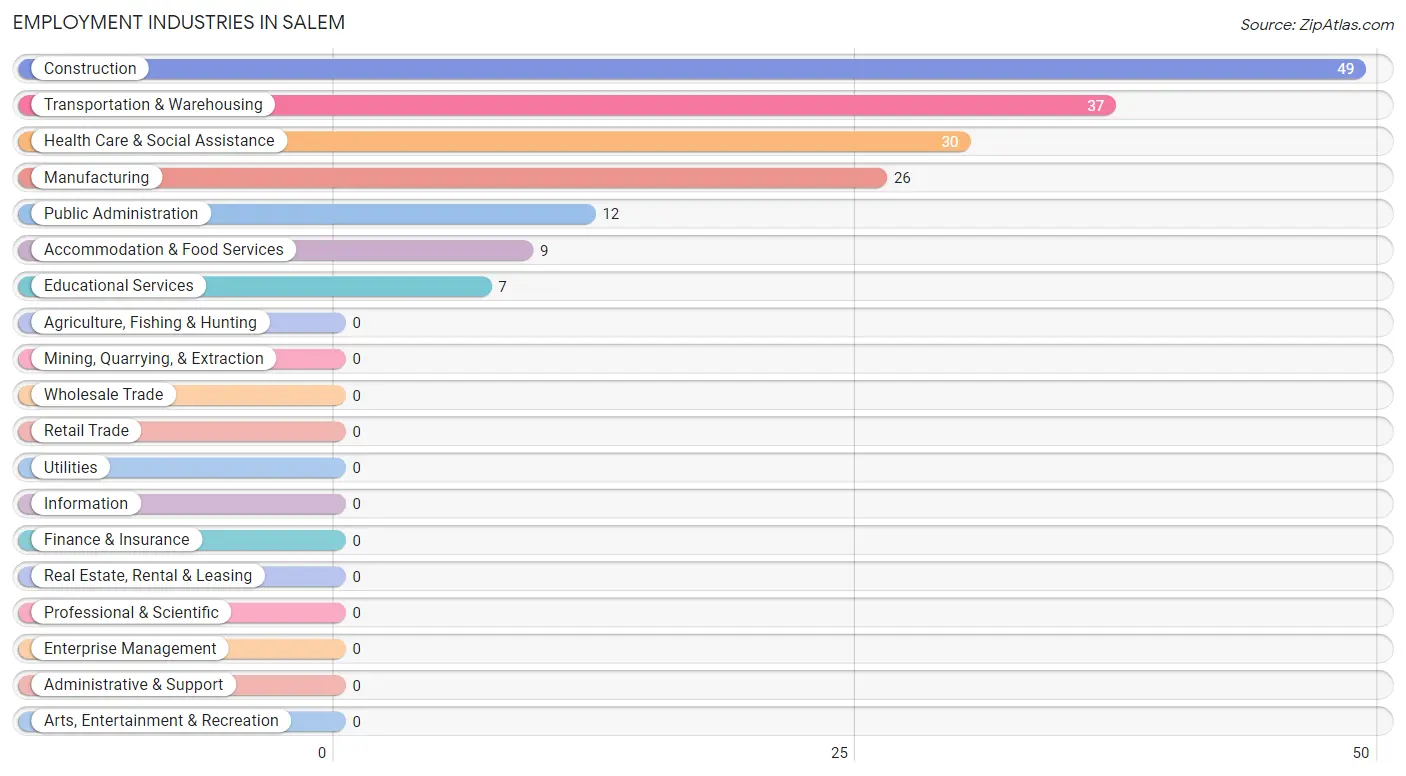
Employment Industries in Salem
The major employment industries in Salem include Construction (49 | 28.8%), Transportation & Warehousing (37 | 21.8%), Health Care & Social Assistance (30 | 17.6%), Manufacturing (26 | 15.3%), and Public Administration (12 | 7.1%).
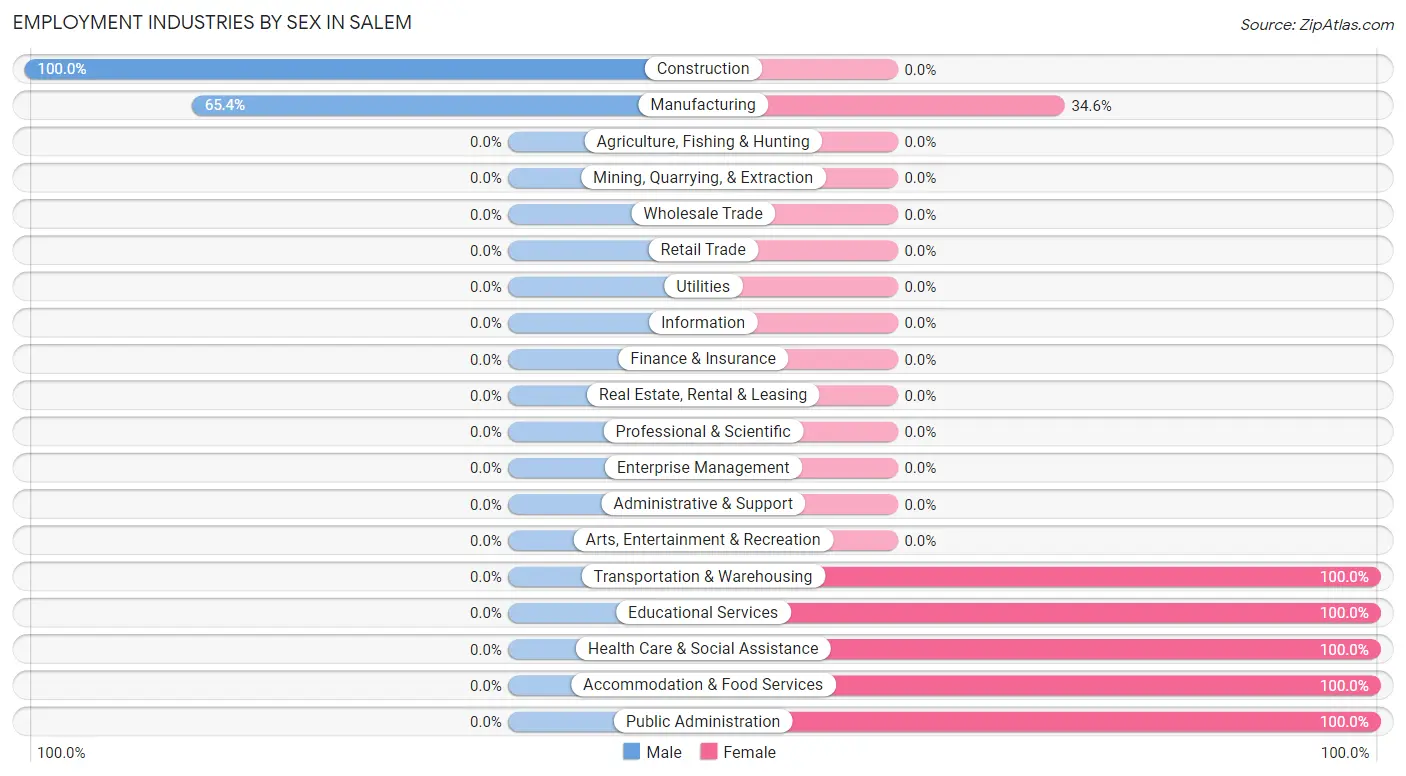
Employment Industries by Sex in Salem
The Salem industries that see more men than women are Construction (100.0%), and Manufacturing (65.4%), whereas the industries that tend to have a higher number of women are Transportation & Warehousing (100.0%), Educational Services (100.0%), and Health Care & Social Assistance (100.0%).
| Industry | Male | Female |
| Agriculture, Fishing & Hunting | 0 (0.0%) | 0 (0.0%) |
| Mining, Quarrying, & Extraction | 0 (0.0%) | 0 (0.0%) |
| Construction | 49 (100.0%) | 0 (0.0%) |
| Manufacturing | 17 (65.4%) | 9 (34.6%) |
| Wholesale Trade | 0 (0.0%) | 0 (0.0%) |
| Retail Trade | 0 (0.0%) | 0 (0.0%) |
| Transportation & Warehousing | 0 (0.0%) | 37 (100.0%) |
| Utilities | 0 (0.0%) | 0 (0.0%) |
| Information | 0 (0.0%) | 0 (0.0%) |
| Finance & Insurance | 0 (0.0%) | 0 (0.0%) |
| Real Estate, Rental & Leasing | 0 (0.0%) | 0 (0.0%) |
| Professional & Scientific | 0 (0.0%) | 0 (0.0%) |
| Enterprise Management | 0 (0.0%) | 0 (0.0%) |
| Administrative & Support | 0 (0.0%) | 0 (0.0%) |
| Educational Services | 0 (0.0%) | 7 (100.0%) |
| Health Care & Social Assistance | 0 (0.0%) | 30 (100.0%) |
| Arts, Entertainment & Recreation | 0 (0.0%) | 0 (0.0%) |
| Accommodation & Food Services | 0 (0.0%) | 9 (100.0%) |
| Public Administration | 0 (0.0%) | 12 (100.0%) |
| Total | 66 (38.8%) | 104 (61.2%) |
Education in Salem
School Enrollment in Salem
The most common levels of schooling among the 71 students in Salem are college / undergraduate (33 | 46.5%), nursery / preschool (17 | 23.9%), and middle school (17 | 23.9%).
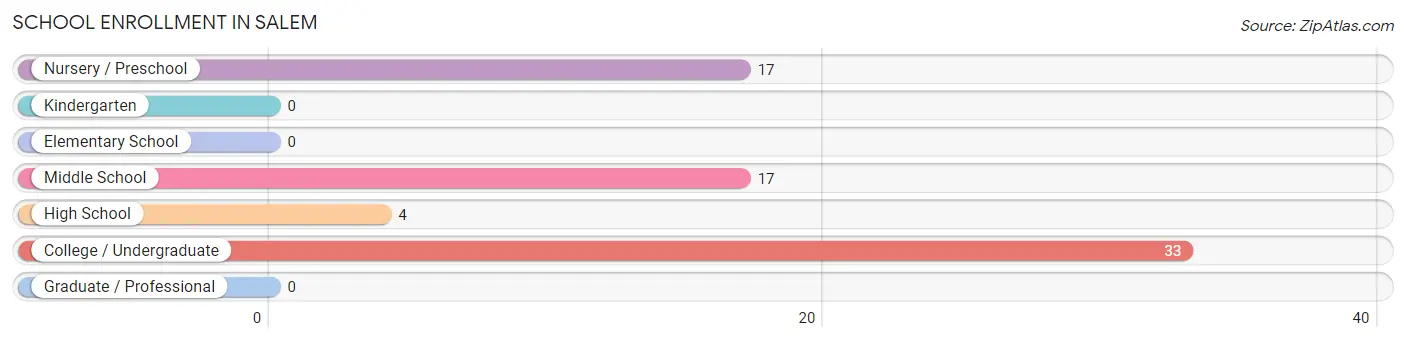
| School Level | # Students | % Students |
| Nursery / Preschool | 17 | 23.9% |
| Kindergarten | 0 | 0.0% |
| Elementary School | 0 | 0.0% |
| Middle School | 17 | 23.9% |
| High School | 4 | 5.6% |
| College / Undergraduate | 33 | 46.5% |
| Graduate / Professional | 0 | 0.0% |
| Total | 71 | 100.0% |
School Enrollment by Age by Funding Source in Salem
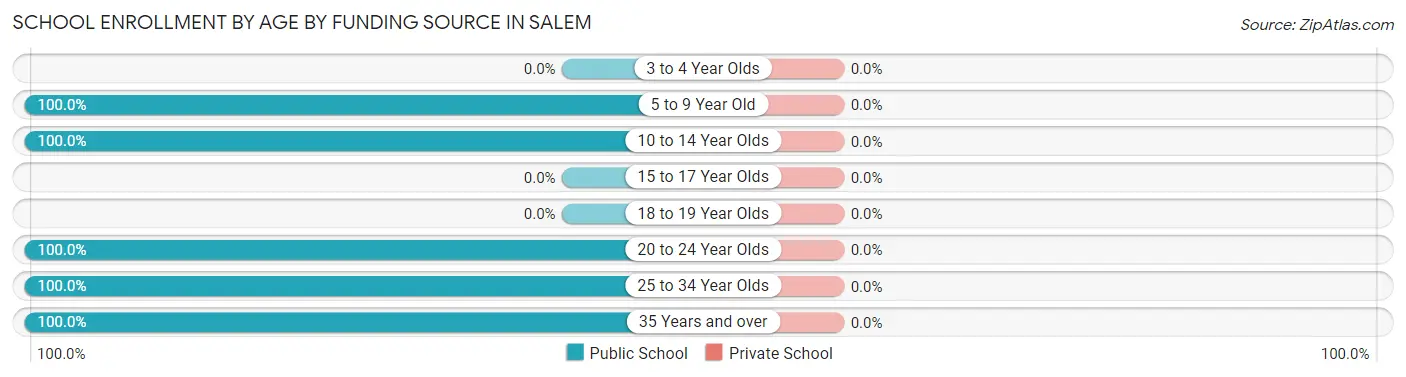
| Age Bracket | Public School | Private School |
| 3 to 4 Year Olds | 0 (0.0%) | 0 (0.0%) |
| 5 to 9 Year Old | 17 (100.0%) | 0 (0.0%) |
| 10 to 14 Year Olds | 17 (100.0%) | 0 (0.0%) |
| 15 to 17 Year Olds | 0 (0.0%) | 0 (0.0%) |
| 18 to 19 Year Olds | 0 (0.0%) | 0 (0.0%) |
| 20 to 24 Year Olds | 21 (100.0%) | 0 (0.0%) |
| 25 to 34 Year Olds | 12 (100.0%) | 0 (0.0%) |
| 35 Years and over | 4 (100.0%) | 0 (0.0%) |
| Total | 71 (100.0%) | 0 (0.0%) |
Educational Attainment by Field of Study in Salem
Education (18 | 51.4%), psychology (13 | 37.1%), and bio, nature & agricultural (4 | 11.4%) are the most common fields of study among 35 individuals in Salem who have obtained a bachelor's degree or higher.
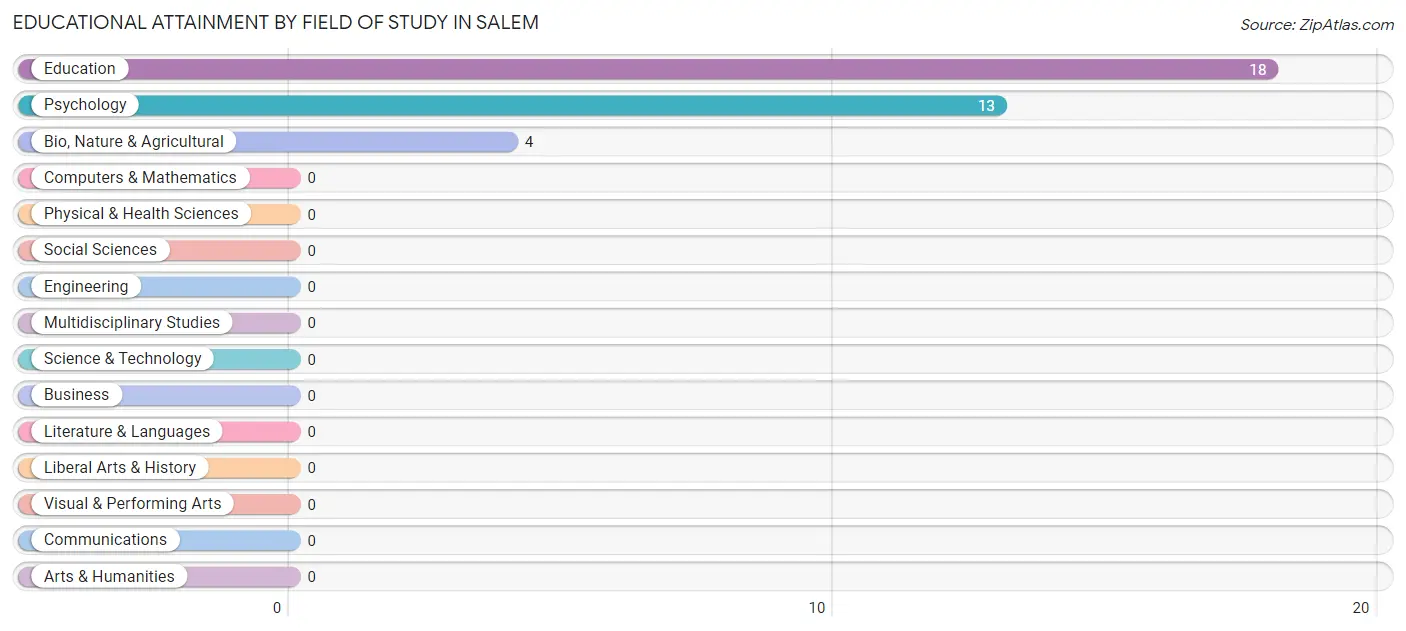
| Field of Study | # Graduates | % Graduates |
| Computers & Mathematics | 0 | 0.0% |
| Bio, Nature & Agricultural | 4 | 11.4% |
| Physical & Health Sciences | 0 | 0.0% |
| Psychology | 13 | 37.1% |
| Social Sciences | 0 | 0.0% |
| Engineering | 0 | 0.0% |
| Multidisciplinary Studies | 0 | 0.0% |
| Science & Technology | 0 | 0.0% |
| Business | 0 | 0.0% |
| Education | 18 | 51.4% |
| Literature & Languages | 0 | 0.0% |
| Liberal Arts & History | 0 | 0.0% |
| Visual & Performing Arts | 0 | 0.0% |
| Communications | 0 | 0.0% |
| Arts & Humanities | 0 | 0.0% |
| Total | 35 | 100.0% |
Transportation & Commute in Salem
Vehicle Availability by Sex in Salem
The most prevalent vehicle ownership categories in Salem are males with 1 vehicle (49, accounting for 74.2%) and females with 1 vehicle (36, making up 53.8%).
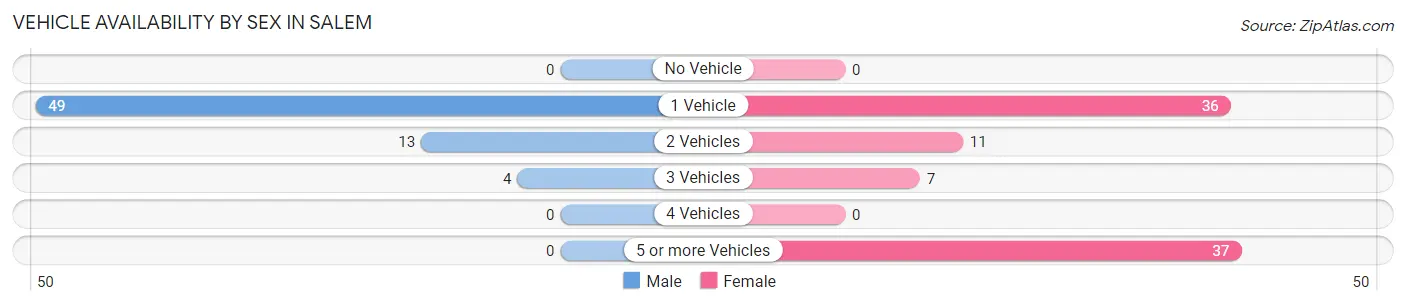
| Vehicles Available | Male | Female |
| No Vehicle | 0 (0.0%) | 0 (0.0%) |
| 1 Vehicle | 49 (74.2%) | 36 (39.6%) |
| 2 Vehicles | 13 (19.7%) | 11 (12.1%) |
| 3 Vehicles | 4 (6.1%) | 7 (7.7%) |
| 4 Vehicles | 0 (0.0%) | 0 (0.0%) |
| 5 or more Vehicles | 0 (0.0%) | 37 (40.7%) |
| Total | 66 (100.0%) | 91 (100.0%) |
Commute Time in Salem
The most frequently occuring commute durations in Salem are 5 to 9 minutes (49 commuters, 31.2%), 30 to 34 minutes (34 commuters, 21.7%), and 40 to 44 minutes (27 commuters, 17.2%).
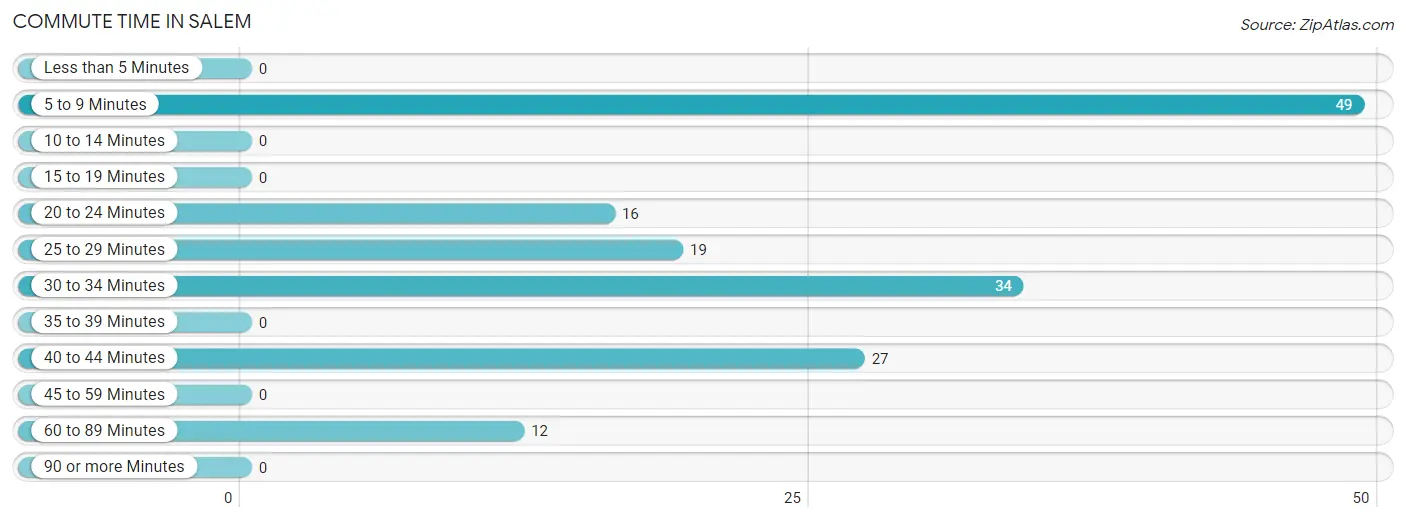
| Commute Time | # Commuters | % Commuters |
| Less than 5 Minutes | 0 | 0.0% |
| 5 to 9 Minutes | 49 | 31.2% |
| 10 to 14 Minutes | 0 | 0.0% |
| 15 to 19 Minutes | 0 | 0.0% |
| 20 to 24 Minutes | 16 | 10.2% |
| 25 to 29 Minutes | 19 | 12.1% |
| 30 to 34 Minutes | 34 | 21.7% |
| 35 to 39 Minutes | 0 | 0.0% |
| 40 to 44 Minutes | 27 | 17.2% |
| 45 to 59 Minutes | 0 | 0.0% |
| 60 to 89 Minutes | 12 | 7.6% |
| 90 or more Minutes | 0 | 0.0% |
Commute Time by Sex in Salem
The most common commute times in Salem are 5 to 9 minutes (49 commuters, 74.2%) for males and 40 to 44 minutes (27 commuters, 29.7%) for females.
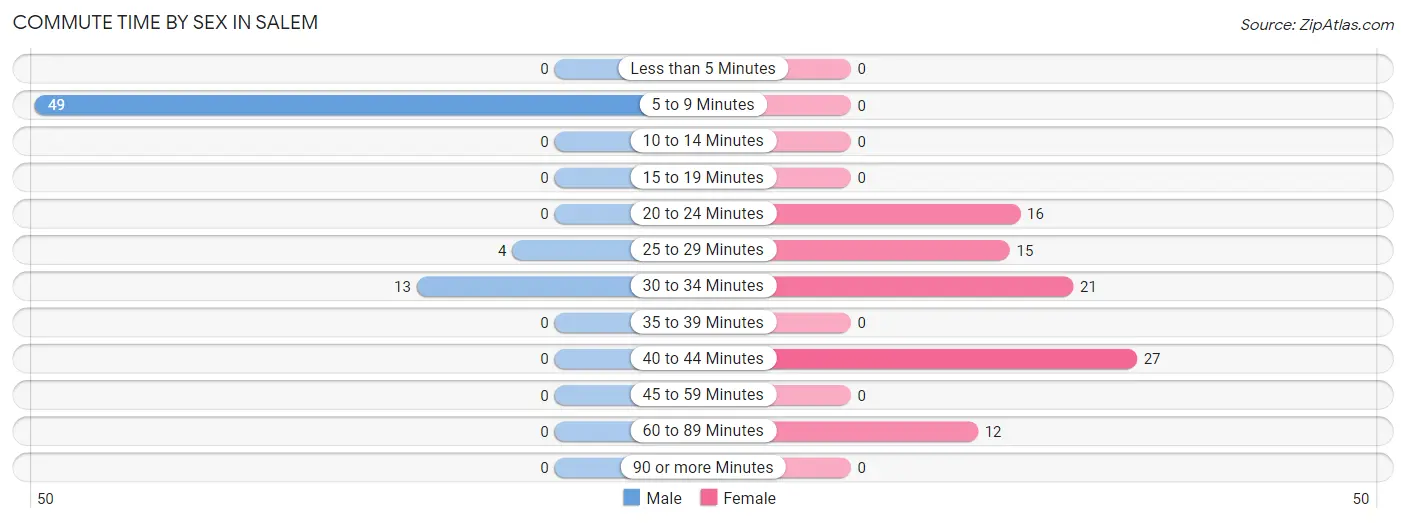
| Commute Time | Male | Female |
| Less than 5 Minutes | 0 (0.0%) | 0 (0.0%) |
| 5 to 9 Minutes | 49 (74.2%) | 0 (0.0%) |
| 10 to 14 Minutes | 0 (0.0%) | 0 (0.0%) |
| 15 to 19 Minutes | 0 (0.0%) | 0 (0.0%) |
| 20 to 24 Minutes | 0 (0.0%) | 16 (17.6%) |
| 25 to 29 Minutes | 4 (6.1%) | 15 (16.5%) |
| 30 to 34 Minutes | 13 (19.7%) | 21 (23.1%) |
| 35 to 39 Minutes | 0 (0.0%) | 0 (0.0%) |
| 40 to 44 Minutes | 0 (0.0%) | 27 (29.7%) |
| 45 to 59 Minutes | 0 (0.0%) | 0 (0.0%) |
| 60 to 89 Minutes | 0 (0.0%) | 12 (13.2%) |
| 90 or more Minutes | 0 (0.0%) | 0 (0.0%) |
Time of Departure to Work by Sex in Salem
The most frequent times of departure to work in Salem are 12:00 AM to 4:59 AM (49, 74.2%) for males and 12:00 AM to 4:59 AM (25, 27.5%) for females.
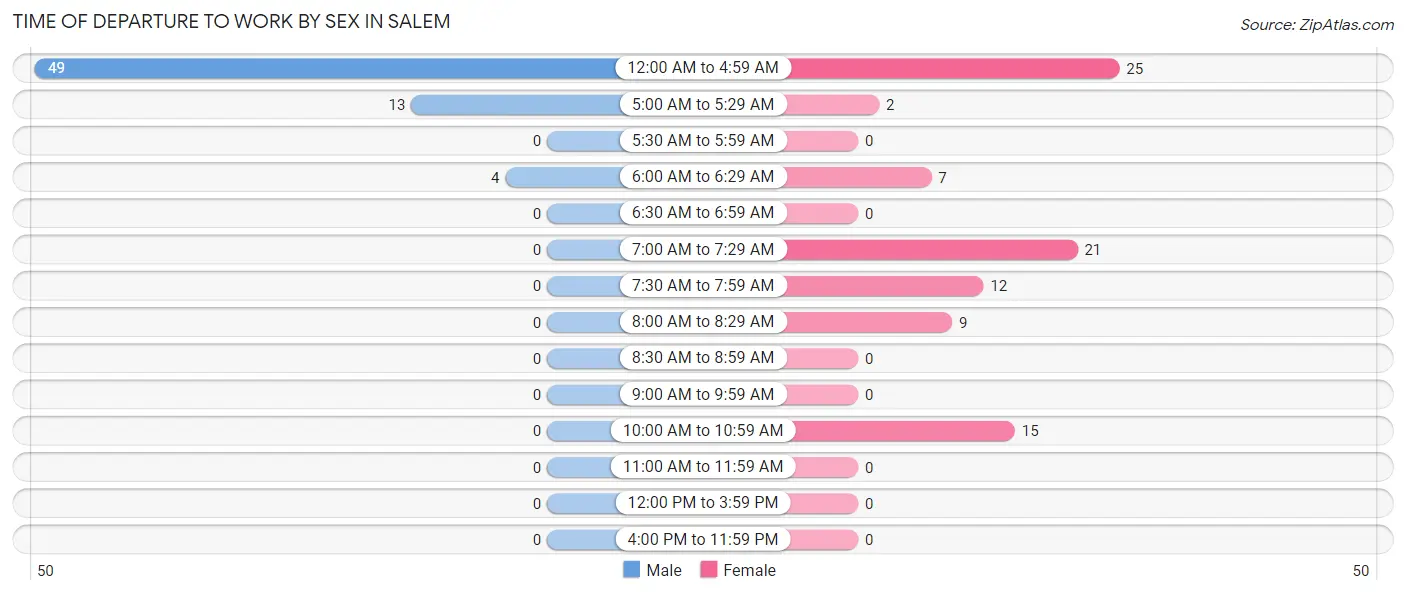
| Time of Departure | Male | Female |
| 12:00 AM to 4:59 AM | 49 (74.2%) | 25 (27.5%) |
| 5:00 AM to 5:29 AM | 13 (19.7%) | 2 (2.2%) |
| 5:30 AM to 5:59 AM | 0 (0.0%) | 0 (0.0%) |
| 6:00 AM to 6:29 AM | 4 (6.1%) | 7 (7.7%) |
| 6:30 AM to 6:59 AM | 0 (0.0%) | 0 (0.0%) |
| 7:00 AM to 7:29 AM | 0 (0.0%) | 21 (23.1%) |
| 7:30 AM to 7:59 AM | 0 (0.0%) | 12 (13.2%) |
| 8:00 AM to 8:29 AM | 0 (0.0%) | 9 (9.9%) |
| 8:30 AM to 8:59 AM | 0 (0.0%) | 0 (0.0%) |
| 9:00 AM to 9:59 AM | 0 (0.0%) | 0 (0.0%) |
| 10:00 AM to 10:59 AM | 0 (0.0%) | 15 (16.5%) |
| 11:00 AM to 11:59 AM | 0 (0.0%) | 0 (0.0%) |
| 12:00 PM to 3:59 PM | 0 (0.0%) | 0 (0.0%) |
| 4:00 PM to 11:59 PM | 0 (0.0%) | 0 (0.0%) |
| Total | 66 (100.0%) | 91 (100.0%) |
Housing Occupancy in Salem
Occupancy by Ownership in Salem
Of the total 176 dwellings in Salem, owner-occupied units account for 119 (67.6%), while renter-occupied units make up 57 (32.4%).
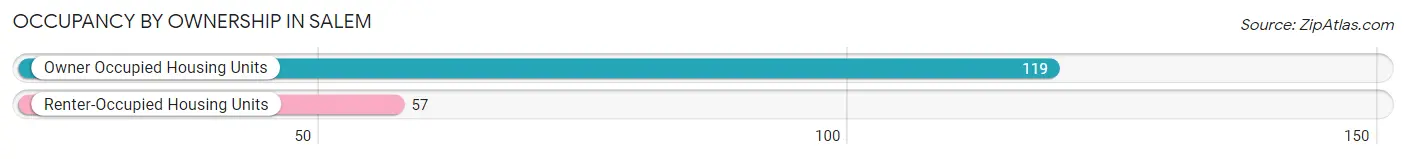
| Occupancy | # Housing Units | % Housing Units |
| Owner Occupied Housing Units | 119 | 67.6% |
| Renter-Occupied Housing Units | 57 | 32.4% |
| Total Occupied Housing Units | 176 | 100.0% |
Occupancy by Household Size in Salem
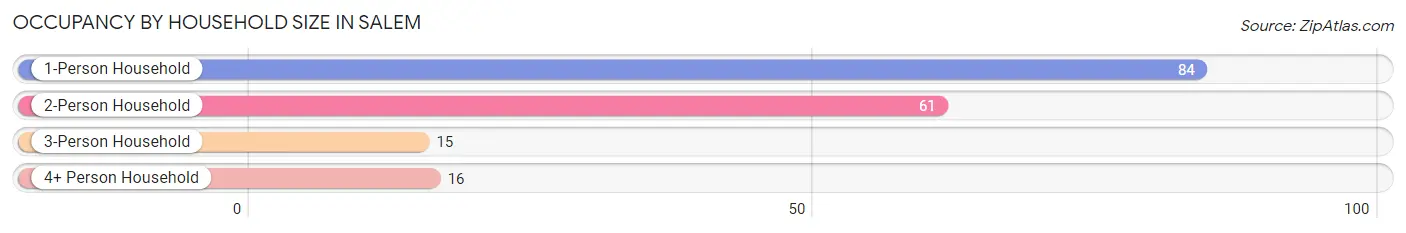
| Household Size | # Housing Units | % Housing Units |
| 1-Person Household | 84 | 47.7% |
| 2-Person Household | 61 | 34.7% |
| 3-Person Household | 15 | 8.5% |
| 4+ Person Household | 16 | 9.1% |
| Total Housing Units | 176 | 100.0% |
Occupancy by Ownership by Household Size in Salem
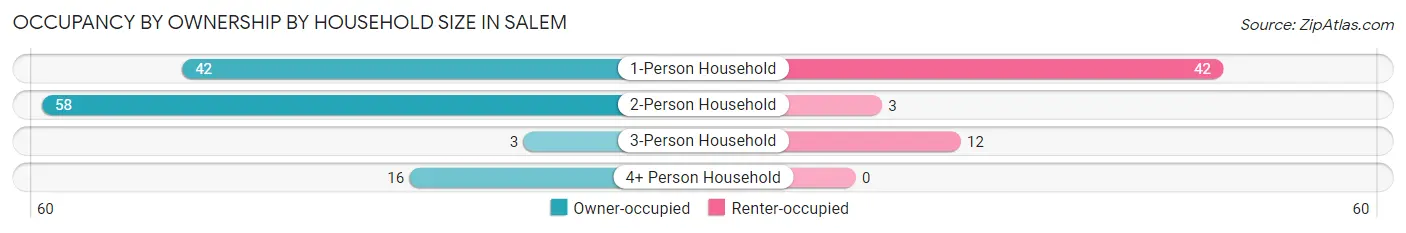
| Household Size | Owner-occupied | Renter-occupied |
| 1-Person Household | 42 (50.0%) | 42 (50.0%) |
| 2-Person Household | 58 (95.1%) | 3 (4.9%) |
| 3-Person Household | 3 (20.0%) | 12 (80.0%) |
| 4+ Person Household | 16 (100.0%) | 0 (0.0%) |
| Total Housing Units | 119 (67.6%) | 57 (32.4%) |
Occupancy by Educational Attainment in Salem
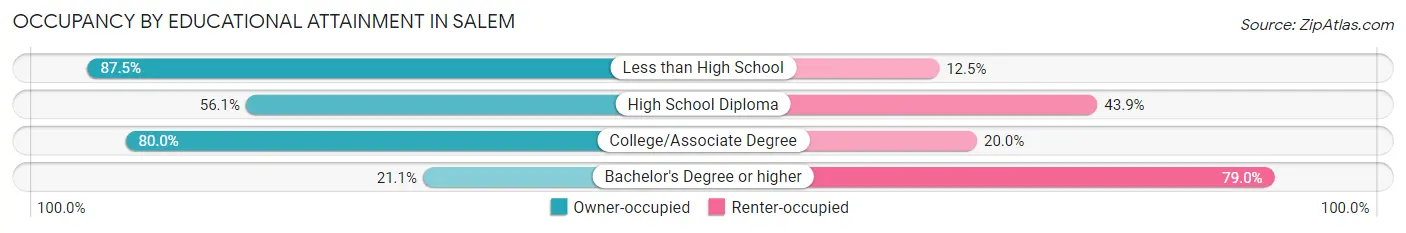
| Household Size | Owner-occupied | Renter-occupied |
| Less than High School | 35 (87.5%) | 5 (12.5%) |
| High School Diploma | 32 (56.1%) | 25 (43.9%) |
| College/Associate Degree | 48 (80.0%) | 12 (20.0%) |
| Bachelor's Degree or higher | 4 (21.0%) | 15 (78.9%) |
Occupancy by Age of Householder in Salem
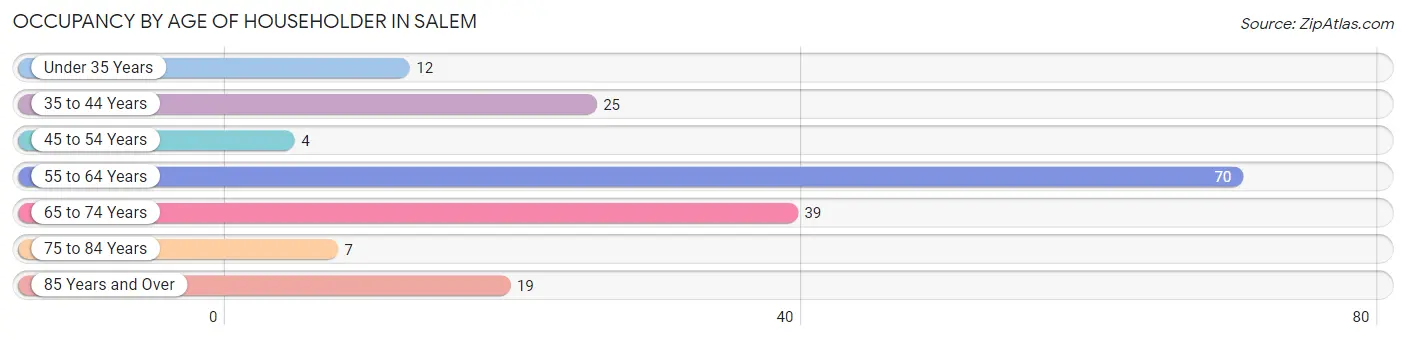
| Age Bracket | # Households | % Households |
| Under 35 Years | 12 | 6.8% |
| 35 to 44 Years | 25 | 14.2% |
| 45 to 54 Years | 4 | 2.3% |
| 55 to 64 Years | 70 | 39.8% |
| 65 to 74 Years | 39 | 22.2% |
| 75 to 84 Years | 7 | 4.0% |
| 85 Years and Over | 19 | 10.8% |
| Total | 176 | 100.0% |
Housing Finances in Salem
Median Income by Occupancy in Salem
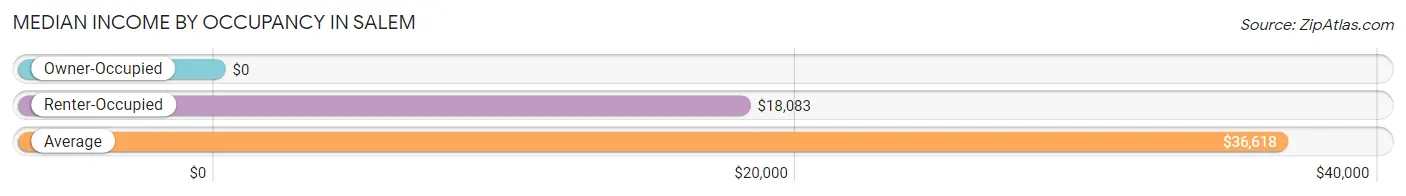
| Occupancy Type | # Households | Median Income |
| Owner-Occupied | 119 (67.6%) | $0 |
| Renter-Occupied | 57 (32.4%) | $18,083 |
| Average | 176 (100.0%) | $36,618 |
Occupancy by Householder Income Bracket in Salem
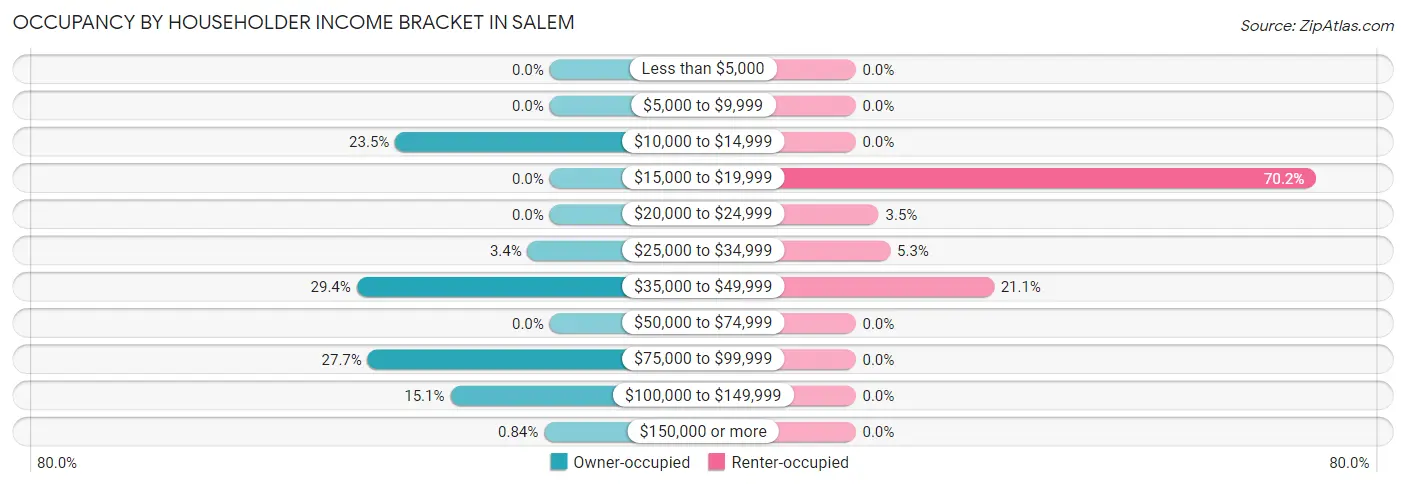
| Income Bracket | Owner-occupied | Renter-occupied |
| Less than $5,000 | 0 (0.0%) | 0 (0.0%) |
| $5,000 to $9,999 | 0 (0.0%) | 0 (0.0%) |
| $10,000 to $14,999 | 28 (23.5%) | 0 (0.0%) |
| $15,000 to $19,999 | 0 (0.0%) | 40 (70.2%) |
| $20,000 to $24,999 | 0 (0.0%) | 2 (3.5%) |
| $25,000 to $34,999 | 4 (3.4%) | 3 (5.3%) |
| $35,000 to $49,999 | 35 (29.4%) | 12 (21.0%) |
| $50,000 to $74,999 | 0 (0.0%) | 0 (0.0%) |
| $75,000 to $99,999 | 33 (27.7%) | 0 (0.0%) |
| $100,000 to $149,999 | 18 (15.1%) | 0 (0.0%) |
| $150,000 or more | 1 (0.8%) | 0 (0.0%) |
| Total | 119 (100.0%) | 57 (100.0%) |
Monthly Housing Cost Tiers in Salem
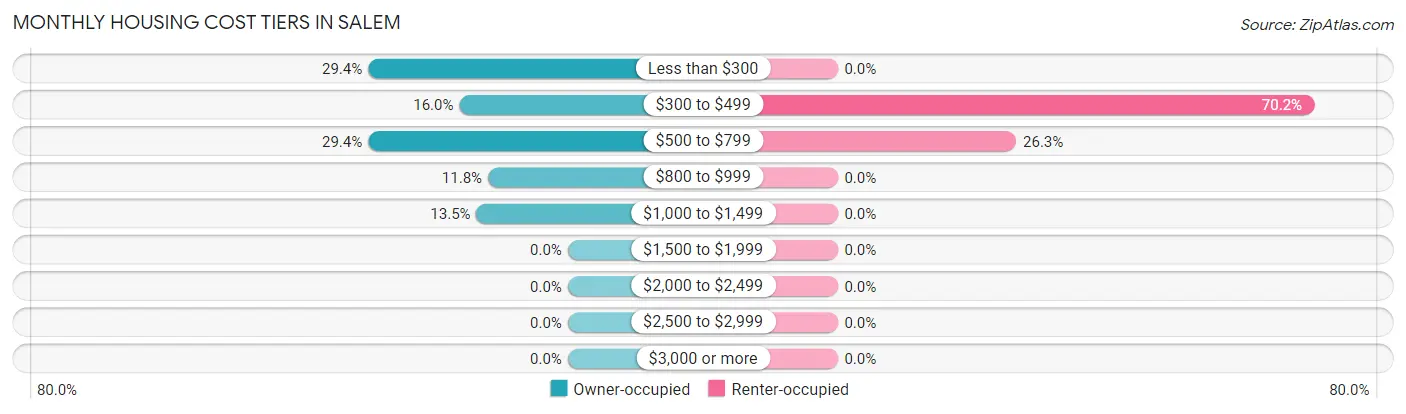
| Monthly Cost | Owner-occupied | Renter-occupied |
| Less than $300 | 35 (29.4%) | 0 (0.0%) |
| $300 to $499 | 19 (16.0%) | 40 (70.2%) |
| $500 to $799 | 35 (29.4%) | 15 (26.3%) |
| $800 to $999 | 14 (11.8%) | 0 (0.0%) |
| $1,000 to $1,499 | 16 (13.5%) | 0 (0.0%) |
| $1,500 to $1,999 | 0 (0.0%) | 0 (0.0%) |
| $2,000 to $2,499 | 0 (0.0%) | 0 (0.0%) |
| $2,500 to $2,999 | 0 (0.0%) | 0 (0.0%) |
| $3,000 or more | 0 (0.0%) | 0 (0.0%) |
| Total | 119 (100.0%) | 57 (100.0%) |
Physical Housing Characteristics in Salem
Housing Structures in Salem
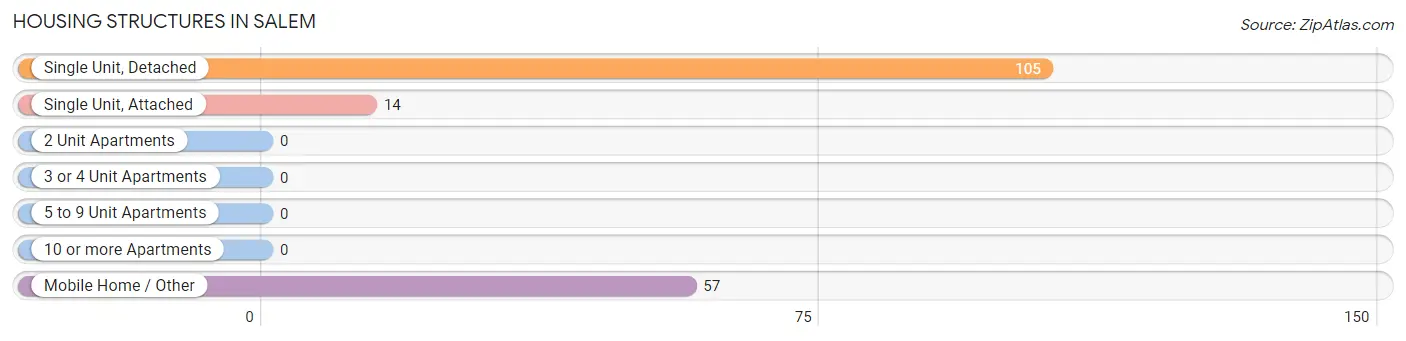
| Structure Type | # Housing Units | % Housing Units |
| Single Unit, Detached | 105 | 59.7% |
| Single Unit, Attached | 14 | 8.0% |
| 2 Unit Apartments | 0 | 0.0% |
| 3 or 4 Unit Apartments | 0 | 0.0% |
| 5 to 9 Unit Apartments | 0 | 0.0% |
| 10 or more Apartments | 0 | 0.0% |
| Mobile Home / Other | 57 | 32.4% |
| Total | 176 | 100.0% |
Housing Structures by Occupancy in Salem
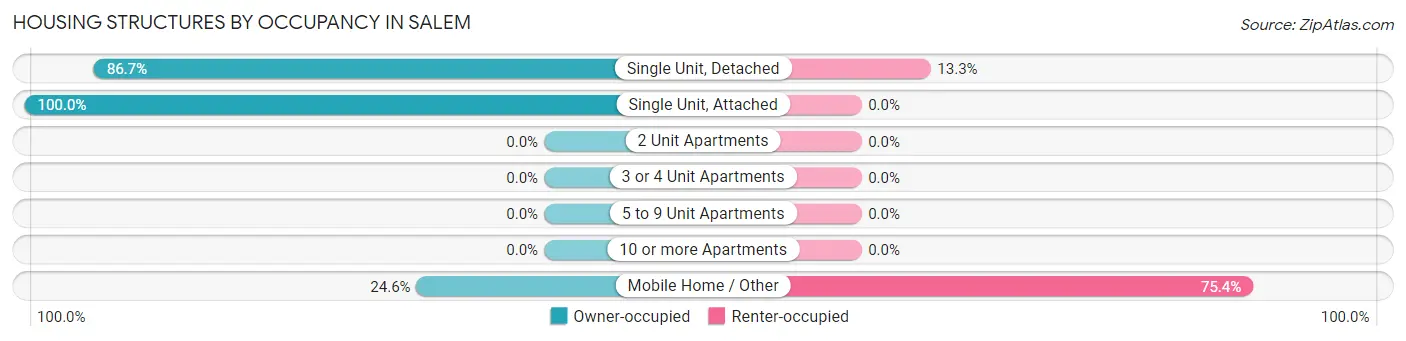
| Structure Type | Owner-occupied | Renter-occupied |
| Single Unit, Detached | 91 (86.7%) | 14 (13.3%) |
| Single Unit, Attached | 14 (100.0%) | 0 (0.0%) |
| 2 Unit Apartments | 0 (0.0%) | 0 (0.0%) |
| 3 or 4 Unit Apartments | 0 (0.0%) | 0 (0.0%) |
| 5 to 9 Unit Apartments | 0 (0.0%) | 0 (0.0%) |
| 10 or more Apartments | 0 (0.0%) | 0 (0.0%) |
| Mobile Home / Other | 14 (24.6%) | 43 (75.4%) |
| Total | 119 (67.6%) | 57 (32.4%) |
Housing Structures by Number of Rooms in Salem
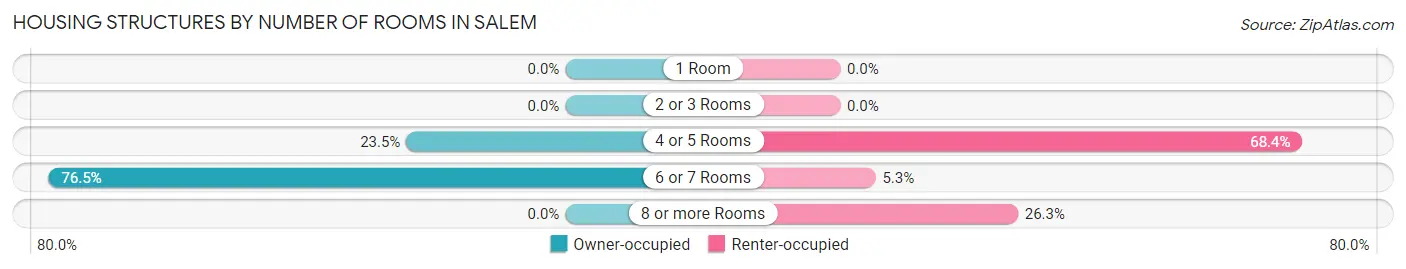
| Number of Rooms | Owner-occupied | Renter-occupied |
| 1 Room | 0 (0.0%) | 0 (0.0%) |
| 2 or 3 Rooms | 0 (0.0%) | 0 (0.0%) |
| 4 or 5 Rooms | 28 (23.5%) | 39 (68.4%) |
| 6 or 7 Rooms | 91 (76.5%) | 3 (5.3%) |
| 8 or more Rooms | 0 (0.0%) | 15 (26.3%) |
| Total | 119 (100.0%) | 57 (100.0%) |
Housing Structure by Heating Type in Salem
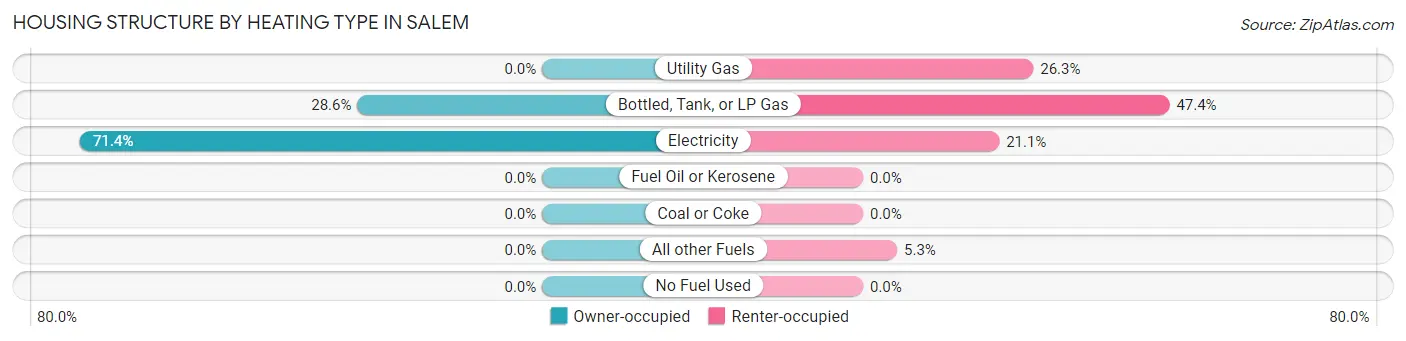
| Heating Type | Owner-occupied | Renter-occupied |
| Utility Gas | 0 (0.0%) | 15 (26.3%) |
| Bottled, Tank, or LP Gas | 34 (28.6%) | 27 (47.4%) |
| Electricity | 85 (71.4%) | 12 (21.0%) |
| Fuel Oil or Kerosene | 0 (0.0%) | 0 (0.0%) |
| Coal or Coke | 0 (0.0%) | 0 (0.0%) |
| All other Fuels | 0 (0.0%) | 3 (5.3%) |
| No Fuel Used | 0 (0.0%) | 0 (0.0%) |
| Total | 119 (100.0%) | 57 (100.0%) |
Household Vehicle Usage in Salem
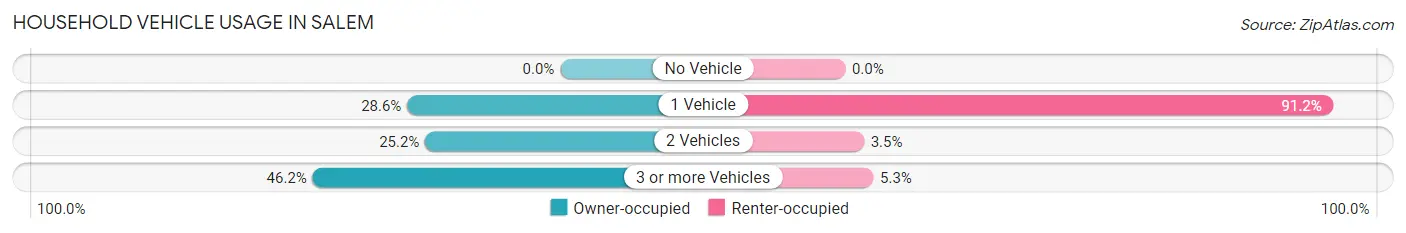
| Vehicles per Household | Owner-occupied | Renter-occupied |
| No Vehicle | 0 (0.0%) | 0 (0.0%) |
| 1 Vehicle | 34 (28.6%) | 52 (91.2%) |
| 2 Vehicles | 30 (25.2%) | 2 (3.5%) |
| 3 or more Vehicles | 55 (46.2%) | 3 (5.3%) |
| Total | 119 (100.0%) | 57 (100.0%) |
Real Estate & Mortgages in Salem
Real Estate and Mortgage Overview in Salem
| Characteristic | Without Mortgage | With Mortgage |
| Housing Units | 72 | 47 |
| Median Property Value | $69,200 | $98,700 |
| Median Household Income | $37,000 | $0 |
| Monthly Housing Costs | $305 | $0 |
| Real Estate Taxes | $613 | $0 |
Property Value by Mortgage Status in Salem
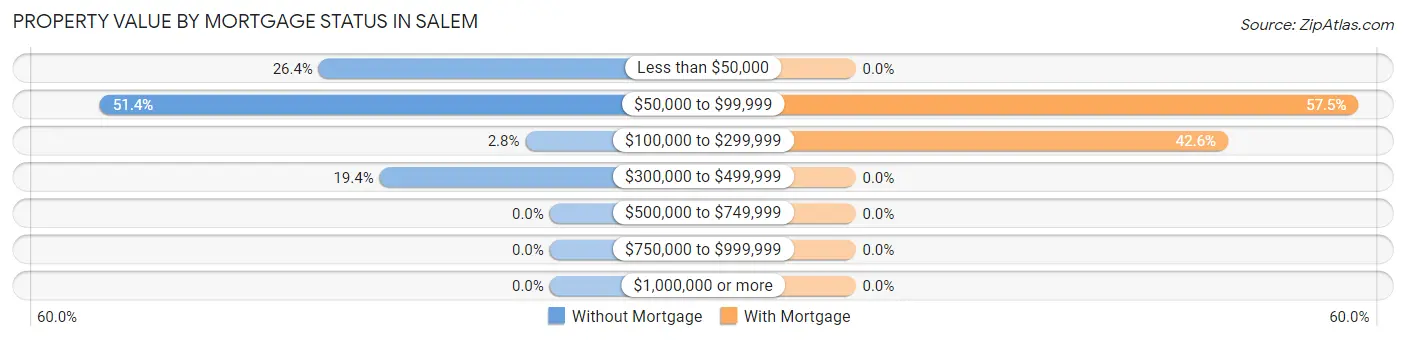
| Property Value | Without Mortgage | With Mortgage |
| Less than $50,000 | 19 (26.4%) | 0 (0.0%) |
| $50,000 to $99,999 | 37 (51.4%) | 27 (57.5%) |
| $100,000 to $299,999 | 2 (2.8%) | 20 (42.5%) |
| $300,000 to $499,999 | 14 (19.4%) | 0 (0.0%) |
| $500,000 to $749,999 | 0 (0.0%) | 0 (0.0%) |
| $750,000 to $999,999 | 0 (0.0%) | 0 (0.0%) |
| $1,000,000 or more | 0 (0.0%) | 0 (0.0%) |
| Total | 72 (100.0%) | 47 (100.0%) |
Household Income by Mortgage Status in Salem
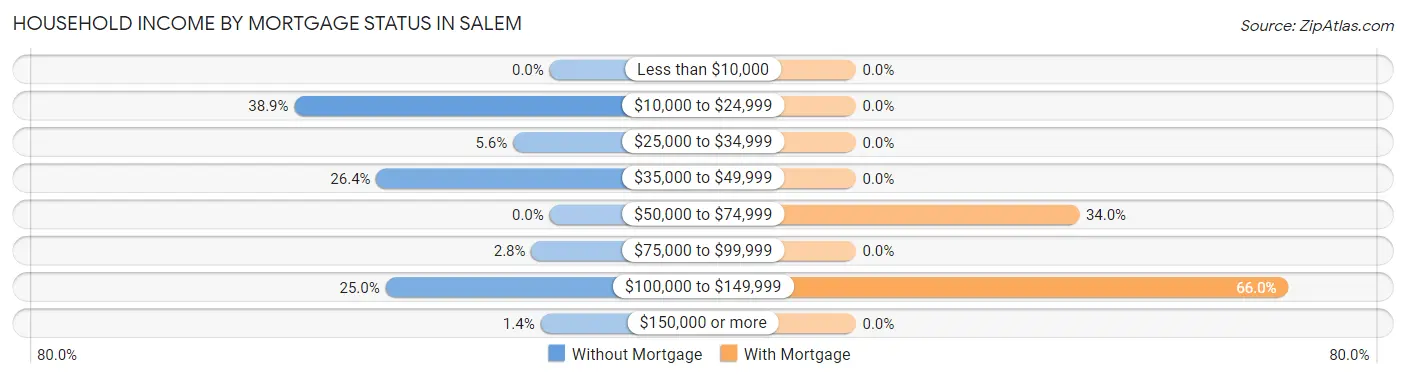
| Household Income | Without Mortgage | With Mortgage |
| Less than $10,000 | 0 (0.0%) | 0 (0.0%) |
| $10,000 to $24,999 | 28 (38.9%) | 0 (0.0%) |
| $25,000 to $34,999 | 4 (5.6%) | 0 (0.0%) |
| $35,000 to $49,999 | 19 (26.4%) | 0 (0.0%) |
| $50,000 to $74,999 | 0 (0.0%) | 16 (34.0%) |
| $75,000 to $99,999 | 2 (2.8%) | 0 (0.0%) |
| $100,000 to $149,999 | 18 (25.0%) | 31 (66.0%) |
| $150,000 or more | 1 (1.4%) | 0 (0.0%) |
| Total | 72 (100.0%) | 47 (100.0%) |
Property Value to Household Income Ratio in Salem
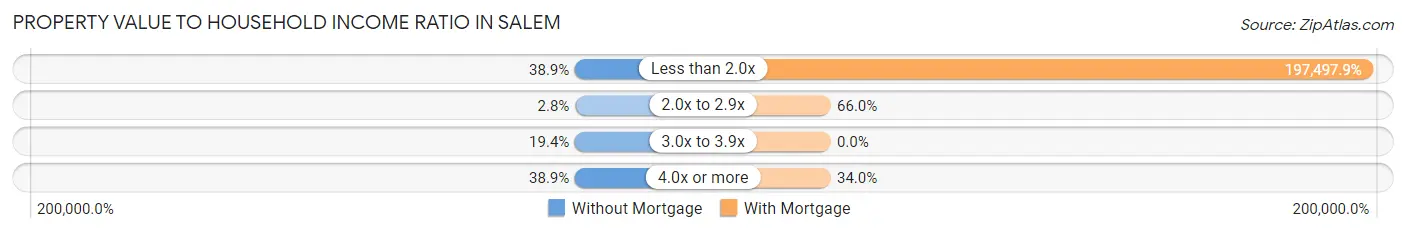
| Value-to-Income Ratio | Without Mortgage | With Mortgage |
| Less than 2.0x | 28 (38.9%) | 92,824 (197,497.9%) |
| 2.0x to 2.9x | 2 (2.8%) | 31 (66.0%) |
| 3.0x to 3.9x | 14 (19.4%) | 0 (0.0%) |
| 4.0x or more | 28 (38.9%) | 16 (34.0%) |
| Total | 72 (100.0%) | 47 (100.0%) |
Real Estate Taxes by Mortgage Status in Salem
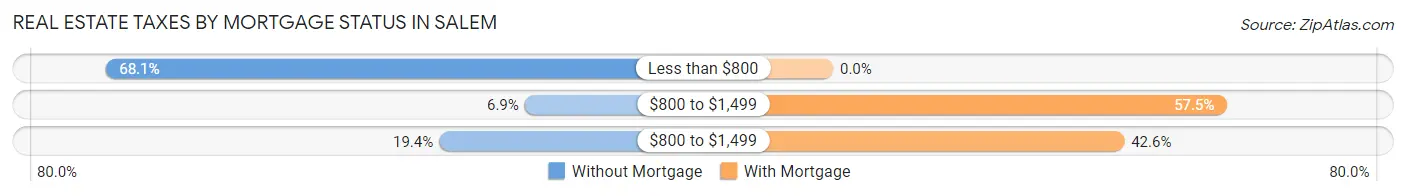
| Property Taxes | Without Mortgage | With Mortgage |
| Less than $800 | 49 (68.1%) | 0 (0.0%) |
| $800 to $1,499 | 5 (6.9%) | 27 (57.5%) |
| $800 to $1,499 | 14 (19.4%) | 20 (42.5%) |
| Total | 72 (100.0%) | 47 (100.0%) |
Health & Disability in Salem
Health Insurance Coverage by Age in Salem
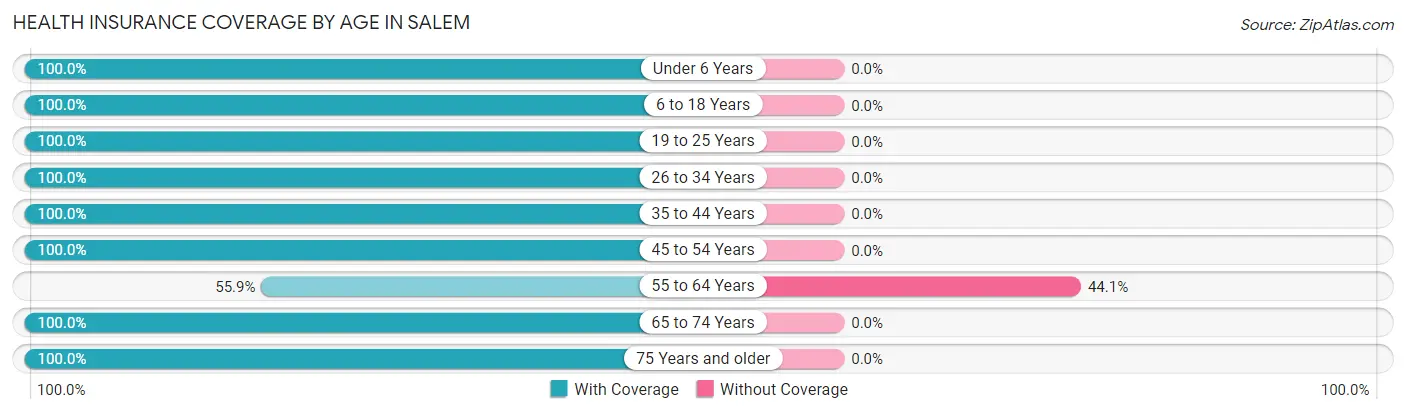
| Age Bracket | With Coverage | Without Coverage |
| Under 6 Years | 39 (100.0%) | 0 (0.0%) |
| 6 to 18 Years | 17 (100.0%) | 0 (0.0%) |
| 19 to 25 Years | 21 (100.0%) | 0 (0.0%) |
| 26 to 34 Years | 25 (100.0%) | 0 (0.0%) |
| 35 to 44 Years | 31 (100.0%) | 0 (0.0%) |
| 45 to 54 Years | 7 (100.0%) | 0 (0.0%) |
| 55 to 64 Years | 81 (55.9%) | 64 (44.1%) |
| 65 to 74 Years | 62 (100.0%) | 0 (0.0%) |
| 75 Years and older | 30 (100.0%) | 0 (0.0%) |
| Total | 313 (83.0%) | 64 (17.0%) |
Health Insurance Coverage by Citizenship Status in Salem
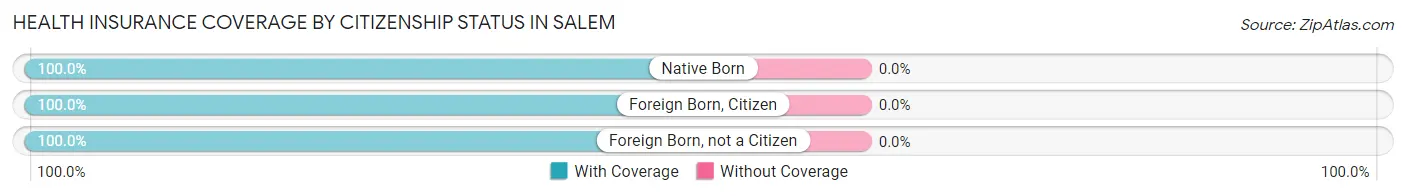
| Citizenship Status | With Coverage | Without Coverage |
| Native Born | 39 (100.0%) | 0 (0.0%) |
| Foreign Born, Citizen | 17 (100.0%) | 0 (0.0%) |
| Foreign Born, not a Citizen | 21 (100.0%) | 0 (0.0%) |
Health Insurance Coverage by Household Income in Salem
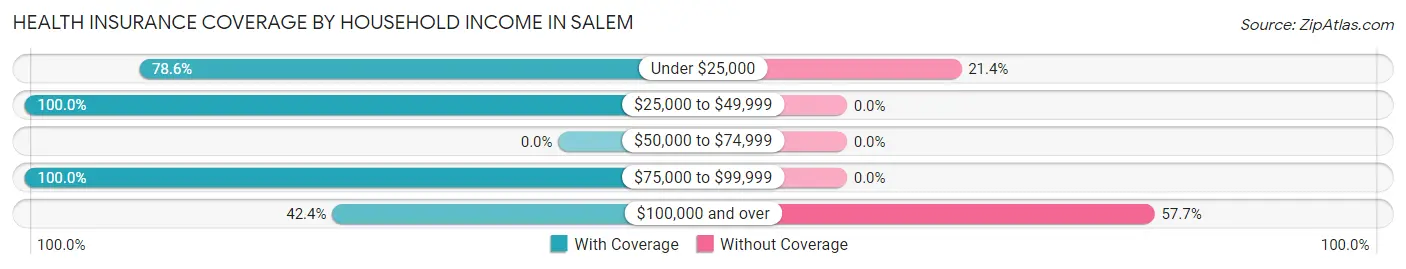
| Household Income | With Coverage | Without Coverage |
| Under $25,000 | 55 (78.6%) | 15 (21.4%) |
| $25,000 to $49,999 | 159 (100.0%) | 0 (0.0%) |
| $50,000 to $74,999 | 0 (0.0%) | 0 (0.0%) |
| $75,000 to $99,999 | 63 (100.0%) | 0 (0.0%) |
| $100,000 and over | 36 (42.3%) | 49 (57.7%) |
Public vs Private Health Insurance Coverage by Age in Salem
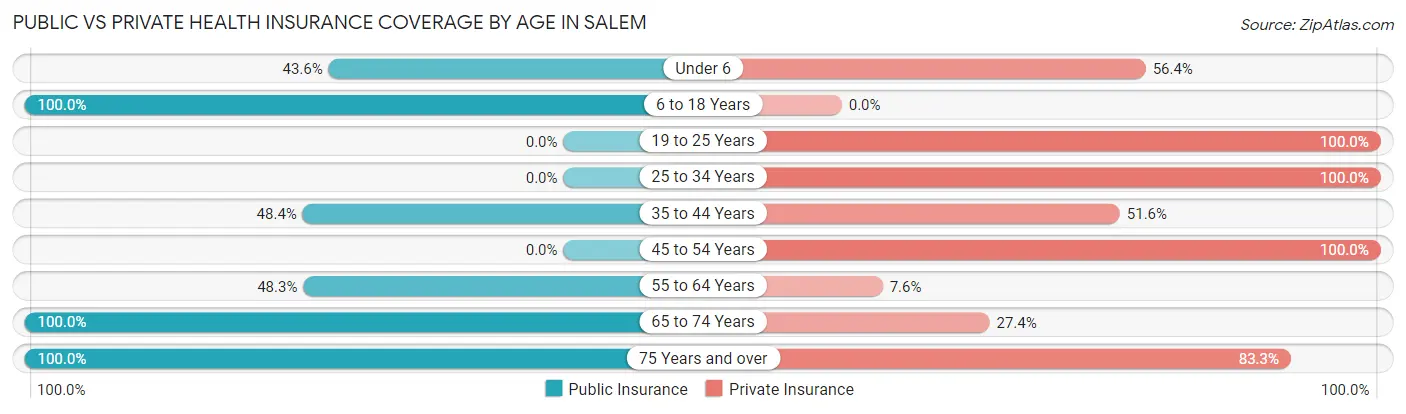
| Age Bracket | Public Insurance | Private Insurance |
| Under 6 | 17 (43.6%) | 22 (56.4%) |
| 6 to 18 Years | 17 (100.0%) | 0 (0.0%) |
| 19 to 25 Years | 0 (0.0%) | 21 (100.0%) |
| 25 to 34 Years | 0 (0.0%) | 25 (100.0%) |
| 35 to 44 Years | 15 (48.4%) | 16 (51.6%) |
| 45 to 54 Years | 0 (0.0%) | 7 (100.0%) |
| 55 to 64 Years | 70 (48.3%) | 11 (7.6%) |
| 65 to 74 Years | 62 (100.0%) | 17 (27.4%) |
| 75 Years and over | 30 (100.0%) | 25 (83.3%) |
| Total | 211 (56.0%) | 144 (38.2%) |
Disability Status by Sex by Age in Salem
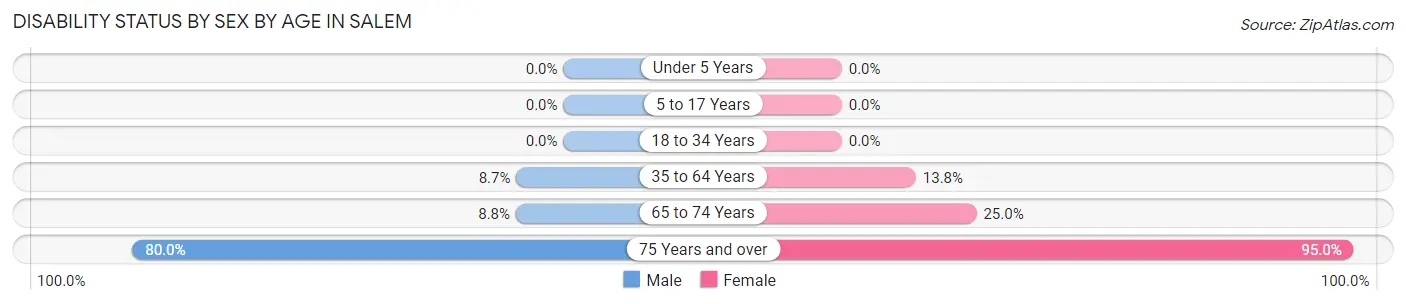
| Age Bracket | Male | Female |
| Under 5 Years | 0 (0.0%) | 0 (0.0%) |
| 5 to 17 Years | 0 (0.0%) | 0 (0.0%) |
| 18 to 34 Years | 0 (0.0%) | 0 (0.0%) |
| 35 to 64 Years | 9 (8.7%) | 11 (13.8%) |
| 65 to 74 Years | 3 (8.8%) | 7 (25.0%) |
| 75 Years and over | 8 (80.0%) | 19 (95.0%) |
Disability Class by Sex by Age in Salem
Disability Class: Hearing Difficulty
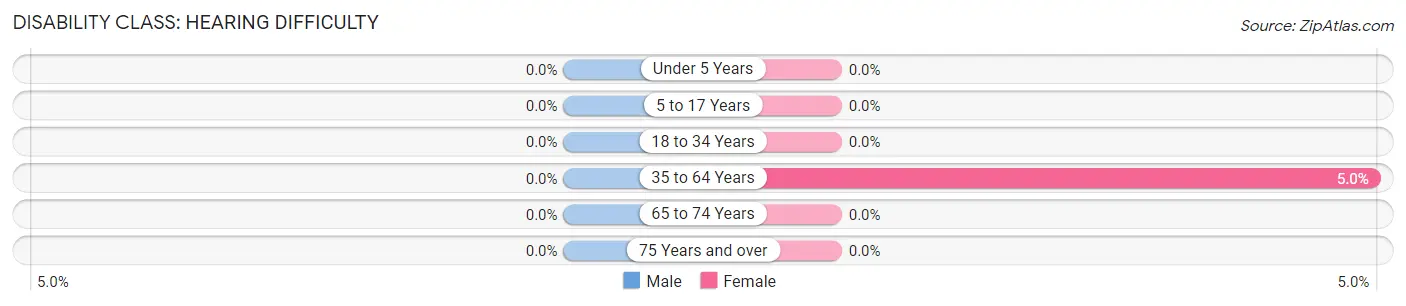
| Age Bracket | Male | Female |
| Under 5 Years | 0 (0.0%) | 0 (0.0%) |
| 5 to 17 Years | 0 (0.0%) | 0 (0.0%) |
| 18 to 34 Years | 0 (0.0%) | 0 (0.0%) |
| 35 to 64 Years | 0 (0.0%) | 4 (5.0%) |
| 65 to 74 Years | 0 (0.0%) | 0 (0.0%) |
| 75 Years and over | 0 (0.0%) | 0 (0.0%) |
Disability Class: Vision Difficulty
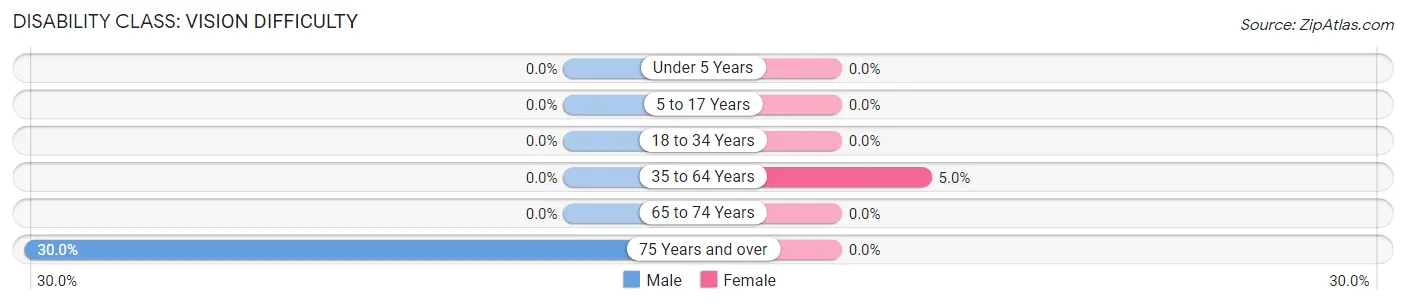
| Age Bracket | Male | Female |
| Under 5 Years | 0 (0.0%) | 0 (0.0%) |
| 5 to 17 Years | 0 (0.0%) | 0 (0.0%) |
| 18 to 34 Years | 0 (0.0%) | 0 (0.0%) |
| 35 to 64 Years | 0 (0.0%) | 4 (5.0%) |
| 65 to 74 Years | 0 (0.0%) | 0 (0.0%) |
| 75 Years and over | 3 (30.0%) | 0 (0.0%) |
Disability Class: Cognitive Difficulty
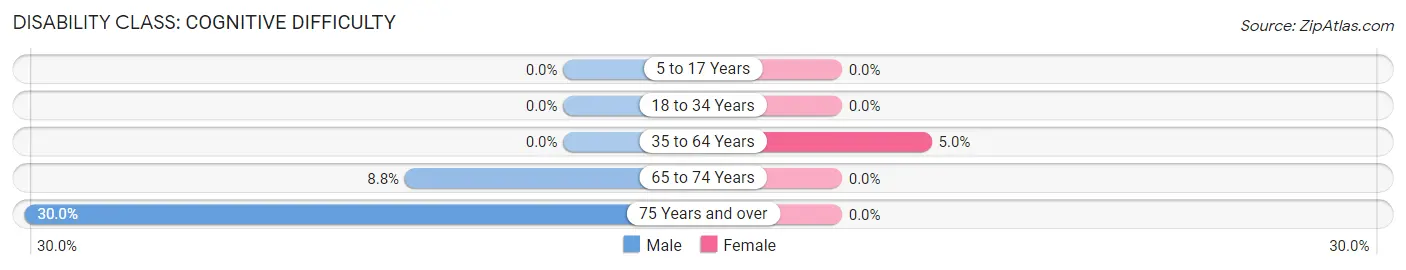
| Age Bracket | Male | Female |
| 5 to 17 Years | 0 (0.0%) | 0 (0.0%) |
| 18 to 34 Years | 0 (0.0%) | 0 (0.0%) |
| 35 to 64 Years | 0 (0.0%) | 4 (5.0%) |
| 65 to 74 Years | 3 (8.8%) | 0 (0.0%) |
| 75 Years and over | 3 (30.0%) | 0 (0.0%) |
Disability Class: Ambulatory Difficulty
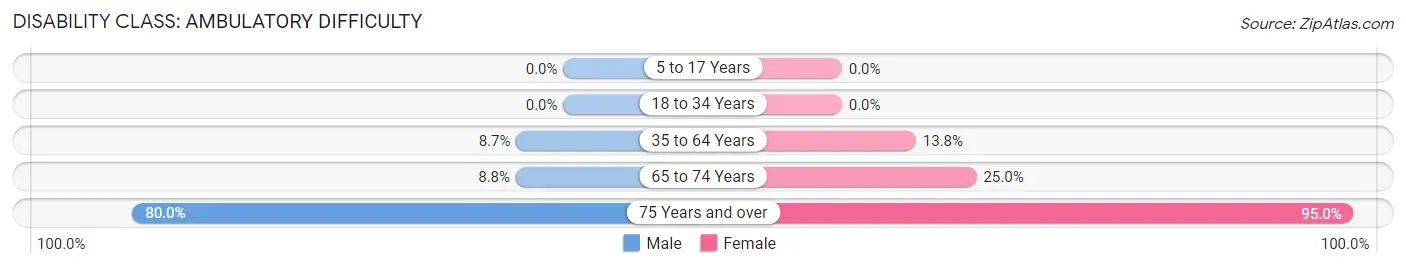
| Age Bracket | Male | Female |
| 5 to 17 Years | 0 (0.0%) | 0 (0.0%) |
| 18 to 34 Years | 0 (0.0%) | 0 (0.0%) |
| 35 to 64 Years | 9 (8.7%) | 11 (13.8%) |
| 65 to 74 Years | 3 (8.8%) | 7 (25.0%) |
| 75 Years and over | 8 (80.0%) | 19 (95.0%) |
Disability Class: Self-Care Difficulty
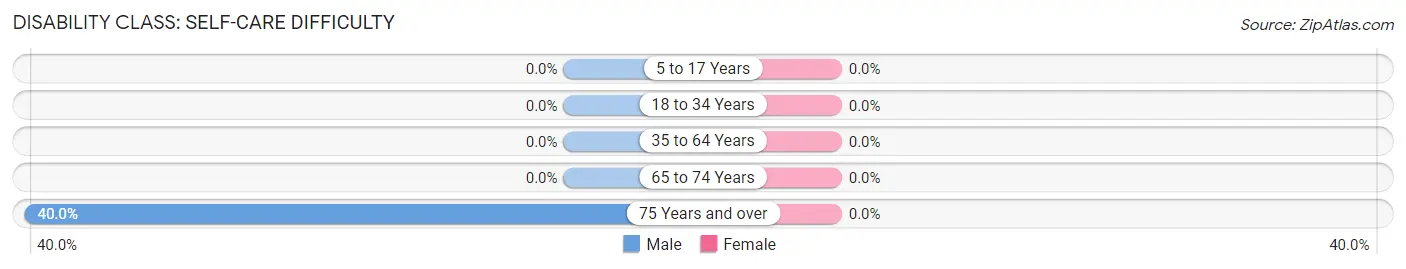
| Age Bracket | Male | Female |
| 5 to 17 Years | 0 (0.0%) | 0 (0.0%) |
| 18 to 34 Years | 0 (0.0%) | 0 (0.0%) |
| 35 to 64 Years | 0 (0.0%) | 0 (0.0%) |
| 65 to 74 Years | 0 (0.0%) | 0 (0.0%) |
| 75 Years and over | 4 (40.0%) | 0 (0.0%) |
Technology Access in Salem
Computing Device Access in Salem
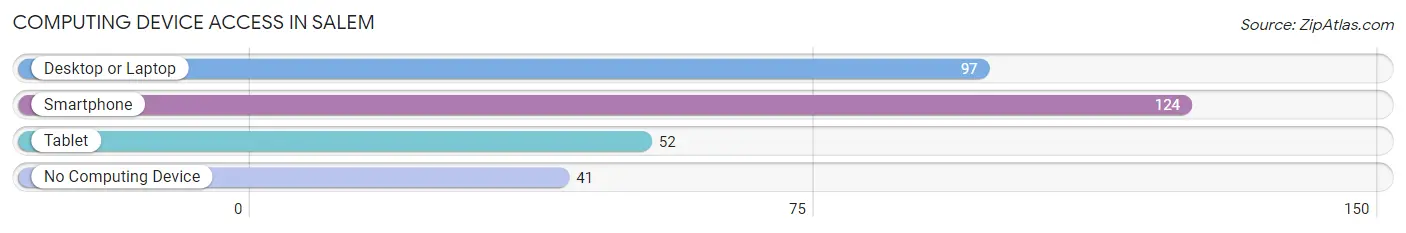
| Device Type | # Households | % Households |
| Desktop or Laptop | 97 | 55.1% |
| Smartphone | 124 | 70.5% |
| Tablet | 52 | 29.5% |
| No Computing Device | 41 | 23.3% |
| Total | 176 | 100.0% |
Internet Access in Salem
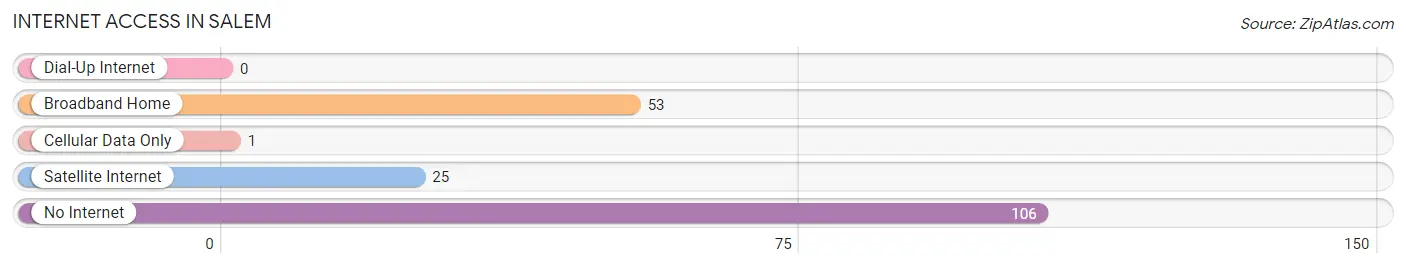
| Internet Type | # Households | % Households |
| Dial-Up Internet | 0 | 0.0% |
| Broadband Home | 53 | 30.1% |
| Cellular Data Only | 1 | 0.6% |
| Satellite Internet | 25 | 14.2% |
| No Internet | 106 | 60.2% |
| Total | 176 | 100.0% |
Salem Summary
Salem, Georgia is a small town located in the southwestern corner of the state, in the foothills of the Appalachian Mountains. It is part of the Rome-Floyd County Metropolitan Statistical Area, and is located about 25 miles northwest of Rome. The town has a population of just over 1,000 people, and is known for its rural charm and small-town atmosphere.
History
The area that is now Salem was first settled in the early 1800s by settlers from North Carolina. The town was originally known as “New Salem”, and was officially incorporated in 1837. The town was named after the biblical city of Salem, and was the first town in Floyd County to be incorporated.
In the late 1800s, Salem was a thriving agricultural community, with cotton, corn, and tobacco being the main crops. The town also had a number of small businesses, including a grist mill, a sawmill, and a blacksmith shop.
In the early 1900s, Salem began to experience a decline in population as many of its residents moved away to larger cities in search of better economic opportunities. The town’s population continued to decline until the 1950s, when the construction of the nearby Rome Air Force Base brought new jobs and economic growth to the area.
Geography
Salem is located in the foothills of the Appalachian Mountains, in the southwestern corner of Floyd County. The town is situated on the banks of the Oostanaula River, and is surrounded by rolling hills and forests. The town is located about 25 miles northwest of Rome, and is about an hour’s drive from Atlanta.
The climate in Salem is mild and temperate, with hot summers and cool winters. The average annual temperature is around 60 degrees Fahrenheit, and the average annual precipitation is around 50 inches.
Economy
The economy of Salem is largely based on agriculture and tourism. The town is home to several farms, which produce a variety of crops, including cotton, corn, and tobacco. The town is also home to several small businesses, including restaurants, shops, and a few manufacturing plants.
The town is also a popular tourist destination, with many visitors coming to enjoy the town’s rural charm and small-town atmosphere. The town is home to several historic sites, including the Old Salem Cemetery and the Salem Presbyterian Church.
Demographics
As of the 2010 census, the population of Salem was 1,072. The racial makeup of the town was 94.3% White, 2.7% African American, 0.3% Native American, 0.3% Asian, 0.1% Pacific Islander, 0.7% from other races, and 1.6% from two or more races. Hispanic or Latino of any race were 2.2% of the population.
The median household income in Salem was $37,500, and the median family income was $45,000. The per capita income in the town was $19,000. About 11.3% of the population was below the poverty line.
Common Questions
What is Per Capita Income in Salem?
Per Capita income in Salem is $27,086.
What is the Median Family Income in Salem?
Median Family Income in Salem is $82,500.
What is the Median Household income in Salem?
Median Household Income in Salem is $36,618.
What is Income or Wage Gap in Salem?
Income or Wage Gap in Salem is 2.6%.
Women in Salem earn 97.4 cents for every dollar earned by a man.
What is Inequality or Gini Index in Salem?
Inequality or Gini Index in Salem is 0.43.
What is the Total Population of Salem?
Total Population of Salem is 377.
What is the Total Male Population of Salem?
Total Male Population of Salem is 216.
What is the Total Female Population of Salem?
Total Female Population of Salem is 161.
What is the Ratio of Males per 100 Females in Salem?
There are 134.16 Males per 100 Females in Salem.
What is the Ratio of Females per 100 Males in Salem?
There are 74.54 Females per 100 Males in Salem.
What is the Median Population Age in Salem?
Median Population Age in Salem is 58.0 Years.
What is the Average Family Size in Salem
Average Family Size in Salem is 3.2 People.
What is the Average Household Size in Salem
Average Household Size in Salem is 2.1 People.
How Large is the Labor Force in Salem?
There are 170 People in the Labor Forcein in Salem.
What is the Percentage of People in the Labor Force in Salem?
53.0% of People are in the Labor Force in Salem.