Carrollwood, FL Map & Demographics
Carrollwood Map
Carrollwood Overview
$45,710
PER CAPITA INCOME
$99,470
AVG FAMILY INCOME
$73,150
AVG HOUSEHOLD INCOME
22.3%
WAGE / INCOME GAP [ % ]
77.7¢/ $1
WAGE / INCOME GAP [ $ ]
$13,008
FAMILY INCOME DEFICIT
0.48
INEQUALITY / GINI INDEX
36,148
TOTAL POPULATION
17,139
MALE POPULATION
19,009
FEMALE POPULATION
90.16
MALES / 100 FEMALES
110.91
FEMALES / 100 MALES
40.7
MEDIAN AGE
3.1
AVG FAMILY SIZE
2.5
AVG HOUSEHOLD SIZE
19,243
LABOR FORCE [ PEOPLE ]
65.3%
PERCENT IN LABOR FORCE
4.0%
UNEMPLOYMENT RATE
Income in Carrollwood
Income Overview in Carrollwood
Per Capita Income in Carrollwood is $45,710, while median incomes of families and households are $99,470 and $73,150 respectively.
| Characteristic | Number | Measure |
| Per Capita Income | 36,148 | $45,710 |
| Median Family Income | 9,016 | $99,470 |
| Mean Family Income | 9,016 | $138,442 |
| Median Household Income | 14,581 | $73,150 |
| Mean Household Income | 14,581 | $111,087 |
| Income Deficit | 9,016 | $13,008 |
| Wage / Income Gap (%) | 36,148 | 22.27% |
| Wage / Income Gap ($) | 36,148 | 77.73¢ per $1 |
| Gini / Inequality Index | 36,148 | 0.48 |
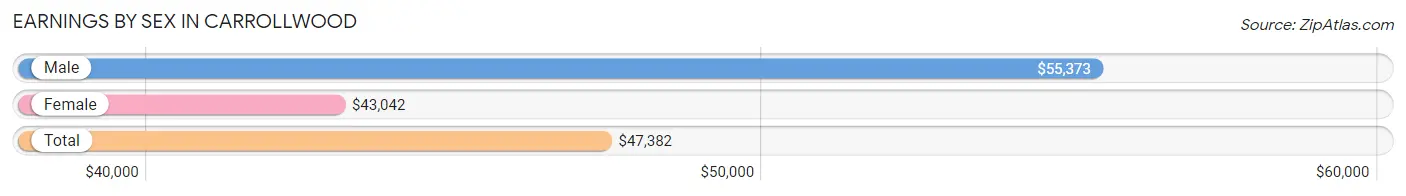
Earnings by Sex in Carrollwood
Average Earnings in Carrollwood are $47,382, $55,373 for men and $43,042 for women, a difference of 22.3%.
| Sex | Number | Average Earnings |
| Male | 10,265 (51.4%) | $55,373 |
| Female | 9,692 (48.6%) | $43,042 |
| Total | 19,957 (100.0%) | $47,382 |
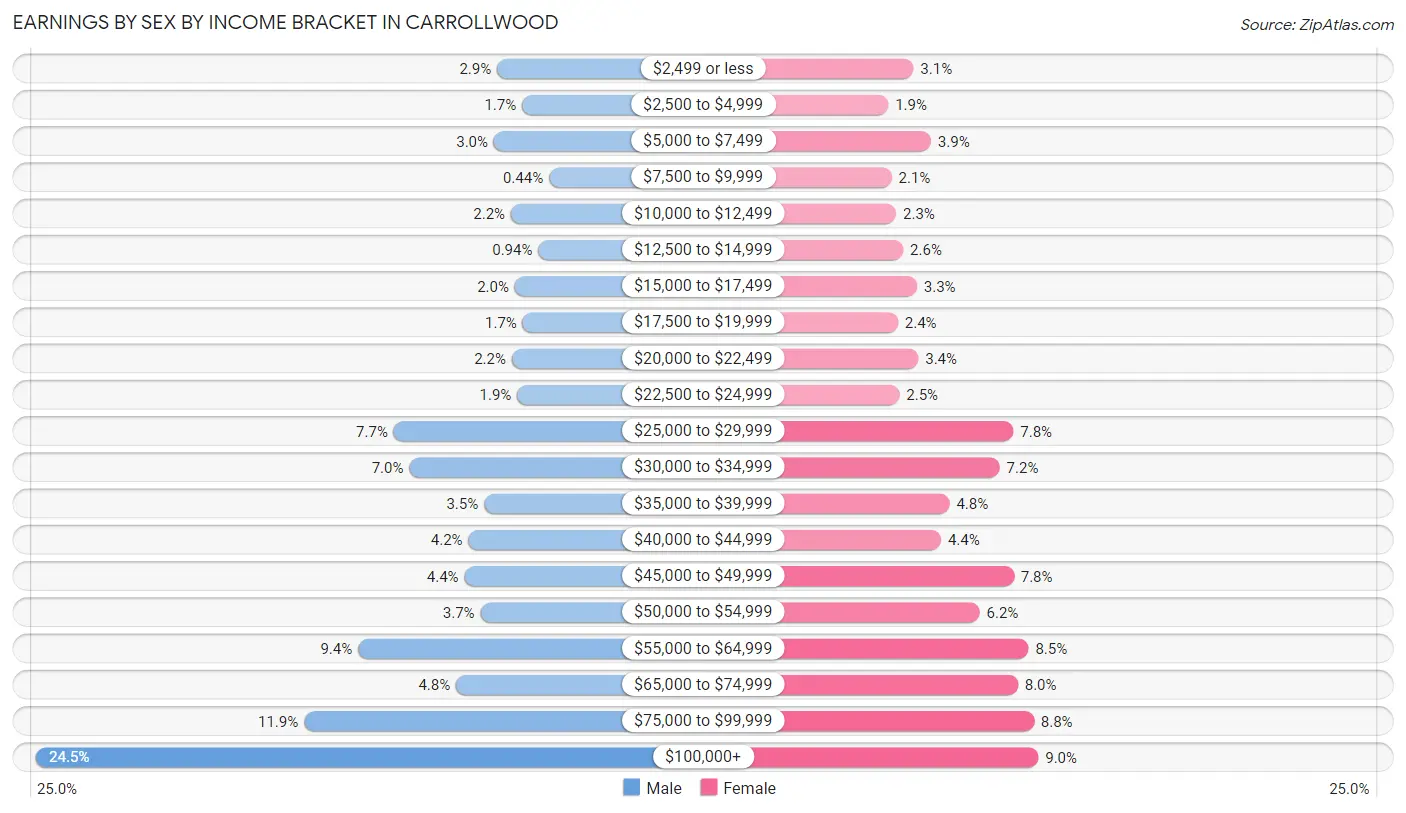
Earnings by Sex by Income Bracket in Carrollwood
The most common earnings brackets in Carrollwood are $100,000+ for men (2,511 | 24.5%) and $100,000+ for women (869 | 9.0%).
| Income | Male | Female |
| $2,499 or less | 295 (2.9%) | 302 (3.1%) |
| $2,500 to $4,999 | 175 (1.7%) | 188 (1.9%) |
| $5,000 to $7,499 | 310 (3.0%) | 382 (3.9%) |
| $7,500 to $9,999 | 45 (0.4%) | 204 (2.1%) |
| $10,000 to $12,499 | 228 (2.2%) | 224 (2.3%) |
| $12,500 to $14,999 | 97 (0.9%) | 256 (2.6%) |
| $15,000 to $17,499 | 209 (2.0%) | 318 (3.3%) |
| $17,500 to $19,999 | 171 (1.7%) | 232 (2.4%) |
| $20,000 to $22,499 | 224 (2.2%) | 325 (3.4%) |
| $22,500 to $24,999 | 198 (1.9%) | 238 (2.5%) |
| $25,000 to $29,999 | 791 (7.7%) | 756 (7.8%) |
| $30,000 to $34,999 | 717 (7.0%) | 694 (7.2%) |
| $35,000 to $39,999 | 357 (3.5%) | 466 (4.8%) |
| $40,000 to $44,999 | 432 (4.2%) | 427 (4.4%) |
| $45,000 to $49,999 | 452 (4.4%) | 758 (7.8%) |
| $50,000 to $54,999 | 375 (3.6%) | 603 (6.2%) |
| $55,000 to $64,999 | 963 (9.4%) | 825 (8.5%) |
| $65,000 to $74,999 | 492 (4.8%) | 776 (8.0%) |
| $75,000 to $99,999 | 1,223 (11.9%) | 849 (8.8%) |
| $100,000+ | 2,511 (24.5%) | 869 (9.0%) |
| Total | 10,265 (100.0%) | 9,692 (100.0%) |
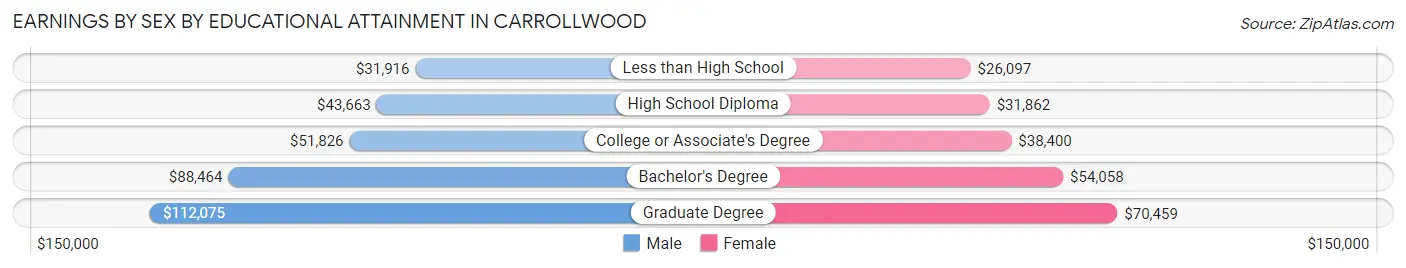
Earnings by Sex by Educational Attainment in Carrollwood
Average earnings in Carrollwood are $57,889 for men and $46,247 for women, a difference of 20.1%. Men with an educational attainment of graduate degree enjoy the highest average annual earnings of $112,075, while those with less than high school education earn the least with $31,916. Women with an educational attainment of graduate degree earn the most with the average annual earnings of $70,459, while those with less than high school education have the smallest earnings of $26,097.
| Educational Attainment | Male Income | Female Income |
| Less than High School | $31,916 | $26,097 |
| High School Diploma | $43,663 | $31,862 |
| College or Associate's Degree | $51,826 | $38,400 |
| Bachelor's Degree | $88,464 | $54,058 |
| Graduate Degree | $112,075 | $70,459 |
| Total | $57,889 | $46,247 |
Family Income in Carrollwood
Family Income Brackets in Carrollwood
According to the Carrollwood family income data, there are 1,704 families falling into the $100,000 to $149,999 income range, which is the most common income bracket and makes up 18.9% of all families. Conversely, the $10,000 to $14,999 income bracket is the least frequent group with only 72 families (0.8%) belonging to this category.
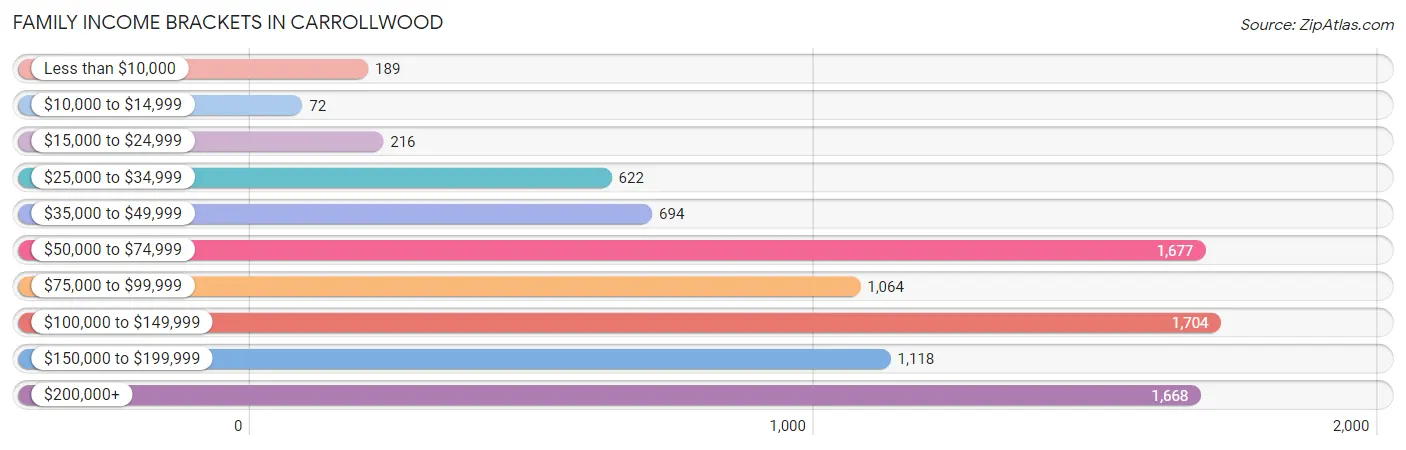
| Income Bracket | # Families | % Families |
| Less than $10,000 | 189 | 2.1% |
| $10,000 to $14,999 | 72 | 0.8% |
| $15,000 to $24,999 | 216 | 2.4% |
| $25,000 to $34,999 | 622 | 6.9% |
| $35,000 to $49,999 | 694 | 7.7% |
| $50,000 to $74,999 | 1,677 | 18.6% |
| $75,000 to $99,999 | 1,064 | 11.8% |
| $100,000 to $149,999 | 1,704 | 18.9% |
| $150,000 to $199,999 | 1,118 | 12.4% |
| $200,000+ | 1,668 | 18.5% |
Family Income by Famaliy Size in Carrollwood
5-person families (369 | 4.1%) account for the highest median family income in Carrollwood with $240,363 per family, while 5-person families (369 | 4.1%) have the highest median income of $48,073 per family member.
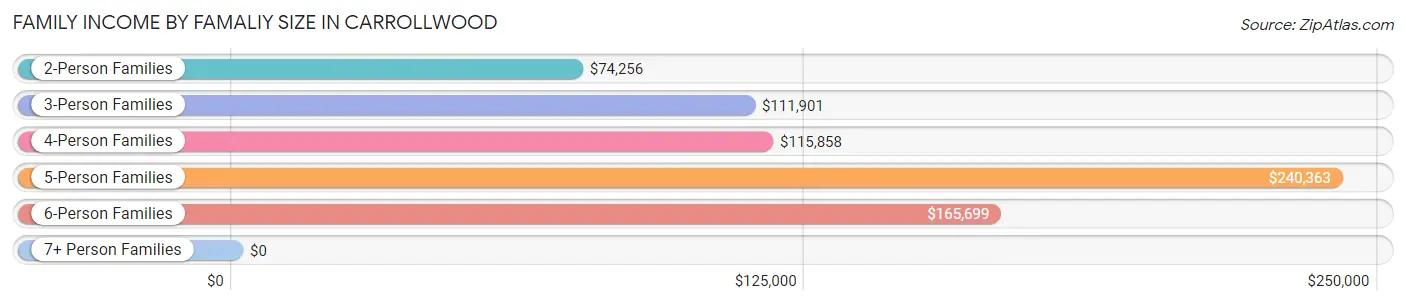
| Income Bracket | # Families | Median Income |
| 2-Person Families | 4,819 (53.4%) | $74,256 |
| 3-Person Families | 2,049 (22.7%) | $111,901 |
| 4-Person Families | 1,305 (14.5%) | $115,858 |
| 5-Person Families | 369 (4.1%) | $240,363 |
| 6-Person Families | 249 (2.8%) | $165,699 |
| 7+ Person Families | 225 (2.5%) | $0 |
| Total | 9,016 (100.0%) | $99,470 |
Family Income by Number of Earners in Carrollwood
The median family income in Carrollwood is $99,470, with families comprising 3+ earners (1,073) having the highest median family income of $152,112, while families with no earners (1,435) have the lowest median family income of $45,201, accounting for 11.9% and 15.9% of families, respectively.
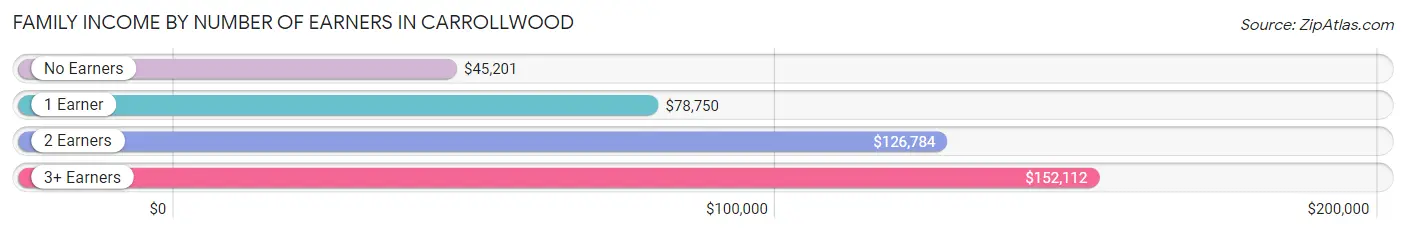
| Number of Earners | # Families | Median Income |
| No Earners | 1,435 (15.9%) | $45,201 |
| 1 Earner | 2,853 (31.6%) | $78,750 |
| 2 Earners | 3,655 (40.5%) | $126,784 |
| 3+ Earners | 1,073 (11.9%) | $152,112 |
| Total | 9,016 (100.0%) | $99,470 |
Household Income in Carrollwood
Household Income Brackets in Carrollwood
With 2,858 households falling in the category, the $50,000 to $74,999 income range is the most frequent in Carrollwood, accounting for 19.6% of all households. In contrast, only 408 households (2.8%) fall into the $10,000 to $14,999 income bracket, making it the least populous group.
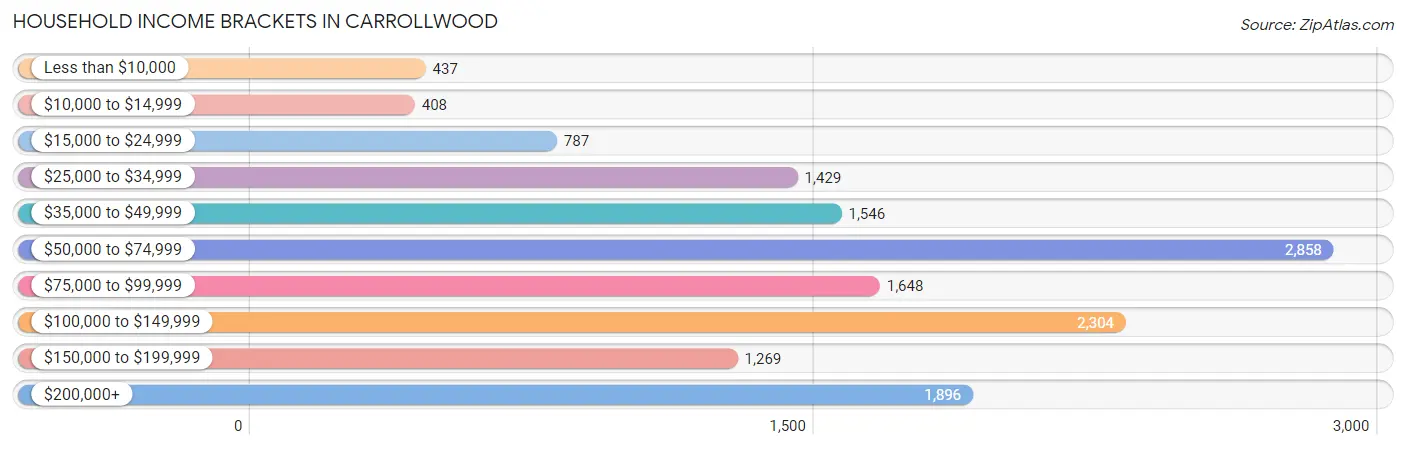
| Income Bracket | # Households | % Households |
| Less than $10,000 | 437 | 3.0% |
| $10,000 to $14,999 | 408 | 2.8% |
| $15,000 to $24,999 | 787 | 5.4% |
| $25,000 to $34,999 | 1,429 | 9.8% |
| $35,000 to $49,999 | 1,546 | 10.6% |
| $50,000 to $74,999 | 2,858 | 19.6% |
| $75,000 to $99,999 | 1,648 | 11.3% |
| $100,000 to $149,999 | 2,304 | 15.8% |
| $150,000 to $199,999 | 1,269 | 8.7% |
| $200,000+ | 1,896 | 13.0% |
Household Income by Householder Age in Carrollwood
The median household income in Carrollwood is $73,150, with the highest median household income of $94,124 found in the 45 to 64 years age bracket for the primary householder. A total of 5,511 households (37.8%) fall into this category. Meanwhile, the 65+ years age bracket for the primary householder has the lowest median household income of $46,591, with 4,034 households (27.7%) in this group.
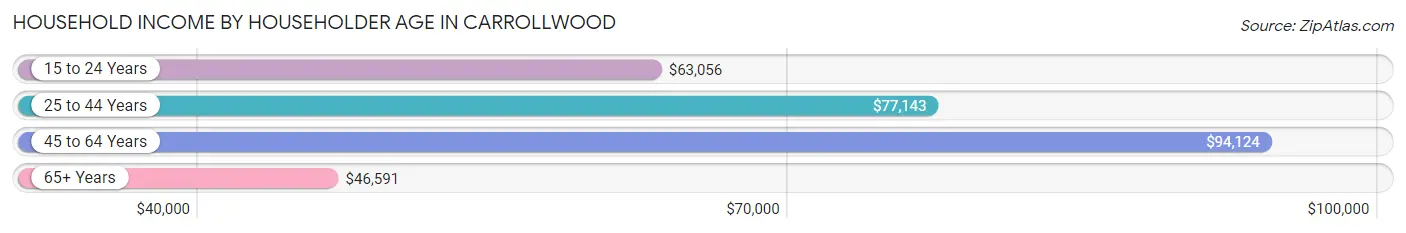
| Income Bracket | # Households | Median Income |
| 15 to 24 Years | 284 (1.9%) | $63,056 |
| 25 to 44 Years | 4,752 (32.6%) | $77,143 |
| 45 to 64 Years | 5,511 (37.8%) | $94,124 |
| 65+ Years | 4,034 (27.7%) | $46,591 |
| Total | 14,581 (100.0%) | $73,150 |
Poverty in Carrollwood
Income Below Poverty by Sex and Age in Carrollwood
With 5.1% poverty level for males and 6.4% for females among the residents of Carrollwood, 18 to 24 year old males and 15 year old females are the most vulnerable to poverty, with 101 males (9.7%) and 48 females (18.6%) in their respective age groups living below the poverty level.
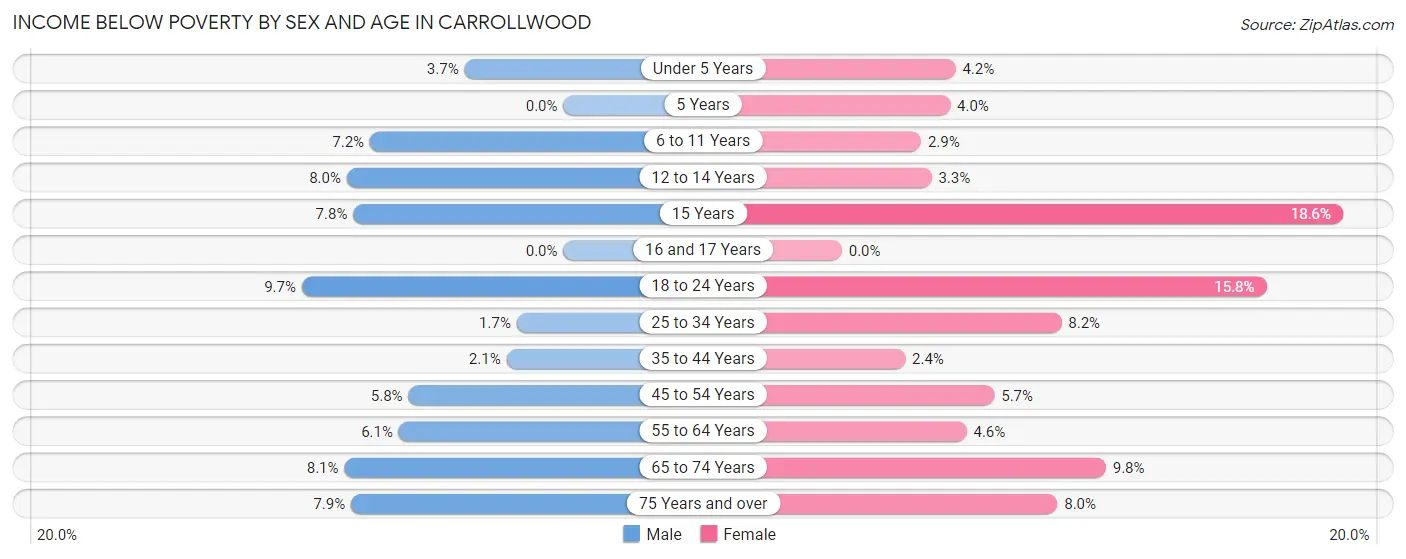
| Age Bracket | Male | Female |
| Under 5 Years | 51 (3.7%) | 58 (4.2%) |
| 5 Years | 0 (0.0%) | 7 (4.0%) |
| 6 to 11 Years | 66 (7.2%) | 34 (2.9%) |
| 12 to 14 Years | 44 (8.0%) | 9 (3.3%) |
| 15 Years | 16 (7.8%) | 48 (18.6%) |
| 16 and 17 Years | 0 (0.0%) | 0 (0.0%) |
| 18 to 24 Years | 101 (9.7%) | 156 (15.8%) |
| 25 to 34 Years | 43 (1.7%) | 239 (8.2%) |
| 35 to 44 Years | 49 (2.1%) | 47 (2.4%) |
| 45 to 54 Years | 163 (5.8%) | 156 (5.7%) |
| 55 to 64 Years | 119 (6.1%) | 128 (4.6%) |
| 65 to 74 Years | 135 (8.1%) | 168 (9.8%) |
| 75 Years and over | 86 (7.9%) | 153 (8.0%) |
| Total | 873 (5.1%) | 1,203 (6.4%) |
Income Above Poverty by Sex and Age in Carrollwood
According to the poverty statistics in Carrollwood, males aged 5 years and females aged 16 and 17 years are the age groups that are most secure financially, with 100.0% of males and 100.0% of females in these age groups living above the poverty line.
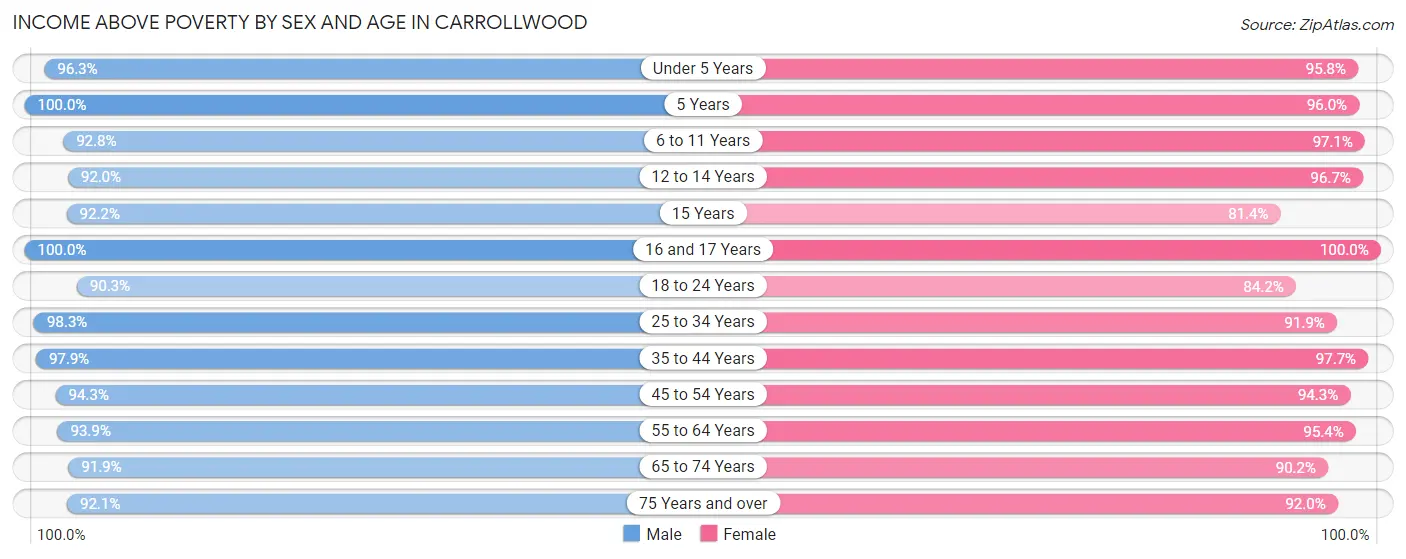
| Age Bracket | Male | Female |
| Under 5 Years | 1,339 (96.3%) | 1,318 (95.8%) |
| 5 Years | 129 (100.0%) | 167 (96.0%) |
| 6 to 11 Years | 853 (92.8%) | 1,124 (97.1%) |
| 12 to 14 Years | 503 (92.0%) | 261 (96.7%) |
| 15 Years | 189 (92.2%) | 210 (81.4%) |
| 16 and 17 Years | 391 (100.0%) | 593 (100.0%) |
| 18 to 24 Years | 939 (90.3%) | 834 (84.2%) |
| 25 to 34 Years | 2,449 (98.3%) | 2,695 (91.8%) |
| 35 to 44 Years | 2,269 (97.9%) | 1,952 (97.7%) |
| 45 to 54 Years | 2,672 (94.3%) | 2,599 (94.3%) |
| 55 to 64 Years | 1,830 (93.9%) | 2,637 (95.4%) |
| 65 to 74 Years | 1,525 (91.9%) | 1,546 (90.2%) |
| 75 Years and over | 1,006 (92.1%) | 1,759 (92.0%) |
| Total | 16,094 (94.9%) | 17,695 (93.6%) |
Income Below Poverty Among Married-Couple Families in Carrollwood
The poverty statistics for married-couple families in Carrollwood show that 2.8% or 188 of the total 6,771 families live below the poverty line. Families with 3 or 4 children have the highest poverty rate of 6.7%, comprising of 27 families. On the other hand, families with 5 or more children have the lowest poverty rate of 0.0%, which includes 0 families.
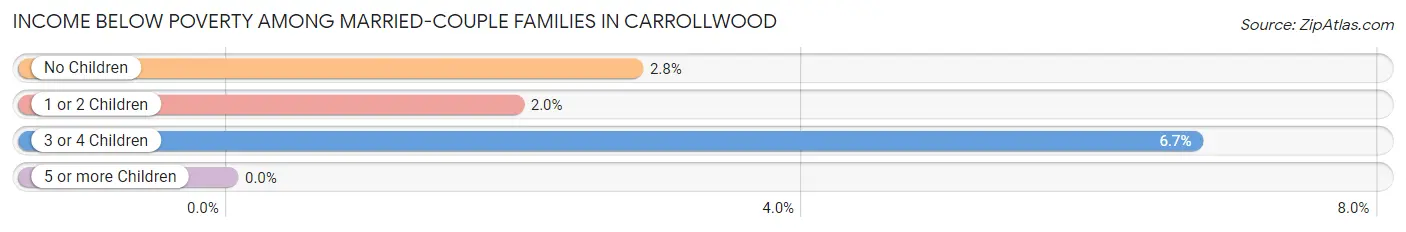
| Children | Above Poverty | Below Poverty |
| No Children | 4,101 (97.2%) | 119 (2.8%) |
| 1 or 2 Children | 2,066 (98.0%) | 42 (2.0%) |
| 3 or 4 Children | 375 (93.3%) | 27 (6.7%) |
| 5 or more Children | 41 (100.0%) | 0 (0.0%) |
| Total | 6,583 (97.2%) | 188 (2.8%) |
Income Below Poverty Among Single-Parent Households in Carrollwood
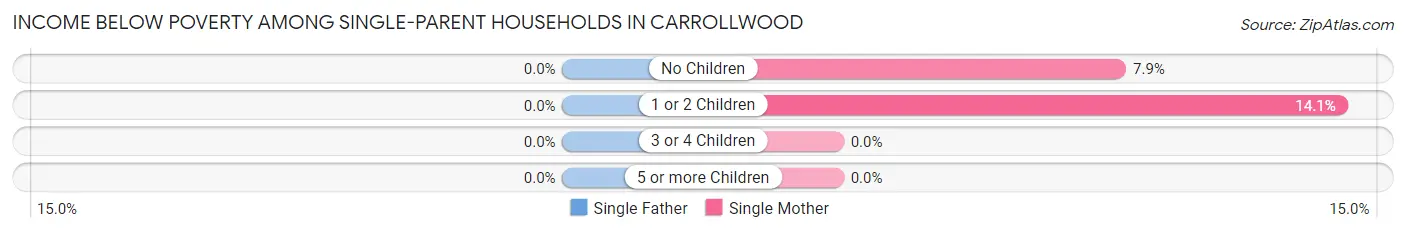
| Children | Single Father | Single Mother |
| No Children | 0 (0.0%) | 73 (7.9%) |
| 1 or 2 Children | 0 (0.0%) | 109 (14.1%) |
| 3 or 4 Children | 0 (0.0%) | 0 (0.0%) |
| 5 or more Children | 0 (0.0%) | 0 (0.0%) |
| Total | 0 (0.0%) | 182 (10.5%) |
Income Below Poverty Among Married-Couple vs Single-Parent Households in Carrollwood
The poverty data for Carrollwood shows that 188 of the married-couple family households (2.8%) and 182 of the single-parent households (8.1%) are living below the poverty level. Within the married-couple family households, those with 3 or 4 children have the highest poverty rate, with 27 households (6.7%) falling below the poverty line. Among the single-parent households, those with 1 or 2 children have the highest poverty rate, with 109 household (11.0%) living below poverty.
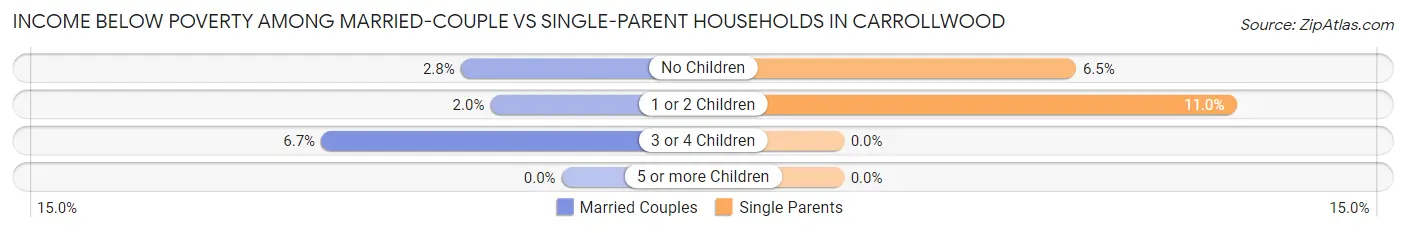
| Children | Married-Couple Families | Single-Parent Households |
| No Children | 119 (2.8%) | 73 (6.5%) |
| 1 or 2 Children | 42 (2.0%) | 109 (11.0%) |
| 3 or 4 Children | 27 (6.7%) | 0 (0.0%) |
| 5 or more Children | 0 (0.0%) | 0 (0.0%) |
| Total | 188 (2.8%) | 182 (8.1%) |
Race in Carrollwood
The most populous races in Carrollwood are White / Caucasian (24,894 | 68.9%), Hispanic or Latino (11,652 | 32.2%), and Two or more Races (5,187 | 14.3%).
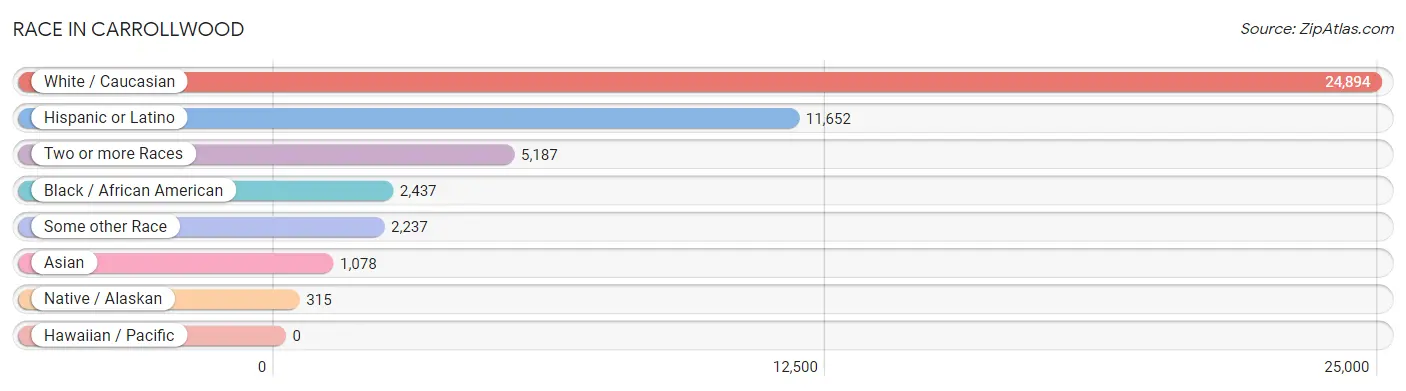
| Race | # Population | % Population |
| Asian | 1,078 | 3.0% |
| Black / African American | 2,437 | 6.7% |
| Hawaiian / Pacific | 0 | 0.0% |
| Hispanic or Latino | 11,652 | 32.2% |
| Native / Alaskan | 315 | 0.9% |
| White / Caucasian | 24,894 | 68.9% |
| Two or more Races | 5,187 | 14.3% |
| Some other Race | 2,237 | 6.2% |
| Total | 36,148 | 100.0% |
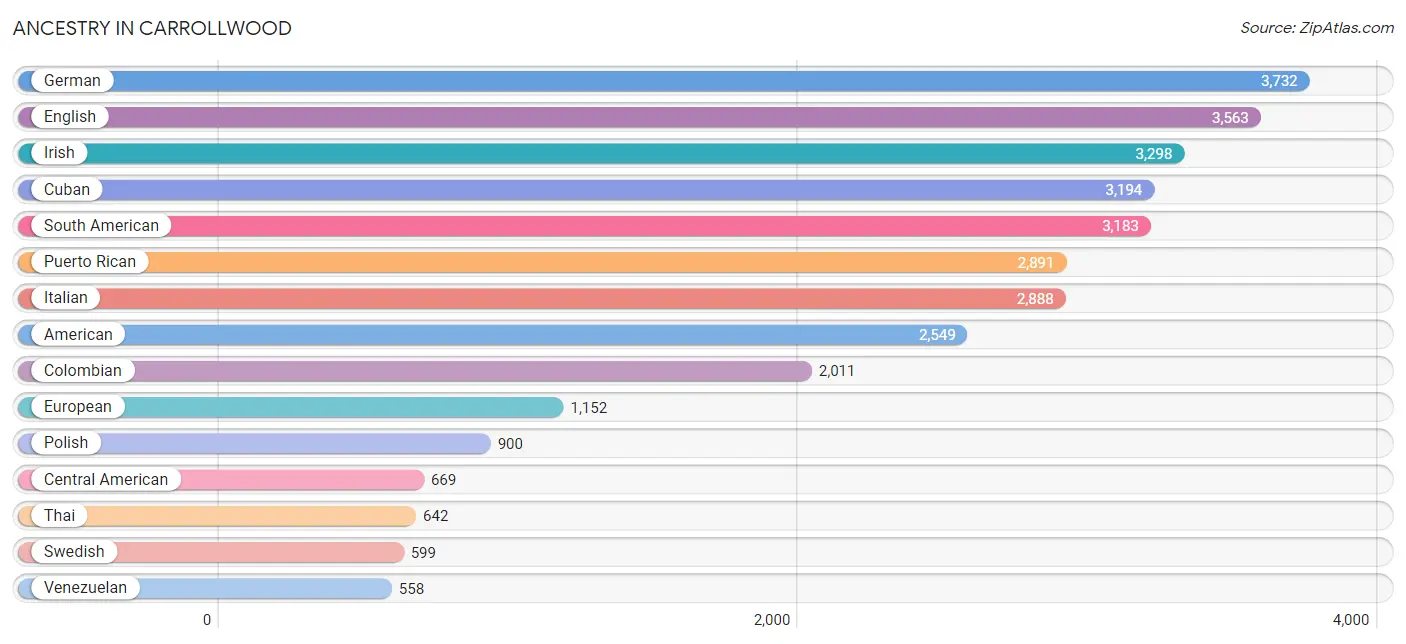
Ancestry in Carrollwood
The most populous ancestries reported in Carrollwood are German (3,732 | 10.3%), English (3,563 | 9.9%), Irish (3,298 | 9.1%), Cuban (3,194 | 8.8%), and South American (3,183 | 8.8%), together accounting for 46.9% of all Carrollwood residents.
| Ancestry | # Population | % Population |
| African | 27 | 0.1% |
| Albanian | 7 | 0.0% |
| American | 2,549 | 7.0% |
| Apache | 44 | 0.1% |
| Arab | 214 | 0.6% |
| Argentinean | 23 | 0.1% |
| Armenian | 29 | 0.1% |
| Austrian | 17 | 0.1% |
| Bhutanese | 61 | 0.2% |
| Brazilian | 106 | 0.3% |
| British | 173 | 0.5% |
| Bulgarian | 89 | 0.3% |
| Burmese | 118 | 0.3% |
| Canadian | 81 | 0.2% |
| Celtic | 10 | 0.0% |
| Central American | 669 | 1.8% |
| Central American Indian | 84 | 0.2% |
| Cherokee | 215 | 0.6% |
| Chilean | 171 | 0.5% |
| Choctaw | 10 | 0.0% |
| Colombian | 2,011 | 5.6% |
| Costa Rican | 154 | 0.4% |
| Creek | 29 | 0.1% |
| Cuban | 3,194 | 8.8% |
| Czech | 79 | 0.2% |
| Czechoslovakian | 83 | 0.2% |
| Danish | 112 | 0.3% |
| Dominican | 316 | 0.9% |
| Dutch | 325 | 0.9% |
| Eastern European | 155 | 0.4% |
| Ecuadorian | 182 | 0.5% |
| English | 3,563 | 9.9% |
| European | 1,152 | 3.2% |
| Finnish | 33 | 0.1% |
| French | 276 | 0.8% |
| French Canadian | 199 | 0.5% |
| German | 3,732 | 10.3% |
| Greek | 116 | 0.3% |
| Guatemalan | 70 | 0.2% |
| Guyanese | 11 | 0.0% |
| Haitian | 296 | 0.8% |
| Honduran | 117 | 0.3% |
| Hungarian | 96 | 0.3% |
| Icelander | 95 | 0.3% |
| Indian (Asian) | 405 | 1.1% |
| Iranian | 42 | 0.1% |
| Iraqi | 79 | 0.2% |
| Irish | 3,298 | 9.1% |
| Iroquois | 10 | 0.0% |
| Israeli | 80 | 0.2% |
| Italian | 2,888 | 8.0% |
| Jamaican | 107 | 0.3% |
| Korean | 90 | 0.3% |
| Latvian | 8 | 0.0% |
| Lebanese | 62 | 0.2% |
| Lithuanian | 36 | 0.1% |
| Luxembourger | 8 | 0.0% |
| Malaysian | 49 | 0.1% |
| Mexican | 513 | 1.4% |
| Mexican American Indian | 62 | 0.2% |
| Moroccan | 53 | 0.2% |
| Native Hawaiian | 8 | 0.0% |
| Nicaraguan | 154 | 0.4% |
| Nigerian | 41 | 0.1% |
| Northern European | 25 | 0.1% |
| Norwegian | 178 | 0.5% |
| Pakistani | 4 | 0.0% |
| Palestinian | 10 | 0.0% |
| Panamanian | 174 | 0.5% |
| Pennsylvania German | 167 | 0.5% |
| Peruvian | 175 | 0.5% |
| Polish | 900 | 2.5% |
| Portuguese | 136 | 0.4% |
| Puerto Rican | 2,891 | 8.0% |
| Romanian | 41 | 0.1% |
| Russian | 234 | 0.6% |
| Scandinavian | 126 | 0.4% |
| Scotch-Irish | 269 | 0.7% |
| Scottish | 468 | 1.3% |
| Serbian | 10 | 0.0% |
| Sioux | 93 | 0.3% |
| Slovak | 23 | 0.1% |
| Somali | 10 | 0.0% |
| South African | 73 | 0.2% |
| South American | 3,183 | 8.8% |
| Spaniard | 336 | 0.9% |
| Spanish | 371 | 1.0% |
| Sri Lankan | 92 | 0.3% |
| Subsaharan African | 151 | 0.4% |
| Swedish | 599 | 1.7% |
| Swiss | 54 | 0.2% |
| Syrian | 12 | 0.0% |
| Thai | 642 | 1.8% |
| Trinidadian and Tobagonian | 295 | 0.8% |
| U.S. Virgin Islander | 17 | 0.1% |
| Ukrainian | 31 | 0.1% |
| Uruguayan | 54 | 0.2% |
| Venezuelan | 558 | 1.5% |
| Welsh | 199 | 0.5% |
| Yugoslavian | 83 | 0.2% | View All 100 Rows |
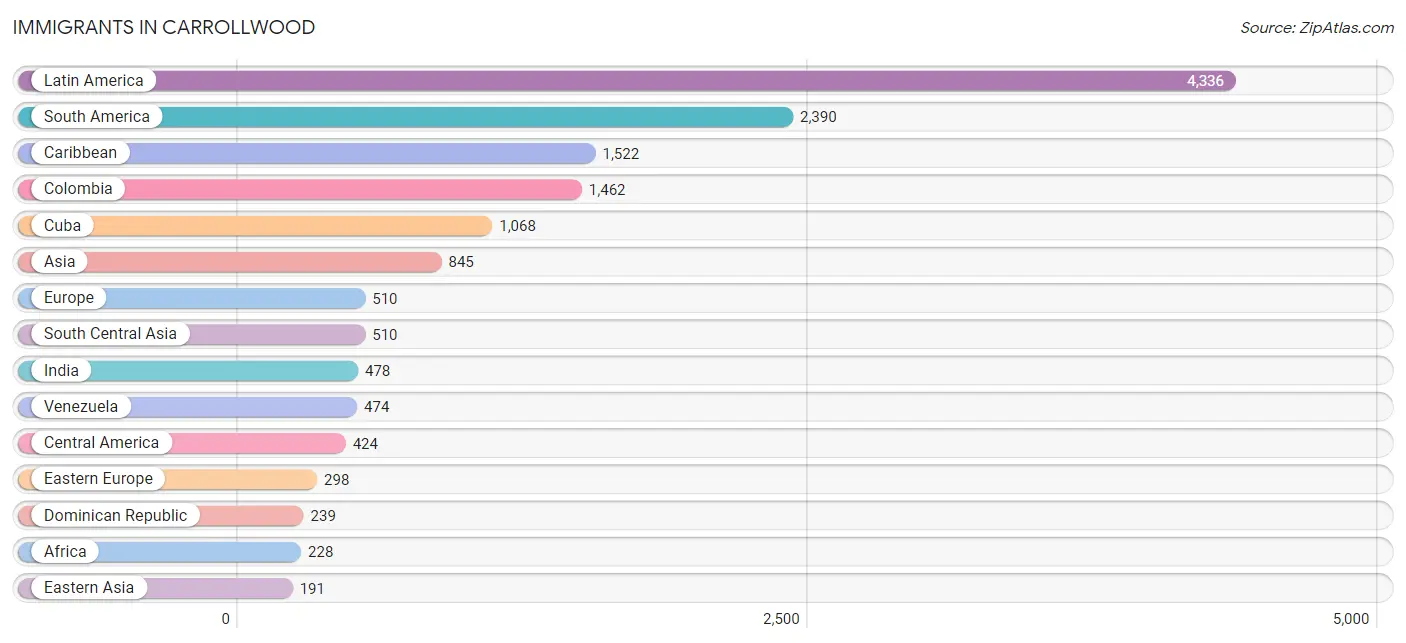
Immigrants in Carrollwood
The most numerous immigrant groups reported in Carrollwood came from Latin America (4,336 | 12.0%), South America (2,390 | 6.6%), Caribbean (1,522 | 4.2%), Colombia (1,462 | 4.0%), and Cuba (1,068 | 2.9%), together accounting for 29.8% of all Carrollwood residents.
| Immigration Origin | # Population | % Population |
| Africa | 228 | 0.6% |
| Argentina | 23 | 0.1% |
| Asia | 845 | 2.3% |
| Bolivia | 9 | 0.0% |
| Bosnia and Herzegovina | 41 | 0.1% |
| Brazil | 169 | 0.5% |
| Bulgaria | 102 | 0.3% |
| Canada | 78 | 0.2% |
| Caribbean | 1,522 | 4.2% |
| Central America | 424 | 1.2% |
| Chile | 10 | 0.0% |
| China | 133 | 0.4% |
| Colombia | 1,462 | 4.0% |
| Costa Rica | 82 | 0.2% |
| Cuba | 1,068 | 2.9% |
| Dominican Republic | 239 | 0.7% |
| Eastern Africa | 52 | 0.1% |
| Eastern Asia | 191 | 0.5% |
| Eastern Europe | 298 | 0.8% |
| Ecuador | 80 | 0.2% |
| Egypt | 10 | 0.0% |
| England | 17 | 0.1% |
| Europe | 510 | 1.4% |
| France | 3 | 0.0% |
| Germany | 17 | 0.1% |
| Greece | 33 | 0.1% |
| Guatemala | 52 | 0.1% |
| Guyana | 11 | 0.0% |
| Haiti | 6 | 0.0% |
| Honduras | 9 | 0.0% |
| Hong Kong | 8 | 0.0% |
| Hungary | 12 | 0.0% |
| India | 478 | 1.3% |
| Indonesia | 7 | 0.0% |
| Iran | 17 | 0.1% |
| Iraq | 45 | 0.1% |
| Israel | 10 | 0.0% |
| Italy | 37 | 0.1% |
| Jamaica | 15 | 0.0% |
| Japan | 12 | 0.0% |
| Kenya | 19 | 0.1% |
| Korea | 46 | 0.1% |
| Laos | 15 | 0.0% |
| Latin America | 4,336 | 12.0% |
| Mexico | 13 | 0.0% |
| Morocco | 56 | 0.2% |
| Netherlands | 10 | 0.0% |
| Nicaragua | 164 | 0.4% |
| Northern Africa | 66 | 0.2% |
| Northern Europe | 101 | 0.3% |
| Oceania | 14 | 0.0% |
| Pakistan | 15 | 0.0% |
| Panama | 104 | 0.3% |
| Peru | 143 | 0.4% |
| Philippines | 31 | 0.1% |
| Poland | 74 | 0.2% |
| Russia | 59 | 0.2% |
| Somalia | 10 | 0.0% |
| South Africa | 95 | 0.3% |
| South America | 2,390 | 6.6% |
| South Central Asia | 510 | 1.4% |
| South Eastern Asia | 89 | 0.3% |
| Southern Europe | 81 | 0.2% |
| Spain | 11 | 0.0% |
| Taiwan | 16 | 0.0% |
| Thailand | 2 | 0.0% |
| Trinidad and Tobago | 150 | 0.4% |
| Uganda | 23 | 0.1% |
| Venezuela | 474 | 1.3% |
| Vietnam | 34 | 0.1% |
| Western Asia | 55 | 0.2% |
| Western Europe | 30 | 0.1% | View All 72 Rows |
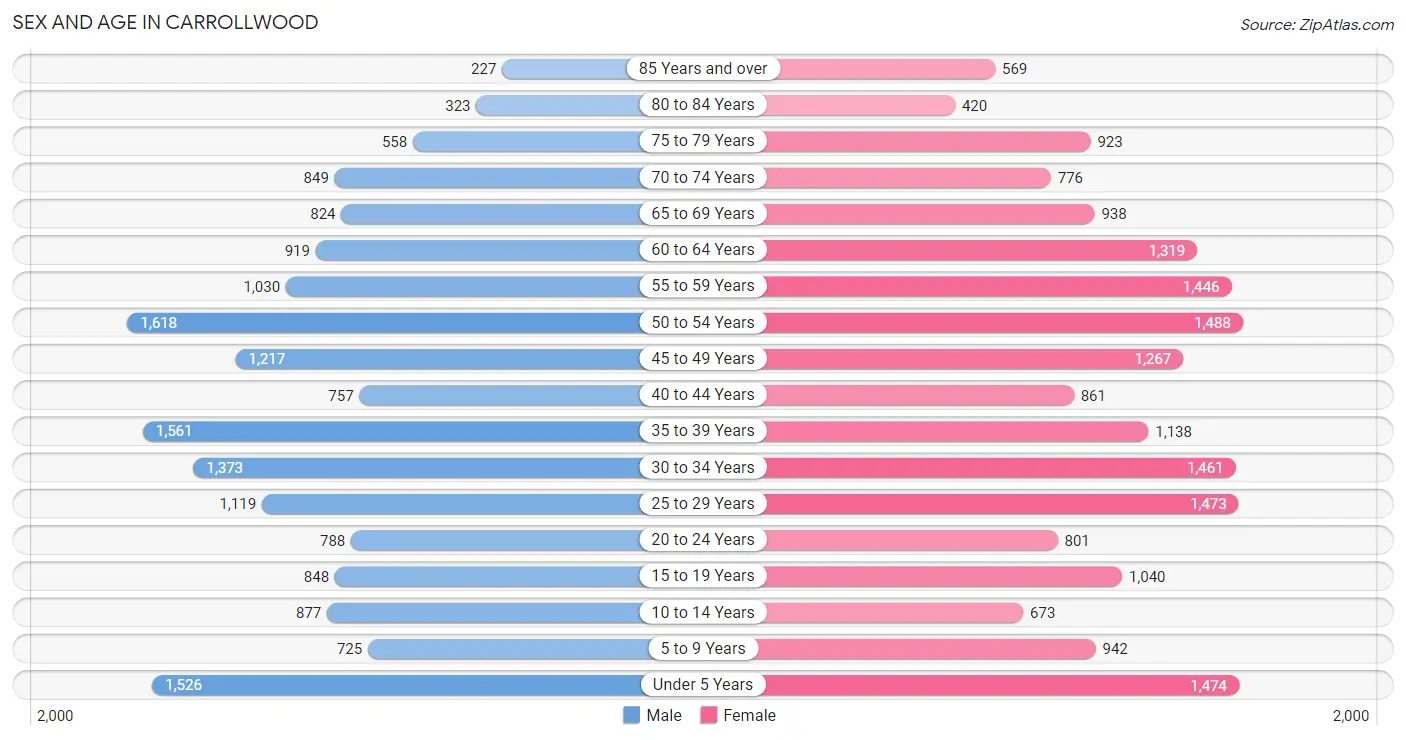
Sex and Age in Carrollwood
Sex and Age in Carrollwood
The most populous age groups in Carrollwood are 50 to 54 Years (1,618 | 9.4%) for men and 50 to 54 Years (1,488 | 7.8%) for women.
| Age Bracket | Male | Female |
| Under 5 Years | 1,526 (8.9%) | 1,474 (7.7%) |
| 5 to 9 Years | 725 (4.2%) | 942 (5.0%) |
| 10 to 14 Years | 877 (5.1%) | 673 (3.5%) |
| 15 to 19 Years | 848 (5.0%) | 1,040 (5.5%) |
| 20 to 24 Years | 788 (4.6%) | 801 (4.2%) |
| 25 to 29 Years | 1,119 (6.5%) | 1,473 (7.7%) |
| 30 to 34 Years | 1,373 (8.0%) | 1,461 (7.7%) |
| 35 to 39 Years | 1,561 (9.1%) | 1,138 (6.0%) |
| 40 to 44 Years | 757 (4.4%) | 861 (4.5%) |
| 45 to 49 Years | 1,217 (7.1%) | 1,267 (6.7%) |
| 50 to 54 Years | 1,618 (9.4%) | 1,488 (7.8%) |
| 55 to 59 Years | 1,030 (6.0%) | 1,446 (7.6%) |
| 60 to 64 Years | 919 (5.4%) | 1,319 (6.9%) |
| 65 to 69 Years | 824 (4.8%) | 938 (4.9%) |
| 70 to 74 Years | 849 (5.0%) | 776 (4.1%) |
| 75 to 79 Years | 558 (3.3%) | 923 (4.9%) |
| 80 to 84 Years | 323 (1.9%) | 420 (2.2%) |
| 85 Years and over | 227 (1.3%) | 569 (3.0%) |
| Total | 17,139 (100.0%) | 19,009 (100.0%) |
Families and Households in Carrollwood
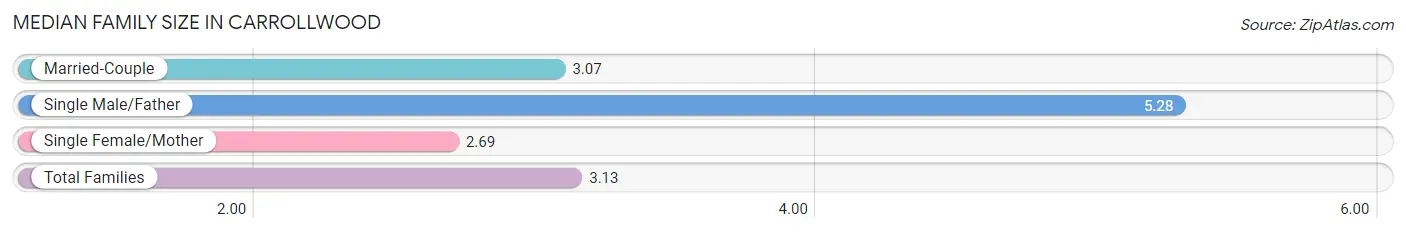
Median Family Size in Carrollwood
The median family size in Carrollwood is 3.13 persons per family, with single male/father families (519 | 5.8%) accounting for the largest median family size of 5.28 persons per family. On the other hand, single female/mother families (1,726 | 19.1%) represent the smallest median family size with 2.69 persons per family.
| Family Type | # Families | Family Size |
| Married-Couple | 6,771 (75.1%) | 3.07 |
| Single Male/Father | 519 (5.8%) | 5.28 |
| Single Female/Mother | 1,726 (19.1%) | 2.69 |
| Total Families | 9,016 (100.0%) | 3.13 |
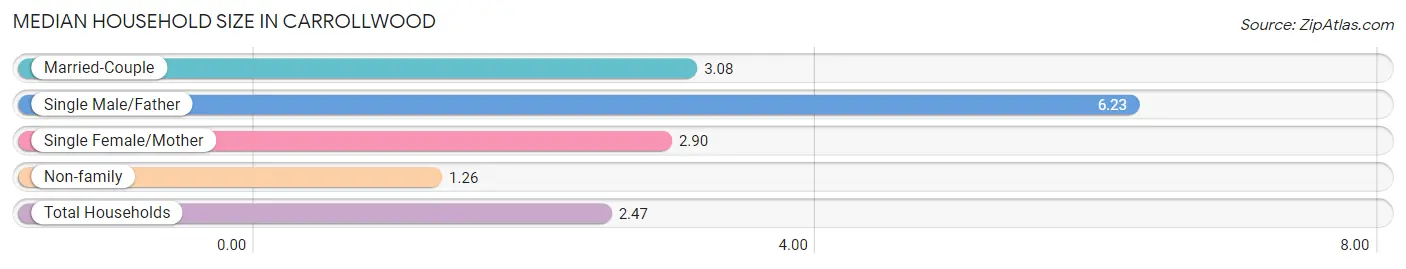
Median Household Size in Carrollwood
The median household size in Carrollwood is 2.47 persons per household, with single male/father households (519 | 3.6%) accounting for the largest median household size of 6.23 persons per household. non-family households (5,565 | 38.2%) represent the smallest median household size with 1.26 persons per household.
| Household Type | # Households | Household Size |
| Married-Couple | 6,771 (46.4%) | 3.08 |
| Single Male/Father | 519 (3.6%) | 6.23 |
| Single Female/Mother | 1,726 (11.8%) | 2.90 |
| Non-family | 5,565 (38.2%) | 1.26 |
| Total Households | 14,581 (100.0%) | 2.47 |
Household Size by Marriage Status in Carrollwood
Out of a total of 14,581 households in Carrollwood, 9,016 (61.8%) are family households, while 5,565 (38.2%) are nonfamily households. The most numerous type of family households are 2-person households, comprising 4,563, and the most common type of nonfamily households are 1-person households, comprising 4,332.
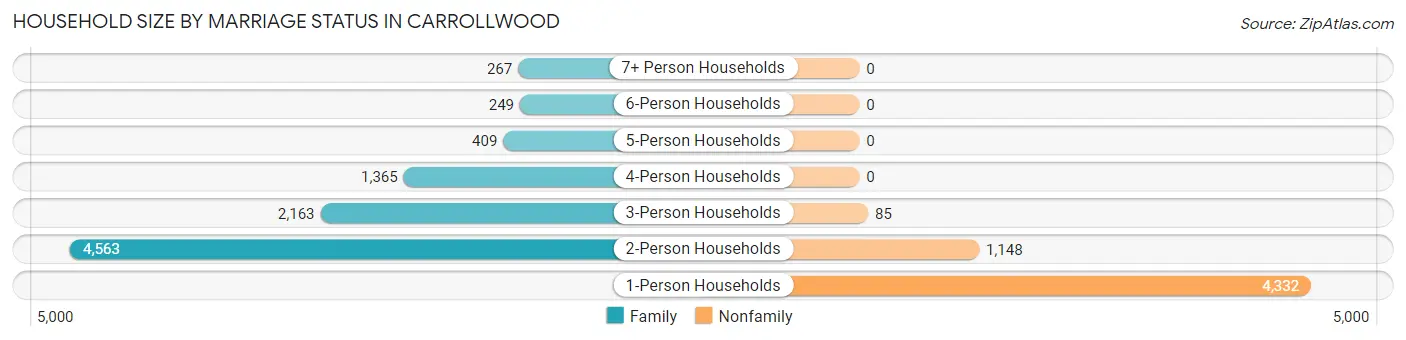
| Household Size | Family Households | Nonfamily Households |
| 1-Person Households | - | 4,332 (29.7%) |
| 2-Person Households | 4,563 (31.3%) | 1,148 (7.9%) |
| 3-Person Households | 2,163 (14.8%) | 85 (0.6%) |
| 4-Person Households | 1,365 (9.4%) | 0 (0.0%) |
| 5-Person Households | 409 (2.8%) | 0 (0.0%) |
| 6-Person Households | 249 (1.7%) | 0 (0.0%) |
| 7+ Person Households | 267 (1.8%) | 0 (0.0%) |
| Total | 9,016 (61.8%) | 5,565 (38.2%) |
Female Fertility in Carrollwood
Fertility by Age in Carrollwood
Average fertility rate in Carrollwood is 76.0 births per 1,000 women. Women in the age bracket of 20 to 34 years have the highest fertility rate with 128.0 births per 1,000 women. Women in the age bracket of 20 to 34 years acount for 77.0% of all women with births.
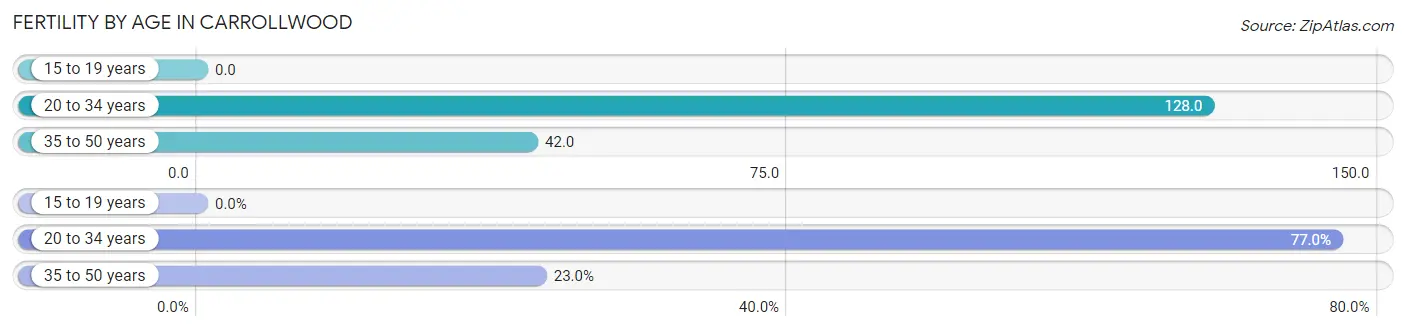
| Age Bracket | Women with Births | Births / 1,000 Women |
| 15 to 19 years | 0 (0.0%) | 0.0 |
| 20 to 34 years | 479 (77.0%) | 128.0 |
| 35 to 50 years | 143 (23.0%) | 42.0 |
| Total | 622 (100.0%) | 76.0 |
Fertility by Age by Marriage Status in Carrollwood
38.6% of women with births (622) in Carrollwood are married. The highest percentage of unmarried women with births falls into 20 to 34 years age bracket with 76.0% of them unmarried at the time of birth, while the lowest percentage of unmarried women with births belong to 35 to 50 years age bracket with 12.6% of them unmarried.
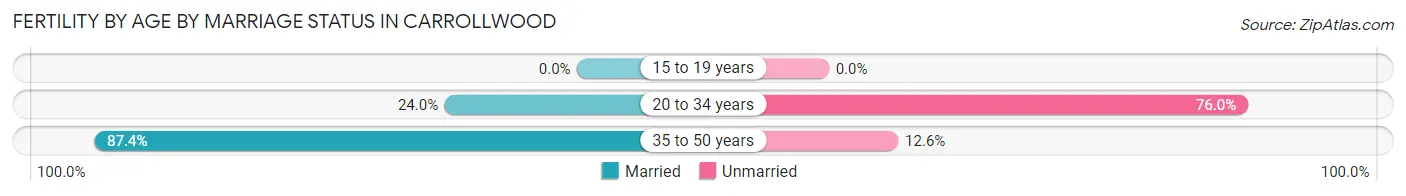
| Age Bracket | Married | Unmarried |
| 15 to 19 years | 0 (0.0%) | 0 (0.0%) |
| 20 to 34 years | 115 (24.0%) | 364 (76.0%) |
| 35 to 50 years | 125 (87.4%) | 18 (12.6%) |
| Total | 240 (38.6%) | 382 (61.4%) |
Fertility by Education in Carrollwood
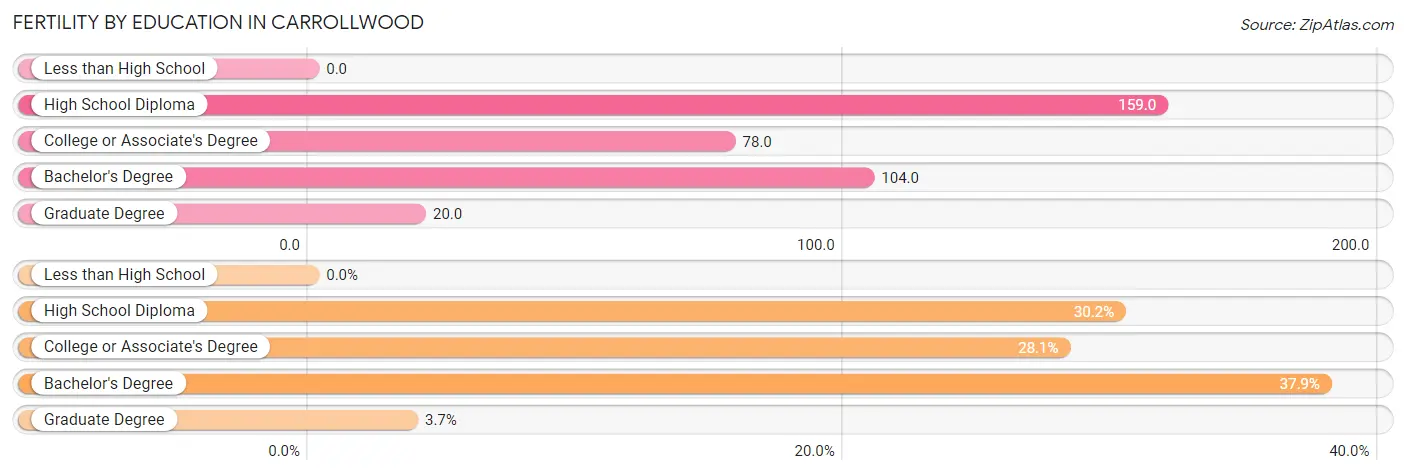
| Educational Attainment | Women with Births | Births / 1,000 Women |
| Less than High School | 0 (0.0%) | 0.0 |
| High School Diploma | 188 (30.2%) | 159.0 |
| College or Associate's Degree | 175 (28.1%) | 78.0 |
| Bachelor's Degree | 236 (37.9%) | 104.0 |
| Graduate Degree | 23 (3.7%) | 20.0 |
| Total | 622 (100.0%) | 76.0 |
Fertility by Education by Marriage Status in Carrollwood
61.4% of women with births in Carrollwood are unmarried. Women with the educational attainment of graduate degree are most likely to be married with 73.9% of them married at childbirth, while women with the educational attainment of high school diploma are least likely to be married with 73.4% of them unmarried at childbirth.
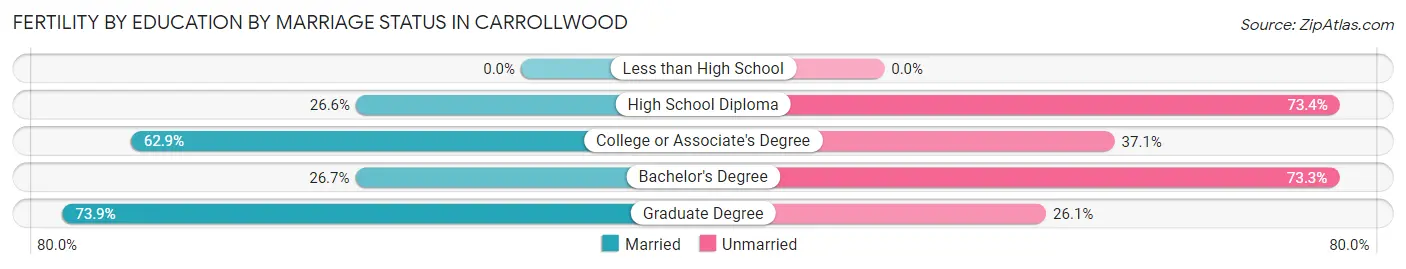
| Educational Attainment | Married | Unmarried |
| Less than High School | 0 (0.0%) | 0 (0.0%) |
| High School Diploma | 50 (26.6%) | 138 (73.4%) |
| College or Associate's Degree | 110 (62.9%) | 65 (37.1%) |
| Bachelor's Degree | 63 (26.7%) | 173 (73.3%) |
| Graduate Degree | 17 (73.9%) | 6 (26.1%) |
| Total | 240 (38.6%) | 382 (61.4%) |
Employment Characteristics in Carrollwood
Employment by Class of Employer in Carrollwood
Among the 18,083 employed individuals in Carrollwood, private company employees (13,193 | 73.0%), not-for-profit organizations (1,442 | 8.0%), and self-employed (incorporated) (981 | 5.4%) make up the most common classes of employment.
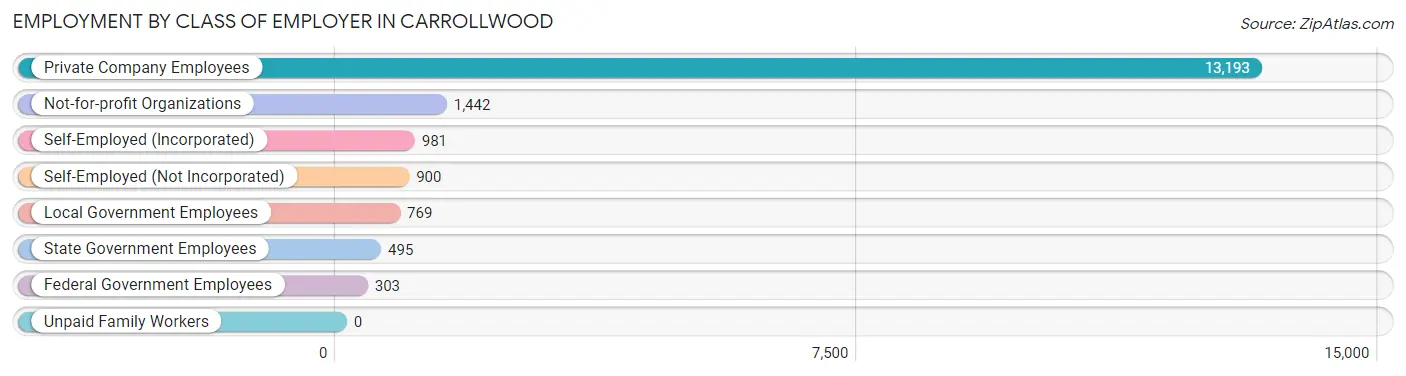
| Employer Class | # Employees | % Employees |
| Private Company Employees | 13,193 | 73.0% |
| Self-Employed (Incorporated) | 981 | 5.4% |
| Self-Employed (Not Incorporated) | 900 | 5.0% |
| Not-for-profit Organizations | 1,442 | 8.0% |
| Local Government Employees | 769 | 4.3% |
| State Government Employees | 495 | 2.7% |
| Federal Government Employees | 303 | 1.7% |
| Unpaid Family Workers | 0 | 0.0% |
| Total | 18,083 | 100.0% |
Employment Status by Age in Carrollwood
According to the labor force statistics for Carrollwood, out of the total population over 16 years of age (29,468), 65.3% or 19,243 individuals are in the labor force, with 4.0% or 770 of them unemployed. The age group with the highest labor force participation rate is 35 to 44 years, with 89.2% or 3,851 individuals in the labor force. Within the labor force, the 16 to 19 years age range has the highest percentage of unemployed individuals, with 29.2% or 155 of them being unemployed.
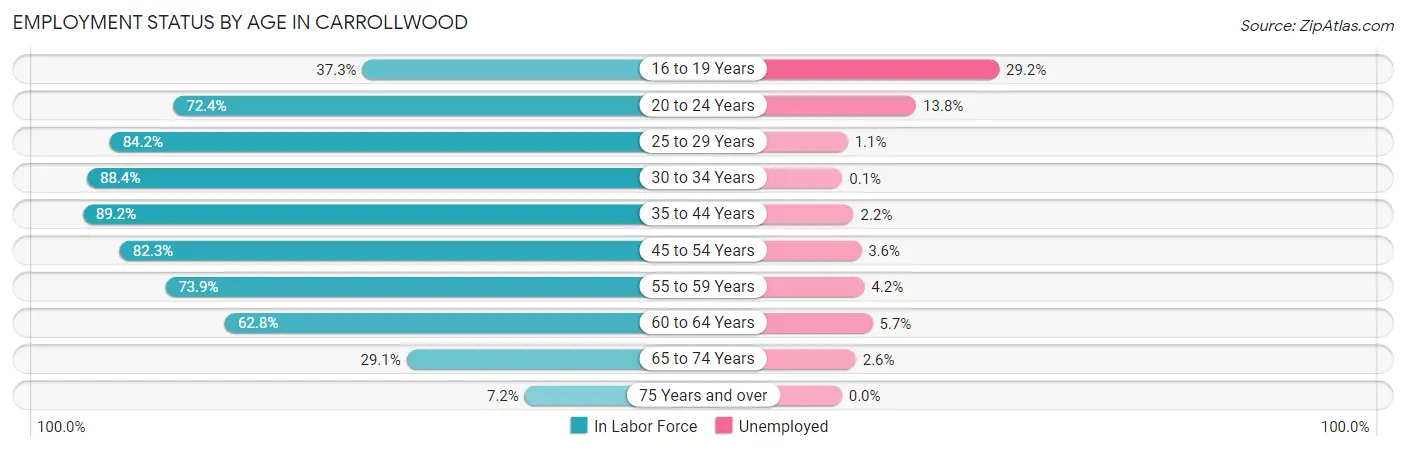
| Age Bracket | In Labor Force | Unemployed |
| 16 to 19 Years | 532 (37.3%) | 155 (29.2%) |
| 20 to 24 Years | 1,150 (72.4%) | 159 (13.8%) |
| 25 to 29 Years | 2,182 (84.2%) | 24 (1.1%) |
| 30 to 34 Years | 2,505 (88.4%) | 3 (0.1%) |
| 35 to 44 Years | 3,851 (89.2%) | 85 (2.2%) |
| 45 to 54 Years | 4,601 (82.3%) | 166 (3.6%) |
| 55 to 59 Years | 1,830 (73.9%) | 77 (4.2%) |
| 60 to 64 Years | 1,405 (62.8%) | 80 (5.7%) |
| 65 to 74 Years | 986 (29.1%) | 26 (2.6%) |
| 75 Years and over | 217 (7.2%) | 0 (0.0%) |
| Total | 19,243 (65.3%) | 770 (4.0%) |
Employment Status by Educational Attainment in Carrollwood
According to labor force statistics for Carrollwood, 81.7% of individuals (16,378) out of the total population between 25 and 64 years of age (20,047) are in the labor force, with 2.6% or 426 of them being unemployed. The group with the highest labor force participation rate are those with the educational attainment of bachelor's degree or higher, with 86.1% or 7,522 individuals in the labor force. Within the labor force, individuals with less than high school education have the highest percentage of unemployment, with 10.3% or 84 of them being unemployed.
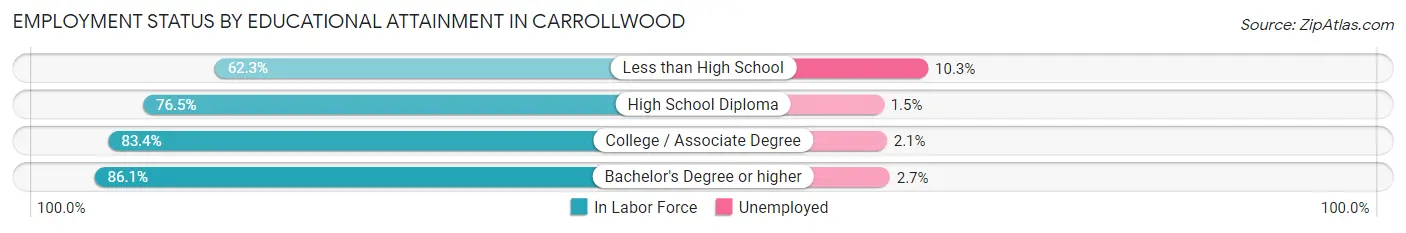
| Educational Attainment | In Labor Force | Unemployed |
| Less than High School | 812 (62.3%) | 134 (10.3%) |
| High School Diploma | 3,432 (76.5%) | 67 (1.5%) |
| College / Associate Degree | 4,605 (83.4%) | 116 (2.1%) |
| Bachelor's Degree or higher | 7,522 (86.1%) | 236 (2.7%) |
| Total | 16,378 (81.7%) | 521 (2.6%) |
Employment Occupations by Sex in Carrollwood
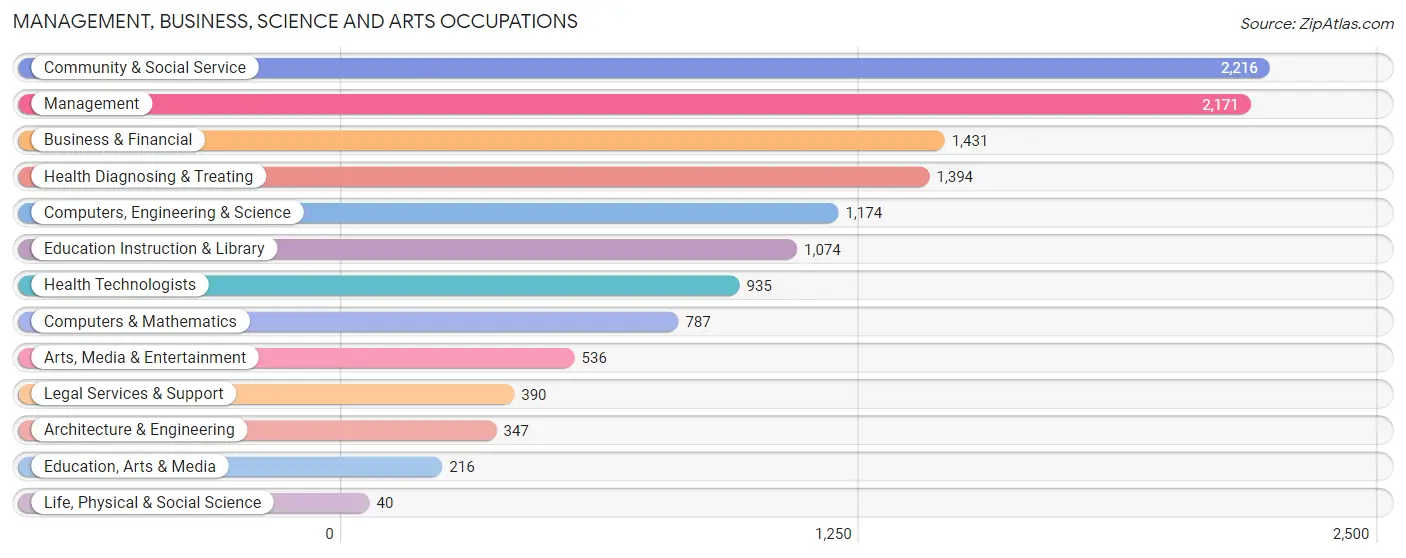
Management, Business, Science and Arts Occupations
The most common Management, Business, Science and Arts occupations in Carrollwood are Community & Social Service (2,216 | 12.0%), Management (2,171 | 11.8%), Business & Financial (1,431 | 7.8%), Health Diagnosing & Treating (1,394 | 7.5%), and Computers, Engineering & Science (1,174 | 6.4%).
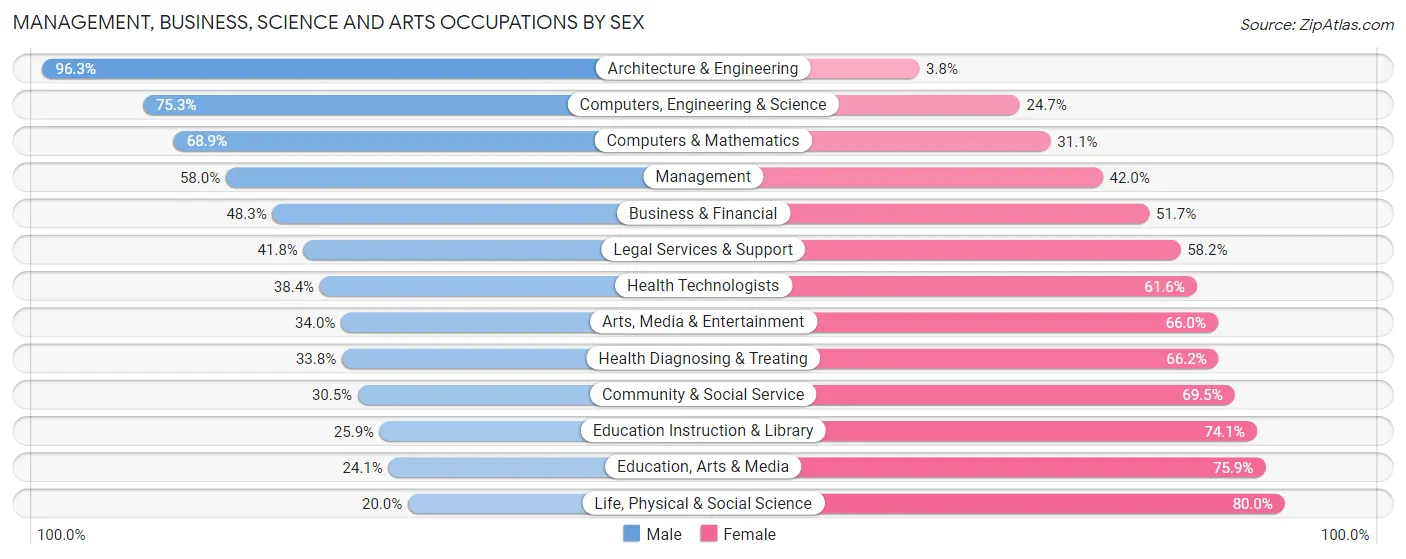
Management, Business, Science and Arts Occupations by Sex
Within the Management, Business, Science and Arts occupations in Carrollwood, the most male-oriented occupations are Architecture & Engineering (96.3%), Computers, Engineering & Science (75.3%), and Computers & Mathematics (68.9%), while the most female-oriented occupations are Life, Physical & Social Science (80.0%), Education, Arts & Media (75.9%), and Education Instruction & Library (74.1%).
| Occupation | Male | Female |
| Management | 1,259 (58.0%) | 912 (42.0%) |
| Business & Financial | 691 (48.3%) | 740 (51.7%) |
| Computers, Engineering & Science | 884 (75.3%) | 290 (24.7%) |
| Computers & Mathematics | 542 (68.9%) | 245 (31.1%) |
| Architecture & Engineering | 334 (96.3%) | 13 (3.7%) |
| Life, Physical & Social Science | 8 (20.0%) | 32 (80.0%) |
| Community & Social Service | 675 (30.5%) | 1,541 (69.5%) |
| Education, Arts & Media | 52 (24.1%) | 164 (75.9%) |
| Legal Services & Support | 163 (41.8%) | 227 (58.2%) |
| Education Instruction & Library | 278 (25.9%) | 796 (74.1%) |
| Arts, Media & Entertainment | 182 (34.0%) | 354 (66.0%) |
| Health Diagnosing & Treating | 471 (33.8%) | 923 (66.2%) |
| Health Technologists | 359 (38.4%) | 576 (61.6%) |
| Total (Category) | 3,980 (47.5%) | 4,406 (52.5%) |
| Total (Overall) | 9,649 (52.3%) | 8,803 (47.7%) |
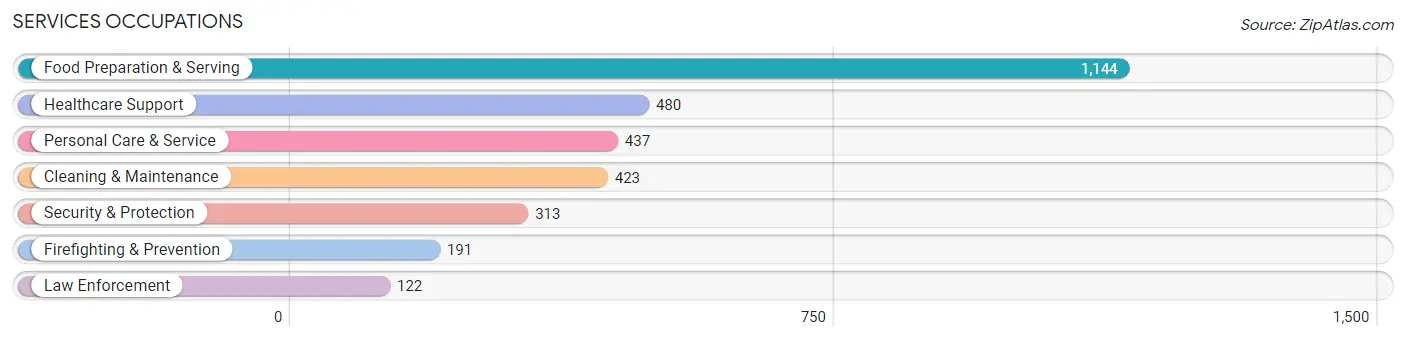
Services Occupations
The most common Services occupations in Carrollwood are Food Preparation & Serving (1,144 | 6.2%), Healthcare Support (480 | 2.6%), Personal Care & Service (437 | 2.4%), Cleaning & Maintenance (423 | 2.3%), and Security & Protection (313 | 1.7%).
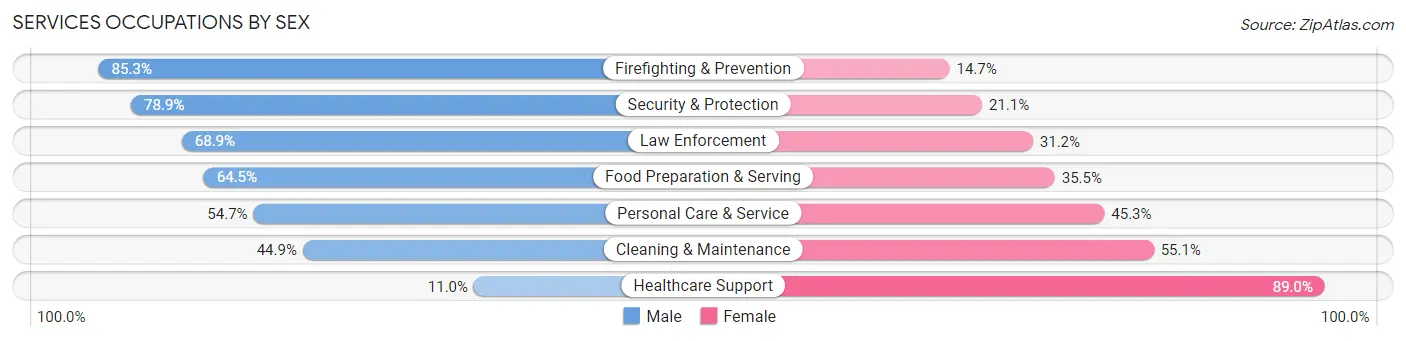
Services Occupations by Sex
Within the Services occupations in Carrollwood, the most male-oriented occupations are Firefighting & Prevention (85.3%), Security & Protection (78.9%), and Law Enforcement (68.9%), while the most female-oriented occupations are Healthcare Support (89.0%), Cleaning & Maintenance (55.1%), and Personal Care & Service (45.3%).
| Occupation | Male | Female |
| Healthcare Support | 53 (11.0%) | 427 (89.0%) |
| Security & Protection | 247 (78.9%) | 66 (21.1%) |
| Firefighting & Prevention | 163 (85.3%) | 28 (14.7%) |
| Law Enforcement | 84 (68.9%) | 38 (31.1%) |
| Food Preparation & Serving | 738 (64.5%) | 406 (35.5%) |
| Cleaning & Maintenance | 190 (44.9%) | 233 (55.1%) |
| Personal Care & Service | 239 (54.7%) | 198 (45.3%) |
| Total (Category) | 1,467 (52.4%) | 1,330 (47.5%) |
| Total (Overall) | 9,649 (52.3%) | 8,803 (47.7%) |
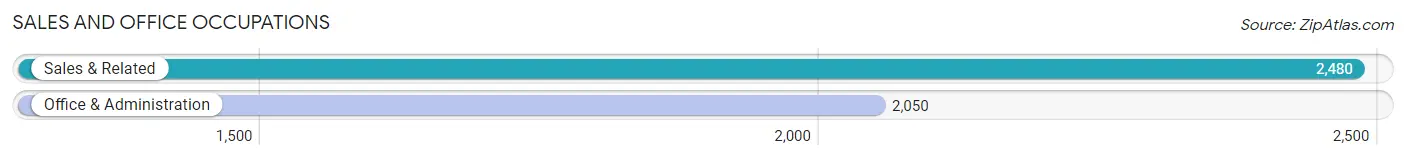
Sales and Office Occupations
The most common Sales and Office occupations in Carrollwood are Sales & Related (2,480 | 13.4%), and Office & Administration (2,050 | 11.1%).
Sales and Office Occupations by Sex
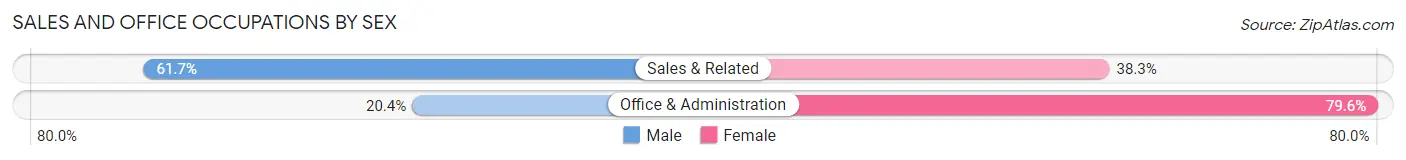
| Occupation | Male | Female |
| Sales & Related | 1,530 (61.7%) | 950 (38.3%) |
| Office & Administration | 418 (20.4%) | 1,632 (79.6%) |
| Total (Category) | 1,948 (43.0%) | 2,582 (57.0%) |
| Total (Overall) | 9,649 (52.3%) | 8,803 (47.7%) |
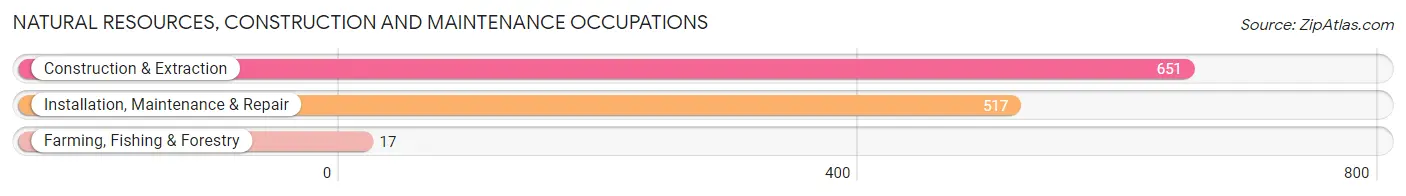
Natural Resources, Construction and Maintenance Occupations
The most common Natural Resources, Construction and Maintenance occupations in Carrollwood are Construction & Extraction (651 | 3.5%), Installation, Maintenance & Repair (517 | 2.8%), and Farming, Fishing & Forestry (17 | 0.1%).
Natural Resources, Construction and Maintenance Occupations by Sex
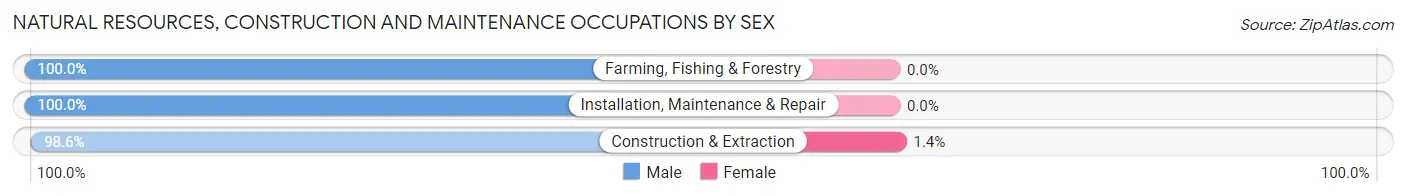
| Occupation | Male | Female |
| Farming, Fishing & Forestry | 17 (100.0%) | 0 (0.0%) |
| Construction & Extraction | 642 (98.6%) | 9 (1.4%) |
| Installation, Maintenance & Repair | 517 (100.0%) | 0 (0.0%) |
| Total (Category) | 1,176 (99.2%) | 9 (0.8%) |
| Total (Overall) | 9,649 (52.3%) | 8,803 (47.7%) |
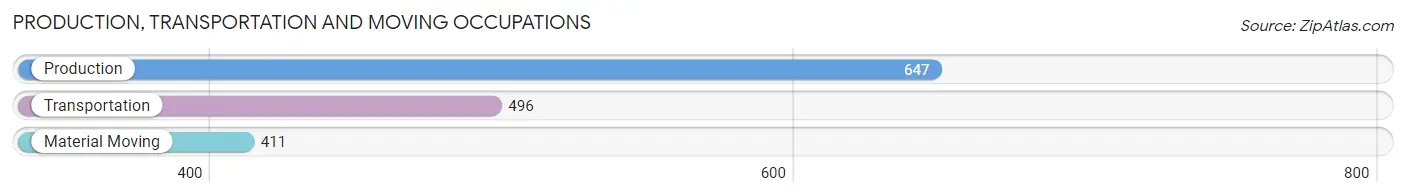
Production, Transportation and Moving Occupations
The most common Production, Transportation and Moving occupations in Carrollwood are Production (647 | 3.5%), Transportation (496 | 2.7%), and Material Moving (411 | 2.2%).
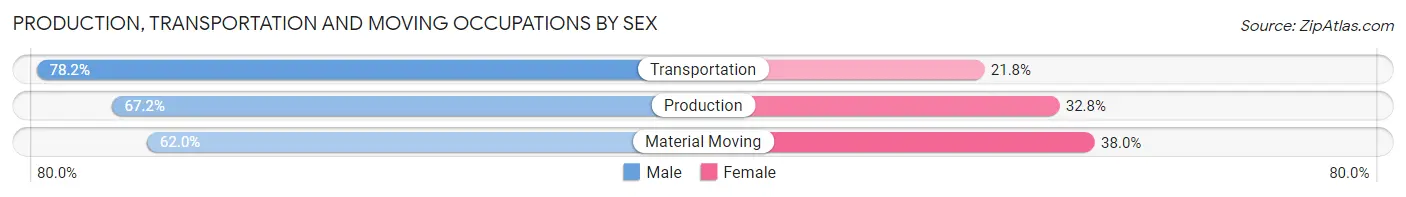
Production, Transportation and Moving Occupations by Sex
| Occupation | Male | Female |
| Production | 435 (67.2%) | 212 (32.8%) |
| Transportation | 388 (78.2%) | 108 (21.8%) |
| Material Moving | 255 (62.0%) | 156 (38.0%) |
| Total (Category) | 1,078 (69.4%) | 476 (30.6%) |
| Total (Overall) | 9,649 (52.3%) | 8,803 (47.7%) |
Employment Industries by Sex in Carrollwood
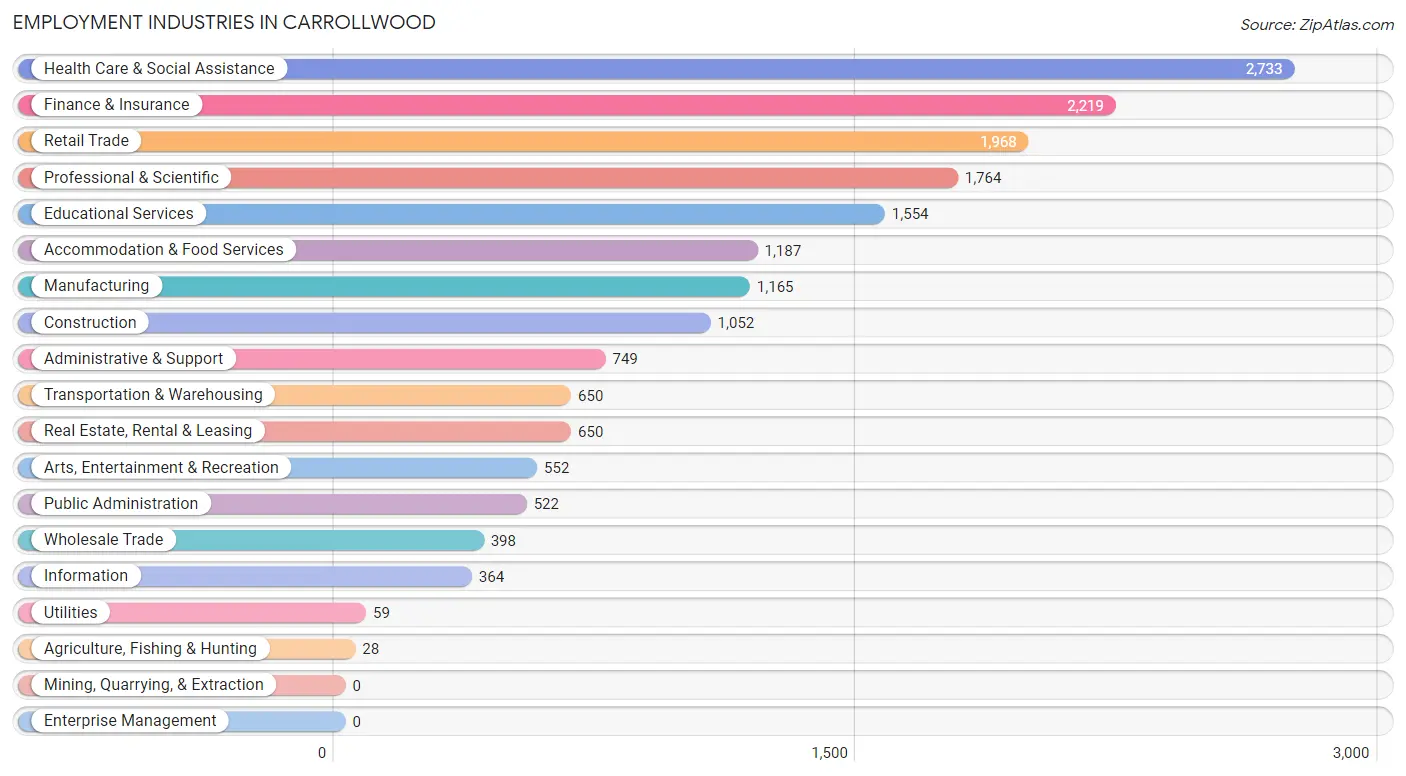
Employment Industries in Carrollwood
The major employment industries in Carrollwood include Health Care & Social Assistance (2,733 | 14.8%), Finance & Insurance (2,219 | 12.0%), Retail Trade (1,968 | 10.7%), Professional & Scientific (1,764 | 9.6%), and Educational Services (1,554 | 8.4%).
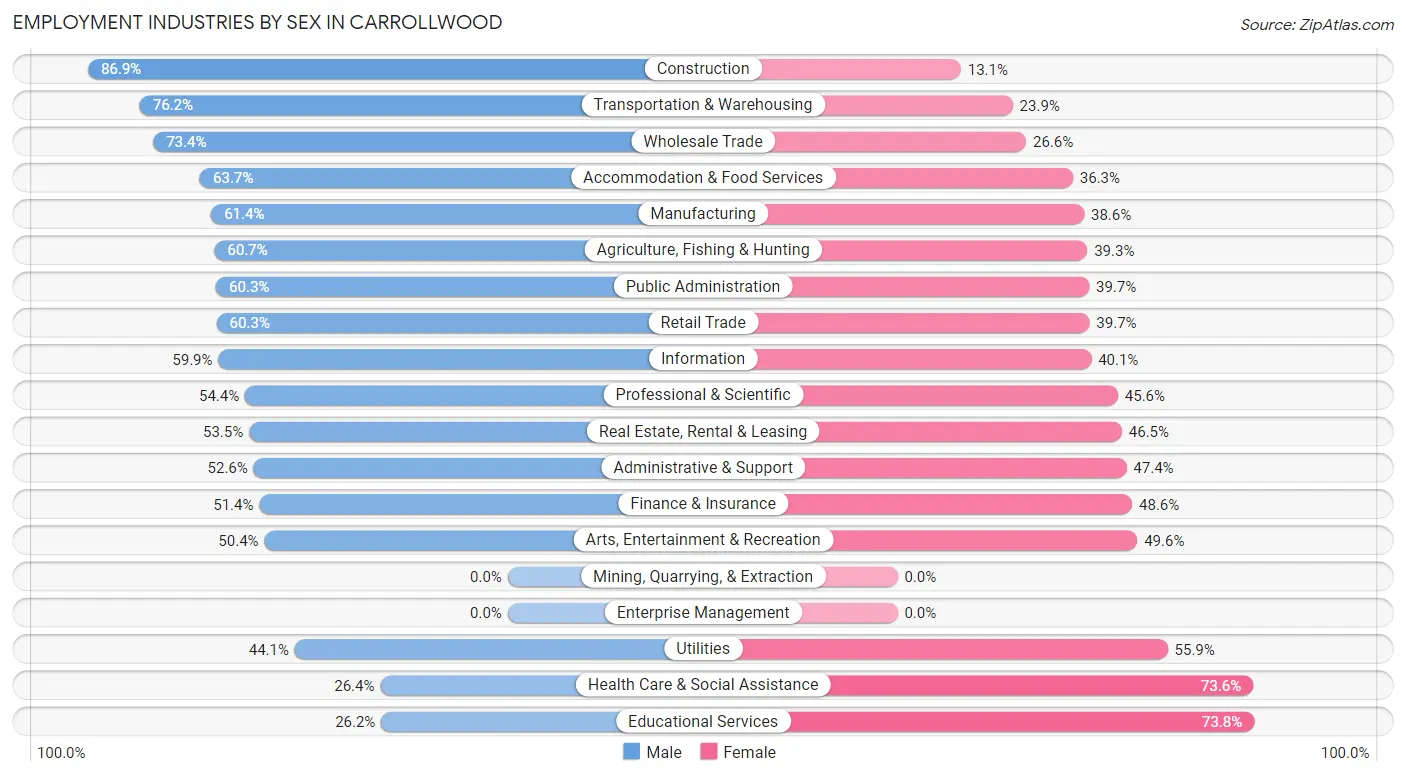
Employment Industries by Sex in Carrollwood
The Carrollwood industries that see more men than women are Construction (86.9%), Transportation & Warehousing (76.1%), and Wholesale Trade (73.4%), whereas the industries that tend to have a higher number of women are Educational Services (73.8%), Health Care & Social Assistance (73.6%), and Utilities (55.9%).
| Industry | Male | Female |
| Agriculture, Fishing & Hunting | 17 (60.7%) | 11 (39.3%) |
| Mining, Quarrying, & Extraction | 0 (0.0%) | 0 (0.0%) |
| Construction | 914 (86.9%) | 138 (13.1%) |
| Manufacturing | 715 (61.4%) | 450 (38.6%) |
| Wholesale Trade | 292 (73.4%) | 106 (26.6%) |
| Retail Trade | 1,186 (60.3%) | 782 (39.7%) |
| Transportation & Warehousing | 495 (76.1%) | 155 (23.8%) |
| Utilities | 26 (44.1%) | 33 (55.9%) |
| Information | 218 (59.9%) | 146 (40.1%) |
| Finance & Insurance | 1,141 (51.4%) | 1,078 (48.6%) |
| Real Estate, Rental & Leasing | 348 (53.5%) | 302 (46.5%) |
| Professional & Scientific | 959 (54.4%) | 805 (45.6%) |
| Enterprise Management | 0 (0.0%) | 0 (0.0%) |
| Administrative & Support | 394 (52.6%) | 355 (47.4%) |
| Educational Services | 407 (26.2%) | 1,147 (73.8%) |
| Health Care & Social Assistance | 721 (26.4%) | 2,012 (73.6%) |
| Arts, Entertainment & Recreation | 278 (50.4%) | 274 (49.6%) |
| Accommodation & Food Services | 756 (63.7%) | 431 (36.3%) |
| Public Administration | 315 (60.3%) | 207 (39.7%) |
| Total | 9,649 (52.3%) | 8,803 (47.7%) |
Education in Carrollwood
School Enrollment in Carrollwood
The most common levels of schooling among the 7,952 students in Carrollwood are college / undergraduate (2,044 | 25.7%), high school (1,833 | 23.1%), and elementary school (1,288 | 16.2%).
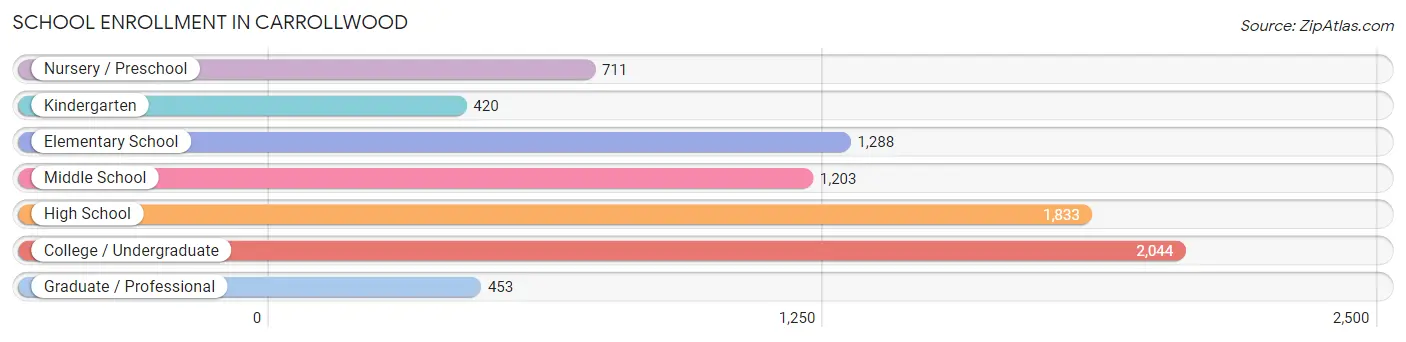
| School Level | # Students | % Students |
| Nursery / Preschool | 711 | 8.9% |
| Kindergarten | 420 | 5.3% |
| Elementary School | 1,288 | 16.2% |
| Middle School | 1,203 | 15.1% |
| High School | 1,833 | 23.1% |
| College / Undergraduate | 2,044 | 25.7% |
| Graduate / Professional | 453 | 5.7% |
| Total | 7,952 | 100.0% |
School Enrollment by Age by Funding Source in Carrollwood
Out of a total of 7,952 students who are enrolled in schools in Carrollwood, 2,179 (27.4%) attend a private institution, while the remaining 5,773 (72.6%) are enrolled in public schools. The age group of 3 to 4 year olds has the highest likelihood of being enrolled in private schools, with 301 (54.6% in the age bracket) enrolled. Conversely, the age group of 25 to 34 year olds has the lowest likelihood of being enrolled in a private school, with 627 (79.9% in the age bracket) attending a public institution.
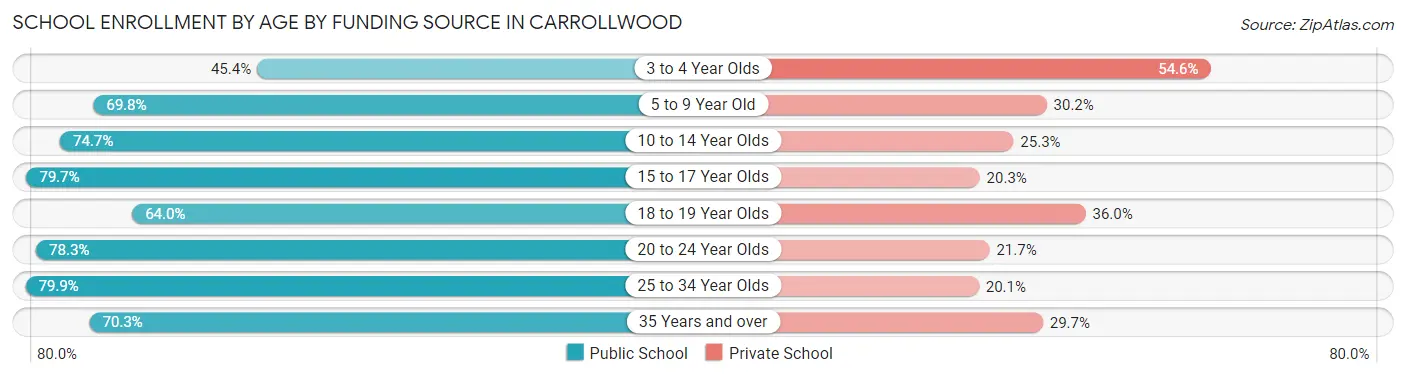
| Age Bracket | Public School | Private School |
| 3 to 4 Year Olds | 250 (45.4%) | 301 (54.6%) |
| 5 to 9 Year Old | 1,149 (69.8%) | 498 (30.2%) |
| 10 to 14 Year Olds | 1,158 (74.7%) | 392 (25.3%) |
| 15 to 17 Year Olds | 1,102 (79.7%) | 280 (20.3%) |
| 18 to 19 Year Olds | 213 (64.0%) | 120 (36.0%) |
| 20 to 24 Year Olds | 735 (78.3%) | 204 (21.7%) |
| 25 to 34 Year Olds | 627 (79.9%) | 158 (20.1%) |
| 35 Years and over | 538 (70.3%) | 227 (29.7%) |
| Total | 5,773 (72.6%) | 2,179 (27.4%) |
Educational Attainment by Field of Study in Carrollwood
Business (3,067 | 25.3%), education (1,705 | 14.1%), social sciences (1,098 | 9.0%), science & technology (1,069 | 8.8%), and engineering (606 | 5.0%) are the most common fields of study among 12,126 individuals in Carrollwood who have obtained a bachelor's degree or higher.
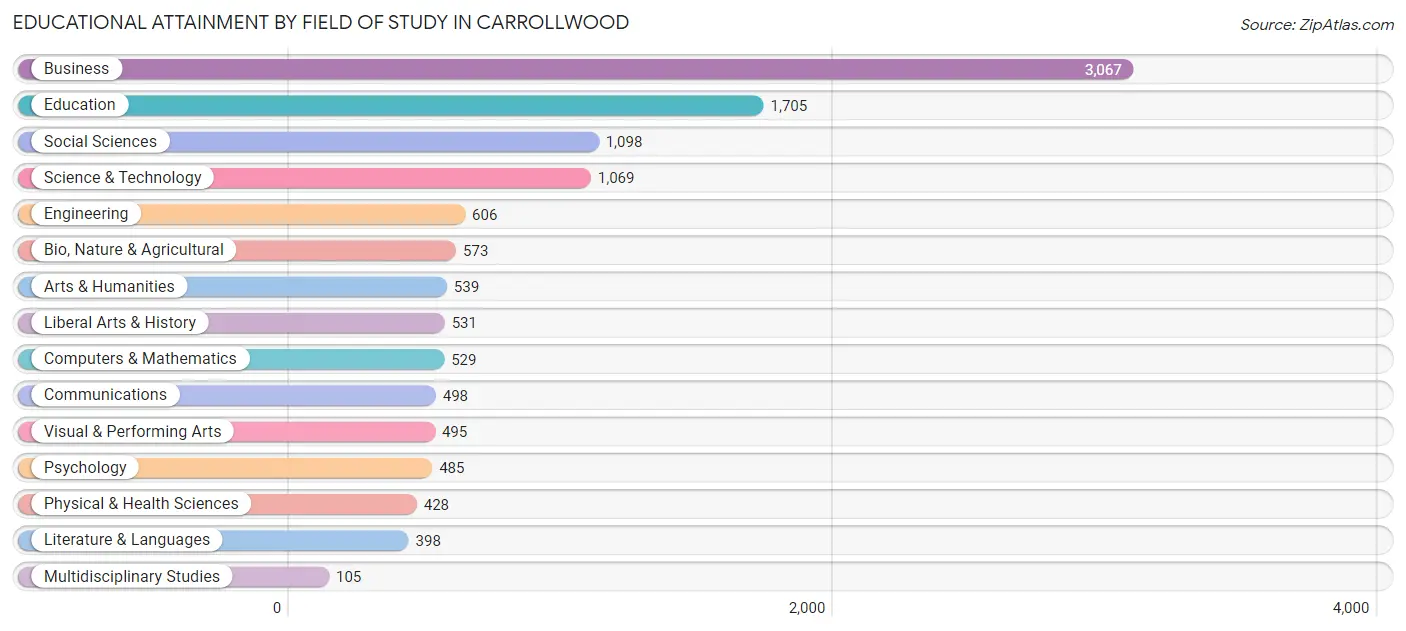
| Field of Study | # Graduates | % Graduates |
| Computers & Mathematics | 529 | 4.4% |
| Bio, Nature & Agricultural | 573 | 4.7% |
| Physical & Health Sciences | 428 | 3.5% |
| Psychology | 485 | 4.0% |
| Social Sciences | 1,098 | 9.0% |
| Engineering | 606 | 5.0% |
| Multidisciplinary Studies | 105 | 0.9% |
| Science & Technology | 1,069 | 8.8% |
| Business | 3,067 | 25.3% |
| Education | 1,705 | 14.1% |
| Literature & Languages | 398 | 3.3% |
| Liberal Arts & History | 531 | 4.4% |
| Visual & Performing Arts | 495 | 4.1% |
| Communications | 498 | 4.1% |
| Arts & Humanities | 539 | 4.4% |
| Total | 12,126 | 100.0% |
Transportation & Commute in Carrollwood
Vehicle Availability by Sex in Carrollwood
The most prevalent vehicle ownership categories in Carrollwood are males with 2 vehicles (4,588, accounting for 48.1%) and females with 2 vehicles (3,735, making up 53.6%).
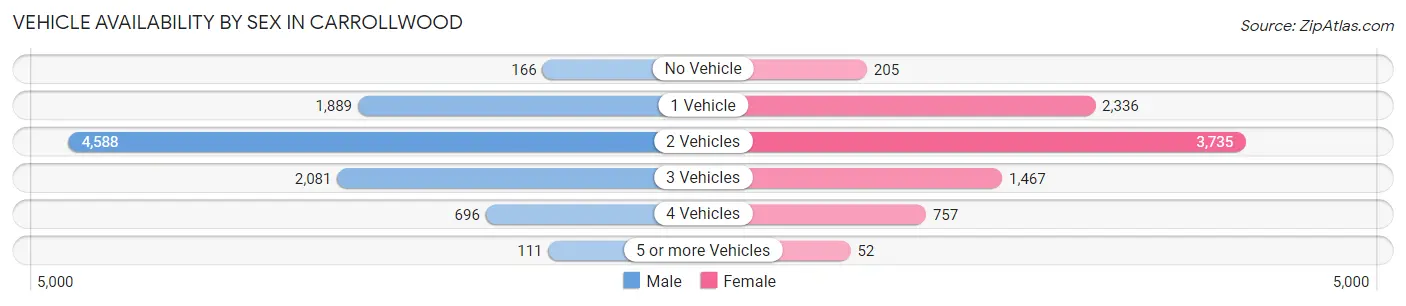
| Vehicles Available | Male | Female |
| No Vehicle | 166 (1.7%) | 205 (2.4%) |
| 1 Vehicle | 1,889 (19.8%) | 2,336 (27.3%) |
| 2 Vehicles | 4,588 (48.1%) | 3,735 (43.7%) |
| 3 Vehicles | 2,081 (21.8%) | 1,467 (17.2%) |
| 4 Vehicles | 696 (7.3%) | 757 (8.8%) |
| 5 or more Vehicles | 111 (1.2%) | 52 (0.6%) |
| Total | 9,531 (100.0%) | 8,552 (100.0%) |
Commute Time in Carrollwood
The most frequently occuring commute durations in Carrollwood are 30 to 34 minutes (3,441 commuters, 23.1%), 15 to 19 minutes (2,087 commuters, 14.0%), and 20 to 24 minutes (2,042 commuters, 13.7%).
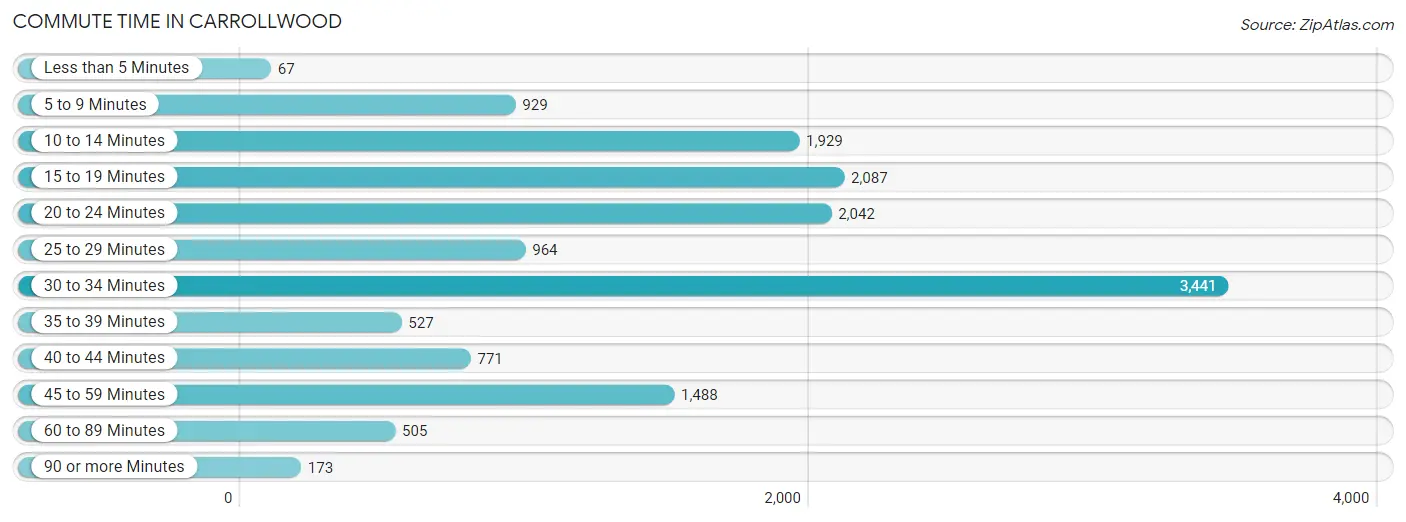
| Commute Time | # Commuters | % Commuters |
| Less than 5 Minutes | 67 | 0.4% |
| 5 to 9 Minutes | 929 | 6.2% |
| 10 to 14 Minutes | 1,929 | 12.9% |
| 15 to 19 Minutes | 2,087 | 14.0% |
| 20 to 24 Minutes | 2,042 | 13.7% |
| 25 to 29 Minutes | 964 | 6.5% |
| 30 to 34 Minutes | 3,441 | 23.1% |
| 35 to 39 Minutes | 527 | 3.5% |
| 40 to 44 Minutes | 771 | 5.2% |
| 45 to 59 Minutes | 1,488 | 10.0% |
| 60 to 89 Minutes | 505 | 3.4% |
| 90 or more Minutes | 173 | 1.2% |
Commute Time by Sex in Carrollwood
The most common commute times in Carrollwood are 30 to 34 minutes (1,994 commuters, 24.6%) for males and 30 to 34 minutes (1,447 commuters, 21.2%) for females.
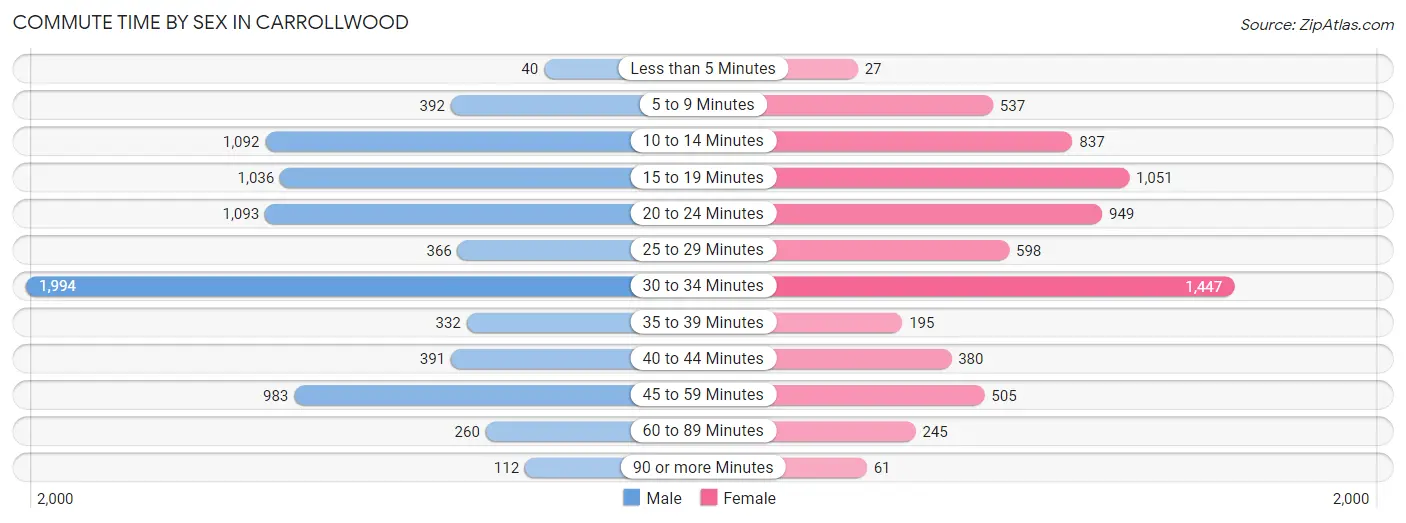
| Commute Time | Male | Female |
| Less than 5 Minutes | 40 (0.5%) | 27 (0.4%) |
| 5 to 9 Minutes | 392 (4.8%) | 537 (7.9%) |
| 10 to 14 Minutes | 1,092 (13.5%) | 837 (12.2%) |
| 15 to 19 Minutes | 1,036 (12.8%) | 1,051 (15.4%) |
| 20 to 24 Minutes | 1,093 (13.5%) | 949 (13.9%) |
| 25 to 29 Minutes | 366 (4.5%) | 598 (8.7%) |
| 30 to 34 Minutes | 1,994 (24.6%) | 1,447 (21.2%) |
| 35 to 39 Minutes | 332 (4.1%) | 195 (2.9%) |
| 40 to 44 Minutes | 391 (4.8%) | 380 (5.6%) |
| 45 to 59 Minutes | 983 (12.1%) | 505 (7.4%) |
| 60 to 89 Minutes | 260 (3.2%) | 245 (3.6%) |
| 90 or more Minutes | 112 (1.4%) | 61 (0.9%) |
Time of Departure to Work by Sex in Carrollwood
The most frequent times of departure to work in Carrollwood are 7:00 AM to 7:29 AM (1,182, 14.6%) for males and 7:00 AM to 7:29 AM (1,232, 18.0%) for females.
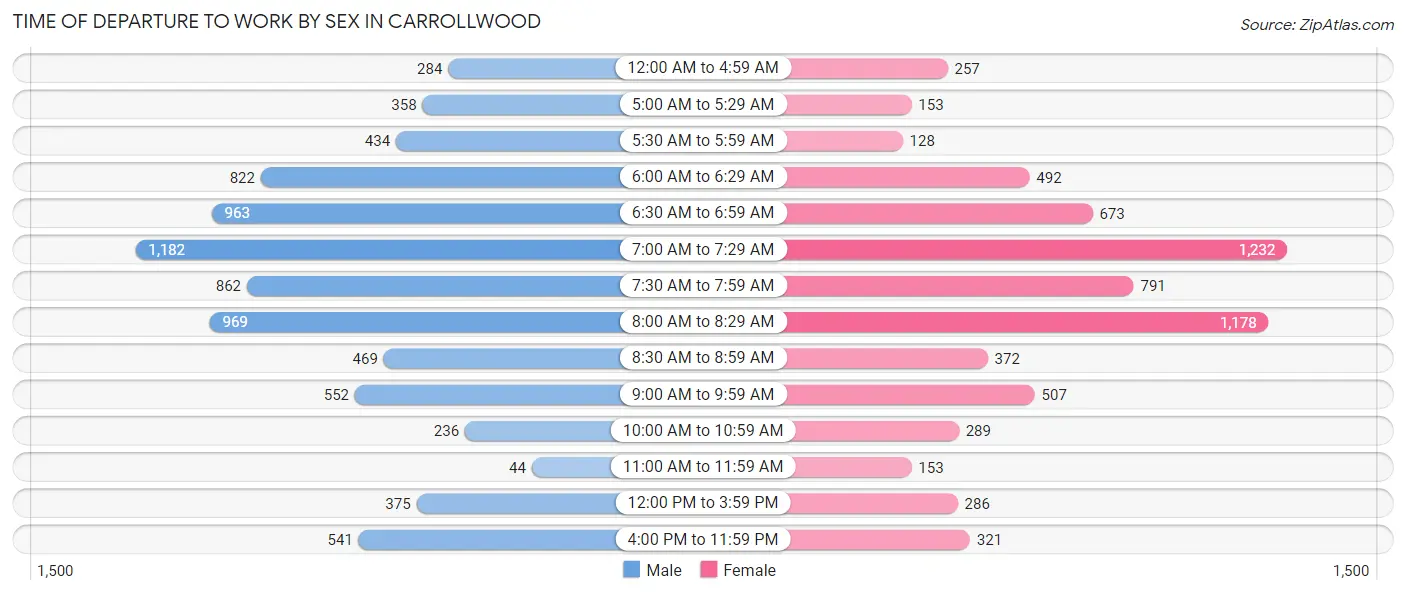
| Time of Departure | Male | Female |
| 12:00 AM to 4:59 AM | 284 (3.5%) | 257 (3.8%) |
| 5:00 AM to 5:29 AM | 358 (4.4%) | 153 (2.2%) |
| 5:30 AM to 5:59 AM | 434 (5.4%) | 128 (1.9%) |
| 6:00 AM to 6:29 AM | 822 (10.2%) | 492 (7.2%) |
| 6:30 AM to 6:59 AM | 963 (11.9%) | 673 (9.9%) |
| 7:00 AM to 7:29 AM | 1,182 (14.6%) | 1,232 (18.0%) |
| 7:30 AM to 7:59 AM | 862 (10.6%) | 791 (11.6%) |
| 8:00 AM to 8:29 AM | 969 (12.0%) | 1,178 (17.2%) |
| 8:30 AM to 8:59 AM | 469 (5.8%) | 372 (5.4%) |
| 9:00 AM to 9:59 AM | 552 (6.8%) | 507 (7.4%) |
| 10:00 AM to 10:59 AM | 236 (2.9%) | 289 (4.2%) |
| 11:00 AM to 11:59 AM | 44 (0.5%) | 153 (2.2%) |
| 12:00 PM to 3:59 PM | 375 (4.6%) | 286 (4.2%) |
| 4:00 PM to 11:59 PM | 541 (6.7%) | 321 (4.7%) |
| Total | 8,091 (100.0%) | 6,832 (100.0%) |
Housing Occupancy in Carrollwood
Occupancy by Ownership in Carrollwood
Of the total 14,581 dwellings in Carrollwood, owner-occupied units account for 9,766 (67.0%), while renter-occupied units make up 4,815 (33.0%).
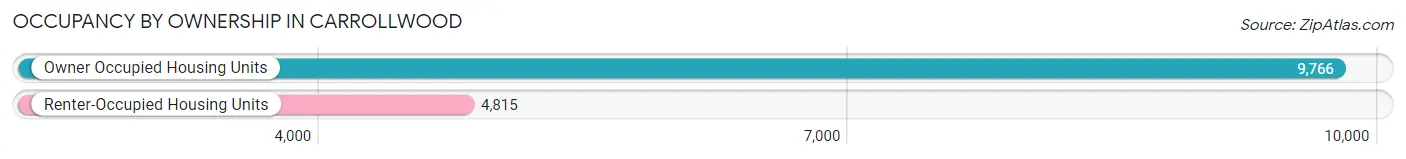
| Occupancy | # Housing Units | % Housing Units |
| Owner Occupied Housing Units | 9,766 | 67.0% |
| Renter-Occupied Housing Units | 4,815 | 33.0% |
| Total Occupied Housing Units | 14,581 | 100.0% |
Occupancy by Household Size in Carrollwood
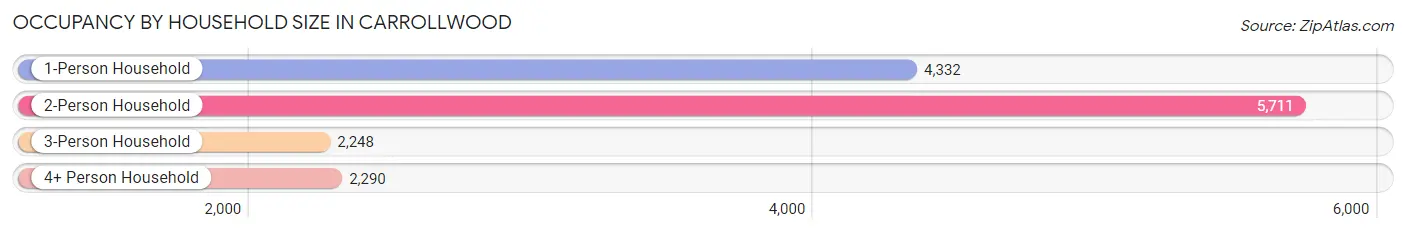
| Household Size | # Housing Units | % Housing Units |
| 1-Person Household | 4,332 | 29.7% |
| 2-Person Household | 5,711 | 39.2% |
| 3-Person Household | 2,248 | 15.4% |
| 4+ Person Household | 2,290 | 15.7% |
| Total Housing Units | 14,581 | 100.0% |
Occupancy by Ownership by Household Size in Carrollwood
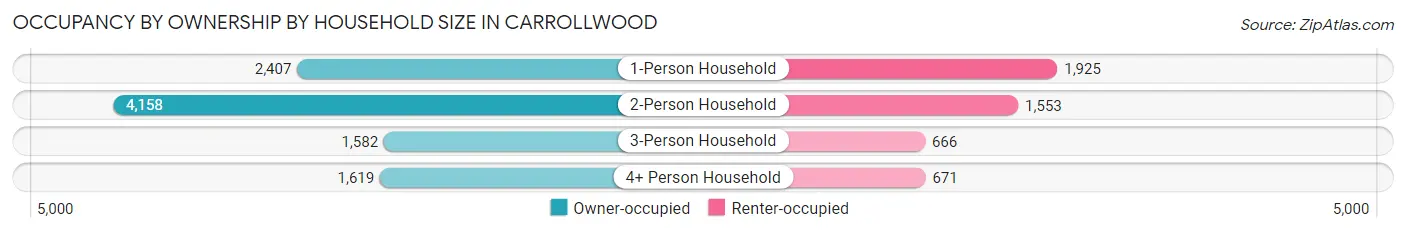
| Household Size | Owner-occupied | Renter-occupied |
| 1-Person Household | 2,407 (55.6%) | 1,925 (44.4%) |
| 2-Person Household | 4,158 (72.8%) | 1,553 (27.2%) |
| 3-Person Household | 1,582 (70.4%) | 666 (29.6%) |
| 4+ Person Household | 1,619 (70.7%) | 671 (29.3%) |
| Total Housing Units | 9,766 (67.0%) | 4,815 (33.0%) |
Occupancy by Educational Attainment in Carrollwood
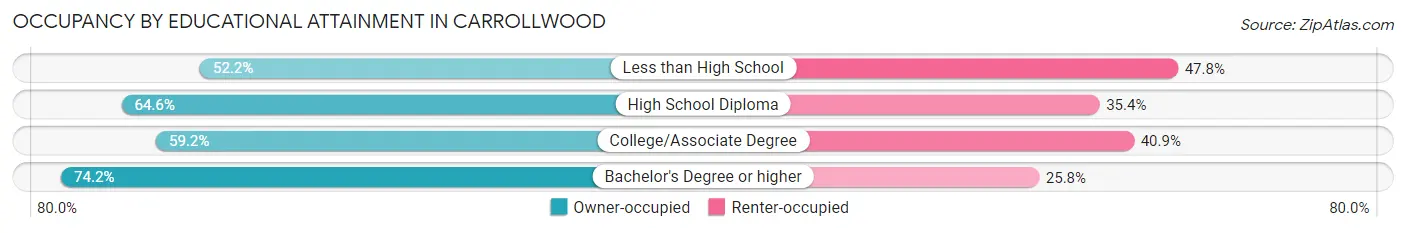
| Household Size | Owner-occupied | Renter-occupied |
| Less than High School | 360 (52.2%) | 330 (47.8%) |
| High School Diploma | 1,744 (64.6%) | 955 (35.4%) |
| College/Associate Degree | 2,525 (59.2%) | 1,744 (40.8%) |
| Bachelor's Degree or higher | 5,137 (74.2%) | 1,786 (25.8%) |
Occupancy by Age of Householder in Carrollwood
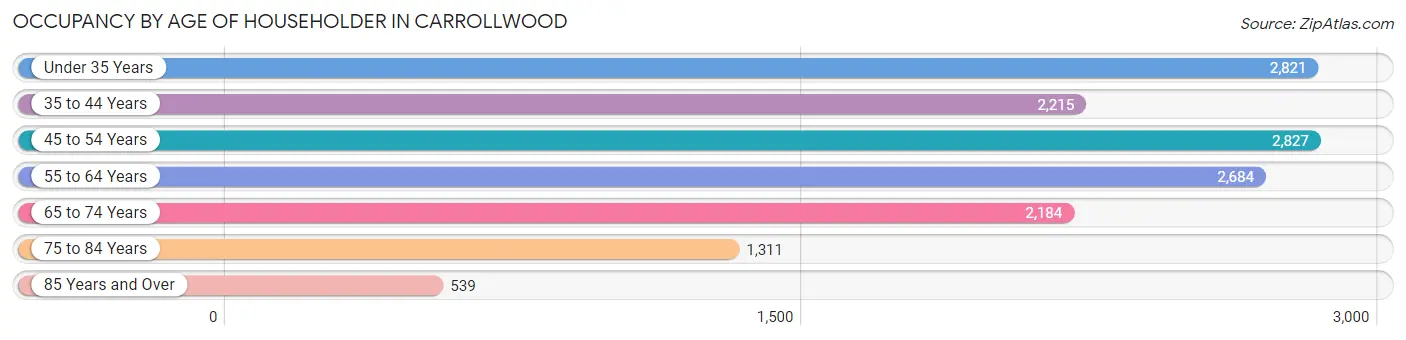
| Age Bracket | # Households | % Households |
| Under 35 Years | 2,821 | 19.4% |
| 35 to 44 Years | 2,215 | 15.2% |
| 45 to 54 Years | 2,827 | 19.4% |
| 55 to 64 Years | 2,684 | 18.4% |
| 65 to 74 Years | 2,184 | 15.0% |
| 75 to 84 Years | 1,311 | 9.0% |
| 85 Years and Over | 539 | 3.7% |
| Total | 14,581 | 100.0% |
Housing Finances in Carrollwood
Median Income by Occupancy in Carrollwood
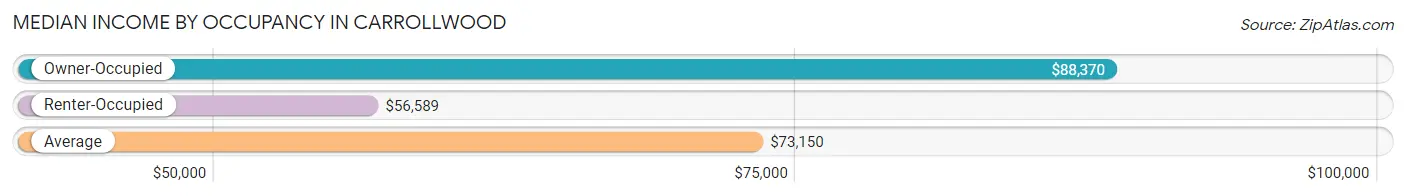
| Occupancy Type | # Households | Median Income |
| Owner-Occupied | 9,766 (67.0%) | $88,370 |
| Renter-Occupied | 4,815 (33.0%) | $56,589 |
| Average | 14,581 (100.0%) | $73,150 |
Occupancy by Householder Income Bracket in Carrollwood
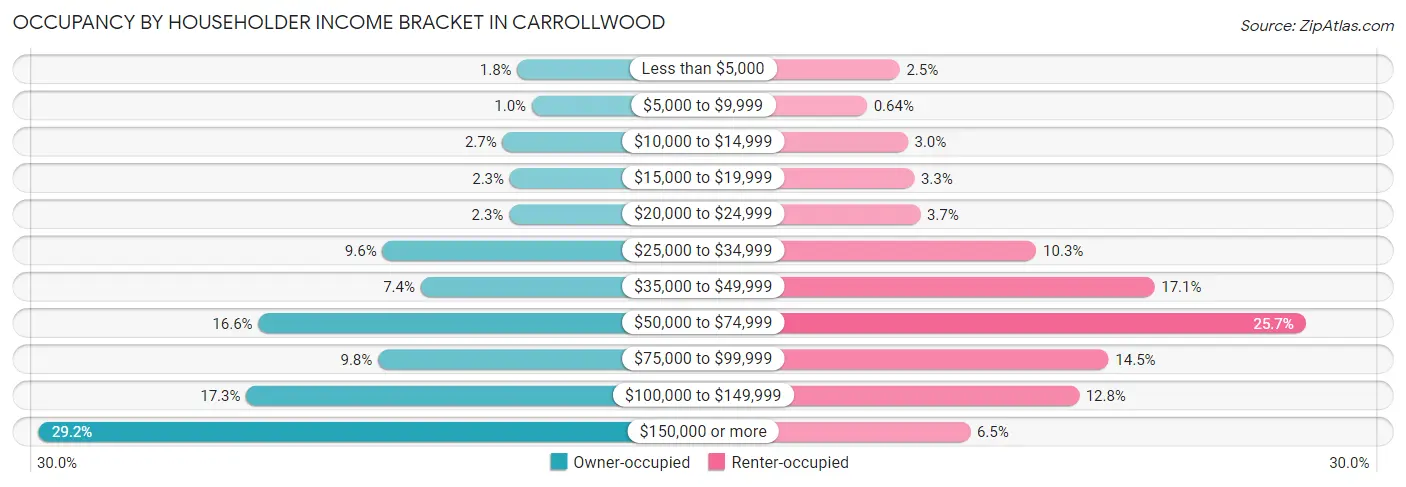
| Income Bracket | Owner-occupied | Renter-occupied |
| Less than $5,000 | 180 (1.8%) | 121 (2.5%) |
| $5,000 to $9,999 | 99 (1.0%) | 31 (0.6%) |
| $10,000 to $14,999 | 263 (2.7%) | 143 (3.0%) |
| $15,000 to $19,999 | 222 (2.3%) | 161 (3.3%) |
| $20,000 to $24,999 | 226 (2.3%) | 177 (3.7%) |
| $25,000 to $34,999 | 933 (9.6%) | 497 (10.3%) |
| $35,000 to $49,999 | 719 (7.4%) | 822 (17.1%) |
| $50,000 to $74,999 | 1,625 (16.6%) | 1,238 (25.7%) |
| $75,000 to $99,999 | 957 (9.8%) | 696 (14.4%) |
| $100,000 to $149,999 | 1,692 (17.3%) | 614 (12.8%) |
| $150,000 or more | 2,850 (29.2%) | 315 (6.5%) |
| Total | 9,766 (100.0%) | 4,815 (100.0%) |
Monthly Housing Cost Tiers in Carrollwood
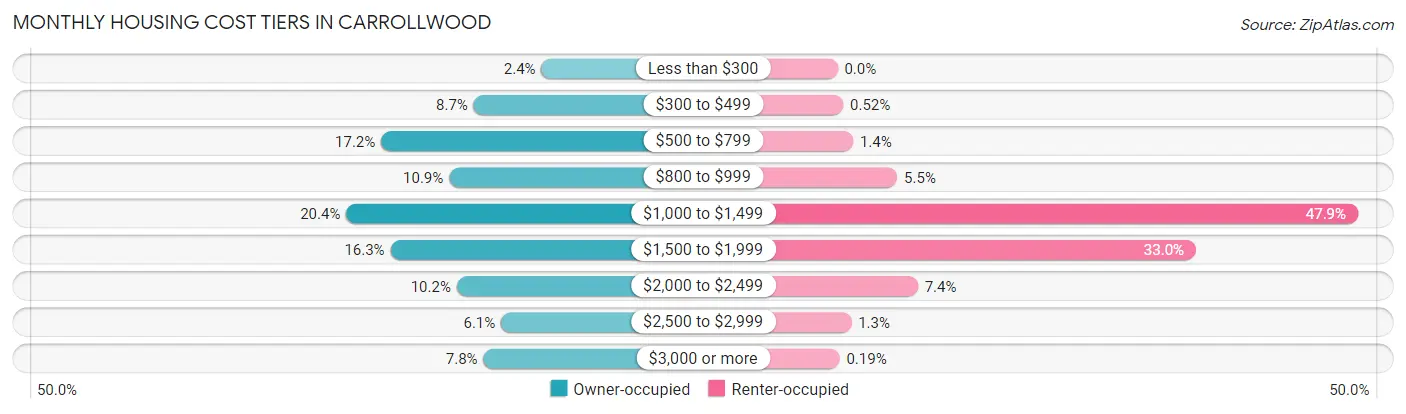
| Monthly Cost | Owner-occupied | Renter-occupied |
| Less than $300 | 236 (2.4%) | 0 (0.0%) |
| $300 to $499 | 846 (8.7%) | 25 (0.5%) |
| $500 to $799 | 1,678 (17.2%) | 69 (1.4%) |
| $800 to $999 | 1,066 (10.9%) | 265 (5.5%) |
| $1,000 to $1,499 | 1,991 (20.4%) | 2,307 (47.9%) |
| $1,500 to $1,999 | 1,594 (16.3%) | 1,589 (33.0%) |
| $2,000 to $2,499 | 998 (10.2%) | 356 (7.4%) |
| $2,500 to $2,999 | 599 (6.1%) | 61 (1.3%) |
| $3,000 or more | 758 (7.8%) | 9 (0.2%) |
| Total | 9,766 (100.0%) | 4,815 (100.0%) |
Physical Housing Characteristics in Carrollwood
Housing Structures in Carrollwood
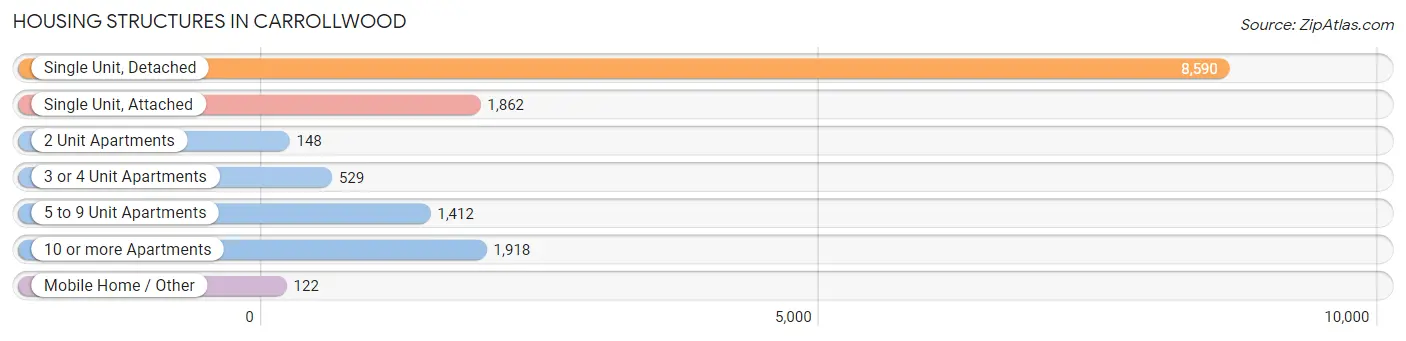
| Structure Type | # Housing Units | % Housing Units |
| Single Unit, Detached | 8,590 | 58.9% |
| Single Unit, Attached | 1,862 | 12.8% |
| 2 Unit Apartments | 148 | 1.0% |
| 3 or 4 Unit Apartments | 529 | 3.6% |
| 5 to 9 Unit Apartments | 1,412 | 9.7% |
| 10 or more Apartments | 1,918 | 13.2% |
| Mobile Home / Other | 122 | 0.8% |
| Total | 14,581 | 100.0% |
Housing Structures by Occupancy in Carrollwood
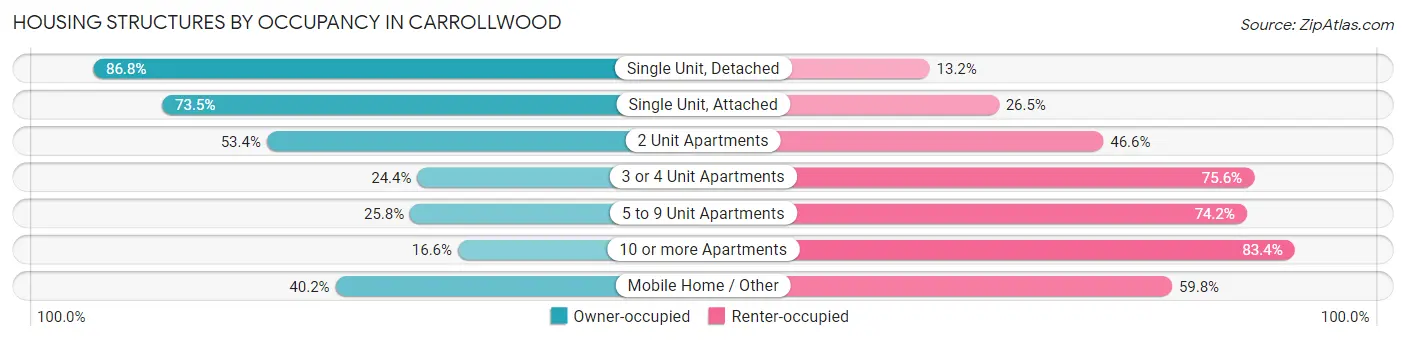
| Structure Type | Owner-occupied | Renter-occupied |
| Single Unit, Detached | 7,458 (86.8%) | 1,132 (13.2%) |
| Single Unit, Attached | 1,369 (73.5%) | 493 (26.5%) |
| 2 Unit Apartments | 79 (53.4%) | 69 (46.6%) |
| 3 or 4 Unit Apartments | 129 (24.4%) | 400 (75.6%) |
| 5 to 9 Unit Apartments | 364 (25.8%) | 1,048 (74.2%) |
| 10 or more Apartments | 318 (16.6%) | 1,600 (83.4%) |
| Mobile Home / Other | 49 (40.2%) | 73 (59.8%) |
| Total | 9,766 (67.0%) | 4,815 (33.0%) |
Housing Structures by Number of Rooms in Carrollwood
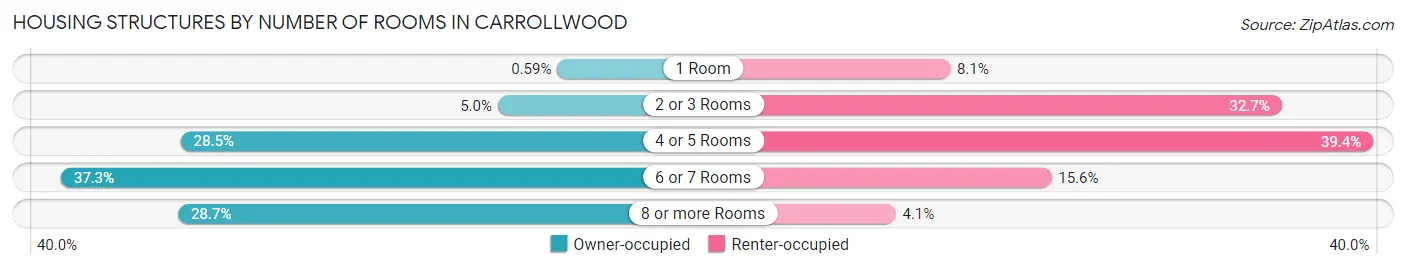
| Number of Rooms | Owner-occupied | Renter-occupied |
| 1 Room | 58 (0.6%) | 392 (8.1%) |
| 2 or 3 Rooms | 487 (5.0%) | 1,573 (32.7%) |
| 4 or 5 Rooms | 2,778 (28.4%) | 1,899 (39.4%) |
| 6 or 7 Rooms | 3,645 (37.3%) | 753 (15.6%) |
| 8 or more Rooms | 2,798 (28.6%) | 198 (4.1%) |
| Total | 9,766 (100.0%) | 4,815 (100.0%) |
Housing Structure by Heating Type in Carrollwood
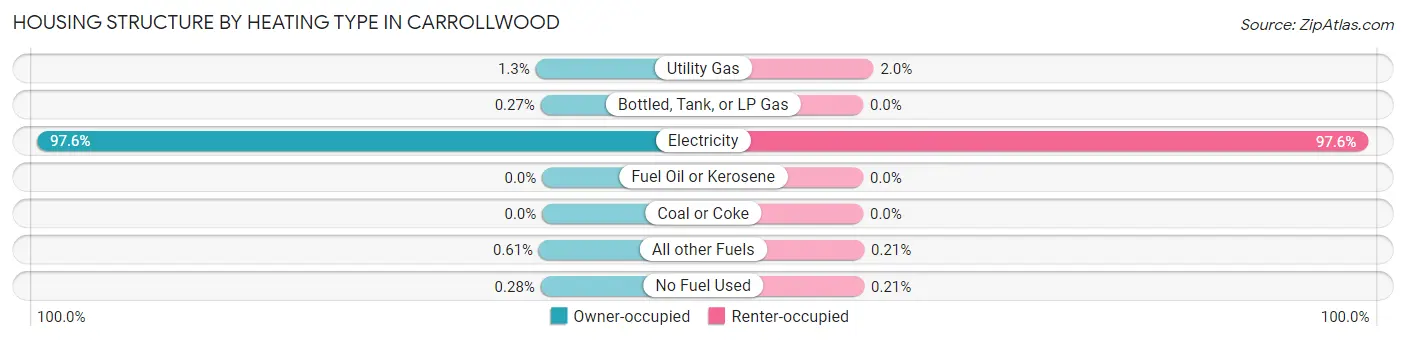
| Heating Type | Owner-occupied | Renter-occupied |
| Utility Gas | 123 (1.3%) | 97 (2.0%) |
| Bottled, Tank, or LP Gas | 26 (0.3%) | 0 (0.0%) |
| Electricity | 9,530 (97.6%) | 4,698 (97.6%) |
| Fuel Oil or Kerosene | 0 (0.0%) | 0 (0.0%) |
| Coal or Coke | 0 (0.0%) | 0 (0.0%) |
| All other Fuels | 60 (0.6%) | 10 (0.2%) |
| No Fuel Used | 27 (0.3%) | 10 (0.2%) |
| Total | 9,766 (100.0%) | 4,815 (100.0%) |
Household Vehicle Usage in Carrollwood
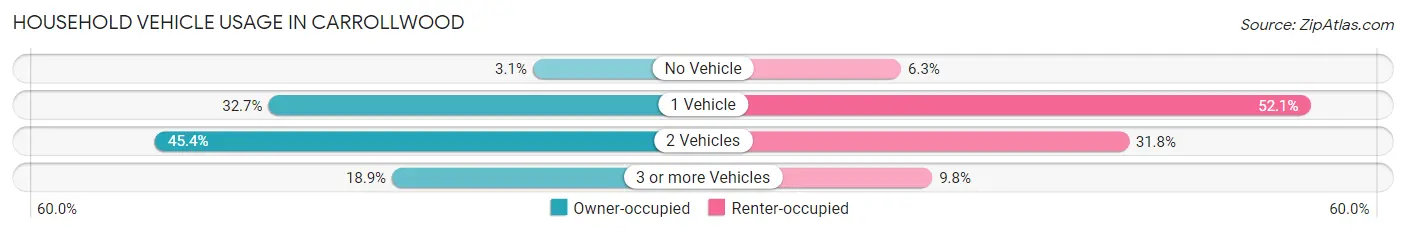
| Vehicles per Household | Owner-occupied | Renter-occupied |
| No Vehicle | 301 (3.1%) | 303 (6.3%) |
| 1 Vehicle | 3,193 (32.7%) | 2,510 (52.1%) |
| 2 Vehicles | 4,431 (45.4%) | 1,531 (31.8%) |
| 3 or more Vehicles | 1,841 (18.9%) | 471 (9.8%) |
| Total | 9,766 (100.0%) | 4,815 (100.0%) |
Real Estate & Mortgages in Carrollwood
Real Estate and Mortgage Overview in Carrollwood
| Characteristic | Without Mortgage | With Mortgage |
| Housing Units | 3,936 | 5,830 |
| Median Property Value | $342,900 | $338,100 |
| Median Household Income | $56,680 | $2,073 |
| Monthly Housing Costs | $654 | $758 |
| Real Estate Taxes | $2,606 | $127 |
Property Value by Mortgage Status in Carrollwood
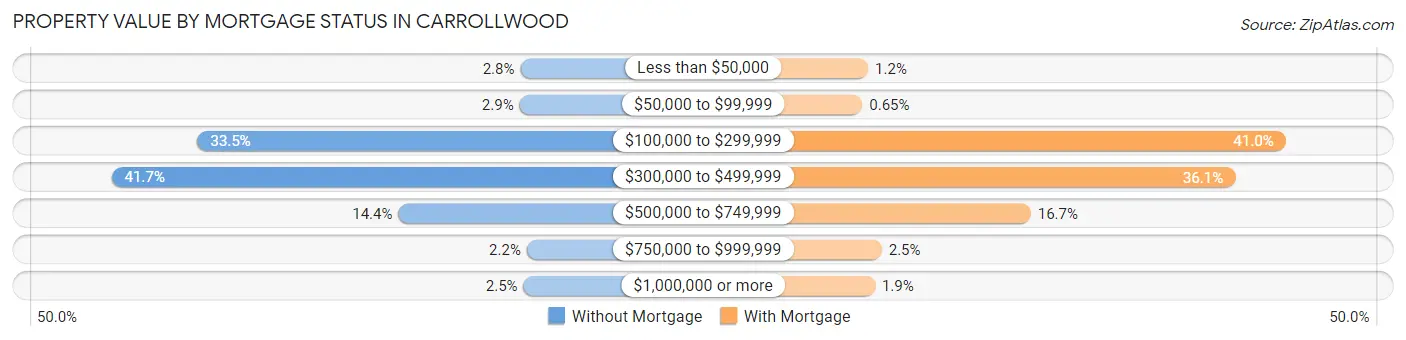
| Property Value | Without Mortgage | With Mortgage |
| Less than $50,000 | 110 (2.8%) | 70 (1.2%) |
| $50,000 to $99,999 | 113 (2.9%) | 38 (0.6%) |
| $100,000 to $299,999 | 1,320 (33.5%) | 2,388 (41.0%) |
| $300,000 to $499,999 | 1,642 (41.7%) | 2,107 (36.1%) |
| $500,000 to $749,999 | 567 (14.4%) | 973 (16.7%) |
| $750,000 to $999,999 | 86 (2.2%) | 146 (2.5%) |
| $1,000,000 or more | 98 (2.5%) | 108 (1.8%) |
| Total | 3,936 (100.0%) | 5,830 (100.0%) |
Household Income by Mortgage Status in Carrollwood
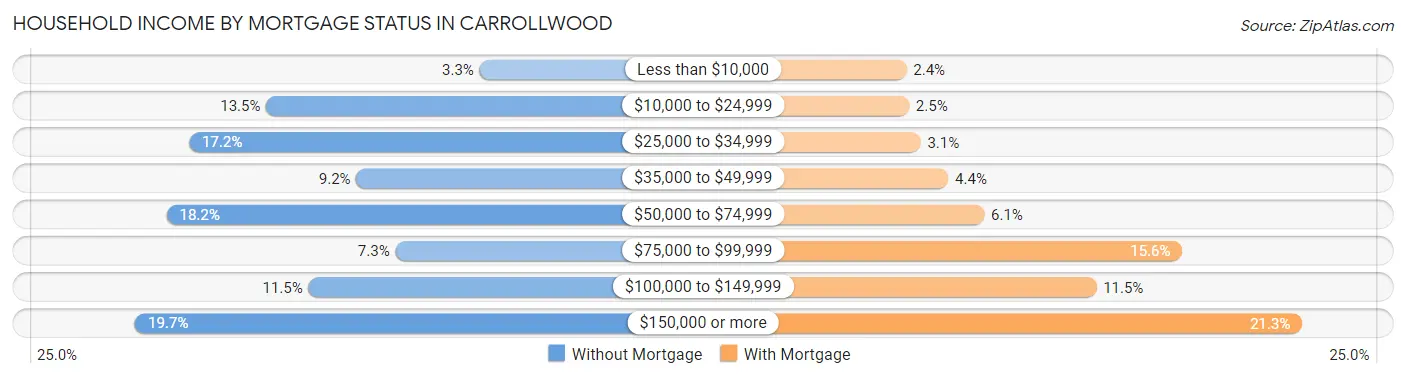
| Household Income | Without Mortgage | With Mortgage |
| Less than $10,000 | 131 (3.3%) | 141 (2.4%) |
| $10,000 to $24,999 | 531 (13.5%) | 148 (2.5%) |
| $25,000 to $34,999 | 676 (17.2%) | 180 (3.1%) |
| $35,000 to $49,999 | 362 (9.2%) | 257 (4.4%) |
| $50,000 to $74,999 | 718 (18.2%) | 357 (6.1%) |
| $75,000 to $99,999 | 289 (7.3%) | 907 (15.6%) |
| $100,000 to $149,999 | 452 (11.5%) | 668 (11.5%) |
| $150,000 or more | 777 (19.7%) | 1,240 (21.3%) |
| Total | 3,936 (100.0%) | 5,830 (100.0%) |
Property Value to Household Income Ratio in Carrollwood
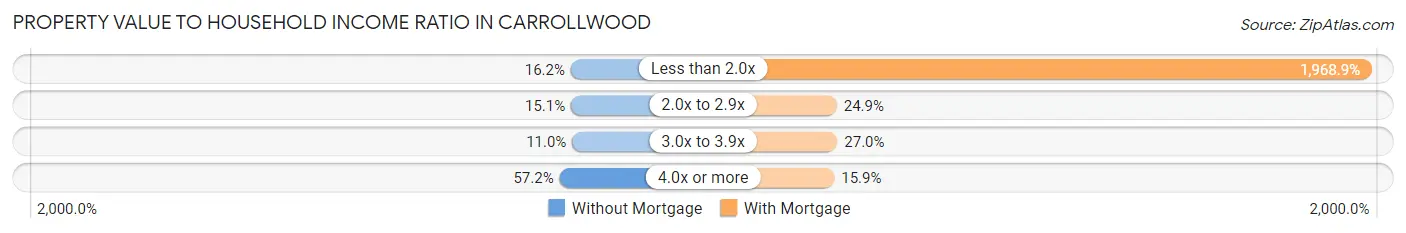
| Value-to-Income Ratio | Without Mortgage | With Mortgage |
| Less than 2.0x | 638 (16.2%) | 114,786 (1,968.9%) |
| 2.0x to 2.9x | 596 (15.1%) | 1,449 (24.8%) |
| 3.0x to 3.9x | 431 (11.0%) | 1,576 (27.0%) |
| 4.0x or more | 2,252 (57.2%) | 927 (15.9%) |
| Total | 3,936 (100.0%) | 5,830 (100.0%) |
Real Estate Taxes by Mortgage Status in Carrollwood
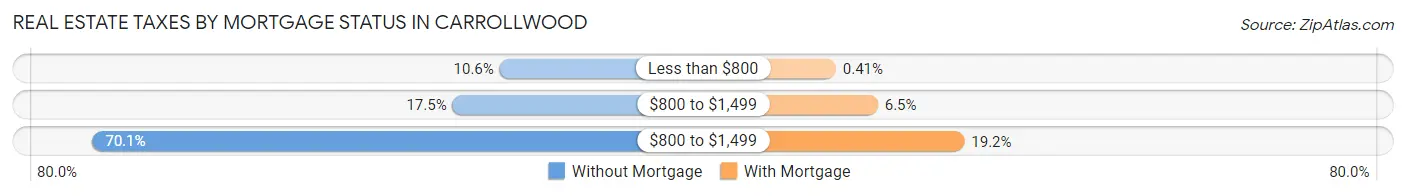
| Property Taxes | Without Mortgage | With Mortgage |
| Less than $800 | 417 (10.6%) | 24 (0.4%) |
| $800 to $1,499 | 688 (17.5%) | 381 (6.5%) |
| $800 to $1,499 | 2,759 (70.1%) | 1,119 (19.2%) |
| Total | 3,936 (100.0%) | 5,830 (100.0%) |
Health & Disability in Carrollwood
Health Insurance Coverage by Age in Carrollwood
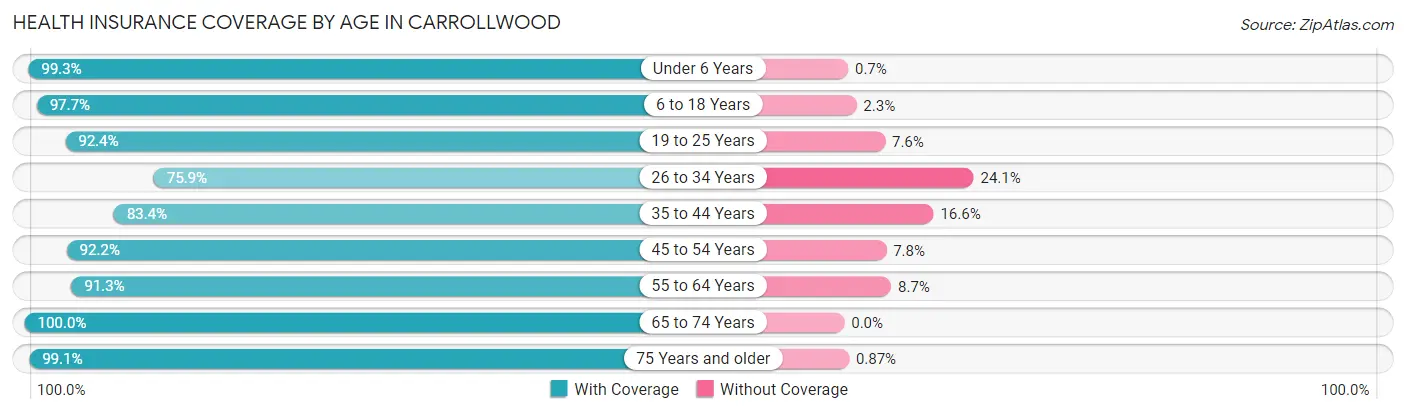
| Age Bracket | With Coverage | Without Coverage |
| Under 6 Years | 3,280 (99.3%) | 23 (0.7%) |
| 6 to 18 Years | 4,459 (97.7%) | 103 (2.3%) |
| 19 to 25 Years | 2,176 (92.4%) | 179 (7.6%) |
| 26 to 34 Years | 3,709 (75.9%) | 1,178 (24.1%) |
| 35 to 44 Years | 3,599 (83.4%) | 718 (16.6%) |
| 45 to 54 Years | 5,136 (92.2%) | 436 (7.8%) |
| 55 to 64 Years | 4,303 (91.3%) | 411 (8.7%) |
| 65 to 74 Years | 3,374 (100.0%) | 0 (0.0%) |
| 75 Years and older | 2,978 (99.1%) | 26 (0.9%) |
| Total | 33,014 (91.5%) | 3,074 (8.5%) |
Health Insurance Coverage by Citizenship Status in Carrollwood
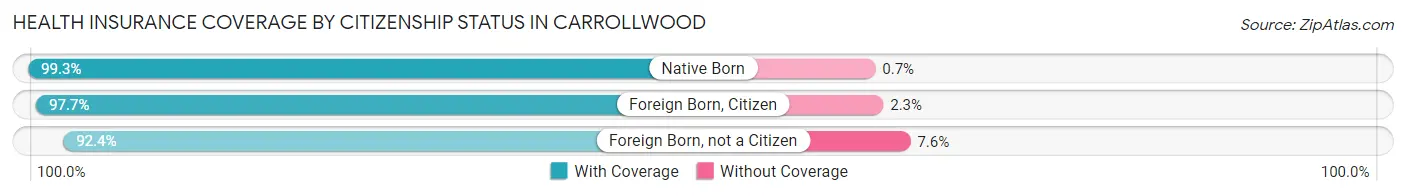
| Citizenship Status | With Coverage | Without Coverage |
| Native Born | 3,280 (99.3%) | 23 (0.7%) |
| Foreign Born, Citizen | 4,459 (97.7%) | 103 (2.3%) |
| Foreign Born, not a Citizen | 2,176 (92.4%) | 179 (7.6%) |
Health Insurance Coverage by Household Income in Carrollwood
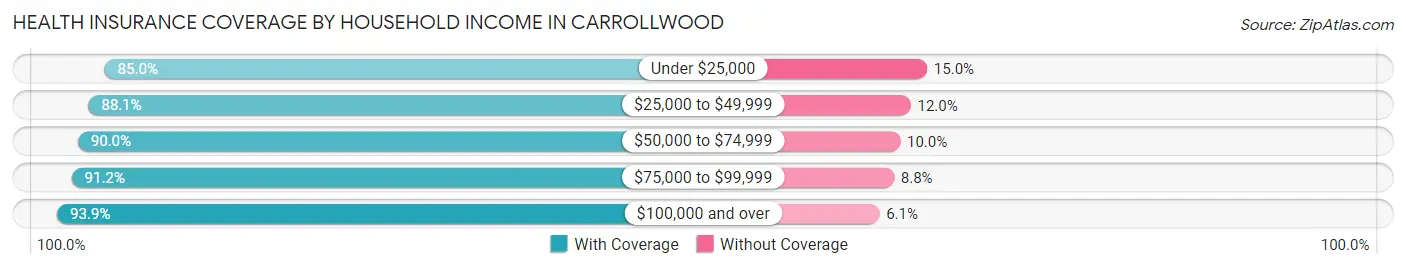
| Household Income | With Coverage | Without Coverage |
| Under $25,000 | 2,180 (85.0%) | 385 (15.0%) |
| $25,000 to $49,999 | 4,253 (88.0%) | 577 (11.9%) |
| $50,000 to $74,999 | 5,769 (90.0%) | 639 (10.0%) |
| $75,000 to $99,999 | 3,890 (91.2%) | 376 (8.8%) |
| $100,000 and over | 16,891 (93.9%) | 1,093 (6.1%) |
Public vs Private Health Insurance Coverage by Age in Carrollwood
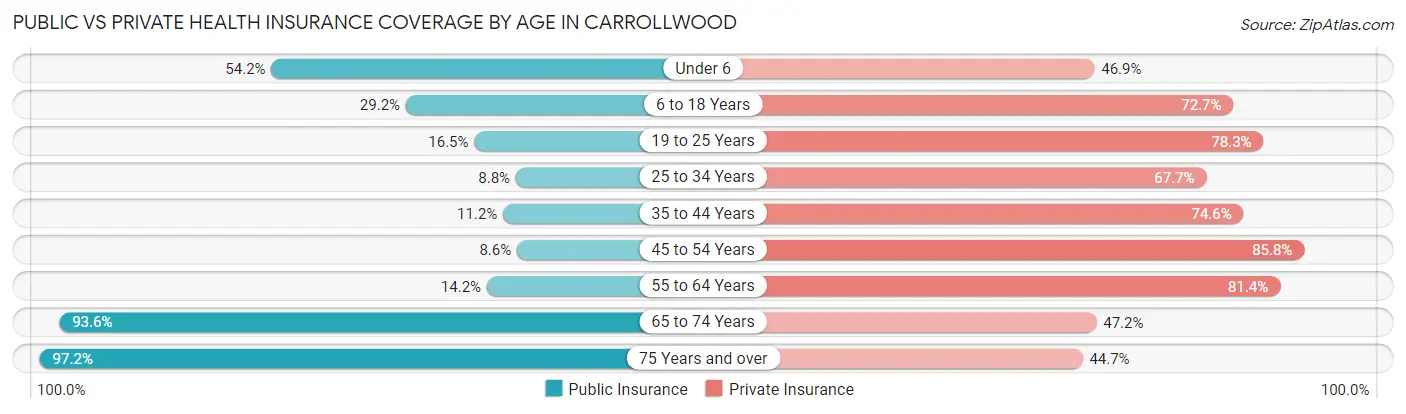
| Age Bracket | Public Insurance | Private Insurance |
| Under 6 | 1,790 (54.2%) | 1,548 (46.9%) |
| 6 to 18 Years | 1,333 (29.2%) | 3,315 (72.7%) |
| 19 to 25 Years | 389 (16.5%) | 1,843 (78.3%) |
| 25 to 34 Years | 430 (8.8%) | 3,307 (67.7%) |
| 35 to 44 Years | 482 (11.2%) | 3,219 (74.6%) |
| 45 to 54 Years | 479 (8.6%) | 4,782 (85.8%) |
| 55 to 64 Years | 669 (14.2%) | 3,835 (81.4%) |
| 65 to 74 Years | 3,157 (93.6%) | 1,594 (47.2%) |
| 75 Years and over | 2,920 (97.2%) | 1,342 (44.7%) |
| Total | 11,649 (32.3%) | 24,785 (68.7%) |
Disability Status by Sex by Age in Carrollwood
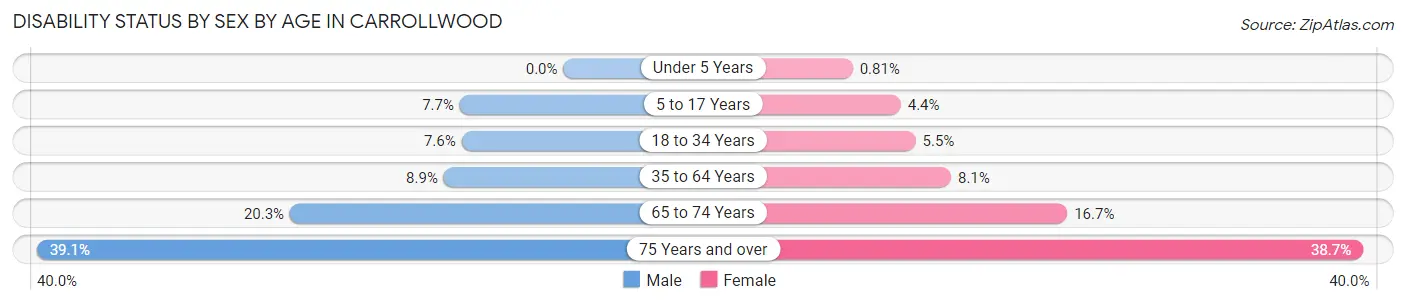
| Age Bracket | Male | Female |
| Under 5 Years | 0 (0.0%) | 12 (0.8%) |
| 5 to 17 Years | 169 (7.7%) | 108 (4.4%) |
| 18 to 34 Years | 266 (7.6%) | 215 (5.5%) |
| 35 to 64 Years | 631 (8.9%) | 608 (8.1%) |
| 65 to 74 Years | 337 (20.3%) | 287 (16.7%) |
| 75 Years and over | 427 (39.1%) | 740 (38.7%) |
Disability Class by Sex by Age in Carrollwood
Disability Class: Hearing Difficulty
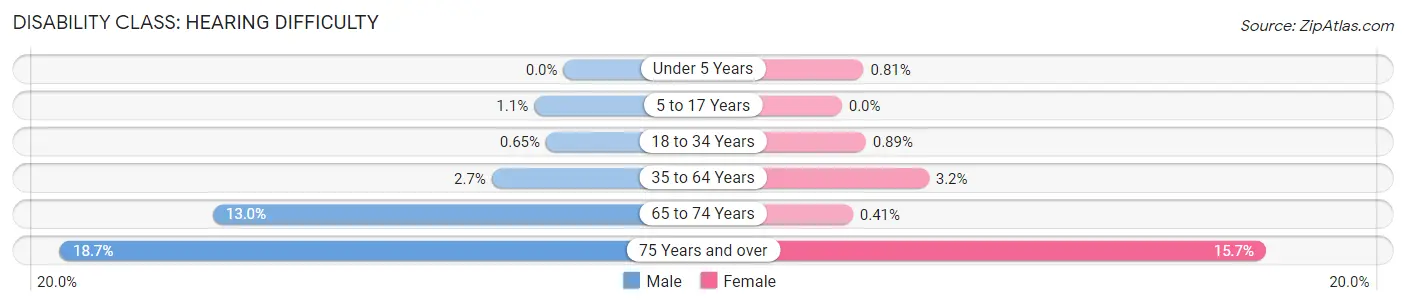
| Age Bracket | Male | Female |
| Under 5 Years | 0 (0.0%) | 12 (0.8%) |
| 5 to 17 Years | 24 (1.1%) | 0 (0.0%) |
| 18 to 34 Years | 23 (0.6%) | 35 (0.9%) |
| 35 to 64 Years | 189 (2.7%) | 242 (3.2%) |
| 65 to 74 Years | 216 (13.0%) | 7 (0.4%) |
| 75 Years and over | 204 (18.7%) | 301 (15.7%) |
Disability Class: Vision Difficulty
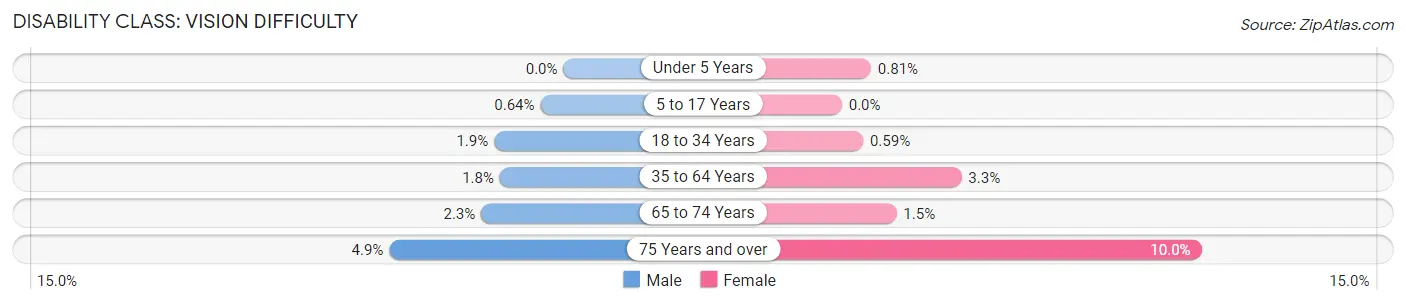
| Age Bracket | Male | Female |
| Under 5 Years | 0 (0.0%) | 12 (0.8%) |
| 5 to 17 Years | 14 (0.6%) | 0 (0.0%) |
| 18 to 34 Years | 68 (1.9%) | 23 (0.6%) |
| 35 to 64 Years | 126 (1.8%) | 250 (3.3%) |
| 65 to 74 Years | 38 (2.3%) | 26 (1.5%) |
| 75 Years and over | 53 (4.9%) | 192 (10.0%) |
Disability Class: Cognitive Difficulty
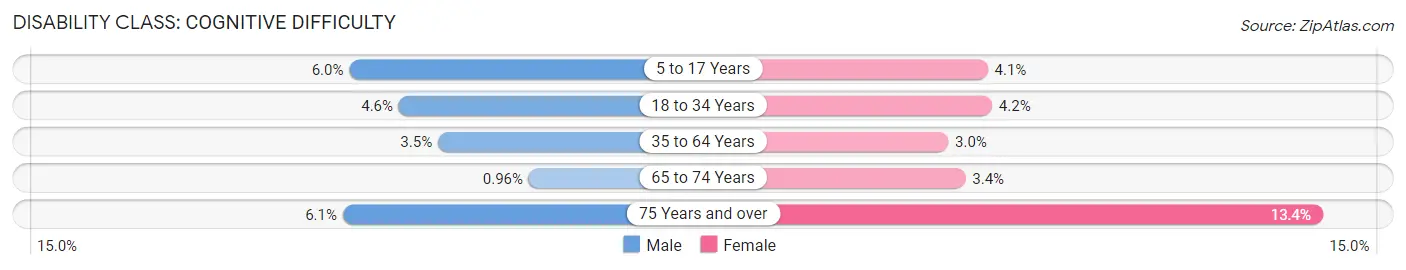
| Age Bracket | Male | Female |
| 5 to 17 Years | 131 (6.0%) | 100 (4.1%) |
| 18 to 34 Years | 161 (4.6%) | 164 (4.2%) |
| 35 to 64 Years | 248 (3.5%) | 222 (3.0%) |
| 65 to 74 Years | 16 (1.0%) | 59 (3.4%) |
| 75 Years and over | 67 (6.1%) | 256 (13.4%) |
Disability Class: Ambulatory Difficulty
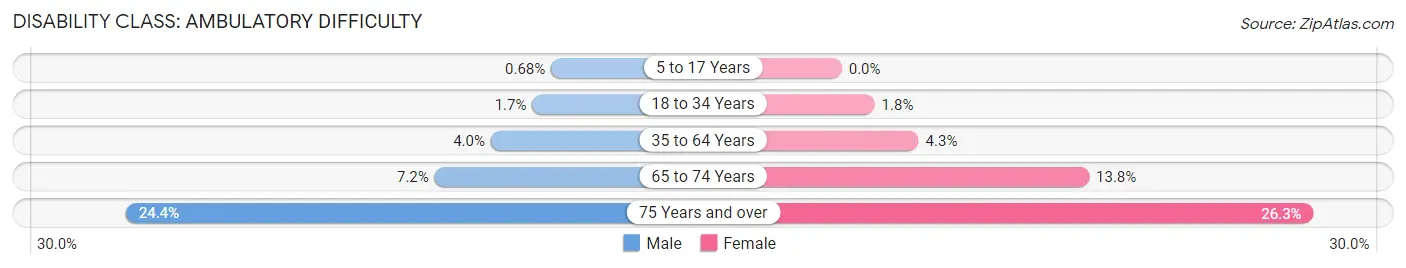
| Age Bracket | Male | Female |
| 5 to 17 Years | 15 (0.7%) | 0 (0.0%) |
| 18 to 34 Years | 61 (1.7%) | 72 (1.8%) |
| 35 to 64 Years | 287 (4.0%) | 321 (4.3%) |
| 65 to 74 Years | 119 (7.2%) | 236 (13.8%) |
| 75 Years and over | 266 (24.4%) | 502 (26.3%) |
Disability Class: Self-Care Difficulty
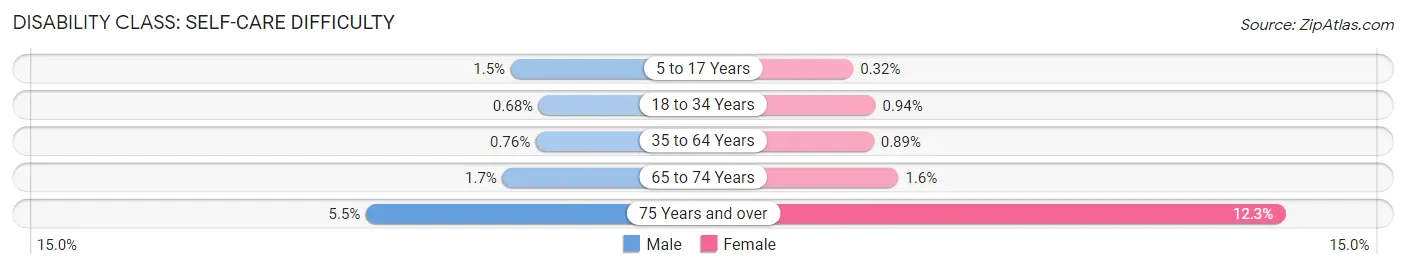
| Age Bracket | Male | Female |
| 5 to 17 Years | 32 (1.5%) | 8 (0.3%) |
| 18 to 34 Years | 24 (0.7%) | 37 (0.9%) |
| 35 to 64 Years | 54 (0.8%) | 67 (0.9%) |
| 65 to 74 Years | 28 (1.7%) | 27 (1.6%) |
| 75 Years and over | 60 (5.5%) | 236 (12.3%) |
Technology Access in Carrollwood
Computing Device Access in Carrollwood
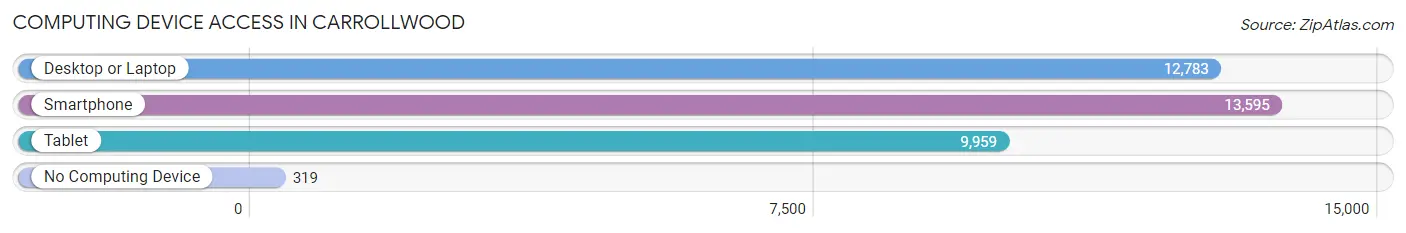
| Device Type | # Households | % Households |
| Desktop or Laptop | 12,783 | 87.7% |
| Smartphone | 13,595 | 93.2% |
| Tablet | 9,959 | 68.3% |
| No Computing Device | 319 | 2.2% |
| Total | 14,581 | 100.0% |
Internet Access in Carrollwood
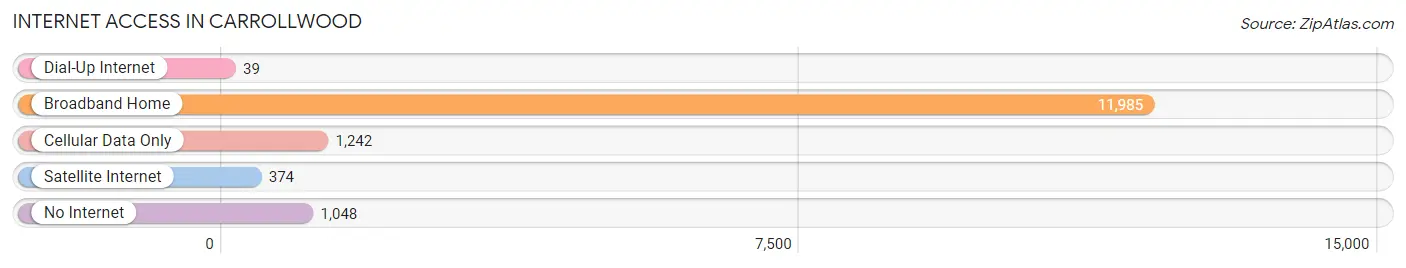
| Internet Type | # Households | % Households |
| Dial-Up Internet | 39 | 0.3% |
| Broadband Home | 11,985 | 82.2% |
| Cellular Data Only | 1,242 | 8.5% |
| Satellite Internet | 374 | 2.6% |
| No Internet | 1,048 | 7.2% |
| Total | 14,581 | 100.0% |
Carrollwood Summary
Carrollwood is an unincorporated census-designated place in Hillsborough County, Florida, United States. It is located north of Tampa, and is part of the larger Tampa Bay Area. The population was 33,365 at the 2010 census.
History
Carrollwood was originally part of the larger Carrollwood Village, which was established in 1959. The area was named after the Carroll family, who were among the first settlers in the area. The Carrolls were originally from Ireland and settled in the area in the late 1800s.
The area was originally a rural farming community, but began to develop in the 1950s and 1960s as the population of Tampa increased. The area was annexed by the City of Tampa in the 1970s, but was later de-annexed in the 1980s.
Geography
Carrollwood is located in Hillsborough County, Florida, at 28°3'N 82°30'W (28.05, -82.50). It is bordered by the City of Tampa to the south, Citrus Park to the west, and Northdale to the north. The area is located approximately 15 miles north of downtown Tampa.
The area is mostly flat, with some rolling hills. The terrain is mostly sandy, with some areas of marshland. The area is home to several lakes, including Lake Carroll, Lake Magdalene, and Lake Ellen.
Economy
Carrollwood is home to a variety of businesses, including retail stores, restaurants, and professional services. The area is also home to several corporate headquarters, including the headquarters of the Tampa Bay Buccaneers.
The area is also home to several medical facilities, including the University of South Florida Medical Center and the Florida Hospital Carrollwood.
Demographics
As of the 2010 census, there were 33,365 people, 13,845 households, and 9,845 families residing in Carrollwood. The population density was 2,845.3 people per square mile (1,098.7/km2). There were 14,845 housing units at an average density of 1,228.3 per square mile (473.2/km2). The racial makeup of the area was 79.2% White, 8.3% African American, 0.3% Native American, 5.2% Asian, 0.1% Pacific Islander, 4.2% from other races, and 2.9% from two or more races. Hispanic or Latino of any race were 15.2% of the population.
The median income for a household in the area was $50,945, and the median income for a family was $60,945. Males had a median income of $41,945 versus $31,945 for females. The per capita income for the area was $25,945. About 5.2% of families and 7.2% of the population were below the poverty line, including 8.2% of those under age 18 and 6.2% of those age 65 or over.
Common Questions
What is Per Capita Income in Carrollwood?
Per Capita income in Carrollwood is $45,710.
What is the Median Family Income in Carrollwood?
Median Family Income in Carrollwood is $99,470.
What is the Median Household income in Carrollwood?
Median Household Income in Carrollwood is $73,150.
What is Income or Wage Gap in Carrollwood?
Income or Wage Gap in Carrollwood is 22.3%.
Women in Carrollwood earn 77.7 cents for every dollar earned by a man.
What is Family Income Deficit in Carrollwood?
Family Income Deficit in Carrollwood is $13,008.
Families that are below poverty line in Carrollwood earn $13,008 less on average than the poverty threshold level.
What is Inequality or Gini Index in Carrollwood?
Inequality or Gini Index in Carrollwood is 0.48.
What is the Total Population of Carrollwood?
Total Population of Carrollwood is 36,148.
What is the Total Male Population of Carrollwood?
Total Male Population of Carrollwood is 17,139.
What is the Total Female Population of Carrollwood?
Total Female Population of Carrollwood is 19,009.
What is the Ratio of Males per 100 Females in Carrollwood?
There are 90.16 Males per 100 Females in Carrollwood.
What is the Ratio of Females per 100 Males in Carrollwood?
There are 110.91 Females per 100 Males in Carrollwood.
What is the Median Population Age in Carrollwood?
Median Population Age in Carrollwood is 40.7 Years.
What is the Average Family Size in Carrollwood
Average Family Size in Carrollwood is 3.1 People.
What is the Average Household Size in Carrollwood
Average Household Size in Carrollwood is 2.5 People.
How Large is the Labor Force in Carrollwood?
There are 19,243 People in the Labor Forcein in Carrollwood.
What is the Percentage of People in the Labor Force in Carrollwood?
65.3% of People are in the Labor Force in Carrollwood.
What is the Unemployment Rate in Carrollwood?
Unemployment Rate in Carrollwood is 4.0%.