Pleasanton, NM Map & Demographics
Pleasanton Map
Pleasanton Overview
$23,185
PER CAPITA INCOME
$48,875
AVG HOUSEHOLD INCOME
0.38
INEQUALITY / GINI INDEX
248
TOTAL POPULATION
110
MALE POPULATION
138
FEMALE POPULATION
79.71
MALES / 100 FEMALES
125.45
FEMALES / 100 MALES
36.7
MEDIAN AGE
2.2
AVG FAMILY SIZE
2.9
AVG HOUSEHOLD SIZE
111
LABOR FORCE [ PEOPLE ]
52.1%
PERCENT IN LABOR FORCE
Income in Pleasanton
Income Overview in Pleasanton
| Characteristic | Number | Measure |
| Per Capita Income | 248 | $23,185 |
| Median Family Income | 43 | $0 |
| Mean Family Income | 43 | $45,316 |
| Median Household Income | 87 | $48,875 |
| Mean Household Income | 87 | $53,999 |
| Income Deficit | 43 | $0 |
| Wage / Income Gap (%) | 248 | 0.00% |
| Wage / Income Gap ($) | 248 | 100.00¢ per $1 |
| Gini / Inequality Index | 248 | 0.38 |
Earnings by Sex in Pleasanton
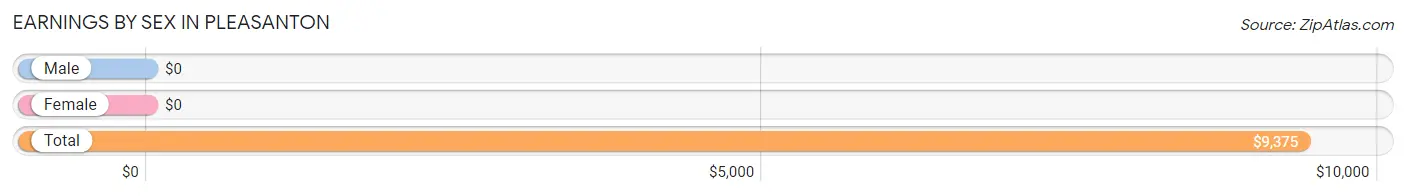
| Sex | Number | Average Earnings |
| Male | 75 (67.6%) | $0 |
| Female | 36 (32.4%) | $0 |
| Total | 111 (100.0%) | $9,375 |
Earnings by Sex by Income Bracket in Pleasanton
The most common earnings brackets in Pleasanton are $7,500 to $9,999 for men (74 | 98.7%) and $22,500 to $24,999 for women (30 | 83.3%).
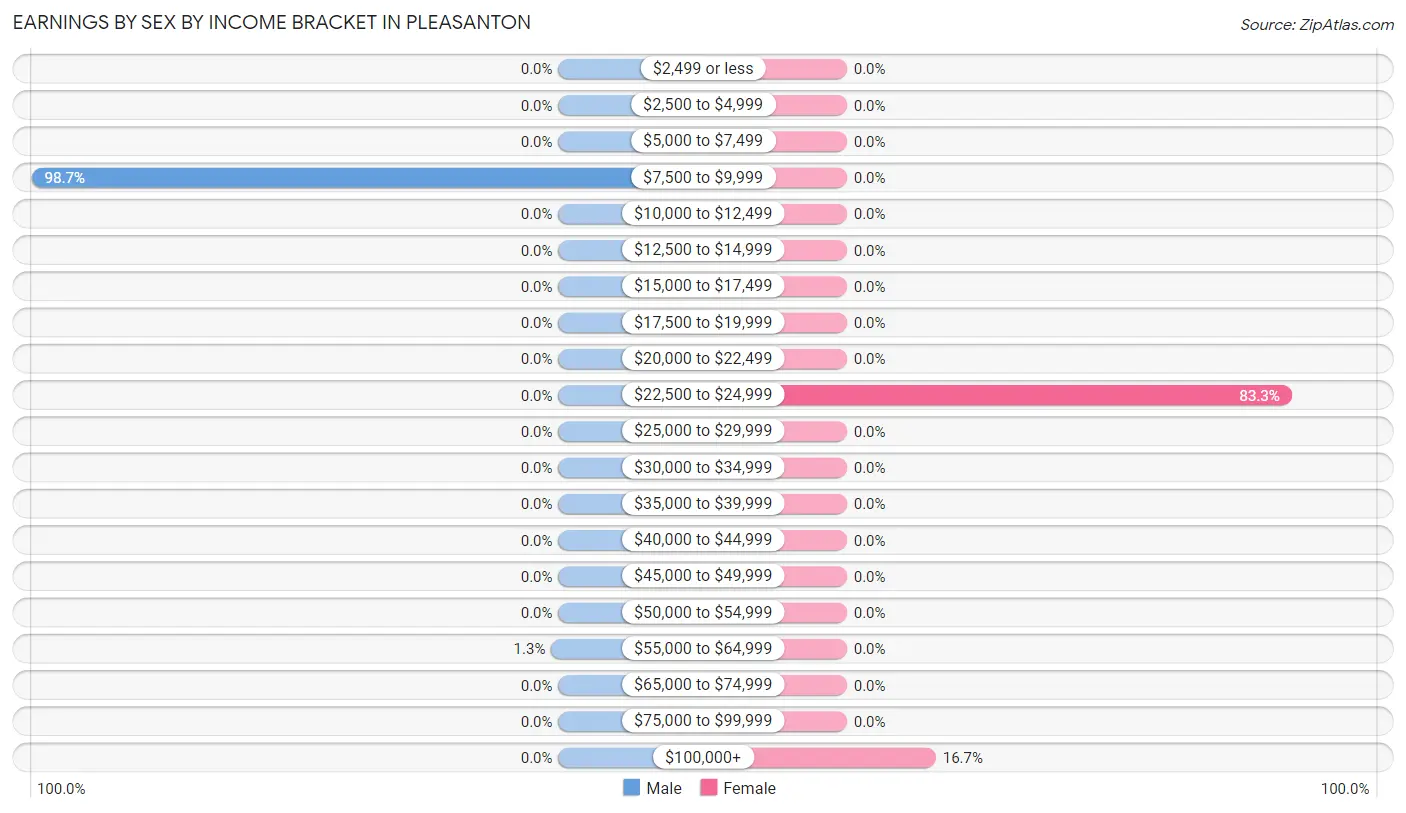
| Income | Male | Female |
| $2,499 or less | 0 (0.0%) | 0 (0.0%) |
| $2,500 to $4,999 | 0 (0.0%) | 0 (0.0%) |
| $5,000 to $7,499 | 0 (0.0%) | 0 (0.0%) |
| $7,500 to $9,999 | 74 (98.7%) | 0 (0.0%) |
| $10,000 to $12,499 | 0 (0.0%) | 0 (0.0%) |
| $12,500 to $14,999 | 0 (0.0%) | 0 (0.0%) |
| $15,000 to $17,499 | 0 (0.0%) | 0 (0.0%) |
| $17,500 to $19,999 | 0 (0.0%) | 0 (0.0%) |
| $20,000 to $22,499 | 0 (0.0%) | 0 (0.0%) |
| $22,500 to $24,999 | 0 (0.0%) | 30 (83.3%) |
| $25,000 to $29,999 | 0 (0.0%) | 0 (0.0%) |
| $30,000 to $34,999 | 0 (0.0%) | 0 (0.0%) |
| $35,000 to $39,999 | 0 (0.0%) | 0 (0.0%) |
| $40,000 to $44,999 | 0 (0.0%) | 0 (0.0%) |
| $45,000 to $49,999 | 0 (0.0%) | 0 (0.0%) |
| $50,000 to $54,999 | 0 (0.0%) | 0 (0.0%) |
| $55,000 to $64,999 | 1 (1.3%) | 0 (0.0%) |
| $65,000 to $74,999 | 0 (0.0%) | 0 (0.0%) |
| $75,000 to $99,999 | 0 (0.0%) | 0 (0.0%) |
| $100,000+ | 0 (0.0%) | 6 (16.7%) |
| Total | 75 (100.0%) | 36 (100.0%) |
Earnings by Sex by Educational Attainment in Pleasanton
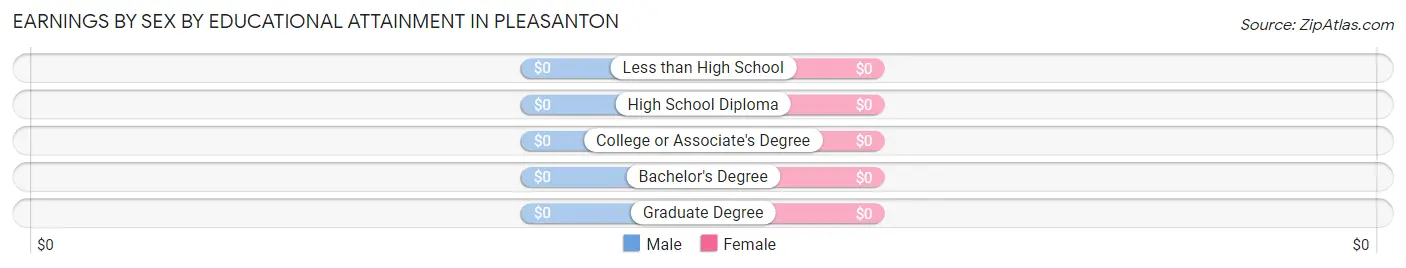
| Educational Attainment | Male Income | Female Income |
| Less than High School | - | - |
| High School Diploma | - | - |
| College or Associate's Degree | - | - |
| Bachelor's Degree | - | - |
| Graduate Degree | - | - |
| Total | - | - |
Family Income in Pleasanton
Family Income Brackets in Pleasanton
According to the Pleasanton family income data, there are 30 families falling into the $15,000 to $24,999 income range, which is the most common income bracket and makes up 69.8% of all families.
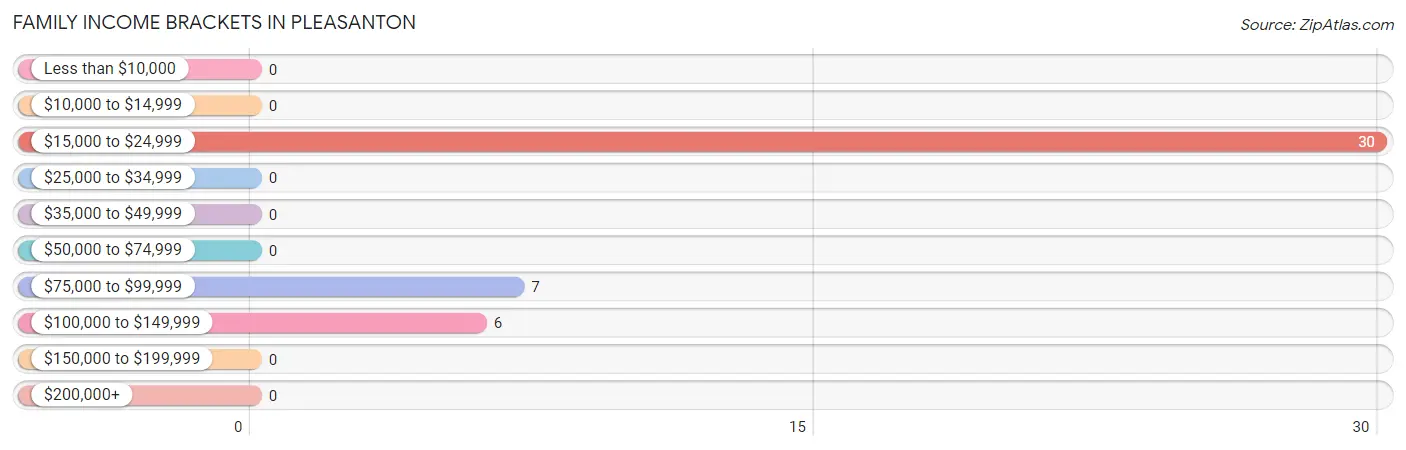
| Income Bracket | # Families | % Families |
| Less than $10,000 | 0 | 0.0% |
| $10,000 to $14,999 | 0 | 0.0% |
| $15,000 to $24,999 | 30 | 69.8% |
| $25,000 to $34,999 | 0 | 0.0% |
| $35,000 to $49,999 | 0 | 0.0% |
| $50,000 to $74,999 | 0 | 0.0% |
| $75,000 to $99,999 | 7 | 16.3% |
| $100,000 to $149,999 | 6 | 14.0% |
| $150,000 to $199,999 | 0 | 0.0% |
| $200,000+ | 0 | 0.0% |
Family Income by Famaliy Size in Pleasanton
| Income Bracket | # Families | Median Income |
| 2-Person Families | 43 (100.0%) | $0 |
| 3-Person Families | 0 (0.0%) | $0 |
| 4-Person Families | 0 (0.0%) | $0 |
| 5-Person Families | 0 (0.0%) | $0 |
| 6-Person Families | 0 (0.0%) | $0 |
| 7+ Person Families | 0 (0.0%) | $0 |
| Total | 43 (100.0%) | $0 |
Family Income by Number of Earners in Pleasanton
| Number of Earners | # Families | Median Income |
| No Earners | 7 (16.3%) | $0 |
| 1 Earner | 36 (83.7%) | $0 |
| 2 Earners | 0 (0.0%) | $0 |
| 3+ Earners | 0 (0.0%) | $0 |
| Total | 43 (100.0%) | $0 |
Household Income in Pleasanton
Household Income Brackets in Pleasanton
With 30 households falling in the category, the $35,000 to $49,999 income range is the most frequent in Pleasanton, accounting for 34.5% of all households.
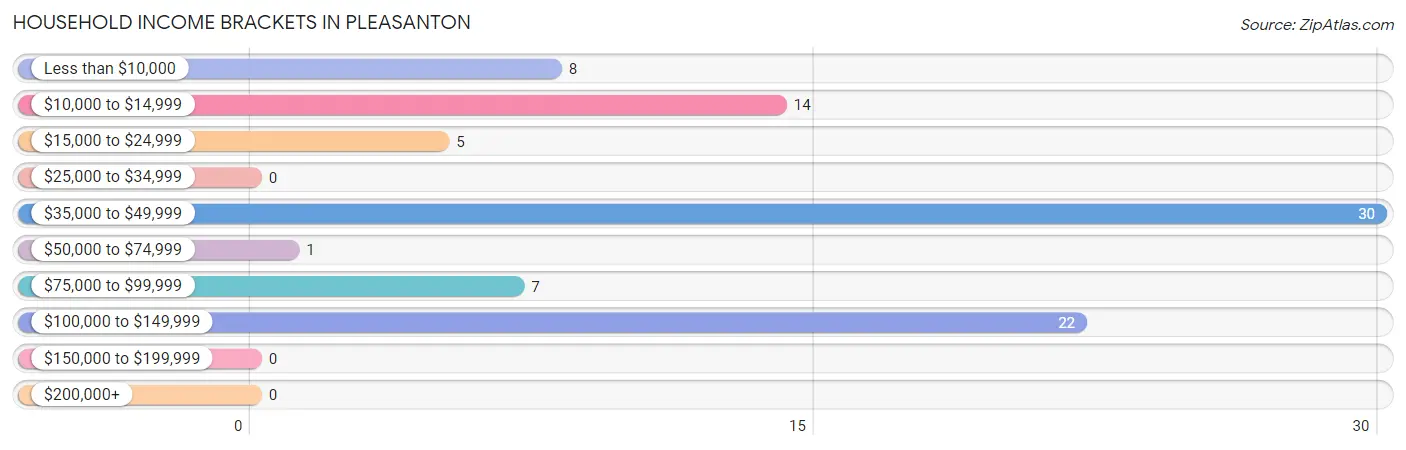
| Income Bracket | # Households | % Households |
| Less than $10,000 | 8 | 9.2% |
| $10,000 to $14,999 | 14 | 16.1% |
| $15,000 to $24,999 | 5 | 5.7% |
| $25,000 to $34,999 | 0 | 0.0% |
| $35,000 to $49,999 | 30 | 34.5% |
| $50,000 to $74,999 | 1 | 1.1% |
| $75,000 to $99,999 | 7 | 8.0% |
| $100,000 to $149,999 | 22 | 25.3% |
| $150,000 to $199,999 | 0 | 0.0% |
| $200,000+ | 0 | 0.0% |
Household Income by Householder Age in Pleasanton
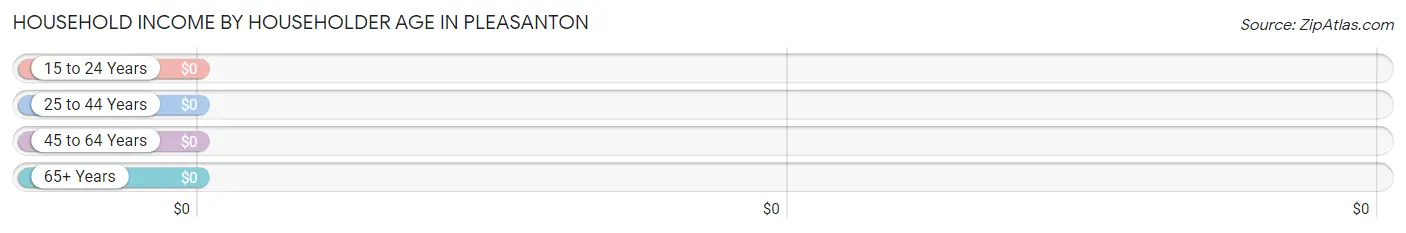
| Income Bracket | # Households | Median Income |
| 15 to 24 Years | 1 (1.1%) | $0 |
| 25 to 44 Years | 30 (34.5%) | $0 |
| 45 to 64 Years | 0 (0.0%) | $0 |
| 65+ Years | 56 (64.4%) | $0 |
| Total | 87 (100.0%) | $48,875 |
Poverty in Pleasanton
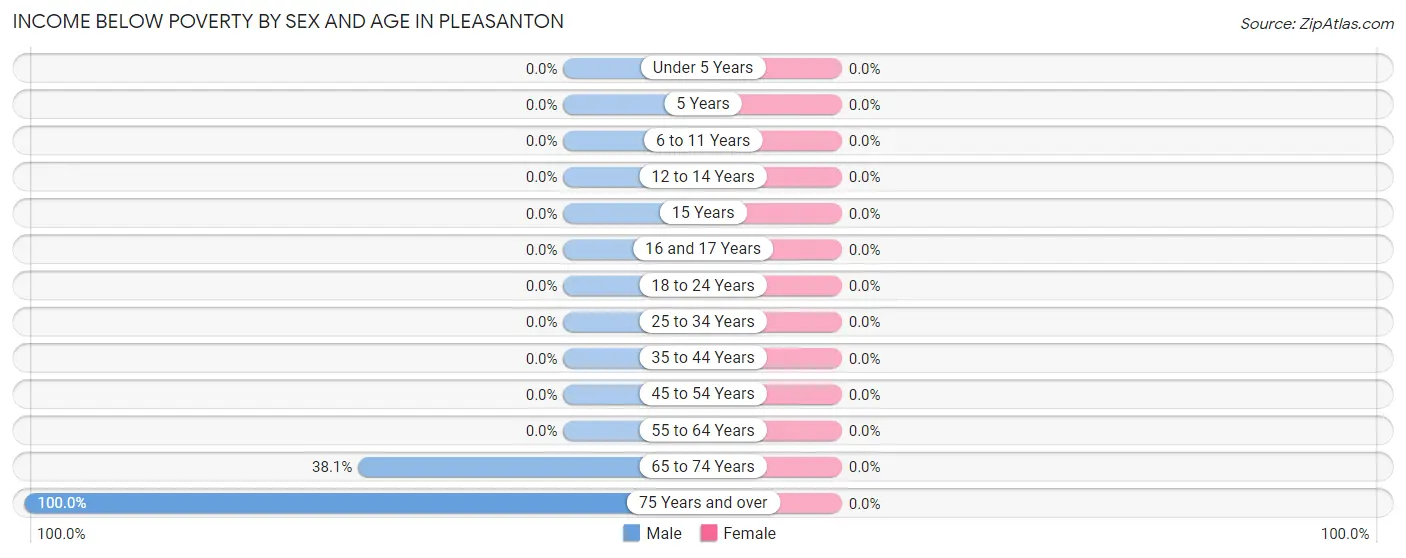
Income Below Poverty by Sex and Age in Pleasanton
| Age Bracket | Male | Female |
| Under 5 Years | 0 (0.0%) | 0 (0.0%) |
| 5 Years | 0 (0.0%) | 0 (0.0%) |
| 6 to 11 Years | 0 (0.0%) | 0 (0.0%) |
| 12 to 14 Years | 0 (0.0%) | 0 (0.0%) |
| 15 Years | 0 (0.0%) | 0 (0.0%) |
| 16 and 17 Years | 0 (0.0%) | 0 (0.0%) |
| 18 to 24 Years | 0 (0.0%) | 0 (0.0%) |
| 25 to 34 Years | 0 (0.0%) | 0 (0.0%) |
| 35 to 44 Years | 0 (0.0%) | 0 (0.0%) |
| 45 to 54 Years | 0 (0.0%) | 0 (0.0%) |
| 55 to 64 Years | 0 (0.0%) | 0 (0.0%) |
| 65 to 74 Years | 8 (38.1%) | 0 (0.0%) |
| 75 Years and over | 14 (100.0%) | 0 (0.0%) |
| Total | 22 (20.0%) | 0 (0.0%) |
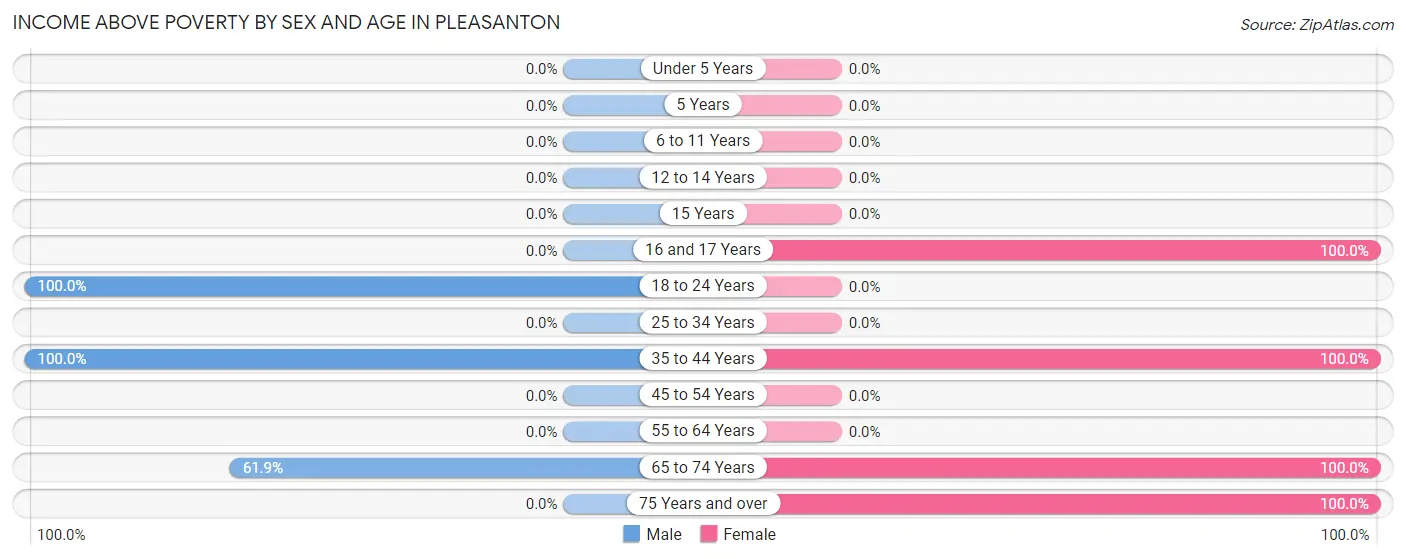
Income Above Poverty by Sex and Age in Pleasanton
According to the poverty statistics in Pleasanton, males aged 18 to 24 years and females aged 16 and 17 years are the age groups that are most secure financially, with 100.0% of males and 100.0% of females in these age groups living above the poverty line.
| Age Bracket | Male | Female |
| Under 5 Years | 0 (0.0%) | 0 (0.0%) |
| 5 Years | 0 (0.0%) | 0 (0.0%) |
| 6 to 11 Years | 0 (0.0%) | 0 (0.0%) |
| 12 to 14 Years | 0 (0.0%) | 0 (0.0%) |
| 15 Years | 0 (0.0%) | 0 (0.0%) |
| 16 and 17 Years | 0 (0.0%) | 39 (100.0%) |
| 18 to 24 Years | 1 (100.0%) | 0 (0.0%) |
| 25 to 34 Years | 0 (0.0%) | 0 (0.0%) |
| 35 to 44 Years | 74 (100.0%) | 30 (100.0%) |
| 45 to 54 Years | 0 (0.0%) | 0 (0.0%) |
| 55 to 64 Years | 0 (0.0%) | 0 (0.0%) |
| 65 to 74 Years | 13 (61.9%) | 29 (100.0%) |
| 75 Years and over | 0 (0.0%) | 5 (100.0%) |
| Total | 88 (80.0%) | 103 (100.0%) |
Income Below Poverty Among Married-Couple Families in Pleasanton
| Children | Above Poverty | Below Poverty |
| No Children | 13 (100.0%) | 0 (0.0%) |
| 1 or 2 Children | 0 (0.0%) | 0 (0.0%) |
| 3 or 4 Children | 0 (0.0%) | 0 (0.0%) |
| 5 or more Children | 0 (0.0%) | 0 (0.0%) |
| Total | 13 (100.0%) | 0 (0.0%) |
Income Below Poverty Among Single-Parent Households in Pleasanton
| Children | Single Father | Single Mother |
| No Children | 0 (0.0%) | 0 (0.0%) |
| 1 or 2 Children | 0 (0.0%) | 0 (0.0%) |
| 3 or 4 Children | 0 (0.0%) | 0 (0.0%) |
| 5 or more Children | 0 (0.0%) | 0 (0.0%) |
| Total | 0 (0.0%) | 0 (0.0%) |
Income Below Poverty Among Married-Couple vs Single-Parent Households in Pleasanton
| Children | Married-Couple Families | Single-Parent Households |
| No Children | 0 (0.0%) | 0 (0.0%) |
| 1 or 2 Children | 0 (0.0%) | 0 (0.0%) |
| 3 or 4 Children | 0 (0.0%) | 0 (0.0%) |
| 5 or more Children | 0 (0.0%) | 0 (0.0%) |
| Total | 0 (0.0%) | 0 (0.0%) |
Race in Pleasanton
The most populous races in Pleasanton are White / Caucasian (234 | 94.4%), Hispanic or Latino (14 | 5.7%), and Some other Race (14 | 5.7%).
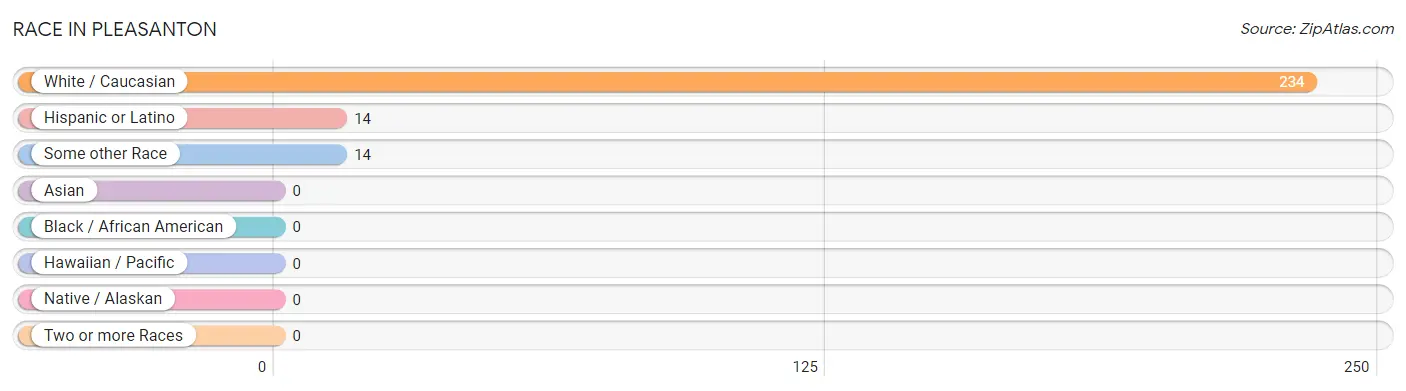
| Race | # Population | % Population |
| Asian | 0 | 0.0% |
| Black / African American | 0 | 0.0% |
| Hawaiian / Pacific | 0 | 0.0% |
| Hispanic or Latino | 14 | 5.7% |
| Native / Alaskan | 0 | 0.0% |
| White / Caucasian | 234 | 94.4% |
| Two or more Races | 0 | 0.0% |
| Some other Race | 14 | 5.7% |
| Total | 248 | 100.0% |
Ancestry in Pleasanton
The most populous ancestries reported in Pleasanton are German (76 | 30.6%), Colombian (14 | 5.7%), South American (14 | 5.7%), Northern European (8 | 3.2%), and Italian (7 | 2.8%), together accounting for 48.0% of all Pleasanton residents.
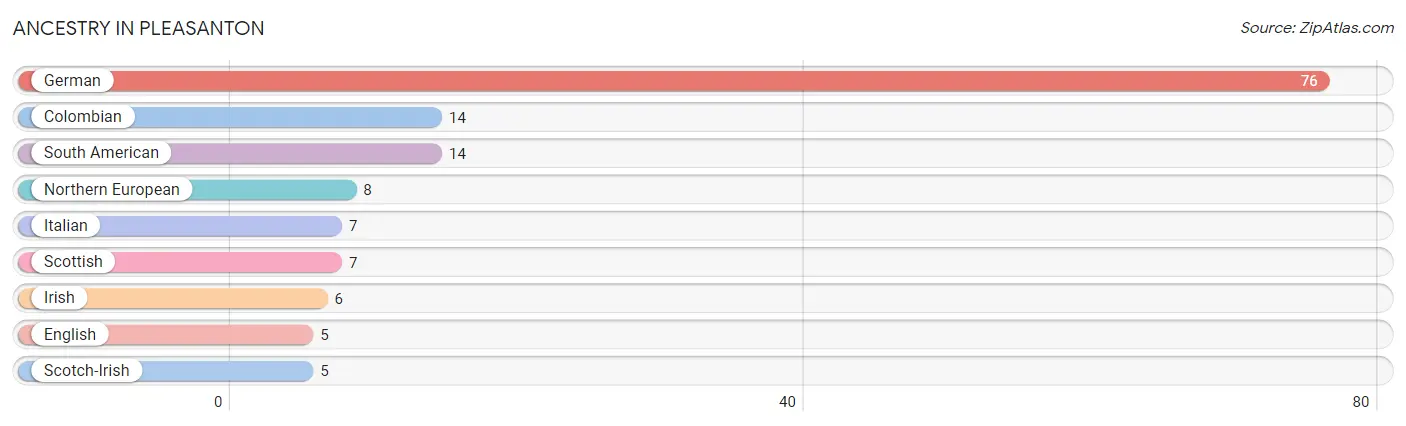
| Ancestry | # Population | % Population |
| Colombian | 14 | 5.7% |
| English | 5 | 2.0% |
| German | 76 | 30.6% |
| Irish | 6 | 2.4% |
| Italian | 7 | 2.8% |
| Northern European | 8 | 3.2% |
| Scotch-Irish | 5 | 2.0% |
| Scottish | 7 | 2.8% |
| South American | 14 | 5.7% | View All 9 Rows |
Immigrants in Pleasanton
The most numerous immigrant groups reported in Pleasanton came from Colombia (14 | 5.7%), Latin America (14 | 5.7%), South America (14 | 5.7%), Europe (7 | 2.8%), and Italy (7 | 2.8%), together accounting for 22.6% of all Pleasanton residents.
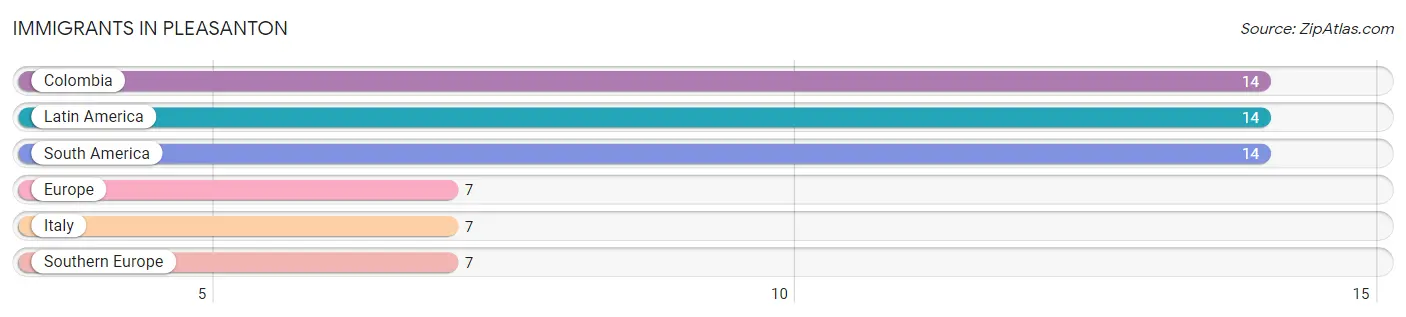
| Immigration Origin | # Population | % Population |
| Colombia | 14 | 5.7% |
| Europe | 7 | 2.8% |
| Italy | 7 | 2.8% |
| Latin America | 14 | 5.7% |
| South America | 14 | 5.7% |
| Southern Europe | 7 | 2.8% | View All 6 Rows |
Sex and Age in Pleasanton
Sex and Age in Pleasanton
The most populous age groups in Pleasanton are 35 to 39 Years (74 | 67.3%) for men and 15 to 19 Years (39 | 28.3%) for women.
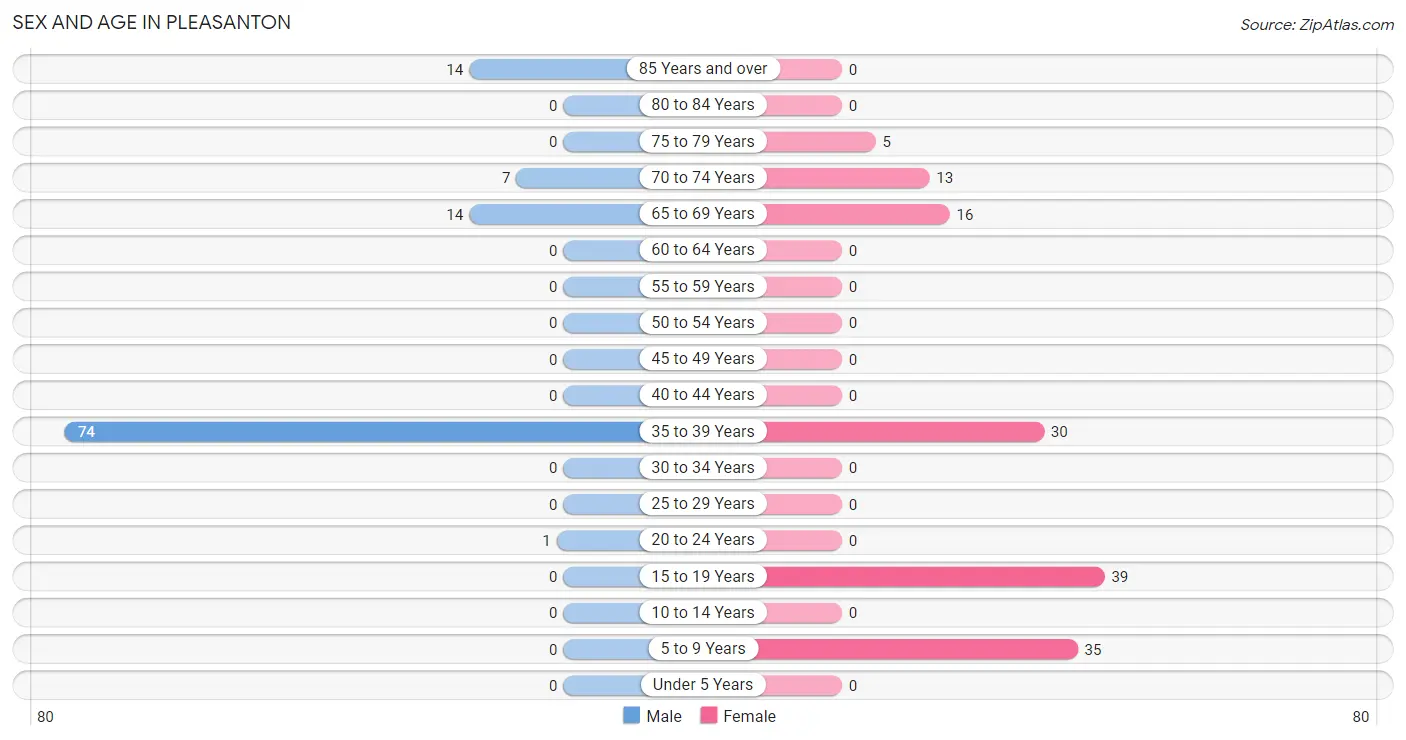
| Age Bracket | Male | Female |
| Under 5 Years | 0 (0.0%) | 0 (0.0%) |
| 5 to 9 Years | 0 (0.0%) | 35 (25.4%) |
| 10 to 14 Years | 0 (0.0%) | 0 (0.0%) |
| 15 to 19 Years | 0 (0.0%) | 39 (28.3%) |
| 20 to 24 Years | 1 (0.9%) | 0 (0.0%) |
| 25 to 29 Years | 0 (0.0%) | 0 (0.0%) |
| 30 to 34 Years | 0 (0.0%) | 0 (0.0%) |
| 35 to 39 Years | 74 (67.3%) | 30 (21.7%) |
| 40 to 44 Years | 0 (0.0%) | 0 (0.0%) |
| 45 to 49 Years | 0 (0.0%) | 0 (0.0%) |
| 50 to 54 Years | 0 (0.0%) | 0 (0.0%) |
| 55 to 59 Years | 0 (0.0%) | 0 (0.0%) |
| 60 to 64 Years | 0 (0.0%) | 0 (0.0%) |
| 65 to 69 Years | 14 (12.7%) | 16 (11.6%) |
| 70 to 74 Years | 7 (6.4%) | 13 (9.4%) |
| 75 to 79 Years | 0 (0.0%) | 5 (3.6%) |
| 80 to 84 Years | 0 (0.0%) | 0 (0.0%) |
| 85 Years and over | 14 (12.7%) | 0 (0.0%) |
| Total | 110 (100.0%) | 138 (100.0%) |
Families and Households in Pleasanton
Median Family Size in Pleasanton
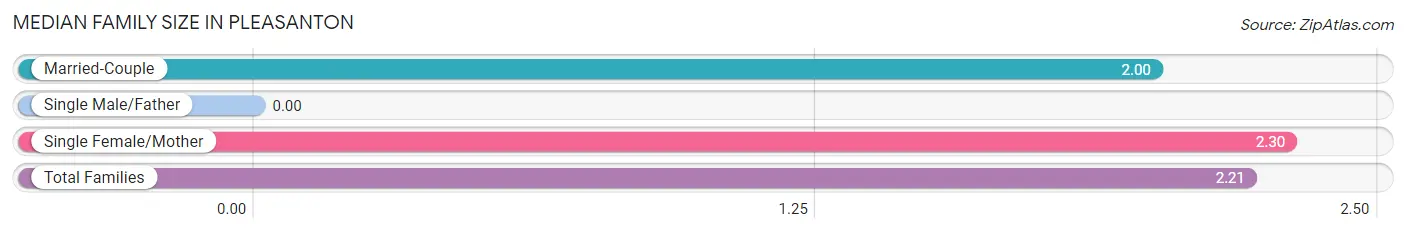
| Family Type | # Families | Family Size |
| Married-Couple | 13 (30.2%) | 2.00 |
| Single Male/Father | 0 (0.0%) | - |
| Single Female/Mother | 30 (69.8%) | 2.30 |
| Total Families | 43 (100.0%) | 2.21 |
Median Household Size in Pleasanton
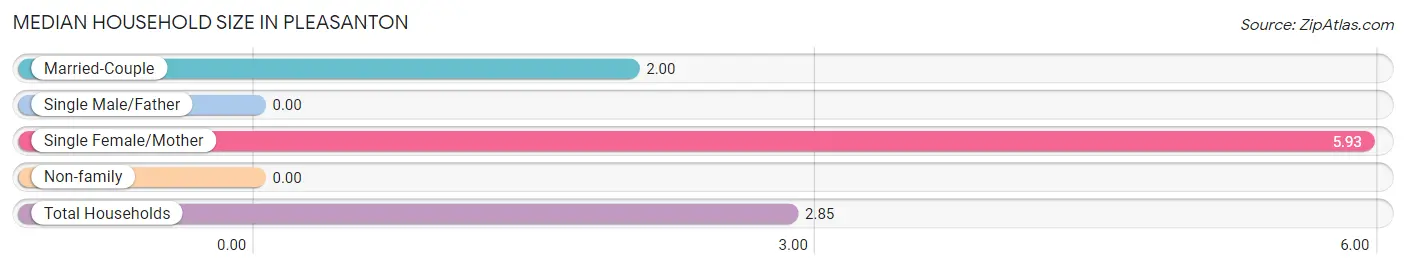
| Household Type | # Households | Household Size |
| Married-Couple | 13 (14.9%) | 2.00 |
| Single Male/Father | 0 (0.0%) | - |
| Single Female/Mother | 30 (34.5%) | 5.93 |
| Non-family | 44 (50.6%) | - |
| Total Households | 87 (100.0%) | 2.85 |
Household Size by Marriage Status in Pleasanton
Out of a total of 87 households in Pleasanton, 43 (49.4%) are family households, while 44 (50.6%) are nonfamily households. The most numerous type of family households are 4-person households, comprising 30, and the most common type of nonfamily households are 1-person households, comprising 44.
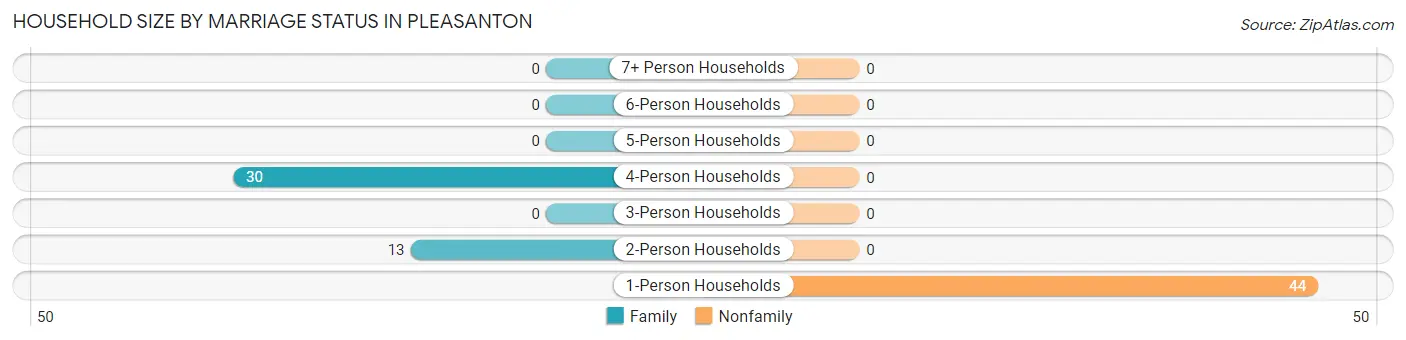
| Household Size | Family Households | Nonfamily Households |
| 1-Person Households | - | 44 (50.6%) |
| 2-Person Households | 13 (14.9%) | 0 (0.0%) |
| 3-Person Households | 0 (0.0%) | 0 (0.0%) |
| 4-Person Households | 30 (34.5%) | 0 (0.0%) |
| 5-Person Households | 0 (0.0%) | 0 (0.0%) |
| 6-Person Households | 0 (0.0%) | 0 (0.0%) |
| 7+ Person Households | 0 (0.0%) | 0 (0.0%) |
| Total | 43 (49.4%) | 44 (50.6%) |
Female Fertility in Pleasanton
Fertility by Age in Pleasanton
| Age Bracket | Women with Births | Births / 1,000 Women |
| 15 to 19 years | 0 (0.0%) | 0.0 |
| 20 to 34 years | 0 (0.0%) | 0.0 |
| 35 to 50 years | 0 (0.0%) | 0.0 |
| Total | 0 (0.0%) | 0.0 |
Fertility by Age by Marriage Status in Pleasanton
| Age Bracket | Married | Unmarried |
| 15 to 19 years | 0 (0.0%) | 0 (0.0%) |
| 20 to 34 years | 0 (0.0%) | 0 (0.0%) |
| 35 to 50 years | 0 (0.0%) | 0 (0.0%) |
| Total | 0 (0.0%) | 0 (0.0%) |
Fertility by Education in Pleasanton
| Educational Attainment | Women with Births | Births / 1,000 Women |
| Less than High School | 0 (0.0%) | 0.0 |
| High School Diploma | 0 (0.0%) | 0.0 |
| College or Associate's Degree | 0 (0.0%) | 0.0 |
| Bachelor's Degree | 0 (0.0%) | 0.0 |
| Graduate Degree | 0 (0.0%) | 0.0 |
| Total | 0 (0.0%) | 0.0 |
Fertility by Education by Marriage Status in Pleasanton
| Educational Attainment | Married | Unmarried |
| Less than High School | 0 (0.0%) | 0 (0.0%) |
| High School Diploma | 0 (0.0%) | 0 (0.0%) |
| College or Associate's Degree | 0 (0.0%) | 0 (0.0%) |
| Bachelor's Degree | 0 (0.0%) | 0 (0.0%) |
| Graduate Degree | 0 (0.0%) | 0 (0.0%) |
| Total | 0 (0.0%) | 0 (0.0%) |
Employment Characteristics in Pleasanton
Employment by Class of Employer in Pleasanton
Among the 111 employed individuals in Pleasanton, private company employees (110 | 99.1%), and state government employees (1 | 0.9%) make up the most common classes of employment.
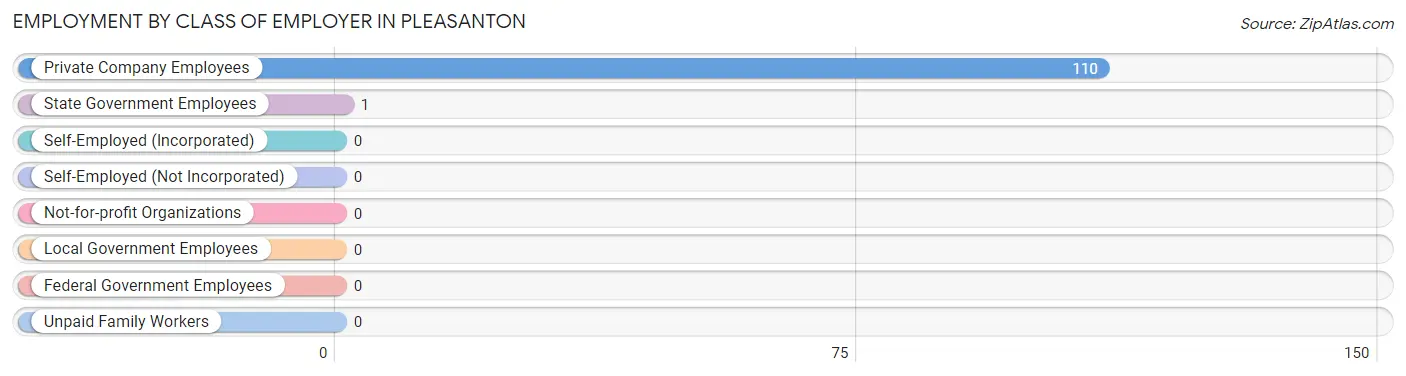
| Employer Class | # Employees | % Employees |
| Private Company Employees | 110 | 99.1% |
| Self-Employed (Incorporated) | 0 | 0.0% |
| Self-Employed (Not Incorporated) | 0 | 0.0% |
| Not-for-profit Organizations | 0 | 0.0% |
| Local Government Employees | 0 | 0.0% |
| State Government Employees | 1 | 0.9% |
| Federal Government Employees | 0 | 0.0% |
| Unpaid Family Workers | 0 | 0.0% |
| Total | 111 | 100.0% |
Employment Status by Age in Pleasanton
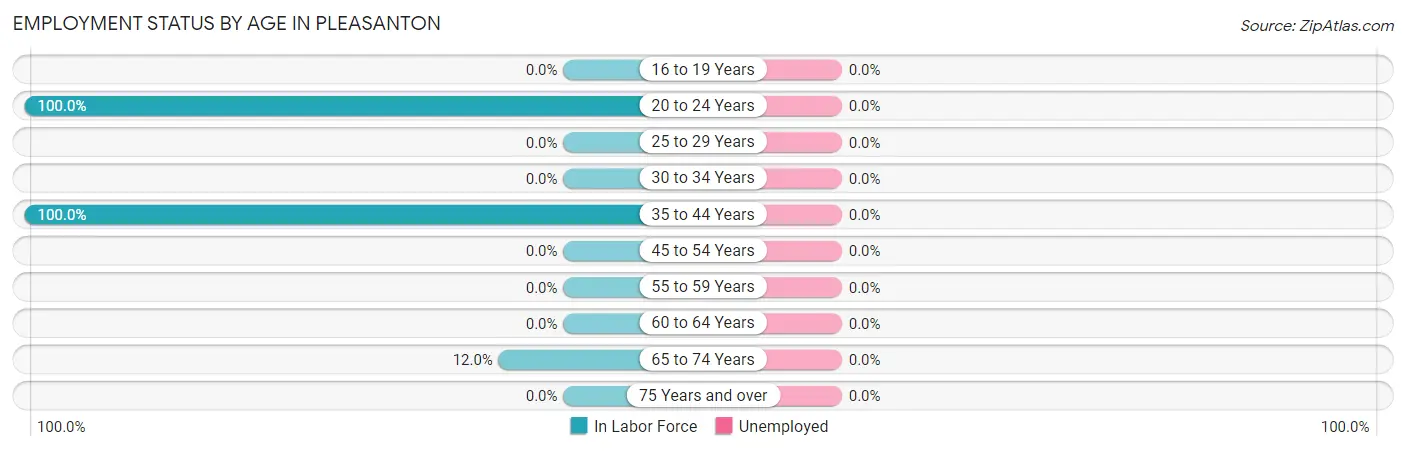
| Age Bracket | In Labor Force | Unemployed |
| 16 to 19 Years | 0 (0.0%) | 0 (0.0%) |
| 20 to 24 Years | 1 (100.0%) | 0 (0.0%) |
| 25 to 29 Years | 0 (0.0%) | 0 (0.0%) |
| 30 to 34 Years | 0 (0.0%) | 0 (0.0%) |
| 35 to 44 Years | 104 (100.0%) | 0 (0.0%) |
| 45 to 54 Years | 0 (0.0%) | 0 (0.0%) |
| 55 to 59 Years | 0 (0.0%) | 0 (0.0%) |
| 60 to 64 Years | 0 (0.0%) | 0 (0.0%) |
| 65 to 74 Years | 6 (12.0%) | 0 (0.0%) |
| 75 Years and over | 0 (0.0%) | 0 (0.0%) |
| Total | 111 (52.1%) | 0 (0.0%) |
Employment Status by Educational Attainment in Pleasanton
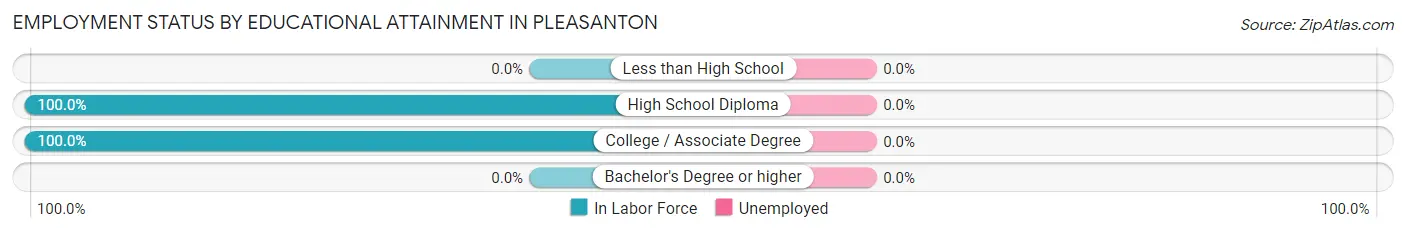
| Educational Attainment | In Labor Force | Unemployed |
| Less than High School | 0 (0.0%) | 0 (0.0%) |
| High School Diploma | 74 (100.0%) | 0 (0.0%) |
| College / Associate Degree | 30 (100.0%) | 0 (0.0%) |
| Bachelor's Degree or higher | 0 (0.0%) | 0 (0.0%) |
| Total | 104 (100.0%) | 0 (0.0%) |
Employment Occupations by Sex in Pleasanton
Management, Business, Science and Arts Occupations
The most common Management, Business, Science and Arts occupations in Pleasanton are , and Management (6 | 5.4%).
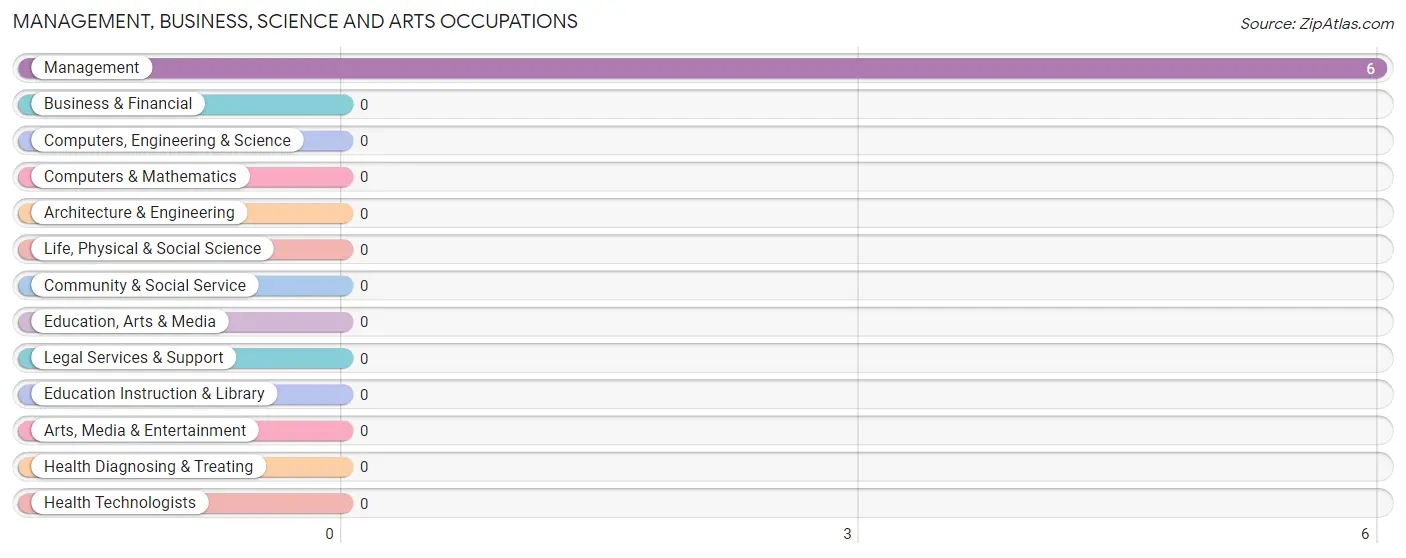
Management, Business, Science and Arts Occupations by Sex
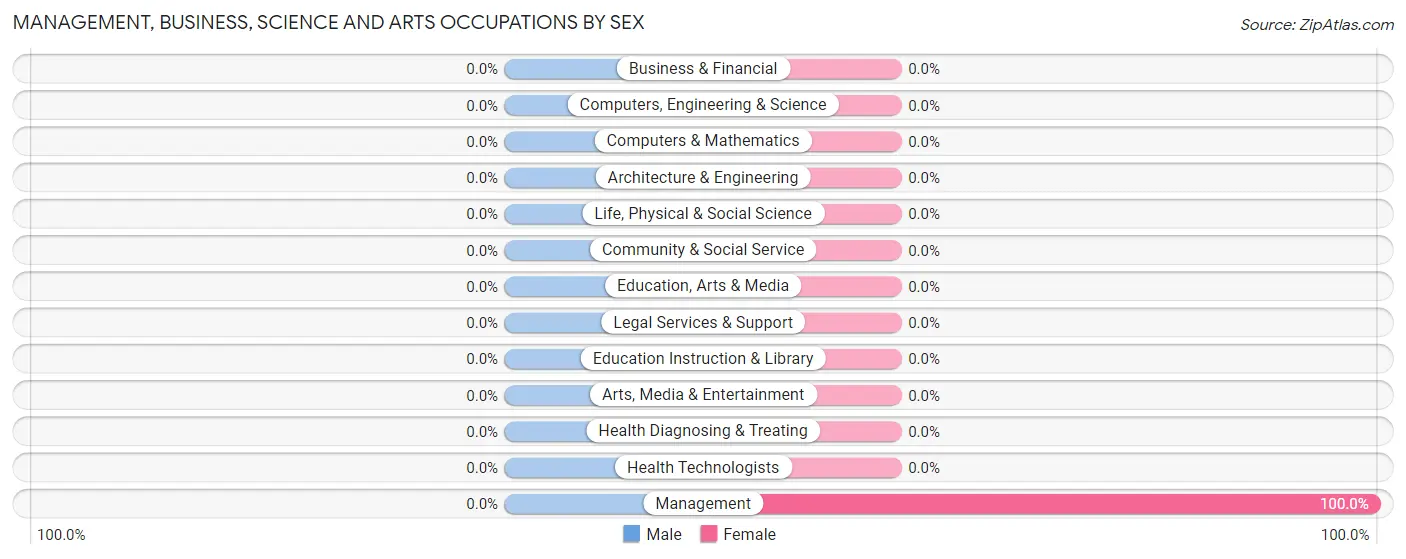
| Occupation | Male | Female |
| Management | 0 (0.0%) | 6 (100.0%) |
| Business & Financial | 0 (0.0%) | 0 (0.0%) |
| Computers, Engineering & Science | 0 (0.0%) | 0 (0.0%) |
| Computers & Mathematics | 0 (0.0%) | 0 (0.0%) |
| Architecture & Engineering | 0 (0.0%) | 0 (0.0%) |
| Life, Physical & Social Science | 0 (0.0%) | 0 (0.0%) |
| Community & Social Service | 0 (0.0%) | 0 (0.0%) |
| Education, Arts & Media | 0 (0.0%) | 0 (0.0%) |
| Legal Services & Support | 0 (0.0%) | 0 (0.0%) |
| Education Instruction & Library | 0 (0.0%) | 0 (0.0%) |
| Arts, Media & Entertainment | 0 (0.0%) | 0 (0.0%) |
| Health Diagnosing & Treating | 0 (0.0%) | 0 (0.0%) |
| Health Technologists | 0 (0.0%) | 0 (0.0%) |
| Total (Category) | 0 (0.0%) | 6 (100.0%) |
| Total (Overall) | 75 (67.6%) | 36 (32.4%) |
Services Occupations
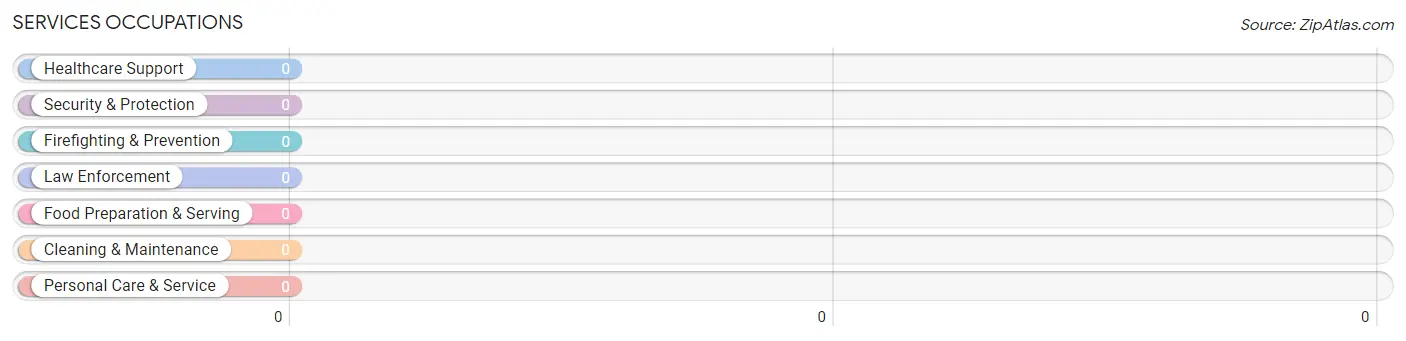
Services Occupations by Sex
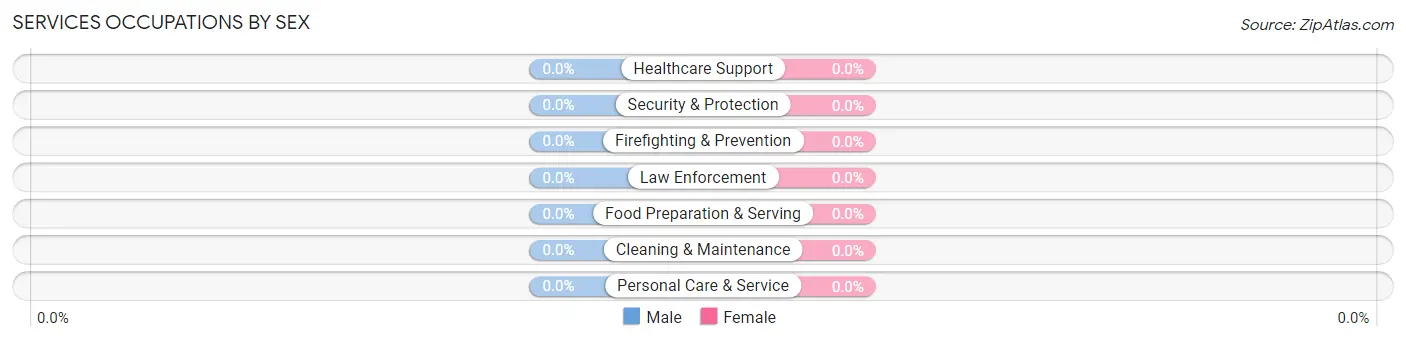
| Occupation | Male | Female |
| Healthcare Support | 0 (0.0%) | 0 (0.0%) |
| Security & Protection | 0 (0.0%) | 0 (0.0%) |
| Firefighting & Prevention | 0 (0.0%) | 0 (0.0%) |
| Law Enforcement | 0 (0.0%) | 0 (0.0%) |
| Food Preparation & Serving | 0 (0.0%) | 0 (0.0%) |
| Cleaning & Maintenance | 0 (0.0%) | 0 (0.0%) |
| Personal Care & Service | 0 (0.0%) | 0 (0.0%) |
| Total (Category) | 0 (0.0%) | 0 (0.0%) |
| Total (Overall) | 75 (67.6%) | 36 (32.4%) |
Sales and Office Occupations
The most common Sales and Office occupations in Pleasanton are , and Office & Administration (30 | 27.0%).
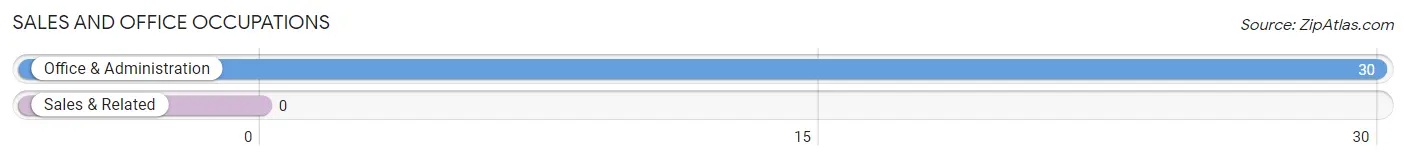
Sales and Office Occupations by Sex
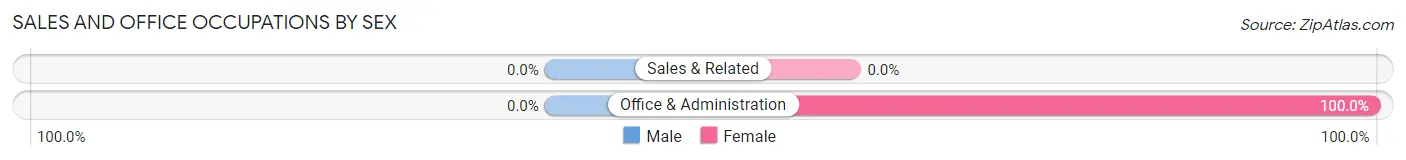
| Occupation | Male | Female |
| Sales & Related | 0 (0.0%) | 0 (0.0%) |
| Office & Administration | 0 (0.0%) | 30 (100.0%) |
| Total (Category) | 0 (0.0%) | 30 (100.0%) |
| Total (Overall) | 75 (67.6%) | 36 (32.4%) |
Natural Resources, Construction and Maintenance Occupations
The most common Natural Resources, Construction and Maintenance occupations in Pleasanton are Installation, Maintenance & Repair (74 | 66.7%), and Construction & Extraction (1 | 0.9%).
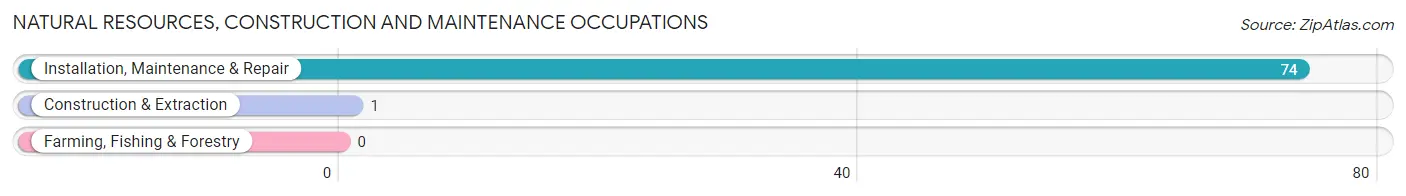
Natural Resources, Construction and Maintenance Occupations by Sex
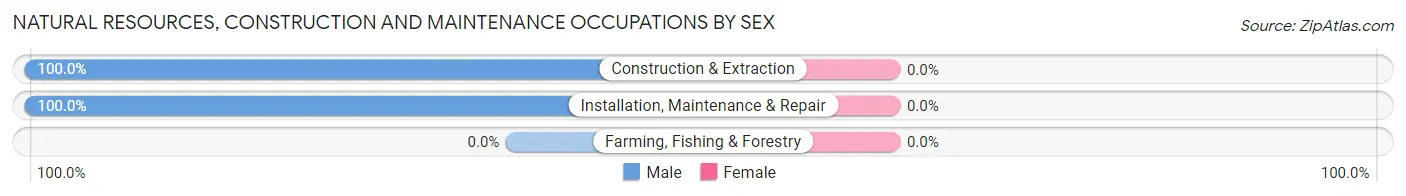
| Occupation | Male | Female |
| Farming, Fishing & Forestry | 0 (0.0%) | 0 (0.0%) |
| Construction & Extraction | 1 (100.0%) | 0 (0.0%) |
| Installation, Maintenance & Repair | 74 (100.0%) | 0 (0.0%) |
| Total (Category) | 75 (100.0%) | 0 (0.0%) |
| Total (Overall) | 75 (67.6%) | 36 (32.4%) |
Production, Transportation and Moving Occupations
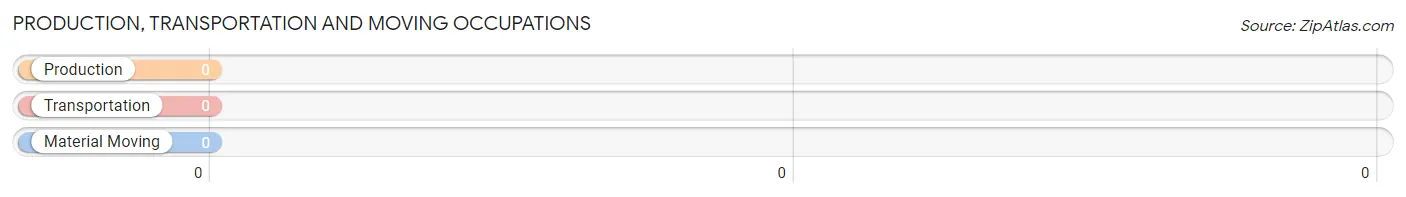
Production, Transportation and Moving Occupations by Sex
| Occupation | Male | Female |
| Production | 0 (0.0%) | 0 (0.0%) |
| Transportation | 0 (0.0%) | 0 (0.0%) |
| Material Moving | 0 (0.0%) | 0 (0.0%) |
| Total (Category) | 0 (0.0%) | 0 (0.0%) |
| Total (Overall) | 75 (67.6%) | 36 (32.4%) |
Employment Industries by Sex in Pleasanton
Employment Industries in Pleasanton
The major employment industries in Pleasanton include Manufacturing (104 | 93.7%), Health Care & Social Assistance (6 | 5.4%), and Construction (1 | 0.9%).
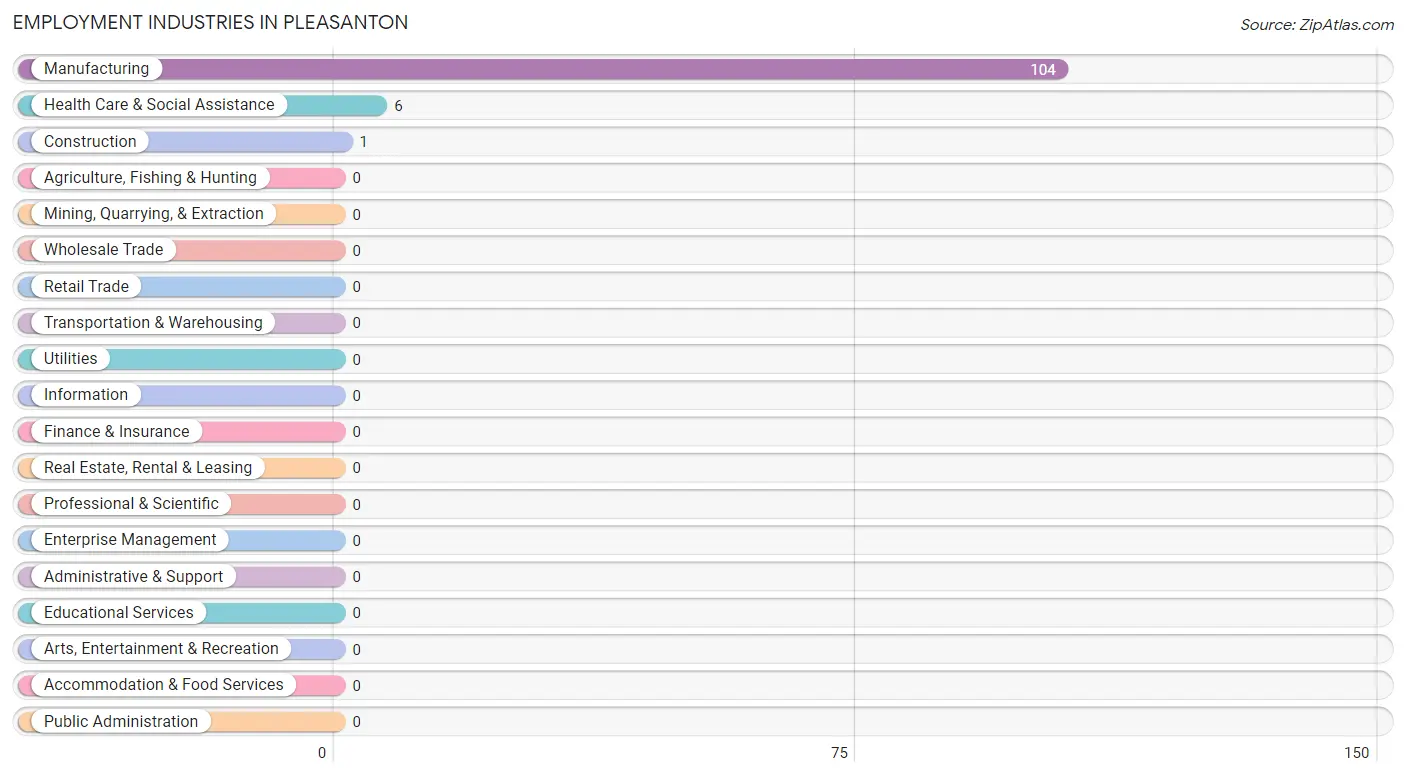
Employment Industries by Sex in Pleasanton
The Pleasanton industries that see more men than women are Construction (100.0%), and Manufacturing (71.2%), whereas the industries that tend to have a higher number of women are Health Care & Social Assistance (100.0%), and Manufacturing (28.8%).
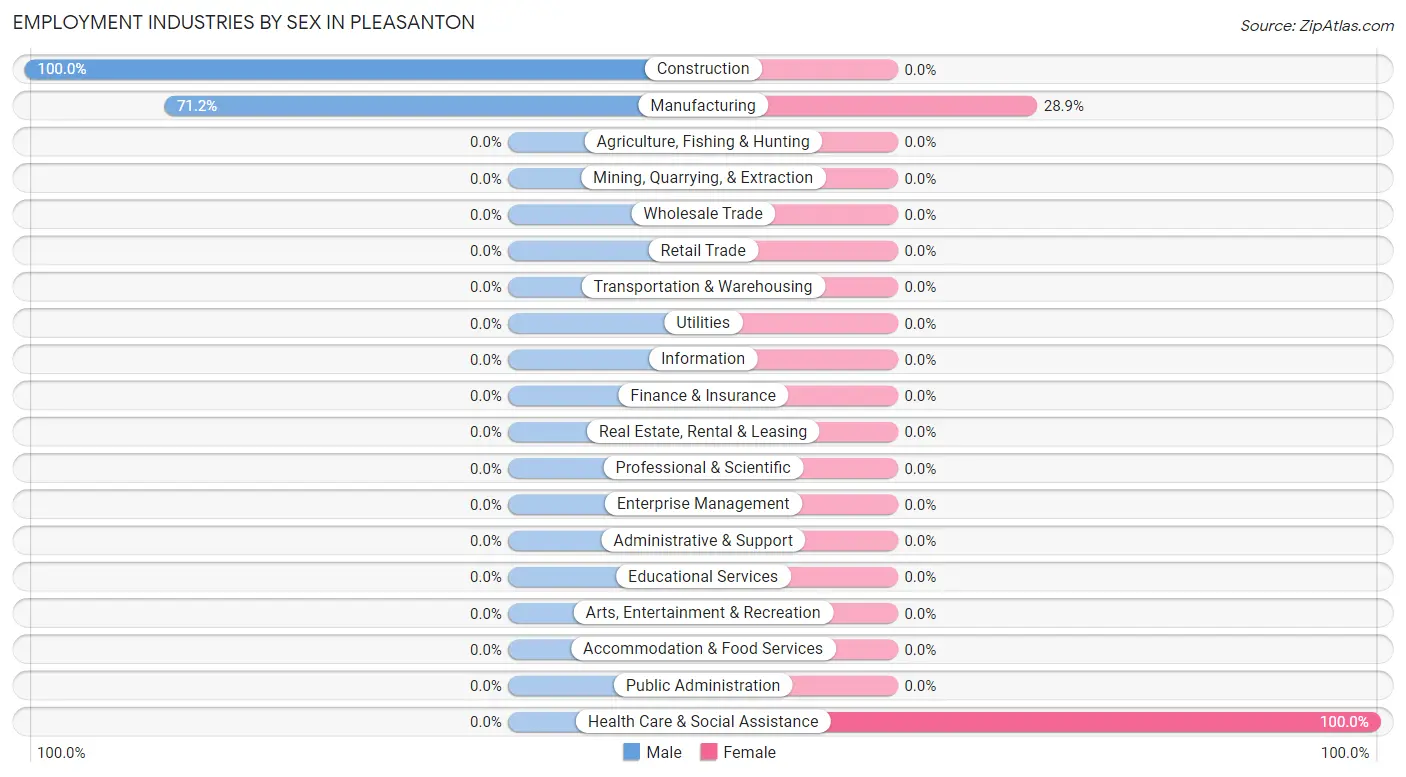
| Industry | Male | Female |
| Agriculture, Fishing & Hunting | 0 (0.0%) | 0 (0.0%) |
| Mining, Quarrying, & Extraction | 0 (0.0%) | 0 (0.0%) |
| Construction | 1 (100.0%) | 0 (0.0%) |
| Manufacturing | 74 (71.2%) | 30 (28.8%) |
| Wholesale Trade | 0 (0.0%) | 0 (0.0%) |
| Retail Trade | 0 (0.0%) | 0 (0.0%) |
| Transportation & Warehousing | 0 (0.0%) | 0 (0.0%) |
| Utilities | 0 (0.0%) | 0 (0.0%) |
| Information | 0 (0.0%) | 0 (0.0%) |
| Finance & Insurance | 0 (0.0%) | 0 (0.0%) |
| Real Estate, Rental & Leasing | 0 (0.0%) | 0 (0.0%) |
| Professional & Scientific | 0 (0.0%) | 0 (0.0%) |
| Enterprise Management | 0 (0.0%) | 0 (0.0%) |
| Administrative & Support | 0 (0.0%) | 0 (0.0%) |
| Educational Services | 0 (0.0%) | 0 (0.0%) |
| Health Care & Social Assistance | 0 (0.0%) | 6 (100.0%) |
| Arts, Entertainment & Recreation | 0 (0.0%) | 0 (0.0%) |
| Accommodation & Food Services | 0 (0.0%) | 0 (0.0%) |
| Public Administration | 0 (0.0%) | 0 (0.0%) |
| Total | 75 (67.6%) | 36 (32.4%) |
Education in Pleasanton
School Enrollment in Pleasanton
The most common levels of schooling among the 74 students in Pleasanton are high school (39 | 52.7%), and kindergarten (35 | 47.3%).
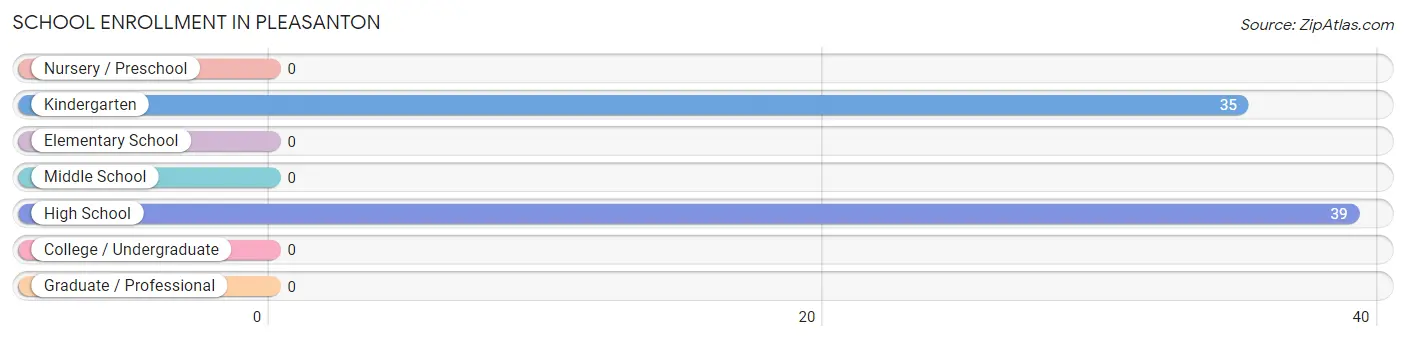
| School Level | # Students | % Students |
| Nursery / Preschool | 0 | 0.0% |
| Kindergarten | 35 | 47.3% |
| Elementary School | 0 | 0.0% |
| Middle School | 0 | 0.0% |
| High School | 39 | 52.7% |
| College / Undergraduate | 0 | 0.0% |
| Graduate / Professional | 0 | 0.0% |
| Total | 74 | 100.0% |
School Enrollment by Age by Funding Source in Pleasanton
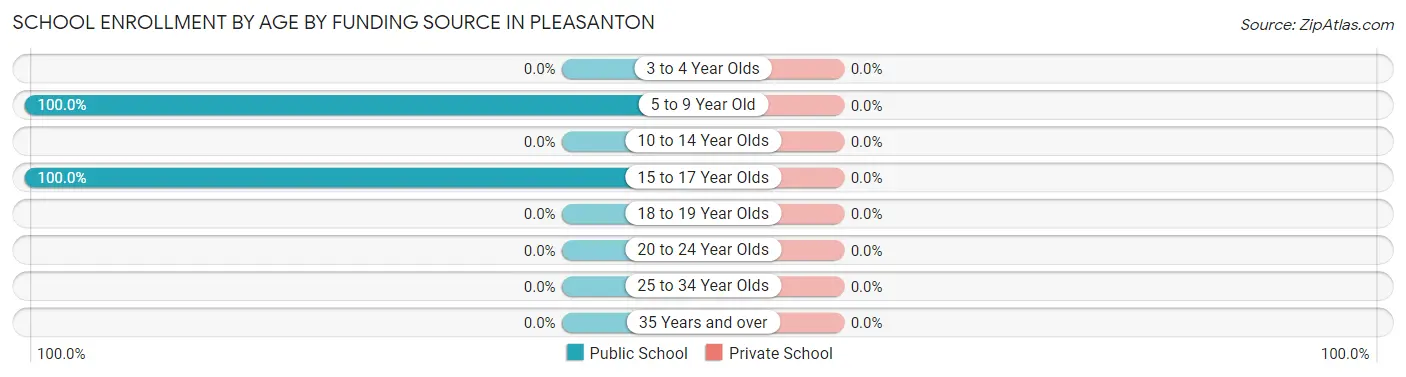
| Age Bracket | Public School | Private School |
| 3 to 4 Year Olds | 0 (0.0%) | 0 (0.0%) |
| 5 to 9 Year Old | 35 (100.0%) | 0 (0.0%) |
| 10 to 14 Year Olds | 0 (0.0%) | 0 (0.0%) |
| 15 to 17 Year Olds | 39 (100.0%) | 0 (0.0%) |
| 18 to 19 Year Olds | 0 (0.0%) | 0 (0.0%) |
| 20 to 24 Year Olds | 0 (0.0%) | 0 (0.0%) |
| 25 to 34 Year Olds | 0 (0.0%) | 0 (0.0%) |
| 35 Years and over | 0 (0.0%) | 0 (0.0%) |
| Total | 74 (100.0%) | 0 (0.0%) |
Educational Attainment by Field of Study in Pleasanton
Communications (16 | 37.2%), liberal arts & history (8 | 18.6%), computers & mathematics (7 | 16.3%), social sciences (6 | 14.0%), and arts & humanities (6 | 14.0%) are the most common fields of study among 43 individuals in Pleasanton who have obtained a bachelor's degree or higher.
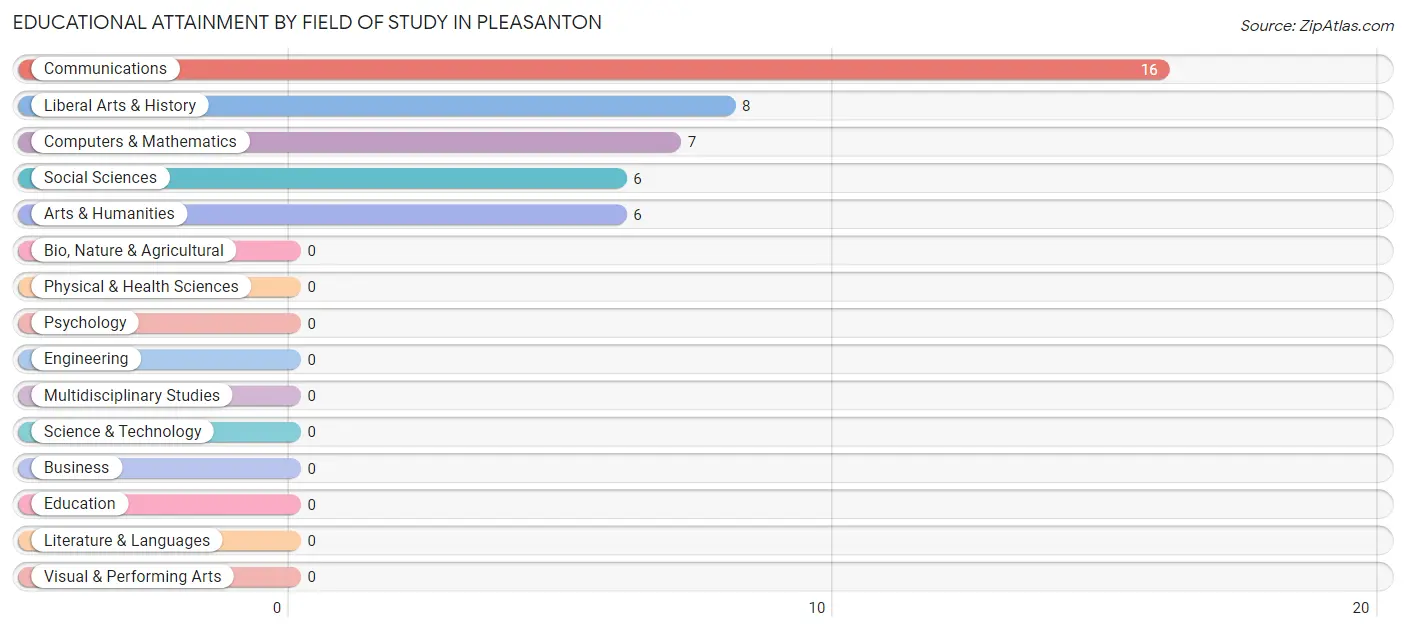
| Field of Study | # Graduates | % Graduates |
| Computers & Mathematics | 7 | 16.3% |
| Bio, Nature & Agricultural | 0 | 0.0% |
| Physical & Health Sciences | 0 | 0.0% |
| Psychology | 0 | 0.0% |
| Social Sciences | 6 | 14.0% |
| Engineering | 0 | 0.0% |
| Multidisciplinary Studies | 0 | 0.0% |
| Science & Technology | 0 | 0.0% |
| Business | 0 | 0.0% |
| Education | 0 | 0.0% |
| Literature & Languages | 0 | 0.0% |
| Liberal Arts & History | 8 | 18.6% |
| Visual & Performing Arts | 0 | 0.0% |
| Communications | 16 | 37.2% |
| Arts & Humanities | 6 | 14.0% |
| Total | 43 | 100.0% |
Transportation & Commute in Pleasanton
Vehicle Availability by Sex in Pleasanton
The most prevalent vehicle ownership categories in Pleasanton are males with 4 vehicles (74, accounting for 98.7%) and females with 4 vehicles (30, making up 205.6%).
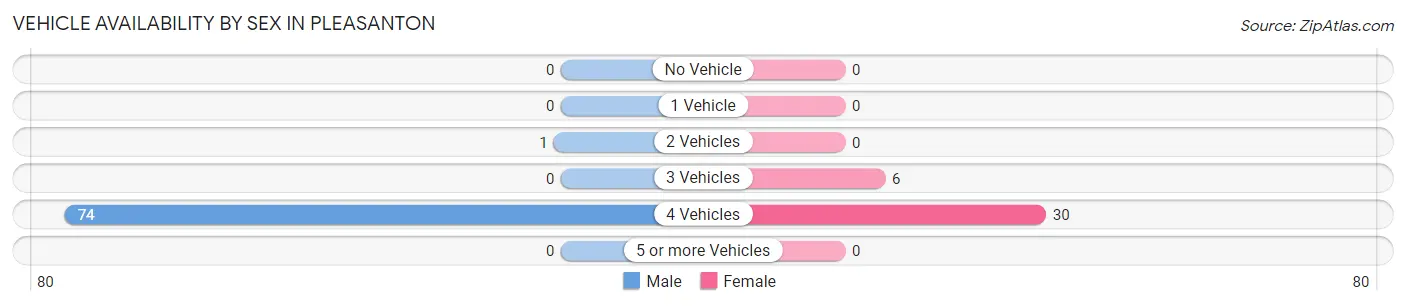
| Vehicles Available | Male | Female |
| No Vehicle | 0 (0.0%) | 0 (0.0%) |
| 1 Vehicle | 0 (0.0%) | 0 (0.0%) |
| 2 Vehicles | 1 (1.3%) | 0 (0.0%) |
| 3 Vehicles | 0 (0.0%) | 6 (16.7%) |
| 4 Vehicles | 74 (98.7%) | 30 (83.3%) |
| 5 or more Vehicles | 0 (0.0%) | 0 (0.0%) |
| Total | 75 (100.0%) | 36 (100.0%) |
Commute Time in Pleasanton
The most frequently occuring commute durations in Pleasanton are less than 5 minutes (80 commuters, 72.1%), 30 to 34 minutes (30 commuters, 27.0%), and 90 or more minutes (1 commuters, 0.9%).
| Commute Time | # Commuters | % Commuters |
| Less than 5 Minutes | 80 | 72.1% |
| 5 to 9 Minutes | 0 | 0.0% |
| 10 to 14 Minutes | 0 | 0.0% |
| 15 to 19 Minutes | 0 | 0.0% |
| 20 to 24 Minutes | 0 | 0.0% |
| 25 to 29 Minutes | 0 | 0.0% |
| 30 to 34 Minutes | 30 | 27.0% |
| 35 to 39 Minutes | 0 | 0.0% |
| 40 to 44 Minutes | 0 | 0.0% |
| 45 to 59 Minutes | 0 | 0.0% |
| 60 to 89 Minutes | 0 | 0.0% |
| 90 or more Minutes | 1 | 0.9% |
Commute Time by Sex in Pleasanton
The most common commute times in Pleasanton are less than 5 minutes (74 commuters, 98.7%) for males and 30 to 34 minutes (30 commuters, 83.3%) for females.
| Commute Time | Male | Female |
| Less than 5 Minutes | 74 (98.7%) | 6 (16.7%) |
| 5 to 9 Minutes | 0 (0.0%) | 0 (0.0%) |
| 10 to 14 Minutes | 0 (0.0%) | 0 (0.0%) |
| 15 to 19 Minutes | 0 (0.0%) | 0 (0.0%) |
| 20 to 24 Minutes | 0 (0.0%) | 0 (0.0%) |
| 25 to 29 Minutes | 0 (0.0%) | 0 (0.0%) |
| 30 to 34 Minutes | 0 (0.0%) | 30 (83.3%) |
| 35 to 39 Minutes | 0 (0.0%) | 0 (0.0%) |
| 40 to 44 Minutes | 0 (0.0%) | 0 (0.0%) |
| 45 to 59 Minutes | 0 (0.0%) | 0 (0.0%) |
| 60 to 89 Minutes | 0 (0.0%) | 0 (0.0%) |
| 90 or more Minutes | 1 (1.3%) | 0 (0.0%) |
Time of Departure to Work by Sex in Pleasanton
The most frequent times of departure to work in Pleasanton are 7:30 AM to 7:59 AM (74, 98.7%) for males and 9:00 AM to 9:59 AM (36, 100.0%) for females.
| Time of Departure | Male | Female |
| 12:00 AM to 4:59 AM | 0 (0.0%) | 0 (0.0%) |
| 5:00 AM to 5:29 AM | 0 (0.0%) | 0 (0.0%) |
| 5:30 AM to 5:59 AM | 0 (0.0%) | 0 (0.0%) |
| 6:00 AM to 6:29 AM | 0 (0.0%) | 0 (0.0%) |
| 6:30 AM to 6:59 AM | 0 (0.0%) | 0 (0.0%) |
| 7:00 AM to 7:29 AM | 0 (0.0%) | 0 (0.0%) |
| 7:30 AM to 7:59 AM | 74 (98.7%) | 0 (0.0%) |
| 8:00 AM to 8:29 AM | 0 (0.0%) | 0 (0.0%) |
| 8:30 AM to 8:59 AM | 0 (0.0%) | 0 (0.0%) |
| 9:00 AM to 9:59 AM | 0 (0.0%) | 36 (100.0%) |
| 10:00 AM to 10:59 AM | 0 (0.0%) | 0 (0.0%) |
| 11:00 AM to 11:59 AM | 0 (0.0%) | 0 (0.0%) |
| 12:00 PM to 3:59 PM | 0 (0.0%) | 0 (0.0%) |
| 4:00 PM to 11:59 PM | 1 (1.3%) | 0 (0.0%) |
| Total | 75 (100.0%) | 36 (100.0%) |
Housing Occupancy in Pleasanton
Occupancy by Ownership in Pleasanton
Of the total 87 dwellings in Pleasanton, owner-occupied units account for 68 (78.2%), while renter-occupied units make up 19 (21.8%).
| Occupancy | # Housing Units | % Housing Units |
| Owner Occupied Housing Units | 68 | 78.2% |
| Renter-Occupied Housing Units | 19 | 21.8% |
| Total Occupied Housing Units | 87 | 100.0% |
Occupancy by Household Size in Pleasanton
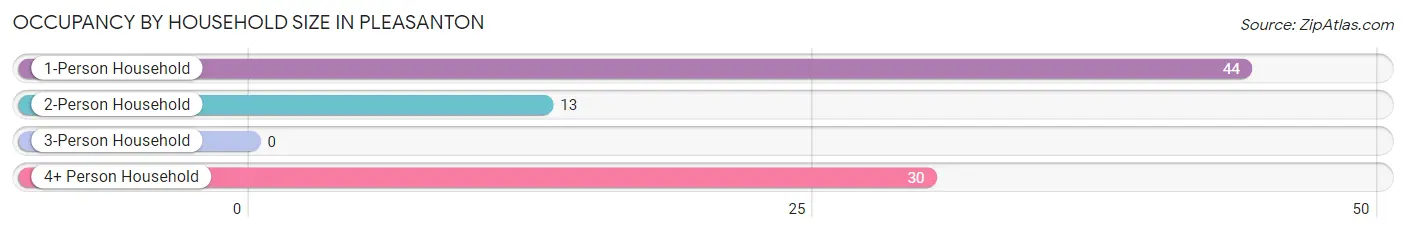
| Household Size | # Housing Units | % Housing Units |
| 1-Person Household | 44 | 50.6% |
| 2-Person Household | 13 | 14.9% |
| 3-Person Household | 0 | 0.0% |
| 4+ Person Household | 30 | 34.5% |
| Total Housing Units | 87 | 100.0% |
Occupancy by Ownership by Household Size in Pleasanton
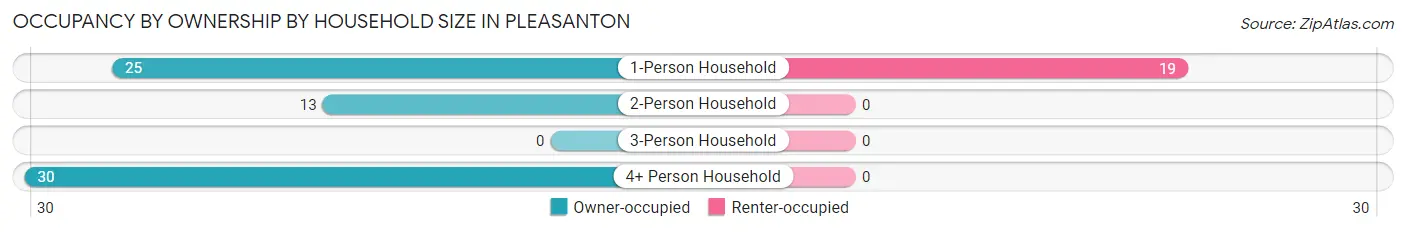
| Household Size | Owner-occupied | Renter-occupied |
| 1-Person Household | 25 (56.8%) | 19 (43.2%) |
| 2-Person Household | 13 (100.0%) | 0 (0.0%) |
| 3-Person Household | 0 (0.0%) | 0 (0.0%) |
| 4+ Person Household | 30 (100.0%) | 0 (0.0%) |
| Total Housing Units | 68 (78.2%) | 19 (21.8%) |
Occupancy by Educational Attainment in Pleasanton
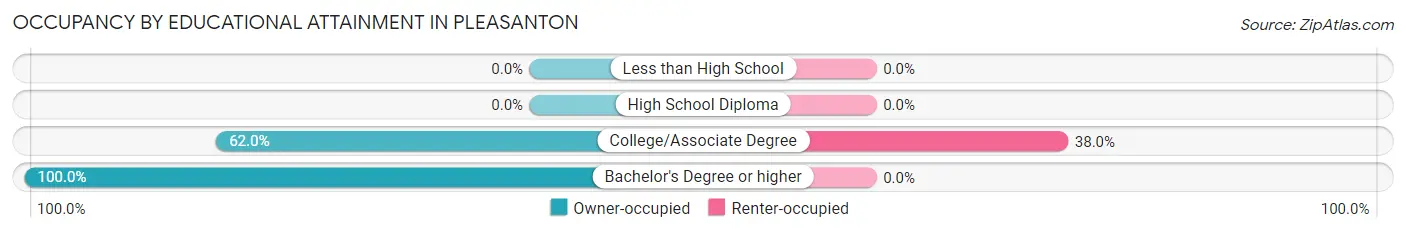
| Household Size | Owner-occupied | Renter-occupied |
| Less than High School | 0 (0.0%) | 0 (0.0%) |
| High School Diploma | 0 (0.0%) | 0 (0.0%) |
| College/Associate Degree | 31 (62.0%) | 19 (38.0%) |
| Bachelor's Degree or higher | 37 (100.0%) | 0 (0.0%) |
Occupancy by Age of Householder in Pleasanton
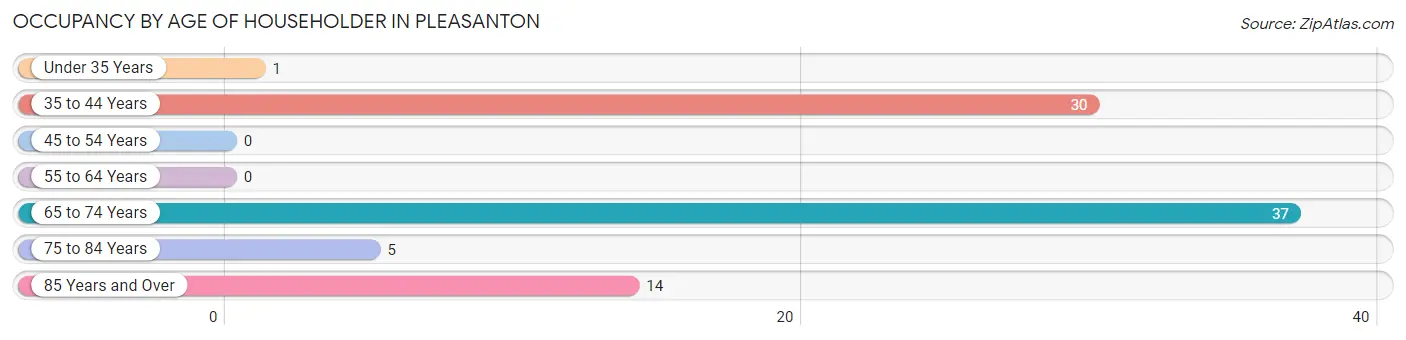
| Age Bracket | # Households | % Households |
| Under 35 Years | 1 | 1.1% |
| 35 to 44 Years | 30 | 34.5% |
| 45 to 54 Years | 0 | 0.0% |
| 55 to 64 Years | 0 | 0.0% |
| 65 to 74 Years | 37 | 42.5% |
| 75 to 84 Years | 5 | 5.8% |
| 85 Years and Over | 14 | 16.1% |
| Total | 87 | 100.0% |
Housing Finances in Pleasanton
Median Income by Occupancy in Pleasanton
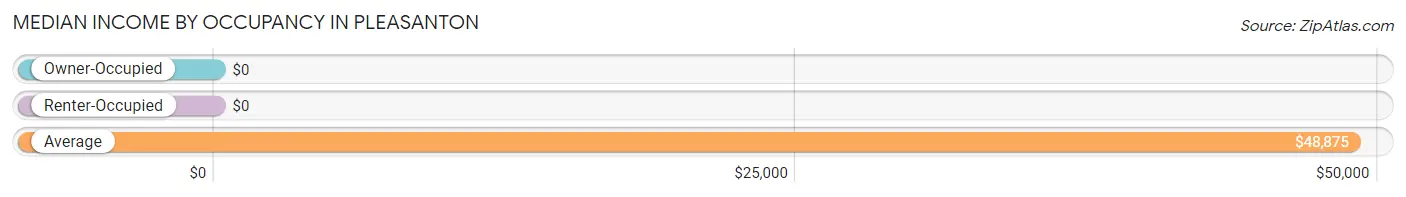
| Occupancy Type | # Households | Median Income |
| Owner-Occupied | 68 (78.2%) | $0 |
| Renter-Occupied | 19 (21.8%) | $0 |
| Average | 87 (100.0%) | $48,875 |
Occupancy by Householder Income Bracket in Pleasanton
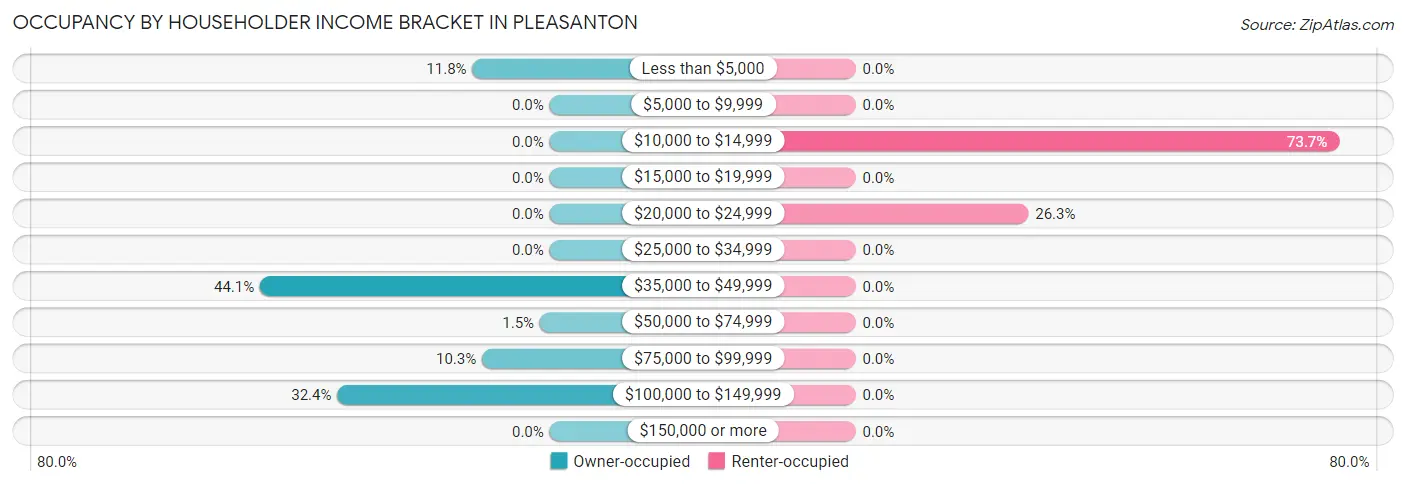
| Income Bracket | Owner-occupied | Renter-occupied |
| Less than $5,000 | 8 (11.8%) | 0 (0.0%) |
| $5,000 to $9,999 | 0 (0.0%) | 0 (0.0%) |
| $10,000 to $14,999 | 0 (0.0%) | 14 (73.7%) |
| $15,000 to $19,999 | 0 (0.0%) | 0 (0.0%) |
| $20,000 to $24,999 | 0 (0.0%) | 5 (26.3%) |
| $25,000 to $34,999 | 0 (0.0%) | 0 (0.0%) |
| $35,000 to $49,999 | 30 (44.1%) | 0 (0.0%) |
| $50,000 to $74,999 | 1 (1.5%) | 0 (0.0%) |
| $75,000 to $99,999 | 7 (10.3%) | 0 (0.0%) |
| $100,000 to $149,999 | 22 (32.4%) | 0 (0.0%) |
| $150,000 or more | 0 (0.0%) | 0 (0.0%) |
| Total | 68 (100.0%) | 19 (100.0%) |
Monthly Housing Cost Tiers in Pleasanton
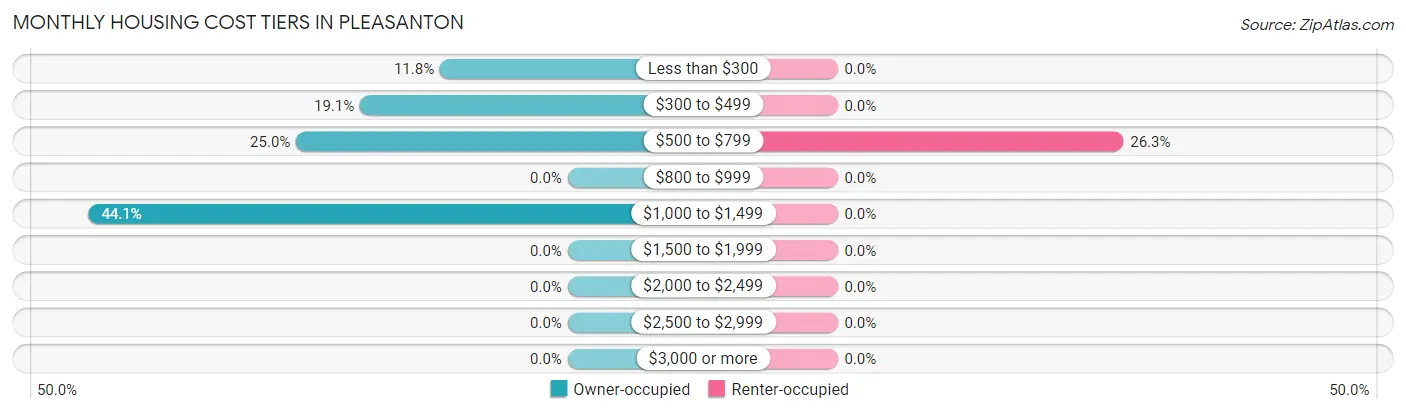
| Monthly Cost | Owner-occupied | Renter-occupied |
| Less than $300 | 8 (11.8%) | 0 (0.0%) |
| $300 to $499 | 13 (19.1%) | 0 (0.0%) |
| $500 to $799 | 17 (25.0%) | 5 (26.3%) |
| $800 to $999 | 0 (0.0%) | 0 (0.0%) |
| $1,000 to $1,499 | 30 (44.1%) | 0 (0.0%) |
| $1,500 to $1,999 | 0 (0.0%) | 0 (0.0%) |
| $2,000 to $2,499 | 0 (0.0%) | 0 (0.0%) |
| $2,500 to $2,999 | 0 (0.0%) | 0 (0.0%) |
| $3,000 or more | 0 (0.0%) | 0 (0.0%) |
| Total | 68 (100.0%) | 19 (100.0%) |
Physical Housing Characteristics in Pleasanton
Housing Structures in Pleasanton
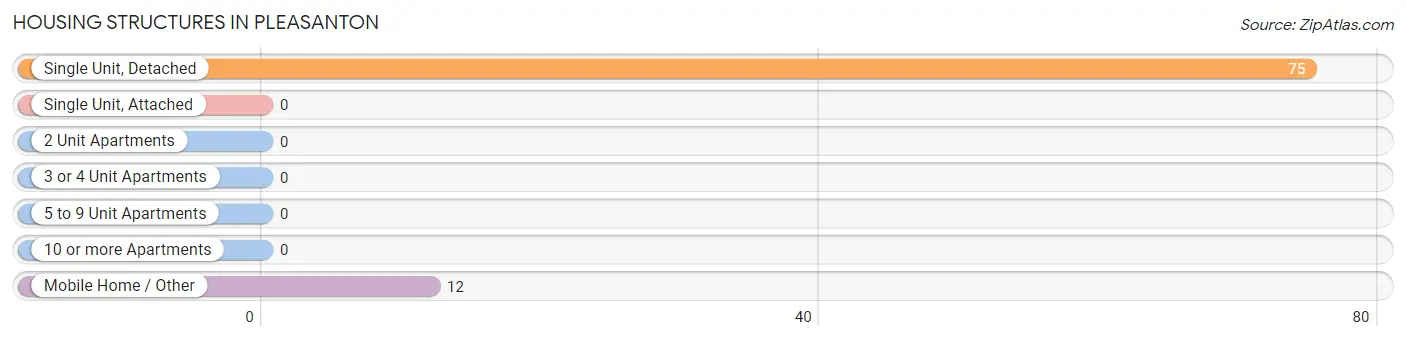
| Structure Type | # Housing Units | % Housing Units |
| Single Unit, Detached | 75 | 86.2% |
| Single Unit, Attached | 0 | 0.0% |
| 2 Unit Apartments | 0 | 0.0% |
| 3 or 4 Unit Apartments | 0 | 0.0% |
| 5 to 9 Unit Apartments | 0 | 0.0% |
| 10 or more Apartments | 0 | 0.0% |
| Mobile Home / Other | 12 | 13.8% |
| Total | 87 | 100.0% |
Housing Structures by Occupancy in Pleasanton
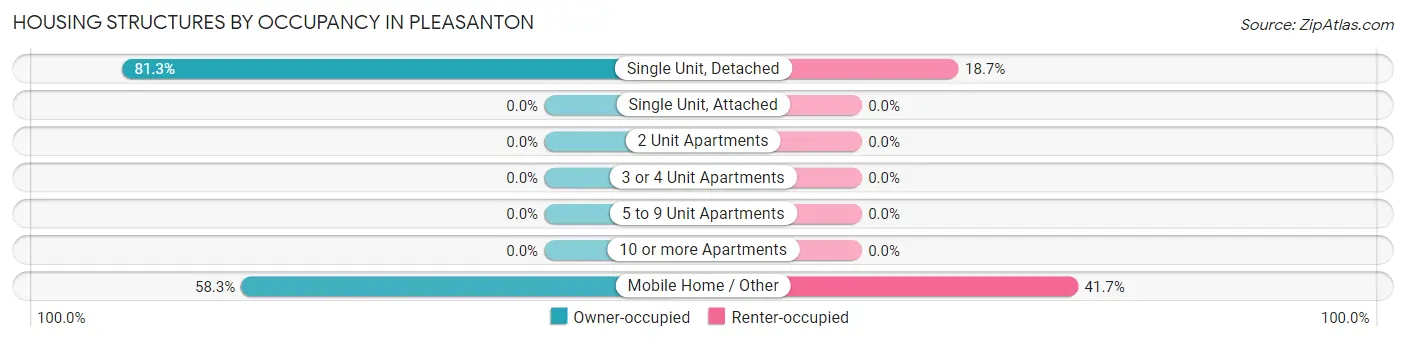
| Structure Type | Owner-occupied | Renter-occupied |
| Single Unit, Detached | 61 (81.3%) | 14 (18.7%) |
| Single Unit, Attached | 0 (0.0%) | 0 (0.0%) |
| 2 Unit Apartments | 0 (0.0%) | 0 (0.0%) |
| 3 or 4 Unit Apartments | 0 (0.0%) | 0 (0.0%) |
| 5 to 9 Unit Apartments | 0 (0.0%) | 0 (0.0%) |
| 10 or more Apartments | 0 (0.0%) | 0 (0.0%) |
| Mobile Home / Other | 7 (58.3%) | 5 (41.7%) |
| Total | 68 (78.2%) | 19 (21.8%) |
Housing Structures by Number of Rooms in Pleasanton
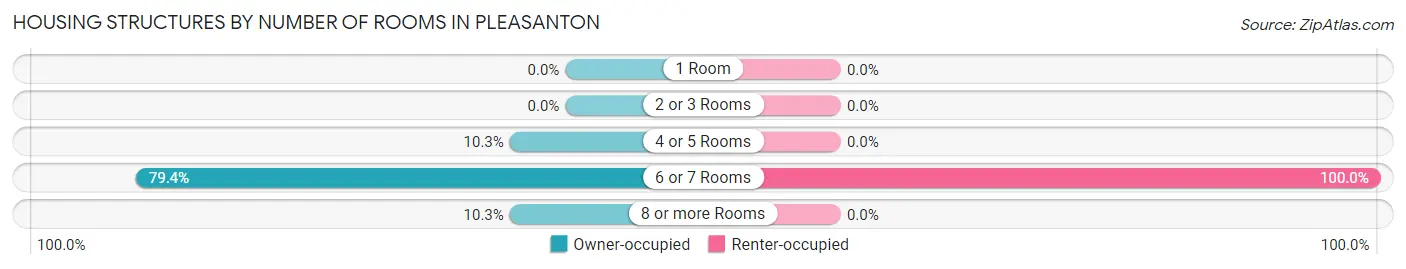
| Number of Rooms | Owner-occupied | Renter-occupied |
| 1 Room | 0 (0.0%) | 0 (0.0%) |
| 2 or 3 Rooms | 0 (0.0%) | 0 (0.0%) |
| 4 or 5 Rooms | 7 (10.3%) | 0 (0.0%) |
| 6 or 7 Rooms | 54 (79.4%) | 19 (100.0%) |
| 8 or more Rooms | 7 (10.3%) | 0 (0.0%) |
| Total | 68 (100.0%) | 19 (100.0%) |
Housing Structure by Heating Type in Pleasanton
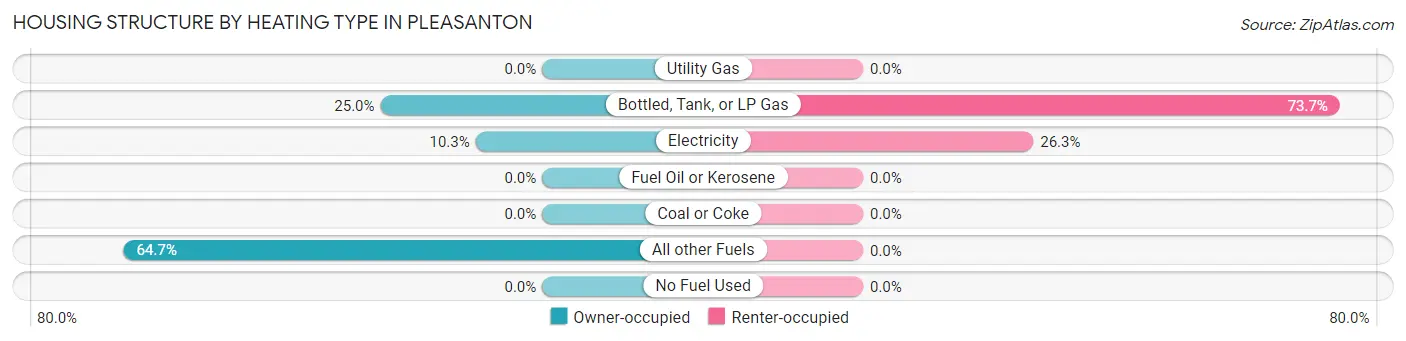
| Heating Type | Owner-occupied | Renter-occupied |
| Utility Gas | 0 (0.0%) | 0 (0.0%) |
| Bottled, Tank, or LP Gas | 17 (25.0%) | 14 (73.7%) |
| Electricity | 7 (10.3%) | 5 (26.3%) |
| Fuel Oil or Kerosene | 0 (0.0%) | 0 (0.0%) |
| Coal or Coke | 0 (0.0%) | 0 (0.0%) |
| All other Fuels | 44 (64.7%) | 0 (0.0%) |
| No Fuel Used | 0 (0.0%) | 0 (0.0%) |
| Total | 68 (100.0%) | 19 (100.0%) |
Household Vehicle Usage in Pleasanton
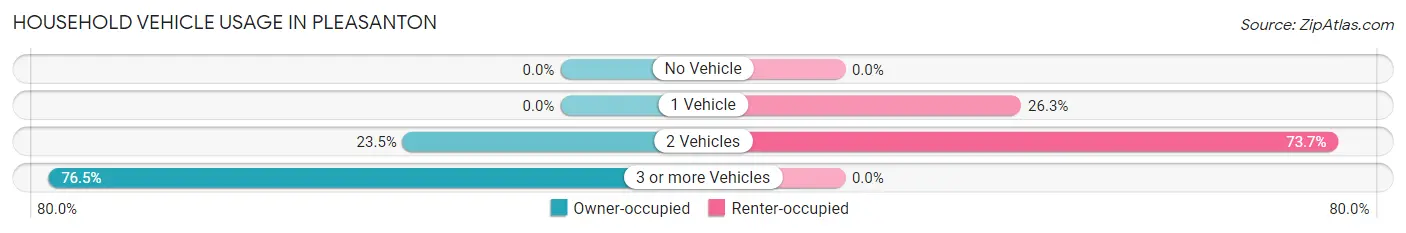
| Vehicles per Household | Owner-occupied | Renter-occupied |
| No Vehicle | 0 (0.0%) | 0 (0.0%) |
| 1 Vehicle | 0 (0.0%) | 5 (26.3%) |
| 2 Vehicles | 16 (23.5%) | 14 (73.7%) |
| 3 or more Vehicles | 52 (76.5%) | 0 (0.0%) |
| Total | 68 (100.0%) | 19 (100.0%) |
Real Estate & Mortgages in Pleasanton
Real Estate and Mortgage Overview in Pleasanton
| Characteristic | Without Mortgage | With Mortgage |
| Housing Units | 37 | 31 |
| Median Property Value | - | - |
| Median Household Income | $103,047 | $0 |
| Monthly Housing Costs | $379 | $0 |
| Real Estate Taxes | $1,598 | $0 |
Property Value by Mortgage Status in Pleasanton
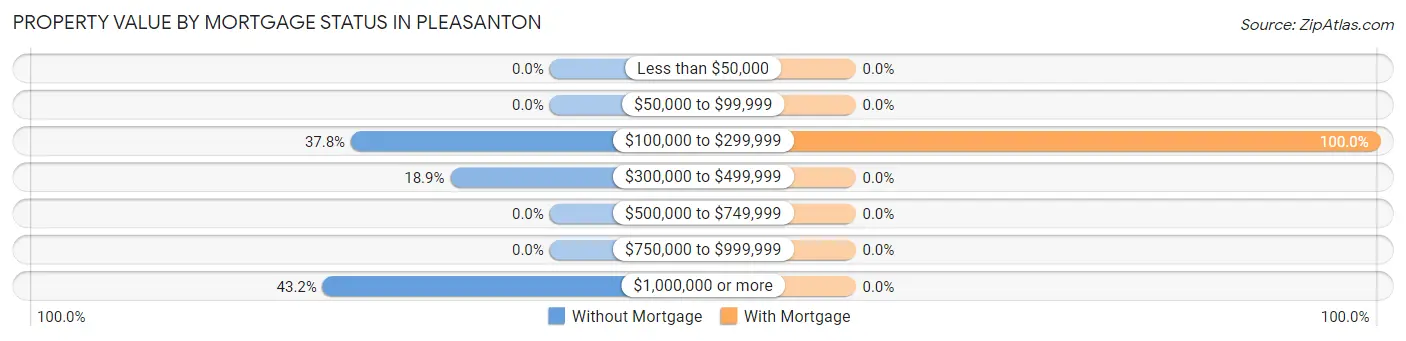
| Property Value | Without Mortgage | With Mortgage |
| Less than $50,000 | 0 (0.0%) | 0 (0.0%) |
| $50,000 to $99,999 | 0 (0.0%) | 0 (0.0%) |
| $100,000 to $299,999 | 14 (37.8%) | 31 (100.0%) |
| $300,000 to $499,999 | 7 (18.9%) | 0 (0.0%) |
| $500,000 to $749,999 | 0 (0.0%) | 0 (0.0%) |
| $750,000 to $999,999 | 0 (0.0%) | 0 (0.0%) |
| $1,000,000 or more | 16 (43.2%) | 0 (0.0%) |
| Total | 37 (100.0%) | 31 (100.0%) |
Household Income by Mortgage Status in Pleasanton
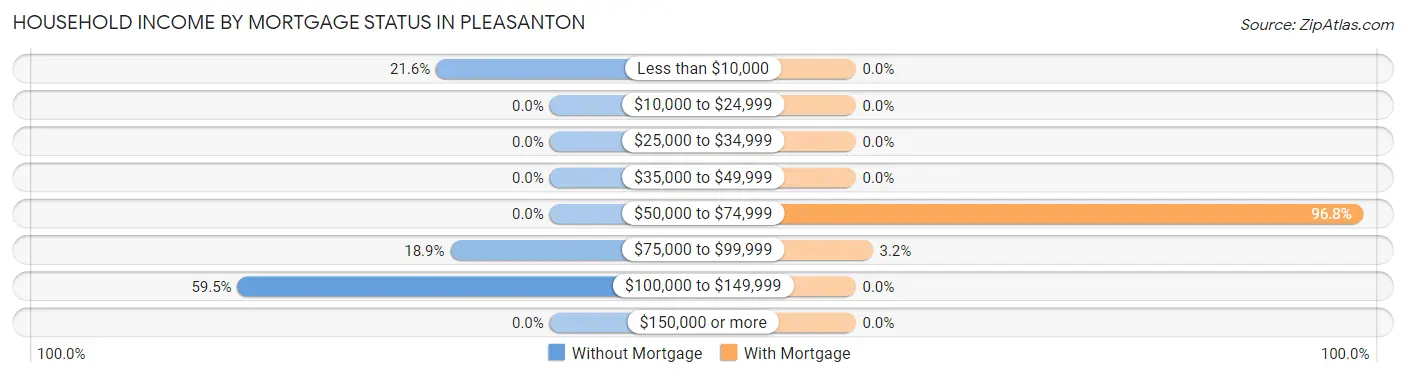
| Household Income | Without Mortgage | With Mortgage |
| Less than $10,000 | 8 (21.6%) | 0 (0.0%) |
| $10,000 to $24,999 | 0 (0.0%) | 0 (0.0%) |
| $25,000 to $34,999 | 0 (0.0%) | 0 (0.0%) |
| $35,000 to $49,999 | 0 (0.0%) | 0 (0.0%) |
| $50,000 to $74,999 | 0 (0.0%) | 30 (96.8%) |
| $75,000 to $99,999 | 7 (18.9%) | 1 (3.2%) |
| $100,000 to $149,999 | 22 (59.5%) | 0 (0.0%) |
| $150,000 or more | 0 (0.0%) | 0 (0.0%) |
| Total | 37 (100.0%) | 31 (100.0%) |
Property Value to Household Income Ratio in Pleasanton
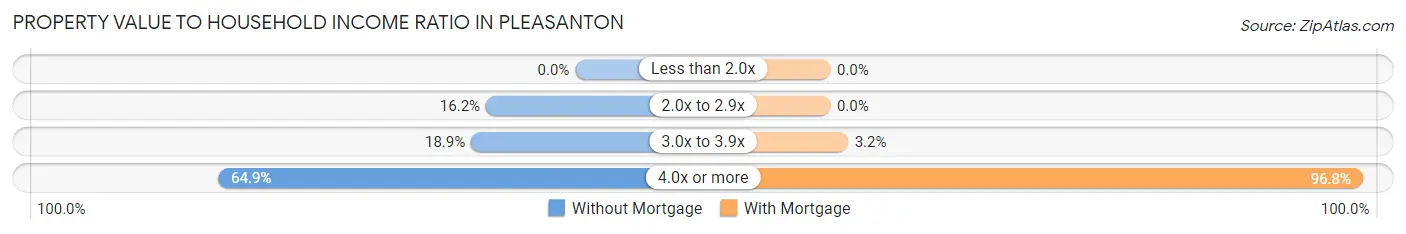
| Value-to-Income Ratio | Without Mortgage | With Mortgage |
| Less than 2.0x | 0 (0.0%) | 0 (0.0%) |
| 2.0x to 2.9x | 6 (16.2%) | 0 (0.0%) |
| 3.0x to 3.9x | 7 (18.9%) | 1 (3.2%) |
| 4.0x or more | 24 (64.9%) | 30 (96.8%) |
| Total | 37 (100.0%) | 31 (100.0%) |
Real Estate Taxes by Mortgage Status in Pleasanton
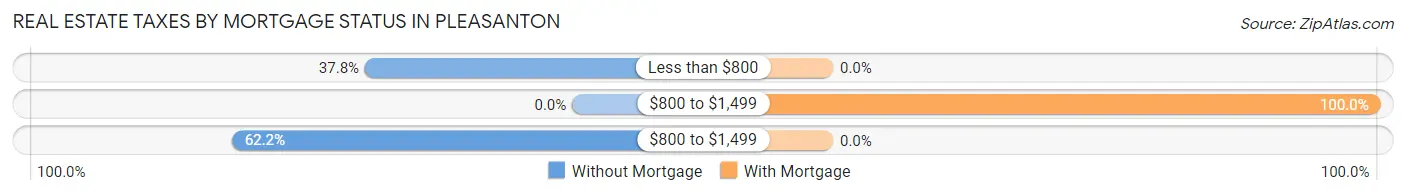
| Property Taxes | Without Mortgage | With Mortgage |
| Less than $800 | 14 (37.8%) | 0 (0.0%) |
| $800 to $1,499 | 0 (0.0%) | 31 (100.0%) |
| $800 to $1,499 | 23 (62.2%) | 0 (0.0%) |
| Total | 37 (100.0%) | 31 (100.0%) |
Health & Disability in Pleasanton
Health Insurance Coverage by Age in Pleasanton
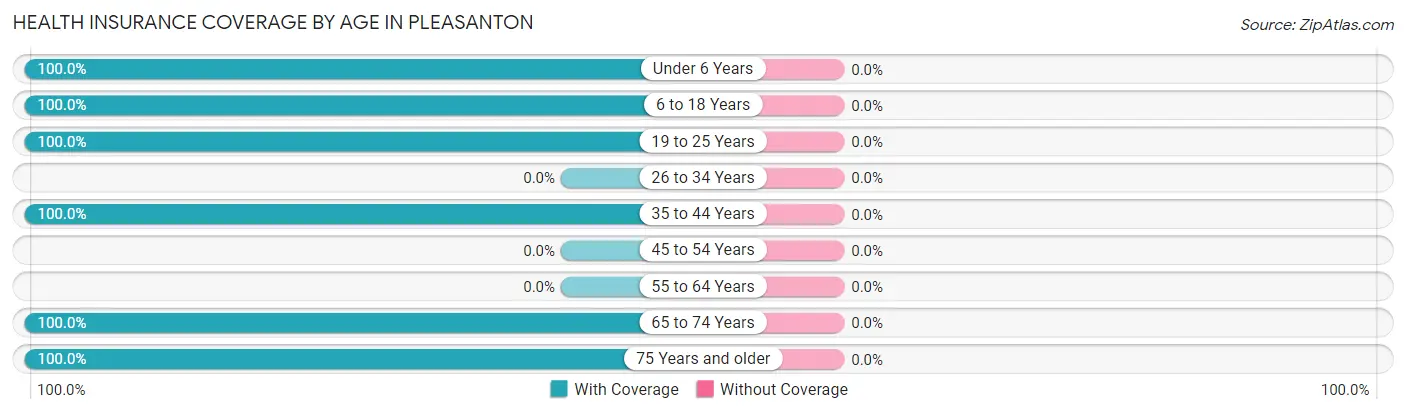
| Age Bracket | With Coverage | Without Coverage |
| Under 6 Years | 35 (100.0%) | 0 (0.0%) |
| 6 to 18 Years | 39 (100.0%) | 0 (0.0%) |
| 19 to 25 Years | 1 (100.0%) | 0 (0.0%) |
| 26 to 34 Years | 0 (0.0%) | 0 (0.0%) |
| 35 to 44 Years | 104 (100.0%) | 0 (0.0%) |
| 45 to 54 Years | 0 (0.0%) | 0 (0.0%) |
| 55 to 64 Years | 0 (0.0%) | 0 (0.0%) |
| 65 to 74 Years | 50 (100.0%) | 0 (0.0%) |
| 75 Years and older | 19 (100.0%) | 0 (0.0%) |
| Total | 248 (100.0%) | 0 (0.0%) |
Health Insurance Coverage by Citizenship Status in Pleasanton
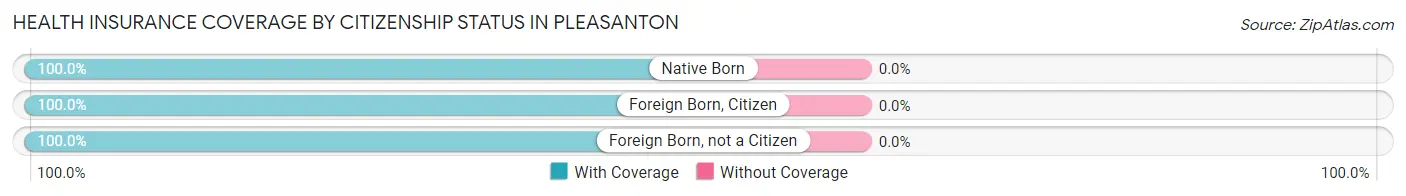
| Citizenship Status | With Coverage | Without Coverage |
| Native Born | 35 (100.0%) | 0 (0.0%) |
| Foreign Born, Citizen | 39 (100.0%) | 0 (0.0%) |
| Foreign Born, not a Citizen | 1 (100.0%) | 0 (0.0%) |
Health Insurance Coverage by Household Income in Pleasanton
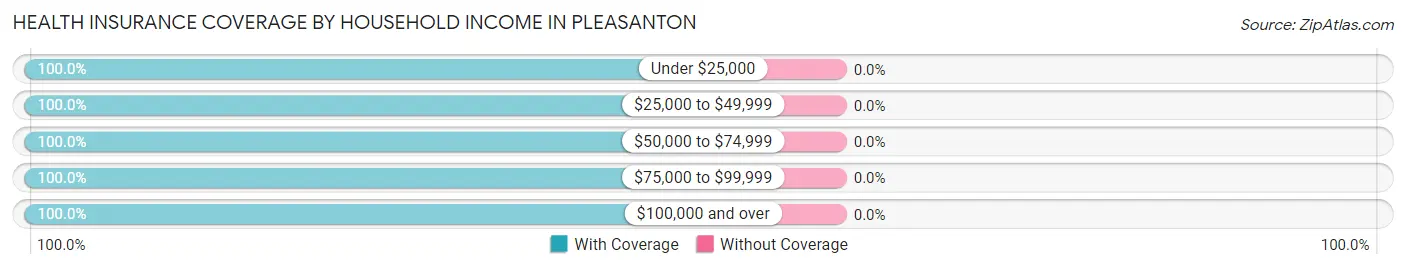
| Household Income | With Coverage | Without Coverage |
| Under $25,000 | 27 (100.0%) | 0 (0.0%) |
| $25,000 to $49,999 | 178 (100.0%) | 0 (0.0%) |
| $50,000 to $74,999 | 1 (100.0%) | 0 (0.0%) |
| $75,000 to $99,999 | 14 (100.0%) | 0 (0.0%) |
| $100,000 and over | 28 (100.0%) | 0 (0.0%) |
Public vs Private Health Insurance Coverage by Age in Pleasanton
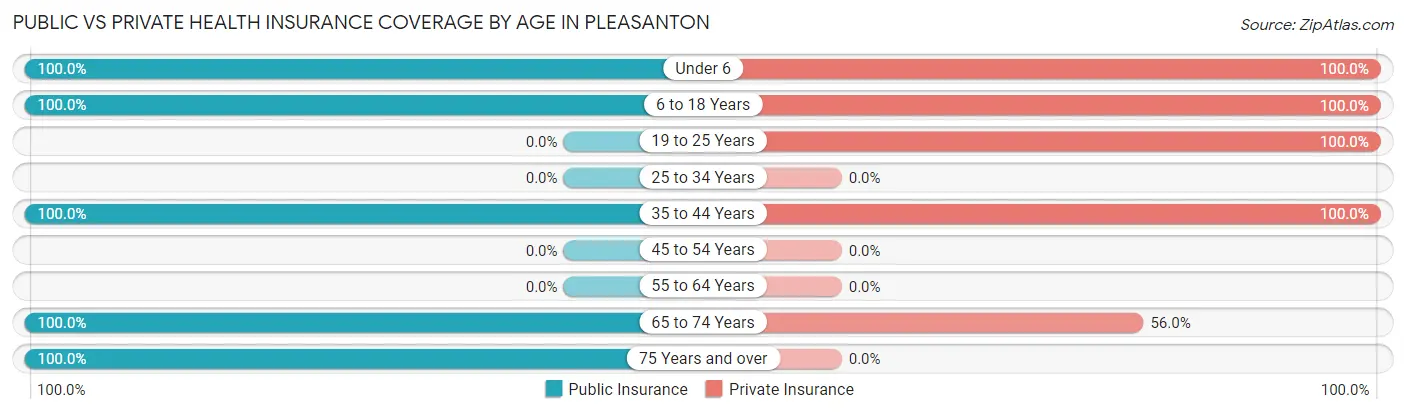
| Age Bracket | Public Insurance | Private Insurance |
| Under 6 | 35 (100.0%) | 35 (100.0%) |
| 6 to 18 Years | 39 (100.0%) | 39 (100.0%) |
| 19 to 25 Years | 0 (0.0%) | 1 (100.0%) |
| 25 to 34 Years | 0 (0.0%) | 0 (0.0%) |
| 35 to 44 Years | 104 (100.0%) | 104 (100.0%) |
| 45 to 54 Years | 0 (0.0%) | 0 (0.0%) |
| 55 to 64 Years | 0 (0.0%) | 0 (0.0%) |
| 65 to 74 Years | 50 (100.0%) | 28 (56.0%) |
| 75 Years and over | 19 (100.0%) | 0 (0.0%) |
| Total | 247 (99.6%) | 207 (83.5%) |
Disability Status by Sex by Age in Pleasanton
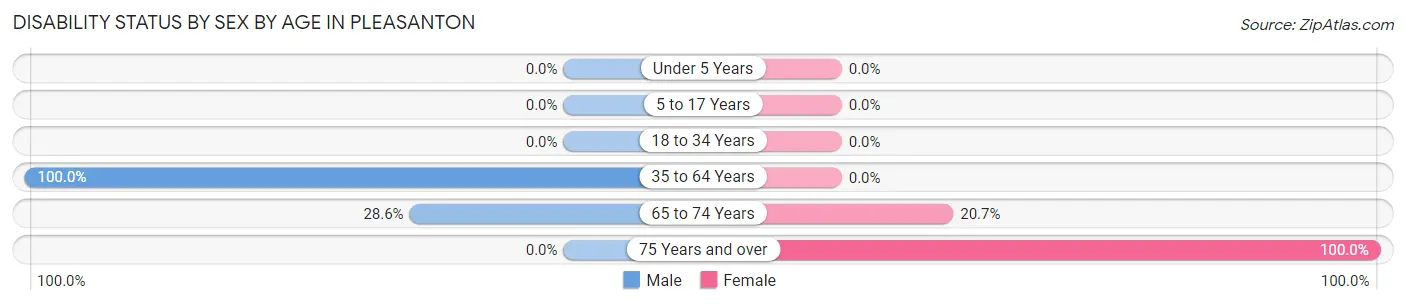
| Age Bracket | Male | Female |
| Under 5 Years | 0 (0.0%) | 0 (0.0%) |
| 5 to 17 Years | 0 (0.0%) | 0 (0.0%) |
| 18 to 34 Years | 0 (0.0%) | 0 (0.0%) |
| 35 to 64 Years | 74 (100.0%) | 0 (0.0%) |
| 65 to 74 Years | 6 (28.6%) | 6 (20.7%) |
| 75 Years and over | 0 (0.0%) | 5 (100.0%) |
Disability Class by Sex by Age in Pleasanton
Disability Class: Hearing Difficulty
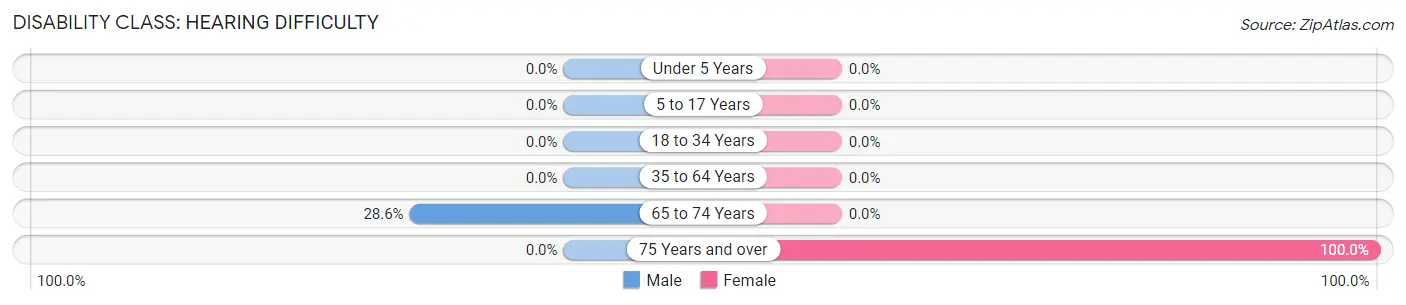
| Age Bracket | Male | Female |
| Under 5 Years | 0 (0.0%) | 0 (0.0%) |
| 5 to 17 Years | 0 (0.0%) | 0 (0.0%) |
| 18 to 34 Years | 0 (0.0%) | 0 (0.0%) |
| 35 to 64 Years | 0 (0.0%) | 0 (0.0%) |
| 65 to 74 Years | 6 (28.6%) | 0 (0.0%) |
| 75 Years and over | 0 (0.0%) | 5 (100.0%) |
Disability Class: Vision Difficulty
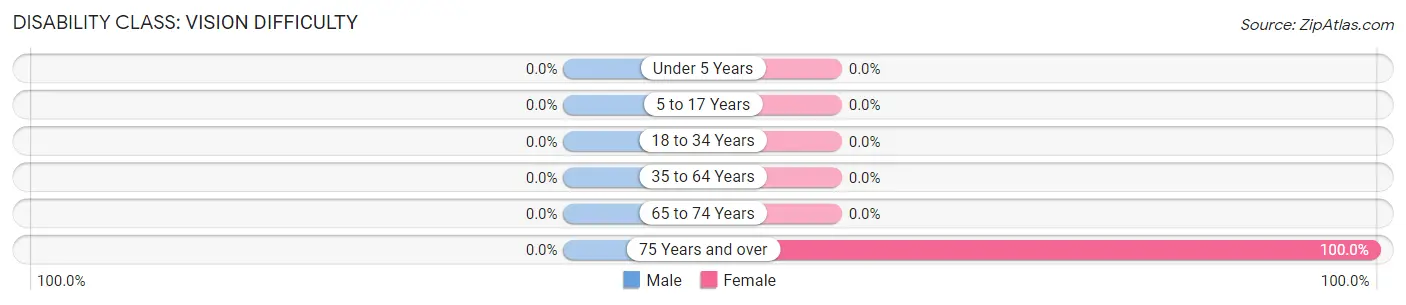
| Age Bracket | Male | Female |
| Under 5 Years | 0 (0.0%) | 0 (0.0%) |
| 5 to 17 Years | 0 (0.0%) | 0 (0.0%) |
| 18 to 34 Years | 0 (0.0%) | 0 (0.0%) |
| 35 to 64 Years | 0 (0.0%) | 0 (0.0%) |
| 65 to 74 Years | 0 (0.0%) | 0 (0.0%) |
| 75 Years and over | 0 (0.0%) | 5 (100.0%) |
Disability Class: Cognitive Difficulty

| Age Bracket | Male | Female |
| 5 to 17 Years | 0 (0.0%) | 0 (0.0%) |
| 18 to 34 Years | 0 (0.0%) | 0 (0.0%) |
| 35 to 64 Years | 0 (0.0%) | 0 (0.0%) |
| 65 to 74 Years | 0 (0.0%) | 0 (0.0%) |
| 75 Years and over | 0 (0.0%) | 0 (0.0%) |
Disability Class: Ambulatory Difficulty
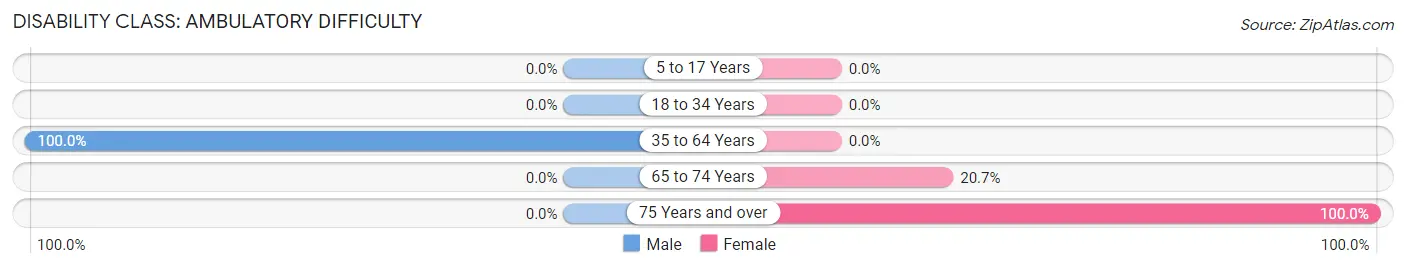
| Age Bracket | Male | Female |
| 5 to 17 Years | 0 (0.0%) | 0 (0.0%) |
| 18 to 34 Years | 0 (0.0%) | 0 (0.0%) |
| 35 to 64 Years | 74 (100.0%) | 0 (0.0%) |
| 65 to 74 Years | 0 (0.0%) | 6 (20.7%) |
| 75 Years and over | 0 (0.0%) | 5 (100.0%) |
Disability Class: Self-Care Difficulty
| Age Bracket | Male | Female |
| 5 to 17 Years | 0 (0.0%) | 0 (0.0%) |
| 18 to 34 Years | 0 (0.0%) | 0 (0.0%) |
| 35 to 64 Years | 0 (0.0%) | 0 (0.0%) |
| 65 to 74 Years | 0 (0.0%) | 0 (0.0%) |
| 75 Years and over | 0 (0.0%) | 0 (0.0%) |
Technology Access in Pleasanton
Computing Device Access in Pleasanton
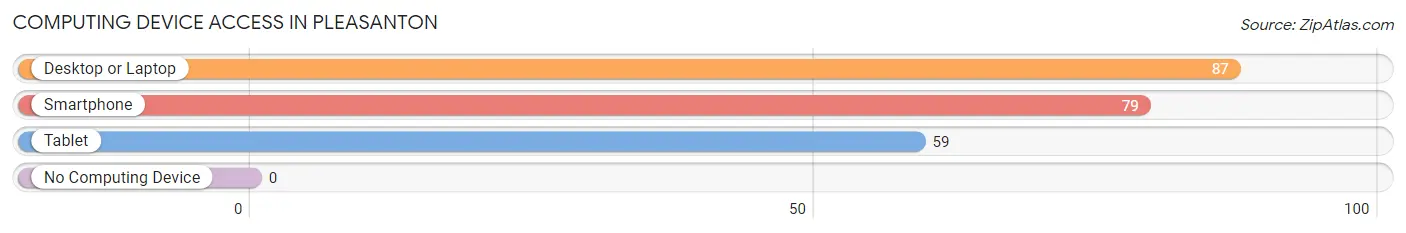
| Device Type | # Households | % Households |
| Desktop or Laptop | 87 | 100.0% |
| Smartphone | 79 | 90.8% |
| Tablet | 59 | 67.8% |
| No Computing Device | 0 | 0.0% |
| Total | 87 | 100.0% |
Internet Access in Pleasanton
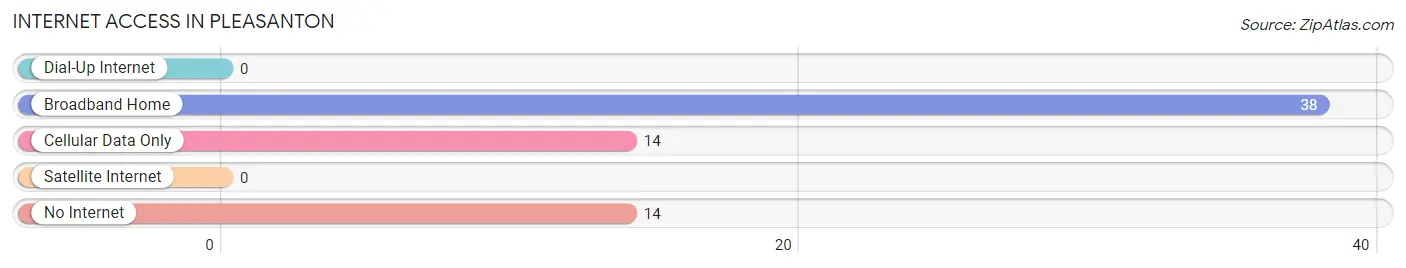
| Internet Type | # Households | % Households |
| Dial-Up Internet | 0 | 0.0% |
| Broadband Home | 38 | 43.7% |
| Cellular Data Only | 14 | 16.1% |
| Satellite Internet | 0 | 0.0% |
| No Internet | 14 | 16.1% |
| Total | 87 | 100.0% |
Pleasanton Summary
Pleasanton is a small unincorporated community located in the state of New Mexico. It is situated in the southeastern corner of the state, in the county of Eddy. The town is located on the banks of the Pecos River, and is surrounded by the Chihuahuan Desert. The town is home to a population of approximately 1,000 people, and is a popular destination for tourists and outdoor enthusiasts.
History
Pleasanton was founded in 1881 by a group of settlers from Texas. The town was named after Pleasanton, Texas, and was originally intended to be a stop on the Texas and Pacific Railway. The town quickly grew, and by the early 1900s, it had become a bustling center of commerce and industry. The town was home to several businesses, including a hotel, a general store, a saloon, and a blacksmith shop.
In the early 1900s, the town was also home to a large number of ranchers and farmers. The town was known for its cattle and sheep, and the surrounding area was used for grazing. The town was also home to a number of mines, including the Pleasanton Mine, which was one of the largest in the area.
Geography
Pleasanton is located in the southeastern corner of New Mexico, in the county of Eddy. The town is situated on the banks of the Pecos River, and is surrounded by the Chihuahuan Desert. The town is located at an elevation of 4,000 feet, and has a semi-arid climate. The average annual temperature is around 70 degrees Fahrenheit, and the average annual precipitation is around 10 inches.
Economy
The economy of Pleasanton is largely based on agriculture and tourism. The town is home to a number of farms and ranches, and the surrounding area is used for grazing. The town is also home to a number of tourist attractions, including the nearby Carlsbad Caverns National Park. The town is also home to a number of businesses, including restaurants, hotels, and retail stores.
Demographics
As of the 2010 census, the population of Pleasanton was 1,000. The town is predominantly white, with a small Hispanic population. The median household income is around $30,000, and the median home value is around $100,000. The town is served by the Carlsbad Municipal School District.
Common Questions
What is Per Capita Income in Pleasanton?
Per Capita income in Pleasanton is $23,185.
What is the Median Household income in Pleasanton?
Median Household Income in Pleasanton is $48,875.
What is Inequality or Gini Index in Pleasanton?
Inequality or Gini Index in Pleasanton is 0.38.
What is the Total Population of Pleasanton?
Total Population of Pleasanton is 248.
What is the Total Male Population of Pleasanton?
Total Male Population of Pleasanton is 110.
What is the Total Female Population of Pleasanton?
Total Female Population of Pleasanton is 138.
What is the Ratio of Males per 100 Females in Pleasanton?
There are 79.71 Males per 100 Females in Pleasanton.
What is the Ratio of Females per 100 Males in Pleasanton?
There are 125.45 Females per 100 Males in Pleasanton.
What is the Median Population Age in Pleasanton?
Median Population Age in Pleasanton is 36.7 Years.
What is the Average Family Size in Pleasanton
Average Family Size in Pleasanton is 2.2 People.
What is the Average Household Size in Pleasanton
Average Household Size in Pleasanton is 2.9 People.
How Large is the Labor Force in Pleasanton?
There are 111 People in the Labor Forcein in Pleasanton.
What is the Percentage of People in the Labor Force in Pleasanton?
52.1% of People are in the Labor Force in Pleasanton.