Littlejohn Island, ME Map & Demographics
Littlejohn Island Map
Littlejohn Island Overview
$118,924
PER CAPITA INCOME
$94,943
AVG HOUSEHOLD INCOME
0.29
INEQUALITY / GINI INDEX
58
TOTAL POPULATION
14
MALE POPULATION
44
FEMALE POPULATION
31.82
MALES / 100 FEMALES
314.29
FEMALES / 100 MALES
66.3
MEDIAN AGE
2.1
AVG FAMILY SIZE
1.4
AVG HOUSEHOLD SIZE
51
LABOR FORCE [ PEOPLE ]
87.9%
PERCENT IN LABOR FORCE
Income in Littlejohn Island
Income Overview in Littlejohn Island
| Characteristic | Number | Measure |
| Per Capita Income | 58 | $118,924 |
| Median Family Income | 14 | $0 |
| Mean Family Income | 14 | $0 |
| Median Household Income | 43 | $94,943 |
| Mean Household Income | 43 | $153,174 |
| Income Deficit | 14 | $0 |
| Wage / Income Gap (%) | 58 | 0.00% |
| Wage / Income Gap ($) | 58 | 100.00¢ per $1 |
| Gini / Inequality Index | 58 | 0.29 |
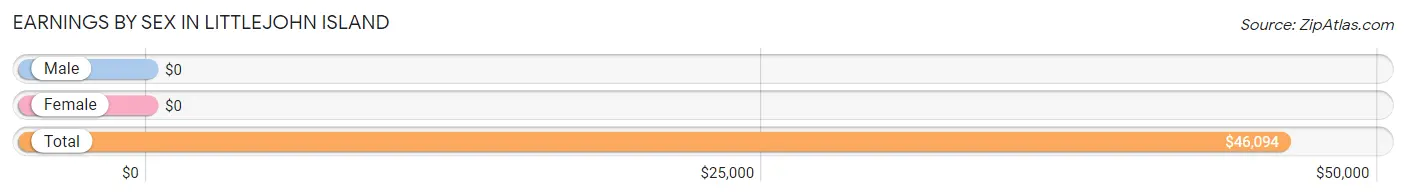
Earnings by Sex in Littlejohn Island
| Sex | Number | Average Earnings |
| Male | 14 (27.5%) | $0 |
| Female | 37 (72.6%) | $0 |
| Total | 51 (100.0%) | $46,094 |
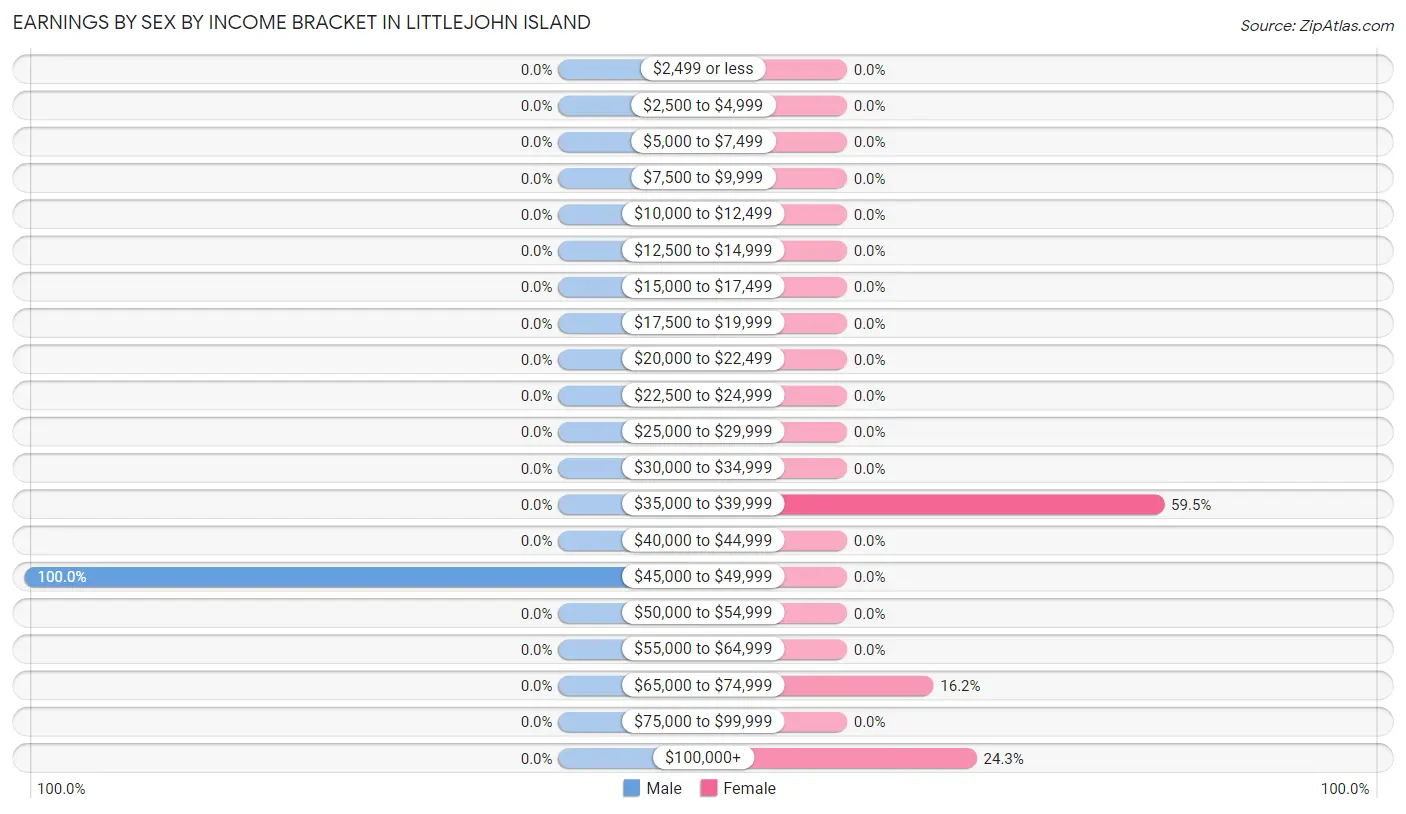
Earnings by Sex by Income Bracket in Littlejohn Island
The most common earnings brackets in Littlejohn Island are $45,000 to $49,999 for men (14 | 100.0%) and $35,000 to $39,999 for women (22 | 59.5%).
| Income | Male | Female |
| $2,499 or less | 0 (0.0%) | 0 (0.0%) |
| $2,500 to $4,999 | 0 (0.0%) | 0 (0.0%) |
| $5,000 to $7,499 | 0 (0.0%) | 0 (0.0%) |
| $7,500 to $9,999 | 0 (0.0%) | 0 (0.0%) |
| $10,000 to $12,499 | 0 (0.0%) | 0 (0.0%) |
| $12,500 to $14,999 | 0 (0.0%) | 0 (0.0%) |
| $15,000 to $17,499 | 0 (0.0%) | 0 (0.0%) |
| $17,500 to $19,999 | 0 (0.0%) | 0 (0.0%) |
| $20,000 to $22,499 | 0 (0.0%) | 0 (0.0%) |
| $22,500 to $24,999 | 0 (0.0%) | 0 (0.0%) |
| $25,000 to $29,999 | 0 (0.0%) | 0 (0.0%) |
| $30,000 to $34,999 | 0 (0.0%) | 0 (0.0%) |
| $35,000 to $39,999 | 0 (0.0%) | 22 (59.5%) |
| $40,000 to $44,999 | 0 (0.0%) | 0 (0.0%) |
| $45,000 to $49,999 | 14 (100.0%) | 0 (0.0%) |
| $50,000 to $54,999 | 0 (0.0%) | 0 (0.0%) |
| $55,000 to $64,999 | 0 (0.0%) | 0 (0.0%) |
| $65,000 to $74,999 | 0 (0.0%) | 6 (16.2%) |
| $75,000 to $99,999 | 0 (0.0%) | 0 (0.0%) |
| $100,000+ | 0 (0.0%) | 9 (24.3%) |
| Total | 14 (100.0%) | 37 (100.0%) |
Earnings by Sex by Educational Attainment in Littlejohn Island
| Educational Attainment | Male Income | Female Income |
| Less than High School | - | - |
| High School Diploma | - | - |
| College or Associate's Degree | - | - |
| Bachelor's Degree | - | - |
| Graduate Degree | - | - |
| Total | - | - |
Family Income in Littlejohn Island
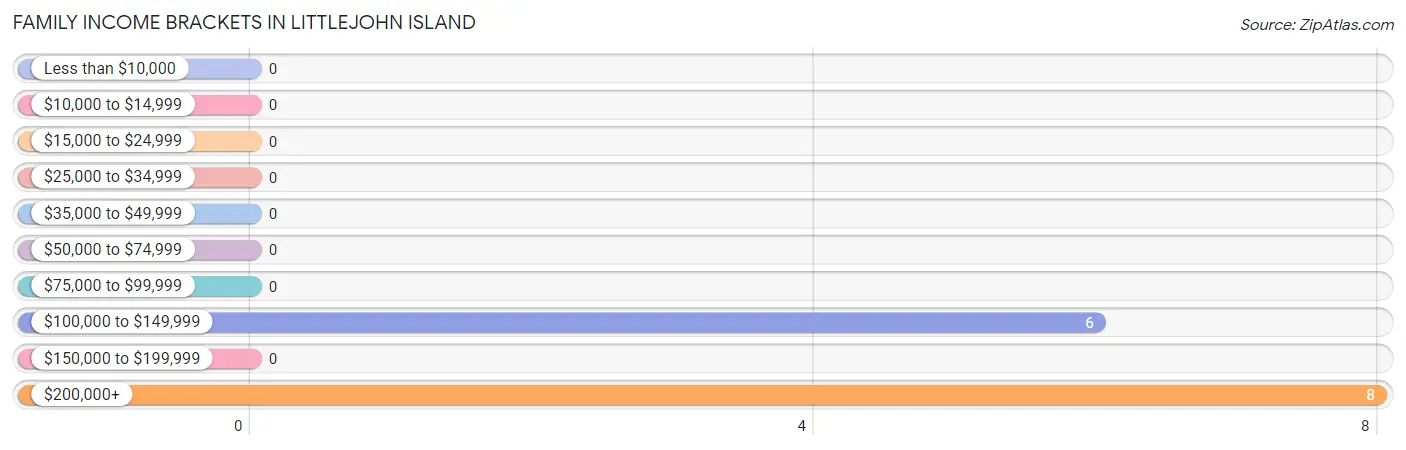
Family Income Brackets in Littlejohn Island
According to the Littlejohn Island family income data, there are 8 families falling into the $200,000+ income range, which is the most common income bracket and makes up 57.1% of all families.
| Income Bracket | # Families | % Families |
| Less than $10,000 | 0 | 0.0% |
| $10,000 to $14,999 | 0 | 0.0% |
| $15,000 to $24,999 | 0 | 0.0% |
| $25,000 to $34,999 | 0 | 0.0% |
| $35,000 to $49,999 | 0 | 0.0% |
| $50,000 to $74,999 | 0 | 0.0% |
| $75,000 to $99,999 | 0 | 0.0% |
| $100,000 to $149,999 | 6 | 42.9% |
| $150,000 to $199,999 | 0 | 0.0% |
| $200,000+ | 8 | 57.1% |
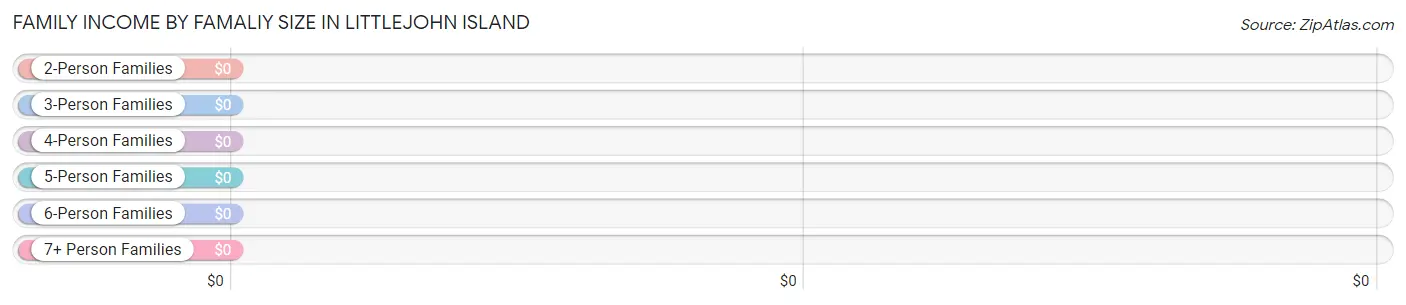
Family Income by Famaliy Size in Littlejohn Island
| Income Bracket | # Families | Median Income |
| 2-Person Families | 14 (100.0%) | $0 |
| 3-Person Families | 0 (0.0%) | $0 |
| 4-Person Families | 0 (0.0%) | $0 |
| 5-Person Families | 0 (0.0%) | $0 |
| 6-Person Families | 0 (0.0%) | $0 |
| 7+ Person Families | 0 (0.0%) | $0 |
| Total | 14 (100.0%) | $0 |
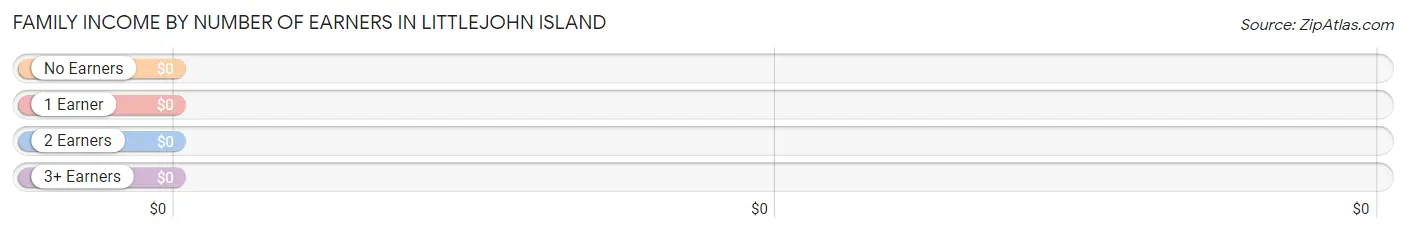
Family Income by Number of Earners in Littlejohn Island
| Number of Earners | # Families | Median Income |
| No Earners | 0 (0.0%) | $0 |
| 1 Earner | 0 (0.0%) | $0 |
| 2 Earners | 14 (100.0%) | $0 |
| 3+ Earners | 0 (0.0%) | $0 |
| Total | 14 (100.0%) | $0 |
Household Income in Littlejohn Island
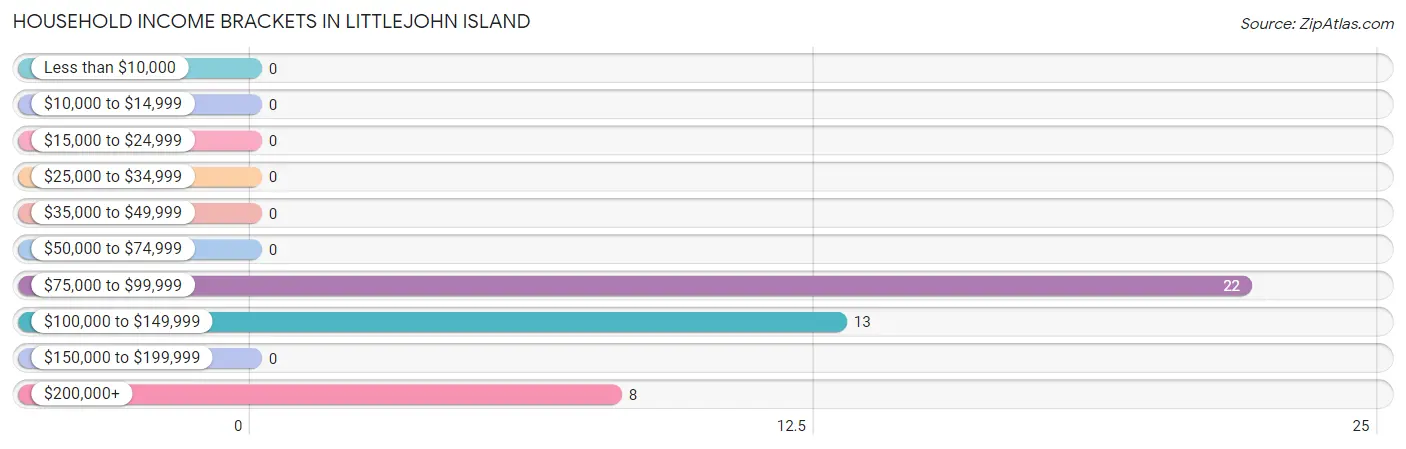
Household Income Brackets in Littlejohn Island
With 22 households falling in the category, the $75,000 to $99,999 income range is the most frequent in Littlejohn Island, accounting for 51.2% of all households.
| Income Bracket | # Households | % Households |
| Less than $10,000 | 0 | 0.0% |
| $10,000 to $14,999 | 0 | 0.0% |
| $15,000 to $24,999 | 0 | 0.0% |
| $25,000 to $34,999 | 0 | 0.0% |
| $35,000 to $49,999 | 0 | 0.0% |
| $50,000 to $74,999 | 0 | 0.0% |
| $75,000 to $99,999 | 22 | 51.2% |
| $100,000 to $149,999 | 13 | 30.2% |
| $150,000 to $199,999 | 0 | 0.0% |
| $200,000+ | 8 | 18.6% |
Household Income by Householder Age in Littlejohn Island
The median household income in Littlejohn Island is $94,943, with the highest median household income of $94,602 found in the 65+ years age bracket for the primary householder. A total of 37 households (86.1%) fall into this category.
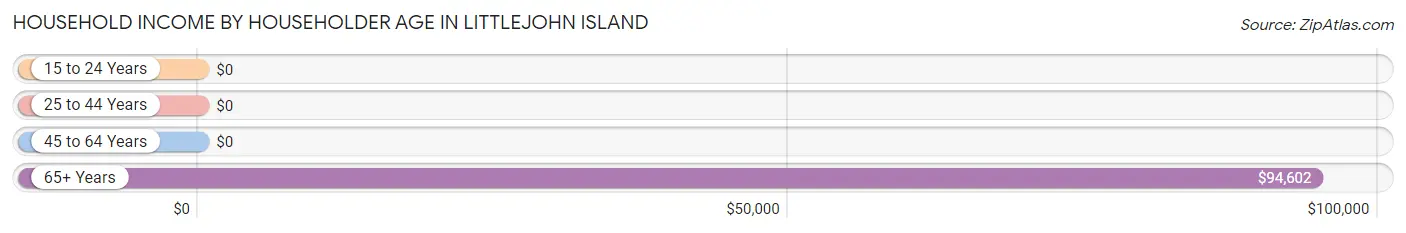
| Income Bracket | # Households | Median Income |
| 15 to 24 Years | 0 (0.0%) | $0 |
| 25 to 44 Years | 0 (0.0%) | $0 |
| 45 to 64 Years | 6 (14.0%) | $0 |
| 65+ Years | 37 (86.1%) | $94,602 |
| Total | 43 (100.0%) | $94,943 |
Poverty in Littlejohn Island
Income Below Poverty by Sex and Age in Littlejohn Island
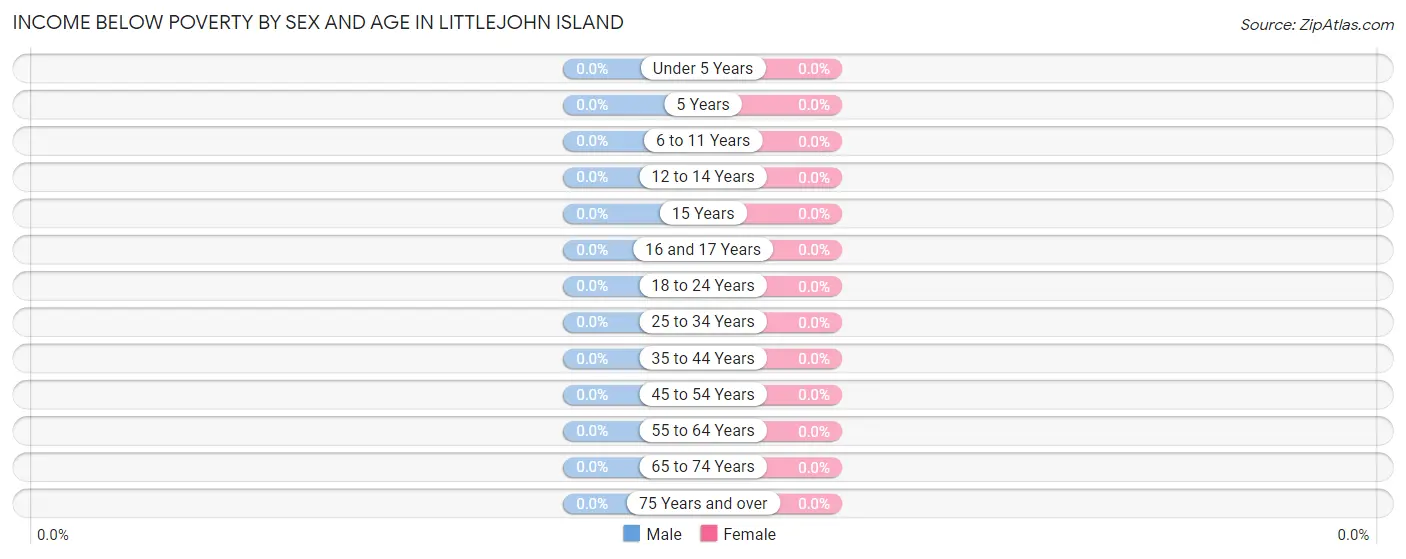
| Age Bracket | Male | Female |
| Under 5 Years | 0 (0.0%) | 0 (0.0%) |
| 5 Years | 0 (0.0%) | 0 (0.0%) |
| 6 to 11 Years | 0 (0.0%) | 0 (0.0%) |
| 12 to 14 Years | 0 (0.0%) | 0 (0.0%) |
| 15 Years | 0 (0.0%) | 0 (0.0%) |
| 16 and 17 Years | 0 (0.0%) | 0 (0.0%) |
| 18 to 24 Years | 0 (0.0%) | 0 (0.0%) |
| 25 to 34 Years | 0 (0.0%) | 0 (0.0%) |
| 35 to 44 Years | 0 (0.0%) | 0 (0.0%) |
| 45 to 54 Years | 0 (0.0%) | 0 (0.0%) |
| 55 to 64 Years | 0 (0.0%) | 0 (0.0%) |
| 65 to 74 Years | 0 (0.0%) | 0 (0.0%) |
| 75 Years and over | 0 (0.0%) | 0 (0.0%) |
| Total | 0 (0.0%) | 0 (0.0%) |
Income Above Poverty by Sex and Age in Littlejohn Island
According to the poverty statistics in Littlejohn Island, males aged 65 to 74 years and females aged 55 to 64 years are the age groups that are most secure financially, with 100.0% of males and 100.0% of females in these age groups living above the poverty line.
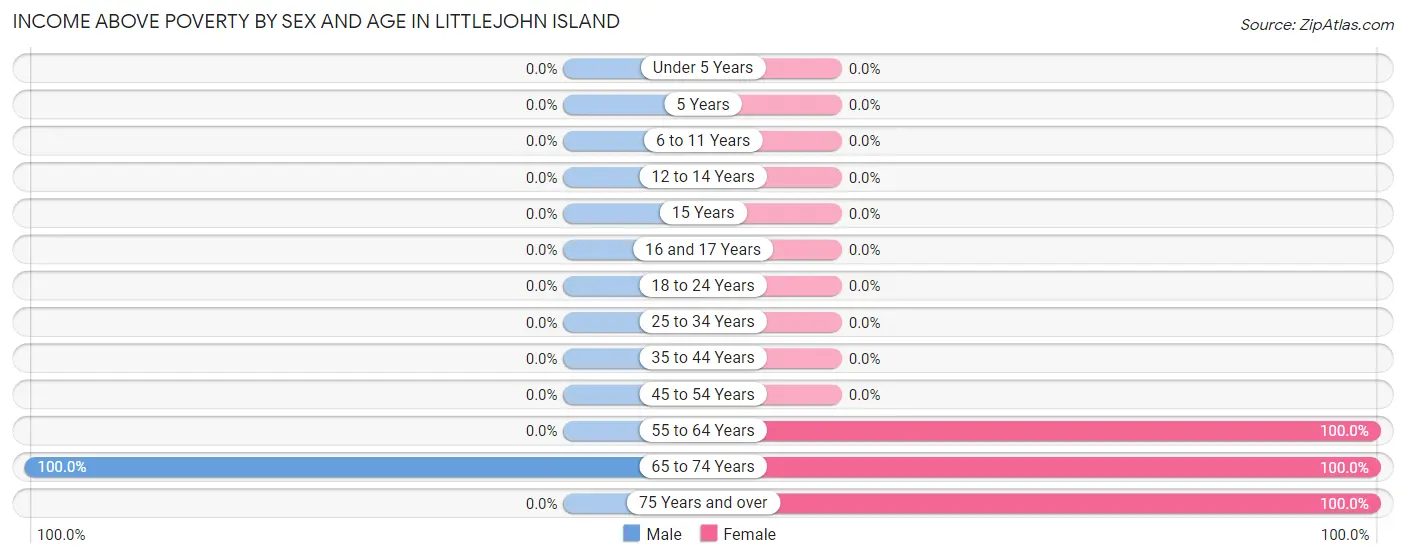
| Age Bracket | Male | Female |
| Under 5 Years | 0 (0.0%) | 0 (0.0%) |
| 5 Years | 0 (0.0%) | 0 (0.0%) |
| 6 to 11 Years | 0 (0.0%) | 0 (0.0%) |
| 12 to 14 Years | 0 (0.0%) | 0 (0.0%) |
| 15 Years | 0 (0.0%) | 0 (0.0%) |
| 16 and 17 Years | 0 (0.0%) | 0 (0.0%) |
| 18 to 24 Years | 0 (0.0%) | 0 (0.0%) |
| 25 to 34 Years | 0 (0.0%) | 0 (0.0%) |
| 35 to 44 Years | 0 (0.0%) | 0 (0.0%) |
| 45 to 54 Years | 0 (0.0%) | 0 (0.0%) |
| 55 to 64 Years | 0 (0.0%) | 15 (100.0%) |
| 65 to 74 Years | 14 (100.0%) | 22 (100.0%) |
| 75 Years and over | 0 (0.0%) | 7 (100.0%) |
| Total | 14 (100.0%) | 44 (100.0%) |
Income Below Poverty Among Married-Couple Families in Littlejohn Island
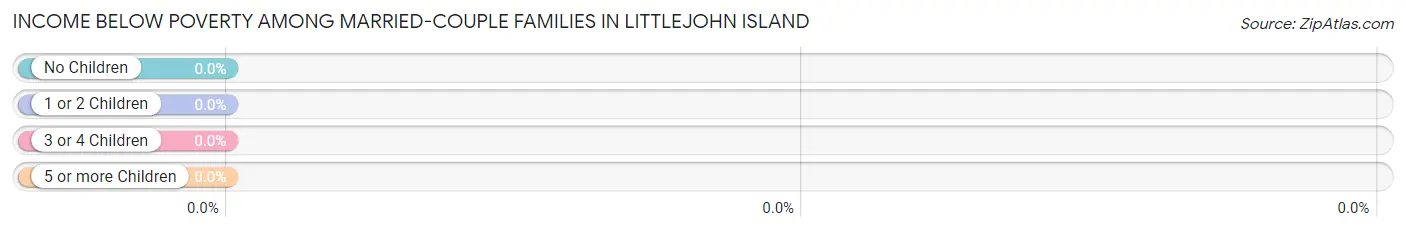
| Children | Above Poverty | Below Poverty |
| No Children | 14 (100.0%) | 0 (0.0%) |
| 1 or 2 Children | 0 (0.0%) | 0 (0.0%) |
| 3 or 4 Children | 0 (0.0%) | 0 (0.0%) |
| 5 or more Children | 0 (0.0%) | 0 (0.0%) |
| Total | 14 (100.0%) | 0 (0.0%) |
Income Below Poverty Among Single-Parent Households in Littlejohn Island
| Children | Single Father | Single Mother |
| No Children | 0 (0.0%) | 0 (0.0%) |
| 1 or 2 Children | 0 (0.0%) | 0 (0.0%) |
| 3 or 4 Children | 0 (0.0%) | 0 (0.0%) |
| 5 or more Children | 0 (0.0%) | 0 (0.0%) |
| Total | 0 (0.0%) | 0 (0.0%) |
Income Below Poverty Among Married-Couple vs Single-Parent Households in Littlejohn Island
| Children | Married-Couple Families | Single-Parent Households |
| No Children | 0 (0.0%) | 0 (0.0%) |
| 1 or 2 Children | 0 (0.0%) | 0 (0.0%) |
| 3 or 4 Children | 0 (0.0%) | 0 (0.0%) |
| 5 or more Children | 0 (0.0%) | 0 (0.0%) |
| Total | 0 (0.0%) | 0 (0.0%) |
Race in Littlejohn Island
The most populous races in Littlejohn Island are , and White / Caucasian (58 | 100.0%).
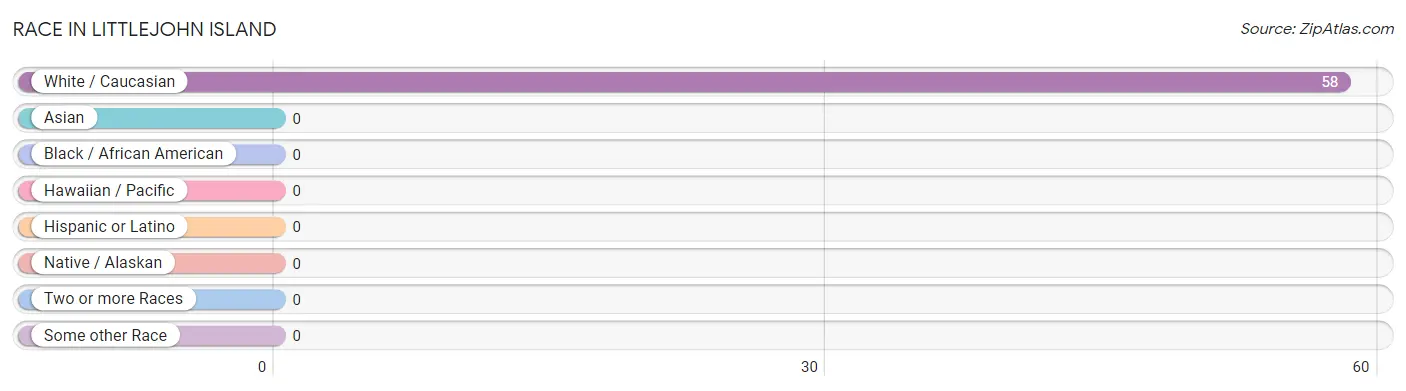
| Race | # Population | % Population |
| Asian | 0 | 0.0% |
| Black / African American | 0 | 0.0% |
| Hawaiian / Pacific | 0 | 0.0% |
| Hispanic or Latino | 0 | 0.0% |
| Native / Alaskan | 0 | 0.0% |
| White / Caucasian | 58 | 100.0% |
| Two or more Races | 0 | 0.0% |
| Some other Race | 0 | 0.0% |
| Total | 58 | 100.0% |
Ancestry in Littlejohn Island
The most populous ancestries reported in Littlejohn Island are English (29 | 50.0%), British (17 | 29.3%), French (6 | 10.3%), and Irish (6 | 10.3%), together accounting for 100.0% of all Littlejohn Island residents.
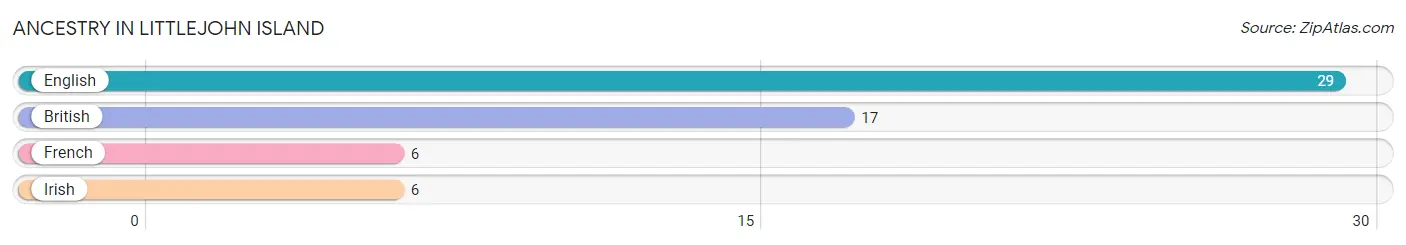
| Ancestry | # Population | % Population |
| British | 17 | 29.3% |
| English | 29 | 50.0% |
| French | 6 | 10.3% |
| Irish | 6 | 10.3% | View All 4 Rows |
Immigrants in Littlejohn Island

| Immigration Origin | # Population | % Population | View All 0 Rows |
Sex and Age in Littlejohn Island
Sex and Age in Littlejohn Island
The most populous age groups in Littlejohn Island are 65 to 69 Years (8 | 57.1%) for men and 65 to 69 Years (22 | 50.0%) for women.
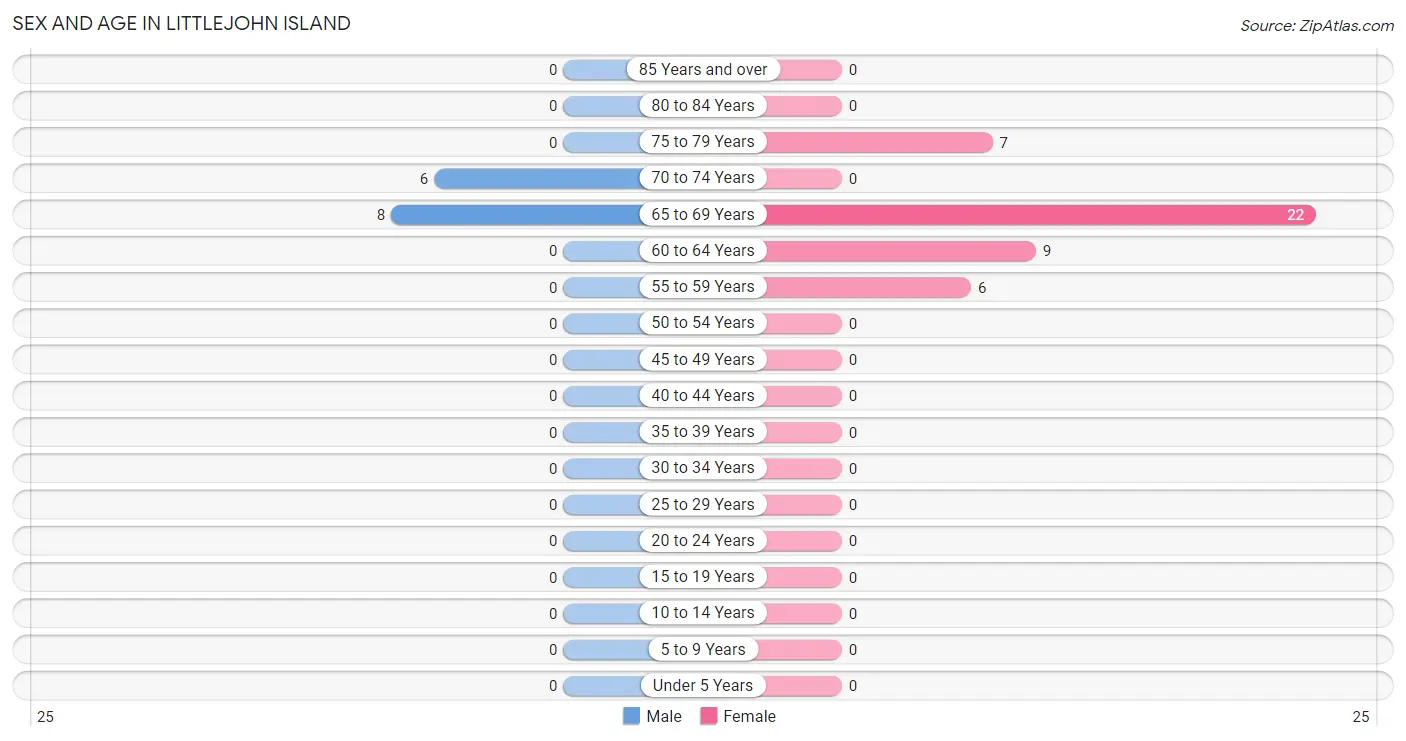
| Age Bracket | Male | Female |
| Under 5 Years | 0 (0.0%) | 0 (0.0%) |
| 5 to 9 Years | 0 (0.0%) | 0 (0.0%) |
| 10 to 14 Years | 0 (0.0%) | 0 (0.0%) |
| 15 to 19 Years | 0 (0.0%) | 0 (0.0%) |
| 20 to 24 Years | 0 (0.0%) | 0 (0.0%) |
| 25 to 29 Years | 0 (0.0%) | 0 (0.0%) |
| 30 to 34 Years | 0 (0.0%) | 0 (0.0%) |
| 35 to 39 Years | 0 (0.0%) | 0 (0.0%) |
| 40 to 44 Years | 0 (0.0%) | 0 (0.0%) |
| 45 to 49 Years | 0 (0.0%) | 0 (0.0%) |
| 50 to 54 Years | 0 (0.0%) | 0 (0.0%) |
| 55 to 59 Years | 0 (0.0%) | 6 (13.6%) |
| 60 to 64 Years | 0 (0.0%) | 9 (20.4%) |
| 65 to 69 Years | 8 (57.1%) | 22 (50.0%) |
| 70 to 74 Years | 6 (42.9%) | 0 (0.0%) |
| 75 to 79 Years | 0 (0.0%) | 7 (15.9%) |
| 80 to 84 Years | 0 (0.0%) | 0 (0.0%) |
| 85 Years and over | 0 (0.0%) | 0 (0.0%) |
| Total | 14 (100.0%) | 44 (100.0%) |
Families and Households in Littlejohn Island
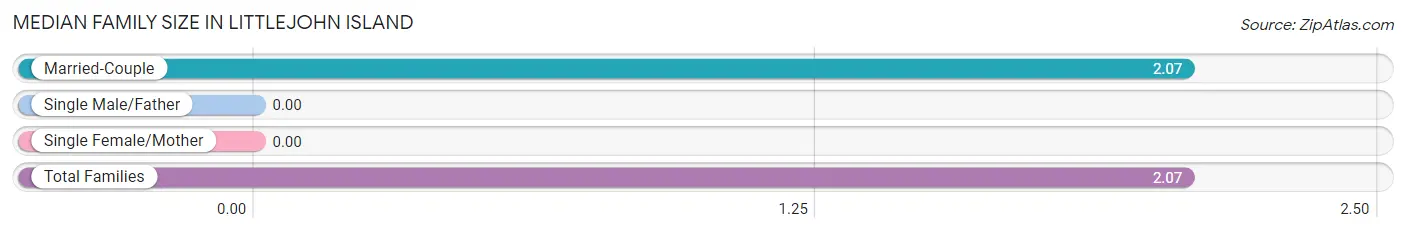
Median Family Size in Littlejohn Island
| Family Type | # Families | Family Size |
| Married-Couple | 14 (100.0%) | 2.07 |
| Single Male/Father | 0 (0.0%) | - |
| Single Female/Mother | 0 (0.0%) | - |
| Total Families | 14 (100.0%) | 2.07 |
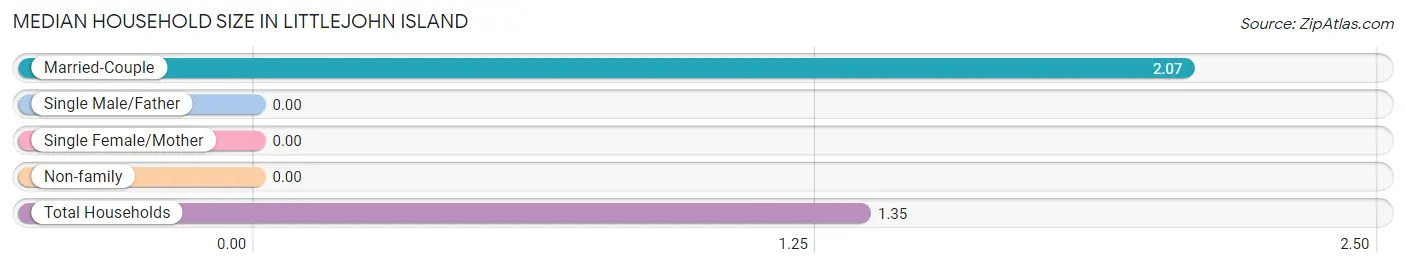
Median Household Size in Littlejohn Island
| Household Type | # Households | Household Size |
| Married-Couple | 14 (32.6%) | 2.07 |
| Single Male/Father | 0 (0.0%) | - |
| Single Female/Mother | 0 (0.0%) | - |
| Non-family | 29 (67.4%) | - |
| Total Households | 43 (100.0%) | 1.35 |
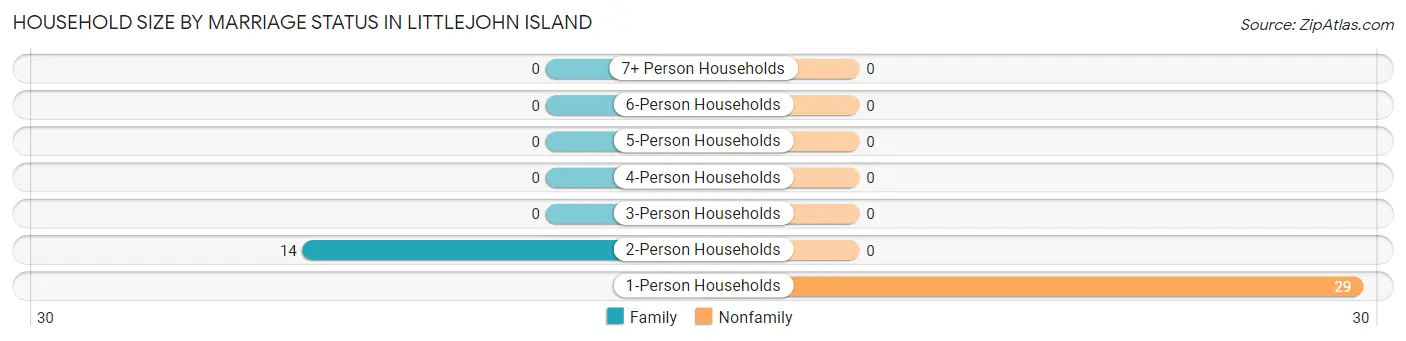
Household Size by Marriage Status in Littlejohn Island
Out of a total of 43 households in Littlejohn Island, 14 (32.6%) are family households, while 29 (67.4%) are nonfamily households. The most numerous type of family households are 2-person households, comprising 14, and the most common type of nonfamily households are 1-person households, comprising 29.
| Household Size | Family Households | Nonfamily Households |
| 1-Person Households | - | 29 (67.4%) |
| 2-Person Households | 14 (32.6%) | 0 (0.0%) |
| 3-Person Households | 0 (0.0%) | 0 (0.0%) |
| 4-Person Households | 0 (0.0%) | 0 (0.0%) |
| 5-Person Households | 0 (0.0%) | 0 (0.0%) |
| 6-Person Households | 0 (0.0%) | 0 (0.0%) |
| 7+ Person Households | 0 (0.0%) | 0 (0.0%) |
| Total | 14 (32.6%) | 29 (67.4%) |
Female Fertility in Littlejohn Island
Fertility by Age in Littlejohn Island
| Age Bracket | Women with Births | Births / 1,000 Women |
| 15 to 19 years | 0 (0.0%) | 0.0 |
| 20 to 34 years | 0 (0.0%) | 0.0 |
| 35 to 50 years | 0 (0.0%) | 0.0 |
| Total | 0 (0.0%) | 0.0 |
Fertility by Age by Marriage Status in Littlejohn Island
| Age Bracket | Married | Unmarried |
| 15 to 19 years | 0 (0.0%) | 0 (0.0%) |
| 20 to 34 years | 0 (0.0%) | 0 (0.0%) |
| 35 to 50 years | 0 (0.0%) | 0 (0.0%) |
| Total | 0 (0.0%) | 0 (0.0%) |
Fertility by Education in Littlejohn Island
| Educational Attainment | Women with Births | Births / 1,000 Women |
| Less than High School | 0 (0.0%) | 0.0 |
| High School Diploma | 0 (0.0%) | 0.0 |
| College or Associate's Degree | 0 (0.0%) | 0.0 |
| Bachelor's Degree | 0 (0.0%) | 0.0 |
| Graduate Degree | 0 (0.0%) | 0.0 |
| Total | 0 (0.0%) | 0.0 |
Fertility by Education by Marriage Status in Littlejohn Island
| Educational Attainment | Married | Unmarried |
| Less than High School | 0 (0.0%) | 0 (0.0%) |
| High School Diploma | 0 (0.0%) | 0 (0.0%) |
| College or Associate's Degree | 0 (0.0%) | 0 (0.0%) |
| Bachelor's Degree | 0 (0.0%) | 0 (0.0%) |
| Graduate Degree | 0 (0.0%) | 0 (0.0%) |
| Total | 0 (0.0%) | 0 (0.0%) |
Employment Characteristics in Littlejohn Island
Employment by Class of Employer in Littlejohn Island
Among the 51 employed individuals in Littlejohn Island, self-employed (not incorporated) (22 | 43.1%), private company employees (15 | 29.4%), and not-for-profit organizations (14 | 27.5%) make up the most common classes of employment.
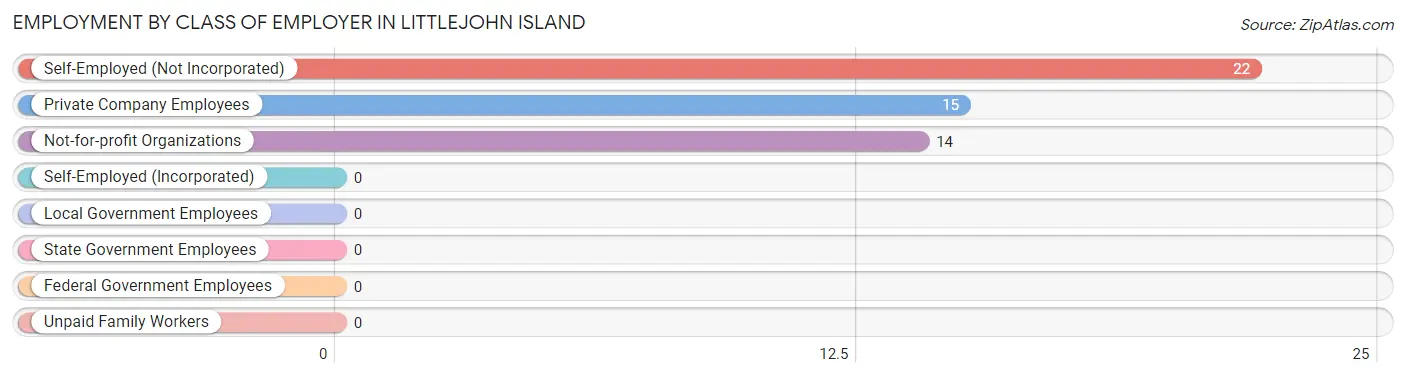
| Employer Class | # Employees | % Employees |
| Private Company Employees | 15 | 29.4% |
| Self-Employed (Incorporated) | 0 | 0.0% |
| Self-Employed (Not Incorporated) | 22 | 43.1% |
| Not-for-profit Organizations | 14 | 27.5% |
| Local Government Employees | 0 | 0.0% |
| State Government Employees | 0 | 0.0% |
| Federal Government Employees | 0 | 0.0% |
| Unpaid Family Workers | 0 | 0.0% |
| Total | 51 | 100.0% |
Employment Status by Age in Littlejohn Island
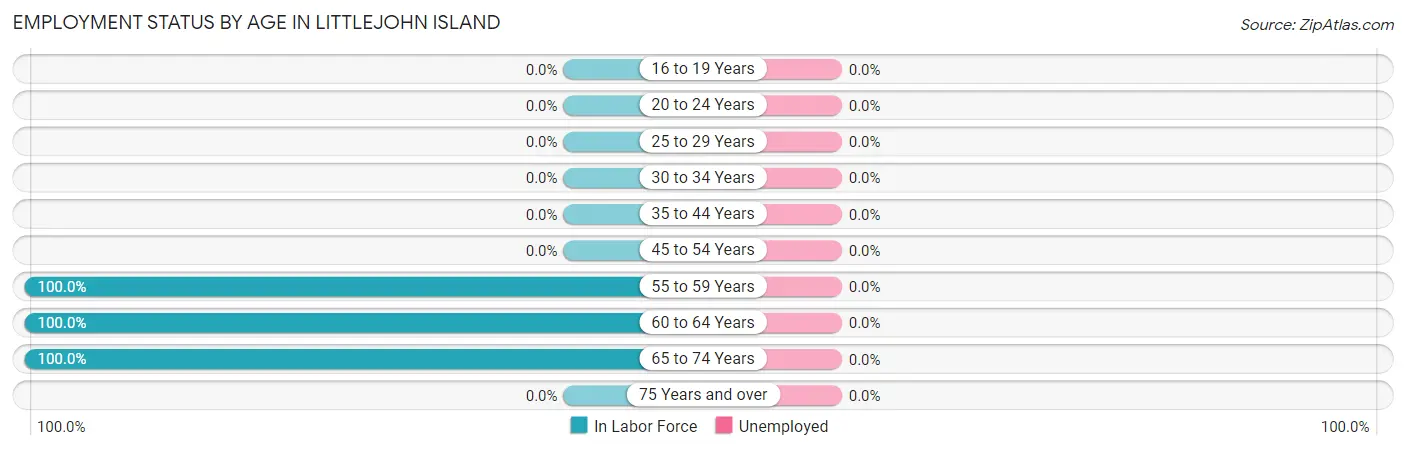
| Age Bracket | In Labor Force | Unemployed |
| 16 to 19 Years | 0 (0.0%) | 0 (0.0%) |
| 20 to 24 Years | 0 (0.0%) | 0 (0.0%) |
| 25 to 29 Years | 0 (0.0%) | 0 (0.0%) |
| 30 to 34 Years | 0 (0.0%) | 0 (0.0%) |
| 35 to 44 Years | 0 (0.0%) | 0 (0.0%) |
| 45 to 54 Years | 0 (0.0%) | 0 (0.0%) |
| 55 to 59 Years | 6 (100.0%) | 0 (0.0%) |
| 60 to 64 Years | 9 (100.0%) | 0 (0.0%) |
| 65 to 74 Years | 36 (100.0%) | 0 (0.0%) |
| 75 Years and over | 0 (0.0%) | 0 (0.0%) |
| Total | 51 (87.9%) | 0 (0.0%) |
Employment Status by Educational Attainment in Littlejohn Island
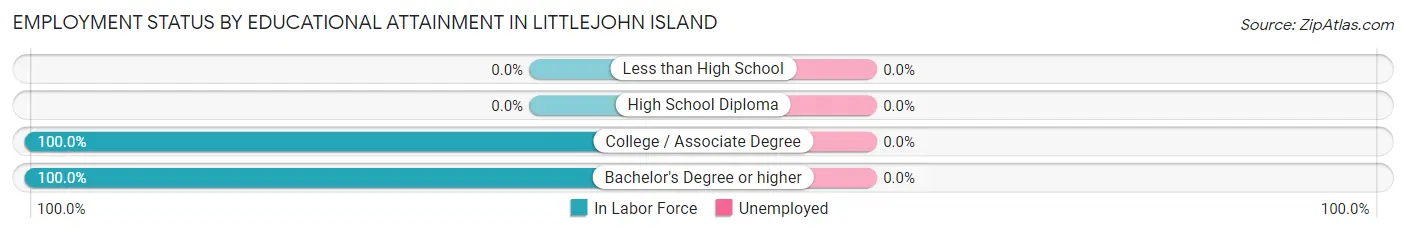
| Educational Attainment | In Labor Force | Unemployed |
| Less than High School | 0 (0.0%) | 0 (0.0%) |
| High School Diploma | 0 (0.0%) | 0 (0.0%) |
| College / Associate Degree | 6 (100.0%) | 0 (0.0%) |
| Bachelor's Degree or higher | 9 (100.0%) | 0 (0.0%) |
| Total | 15 (100.0%) | 0 (0.0%) |
Employment Occupations by Sex in Littlejohn Island
Management, Business, Science and Arts Occupations
The most common Management, Business, Science and Arts occupations in Littlejohn Island are Community & Social Service (22 | 43.1%), Legal Services & Support (22 | 43.1%), Management (15 | 29.4%), and Business & Financial (8 | 15.7%).
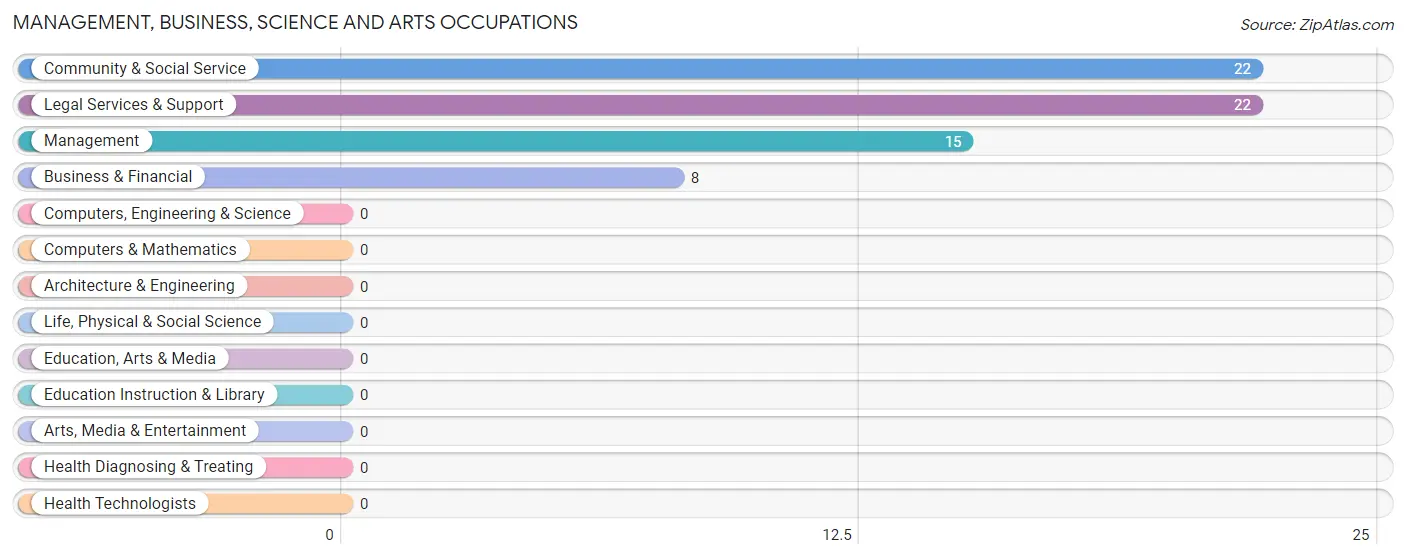
Management, Business, Science and Arts Occupations by Sex
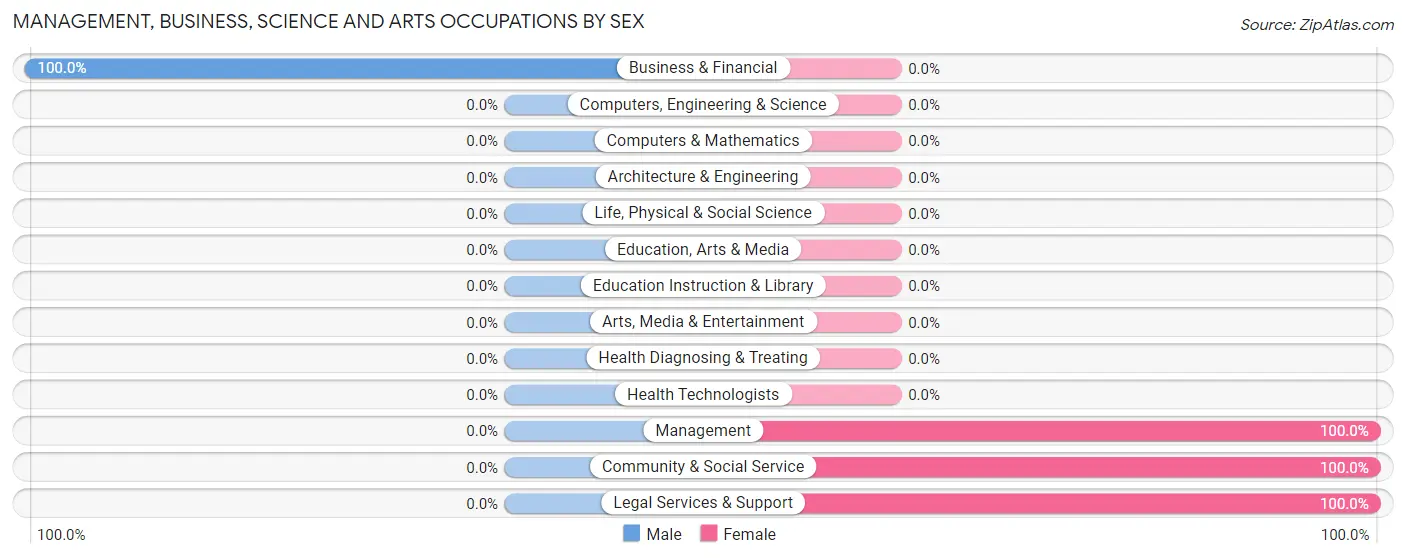
| Occupation | Male | Female |
| Management | 0 (0.0%) | 15 (100.0%) |
| Business & Financial | 8 (100.0%) | 0 (0.0%) |
| Computers, Engineering & Science | 0 (0.0%) | 0 (0.0%) |
| Computers & Mathematics | 0 (0.0%) | 0 (0.0%) |
| Architecture & Engineering | 0 (0.0%) | 0 (0.0%) |
| Life, Physical & Social Science | 0 (0.0%) | 0 (0.0%) |
| Community & Social Service | 0 (0.0%) | 22 (100.0%) |
| Education, Arts & Media | 0 (0.0%) | 0 (0.0%) |
| Legal Services & Support | 0 (0.0%) | 22 (100.0%) |
| Education Instruction & Library | 0 (0.0%) | 0 (0.0%) |
| Arts, Media & Entertainment | 0 (0.0%) | 0 (0.0%) |
| Health Diagnosing & Treating | 0 (0.0%) | 0 (0.0%) |
| Health Technologists | 0 (0.0%) | 0 (0.0%) |
| Total (Category) | 8 (17.8%) | 37 (82.2%) |
| Total (Overall) | 14 (27.5%) | 37 (72.6%) |
Services Occupations
Services Occupations by Sex
| Occupation | Male | Female |
| Healthcare Support | 0 (0.0%) | 0 (0.0%) |
| Security & Protection | 0 (0.0%) | 0 (0.0%) |
| Firefighting & Prevention | 0 (0.0%) | 0 (0.0%) |
| Law Enforcement | 0 (0.0%) | 0 (0.0%) |
| Food Preparation & Serving | 0 (0.0%) | 0 (0.0%) |
| Cleaning & Maintenance | 0 (0.0%) | 0 (0.0%) |
| Personal Care & Service | 0 (0.0%) | 0 (0.0%) |
| Total (Category) | 0 (0.0%) | 0 (0.0%) |
| Total (Overall) | 14 (27.5%) | 37 (72.6%) |
Sales and Office Occupations
The most common Sales and Office occupations in Littlejohn Island are , and Sales & Related (6 | 11.8%).
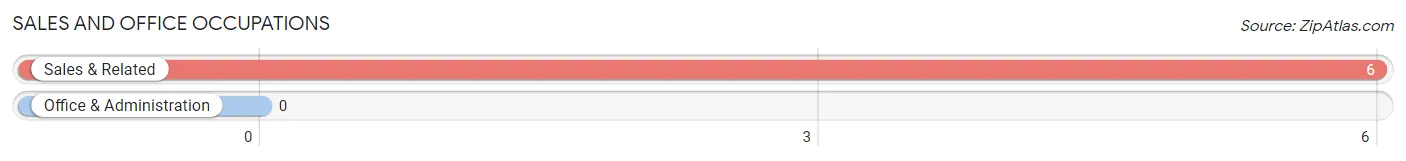
Sales and Office Occupations by Sex
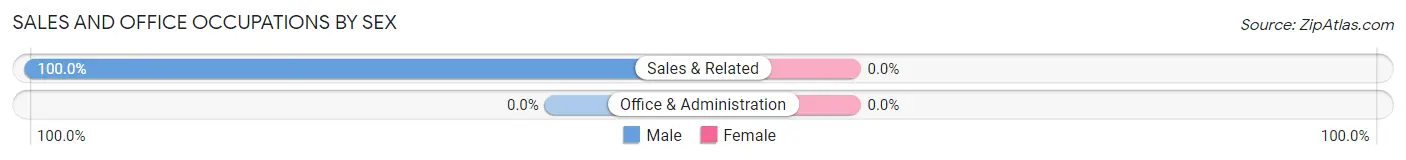
| Occupation | Male | Female |
| Sales & Related | 6 (100.0%) | 0 (0.0%) |
| Office & Administration | 0 (0.0%) | 0 (0.0%) |
| Total (Category) | 6 (100.0%) | 0 (0.0%) |
| Total (Overall) | 14 (27.5%) | 37 (72.6%) |
Natural Resources, Construction and Maintenance Occupations
Natural Resources, Construction and Maintenance Occupations by Sex
| Occupation | Male | Female |
| Farming, Fishing & Forestry | 0 (0.0%) | 0 (0.0%) |
| Construction & Extraction | 0 (0.0%) | 0 (0.0%) |
| Installation, Maintenance & Repair | 0 (0.0%) | 0 (0.0%) |
| Total (Category) | 0 (0.0%) | 0 (0.0%) |
| Total (Overall) | 14 (27.5%) | 37 (72.6%) |
Production, Transportation and Moving Occupations
Production, Transportation and Moving Occupations by Sex
| Occupation | Male | Female |
| Production | 0 (0.0%) | 0 (0.0%) |
| Transportation | 0 (0.0%) | 0 (0.0%) |
| Material Moving | 0 (0.0%) | 0 (0.0%) |
| Total (Category) | 0 (0.0%) | 0 (0.0%) |
| Total (Overall) | 14 (27.5%) | 37 (72.6%) |
Employment Industries by Sex in Littlejohn Island
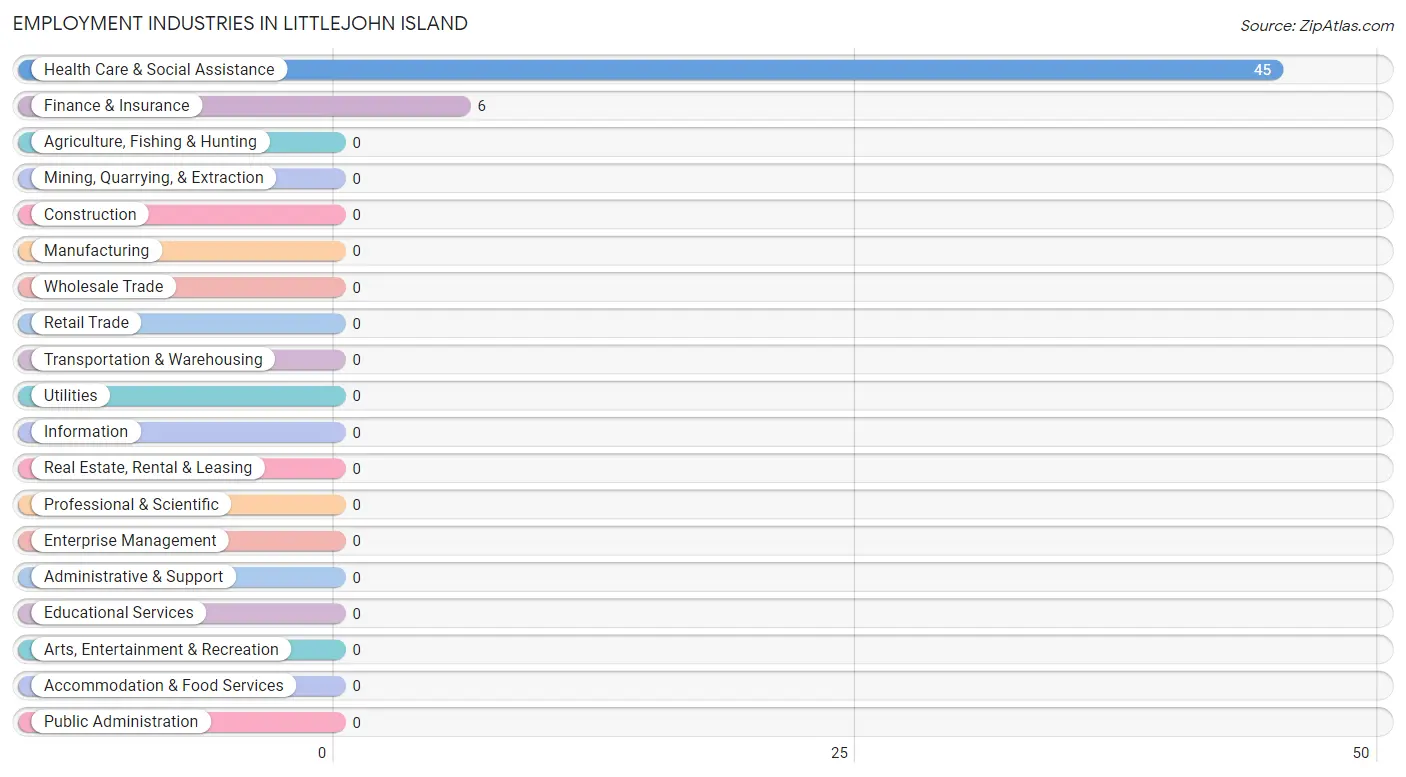
Employment Industries in Littlejohn Island
The major employment industries in Littlejohn Island include Health Care & Social Assistance (45 | 88.2%), and Finance & Insurance (6 | 11.8%).
Employment Industries by Sex in Littlejohn Island
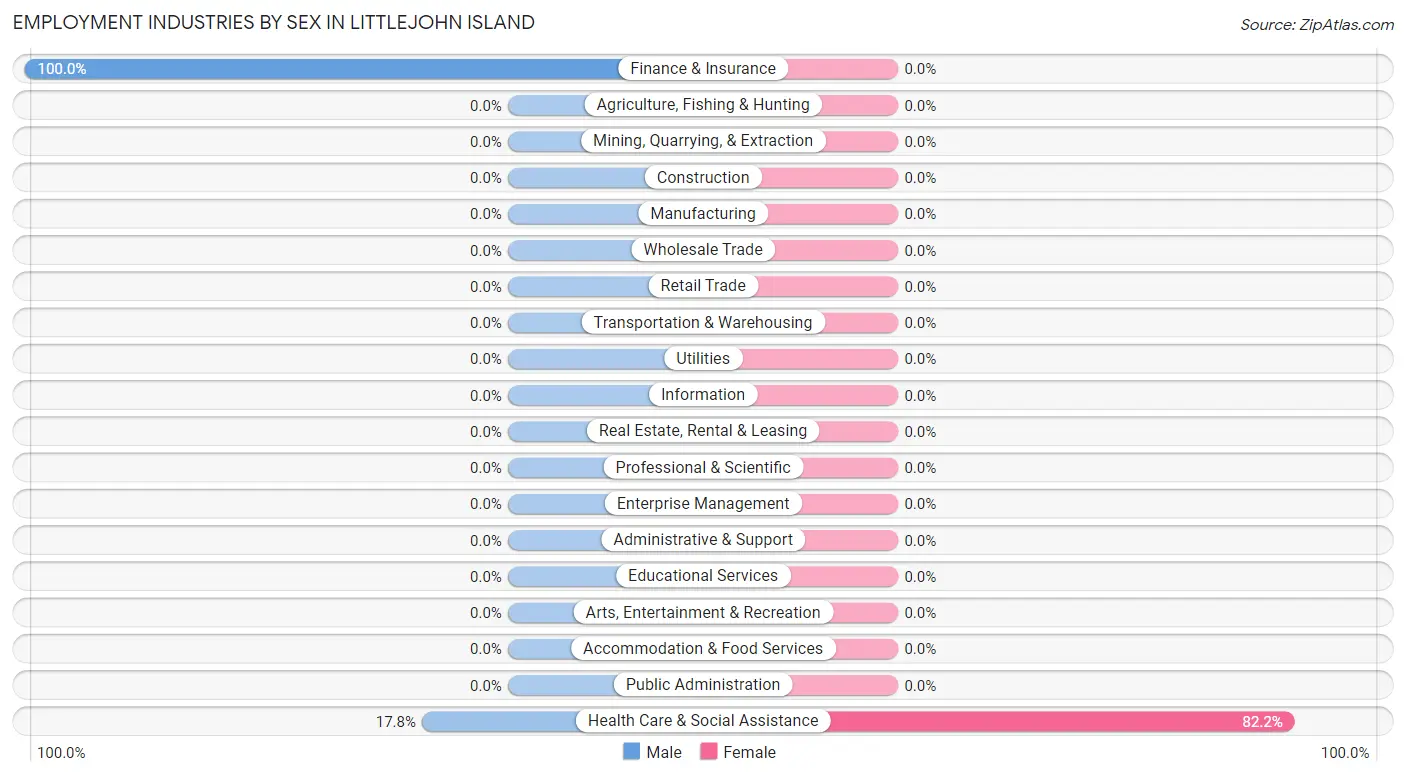
| Industry | Male | Female |
| Agriculture, Fishing & Hunting | 0 (0.0%) | 0 (0.0%) |
| Mining, Quarrying, & Extraction | 0 (0.0%) | 0 (0.0%) |
| Construction | 0 (0.0%) | 0 (0.0%) |
| Manufacturing | 0 (0.0%) | 0 (0.0%) |
| Wholesale Trade | 0 (0.0%) | 0 (0.0%) |
| Retail Trade | 0 (0.0%) | 0 (0.0%) |
| Transportation & Warehousing | 0 (0.0%) | 0 (0.0%) |
| Utilities | 0 (0.0%) | 0 (0.0%) |
| Information | 0 (0.0%) | 0 (0.0%) |
| Finance & Insurance | 6 (100.0%) | 0 (0.0%) |
| Real Estate, Rental & Leasing | 0 (0.0%) | 0 (0.0%) |
| Professional & Scientific | 0 (0.0%) | 0 (0.0%) |
| Enterprise Management | 0 (0.0%) | 0 (0.0%) |
| Administrative & Support | 0 (0.0%) | 0 (0.0%) |
| Educational Services | 0 (0.0%) | 0 (0.0%) |
| Health Care & Social Assistance | 8 (17.8%) | 37 (82.2%) |
| Arts, Entertainment & Recreation | 0 (0.0%) | 0 (0.0%) |
| Accommodation & Food Services | 0 (0.0%) | 0 (0.0%) |
| Public Administration | 0 (0.0%) | 0 (0.0%) |
| Total | 14 (27.5%) | 37 (72.6%) |
Education in Littlejohn Island
School Enrollment in Littlejohn Island
| School Level | # Students | % Students |
| Nursery / Preschool | 0 | 0.0% |
| Kindergarten | 0 | 0.0% |
| Elementary School | 0 | 0.0% |
| Middle School | 0 | 0.0% |
| High School | 0 | 0.0% |
| College / Undergraduate | 0 | 0.0% |
| Graduate / Professional | 0 | 0.0% |
| Total | 0 | 0.0% |
School Enrollment by Age by Funding Source in Littlejohn Island
| Age Bracket | Public School | Private School |
| 3 to 4 Year Olds | 0 (0.0%) | 0 (0.0%) |
| 5 to 9 Year Old | 0 (0.0%) | 0 (0.0%) |
| 10 to 14 Year Olds | 0 (0.0%) | 0 (0.0%) |
| 15 to 17 Year Olds | 0 (0.0%) | 0 (0.0%) |
| 18 to 19 Year Olds | 0 (0.0%) | 0 (0.0%) |
| 20 to 24 Year Olds | 0 (0.0%) | 0 (0.0%) |
| 25 to 34 Year Olds | 0 (0.0%) | 0 (0.0%) |
| 35 Years and over | 0 (0.0%) | 0 (0.0%) |
| Total | 0 (0.0%) | 0 (0.0%) |
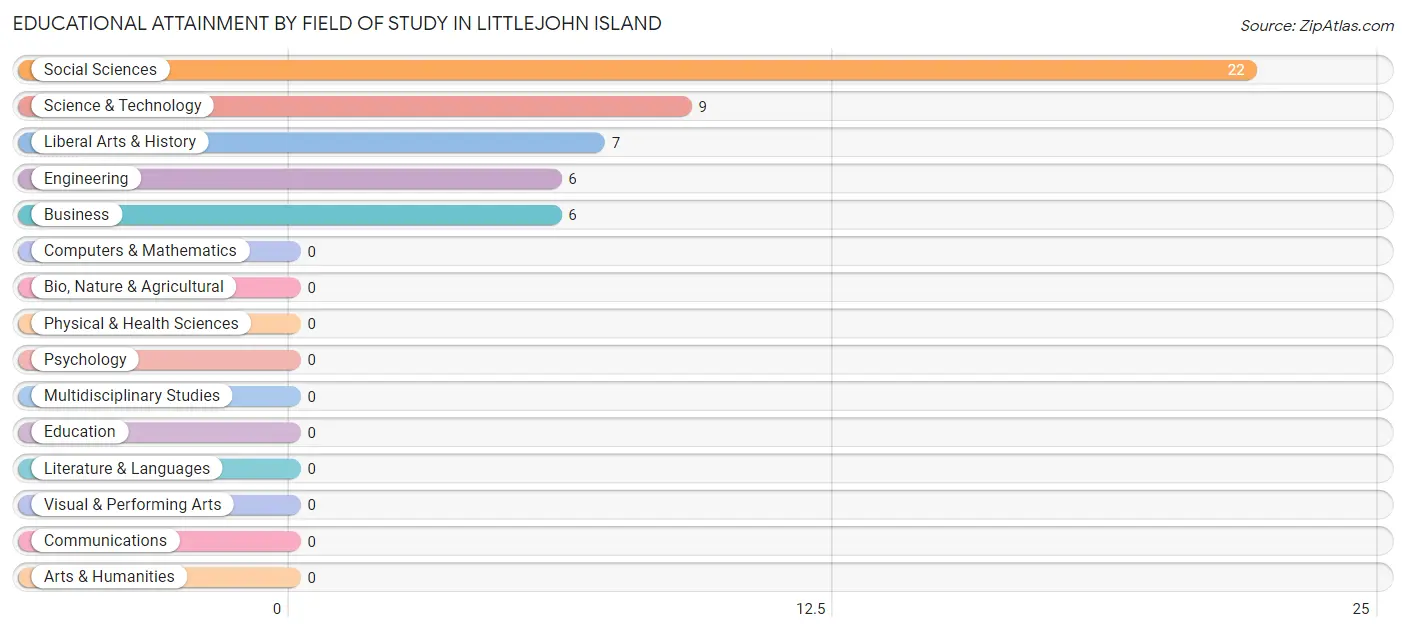
Educational Attainment by Field of Study in Littlejohn Island
Social sciences (22 | 44.0%), science & technology (9 | 18.0%), liberal arts & history (7 | 14.0%), engineering (6 | 12.0%), and business (6 | 12.0%) are the most common fields of study among 50 individuals in Littlejohn Island who have obtained a bachelor's degree or higher.
| Field of Study | # Graduates | % Graduates |
| Computers & Mathematics | 0 | 0.0% |
| Bio, Nature & Agricultural | 0 | 0.0% |
| Physical & Health Sciences | 0 | 0.0% |
| Psychology | 0 | 0.0% |
| Social Sciences | 22 | 44.0% |
| Engineering | 6 | 12.0% |
| Multidisciplinary Studies | 0 | 0.0% |
| Science & Technology | 9 | 18.0% |
| Business | 6 | 12.0% |
| Education | 0 | 0.0% |
| Literature & Languages | 0 | 0.0% |
| Liberal Arts & History | 7 | 14.0% |
| Visual & Performing Arts | 0 | 0.0% |
| Communications | 0 | 0.0% |
| Arts & Humanities | 0 | 0.0% |
| Total | 50 | 100.0% |
Transportation & Commute in Littlejohn Island
Vehicle Availability by Sex in Littlejohn Island
The most prevalent vehicle ownership categories in Littlejohn Island are males with 3 vehicles (8, accounting for 57.1%) and females with 3 vehicles (9, making up 21.6%).
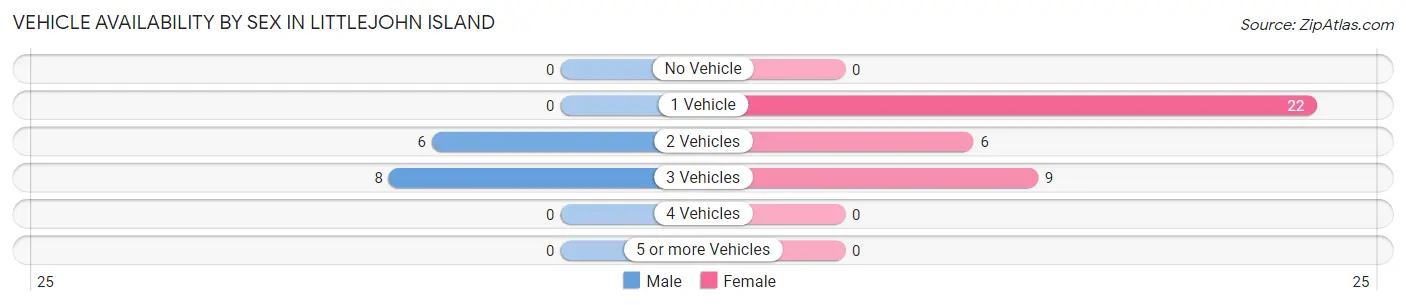
| Vehicles Available | Male | Female |
| No Vehicle | 0 (0.0%) | 0 (0.0%) |
| 1 Vehicle | 0 (0.0%) | 22 (59.5%) |
| 2 Vehicles | 6 (42.9%) | 6 (16.2%) |
| 3 Vehicles | 8 (57.1%) | 9 (24.3%) |
| 4 Vehicles | 0 (0.0%) | 0 (0.0%) |
| 5 or more Vehicles | 0 (0.0%) | 0 (0.0%) |
| Total | 14 (100.0%) | 37 (100.0%) |
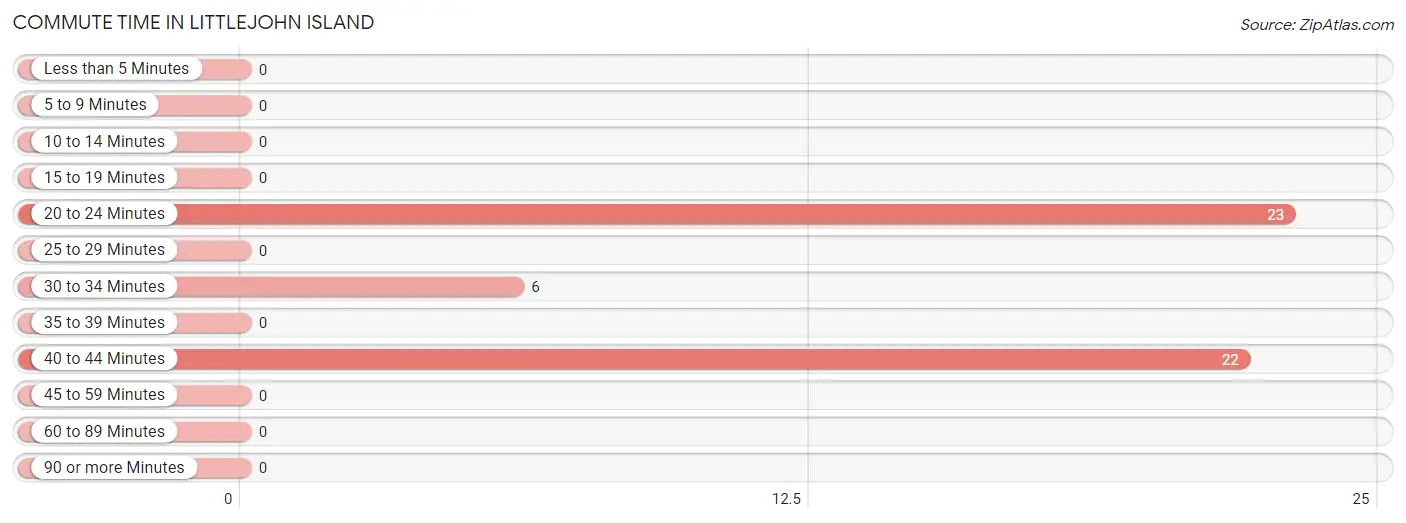
Commute Time in Littlejohn Island
The most frequently occuring commute durations in Littlejohn Island are 20 to 24 minutes (23 commuters, 45.1%), 40 to 44 minutes (22 commuters, 43.1%), and 30 to 34 minutes (6 commuters, 11.8%).
| Commute Time | # Commuters | % Commuters |
| Less than 5 Minutes | 0 | 0.0% |
| 5 to 9 Minutes | 0 | 0.0% |
| 10 to 14 Minutes | 0 | 0.0% |
| 15 to 19 Minutes | 0 | 0.0% |
| 20 to 24 Minutes | 23 | 45.1% |
| 25 to 29 Minutes | 0 | 0.0% |
| 30 to 34 Minutes | 6 | 11.8% |
| 35 to 39 Minutes | 0 | 0.0% |
| 40 to 44 Minutes | 22 | 43.1% |
| 45 to 59 Minutes | 0 | 0.0% |
| 60 to 89 Minutes | 0 | 0.0% |
| 90 or more Minutes | 0 | 0.0% |
Commute Time by Sex in Littlejohn Island
The most common commute times in Littlejohn Island are 20 to 24 minutes (14 commuters, 100.0%) for males and 40 to 44 minutes (22 commuters, 59.5%) for females.
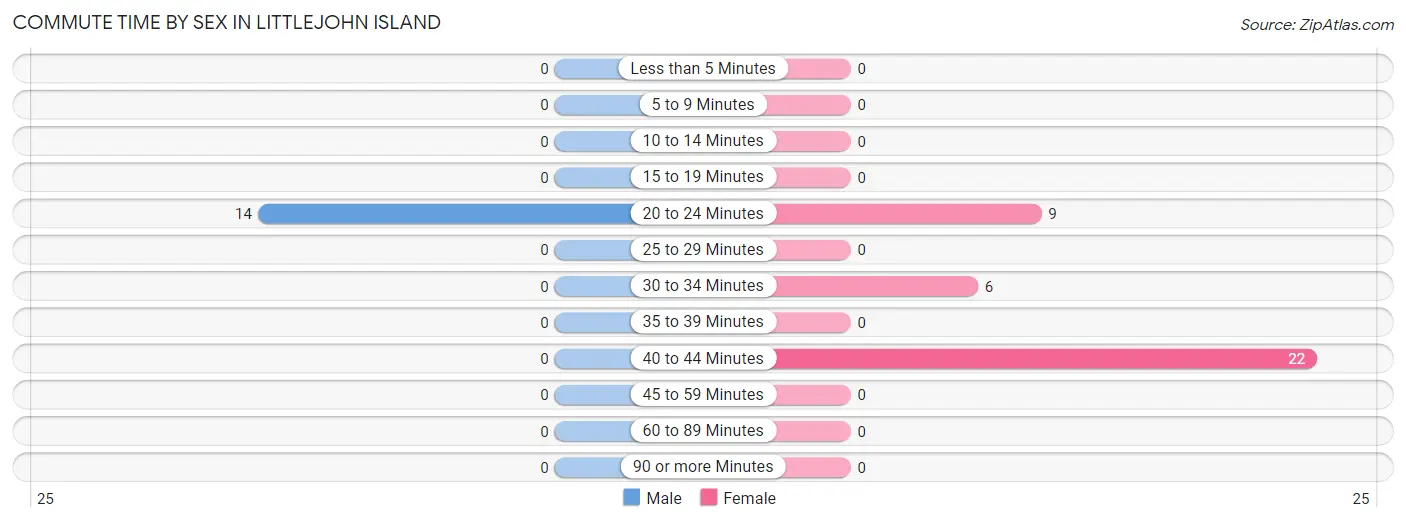
| Commute Time | Male | Female |
| Less than 5 Minutes | 0 (0.0%) | 0 (0.0%) |
| 5 to 9 Minutes | 0 (0.0%) | 0 (0.0%) |
| 10 to 14 Minutes | 0 (0.0%) | 0 (0.0%) |
| 15 to 19 Minutes | 0 (0.0%) | 0 (0.0%) |
| 20 to 24 Minutes | 14 (100.0%) | 9 (24.3%) |
| 25 to 29 Minutes | 0 (0.0%) | 0 (0.0%) |
| 30 to 34 Minutes | 0 (0.0%) | 6 (16.2%) |
| 35 to 39 Minutes | 0 (0.0%) | 0 (0.0%) |
| 40 to 44 Minutes | 0 (0.0%) | 22 (59.5%) |
| 45 to 59 Minutes | 0 (0.0%) | 0 (0.0%) |
| 60 to 89 Minutes | 0 (0.0%) | 0 (0.0%) |
| 90 or more Minutes | 0 (0.0%) | 0 (0.0%) |
Time of Departure to Work by Sex in Littlejohn Island
The most frequent times of departure to work in Littlejohn Island are 9:00 AM to 9:59 AM (8, 57.1%) for males and 9:00 AM to 9:59 AM (31, 83.8%) for females.
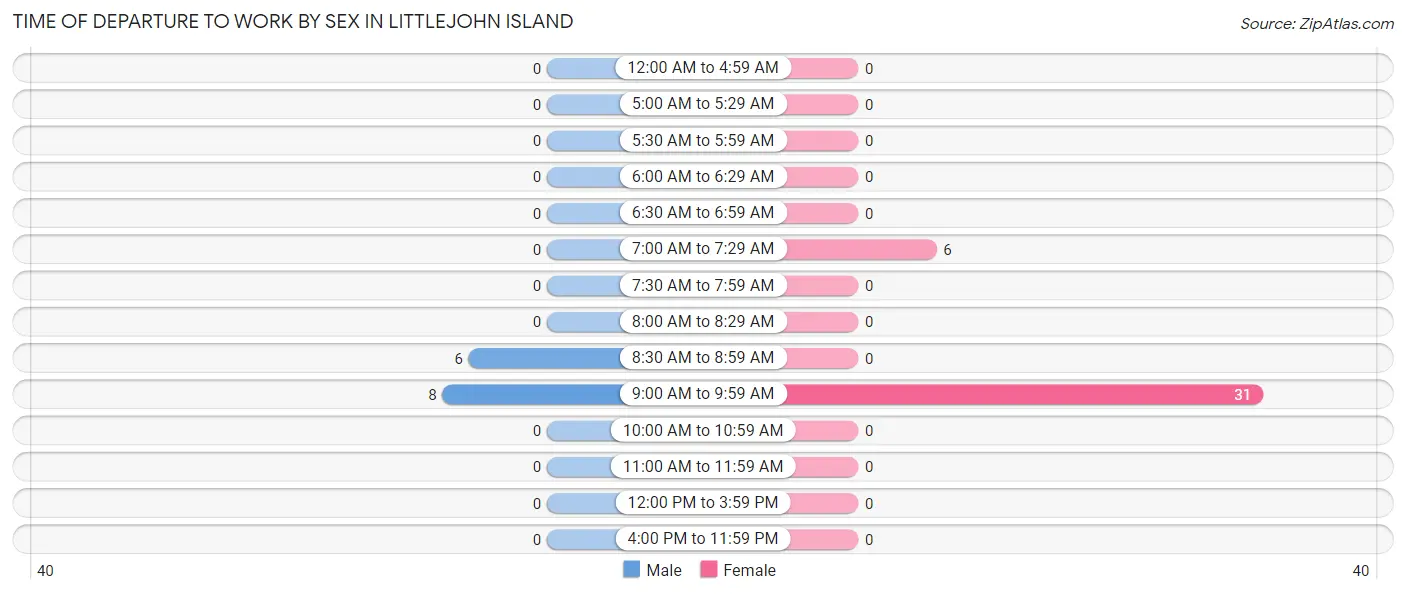
| Time of Departure | Male | Female |
| 12:00 AM to 4:59 AM | 0 (0.0%) | 0 (0.0%) |
| 5:00 AM to 5:29 AM | 0 (0.0%) | 0 (0.0%) |
| 5:30 AM to 5:59 AM | 0 (0.0%) | 0 (0.0%) |
| 6:00 AM to 6:29 AM | 0 (0.0%) | 0 (0.0%) |
| 6:30 AM to 6:59 AM | 0 (0.0%) | 0 (0.0%) |
| 7:00 AM to 7:29 AM | 0 (0.0%) | 6 (16.2%) |
| 7:30 AM to 7:59 AM | 0 (0.0%) | 0 (0.0%) |
| 8:00 AM to 8:29 AM | 0 (0.0%) | 0 (0.0%) |
| 8:30 AM to 8:59 AM | 6 (42.9%) | 0 (0.0%) |
| 9:00 AM to 9:59 AM | 8 (57.1%) | 31 (83.8%) |
| 10:00 AM to 10:59 AM | 0 (0.0%) | 0 (0.0%) |
| 11:00 AM to 11:59 AM | 0 (0.0%) | 0 (0.0%) |
| 12:00 PM to 3:59 PM | 0 (0.0%) | 0 (0.0%) |
| 4:00 PM to 11:59 PM | 0 (0.0%) | 0 (0.0%) |
| Total | 14 (100.0%) | 37 (100.0%) |
Housing Occupancy in Littlejohn Island
Occupancy by Ownership in Littlejohn Island
Of the total 43 dwellings in Littlejohn Island, owner-occupied units account for 43 (100.0%), while renter-occupied units make up 0 (0.0%).
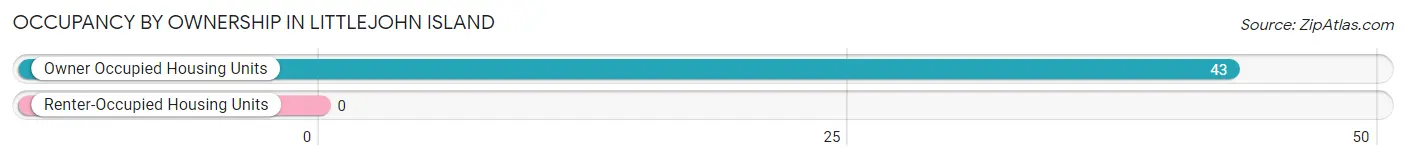
| Occupancy | # Housing Units | % Housing Units |
| Owner Occupied Housing Units | 43 | 100.0% |
| Renter-Occupied Housing Units | 0 | 0.0% |
| Total Occupied Housing Units | 43 | 100.0% |
Occupancy by Household Size in Littlejohn Island
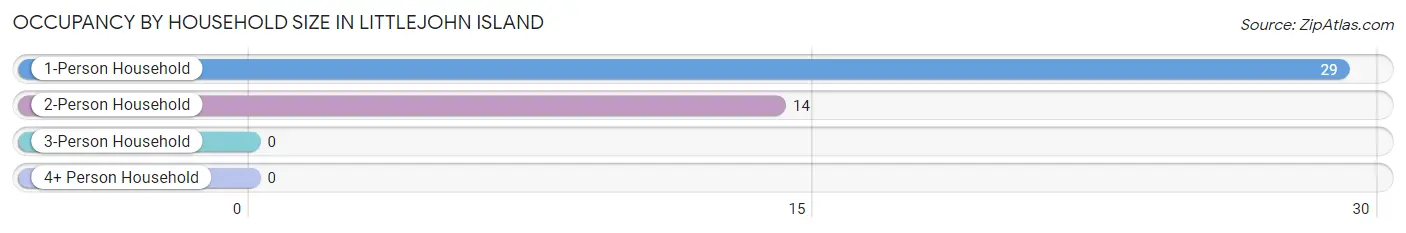
| Household Size | # Housing Units | % Housing Units |
| 1-Person Household | 29 | 67.4% |
| 2-Person Household | 14 | 32.6% |
| 3-Person Household | 0 | 0.0% |
| 4+ Person Household | 0 | 0.0% |
| Total Housing Units | 43 | 100.0% |
Occupancy by Ownership by Household Size in Littlejohn Island
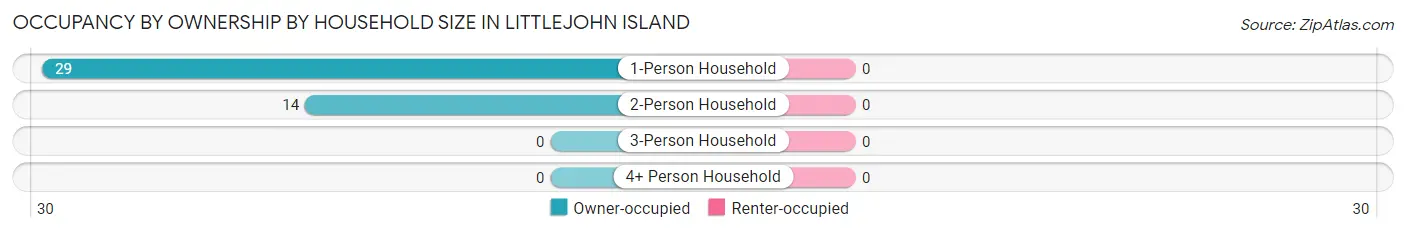
| Household Size | Owner-occupied | Renter-occupied |
| 1-Person Household | 29 (100.0%) | 0 (0.0%) |
| 2-Person Household | 14 (100.0%) | 0 (0.0%) |
| 3-Person Household | 0 (0.0%) | 0 (0.0%) |
| 4+ Person Household | 0 (0.0%) | 0 (0.0%) |
| Total Housing Units | 43 (100.0%) | 0 (0.0%) |
Occupancy by Educational Attainment in Littlejohn Island
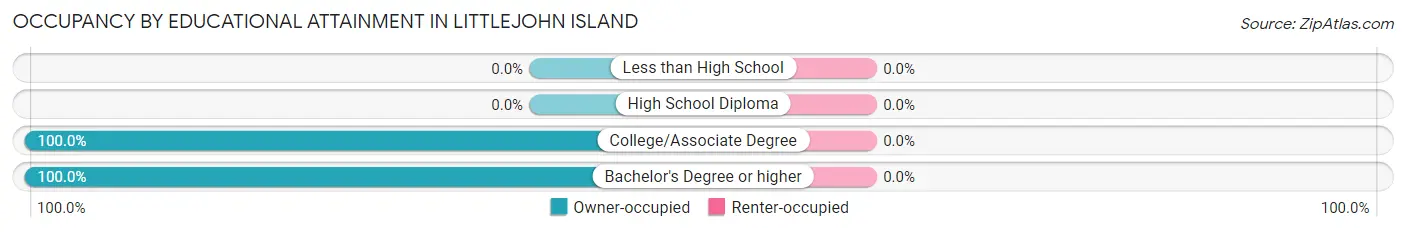
| Household Size | Owner-occupied | Renter-occupied |
| Less than High School | 0 (0.0%) | 0 (0.0%) |
| High School Diploma | 0 (0.0%) | 0 (0.0%) |
| College/Associate Degree | 14 (100.0%) | 0 (0.0%) |
| Bachelor's Degree or higher | 29 (100.0%) | 0 (0.0%) |
Occupancy by Age of Householder in Littlejohn Island
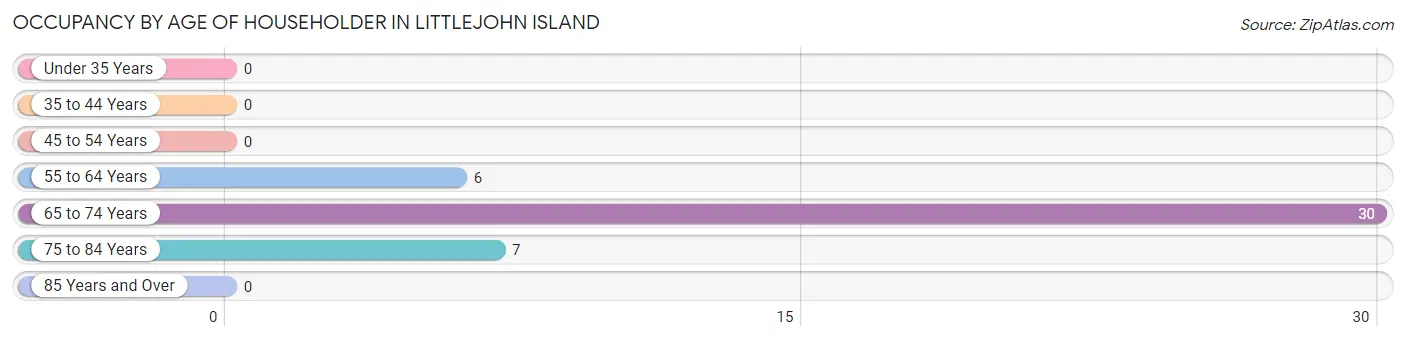
| Age Bracket | # Households | % Households |
| Under 35 Years | 0 | 0.0% |
| 35 to 44 Years | 0 | 0.0% |
| 45 to 54 Years | 0 | 0.0% |
| 55 to 64 Years | 6 | 14.0% |
| 65 to 74 Years | 30 | 69.8% |
| 75 to 84 Years | 7 | 16.3% |
| 85 Years and Over | 0 | 0.0% |
| Total | 43 | 100.0% |
Housing Finances in Littlejohn Island
Median Income by Occupancy in Littlejohn Island
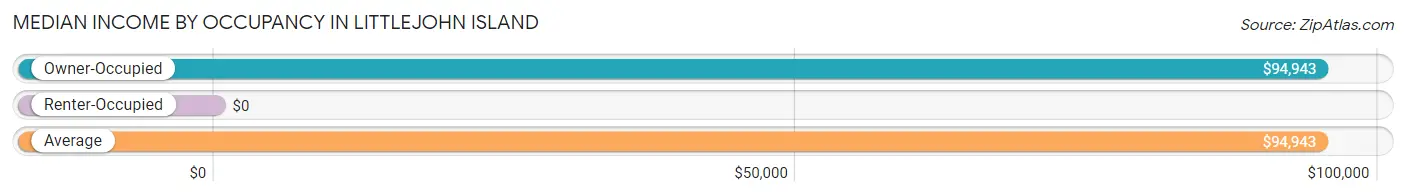
| Occupancy Type | # Households | Median Income |
| Owner-Occupied | 43 (100.0%) | $94,943 |
| Renter-Occupied | 0 (0.0%) | $0 |
| Average | 43 (100.0%) | $94,943 |
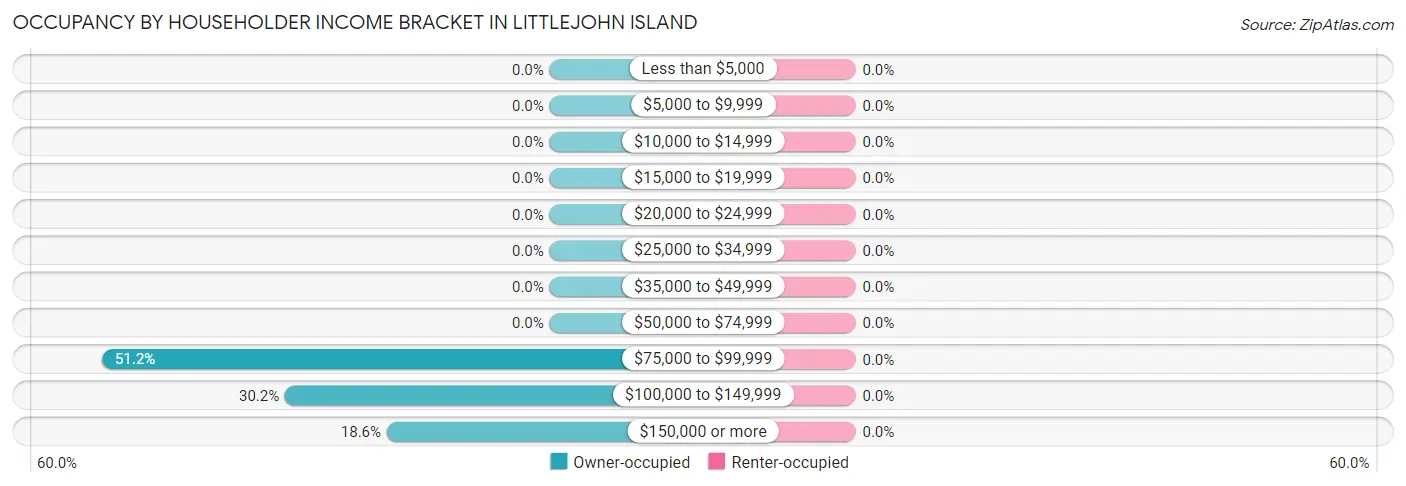
Occupancy by Householder Income Bracket in Littlejohn Island
| Income Bracket | Owner-occupied | Renter-occupied |
| Less than $5,000 | 0 (0.0%) | 0 (0.0%) |
| $5,000 to $9,999 | 0 (0.0%) | 0 (0.0%) |
| $10,000 to $14,999 | 0 (0.0%) | 0 (0.0%) |
| $15,000 to $19,999 | 0 (0.0%) | 0 (0.0%) |
| $20,000 to $24,999 | 0 (0.0%) | 0 (0.0%) |
| $25,000 to $34,999 | 0 (0.0%) | 0 (0.0%) |
| $35,000 to $49,999 | 0 (0.0%) | 0 (0.0%) |
| $50,000 to $74,999 | 0 (0.0%) | 0 (0.0%) |
| $75,000 to $99,999 | 22 (51.2%) | 0 (0.0%) |
| $100,000 to $149,999 | 13 (30.2%) | 0 (0.0%) |
| $150,000 or more | 8 (18.6%) | 0 (0.0%) |
| Total | 43 (100.0%) | 0 (0.0%) |
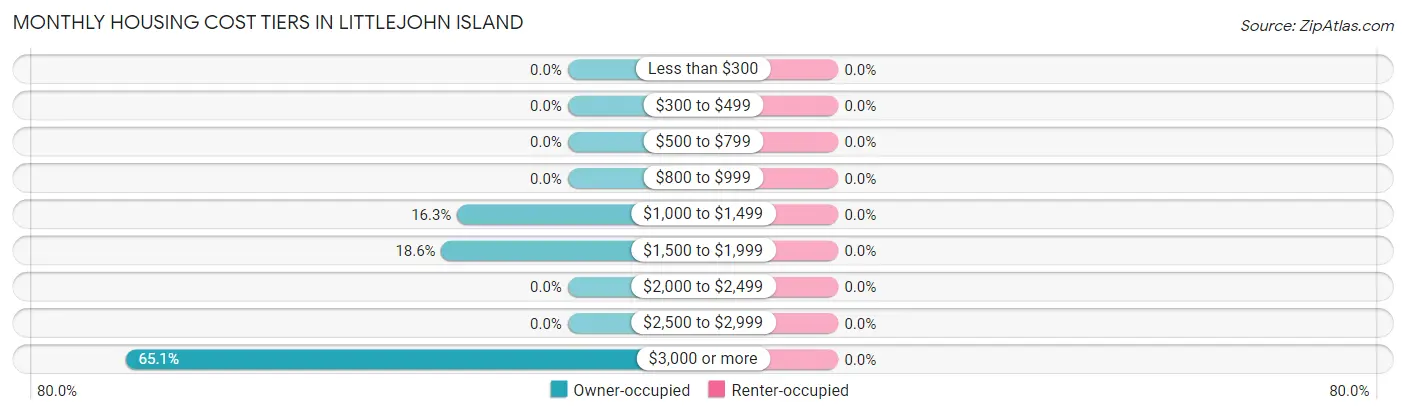
Monthly Housing Cost Tiers in Littlejohn Island
| Monthly Cost | Owner-occupied | Renter-occupied |
| Less than $300 | 0 (0.0%) | 0 (0.0%) |
| $300 to $499 | 0 (0.0%) | 0 (0.0%) |
| $500 to $799 | 0 (0.0%) | 0 (0.0%) |
| $800 to $999 | 0 (0.0%) | 0 (0.0%) |
| $1,000 to $1,499 | 7 (16.3%) | 0 (0.0%) |
| $1,500 to $1,999 | 8 (18.6%) | 0 (0.0%) |
| $2,000 to $2,499 | 0 (0.0%) | 0 (0.0%) |
| $2,500 to $2,999 | 0 (0.0%) | 0 (0.0%) |
| $3,000 or more | 28 (65.1%) | 0 (0.0%) |
| Total | 43 (100.0%) | 0 (0.0%) |
Physical Housing Characteristics in Littlejohn Island
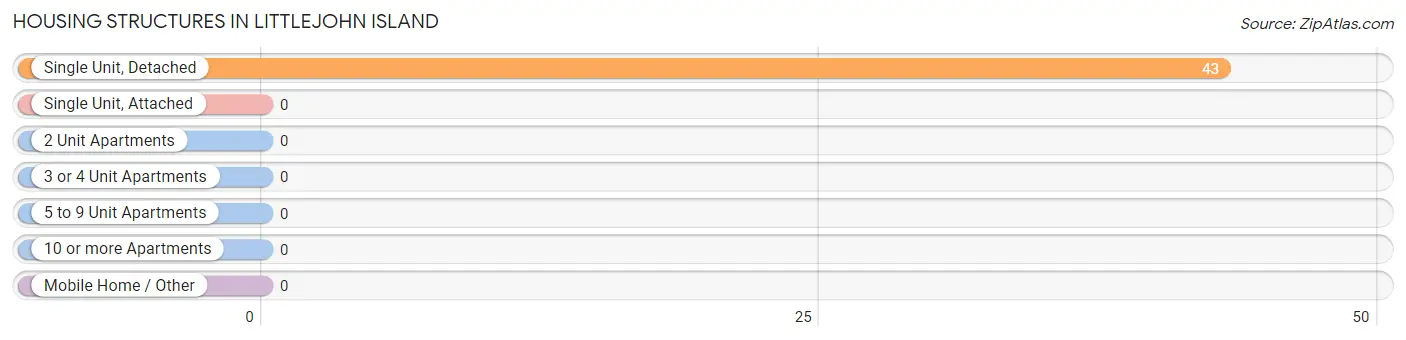
Housing Structures in Littlejohn Island
| Structure Type | # Housing Units | % Housing Units |
| Single Unit, Detached | 43 | 100.0% |
| Single Unit, Attached | 0 | 0.0% |
| 2 Unit Apartments | 0 | 0.0% |
| 3 or 4 Unit Apartments | 0 | 0.0% |
| 5 to 9 Unit Apartments | 0 | 0.0% |
| 10 or more Apartments | 0 | 0.0% |
| Mobile Home / Other | 0 | 0.0% |
| Total | 43 | 100.0% |
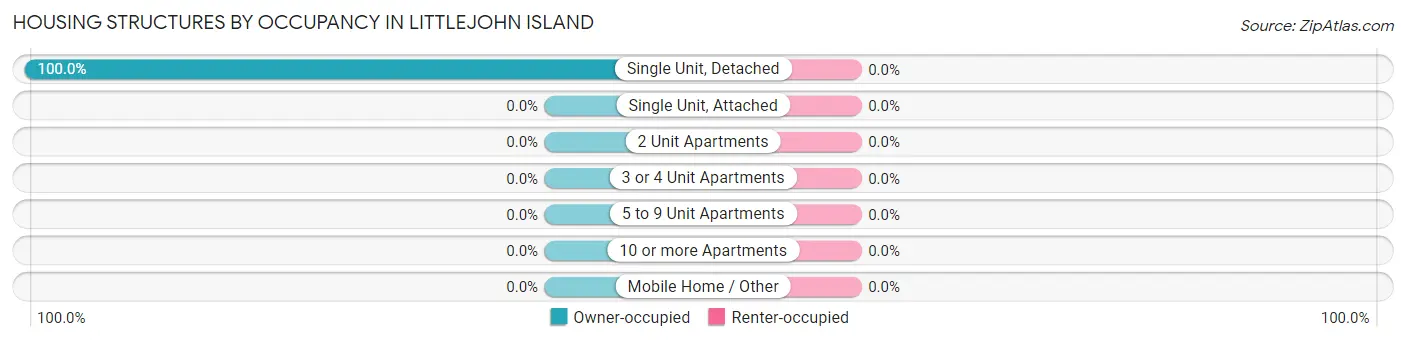
Housing Structures by Occupancy in Littlejohn Island
| Structure Type | Owner-occupied | Renter-occupied |
| Single Unit, Detached | 43 (100.0%) | 0 (0.0%) |
| Single Unit, Attached | 0 (0.0%) | 0 (0.0%) |
| 2 Unit Apartments | 0 (0.0%) | 0 (0.0%) |
| 3 or 4 Unit Apartments | 0 (0.0%) | 0 (0.0%) |
| 5 to 9 Unit Apartments | 0 (0.0%) | 0 (0.0%) |
| 10 or more Apartments | 0 (0.0%) | 0 (0.0%) |
| Mobile Home / Other | 0 (0.0%) | 0 (0.0%) |
| Total | 43 (100.0%) | 0 (0.0%) |
Housing Structures by Number of Rooms in Littlejohn Island
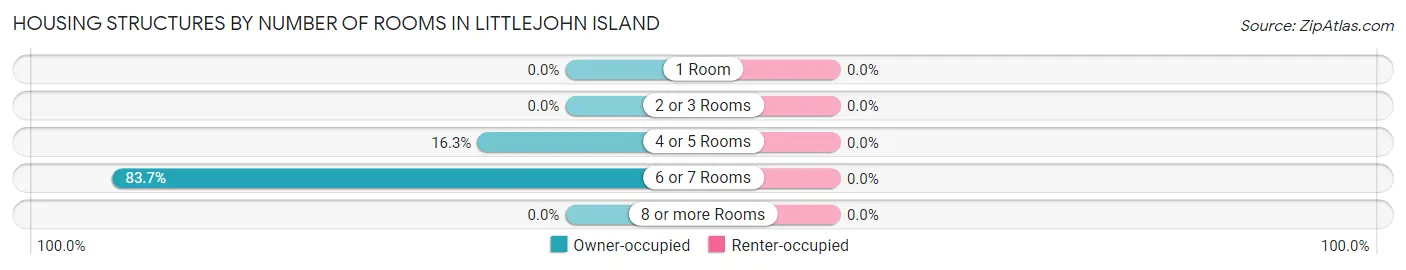
| Number of Rooms | Owner-occupied | Renter-occupied |
| 1 Room | 0 (0.0%) | 0 (0.0%) |
| 2 or 3 Rooms | 0 (0.0%) | 0 (0.0%) |
| 4 or 5 Rooms | 7 (16.3%) | 0 (0.0%) |
| 6 or 7 Rooms | 36 (83.7%) | 0 (0.0%) |
| 8 or more Rooms | 0 (0.0%) | 0 (0.0%) |
| Total | 43 (100.0%) | 0 (0.0%) |
Housing Structure by Heating Type in Littlejohn Island
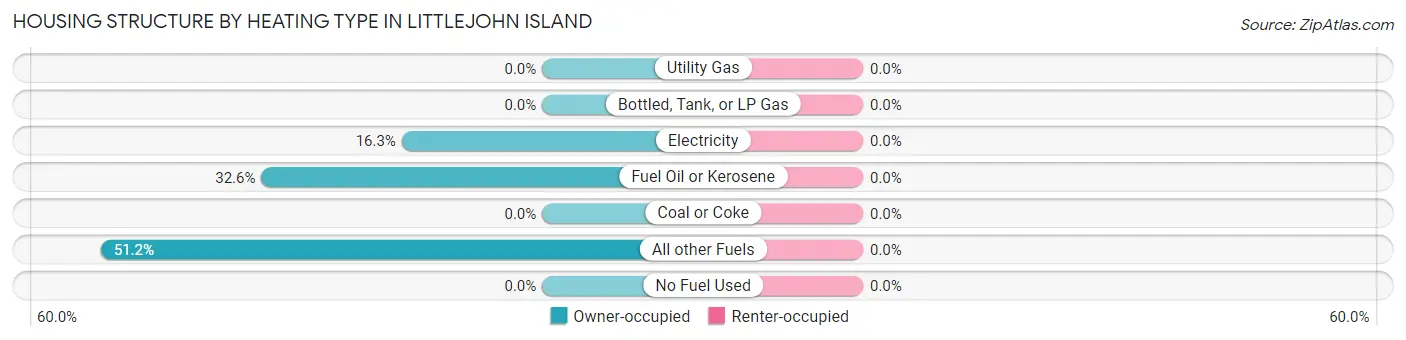
| Heating Type | Owner-occupied | Renter-occupied |
| Utility Gas | 0 (0.0%) | 0 (0.0%) |
| Bottled, Tank, or LP Gas | 0 (0.0%) | 0 (0.0%) |
| Electricity | 7 (16.3%) | 0 (0.0%) |
| Fuel Oil or Kerosene | 14 (32.6%) | 0 (0.0%) |
| Coal or Coke | 0 (0.0%) | 0 (0.0%) |
| All other Fuels | 22 (51.2%) | 0 (0.0%) |
| No Fuel Used | 0 (0.0%) | 0 (0.0%) |
| Total | 43 (100.0%) | 0 (0.0%) |
Household Vehicle Usage in Littlejohn Island
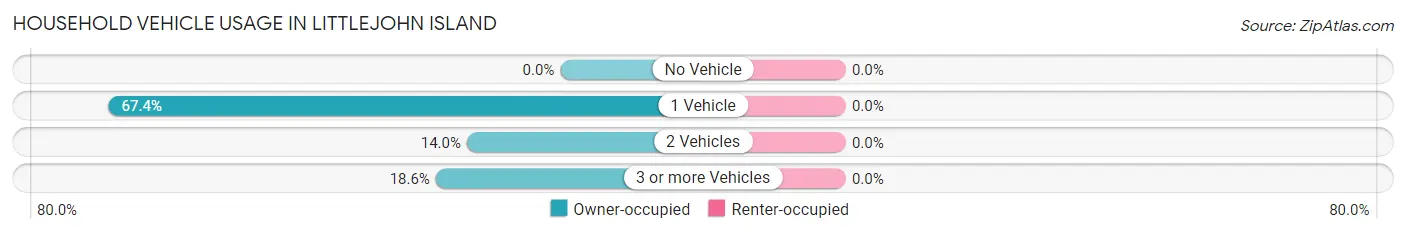
| Vehicles per Household | Owner-occupied | Renter-occupied |
| No Vehicle | 0 (0.0%) | 0 (0.0%) |
| 1 Vehicle | 29 (67.4%) | 0 (0.0%) |
| 2 Vehicles | 6 (14.0%) | 0 (0.0%) |
| 3 or more Vehicles | 8 (18.6%) | 0 (0.0%) |
| Total | 43 (100.0%) | 0 (0.0%) |
Real Estate & Mortgages in Littlejohn Island
Real Estate and Mortgage Overview in Littlejohn Island
| Characteristic | Without Mortgage | With Mortgage |
| Housing Units | 7 | 36 |
| Median Property Value | - | - |
| Median Household Income | - | - |
| Monthly Housing Costs | - | - |
| Real Estate Taxes | - | - |
Property Value by Mortgage Status in Littlejohn Island
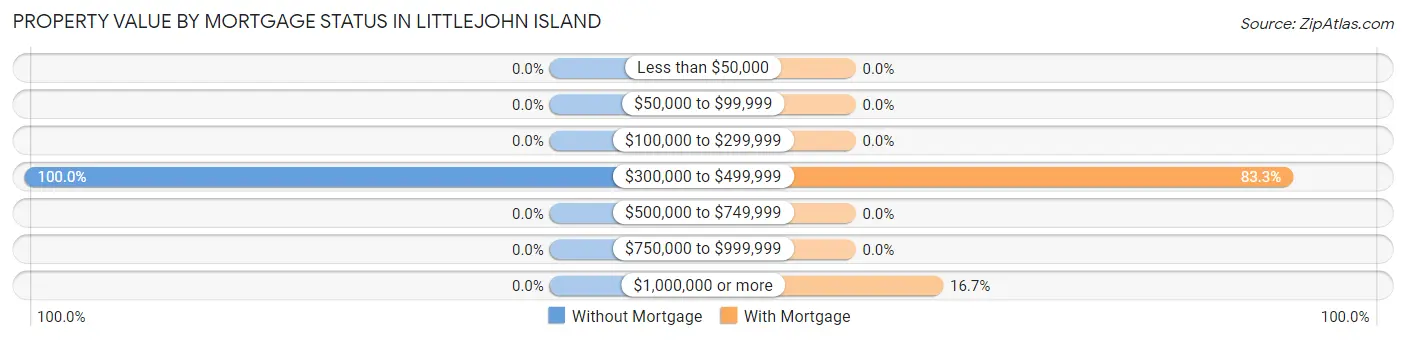
| Property Value | Without Mortgage | With Mortgage |
| Less than $50,000 | 0 (0.0%) | 0 (0.0%) |
| $50,000 to $99,999 | 0 (0.0%) | 0 (0.0%) |
| $100,000 to $299,999 | 0 (0.0%) | 0 (0.0%) |
| $300,000 to $499,999 | 7 (100.0%) | 30 (83.3%) |
| $500,000 to $749,999 | 0 (0.0%) | 0 (0.0%) |
| $750,000 to $999,999 | 0 (0.0%) | 0 (0.0%) |
| $1,000,000 or more | 0 (0.0%) | 6 (16.7%) |
| Total | 7 (100.0%) | 36 (100.0%) |
Household Income by Mortgage Status in Littlejohn Island
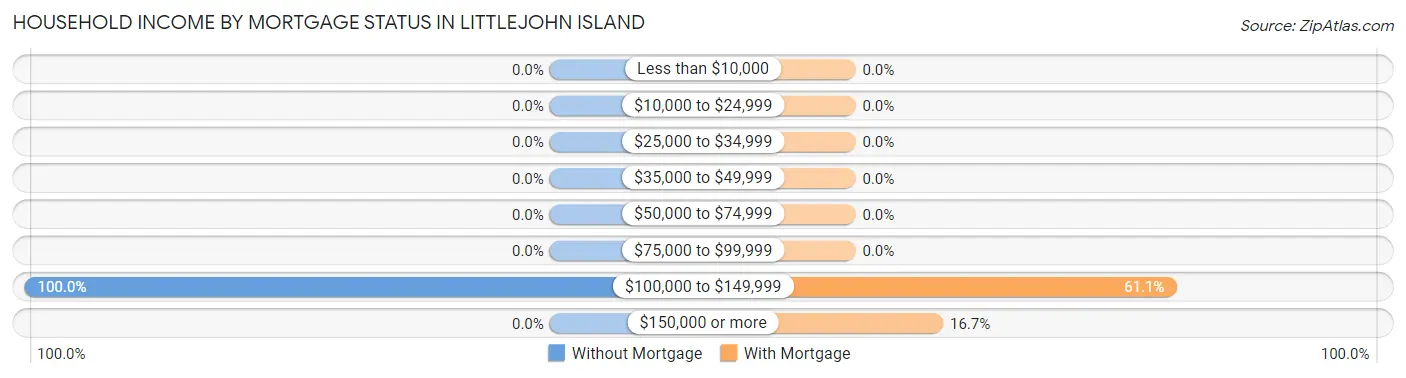
| Household Income | Without Mortgage | With Mortgage |
| Less than $10,000 | 0 (0.0%) | 0 (0.0%) |
| $10,000 to $24,999 | 0 (0.0%) | 0 (0.0%) |
| $25,000 to $34,999 | 0 (0.0%) | 0 (0.0%) |
| $35,000 to $49,999 | 0 (0.0%) | 0 (0.0%) |
| $50,000 to $74,999 | 0 (0.0%) | 0 (0.0%) |
| $75,000 to $99,999 | 0 (0.0%) | 0 (0.0%) |
| $100,000 to $149,999 | 7 (100.0%) | 22 (61.1%) |
| $150,000 or more | 0 (0.0%) | 6 (16.7%) |
| Total | 7 (100.0%) | 36 (100.0%) |
Property Value to Household Income Ratio in Littlejohn Island
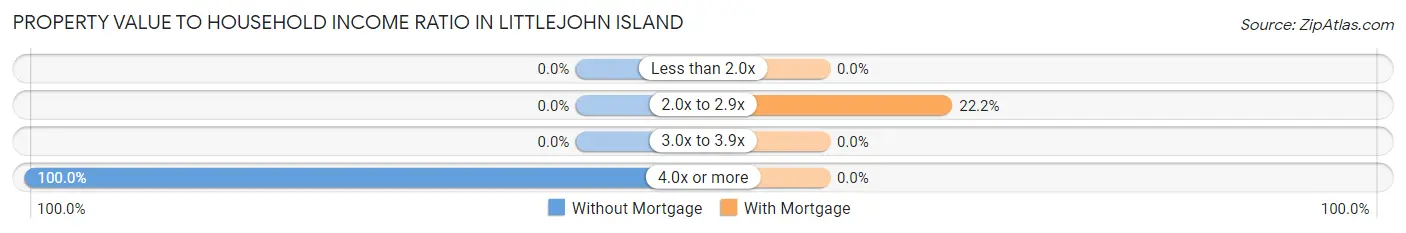
| Value-to-Income Ratio | Without Mortgage | With Mortgage |
| Less than 2.0x | 0 (0.0%) | 0 (0.0%) |
| 2.0x to 2.9x | 0 (0.0%) | 8 (22.2%) |
| 3.0x to 3.9x | 0 (0.0%) | 0 (0.0%) |
| 4.0x or more | 7 (100.0%) | 0 (0.0%) |
| Total | 7 (100.0%) | 36 (100.0%) |
Real Estate Taxes by Mortgage Status in Littlejohn Island
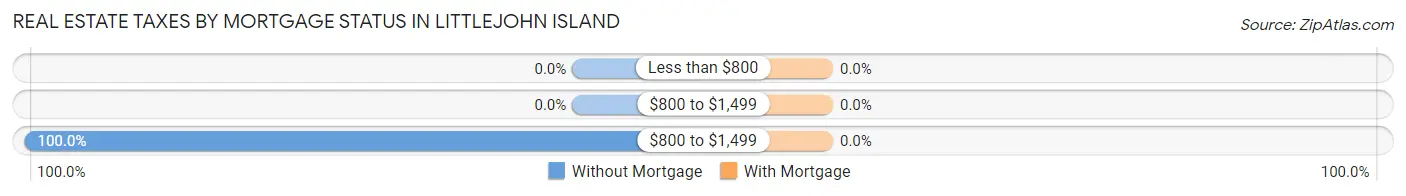
| Property Taxes | Without Mortgage | With Mortgage |
| Less than $800 | 0 (0.0%) | 0 (0.0%) |
| $800 to $1,499 | 0 (0.0%) | 0 (0.0%) |
| $800 to $1,499 | 7 (100.0%) | 0 (0.0%) |
| Total | 7 (100.0%) | 36 (100.0%) |
Health & Disability in Littlejohn Island
Health Insurance Coverage by Age in Littlejohn Island
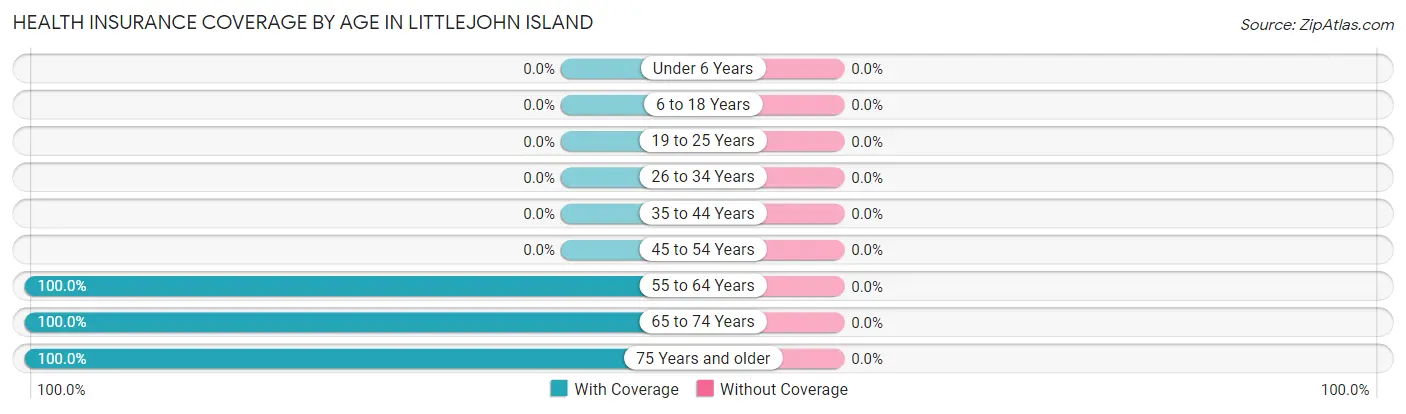
| Age Bracket | With Coverage | Without Coverage |
| Under 6 Years | 0 (0.0%) | 0 (0.0%) |
| 6 to 18 Years | 0 (0.0%) | 0 (0.0%) |
| 19 to 25 Years | 0 (0.0%) | 0 (0.0%) |
| 26 to 34 Years | 0 (0.0%) | 0 (0.0%) |
| 35 to 44 Years | 0 (0.0%) | 0 (0.0%) |
| 45 to 54 Years | 0 (0.0%) | 0 (0.0%) |
| 55 to 64 Years | 15 (100.0%) | 0 (0.0%) |
| 65 to 74 Years | 36 (100.0%) | 0 (0.0%) |
| 75 Years and older | 7 (100.0%) | 0 (0.0%) |
| Total | 58 (100.0%) | 0 (0.0%) |
Health Insurance Coverage by Citizenship Status in Littlejohn Island
| Citizenship Status | With Coverage | Without Coverage |
| Native Born | 0 (0.0%) | 0 (0.0%) |
| Foreign Born, Citizen | 0 (0.0%) | 0 (0.0%) |
| Foreign Born, not a Citizen | 0 (0.0%) | 0 (0.0%) |
Health Insurance Coverage by Household Income in Littlejohn Island
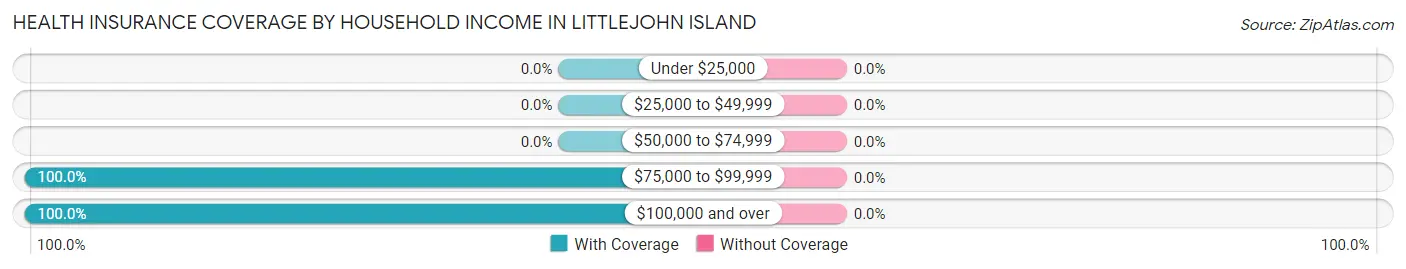
| Household Income | With Coverage | Without Coverage |
| Under $25,000 | 0 (0.0%) | 0 (0.0%) |
| $25,000 to $49,999 | 0 (0.0%) | 0 (0.0%) |
| $50,000 to $74,999 | 0 (0.0%) | 0 (0.0%) |
| $75,000 to $99,999 | 22 (100.0%) | 0 (0.0%) |
| $100,000 and over | 36 (100.0%) | 0 (0.0%) |
Public vs Private Health Insurance Coverage by Age in Littlejohn Island
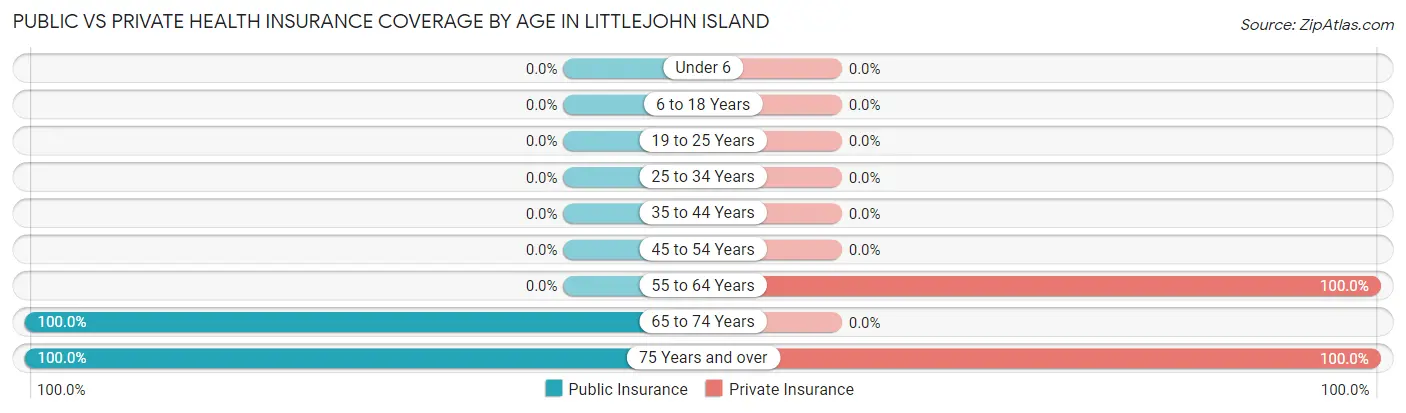
| Age Bracket | Public Insurance | Private Insurance |
| Under 6 | 0 (0.0%) | 0 (0.0%) |
| 6 to 18 Years | 0 (0.0%) | 0 (0.0%) |
| 19 to 25 Years | 0 (0.0%) | 0 (0.0%) |
| 25 to 34 Years | 0 (0.0%) | 0 (0.0%) |
| 35 to 44 Years | 0 (0.0%) | 0 (0.0%) |
| 45 to 54 Years | 0 (0.0%) | 0 (0.0%) |
| 55 to 64 Years | 0 (0.0%) | 15 (100.0%) |
| 65 to 74 Years | 36 (100.0%) | 0 (0.0%) |
| 75 Years and over | 7 (100.0%) | 7 (100.0%) |
| Total | 43 (74.1%) | 22 (37.9%) |
Disability Status by Sex by Age in Littlejohn Island
| Age Bracket | Male | Female |
| Under 5 Years | 0 (0.0%) | 0 (0.0%) |
| 5 to 17 Years | 0 (0.0%) | 0 (0.0%) |
| 18 to 34 Years | 0 (0.0%) | 0 (0.0%) |
| 35 to 64 Years | 0 (0.0%) | 0 (0.0%) |
| 65 to 74 Years | 0 (0.0%) | 0 (0.0%) |
| 75 Years and over | 0 (0.0%) | 0 (0.0%) |
Disability Class by Sex by Age in Littlejohn Island
Disability Class: Hearing Difficulty
| Age Bracket | Male | Female |
| Under 5 Years | 0 (0.0%) | 0 (0.0%) |
| 5 to 17 Years | 0 (0.0%) | 0 (0.0%) |
| 18 to 34 Years | 0 (0.0%) | 0 (0.0%) |
| 35 to 64 Years | 0 (0.0%) | 0 (0.0%) |
| 65 to 74 Years | 0 (0.0%) | 0 (0.0%) |
| 75 Years and over | 0 (0.0%) | 0 (0.0%) |
Disability Class: Vision Difficulty
| Age Bracket | Male | Female |
| Under 5 Years | 0 (0.0%) | 0 (0.0%) |
| 5 to 17 Years | 0 (0.0%) | 0 (0.0%) |
| 18 to 34 Years | 0 (0.0%) | 0 (0.0%) |
| 35 to 64 Years | 0 (0.0%) | 0 (0.0%) |
| 65 to 74 Years | 0 (0.0%) | 0 (0.0%) |
| 75 Years and over | 0 (0.0%) | 0 (0.0%) |
Disability Class: Cognitive Difficulty
| Age Bracket | Male | Female |
| 5 to 17 Years | 0 (0.0%) | 0 (0.0%) |
| 18 to 34 Years | 0 (0.0%) | 0 (0.0%) |
| 35 to 64 Years | 0 (0.0%) | 0 (0.0%) |
| 65 to 74 Years | 0 (0.0%) | 0 (0.0%) |
| 75 Years and over | 0 (0.0%) | 0 (0.0%) |
Disability Class: Ambulatory Difficulty
| Age Bracket | Male | Female |
| 5 to 17 Years | 0 (0.0%) | 0 (0.0%) |
| 18 to 34 Years | 0 (0.0%) | 0 (0.0%) |
| 35 to 64 Years | 0 (0.0%) | 0 (0.0%) |
| 65 to 74 Years | 0 (0.0%) | 0 (0.0%) |
| 75 Years and over | 0 (0.0%) | 0 (0.0%) |
Disability Class: Self-Care Difficulty

| Age Bracket | Male | Female |
| 5 to 17 Years | 0 (0.0%) | 0 (0.0%) |
| 18 to 34 Years | 0 (0.0%) | 0 (0.0%) |
| 35 to 64 Years | 0 (0.0%) | 0 (0.0%) |
| 65 to 74 Years | 0 (0.0%) | 0 (0.0%) |
| 75 Years and over | 0 (0.0%) | 0 (0.0%) |
Technology Access in Littlejohn Island
Computing Device Access in Littlejohn Island
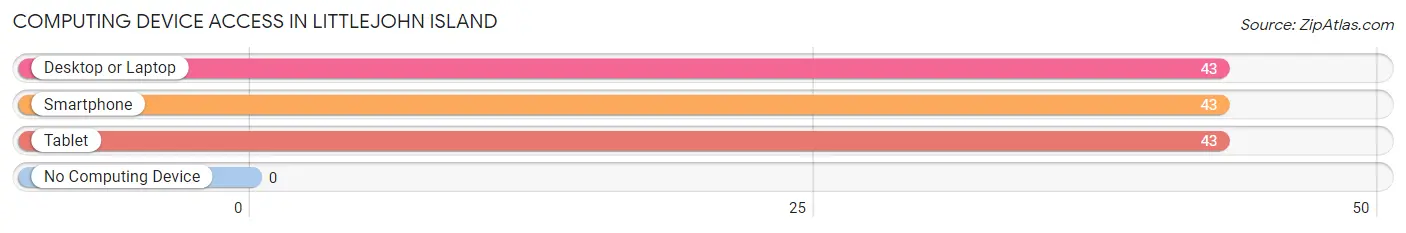
| Device Type | # Households | % Households |
| Desktop or Laptop | 43 | 100.0% |
| Smartphone | 43 | 100.0% |
| Tablet | 43 | 100.0% |
| No Computing Device | 0 | 0.0% |
| Total | 43 | 100.0% |
Internet Access in Littlejohn Island
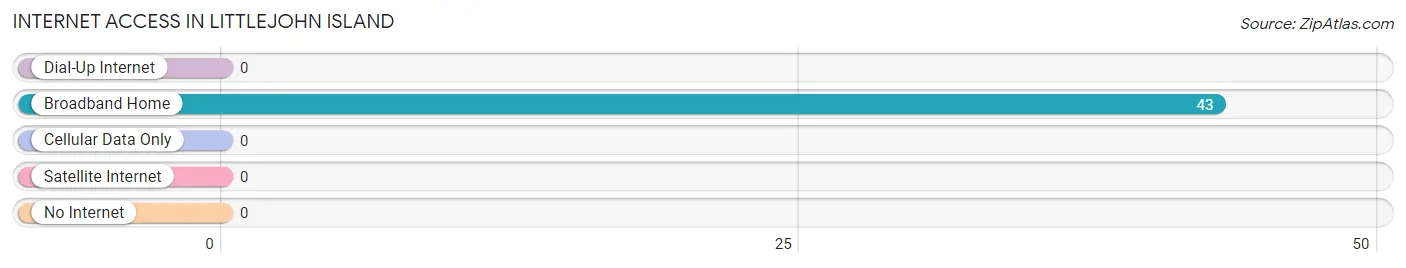
| Internet Type | # Households | % Households |
| Dial-Up Internet | 0 | 0.0% |
| Broadband Home | 43 | 100.0% |
| Cellular Data Only | 0 | 0.0% |
| Satellite Internet | 0 | 0.0% |
| No Internet | 0 | 0.0% |
| Total | 43 | 100.0% |
Littlejohn Island Summary
John Island is a small island located off the coast of Maine in the United States. It is part of the town of Southport, Maine and is located in Lincoln County. The island is approximately 1.5 miles long and 0.5 miles wide, with a total area of 0.8 square miles. The island is accessible by boat only, and is home to a small population of year-round residents.
History
John Island was first settled in the late 1700s by a group of fishermen from the nearby town of Boothbay Harbor. The island was named after the first settler, John Littlejohn, who established a fishing camp on the island. The island was used primarily for fishing and farming, and the population remained small throughout the 19th century.
In the early 20th century, the island began to attract more visitors, and a small resort was established. The resort was popular with tourists from the mainland, and the island's population began to grow. In the 1950s, the island was connected to the mainland by a bridge, and the population continued to grow.
Geography
John Island is located off the coast of Maine, in Lincoln County. The island is approximately 1.5 miles long and 0.5 miles wide, with a total area of 0.8 square miles. The island is surrounded by the Atlantic Ocean, and is accessible by boat only. The island is mostly flat, with a few hills and valleys. The highest point on the island is approximately 50 feet above sea level.
The island is home to a variety of wildlife, including deer, foxes, rabbits, and a variety of birds. The island is also home to a variety of plant life, including a variety of trees, shrubs, and wildflowers.
Economy
John Island's economy is primarily based on tourism and fishing. The island is home to a small resort, which attracts visitors from the mainland. The island is also home to a number of fishing boats, which provide a source of income for the island's residents.
Demographics
John Island has a population of approximately 200 people. The population is mostly white, with a small minority of African Americans. The median age of the population is 45, and the median household income is $50,000. The island is home to a variety of religious denominations, including Protestant, Catholic, and Jewish.
Common Questions
What is Per Capita Income in Littlejohn Island?
Per Capita income in Littlejohn Island is $118,924.
What is the Median Household income in Littlejohn Island?
Median Household Income in Littlejohn Island is $94,943.
What is Inequality or Gini Index in Littlejohn Island?
Inequality or Gini Index in Littlejohn Island is 0.29.
What is the Total Population of Littlejohn Island?
Total Population of Littlejohn Island is 58.
What is the Total Male Population of Littlejohn Island?
Total Male Population of Littlejohn Island is 14.
What is the Total Female Population of Littlejohn Island?
Total Female Population of Littlejohn Island is 44.
What is the Ratio of Males per 100 Females in Littlejohn Island?
There are 31.82 Males per 100 Females in Littlejohn Island.
What is the Ratio of Females per 100 Males in Littlejohn Island?
There are 314.29 Females per 100 Males in Littlejohn Island.
What is the Median Population Age in Littlejohn Island?
Median Population Age in Littlejohn Island is 66.3 Years.
What is the Average Family Size in Littlejohn Island
Average Family Size in Littlejohn Island is 2.1 People.
What is the Average Household Size in Littlejohn Island
Average Household Size in Littlejohn Island is 1.4 People.
How Large is the Labor Force in Littlejohn Island?
There are 51 People in the Labor Forcein in Littlejohn Island.
What is the Percentage of People in the Labor Force in Littlejohn Island?
87.9% of People are in the Labor Force in Littlejohn Island.