Pueblitos, NM Map & Demographics
Pueblitos Map
Pueblitos Overview
$28,976
PER CAPITA INCOME
$62,054
AVG FAMILY INCOME
$57,361
AVG HOUSEHOLD INCOME
0.37
INEQUALITY / GINI INDEX
422
TOTAL POPULATION
223
MALE POPULATION
199
FEMALE POPULATION
112.06
MALES / 100 FEMALES
89.24
FEMALES / 100 MALES
54.2
MEDIAN AGE
3.1
AVG FAMILY SIZE
2.8
AVG HOUSEHOLD SIZE
270
LABOR FORCE [ PEOPLE ]
70.9%
PERCENT IN LABOR FORCE
17.8%
UNEMPLOYMENT RATE
Income in Pueblitos
Income Overview in Pueblitos
Per Capita Income in Pueblitos is $28,976, while median incomes of families and households are $62,054 and $57,361 respectively.
| Characteristic | Number | Measure |
| Per Capita Income | 422 | $28,976 |
| Median Family Income | 129 | $62,054 |
| Mean Family Income | 129 | $80,481 |
| Median Household Income | 153 | $57,361 |
| Mean Household Income | 153 | $71,610 |
| Income Deficit | 129 | $0 |
| Wage / Income Gap (%) | 422 | 0.00% |
| Wage / Income Gap ($) | 422 | 100.00¢ per $1 |
| Gini / Inequality Index | 422 | 0.37 |
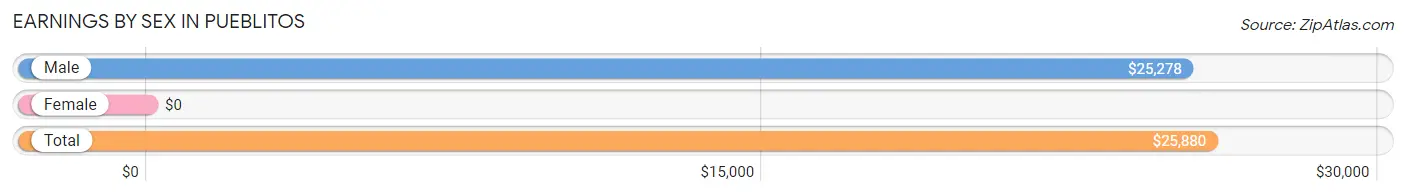
Earnings by Sex in Pueblitos
| Sex | Number | Average Earnings |
| Male | 88 (38.4%) | $25,278 |
| Female | 141 (61.6%) | $0 |
| Total | 229 (100.0%) | $25,880 |
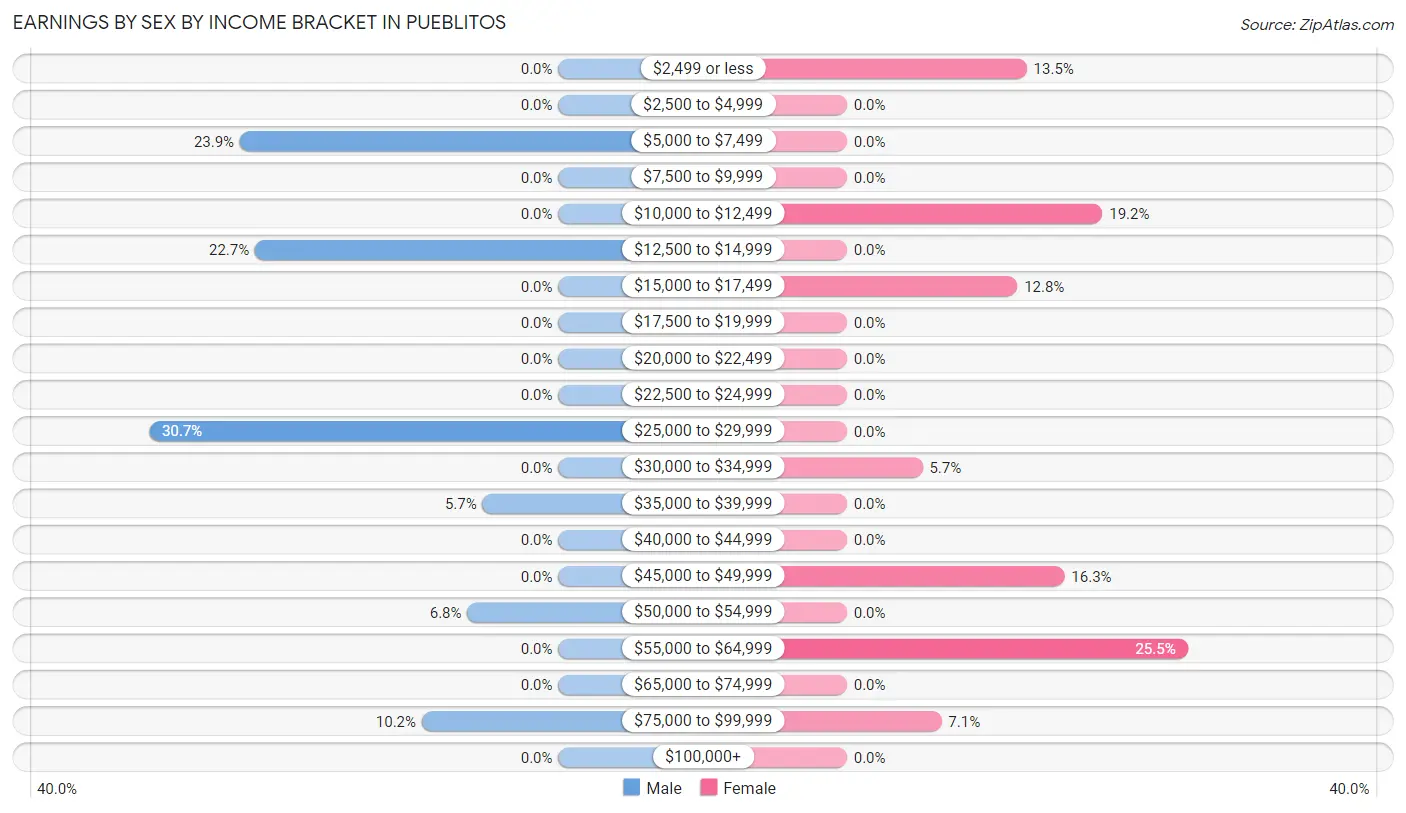
Earnings by Sex by Income Bracket in Pueblitos
The most common earnings brackets in Pueblitos are $25,000 to $29,999 for men (27 | 30.7%) and $55,000 to $64,999 for women (36 | 25.5%).
| Income | Male | Female |
| $2,499 or less | 0 (0.0%) | 19 (13.5%) |
| $2,500 to $4,999 | 0 (0.0%) | 0 (0.0%) |
| $5,000 to $7,499 | 21 (23.9%) | 0 (0.0%) |
| $7,500 to $9,999 | 0 (0.0%) | 0 (0.0%) |
| $10,000 to $12,499 | 0 (0.0%) | 27 (19.2%) |
| $12,500 to $14,999 | 20 (22.7%) | 0 (0.0%) |
| $15,000 to $17,499 | 0 (0.0%) | 18 (12.8%) |
| $17,500 to $19,999 | 0 (0.0%) | 0 (0.0%) |
| $20,000 to $22,499 | 0 (0.0%) | 0 (0.0%) |
| $22,500 to $24,999 | 0 (0.0%) | 0 (0.0%) |
| $25,000 to $29,999 | 27 (30.7%) | 0 (0.0%) |
| $30,000 to $34,999 | 0 (0.0%) | 8 (5.7%) |
| $35,000 to $39,999 | 5 (5.7%) | 0 (0.0%) |
| $40,000 to $44,999 | 0 (0.0%) | 0 (0.0%) |
| $45,000 to $49,999 | 0 (0.0%) | 23 (16.3%) |
| $50,000 to $54,999 | 6 (6.8%) | 0 (0.0%) |
| $55,000 to $64,999 | 0 (0.0%) | 36 (25.5%) |
| $65,000 to $74,999 | 0 (0.0%) | 0 (0.0%) |
| $75,000 to $99,999 | 9 (10.2%) | 10 (7.1%) |
| $100,000+ | 0 (0.0%) | 0 (0.0%) |
| Total | 88 (100.0%) | 141 (100.0%) |
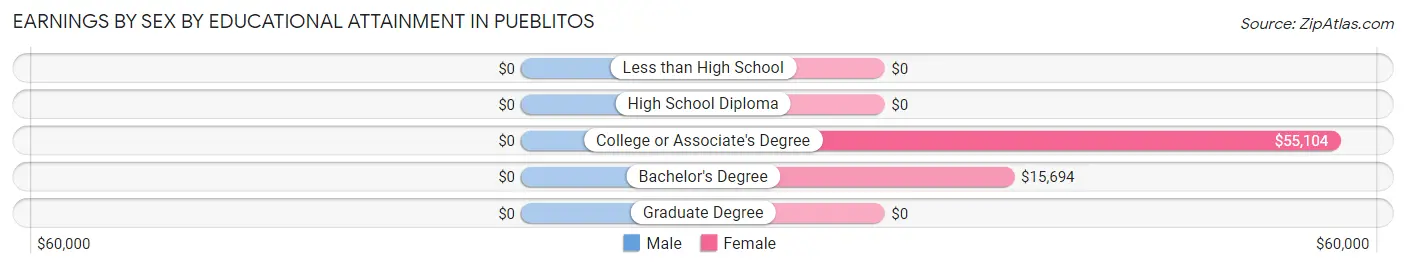
Earnings by Sex by Educational Attainment in Pueblitos
| Educational Attainment | Male Income | Female Income |
| Less than High School | - | - |
| High School Diploma | - | - |
| College or Associate's Degree | - | - |
| Bachelor's Degree | - | - |
| Graduate Degree | - | - |
| Total | $25,278 | $0 |
Family Income in Pueblitos
Family Income Brackets in Pueblitos
According to the Pueblitos family income data, there are 29 families falling into the $50,000 to $74,999 income range, which is the most common income bracket and makes up 22.5% of all families.
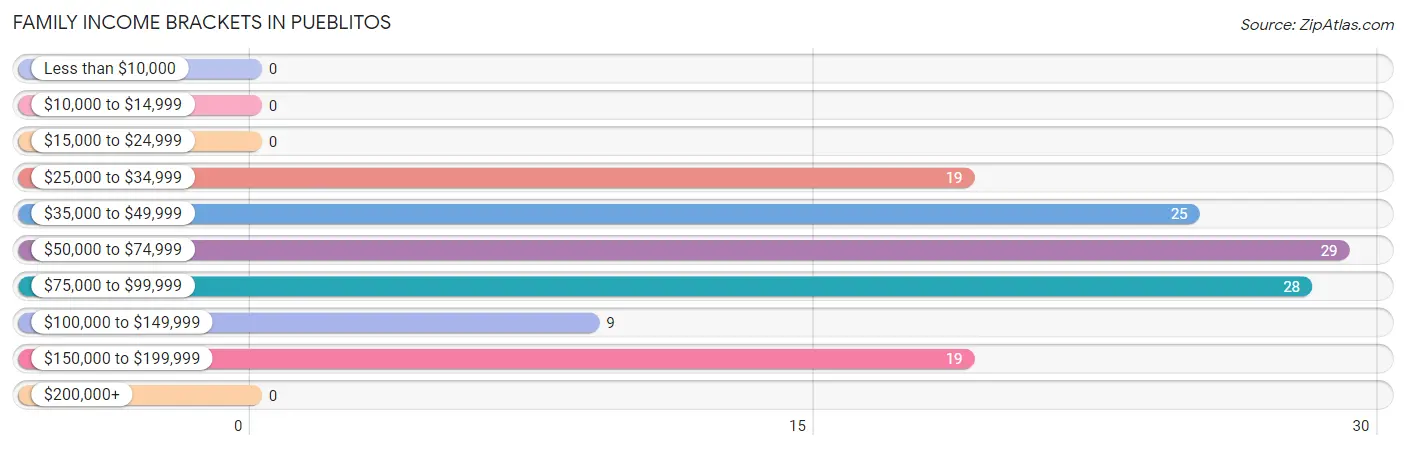
| Income Bracket | # Families | % Families |
| Less than $10,000 | 0 | 0.0% |
| $10,000 to $14,999 | 0 | 0.0% |
| $15,000 to $24,999 | 0 | 0.0% |
| $25,000 to $34,999 | 19 | 14.7% |
| $35,000 to $49,999 | 25 | 19.4% |
| $50,000 to $74,999 | 29 | 22.5% |
| $75,000 to $99,999 | 28 | 21.7% |
| $100,000 to $149,999 | 9 | 7.0% |
| $150,000 to $199,999 | 19 | 14.7% |
| $200,000+ | 0 | 0.0% |
Family Income by Famaliy Size in Pueblitos
2-person families (77 | 59.7%) account for the highest median family income in Pueblitos with $61,696 per family, while 2-person families (77 | 59.7%) have the highest median income of $30,848 per family member.
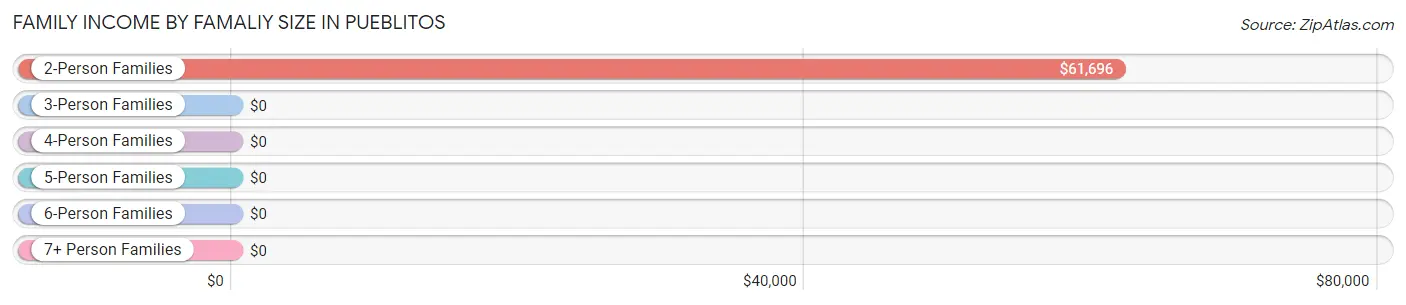
| Income Bracket | # Families | Median Income |
| 2-Person Families | 77 (59.7%) | $61,696 |
| 3-Person Families | 24 (18.6%) | $0 |
| 4-Person Families | 28 (21.7%) | $0 |
| 5-Person Families | 0 (0.0%) | $0 |
| 6-Person Families | 0 (0.0%) | $0 |
| 7+ Person Families | 0 (0.0%) | $0 |
| Total | 129 (100.0%) | $62,054 |
Family Income by Number of Earners in Pueblitos

| Number of Earners | # Families | Median Income |
| No Earners | 40 (31.0%) | $61,250 |
| 1 Earner | 26 (20.2%) | $0 |
| 2 Earners | 54 (41.9%) | $0 |
| 3+ Earners | 9 (7.0%) | $0 |
| Total | 129 (100.0%) | $62,054 |
Household Income in Pueblitos
Household Income Brackets in Pueblitos
With 29 households falling in the category, the $50,000 to $74,999 income range is the most frequent in Pueblitos, accounting for 19.0% of all households.
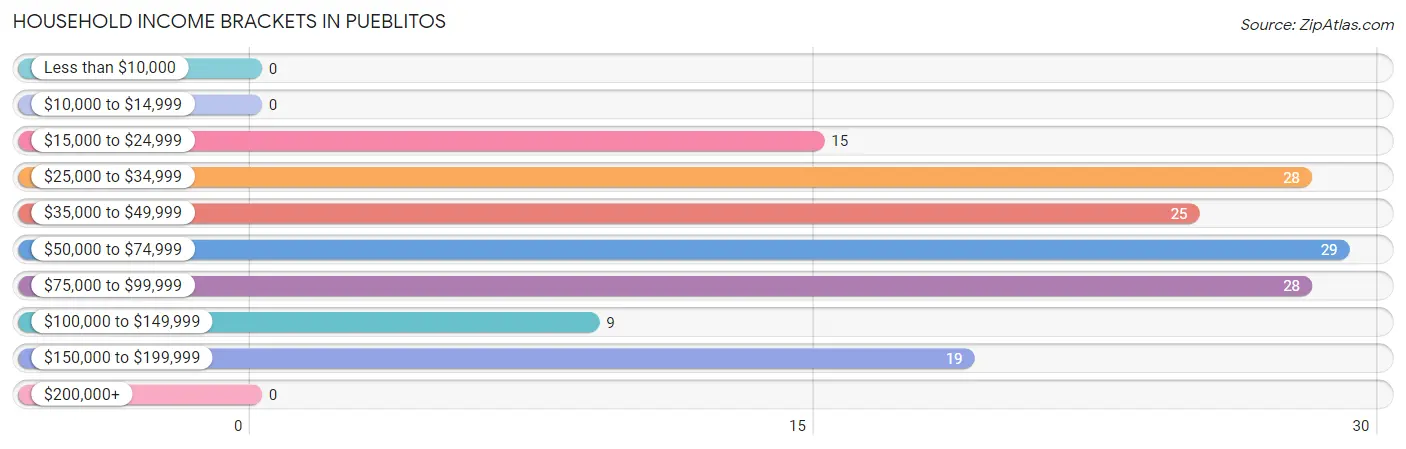
| Income Bracket | # Households | % Households |
| Less than $10,000 | 0 | 0.0% |
| $10,000 to $14,999 | 0 | 0.0% |
| $15,000 to $24,999 | 15 | 9.8% |
| $25,000 to $34,999 | 28 | 18.3% |
| $35,000 to $49,999 | 25 | 16.3% |
| $50,000 to $74,999 | 29 | 19.0% |
| $75,000 to $99,999 | 28 | 18.3% |
| $100,000 to $149,999 | 9 | 5.9% |
| $150,000 to $199,999 | 19 | 12.4% |
| $200,000+ | 0 | 0.0% |
Household Income by Householder Age in Pueblitos
The median household income in Pueblitos is $57,361, with the highest median household income of $92,625 found in the 45 to 64 years age bracket for the primary householder. A total of 37 households (24.2%) fall into this category.
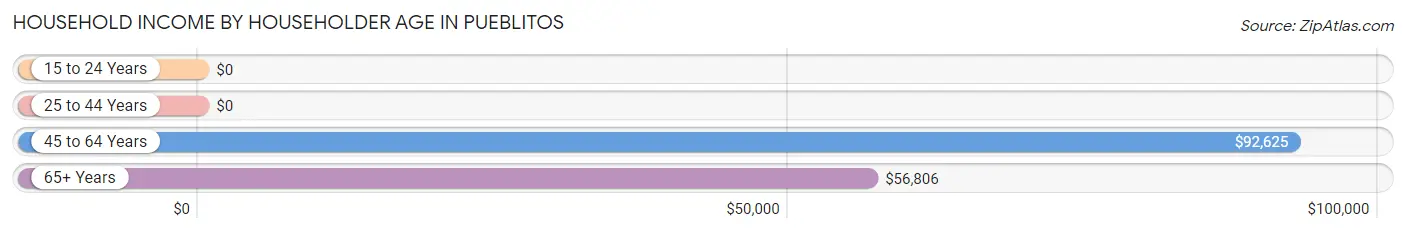
| Income Bracket | # Households | Median Income |
| 15 to 24 Years | 0 (0.0%) | $0 |
| 25 to 44 Years | 19 (12.4%) | $0 |
| 45 to 64 Years | 37 (24.2%) | $92,625 |
| 65+ Years | 97 (63.4%) | $56,806 |
| Total | 153 (100.0%) | $57,361 |
Poverty in Pueblitos
Income Below Poverty by Sex and Age in Pueblitos
With 21.1% poverty level for males and 9.6% for females among the residents of Pueblitos, 6 to 11 year old males and 35 to 44 year old females are the most vulnerable to poverty, with 17 males (100.0%) and 19 females (100.0%) in their respective age groups living below the poverty level.
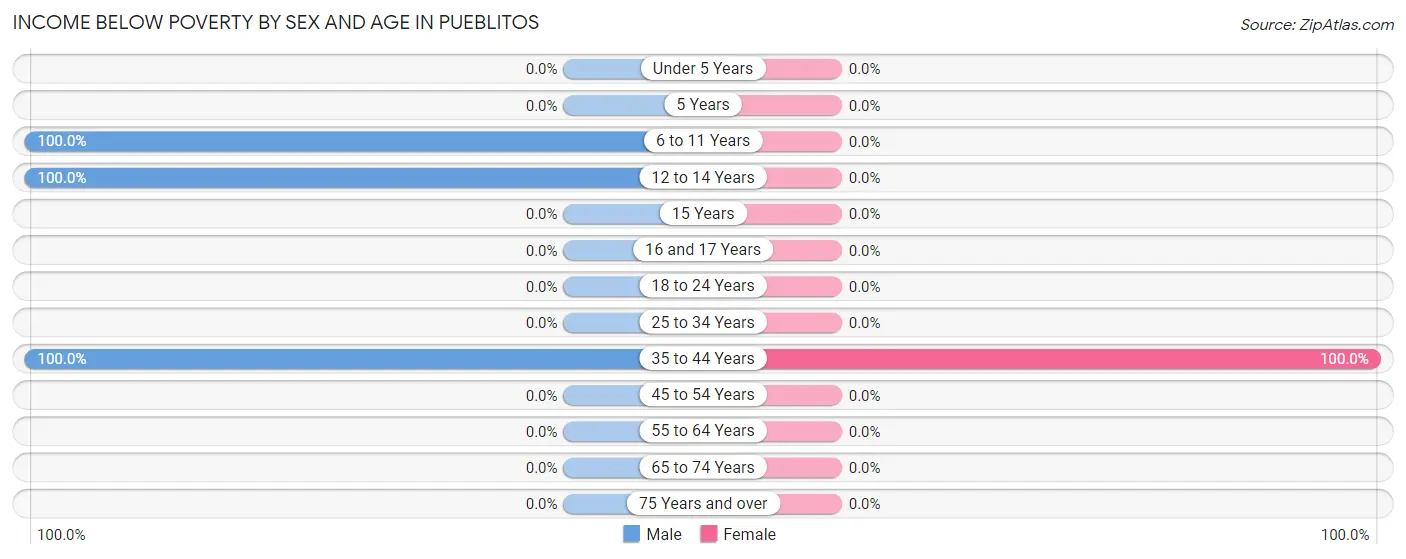
| Age Bracket | Male | Female |
| Under 5 Years | 0 (0.0%) | 0 (0.0%) |
| 5 Years | 0 (0.0%) | 0 (0.0%) |
| 6 to 11 Years | 17 (100.0%) | 0 (0.0%) |
| 12 to 14 Years | 16 (100.0%) | 0 (0.0%) |
| 15 Years | 0 (0.0%) | 0 (0.0%) |
| 16 and 17 Years | 0 (0.0%) | 0 (0.0%) |
| 18 to 24 Years | 0 (0.0%) | 0 (0.0%) |
| 25 to 34 Years | 0 (0.0%) | 0 (0.0%) |
| 35 to 44 Years | 14 (100.0%) | 19 (100.0%) |
| 45 to 54 Years | 0 (0.0%) | 0 (0.0%) |
| 55 to 64 Years | 0 (0.0%) | 0 (0.0%) |
| 65 to 74 Years | 0 (0.0%) | 0 (0.0%) |
| 75 Years and over | 0 (0.0%) | 0 (0.0%) |
| Total | 47 (21.1%) | 19 (9.6%) |
Income Above Poverty by Sex and Age in Pueblitos
According to the poverty statistics in Pueblitos, males aged 25 to 34 years and females aged 6 to 11 years are the age groups that are most secure financially, with 100.0% of males and 100.0% of females in these age groups living above the poverty line.
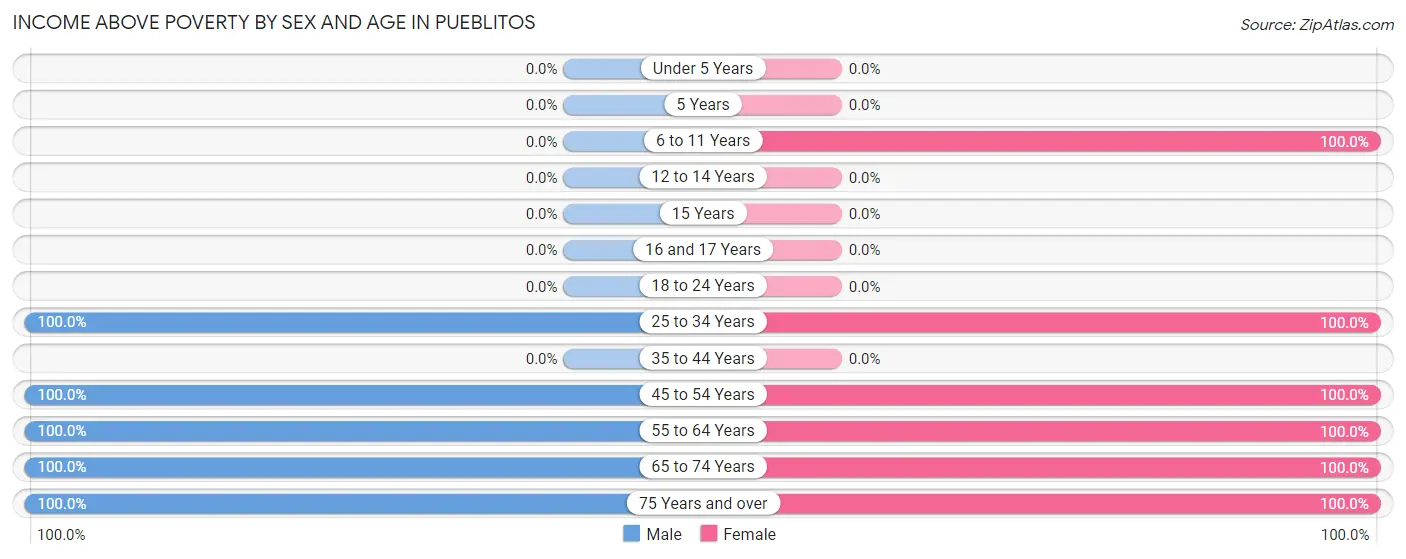
| Age Bracket | Male | Female |
| Under 5 Years | 0 (0.0%) | 0 (0.0%) |
| 5 Years | 0 (0.0%) | 0 (0.0%) |
| 6 to 11 Years | 0 (0.0%) | 8 (100.0%) |
| 12 to 14 Years | 0 (0.0%) | 0 (0.0%) |
| 15 Years | 0 (0.0%) | 0 (0.0%) |
| 16 and 17 Years | 0 (0.0%) | 0 (0.0%) |
| 18 to 24 Years | 0 (0.0%) | 0 (0.0%) |
| 25 to 34 Years | 41 (100.0%) | 67 (100.0%) |
| 35 to 44 Years | 0 (0.0%) | 0 (0.0%) |
| 45 to 54 Years | 26 (100.0%) | 18 (100.0%) |
| 55 to 64 Years | 29 (100.0%) | 37 (100.0%) |
| 65 to 74 Years | 40 (100.0%) | 23 (100.0%) |
| 75 Years and over | 40 (100.0%) | 27 (100.0%) |
| Total | 176 (78.9%) | 180 (90.4%) |
Income Below Poverty Among Married-Couple Families in Pueblitos
The poverty statistics for married-couple families in Pueblitos show that 20.0% or 19 of the total 95 families live below the poverty line. Families with 1 or 2 children have the highest poverty rate of 67.9%, comprising of 19 families. On the other hand, families with no children have the lowest poverty rate of 0.0%, which includes 0 families.
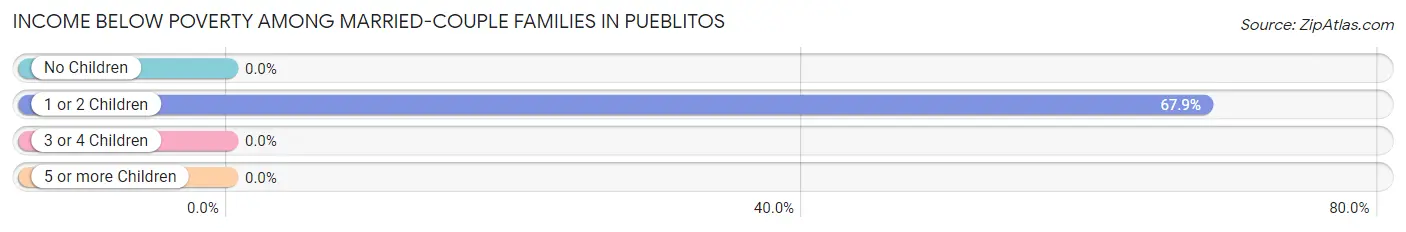
| Children | Above Poverty | Below Poverty |
| No Children | 67 (100.0%) | 0 (0.0%) |
| 1 or 2 Children | 9 (32.1%) | 19 (67.9%) |
| 3 or 4 Children | 0 (0.0%) | 0 (0.0%) |
| 5 or more Children | 0 (0.0%) | 0 (0.0%) |
| Total | 76 (80.0%) | 19 (20.0%) |
Income Below Poverty Among Single-Parent Households in Pueblitos
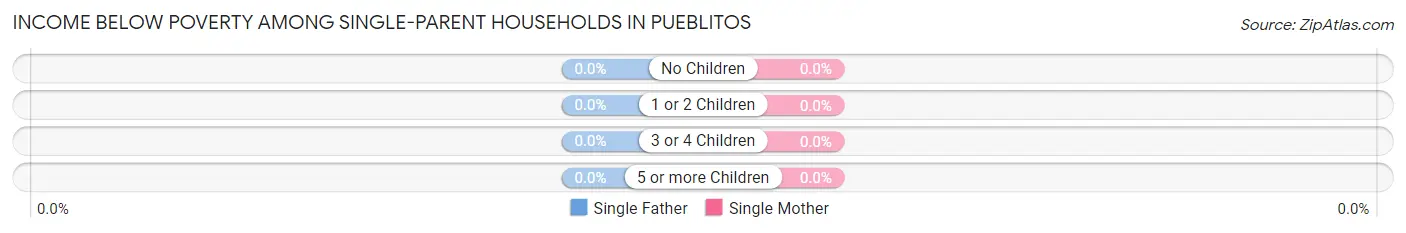
| Children | Single Father | Single Mother |
| No Children | 0 (0.0%) | 0 (0.0%) |
| 1 or 2 Children | 0 (0.0%) | 0 (0.0%) |
| 3 or 4 Children | 0 (0.0%) | 0 (0.0%) |
| 5 or more Children | 0 (0.0%) | 0 (0.0%) |
| Total | 0 (0.0%) | 0 (0.0%) |
Income Below Poverty Among Married-Couple vs Single-Parent Households in Pueblitos
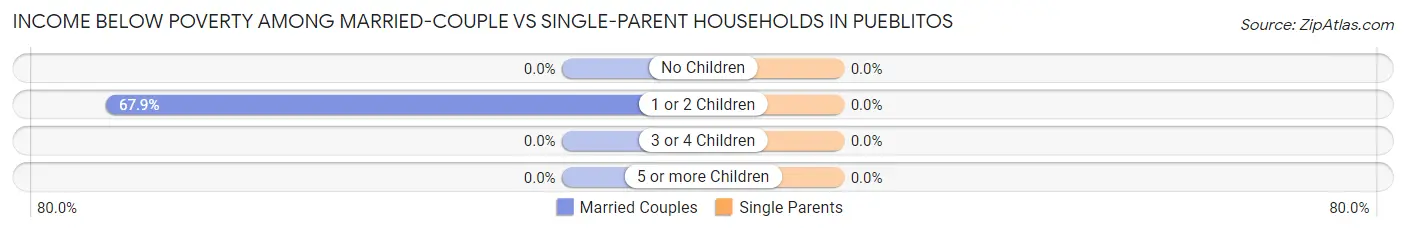
| Children | Married-Couple Families | Single-Parent Households |
| No Children | 0 (0.0%) | 0 (0.0%) |
| 1 or 2 Children | 19 (67.9%) | 0 (0.0%) |
| 3 or 4 Children | 0 (0.0%) | 0 (0.0%) |
| 5 or more Children | 0 (0.0%) | 0 (0.0%) |
| Total | 19 (20.0%) | 0 (0.0%) |
Race in Pueblitos
The most populous races in Pueblitos are Hispanic or Latino (335 | 79.4%), White / Caucasian (185 | 43.8%), and Two or more Races (162 | 38.4%).
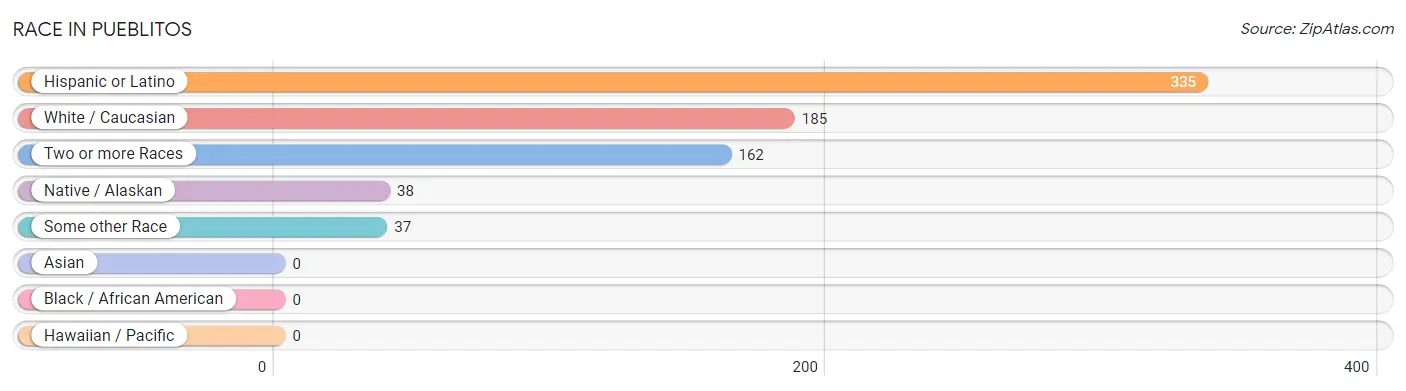
| Race | # Population | % Population |
| Asian | 0 | 0.0% |
| Black / African American | 0 | 0.0% |
| Hawaiian / Pacific | 0 | 0.0% |
| Hispanic or Latino | 335 | 79.4% |
| Native / Alaskan | 38 | 9.0% |
| White / Caucasian | 185 | 43.8% |
| Two or more Races | 162 | 38.4% |
| Some other Race | 37 | 8.8% |
| Total | 422 | 100.0% |
Ancestry in Pueblitos
The most populous ancestries reported in Pueblitos are Mexican (233 | 55.2%), Pueblo (38 | 9.0%), Apache (30 | 7.1%), American (27 | 6.4%), and German (21 | 5.0%), together accounting for 82.7% of all Pueblitos residents.
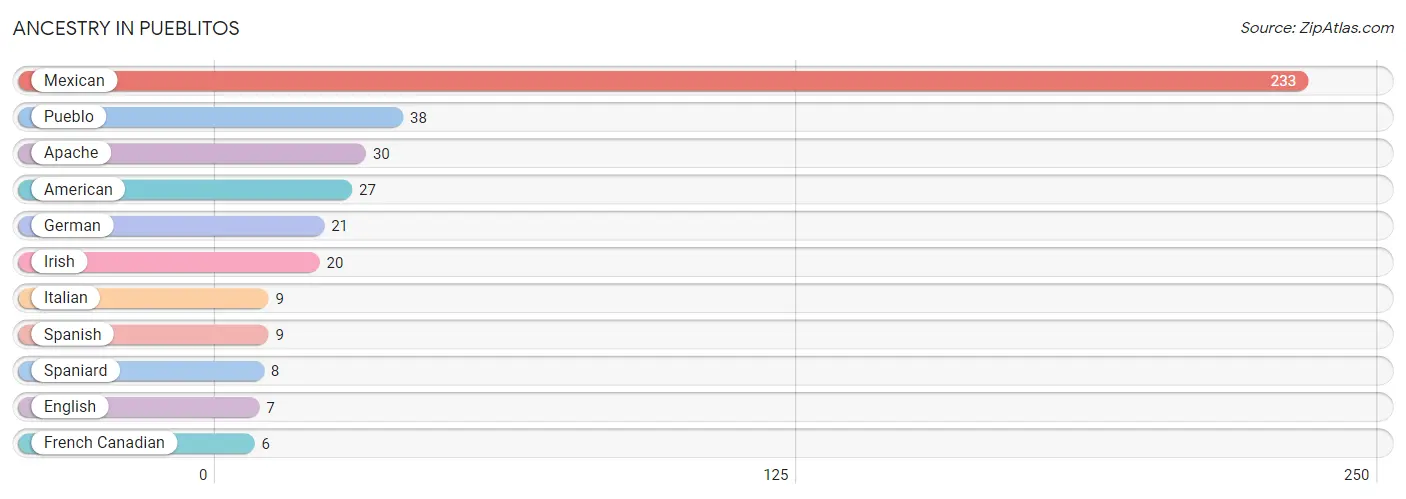
| Ancestry | # Population | % Population |
| American | 27 | 6.4% |
| Apache | 30 | 7.1% |
| English | 7 | 1.7% |
| French Canadian | 6 | 1.4% |
| German | 21 | 5.0% |
| Irish | 20 | 4.7% |
| Italian | 9 | 2.1% |
| Mexican | 233 | 55.2% |
| Pueblo | 38 | 9.0% |
| Spaniard | 8 | 1.9% |
| Spanish | 9 | 2.1% | View All 11 Rows |
Immigrants in Pueblitos
The most numerous immigrant groups reported in Pueblitos came from Central America (33 | 7.8%), Latin America (33 | 7.8%), and Mexico (33 | 7.8%), together accounting for 23.5% of all Pueblitos residents.
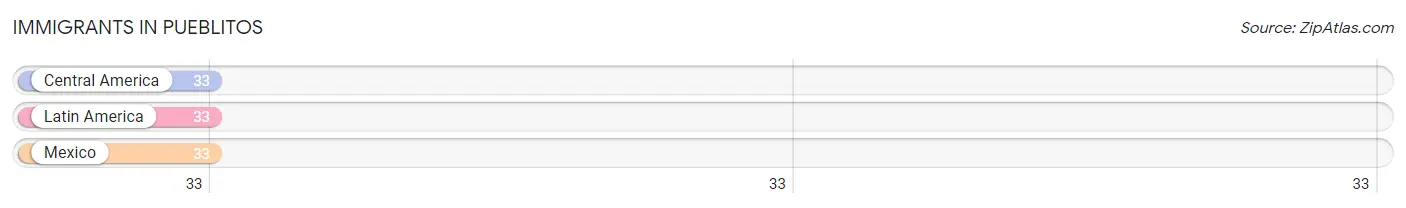
| Immigration Origin | # Population | % Population |
| Central America | 33 | 7.8% |
| Latin America | 33 | 7.8% |
| Mexico | 33 | 7.8% | View All 3 Rows |
Sex and Age in Pueblitos
Sex and Age in Pueblitos
The most populous age groups in Pueblitos are 25 to 29 Years (41 | 18.4%) for men and 30 to 34 Years (49 | 24.6%) for women.
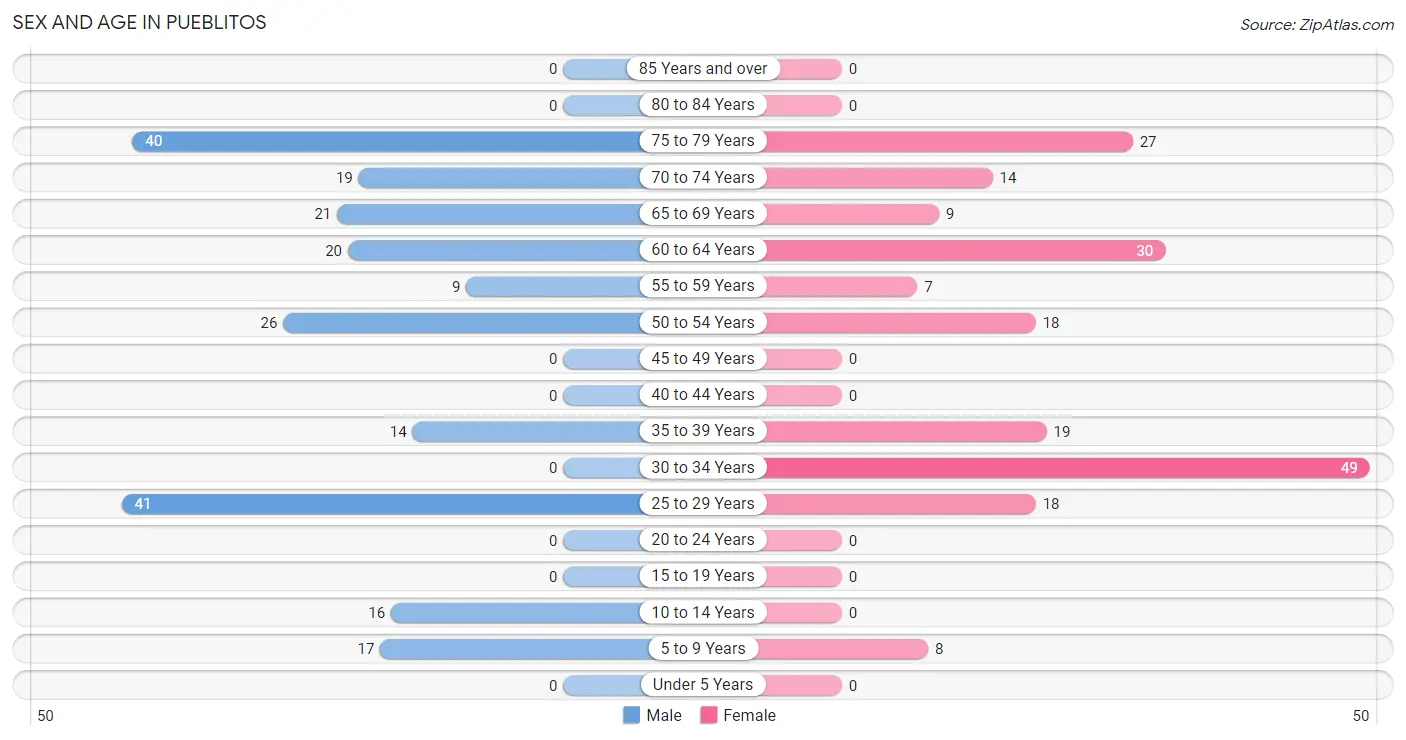
| Age Bracket | Male | Female |
| Under 5 Years | 0 (0.0%) | 0 (0.0%) |
| 5 to 9 Years | 17 (7.6%) | 8 (4.0%) |
| 10 to 14 Years | 16 (7.2%) | 0 (0.0%) |
| 15 to 19 Years | 0 (0.0%) | 0 (0.0%) |
| 20 to 24 Years | 0 (0.0%) | 0 (0.0%) |
| 25 to 29 Years | 41 (18.4%) | 18 (9.0%) |
| 30 to 34 Years | 0 (0.0%) | 49 (24.6%) |
| 35 to 39 Years | 14 (6.3%) | 19 (9.6%) |
| 40 to 44 Years | 0 (0.0%) | 0 (0.0%) |
| 45 to 49 Years | 0 (0.0%) | 0 (0.0%) |
| 50 to 54 Years | 26 (11.7%) | 18 (9.0%) |
| 55 to 59 Years | 9 (4.0%) | 7 (3.5%) |
| 60 to 64 Years | 20 (9.0%) | 30 (15.1%) |
| 65 to 69 Years | 21 (9.4%) | 9 (4.5%) |
| 70 to 74 Years | 19 (8.5%) | 14 (7.0%) |
| 75 to 79 Years | 40 (17.9%) | 27 (13.6%) |
| 80 to 84 Years | 0 (0.0%) | 0 (0.0%) |
| 85 Years and over | 0 (0.0%) | 0 (0.0%) |
| Total | 223 (100.0%) | 199 (100.0%) |
Families and Households in Pueblitos
Median Family Size in Pueblitos
The median family size in Pueblitos is 3.09 persons per family, with single female/mother families (21 | 16.3%) accounting for the largest median family size of 4.43 persons per family. On the other hand, married-couple families (95 | 73.6%) represent the smallest median family size with 2.80 persons per family.
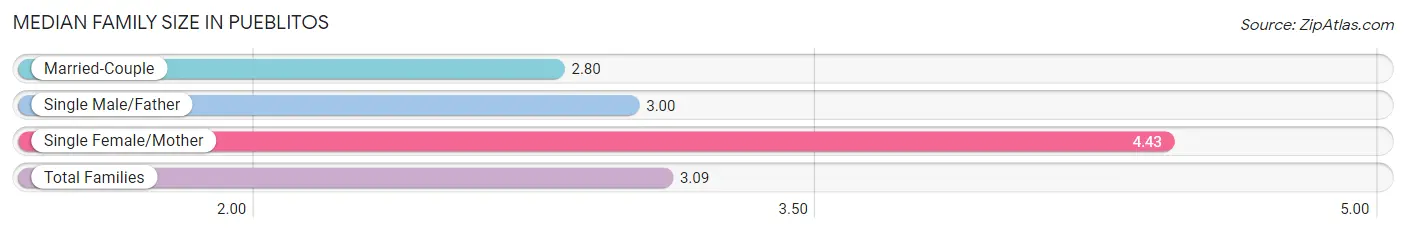
| Family Type | # Families | Family Size |
| Married-Couple | 95 (73.6%) | 2.80 |
| Single Male/Father | 13 (10.1%) | 3.00 |
| Single Female/Mother | 21 (16.3%) | 4.43 |
| Total Families | 129 (100.0%) | 3.09 |
Median Household Size in Pueblitos
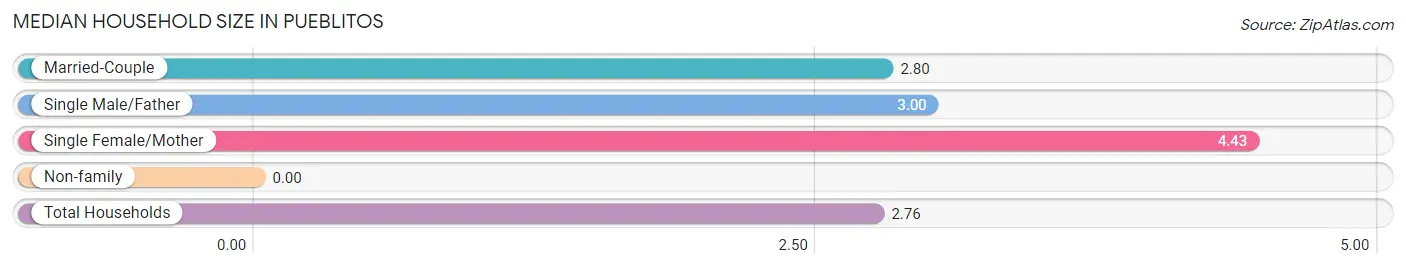
| Household Type | # Households | Household Size |
| Married-Couple | 95 (62.1%) | 2.80 |
| Single Male/Father | 13 (8.5%) | 3.00 |
| Single Female/Mother | 21 (13.7%) | 4.43 |
| Non-family | 24 (15.7%) | - |
| Total Households | 153 (100.0%) | 2.76 |
Household Size by Marriage Status in Pueblitos
Out of a total of 153 households in Pueblitos, 129 (84.3%) are family households, while 24 (15.7%) are nonfamily households. The most numerous type of family households are 2-person households, comprising 77, and the most common type of nonfamily households are 1-person households, comprising 24.
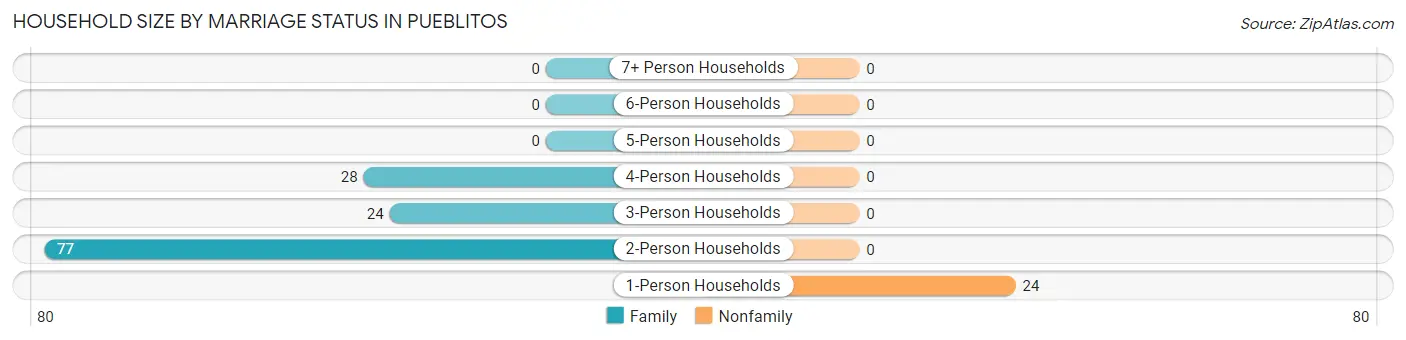
| Household Size | Family Households | Nonfamily Households |
| 1-Person Households | - | 24 (15.7%) |
| 2-Person Households | 77 (50.3%) | 0 (0.0%) |
| 3-Person Households | 24 (15.7%) | 0 (0.0%) |
| 4-Person Households | 28 (18.3%) | 0 (0.0%) |
| 5-Person Households | 0 (0.0%) | 0 (0.0%) |
| 6-Person Households | 0 (0.0%) | 0 (0.0%) |
| 7+ Person Households | 0 (0.0%) | 0 (0.0%) |
| Total | 129 (84.3%) | 24 (15.7%) |
Female Fertility in Pueblitos
Fertility by Age in Pueblitos
| Age Bracket | Women with Births | Births / 1,000 Women |
| 15 to 19 years | 0 (0.0%) | 0.0 |
| 20 to 34 years | 0 (0.0%) | 0.0 |
| 35 to 50 years | 0 (0.0%) | 0.0 |
| Total | 0 (0.0%) | 0.0 |
Fertility by Age by Marriage Status in Pueblitos
| Age Bracket | Married | Unmarried |
| 15 to 19 years | 0 (0.0%) | 0 (0.0%) |
| 20 to 34 years | 0 (0.0%) | 0 (0.0%) |
| 35 to 50 years | 0 (0.0%) | 0 (0.0%) |
| Total | 0 (0.0%) | 0 (0.0%) |
Fertility by Education in Pueblitos
| Educational Attainment | Women with Births | Births / 1,000 Women |
| Less than High School | 0 (0.0%) | 0.0 |
| High School Diploma | 0 (0.0%) | 0.0 |
| College or Associate's Degree | 0 (0.0%) | 0.0 |
| Bachelor's Degree | 0 (0.0%) | 0.0 |
| Graduate Degree | 0 (0.0%) | 0.0 |
| Total | 0 (0.0%) | 0.0 |
Fertility by Education by Marriage Status in Pueblitos
| Educational Attainment | Married | Unmarried |
| Less than High School | 0 (0.0%) | 0 (0.0%) |
| High School Diploma | 0 (0.0%) | 0 (0.0%) |
| College or Associate's Degree | 0 (0.0%) | 0 (0.0%) |
| Bachelor's Degree | 0 (0.0%) | 0 (0.0%) |
| Graduate Degree | 0 (0.0%) | 0 (0.0%) |
| Total | 0 (0.0%) | 0 (0.0%) |
Employment Characteristics in Pueblitos
Employment by Class of Employer in Pueblitos
Among the 222 employed individuals in Pueblitos, private company employees (135 | 60.8%), self-employed (not incorporated) (32 | 14.4%), and local government employees (28 | 12.6%) make up the most common classes of employment.
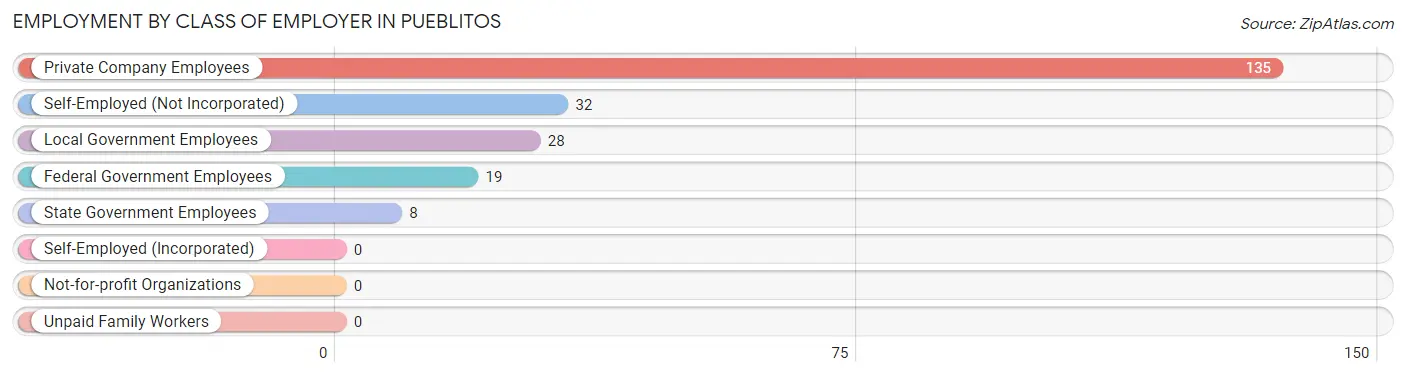
| Employer Class | # Employees | % Employees |
| Private Company Employees | 135 | 60.8% |
| Self-Employed (Incorporated) | 0 | 0.0% |
| Self-Employed (Not Incorporated) | 32 | 14.4% |
| Not-for-profit Organizations | 0 | 0.0% |
| Local Government Employees | 28 | 12.6% |
| State Government Employees | 8 | 3.6% |
| Federal Government Employees | 19 | 8.6% |
| Unpaid Family Workers | 0 | 0.0% |
| Total | 222 | 100.0% |
Employment Status by Age in Pueblitos
According to the labor force statistics for Pueblitos, out of the total population over 16 years of age (381), 70.9% or 270 individuals are in the labor force, with 17.8% or 48 of them unemployed. The age group with the highest labor force participation rate is 25 to 29 years, with 100.0% or 59 individuals in the labor force. Within the labor force, the 75 years and over age range has the highest percentage of unemployed individuals, with 100.0% or 13 of them being unemployed.
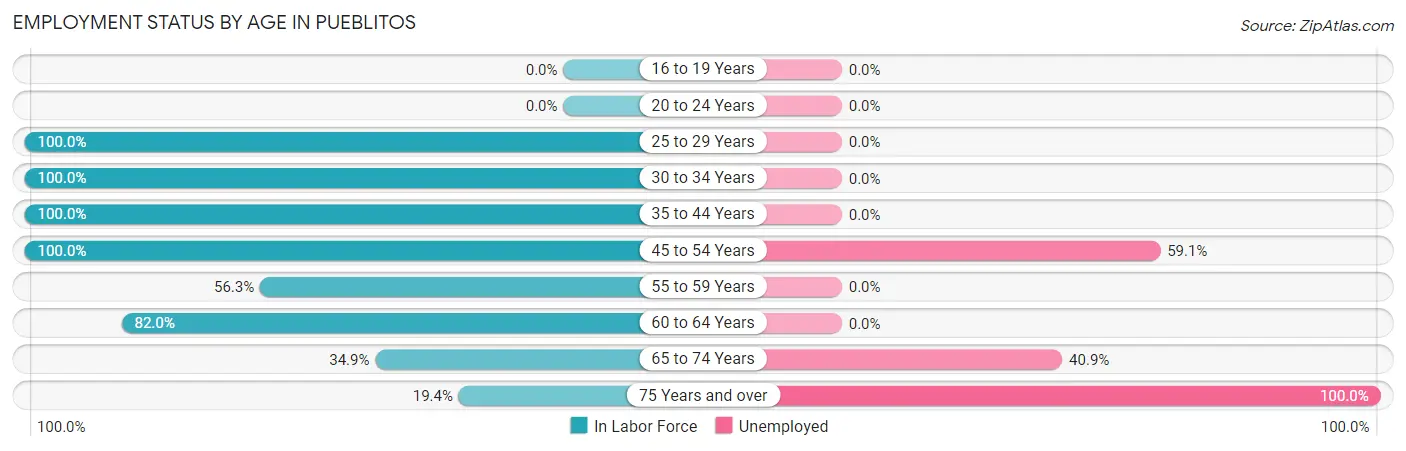
| Age Bracket | In Labor Force | Unemployed |
| 16 to 19 Years | 0 (0.0%) | 0 (0.0%) |
| 20 to 24 Years | 0 (0.0%) | 0 (0.0%) |
| 25 to 29 Years | 59 (100.0%) | 0 (0.0%) |
| 30 to 34 Years | 49 (100.0%) | 0 (0.0%) |
| 35 to 44 Years | 33 (100.0%) | 0 (0.0%) |
| 45 to 54 Years | 44 (100.0%) | 26 (59.1%) |
| 55 to 59 Years | 9 (56.3%) | 0 (0.0%) |
| 60 to 64 Years | 41 (82.0%) | 0 (0.0%) |
| 65 to 74 Years | 22 (34.9%) | 9 (40.9%) |
| 75 Years and over | 13 (19.4%) | 13 (100.0%) |
| Total | 270 (70.9%) | 48 (17.8%) |
Employment Status by Educational Attainment in Pueblitos
According to labor force statistics for Pueblitos, 93.6% of individuals (235) out of the total population between 25 and 64 years of age (251) are in the labor force, with 11.1% or 26 of them being unemployed. The group with the highest labor force participation rate are those with the educational attainment of high school diploma, with 100.0% or 54 individuals in the labor force. Within the labor force, individuals with high school diploma education have the highest percentage of unemployment, with 48.1% or 26 of them being unemployed.
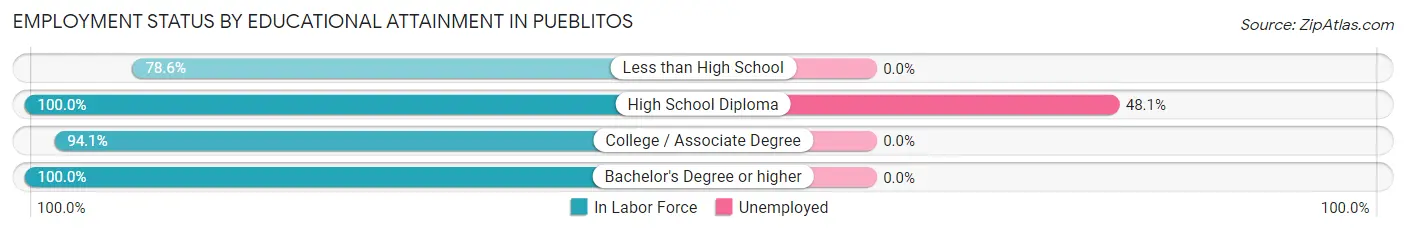
| Educational Attainment | In Labor Force | Unemployed |
| Less than High School | 33 (78.6%) | 0 (0.0%) |
| High School Diploma | 54 (100.0%) | 26 (48.1%) |
| College / Associate Degree | 112 (94.1%) | 0 (0.0%) |
| Bachelor's Degree or higher | 36 (100.0%) | 0 (0.0%) |
| Total | 235 (93.6%) | 28 (11.1%) |
Employment Occupations by Sex in Pueblitos
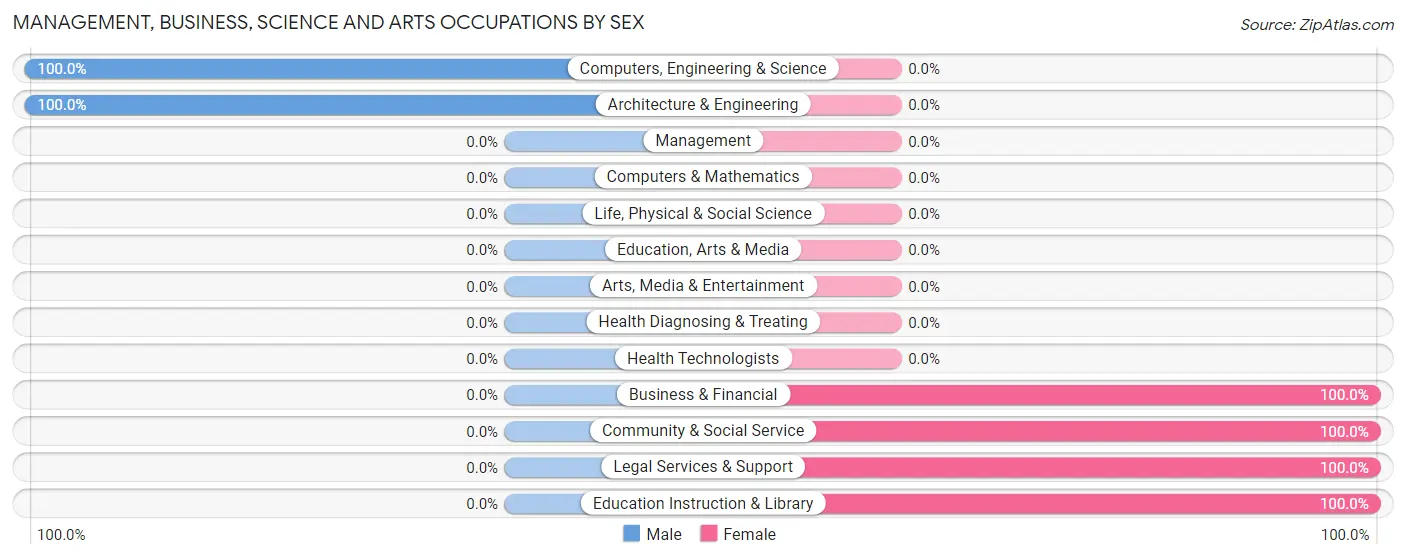
Management, Business, Science and Arts Occupations
The most common Management, Business, Science and Arts occupations in Pueblitos are Community & Social Service (41 | 18.5%), Legal Services & Support (36 | 16.2%), Business & Financial (18 | 8.1%), Computers, Engineering & Science (6 | 2.7%), and Architecture & Engineering (6 | 2.7%).
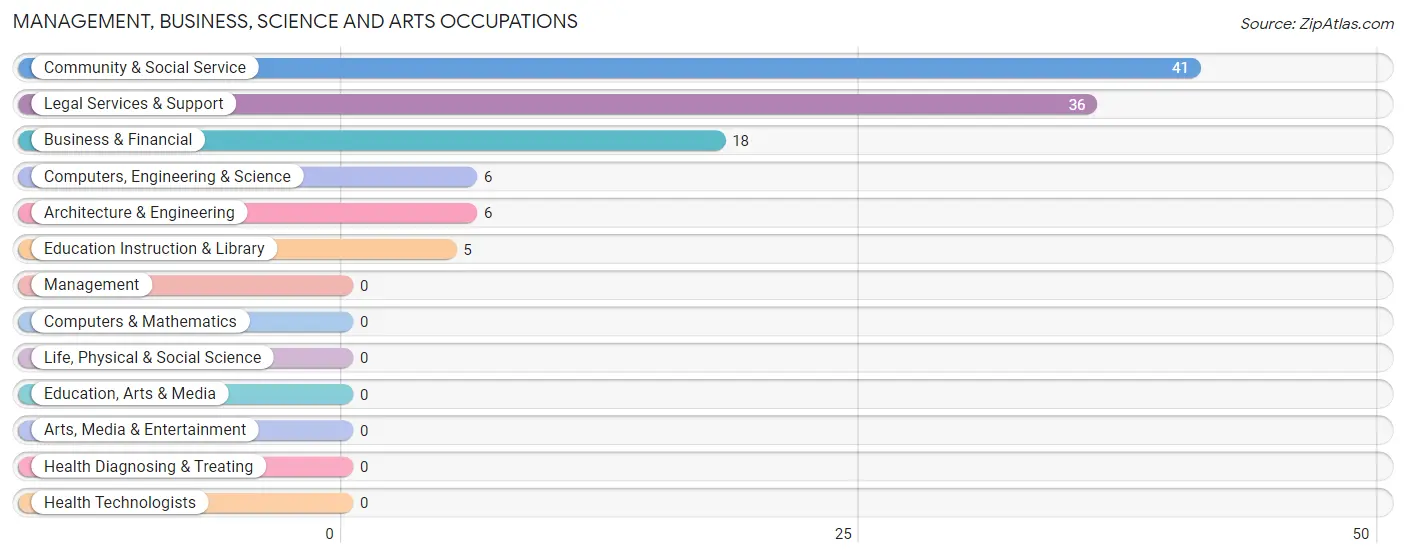
Management, Business, Science and Arts Occupations by Sex
Within the Management, Business, Science and Arts occupations in Pueblitos, the most male-oriented occupations are Computers, Engineering & Science (100.0%), and Architecture & Engineering (100.0%), while the most female-oriented occupations are Business & Financial (100.0%), Community & Social Service (100.0%), and Legal Services & Support (100.0%).
| Occupation | Male | Female |
| Management | 0 (0.0%) | 0 (0.0%) |
| Business & Financial | 0 (0.0%) | 18 (100.0%) |
| Computers, Engineering & Science | 6 (100.0%) | 0 (0.0%) |
| Computers & Mathematics | 0 (0.0%) | 0 (0.0%) |
| Architecture & Engineering | 6 (100.0%) | 0 (0.0%) |
| Life, Physical & Social Science | 0 (0.0%) | 0 (0.0%) |
| Community & Social Service | 0 (0.0%) | 41 (100.0%) |
| Education, Arts & Media | 0 (0.0%) | 0 (0.0%) |
| Legal Services & Support | 0 (0.0%) | 36 (100.0%) |
| Education Instruction & Library | 0 (0.0%) | 5 (100.0%) |
| Arts, Media & Entertainment | 0 (0.0%) | 0 (0.0%) |
| Health Diagnosing & Treating | 0 (0.0%) | 0 (0.0%) |
| Health Technologists | 0 (0.0%) | 0 (0.0%) |
| Total (Category) | 6 (9.2%) | 59 (90.8%) |
| Total (Overall) | 88 (39.6%) | 134 (60.4%) |
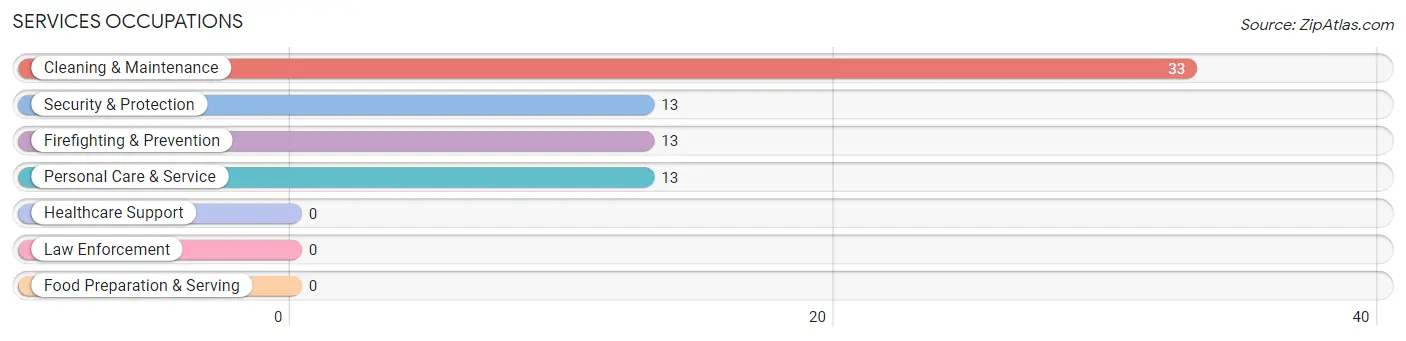
Services Occupations
The most common Services occupations in Pueblitos are Cleaning & Maintenance (33 | 14.9%), Security & Protection (13 | 5.9%), Firefighting & Prevention (13 | 5.9%), and Personal Care & Service (13 | 5.9%).
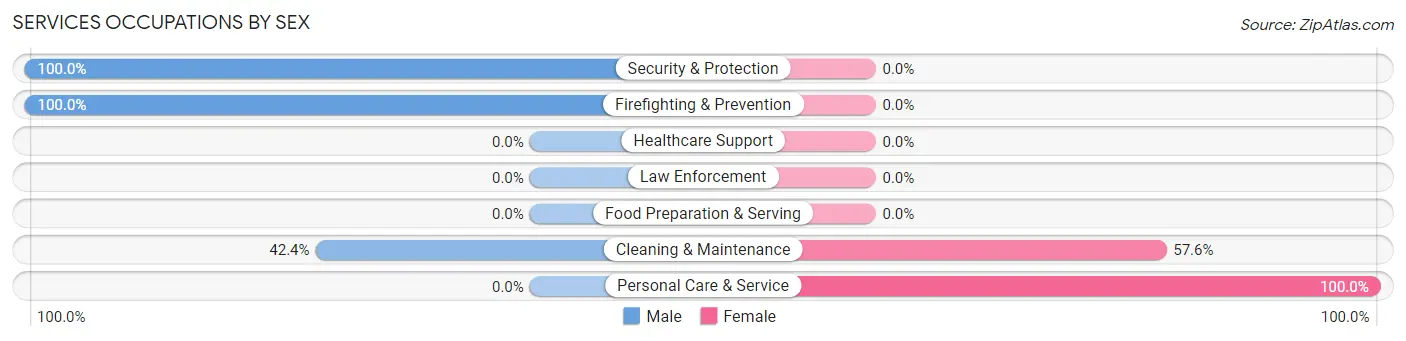
Services Occupations by Sex
Within the Services occupations in Pueblitos, the most male-oriented occupations are Security & Protection (100.0%), Firefighting & Prevention (100.0%), and Cleaning & Maintenance (42.4%), while the most female-oriented occupations are Personal Care & Service (100.0%), and Cleaning & Maintenance (57.6%).
| Occupation | Male | Female |
| Healthcare Support | 0 (0.0%) | 0 (0.0%) |
| Security & Protection | 13 (100.0%) | 0 (0.0%) |
| Firefighting & Prevention | 13 (100.0%) | 0 (0.0%) |
| Law Enforcement | 0 (0.0%) | 0 (0.0%) |
| Food Preparation & Serving | 0 (0.0%) | 0 (0.0%) |
| Cleaning & Maintenance | 14 (42.4%) | 19 (57.6%) |
| Personal Care & Service | 0 (0.0%) | 13 (100.0%) |
| Total (Category) | 27 (45.8%) | 32 (54.2%) |
| Total (Overall) | 88 (39.6%) | 134 (60.4%) |
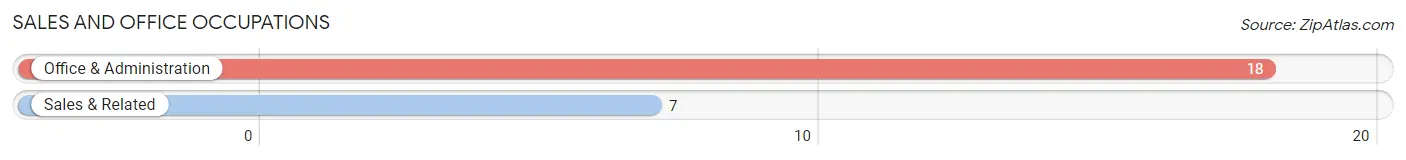
Sales and Office Occupations
The most common Sales and Office occupations in Pueblitos are Office & Administration (18 | 8.1%), and Sales & Related (7 | 3.2%).
Sales and Office Occupations by Sex
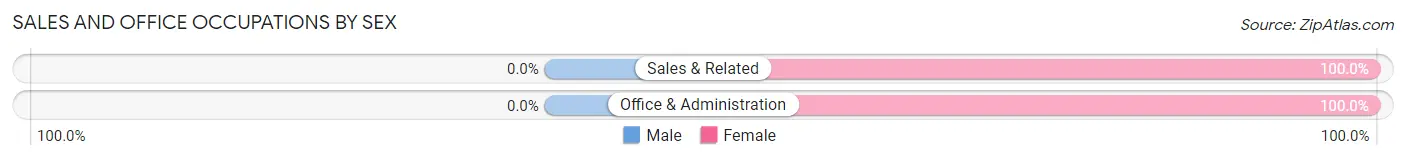
| Occupation | Male | Female |
| Sales & Related | 0 (0.0%) | 7 (100.0%) |
| Office & Administration | 0 (0.0%) | 18 (100.0%) |
| Total (Category) | 0 (0.0%) | 25 (100.0%) |
| Total (Overall) | 88 (39.6%) | 134 (60.4%) |
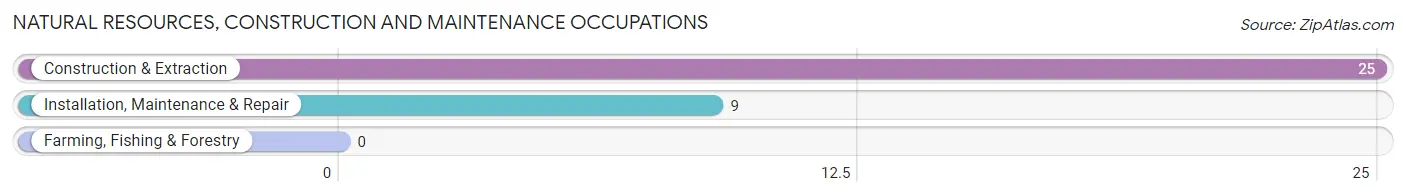
Natural Resources, Construction and Maintenance Occupations
The most common Natural Resources, Construction and Maintenance occupations in Pueblitos are Construction & Extraction (25 | 11.3%), and Installation, Maintenance & Repair (9 | 4.1%).
Natural Resources, Construction and Maintenance Occupations by Sex
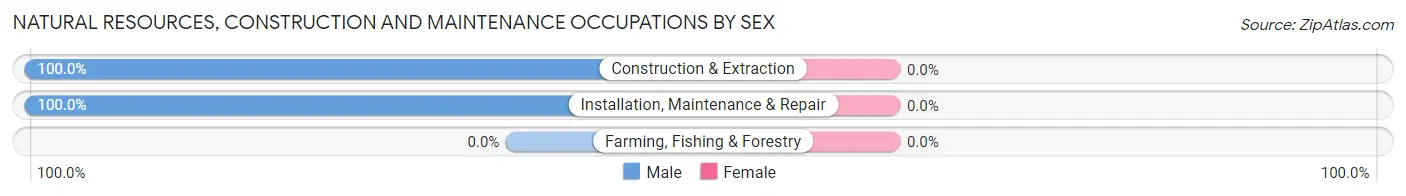
| Occupation | Male | Female |
| Farming, Fishing & Forestry | 0 (0.0%) | 0 (0.0%) |
| Construction & Extraction | 25 (100.0%) | 0 (0.0%) |
| Installation, Maintenance & Repair | 9 (100.0%) | 0 (0.0%) |
| Total (Category) | 34 (100.0%) | 0 (0.0%) |
| Total (Overall) | 88 (39.6%) | 134 (60.4%) |
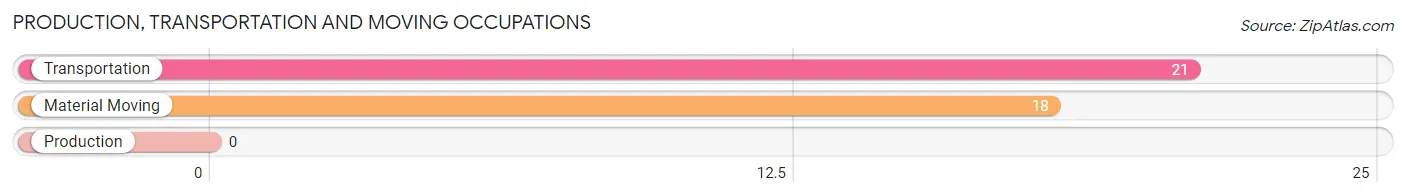
Production, Transportation and Moving Occupations
The most common Production, Transportation and Moving occupations in Pueblitos are Transportation (21 | 9.5%), and Material Moving (18 | 8.1%).
Production, Transportation and Moving Occupations by Sex
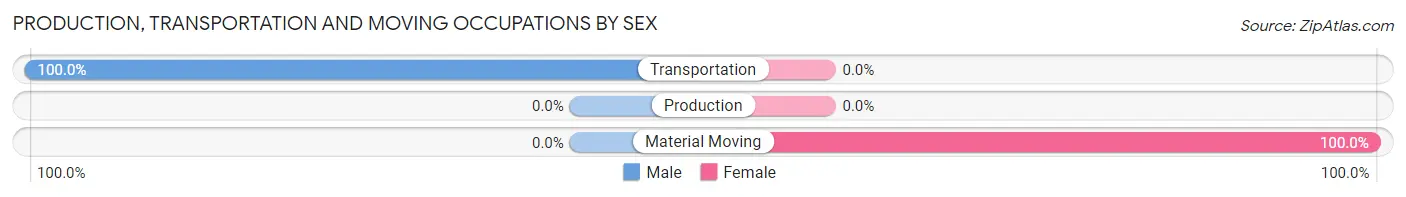
| Occupation | Male | Female |
| Production | 0 (0.0%) | 0 (0.0%) |
| Transportation | 21 (100.0%) | 0 (0.0%) |
| Material Moving | 0 (0.0%) | 18 (100.0%) |
| Total (Category) | 21 (53.8%) | 18 (46.2%) |
| Total (Overall) | 88 (39.6%) | 134 (60.4%) |
Employment Industries by Sex in Pueblitos
Employment Industries in Pueblitos
The major employment industries in Pueblitos include Professional & Scientific (45 | 20.3%), Transportation & Warehousing (31 | 14.0%), Educational Services (31 | 14.0%), Construction (25 | 11.3%), and Retail Trade (25 | 11.3%).
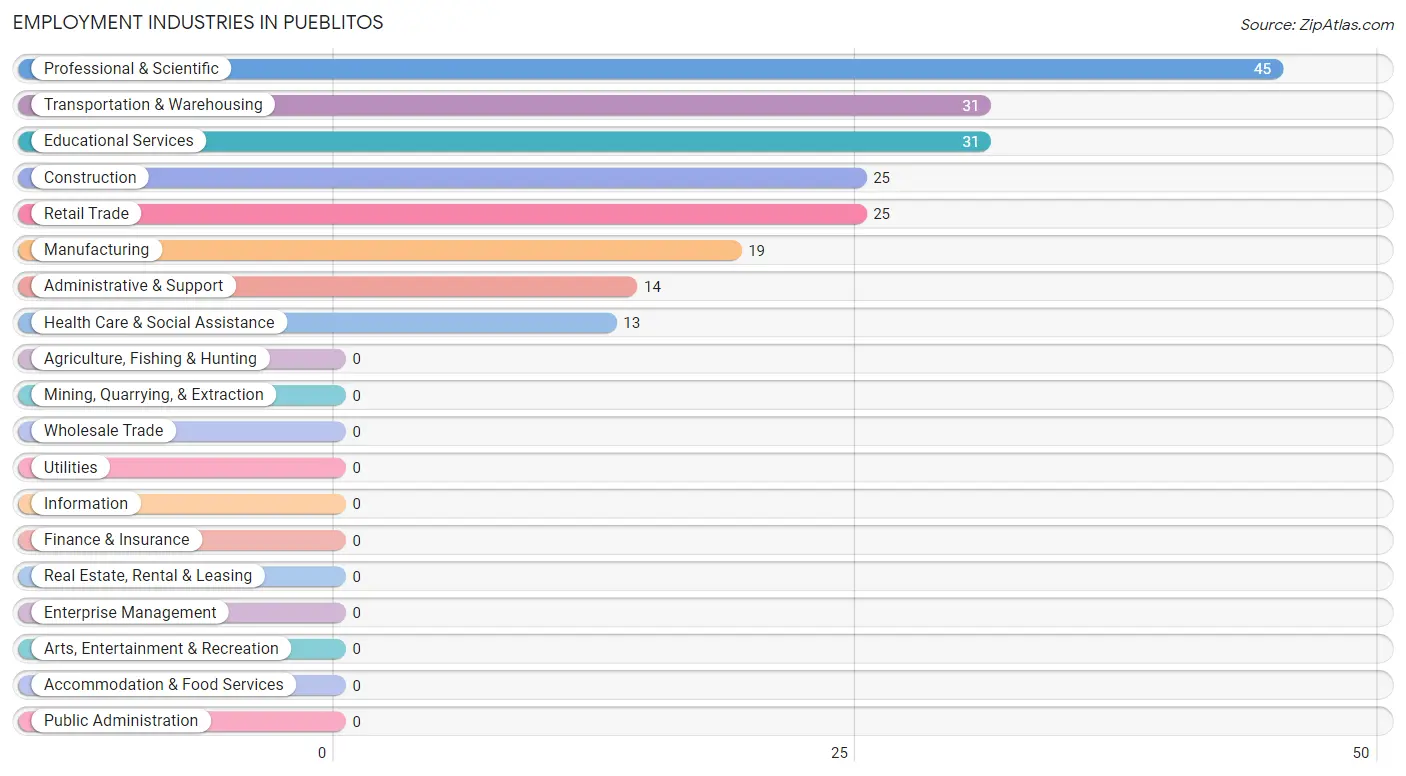
Employment Industries by Sex in Pueblitos
The Pueblitos industries that see more men than women are Construction (100.0%), Manufacturing (100.0%), and Administrative & Support (100.0%), whereas the industries that tend to have a higher number of women are Retail Trade (100.0%), Educational Services (100.0%), and Health Care & Social Assistance (100.0%).

| Industry | Male | Female |
| Agriculture, Fishing & Hunting | 0 (0.0%) | 0 (0.0%) |
| Mining, Quarrying, & Extraction | 0 (0.0%) | 0 (0.0%) |
| Construction | 25 (100.0%) | 0 (0.0%) |
| Manufacturing | 19 (100.0%) | 0 (0.0%) |
| Wholesale Trade | 0 (0.0%) | 0 (0.0%) |
| Retail Trade | 0 (0.0%) | 25 (100.0%) |
| Transportation & Warehousing | 21 (67.7%) | 10 (32.3%) |
| Utilities | 0 (0.0%) | 0 (0.0%) |
| Information | 0 (0.0%) | 0 (0.0%) |
| Finance & Insurance | 0 (0.0%) | 0 (0.0%) |
| Real Estate, Rental & Leasing | 0 (0.0%) | 0 (0.0%) |
| Professional & Scientific | 9 (20.0%) | 36 (80.0%) |
| Enterprise Management | 0 (0.0%) | 0 (0.0%) |
| Administrative & Support | 14 (100.0%) | 0 (0.0%) |
| Educational Services | 0 (0.0%) | 31 (100.0%) |
| Health Care & Social Assistance | 0 (0.0%) | 13 (100.0%) |
| Arts, Entertainment & Recreation | 0 (0.0%) | 0 (0.0%) |
| Accommodation & Food Services | 0 (0.0%) | 0 (0.0%) |
| Public Administration | 0 (0.0%) | 0 (0.0%) |
| Total | 88 (39.6%) | 134 (60.4%) |
Education in Pueblitos
School Enrollment in Pueblitos
The most common levels of schooling among the 95 students in Pueblitos are college / undergraduate (36 | 37.9%), elementary school (25 | 26.3%), and graduate / professional (18 | 19.0%).
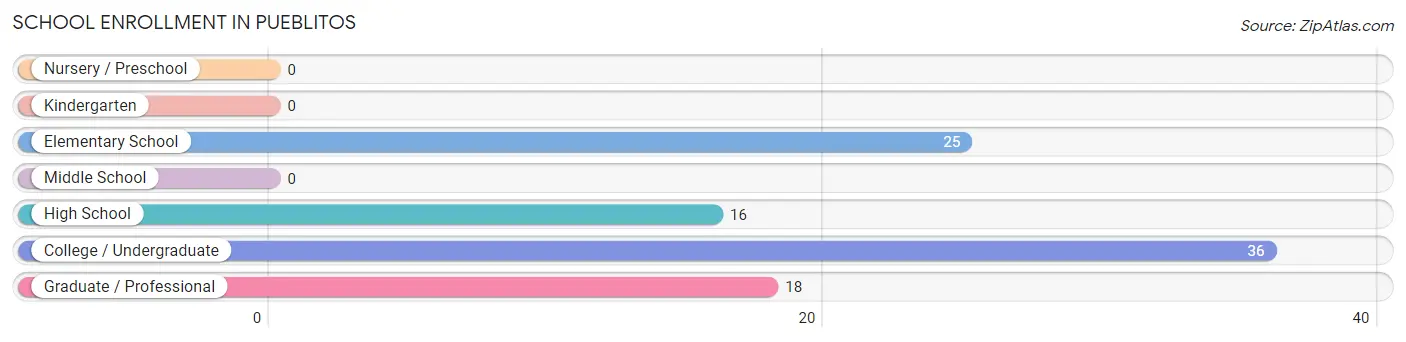
| School Level | # Students | % Students |
| Nursery / Preschool | 0 | 0.0% |
| Kindergarten | 0 | 0.0% |
| Elementary School | 25 | 26.3% |
| Middle School | 0 | 0.0% |
| High School | 16 | 16.8% |
| College / Undergraduate | 36 | 37.9% |
| Graduate / Professional | 18 | 19.0% |
| Total | 95 | 100.0% |
School Enrollment by Age by Funding Source in Pueblitos
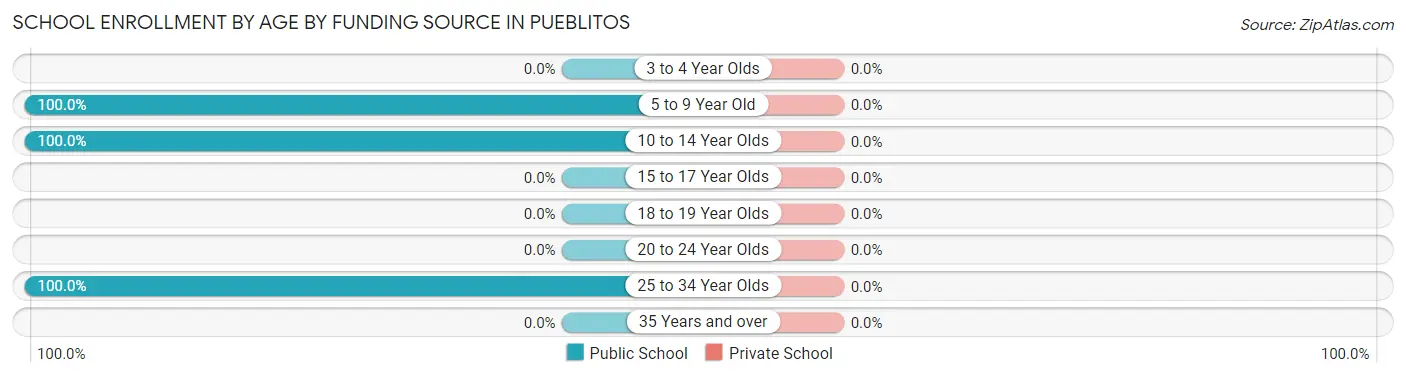
| Age Bracket | Public School | Private School |
| 3 to 4 Year Olds | 0 (0.0%) | 0 (0.0%) |
| 5 to 9 Year Old | 25 (100.0%) | 0 (0.0%) |
| 10 to 14 Year Olds | 16 (100.0%) | 0 (0.0%) |
| 15 to 17 Year Olds | 0 (0.0%) | 0 (0.0%) |
| 18 to 19 Year Olds | 0 (0.0%) | 0 (0.0%) |
| 20 to 24 Year Olds | 0 (0.0%) | 0 (0.0%) |
| 25 to 34 Year Olds | 54 (100.0%) | 0 (0.0%) |
| 35 Years and over | 0 (0.0%) | 0 (0.0%) |
| Total | 95 (100.0%) | 0 (0.0%) |
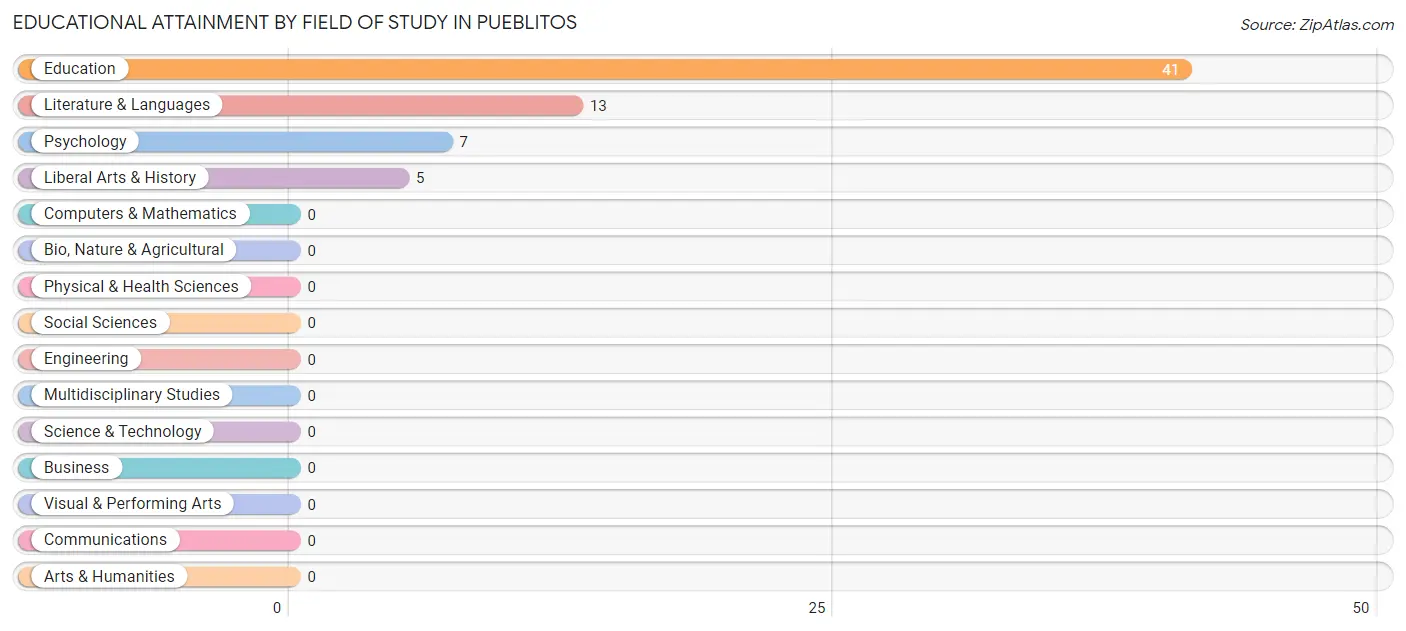
Educational Attainment by Field of Study in Pueblitos
Education (41 | 62.1%), literature & languages (13 | 19.7%), psychology (7 | 10.6%), and liberal arts & history (5 | 7.6%) are the most common fields of study among 66 individuals in Pueblitos who have obtained a bachelor's degree or higher.
| Field of Study | # Graduates | % Graduates |
| Computers & Mathematics | 0 | 0.0% |
| Bio, Nature & Agricultural | 0 | 0.0% |
| Physical & Health Sciences | 0 | 0.0% |
| Psychology | 7 | 10.6% |
| Social Sciences | 0 | 0.0% |
| Engineering | 0 | 0.0% |
| Multidisciplinary Studies | 0 | 0.0% |
| Science & Technology | 0 | 0.0% |
| Business | 0 | 0.0% |
| Education | 41 | 62.1% |
| Literature & Languages | 13 | 19.7% |
| Liberal Arts & History | 5 | 7.6% |
| Visual & Performing Arts | 0 | 0.0% |
| Communications | 0 | 0.0% |
| Arts & Humanities | 0 | 0.0% |
| Total | 66 | 100.0% |
Transportation & Commute in Pueblitos
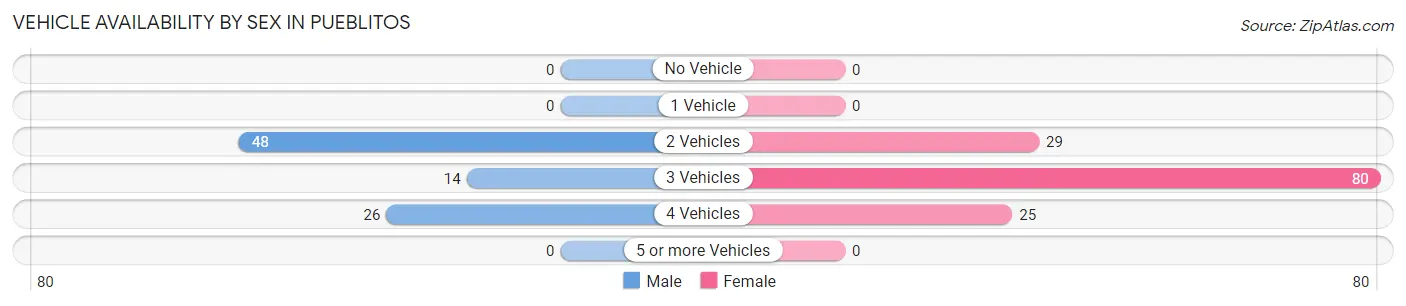
Vehicle Availability by Sex in Pueblitos
The most prevalent vehicle ownership categories in Pueblitos are males with 2 vehicles (48, accounting for 54.5%) and females with 2 vehicles (29, making up 35.8%).
| Vehicles Available | Male | Female |
| No Vehicle | 0 (0.0%) | 0 (0.0%) |
| 1 Vehicle | 0 (0.0%) | 0 (0.0%) |
| 2 Vehicles | 48 (54.5%) | 29 (21.6%) |
| 3 Vehicles | 14 (15.9%) | 80 (59.7%) |
| 4 Vehicles | 26 (29.5%) | 25 (18.7%) |
| 5 or more Vehicles | 0 (0.0%) | 0 (0.0%) |
| Total | 88 (100.0%) | 134 (100.0%) |
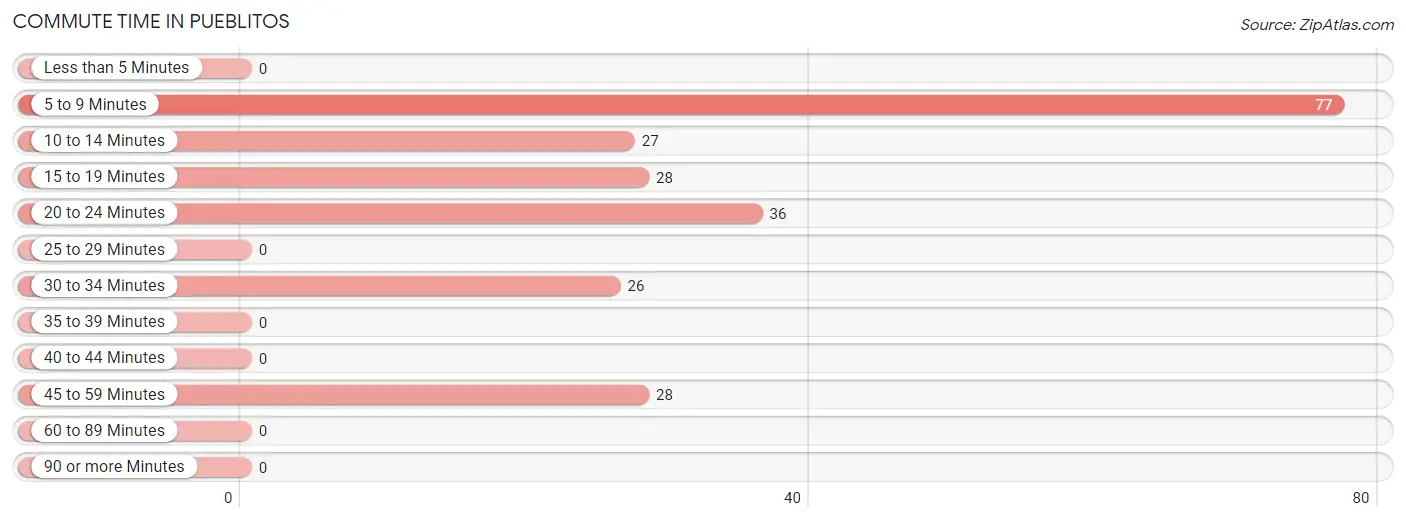
Commute Time in Pueblitos
The most frequently occuring commute durations in Pueblitos are 5 to 9 minutes (77 commuters, 34.7%), 20 to 24 minutes (36 commuters, 16.2%), and 15 to 19 minutes (28 commuters, 12.6%).
| Commute Time | # Commuters | % Commuters |
| Less than 5 Minutes | 0 | 0.0% |
| 5 to 9 Minutes | 77 | 34.7% |
| 10 to 14 Minutes | 27 | 12.2% |
| 15 to 19 Minutes | 28 | 12.6% |
| 20 to 24 Minutes | 36 | 16.2% |
| 25 to 29 Minutes | 0 | 0.0% |
| 30 to 34 Minutes | 26 | 11.7% |
| 35 to 39 Minutes | 0 | 0.0% |
| 40 to 44 Minutes | 0 | 0.0% |
| 45 to 59 Minutes | 28 | 12.6% |
| 60 to 89 Minutes | 0 | 0.0% |
| 90 or more Minutes | 0 | 0.0% |
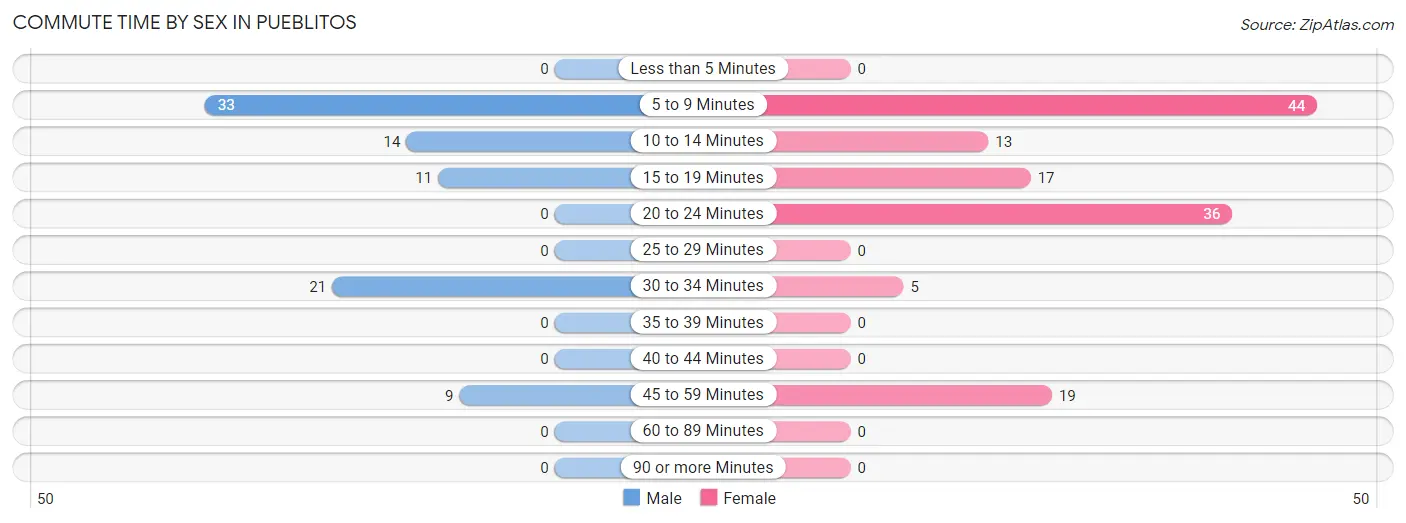
Commute Time by Sex in Pueblitos
The most common commute times in Pueblitos are 5 to 9 minutes (33 commuters, 37.5%) for males and 5 to 9 minutes (44 commuters, 32.8%) for females.
| Commute Time | Male | Female |
| Less than 5 Minutes | 0 (0.0%) | 0 (0.0%) |
| 5 to 9 Minutes | 33 (37.5%) | 44 (32.8%) |
| 10 to 14 Minutes | 14 (15.9%) | 13 (9.7%) |
| 15 to 19 Minutes | 11 (12.5%) | 17 (12.7%) |
| 20 to 24 Minutes | 0 (0.0%) | 36 (26.9%) |
| 25 to 29 Minutes | 0 (0.0%) | 0 (0.0%) |
| 30 to 34 Minutes | 21 (23.9%) | 5 (3.7%) |
| 35 to 39 Minutes | 0 (0.0%) | 0 (0.0%) |
| 40 to 44 Minutes | 0 (0.0%) | 0 (0.0%) |
| 45 to 59 Minutes | 9 (10.2%) | 19 (14.2%) |
| 60 to 89 Minutes | 0 (0.0%) | 0 (0.0%) |
| 90 or more Minutes | 0 (0.0%) | 0 (0.0%) |
Time of Departure to Work by Sex in Pueblitos
The most frequent times of departure to work in Pueblitos are 6:00 AM to 6:29 AM (36, 40.9%) for males and 6:00 AM to 6:29 AM (37, 27.6%) for females.
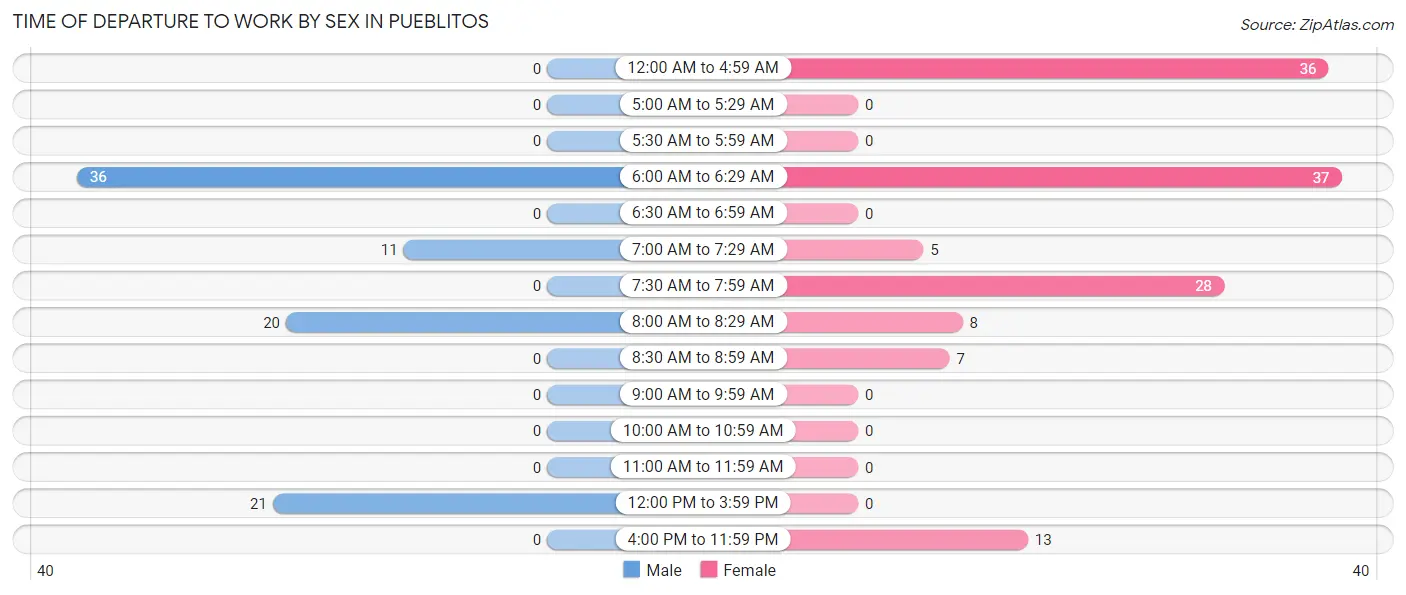
| Time of Departure | Male | Female |
| 12:00 AM to 4:59 AM | 0 (0.0%) | 36 (26.9%) |
| 5:00 AM to 5:29 AM | 0 (0.0%) | 0 (0.0%) |
| 5:30 AM to 5:59 AM | 0 (0.0%) | 0 (0.0%) |
| 6:00 AM to 6:29 AM | 36 (40.9%) | 37 (27.6%) |
| 6:30 AM to 6:59 AM | 0 (0.0%) | 0 (0.0%) |
| 7:00 AM to 7:29 AM | 11 (12.5%) | 5 (3.7%) |
| 7:30 AM to 7:59 AM | 0 (0.0%) | 28 (20.9%) |
| 8:00 AM to 8:29 AM | 20 (22.7%) | 8 (6.0%) |
| 8:30 AM to 8:59 AM | 0 (0.0%) | 7 (5.2%) |
| 9:00 AM to 9:59 AM | 0 (0.0%) | 0 (0.0%) |
| 10:00 AM to 10:59 AM | 0 (0.0%) | 0 (0.0%) |
| 11:00 AM to 11:59 AM | 0 (0.0%) | 0 (0.0%) |
| 12:00 PM to 3:59 PM | 21 (23.9%) | 0 (0.0%) |
| 4:00 PM to 11:59 PM | 0 (0.0%) | 13 (9.7%) |
| Total | 88 (100.0%) | 134 (100.0%) |
Housing Occupancy in Pueblitos
Occupancy by Ownership in Pueblitos
Of the total 153 dwellings in Pueblitos, owner-occupied units account for 127 (83.0%), while renter-occupied units make up 26 (17.0%).
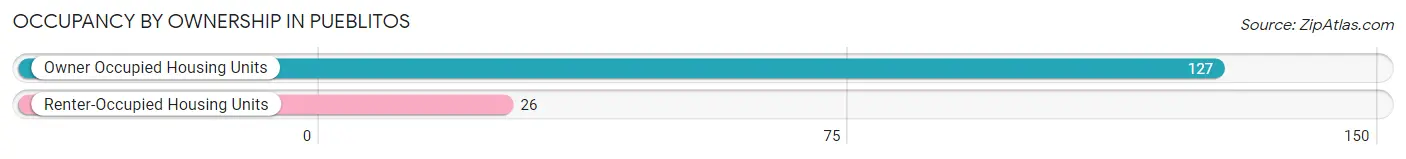
| Occupancy | # Housing Units | % Housing Units |
| Owner Occupied Housing Units | 127 | 83.0% |
| Renter-Occupied Housing Units | 26 | 17.0% |
| Total Occupied Housing Units | 153 | 100.0% |
Occupancy by Household Size in Pueblitos
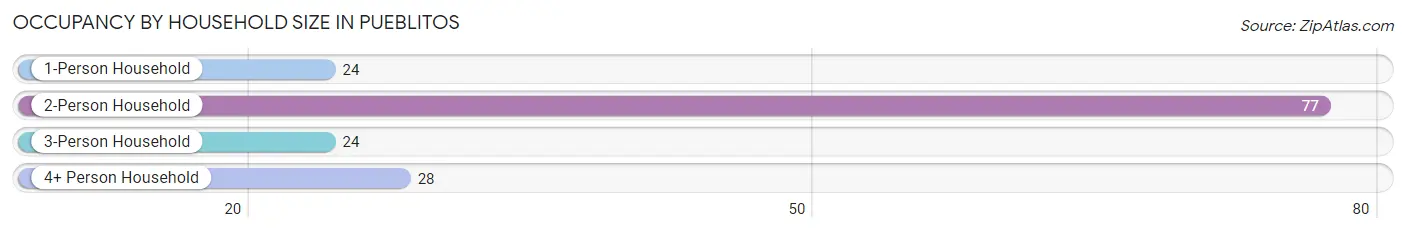
| Household Size | # Housing Units | % Housing Units |
| 1-Person Household | 24 | 15.7% |
| 2-Person Household | 77 | 50.3% |
| 3-Person Household | 24 | 15.7% |
| 4+ Person Household | 28 | 18.3% |
| Total Housing Units | 153 | 100.0% |
Occupancy by Ownership by Household Size in Pueblitos
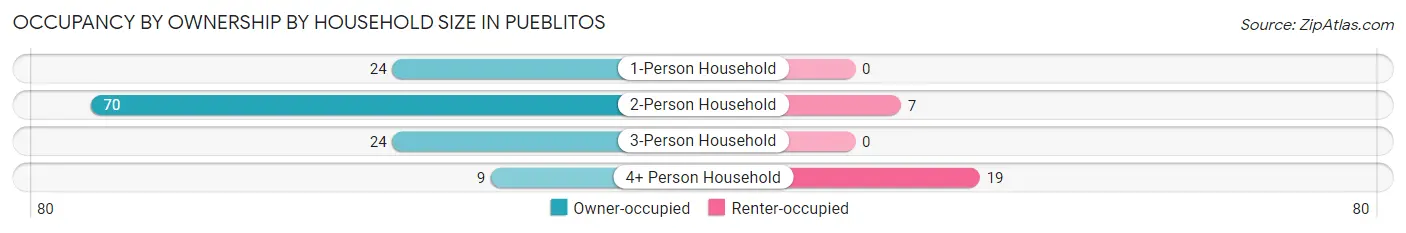
| Household Size | Owner-occupied | Renter-occupied |
| 1-Person Household | 24 (100.0%) | 0 (0.0%) |
| 2-Person Household | 70 (90.9%) | 7 (9.1%) |
| 3-Person Household | 24 (100.0%) | 0 (0.0%) |
| 4+ Person Household | 9 (32.1%) | 19 (67.9%) |
| Total Housing Units | 127 (83.0%) | 26 (17.0%) |
Occupancy by Educational Attainment in Pueblitos
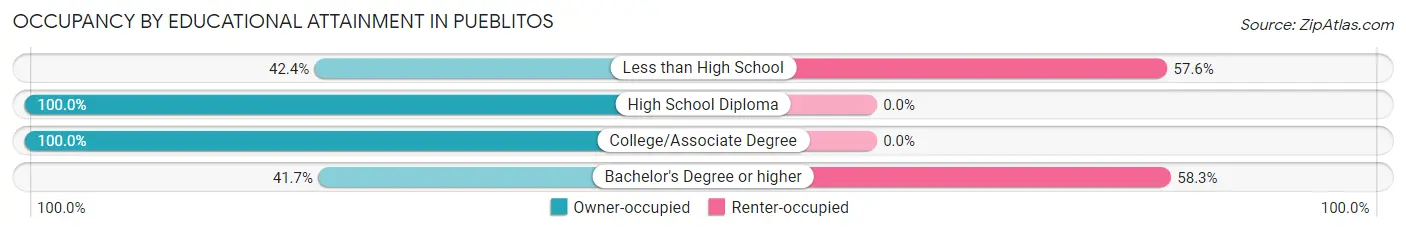
| Household Size | Owner-occupied | Renter-occupied |
| Less than High School | 14 (42.4%) | 19 (57.6%) |
| High School Diploma | 38 (100.0%) | 0 (0.0%) |
| College/Associate Degree | 70 (100.0%) | 0 (0.0%) |
| Bachelor's Degree or higher | 5 (41.7%) | 7 (58.3%) |
Occupancy by Age of Householder in Pueblitos
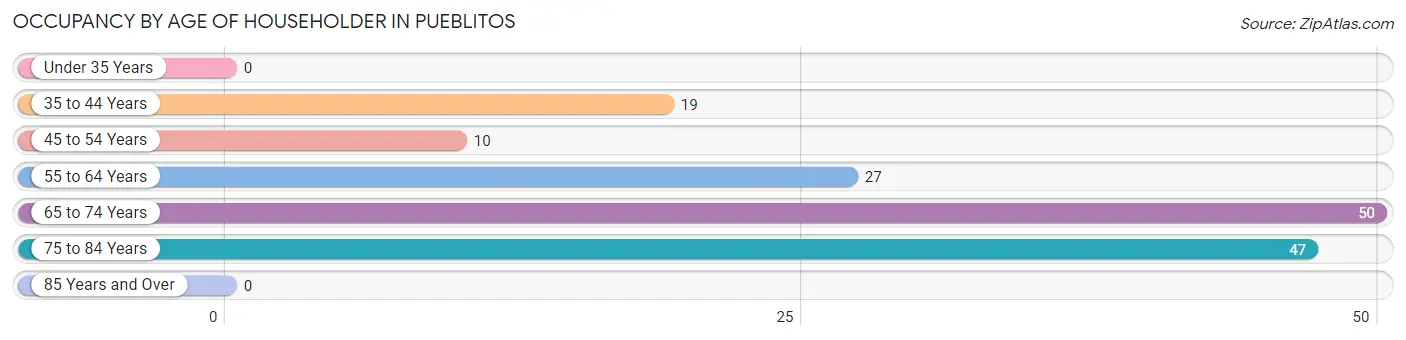
| Age Bracket | # Households | % Households |
| Under 35 Years | 0 | 0.0% |
| 35 to 44 Years | 19 | 12.4% |
| 45 to 54 Years | 10 | 6.5% |
| 55 to 64 Years | 27 | 17.6% |
| 65 to 74 Years | 50 | 32.7% |
| 75 to 84 Years | 47 | 30.7% |
| 85 Years and Over | 0 | 0.0% |
| Total | 153 | 100.0% |
Housing Finances in Pueblitos
Median Income by Occupancy in Pueblitos
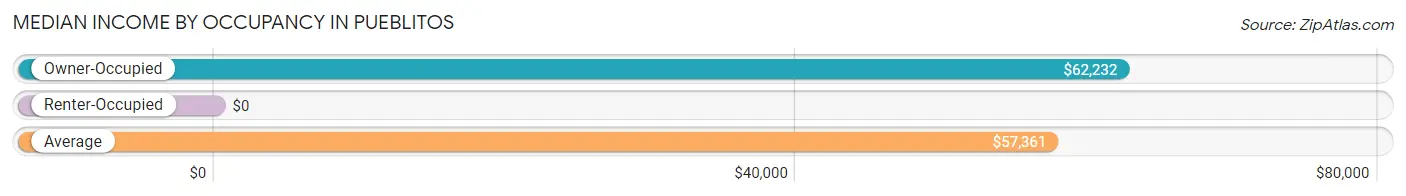
| Occupancy Type | # Households | Median Income |
| Owner-Occupied | 127 (83.0%) | $62,232 |
| Renter-Occupied | 26 (17.0%) | $0 |
| Average | 153 (100.0%) | $57,361 |
Occupancy by Householder Income Bracket in Pueblitos
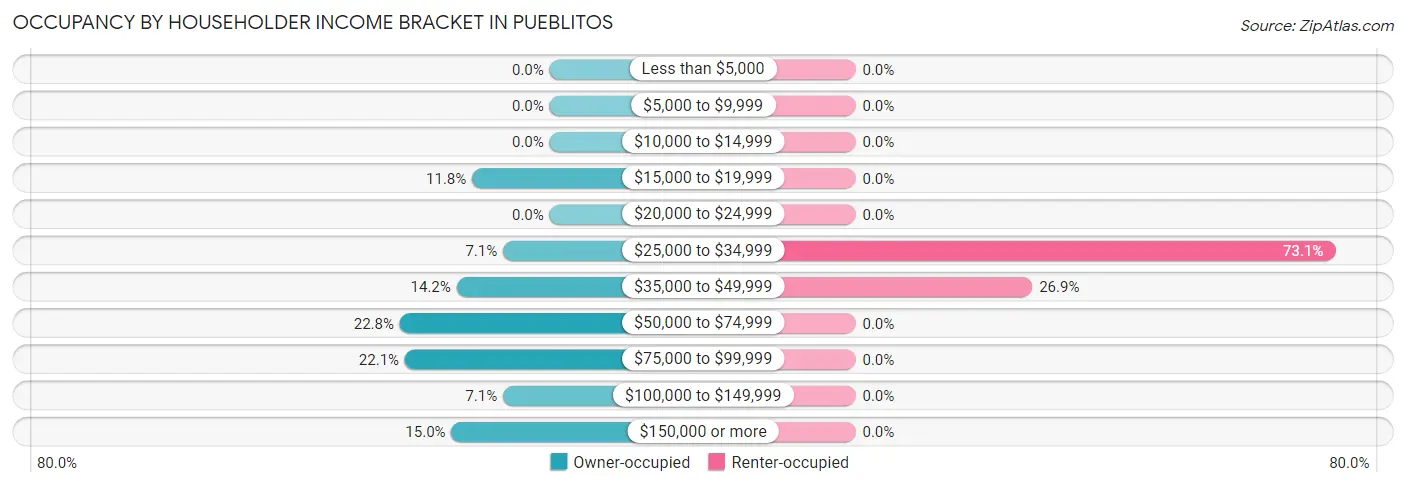
| Income Bracket | Owner-occupied | Renter-occupied |
| Less than $5,000 | 0 (0.0%) | 0 (0.0%) |
| $5,000 to $9,999 | 0 (0.0%) | 0 (0.0%) |
| $10,000 to $14,999 | 0 (0.0%) | 0 (0.0%) |
| $15,000 to $19,999 | 15 (11.8%) | 0 (0.0%) |
| $20,000 to $24,999 | 0 (0.0%) | 0 (0.0%) |
| $25,000 to $34,999 | 9 (7.1%) | 19 (73.1%) |
| $35,000 to $49,999 | 18 (14.2%) | 7 (26.9%) |
| $50,000 to $74,999 | 29 (22.8%) | 0 (0.0%) |
| $75,000 to $99,999 | 28 (22.1%) | 0 (0.0%) |
| $100,000 to $149,999 | 9 (7.1%) | 0 (0.0%) |
| $150,000 or more | 19 (15.0%) | 0 (0.0%) |
| Total | 127 (100.0%) | 26 (100.0%) |
Monthly Housing Cost Tiers in Pueblitos
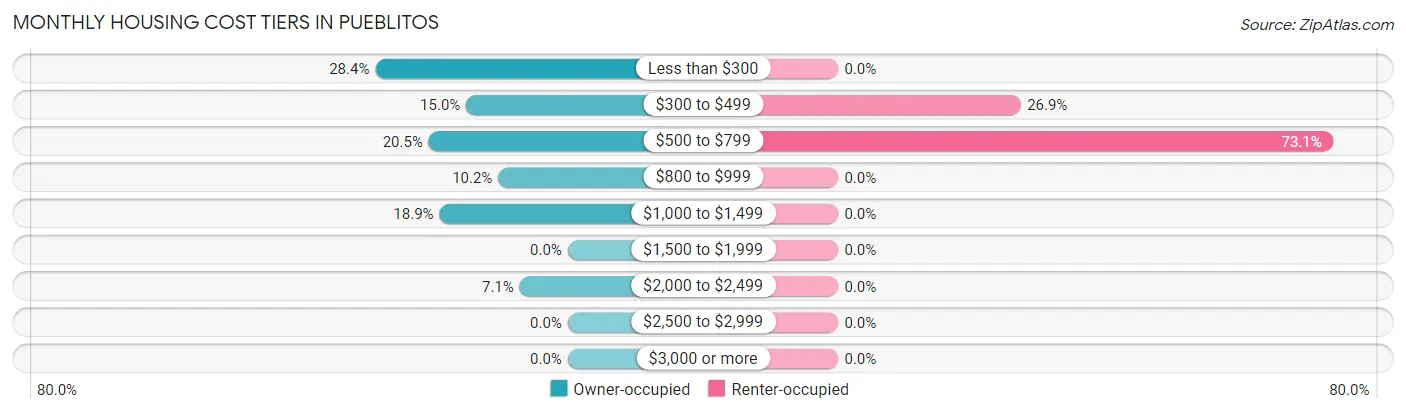
| Monthly Cost | Owner-occupied | Renter-occupied |
| Less than $300 | 36 (28.3%) | 0 (0.0%) |
| $300 to $499 | 19 (15.0%) | 7 (26.9%) |
| $500 to $799 | 26 (20.5%) | 19 (73.1%) |
| $800 to $999 | 13 (10.2%) | 0 (0.0%) |
| $1,000 to $1,499 | 24 (18.9%) | 0 (0.0%) |
| $1,500 to $1,999 | 0 (0.0%) | 0 (0.0%) |
| $2,000 to $2,499 | 9 (7.1%) | 0 (0.0%) |
| $2,500 to $2,999 | 0 (0.0%) | 0 (0.0%) |
| $3,000 or more | 0 (0.0%) | 0 (0.0%) |
| Total | 127 (100.0%) | 26 (100.0%) |
Physical Housing Characteristics in Pueblitos
Housing Structures in Pueblitos
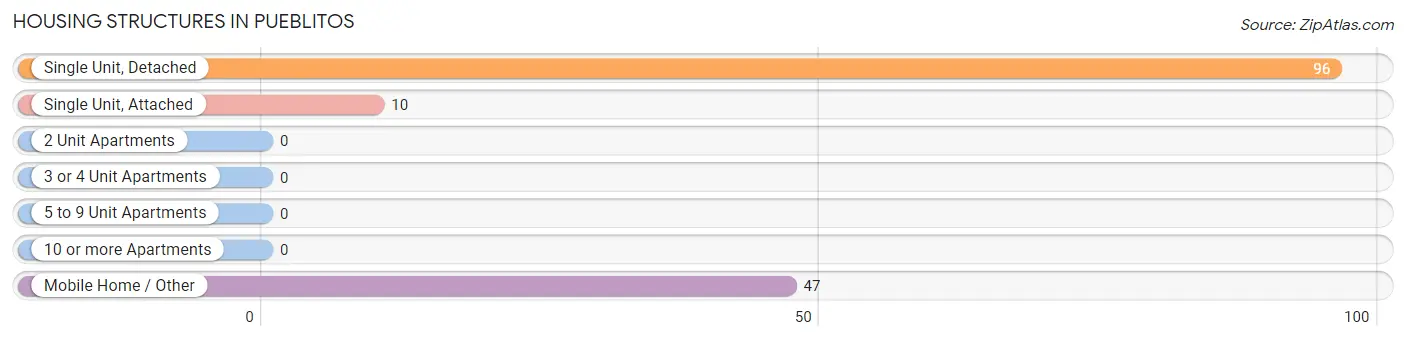
| Structure Type | # Housing Units | % Housing Units |
| Single Unit, Detached | 96 | 62.7% |
| Single Unit, Attached | 10 | 6.5% |
| 2 Unit Apartments | 0 | 0.0% |
| 3 or 4 Unit Apartments | 0 | 0.0% |
| 5 to 9 Unit Apartments | 0 | 0.0% |
| 10 or more Apartments | 0 | 0.0% |
| Mobile Home / Other | 47 | 30.7% |
| Total | 153 | 100.0% |
Housing Structures by Occupancy in Pueblitos
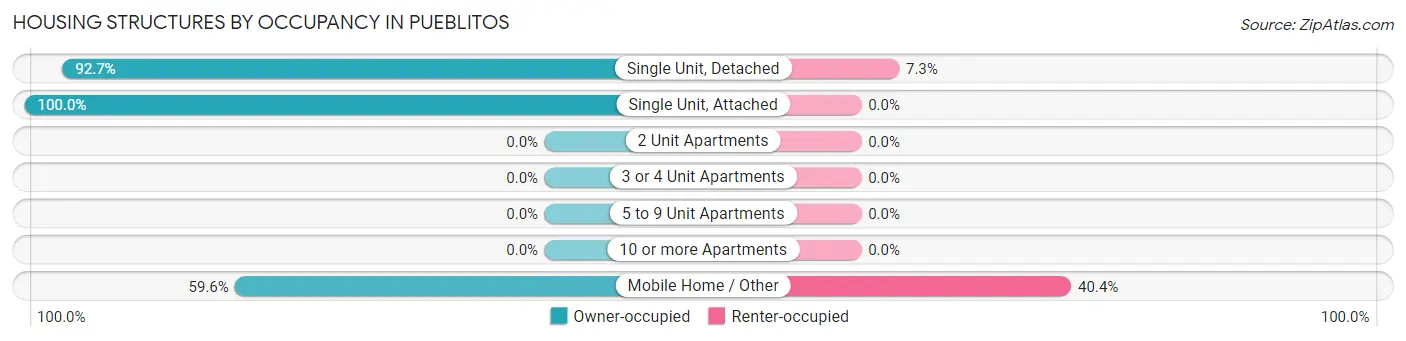
| Structure Type | Owner-occupied | Renter-occupied |
| Single Unit, Detached | 89 (92.7%) | 7 (7.3%) |
| Single Unit, Attached | 10 (100.0%) | 0 (0.0%) |
| 2 Unit Apartments | 0 (0.0%) | 0 (0.0%) |
| 3 or 4 Unit Apartments | 0 (0.0%) | 0 (0.0%) |
| 5 to 9 Unit Apartments | 0 (0.0%) | 0 (0.0%) |
| 10 or more Apartments | 0 (0.0%) | 0 (0.0%) |
| Mobile Home / Other | 28 (59.6%) | 19 (40.4%) |
| Total | 127 (83.0%) | 26 (17.0%) |
Housing Structures by Number of Rooms in Pueblitos
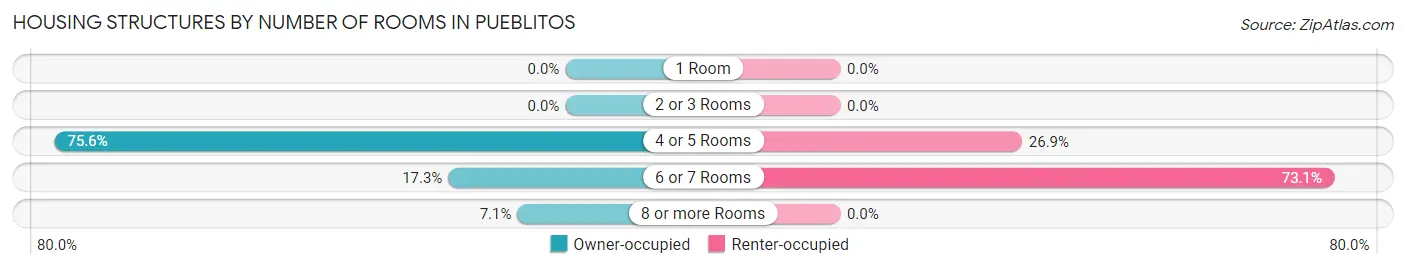
| Number of Rooms | Owner-occupied | Renter-occupied |
| 1 Room | 0 (0.0%) | 0 (0.0%) |
| 2 or 3 Rooms | 0 (0.0%) | 0 (0.0%) |
| 4 or 5 Rooms | 96 (75.6%) | 7 (26.9%) |
| 6 or 7 Rooms | 22 (17.3%) | 19 (73.1%) |
| 8 or more Rooms | 9 (7.1%) | 0 (0.0%) |
| Total | 127 (100.0%) | 26 (100.0%) |
Housing Structure by Heating Type in Pueblitos
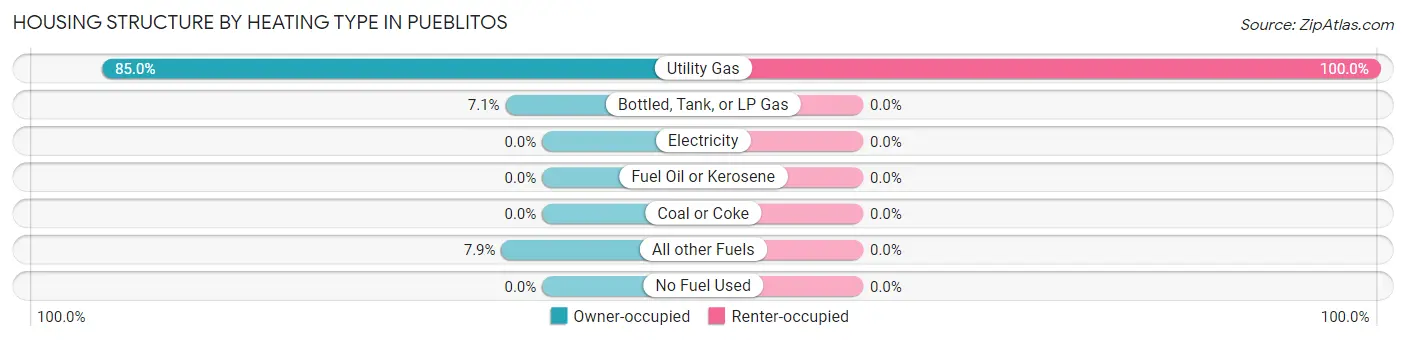
| Heating Type | Owner-occupied | Renter-occupied |
| Utility Gas | 108 (85.0%) | 26 (100.0%) |
| Bottled, Tank, or LP Gas | 9 (7.1%) | 0 (0.0%) |
| Electricity | 0 (0.0%) | 0 (0.0%) |
| Fuel Oil or Kerosene | 0 (0.0%) | 0 (0.0%) |
| Coal or Coke | 0 (0.0%) | 0 (0.0%) |
| All other Fuels | 10 (7.9%) | 0 (0.0%) |
| No Fuel Used | 0 (0.0%) | 0 (0.0%) |
| Total | 127 (100.0%) | 26 (100.0%) |
Household Vehicle Usage in Pueblitos
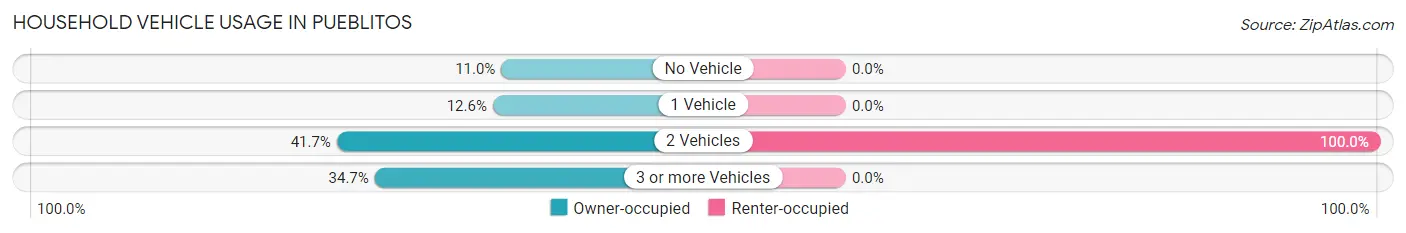
| Vehicles per Household | Owner-occupied | Renter-occupied |
| No Vehicle | 14 (11.0%) | 0 (0.0%) |
| 1 Vehicle | 16 (12.6%) | 0 (0.0%) |
| 2 Vehicles | 53 (41.7%) | 26 (100.0%) |
| 3 or more Vehicles | 44 (34.6%) | 0 (0.0%) |
| Total | 127 (100.0%) | 26 (100.0%) |
Real Estate & Mortgages in Pueblitos
Real Estate and Mortgage Overview in Pueblitos
| Characteristic | Without Mortgage | With Mortgage |
| Housing Units | 74 | 53 |
| Median Property Value | $163,200 | $154,200 |
| Median Household Income | $62,917 | $0 |
| Monthly Housing Costs | $354 | $0 |
| Real Estate Taxes | $1,049 | $0 |
Property Value by Mortgage Status in Pueblitos
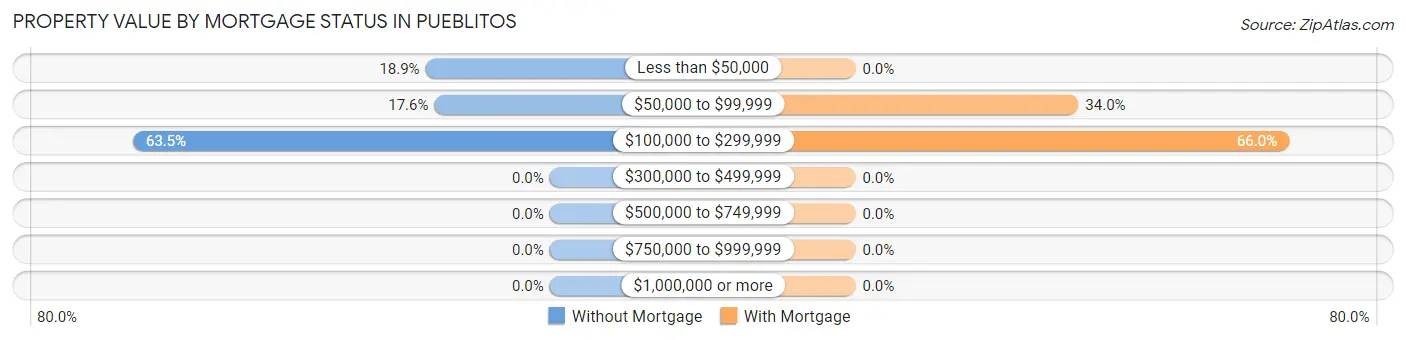
| Property Value | Without Mortgage | With Mortgage |
| Less than $50,000 | 14 (18.9%) | 0 (0.0%) |
| $50,000 to $99,999 | 13 (17.6%) | 18 (34.0%) |
| $100,000 to $299,999 | 47 (63.5%) | 35 (66.0%) |
| $300,000 to $499,999 | 0 (0.0%) | 0 (0.0%) |
| $500,000 to $749,999 | 0 (0.0%) | 0 (0.0%) |
| $750,000 to $999,999 | 0 (0.0%) | 0 (0.0%) |
| $1,000,000 or more | 0 (0.0%) | 0 (0.0%) |
| Total | 74 (100.0%) | 53 (100.0%) |
Household Income by Mortgage Status in Pueblitos
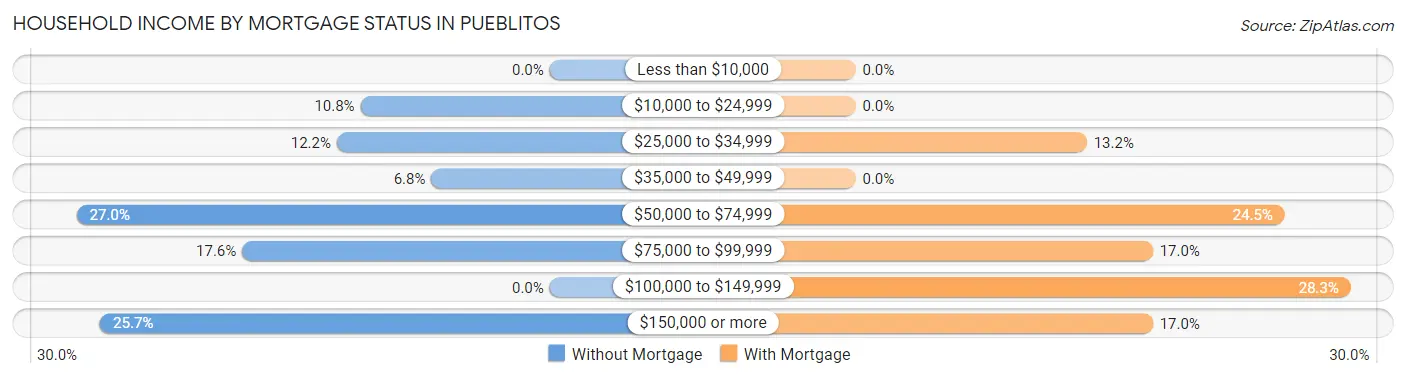
| Household Income | Without Mortgage | With Mortgage |
| Less than $10,000 | 0 (0.0%) | 0 (0.0%) |
| $10,000 to $24,999 | 8 (10.8%) | 0 (0.0%) |
| $25,000 to $34,999 | 9 (12.2%) | 7 (13.2%) |
| $35,000 to $49,999 | 5 (6.8%) | 0 (0.0%) |
| $50,000 to $74,999 | 20 (27.0%) | 13 (24.5%) |
| $75,000 to $99,999 | 13 (17.6%) | 9 (17.0%) |
| $100,000 to $149,999 | 0 (0.0%) | 15 (28.3%) |
| $150,000 or more | 19 (25.7%) | 9 (17.0%) |
| Total | 74 (100.0%) | 53 (100.0%) |
Property Value to Household Income Ratio in Pueblitos
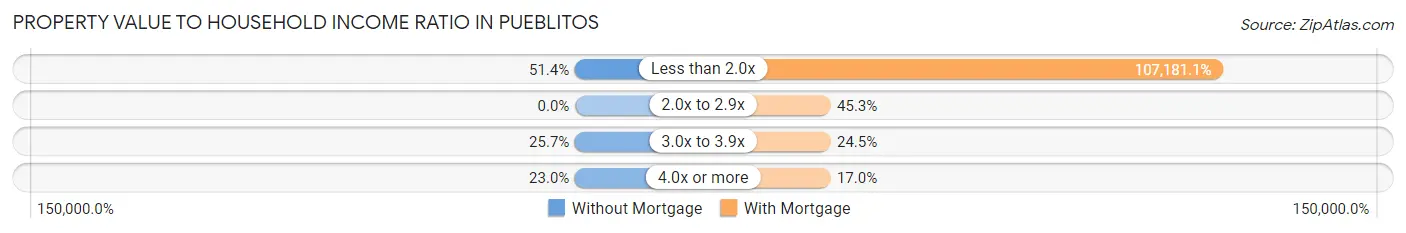
| Value-to-Income Ratio | Without Mortgage | With Mortgage |
| Less than 2.0x | 38 (51.3%) | 56,806 (107,181.1%) |
| 2.0x to 2.9x | 0 (0.0%) | 24 (45.3%) |
| 3.0x to 3.9x | 19 (25.7%) | 13 (24.5%) |
| 4.0x or more | 17 (23.0%) | 9 (17.0%) |
| Total | 74 (100.0%) | 53 (100.0%) |
Real Estate Taxes by Mortgage Status in Pueblitos
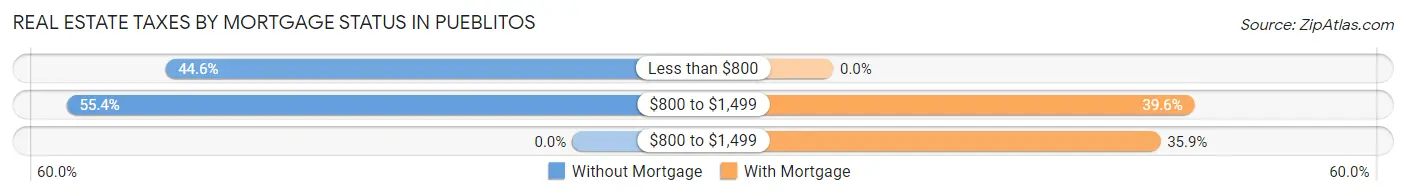
| Property Taxes | Without Mortgage | With Mortgage |
| Less than $800 | 33 (44.6%) | 0 (0.0%) |
| $800 to $1,499 | 41 (55.4%) | 21 (39.6%) |
| $800 to $1,499 | 0 (0.0%) | 19 (35.8%) |
| Total | 74 (100.0%) | 53 (100.0%) |
Health & Disability in Pueblitos
Health Insurance Coverage by Age in Pueblitos
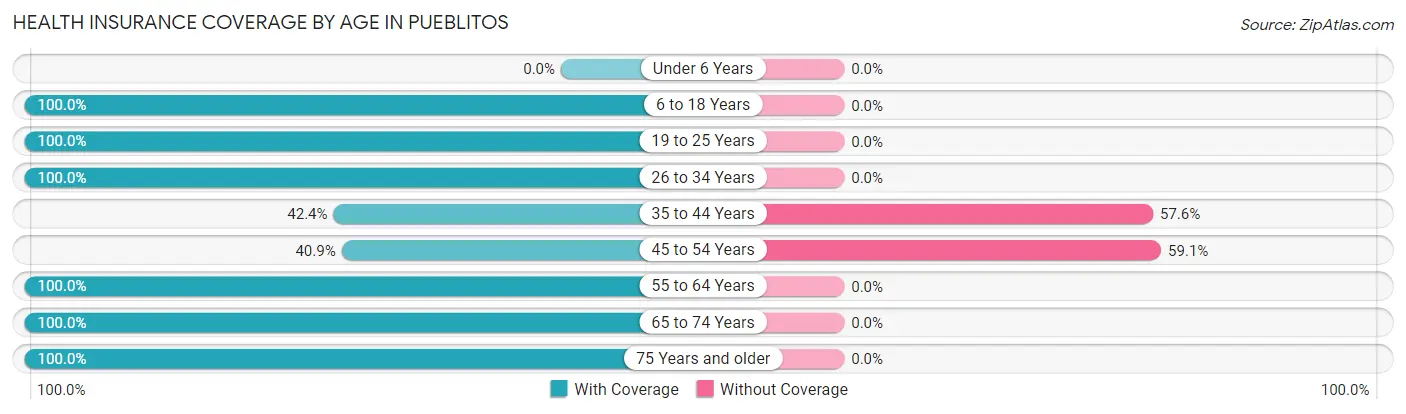
| Age Bracket | With Coverage | Without Coverage |
| Under 6 Years | 0 (0.0%) | 0 (0.0%) |
| 6 to 18 Years | 41 (100.0%) | 0 (0.0%) |
| 19 to 25 Years | 39 (100.0%) | 0 (0.0%) |
| 26 to 34 Years | 69 (100.0%) | 0 (0.0%) |
| 35 to 44 Years | 14 (42.4%) | 19 (57.6%) |
| 45 to 54 Years | 18 (40.9%) | 26 (59.1%) |
| 55 to 64 Years | 66 (100.0%) | 0 (0.0%) |
| 65 to 74 Years | 63 (100.0%) | 0 (0.0%) |
| 75 Years and older | 67 (100.0%) | 0 (0.0%) |
| Total | 377 (89.3%) | 45 (10.7%) |
Health Insurance Coverage by Citizenship Status in Pueblitos
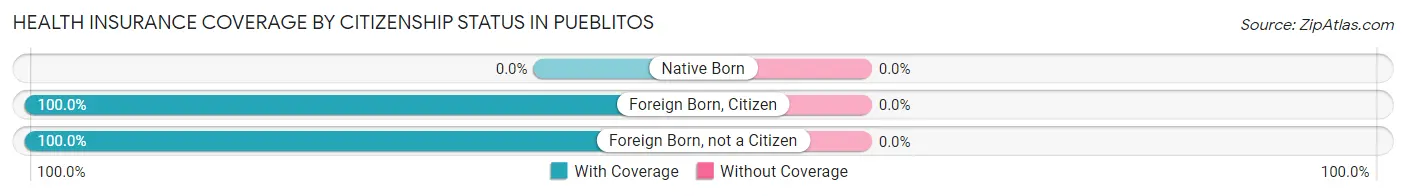
| Citizenship Status | With Coverage | Without Coverage |
| Native Born | 0 (0.0%) | 0 (0.0%) |
| Foreign Born, Citizen | 41 (100.0%) | 0 (0.0%) |
| Foreign Born, not a Citizen | 39 (100.0%) | 0 (0.0%) |
Health Insurance Coverage by Household Income in Pueblitos
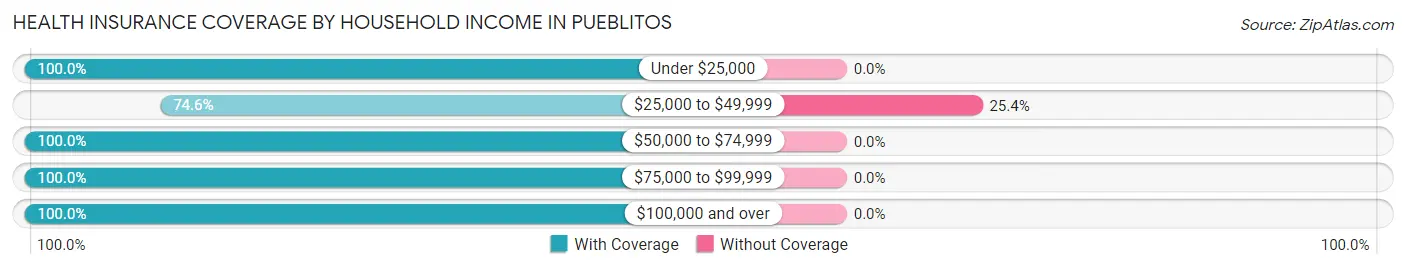
| Household Income | With Coverage | Without Coverage |
| Under $25,000 | 15 (100.0%) | 0 (0.0%) |
| $25,000 to $49,999 | 132 (74.6%) | 45 (25.4%) |
| $50,000 to $74,999 | 67 (100.0%) | 0 (0.0%) |
| $75,000 to $99,999 | 52 (100.0%) | 0 (0.0%) |
| $100,000 and over | 111 (100.0%) | 0 (0.0%) |
Public vs Private Health Insurance Coverage by Age in Pueblitos
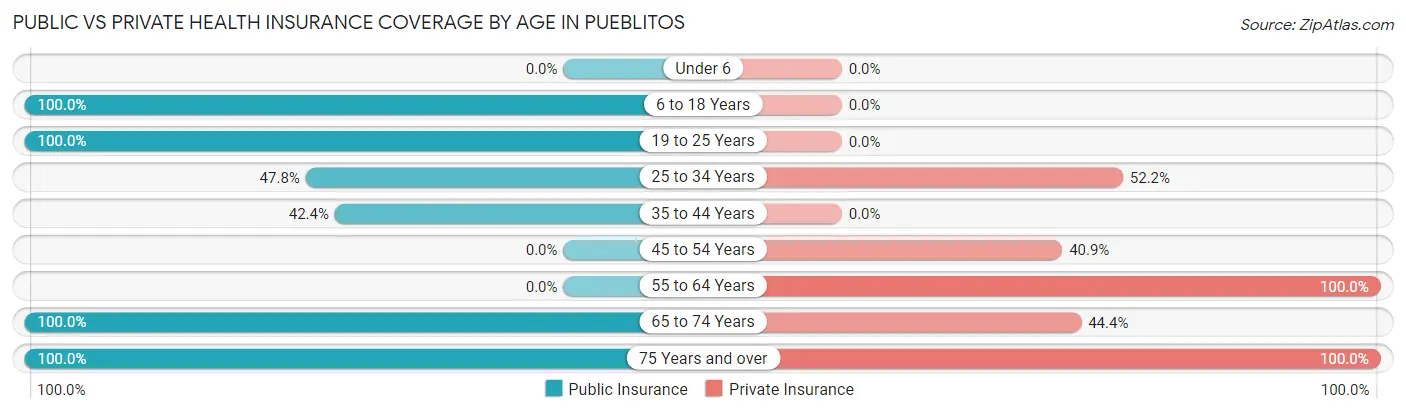
| Age Bracket | Public Insurance | Private Insurance |
| Under 6 | 0 (0.0%) | 0 (0.0%) |
| 6 to 18 Years | 41 (100.0%) | 0 (0.0%) |
| 19 to 25 Years | 39 (100.0%) | 0 (0.0%) |
| 25 to 34 Years | 33 (47.8%) | 36 (52.2%) |
| 35 to 44 Years | 14 (42.4%) | 0 (0.0%) |
| 45 to 54 Years | 0 (0.0%) | 18 (40.9%) |
| 55 to 64 Years | 0 (0.0%) | 66 (100.0%) |
| 65 to 74 Years | 63 (100.0%) | 28 (44.4%) |
| 75 Years and over | 67 (100.0%) | 67 (100.0%) |
| Total | 257 (60.9%) | 215 (50.9%) |
Disability Status by Sex by Age in Pueblitos
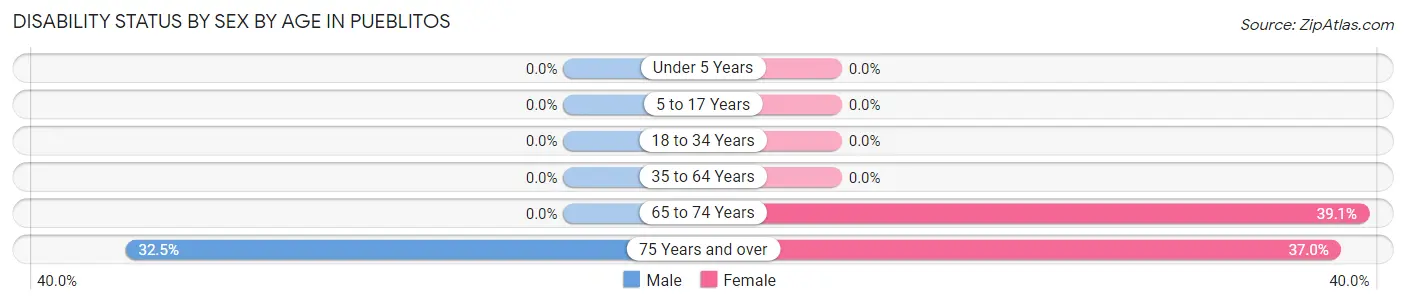
| Age Bracket | Male | Female |
| Under 5 Years | 0 (0.0%) | 0 (0.0%) |
| 5 to 17 Years | 0 (0.0%) | 0 (0.0%) |
| 18 to 34 Years | 0 (0.0%) | 0 (0.0%) |
| 35 to 64 Years | 0 (0.0%) | 0 (0.0%) |
| 65 to 74 Years | 0 (0.0%) | 9 (39.1%) |
| 75 Years and over | 13 (32.5%) | 10 (37.0%) |
Disability Class by Sex by Age in Pueblitos
Disability Class: Hearing Difficulty
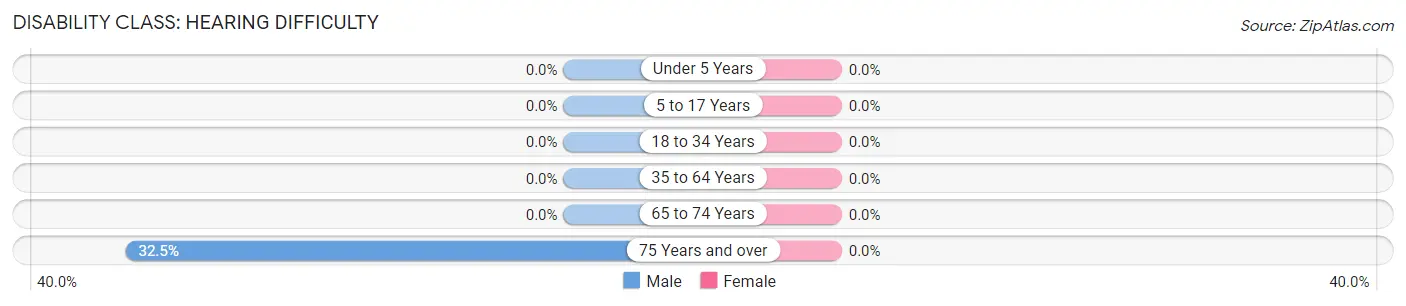
| Age Bracket | Male | Female |
| Under 5 Years | 0 (0.0%) | 0 (0.0%) |
| 5 to 17 Years | 0 (0.0%) | 0 (0.0%) |
| 18 to 34 Years | 0 (0.0%) | 0 (0.0%) |
| 35 to 64 Years | 0 (0.0%) | 0 (0.0%) |
| 65 to 74 Years | 0 (0.0%) | 0 (0.0%) |
| 75 Years and over | 13 (32.5%) | 0 (0.0%) |
Disability Class: Vision Difficulty
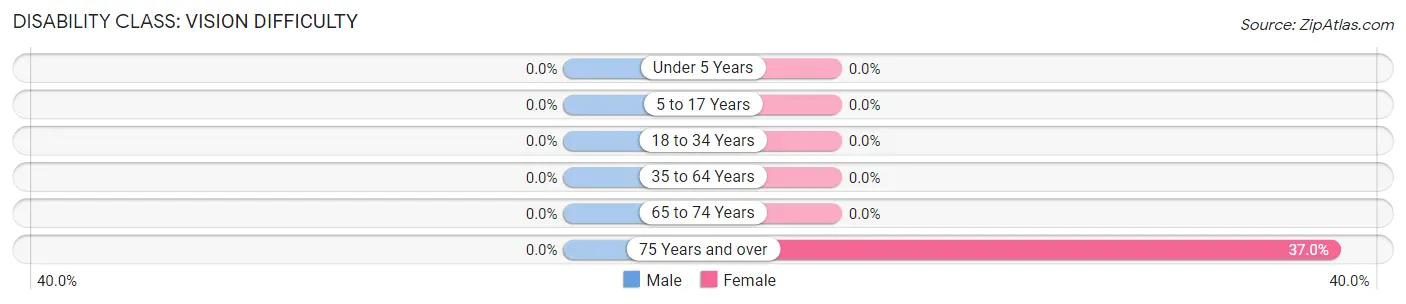
| Age Bracket | Male | Female |
| Under 5 Years | 0 (0.0%) | 0 (0.0%) |
| 5 to 17 Years | 0 (0.0%) | 0 (0.0%) |
| 18 to 34 Years | 0 (0.0%) | 0 (0.0%) |
| 35 to 64 Years | 0 (0.0%) | 0 (0.0%) |
| 65 to 74 Years | 0 (0.0%) | 0 (0.0%) |
| 75 Years and over | 0 (0.0%) | 10 (37.0%) |
Disability Class: Cognitive Difficulty
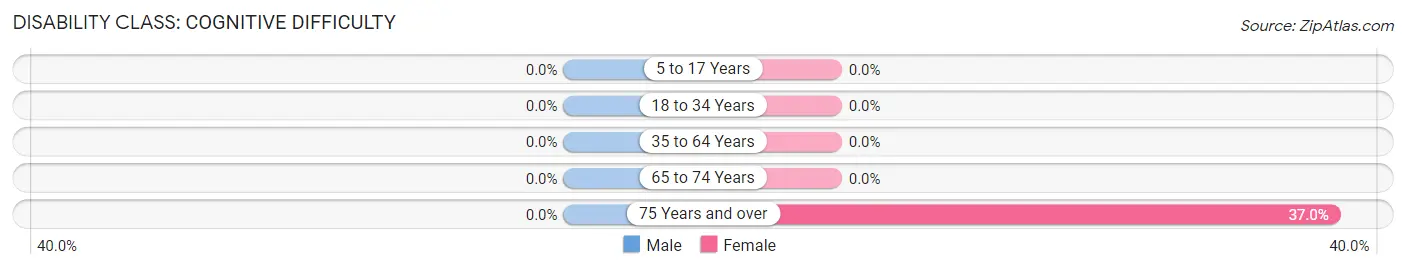
| Age Bracket | Male | Female |
| 5 to 17 Years | 0 (0.0%) | 0 (0.0%) |
| 18 to 34 Years | 0 (0.0%) | 0 (0.0%) |
| 35 to 64 Years | 0 (0.0%) | 0 (0.0%) |
| 65 to 74 Years | 0 (0.0%) | 0 (0.0%) |
| 75 Years and over | 0 (0.0%) | 10 (37.0%) |
Disability Class: Ambulatory Difficulty
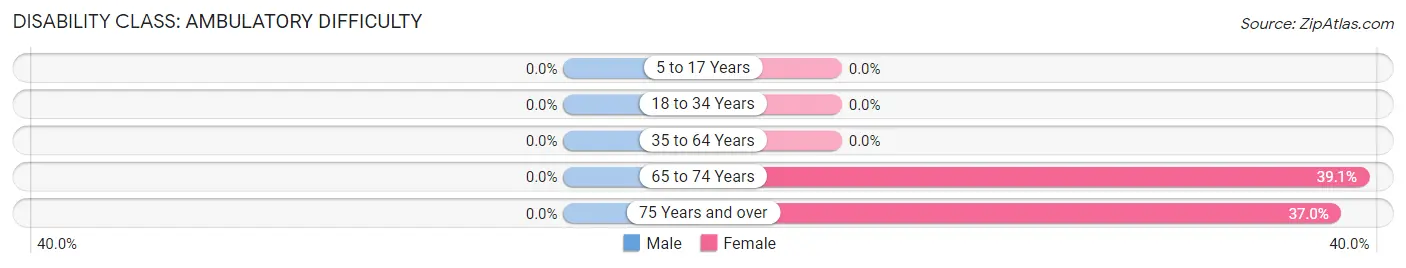
| Age Bracket | Male | Female |
| 5 to 17 Years | 0 (0.0%) | 0 (0.0%) |
| 18 to 34 Years | 0 (0.0%) | 0 (0.0%) |
| 35 to 64 Years | 0 (0.0%) | 0 (0.0%) |
| 65 to 74 Years | 0 (0.0%) | 9 (39.1%) |
| 75 Years and over | 0 (0.0%) | 10 (37.0%) |
Disability Class: Self-Care Difficulty
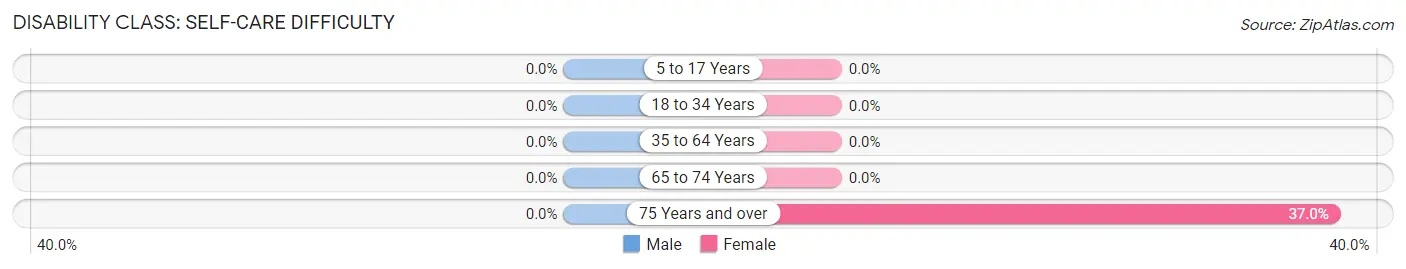
| Age Bracket | Male | Female |
| 5 to 17 Years | 0 (0.0%) | 0 (0.0%) |
| 18 to 34 Years | 0 (0.0%) | 0 (0.0%) |
| 35 to 64 Years | 0 (0.0%) | 0 (0.0%) |
| 65 to 74 Years | 0 (0.0%) | 0 (0.0%) |
| 75 Years and over | 0 (0.0%) | 10 (37.0%) |
Technology Access in Pueblitos
Computing Device Access in Pueblitos
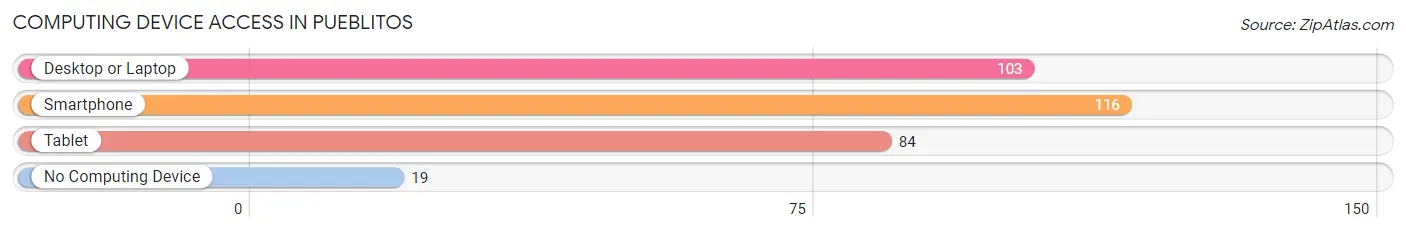
| Device Type | # Households | % Households |
| Desktop or Laptop | 103 | 67.3% |
| Smartphone | 116 | 75.8% |
| Tablet | 84 | 54.9% |
| No Computing Device | 19 | 12.4% |
| Total | 153 | 100.0% |
Internet Access in Pueblitos
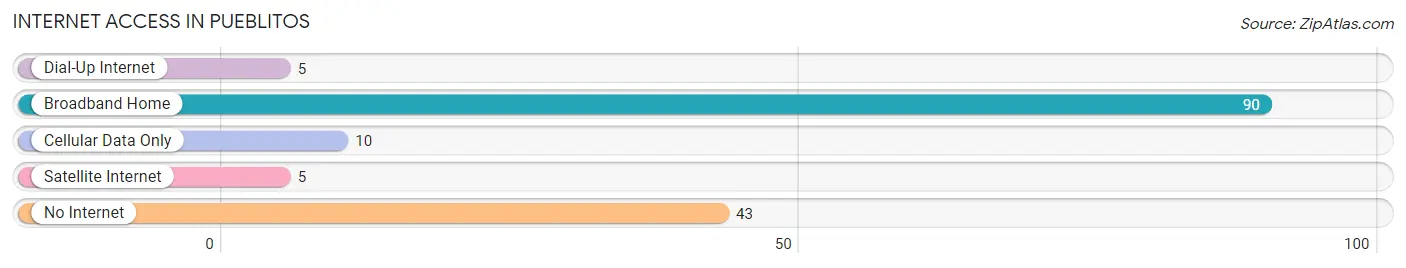
| Internet Type | # Households | % Households |
| Dial-Up Internet | 5 | 3.3% |
| Broadband Home | 90 | 58.8% |
| Cellular Data Only | 10 | 6.5% |
| Satellite Internet | 5 | 3.3% |
| No Internet | 43 | 28.1% |
| Total | 153 | 100.0% |
Pueblitos Summary
Pueblitos, NM is a small unincorporated community located in the northern part of New Mexico. It is situated in the San Juan County, approximately 25 miles south of Farmington. The population of Pueblitos was estimated to be around 200 people in 2020.
History
Pueblitos was first established in the late 1800s by settlers from the nearby Navajo Nation. The community was originally known as “Little Pueblo” due to its small size. The name was later changed to Pueblitos. The community was a small farming and ranching community, and the residents were mostly of Navajo descent.
In the early 1900s, the community was home to a trading post, a post office, and a school. The school was established in 1912 and served the local children until it closed in the 1950s.
Geography
Pueblitos is located in the northern part of New Mexico, in the San Juan County. It is situated at an elevation of 5,890 feet above sea level. The climate in the area is semi-arid, with hot summers and cold winters. The average annual precipitation is around 10 inches.
The landscape of Pueblitos is mostly flat, with some rolling hills. The area is mostly covered in grasslands and shrublands. The nearby Chaco Canyon National Historic Park is a popular tourist destination.
Economy
The economy of Pueblitos is largely based on agriculture and ranching. The local farmers grow a variety of crops, including corn, wheat, and alfalfa. The area is also home to several cattle ranches.
In addition to agriculture, the community is home to several small businesses, including a gas station, a grocery store, and a restaurant. The local residents also work in the nearby cities of Farmington and Aztec.
Demographics
As of 2020, the population of Pueblitos was estimated to be around 200 people. The majority of the population is of Navajo descent. The median household income in the community is around $30,000. The median age is around 40 years old.
The community is served by the San Juan County School District. The local school is Pueblitos Elementary School, which serves students in grades K-8. The school has an enrollment of around 100 students.
Conclusion
Pueblitos, NM is a small unincorporated community located in the northern part of New Mexico. It is situated in the San Juan County, approximately 25 miles south of Farmington. The population of Pueblitos was estimated to be around 200 people in 2020. The economy of the community is largely based on agriculture and ranching, and the majority of the population is of Navajo descent. The community is served by the San Juan County School District, and the local school is Pueblitos Elementary School.
Common Questions
What is Per Capita Income in Pueblitos?
Per Capita income in Pueblitos is $28,976.
What is the Median Family Income in Pueblitos?
Median Family Income in Pueblitos is $62,054.
What is the Median Household income in Pueblitos?
Median Household Income in Pueblitos is $57,361.
What is Inequality or Gini Index in Pueblitos?
Inequality or Gini Index in Pueblitos is 0.37.
What is the Total Population of Pueblitos?
Total Population of Pueblitos is 422.
What is the Total Male Population of Pueblitos?
Total Male Population of Pueblitos is 223.
What is the Total Female Population of Pueblitos?
Total Female Population of Pueblitos is 199.
What is the Ratio of Males per 100 Females in Pueblitos?
There are 112.06 Males per 100 Females in Pueblitos.
What is the Ratio of Females per 100 Males in Pueblitos?
There are 89.24 Females per 100 Males in Pueblitos.
What is the Median Population Age in Pueblitos?
Median Population Age in Pueblitos is 54.2 Years.
What is the Average Family Size in Pueblitos
Average Family Size in Pueblitos is 3.1 People.
What is the Average Household Size in Pueblitos
Average Household Size in Pueblitos is 2.8 People.
How Large is the Labor Force in Pueblitos?
There are 270 People in the Labor Forcein in Pueblitos.
What is the Percentage of People in the Labor Force in Pueblitos?
70.9% of People are in the Labor Force in Pueblitos.
What is the Unemployment Rate in Pueblitos?
Unemployment Rate in Pueblitos is 17.8%.