Zip Codes with the Highest Percentage of Population Employed in Legal Services & Support in the United States
RELATED REPORTS & OPTIONS
Legal Services & Support
United States
Compare Zip Codes
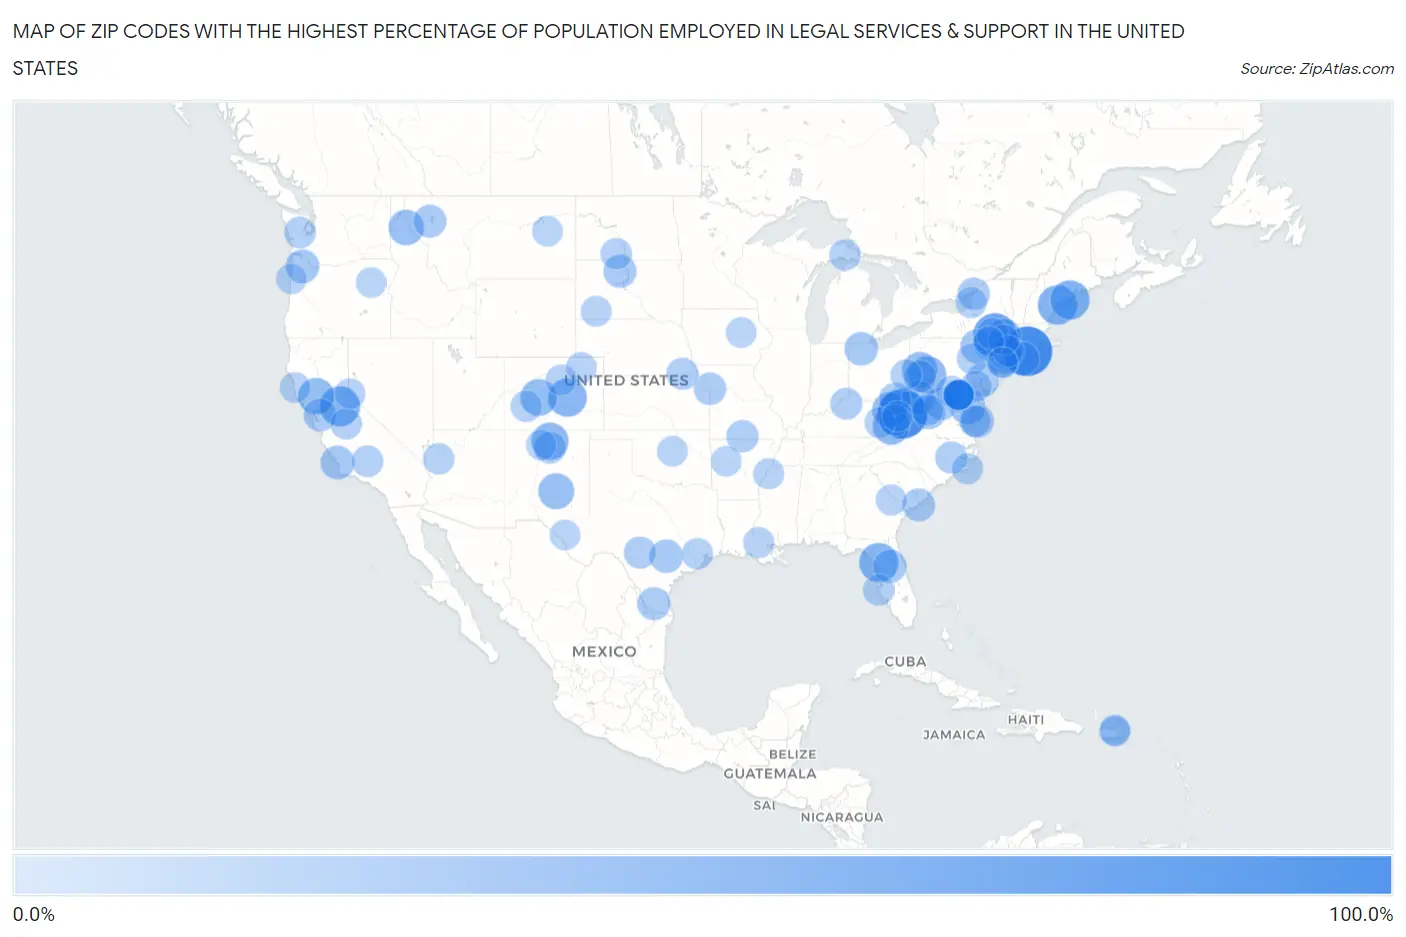
Map of Zip Codes with the Highest Percentage of Population Employed in Legal Services & Support in the United States
0.0%
100.0%
Zip Codes with the Highest Percentage of Population Employed in Legal Services & Support in the United States
| Zip Code | % Employed | vs State | vs National | |
| 1. | 06376 | 100.0% | 1.4%(+98.6)#1 | 1.2%(+98.8)#1 |
| 2. | 25936 | 100.0% | 1.1%(+98.9)#1 | 1.2%(+98.8)#2 |
| 3. | 12441 | 71.8% | 1.9%(+69.9)#1 | 1.2%(+70.6)#3 |
| 4. | 95232 | 56.5% | 1.3%(+55.3)#1 | 1.2%(+55.3)#4 |
| 5. | 04019 | 53.3% | 0.95%(+52.4)#1 | 1.2%(+52.1)#5 |
| 6. | 04855 | 53.1% | 0.95%(+52.2)#2 | 1.2%(+52.0)#6 |
| 7. | 32639 | 52.5% | 1.3%(+51.2)#1 | 1.2%(+51.4)#7 |
| 8. | 80929 | 50.0% | 1.2%(+48.8)#1 | 1.2%(+48.8)#8 |
| 9. | 15502 | 45.3% | 1.1%(+44.1)#1 | 1.2%(+44.1)#9 |
| 10. | 87517 | 44.0% | 1.3%(+42.6)#1 | 1.2%(+42.8)#10 |
| 11. | 24657 | 42.1% | 1.6%(+40.5)#1 | 1.2%(+40.9)#11 |
| 12. | 81210 | 41.7% | 1.2%(+40.6)#2 | 1.2%(+40.6)#12 |
| 13. | 95679 | 40.4% | 1.3%(+39.1)#2 | 1.2%(+39.2)#13 |
| 14. | 20688 | 38.0% | 1.8%(+36.2)#1 | 1.2%(+36.8)#14 |
| 15. | 88338 | 37.9% | 1.3%(+36.6)#2 | 1.2%(+36.7)#15 |
| 16. | 15047 | 37.7% | 1.1%(+36.5)#2 | 1.2%(+36.5)#16 |
| 17. | 25565 | 36.7% | 1.1%(+35.6)#2 | 1.2%(+35.5)#17 |
| 18. | 83867 | 35.8% | 0.88%(+34.9)#1 | 1.2%(+34.6)#18 |
| 19. | 10503 | 35.6% | 1.9%(+33.7)#2 | 1.2%(+34.4)#19 |
| 20. | 12453 | 33.9% | 1.9%(+32.0)#3 | 1.2%(+32.7)#20 |
| 21. | 18440 | 29.5% | 1.1%(+28.4)#3 | 1.2%(+28.4)#21 |
| 22. | 11970 | 29.2% | 1.9%(+27.3)#4 | 1.2%(+28.0)#22 |
| 23. | 93424 | 28.6% | 1.3%(+27.4)#3 | 1.2%(+27.5)#23 |
| 24. | 10535 | 28.6% | 1.9%(+26.7)#5 | 1.2%(+27.4)#24 |
| 25. | 97125 | 27.6% | 1.1%(+26.5)#1 | 1.2%(+26.4)#25 |
| 26. | 43510 | 27.3% | 0.92%(+26.3)#1 | 1.2%(+26.1)#26 |
| 27. | 22211 | 26.7% | 1.6%(+25.0)#2 | 1.2%(+25.5)#27 |
| 28. | 78658 | 26.7% | 1.0%(+25.7)#1 | 1.2%(+25.5)#28 |
| 29. | 26259 | 26.7% | 1.1%(+25.6)#3 | 1.2%(+25.5)#29 |
| 30. | 24476 | 26.4% | 1.6%(+24.8)#3 | 1.2%(+25.2)#30 |
| 31. | 32133 | 26.3% | 1.3%(+25.0)#2 | 1.2%(+25.2)#31 |
| 32. | 08014 | 26.2% | 1.5%(+24.7)#1 | 1.2%(+25.0)#32 |
| 33. | 20004 | 26.0% | 8.4%(+17.6)#1 | 1.2%(+24.8)#33 |
| 34. | 57630 | 25.0% | 0.65%(+24.4)#1 | 1.2%(+23.8)#34 |
| 35. | 23423 | 24.8% | 1.6%(+23.1)#4 | 1.2%(+23.6)#35 |
| 36. | 22711 | 24.6% | 1.6%(+23.0)#5 | 1.2%(+23.4)#36 |
| 37. | 78591 | 24.5% | 1.0%(+23.5)#2 | 1.2%(+23.3)#37 |
| 38. | 59910 | 24.5% | 0.99%(+23.5)#1 | 1.2%(+23.3)#38 |
| 39. | 94528 | 24.3% | 1.3%(+23.1)#4 | 1.2%(+23.1)#39 |
| 40. | 29439 | 24.0% | 0.97%(+23.1)#1 | 1.2%(+22.9)#40 |
| 41. | 64165 | 22.0% | 0.99%(+21.0)#1 | 1.2%(+20.8)#41 |
| 42. | 13692 | 21.8% | 1.9%(+19.9)#6 | 1.2%(+20.6)#42 |
| 43. | 78885 | 21.4% | 1.0%(+20.4)#3 | 1.2%(+20.2)#43 |
| 44. | 65760 | 21.1% | 0.99%(+20.1)#2 | 1.2%(+19.9)#44 |
| 45. | 12752 | 20.6% | 1.9%(+18.7)#7 | 1.2%(+19.4)#45 |
| 46. | 87578 | 20.3% | 1.3%(+19.0)#3 | 1.2%(+19.1)#46 |
| 47. | 15449 | 20.1% | 1.1%(+19.0)#4 | 1.2%(+18.9)#47 |
| 48. | 40036 | 20.0% | 0.95%(+19.1)#1 | 1.2%(+18.8)#48 |
| 49. | 68381 | 20.0% | 0.82%(+19.2)#1 | 1.2%(+18.8)#49 |
| 50. | 25244 | 19.8% | 1.1%(+18.7)#4 | 1.2%(+18.6)#50 |
| 51. | 28554 | 19.7% | 0.86%(+18.8)#1 | 1.2%(+18.5)#51 |
| 52. | 20036 | 19.4% | 8.4%(+11.1)#2 | 1.2%(+18.3)#52 |
| 53. | 12459 | 19.2% | 1.9%(+17.4)#8 | 1.2%(+18.0)#53 |
| 54. | 20015 | 19.2% | 8.4%(+10.8)#3 | 1.2%(+18.0)#54 |
| 55. | 98560 | 18.9% | 1.1%(+17.8)#1 | 1.2%(+17.7)#55 |
| 56. | 24479 | 18.6% | 1.6%(+17.0)#6 | 1.2%(+17.4)#56 |
| 57. | 93531 | 18.6% | 1.3%(+17.3)#5 | 1.2%(+17.4)#57 |
| 58. | 23354 | 18.1% | 1.6%(+16.5)#7 | 1.2%(+16.9)#58 |
| 59. | 34216 | 17.7% | 1.3%(+16.4)#3 | 1.2%(+16.5)#59 |
| 60. | 58569 | 17.6% | 0.59%(+17.1)#1 | 1.2%(+16.5)#60 |
| 61. | 10006 | 17.6% | 1.9%(+15.7)#9 | 1.2%(+16.4)#61 |
| 62. | 95306 | 17.6% | 1.3%(+16.3)#6 | 1.2%(+16.4)#62 |
| 63. | 81220 | 17.5% | 1.2%(+16.3)#3 | 1.2%(+16.3)#63 |
| 64. | 24874 | 17.4% | 1.1%(+16.3)#5 | 1.2%(+16.2)#64 |
| 65. | 86437 | 17.4% | 0.99%(+16.4)#1 | 1.2%(+16.2)#65 |
| 66. | 77046 | 17.1% | 1.0%(+16.1)#4 | 1.2%(+15.9)#66 |
| 67. | 13651 | 17.1% | 1.9%(+15.2)#10 | 1.2%(+15.9)#67 |
| 68. | 49793 | 17.1% | 0.89%(+16.2)#1 | 1.2%(+15.9)#68 |
| 69. | 18256 | 16.9% | 1.1%(+15.8)#5 | 1.2%(+15.8)#69 |
| 70. | 28524 | 16.9% | 0.86%(+16.0)#2 | 1.2%(+15.7)#70 |
| 71. | 43934 | 16.7% | 0.92%(+15.7)#2 | 1.2%(+15.5)#71 |
| 72. | 70801 | 16.0% | 1.3%(+14.7)#1 | 1.2%(+14.8)#72 |
| 73. | 10597 | 16.0% | 1.9%(+14.1)#11 | 1.2%(+14.8)#73 |
| 74. | 38626 | 15.7% | 0.75%(+14.9)#1 | 1.2%(+14.5)#74 |
| 75. | 21912 | 15.7% | 1.8%(+13.9)#2 | 1.2%(+14.5)#75 |
| 76. | 30456 | 15.5% | 1.1%(+14.4)#1 | 1.2%(+14.3)#76 |
| 77. | 80290 | 15.4% | 1.2%(+14.2)#4 | 1.2%(+14.2)#77 |
| 78. | 00906 | 15.3% | 1.0%(+14.3)#1 | 1.2%(+14.1)#78 |
| 79. | 41631 | 15.2% | 0.95%(+14.3)#2 | 1.2%(+14.1)#79 |
| 80. | 20129 | 15.2% | 1.6%(+13.6)#8 | 1.2%(+14.0)#80 |
| 81. | 12574 | 15.2% | 1.9%(+13.3)#12 | 1.2%(+14.0)#81 |
| 82. | 57772 | 14.9% | 0.65%(+14.3)#2 | 1.2%(+13.7)#82 |
| 83. | 80750 | 14.8% | 1.2%(+13.6)#5 | 1.2%(+13.6)#83 |
| 84. | 95420 | 14.6% | 1.3%(+13.3)#7 | 1.2%(+13.4)#84 |
| 85. | 89411 | 14.5% | 0.99%(+13.6)#1 | 1.2%(+13.4)#85 |
| 86. | 73058 | 14.5% | 1.0%(+13.5)#1 | 1.2%(+13.3)#86 |
| 87. | 25839 | 14.4% | 1.1%(+13.3)#6 | 1.2%(+13.2)#87 |
| 88. | 59214 | 14.3% | 0.99%(+13.3)#2 | 1.2%(+13.1)#88 |
| 89. | 20008 | 14.2% | 8.4%(+5.87)#4 | 1.2%(+13.0)#89 |
| 90. | 00968 | 14.2% | 1.0%(+13.2)#2 | 1.2%(+13.0)#90 |
| 91. | 97364 | 14.0% | 1.1%(+12.9)#2 | 1.2%(+12.9)#91 |
| 92. | 72851 | 14.0% | 0.79%(+13.2)#1 | 1.2%(+12.8)#92 |
| 93. | 12724 | 14.0% | 1.9%(+12.1)#13 | 1.2%(+12.8)#93 |
| 94. | 50612 | 13.9% | 0.75%(+13.2)#1 | 1.2%(+12.7)#94 |
| 95. | 20815 | 13.8% | 1.8%(+12.0)#3 | 1.2%(+12.6)#95 |
| 96. | 97877 | 13.8% | 1.1%(+12.7)#3 | 1.2%(+12.6)#96 |
| 97. | 79855 | 13.8% | 1.0%(+12.8)#5 | 1.2%(+12.6)#97 |
| 98. | 20816 | 13.6% | 1.8%(+11.8)#4 | 1.2%(+12.4)#98 |
| 99. | 10004 | 13.6% | 1.9%(+11.7)#14 | 1.2%(+12.4)#99 |
| 100. | 87516 | 13.4% | 1.3%(+12.1)#4 | 1.2%(+12.2)#100 |
Common Questions
What are the Top 10 Zip Codes with the Highest Percentage of Population Employed in Legal Services & Support in the United States?
Top 10 Zip Codes with the Highest Percentage of Population Employed in Legal Services & Support in the United States are:
#1
100.0%
#2
100.0%
#3
71.8%
#4
56.5%
#5
53.3%
#6
53.1%
#7
52.5%
#8
50.0%
#9
45.3%
#10
44.0%
What zip code has the Highest Percentage of Population Employed in Legal Services & Support in the United States?
06376 has the Highest Percentage of Population Employed in Legal Services & Support in the United States with 100.0%.
What is the Percentage of Population Employed in Legal Services & Support in the United States?
Percentage of Population Employed in Legal Services & Support in the United States is 1.2%.