Skyland, NV Map & Demographics
Skyland Map
Skyland Overview
$67,083
PER CAPITA INCOME
$84,130
AVG FAMILY INCOME
$82,772
AVG HOUSEHOLD INCOME
0.48
INEQUALITY / GINI INDEX
396
TOTAL POPULATION
235
MALE POPULATION
161
FEMALE POPULATION
145.96
MALES / 100 FEMALES
68.51
FEMALES / 100 MALES
60.8
MEDIAN AGE
2.2
AVG FAMILY SIZE
1.9
AVG HOUSEHOLD SIZE
119
LABOR FORCE [ PEOPLE ]
32.0%
PERCENT IN LABOR FORCE
Income in Skyland
Income Overview in Skyland
Per Capita Income in Skyland is $67,083, while median incomes of families and households are $84,130 and $82,772 respectively.
| Characteristic | Number | Measure |
| Per Capita Income | 396 | $67,083 |
| Median Family Income | 160 | $84,130 |
| Mean Family Income | 160 | $138,210 |
| Median Household Income | 205 | $82,772 |
| Mean Household Income | 205 | $120,983 |
| Income Deficit | 160 | $0 |
| Wage / Income Gap (%) | 396 | 0.00% |
| Wage / Income Gap ($) | 396 | 100.00¢ per $1 |
| Gini / Inequality Index | 396 | 0.48 |
Earnings by Sex in Skyland
| Sex | Number | Average Earnings |
| Male | 111 (86.1%) | $0 |
| Female | 18 (14.0%) | $0 |
| Total | 129 (100.0%) | $0 |
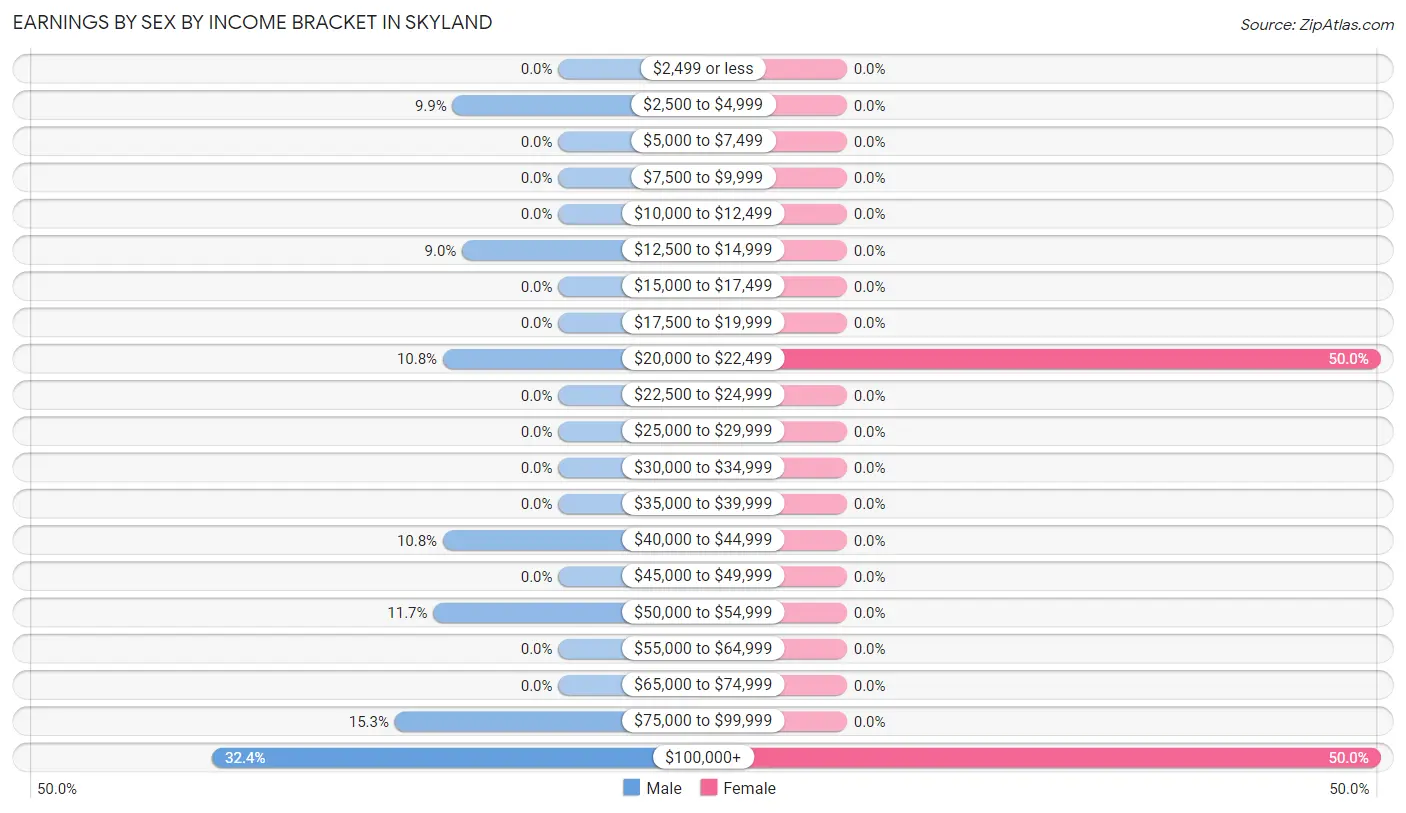
Earnings by Sex by Income Bracket in Skyland
The most common earnings brackets in Skyland are $100,000+ for men (36 | 32.4%) and $20,000 to $22,499 for women (9 | 50.0%).
| Income | Male | Female |
| $2,499 or less | 0 (0.0%) | 0 (0.0%) |
| $2,500 to $4,999 | 11 (9.9%) | 0 (0.0%) |
| $5,000 to $7,499 | 0 (0.0%) | 0 (0.0%) |
| $7,500 to $9,999 | 0 (0.0%) | 0 (0.0%) |
| $10,000 to $12,499 | 0 (0.0%) | 0 (0.0%) |
| $12,500 to $14,999 | 10 (9.0%) | 0 (0.0%) |
| $15,000 to $17,499 | 0 (0.0%) | 0 (0.0%) |
| $17,500 to $19,999 | 0 (0.0%) | 0 (0.0%) |
| $20,000 to $22,499 | 12 (10.8%) | 9 (50.0%) |
| $22,500 to $24,999 | 0 (0.0%) | 0 (0.0%) |
| $25,000 to $29,999 | 0 (0.0%) | 0 (0.0%) |
| $30,000 to $34,999 | 0 (0.0%) | 0 (0.0%) |
| $35,000 to $39,999 | 0 (0.0%) | 0 (0.0%) |
| $40,000 to $44,999 | 12 (10.8%) | 0 (0.0%) |
| $45,000 to $49,999 | 0 (0.0%) | 0 (0.0%) |
| $50,000 to $54,999 | 13 (11.7%) | 0 (0.0%) |
| $55,000 to $64,999 | 0 (0.0%) | 0 (0.0%) |
| $65,000 to $74,999 | 0 (0.0%) | 0 (0.0%) |
| $75,000 to $99,999 | 17 (15.3%) | 0 (0.0%) |
| $100,000+ | 36 (32.4%) | 9 (50.0%) |
| Total | 111 (100.0%) | 18 (100.0%) |
Earnings by Sex by Educational Attainment in Skyland
| Educational Attainment | Male Income | Female Income |
| Less than High School | - | - |
| High School Diploma | - | - |
| College or Associate's Degree | - | - |
| Bachelor's Degree | - | - |
| Graduate Degree | - | - |
| Total | - | - |
Family Income in Skyland
Family Income Brackets in Skyland
According to the Skyland family income data, there are 45 families falling into the $200,000+ income range, which is the most common income bracket and makes up 28.1% of all families.
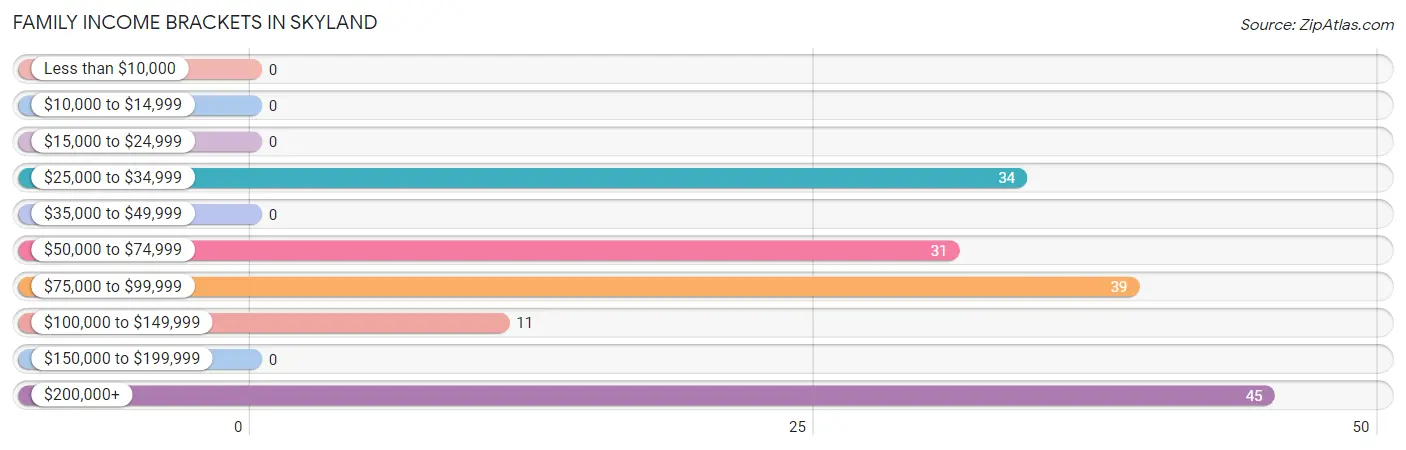
| Income Bracket | # Families | % Families |
| Less than $10,000 | 0 | 0.0% |
| $10,000 to $14,999 | 0 | 0.0% |
| $15,000 to $24,999 | 0 | 0.0% |
| $25,000 to $34,999 | 34 | 21.3% |
| $35,000 to $49,999 | 0 | 0.0% |
| $50,000 to $74,999 | 31 | 19.4% |
| $75,000 to $99,999 | 39 | 24.4% |
| $100,000 to $149,999 | 11 | 6.9% |
| $150,000 to $199,999 | 0 | 0.0% |
| $200,000+ | 45 | 28.1% |
Family Income by Famaliy Size in Skyland
2-person families (141 | 88.1%) account for the highest median family income in Skyland with $83,098 per family, while 2-person families (141 | 88.1%) have the highest median income of $41,549 per family member.
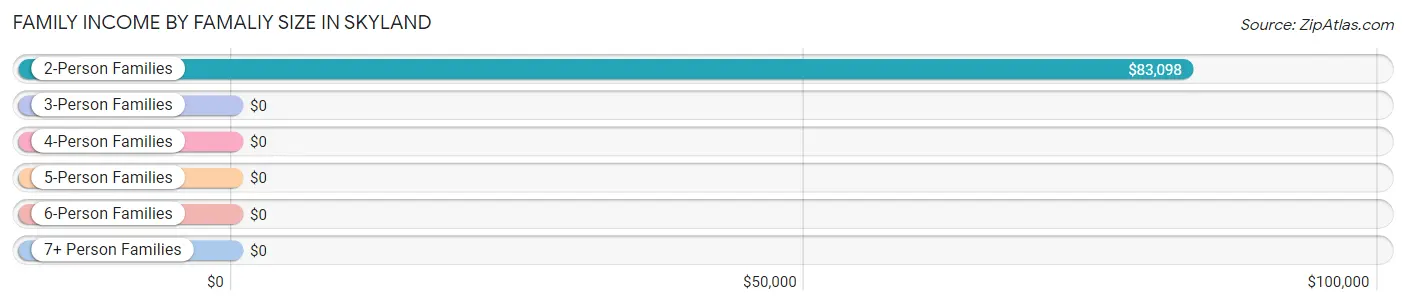
| Income Bracket | # Families | Median Income |
| 2-Person Families | 141 (88.1%) | $83,098 |
| 3-Person Families | 11 (6.9%) | $0 |
| 4-Person Families | 8 (5.0%) | $0 |
| 5-Person Families | 0 (0.0%) | $0 |
| 6-Person Families | 0 (0.0%) | $0 |
| 7+ Person Families | 0 (0.0%) | $0 |
| Total | 160 (100.0%) | $84,130 |
Family Income by Number of Earners in Skyland
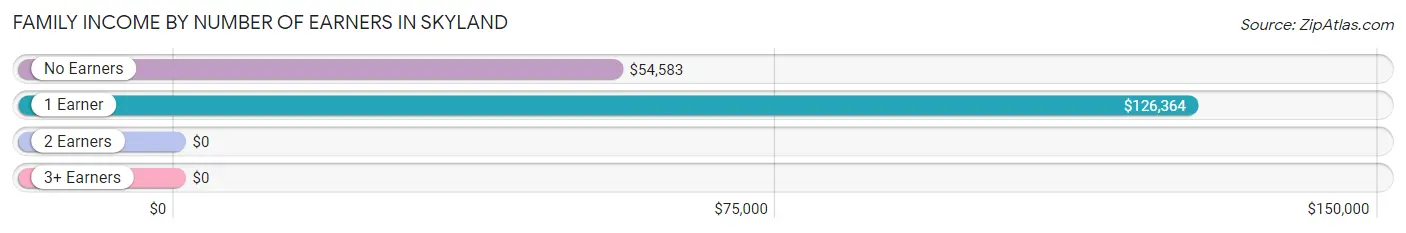
| Number of Earners | # Families | Median Income |
| No Earners | 85 (53.1%) | $54,583 |
| 1 Earner | 50 (31.2%) | $126,364 |
| 2 Earners | 25 (15.6%) | $0 |
| 3+ Earners | 0 (0.0%) | $0 |
| Total | 160 (100.0%) | $84,130 |
Household Income in Skyland
Household Income Brackets in Skyland
With 45 households falling in the category, the $200,000+ income range is the most frequent in Skyland, accounting for 22.0% of all households.
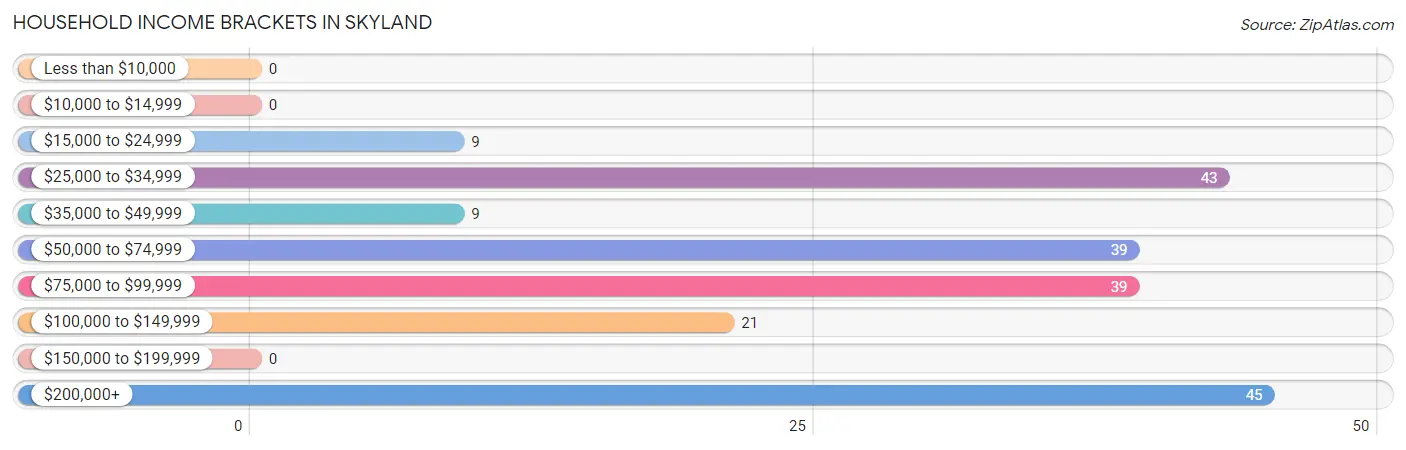
| Income Bracket | # Households | % Households |
| Less than $10,000 | 0 | 0.0% |
| $10,000 to $14,999 | 0 | 0.0% |
| $15,000 to $24,999 | 9 | 4.4% |
| $25,000 to $34,999 | 43 | 21.0% |
| $35,000 to $49,999 | 9 | 4.4% |
| $50,000 to $74,999 | 39 | 19.0% |
| $75,000 to $99,999 | 39 | 19.0% |
| $100,000 to $149,999 | 21 | 10.2% |
| $150,000 to $199,999 | 0 | 0.0% |
| $200,000+ | 45 | 22.0% |
Household Income by Householder Age in Skyland
The median household income in Skyland is $82,772, with the highest median household income of $59,615 found in the 65+ years age bracket for the primary householder. A total of 108 households (52.7%) fall into this category.
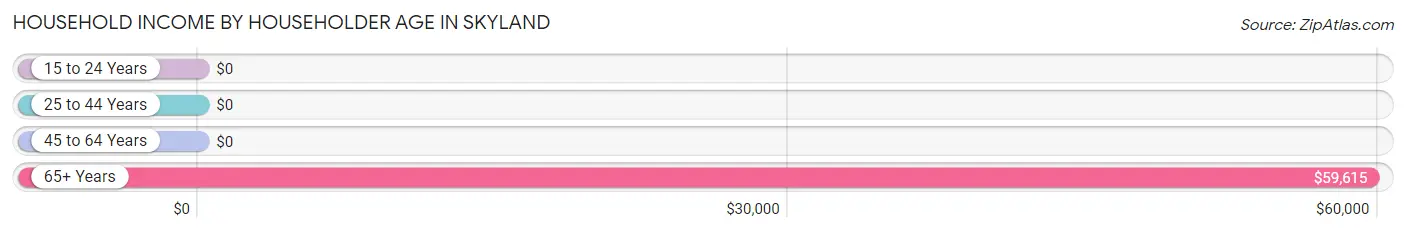
| Income Bracket | # Households | Median Income |
| 15 to 24 Years | 0 (0.0%) | $0 |
| 25 to 44 Years | 8 (3.9%) | $0 |
| 45 to 64 Years | 89 (43.4%) | $0 |
| 65+ Years | 108 (52.7%) | $59,615 |
| Total | 205 (100.0%) | $82,772 |
Poverty in Skyland
Income Below Poverty by Sex and Age in Skyland
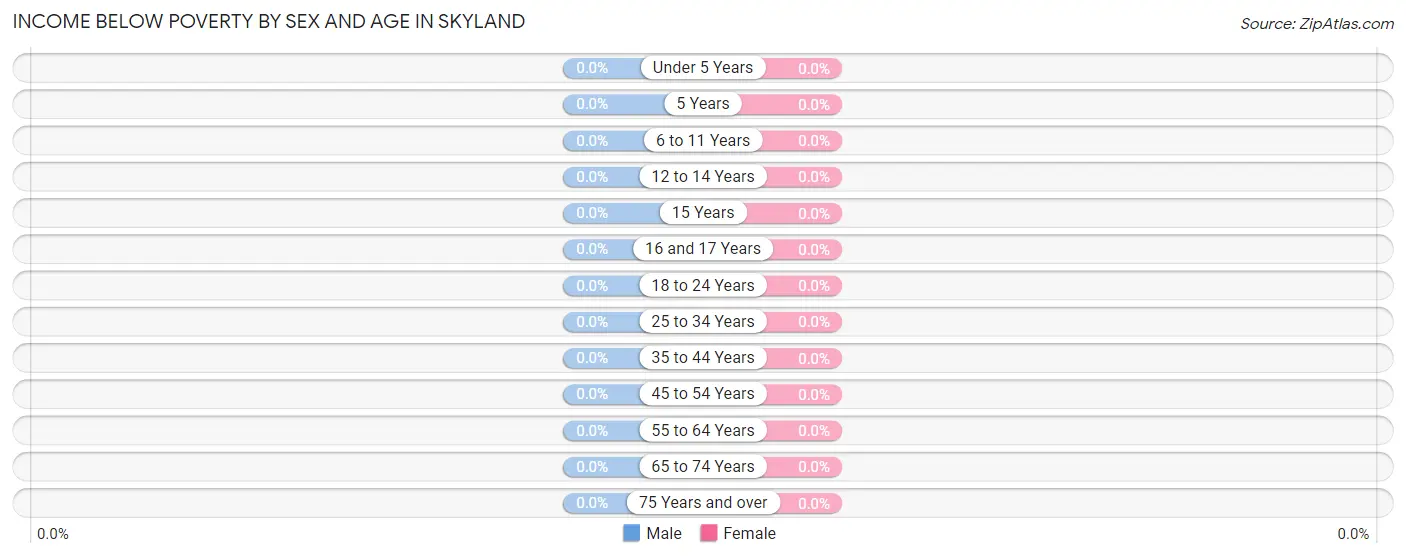
| Age Bracket | Male | Female |
| Under 5 Years | 0 (0.0%) | 0 (0.0%) |
| 5 Years | 0 (0.0%) | 0 (0.0%) |
| 6 to 11 Years | 0 (0.0%) | 0 (0.0%) |
| 12 to 14 Years | 0 (0.0%) | 0 (0.0%) |
| 15 Years | 0 (0.0%) | 0 (0.0%) |
| 16 and 17 Years | 0 (0.0%) | 0 (0.0%) |
| 18 to 24 Years | 0 (0.0%) | 0 (0.0%) |
| 25 to 34 Years | 0 (0.0%) | 0 (0.0%) |
| 35 to 44 Years | 0 (0.0%) | 0 (0.0%) |
| 45 to 54 Years | 0 (0.0%) | 0 (0.0%) |
| 55 to 64 Years | 0 (0.0%) | 0 (0.0%) |
| 65 to 74 Years | 0 (0.0%) | 0 (0.0%) |
| 75 Years and over | 0 (0.0%) | 0 (0.0%) |
| Total | 0 (0.0%) | 0 (0.0%) |
Income Above Poverty by Sex and Age in Skyland
According to the poverty statistics in Skyland, males aged 6 to 11 years and females aged 12 to 14 years are the age groups that are most secure financially, with 100.0% of males and 100.0% of females in these age groups living above the poverty line.
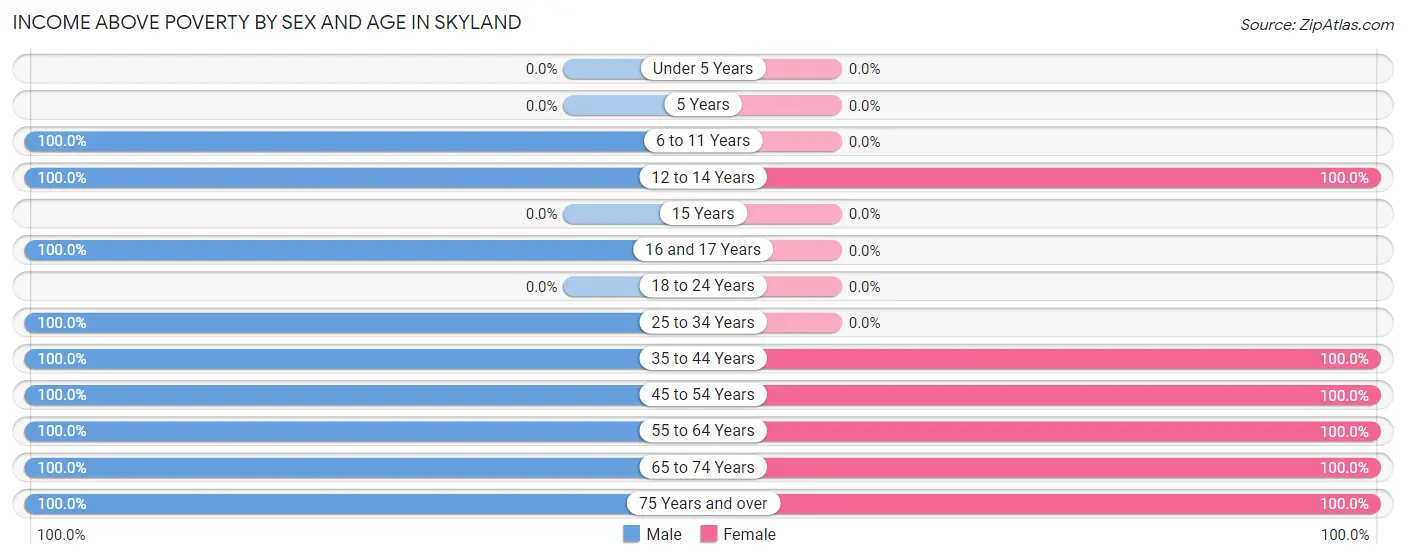
| Age Bracket | Male | Female |
| Under 5 Years | 0 (0.0%) | 0 (0.0%) |
| 5 Years | 0 (0.0%) | 0 (0.0%) |
| 6 to 11 Years | 8 (100.0%) | 0 (0.0%) |
| 12 to 14 Years | 5 (100.0%) | 11 (100.0%) |
| 15 Years | 0 (0.0%) | 0 (0.0%) |
| 16 and 17 Years | 36 (100.0%) | 0 (0.0%) |
| 18 to 24 Years | 0 (0.0%) | 0 (0.0%) |
| 25 to 34 Years | 12 (100.0%) | 0 (0.0%) |
| 35 to 44 Years | 8 (100.0%) | 9 (100.0%) |
| 45 to 54 Years | 36 (100.0%) | 43 (100.0%) |
| 55 to 64 Years | 49 (100.0%) | 27 (100.0%) |
| 65 to 74 Years | 37 (100.0%) | 43 (100.0%) |
| 75 Years and over | 44 (100.0%) | 28 (100.0%) |
| Total | 235 (100.0%) | 161 (100.0%) |
Income Below Poverty Among Married-Couple Families in Skyland
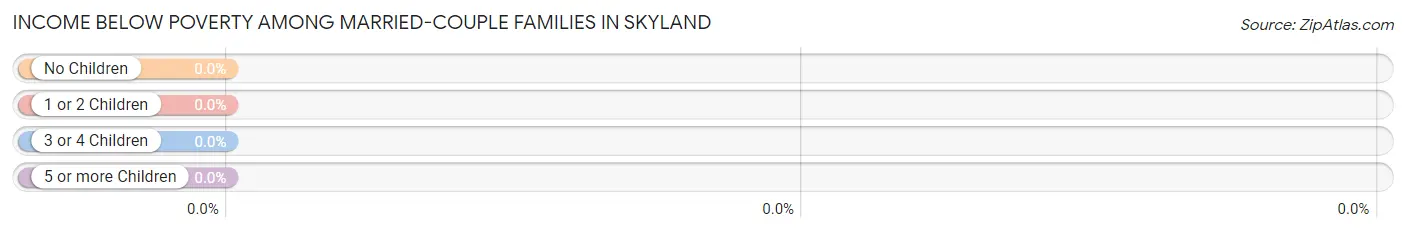
| Children | Above Poverty | Below Poverty |
| No Children | 100 (100.0%) | 0 (0.0%) |
| 1 or 2 Children | 8 (100.0%) | 0 (0.0%) |
| 3 or 4 Children | 0 (0.0%) | 0 (0.0%) |
| 5 or more Children | 0 (0.0%) | 0 (0.0%) |
| Total | 108 (100.0%) | 0 (0.0%) |
Income Below Poverty Among Single-Parent Households in Skyland
| Children | Single Father | Single Mother |
| No Children | 0 (0.0%) | 0 (0.0%) |
| 1 or 2 Children | 0 (0.0%) | 0 (0.0%) |
| 3 or 4 Children | 0 (0.0%) | 0 (0.0%) |
| 5 or more Children | 0 (0.0%) | 0 (0.0%) |
| Total | 0 (0.0%) | 0 (0.0%) |
Income Below Poverty Among Married-Couple vs Single-Parent Households in Skyland
| Children | Married-Couple Families | Single-Parent Households |
| No Children | 0 (0.0%) | 0 (0.0%) |
| 1 or 2 Children | 0 (0.0%) | 0 (0.0%) |
| 3 or 4 Children | 0 (0.0%) | 0 (0.0%) |
| 5 or more Children | 0 (0.0%) | 0 (0.0%) |
| Total | 0 (0.0%) | 0 (0.0%) |
Race in Skyland
The most populous races in Skyland are White / Caucasian (321 | 81.1%), Asian (53 | 13.4%), and Hispanic or Latino (43 | 10.9%).
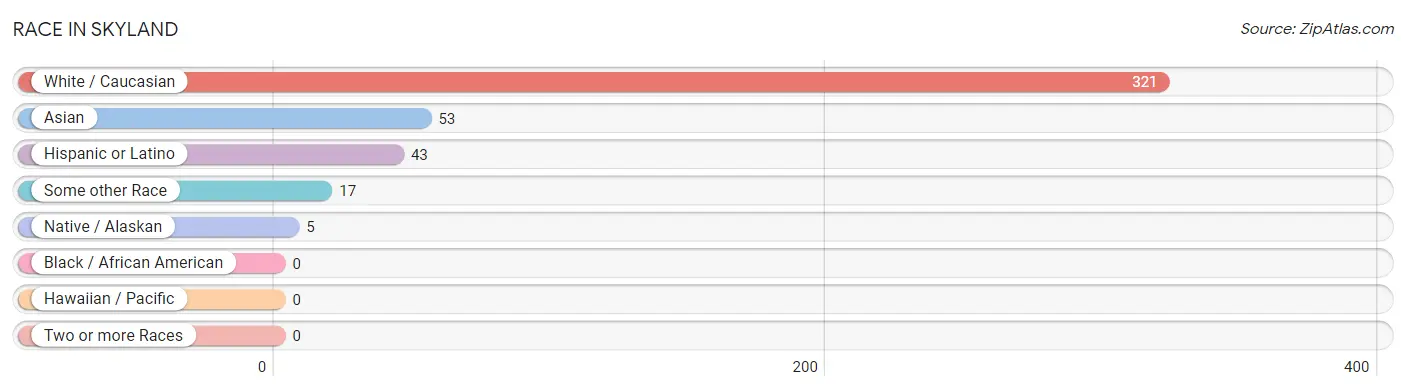
| Race | # Population | % Population |
| Asian | 53 | 13.4% |
| Black / African American | 0 | 0.0% |
| Hawaiian / Pacific | 0 | 0.0% |
| Hispanic or Latino | 43 | 10.9% |
| Native / Alaskan | 5 | 1.3% |
| White / Caucasian | 321 | 81.1% |
| Two or more Races | 0 | 0.0% |
| Some other Race | 17 | 4.3% |
| Total | 396 | 100.0% |
Ancestry in Skyland
The most populous ancestries reported in Skyland are German (80 | 20.2%), English (71 | 17.9%), Burmese (53 | 13.4%), American (50 | 12.6%), and Irish (38 | 9.6%), together accounting for 73.7% of all Skyland residents.
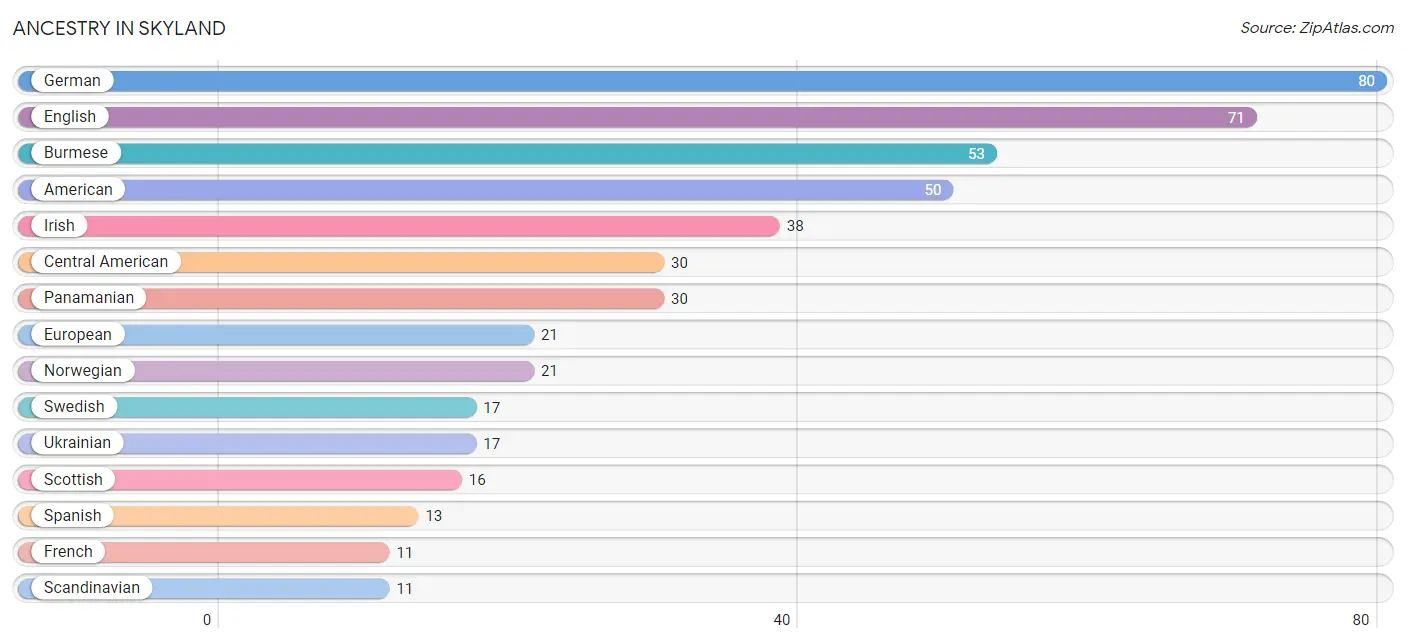
| Ancestry | # Population | % Population |
| American | 50 | 12.6% |
| Burmese | 53 | 13.4% |
| Central American | 30 | 7.6% |
| Cherokee | 5 | 1.3% |
| English | 71 | 17.9% |
| European | 21 | 5.3% |
| French | 11 | 2.8% |
| German | 80 | 20.2% |
| Irish | 38 | 9.6% |
| Norwegian | 21 | 5.3% |
| Panamanian | 30 | 7.6% |
| Scandinavian | 11 | 2.8% |
| Scottish | 16 | 4.0% |
| Spanish | 13 | 3.3% |
| Swedish | 17 | 4.3% |
| Ukrainian | 17 | 4.3% | View All 16 Rows |
Immigrants in Skyland
The most numerous immigrant groups reported in Skyland came from Asia (43 | 10.9%), Eastern Asia (26 | 6.6%), Korea (26 | 6.6%), India (17 | 4.3%), and South Central Asia (17 | 4.3%), together accounting for 32.6% of all Skyland residents.
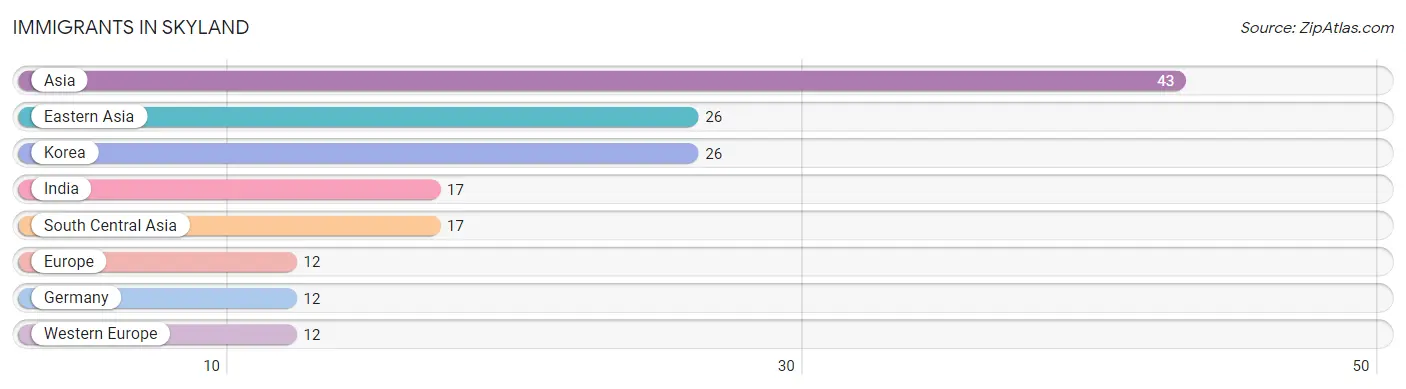
| Immigration Origin | # Population | % Population |
| Asia | 43 | 10.9% |
| Eastern Asia | 26 | 6.6% |
| Europe | 12 | 3.0% |
| Germany | 12 | 3.0% |
| India | 17 | 4.3% |
| Korea | 26 | 6.6% |
| South Central Asia | 17 | 4.3% |
| Western Europe | 12 | 3.0% | View All 8 Rows |
Sex and Age in Skyland
Sex and Age in Skyland
The most populous age groups in Skyland are 15 to 19 Years (36 | 15.3%) for men and 70 to 74 Years (30 | 18.6%) for women.
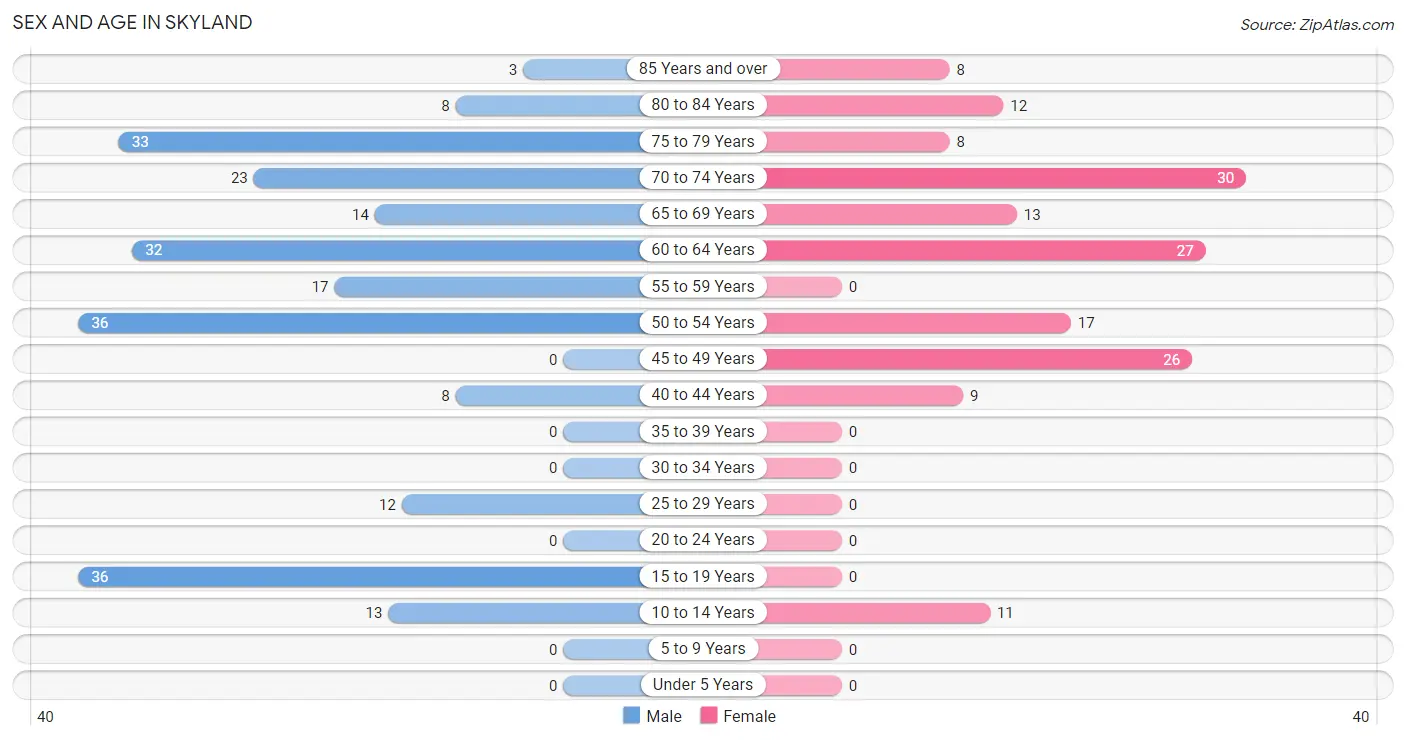
| Age Bracket | Male | Female |
| Under 5 Years | 0 (0.0%) | 0 (0.0%) |
| 5 to 9 Years | 0 (0.0%) | 0 (0.0%) |
| 10 to 14 Years | 13 (5.5%) | 11 (6.8%) |
| 15 to 19 Years | 36 (15.3%) | 0 (0.0%) |
| 20 to 24 Years | 0 (0.0%) | 0 (0.0%) |
| 25 to 29 Years | 12 (5.1%) | 0 (0.0%) |
| 30 to 34 Years | 0 (0.0%) | 0 (0.0%) |
| 35 to 39 Years | 0 (0.0%) | 0 (0.0%) |
| 40 to 44 Years | 8 (3.4%) | 9 (5.6%) |
| 45 to 49 Years | 0 (0.0%) | 26 (16.2%) |
| 50 to 54 Years | 36 (15.3%) | 17 (10.6%) |
| 55 to 59 Years | 17 (7.2%) | 0 (0.0%) |
| 60 to 64 Years | 32 (13.6%) | 27 (16.8%) |
| 65 to 69 Years | 14 (6.0%) | 13 (8.1%) |
| 70 to 74 Years | 23 (9.8%) | 30 (18.6%) |
| 75 to 79 Years | 33 (14.0%) | 8 (5.0%) |
| 80 to 84 Years | 8 (3.4%) | 12 (7.4%) |
| 85 Years and over | 3 (1.3%) | 8 (5.0%) |
| Total | 235 (100.0%) | 161 (100.0%) |
Families and Households in Skyland
Median Family Size in Skyland
The median family size in Skyland is 2.19 persons per family, with single male/father families (17 | 10.6%) accounting for the largest median family size of 2.29 persons per family. On the other hand, single female/mother families (35 | 21.9%) represent the smallest median family size with 2.11 persons per family.
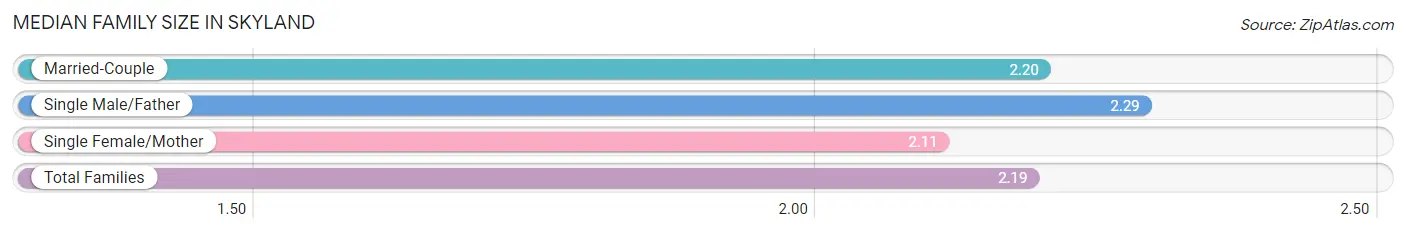
| Family Type | # Families | Family Size |
| Married-Couple | 108 (67.5%) | 2.20 |
| Single Male/Father | 17 (10.6%) | 2.29 |
| Single Female/Mother | 35 (21.9%) | 2.11 |
| Total Families | 160 (100.0%) | 2.19 |
Median Household Size in Skyland
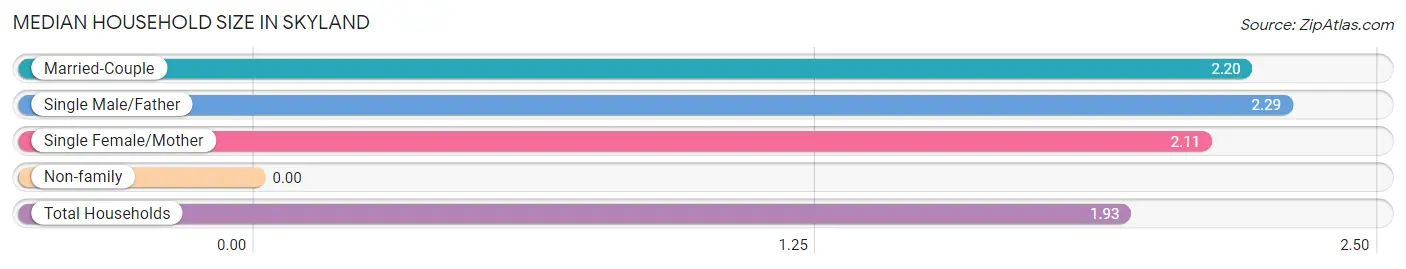
| Household Type | # Households | Household Size |
| Married-Couple | 108 (52.7%) | 2.20 |
| Single Male/Father | 17 (8.3%) | 2.29 |
| Single Female/Mother | 35 (17.1%) | 2.11 |
| Non-family | 45 (22.0%) | - |
| Total Households | 205 (100.0%) | 1.93 |
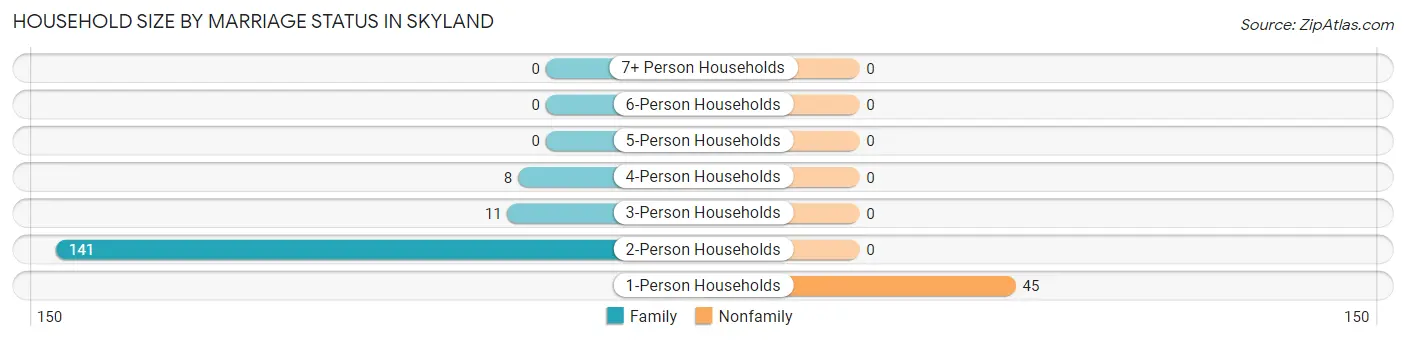
Household Size by Marriage Status in Skyland
Out of a total of 205 households in Skyland, 160 (78.0%) are family households, while 45 (22.0%) are nonfamily households. The most numerous type of family households are 2-person households, comprising 141, and the most common type of nonfamily households are 1-person households, comprising 45.
| Household Size | Family Households | Nonfamily Households |
| 1-Person Households | - | 45 (22.0%) |
| 2-Person Households | 141 (68.8%) | 0 (0.0%) |
| 3-Person Households | 11 (5.4%) | 0 (0.0%) |
| 4-Person Households | 8 (3.9%) | 0 (0.0%) |
| 5-Person Households | 0 (0.0%) | 0 (0.0%) |
| 6-Person Households | 0 (0.0%) | 0 (0.0%) |
| 7+ Person Households | 0 (0.0%) | 0 (0.0%) |
| Total | 160 (78.0%) | 45 (22.0%) |
Female Fertility in Skyland
Fertility by Age in Skyland
| Age Bracket | Women with Births | Births / 1,000 Women |
| 15 to 19 years | 0 (0.0%) | 0.0 |
| 20 to 34 years | 0 (0.0%) | 0.0 |
| 35 to 50 years | 0 (0.0%) | 0.0 |
| Total | 0 (0.0%) | 0.0 |
Fertility by Age by Marriage Status in Skyland
| Age Bracket | Married | Unmarried |
| 15 to 19 years | 0 (0.0%) | 0 (0.0%) |
| 20 to 34 years | 0 (0.0%) | 0 (0.0%) |
| 35 to 50 years | 0 (0.0%) | 0 (0.0%) |
| Total | 0 (0.0%) | 0 (0.0%) |
Fertility by Education in Skyland
| Educational Attainment | Women with Births | Births / 1,000 Women |
| Less than High School | 0 (0.0%) | 0.0 |
| High School Diploma | 0 (0.0%) | 0.0 |
| College or Associate's Degree | 0 (0.0%) | 0.0 |
| Bachelor's Degree | 0 (0.0%) | 0.0 |
| Graduate Degree | 0 (0.0%) | 0.0 |
| Total | 0 (0.0%) | 0.0 |
Fertility by Education by Marriage Status in Skyland
| Educational Attainment | Married | Unmarried |
| Less than High School | 0 (0.0%) | 0 (0.0%) |
| High School Diploma | 0 (0.0%) | 0 (0.0%) |
| College or Associate's Degree | 0 (0.0%) | 0 (0.0%) |
| Bachelor's Degree | 0 (0.0%) | 0 (0.0%) |
| Graduate Degree | 0 (0.0%) | 0 (0.0%) |
| Total | 0 (0.0%) | 0 (0.0%) |
Employment Characteristics in Skyland
Employment by Class of Employer in Skyland
Among the 108 employed individuals in Skyland, self-employed (incorporated) (36 | 33.3%), private company employees (21 | 19.4%), and self-employed (not incorporated) (17 | 15.7%) make up the most common classes of employment.
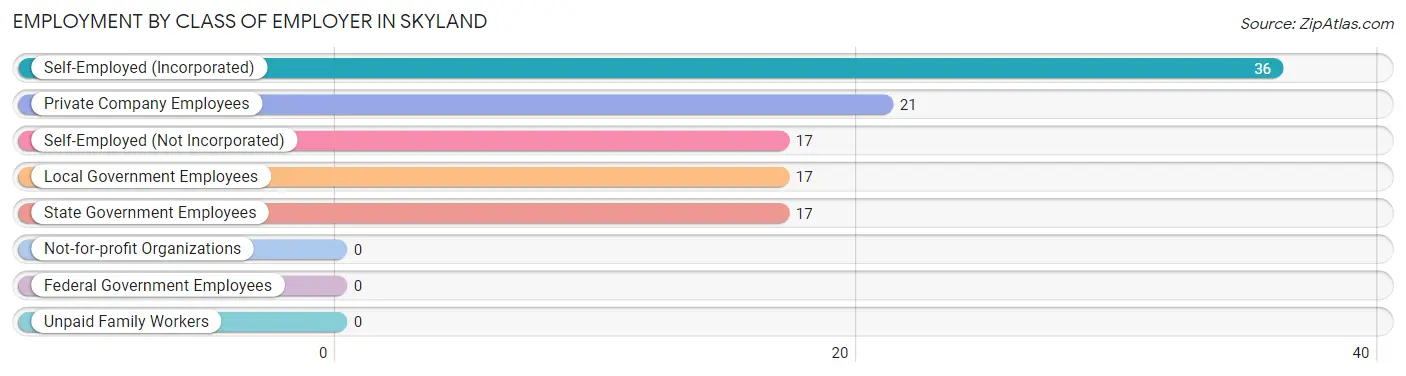
| Employer Class | # Employees | % Employees |
| Private Company Employees | 21 | 19.4% |
| Self-Employed (Incorporated) | 36 | 33.3% |
| Self-Employed (Not Incorporated) | 17 | 15.7% |
| Not-for-profit Organizations | 0 | 0.0% |
| Local Government Employees | 17 | 15.7% |
| State Government Employees | 17 | 15.7% |
| Federal Government Employees | 0 | 0.0% |
| Unpaid Family Workers | 0 | 0.0% |
| Total | 108 | 100.0% |
Employment Status by Age in Skyland
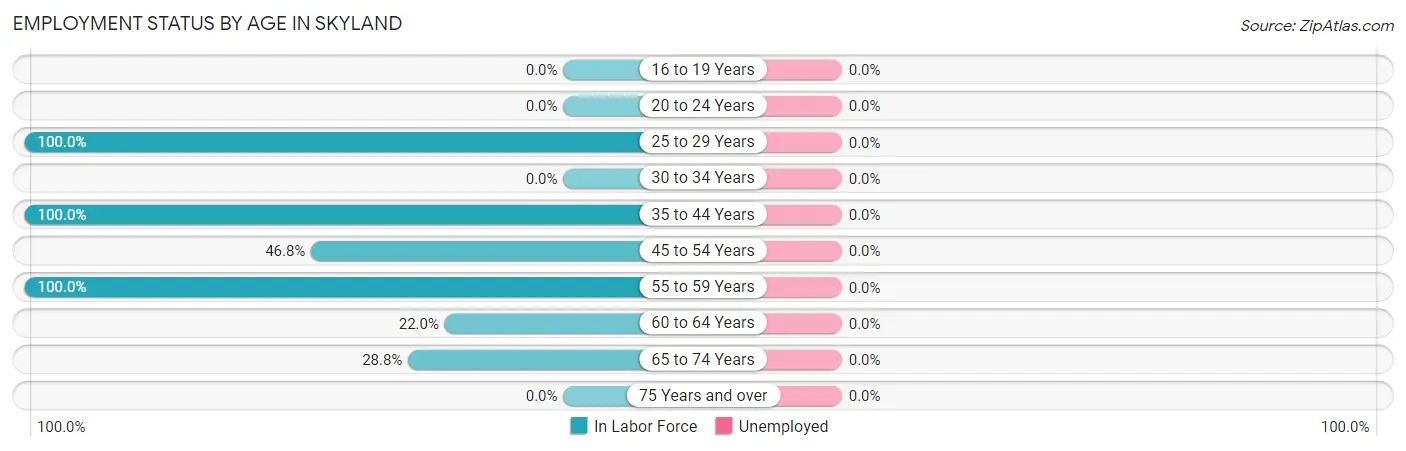
| Age Bracket | In Labor Force | Unemployed |
| 16 to 19 Years | 0 (0.0%) | 0 (0.0%) |
| 20 to 24 Years | 0 (0.0%) | 0 (0.0%) |
| 25 to 29 Years | 12 (100.0%) | 0 (0.0%) |
| 30 to 34 Years | 0 (0.0%) | 0 (0.0%) |
| 35 to 44 Years | 17 (100.0%) | 0 (0.0%) |
| 45 to 54 Years | 37 (46.8%) | 0 (0.0%) |
| 55 to 59 Years | 17 (100.0%) | 0 (0.0%) |
| 60 to 64 Years | 13 (22.0%) | 0 (0.0%) |
| 65 to 74 Years | 23 (28.8%) | 0 (0.0%) |
| 75 Years and over | 0 (0.0%) | 0 (0.0%) |
| Total | 119 (32.0%) | 0 (0.0%) |
Employment Status by Educational Attainment in Skyland
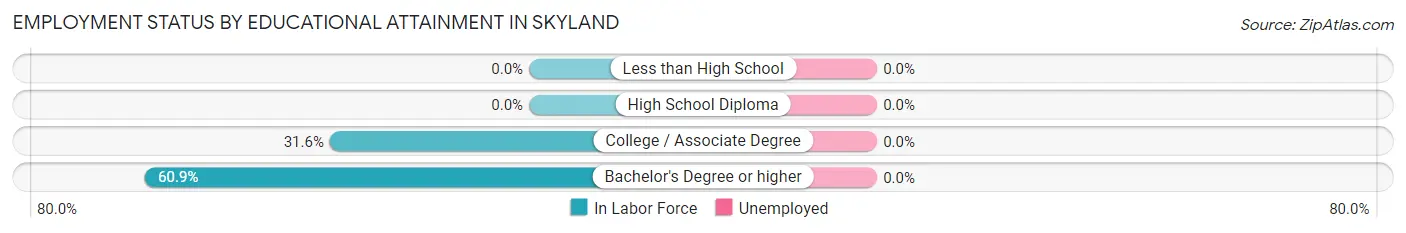
| Educational Attainment | In Labor Force | Unemployed |
| Less than High School | 0 (0.0%) | 0 (0.0%) |
| High School Diploma | 0 (0.0%) | 0 (0.0%) |
| College / Associate Degree | 12 (31.6%) | 0 (0.0%) |
| Bachelor's Degree or higher | 84 (60.9%) | 0 (0.0%) |
| Total | 96 (52.2%) | 0 (0.0%) |
Employment Occupations by Sex in Skyland
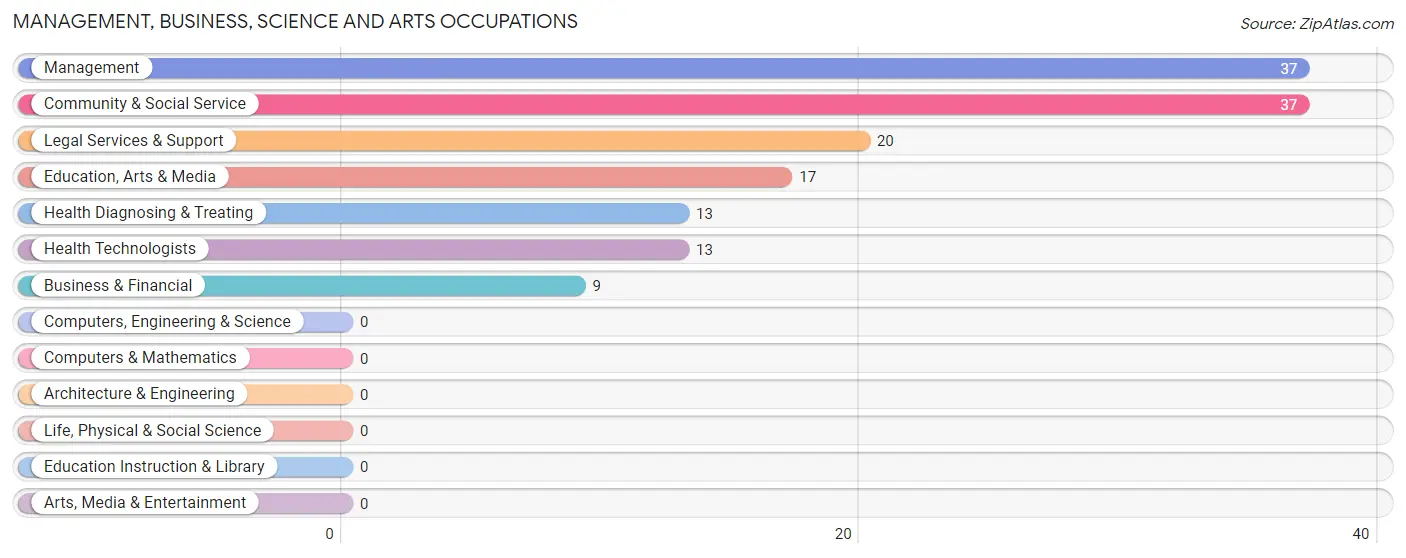
Management, Business, Science and Arts Occupations
The most common Management, Business, Science and Arts occupations in Skyland are Management (37 | 31.1%), Community & Social Service (37 | 31.1%), Legal Services & Support (20 | 16.8%), Education, Arts & Media (17 | 14.3%), and Health Diagnosing & Treating (13 | 10.9%).
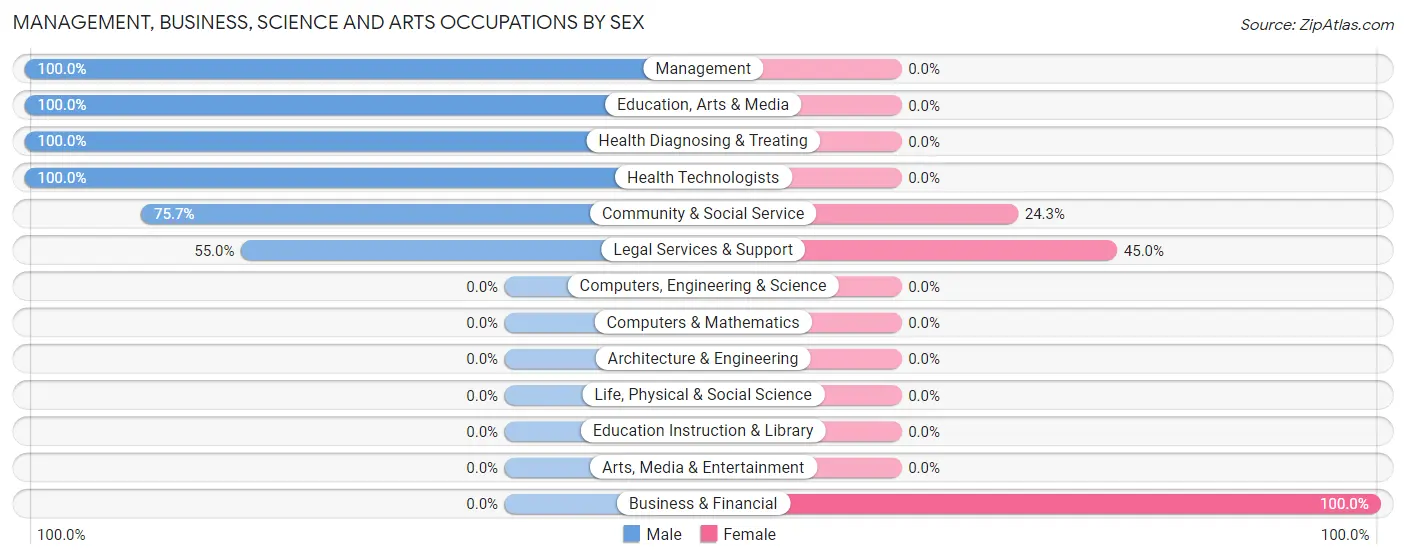
Management, Business, Science and Arts Occupations by Sex
Within the Management, Business, Science and Arts occupations in Skyland, the most male-oriented occupations are Management (100.0%), Education, Arts & Media (100.0%), and Health Diagnosing & Treating (100.0%), while the most female-oriented occupations are Business & Financial (100.0%), Legal Services & Support (45.0%), and Community & Social Service (24.3%).
| Occupation | Male | Female |
| Management | 37 (100.0%) | 0 (0.0%) |
| Business & Financial | 0 (0.0%) | 9 (100.0%) |
| Computers, Engineering & Science | 0 (0.0%) | 0 (0.0%) |
| Computers & Mathematics | 0 (0.0%) | 0 (0.0%) |
| Architecture & Engineering | 0 (0.0%) | 0 (0.0%) |
| Life, Physical & Social Science | 0 (0.0%) | 0 (0.0%) |
| Community & Social Service | 28 (75.7%) | 9 (24.3%) |
| Education, Arts & Media | 17 (100.0%) | 0 (0.0%) |
| Legal Services & Support | 11 (55.0%) | 9 (45.0%) |
| Education Instruction & Library | 0 (0.0%) | 0 (0.0%) |
| Arts, Media & Entertainment | 0 (0.0%) | 0 (0.0%) |
| Health Diagnosing & Treating | 13 (100.0%) | 0 (0.0%) |
| Health Technologists | 13 (100.0%) | 0 (0.0%) |
| Total (Category) | 78 (81.2%) | 18 (18.8%) |
| Total (Overall) | 101 (84.9%) | 18 (15.1%) |
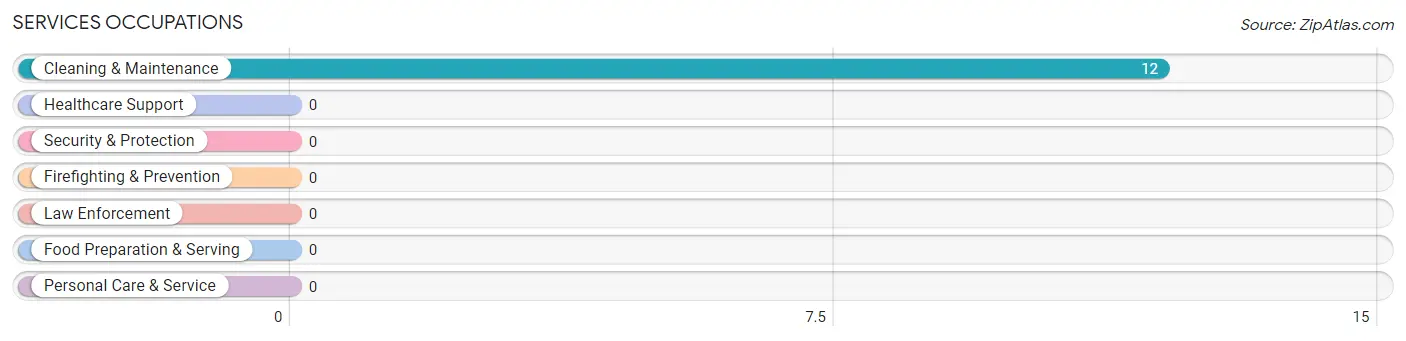
Services Occupations
The most common Services occupations in Skyland are , and Cleaning & Maintenance (12 | 10.1%).
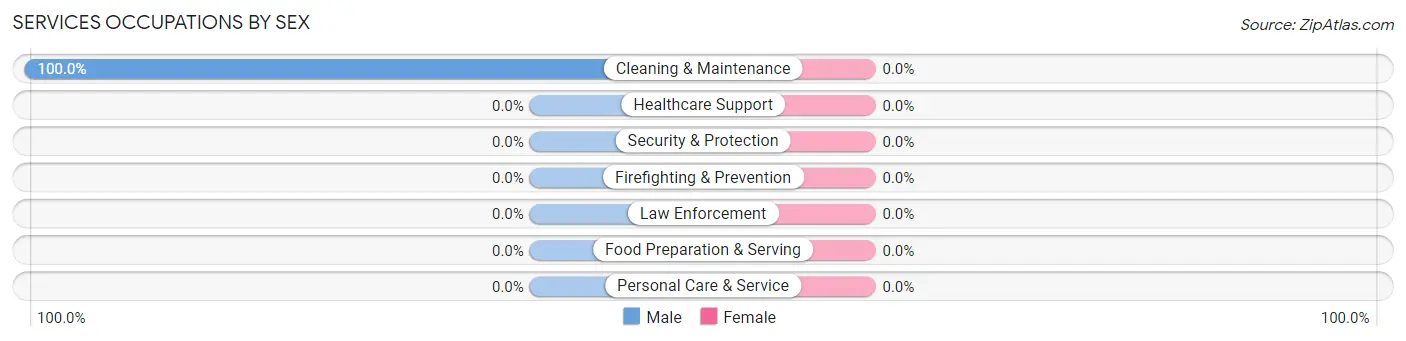
Services Occupations by Sex
| Occupation | Male | Female |
| Healthcare Support | 0 (0.0%) | 0 (0.0%) |
| Security & Protection | 0 (0.0%) | 0 (0.0%) |
| Firefighting & Prevention | 0 (0.0%) | 0 (0.0%) |
| Law Enforcement | 0 (0.0%) | 0 (0.0%) |
| Food Preparation & Serving | 0 (0.0%) | 0 (0.0%) |
| Cleaning & Maintenance | 12 (100.0%) | 0 (0.0%) |
| Personal Care & Service | 0 (0.0%) | 0 (0.0%) |
| Total (Category) | 12 (100.0%) | 0 (0.0%) |
| Total (Overall) | 101 (84.9%) | 18 (15.1%) |
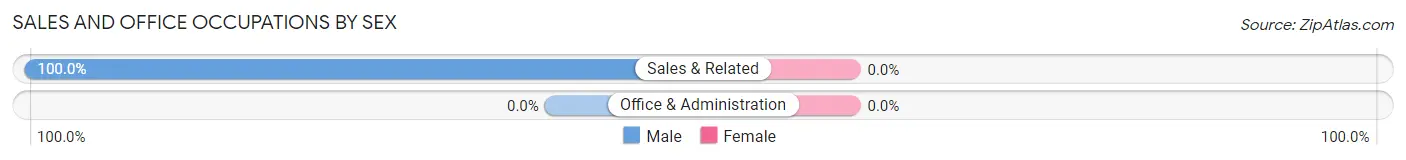
Sales and Office Occupations
The most common Sales and Office occupations in Skyland are , and Sales & Related (11 | 9.2%).
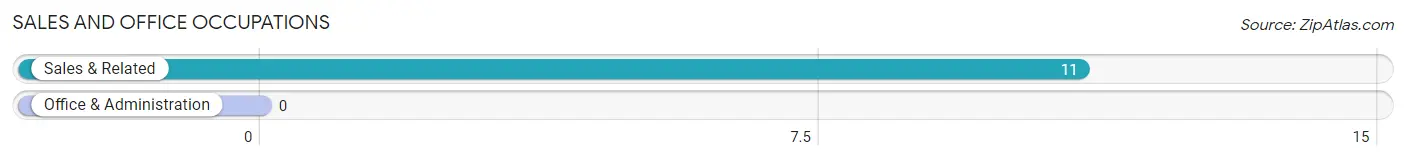
Sales and Office Occupations by Sex
| Occupation | Male | Female |
| Sales & Related | 11 (100.0%) | 0 (0.0%) |
| Office & Administration | 0 (0.0%) | 0 (0.0%) |
| Total (Category) | 11 (100.0%) | 0 (0.0%) |
| Total (Overall) | 101 (84.9%) | 18 (15.1%) |
Natural Resources, Construction and Maintenance Occupations
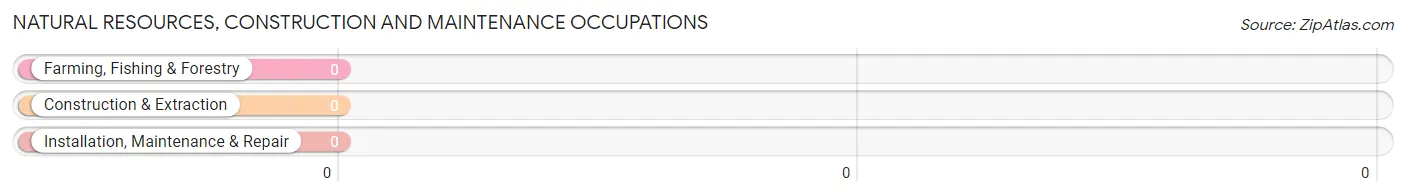
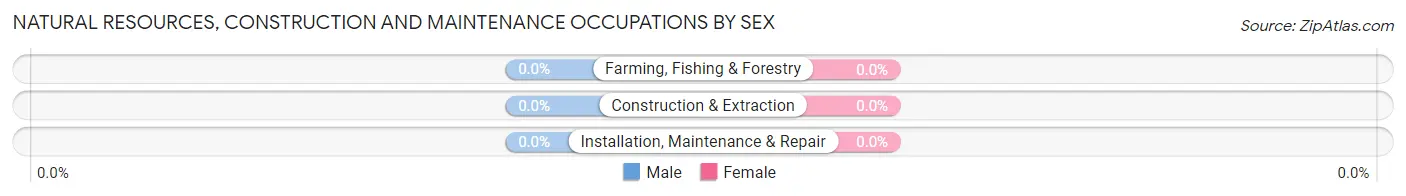
Natural Resources, Construction and Maintenance Occupations by Sex
| Occupation | Male | Female |
| Farming, Fishing & Forestry | 0 (0.0%) | 0 (0.0%) |
| Construction & Extraction | 0 (0.0%) | 0 (0.0%) |
| Installation, Maintenance & Repair | 0 (0.0%) | 0 (0.0%) |
| Total (Category) | 0 (0.0%) | 0 (0.0%) |
| Total (Overall) | 101 (84.9%) | 18 (15.1%) |
Production, Transportation and Moving Occupations
Production, Transportation and Moving Occupations by Sex
| Occupation | Male | Female |
| Production | 0 (0.0%) | 0 (0.0%) |
| Transportation | 0 (0.0%) | 0 (0.0%) |
| Material Moving | 0 (0.0%) | 0 (0.0%) |
| Total (Category) | 0 (0.0%) | 0 (0.0%) |
| Total (Overall) | 101 (84.9%) | 18 (15.1%) |
Employment Industries by Sex in Skyland
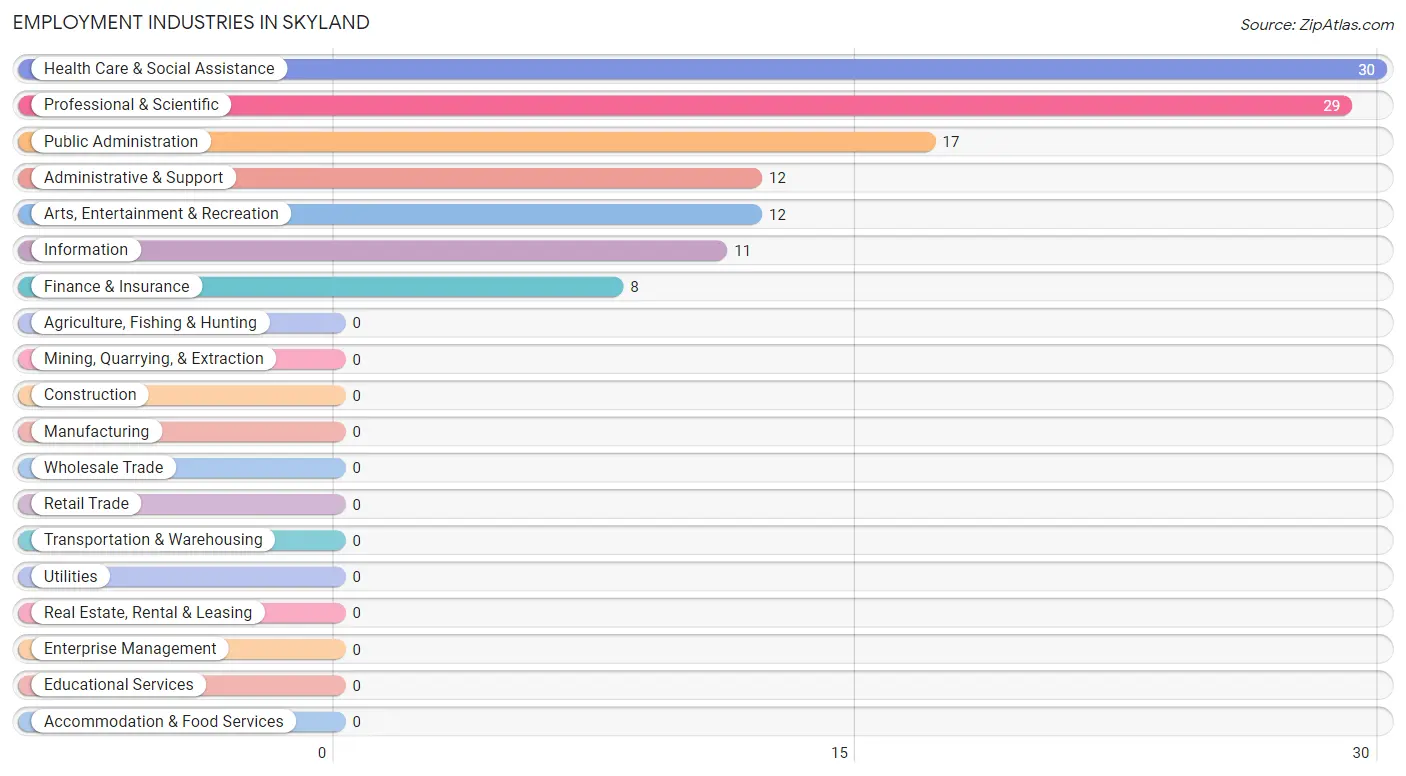
Employment Industries in Skyland
The major employment industries in Skyland include Health Care & Social Assistance (30 | 25.2%), Professional & Scientific (29 | 24.4%), Public Administration (17 | 14.3%), Administrative & Support (12 | 10.1%), and Arts, Entertainment & Recreation (12 | 10.1%).
Employment Industries by Sex in Skyland
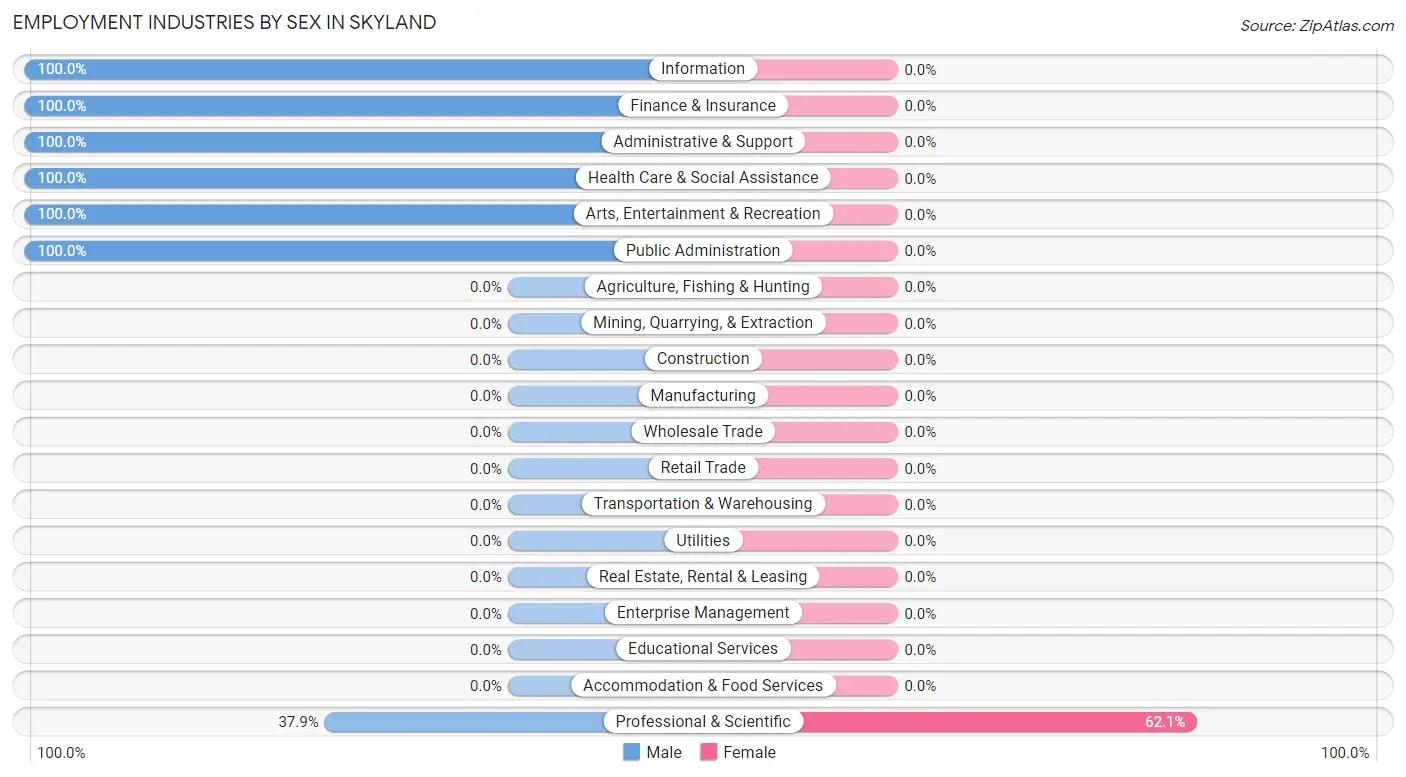
| Industry | Male | Female |
| Agriculture, Fishing & Hunting | 0 (0.0%) | 0 (0.0%) |
| Mining, Quarrying, & Extraction | 0 (0.0%) | 0 (0.0%) |
| Construction | 0 (0.0%) | 0 (0.0%) |
| Manufacturing | 0 (0.0%) | 0 (0.0%) |
| Wholesale Trade | 0 (0.0%) | 0 (0.0%) |
| Retail Trade | 0 (0.0%) | 0 (0.0%) |
| Transportation & Warehousing | 0 (0.0%) | 0 (0.0%) |
| Utilities | 0 (0.0%) | 0 (0.0%) |
| Information | 11 (100.0%) | 0 (0.0%) |
| Finance & Insurance | 8 (100.0%) | 0 (0.0%) |
| Real Estate, Rental & Leasing | 0 (0.0%) | 0 (0.0%) |
| Professional & Scientific | 11 (37.9%) | 18 (62.1%) |
| Enterprise Management | 0 (0.0%) | 0 (0.0%) |
| Administrative & Support | 12 (100.0%) | 0 (0.0%) |
| Educational Services | 0 (0.0%) | 0 (0.0%) |
| Health Care & Social Assistance | 30 (100.0%) | 0 (0.0%) |
| Arts, Entertainment & Recreation | 12 (100.0%) | 0 (0.0%) |
| Accommodation & Food Services | 0 (0.0%) | 0 (0.0%) |
| Public Administration | 17 (100.0%) | 0 (0.0%) |
| Total | 101 (84.9%) | 18 (15.1%) |
Education in Skyland
School Enrollment in Skyland
The most common levels of schooling among the 60 students in Skyland are high school (36 | 60.0%), and middle school (24 | 40.0%).
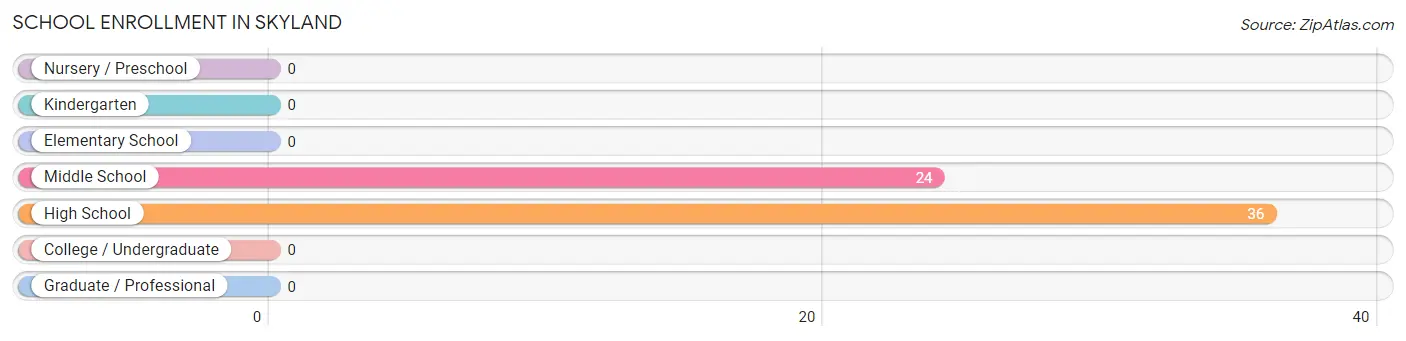
| School Level | # Students | % Students |
| Nursery / Preschool | 0 | 0.0% |
| Kindergarten | 0 | 0.0% |
| Elementary School | 0 | 0.0% |
| Middle School | 24 | 40.0% |
| High School | 36 | 60.0% |
| College / Undergraduate | 0 | 0.0% |
| Graduate / Professional | 0 | 0.0% |
| Total | 60 | 100.0% |
School Enrollment by Age by Funding Source in Skyland
Out of a total of 60 students who are enrolled in schools in Skyland, 19 (31.7%) attend a private institution, while the remaining 41 (68.3%) are enrolled in public schools. The age group of 10 to 14 year olds has the highest likelihood of being enrolled in private schools, with 19 (79.2% in the age bracket) enrolled. Conversely, the age group of 15 to 17 year olds has the lowest likelihood of being enrolled in a private school, with 36 (100.0% in the age bracket) attending a public institution.
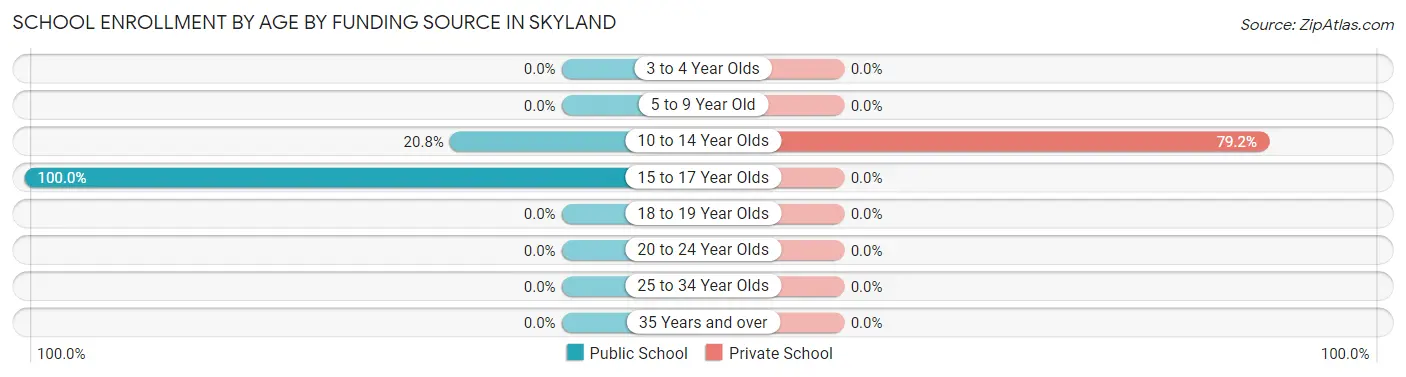
| Age Bracket | Public School | Private School |
| 3 to 4 Year Olds | 0 (0.0%) | 0 (0.0%) |
| 5 to 9 Year Old | 0 (0.0%) | 0 (0.0%) |
| 10 to 14 Year Olds | 5 (20.8%) | 19 (79.2%) |
| 15 to 17 Year Olds | 36 (100.0%) | 0 (0.0%) |
| 18 to 19 Year Olds | 0 (0.0%) | 0 (0.0%) |
| 20 to 24 Year Olds | 0 (0.0%) | 0 (0.0%) |
| 25 to 34 Year Olds | 0 (0.0%) | 0 (0.0%) |
| 35 Years and over | 0 (0.0%) | 0 (0.0%) |
| Total | 41 (68.3%) | 19 (31.7%) |
Educational Attainment by Field of Study in Skyland
Business (88 | 34.9%), social sciences (39 | 15.5%), engineering (31 | 12.3%), computers & mathematics (17 | 6.8%), and communications (17 | 6.8%) are the most common fields of study among 252 individuals in Skyland who have obtained a bachelor's degree or higher.
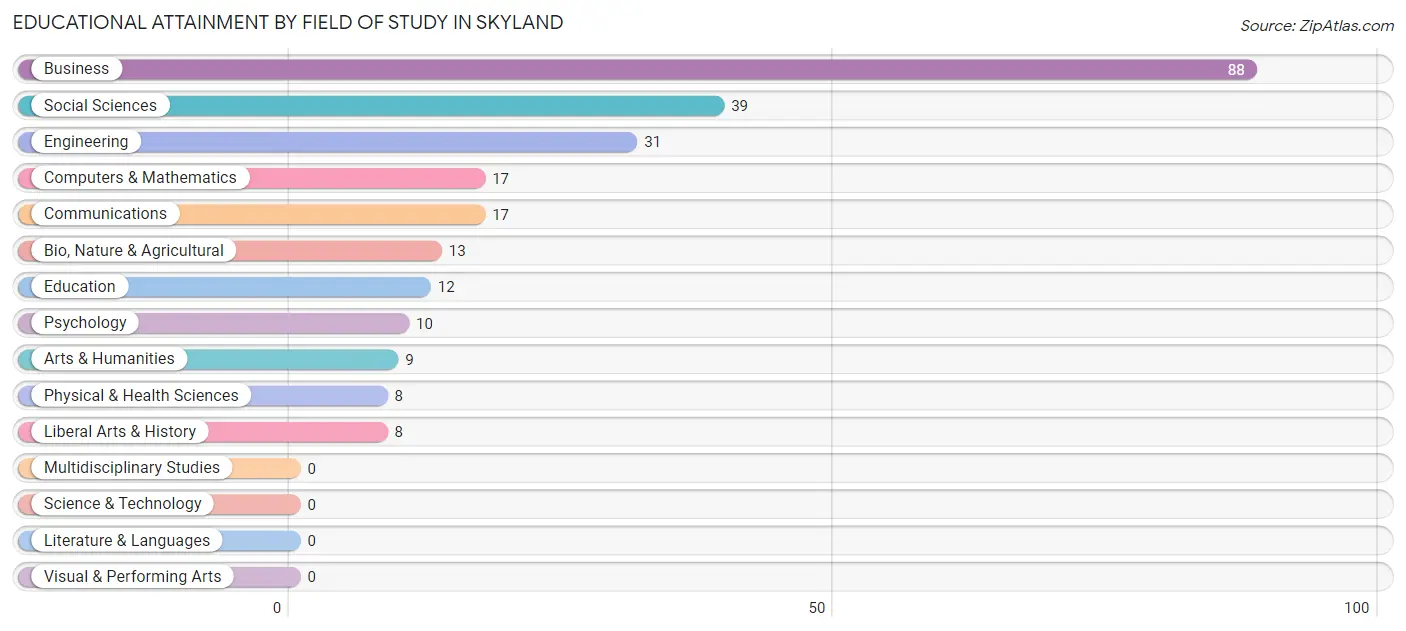
| Field of Study | # Graduates | % Graduates |
| Computers & Mathematics | 17 | 6.8% |
| Bio, Nature & Agricultural | 13 | 5.2% |
| Physical & Health Sciences | 8 | 3.2% |
| Psychology | 10 | 4.0% |
| Social Sciences | 39 | 15.5% |
| Engineering | 31 | 12.3% |
| Multidisciplinary Studies | 0 | 0.0% |
| Science & Technology | 0 | 0.0% |
| Business | 88 | 34.9% |
| Education | 12 | 4.8% |
| Literature & Languages | 0 | 0.0% |
| Liberal Arts & History | 8 | 3.2% |
| Visual & Performing Arts | 0 | 0.0% |
| Communications | 17 | 6.8% |
| Arts & Humanities | 9 | 3.6% |
| Total | 252 | 100.0% |
Transportation & Commute in Skyland
Vehicle Availability by Sex in Skyland
The most prevalent vehicle ownership categories in Skyland are males with 3 vehicles (66, accounting for 73.3%) and females with 3 vehicles (9, making up 366.7%).
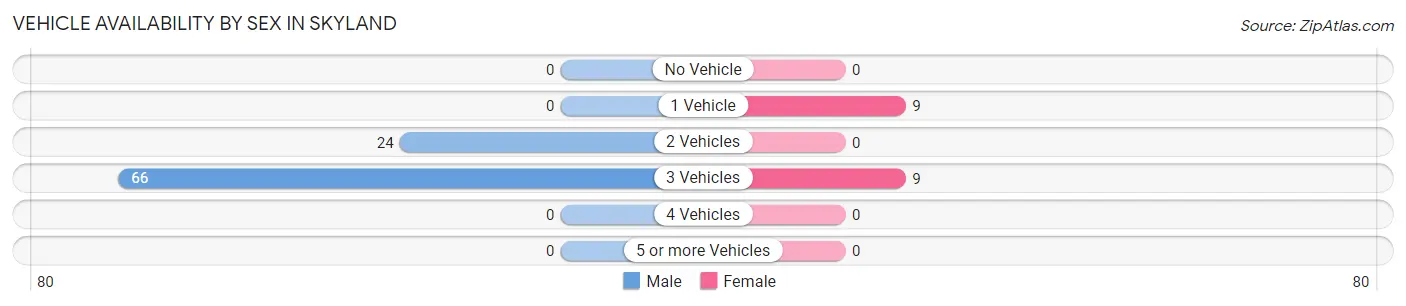
| Vehicles Available | Male | Female |
| No Vehicle | 0 (0.0%) | 0 (0.0%) |
| 1 Vehicle | 0 (0.0%) | 9 (50.0%) |
| 2 Vehicles | 24 (26.7%) | 0 (0.0%) |
| 3 Vehicles | 66 (73.3%) | 9 (50.0%) |
| 4 Vehicles | 0 (0.0%) | 0 (0.0%) |
| 5 or more Vehicles | 0 (0.0%) | 0 (0.0%) |
| Total | 90 (100.0%) | 18 (100.0%) |
Commute Time in Skyland
The most frequently occuring commute durations in Skyland are 15 to 19 minutes (57 commuters, 62.6%), 45 to 59 minutes (13 commuters, 14.3%), and 5 to 9 minutes (12 commuters, 13.2%).
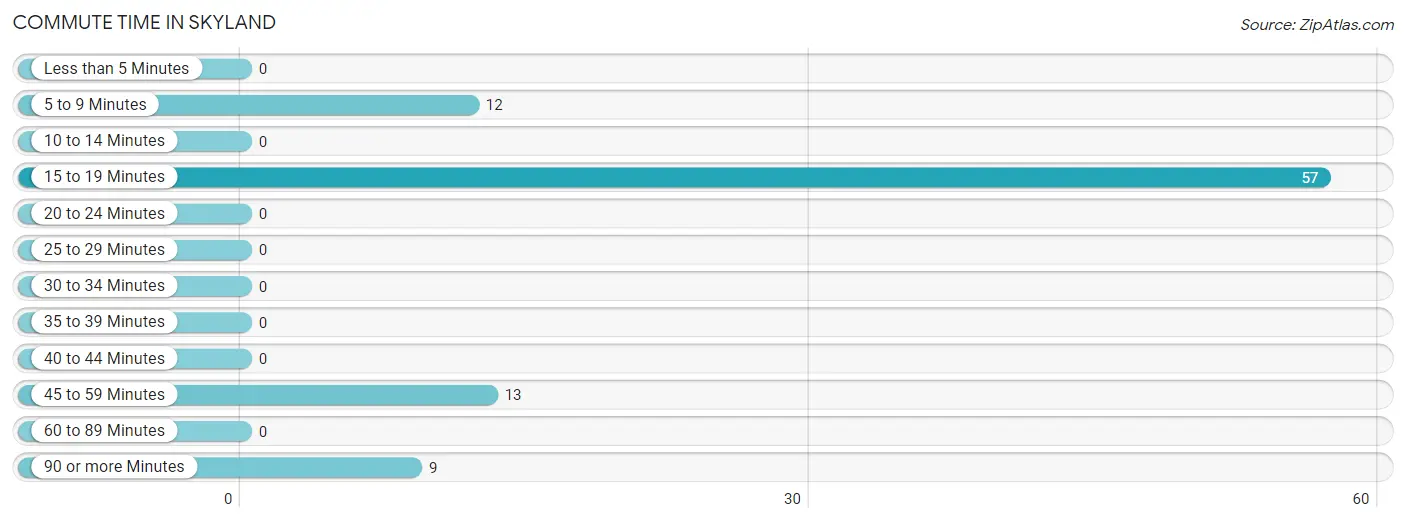
| Commute Time | # Commuters | % Commuters |
| Less than 5 Minutes | 0 | 0.0% |
| 5 to 9 Minutes | 12 | 13.2% |
| 10 to 14 Minutes | 0 | 0.0% |
| 15 to 19 Minutes | 57 | 62.6% |
| 20 to 24 Minutes | 0 | 0.0% |
| 25 to 29 Minutes | 0 | 0.0% |
| 30 to 34 Minutes | 0 | 0.0% |
| 35 to 39 Minutes | 0 | 0.0% |
| 40 to 44 Minutes | 0 | 0.0% |
| 45 to 59 Minutes | 13 | 14.3% |
| 60 to 89 Minutes | 0 | 0.0% |
| 90 or more Minutes | 9 | 9.9% |
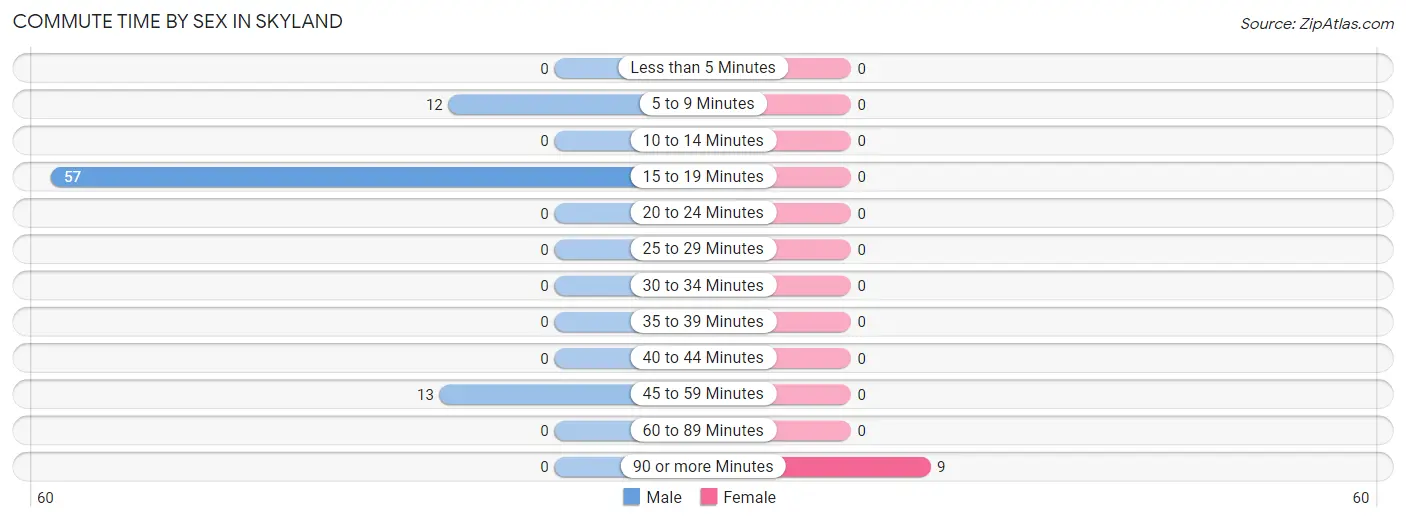
Commute Time by Sex in Skyland
The most common commute times in Skyland are 15 to 19 minutes (57 commuters, 69.5%) for males and 90 or more minutes (9 commuters, 100.0%) for females.
| Commute Time | Male | Female |
| Less than 5 Minutes | 0 (0.0%) | 0 (0.0%) |
| 5 to 9 Minutes | 12 (14.6%) | 0 (0.0%) |
| 10 to 14 Minutes | 0 (0.0%) | 0 (0.0%) |
| 15 to 19 Minutes | 57 (69.5%) | 0 (0.0%) |
| 20 to 24 Minutes | 0 (0.0%) | 0 (0.0%) |
| 25 to 29 Minutes | 0 (0.0%) | 0 (0.0%) |
| 30 to 34 Minutes | 0 (0.0%) | 0 (0.0%) |
| 35 to 39 Minutes | 0 (0.0%) | 0 (0.0%) |
| 40 to 44 Minutes | 0 (0.0%) | 0 (0.0%) |
| 45 to 59 Minutes | 13 (15.9%) | 0 (0.0%) |
| 60 to 89 Minutes | 0 (0.0%) | 0 (0.0%) |
| 90 or more Minutes | 0 (0.0%) | 9 (100.0%) |
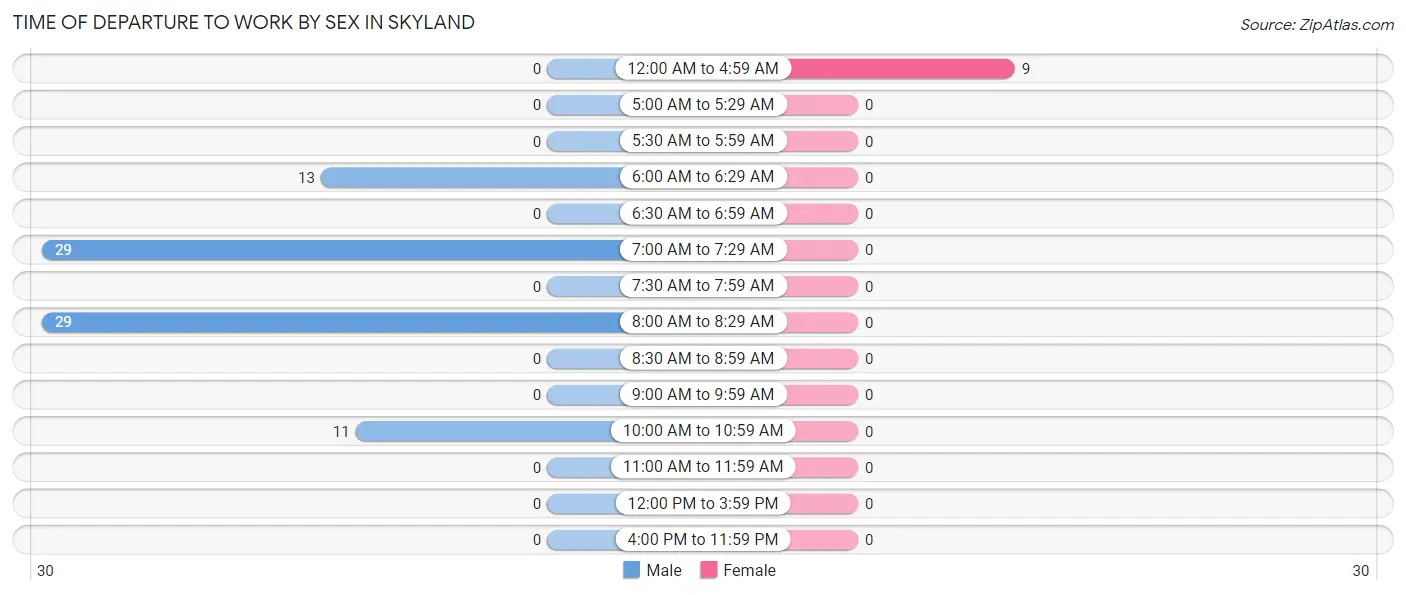
Time of Departure to Work by Sex in Skyland
The most frequent times of departure to work in Skyland are 7:00 AM to 7:29 AM (29, 35.4%) for males and 12:00 AM to 4:59 AM (9, 100.0%) for females.
| Time of Departure | Male | Female |
| 12:00 AM to 4:59 AM | 0 (0.0%) | 9 (100.0%) |
| 5:00 AM to 5:29 AM | 0 (0.0%) | 0 (0.0%) |
| 5:30 AM to 5:59 AM | 0 (0.0%) | 0 (0.0%) |
| 6:00 AM to 6:29 AM | 13 (15.9%) | 0 (0.0%) |
| 6:30 AM to 6:59 AM | 0 (0.0%) | 0 (0.0%) |
| 7:00 AM to 7:29 AM | 29 (35.4%) | 0 (0.0%) |
| 7:30 AM to 7:59 AM | 0 (0.0%) | 0 (0.0%) |
| 8:00 AM to 8:29 AM | 29 (35.4%) | 0 (0.0%) |
| 8:30 AM to 8:59 AM | 0 (0.0%) | 0 (0.0%) |
| 9:00 AM to 9:59 AM | 0 (0.0%) | 0 (0.0%) |
| 10:00 AM to 10:59 AM | 11 (13.4%) | 0 (0.0%) |
| 11:00 AM to 11:59 AM | 0 (0.0%) | 0 (0.0%) |
| 12:00 PM to 3:59 PM | 0 (0.0%) | 0 (0.0%) |
| 4:00 PM to 11:59 PM | 0 (0.0%) | 0 (0.0%) |
| Total | 82 (100.0%) | 9 (100.0%) |
Housing Occupancy in Skyland
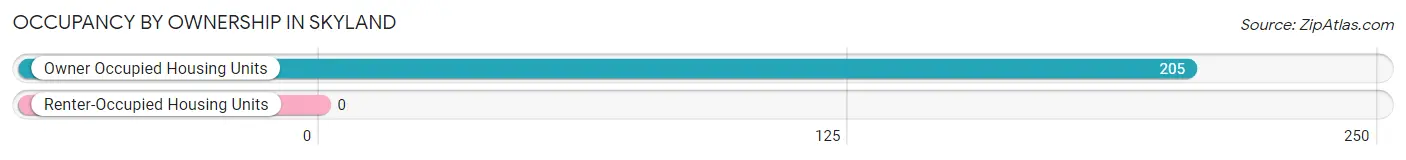
Occupancy by Ownership in Skyland
Of the total 205 dwellings in Skyland, owner-occupied units account for 205 (100.0%), while renter-occupied units make up 0 (0.0%).
| Occupancy | # Housing Units | % Housing Units |
| Owner Occupied Housing Units | 205 | 100.0% |
| Renter-Occupied Housing Units | 0 | 0.0% |
| Total Occupied Housing Units | 205 | 100.0% |
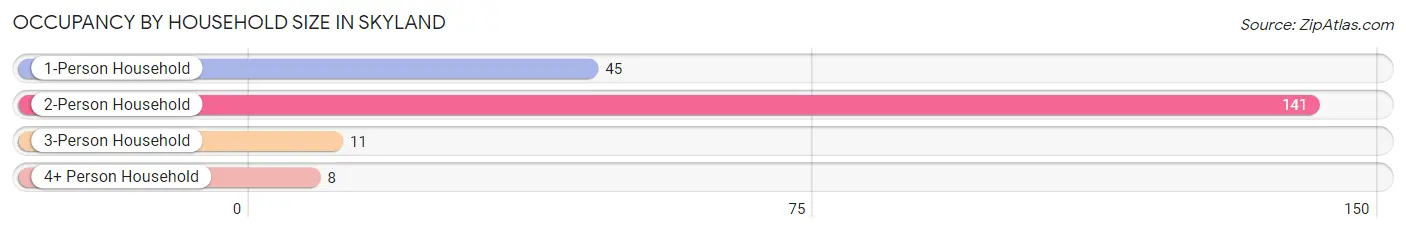
Occupancy by Household Size in Skyland
| Household Size | # Housing Units | % Housing Units |
| 1-Person Household | 45 | 22.0% |
| 2-Person Household | 141 | 68.8% |
| 3-Person Household | 11 | 5.4% |
| 4+ Person Household | 8 | 3.9% |
| Total Housing Units | 205 | 100.0% |
Occupancy by Ownership by Household Size in Skyland
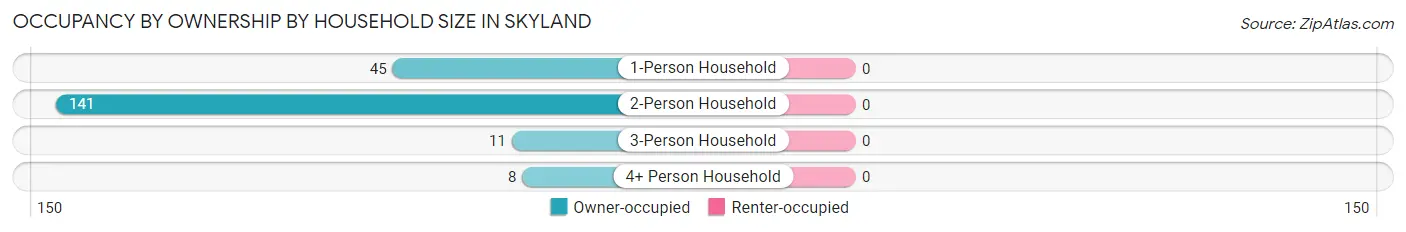
| Household Size | Owner-occupied | Renter-occupied |
| 1-Person Household | 45 (100.0%) | 0 (0.0%) |
| 2-Person Household | 141 (100.0%) | 0 (0.0%) |
| 3-Person Household | 11 (100.0%) | 0 (0.0%) |
| 4+ Person Household | 8 (100.0%) | 0 (0.0%) |
| Total Housing Units | 205 (100.0%) | 0 (0.0%) |
Occupancy by Educational Attainment in Skyland
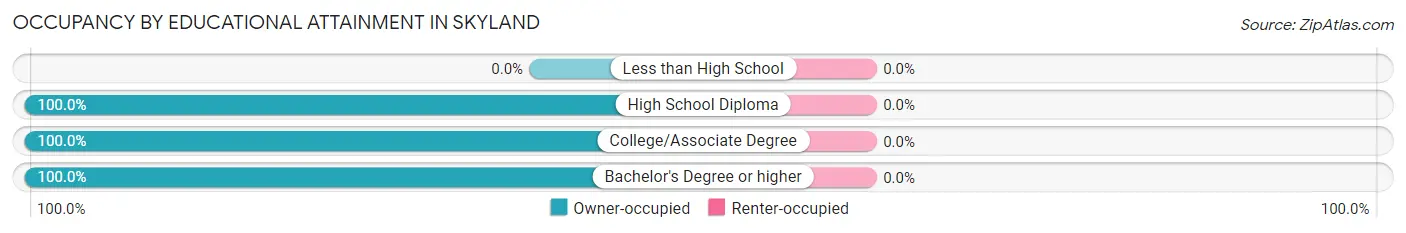
| Household Size | Owner-occupied | Renter-occupied |
| Less than High School | 0 (0.0%) | 0 (0.0%) |
| High School Diploma | 20 (100.0%) | 0 (0.0%) |
| College/Associate Degree | 45 (100.0%) | 0 (0.0%) |
| Bachelor's Degree or higher | 140 (100.0%) | 0 (0.0%) |
Occupancy by Age of Householder in Skyland
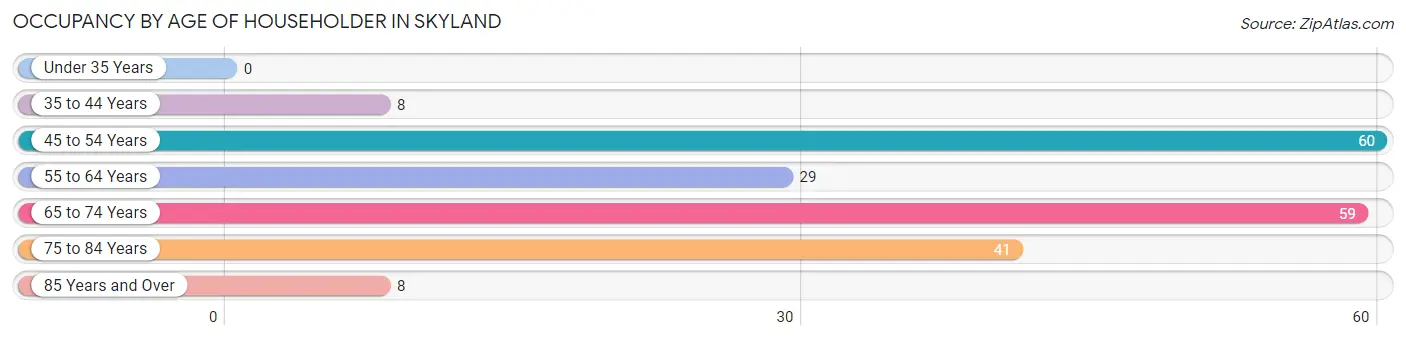
| Age Bracket | # Households | % Households |
| Under 35 Years | 0 | 0.0% |
| 35 to 44 Years | 8 | 3.9% |
| 45 to 54 Years | 60 | 29.3% |
| 55 to 64 Years | 29 | 14.1% |
| 65 to 74 Years | 59 | 28.8% |
| 75 to 84 Years | 41 | 20.0% |
| 85 Years and Over | 8 | 3.9% |
| Total | 205 | 100.0% |
Housing Finances in Skyland
Median Income by Occupancy in Skyland
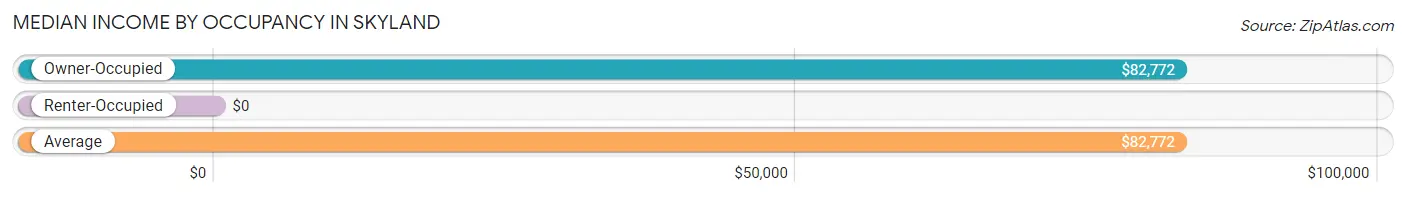
| Occupancy Type | # Households | Median Income |
| Owner-Occupied | 205 (100.0%) | $82,772 |
| Renter-Occupied | 0 (0.0%) | $0 |
| Average | 205 (100.0%) | $82,772 |
Occupancy by Householder Income Bracket in Skyland
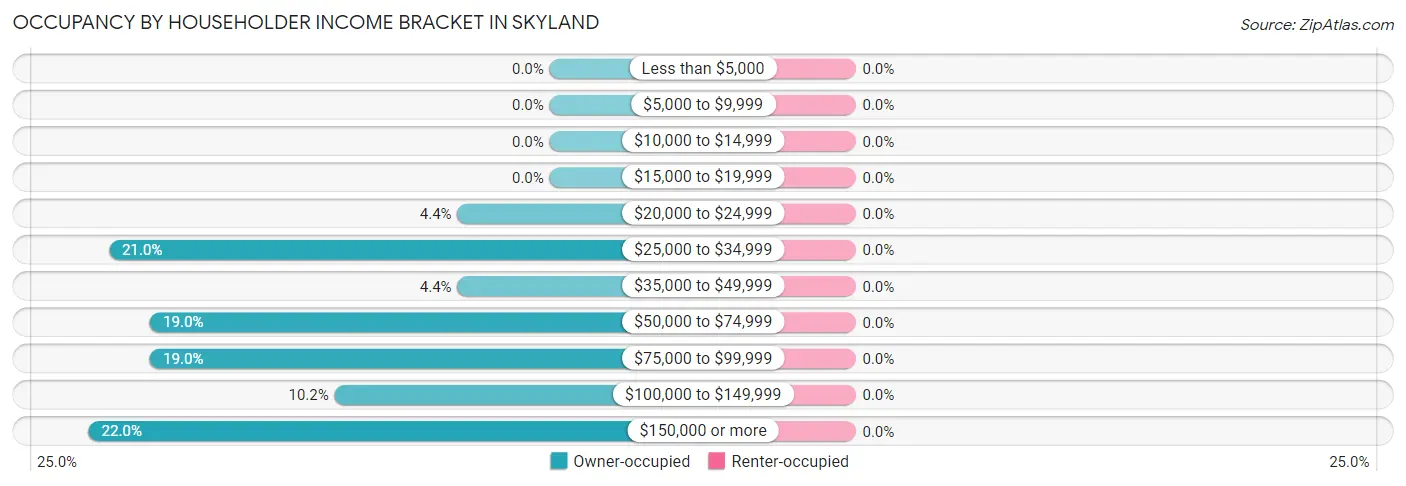
| Income Bracket | Owner-occupied | Renter-occupied |
| Less than $5,000 | 0 (0.0%) | 0 (0.0%) |
| $5,000 to $9,999 | 0 (0.0%) | 0 (0.0%) |
| $10,000 to $14,999 | 0 (0.0%) | 0 (0.0%) |
| $15,000 to $19,999 | 0 (0.0%) | 0 (0.0%) |
| $20,000 to $24,999 | 9 (4.4%) | 0 (0.0%) |
| $25,000 to $34,999 | 43 (21.0%) | 0 (0.0%) |
| $35,000 to $49,999 | 9 (4.4%) | 0 (0.0%) |
| $50,000 to $74,999 | 39 (19.0%) | 0 (0.0%) |
| $75,000 to $99,999 | 39 (19.0%) | 0 (0.0%) |
| $100,000 to $149,999 | 21 (10.2%) | 0 (0.0%) |
| $150,000 or more | 45 (22.0%) | 0 (0.0%) |
| Total | 205 (100.0%) | 0 (0.0%) |
Monthly Housing Cost Tiers in Skyland
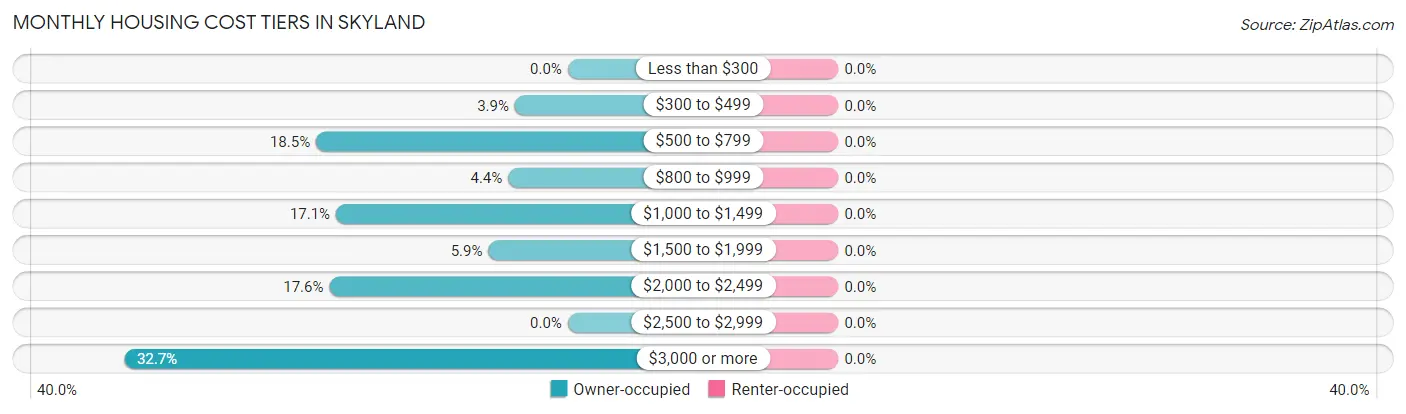
| Monthly Cost | Owner-occupied | Renter-occupied |
| Less than $300 | 0 (0.0%) | 0 (0.0%) |
| $300 to $499 | 8 (3.9%) | 0 (0.0%) |
| $500 to $799 | 38 (18.5%) | 0 (0.0%) |
| $800 to $999 | 9 (4.4%) | 0 (0.0%) |
| $1,000 to $1,499 | 35 (17.1%) | 0 (0.0%) |
| $1,500 to $1,999 | 12 (5.9%) | 0 (0.0%) |
| $2,000 to $2,499 | 36 (17.6%) | 0 (0.0%) |
| $2,500 to $2,999 | 0 (0.0%) | 0 (0.0%) |
| $3,000 or more | 67 (32.7%) | 0 (0.0%) |
| Total | 205 (100.0%) | 0 (0.0%) |
Physical Housing Characteristics in Skyland
Housing Structures in Skyland
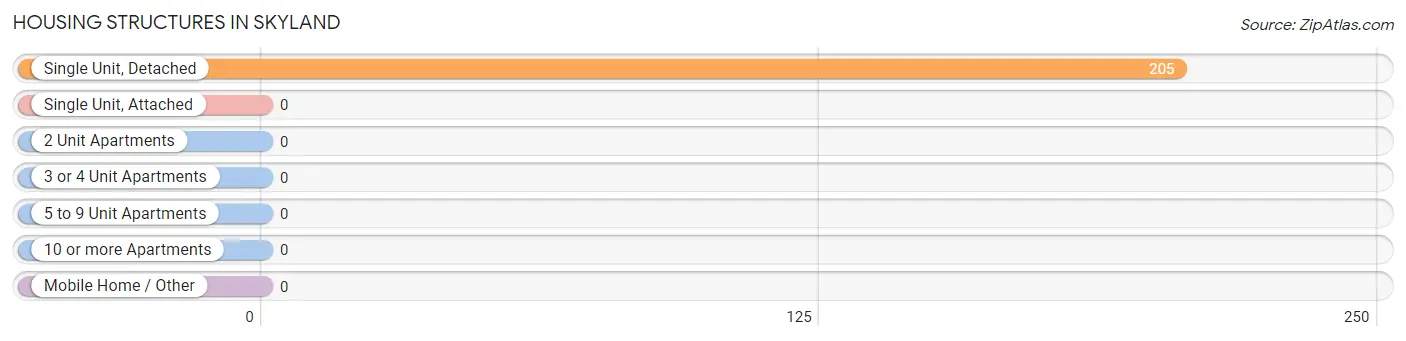
| Structure Type | # Housing Units | % Housing Units |
| Single Unit, Detached | 205 | 100.0% |
| Single Unit, Attached | 0 | 0.0% |
| 2 Unit Apartments | 0 | 0.0% |
| 3 or 4 Unit Apartments | 0 | 0.0% |
| 5 to 9 Unit Apartments | 0 | 0.0% |
| 10 or more Apartments | 0 | 0.0% |
| Mobile Home / Other | 0 | 0.0% |
| Total | 205 | 100.0% |
Housing Structures by Occupancy in Skyland
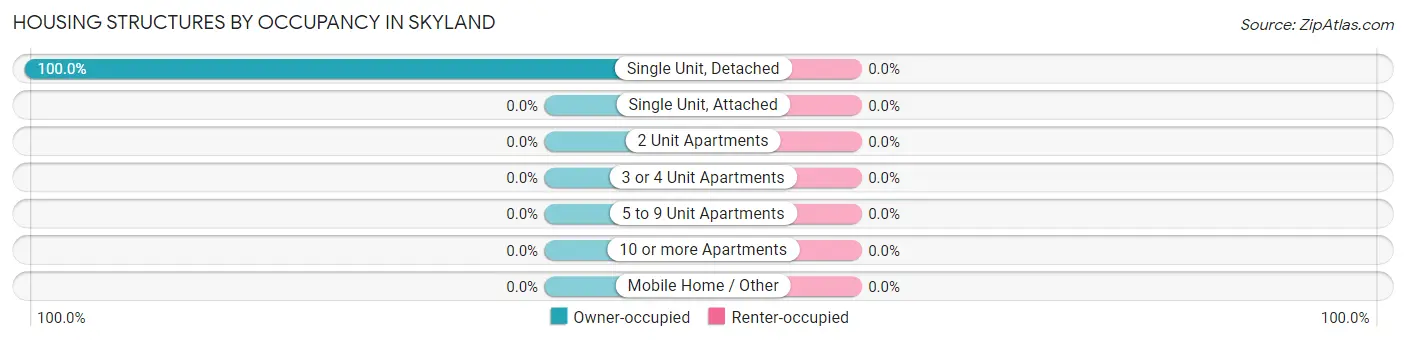
| Structure Type | Owner-occupied | Renter-occupied |
| Single Unit, Detached | 205 (100.0%) | 0 (0.0%) |
| Single Unit, Attached | 0 (0.0%) | 0 (0.0%) |
| 2 Unit Apartments | 0 (0.0%) | 0 (0.0%) |
| 3 or 4 Unit Apartments | 0 (0.0%) | 0 (0.0%) |
| 5 to 9 Unit Apartments | 0 (0.0%) | 0 (0.0%) |
| 10 or more Apartments | 0 (0.0%) | 0 (0.0%) |
| Mobile Home / Other | 0 (0.0%) | 0 (0.0%) |
| Total | 205 (100.0%) | 0 (0.0%) |
Housing Structures by Number of Rooms in Skyland
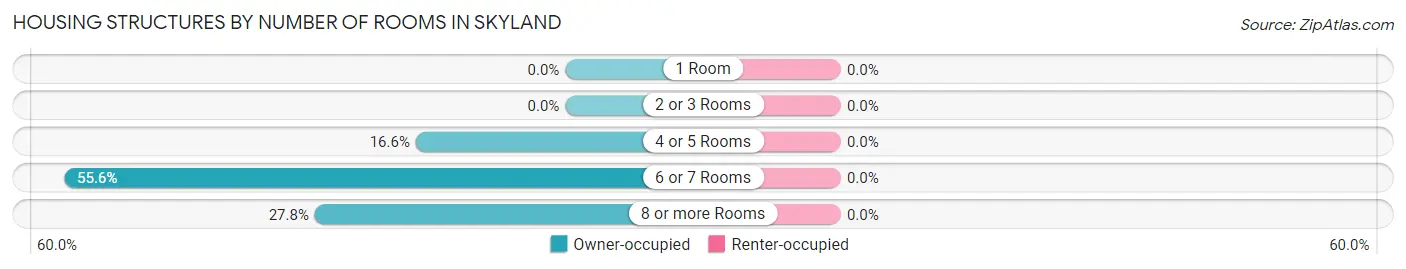
| Number of Rooms | Owner-occupied | Renter-occupied |
| 1 Room | 0 (0.0%) | 0 (0.0%) |
| 2 or 3 Rooms | 0 (0.0%) | 0 (0.0%) |
| 4 or 5 Rooms | 34 (16.6%) | 0 (0.0%) |
| 6 or 7 Rooms | 114 (55.6%) | 0 (0.0%) |
| 8 or more Rooms | 57 (27.8%) | 0 (0.0%) |
| Total | 205 (100.0%) | 0 (0.0%) |
Housing Structure by Heating Type in Skyland
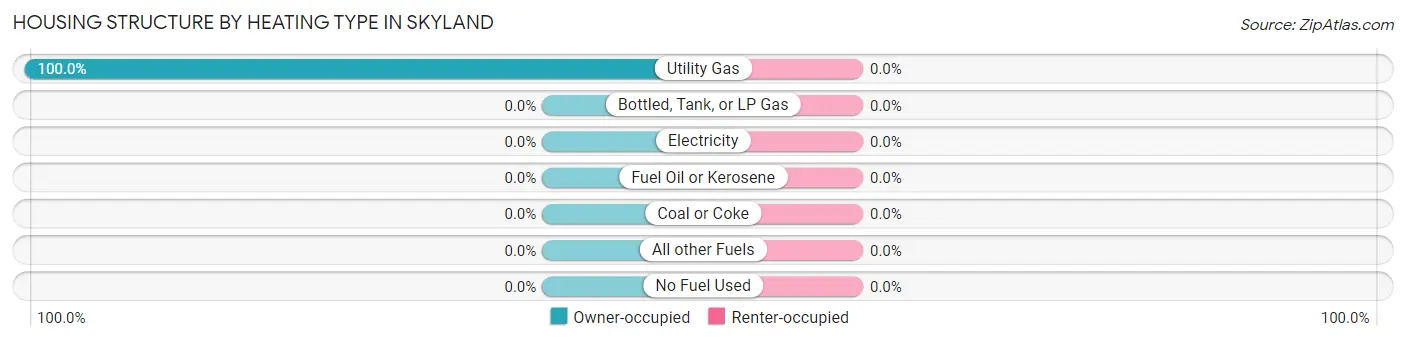
| Heating Type | Owner-occupied | Renter-occupied |
| Utility Gas | 205 (100.0%) | 0 (0.0%) |
| Bottled, Tank, or LP Gas | 0 (0.0%) | 0 (0.0%) |
| Electricity | 0 (0.0%) | 0 (0.0%) |
| Fuel Oil or Kerosene | 0 (0.0%) | 0 (0.0%) |
| Coal or Coke | 0 (0.0%) | 0 (0.0%) |
| All other Fuels | 0 (0.0%) | 0 (0.0%) |
| No Fuel Used | 0 (0.0%) | 0 (0.0%) |
| Total | 205 (100.0%) | 0 (0.0%) |
Household Vehicle Usage in Skyland
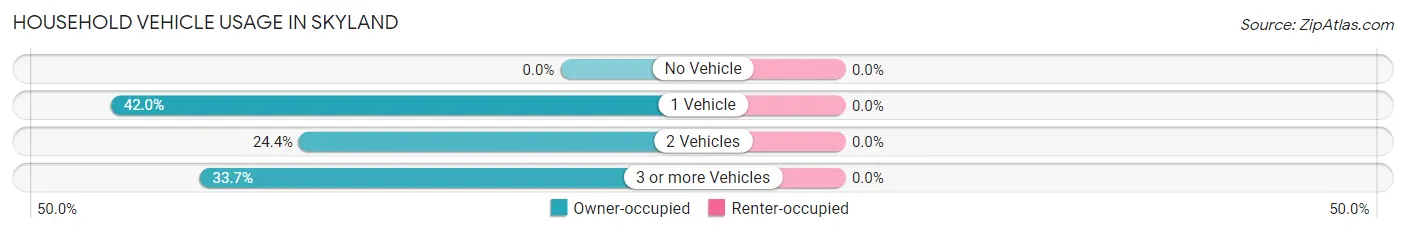
| Vehicles per Household | Owner-occupied | Renter-occupied |
| No Vehicle | 0 (0.0%) | 0 (0.0%) |
| 1 Vehicle | 86 (41.9%) | 0 (0.0%) |
| 2 Vehicles | 50 (24.4%) | 0 (0.0%) |
| 3 or more Vehicles | 69 (33.7%) | 0 (0.0%) |
| Total | 205 (100.0%) | 0 (0.0%) |
Real Estate & Mortgages in Skyland
Real Estate and Mortgage Overview in Skyland
| Characteristic | Without Mortgage | With Mortgage |
| Housing Units | 74 | 131 |
| Median Property Value | - | - |
| Median Household Income | $50,833 | $45 |
| Monthly Housing Costs | $650 | $67 |
| Real Estate Taxes | $3,707 | $0 |
Property Value by Mortgage Status in Skyland
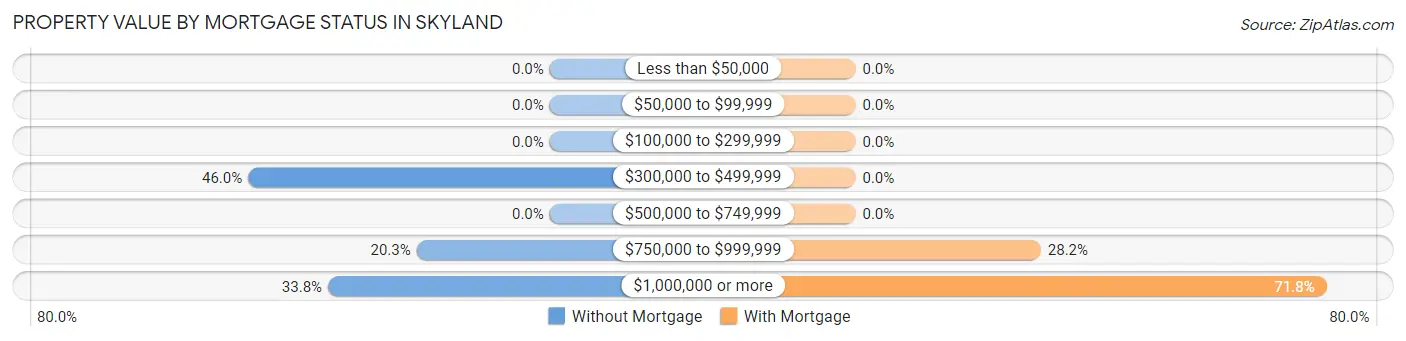
| Property Value | Without Mortgage | With Mortgage |
| Less than $50,000 | 0 (0.0%) | 0 (0.0%) |
| $50,000 to $99,999 | 0 (0.0%) | 0 (0.0%) |
| $100,000 to $299,999 | 0 (0.0%) | 0 (0.0%) |
| $300,000 to $499,999 | 34 (46.0%) | 0 (0.0%) |
| $500,000 to $749,999 | 0 (0.0%) | 0 (0.0%) |
| $750,000 to $999,999 | 15 (20.3%) | 37 (28.2%) |
| $1,000,000 or more | 25 (33.8%) | 94 (71.8%) |
| Total | 74 (100.0%) | 131 (100.0%) |
Household Income by Mortgage Status in Skyland
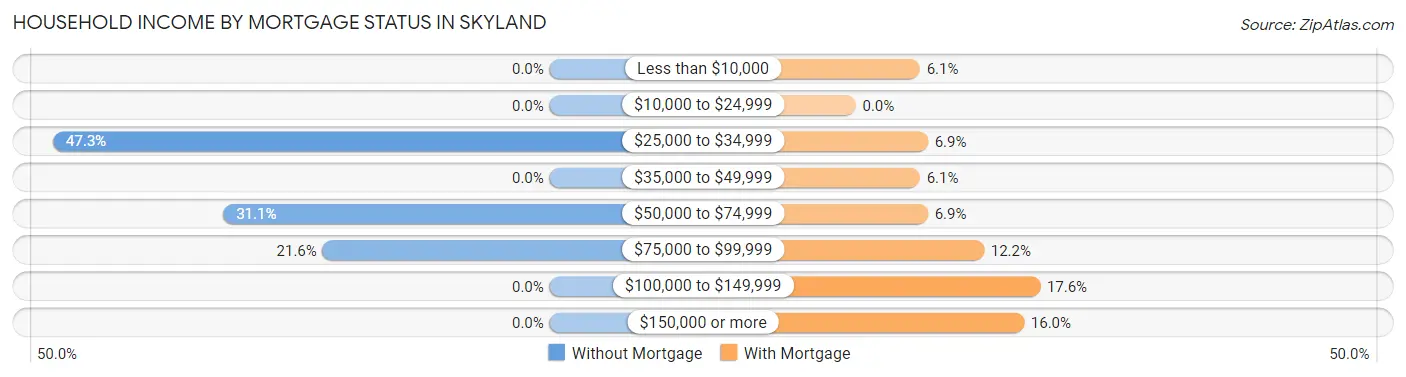
| Household Income | Without Mortgage | With Mortgage |
| Less than $10,000 | 0 (0.0%) | 8 (6.1%) |
| $10,000 to $24,999 | 0 (0.0%) | 0 (0.0%) |
| $25,000 to $34,999 | 35 (47.3%) | 9 (6.9%) |
| $35,000 to $49,999 | 0 (0.0%) | 8 (6.1%) |
| $50,000 to $74,999 | 23 (31.1%) | 9 (6.9%) |
| $75,000 to $99,999 | 16 (21.6%) | 16 (12.2%) |
| $100,000 to $149,999 | 0 (0.0%) | 23 (17.6%) |
| $150,000 or more | 0 (0.0%) | 21 (16.0%) |
| Total | 74 (100.0%) | 131 (100.0%) |
Property Value to Household Income Ratio in Skyland
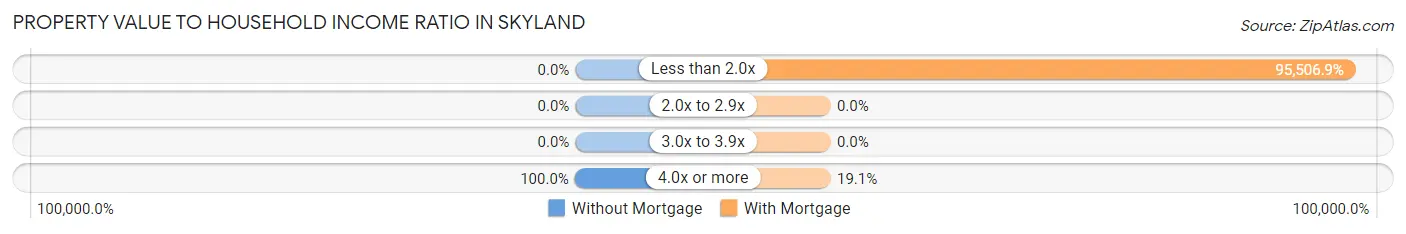
| Value-to-Income Ratio | Without Mortgage | With Mortgage |
| Less than 2.0x | 0 (0.0%) | 125,114 (95,506.9%) |
| 2.0x to 2.9x | 0 (0.0%) | 0 (0.0%) |
| 3.0x to 3.9x | 0 (0.0%) | 0 (0.0%) |
| 4.0x or more | 74 (100.0%) | 25 (19.1%) |
| Total | 74 (100.0%) | 131 (100.0%) |
Real Estate Taxes by Mortgage Status in Skyland
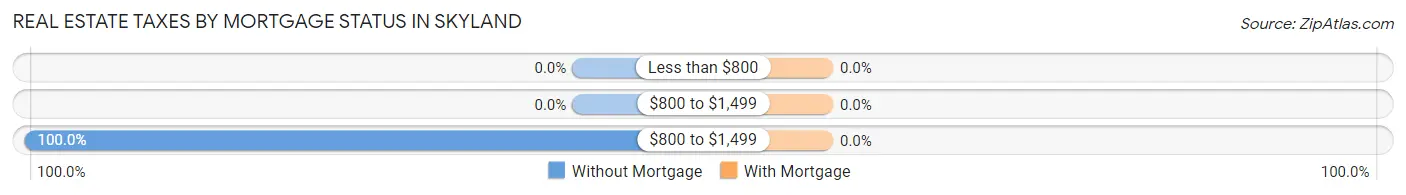
| Property Taxes | Without Mortgage | With Mortgage |
| Less than $800 | 0 (0.0%) | 0 (0.0%) |
| $800 to $1,499 | 0 (0.0%) | 0 (0.0%) |
| $800 to $1,499 | 74 (100.0%) | 0 (0.0%) |
| Total | 74 (100.0%) | 131 (100.0%) |
Health & Disability in Skyland
Health Insurance Coverage by Age in Skyland
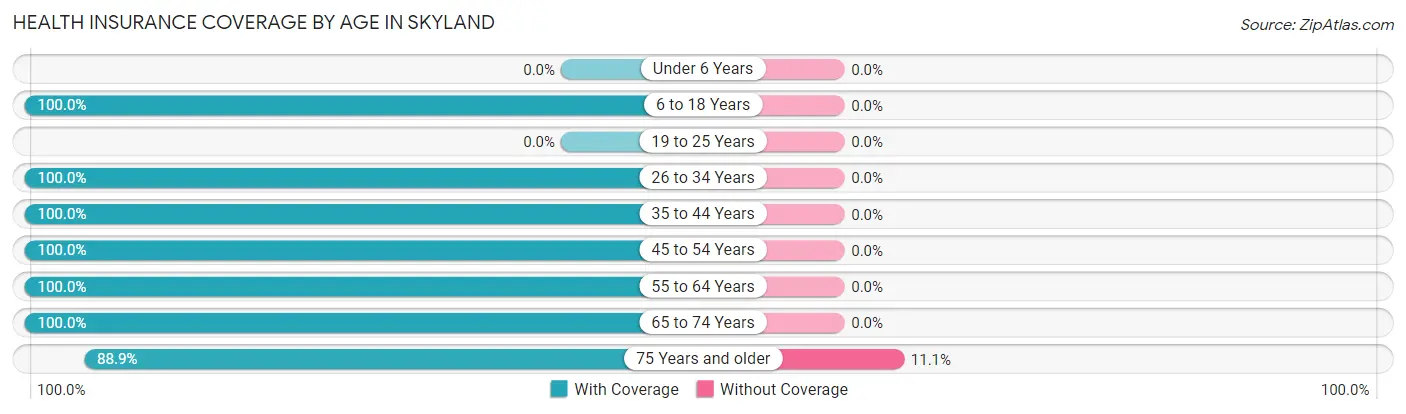
| Age Bracket | With Coverage | Without Coverage |
| Under 6 Years | 0 (0.0%) | 0 (0.0%) |
| 6 to 18 Years | 60 (100.0%) | 0 (0.0%) |
| 19 to 25 Years | 0 (0.0%) | 0 (0.0%) |
| 26 to 34 Years | 12 (100.0%) | 0 (0.0%) |
| 35 to 44 Years | 17 (100.0%) | 0 (0.0%) |
| 45 to 54 Years | 79 (100.0%) | 0 (0.0%) |
| 55 to 64 Years | 76 (100.0%) | 0 (0.0%) |
| 65 to 74 Years | 80 (100.0%) | 0 (0.0%) |
| 75 Years and older | 64 (88.9%) | 8 (11.1%) |
| Total | 388 (98.0%) | 8 (2.0%) |
Health Insurance Coverage by Citizenship Status in Skyland
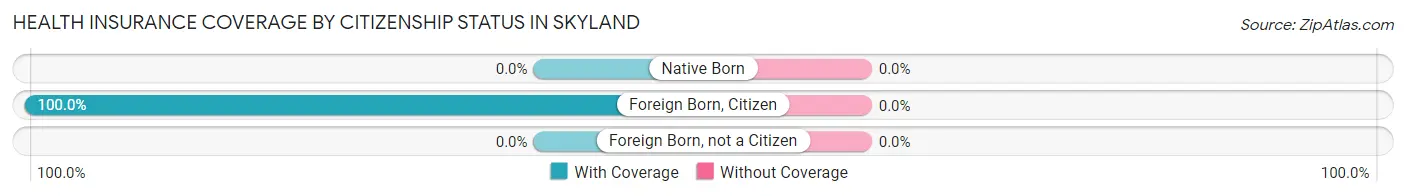
| Citizenship Status | With Coverage | Without Coverage |
| Native Born | 0 (0.0%) | 0 (0.0%) |
| Foreign Born, Citizen | 60 (100.0%) | 0 (0.0%) |
| Foreign Born, not a Citizen | 0 (0.0%) | 0 (0.0%) |
Health Insurance Coverage by Household Income in Skyland
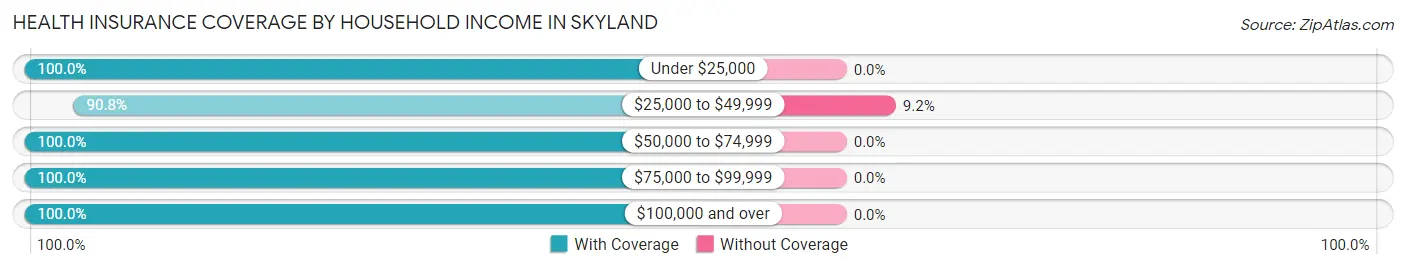
| Household Income | With Coverage | Without Coverage |
| Under $25,000 | 9 (100.0%) | 0 (0.0%) |
| $25,000 to $49,999 | 79 (90.8%) | 8 (9.2%) |
| $50,000 to $74,999 | 72 (100.0%) | 0 (0.0%) |
| $75,000 to $99,999 | 81 (100.0%) | 0 (0.0%) |
| $100,000 and over | 147 (100.0%) | 0 (0.0%) |
Public vs Private Health Insurance Coverage by Age in Skyland
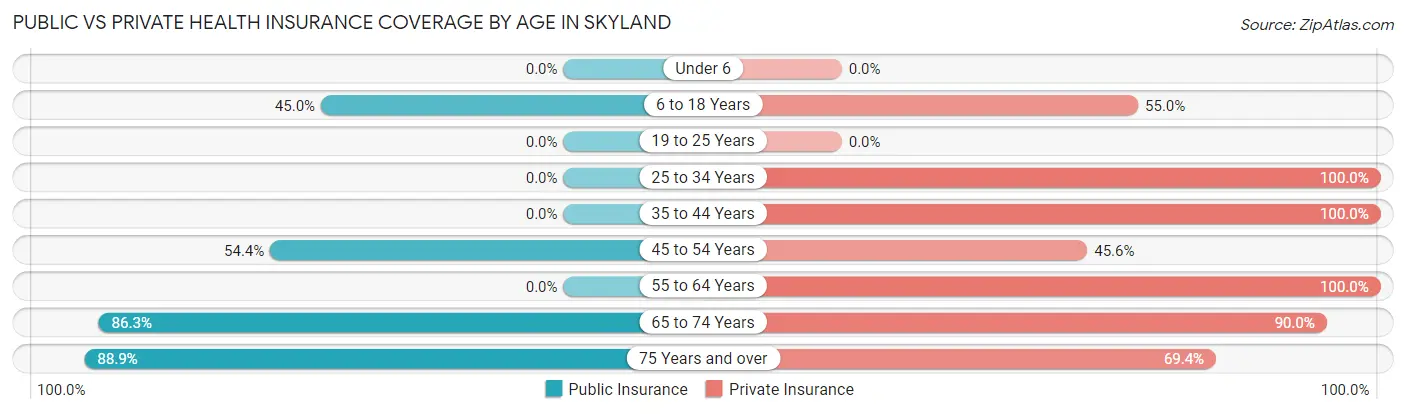
| Age Bracket | Public Insurance | Private Insurance |
| Under 6 | 0 (0.0%) | 0 (0.0%) |
| 6 to 18 Years | 27 (45.0%) | 33 (55.0%) |
| 19 to 25 Years | 0 (0.0%) | 0 (0.0%) |
| 25 to 34 Years | 0 (0.0%) | 12 (100.0%) |
| 35 to 44 Years | 0 (0.0%) | 17 (100.0%) |
| 45 to 54 Years | 43 (54.4%) | 36 (45.6%) |
| 55 to 64 Years | 0 (0.0%) | 76 (100.0%) |
| 65 to 74 Years | 69 (86.3%) | 72 (90.0%) |
| 75 Years and over | 64 (88.9%) | 50 (69.4%) |
| Total | 203 (51.3%) | 296 (74.8%) |
Disability Status by Sex by Age in Skyland
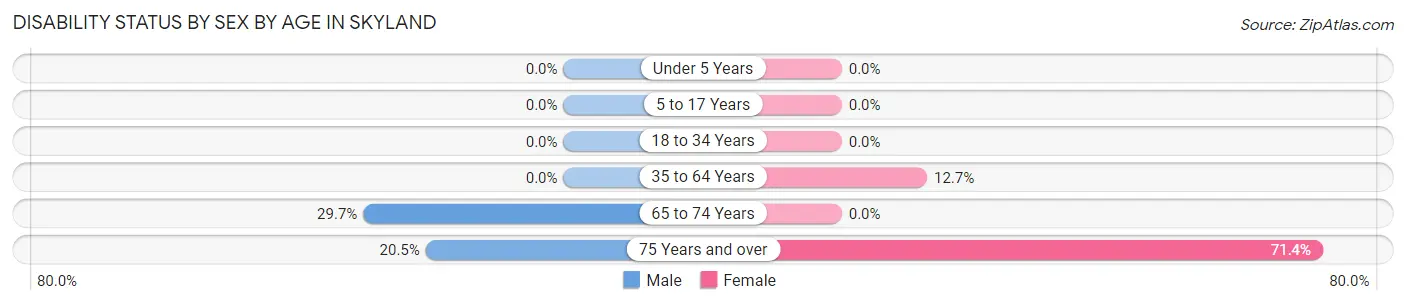
| Age Bracket | Male | Female |
| Under 5 Years | 0 (0.0%) | 0 (0.0%) |
| 5 to 17 Years | 0 (0.0%) | 0 (0.0%) |
| 18 to 34 Years | 0 (0.0%) | 0 (0.0%) |
| 35 to 64 Years | 0 (0.0%) | 10 (12.7%) |
| 65 to 74 Years | 11 (29.7%) | 0 (0.0%) |
| 75 Years and over | 9 (20.4%) | 20 (71.4%) |
Disability Class by Sex by Age in Skyland
Disability Class: Hearing Difficulty
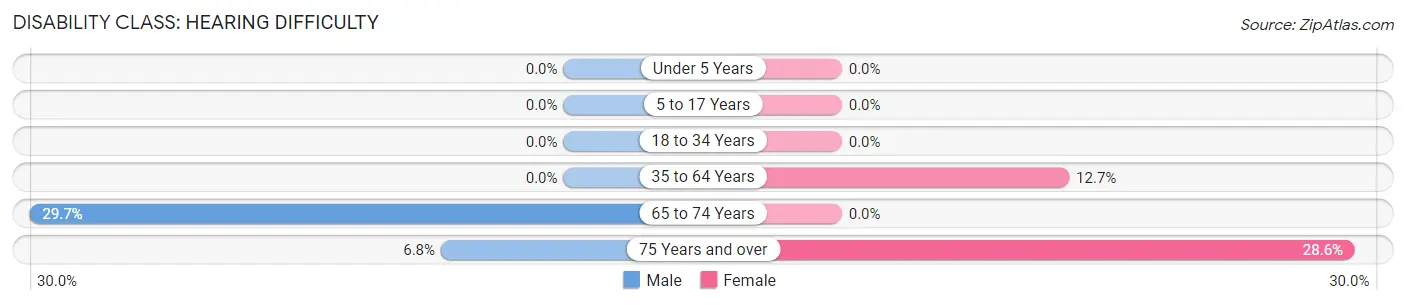
| Age Bracket | Male | Female |
| Under 5 Years | 0 (0.0%) | 0 (0.0%) |
| 5 to 17 Years | 0 (0.0%) | 0 (0.0%) |
| 18 to 34 Years | 0 (0.0%) | 0 (0.0%) |
| 35 to 64 Years | 0 (0.0%) | 10 (12.7%) |
| 65 to 74 Years | 11 (29.7%) | 0 (0.0%) |
| 75 Years and over | 3 (6.8%) | 8 (28.6%) |
Disability Class: Vision Difficulty
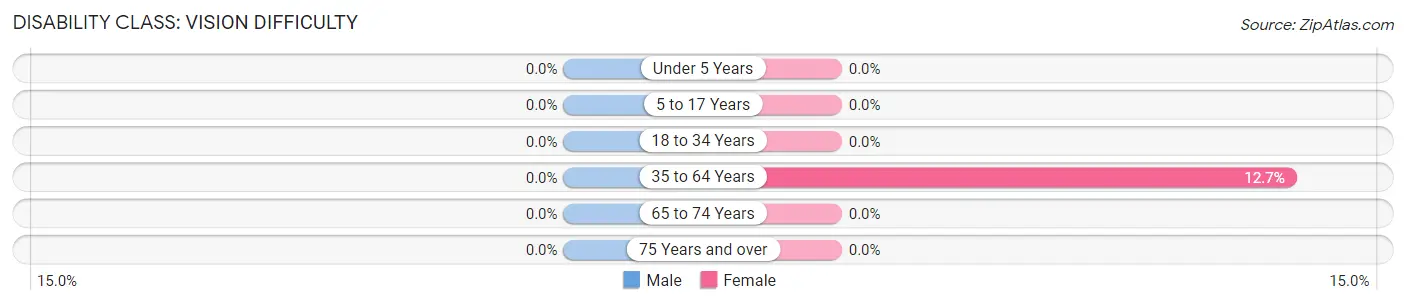
| Age Bracket | Male | Female |
| Under 5 Years | 0 (0.0%) | 0 (0.0%) |
| 5 to 17 Years | 0 (0.0%) | 0 (0.0%) |
| 18 to 34 Years | 0 (0.0%) | 0 (0.0%) |
| 35 to 64 Years | 0 (0.0%) | 10 (12.7%) |
| 65 to 74 Years | 0 (0.0%) | 0 (0.0%) |
| 75 Years and over | 0 (0.0%) | 0 (0.0%) |
Disability Class: Cognitive Difficulty
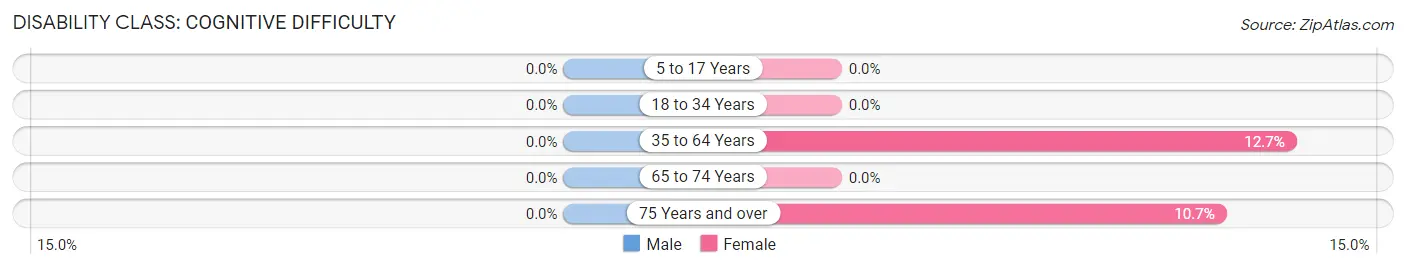
| Age Bracket | Male | Female |
| 5 to 17 Years | 0 (0.0%) | 0 (0.0%) |
| 18 to 34 Years | 0 (0.0%) | 0 (0.0%) |
| 35 to 64 Years | 0 (0.0%) | 10 (12.7%) |
| 65 to 74 Years | 0 (0.0%) | 0 (0.0%) |
| 75 Years and over | 0 (0.0%) | 3 (10.7%) |
Disability Class: Ambulatory Difficulty
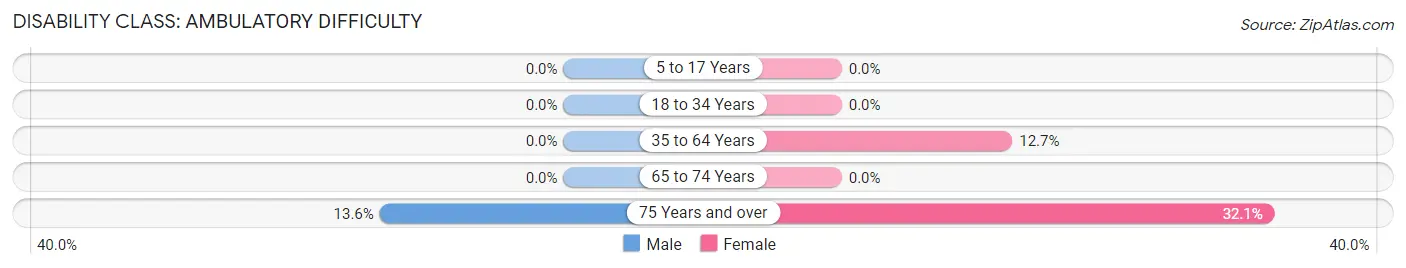
| Age Bracket | Male | Female |
| 5 to 17 Years | 0 (0.0%) | 0 (0.0%) |
| 18 to 34 Years | 0 (0.0%) | 0 (0.0%) |
| 35 to 64 Years | 0 (0.0%) | 10 (12.7%) |
| 65 to 74 Years | 0 (0.0%) | 0 (0.0%) |
| 75 Years and over | 6 (13.6%) | 9 (32.1%) |
Disability Class: Self-Care Difficulty
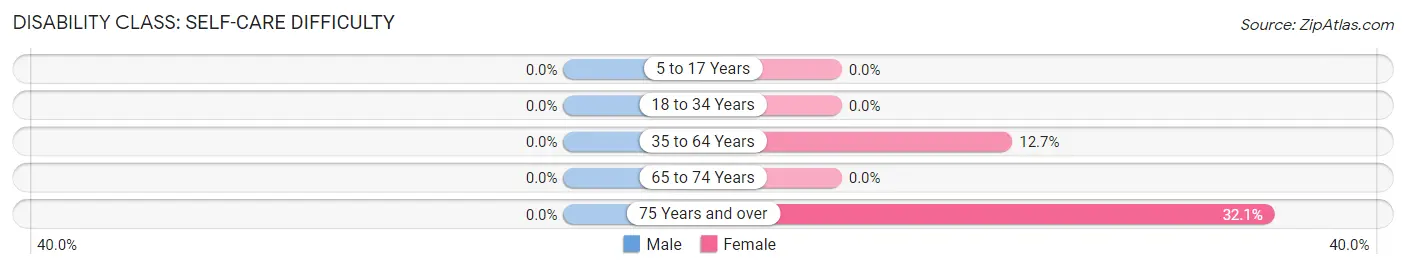
| Age Bracket | Male | Female |
| 5 to 17 Years | 0 (0.0%) | 0 (0.0%) |
| 18 to 34 Years | 0 (0.0%) | 0 (0.0%) |
| 35 to 64 Years | 0 (0.0%) | 10 (12.7%) |
| 65 to 74 Years | 0 (0.0%) | 0 (0.0%) |
| 75 Years and over | 0 (0.0%) | 9 (32.1%) |
Technology Access in Skyland
Computing Device Access in Skyland
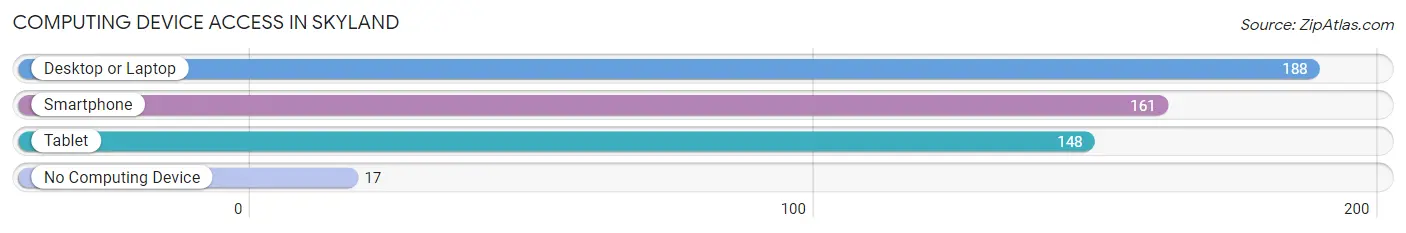
| Device Type | # Households | % Households |
| Desktop or Laptop | 188 | 91.7% |
| Smartphone | 161 | 78.5% |
| Tablet | 148 | 72.2% |
| No Computing Device | 17 | 8.3% |
| Total | 205 | 100.0% |
Internet Access in Skyland
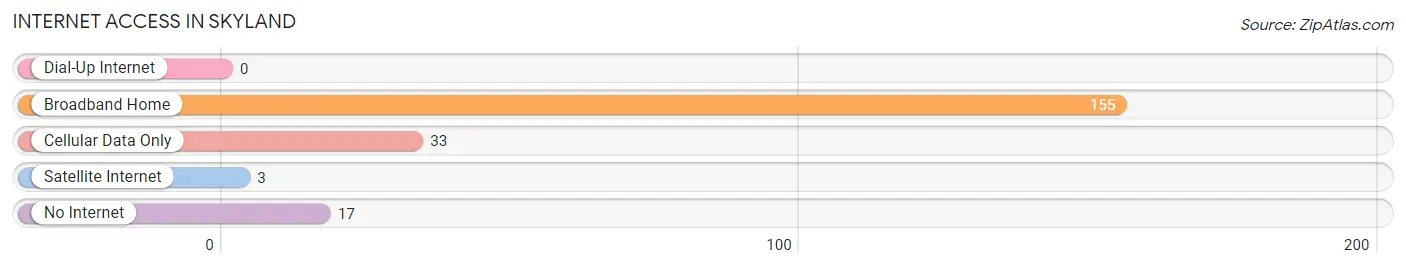
| Internet Type | # Households | % Households |
| Dial-Up Internet | 0 | 0.0% |
| Broadband Home | 155 | 75.6% |
| Cellular Data Only | 33 | 16.1% |
| Satellite Internet | 3 | 1.5% |
| No Internet | 17 | 8.3% |
| Total | 205 | 100.0% |
Skyland Summary
Skyland is a small unincorporated community located in the state of Nevada, in the United States. It is situated in the northern part of the state, in the Humboldt County, and is located about 20 miles south of the city of Winnemucca. Skyland is a rural community, with a population of just over 200 people, according to the 2010 census.
History
Skyland was first settled in the late 1800s, when a group of ranchers and miners moved into the area. The town was originally known as “Skyland Station”, and was a stop on the Central Pacific Railroad. The town was officially established in 1883, and was named after the nearby Skyland Mountain.
In the early 1900s, Skyland was a thriving community, with a population of over 500 people. The town had several businesses, including a hotel, a general store, a saloon, and a post office. The town also had a school, which was built in 1906.
Geography
Skyland is located in the northern part of Nevada, in the Humboldt County. It is situated about 20 miles south of the city of Winnemucca, and is located at an elevation of 4,890 feet. The town is surrounded by the Humboldt National Forest, and is located near the Humboldt River.
The climate in Skyland is semi-arid, with hot summers and cold winters. The average annual temperature is around 50 degrees Fahrenheit, and the average annual precipitation is around 8 inches.
Economy
The economy of Skyland is largely based on agriculture and ranching. The town is home to several farms and ranches, which produce a variety of crops and livestock. The town also has a few small businesses, including a general store and a gas station.
Demographics
According to the 2010 census, the population of Skyland was 206 people. The racial makeup of the town was 95.1% White, 0.5% African American, 0.5% Native American, 0.5% Asian, and 3.4% from other races. The median household income was $37,500, and the median age was 44 years.
Skyland is a small, rural community with a rich history and a unique culture. The town is home to a diverse population, and is a great place to live and work. The town is surrounded by beautiful scenery, and offers a peaceful and quiet lifestyle.
Common Questions
What is Per Capita Income in Skyland?
Per Capita income in Skyland is $67,083.
What is the Median Family Income in Skyland?
Median Family Income in Skyland is $84,130.
What is the Median Household income in Skyland?
Median Household Income in Skyland is $82,772.
What is Inequality or Gini Index in Skyland?
Inequality or Gini Index in Skyland is 0.48.
What is the Total Population of Skyland?
Total Population of Skyland is 396.
What is the Total Male Population of Skyland?
Total Male Population of Skyland is 235.
What is the Total Female Population of Skyland?
Total Female Population of Skyland is 161.
What is the Ratio of Males per 100 Females in Skyland?
There are 145.96 Males per 100 Females in Skyland.
What is the Ratio of Females per 100 Males in Skyland?
There are 68.51 Females per 100 Males in Skyland.
What is the Median Population Age in Skyland?
Median Population Age in Skyland is 60.8 Years.
What is the Average Family Size in Skyland
Average Family Size in Skyland is 2.2 People.
What is the Average Household Size in Skyland
Average Household Size in Skyland is 1.9 People.
How Large is the Labor Force in Skyland?
There are 119 People in the Labor Forcein in Skyland.
What is the Percentage of People in the Labor Force in Skyland?
32.0% of People are in the Labor Force in Skyland.