Juntura, OR Map & Demographics
Juntura Map
Juntura Overview
$24,076
PER CAPITA INCOME
0.56
INEQUALITY / GINI INDEX
21
TOTAL POPULATION
9
MALE POPULATION
12
FEMALE POPULATION
75.00
MALES / 100 FEMALES
133.33
FEMALES / 100 MALES
64.5
MEDIAN AGE
2.0
AVG FAMILY SIZE
1.2
AVG HOUSEHOLD SIZE
8
LABOR FORCE [ PEOPLE ]
38.1%
PERCENT IN LABOR FORCE
Juntura Zip Codes
Juntura Area Codes
Income in Juntura
Income Overview in Juntura
| Characteristic | Number | Measure |
| Per Capita Income | 21 | $24,076 |
| Median Family Income | 3 | $0 |
| Mean Family Income | 3 | $60,200 |
| Median Household Income | 18 | $0 |
| Mean Household Income | 18 | $28,089 |
| Income Deficit | 3 | $0 |
| Wage / Income Gap (%) | 21 | 0.00% |
| Wage / Income Gap ($) | 21 | 100.00¢ per $1 |
| Gini / Inequality Index | 21 | 0.56 |
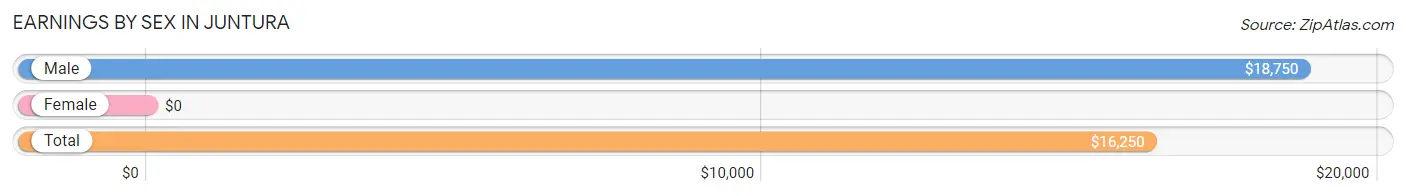
Earnings by Sex in Juntura
| Sex | Number | Average Earnings |
| Male | 7 (63.6%) | $18,750 |
| Female | 4 (36.4%) | $0 |
| Total | 11 (100.0%) | $16,250 |
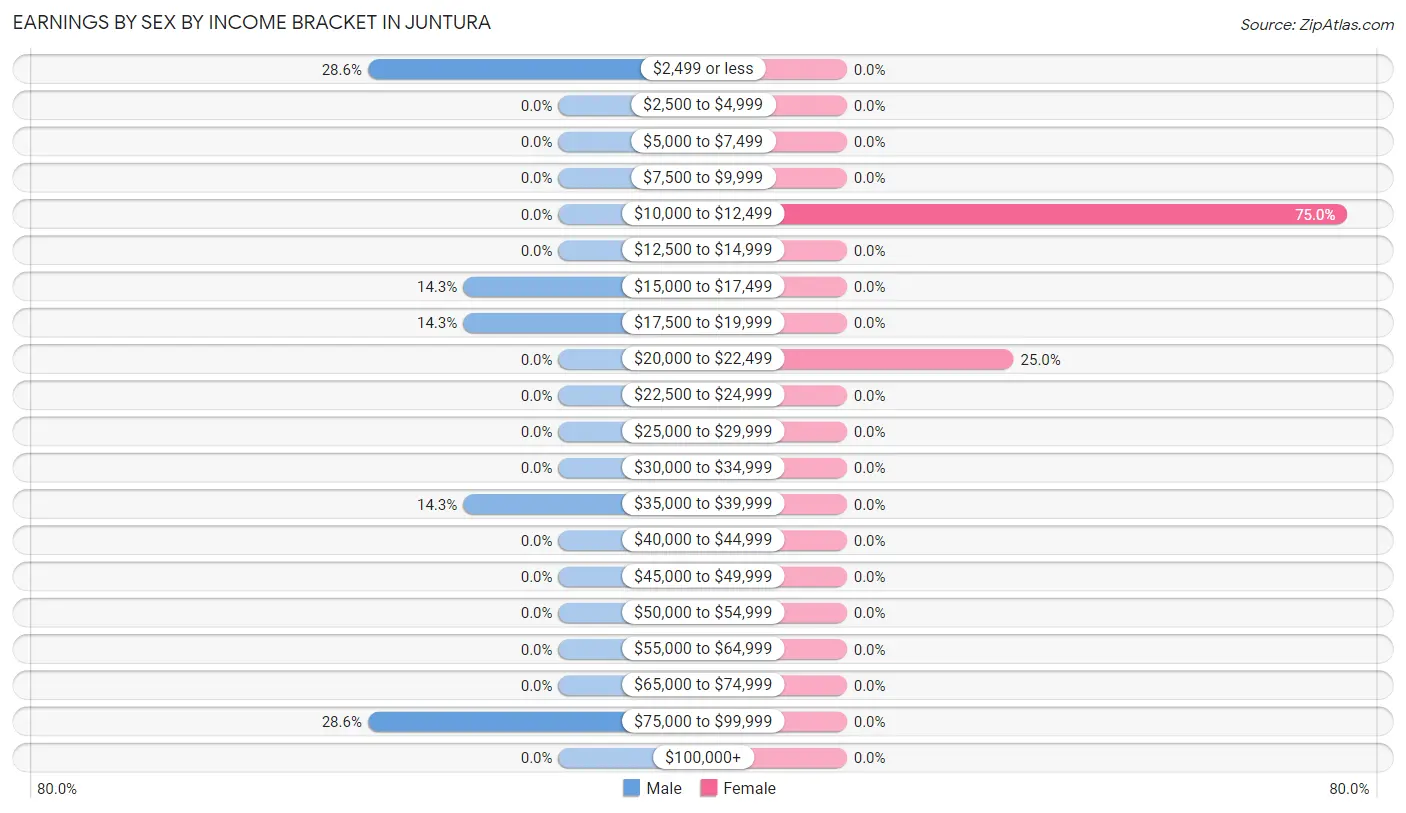
Earnings by Sex by Income Bracket in Juntura
The most common earnings brackets in Juntura are $2,499 or less for men (2 | 28.6%) and $10,000 to $12,499 for women (3 | 75.0%).
| Income | Male | Female |
| $2,499 or less | 2 (28.6%) | 0 (0.0%) |
| $2,500 to $4,999 | 0 (0.0%) | 0 (0.0%) |
| $5,000 to $7,499 | 0 (0.0%) | 0 (0.0%) |
| $7,500 to $9,999 | 0 (0.0%) | 0 (0.0%) |
| $10,000 to $12,499 | 0 (0.0%) | 3 (75.0%) |
| $12,500 to $14,999 | 0 (0.0%) | 0 (0.0%) |
| $15,000 to $17,499 | 1 (14.3%) | 0 (0.0%) |
| $17,500 to $19,999 | 1 (14.3%) | 0 (0.0%) |
| $20,000 to $22,499 | 0 (0.0%) | 1 (25.0%) |
| $22,500 to $24,999 | 0 (0.0%) | 0 (0.0%) |
| $25,000 to $29,999 | 0 (0.0%) | 0 (0.0%) |
| $30,000 to $34,999 | 0 (0.0%) | 0 (0.0%) |
| $35,000 to $39,999 | 1 (14.3%) | 0 (0.0%) |
| $40,000 to $44,999 | 0 (0.0%) | 0 (0.0%) |
| $45,000 to $49,999 | 0 (0.0%) | 0 (0.0%) |
| $50,000 to $54,999 | 0 (0.0%) | 0 (0.0%) |
| $55,000 to $64,999 | 0 (0.0%) | 0 (0.0%) |
| $65,000 to $74,999 | 0 (0.0%) | 0 (0.0%) |
| $75,000 to $99,999 | 2 (28.6%) | 0 (0.0%) |
| $100,000+ | 0 (0.0%) | 0 (0.0%) |
| Total | 7 (100.0%) | 4 (100.0%) |
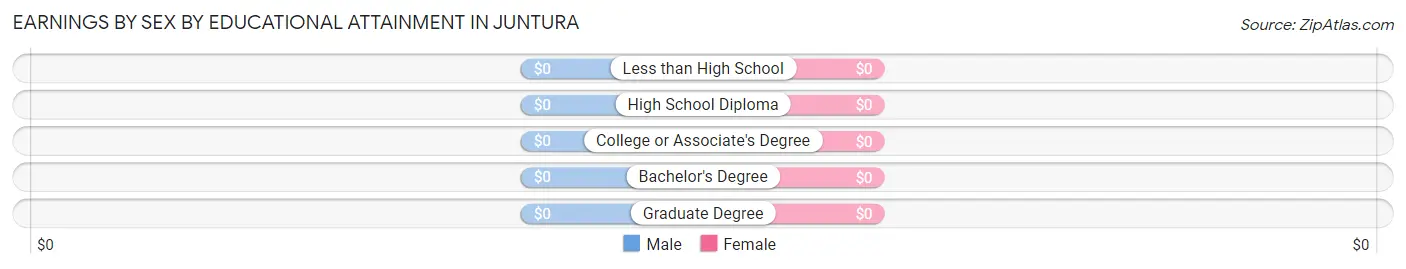
Earnings by Sex by Educational Attainment in Juntura
| Educational Attainment | Male Income | Female Income |
| Less than High School | - | - |
| High School Diploma | - | - |
| College or Associate's Degree | - | - |
| Bachelor's Degree | - | - |
| Graduate Degree | - | - |
| Total | $18,750 | $0 |
Family Income in Juntura
Family Income Brackets in Juntura
According to the Juntura family income data, there are 2 families falling into the $35,000 to $49,999 income range, which is the most common income bracket and makes up 66.7% of all families.
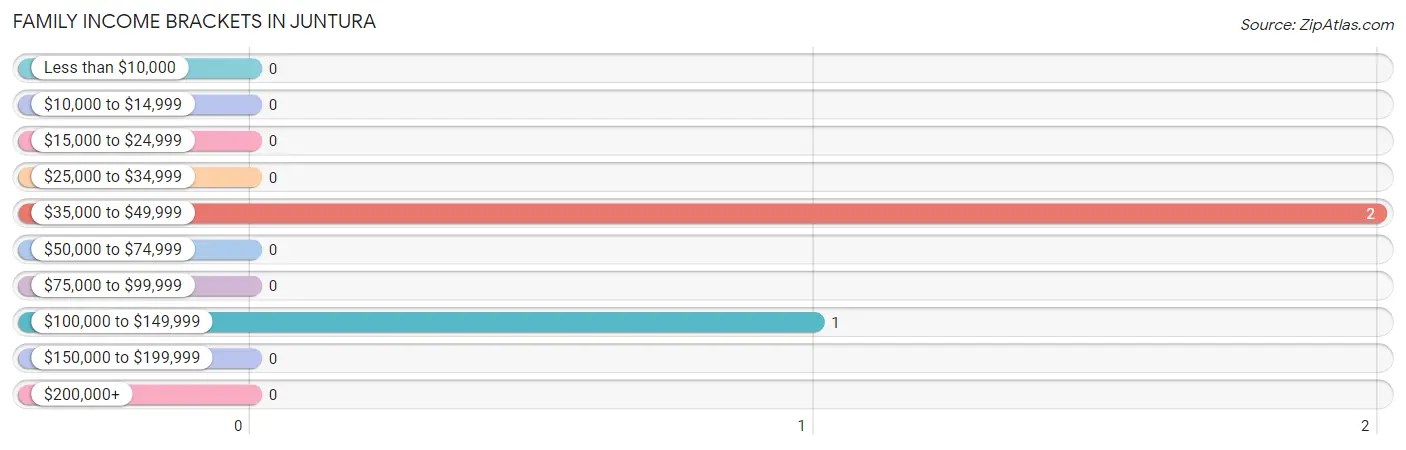
| Income Bracket | # Families | % Families |
| Less than $10,000 | 0 | 0.0% |
| $10,000 to $14,999 | 0 | 0.0% |
| $15,000 to $24,999 | 0 | 0.0% |
| $25,000 to $34,999 | 0 | 0.0% |
| $35,000 to $49,999 | 2 | 66.7% |
| $50,000 to $74,999 | 0 | 0.0% |
| $75,000 to $99,999 | 0 | 0.0% |
| $100,000 to $149,999 | 1 | 33.3% |
| $150,000 to $199,999 | 0 | 0.0% |
| $200,000+ | 0 | 0.0% |
Family Income by Famaliy Size in Juntura
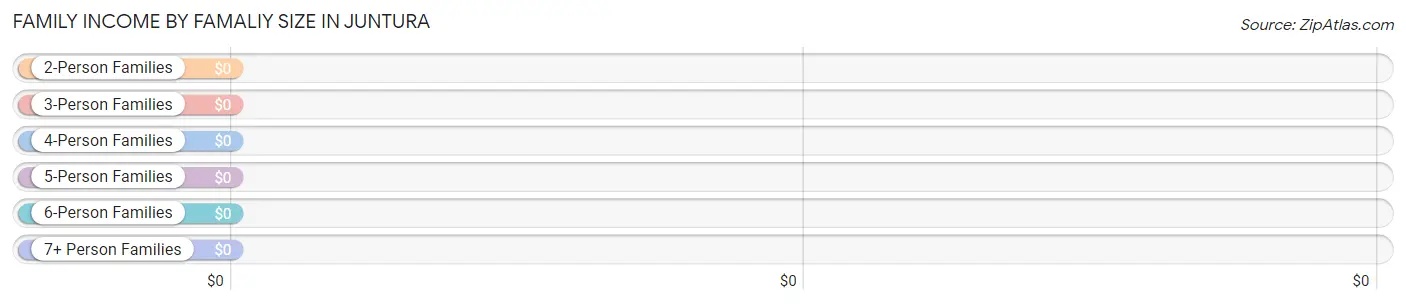
| Income Bracket | # Families | Median Income |
| 2-Person Families | 3 (100.0%) | $0 |
| 3-Person Families | 0 (0.0%) | $0 |
| 4-Person Families | 0 (0.0%) | $0 |
| 5-Person Families | 0 (0.0%) | $0 |
| 6-Person Families | 0 (0.0%) | $0 |
| 7+ Person Families | 0 (0.0%) | $0 |
| Total | 3 (100.0%) | $0 |
Family Income by Number of Earners in Juntura
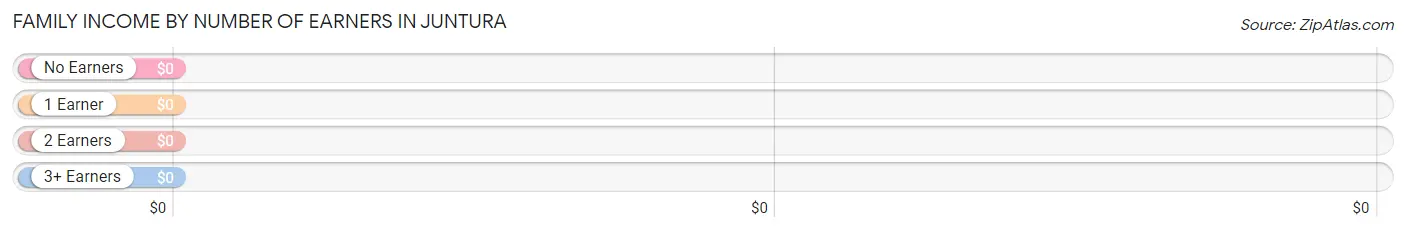
| Number of Earners | # Families | Median Income |
| No Earners | 2 (66.7%) | $0 |
| 1 Earner | 1 (33.3%) | $0 |
| 2 Earners | 0 (0.0%) | $0 |
| 3+ Earners | 0 (0.0%) | $0 |
| Total | 3 (100.0%) | $0 |
Household Income in Juntura
Household Income Brackets in Juntura
With 6 households falling in the category, the less than $10,000 income range is the most frequent in Juntura, accounting for 33.3% of all households.
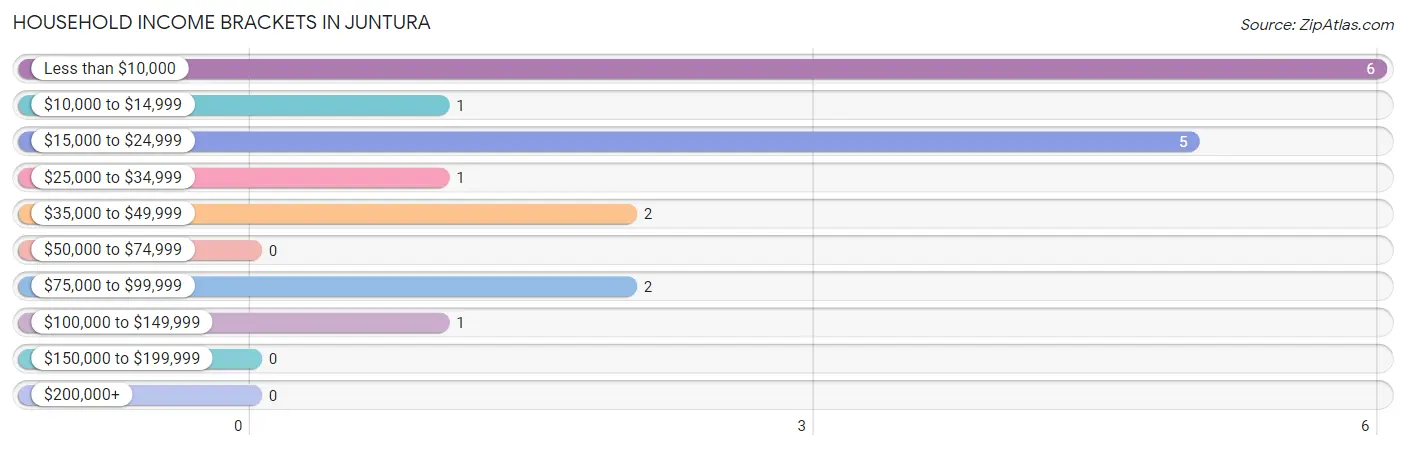
| Income Bracket | # Households | % Households |
| Less than $10,000 | 6 | 33.3% |
| $10,000 to $14,999 | 1 | 5.6% |
| $15,000 to $24,999 | 5 | 27.8% |
| $25,000 to $34,999 | 1 | 5.6% |
| $35,000 to $49,999 | 2 | 11.1% |
| $50,000 to $74,999 | 0 | 0.0% |
| $75,000 to $99,999 | 2 | 11.1% |
| $100,000 to $149,999 | 1 | 5.6% |
| $150,000 to $199,999 | 0 | 0.0% |
| $200,000+ | 0 | 0.0% |
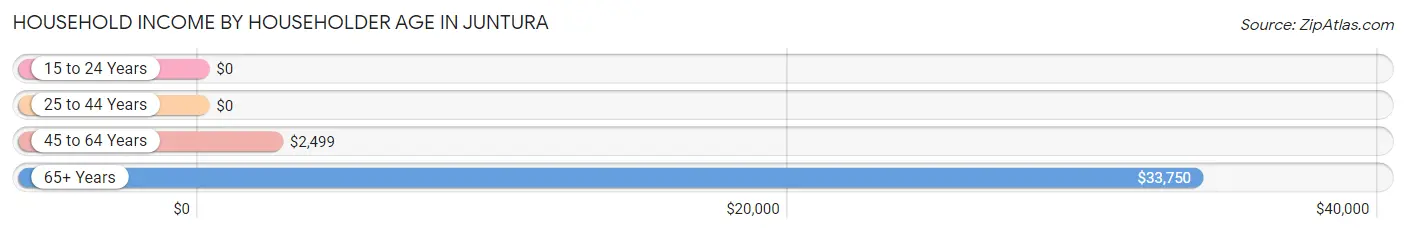
Household Income by Householder Age in Juntura
The median household income in Juntura is $0, with the highest median household income of $33,750 found in the 65+ years age bracket for the primary householder. A total of 9 households (50.0%) fall into this category.
| Income Bracket | # Households | Median Income |
| 15 to 24 Years | 0 (0.0%) | $0 |
| 25 to 44 Years | 1 (5.6%) | $0 |
| 45 to 64 Years | 8 (44.4%) | $2,499 |
| 65+ Years | 9 (50.0%) | $33,750 |
| Total | 18 (100.0%) | $0 |
Poverty in Juntura
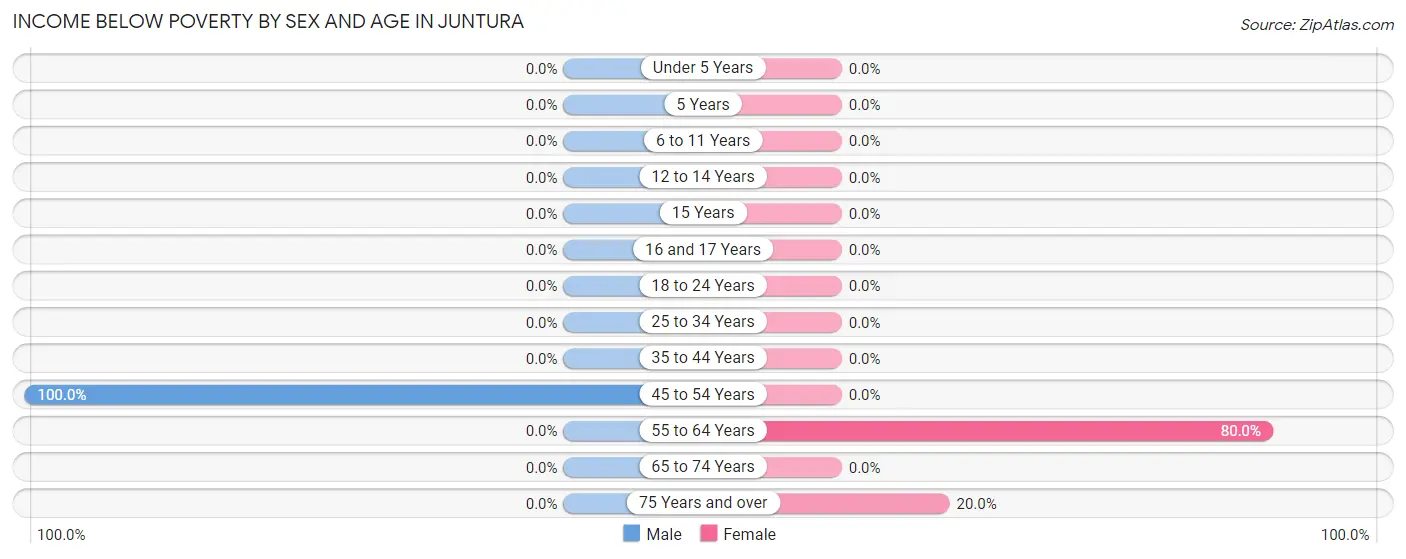
Income Below Poverty by Sex and Age in Juntura
With 22.2% poverty level for males and 41.7% for females among the residents of Juntura, 45 to 54 year old males and 55 to 64 year old females are the most vulnerable to poverty, with 2 males (100.0%) and 4 females (80.0%) in their respective age groups living below the poverty level.
| Age Bracket | Male | Female |
| Under 5 Years | 0 (0.0%) | 0 (0.0%) |
| 5 Years | 0 (0.0%) | 0 (0.0%) |
| 6 to 11 Years | 0 (0.0%) | 0 (0.0%) |
| 12 to 14 Years | 0 (0.0%) | 0 (0.0%) |
| 15 Years | 0 (0.0%) | 0 (0.0%) |
| 16 and 17 Years | 0 (0.0%) | 0 (0.0%) |
| 18 to 24 Years | 0 (0.0%) | 0 (0.0%) |
| 25 to 34 Years | 0 (0.0%) | 0 (0.0%) |
| 35 to 44 Years | 0 (0.0%) | 0 (0.0%) |
| 45 to 54 Years | 2 (100.0%) | 0 (0.0%) |
| 55 to 64 Years | 0 (0.0%) | 4 (80.0%) |
| 65 to 74 Years | 0 (0.0%) | 0 (0.0%) |
| 75 Years and over | 0 (0.0%) | 1 (20.0%) |
| Total | 2 (22.2%) | 5 (41.7%) |
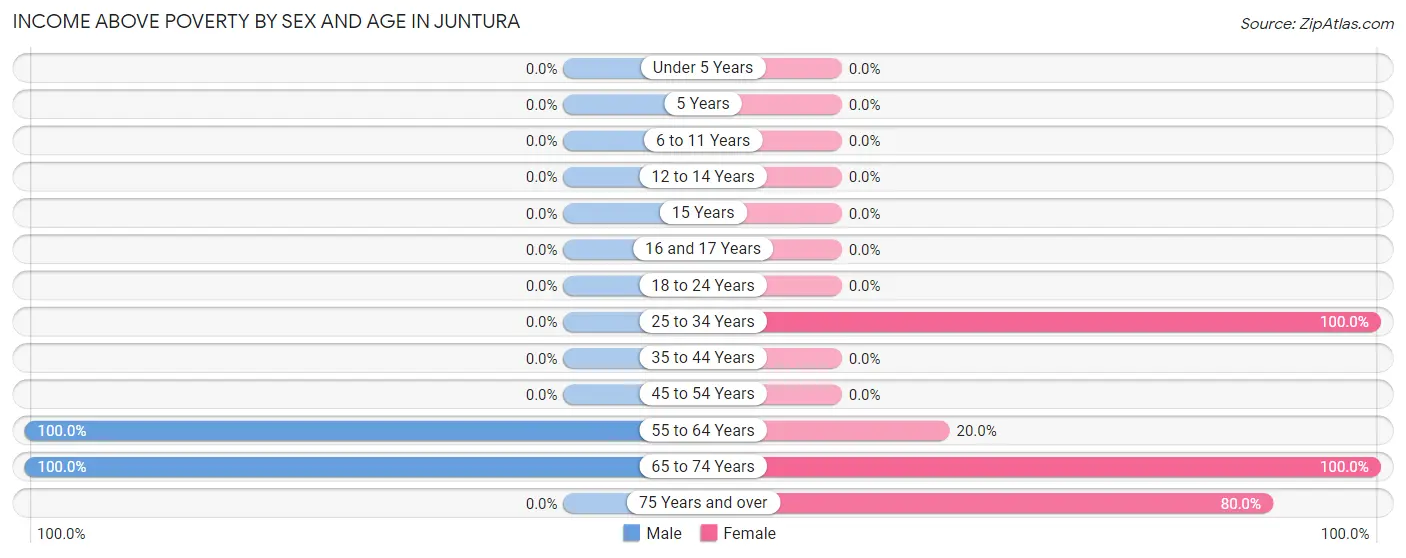
Income Above Poverty by Sex and Age in Juntura
According to the poverty statistics in Juntura, males aged 55 to 64 years and females aged 25 to 34 years are the age groups that are most secure financially, with 100.0% of males and 100.0% of females in these age groups living above the poverty line.
| Age Bracket | Male | Female |
| Under 5 Years | 0 (0.0%) | 0 (0.0%) |
| 5 Years | 0 (0.0%) | 0 (0.0%) |
| 6 to 11 Years | 0 (0.0%) | 0 (0.0%) |
| 12 to 14 Years | 0 (0.0%) | 0 (0.0%) |
| 15 Years | 0 (0.0%) | 0 (0.0%) |
| 16 and 17 Years | 0 (0.0%) | 0 (0.0%) |
| 18 to 24 Years | 0 (0.0%) | 0 (0.0%) |
| 25 to 34 Years | 0 (0.0%) | 1 (100.0%) |
| 35 to 44 Years | 0 (0.0%) | 0 (0.0%) |
| 45 to 54 Years | 0 (0.0%) | 0 (0.0%) |
| 55 to 64 Years | 3 (100.0%) | 1 (20.0%) |
| 65 to 74 Years | 4 (100.0%) | 1 (100.0%) |
| 75 Years and over | 0 (0.0%) | 4 (80.0%) |
| Total | 7 (77.8%) | 7 (58.3%) |
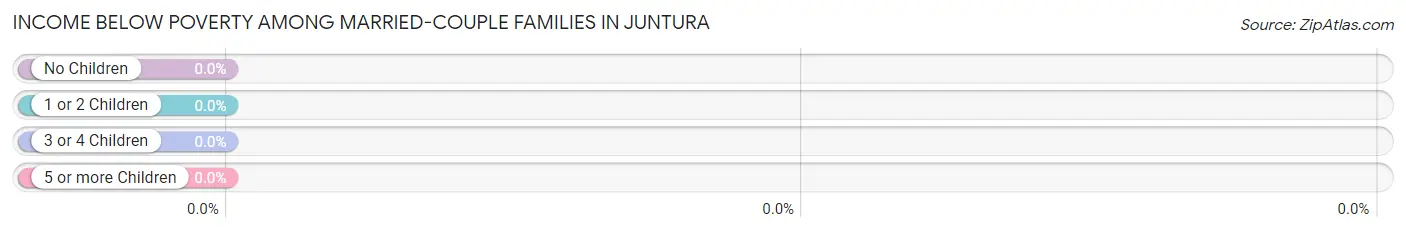
Income Below Poverty Among Married-Couple Families in Juntura
| Children | Above Poverty | Below Poverty |
| No Children | 2 (100.0%) | 0 (0.0%) |
| 1 or 2 Children | 0 (0.0%) | 0 (0.0%) |
| 3 or 4 Children | 0 (0.0%) | 0 (0.0%) |
| 5 or more Children | 0 (0.0%) | 0 (0.0%) |
| Total | 2 (100.0%) | 0 (0.0%) |
Income Below Poverty Among Single-Parent Households in Juntura
| Children | Single Father | Single Mother |
| No Children | 0 (0.0%) | 0 (0.0%) |
| 1 or 2 Children | 0 (0.0%) | 0 (0.0%) |
| 3 or 4 Children | 0 (0.0%) | 0 (0.0%) |
| 5 or more Children | 0 (0.0%) | 0 (0.0%) |
| Total | 0 (0.0%) | 0 (0.0%) |
Income Below Poverty Among Married-Couple vs Single-Parent Households in Juntura
| Children | Married-Couple Families | Single-Parent Households |
| No Children | 0 (0.0%) | 0 (0.0%) |
| 1 or 2 Children | 0 (0.0%) | 0 (0.0%) |
| 3 or 4 Children | 0 (0.0%) | 0 (0.0%) |
| 5 or more Children | 0 (0.0%) | 0 (0.0%) |
| Total | 0 (0.0%) | 0 (0.0%) |
Race in Juntura
The most populous races in Juntura are , and White / Caucasian (21 | 100.0%).
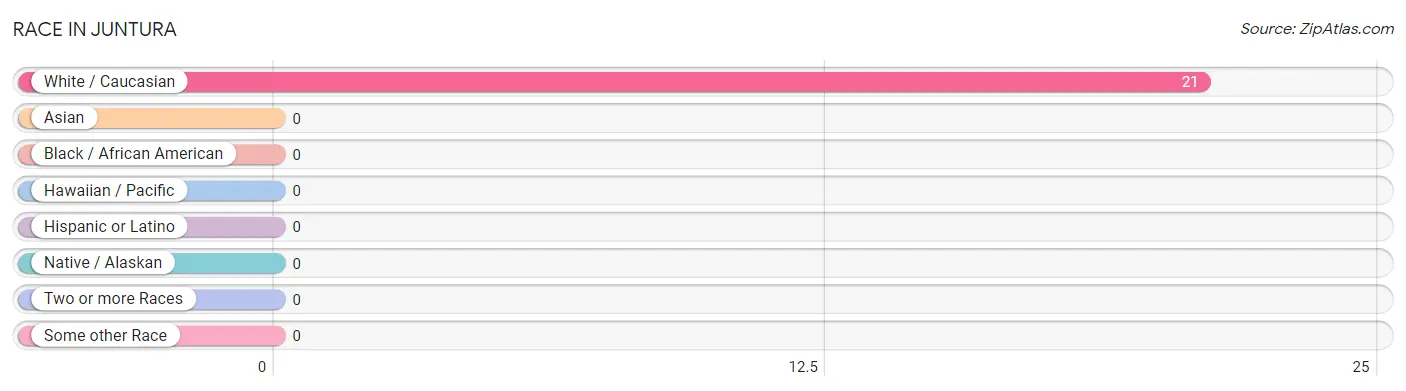
| Race | # Population | % Population |
| Asian | 0 | 0.0% |
| Black / African American | 0 | 0.0% |
| Hawaiian / Pacific | 0 | 0.0% |
| Hispanic or Latino | 0 | 0.0% |
| Native / Alaskan | 0 | 0.0% |
| White / Caucasian | 21 | 100.0% |
| Two or more Races | 0 | 0.0% |
| Some other Race | 0 | 0.0% |
| Total | 21 | 100.0% |
Ancestry in Juntura
The most populous ancestries reported in Juntura are Irish (8 | 38.1%), American (4 | 19.1%), Dutch (3 | 14.3%), German (3 | 14.3%), and Welsh (2 | 9.5%), together accounting for 95.3% of all Juntura residents.
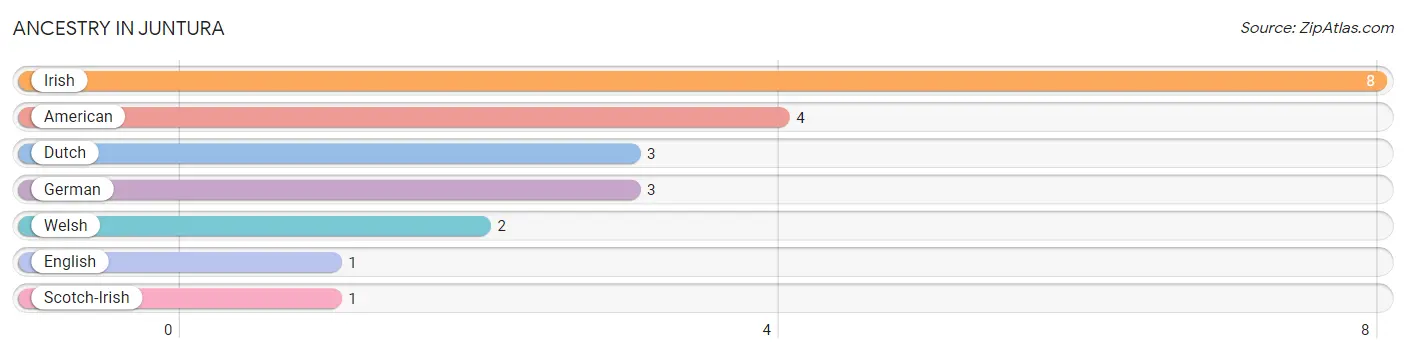
| Ancestry | # Population | % Population |
| American | 4 | 19.1% |
| Dutch | 3 | 14.3% |
| English | 1 | 4.8% |
| German | 3 | 14.3% |
| Irish | 8 | 38.1% |
| Scotch-Irish | 1 | 4.8% |
| Welsh | 2 | 9.5% | View All 7 Rows |
Immigrants in Juntura

| Immigration Origin | # Population | % Population | View All 0 Rows |
Sex and Age in Juntura
Sex and Age in Juntura
The most populous age groups in Juntura are 65 to 69 Years (3 | 33.3%) for men and 55 to 59 Years (5 | 41.7%) for women.
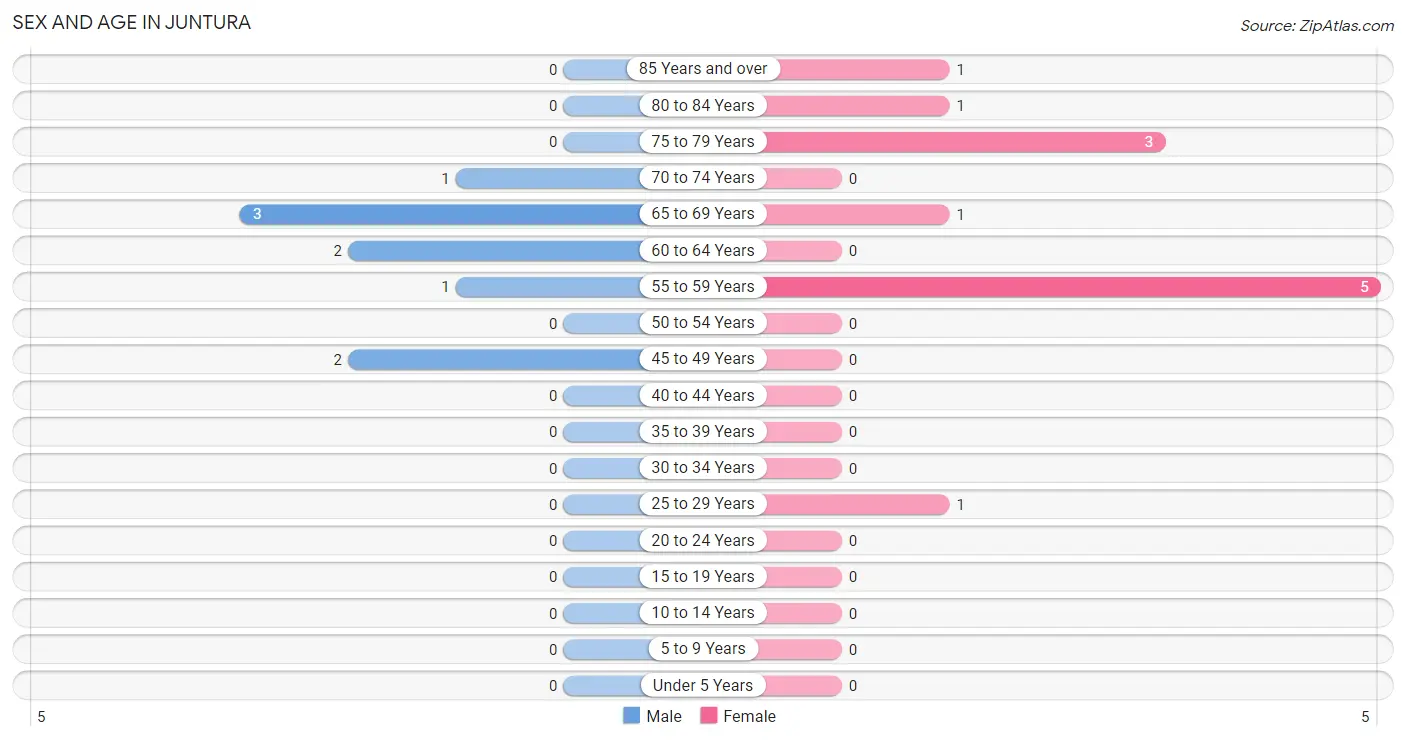
| Age Bracket | Male | Female |
| Under 5 Years | 0 (0.0%) | 0 (0.0%) |
| 5 to 9 Years | 0 (0.0%) | 0 (0.0%) |
| 10 to 14 Years | 0 (0.0%) | 0 (0.0%) |
| 15 to 19 Years | 0 (0.0%) | 0 (0.0%) |
| 20 to 24 Years | 0 (0.0%) | 0 (0.0%) |
| 25 to 29 Years | 0 (0.0%) | 1 (8.3%) |
| 30 to 34 Years | 0 (0.0%) | 0 (0.0%) |
| 35 to 39 Years | 0 (0.0%) | 0 (0.0%) |
| 40 to 44 Years | 0 (0.0%) | 0 (0.0%) |
| 45 to 49 Years | 2 (22.2%) | 0 (0.0%) |
| 50 to 54 Years | 0 (0.0%) | 0 (0.0%) |
| 55 to 59 Years | 1 (11.1%) | 5 (41.7%) |
| 60 to 64 Years | 2 (22.2%) | 0 (0.0%) |
| 65 to 69 Years | 3 (33.3%) | 1 (8.3%) |
| 70 to 74 Years | 1 (11.1%) | 0 (0.0%) |
| 75 to 79 Years | 0 (0.0%) | 3 (25.0%) |
| 80 to 84 Years | 0 (0.0%) | 1 (8.3%) |
| 85 Years and over | 0 (0.0%) | 1 (8.3%) |
| Total | 9 (100.0%) | 12 (100.0%) |
Families and Households in Juntura
Median Family Size in Juntura
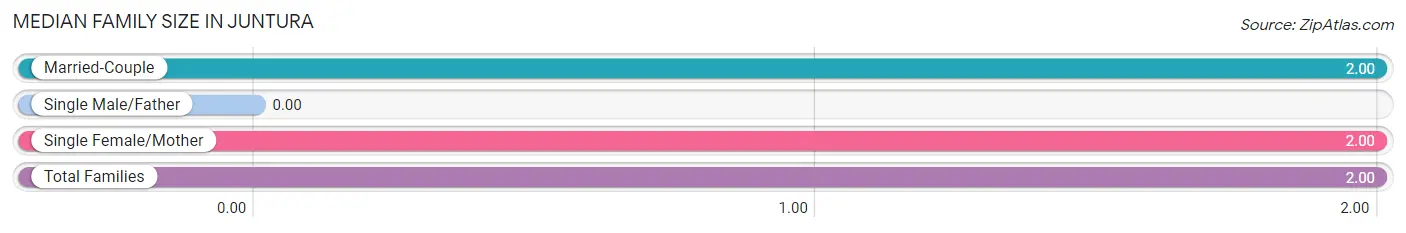
| Family Type | # Families | Family Size |
| Married-Couple | 2 (66.7%) | 2.00 |
| Single Male/Father | 0 (0.0%) | - |
| Single Female/Mother | 1 (33.3%) | 2.00 |
| Total Families | 3 (100.0%) | 2.00 |
Median Household Size in Juntura
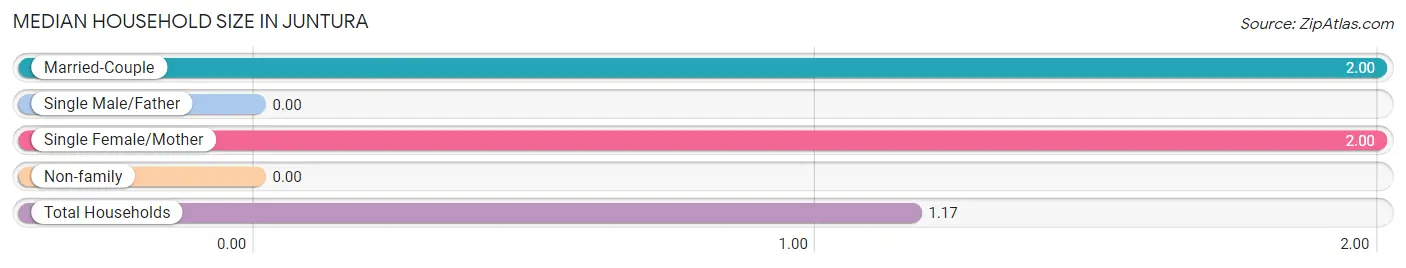
| Household Type | # Households | Household Size |
| Married-Couple | 2 (11.1%) | 2.00 |
| Single Male/Father | 0 (0.0%) | - |
| Single Female/Mother | 1 (5.6%) | 2.00 |
| Non-family | 15 (83.3%) | - |
| Total Households | 18 (100.0%) | 1.17 |
Household Size by Marriage Status in Juntura
Out of a total of 18 households in Juntura, 3 (16.7%) are family households, while 15 (83.3%) are nonfamily households. The most numerous type of family households are 2-person households, comprising 3, and the most common type of nonfamily households are 1-person households, comprising 15.
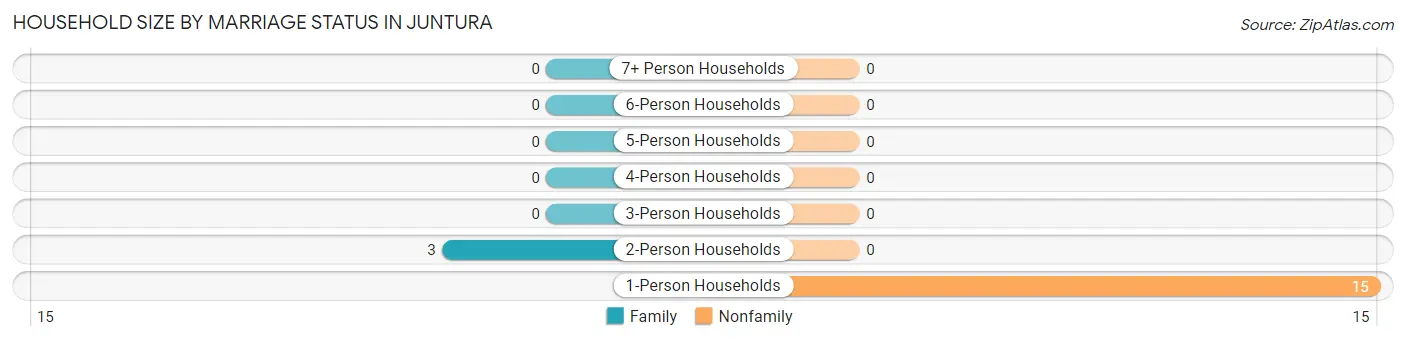
| Household Size | Family Households | Nonfamily Households |
| 1-Person Households | - | 15 (83.3%) |
| 2-Person Households | 3 (16.7%) | 0 (0.0%) |
| 3-Person Households | 0 (0.0%) | 0 (0.0%) |
| 4-Person Households | 0 (0.0%) | 0 (0.0%) |
| 5-Person Households | 0 (0.0%) | 0 (0.0%) |
| 6-Person Households | 0 (0.0%) | 0 (0.0%) |
| 7+ Person Households | 0 (0.0%) | 0 (0.0%) |
| Total | 3 (16.7%) | 15 (83.3%) |
Female Fertility in Juntura
Fertility by Age in Juntura
| Age Bracket | Women with Births | Births / 1,000 Women |
| 15 to 19 years | 0 (0.0%) | 0.0 |
| 20 to 34 years | 0 (0.0%) | 0.0 |
| 35 to 50 years | 0 (0.0%) | 0.0 |
| Total | 0 (0.0%) | 0.0 |
Fertility by Age by Marriage Status in Juntura
| Age Bracket | Married | Unmarried |
| 15 to 19 years | 0 (0.0%) | 0 (0.0%) |
| 20 to 34 years | 0 (0.0%) | 0 (0.0%) |
| 35 to 50 years | 0 (0.0%) | 0 (0.0%) |
| Total | 0 (0.0%) | 0 (0.0%) |
Fertility by Education in Juntura
| Educational Attainment | Women with Births | Births / 1,000 Women |
| Less than High School | 0 (0.0%) | 0.0 |
| High School Diploma | 0 (0.0%) | 0.0 |
| College or Associate's Degree | 0 (0.0%) | 0.0 |
| Bachelor's Degree | 0 (0.0%) | 0.0 |
| Graduate Degree | 0 (0.0%) | 0.0 |
| Total | 0 (0.0%) | 0.0 |
Fertility by Education by Marriage Status in Juntura
| Educational Attainment | Married | Unmarried |
| Less than High School | 0 (0.0%) | 0 (0.0%) |
| High School Diploma | 0 (0.0%) | 0 (0.0%) |
| College or Associate's Degree | 0 (0.0%) | 0 (0.0%) |
| Bachelor's Degree | 0 (0.0%) | 0 (0.0%) |
| Graduate Degree | 0 (0.0%) | 0 (0.0%) |
| Total | 0 (0.0%) | 0 (0.0%) |
Employment Characteristics in Juntura
Employment by Class of Employer in Juntura
Among the 8 employed individuals in Juntura, private company employees (3 | 37.5%), local government employees (3 | 37.5%), and self-employed (not incorporated) (1 | 12.5%) make up the most common classes of employment.
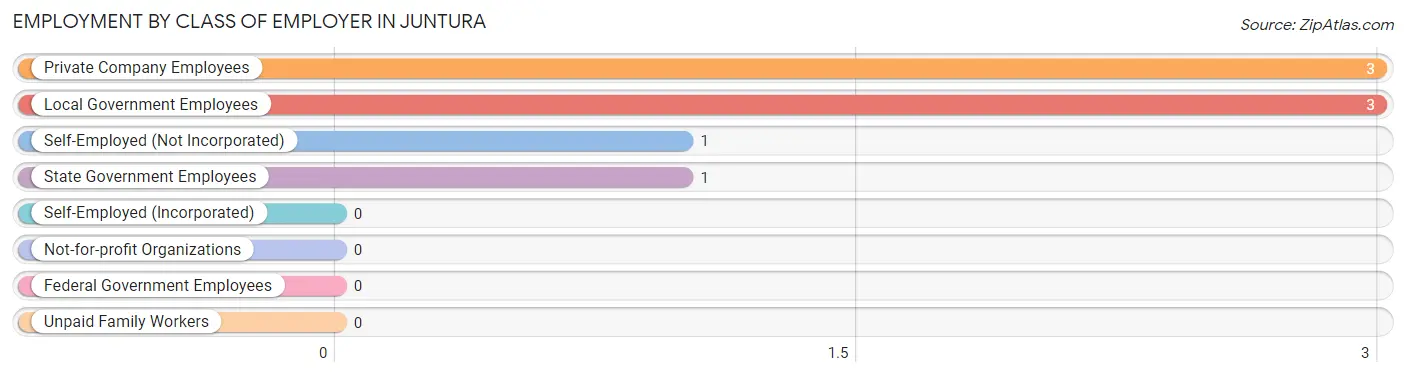
| Employer Class | # Employees | % Employees |
| Private Company Employees | 3 | 37.5% |
| Self-Employed (Incorporated) | 0 | 0.0% |
| Self-Employed (Not Incorporated) | 1 | 12.5% |
| Not-for-profit Organizations | 0 | 0.0% |
| Local Government Employees | 3 | 37.5% |
| State Government Employees | 1 | 12.5% |
| Federal Government Employees | 0 | 0.0% |
| Unpaid Family Workers | 0 | 0.0% |
| Total | 8 | 100.0% |
Employment Status by Age in Juntura
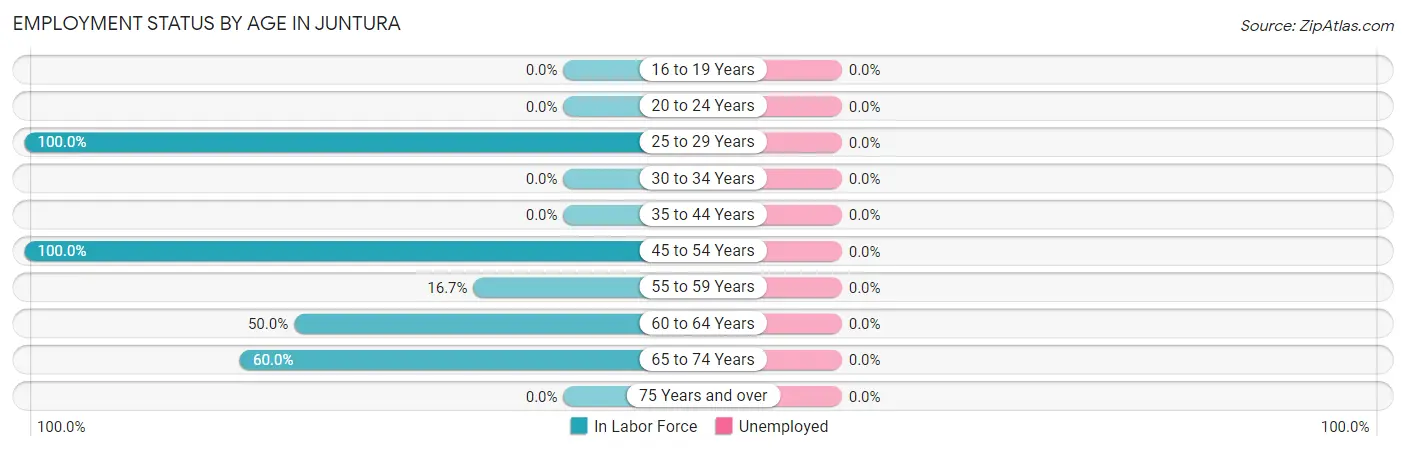
| Age Bracket | In Labor Force | Unemployed |
| 16 to 19 Years | 0 (0.0%) | 0 (0.0%) |
| 20 to 24 Years | 0 (0.0%) | 0 (0.0%) |
| 25 to 29 Years | 1 (100.0%) | 0 (0.0%) |
| 30 to 34 Years | 0 (0.0%) | 0 (0.0%) |
| 35 to 44 Years | 0 (0.0%) | 0 (0.0%) |
| 45 to 54 Years | 2 (100.0%) | 0 (0.0%) |
| 55 to 59 Years | 1 (16.7%) | 0 (0.0%) |
| 60 to 64 Years | 1 (50.0%) | 0 (0.0%) |
| 65 to 74 Years | 3 (60.0%) | 0 (0.0%) |
| 75 Years and over | 0 (0.0%) | 0 (0.0%) |
| Total | 8 (38.1%) | 0 (0.0%) |
Employment Status by Educational Attainment in Juntura
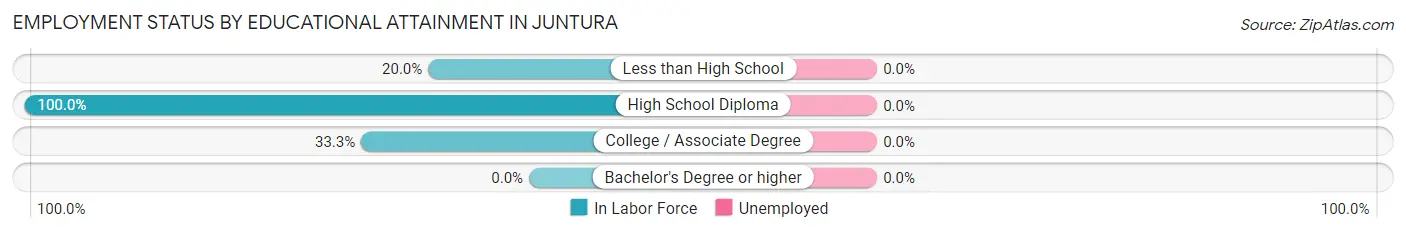
| Educational Attainment | In Labor Force | Unemployed |
| Less than High School | 1 (20.0%) | 0 (0.0%) |
| High School Diploma | 3 (100.0%) | 0 (0.0%) |
| College / Associate Degree | 1 (33.3%) | 0 (0.0%) |
| Bachelor's Degree or higher | 0 (0.0%) | 0 (0.0%) |
| Total | 5 (45.5%) | 0 (0.0%) |
Employment Occupations by Sex in Juntura
Management, Business, Science and Arts Occupations
The most common Management, Business, Science and Arts occupations in Juntura are Community & Social Service (2 | 25.0%), and Legal Services & Support (2 | 25.0%).
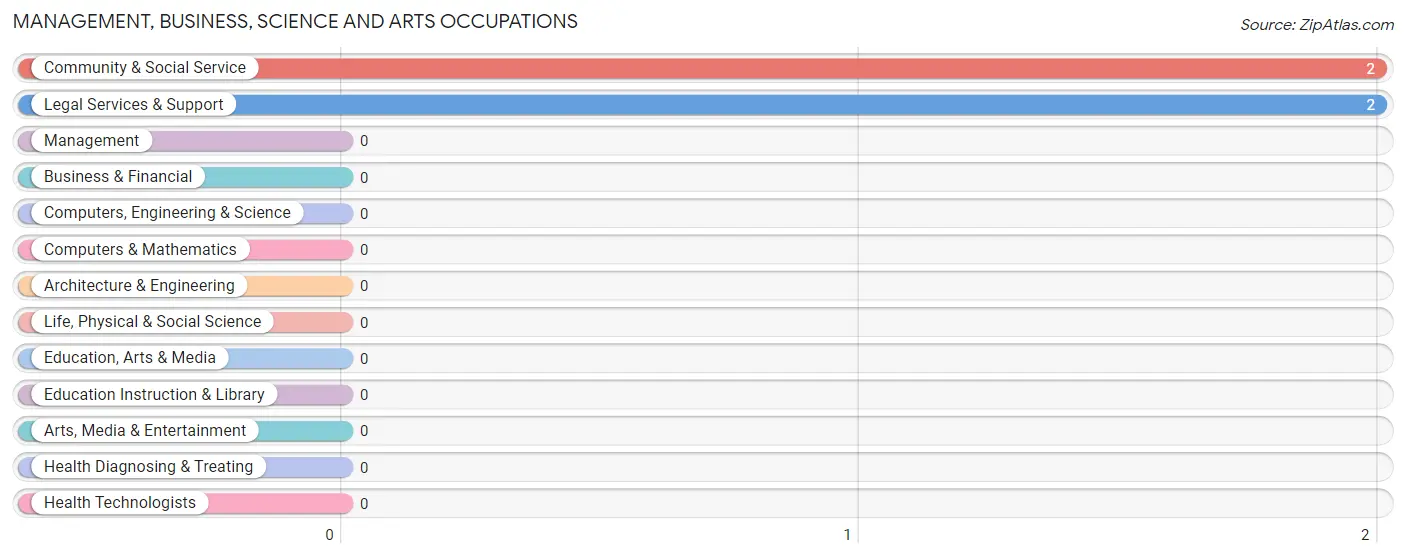
Management, Business, Science and Arts Occupations by Sex
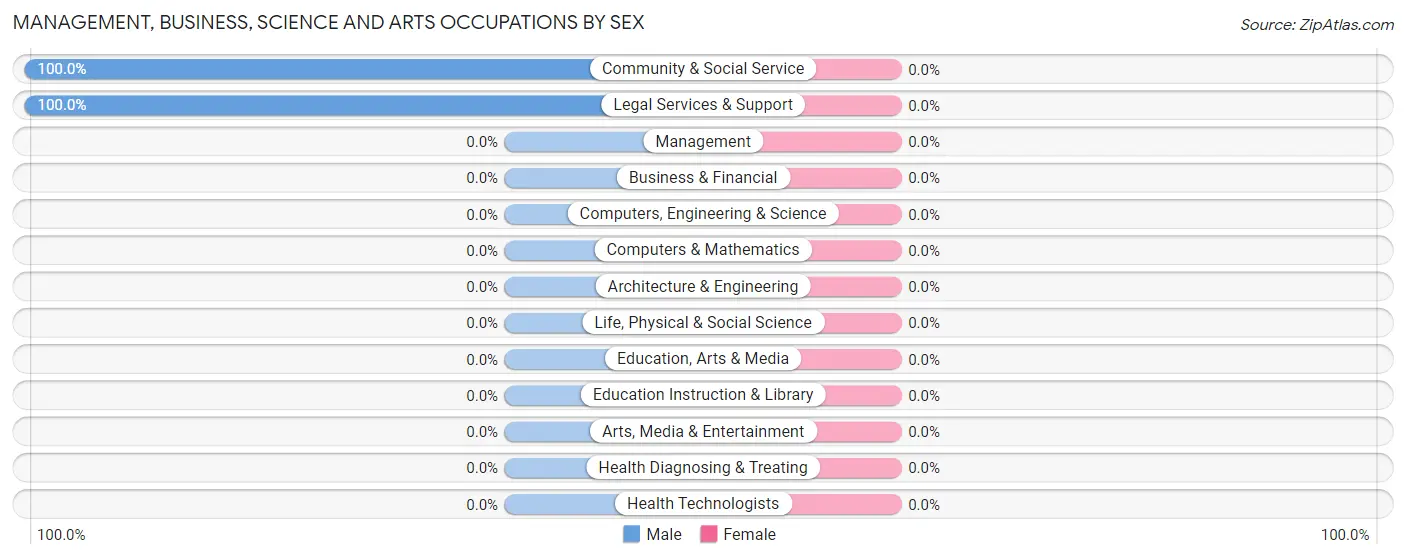
| Occupation | Male | Female |
| Management | 0 (0.0%) | 0 (0.0%) |
| Business & Financial | 0 (0.0%) | 0 (0.0%) |
| Computers, Engineering & Science | 0 (0.0%) | 0 (0.0%) |
| Computers & Mathematics | 0 (0.0%) | 0 (0.0%) |
| Architecture & Engineering | 0 (0.0%) | 0 (0.0%) |
| Life, Physical & Social Science | 0 (0.0%) | 0 (0.0%) |
| Community & Social Service | 2 (100.0%) | 0 (0.0%) |
| Education, Arts & Media | 0 (0.0%) | 0 (0.0%) |
| Legal Services & Support | 2 (100.0%) | 0 (0.0%) |
| Education Instruction & Library | 0 (0.0%) | 0 (0.0%) |
| Arts, Media & Entertainment | 0 (0.0%) | 0 (0.0%) |
| Health Diagnosing & Treating | 0 (0.0%) | 0 (0.0%) |
| Health Technologists | 0 (0.0%) | 0 (0.0%) |
| Total (Category) | 2 (100.0%) | 0 (0.0%) |
| Total (Overall) | 7 (87.5%) | 1 (12.5%) |
Services Occupations
The most common Services occupations in Juntura are Cleaning & Maintenance (3 | 37.5%), and Food Preparation & Serving (1 | 12.5%).
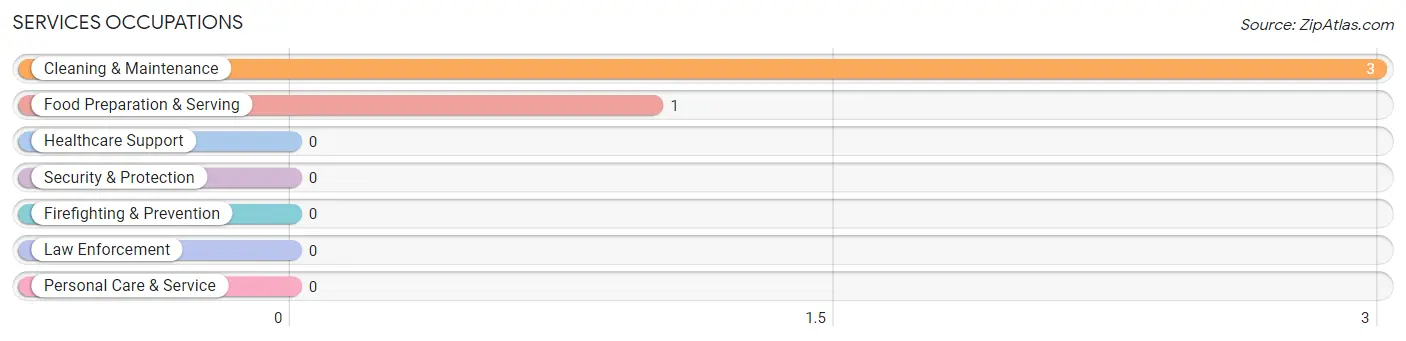
Services Occupations by Sex
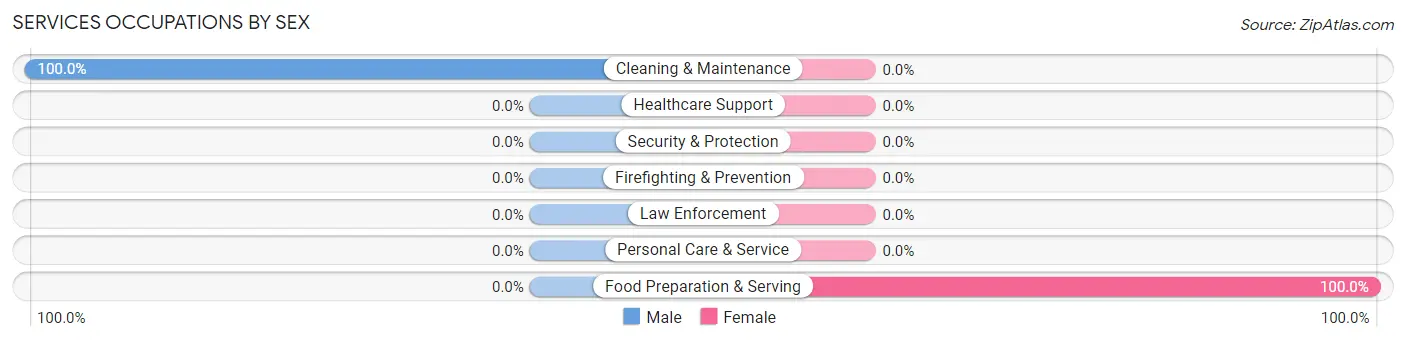
| Occupation | Male | Female |
| Healthcare Support | 0 (0.0%) | 0 (0.0%) |
| Security & Protection | 0 (0.0%) | 0 (0.0%) |
| Firefighting & Prevention | 0 (0.0%) | 0 (0.0%) |
| Law Enforcement | 0 (0.0%) | 0 (0.0%) |
| Food Preparation & Serving | 0 (0.0%) | 1 (100.0%) |
| Cleaning & Maintenance | 3 (100.0%) | 0 (0.0%) |
| Personal Care & Service | 0 (0.0%) | 0 (0.0%) |
| Total (Category) | 3 (75.0%) | 1 (25.0%) |
| Total (Overall) | 7 (87.5%) | 1 (12.5%) |
Sales and Office Occupations
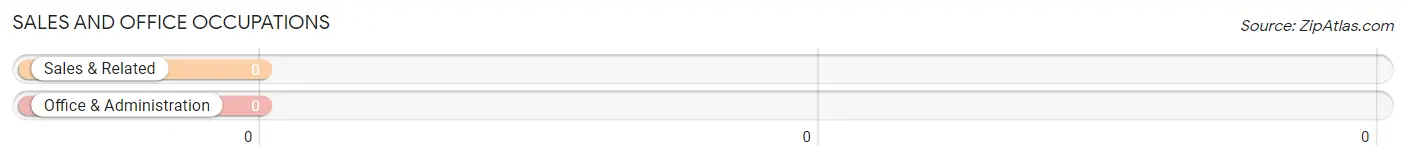
Sales and Office Occupations by Sex
| Occupation | Male | Female |
| Sales & Related | 0 (0.0%) | 0 (0.0%) |
| Office & Administration | 0 (0.0%) | 0 (0.0%) |
| Total (Category) | 0 (0.0%) | 0 (0.0%) |
| Total (Overall) | 7 (87.5%) | 1 (12.5%) |
Natural Resources, Construction and Maintenance Occupations
The most common Natural Resources, Construction and Maintenance occupations in Juntura are , and Construction & Extraction (1 | 12.5%).
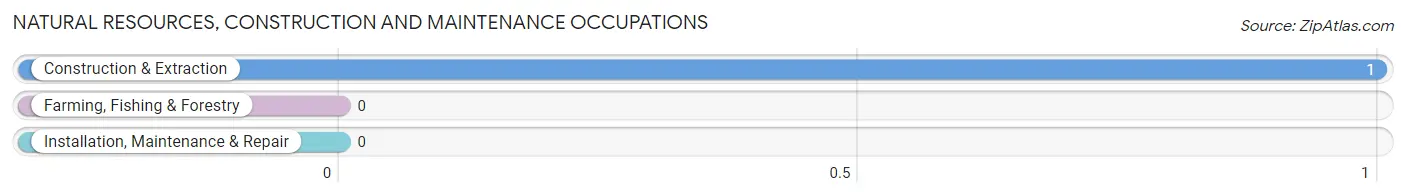
Natural Resources, Construction and Maintenance Occupations by Sex
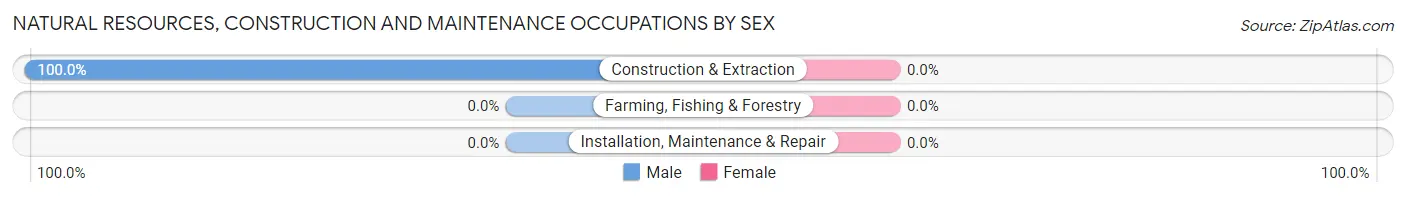
| Occupation | Male | Female |
| Farming, Fishing & Forestry | 0 (0.0%) | 0 (0.0%) |
| Construction & Extraction | 1 (100.0%) | 0 (0.0%) |
| Installation, Maintenance & Repair | 0 (0.0%) | 0 (0.0%) |
| Total (Category) | 1 (100.0%) | 0 (0.0%) |
| Total (Overall) | 7 (87.5%) | 1 (12.5%) |
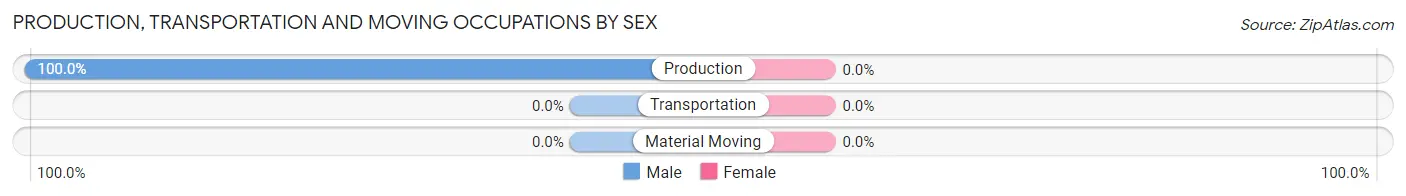
Production, Transportation and Moving Occupations
The most common Production, Transportation and Moving occupations in Juntura are , and Production (1 | 12.5%).
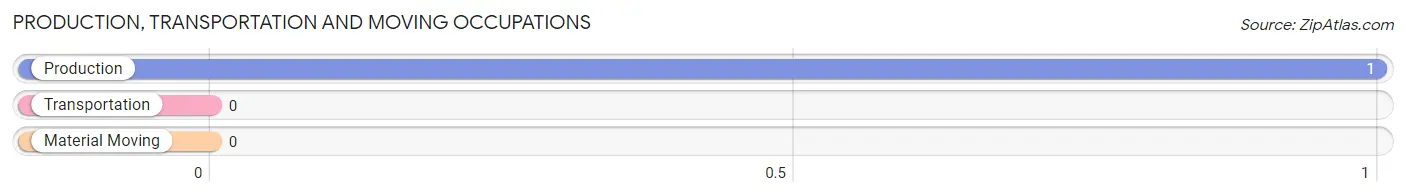
Production, Transportation and Moving Occupations by Sex
| Occupation | Male | Female |
| Production | 1 (100.0%) | 0 (0.0%) |
| Transportation | 0 (0.0%) | 0 (0.0%) |
| Material Moving | 0 (0.0%) | 0 (0.0%) |
| Total (Category) | 1 (100.0%) | 0 (0.0%) |
| Total (Overall) | 7 (87.5%) | 1 (12.5%) |
Employment Industries by Sex in Juntura
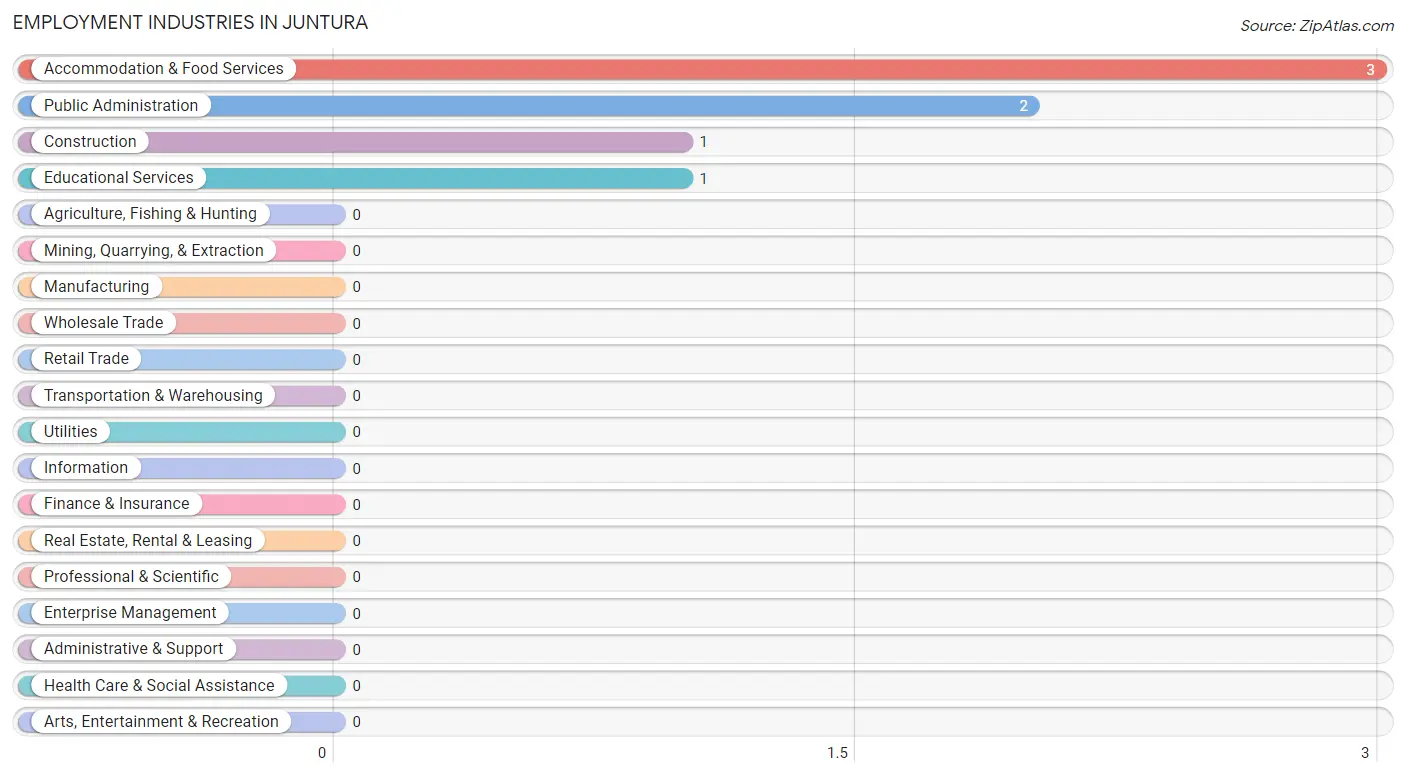
Employment Industries in Juntura
The major employment industries in Juntura include Accommodation & Food Services (3 | 37.5%), Public Administration (2 | 25.0%), Construction (1 | 12.5%), and Educational Services (1 | 12.5%).
Employment Industries by Sex in Juntura
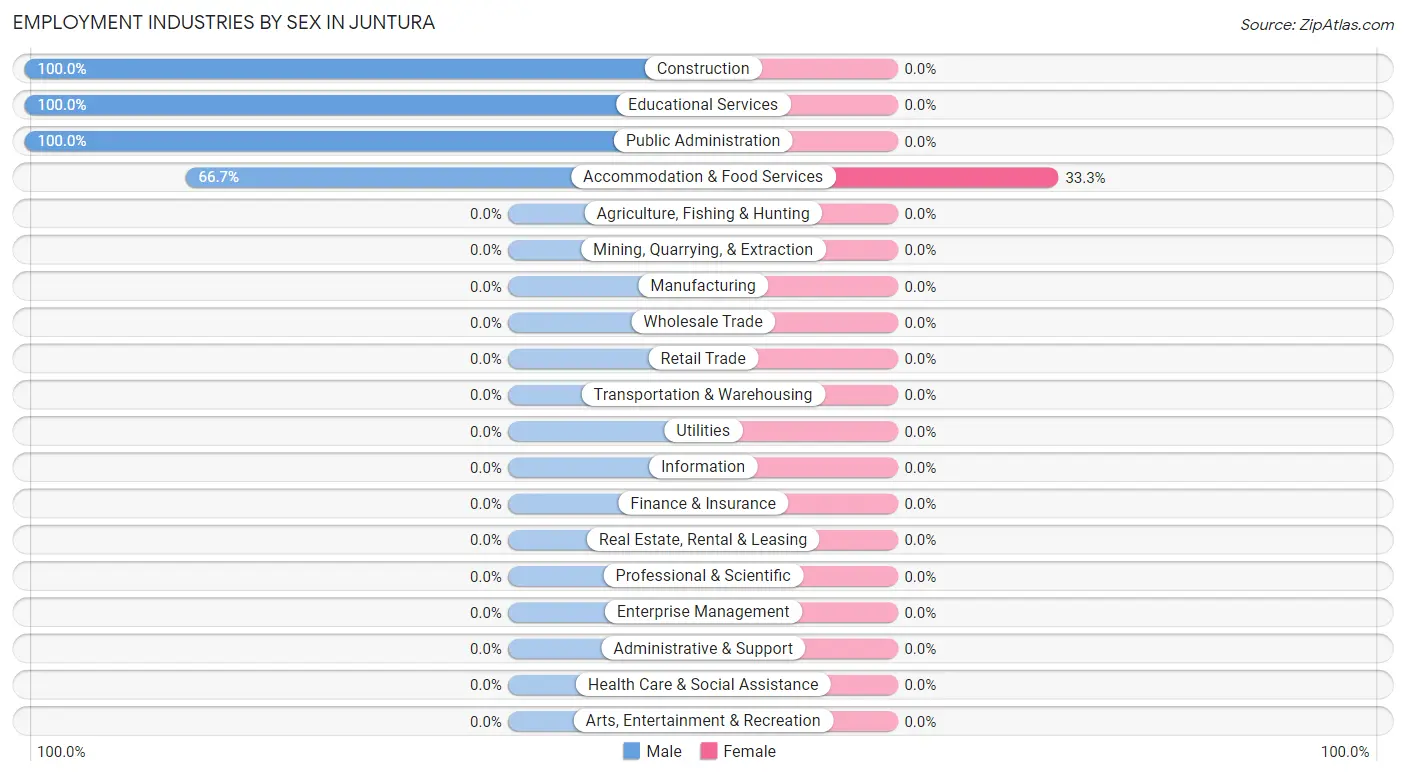
| Industry | Male | Female |
| Agriculture, Fishing & Hunting | 0 (0.0%) | 0 (0.0%) |
| Mining, Quarrying, & Extraction | 0 (0.0%) | 0 (0.0%) |
| Construction | 1 (100.0%) | 0 (0.0%) |
| Manufacturing | 0 (0.0%) | 0 (0.0%) |
| Wholesale Trade | 0 (0.0%) | 0 (0.0%) |
| Retail Trade | 0 (0.0%) | 0 (0.0%) |
| Transportation & Warehousing | 0 (0.0%) | 0 (0.0%) |
| Utilities | 0 (0.0%) | 0 (0.0%) |
| Information | 0 (0.0%) | 0 (0.0%) |
| Finance & Insurance | 0 (0.0%) | 0 (0.0%) |
| Real Estate, Rental & Leasing | 0 (0.0%) | 0 (0.0%) |
| Professional & Scientific | 0 (0.0%) | 0 (0.0%) |
| Enterprise Management | 0 (0.0%) | 0 (0.0%) |
| Administrative & Support | 0 (0.0%) | 0 (0.0%) |
| Educational Services | 1 (100.0%) | 0 (0.0%) |
| Health Care & Social Assistance | 0 (0.0%) | 0 (0.0%) |
| Arts, Entertainment & Recreation | 0 (0.0%) | 0 (0.0%) |
| Accommodation & Food Services | 2 (66.7%) | 1 (33.3%) |
| Public Administration | 2 (100.0%) | 0 (0.0%) |
| Total | 7 (87.5%) | 1 (12.5%) |
Education in Juntura
School Enrollment in Juntura
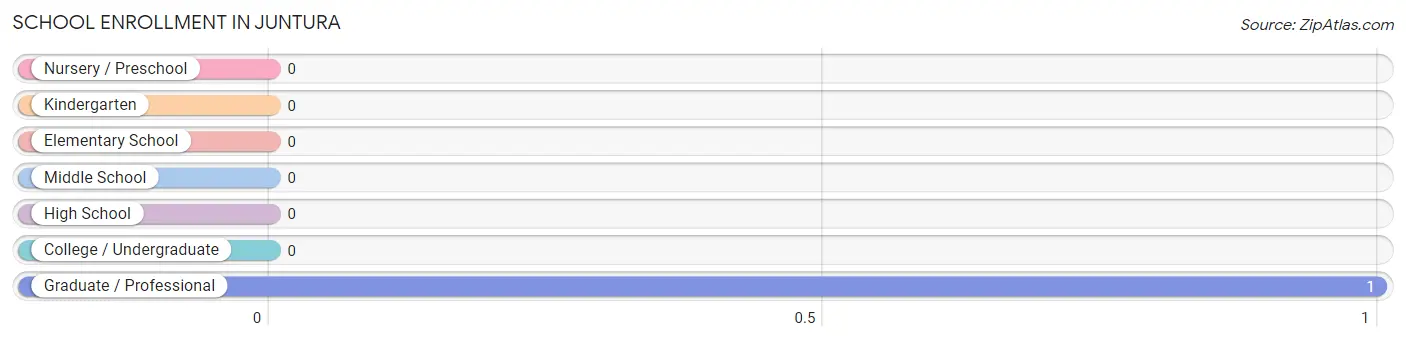
| School Level | # Students | % Students |
| Nursery / Preschool | 0 | 0.0% |
| Kindergarten | 0 | 0.0% |
| Elementary School | 0 | 0.0% |
| Middle School | 0 | 0.0% |
| High School | 0 | 0.0% |
| College / Undergraduate | 0 | 0.0% |
| Graduate / Professional | 1 | 100.0% |
| Total | 1 | 100.0% |
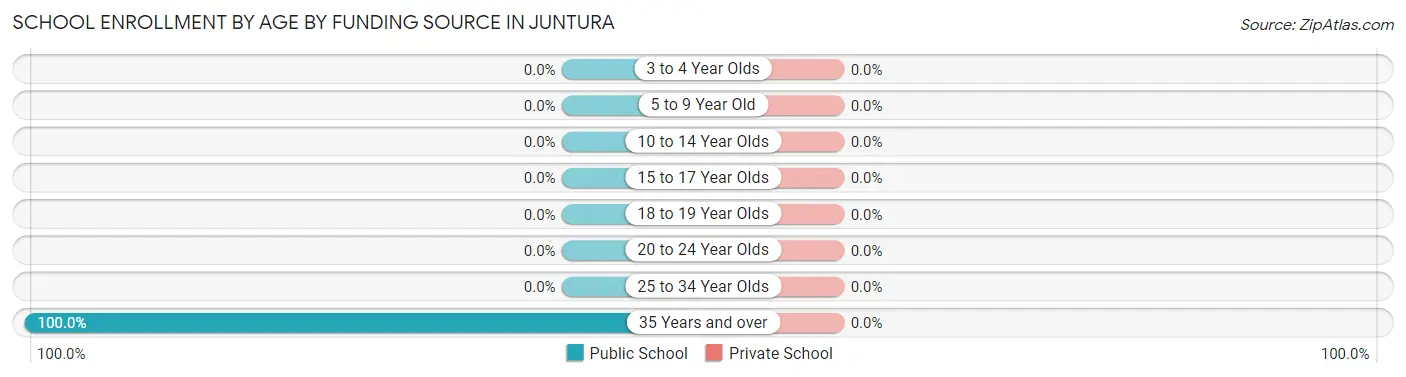
School Enrollment by Age by Funding Source in Juntura
| Age Bracket | Public School | Private School |
| 3 to 4 Year Olds | 0 (0.0%) | 0 (0.0%) |
| 5 to 9 Year Old | 0 (0.0%) | 0 (0.0%) |
| 10 to 14 Year Olds | 0 (0.0%) | 0 (0.0%) |
| 15 to 17 Year Olds | 0 (0.0%) | 0 (0.0%) |
| 18 to 19 Year Olds | 0 (0.0%) | 0 (0.0%) |
| 20 to 24 Year Olds | 0 (0.0%) | 0 (0.0%) |
| 25 to 34 Year Olds | 0 (0.0%) | 0 (0.0%) |
| 35 Years and over | 1 (100.0%) | 0 (0.0%) |
| Total | 1 (100.0%) | 0 (0.0%) |
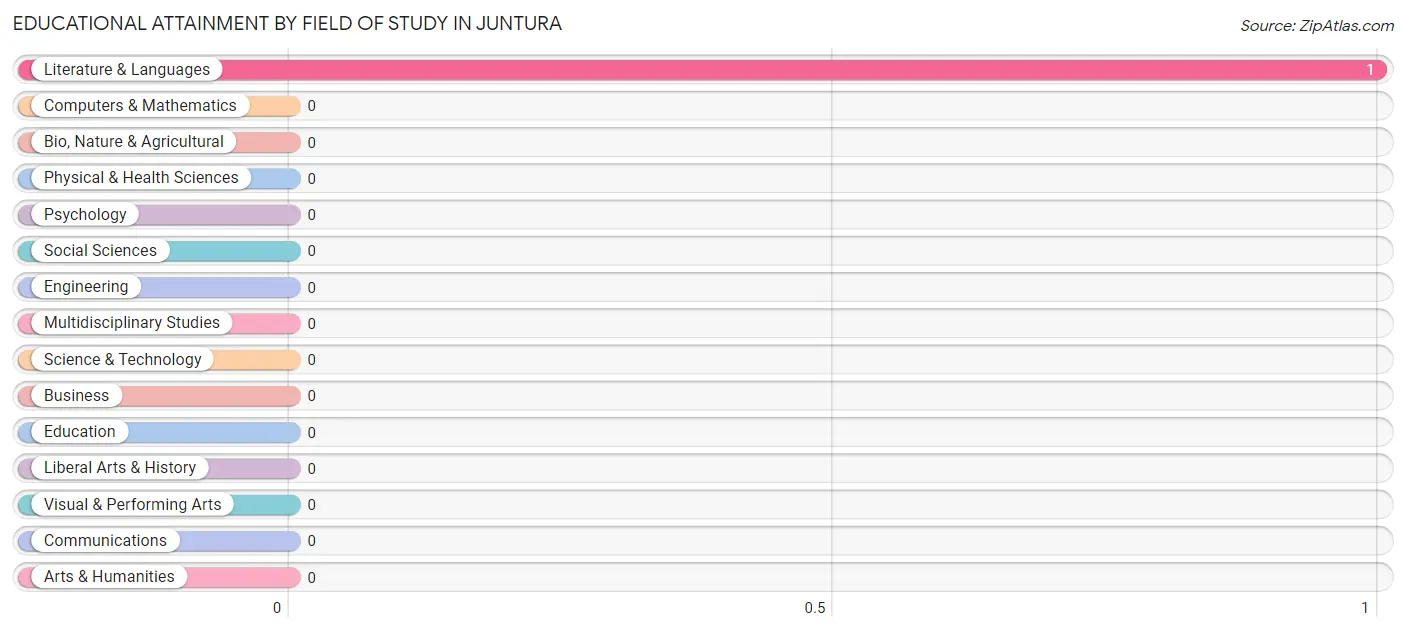
Educational Attainment by Field of Study in Juntura
, and literature & languages (1 | 100.0%) are the most common fields of study among 1 individuals in Juntura who have obtained a bachelor's degree or higher.
| Field of Study | # Graduates | % Graduates |
| Computers & Mathematics | 0 | 0.0% |
| Bio, Nature & Agricultural | 0 | 0.0% |
| Physical & Health Sciences | 0 | 0.0% |
| Psychology | 0 | 0.0% |
| Social Sciences | 0 | 0.0% |
| Engineering | 0 | 0.0% |
| Multidisciplinary Studies | 0 | 0.0% |
| Science & Technology | 0 | 0.0% |
| Business | 0 | 0.0% |
| Education | 0 | 0.0% |
| Literature & Languages | 1 | 100.0% |
| Liberal Arts & History | 0 | 0.0% |
| Visual & Performing Arts | 0 | 0.0% |
| Communications | 0 | 0.0% |
| Arts & Humanities | 0 | 0.0% |
| Total | 1 | 100.0% |
Transportation & Commute in Juntura
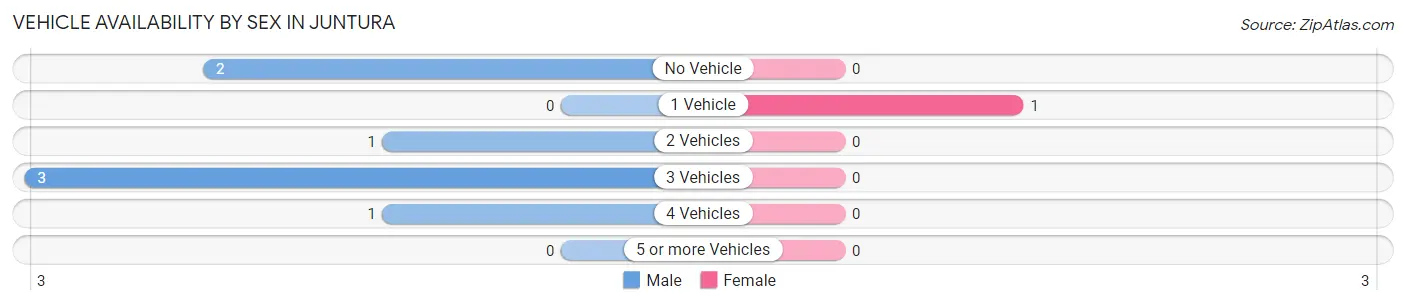
Vehicle Availability by Sex in Juntura
The most prevalent vehicle ownership categories in Juntura are males with 3 vehicles (3, accounting for 42.9%) and females with 3 vehicles (0, making up 300.0%).
| Vehicles Available | Male | Female |
| No Vehicle | 2 (28.6%) | 0 (0.0%) |
| 1 Vehicle | 0 (0.0%) | 1 (100.0%) |
| 2 Vehicles | 1 (14.3%) | 0 (0.0%) |
| 3 Vehicles | 3 (42.9%) | 0 (0.0%) |
| 4 Vehicles | 1 (14.3%) | 0 (0.0%) |
| 5 or more Vehicles | 0 (0.0%) | 0 (0.0%) |
| Total | 7 (100.0%) | 1 (100.0%) |
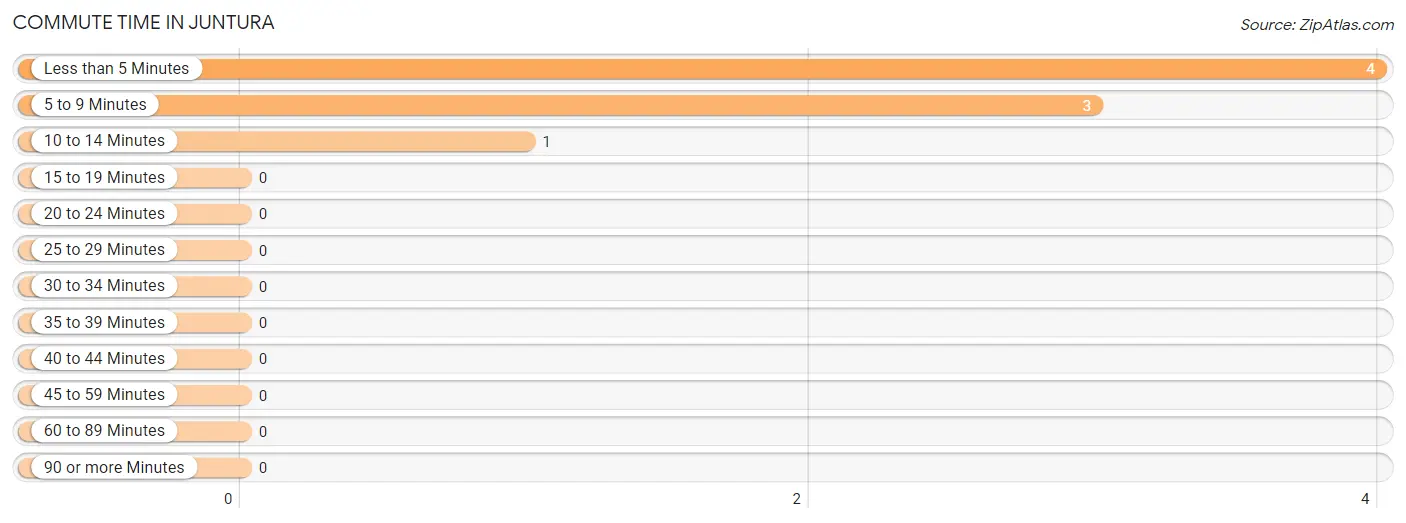
Commute Time in Juntura
The most frequently occuring commute durations in Juntura are less than 5 minutes (4 commuters, 50.0%), 5 to 9 minutes (3 commuters, 37.5%), and 10 to 14 minutes (1 commuters, 12.5%).
| Commute Time | # Commuters | % Commuters |
| Less than 5 Minutes | 4 | 50.0% |
| 5 to 9 Minutes | 3 | 37.5% |
| 10 to 14 Minutes | 1 | 12.5% |
| 15 to 19 Minutes | 0 | 0.0% |
| 20 to 24 Minutes | 0 | 0.0% |
| 25 to 29 Minutes | 0 | 0.0% |
| 30 to 34 Minutes | 0 | 0.0% |
| 35 to 39 Minutes | 0 | 0.0% |
| 40 to 44 Minutes | 0 | 0.0% |
| 45 to 59 Minutes | 0 | 0.0% |
| 60 to 89 Minutes | 0 | 0.0% |
| 90 or more Minutes | 0 | 0.0% |
Commute Time by Sex in Juntura
The most common commute times in Juntura are less than 5 minutes (3 commuters, 42.9%) for males and less than 5 minutes (1 commuters, 100.0%) for females.
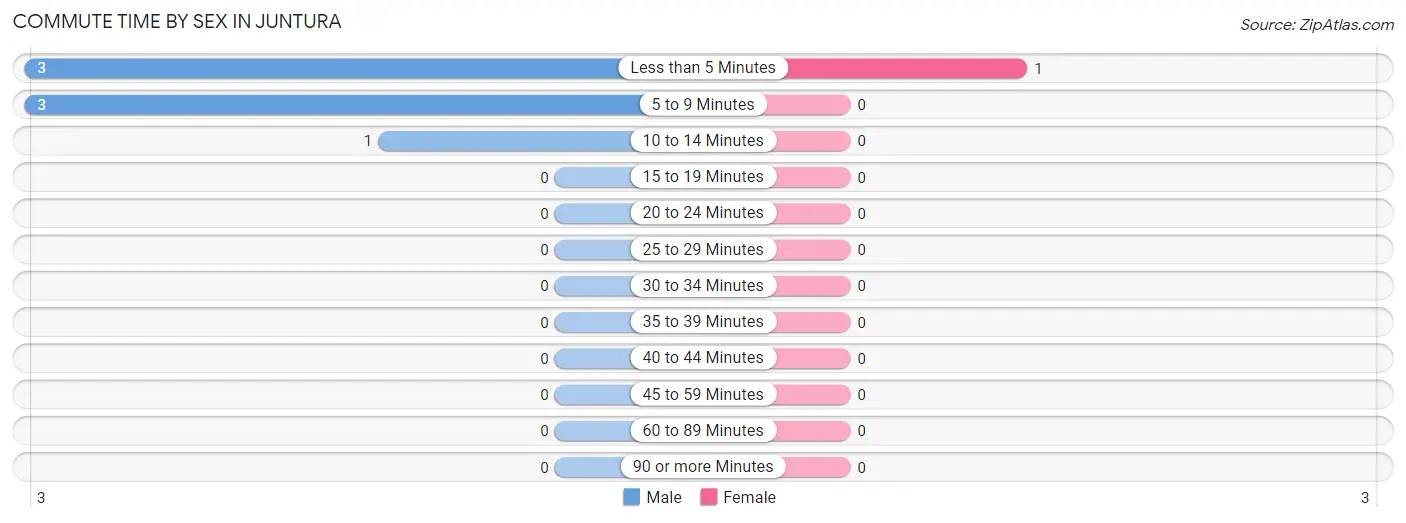
| Commute Time | Male | Female |
| Less than 5 Minutes | 3 (42.9%) | 1 (100.0%) |
| 5 to 9 Minutes | 3 (42.9%) | 0 (0.0%) |
| 10 to 14 Minutes | 1 (14.3%) | 0 (0.0%) |
| 15 to 19 Minutes | 0 (0.0%) | 0 (0.0%) |
| 20 to 24 Minutes | 0 (0.0%) | 0 (0.0%) |
| 25 to 29 Minutes | 0 (0.0%) | 0 (0.0%) |
| 30 to 34 Minutes | 0 (0.0%) | 0 (0.0%) |
| 35 to 39 Minutes | 0 (0.0%) | 0 (0.0%) |
| 40 to 44 Minutes | 0 (0.0%) | 0 (0.0%) |
| 45 to 59 Minutes | 0 (0.0%) | 0 (0.0%) |
| 60 to 89 Minutes | 0 (0.0%) | 0 (0.0%) |
| 90 or more Minutes | 0 (0.0%) | 0 (0.0%) |
Time of Departure to Work by Sex in Juntura
The most frequent times of departure to work in Juntura are 7:30 AM to 7:59 AM (2, 28.6%) for males and 12:00 PM to 3:59 PM (1, 100.0%) for females.
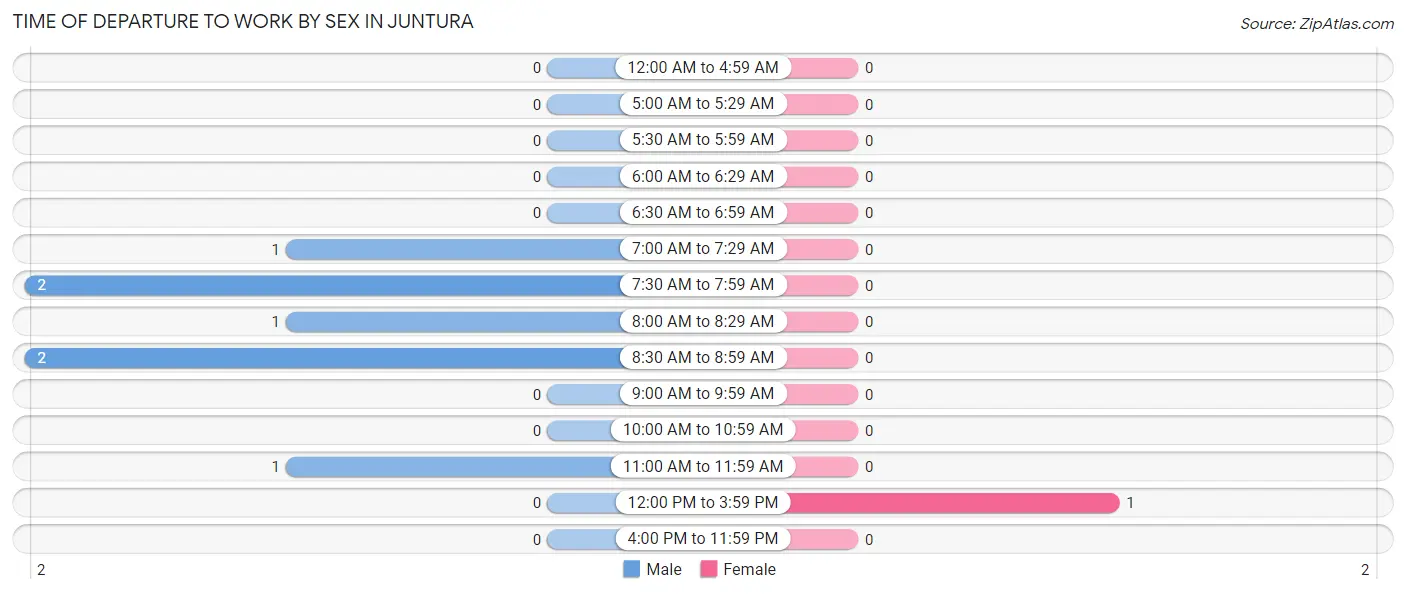
| Time of Departure | Male | Female |
| 12:00 AM to 4:59 AM | 0 (0.0%) | 0 (0.0%) |
| 5:00 AM to 5:29 AM | 0 (0.0%) | 0 (0.0%) |
| 5:30 AM to 5:59 AM | 0 (0.0%) | 0 (0.0%) |
| 6:00 AM to 6:29 AM | 0 (0.0%) | 0 (0.0%) |
| 6:30 AM to 6:59 AM | 0 (0.0%) | 0 (0.0%) |
| 7:00 AM to 7:29 AM | 1 (14.3%) | 0 (0.0%) |
| 7:30 AM to 7:59 AM | 2 (28.6%) | 0 (0.0%) |
| 8:00 AM to 8:29 AM | 1 (14.3%) | 0 (0.0%) |
| 8:30 AM to 8:59 AM | 2 (28.6%) | 0 (0.0%) |
| 9:00 AM to 9:59 AM | 0 (0.0%) | 0 (0.0%) |
| 10:00 AM to 10:59 AM | 0 (0.0%) | 0 (0.0%) |
| 11:00 AM to 11:59 AM | 1 (14.3%) | 0 (0.0%) |
| 12:00 PM to 3:59 PM | 0 (0.0%) | 1 (100.0%) |
| 4:00 PM to 11:59 PM | 0 (0.0%) | 0 (0.0%) |
| Total | 7 (100.0%) | 1 (100.0%) |
Housing Occupancy in Juntura
Occupancy by Ownership in Juntura
Of the total 18 dwellings in Juntura, owner-occupied units account for 12 (66.7%), while renter-occupied units make up 6 (33.3%).
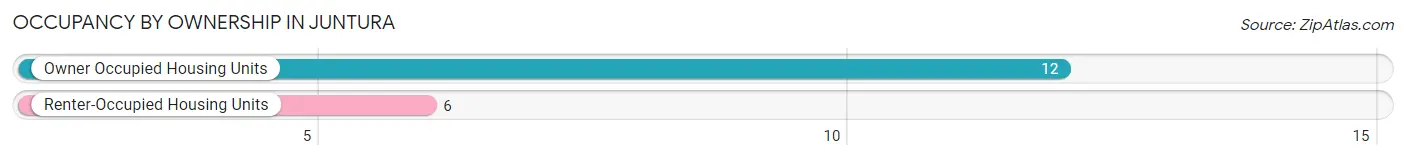
| Occupancy | # Housing Units | % Housing Units |
| Owner Occupied Housing Units | 12 | 66.7% |
| Renter-Occupied Housing Units | 6 | 33.3% |
| Total Occupied Housing Units | 18 | 100.0% |
Occupancy by Household Size in Juntura
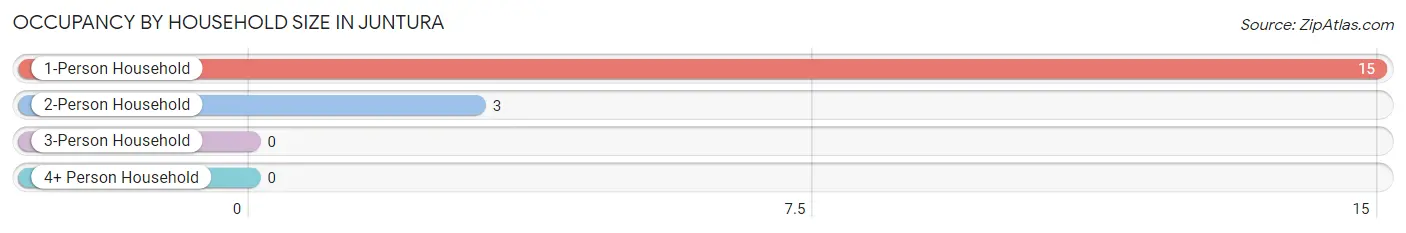
| Household Size | # Housing Units | % Housing Units |
| 1-Person Household | 15 | 83.3% |
| 2-Person Household | 3 | 16.7% |
| 3-Person Household | 0 | 0.0% |
| 4+ Person Household | 0 | 0.0% |
| Total Housing Units | 18 | 100.0% |
Occupancy by Ownership by Household Size in Juntura
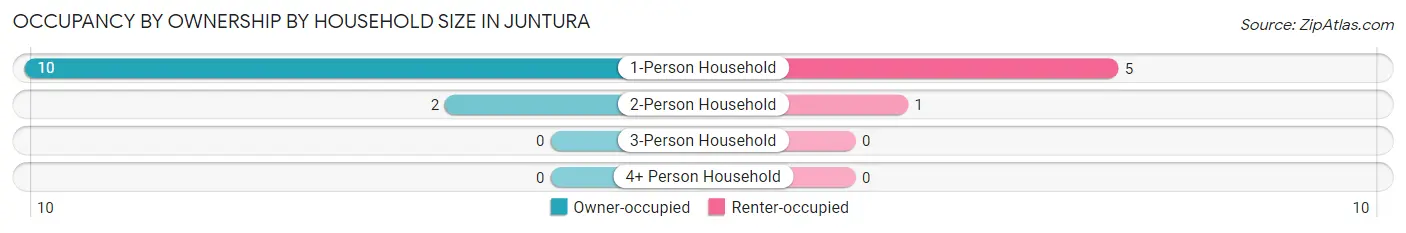
| Household Size | Owner-occupied | Renter-occupied |
| 1-Person Household | 10 (66.7%) | 5 (33.3%) |
| 2-Person Household | 2 (66.7%) | 1 (33.3%) |
| 3-Person Household | 0 (0.0%) | 0 (0.0%) |
| 4+ Person Household | 0 (0.0%) | 0 (0.0%) |
| Total Housing Units | 12 (66.7%) | 6 (33.3%) |
Occupancy by Educational Attainment in Juntura
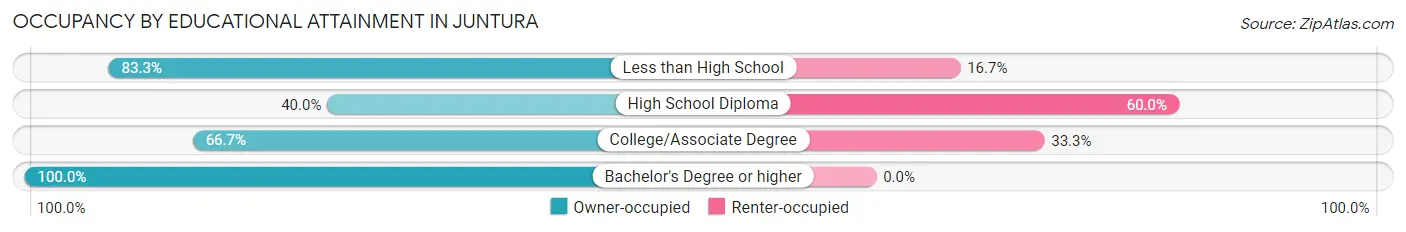
| Household Size | Owner-occupied | Renter-occupied |
| Less than High School | 5 (83.3%) | 1 (16.7%) |
| High School Diploma | 2 (40.0%) | 3 (60.0%) |
| College/Associate Degree | 4 (66.7%) | 2 (33.3%) |
| Bachelor's Degree or higher | 1 (100.0%) | 0 (0.0%) |
Occupancy by Age of Householder in Juntura
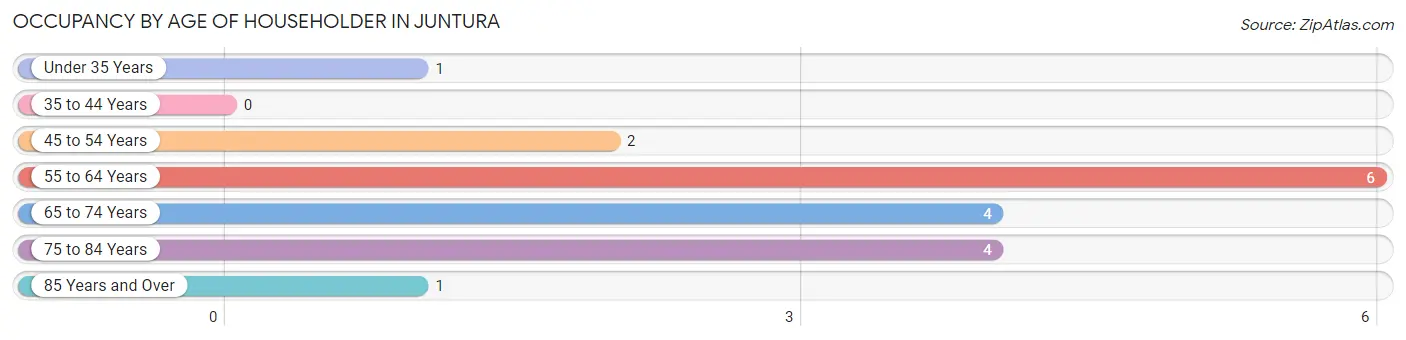
| Age Bracket | # Households | % Households |
| Under 35 Years | 1 | 5.6% |
| 35 to 44 Years | 0 | 0.0% |
| 45 to 54 Years | 2 | 11.1% |
| 55 to 64 Years | 6 | 33.3% |
| 65 to 74 Years | 4 | 22.2% |
| 75 to 84 Years | 4 | 22.2% |
| 85 Years and Over | 1 | 5.6% |
| Total | 18 | 100.0% |
Housing Finances in Juntura
Median Income by Occupancy in Juntura
| Occupancy Type | # Households | Median Income |
| Owner-Occupied | 12 (66.7%) | $0 |
| Renter-Occupied | 6 (33.3%) | $0 |
| Average | 18 (100.0%) | $0 |
Occupancy by Householder Income Bracket in Juntura
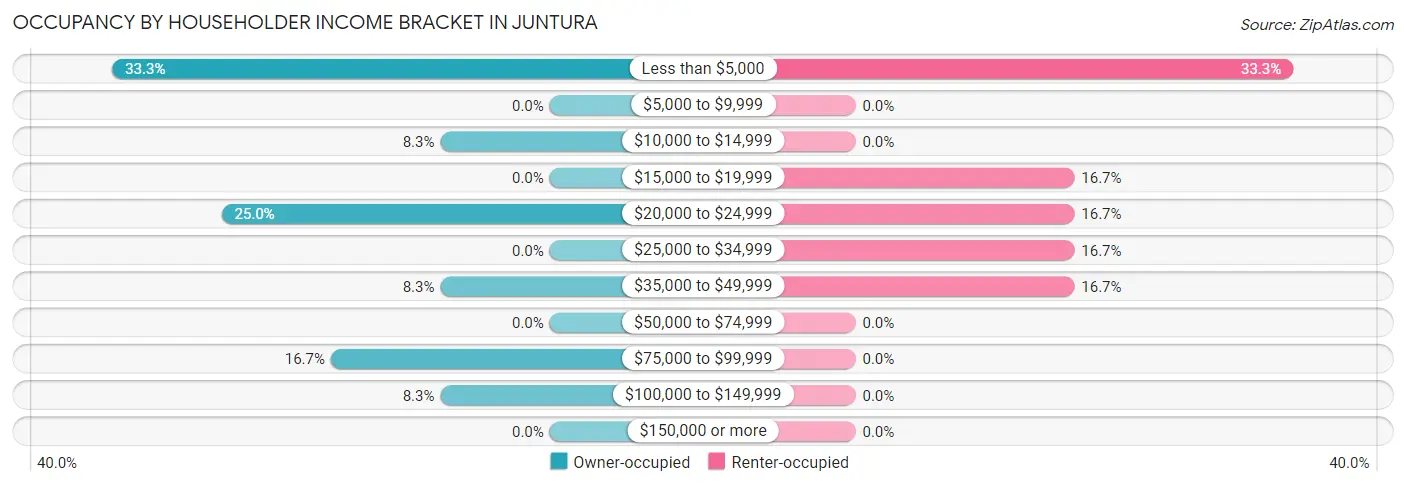
| Income Bracket | Owner-occupied | Renter-occupied |
| Less than $5,000 | 4 (33.3%) | 2 (33.3%) |
| $5,000 to $9,999 | 0 (0.0%) | 0 (0.0%) |
| $10,000 to $14,999 | 1 (8.3%) | 0 (0.0%) |
| $15,000 to $19,999 | 0 (0.0%) | 1 (16.7%) |
| $20,000 to $24,999 | 3 (25.0%) | 1 (16.7%) |
| $25,000 to $34,999 | 0 (0.0%) | 1 (16.7%) |
| $35,000 to $49,999 | 1 (8.3%) | 1 (16.7%) |
| $50,000 to $74,999 | 0 (0.0%) | 0 (0.0%) |
| $75,000 to $99,999 | 2 (16.7%) | 0 (0.0%) |
| $100,000 to $149,999 | 1 (8.3%) | 0 (0.0%) |
| $150,000 or more | 0 (0.0%) | 0 (0.0%) |
| Total | 12 (100.0%) | 6 (100.0%) |
Monthly Housing Cost Tiers in Juntura
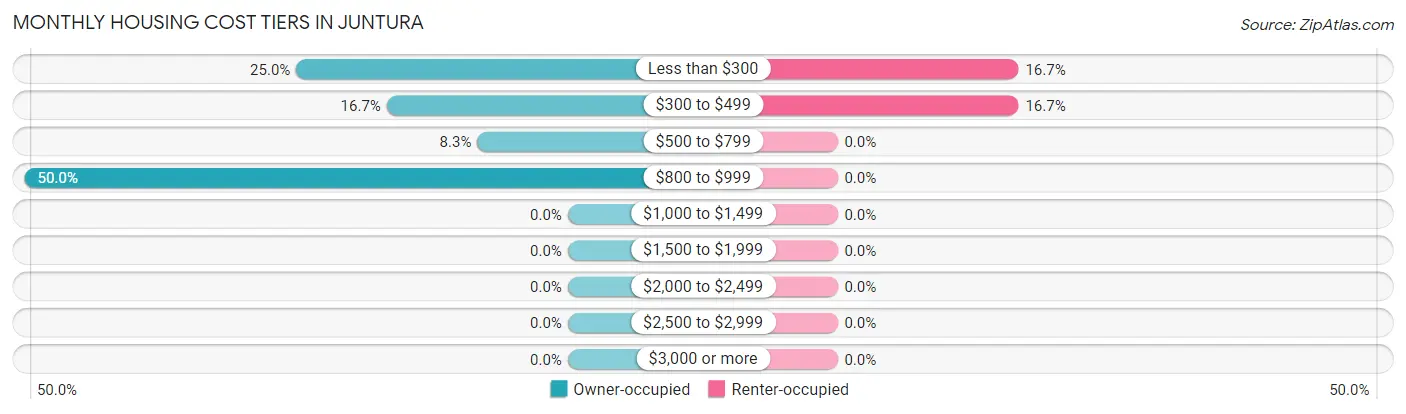
| Monthly Cost | Owner-occupied | Renter-occupied |
| Less than $300 | 3 (25.0%) | 1 (16.7%) |
| $300 to $499 | 2 (16.7%) | 1 (16.7%) |
| $500 to $799 | 1 (8.3%) | 0 (0.0%) |
| $800 to $999 | 6 (50.0%) | 0 (0.0%) |
| $1,000 to $1,499 | 0 (0.0%) | 0 (0.0%) |
| $1,500 to $1,999 | 0 (0.0%) | 0 (0.0%) |
| $2,000 to $2,499 | 0 (0.0%) | 0 (0.0%) |
| $2,500 to $2,999 | 0 (0.0%) | 0 (0.0%) |
| $3,000 or more | 0 (0.0%) | 0 (0.0%) |
| Total | 12 (100.0%) | 6 (100.0%) |
Physical Housing Characteristics in Juntura
Housing Structures in Juntura
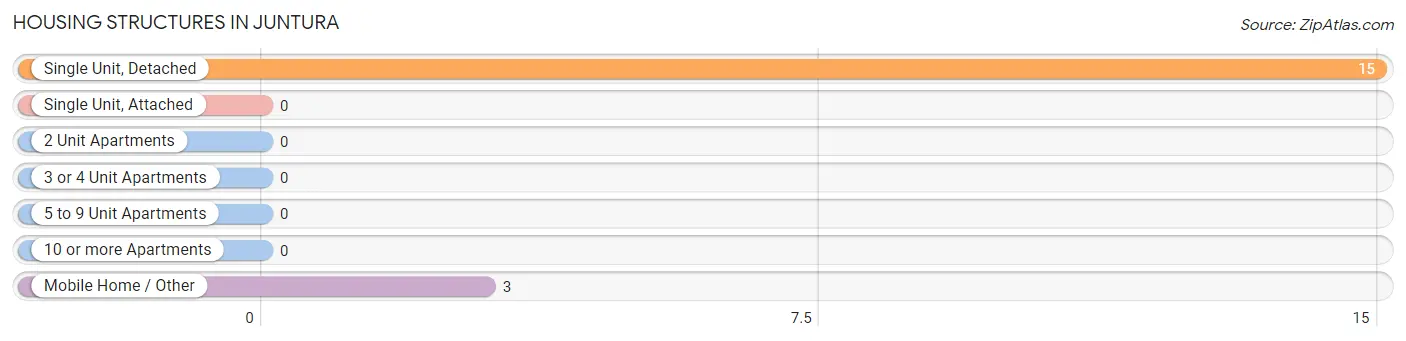
| Structure Type | # Housing Units | % Housing Units |
| Single Unit, Detached | 15 | 83.3% |
| Single Unit, Attached | 0 | 0.0% |
| 2 Unit Apartments | 0 | 0.0% |
| 3 or 4 Unit Apartments | 0 | 0.0% |
| 5 to 9 Unit Apartments | 0 | 0.0% |
| 10 or more Apartments | 0 | 0.0% |
| Mobile Home / Other | 3 | 16.7% |
| Total | 18 | 100.0% |
Housing Structures by Occupancy in Juntura
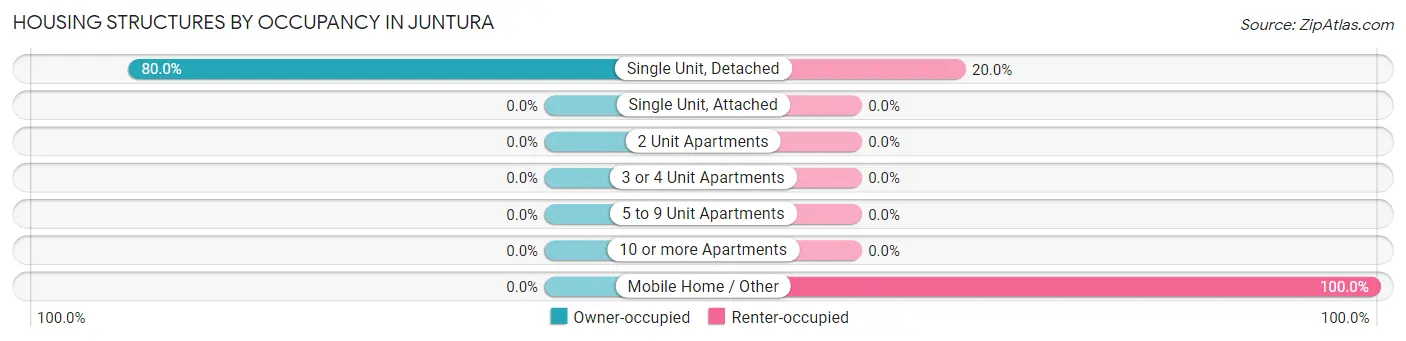
| Structure Type | Owner-occupied | Renter-occupied |
| Single Unit, Detached | 12 (80.0%) | 3 (20.0%) |
| Single Unit, Attached | 0 (0.0%) | 0 (0.0%) |
| 2 Unit Apartments | 0 (0.0%) | 0 (0.0%) |
| 3 or 4 Unit Apartments | 0 (0.0%) | 0 (0.0%) |
| 5 to 9 Unit Apartments | 0 (0.0%) | 0 (0.0%) |
| 10 or more Apartments | 0 (0.0%) | 0 (0.0%) |
| Mobile Home / Other | 0 (0.0%) | 3 (100.0%) |
| Total | 12 (66.7%) | 6 (33.3%) |
Housing Structures by Number of Rooms in Juntura
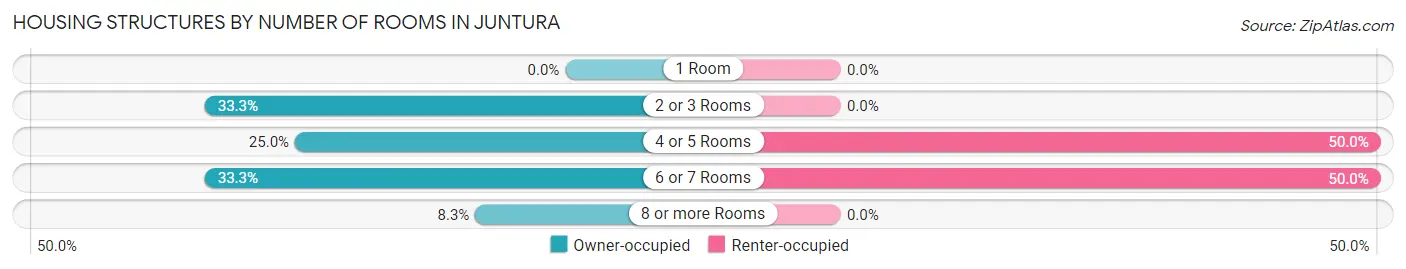
| Number of Rooms | Owner-occupied | Renter-occupied |
| 1 Room | 0 (0.0%) | 0 (0.0%) |
| 2 or 3 Rooms | 4 (33.3%) | 0 (0.0%) |
| 4 or 5 Rooms | 3 (25.0%) | 3 (50.0%) |
| 6 or 7 Rooms | 4 (33.3%) | 3 (50.0%) |
| 8 or more Rooms | 1 (8.3%) | 0 (0.0%) |
| Total | 12 (100.0%) | 6 (100.0%) |
Housing Structure by Heating Type in Juntura
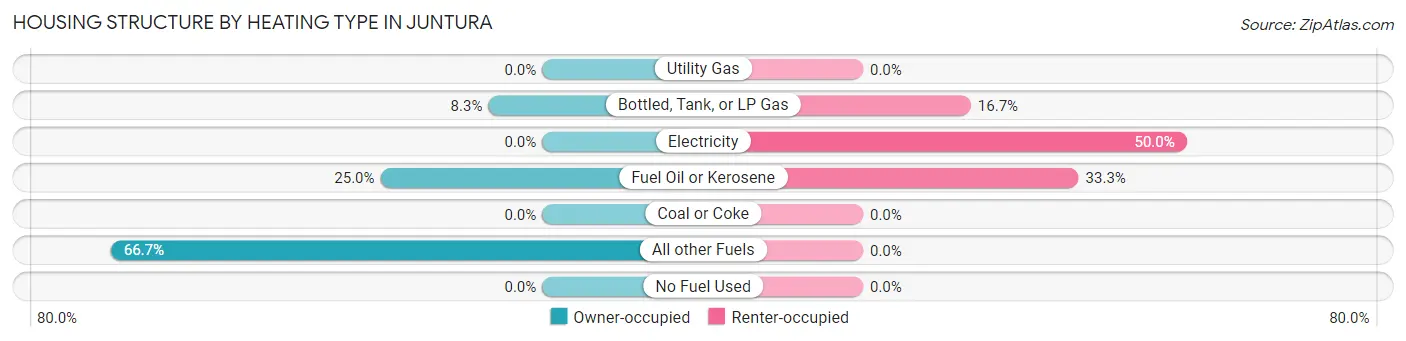
| Heating Type | Owner-occupied | Renter-occupied |
| Utility Gas | 0 (0.0%) | 0 (0.0%) |
| Bottled, Tank, or LP Gas | 1 (8.3%) | 1 (16.7%) |
| Electricity | 0 (0.0%) | 3 (50.0%) |
| Fuel Oil or Kerosene | 3 (25.0%) | 2 (33.3%) |
| Coal or Coke | 0 (0.0%) | 0 (0.0%) |
| All other Fuels | 8 (66.7%) | 0 (0.0%) |
| No Fuel Used | 0 (0.0%) | 0 (0.0%) |
| Total | 12 (100.0%) | 6 (100.0%) |
Household Vehicle Usage in Juntura
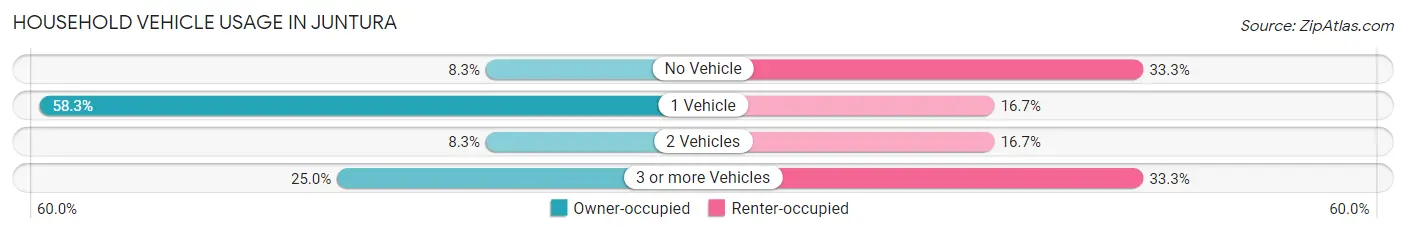
| Vehicles per Household | Owner-occupied | Renter-occupied |
| No Vehicle | 1 (8.3%) | 2 (33.3%) |
| 1 Vehicle | 7 (58.3%) | 1 (16.7%) |
| 2 Vehicles | 1 (8.3%) | 1 (16.7%) |
| 3 or more Vehicles | 3 (25.0%) | 2 (33.3%) |
| Total | 12 (100.0%) | 6 (100.0%) |
Real Estate & Mortgages in Juntura
Real Estate and Mortgage Overview in Juntura
| Characteristic | Without Mortgage | With Mortgage |
| Housing Units | 6 | 6 |
| Median Property Value | - | - |
| Median Household Income | $24,167 | $0 |
| Monthly Housing Costs | $275 | $0 |
| Real Estate Taxes | $500 | $0 |
Property Value by Mortgage Status in Juntura
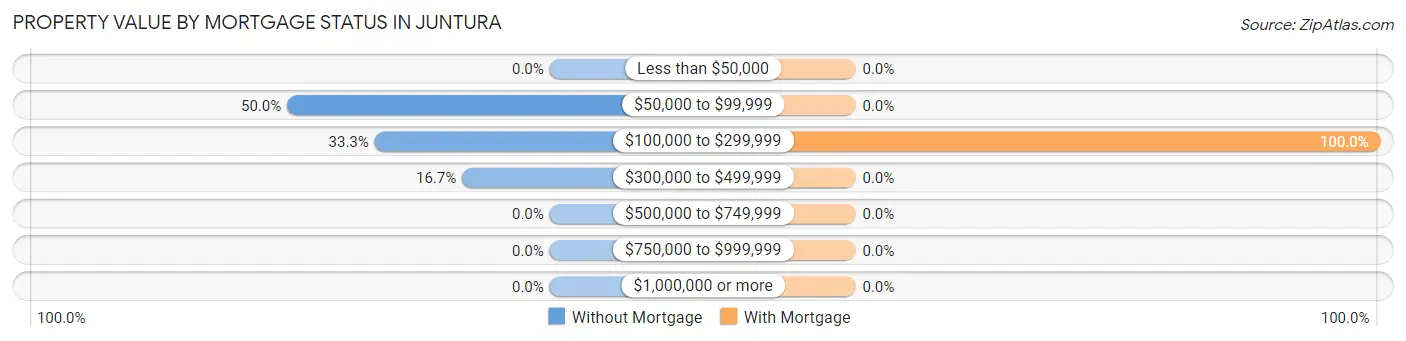
| Property Value | Without Mortgage | With Mortgage |
| Less than $50,000 | 0 (0.0%) | 0 (0.0%) |
| $50,000 to $99,999 | 3 (50.0%) | 0 (0.0%) |
| $100,000 to $299,999 | 2 (33.3%) | 6 (100.0%) |
| $300,000 to $499,999 | 1 (16.7%) | 0 (0.0%) |
| $500,000 to $749,999 | 0 (0.0%) | 0 (0.0%) |
| $750,000 to $999,999 | 0 (0.0%) | 0 (0.0%) |
| $1,000,000 or more | 0 (0.0%) | 0 (0.0%) |
| Total | 6 (100.0%) | 6 (100.0%) |
Household Income by Mortgage Status in Juntura
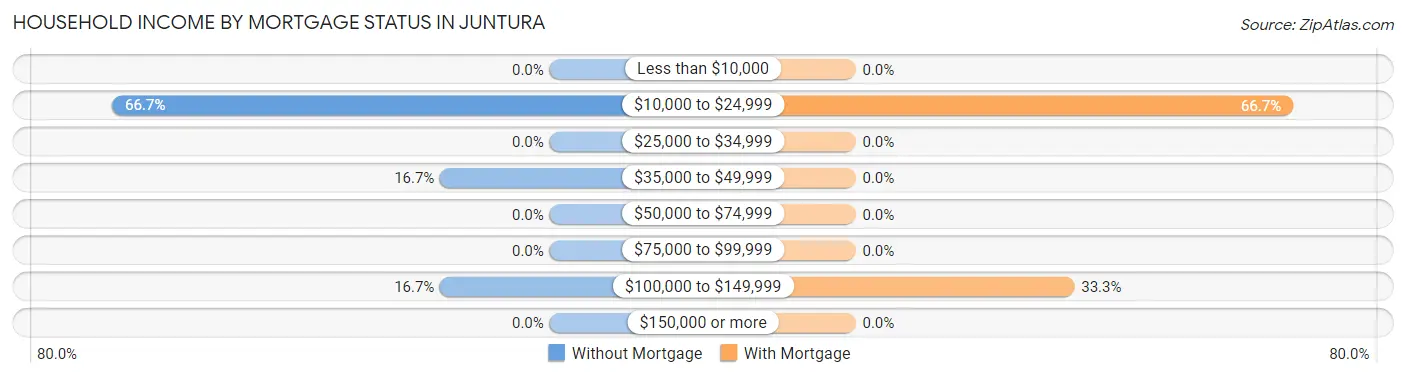
| Household Income | Without Mortgage | With Mortgage |
| Less than $10,000 | 0 (0.0%) | 0 (0.0%) |
| $10,000 to $24,999 | 4 (66.7%) | 4 (66.7%) |
| $25,000 to $34,999 | 0 (0.0%) | 0 (0.0%) |
| $35,000 to $49,999 | 1 (16.7%) | 0 (0.0%) |
| $50,000 to $74,999 | 0 (0.0%) | 0 (0.0%) |
| $75,000 to $99,999 | 0 (0.0%) | 0 (0.0%) |
| $100,000 to $149,999 | 1 (16.7%) | 2 (33.3%) |
| $150,000 or more | 0 (0.0%) | 0 (0.0%) |
| Total | 6 (100.0%) | 6 (100.0%) |
Property Value to Household Income Ratio in Juntura
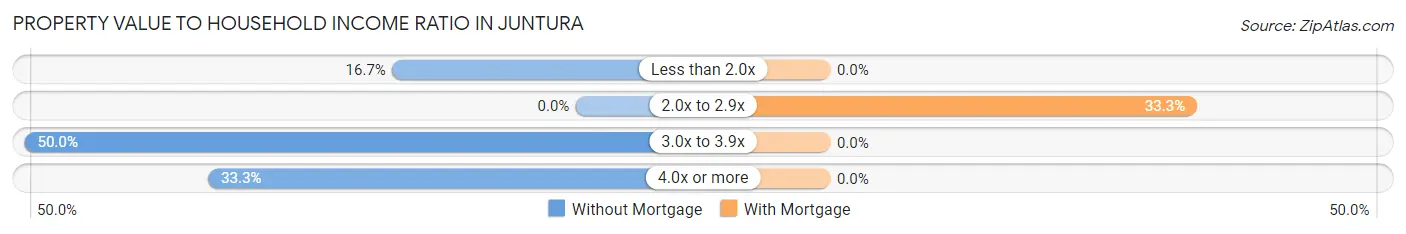
| Value-to-Income Ratio | Without Mortgage | With Mortgage |
| Less than 2.0x | 1 (16.7%) | 0 (0.0%) |
| 2.0x to 2.9x | 0 (0.0%) | 2 (33.3%) |
| 3.0x to 3.9x | 3 (50.0%) | 0 (0.0%) |
| 4.0x or more | 2 (33.3%) | 0 (0.0%) |
| Total | 6 (100.0%) | 6 (100.0%) |
Real Estate Taxes by Mortgage Status in Juntura
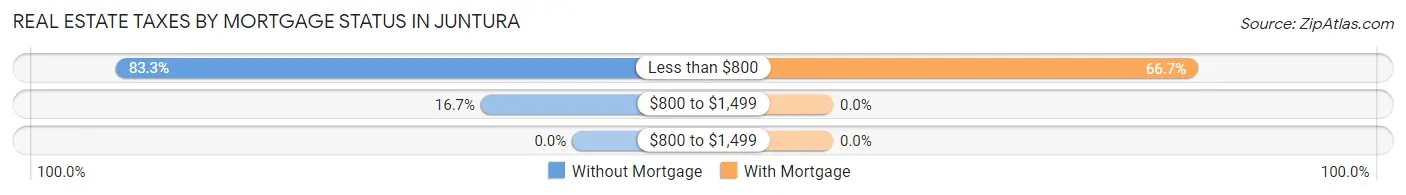
| Property Taxes | Without Mortgage | With Mortgage |
| Less than $800 | 5 (83.3%) | 4 (66.7%) |
| $800 to $1,499 | 1 (16.7%) | 0 (0.0%) |
| $800 to $1,499 | 0 (0.0%) | 0 (0.0%) |
| Total | 6 (100.0%) | 6 (100.0%) |
Health & Disability in Juntura
Health Insurance Coverage by Age in Juntura
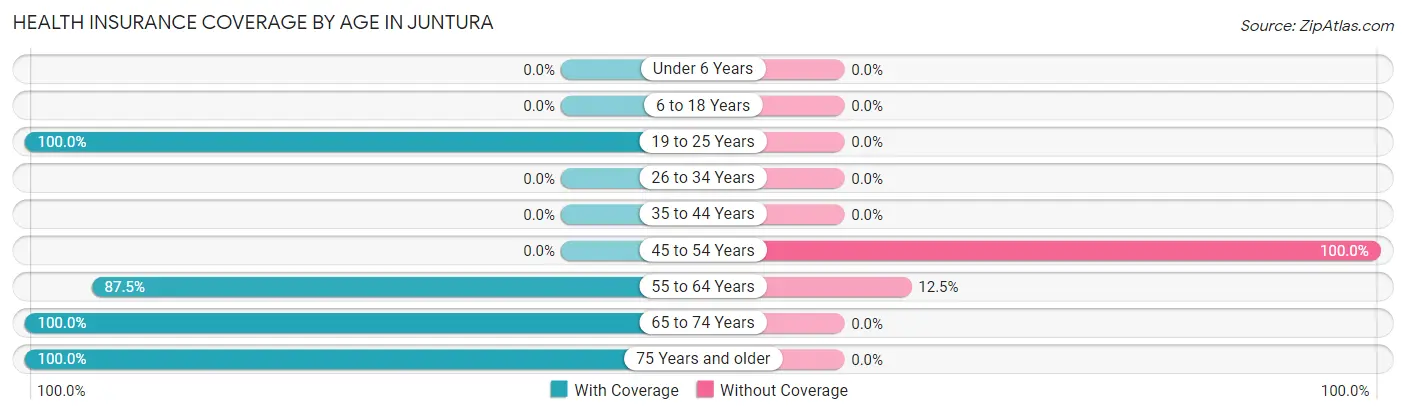
| Age Bracket | With Coverage | Without Coverage |
| Under 6 Years | 0 (0.0%) | 0 (0.0%) |
| 6 to 18 Years | 0 (0.0%) | 0 (0.0%) |
| 19 to 25 Years | 1 (100.0%) | 0 (0.0%) |
| 26 to 34 Years | 0 (0.0%) | 0 (0.0%) |
| 35 to 44 Years | 0 (0.0%) | 0 (0.0%) |
| 45 to 54 Years | 0 (0.0%) | 2 (100.0%) |
| 55 to 64 Years | 7 (87.5%) | 1 (12.5%) |
| 65 to 74 Years | 5 (100.0%) | 0 (0.0%) |
| 75 Years and older | 5 (100.0%) | 0 (0.0%) |
| Total | 18 (85.7%) | 3 (14.3%) |
Health Insurance Coverage by Citizenship Status in Juntura
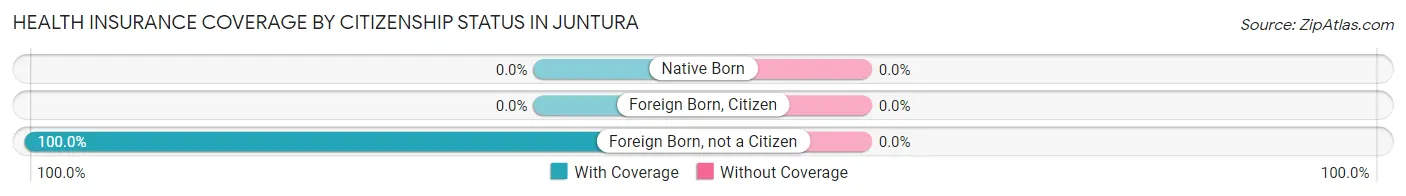
| Citizenship Status | With Coverage | Without Coverage |
| Native Born | 0 (0.0%) | 0 (0.0%) |
| Foreign Born, Citizen | 0 (0.0%) | 0 (0.0%) |
| Foreign Born, not a Citizen | 1 (100.0%) | 0 (0.0%) |
Health Insurance Coverage by Household Income in Juntura
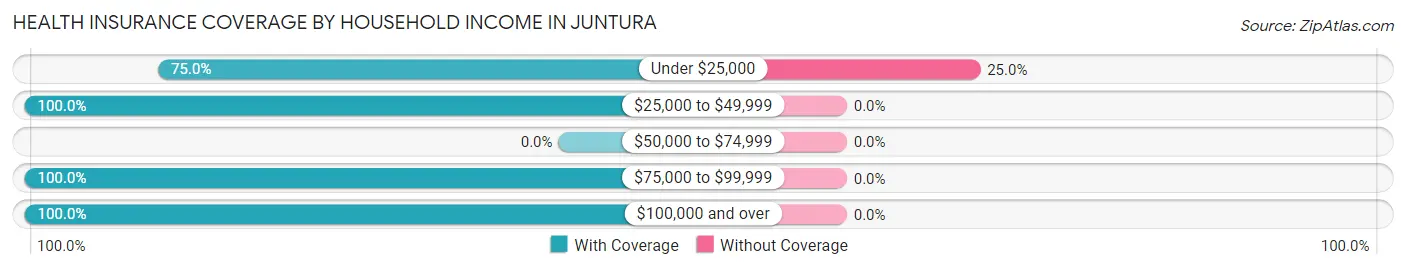
| Household Income | With Coverage | Without Coverage |
| Under $25,000 | 9 (75.0%) | 3 (25.0%) |
| $25,000 to $49,999 | 5 (100.0%) | 0 (0.0%) |
| $50,000 to $74,999 | 0 (0.0%) | 0 (0.0%) |
| $75,000 to $99,999 | 2 (100.0%) | 0 (0.0%) |
| $100,000 and over | 2 (100.0%) | 0 (0.0%) |
Public vs Private Health Insurance Coverage by Age in Juntura
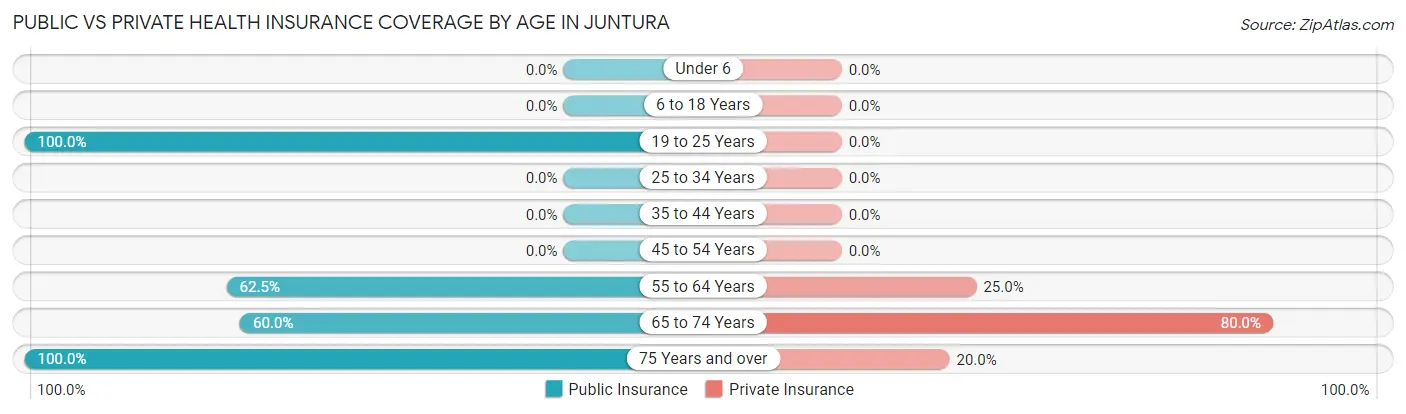
| Age Bracket | Public Insurance | Private Insurance |
| Under 6 | 0 (0.0%) | 0 (0.0%) |
| 6 to 18 Years | 0 (0.0%) | 0 (0.0%) |
| 19 to 25 Years | 1 (100.0%) | 0 (0.0%) |
| 25 to 34 Years | 0 (0.0%) | 0 (0.0%) |
| 35 to 44 Years | 0 (0.0%) | 0 (0.0%) |
| 45 to 54 Years | 0 (0.0%) | 0 (0.0%) |
| 55 to 64 Years | 5 (62.5%) | 2 (25.0%) |
| 65 to 74 Years | 3 (60.0%) | 4 (80.0%) |
| 75 Years and over | 5 (100.0%) | 1 (20.0%) |
| Total | 14 (66.7%) | 7 (33.3%) |
Disability Status by Sex by Age in Juntura
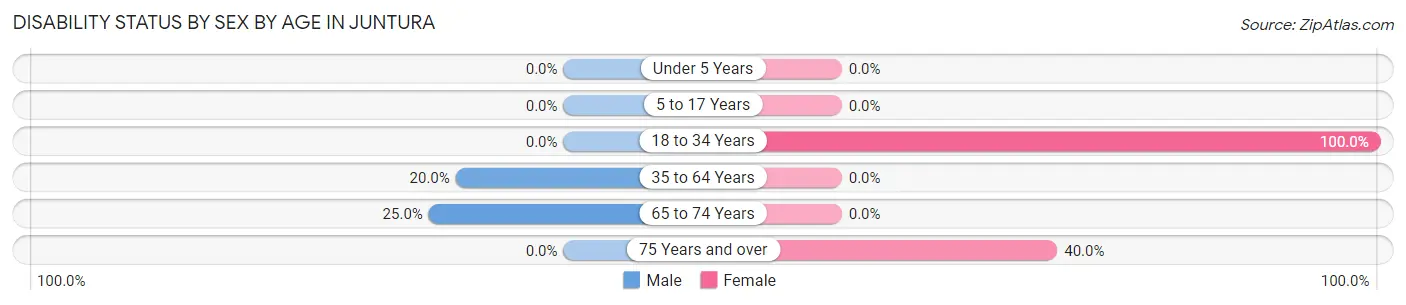
| Age Bracket | Male | Female |
| Under 5 Years | 0 (0.0%) | 0 (0.0%) |
| 5 to 17 Years | 0 (0.0%) | 0 (0.0%) |
| 18 to 34 Years | 0 (0.0%) | 1 (100.0%) |
| 35 to 64 Years | 1 (20.0%) | 0 (0.0%) |
| 65 to 74 Years | 1 (25.0%) | 0 (0.0%) |
| 75 Years and over | 0 (0.0%) | 2 (40.0%) |
Disability Class by Sex by Age in Juntura
Disability Class: Hearing Difficulty
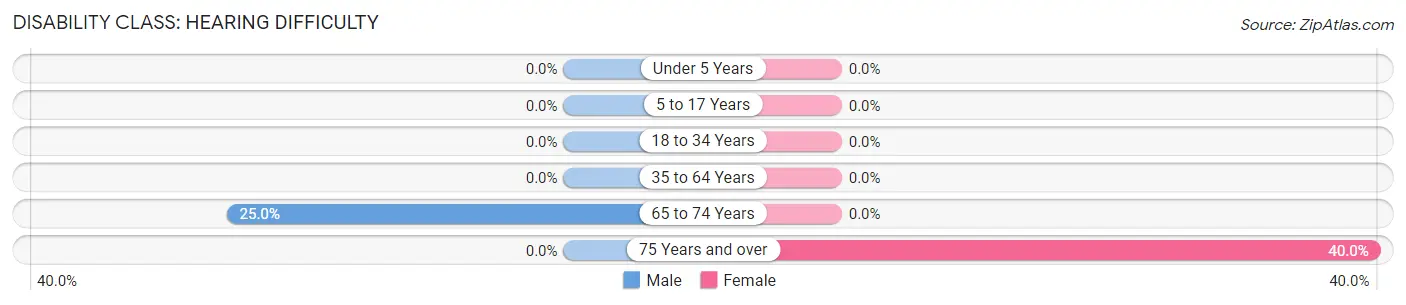
| Age Bracket | Male | Female |
| Under 5 Years | 0 (0.0%) | 0 (0.0%) |
| 5 to 17 Years | 0 (0.0%) | 0 (0.0%) |
| 18 to 34 Years | 0 (0.0%) | 0 (0.0%) |
| 35 to 64 Years | 0 (0.0%) | 0 (0.0%) |
| 65 to 74 Years | 1 (25.0%) | 0 (0.0%) |
| 75 Years and over | 0 (0.0%) | 2 (40.0%) |
Disability Class: Vision Difficulty
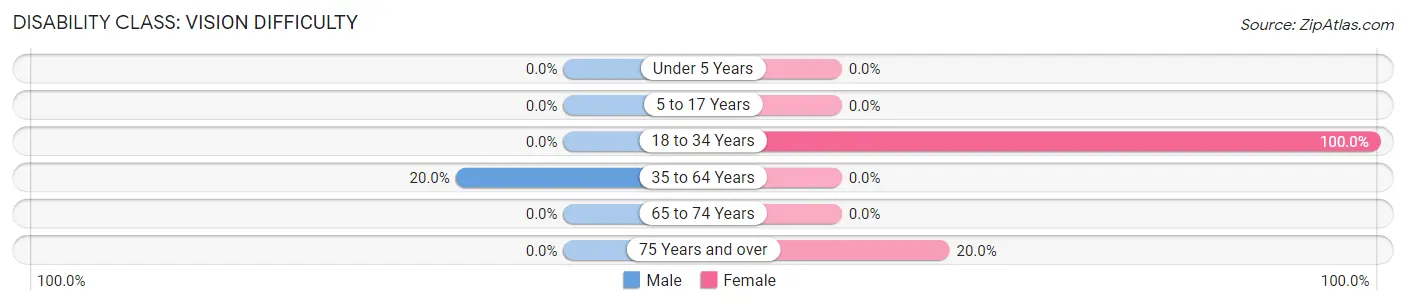
| Age Bracket | Male | Female |
| Under 5 Years | 0 (0.0%) | 0 (0.0%) |
| 5 to 17 Years | 0 (0.0%) | 0 (0.0%) |
| 18 to 34 Years | 0 (0.0%) | 1 (100.0%) |
| 35 to 64 Years | 1 (20.0%) | 0 (0.0%) |
| 65 to 74 Years | 0 (0.0%) | 0 (0.0%) |
| 75 Years and over | 0 (0.0%) | 1 (20.0%) |
Disability Class: Cognitive Difficulty
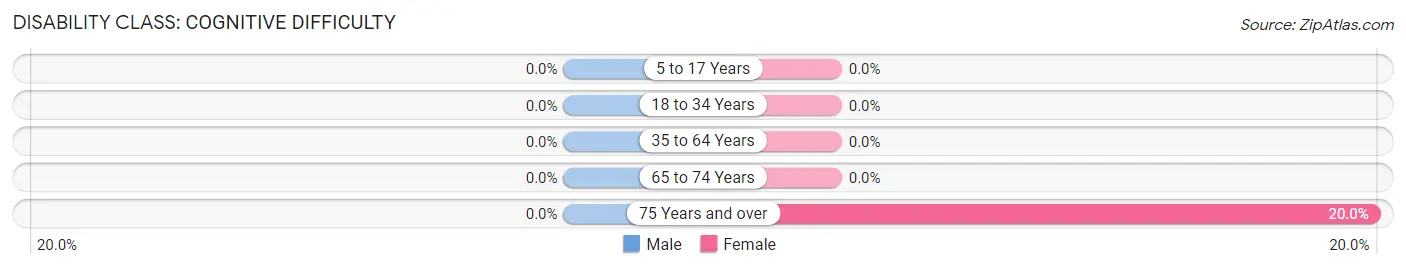
| Age Bracket | Male | Female |
| 5 to 17 Years | 0 (0.0%) | 0 (0.0%) |
| 18 to 34 Years | 0 (0.0%) | 0 (0.0%) |
| 35 to 64 Years | 0 (0.0%) | 0 (0.0%) |
| 65 to 74 Years | 0 (0.0%) | 0 (0.0%) |
| 75 Years and over | 0 (0.0%) | 1 (20.0%) |
Disability Class: Ambulatory Difficulty
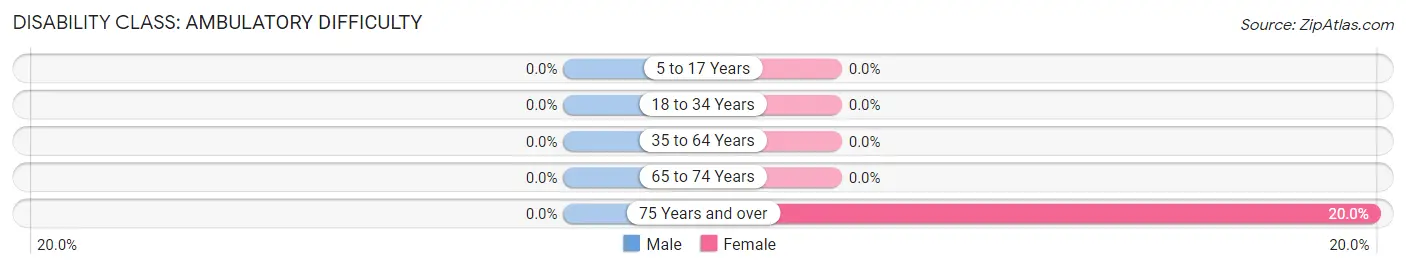
| Age Bracket | Male | Female |
| 5 to 17 Years | 0 (0.0%) | 0 (0.0%) |
| 18 to 34 Years | 0 (0.0%) | 0 (0.0%) |
| 35 to 64 Years | 0 (0.0%) | 0 (0.0%) |
| 65 to 74 Years | 0 (0.0%) | 0 (0.0%) |
| 75 Years and over | 0 (0.0%) | 1 (20.0%) |
Disability Class: Self-Care Difficulty
| Age Bracket | Male | Female |
| 5 to 17 Years | 0 (0.0%) | 0 (0.0%) |
| 18 to 34 Years | 0 (0.0%) | 0 (0.0%) |
| 35 to 64 Years | 0 (0.0%) | 0 (0.0%) |
| 65 to 74 Years | 0 (0.0%) | 0 (0.0%) |
| 75 Years and over | 0 (0.0%) | 0 (0.0%) |
Technology Access in Juntura
Computing Device Access in Juntura
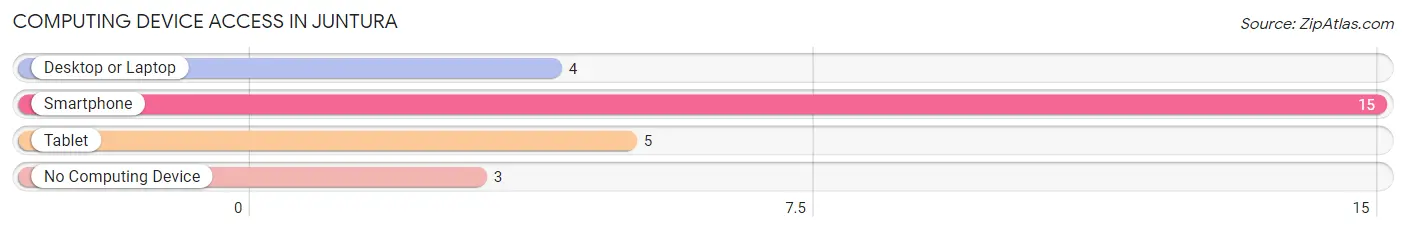
| Device Type | # Households | % Households |
| Desktop or Laptop | 4 | 22.2% |
| Smartphone | 15 | 83.3% |
| Tablet | 5 | 27.8% |
| No Computing Device | 3 | 16.7% |
| Total | 18 | 100.0% |
Internet Access in Juntura
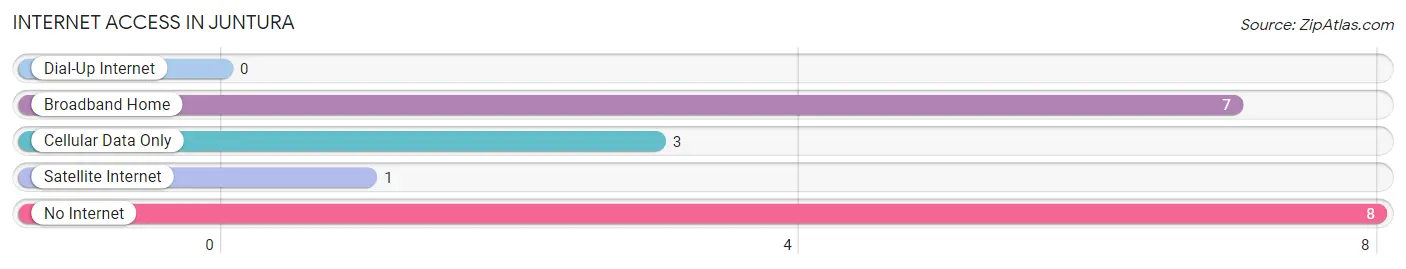
| Internet Type | # Households | % Households |
| Dial-Up Internet | 0 | 0.0% |
| Broadband Home | 7 | 38.9% |
| Cellular Data Only | 3 | 16.7% |
| Satellite Internet | 1 | 5.6% |
| No Internet | 8 | 44.4% |
| Total | 18 | 100.0% |
Juntura Summary
Juntura is a small unincorporated community located in Malheur County, Oregon. It is situated in the high desert of eastern Oregon, approximately 30 miles south of the city of Vale. The population of Juntura was estimated to be around 50 people in 2000.
History
Juntura was established in the late 1800s as a stagecoach stop along the Oregon Trail. The town was named after the nearby Juntura River, which was named by early settlers who thought the river resembled a “junction” of two rivers. The town was originally a small farming community, but it eventually grew to include a post office, a general store, a hotel, and a saloon.
In the early 1900s, Juntura was a popular stop for travelers on the Oregon Trail. The town was also a popular destination for sheepherders and cattle ranchers. In the 1920s, the town was home to a large sheep ranch, which was owned by the Juntura Sheep Company.
Geography
Juntura is located in the high desert of eastern Oregon, approximately 30 miles south of the city of Vale. The town is situated at an elevation of 4,000 feet, and is surrounded by the Owyhee Mountains to the east and the Malheur National Forest to the west. The Juntura River runs through the town, and is a popular destination for fishing and camping.
Economy
The economy of Juntura is largely based on agriculture and ranching. The town is home to several farms and ranches, which produce a variety of crops and livestock. The town is also home to a small sawmill, which produces lumber for local use.
Demographics
As of the 2000 census, the population of Juntura was estimated to be around 50 people. The racial makeup of the town was 97.1% White, 0.8% Native American, 0.4% Asian, and 1.7% from other races. The median household income was $25,000, and the median family income was $30,000.
Conclusion
Juntura is a small unincorporated community located in Malheur County, Oregon. It is situated in the high desert of eastern Oregon, approximately 30 miles south of the city of Vale. The population of Juntura was estimated to be around 50 people in 2000. The town was originally a small farming community, but it eventually grew to include a post office, a general store, a hotel, and a saloon. The economy of Juntura is largely based on agriculture and ranching, and the town is home to several farms and ranches. The racial makeup of the town was 97.1% White, 0.8% Native American, 0.4% Asian, and 1.7% from other races. The median household income was $25,000, and the median family income was $30,000.
Common Questions
What is Per Capita Income in Juntura?
Per Capita income in Juntura is $24,076.
What is Inequality or Gini Index in Juntura?
Inequality or Gini Index in Juntura is 0.56.
What is the Total Population of Juntura?
Total Population of Juntura is 21.
What is the Total Male Population of Juntura?
Total Male Population of Juntura is 9.
What is the Total Female Population of Juntura?
Total Female Population of Juntura is 12.
What is the Ratio of Males per 100 Females in Juntura?
There are 75.00 Males per 100 Females in Juntura.
What is the Ratio of Females per 100 Males in Juntura?
There are 133.33 Females per 100 Males in Juntura.
What is the Median Population Age in Juntura?
Median Population Age in Juntura is 64.5 Years.
What is the Average Family Size in Juntura
Average Family Size in Juntura is 2.0 People.
What is the Average Household Size in Juntura
Average Household Size in Juntura is 1.2 People.
How Large is the Labor Force in Juntura?
There are 8 People in the Labor Forcein in Juntura.
What is the Percentage of People in the Labor Force in Juntura?
38.1% of People are in the Labor Force in Juntura.