Cape Meares, OR Map & Demographics
Cape Meares Map
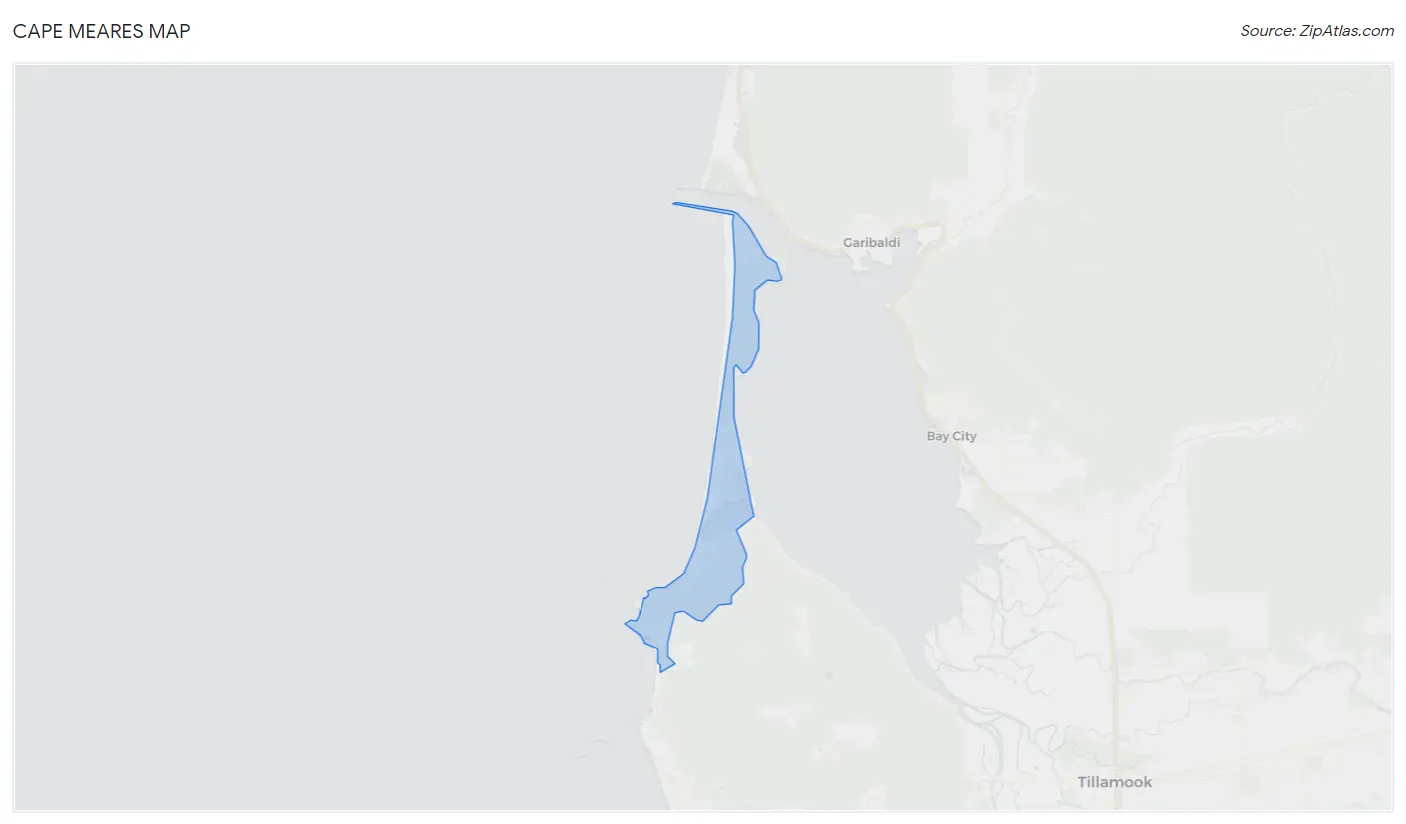
Cape Meares Overview
$54,019
PER CAPITA INCOME
$87,107
AVG FAMILY INCOME
$87,000
AVG HOUSEHOLD INCOME
0.27
INEQUALITY / GINI INDEX
199
TOTAL POPULATION
106
MALE POPULATION
93
FEMALE POPULATION
113.98
MALES / 100 FEMALES
87.74
FEMALES / 100 MALES
75.0
MEDIAN AGE
2.0
AVG FAMILY SIZE
1.8
AVG HOUSEHOLD SIZE
54
LABOR FORCE [ PEOPLE ]
28.7%
PERCENT IN LABOR FORCE
Income in Cape Meares
Income Overview in Cape Meares
Per Capita Income in Cape Meares is $54,019, while median incomes of families and households are $87,107 and $87,000 respectively.
| Characteristic | Number | Measure |
| Per Capita Income | 199 | $54,019 |
| Median Family Income | 89 | $87,107 |
| Mean Family Income | 89 | $98,490 |
| Median Household Income | 110 | $87,000 |
| Mean Household Income | 110 | $97,805 |
| Income Deficit | 89 | $0 |
| Wage / Income Gap (%) | 199 | 0.00% |
| Wage / Income Gap ($) | 199 | 100.00¢ per $1 |
| Gini / Inequality Index | 199 | 0.27 |
Earnings by Sex in Cape Meares
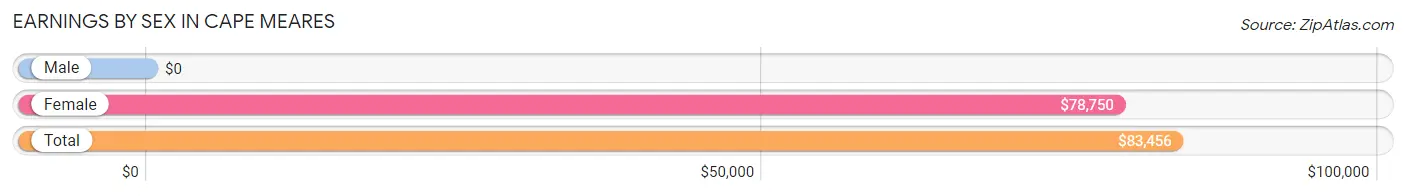
| Sex | Number | Average Earnings |
| Male | 26 (45.6%) | $0 |
| Female | 31 (54.4%) | $78,750 |
| Total | 57 (100.0%) | $83,456 |
Earnings by Sex by Income Bracket in Cape Meares
The most common earnings brackets in Cape Meares are $75,000 to $99,999 for men (17 | 65.4%) and $75,000 to $99,999 for women (13 | 41.9%).
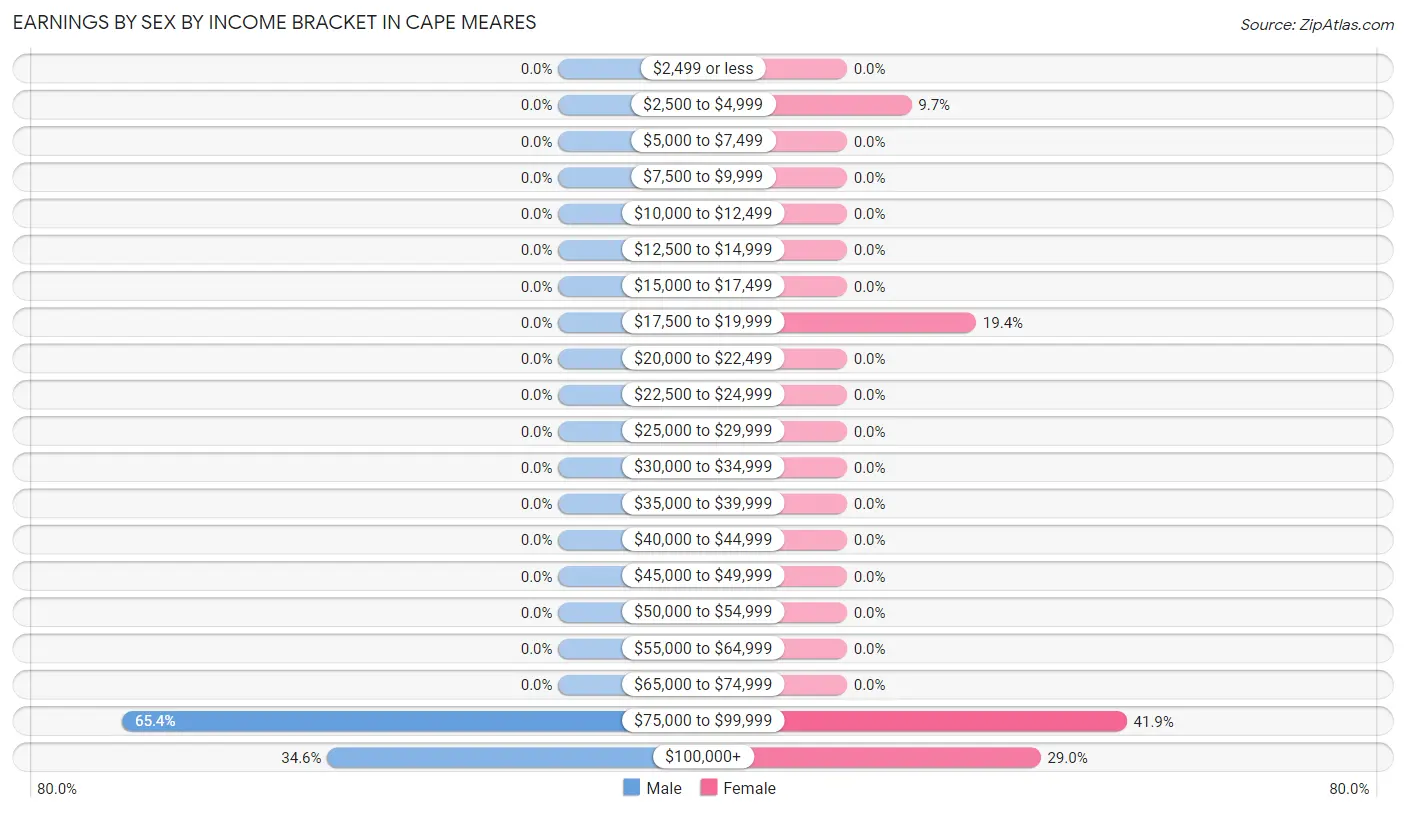
| Income | Male | Female |
| $2,499 or less | 0 (0.0%) | 0 (0.0%) |
| $2,500 to $4,999 | 0 (0.0%) | 3 (9.7%) |
| $5,000 to $7,499 | 0 (0.0%) | 0 (0.0%) |
| $7,500 to $9,999 | 0 (0.0%) | 0 (0.0%) |
| $10,000 to $12,499 | 0 (0.0%) | 0 (0.0%) |
| $12,500 to $14,999 | 0 (0.0%) | 0 (0.0%) |
| $15,000 to $17,499 | 0 (0.0%) | 0 (0.0%) |
| $17,500 to $19,999 | 0 (0.0%) | 6 (19.4%) |
| $20,000 to $22,499 | 0 (0.0%) | 0 (0.0%) |
| $22,500 to $24,999 | 0 (0.0%) | 0 (0.0%) |
| $25,000 to $29,999 | 0 (0.0%) | 0 (0.0%) |
| $30,000 to $34,999 | 0 (0.0%) | 0 (0.0%) |
| $35,000 to $39,999 | 0 (0.0%) | 0 (0.0%) |
| $40,000 to $44,999 | 0 (0.0%) | 0 (0.0%) |
| $45,000 to $49,999 | 0 (0.0%) | 0 (0.0%) |
| $50,000 to $54,999 | 0 (0.0%) | 0 (0.0%) |
| $55,000 to $64,999 | 0 (0.0%) | 0 (0.0%) |
| $65,000 to $74,999 | 0 (0.0%) | 0 (0.0%) |
| $75,000 to $99,999 | 17 (65.4%) | 13 (41.9%) |
| $100,000+ | 9 (34.6%) | 9 (29.0%) |
| Total | 26 (100.0%) | 31 (100.0%) |
Earnings by Sex by Educational Attainment in Cape Meares
| Educational Attainment | Male Income | Female Income |
| Less than High School | - | - |
| High School Diploma | - | - |
| College or Associate's Degree | - | - |
| Bachelor's Degree | - | - |
| Graduate Degree | - | - |
| Total | - | - |
Family Income in Cape Meares
Family Income Brackets in Cape Meares
According to the Cape Meares family income data, there are 42 families falling into the $75,000 to $99,999 income range, which is the most common income bracket and makes up 47.2% of all families.
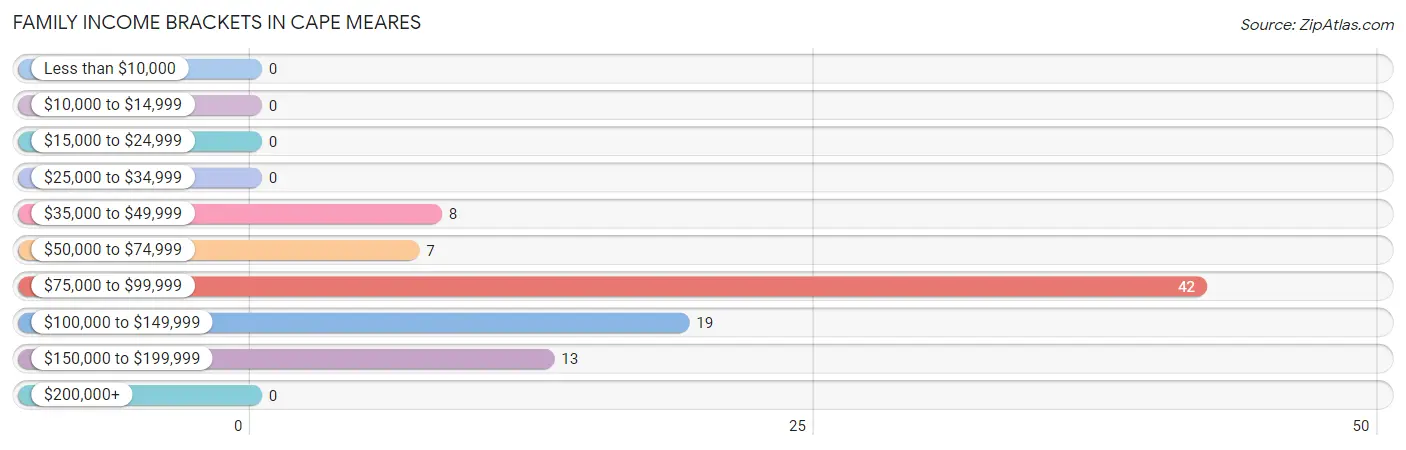
| Income Bracket | # Families | % Families |
| Less than $10,000 | 0 | 0.0% |
| $10,000 to $14,999 | 0 | 0.0% |
| $15,000 to $24,999 | 0 | 0.0% |
| $25,000 to $34,999 | 0 | 0.0% |
| $35,000 to $49,999 | 8 | 9.0% |
| $50,000 to $74,999 | 7 | 7.9% |
| $75,000 to $99,999 | 42 | 47.2% |
| $100,000 to $149,999 | 19 | 21.3% |
| $150,000 to $199,999 | 13 | 14.6% |
| $200,000+ | 0 | 0.0% |
Family Income by Famaliy Size in Cape Meares
2-person families (80 | 89.9%) account for the highest median family income in Cape Meares with $86,786 per family, while 2-person families (80 | 89.9%) have the highest median income of $43,393 per family member.
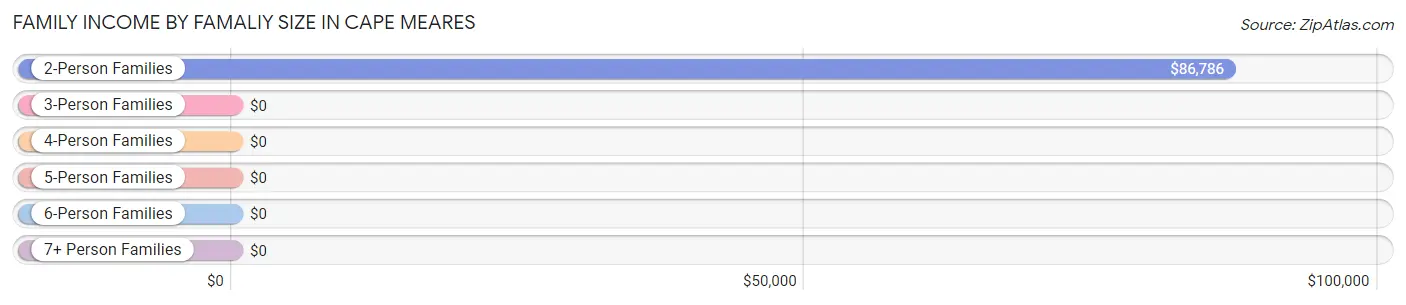
| Income Bracket | # Families | Median Income |
| 2-Person Families | 80 (89.9%) | $86,786 |
| 3-Person Families | 0 (0.0%) | $0 |
| 4-Person Families | 9 (10.1%) | $0 |
| 5-Person Families | 0 (0.0%) | $0 |
| 6-Person Families | 0 (0.0%) | $0 |
| 7+ Person Families | 0 (0.0%) | $0 |
| Total | 89 (100.0%) | $87,107 |
Family Income by Number of Earners in Cape Meares
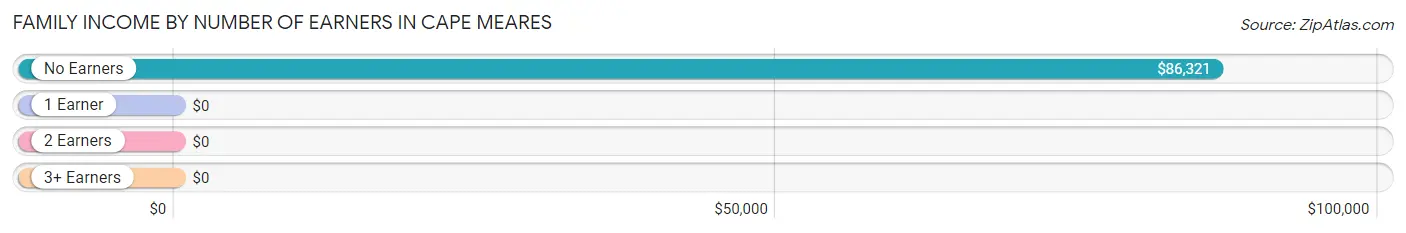
| Number of Earners | # Families | Median Income |
| No Earners | 67 (75.3%) | $86,321 |
| 1 Earner | 0 (0.0%) | $0 |
| 2 Earners | 22 (24.7%) | $0 |
| 3+ Earners | 0 (0.0%) | $0 |
| Total | 89 (100.0%) | $87,107 |
Household Income in Cape Meares
Household Income Brackets in Cape Meares
With 42 households falling in the category, the $75,000 to $99,999 income range is the most frequent in Cape Meares, accounting for 38.2% of all households.
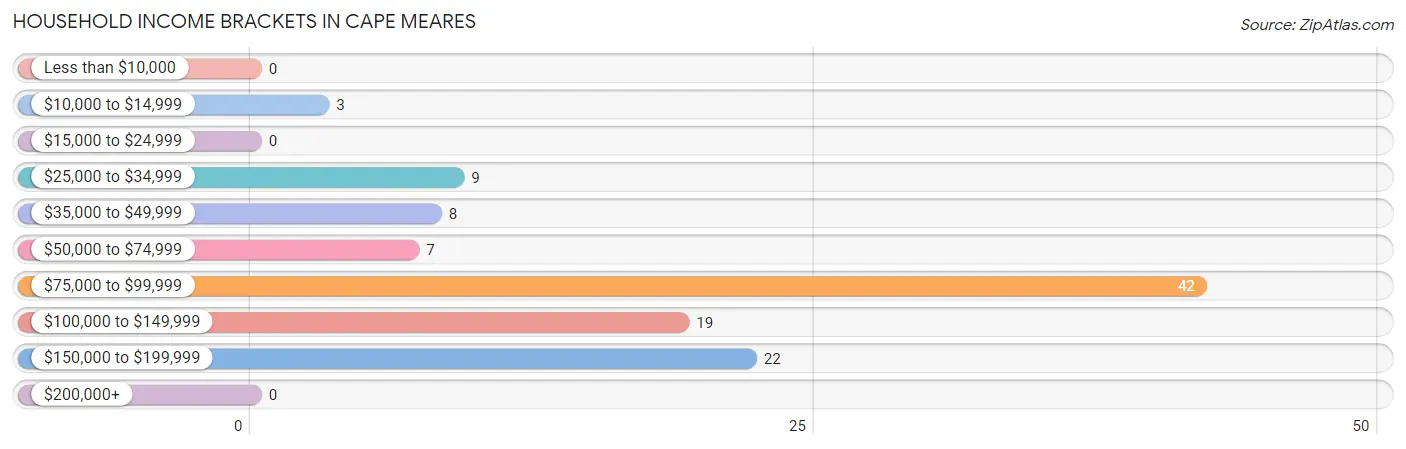
| Income Bracket | # Households | % Households |
| Less than $10,000 | 0 | 0.0% |
| $10,000 to $14,999 | 3 | 2.7% |
| $15,000 to $24,999 | 0 | 0.0% |
| $25,000 to $34,999 | 9 | 8.2% |
| $35,000 to $49,999 | 8 | 7.3% |
| $50,000 to $74,999 | 7 | 6.4% |
| $75,000 to $99,999 | 42 | 38.2% |
| $100,000 to $149,999 | 19 | 17.3% |
| $150,000 to $199,999 | 22 | 20.0% |
| $200,000+ | 0 | 0.0% |
Household Income by Householder Age in Cape Meares
The median household income in Cape Meares is $87,000, with the highest median household income of $85,893 found in the 65+ years age bracket for the primary householder. A total of 79 households (71.8%) fall into this category.
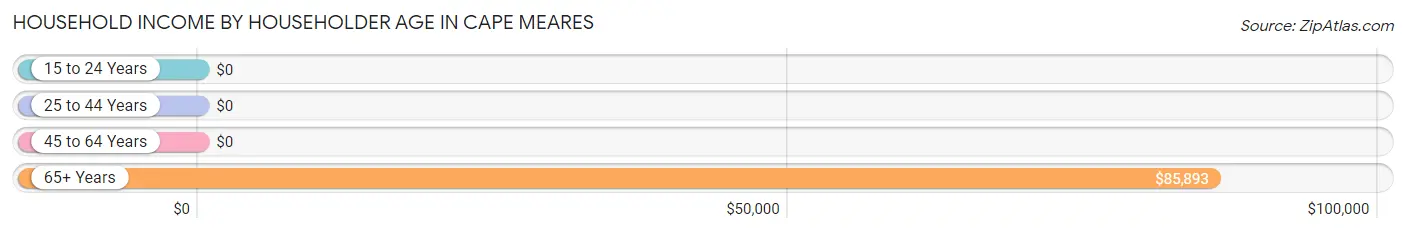
| Income Bracket | # Households | Median Income |
| 15 to 24 Years | 0 (0.0%) | $0 |
| 25 to 44 Years | 22 (20.0%) | $0 |
| 45 to 64 Years | 9 (8.2%) | $0 |
| 65+ Years | 79 (71.8%) | $85,893 |
| Total | 110 (100.0%) | $87,000 |
Poverty in Cape Meares
Income Below Poverty by Sex and Age in Cape Meares
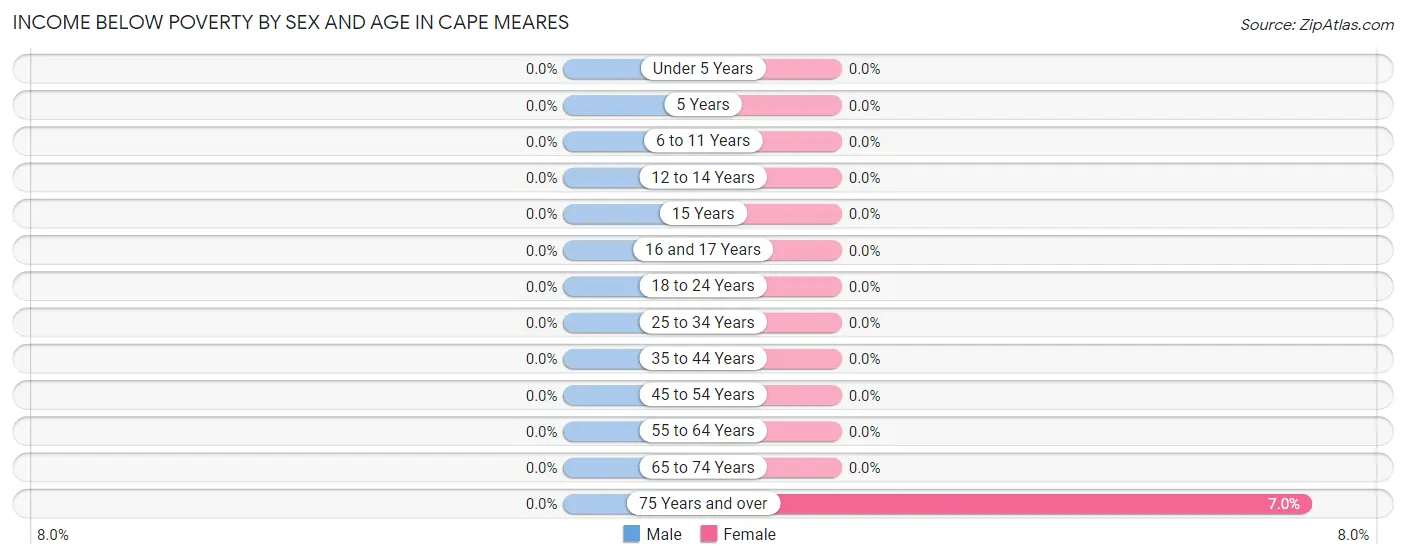
| Age Bracket | Male | Female |
| Under 5 Years | 0 (0.0%) | 0 (0.0%) |
| 5 Years | 0 (0.0%) | 0 (0.0%) |
| 6 to 11 Years | 0 (0.0%) | 0 (0.0%) |
| 12 to 14 Years | 0 (0.0%) | 0 (0.0%) |
| 15 Years | 0 (0.0%) | 0 (0.0%) |
| 16 and 17 Years | 0 (0.0%) | 0 (0.0%) |
| 18 to 24 Years | 0 (0.0%) | 0 (0.0%) |
| 25 to 34 Years | 0 (0.0%) | 0 (0.0%) |
| 35 to 44 Years | 0 (0.0%) | 0 (0.0%) |
| 45 to 54 Years | 0 (0.0%) | 0 (0.0%) |
| 55 to 64 Years | 0 (0.0%) | 0 (0.0%) |
| 65 to 74 Years | 0 (0.0%) | 0 (0.0%) |
| 75 Years and over | 0 (0.0%) | 3 (7.0%) |
| Total | 0 (0.0%) | 3 (3.2%) |
Income Above Poverty by Sex and Age in Cape Meares
According to the poverty statistics in Cape Meares, males aged 15 years and females aged 6 to 11 years are the age groups that are most secure financially, with 100.0% of males and 100.0% of females in these age groups living above the poverty line.
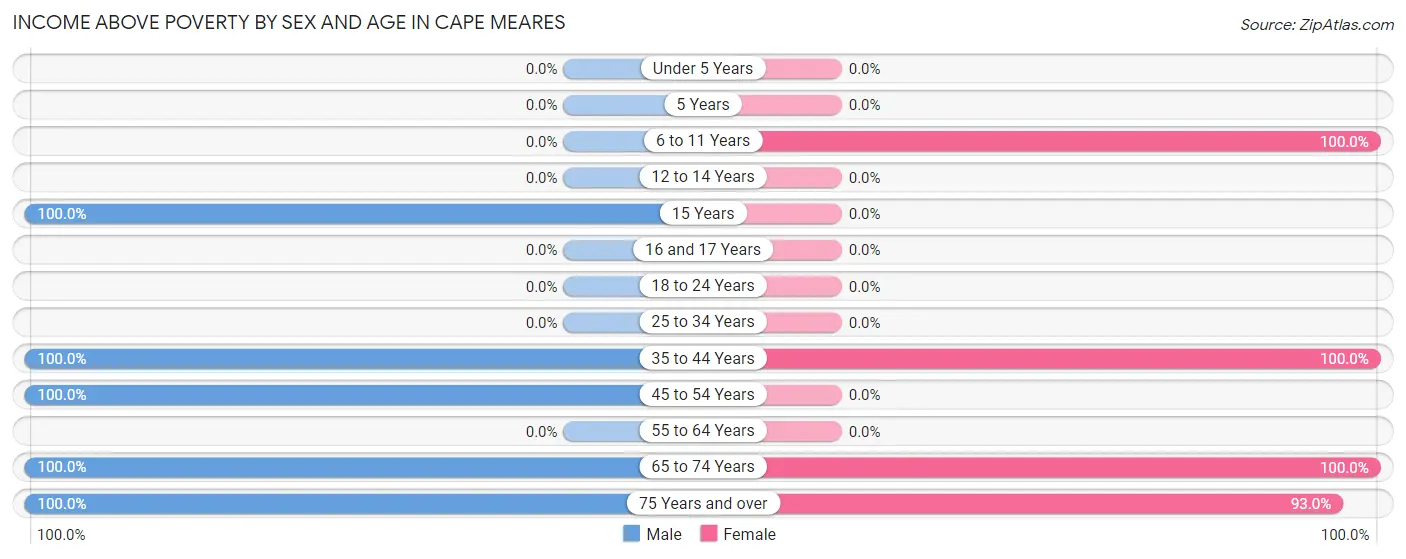
| Age Bracket | Male | Female |
| Under 5 Years | 0 (0.0%) | 0 (0.0%) |
| 5 Years | 0 (0.0%) | 0 (0.0%) |
| 6 to 11 Years | 0 (0.0%) | 6 (100.0%) |
| 12 to 14 Years | 0 (0.0%) | 0 (0.0%) |
| 15 Years | 5 (100.0%) | 0 (0.0%) |
| 16 and 17 Years | 0 (0.0%) | 0 (0.0%) |
| 18 to 24 Years | 0 (0.0%) | 0 (0.0%) |
| 25 to 34 Years | 0 (0.0%) | 0 (0.0%) |
| 35 to 44 Years | 17 (100.0%) | 28 (100.0%) |
| 45 to 54 Years | 9 (100.0%) | 0 (0.0%) |
| 55 to 64 Years | 0 (0.0%) | 0 (0.0%) |
| 65 to 74 Years | 18 (100.0%) | 16 (100.0%) |
| 75 Years and over | 57 (100.0%) | 40 (93.0%) |
| Total | 106 (100.0%) | 90 (96.8%) |
Income Below Poverty Among Married-Couple Families in Cape Meares
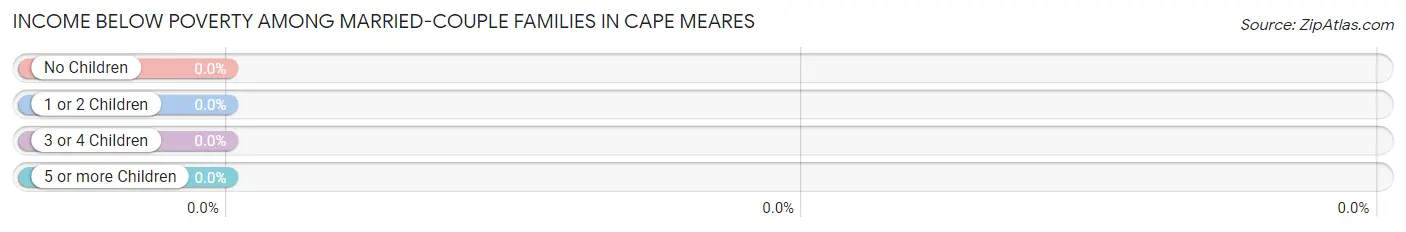
| Children | Above Poverty | Below Poverty |
| No Children | 80 (100.0%) | 0 (0.0%) |
| 1 or 2 Children | 9 (100.0%) | 0 (0.0%) |
| 3 or 4 Children | 0 (0.0%) | 0 (0.0%) |
| 5 or more Children | 0 (0.0%) | 0 (0.0%) |
| Total | 89 (100.0%) | 0 (0.0%) |
Income Below Poverty Among Single-Parent Households in Cape Meares
| Children | Single Father | Single Mother |
| No Children | 0 (0.0%) | 0 (0.0%) |
| 1 or 2 Children | 0 (0.0%) | 0 (0.0%) |
| 3 or 4 Children | 0 (0.0%) | 0 (0.0%) |
| 5 or more Children | 0 (0.0%) | 0 (0.0%) |
| Total | 0 (0.0%) | 0 (0.0%) |
Income Below Poverty Among Married-Couple vs Single-Parent Households in Cape Meares
| Children | Married-Couple Families | Single-Parent Households |
| No Children | 0 (0.0%) | 0 (0.0%) |
| 1 or 2 Children | 0 (0.0%) | 0 (0.0%) |
| 3 or 4 Children | 0 (0.0%) | 0 (0.0%) |
| 5 or more Children | 0 (0.0%) | 0 (0.0%) |
| Total | 0 (0.0%) | 0 (0.0%) |
Race in Cape Meares
The most populous races in Cape Meares are White / Caucasian (190 | 95.5%), and Two or more Races (9 | 4.5%).
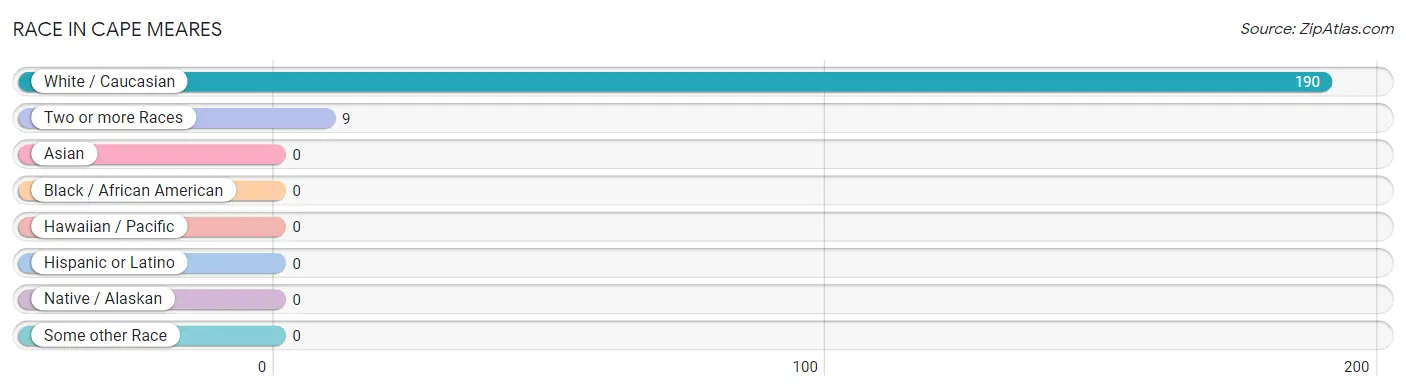
| Race | # Population | % Population |
| Asian | 0 | 0.0% |
| Black / African American | 0 | 0.0% |
| Hawaiian / Pacific | 0 | 0.0% |
| Hispanic or Latino | 0 | 0.0% |
| Native / Alaskan | 0 | 0.0% |
| White / Caucasian | 190 | 95.5% |
| Two or more Races | 9 | 4.5% |
| Some other Race | 0 | 0.0% |
| Total | 199 | 100.0% |
Ancestry in Cape Meares
The most populous ancestries reported in Cape Meares are English (90 | 45.2%), French (41 | 20.6%), Swiss (35 | 17.6%), German (30 | 15.1%), and European (26 | 13.1%), together accounting for 111.6% of all Cape Meares residents.
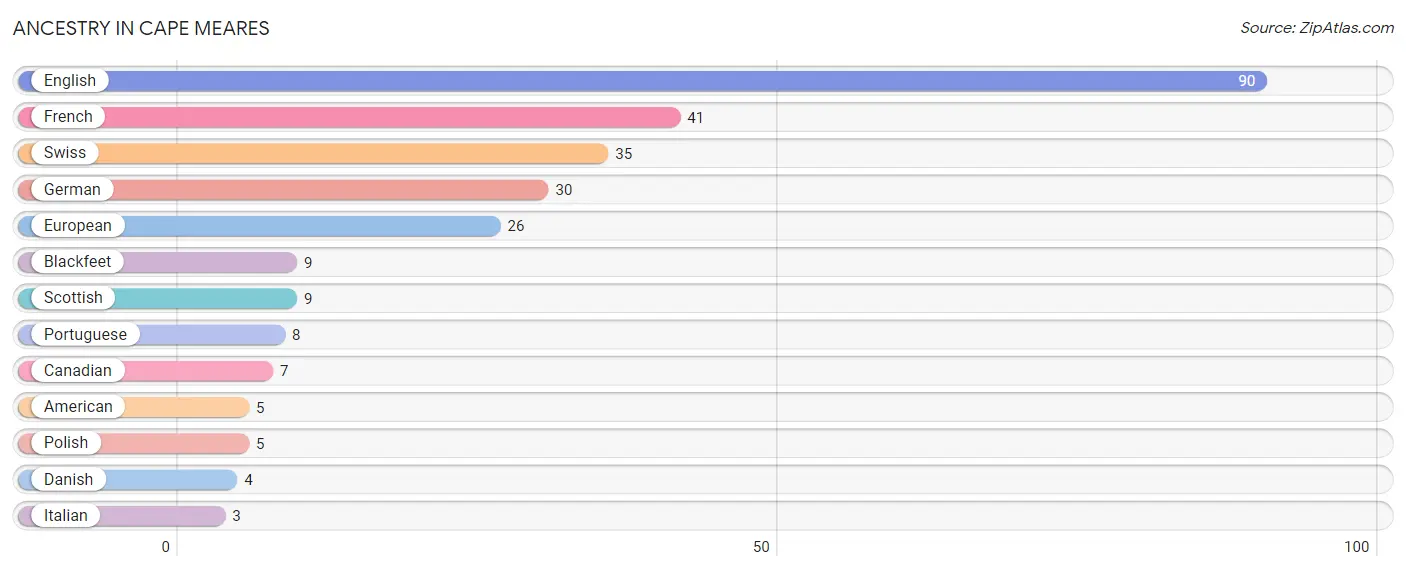
| Ancestry | # Population | % Population |
| American | 5 | 2.5% |
| Blackfeet | 9 | 4.5% |
| Canadian | 7 | 3.5% |
| Danish | 4 | 2.0% |
| English | 90 | 45.2% |
| European | 26 | 13.1% |
| French | 41 | 20.6% |
| German | 30 | 15.1% |
| Italian | 3 | 1.5% |
| Polish | 5 | 2.5% |
| Portuguese | 8 | 4.0% |
| Scottish | 9 | 4.5% |
| Swiss | 35 | 17.6% | View All 13 Rows |
Immigrants in Cape Meares
The most numerous immigrant groups reported in Cape Meares came from , and Canada (7 | 3.5%), together accounting for 3.5% of all Cape Meares residents.

| Immigration Origin | # Population | % Population |
| Canada | 7 | 3.5% | View All 1 Rows |
Sex and Age in Cape Meares
Sex and Age in Cape Meares
The most populous age groups in Cape Meares are 75 to 79 Years (50 | 47.2%) for men and 75 to 79 Years (37 | 39.8%) for women.
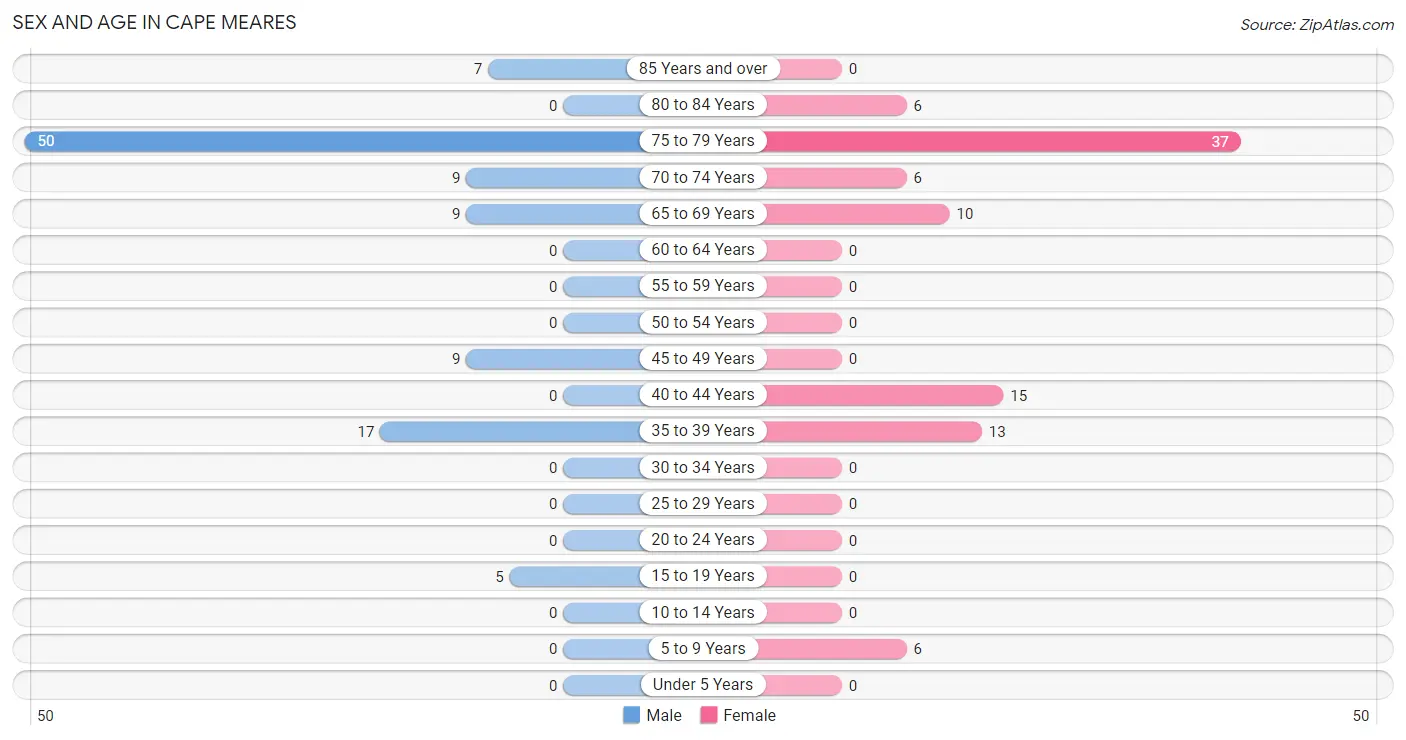
| Age Bracket | Male | Female |
| Under 5 Years | 0 (0.0%) | 0 (0.0%) |
| 5 to 9 Years | 0 (0.0%) | 6 (6.5%) |
| 10 to 14 Years | 0 (0.0%) | 0 (0.0%) |
| 15 to 19 Years | 5 (4.7%) | 0 (0.0%) |
| 20 to 24 Years | 0 (0.0%) | 0 (0.0%) |
| 25 to 29 Years | 0 (0.0%) | 0 (0.0%) |
| 30 to 34 Years | 0 (0.0%) | 0 (0.0%) |
| 35 to 39 Years | 17 (16.0%) | 13 (14.0%) |
| 40 to 44 Years | 0 (0.0%) | 15 (16.1%) |
| 45 to 49 Years | 9 (8.5%) | 0 (0.0%) |
| 50 to 54 Years | 0 (0.0%) | 0 (0.0%) |
| 55 to 59 Years | 0 (0.0%) | 0 (0.0%) |
| 60 to 64 Years | 0 (0.0%) | 0 (0.0%) |
| 65 to 69 Years | 9 (8.5%) | 10 (10.7%) |
| 70 to 74 Years | 9 (8.5%) | 6 (6.5%) |
| 75 to 79 Years | 50 (47.2%) | 37 (39.8%) |
| 80 to 84 Years | 0 (0.0%) | 6 (6.5%) |
| 85 Years and over | 7 (6.6%) | 0 (0.0%) |
| Total | 106 (100.0%) | 93 (100.0%) |
Families and Households in Cape Meares
Median Family Size in Cape Meares
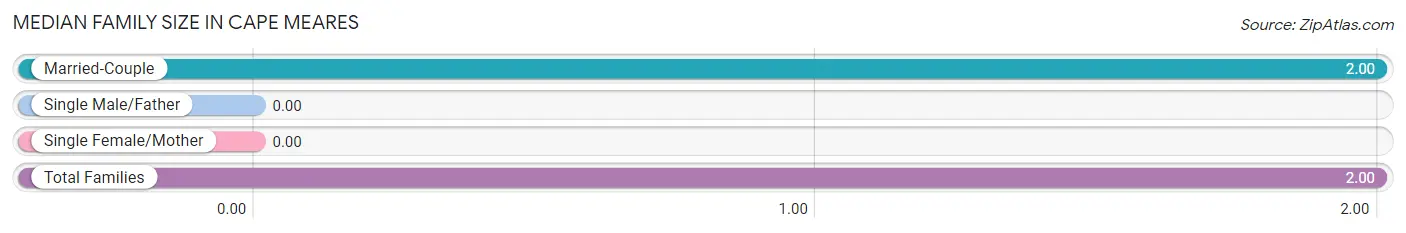
| Family Type | # Families | Family Size |
| Married-Couple | 89 (100.0%) | 2.00 |
| Single Male/Father | 0 (0.0%) | - |
| Single Female/Mother | 0 (0.0%) | - |
| Total Families | 89 (100.0%) | 2.00 |
Median Household Size in Cape Meares
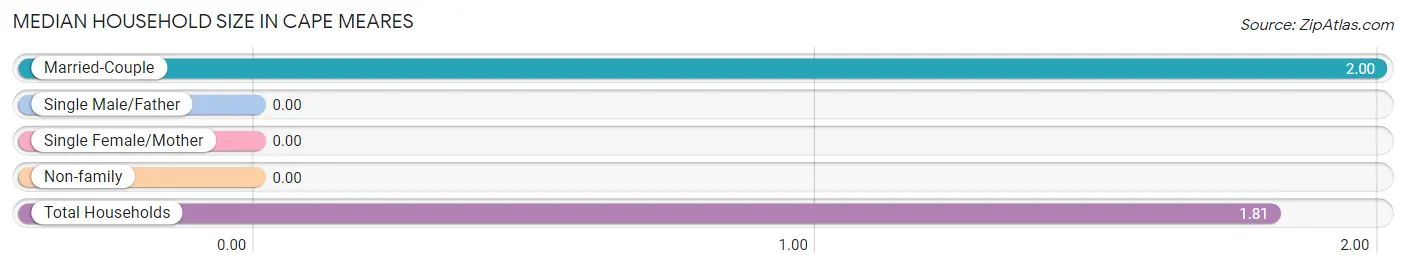
| Household Type | # Households | Household Size |
| Married-Couple | 89 (80.9%) | 2.00 |
| Single Male/Father | 0 (0.0%) | - |
| Single Female/Mother | 0 (0.0%) | - |
| Non-family | 21 (19.1%) | - |
| Total Households | 110 (100.0%) | 1.81 |
Household Size by Marriage Status in Cape Meares
Out of a total of 110 households in Cape Meares, 89 (80.9%) are family households, while 21 (19.1%) are nonfamily households. The most numerous type of family households are 2-person households, comprising 80, and the most common type of nonfamily households are 1-person households, comprising 21.
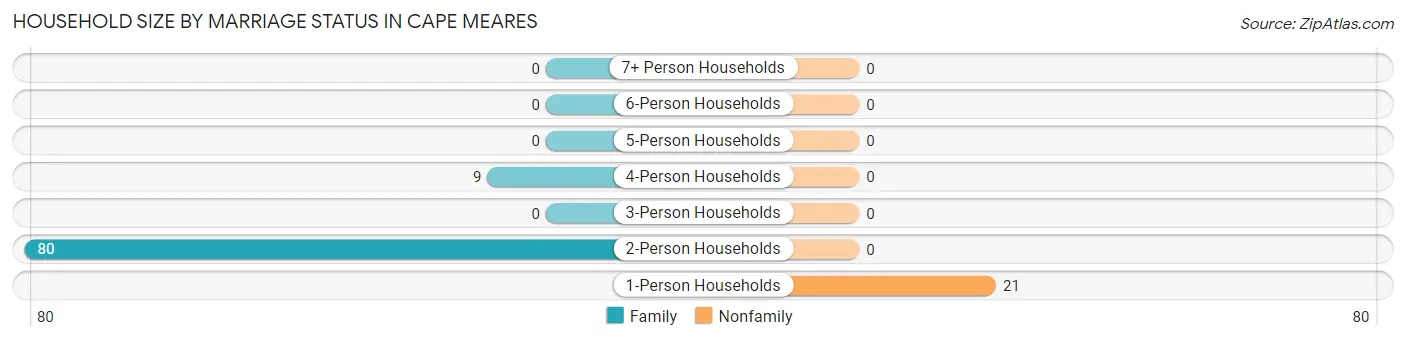
| Household Size | Family Households | Nonfamily Households |
| 1-Person Households | - | 21 (19.1%) |
| 2-Person Households | 80 (72.7%) | 0 (0.0%) |
| 3-Person Households | 0 (0.0%) | 0 (0.0%) |
| 4-Person Households | 9 (8.2%) | 0 (0.0%) |
| 5-Person Households | 0 (0.0%) | 0 (0.0%) |
| 6-Person Households | 0 (0.0%) | 0 (0.0%) |
| 7+ Person Households | 0 (0.0%) | 0 (0.0%) |
| Total | 89 (80.9%) | 21 (19.1%) |
Female Fertility in Cape Meares
Fertility by Age in Cape Meares
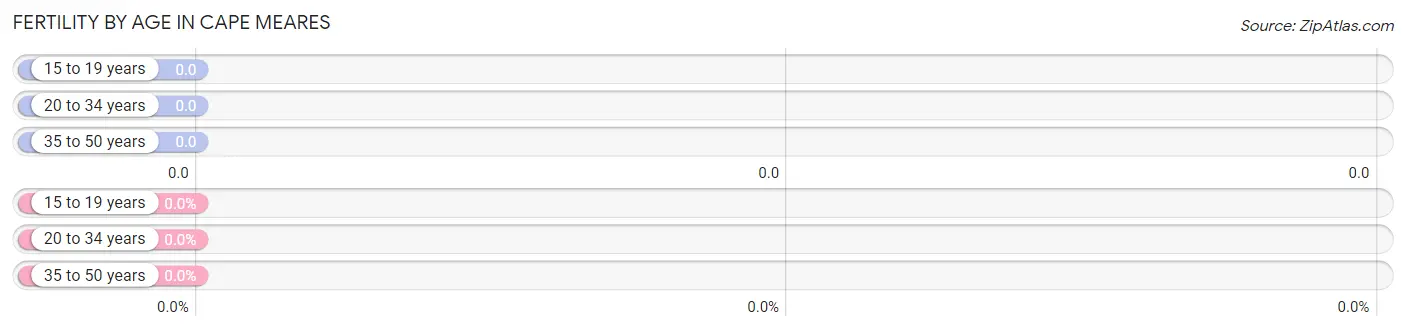
| Age Bracket | Women with Births | Births / 1,000 Women |
| 15 to 19 years | 0 (0.0%) | 0.0 |
| 20 to 34 years | 0 (0.0%) | 0.0 |
| 35 to 50 years | 0 (0.0%) | 0.0 |
| Total | 0 (0.0%) | 0.0 |
Fertility by Age by Marriage Status in Cape Meares
| Age Bracket | Married | Unmarried |
| 15 to 19 years | 0 (0.0%) | 0 (0.0%) |
| 20 to 34 years | 0 (0.0%) | 0 (0.0%) |
| 35 to 50 years | 0 (0.0%) | 0 (0.0%) |
| Total | 0 (0.0%) | 0 (0.0%) |
Fertility by Education in Cape Meares
| Educational Attainment | Women with Births | Births / 1,000 Women |
| Less than High School | 0 (0.0%) | 0.0 |
| High School Diploma | 0 (0.0%) | 0.0 |
| College or Associate's Degree | 0 (0.0%) | 0.0 |
| Bachelor's Degree | 0 (0.0%) | 0.0 |
| Graduate Degree | 0 (0.0%) | 0.0 |
| Total | 0 (0.0%) | 0.0 |
Fertility by Education by Marriage Status in Cape Meares
| Educational Attainment | Married | Unmarried |
| Less than High School | 0 (0.0%) | 0 (0.0%) |
| High School Diploma | 0 (0.0%) | 0 (0.0%) |
| College or Associate's Degree | 0 (0.0%) | 0 (0.0%) |
| Bachelor's Degree | 0 (0.0%) | 0 (0.0%) |
| Graduate Degree | 0 (0.0%) | 0 (0.0%) |
| Total | 0 (0.0%) | 0 (0.0%) |
Employment Characteristics in Cape Meares
Employment by Class of Employer in Cape Meares
Among the 54 employed individuals in Cape Meares, state government employees (30 | 55.6%), private company employees (9 | 16.7%), and self-employed (not incorporated) (9 | 16.7%) make up the most common classes of employment.
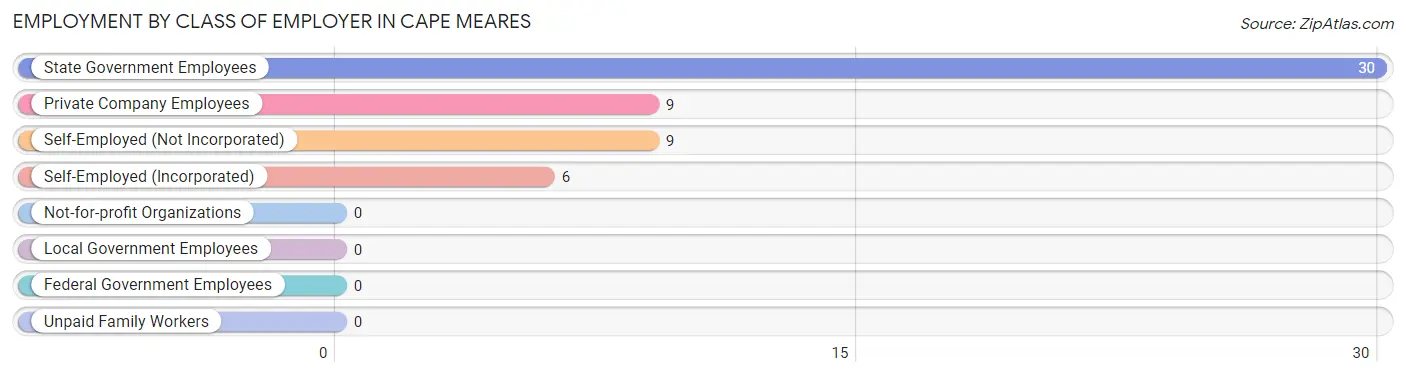
| Employer Class | # Employees | % Employees |
| Private Company Employees | 9 | 16.7% |
| Self-Employed (Incorporated) | 6 | 11.1% |
| Self-Employed (Not Incorporated) | 9 | 16.7% |
| Not-for-profit Organizations | 0 | 0.0% |
| Local Government Employees | 0 | 0.0% |
| State Government Employees | 30 | 55.6% |
| Federal Government Employees | 0 | 0.0% |
| Unpaid Family Workers | 0 | 0.0% |
| Total | 54 | 100.0% |
Employment Status by Age in Cape Meares
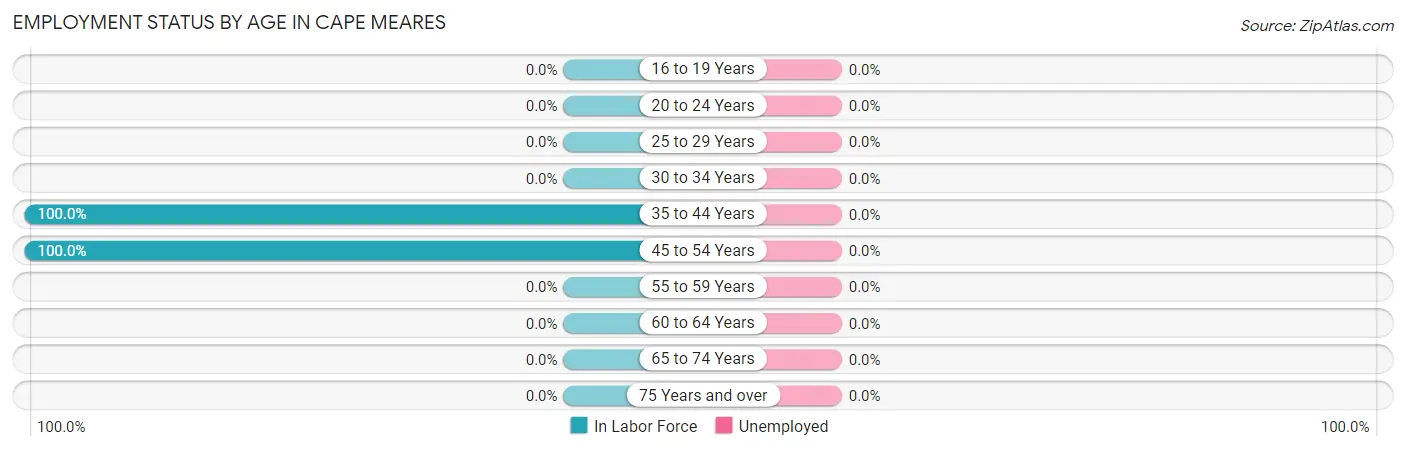
| Age Bracket | In Labor Force | Unemployed |
| 16 to 19 Years | 0 (0.0%) | 0 (0.0%) |
| 20 to 24 Years | 0 (0.0%) | 0 (0.0%) |
| 25 to 29 Years | 0 (0.0%) | 0 (0.0%) |
| 30 to 34 Years | 0 (0.0%) | 0 (0.0%) |
| 35 to 44 Years | 45 (100.0%) | 0 (0.0%) |
| 45 to 54 Years | 9 (100.0%) | 0 (0.0%) |
| 55 to 59 Years | 0 (0.0%) | 0 (0.0%) |
| 60 to 64 Years | 0 (0.0%) | 0 (0.0%) |
| 65 to 74 Years | 0 (0.0%) | 0 (0.0%) |
| 75 Years and over | 0 (0.0%) | 0 (0.0%) |
| Total | 54 (28.7%) | 0 (0.0%) |
Employment Status by Educational Attainment in Cape Meares
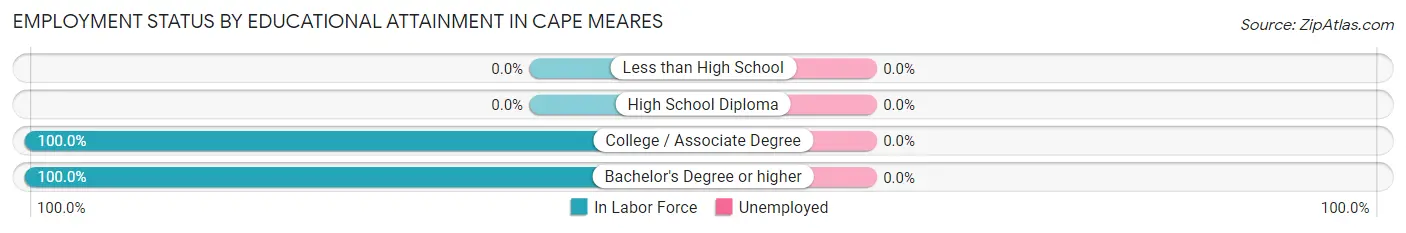
| Educational Attainment | In Labor Force | Unemployed |
| Less than High School | 0 (0.0%) | 0 (0.0%) |
| High School Diploma | 0 (0.0%) | 0 (0.0%) |
| College / Associate Degree | 9 (100.0%) | 0 (0.0%) |
| Bachelor's Degree or higher | 45 (100.0%) | 0 (0.0%) |
| Total | 54 (100.0%) | 0 (0.0%) |
Employment Occupations by Sex in Cape Meares
Management, Business, Science and Arts Occupations
The most common Management, Business, Science and Arts occupations in Cape Meares are Health Diagnosing & Treating (30 | 55.6%), Health Technologists (30 | 55.6%), Community & Social Service (15 | 27.8%), Management (9 | 16.7%), and Legal Services & Support (9 | 16.7%).
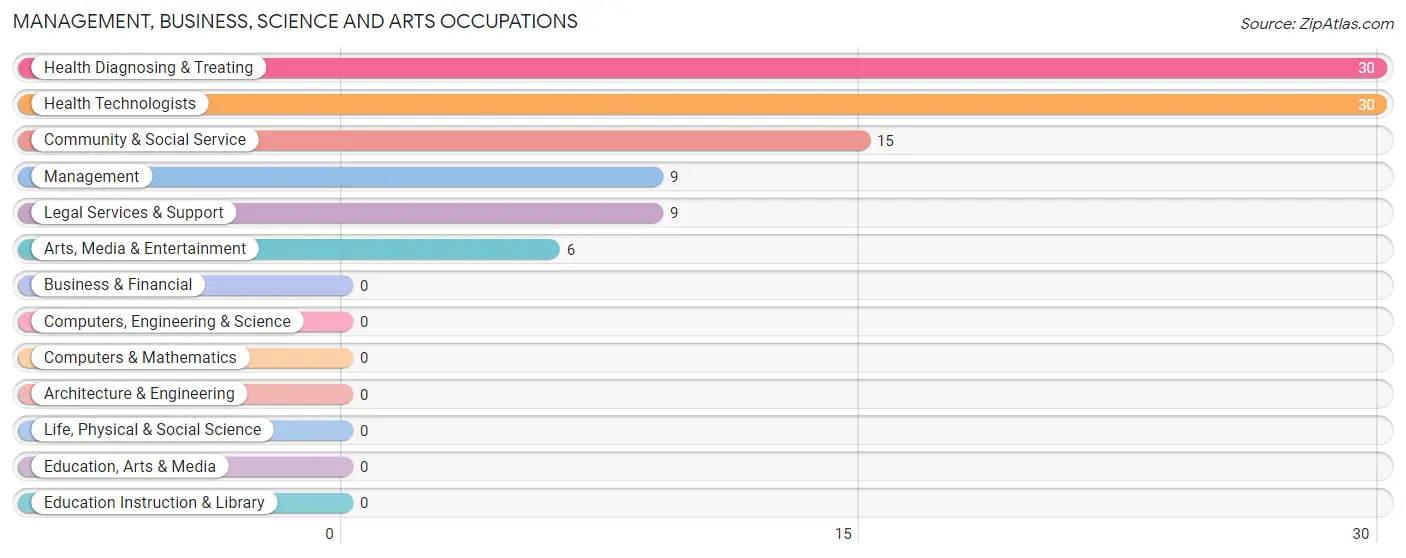
Management, Business, Science and Arts Occupations by Sex
Within the Management, Business, Science and Arts occupations in Cape Meares, the most male-oriented occupations are Legal Services & Support (100.0%), Community & Social Service (60.0%), and Health Diagnosing & Treating (56.7%), while the most female-oriented occupations are Management (100.0%), Arts, Media & Entertainment (100.0%), and Health Diagnosing & Treating (43.3%).
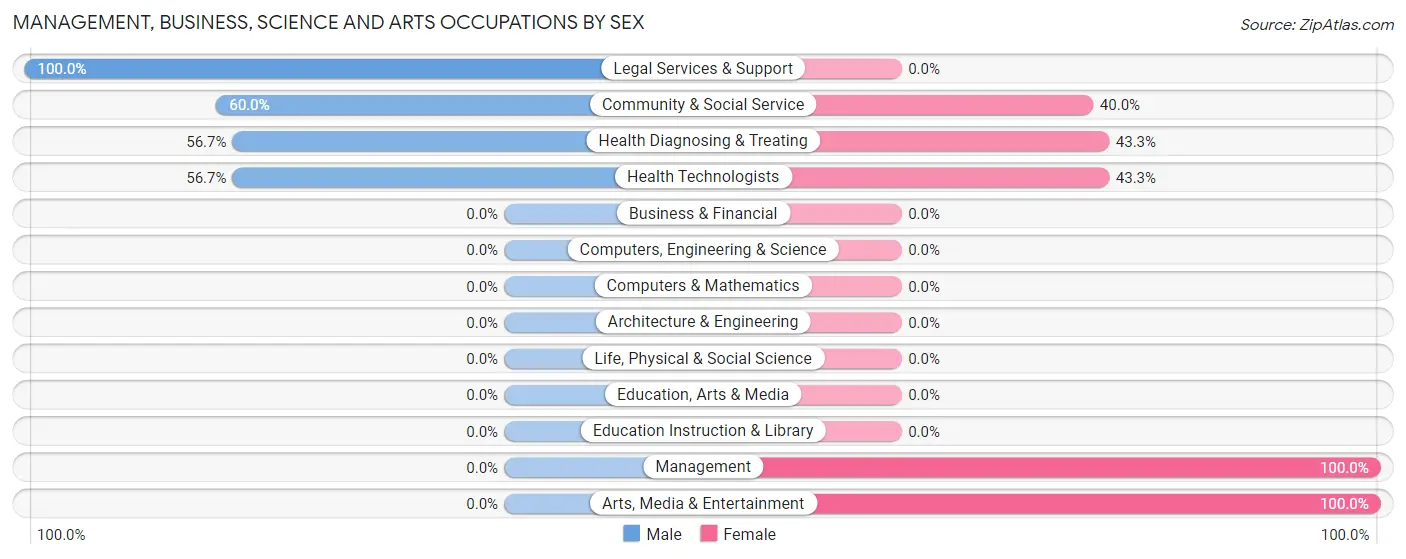
| Occupation | Male | Female |
| Management | 0 (0.0%) | 9 (100.0%) |
| Business & Financial | 0 (0.0%) | 0 (0.0%) |
| Computers, Engineering & Science | 0 (0.0%) | 0 (0.0%) |
| Computers & Mathematics | 0 (0.0%) | 0 (0.0%) |
| Architecture & Engineering | 0 (0.0%) | 0 (0.0%) |
| Life, Physical & Social Science | 0 (0.0%) | 0 (0.0%) |
| Community & Social Service | 9 (60.0%) | 6 (40.0%) |
| Education, Arts & Media | 0 (0.0%) | 0 (0.0%) |
| Legal Services & Support | 9 (100.0%) | 0 (0.0%) |
| Education Instruction & Library | 0 (0.0%) | 0 (0.0%) |
| Arts, Media & Entertainment | 0 (0.0%) | 6 (100.0%) |
| Health Diagnosing & Treating | 17 (56.7%) | 13 (43.3%) |
| Health Technologists | 17 (56.7%) | 13 (43.3%) |
| Total (Category) | 26 (48.1%) | 28 (51.8%) |
| Total (Overall) | 26 (48.1%) | 28 (51.8%) |
Services Occupations
Services Occupations by Sex
| Occupation | Male | Female |
| Healthcare Support | 0 (0.0%) | 0 (0.0%) |
| Security & Protection | 0 (0.0%) | 0 (0.0%) |
| Firefighting & Prevention | 0 (0.0%) | 0 (0.0%) |
| Law Enforcement | 0 (0.0%) | 0 (0.0%) |
| Food Preparation & Serving | 0 (0.0%) | 0 (0.0%) |
| Cleaning & Maintenance | 0 (0.0%) | 0 (0.0%) |
| Personal Care & Service | 0 (0.0%) | 0 (0.0%) |
| Total (Category) | 0 (0.0%) | 0 (0.0%) |
| Total (Overall) | 26 (48.1%) | 28 (51.8%) |
Sales and Office Occupations
Sales and Office Occupations by Sex
| Occupation | Male | Female |
| Sales & Related | 0 (0.0%) | 0 (0.0%) |
| Office & Administration | 0 (0.0%) | 0 (0.0%) |
| Total (Category) | 0 (0.0%) | 0 (0.0%) |
| Total (Overall) | 26 (48.1%) | 28 (51.8%) |
Natural Resources, Construction and Maintenance Occupations
Natural Resources, Construction and Maintenance Occupations by Sex
| Occupation | Male | Female |
| Farming, Fishing & Forestry | 0 (0.0%) | 0 (0.0%) |
| Construction & Extraction | 0 (0.0%) | 0 (0.0%) |
| Installation, Maintenance & Repair | 0 (0.0%) | 0 (0.0%) |
| Total (Category) | 0 (0.0%) | 0 (0.0%) |
| Total (Overall) | 26 (48.1%) | 28 (51.8%) |
Production, Transportation and Moving Occupations
Production, Transportation and Moving Occupations by Sex
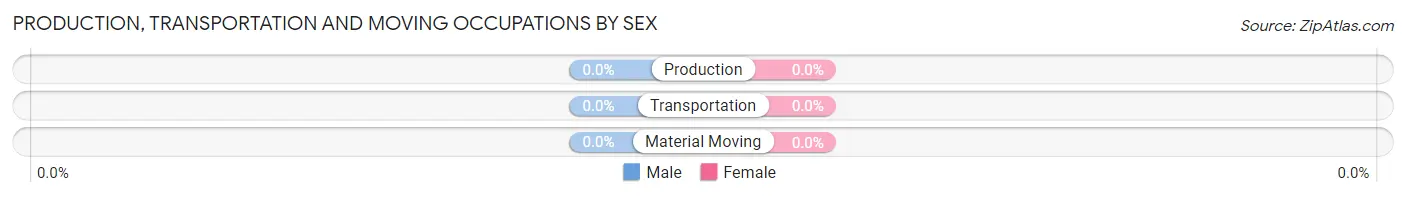
| Occupation | Male | Female |
| Production | 0 (0.0%) | 0 (0.0%) |
| Transportation | 0 (0.0%) | 0 (0.0%) |
| Material Moving | 0 (0.0%) | 0 (0.0%) |
| Total (Category) | 0 (0.0%) | 0 (0.0%) |
| Total (Overall) | 26 (48.1%) | 28 (51.8%) |
Employment Industries by Sex in Cape Meares
Employment Industries in Cape Meares
The major employment industries in Cape Meares include , and Professional & Scientific (54 | 100.0%).
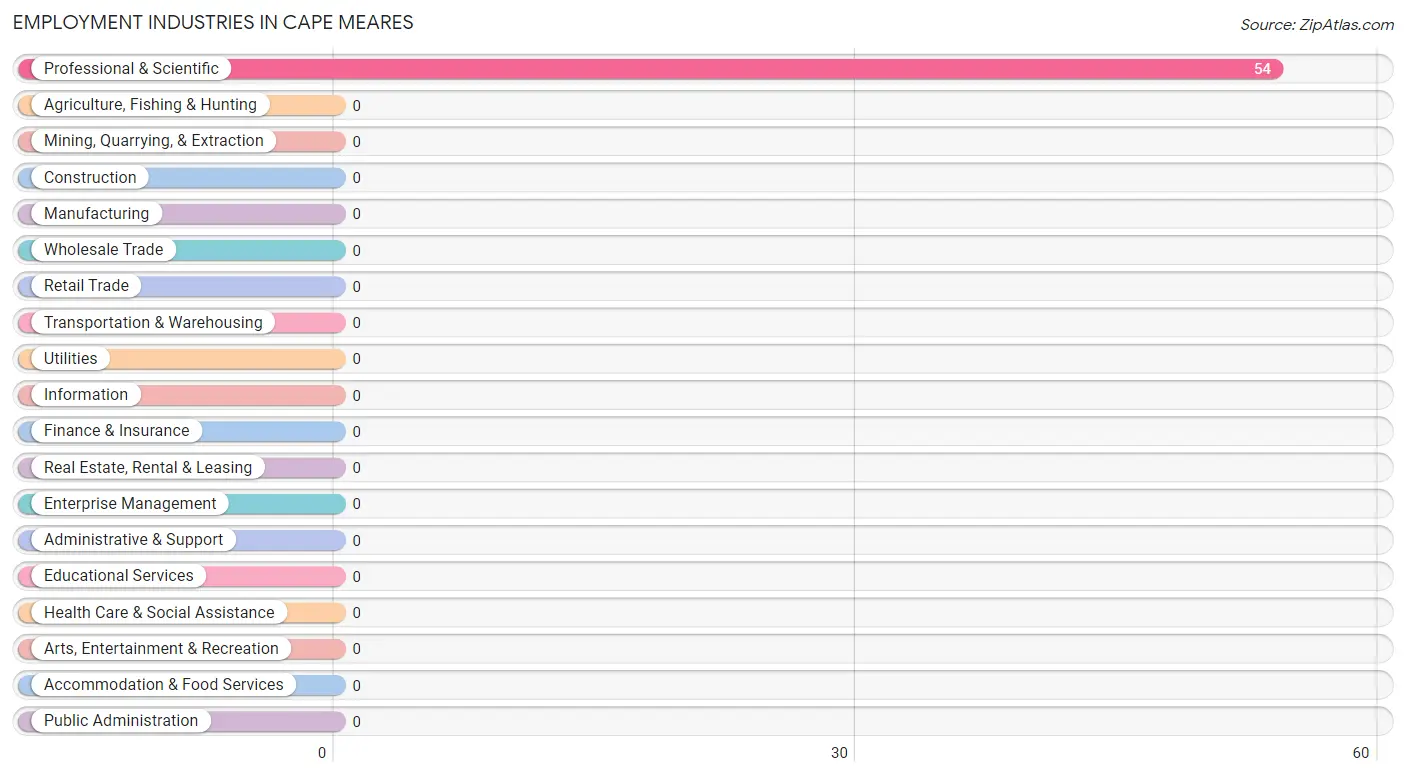
Employment Industries by Sex in Cape Meares
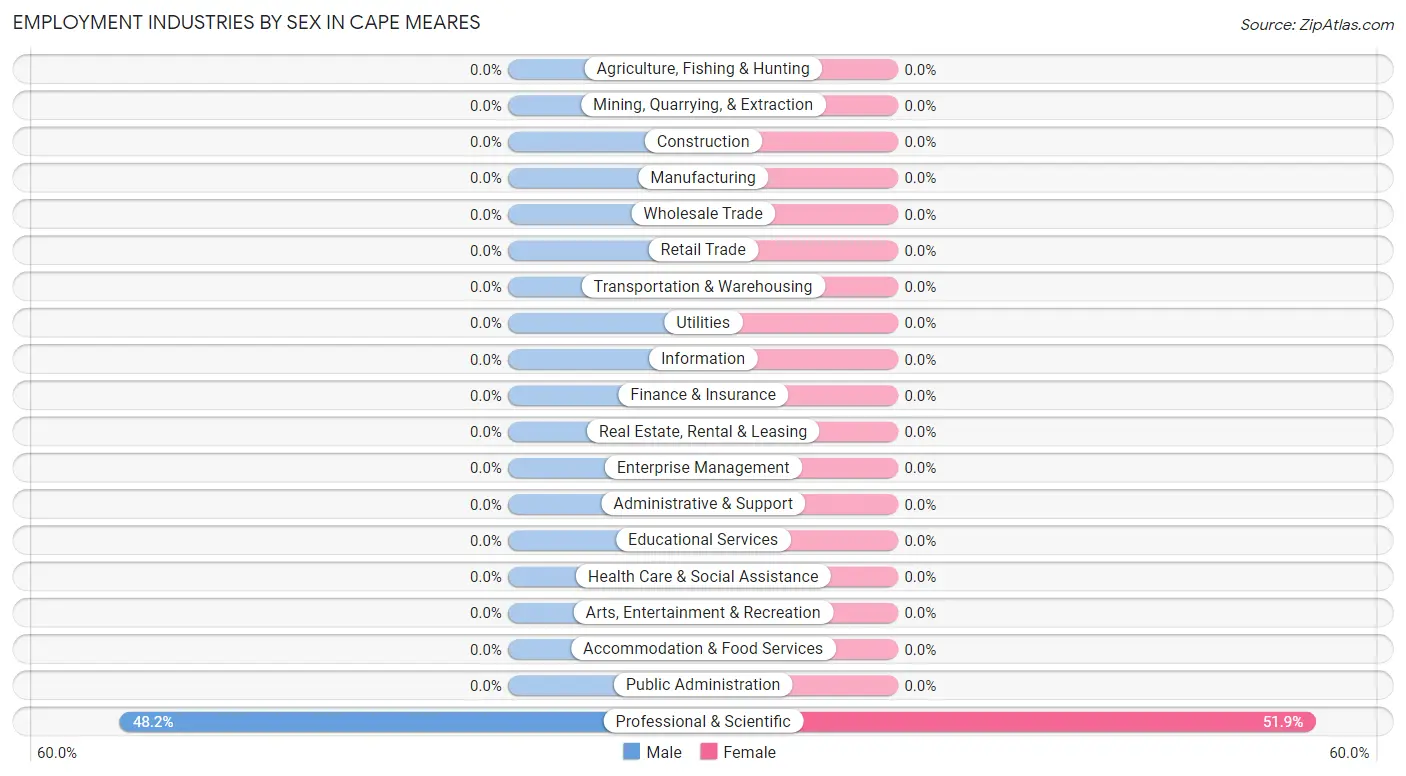
| Industry | Male | Female |
| Agriculture, Fishing & Hunting | 0 (0.0%) | 0 (0.0%) |
| Mining, Quarrying, & Extraction | 0 (0.0%) | 0 (0.0%) |
| Construction | 0 (0.0%) | 0 (0.0%) |
| Manufacturing | 0 (0.0%) | 0 (0.0%) |
| Wholesale Trade | 0 (0.0%) | 0 (0.0%) |
| Retail Trade | 0 (0.0%) | 0 (0.0%) |
| Transportation & Warehousing | 0 (0.0%) | 0 (0.0%) |
| Utilities | 0 (0.0%) | 0 (0.0%) |
| Information | 0 (0.0%) | 0 (0.0%) |
| Finance & Insurance | 0 (0.0%) | 0 (0.0%) |
| Real Estate, Rental & Leasing | 0 (0.0%) | 0 (0.0%) |
| Professional & Scientific | 26 (48.1%) | 28 (51.8%) |
| Enterprise Management | 0 (0.0%) | 0 (0.0%) |
| Administrative & Support | 0 (0.0%) | 0 (0.0%) |
| Educational Services | 0 (0.0%) | 0 (0.0%) |
| Health Care & Social Assistance | 0 (0.0%) | 0 (0.0%) |
| Arts, Entertainment & Recreation | 0 (0.0%) | 0 (0.0%) |
| Accommodation & Food Services | 0 (0.0%) | 0 (0.0%) |
| Public Administration | 0 (0.0%) | 0 (0.0%) |
| Total | 26 (48.1%) | 28 (51.8%) |
Education in Cape Meares
School Enrollment in Cape Meares
The most common levels of schooling among the 11 students in Cape Meares are elementary school (6 | 54.5%), and high school (5 | 45.5%).
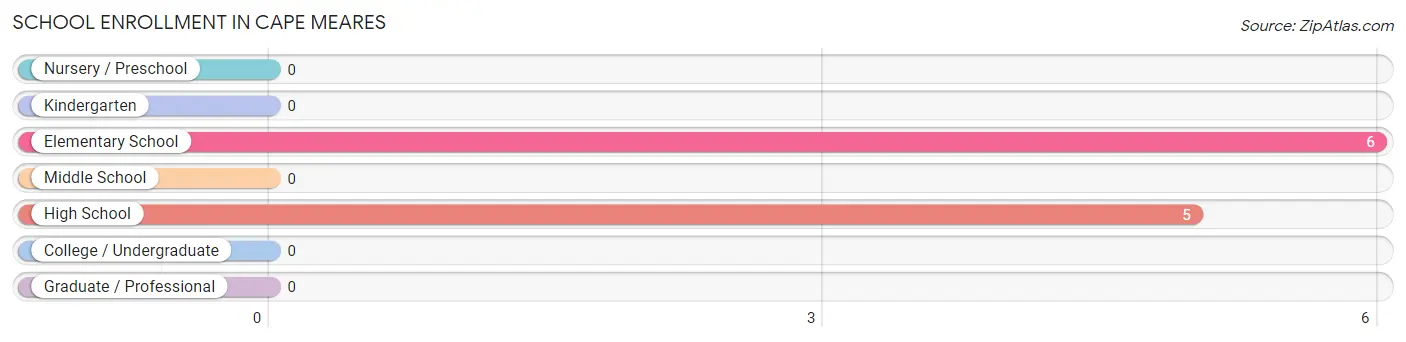
| School Level | # Students | % Students |
| Nursery / Preschool | 0 | 0.0% |
| Kindergarten | 0 | 0.0% |
| Elementary School | 6 | 54.5% |
| Middle School | 0 | 0.0% |
| High School | 5 | 45.5% |
| College / Undergraduate | 0 | 0.0% |
| Graduate / Professional | 0 | 0.0% |
| Total | 11 | 100.0% |
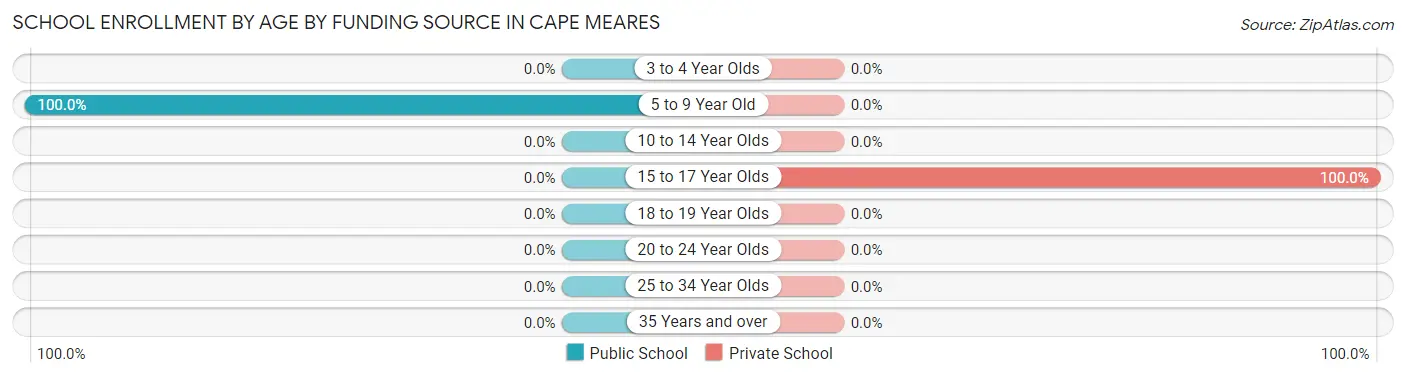
School Enrollment by Age by Funding Source in Cape Meares
Out of a total of 11 students who are enrolled in schools in Cape Meares, 5 (45.5%) attend a private institution, while the remaining 6 (54.5%) are enrolled in public schools. The age group of 15 to 17 year olds has the highest likelihood of being enrolled in private schools, with 5 (100.0% in the age bracket) enrolled. Conversely, the age group of 5 to 9 year old has the lowest likelihood of being enrolled in a private school, with 6 (100.0% in the age bracket) attending a public institution.
| Age Bracket | Public School | Private School |
| 3 to 4 Year Olds | 0 (0.0%) | 0 (0.0%) |
| 5 to 9 Year Old | 6 (100.0%) | 0 (0.0%) |
| 10 to 14 Year Olds | 0 (0.0%) | 0 (0.0%) |
| 15 to 17 Year Olds | 0 (0.0%) | 5 (100.0%) |
| 18 to 19 Year Olds | 0 (0.0%) | 0 (0.0%) |
| 20 to 24 Year Olds | 0 (0.0%) | 0 (0.0%) |
| 25 to 34 Year Olds | 0 (0.0%) | 0 (0.0%) |
| 35 Years and over | 0 (0.0%) | 0 (0.0%) |
| Total | 6 (54.5%) | 5 (45.5%) |
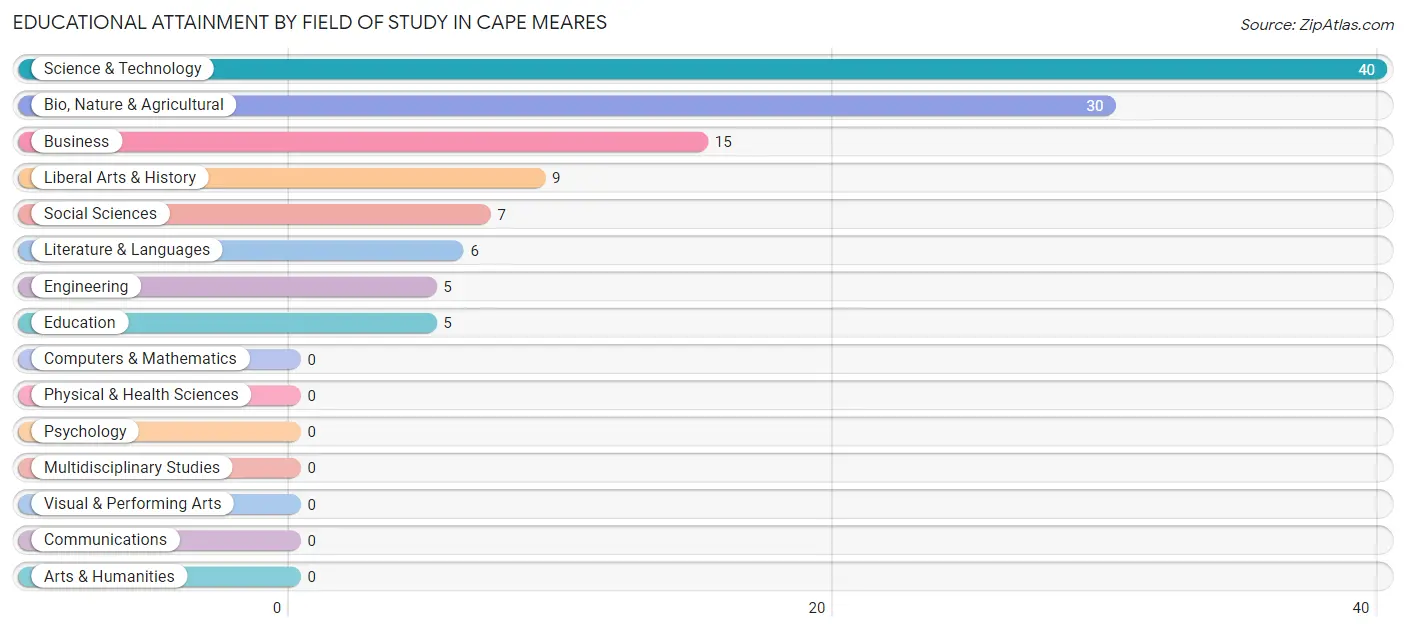
Educational Attainment by Field of Study in Cape Meares
Science & technology (40 | 34.2%), bio, nature & agricultural (30 | 25.6%), business (15 | 12.8%), liberal arts & history (9 | 7.7%), and social sciences (7 | 6.0%) are the most common fields of study among 117 individuals in Cape Meares who have obtained a bachelor's degree or higher.
| Field of Study | # Graduates | % Graduates |
| Computers & Mathematics | 0 | 0.0% |
| Bio, Nature & Agricultural | 30 | 25.6% |
| Physical & Health Sciences | 0 | 0.0% |
| Psychology | 0 | 0.0% |
| Social Sciences | 7 | 6.0% |
| Engineering | 5 | 4.3% |
| Multidisciplinary Studies | 0 | 0.0% |
| Science & Technology | 40 | 34.2% |
| Business | 15 | 12.8% |
| Education | 5 | 4.3% |
| Literature & Languages | 6 | 5.1% |
| Liberal Arts & History | 9 | 7.7% |
| Visual & Performing Arts | 0 | 0.0% |
| Communications | 0 | 0.0% |
| Arts & Humanities | 0 | 0.0% |
| Total | 117 | 100.0% |
Transportation & Commute in Cape Meares
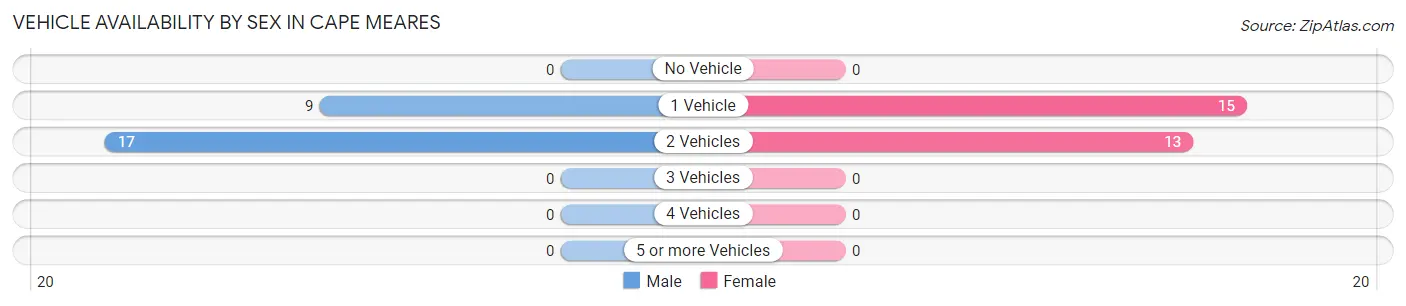
Vehicle Availability by Sex in Cape Meares
The most prevalent vehicle ownership categories in Cape Meares are males with 2 vehicles (17, accounting for 65.4%) and females with 2 vehicles (13, making up 60.7%).
| Vehicles Available | Male | Female |
| No Vehicle | 0 (0.0%) | 0 (0.0%) |
| 1 Vehicle | 9 (34.6%) | 15 (53.6%) |
| 2 Vehicles | 17 (65.4%) | 13 (46.4%) |
| 3 Vehicles | 0 (0.0%) | 0 (0.0%) |
| 4 Vehicles | 0 (0.0%) | 0 (0.0%) |
| 5 or more Vehicles | 0 (0.0%) | 0 (0.0%) |
| Total | 26 (100.0%) | 28 (100.0%) |
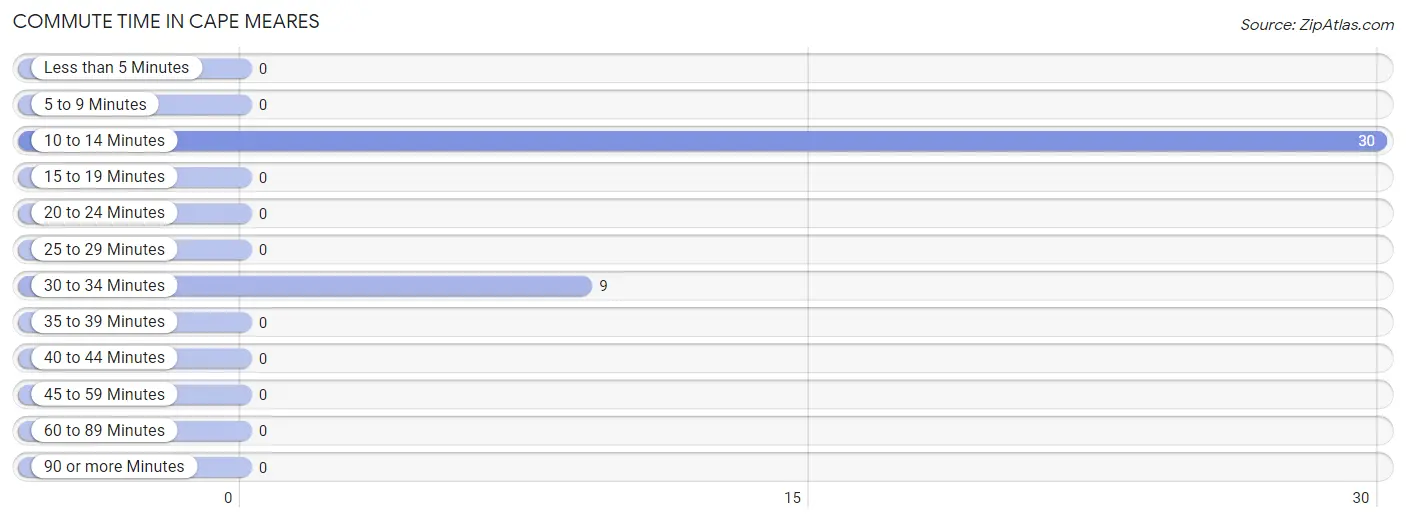
Commute Time in Cape Meares
The most frequently occuring commute durations in Cape Meares are 10 to 14 minutes (30 commuters, 76.9%), 30 to 34 minutes (9 commuters, 23.1%), and less than 5 minutes (0 commuters, 0.0%).
| Commute Time | # Commuters | % Commuters |
| Less than 5 Minutes | 0 | 0.0% |
| 5 to 9 Minutes | 0 | 0.0% |
| 10 to 14 Minutes | 30 | 76.9% |
| 15 to 19 Minutes | 0 | 0.0% |
| 20 to 24 Minutes | 0 | 0.0% |
| 25 to 29 Minutes | 0 | 0.0% |
| 30 to 34 Minutes | 9 | 23.1% |
| 35 to 39 Minutes | 0 | 0.0% |
| 40 to 44 Minutes | 0 | 0.0% |
| 45 to 59 Minutes | 0 | 0.0% |
| 60 to 89 Minutes | 0 | 0.0% |
| 90 or more Minutes | 0 | 0.0% |
Commute Time by Sex in Cape Meares
The most common commute times in Cape Meares are 10 to 14 minutes (17 commuters, 65.4%) for males and 10 to 14 minutes (13 commuters, 100.0%) for females.
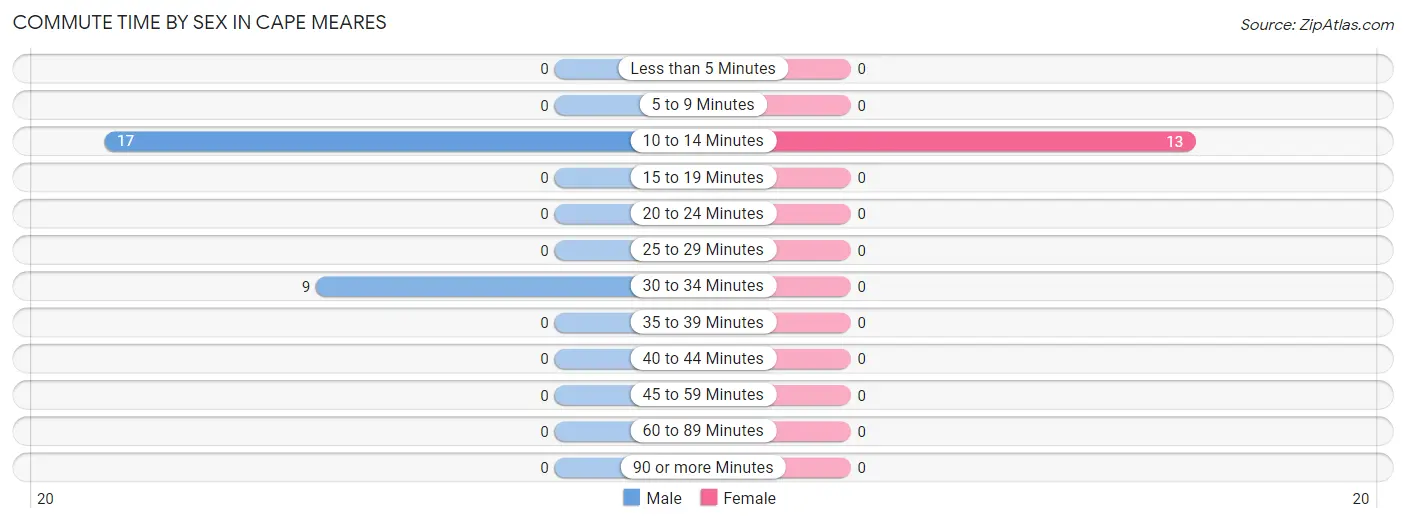
| Commute Time | Male | Female |
| Less than 5 Minutes | 0 (0.0%) | 0 (0.0%) |
| 5 to 9 Minutes | 0 (0.0%) | 0 (0.0%) |
| 10 to 14 Minutes | 17 (65.4%) | 13 (100.0%) |
| 15 to 19 Minutes | 0 (0.0%) | 0 (0.0%) |
| 20 to 24 Minutes | 0 (0.0%) | 0 (0.0%) |
| 25 to 29 Minutes | 0 (0.0%) | 0 (0.0%) |
| 30 to 34 Minutes | 9 (34.6%) | 0 (0.0%) |
| 35 to 39 Minutes | 0 (0.0%) | 0 (0.0%) |
| 40 to 44 Minutes | 0 (0.0%) | 0 (0.0%) |
| 45 to 59 Minutes | 0 (0.0%) | 0 (0.0%) |
| 60 to 89 Minutes | 0 (0.0%) | 0 (0.0%) |
| 90 or more Minutes | 0 (0.0%) | 0 (0.0%) |
Time of Departure to Work by Sex in Cape Meares
The most frequent times of departure to work in Cape Meares are 8:30 AM to 8:59 AM (17, 65.4%) for males and 7:00 AM to 7:29 AM (13, 100.0%) for females.
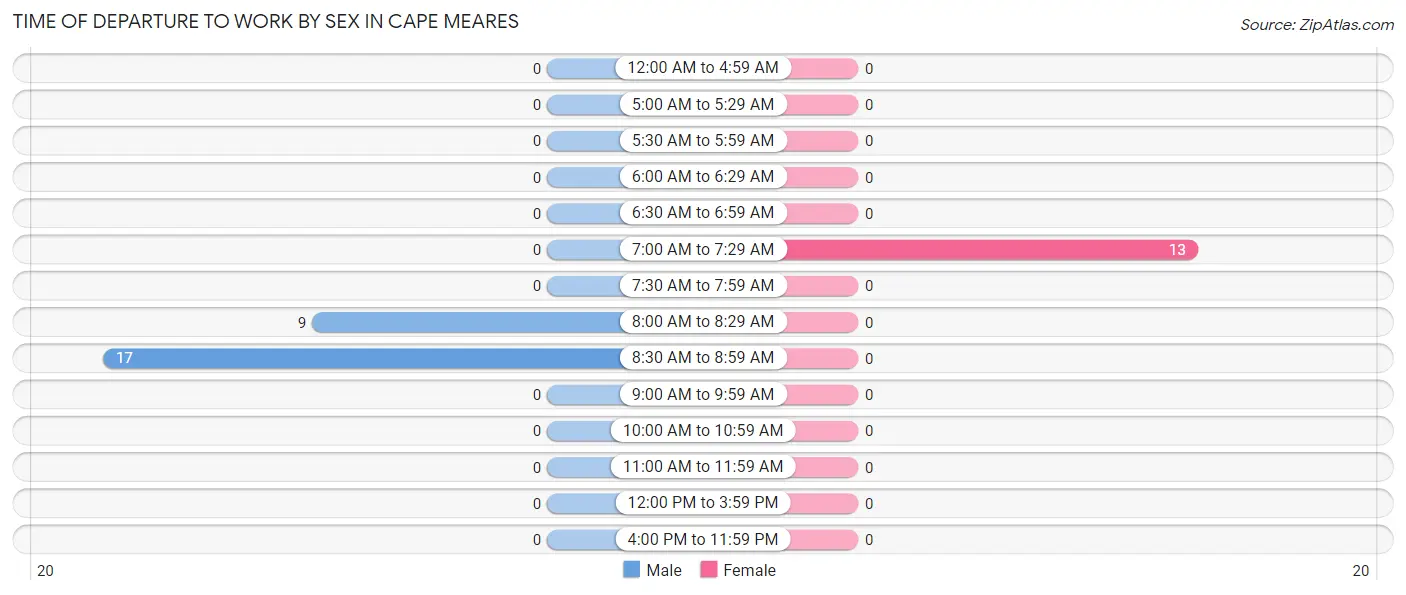
| Time of Departure | Male | Female |
| 12:00 AM to 4:59 AM | 0 (0.0%) | 0 (0.0%) |
| 5:00 AM to 5:29 AM | 0 (0.0%) | 0 (0.0%) |
| 5:30 AM to 5:59 AM | 0 (0.0%) | 0 (0.0%) |
| 6:00 AM to 6:29 AM | 0 (0.0%) | 0 (0.0%) |
| 6:30 AM to 6:59 AM | 0 (0.0%) | 0 (0.0%) |
| 7:00 AM to 7:29 AM | 0 (0.0%) | 13 (100.0%) |
| 7:30 AM to 7:59 AM | 0 (0.0%) | 0 (0.0%) |
| 8:00 AM to 8:29 AM | 9 (34.6%) | 0 (0.0%) |
| 8:30 AM to 8:59 AM | 17 (65.4%) | 0 (0.0%) |
| 9:00 AM to 9:59 AM | 0 (0.0%) | 0 (0.0%) |
| 10:00 AM to 10:59 AM | 0 (0.0%) | 0 (0.0%) |
| 11:00 AM to 11:59 AM | 0 (0.0%) | 0 (0.0%) |
| 12:00 PM to 3:59 PM | 0 (0.0%) | 0 (0.0%) |
| 4:00 PM to 11:59 PM | 0 (0.0%) | 0 (0.0%) |
| Total | 26 (100.0%) | 13 (100.0%) |
Housing Occupancy in Cape Meares
Occupancy by Ownership in Cape Meares
Of the total 110 dwellings in Cape Meares, owner-occupied units account for 97 (88.2%), while renter-occupied units make up 13 (11.8%).
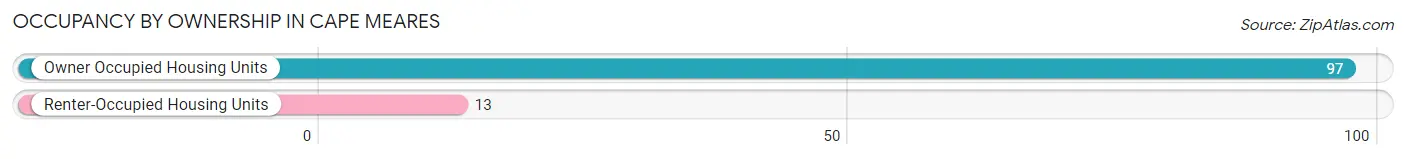
| Occupancy | # Housing Units | % Housing Units |
| Owner Occupied Housing Units | 97 | 88.2% |
| Renter-Occupied Housing Units | 13 | 11.8% |
| Total Occupied Housing Units | 110 | 100.0% |
Occupancy by Household Size in Cape Meares
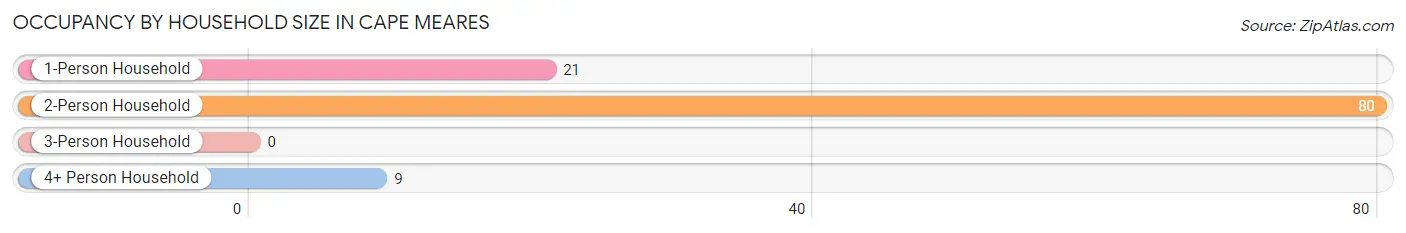
| Household Size | # Housing Units | % Housing Units |
| 1-Person Household | 21 | 19.1% |
| 2-Person Household | 80 | 72.7% |
| 3-Person Household | 0 | 0.0% |
| 4+ Person Household | 9 | 8.2% |
| Total Housing Units | 110 | 100.0% |
Occupancy by Ownership by Household Size in Cape Meares
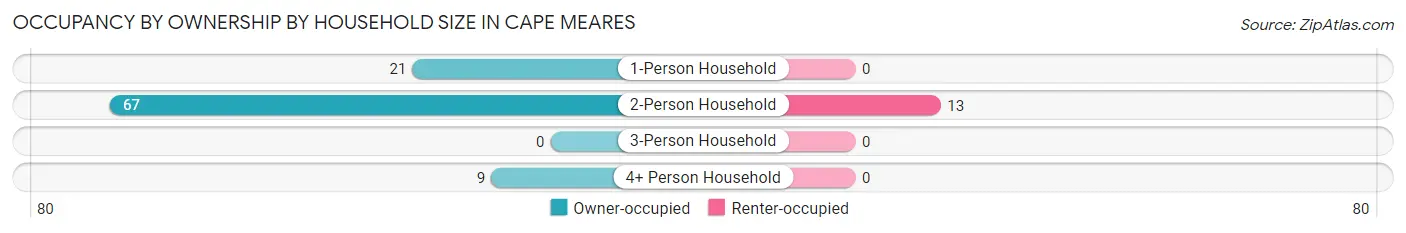
| Household Size | Owner-occupied | Renter-occupied |
| 1-Person Household | 21 (100.0%) | 0 (0.0%) |
| 2-Person Household | 67 (83.8%) | 13 (16.3%) |
| 3-Person Household | 0 (0.0%) | 0 (0.0%) |
| 4+ Person Household | 9 (100.0%) | 0 (0.0%) |
| Total Housing Units | 97 (88.2%) | 13 (11.8%) |
Occupancy by Educational Attainment in Cape Meares
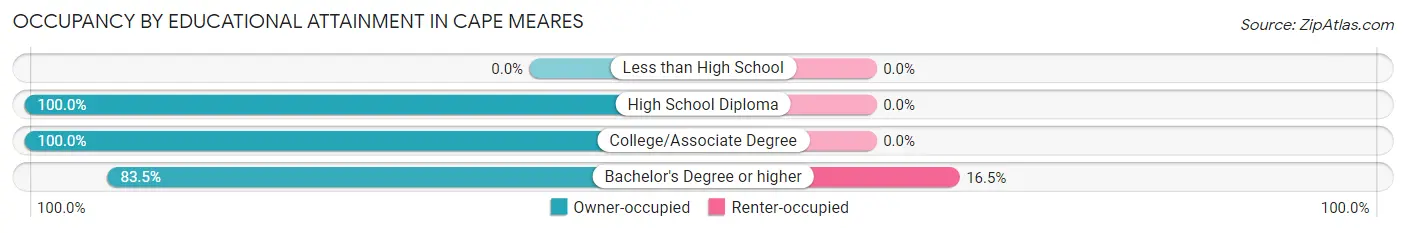
| Household Size | Owner-occupied | Renter-occupied |
| Less than High School | 0 (0.0%) | 0 (0.0%) |
| High School Diploma | 7 (100.0%) | 0 (0.0%) |
| College/Associate Degree | 24 (100.0%) | 0 (0.0%) |
| Bachelor's Degree or higher | 66 (83.5%) | 13 (16.5%) |
Occupancy by Age of Householder in Cape Meares
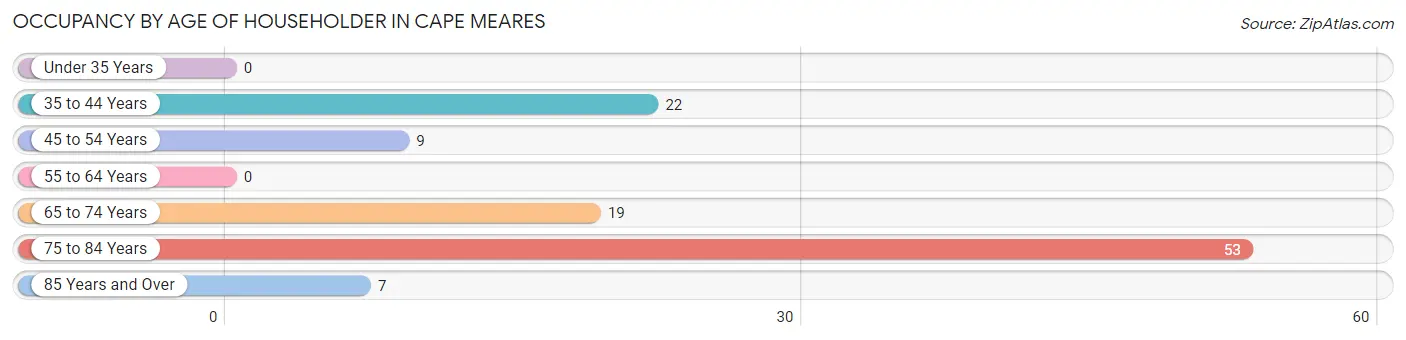
| Age Bracket | # Households | % Households |
| Under 35 Years | 0 | 0.0% |
| 35 to 44 Years | 22 | 20.0% |
| 45 to 54 Years | 9 | 8.2% |
| 55 to 64 Years | 0 | 0.0% |
| 65 to 74 Years | 19 | 17.3% |
| 75 to 84 Years | 53 | 48.2% |
| 85 Years and Over | 7 | 6.4% |
| Total | 110 | 100.0% |
Housing Finances in Cape Meares
Median Income by Occupancy in Cape Meares
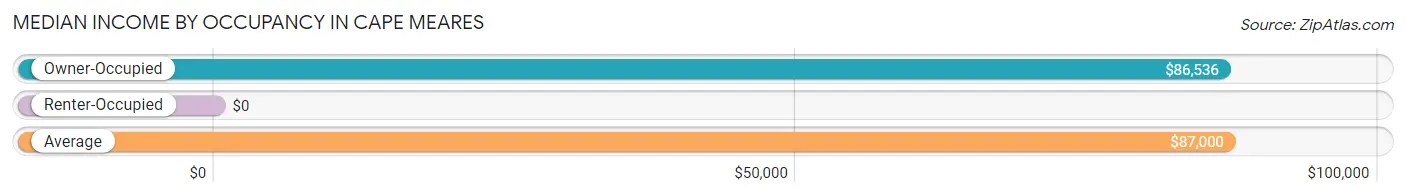
| Occupancy Type | # Households | Median Income |
| Owner-Occupied | 97 (88.2%) | $86,536 |
| Renter-Occupied | 13 (11.8%) | $0 |
| Average | 110 (100.0%) | $87,000 |
Occupancy by Householder Income Bracket in Cape Meares
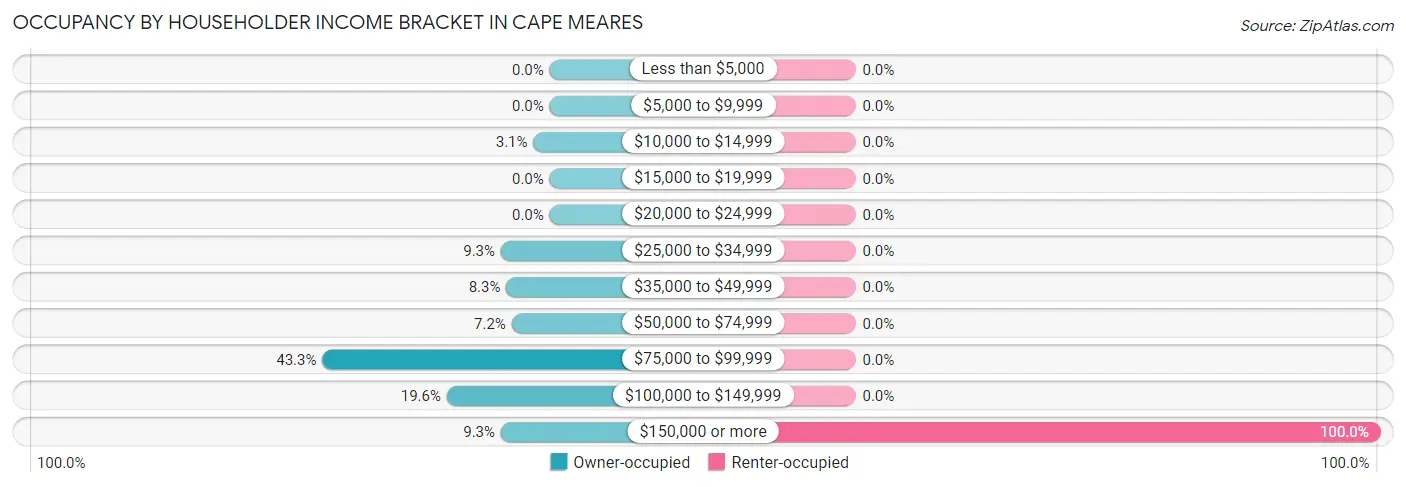
| Income Bracket | Owner-occupied | Renter-occupied |
| Less than $5,000 | 0 (0.0%) | 0 (0.0%) |
| $5,000 to $9,999 | 0 (0.0%) | 0 (0.0%) |
| $10,000 to $14,999 | 3 (3.1%) | 0 (0.0%) |
| $15,000 to $19,999 | 0 (0.0%) | 0 (0.0%) |
| $20,000 to $24,999 | 0 (0.0%) | 0 (0.0%) |
| $25,000 to $34,999 | 9 (9.3%) | 0 (0.0%) |
| $35,000 to $49,999 | 8 (8.3%) | 0 (0.0%) |
| $50,000 to $74,999 | 7 (7.2%) | 0 (0.0%) |
| $75,000 to $99,999 | 42 (43.3%) | 0 (0.0%) |
| $100,000 to $149,999 | 19 (19.6%) | 0 (0.0%) |
| $150,000 or more | 9 (9.3%) | 13 (100.0%) |
| Total | 97 (100.0%) | 13 (100.0%) |
Monthly Housing Cost Tiers in Cape Meares
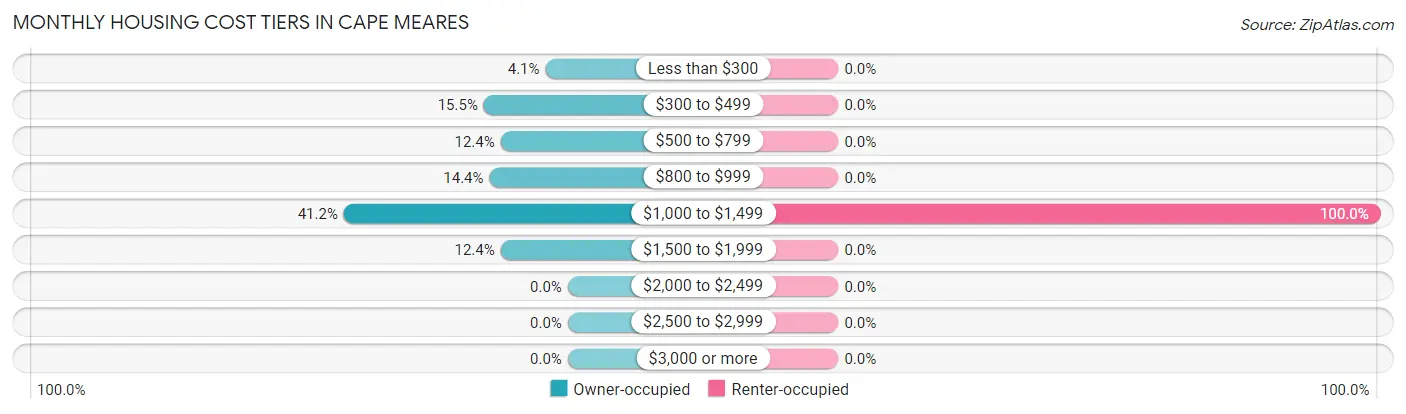
| Monthly Cost | Owner-occupied | Renter-occupied |
| Less than $300 | 4 (4.1%) | 0 (0.0%) |
| $300 to $499 | 15 (15.5%) | 0 (0.0%) |
| $500 to $799 | 12 (12.4%) | 0 (0.0%) |
| $800 to $999 | 14 (14.4%) | 0 (0.0%) |
| $1,000 to $1,499 | 40 (41.2%) | 13 (100.0%) |
| $1,500 to $1,999 | 12 (12.4%) | 0 (0.0%) |
| $2,000 to $2,499 | 0 (0.0%) | 0 (0.0%) |
| $2,500 to $2,999 | 0 (0.0%) | 0 (0.0%) |
| $3,000 or more | 0 (0.0%) | 0 (0.0%) |
| Total | 97 (100.0%) | 13 (100.0%) |
Physical Housing Characteristics in Cape Meares
Housing Structures in Cape Meares
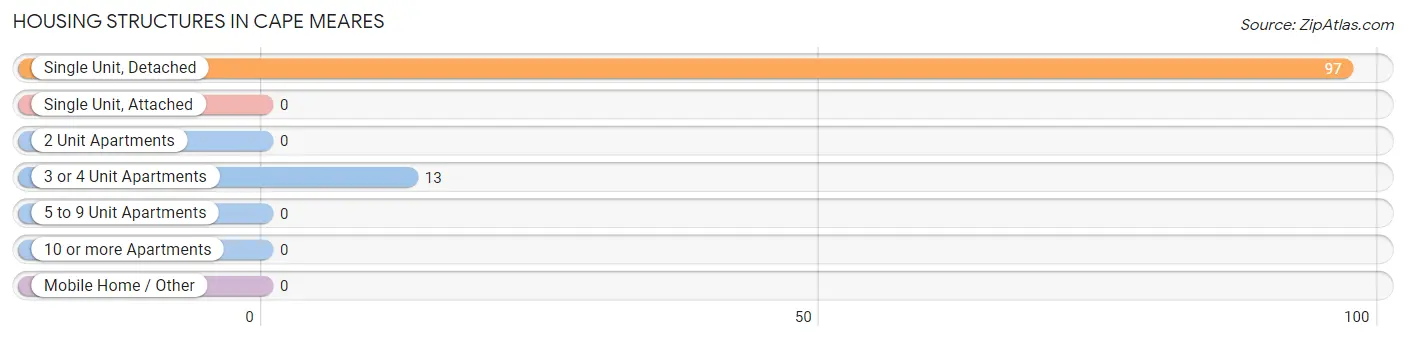
| Structure Type | # Housing Units | % Housing Units |
| Single Unit, Detached | 97 | 88.2% |
| Single Unit, Attached | 0 | 0.0% |
| 2 Unit Apartments | 0 | 0.0% |
| 3 or 4 Unit Apartments | 13 | 11.8% |
| 5 to 9 Unit Apartments | 0 | 0.0% |
| 10 or more Apartments | 0 | 0.0% |
| Mobile Home / Other | 0 | 0.0% |
| Total | 110 | 100.0% |
Housing Structures by Occupancy in Cape Meares
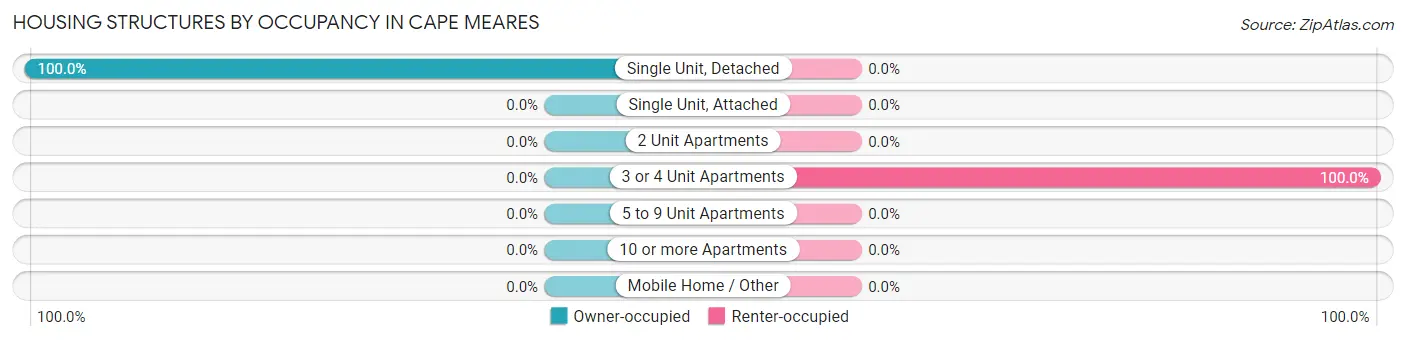
| Structure Type | Owner-occupied | Renter-occupied |
| Single Unit, Detached | 97 (100.0%) | 0 (0.0%) |
| Single Unit, Attached | 0 (0.0%) | 0 (0.0%) |
| 2 Unit Apartments | 0 (0.0%) | 0 (0.0%) |
| 3 or 4 Unit Apartments | 0 (0.0%) | 13 (100.0%) |
| 5 to 9 Unit Apartments | 0 (0.0%) | 0 (0.0%) |
| 10 or more Apartments | 0 (0.0%) | 0 (0.0%) |
| Mobile Home / Other | 0 (0.0%) | 0 (0.0%) |
| Total | 97 (88.2%) | 13 (11.8%) |
Housing Structures by Number of Rooms in Cape Meares
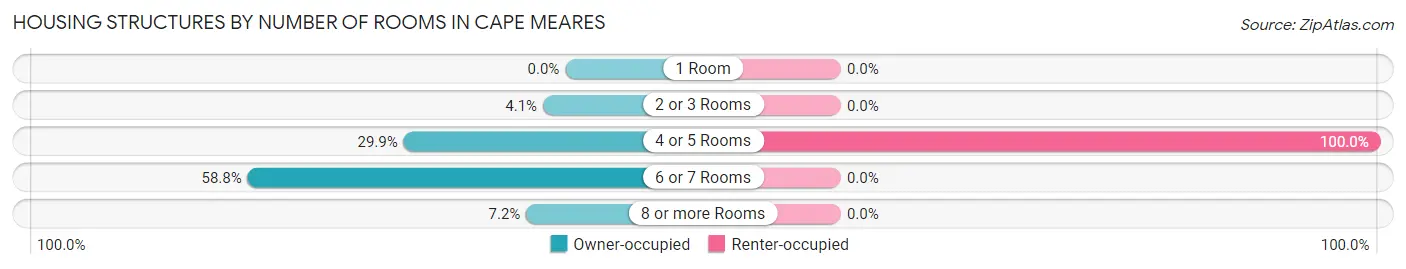
| Number of Rooms | Owner-occupied | Renter-occupied |
| 1 Room | 0 (0.0%) | 0 (0.0%) |
| 2 or 3 Rooms | 4 (4.1%) | 0 (0.0%) |
| 4 or 5 Rooms | 29 (29.9%) | 13 (100.0%) |
| 6 or 7 Rooms | 57 (58.8%) | 0 (0.0%) |
| 8 or more Rooms | 7 (7.2%) | 0 (0.0%) |
| Total | 97 (100.0%) | 13 (100.0%) |
Housing Structure by Heating Type in Cape Meares
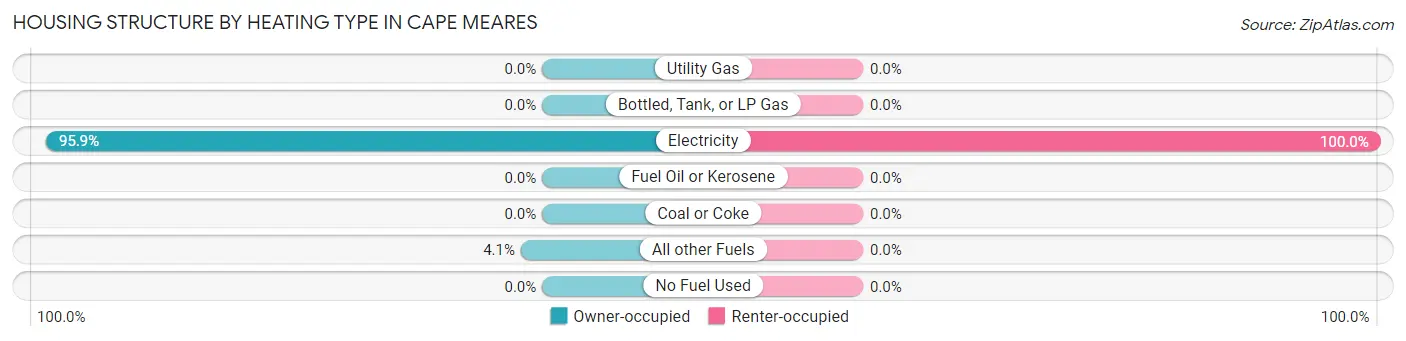
| Heating Type | Owner-occupied | Renter-occupied |
| Utility Gas | 0 (0.0%) | 0 (0.0%) |
| Bottled, Tank, or LP Gas | 0 (0.0%) | 0 (0.0%) |
| Electricity | 93 (95.9%) | 13 (100.0%) |
| Fuel Oil or Kerosene | 0 (0.0%) | 0 (0.0%) |
| Coal or Coke | 0 (0.0%) | 0 (0.0%) |
| All other Fuels | 4 (4.1%) | 0 (0.0%) |
| No Fuel Used | 0 (0.0%) | 0 (0.0%) |
| Total | 97 (100.0%) | 13 (100.0%) |
Household Vehicle Usage in Cape Meares
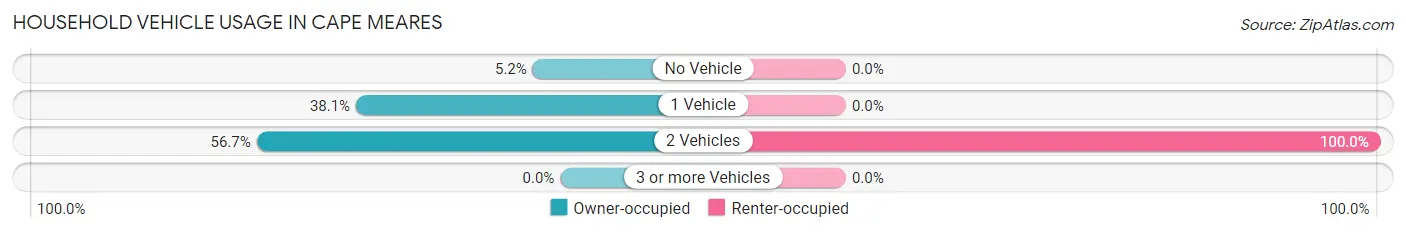
| Vehicles per Household | Owner-occupied | Renter-occupied |
| No Vehicle | 5 (5.1%) | 0 (0.0%) |
| 1 Vehicle | 37 (38.1%) | 0 (0.0%) |
| 2 Vehicles | 55 (56.7%) | 13 (100.0%) |
| 3 or more Vehicles | 0 (0.0%) | 0 (0.0%) |
| Total | 97 (100.0%) | 13 (100.0%) |
Real Estate & Mortgages in Cape Meares
Real Estate and Mortgage Overview in Cape Meares
| Characteristic | Without Mortgage | With Mortgage |
| Housing Units | 80 | 17 |
| Median Property Value | $856,500 | $470,800 |
| Median Household Income | $86,500 | $9 |
| Monthly Housing Costs | - | - |
| Real Estate Taxes | $4,400 | $0 |
Property Value by Mortgage Status in Cape Meares
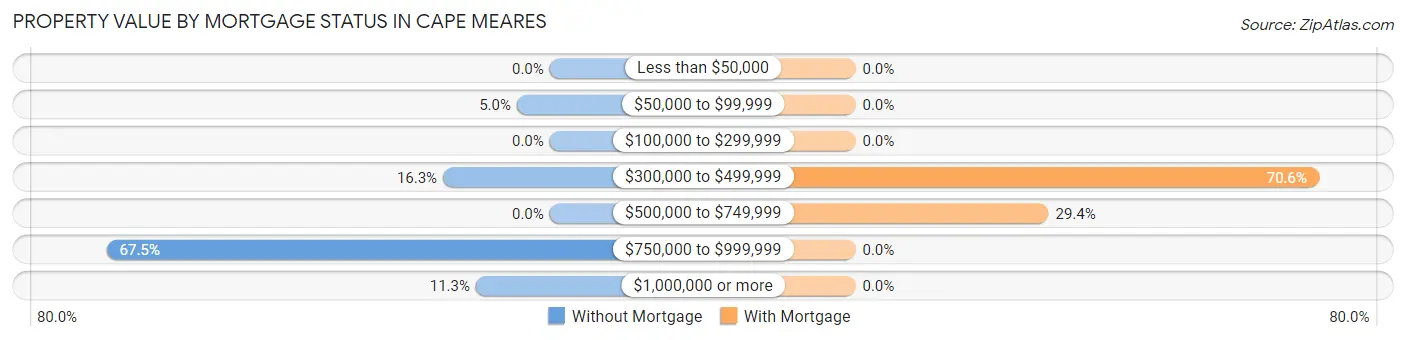
| Property Value | Without Mortgage | With Mortgage |
| Less than $50,000 | 0 (0.0%) | 0 (0.0%) |
| $50,000 to $99,999 | 4 (5.0%) | 0 (0.0%) |
| $100,000 to $299,999 | 0 (0.0%) | 0 (0.0%) |
| $300,000 to $499,999 | 13 (16.3%) | 12 (70.6%) |
| $500,000 to $749,999 | 0 (0.0%) | 5 (29.4%) |
| $750,000 to $999,999 | 54 (67.5%) | 0 (0.0%) |
| $1,000,000 or more | 9 (11.3%) | 0 (0.0%) |
| Total | 80 (100.0%) | 17 (100.0%) |
Household Income by Mortgage Status in Cape Meares
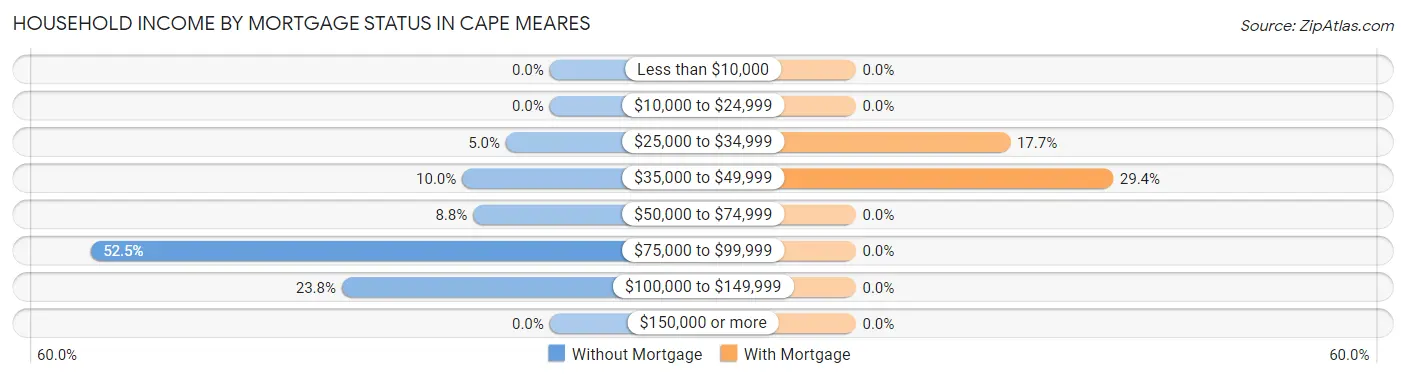
| Household Income | Without Mortgage | With Mortgage |
| Less than $10,000 | 0 (0.0%) | 0 (0.0%) |
| $10,000 to $24,999 | 0 (0.0%) | 0 (0.0%) |
| $25,000 to $34,999 | 4 (5.0%) | 3 (17.6%) |
| $35,000 to $49,999 | 8 (10.0%) | 5 (29.4%) |
| $50,000 to $74,999 | 7 (8.7%) | 0 (0.0%) |
| $75,000 to $99,999 | 42 (52.5%) | 0 (0.0%) |
| $100,000 to $149,999 | 19 (23.7%) | 0 (0.0%) |
| $150,000 or more | 0 (0.0%) | 0 (0.0%) |
| Total | 80 (100.0%) | 17 (100.0%) |
Property Value to Household Income Ratio in Cape Meares
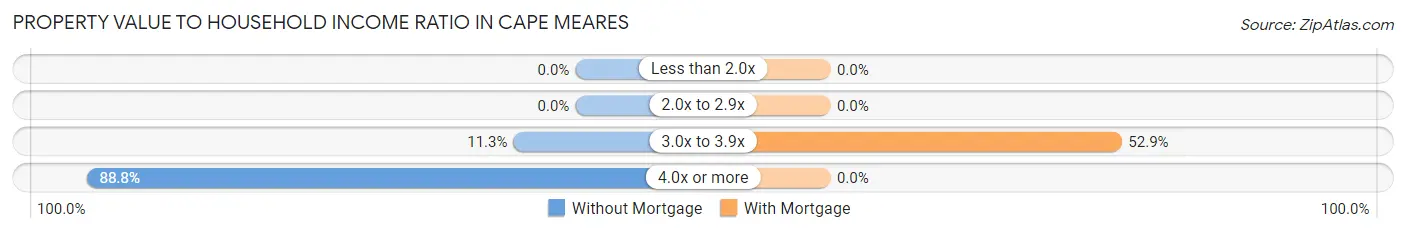
| Value-to-Income Ratio | Without Mortgage | With Mortgage |
| Less than 2.0x | 0 (0.0%) | 0 (0.0%) |
| 2.0x to 2.9x | 0 (0.0%) | 0 (0.0%) |
| 3.0x to 3.9x | 9 (11.3%) | 9 (52.9%) |
| 4.0x or more | 71 (88.7%) | 0 (0.0%) |
| Total | 80 (100.0%) | 17 (100.0%) |
Real Estate Taxes by Mortgage Status in Cape Meares
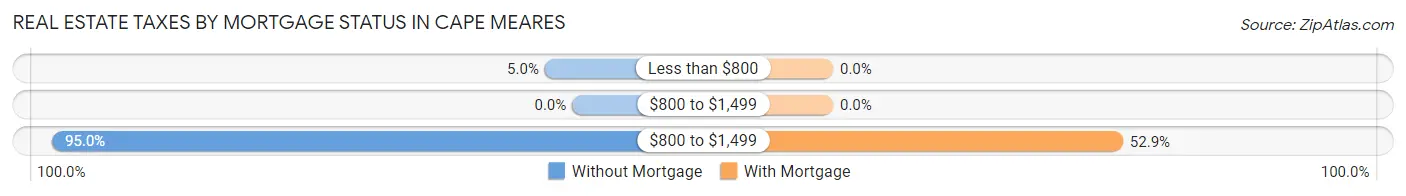
| Property Taxes | Without Mortgage | With Mortgage |
| Less than $800 | 4 (5.0%) | 0 (0.0%) |
| $800 to $1,499 | 0 (0.0%) | 0 (0.0%) |
| $800 to $1,499 | 76 (95.0%) | 9 (52.9%) |
| Total | 80 (100.0%) | 17 (100.0%) |
Health & Disability in Cape Meares
Health Insurance Coverage by Age in Cape Meares
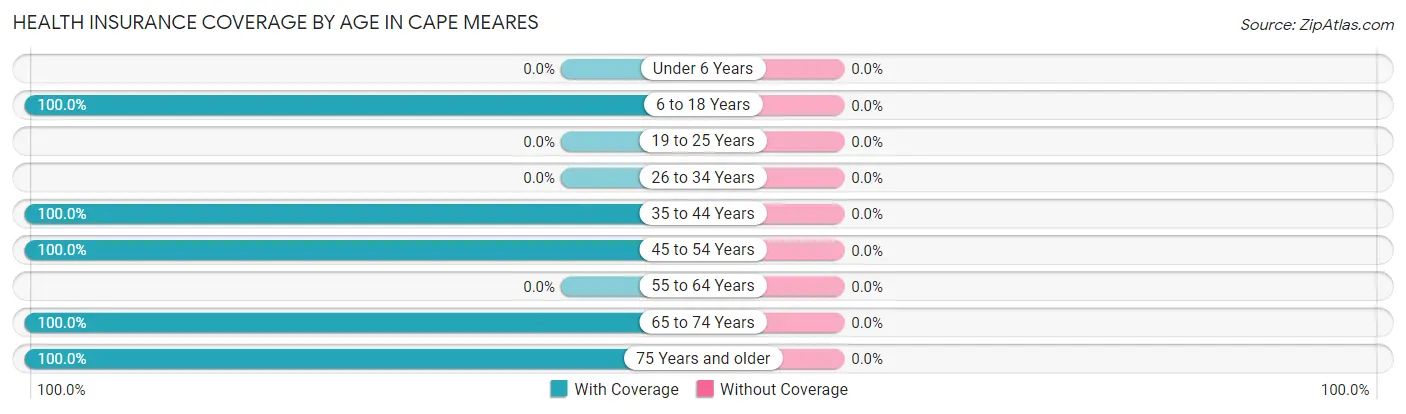
| Age Bracket | With Coverage | Without Coverage |
| Under 6 Years | 0 (0.0%) | 0 (0.0%) |
| 6 to 18 Years | 11 (100.0%) | 0 (0.0%) |
| 19 to 25 Years | 0 (0.0%) | 0 (0.0%) |
| 26 to 34 Years | 0 (0.0%) | 0 (0.0%) |
| 35 to 44 Years | 45 (100.0%) | 0 (0.0%) |
| 45 to 54 Years | 9 (100.0%) | 0 (0.0%) |
| 55 to 64 Years | 0 (0.0%) | 0 (0.0%) |
| 65 to 74 Years | 34 (100.0%) | 0 (0.0%) |
| 75 Years and older | 100 (100.0%) | 0 (0.0%) |
| Total | 199 (100.0%) | 0 (0.0%) |
Health Insurance Coverage by Citizenship Status in Cape Meares
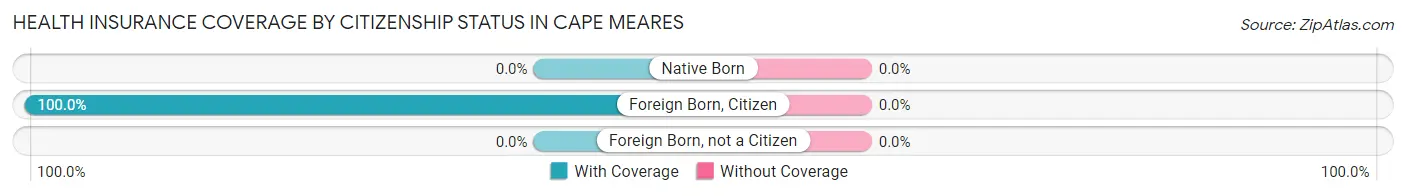
| Citizenship Status | With Coverage | Without Coverage |
| Native Born | 0 (0.0%) | 0 (0.0%) |
| Foreign Born, Citizen | 11 (100.0%) | 0 (0.0%) |
| Foreign Born, not a Citizen | 0 (0.0%) | 0 (0.0%) |
Health Insurance Coverage by Household Income in Cape Meares
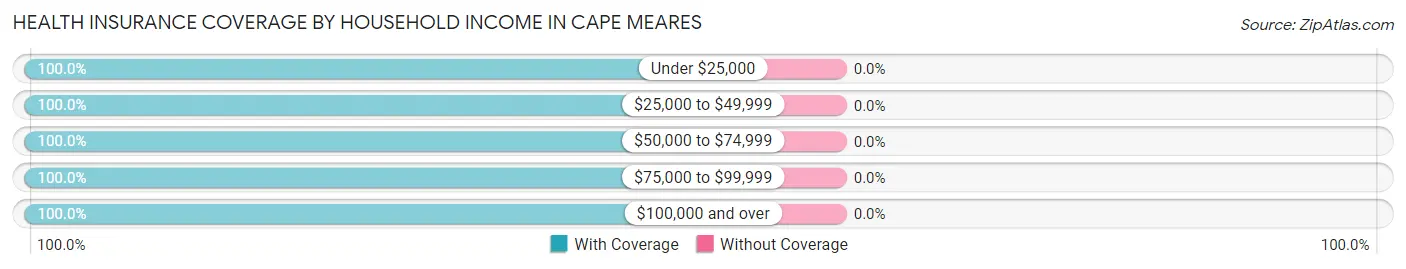
| Household Income | With Coverage | Without Coverage |
| Under $25,000 | 3 (100.0%) | 0 (0.0%) |
| $25,000 to $49,999 | 23 (100.0%) | 0 (0.0%) |
| $50,000 to $74,999 | 12 (100.0%) | 0 (0.0%) |
| $75,000 to $99,999 | 76 (100.0%) | 0 (0.0%) |
| $100,000 and over | 85 (100.0%) | 0 (0.0%) |
Public vs Private Health Insurance Coverage by Age in Cape Meares
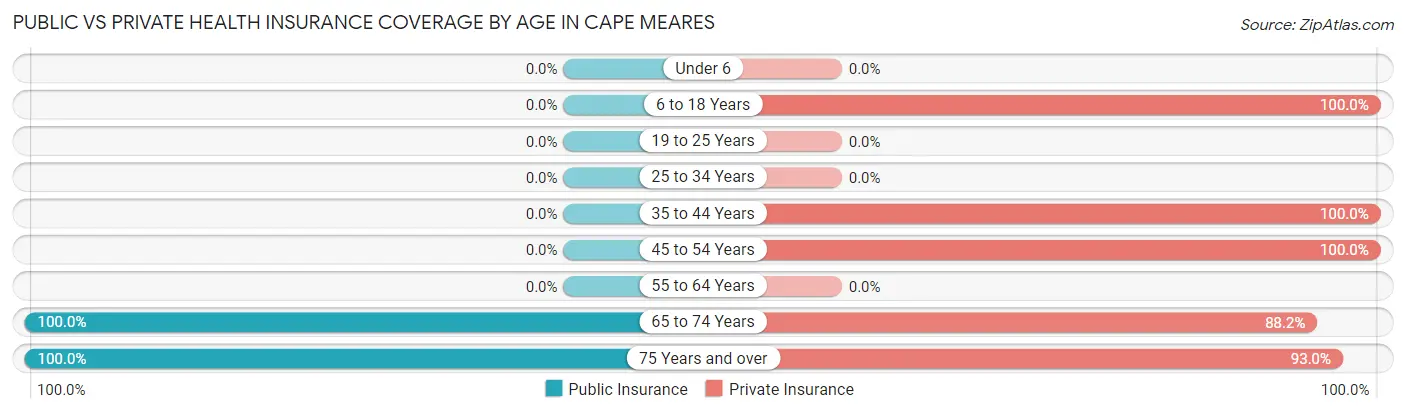
| Age Bracket | Public Insurance | Private Insurance |
| Under 6 | 0 (0.0%) | 0 (0.0%) |
| 6 to 18 Years | 0 (0.0%) | 11 (100.0%) |
| 19 to 25 Years | 0 (0.0%) | 0 (0.0%) |
| 25 to 34 Years | 0 (0.0%) | 0 (0.0%) |
| 35 to 44 Years | 0 (0.0%) | 45 (100.0%) |
| 45 to 54 Years | 0 (0.0%) | 9 (100.0%) |
| 55 to 64 Years | 0 (0.0%) | 0 (0.0%) |
| 65 to 74 Years | 34 (100.0%) | 30 (88.2%) |
| 75 Years and over | 100 (100.0%) | 93 (93.0%) |
| Total | 134 (67.3%) | 188 (94.5%) |
Disability Status by Sex by Age in Cape Meares
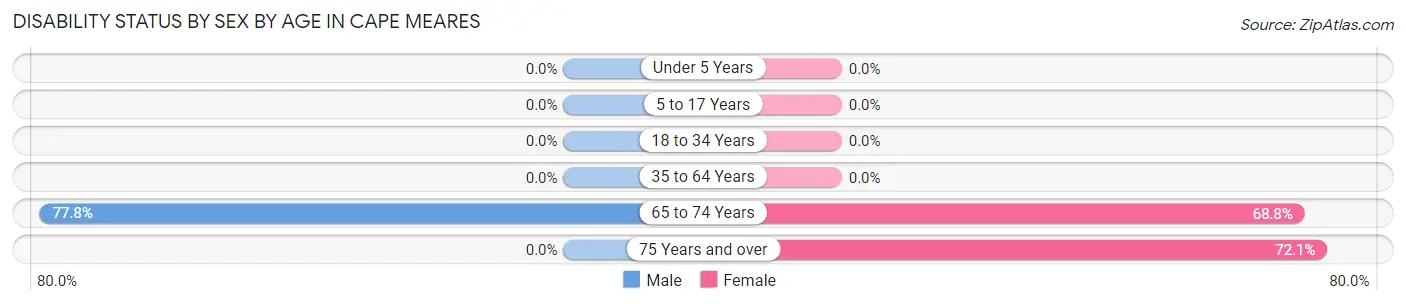
| Age Bracket | Male | Female |
| Under 5 Years | 0 (0.0%) | 0 (0.0%) |
| 5 to 17 Years | 0 (0.0%) | 0 (0.0%) |
| 18 to 34 Years | 0 (0.0%) | 0 (0.0%) |
| 35 to 64 Years | 0 (0.0%) | 0 (0.0%) |
| 65 to 74 Years | 14 (77.8%) | 11 (68.8%) |
| 75 Years and over | 0 (0.0%) | 31 (72.1%) |
Disability Class by Sex by Age in Cape Meares
Disability Class: Hearing Difficulty
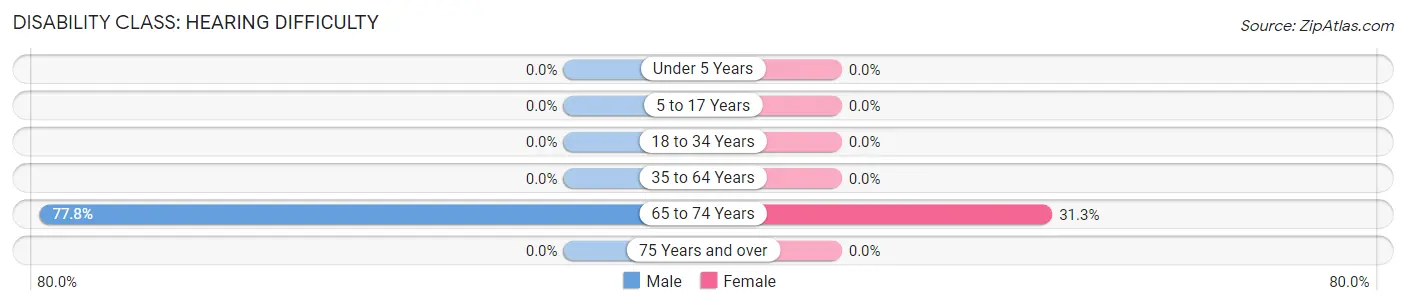
| Age Bracket | Male | Female |
| Under 5 Years | 0 (0.0%) | 0 (0.0%) |
| 5 to 17 Years | 0 (0.0%) | 0 (0.0%) |
| 18 to 34 Years | 0 (0.0%) | 0 (0.0%) |
| 35 to 64 Years | 0 (0.0%) | 0 (0.0%) |
| 65 to 74 Years | 14 (77.8%) | 5 (31.2%) |
| 75 Years and over | 0 (0.0%) | 0 (0.0%) |
Disability Class: Vision Difficulty
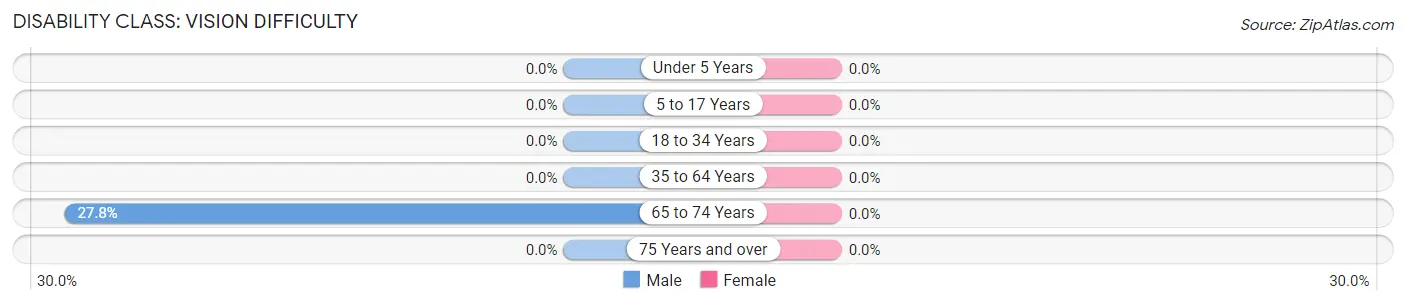
| Age Bracket | Male | Female |
| Under 5 Years | 0 (0.0%) | 0 (0.0%) |
| 5 to 17 Years | 0 (0.0%) | 0 (0.0%) |
| 18 to 34 Years | 0 (0.0%) | 0 (0.0%) |
| 35 to 64 Years | 0 (0.0%) | 0 (0.0%) |
| 65 to 74 Years | 5 (27.8%) | 0 (0.0%) |
| 75 Years and over | 0 (0.0%) | 0 (0.0%) |
Disability Class: Cognitive Difficulty
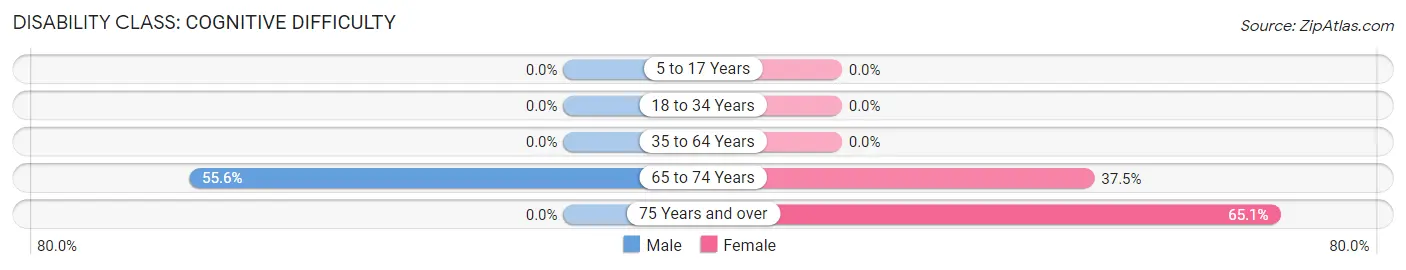
| Age Bracket | Male | Female |
| 5 to 17 Years | 0 (0.0%) | 0 (0.0%) |
| 18 to 34 Years | 0 (0.0%) | 0 (0.0%) |
| 35 to 64 Years | 0 (0.0%) | 0 (0.0%) |
| 65 to 74 Years | 10 (55.6%) | 6 (37.5%) |
| 75 Years and over | 0 (0.0%) | 28 (65.1%) |
Disability Class: Ambulatory Difficulty
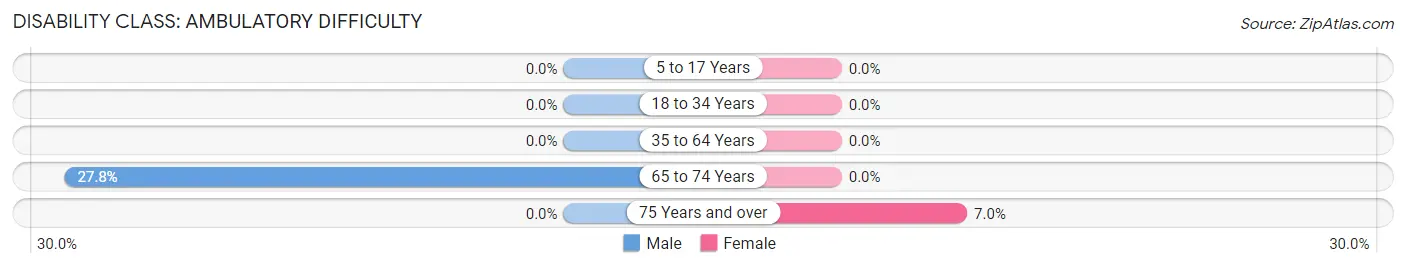
| Age Bracket | Male | Female |
| 5 to 17 Years | 0 (0.0%) | 0 (0.0%) |
| 18 to 34 Years | 0 (0.0%) | 0 (0.0%) |
| 35 to 64 Years | 0 (0.0%) | 0 (0.0%) |
| 65 to 74 Years | 5 (27.8%) | 0 (0.0%) |
| 75 Years and over | 0 (0.0%) | 3 (7.0%) |
Disability Class: Self-Care Difficulty
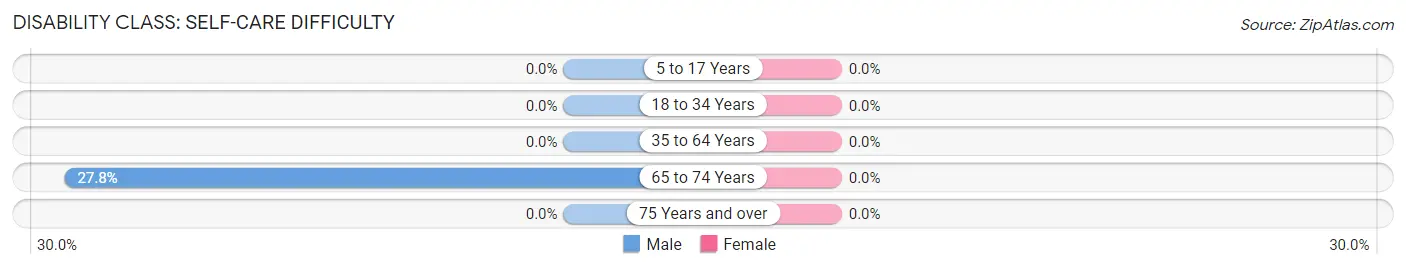
| Age Bracket | Male | Female |
| 5 to 17 Years | 0 (0.0%) | 0 (0.0%) |
| 18 to 34 Years | 0 (0.0%) | 0 (0.0%) |
| 35 to 64 Years | 0 (0.0%) | 0 (0.0%) |
| 65 to 74 Years | 5 (27.8%) | 0 (0.0%) |
| 75 Years and over | 0 (0.0%) | 0 (0.0%) |
Technology Access in Cape Meares
Computing Device Access in Cape Meares
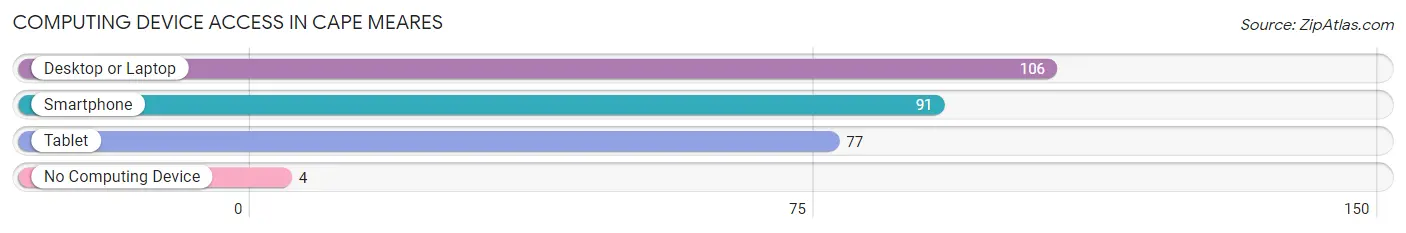
| Device Type | # Households | % Households |
| Desktop or Laptop | 106 | 96.4% |
| Smartphone | 91 | 82.7% |
| Tablet | 77 | 70.0% |
| No Computing Device | 4 | 3.6% |
| Total | 110 | 100.0% |
Internet Access in Cape Meares
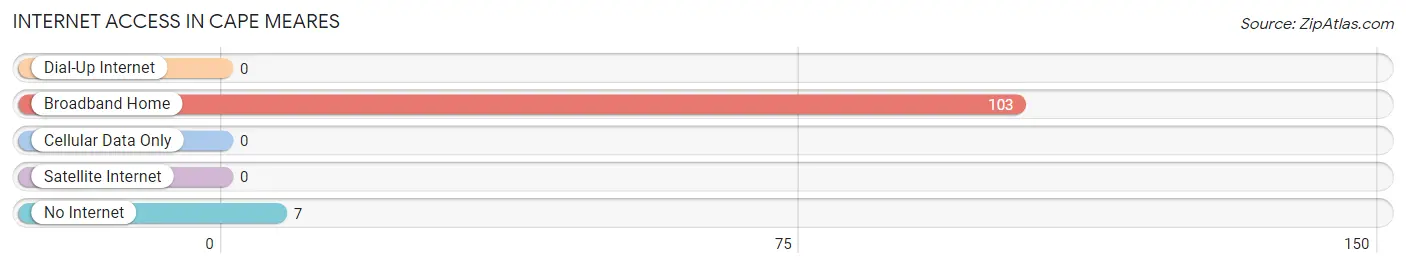
| Internet Type | # Households | % Households |
| Dial-Up Internet | 0 | 0.0% |
| Broadband Home | 103 | 93.6% |
| Cellular Data Only | 0 | 0.0% |
| Satellite Internet | 0 | 0.0% |
| No Internet | 7 | 6.4% |
| Total | 110 | 100.0% |
Cape Meares Summary
Cape Meares is a small unincorporated community located on the Oregon Coast in Tillamook County, Oregon. It is situated on the northern tip of the Cape Meares Peninsula, which juts out into the Pacific Ocean. The community is located approximately 20 miles west of Tillamook and is home to a population of approximately 200 people.
History
The area around Cape Meares has been inhabited for thousands of years by the Tillamook people. The first European to explore the area was Spanish explorer Bruno de Heceta in 1775. He named the cape after his friend, Spanish naval officer Antonio de Meares. The area was later explored by American fur traders in the early 1800s.
In 1851, the first settlers arrived in the area and established a small fishing village. The village was named Cape Meares after the cape. The village grew slowly over the next few decades, and by the early 1900s, it had become a popular tourist destination.
In the late 1800s, the area was logged extensively, and the timber industry became a major part of the local economy. The timber industry declined in the early 1900s, and the area became primarily a fishing and tourist destination.
Geography
Cape Meares is located on the northern tip of the Cape Meares Peninsula, which juts out into the Pacific Ocean. The peninsula is approximately 5 miles long and 1 mile wide. The area is characterized by rugged cliffs, rocky beaches, and dense forests.
The climate in the area is mild and temperate, with average temperatures ranging from the mid-50s in the winter to the mid-70s in the summer. The area receives an average of 60 inches of rain per year.
Economy
The economy of Cape Meares is primarily based on tourism and fishing. The area is a popular destination for tourists, who come to enjoy the area’s rugged coastline, beaches, and forests. The area is also home to a number of commercial fishing operations, which provide fresh seafood to local restaurants and markets.
Demographics
As of the 2010 census, the population of Cape Meares was approximately 200 people. The population is primarily white (95%), with a small minority of Native American (2%) and Hispanic (3%) residents. The median household income in the area is $45,000, and the median home value is $250,000.
Conclusion
Cape Meares is a small unincorporated community located on the Oregon Coast in Tillamook County, Oregon. It is situated on the northern tip of the Cape Meares Peninsula, which juts out into the Pacific Ocean. The area has been inhabited for thousands of years and is now a popular tourist destination. The economy of the area is primarily based on tourism and fishing, and the population is primarily white.
Common Questions
What is Per Capita Income in Cape Meares?
Per Capita income in Cape Meares is $54,019.
What is the Median Family Income in Cape Meares?
Median Family Income in Cape Meares is $87,107.
What is the Median Household income in Cape Meares?
Median Household Income in Cape Meares is $87,000.
What is Inequality or Gini Index in Cape Meares?
Inequality or Gini Index in Cape Meares is 0.27.
What is the Total Population of Cape Meares?
Total Population of Cape Meares is 199.
What is the Total Male Population of Cape Meares?
Total Male Population of Cape Meares is 106.
What is the Total Female Population of Cape Meares?
Total Female Population of Cape Meares is 93.
What is the Ratio of Males per 100 Females in Cape Meares?
There are 113.98 Males per 100 Females in Cape Meares.
What is the Ratio of Females per 100 Males in Cape Meares?
There are 87.74 Females per 100 Males in Cape Meares.
What is the Median Population Age in Cape Meares?
Median Population Age in Cape Meares is 75.0 Years.
What is the Average Family Size in Cape Meares
Average Family Size in Cape Meares is 2.0 People.
What is the Average Household Size in Cape Meares
Average Household Size in Cape Meares is 1.8 People.
How Large is the Labor Force in Cape Meares?
There are 54 People in the Labor Forcein in Cape Meares.
What is the Percentage of People in the Labor Force in Cape Meares?
28.7% of People are in the Labor Force in Cape Meares.