Truchas, NM Map & Demographics
Truchas Map
Truchas Overview
$38,782
PER CAPITA INCOME
$190,580
AVG FAMILY INCOME
0.45
INEQUALITY / GINI INDEX
320
TOTAL POPULATION
181
MALE POPULATION
139
FEMALE POPULATION
130.22
MALES / 100 FEMALES
76.80
FEMALES / 100 MALES
46.7
MEDIAN AGE
4.3
AVG FAMILY SIZE
2.4
AVG HOUSEHOLD SIZE
74
LABOR FORCE [ PEOPLE ]
26.0%
PERCENT IN LABOR FORCE
Truchas Zip Codes
Truchas Area Codes
Income in Truchas
Income Overview in Truchas
| Characteristic | Number | Measure |
| Per Capita Income | 320 | $38,782 |
| Median Family Income | 43 | $190,580 |
| Mean Family Income | 43 | $166,830 |
| Median Household Income | 133 | $0 |
| Mean Household Income | 133 | $76,465 |
| Income Deficit | 43 | $0 |
| Wage / Income Gap (%) | 320 | 0.00% |
| Wage / Income Gap ($) | 320 | 100.00¢ per $1 |
| Gini / Inequality Index | 320 | 0.45 |
Earnings by Sex in Truchas
| Sex | Number | Average Earnings |
| Male | 16 (21.6%) | $0 |
| Female | 58 (78.4%) | $0 |
| Total | 74 (100.0%) | $0 |
Earnings by Sex by Income Bracket in Truchas
The most common earnings brackets in Truchas are $15,000 to $17,499 for men (9 | 56.2%) and $100,000+ for women (28 | 48.3%).
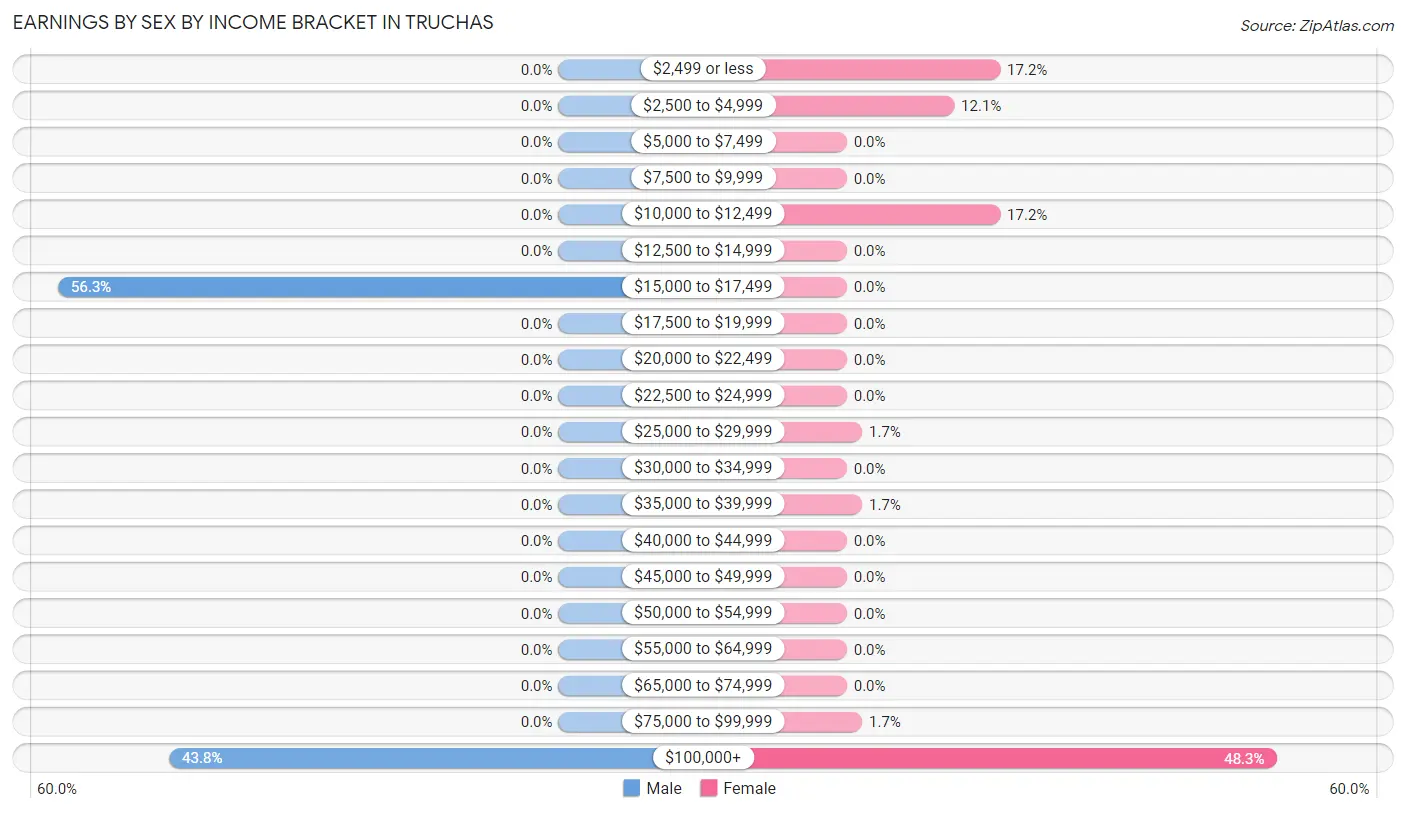
| Income | Male | Female |
| $2,499 or less | 0 (0.0%) | 10 (17.2%) |
| $2,500 to $4,999 | 0 (0.0%) | 7 (12.1%) |
| $5,000 to $7,499 | 0 (0.0%) | 0 (0.0%) |
| $7,500 to $9,999 | 0 (0.0%) | 0 (0.0%) |
| $10,000 to $12,499 | 0 (0.0%) | 10 (17.2%) |
| $12,500 to $14,999 | 0 (0.0%) | 0 (0.0%) |
| $15,000 to $17,499 | 9 (56.2%) | 0 (0.0%) |
| $17,500 to $19,999 | 0 (0.0%) | 0 (0.0%) |
| $20,000 to $22,499 | 0 (0.0%) | 0 (0.0%) |
| $22,500 to $24,999 | 0 (0.0%) | 0 (0.0%) |
| $25,000 to $29,999 | 0 (0.0%) | 1 (1.7%) |
| $30,000 to $34,999 | 0 (0.0%) | 0 (0.0%) |
| $35,000 to $39,999 | 0 (0.0%) | 1 (1.7%) |
| $40,000 to $44,999 | 0 (0.0%) | 0 (0.0%) |
| $45,000 to $49,999 | 0 (0.0%) | 0 (0.0%) |
| $50,000 to $54,999 | 0 (0.0%) | 0 (0.0%) |
| $55,000 to $64,999 | 0 (0.0%) | 0 (0.0%) |
| $65,000 to $74,999 | 0 (0.0%) | 0 (0.0%) |
| $75,000 to $99,999 | 0 (0.0%) | 1 (1.7%) |
| $100,000+ | 7 (43.8%) | 28 (48.3%) |
| Total | 16 (100.0%) | 58 (100.0%) |
Earnings by Sex by Educational Attainment in Truchas
| Educational Attainment | Male Income | Female Income |
| Less than High School | - | - |
| High School Diploma | - | - |
| College or Associate's Degree | - | - |
| Bachelor's Degree | - | - |
| Graduate Degree | - | - |
| Total | - | - |
Family Income in Truchas
Family Income Brackets in Truchas
According to the Truchas family income data, there are 35 families falling into the $150,000 to $199,999 income range, which is the most common income bracket and makes up 81.4% of all families.
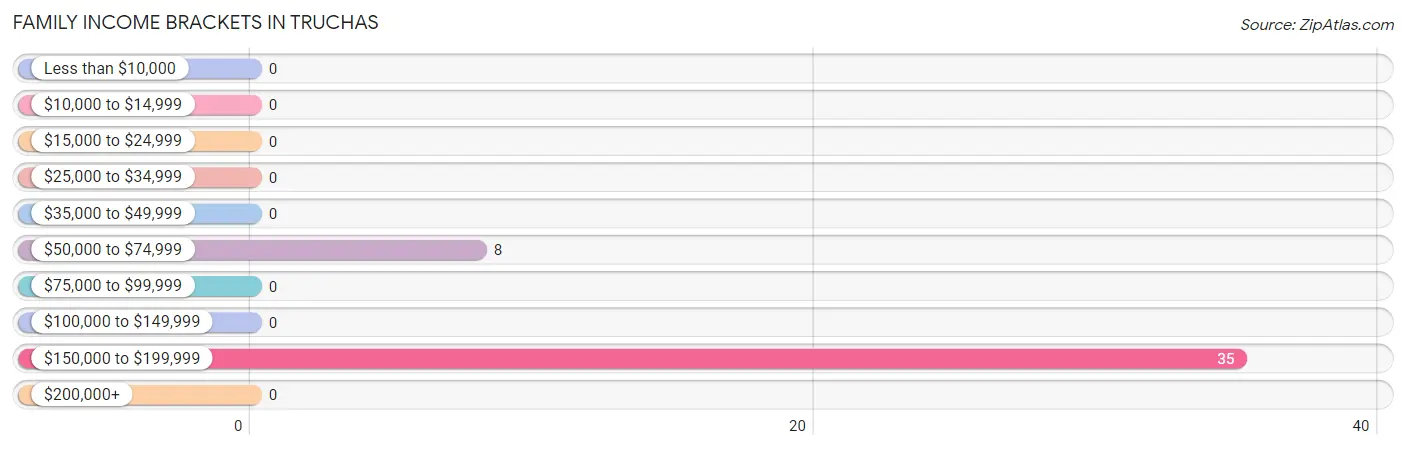
| Income Bracket | # Families | % Families |
| Less than $10,000 | 0 | 0.0% |
| $10,000 to $14,999 | 0 | 0.0% |
| $15,000 to $24,999 | 0 | 0.0% |
| $25,000 to $34,999 | 0 | 0.0% |
| $35,000 to $49,999 | 0 | 0.0% |
| $50,000 to $74,999 | 8 | 18.6% |
| $75,000 to $99,999 | 0 | 0.0% |
| $100,000 to $149,999 | 0 | 0.0% |
| $150,000 to $199,999 | 35 | 81.4% |
| $200,000+ | 0 | 0.0% |
Family Income by Famaliy Size in Truchas
| Income Bracket | # Families | Median Income |
| 2-Person Families | 35 (81.4%) | $0 |
| 3-Person Families | 8 (18.6%) | $0 |
| 4-Person Families | 0 (0.0%) | $0 |
| 5-Person Families | 0 (0.0%) | $0 |
| 6-Person Families | 0 (0.0%) | $0 |
| 7+ Person Families | 0 (0.0%) | $0 |
| Total | 43 (100.0%) | $190,580 |
Family Income by Number of Earners in Truchas
| Number of Earners | # Families | Median Income |
| No Earners | 8 (18.6%) | $0 |
| 1 Earner | 35 (81.4%) | $0 |
| 2 Earners | 0 (0.0%) | $0 |
| 3+ Earners | 0 (0.0%) | $0 |
| Total | 43 (100.0%) | $190,580 |
Household Income in Truchas
Household Income Brackets in Truchas
With 55 households falling in the category, the $35,000 to $49,999 income range is the most frequent in Truchas, accounting for 41.3% of all households.
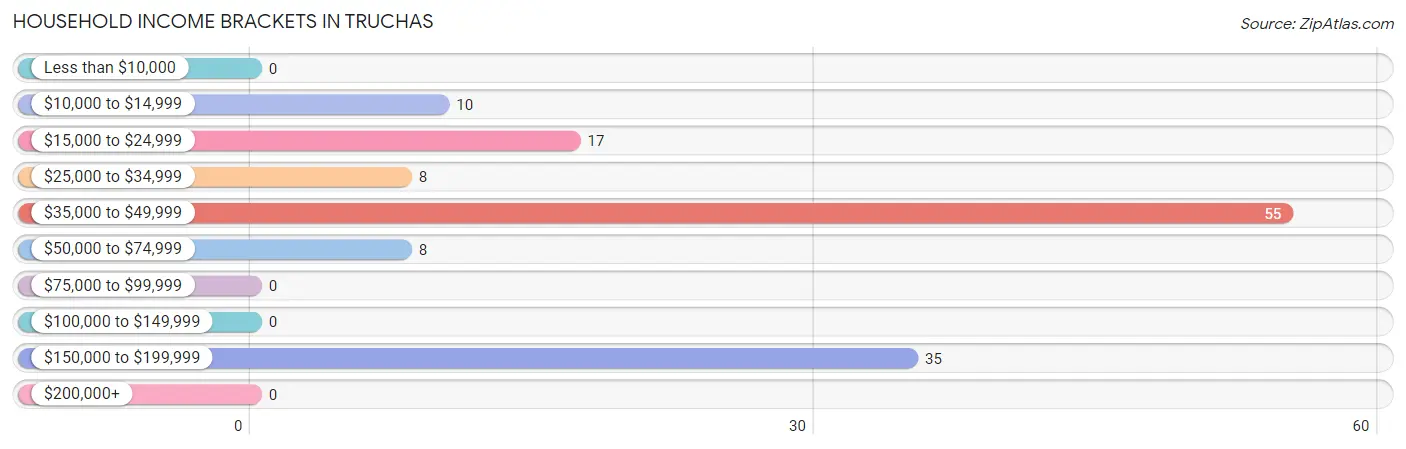
| Income Bracket | # Households | % Households |
| Less than $10,000 | 0 | 0.0% |
| $10,000 to $14,999 | 10 | 7.5% |
| $15,000 to $24,999 | 17 | 12.8% |
| $25,000 to $34,999 | 8 | 6.0% |
| $35,000 to $49,999 | 55 | 41.4% |
| $50,000 to $74,999 | 8 | 6.0% |
| $75,000 to $99,999 | 0 | 0.0% |
| $100,000 to $149,999 | 0 | 0.0% |
| $150,000 to $199,999 | 35 | 26.3% |
| $200,000+ | 0 | 0.0% |
Household Income by Householder Age in Truchas
The median household income in Truchas is $0, with the highest median household income of $36,750 found in the 65+ years age bracket for the primary householder. A total of 98 households (73.7%) fall into this category.
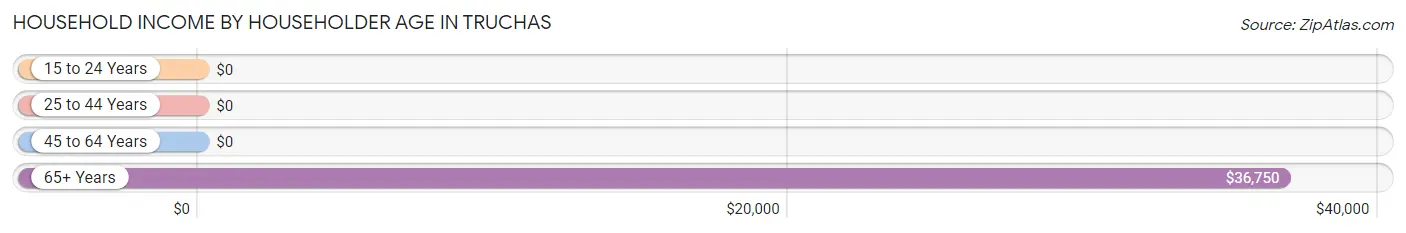
| Income Bracket | # Households | Median Income |
| 15 to 24 Years | 0 (0.0%) | $0 |
| 25 to 44 Years | 35 (26.3%) | $0 |
| 45 to 64 Years | 0 (0.0%) | $0 |
| 65+ Years | 98 (73.7%) | $36,750 |
| Total | 133 (100.0%) | $0 |
Poverty in Truchas
Income Below Poverty by Sex and Age in Truchas
With 17.1% poverty level for males and 12.2% for females among the residents of Truchas, 16 and 17 year old males and 25 to 34 year old females are the most vulnerable to poverty, with 1 males (100.0%) and 7 females (100.0%) in their respective age groups living below the poverty level.
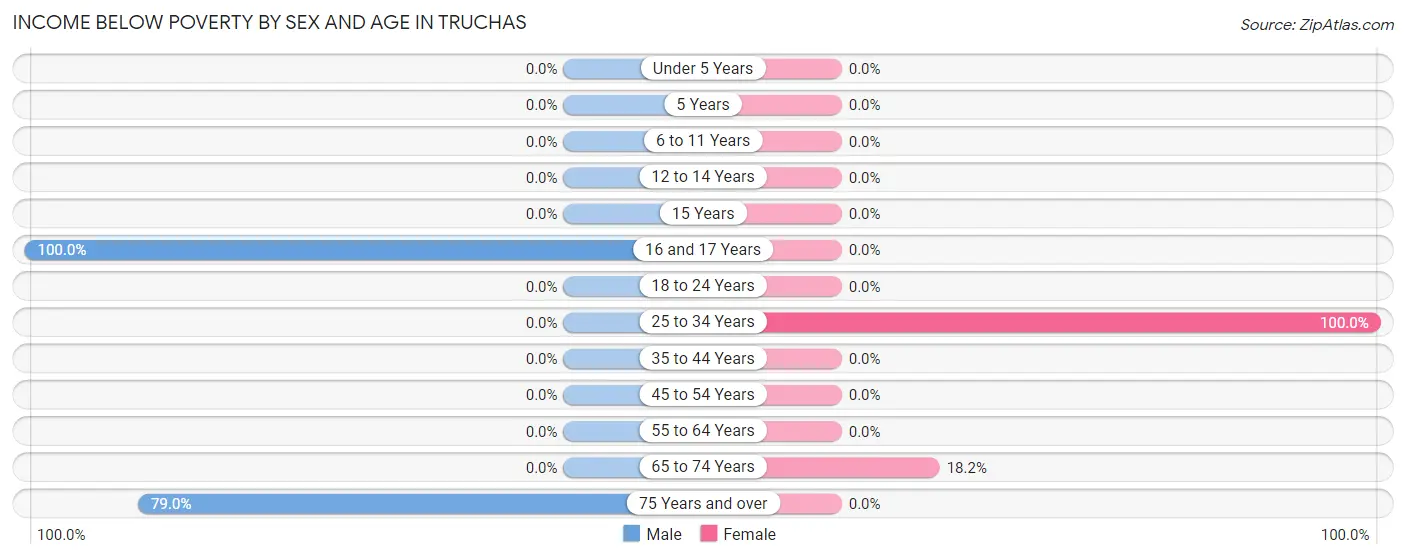
| Age Bracket | Male | Female |
| Under 5 Years | 0 (0.0%) | 0 (0.0%) |
| 5 Years | 0 (0.0%) | 0 (0.0%) |
| 6 to 11 Years | 0 (0.0%) | 0 (0.0%) |
| 12 to 14 Years | 0 (0.0%) | 0 (0.0%) |
| 15 Years | 0 (0.0%) | 0 (0.0%) |
| 16 and 17 Years | 1 (100.0%) | 0 (0.0%) |
| 18 to 24 Years | 0 (0.0%) | 0 (0.0%) |
| 25 to 34 Years | 0 (0.0%) | 7 (100.0%) |
| 35 to 44 Years | 0 (0.0%) | 0 (0.0%) |
| 45 to 54 Years | 0 (0.0%) | 0 (0.0%) |
| 55 to 64 Years | 0 (0.0%) | 0 (0.0%) |
| 65 to 74 Years | 0 (0.0%) | 10 (18.2%) |
| 75 Years and over | 30 (78.9%) | 0 (0.0%) |
| Total | 31 (17.1%) | 17 (12.2%) |
Income Above Poverty by Sex and Age in Truchas
According to the poverty statistics in Truchas, males aged 25 to 34 years and females aged 12 to 14 years are the age groups that are most secure financially, with 100.0% of males and 100.0% of females in these age groups living above the poverty line.
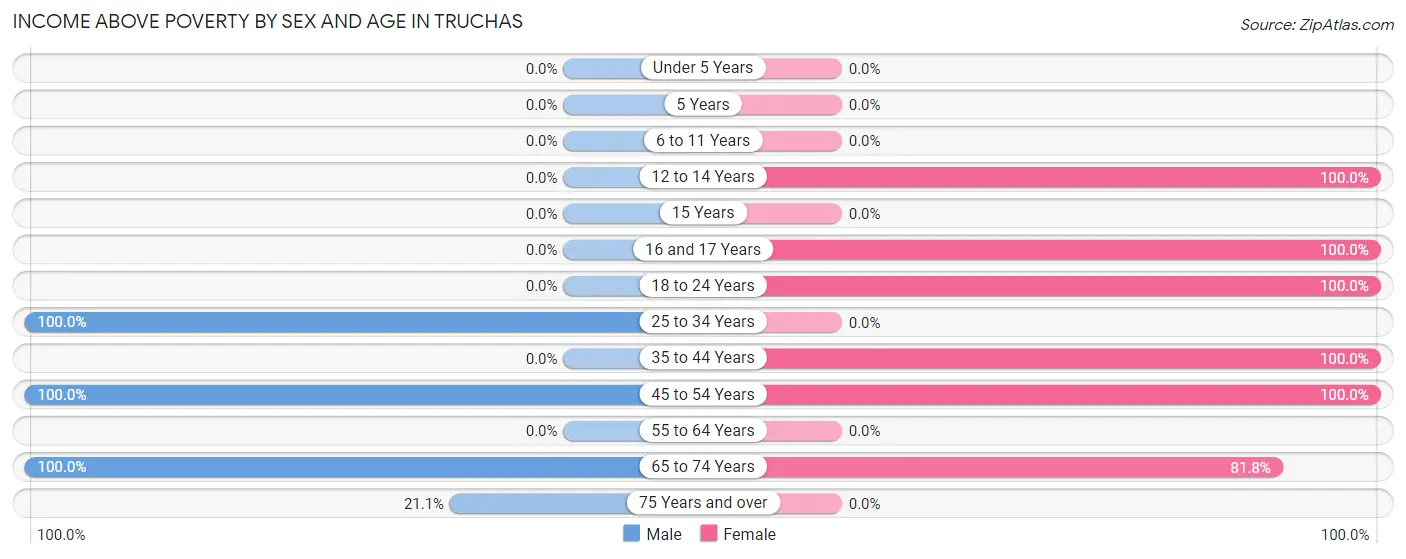
| Age Bracket | Male | Female |
| Under 5 Years | 0 (0.0%) | 0 (0.0%) |
| 5 Years | 0 (0.0%) | 0 (0.0%) |
| 6 to 11 Years | 0 (0.0%) | 0 (0.0%) |
| 12 to 14 Years | 0 (0.0%) | 35 (100.0%) |
| 15 Years | 0 (0.0%) | 0 (0.0%) |
| 16 and 17 Years | 0 (0.0%) | 1 (100.0%) |
| 18 to 24 Years | 0 (0.0%) | 1 (100.0%) |
| 25 to 34 Years | 9 (100.0%) | 0 (0.0%) |
| 35 to 44 Years | 0 (0.0%) | 29 (100.0%) |
| 45 to 54 Years | 93 (100.0%) | 11 (100.0%) |
| 55 to 64 Years | 0 (0.0%) | 0 (0.0%) |
| 65 to 74 Years | 40 (100.0%) | 45 (81.8%) |
| 75 Years and over | 8 (21.0%) | 0 (0.0%) |
| Total | 150 (82.9%) | 122 (87.8%) |
Income Below Poverty Among Married-Couple Families in Truchas
| Children | Above Poverty | Below Poverty |
| No Children | 15 (100.0%) | 0 (0.0%) |
| 1 or 2 Children | 0 (0.0%) | 0 (0.0%) |
| 3 or 4 Children | 0 (0.0%) | 0 (0.0%) |
| 5 or more Children | 0 (0.0%) | 0 (0.0%) |
| Total | 15 (100.0%) | 0 (0.0%) |
Income Below Poverty Among Single-Parent Households in Truchas
| Children | Single Father | Single Mother |
| No Children | 0 (0.0%) | 0 (0.0%) |
| 1 or 2 Children | 0 (0.0%) | 0 (0.0%) |
| 3 or 4 Children | 0 (0.0%) | 0 (0.0%) |
| 5 or more Children | 0 (0.0%) | 0 (0.0%) |
| Total | 0 (0.0%) | 0 (0.0%) |
Income Below Poverty Among Married-Couple vs Single-Parent Households in Truchas
| Children | Married-Couple Families | Single-Parent Households |
| No Children | 0 (0.0%) | 0 (0.0%) |
| 1 or 2 Children | 0 (0.0%) | 0 (0.0%) |
| 3 or 4 Children | 0 (0.0%) | 0 (0.0%) |
| 5 or more Children | 0 (0.0%) | 0 (0.0%) |
| Total | 0 (0.0%) | 0 (0.0%) |
Race in Truchas
The most populous races in Truchas are White / Caucasian (222 | 69.4%), Hispanic or Latino (199 | 62.2%), and Some other Race (89 | 27.8%).
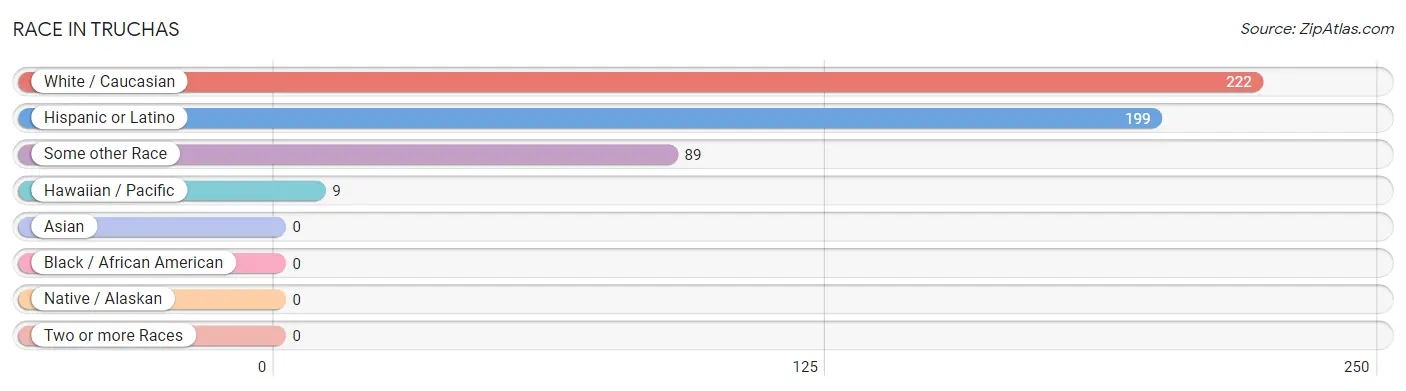
| Race | # Population | % Population |
| Asian | 0 | 0.0% |
| Black / African American | 0 | 0.0% |
| Hawaiian / Pacific | 9 | 2.8% |
| Hispanic or Latino | 199 | 62.2% |
| Native / Alaskan | 0 | 0.0% |
| White / Caucasian | 222 | 69.4% |
| Two or more Races | 0 | 0.0% |
| Some other Race | 89 | 27.8% |
| Total | 320 | 100.0% |
Ancestry in Truchas
The most populous ancestries reported in Truchas are Spaniard (63 | 19.7%), German (45 | 14.1%), Irish (30 | 9.4%), English (10 | 3.1%), and Swedish (10 | 3.1%), together accounting for 49.4% of all Truchas residents.
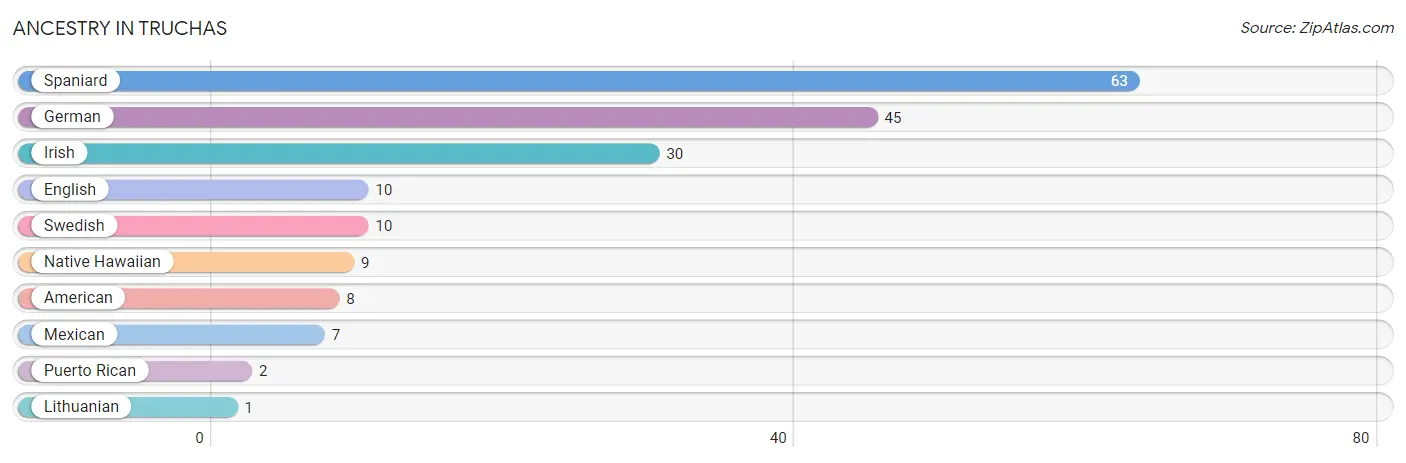
| Ancestry | # Population | % Population |
| American | 8 | 2.5% |
| English | 10 | 3.1% |
| German | 45 | 14.1% |
| Irish | 30 | 9.4% |
| Lithuanian | 1 | 0.3% |
| Mexican | 7 | 2.2% |
| Native Hawaiian | 9 | 2.8% |
| Puerto Rican | 2 | 0.6% |
| Spaniard | 63 | 19.7% |
| Swedish | 10 | 3.1% | View All 10 Rows |
Immigrants in Truchas
The most numerous immigrant groups reported in Truchas came from Europe (10 | 3.1%), Northern Europe (10 | 3.1%), and Sweden (10 | 3.1%), together accounting for 9.4% of all Truchas residents.
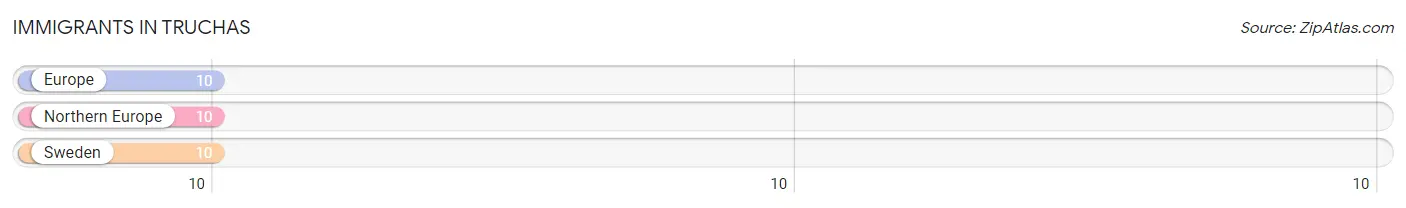
| Immigration Origin | # Population | % Population |
| Europe | 10 | 3.1% |
| Northern Europe | 10 | 3.1% |
| Sweden | 10 | 3.1% | View All 3 Rows |
Sex and Age in Truchas
Sex and Age in Truchas
The most populous age groups in Truchas are 45 to 49 Years (93 | 51.4%) for men and 10 to 14 Years (35 | 25.2%) for women.
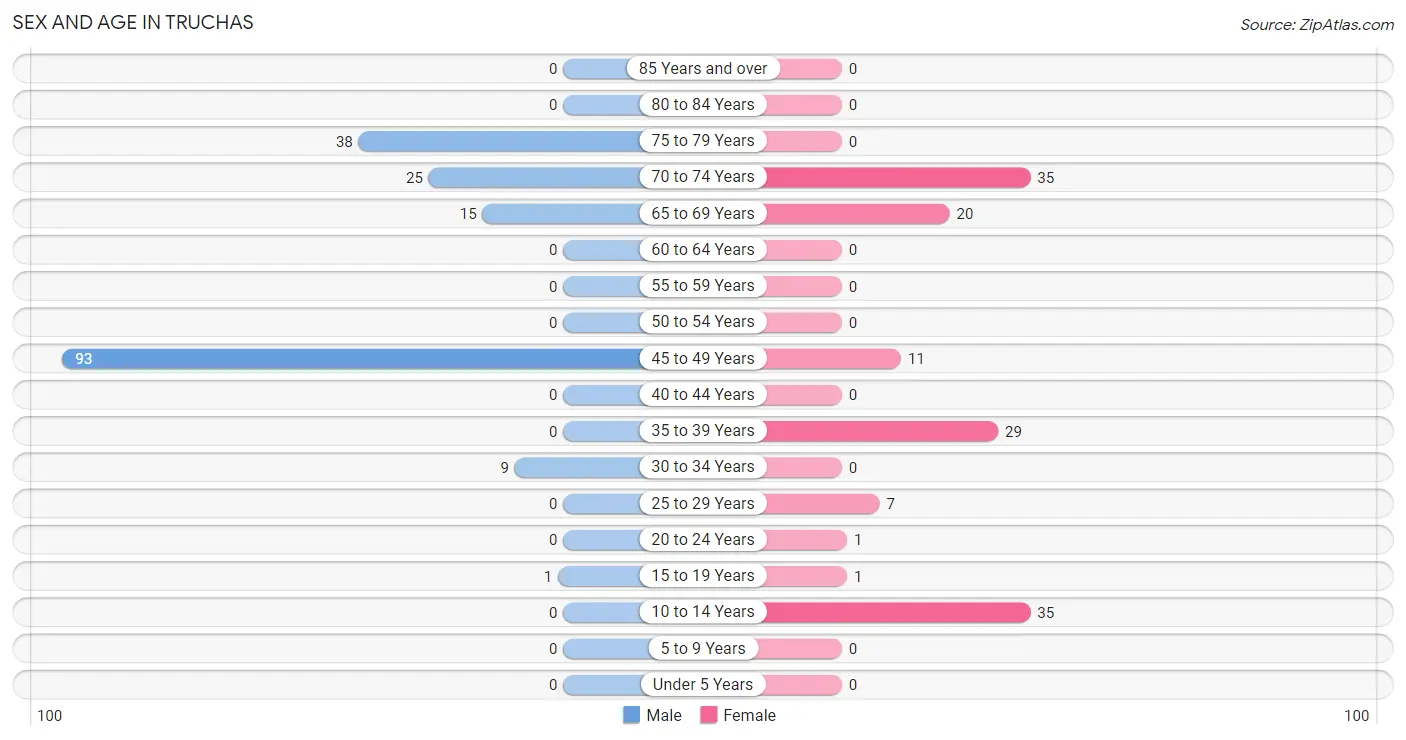
| Age Bracket | Male | Female |
| Under 5 Years | 0 (0.0%) | 0 (0.0%) |
| 5 to 9 Years | 0 (0.0%) | 0 (0.0%) |
| 10 to 14 Years | 0 (0.0%) | 35 (25.2%) |
| 15 to 19 Years | 1 (0.5%) | 1 (0.7%) |
| 20 to 24 Years | 0 (0.0%) | 1 (0.7%) |
| 25 to 29 Years | 0 (0.0%) | 7 (5.0%) |
| 30 to 34 Years | 9 (5.0%) | 0 (0.0%) |
| 35 to 39 Years | 0 (0.0%) | 29 (20.9%) |
| 40 to 44 Years | 0 (0.0%) | 0 (0.0%) |
| 45 to 49 Years | 93 (51.4%) | 11 (7.9%) |
| 50 to 54 Years | 0 (0.0%) | 0 (0.0%) |
| 55 to 59 Years | 0 (0.0%) | 0 (0.0%) |
| 60 to 64 Years | 0 (0.0%) | 0 (0.0%) |
| 65 to 69 Years | 15 (8.3%) | 20 (14.4%) |
| 70 to 74 Years | 25 (13.8%) | 35 (25.2%) |
| 75 to 79 Years | 38 (21.0%) | 0 (0.0%) |
| 80 to 84 Years | 0 (0.0%) | 0 (0.0%) |
| 85 Years and over | 0 (0.0%) | 0 (0.0%) |
| Total | 181 (100.0%) | 139 (100.0%) |
Families and Households in Truchas
Median Family Size in Truchas
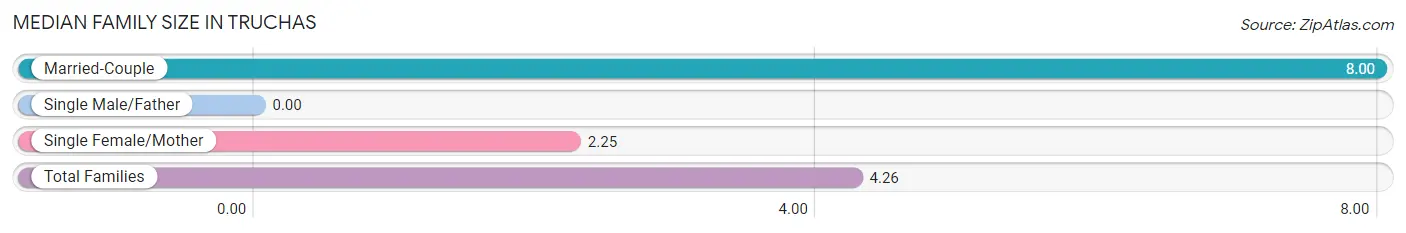
| Family Type | # Families | Family Size |
| Married-Couple | 15 (34.9%) | 8.00 |
| Single Male/Father | 0 (0.0%) | - |
| Single Female/Mother | 28 (65.1%) | 2.25 |
| Total Families | 43 (100.0%) | 4.26 |
Median Household Size in Truchas
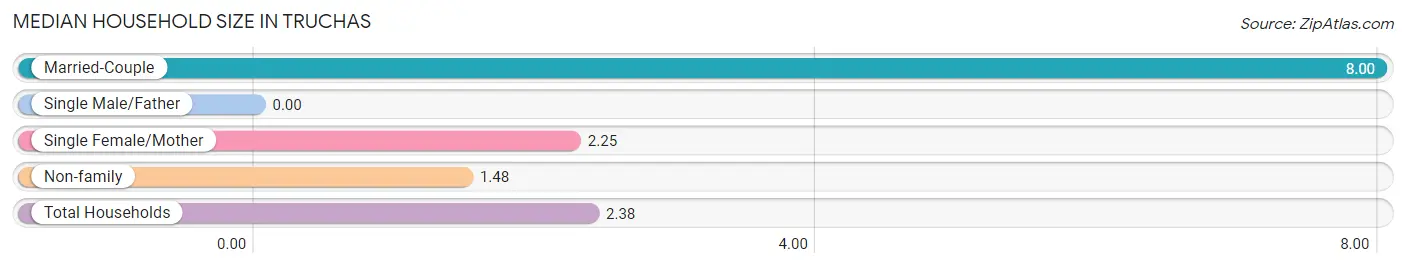
| Household Type | # Households | Household Size |
| Married-Couple | 15 (11.3%) | 8.00 |
| Single Male/Father | 0 (0.0%) | - |
| Single Female/Mother | 28 (21.0%) | 2.25 |
| Non-family | 90 (67.7%) | 1.48 |
| Total Households | 133 (100.0%) | 2.38 |
Household Size by Marriage Status in Truchas
Out of a total of 133 households in Truchas, 43 (32.3%) are family households, while 90 (67.7%) are nonfamily households. The most numerous type of family households are 2-person households, comprising 35, and the most common type of nonfamily households are 1-person households, comprising 53.
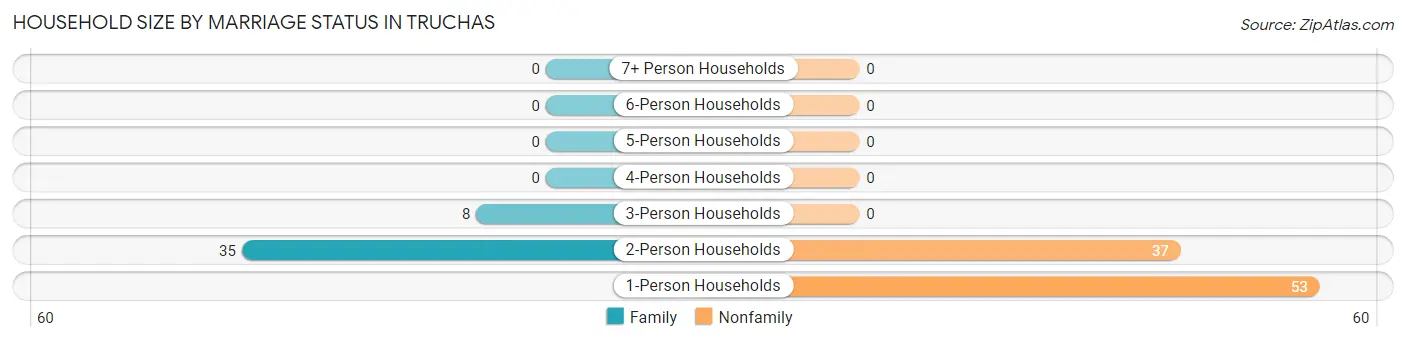
| Household Size | Family Households | Nonfamily Households |
| 1-Person Households | - | 53 (39.9%) |
| 2-Person Households | 35 (26.3%) | 37 (27.8%) |
| 3-Person Households | 8 (6.0%) | 0 (0.0%) |
| 4-Person Households | 0 (0.0%) | 0 (0.0%) |
| 5-Person Households | 0 (0.0%) | 0 (0.0%) |
| 6-Person Households | 0 (0.0%) | 0 (0.0%) |
| 7+ Person Households | 0 (0.0%) | 0 (0.0%) |
| Total | 43 (32.3%) | 90 (67.7%) |
Female Fertility in Truchas
Fertility by Age in Truchas
| Age Bracket | Women with Births | Births / 1,000 Women |
| 15 to 19 years | 0 (0.0%) | 0.0 |
| 20 to 34 years | 0 (0.0%) | 0.0 |
| 35 to 50 years | 0 (0.0%) | 0.0 |
| Total | 0 (0.0%) | 0.0 |
Fertility by Age by Marriage Status in Truchas
| Age Bracket | Married | Unmarried |
| 15 to 19 years | 0 (0.0%) | 0 (0.0%) |
| 20 to 34 years | 0 (0.0%) | 0 (0.0%) |
| 35 to 50 years | 0 (0.0%) | 0 (0.0%) |
| Total | 0 (0.0%) | 0 (0.0%) |
Fertility by Education in Truchas
| Educational Attainment | Women with Births | Births / 1,000 Women |
| Less than High School | 0 (0.0%) | 0.0 |
| High School Diploma | 0 (0.0%) | 0.0 |
| College or Associate's Degree | 0 (0.0%) | 0.0 |
| Bachelor's Degree | 0 (0.0%) | 0.0 |
| Graduate Degree | 0 (0.0%) | 0.0 |
| Total | 0 (0.0%) | 0.0 |
Fertility by Education by Marriage Status in Truchas
| Educational Attainment | Married | Unmarried |
| Less than High School | 0 (0.0%) | 0 (0.0%) |
| High School Diploma | 0 (0.0%) | 0 (0.0%) |
| College or Associate's Degree | 0 (0.0%) | 0 (0.0%) |
| Bachelor's Degree | 0 (0.0%) | 0 (0.0%) |
| Graduate Degree | 0 (0.0%) | 0 (0.0%) |
| Total | 0 (0.0%) | 0 (0.0%) |
Employment Characteristics in Truchas
Employment by Class of Employer in Truchas
Among the 74 employed individuals in Truchas, federal government employees (28 | 37.8%), self-employed (not incorporated) (20 | 27.0%), and not-for-profit organizations (11 | 14.9%) make up the most common classes of employment.
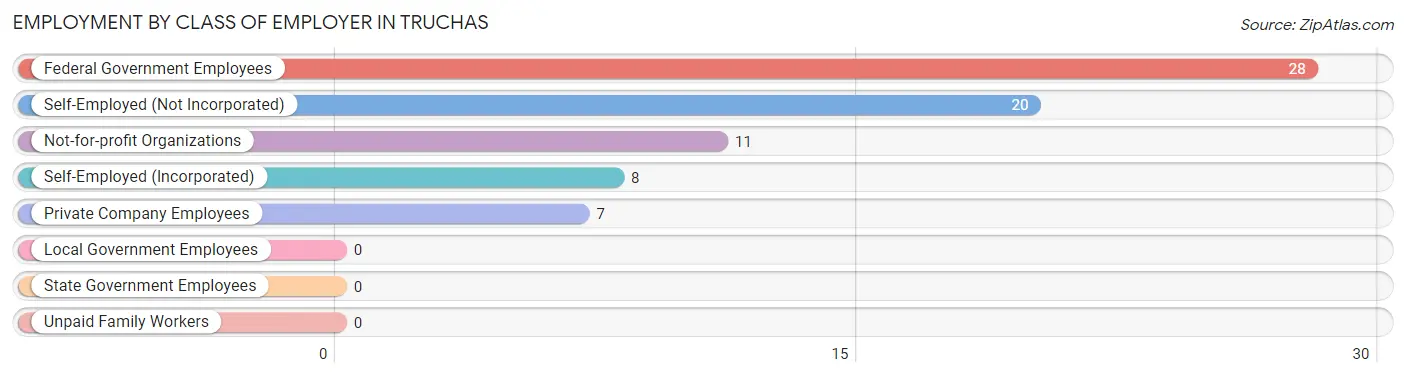
| Employer Class | # Employees | % Employees |
| Private Company Employees | 7 | 9.5% |
| Self-Employed (Incorporated) | 8 | 10.8% |
| Self-Employed (Not Incorporated) | 20 | 27.0% |
| Not-for-profit Organizations | 11 | 14.9% |
| Local Government Employees | 0 | 0.0% |
| State Government Employees | 0 | 0.0% |
| Federal Government Employees | 28 | 37.8% |
| Unpaid Family Workers | 0 | 0.0% |
| Total | 74 | 100.0% |
Employment Status by Age in Truchas
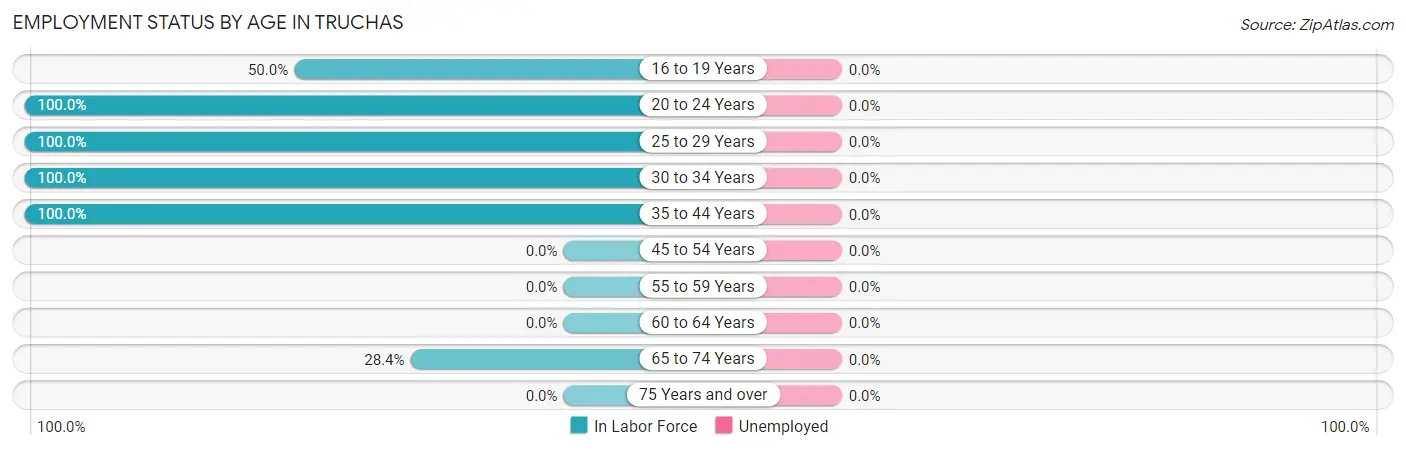
| Age Bracket | In Labor Force | Unemployed |
| 16 to 19 Years | 1 (50.0%) | 0 (0.0%) |
| 20 to 24 Years | 1 (100.0%) | 0 (0.0%) |
| 25 to 29 Years | 7 (100.0%) | 0 (0.0%) |
| 30 to 34 Years | 9 (100.0%) | 0 (0.0%) |
| 35 to 44 Years | 29 (100.0%) | 0 (0.0%) |
| 45 to 54 Years | 0 (0.0%) | 0 (0.0%) |
| 55 to 59 Years | 0 (0.0%) | 0 (0.0%) |
| 60 to 64 Years | 0 (0.0%) | 0 (0.0%) |
| 65 to 74 Years | 27 (28.4%) | 0 (0.0%) |
| 75 Years and over | 0 (0.0%) | 0 (0.0%) |
| Total | 74 (26.0%) | 0 (0.0%) |
Employment Status by Educational Attainment in Truchas
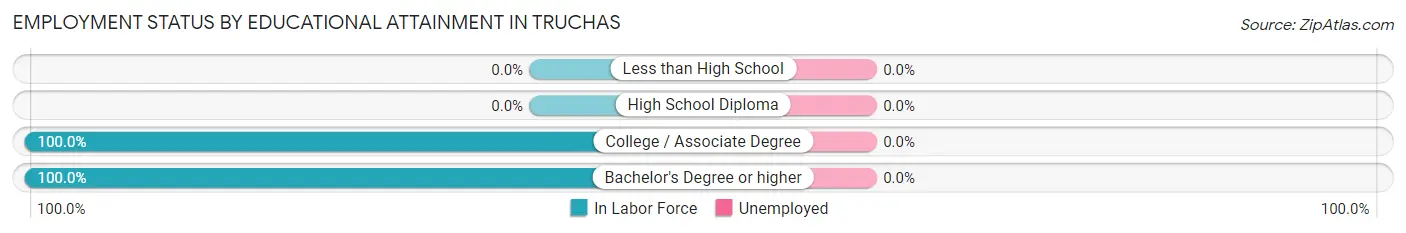
| Educational Attainment | In Labor Force | Unemployed |
| Less than High School | 0 (0.0%) | 0 (0.0%) |
| High School Diploma | 0 (0.0%) | 0 (0.0%) |
| College / Associate Degree | 1 (100.0%) | 0 (0.0%) |
| Bachelor's Degree or higher | 44 (100.0%) | 0 (0.0%) |
| Total | 45 (30.2%) | 0 (0.0%) |
Employment Occupations by Sex in Truchas
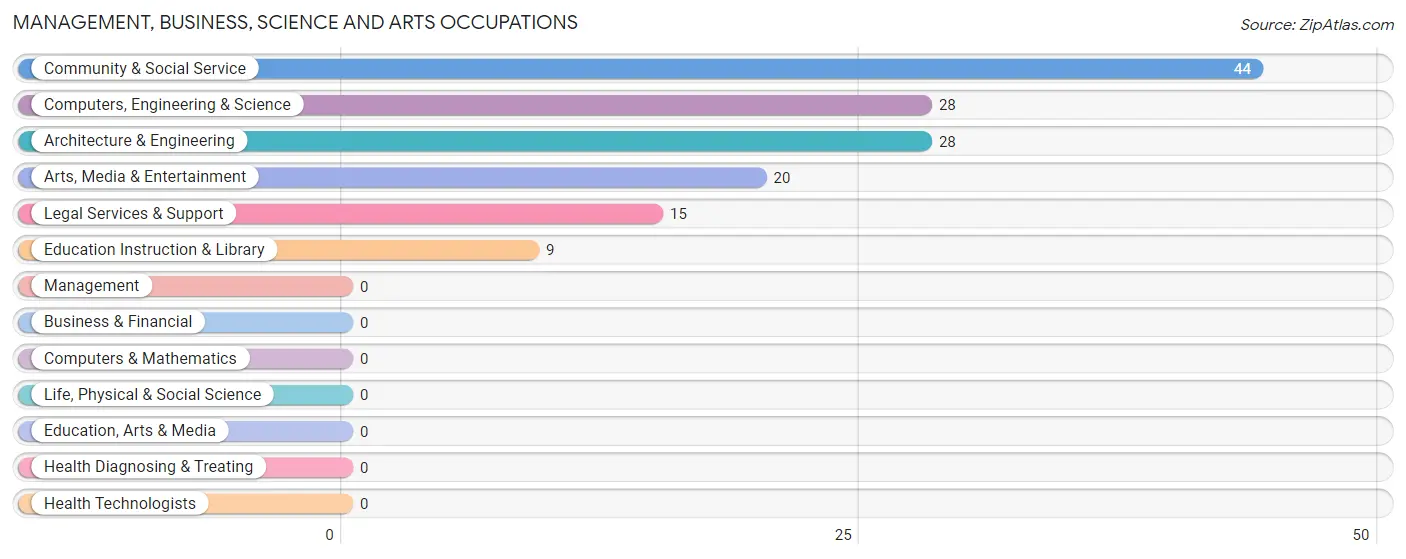
Management, Business, Science and Arts Occupations
The most common Management, Business, Science and Arts occupations in Truchas are Community & Social Service (44 | 59.5%), Computers, Engineering & Science (28 | 37.8%), Architecture & Engineering (28 | 37.8%), Arts, Media & Entertainment (20 | 27.0%), and Legal Services & Support (15 | 20.3%).
Management, Business, Science and Arts Occupations by Sex
Within the Management, Business, Science and Arts occupations in Truchas, the most male-oriented occupations are Education Instruction & Library (100.0%), Legal Services & Support (46.7%), and Community & Social Service (36.4%), while the most female-oriented occupations are Computers, Engineering & Science (100.0%), Architecture & Engineering (100.0%), and Arts, Media & Entertainment (100.0%).
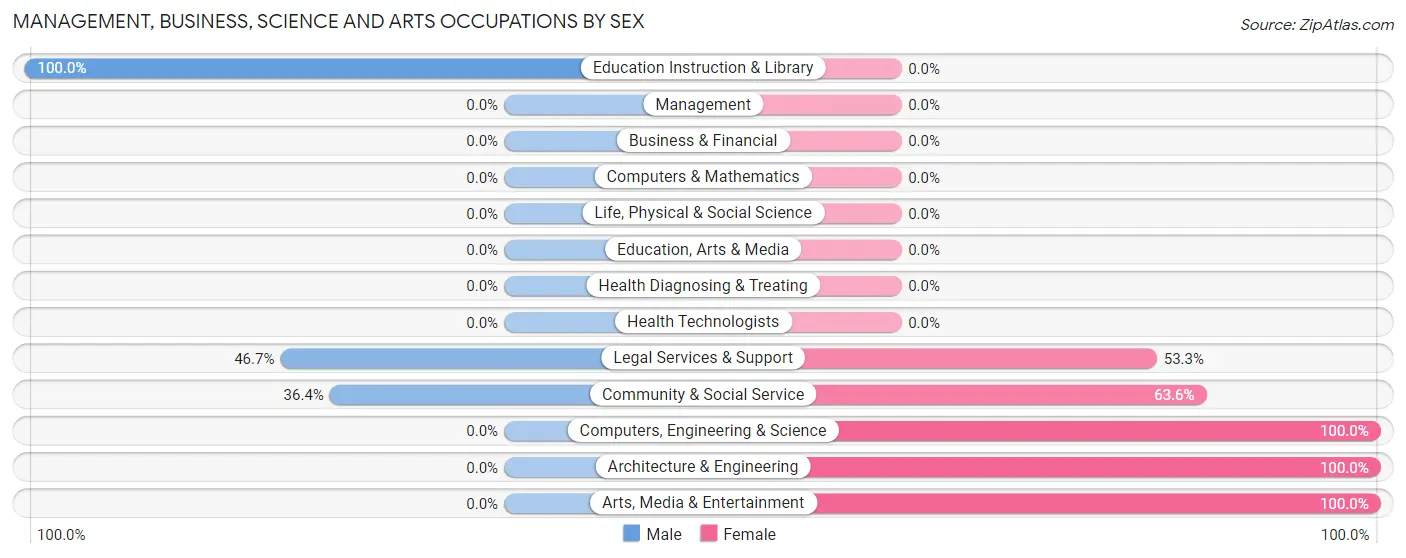
| Occupation | Male | Female |
| Management | 0 (0.0%) | 0 (0.0%) |
| Business & Financial | 0 (0.0%) | 0 (0.0%) |
| Computers, Engineering & Science | 0 (0.0%) | 28 (100.0%) |
| Computers & Mathematics | 0 (0.0%) | 0 (0.0%) |
| Architecture & Engineering | 0 (0.0%) | 28 (100.0%) |
| Life, Physical & Social Science | 0 (0.0%) | 0 (0.0%) |
| Community & Social Service | 16 (36.4%) | 28 (63.6%) |
| Education, Arts & Media | 0 (0.0%) | 0 (0.0%) |
| Legal Services & Support | 7 (46.7%) | 8 (53.3%) |
| Education Instruction & Library | 9 (100.0%) | 0 (0.0%) |
| Arts, Media & Entertainment | 0 (0.0%) | 20 (100.0%) |
| Health Diagnosing & Treating | 0 (0.0%) | 0 (0.0%) |
| Health Technologists | 0 (0.0%) | 0 (0.0%) |
| Total (Category) | 16 (22.2%) | 56 (77.8%) |
| Total (Overall) | 16 (21.6%) | 58 (78.4%) |
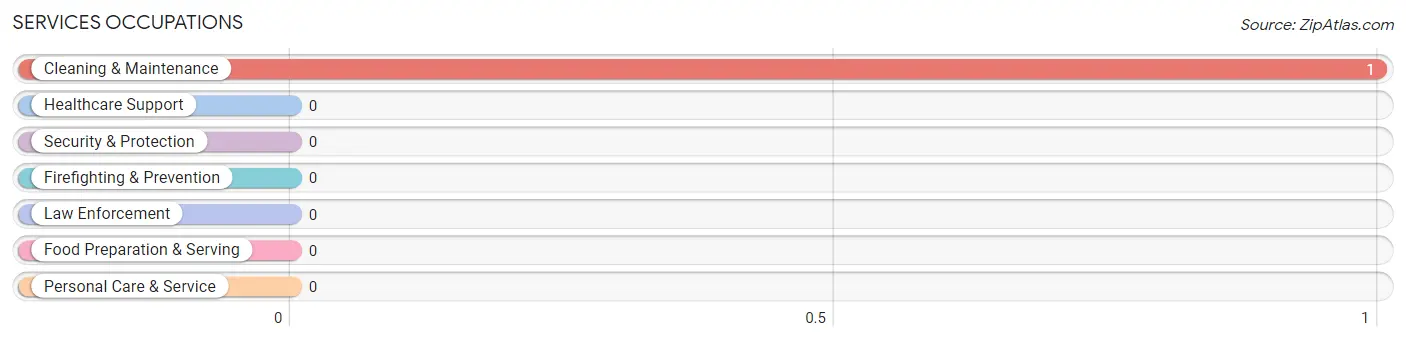
Services Occupations
The most common Services occupations in Truchas are , and Cleaning & Maintenance (1 | 1.3%).
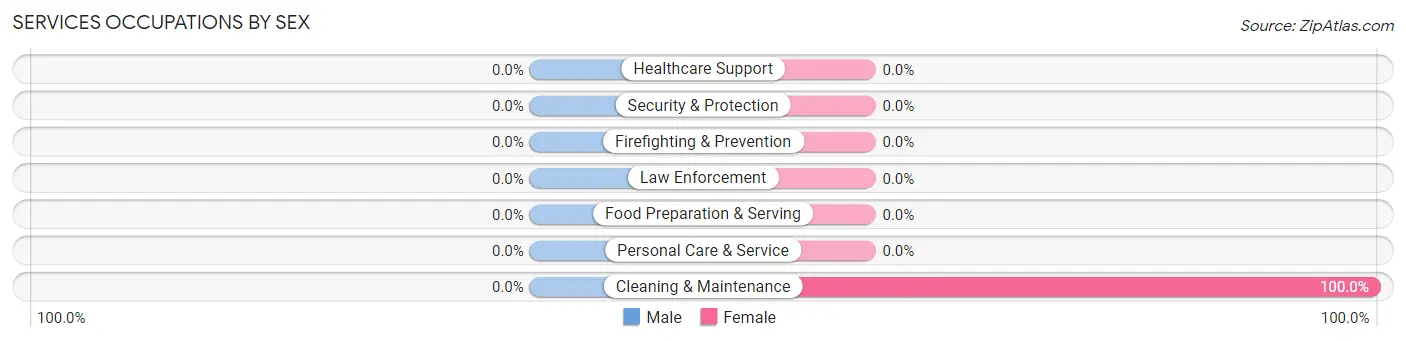
Services Occupations by Sex
| Occupation | Male | Female |
| Healthcare Support | 0 (0.0%) | 0 (0.0%) |
| Security & Protection | 0 (0.0%) | 0 (0.0%) |
| Firefighting & Prevention | 0 (0.0%) | 0 (0.0%) |
| Law Enforcement | 0 (0.0%) | 0 (0.0%) |
| Food Preparation & Serving | 0 (0.0%) | 0 (0.0%) |
| Cleaning & Maintenance | 0 (0.0%) | 1 (100.0%) |
| Personal Care & Service | 0 (0.0%) | 0 (0.0%) |
| Total (Category) | 0 (0.0%) | 1 (100.0%) |
| Total (Overall) | 16 (21.6%) | 58 (78.4%) |
Sales and Office Occupations
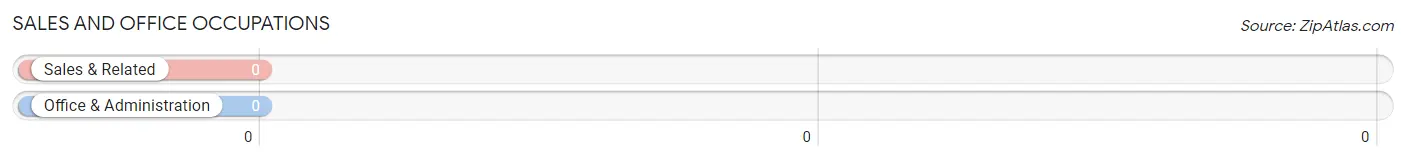
Sales and Office Occupations by Sex
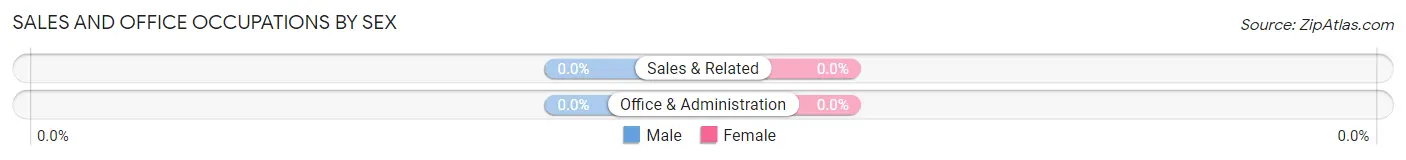
| Occupation | Male | Female |
| Sales & Related | 0 (0.0%) | 0 (0.0%) |
| Office & Administration | 0 (0.0%) | 0 (0.0%) |
| Total (Category) | 0 (0.0%) | 0 (0.0%) |
| Total (Overall) | 16 (21.6%) | 58 (78.4%) |
Natural Resources, Construction and Maintenance Occupations
The most common Natural Resources, Construction and Maintenance occupations in Truchas are , and Installation, Maintenance & Repair (1 | 1.3%).
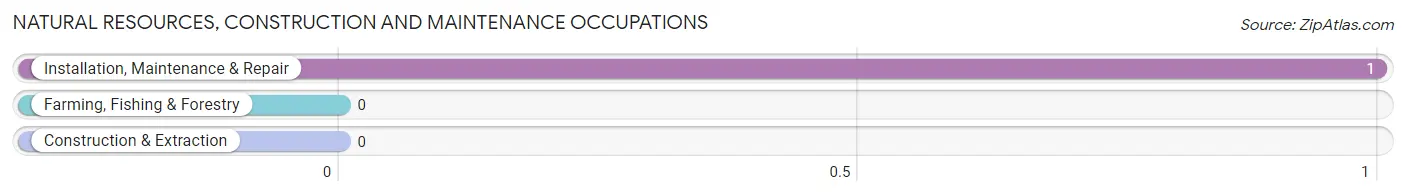
Natural Resources, Construction and Maintenance Occupations by Sex
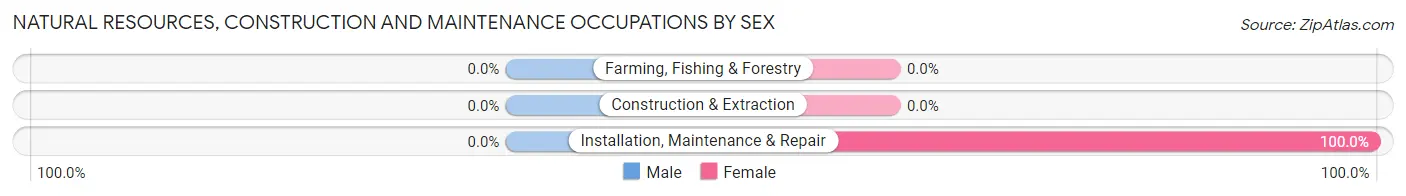
| Occupation | Male | Female |
| Farming, Fishing & Forestry | 0 (0.0%) | 0 (0.0%) |
| Construction & Extraction | 0 (0.0%) | 0 (0.0%) |
| Installation, Maintenance & Repair | 0 (0.0%) | 1 (100.0%) |
| Total (Category) | 0 (0.0%) | 1 (100.0%) |
| Total (Overall) | 16 (21.6%) | 58 (78.4%) |
Production, Transportation and Moving Occupations
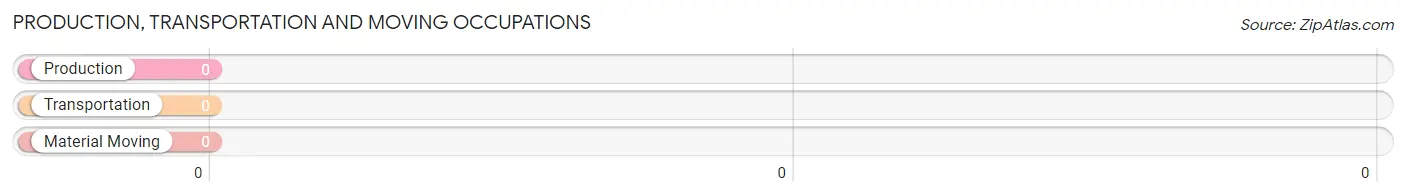
Production, Transportation and Moving Occupations by Sex
| Occupation | Male | Female |
| Production | 0 (0.0%) | 0 (0.0%) |
| Transportation | 0 (0.0%) | 0 (0.0%) |
| Material Moving | 0 (0.0%) | 0 (0.0%) |
| Total (Category) | 0 (0.0%) | 0 (0.0%) |
| Total (Overall) | 16 (21.6%) | 58 (78.4%) |
Employment Industries by Sex in Truchas
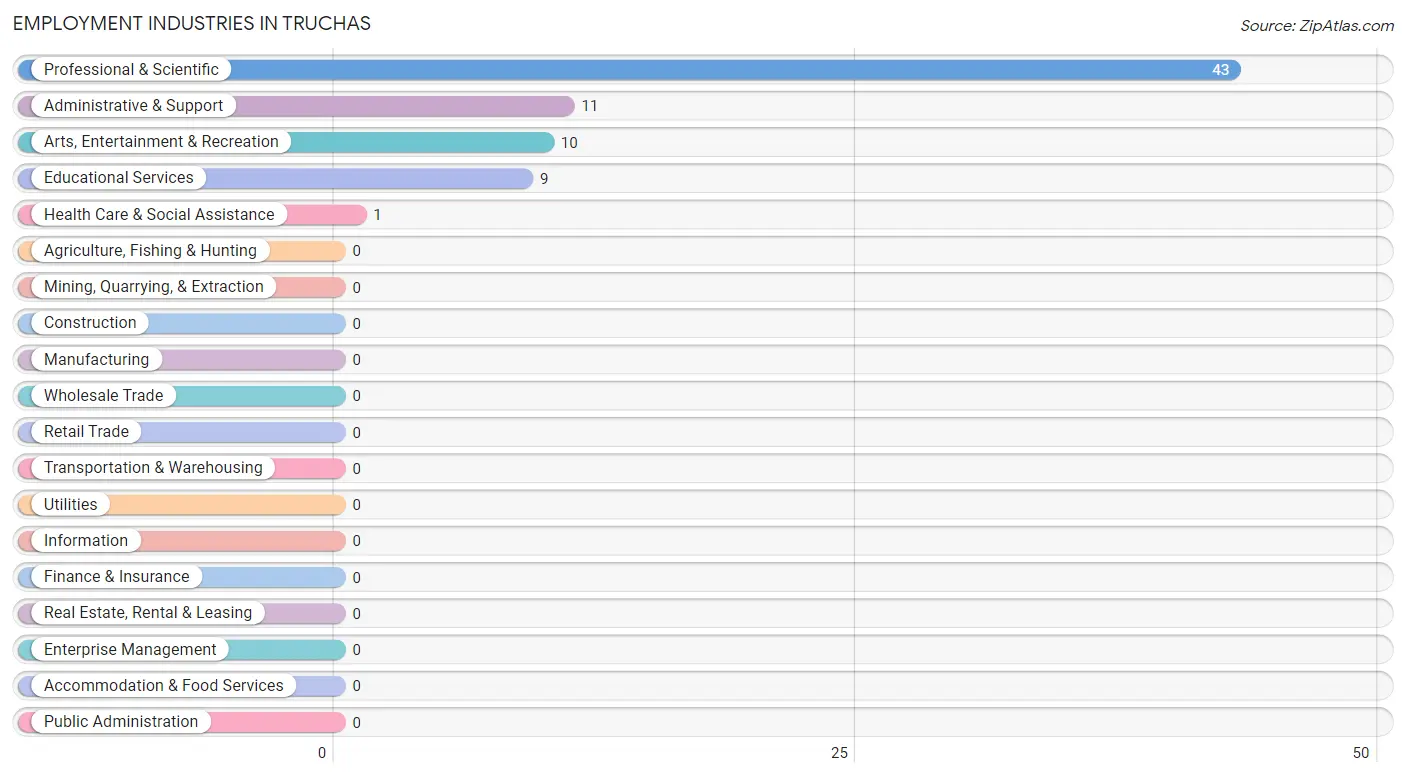
Employment Industries in Truchas
The major employment industries in Truchas include Professional & Scientific (43 | 58.1%), Administrative & Support (11 | 14.9%), Arts, Entertainment & Recreation (10 | 13.5%), Educational Services (9 | 12.2%), and Health Care & Social Assistance (1 | 1.3%).
Employment Industries by Sex in Truchas
The Truchas industries that see more men than women are Educational Services (100.0%), and Professional & Scientific (16.3%), whereas the industries that tend to have a higher number of women are Administrative & Support (100.0%), Health Care & Social Assistance (100.0%), and Arts, Entertainment & Recreation (100.0%).
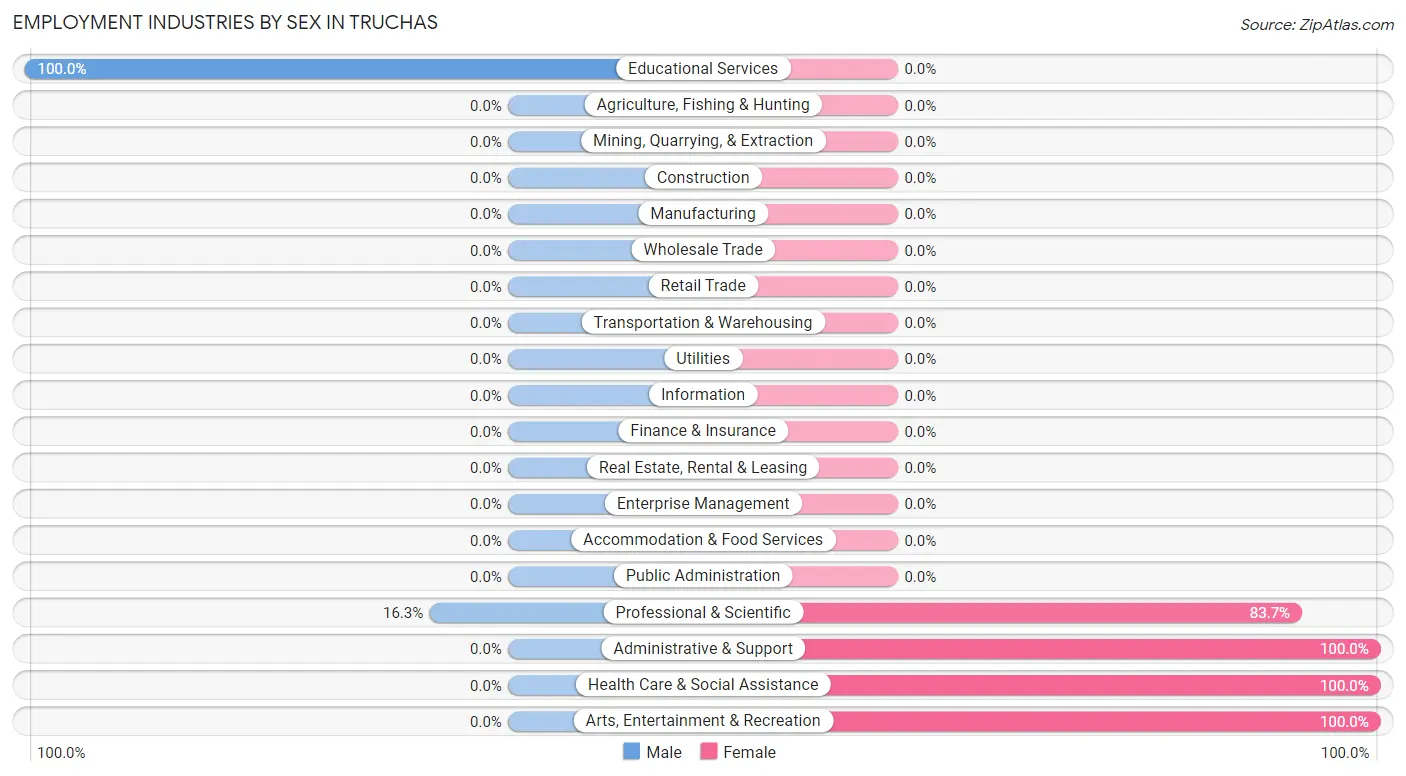
| Industry | Male | Female |
| Agriculture, Fishing & Hunting | 0 (0.0%) | 0 (0.0%) |
| Mining, Quarrying, & Extraction | 0 (0.0%) | 0 (0.0%) |
| Construction | 0 (0.0%) | 0 (0.0%) |
| Manufacturing | 0 (0.0%) | 0 (0.0%) |
| Wholesale Trade | 0 (0.0%) | 0 (0.0%) |
| Retail Trade | 0 (0.0%) | 0 (0.0%) |
| Transportation & Warehousing | 0 (0.0%) | 0 (0.0%) |
| Utilities | 0 (0.0%) | 0 (0.0%) |
| Information | 0 (0.0%) | 0 (0.0%) |
| Finance & Insurance | 0 (0.0%) | 0 (0.0%) |
| Real Estate, Rental & Leasing | 0 (0.0%) | 0 (0.0%) |
| Professional & Scientific | 7 (16.3%) | 36 (83.7%) |
| Enterprise Management | 0 (0.0%) | 0 (0.0%) |
| Administrative & Support | 0 (0.0%) | 11 (100.0%) |
| Educational Services | 9 (100.0%) | 0 (0.0%) |
| Health Care & Social Assistance | 0 (0.0%) | 1 (100.0%) |
| Arts, Entertainment & Recreation | 0 (0.0%) | 10 (100.0%) |
| Accommodation & Food Services | 0 (0.0%) | 0 (0.0%) |
| Public Administration | 0 (0.0%) | 0 (0.0%) |
| Total | 16 (21.6%) | 58 (78.4%) |
Education in Truchas
School Enrollment in Truchas
The most common levels of schooling among the 53 students in Truchas are middle school (35 | 66.0%), graduate / professional (16 | 30.2%), and high school (2 | 3.8%).
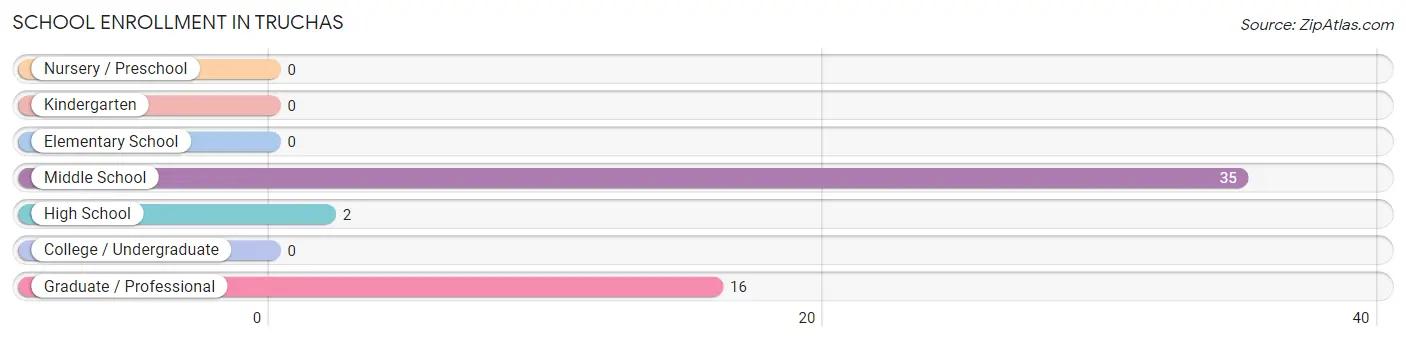
| School Level | # Students | % Students |
| Nursery / Preschool | 0 | 0.0% |
| Kindergarten | 0 | 0.0% |
| Elementary School | 0 | 0.0% |
| Middle School | 35 | 66.0% |
| High School | 2 | 3.8% |
| College / Undergraduate | 0 | 0.0% |
| Graduate / Professional | 16 | 30.2% |
| Total | 53 | 100.0% |
School Enrollment by Age by Funding Source in Truchas
Out of a total of 53 students who are enrolled in schools in Truchas, 1 (1.9%) attend a private institution, while the remaining 52 (98.1%) are enrolled in public schools. The age group of 15 to 17 year olds has the highest likelihood of being enrolled in private schools, with 1 (50.0% in the age bracket) enrolled. Conversely, the age group of 10 to 14 year olds has the lowest likelihood of being enrolled in a private school, with 35 (100.0% in the age bracket) attending a public institution.
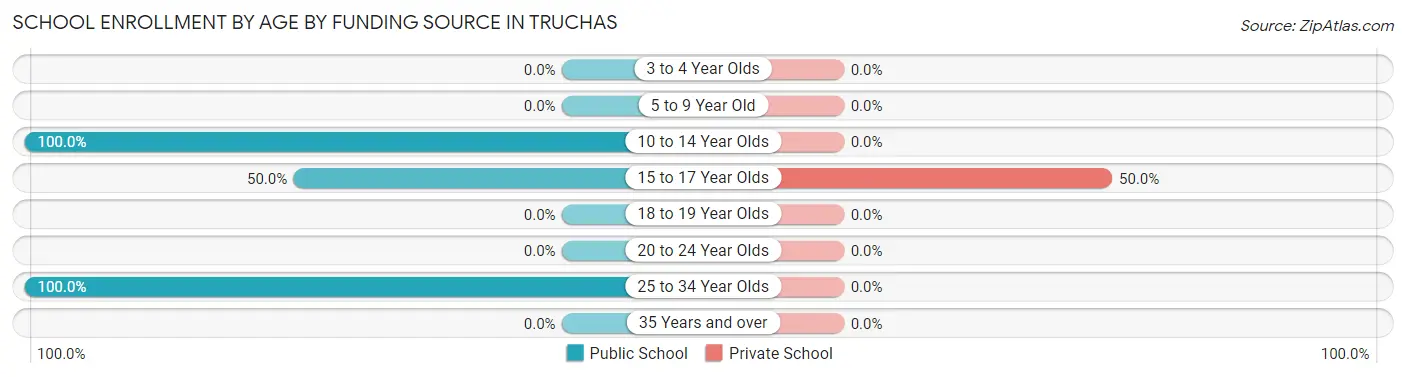
| Age Bracket | Public School | Private School |
| 3 to 4 Year Olds | 0 (0.0%) | 0 (0.0%) |
| 5 to 9 Year Old | 0 (0.0%) | 0 (0.0%) |
| 10 to 14 Year Olds | 35 (100.0%) | 0 (0.0%) |
| 15 to 17 Year Olds | 1 (50.0%) | 1 (50.0%) |
| 18 to 19 Year Olds | 0 (0.0%) | 0 (0.0%) |
| 20 to 24 Year Olds | 0 (0.0%) | 0 (0.0%) |
| 25 to 34 Year Olds | 16 (100.0%) | 0 (0.0%) |
| 35 Years and over | 0 (0.0%) | 0 (0.0%) |
| Total | 52 (98.1%) | 1 (1.9%) |
Educational Attainment by Field of Study in Truchas
Visual & performing arts (48 | 36.1%), business (34 | 25.6%), bio, nature & agricultural (28 | 21.0%), and social sciences (23 | 17.3%) are the most common fields of study among 133 individuals in Truchas who have obtained a bachelor's degree or higher.
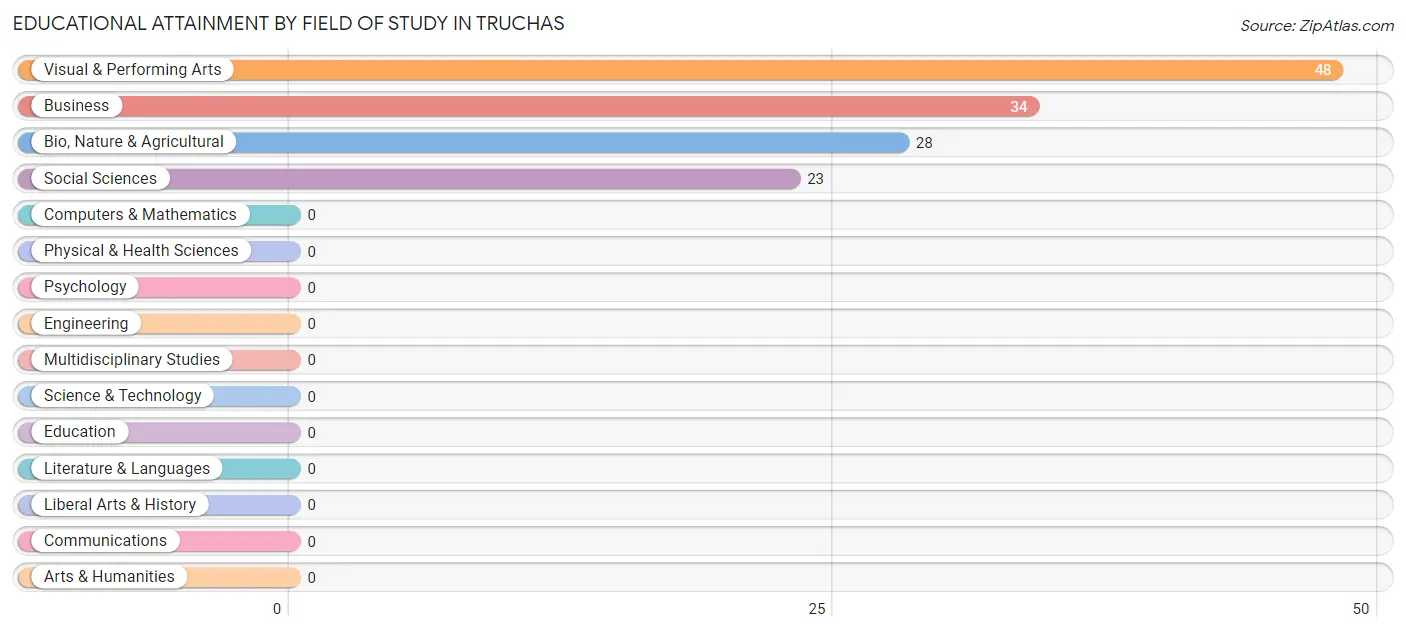
| Field of Study | # Graduates | % Graduates |
| Computers & Mathematics | 0 | 0.0% |
| Bio, Nature & Agricultural | 28 | 21.0% |
| Physical & Health Sciences | 0 | 0.0% |
| Psychology | 0 | 0.0% |
| Social Sciences | 23 | 17.3% |
| Engineering | 0 | 0.0% |
| Multidisciplinary Studies | 0 | 0.0% |
| Science & Technology | 0 | 0.0% |
| Business | 34 | 25.6% |
| Education | 0 | 0.0% |
| Literature & Languages | 0 | 0.0% |
| Liberal Arts & History | 0 | 0.0% |
| Visual & Performing Arts | 48 | 36.1% |
| Communications | 0 | 0.0% |
| Arts & Humanities | 0 | 0.0% |
| Total | 133 | 100.0% |
Transportation & Commute in Truchas
Vehicle Availability by Sex in Truchas
The most prevalent vehicle ownership categories in Truchas are males with 2 vehicles (9, accounting for 56.2%) and females with 2 vehicles (7, making up 16.4%).
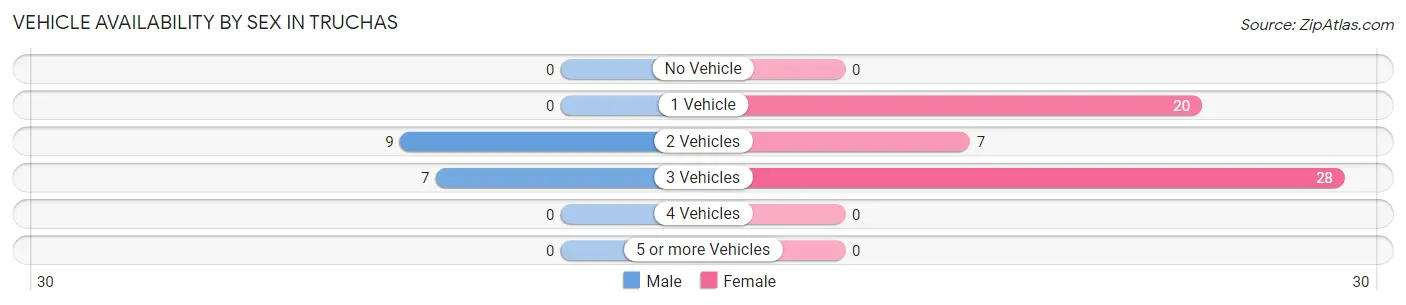
| Vehicles Available | Male | Female |
| No Vehicle | 0 (0.0%) | 0 (0.0%) |
| 1 Vehicle | 0 (0.0%) | 20 (36.4%) |
| 2 Vehicles | 9 (56.2%) | 7 (12.7%) |
| 3 Vehicles | 7 (43.8%) | 28 (50.9%) |
| 4 Vehicles | 0 (0.0%) | 0 (0.0%) |
| 5 or more Vehicles | 0 (0.0%) | 0 (0.0%) |
| Total | 16 (100.0%) | 55 (100.0%) |
Commute Time in Truchas
The most frequently occuring commute durations in Truchas are 30 to 34 minutes (28 commuters, 73.7%), 45 to 59 minutes (7 commuters, 18.4%), and less than 5 minutes (1 commuters, 2.6%).
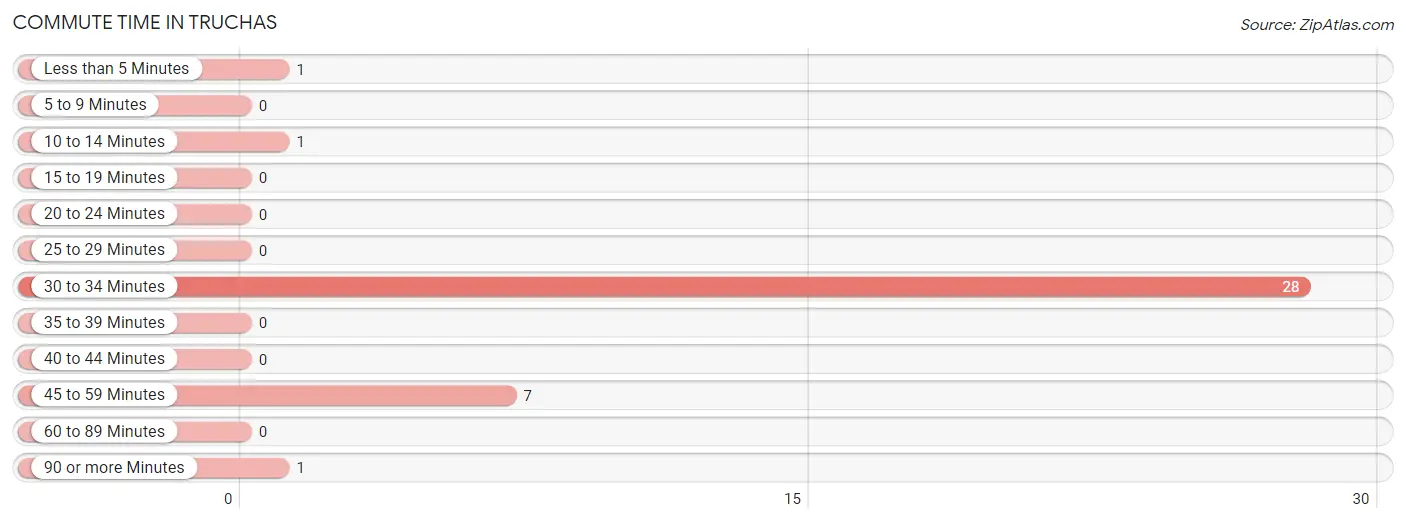
| Commute Time | # Commuters | % Commuters |
| Less than 5 Minutes | 1 | 2.6% |
| 5 to 9 Minutes | 0 | 0.0% |
| 10 to 14 Minutes | 1 | 2.6% |
| 15 to 19 Minutes | 0 | 0.0% |
| 20 to 24 Minutes | 0 | 0.0% |
| 25 to 29 Minutes | 0 | 0.0% |
| 30 to 34 Minutes | 28 | 73.7% |
| 35 to 39 Minutes | 0 | 0.0% |
| 40 to 44 Minutes | 0 | 0.0% |
| 45 to 59 Minutes | 7 | 18.4% |
| 60 to 89 Minutes | 0 | 0.0% |
| 90 or more Minutes | 1 | 2.6% |
Commute Time by Sex in Truchas
The most common commute times in Truchas are 45 to 59 minutes (7 commuters, 100.0%) for males and 30 to 34 minutes (28 commuters, 90.3%) for females.
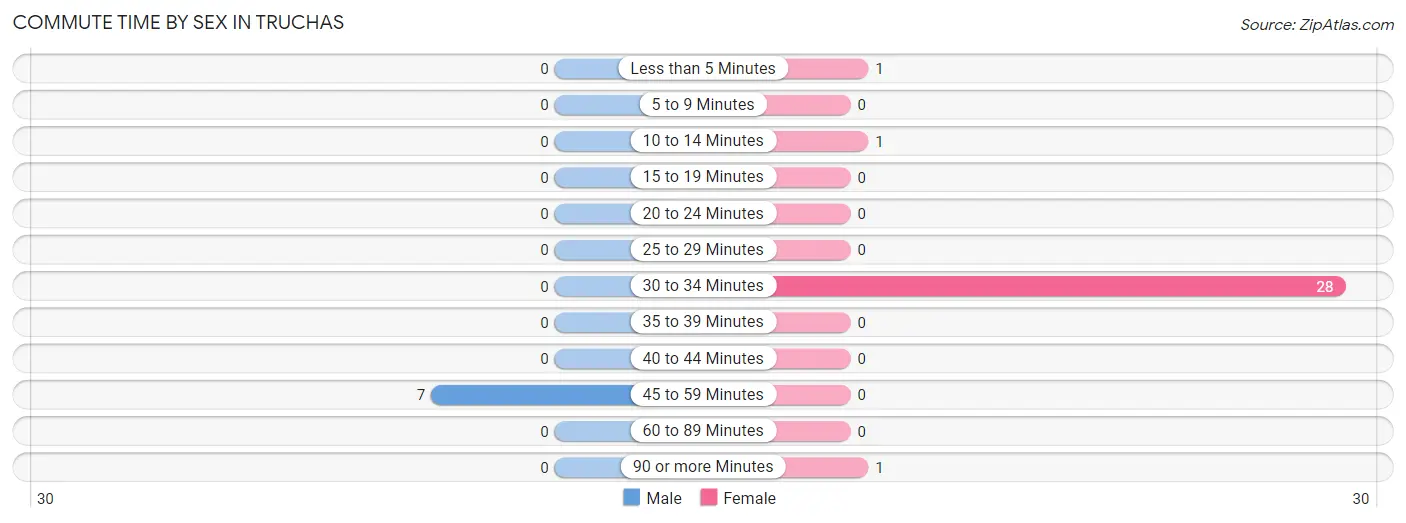
| Commute Time | Male | Female |
| Less than 5 Minutes | 0 (0.0%) | 1 (3.2%) |
| 5 to 9 Minutes | 0 (0.0%) | 0 (0.0%) |
| 10 to 14 Minutes | 0 (0.0%) | 1 (3.2%) |
| 15 to 19 Minutes | 0 (0.0%) | 0 (0.0%) |
| 20 to 24 Minutes | 0 (0.0%) | 0 (0.0%) |
| 25 to 29 Minutes | 0 (0.0%) | 0 (0.0%) |
| 30 to 34 Minutes | 0 (0.0%) | 28 (90.3%) |
| 35 to 39 Minutes | 0 (0.0%) | 0 (0.0%) |
| 40 to 44 Minutes | 0 (0.0%) | 0 (0.0%) |
| 45 to 59 Minutes | 7 (100.0%) | 0 (0.0%) |
| 60 to 89 Minutes | 0 (0.0%) | 0 (0.0%) |
| 90 or more Minutes | 0 (0.0%) | 1 (3.2%) |
Time of Departure to Work by Sex in Truchas
The most frequent times of departure to work in Truchas are 7:00 AM to 7:29 AM (7, 100.0%) for males and 5:00 AM to 5:29 AM (28, 90.3%) for females.
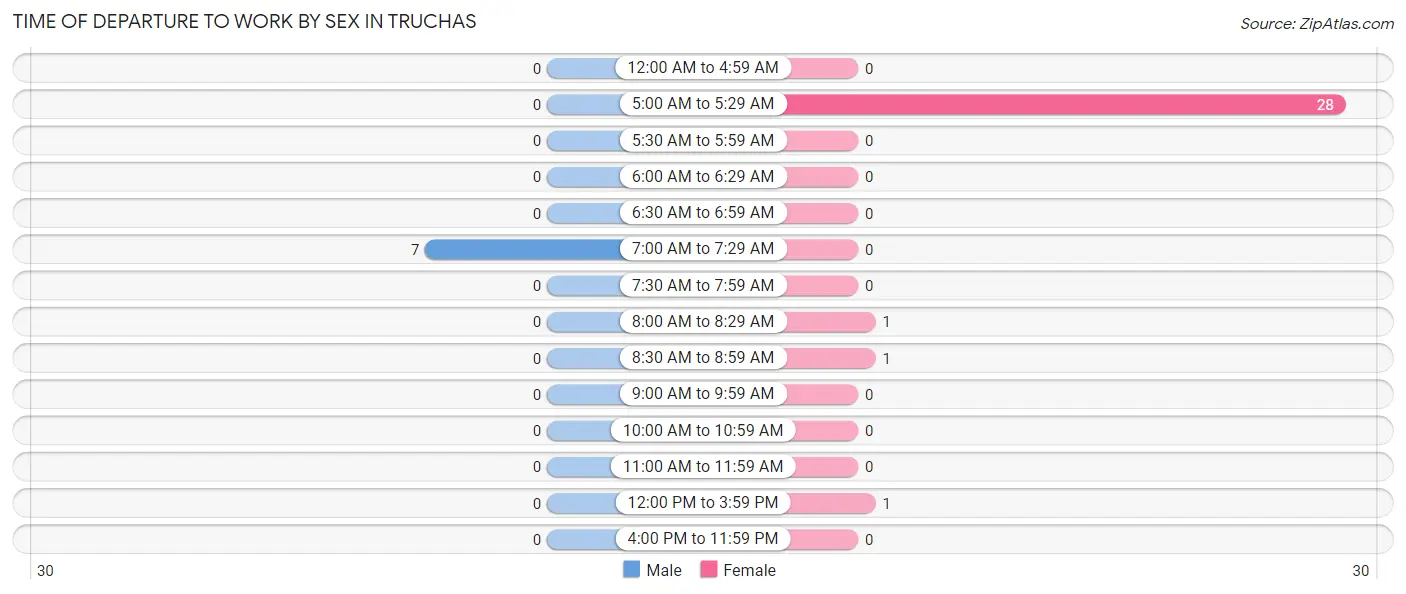
| Time of Departure | Male | Female |
| 12:00 AM to 4:59 AM | 0 (0.0%) | 0 (0.0%) |
| 5:00 AM to 5:29 AM | 0 (0.0%) | 28 (90.3%) |
| 5:30 AM to 5:59 AM | 0 (0.0%) | 0 (0.0%) |
| 6:00 AM to 6:29 AM | 0 (0.0%) | 0 (0.0%) |
| 6:30 AM to 6:59 AM | 0 (0.0%) | 0 (0.0%) |
| 7:00 AM to 7:29 AM | 7 (100.0%) | 0 (0.0%) |
| 7:30 AM to 7:59 AM | 0 (0.0%) | 0 (0.0%) |
| 8:00 AM to 8:29 AM | 0 (0.0%) | 1 (3.2%) |
| 8:30 AM to 8:59 AM | 0 (0.0%) | 1 (3.2%) |
| 9:00 AM to 9:59 AM | 0 (0.0%) | 0 (0.0%) |
| 10:00 AM to 10:59 AM | 0 (0.0%) | 0 (0.0%) |
| 11:00 AM to 11:59 AM | 0 (0.0%) | 0 (0.0%) |
| 12:00 PM to 3:59 PM | 0 (0.0%) | 1 (3.2%) |
| 4:00 PM to 11:59 PM | 0 (0.0%) | 0 (0.0%) |
| Total | 7 (100.0%) | 31 (100.0%) |
Housing Occupancy in Truchas
Occupancy by Ownership in Truchas
Of the total 133 dwellings in Truchas, owner-occupied units account for 75 (56.4%), while renter-occupied units make up 58 (43.6%).
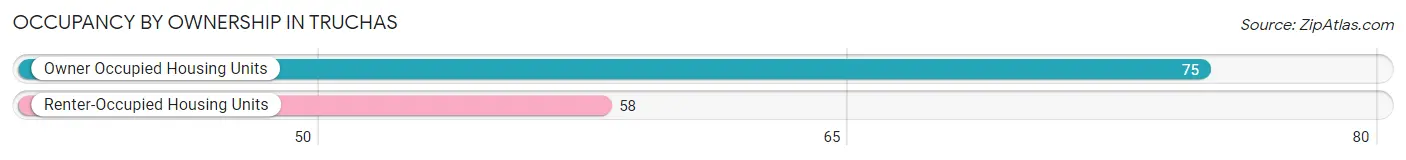
| Occupancy | # Housing Units | % Housing Units |
| Owner Occupied Housing Units | 75 | 56.4% |
| Renter-Occupied Housing Units | 58 | 43.6% |
| Total Occupied Housing Units | 133 | 100.0% |
Occupancy by Household Size in Truchas
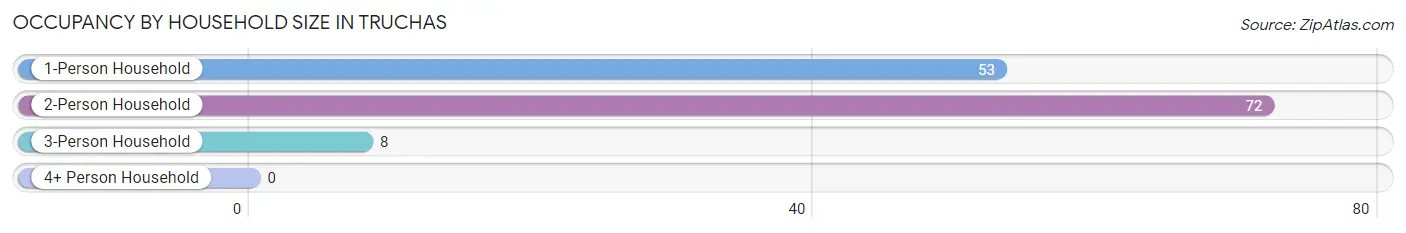
| Household Size | # Housing Units | % Housing Units |
| 1-Person Household | 53 | 39.9% |
| 2-Person Household | 72 | 54.1% |
| 3-Person Household | 8 | 6.0% |
| 4+ Person Household | 0 | 0.0% |
| Total Housing Units | 133 | 100.0% |
Occupancy by Ownership by Household Size in Truchas
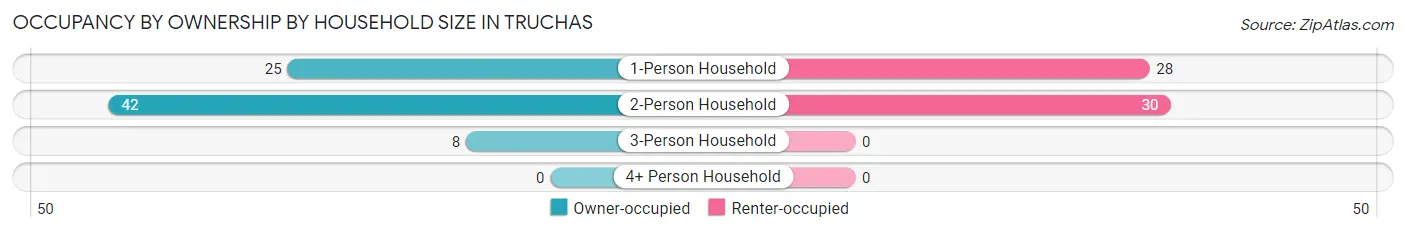
| Household Size | Owner-occupied | Renter-occupied |
| 1-Person Household | 25 (47.2%) | 28 (52.8%) |
| 2-Person Household | 42 (58.3%) | 30 (41.7%) |
| 3-Person Household | 8 (100.0%) | 0 (0.0%) |
| 4+ Person Household | 0 (0.0%) | 0 (0.0%) |
| Total Housing Units | 75 (56.4%) | 58 (43.6%) |
Occupancy by Educational Attainment in Truchas
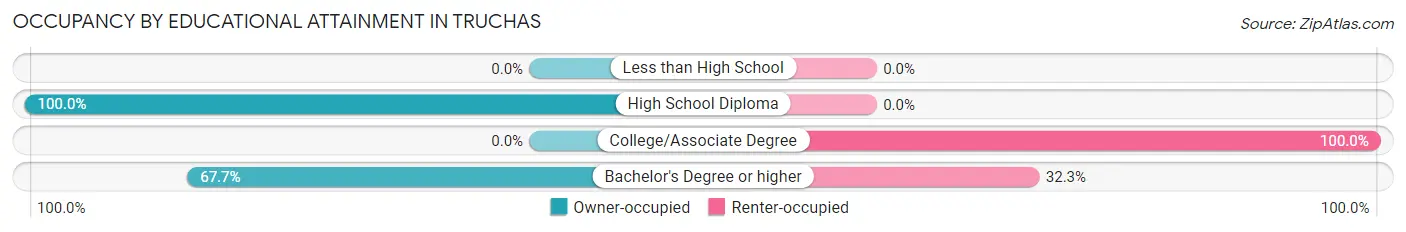
| Household Size | Owner-occupied | Renter-occupied |
| Less than High School | 0 (0.0%) | 0 (0.0%) |
| High School Diploma | 33 (100.0%) | 0 (0.0%) |
| College/Associate Degree | 0 (0.0%) | 38 (100.0%) |
| Bachelor's Degree or higher | 42 (67.7%) | 20 (32.3%) |
Occupancy by Age of Householder in Truchas
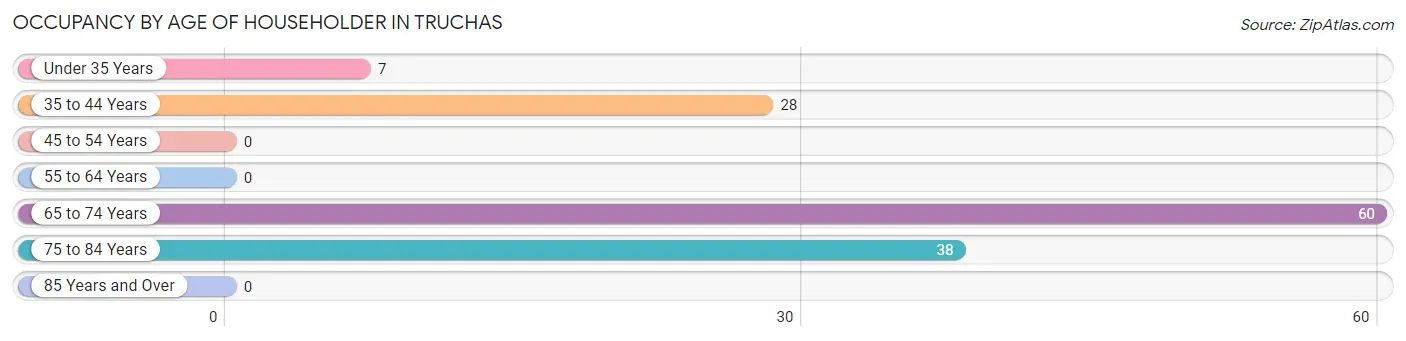
| Age Bracket | # Households | % Households |
| Under 35 Years | 7 | 5.3% |
| 35 to 44 Years | 28 | 21.0% |
| 45 to 54 Years | 0 | 0.0% |
| 55 to 64 Years | 0 | 0.0% |
| 65 to 74 Years | 60 | 45.1% |
| 75 to 84 Years | 38 | 28.6% |
| 85 Years and Over | 0 | 0.0% |
| Total | 133 | 100.0% |
Housing Finances in Truchas
Median Income by Occupancy in Truchas
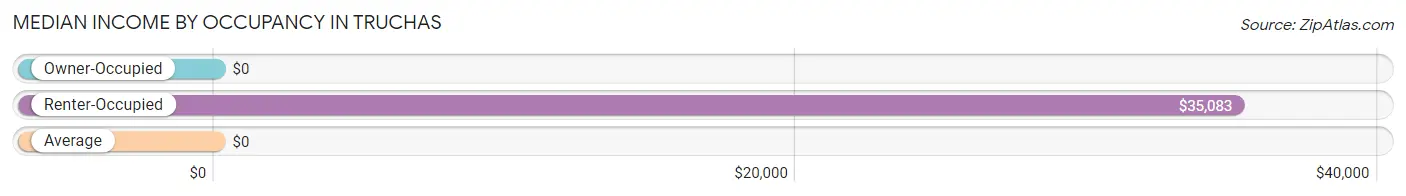
| Occupancy Type | # Households | Median Income |
| Owner-Occupied | 75 (56.4%) | $0 |
| Renter-Occupied | 58 (43.6%) | $35,083 |
| Average | 133 (100.0%) | $0 |
Occupancy by Householder Income Bracket in Truchas
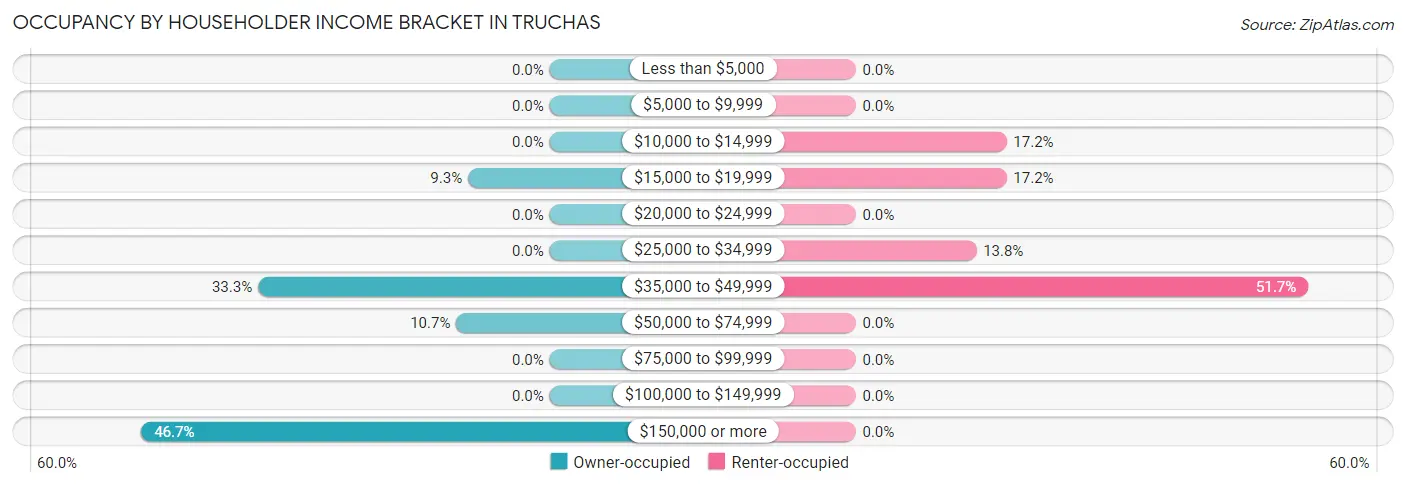
| Income Bracket | Owner-occupied | Renter-occupied |
| Less than $5,000 | 0 (0.0%) | 0 (0.0%) |
| $5,000 to $9,999 | 0 (0.0%) | 0 (0.0%) |
| $10,000 to $14,999 | 0 (0.0%) | 10 (17.2%) |
| $15,000 to $19,999 | 7 (9.3%) | 10 (17.2%) |
| $20,000 to $24,999 | 0 (0.0%) | 0 (0.0%) |
| $25,000 to $34,999 | 0 (0.0%) | 8 (13.8%) |
| $35,000 to $49,999 | 25 (33.3%) | 30 (51.7%) |
| $50,000 to $74,999 | 8 (10.7%) | 0 (0.0%) |
| $75,000 to $99,999 | 0 (0.0%) | 0 (0.0%) |
| $100,000 to $149,999 | 0 (0.0%) | 0 (0.0%) |
| $150,000 or more | 35 (46.7%) | 0 (0.0%) |
| Total | 75 (100.0%) | 58 (100.0%) |
Monthly Housing Cost Tiers in Truchas
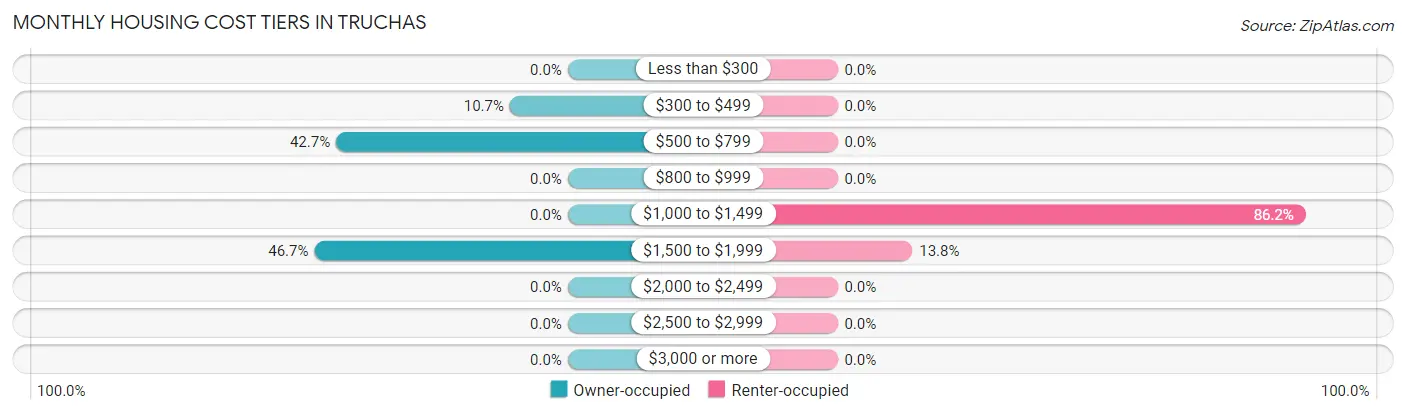
| Monthly Cost | Owner-occupied | Renter-occupied |
| Less than $300 | 0 (0.0%) | 0 (0.0%) |
| $300 to $499 | 8 (10.7%) | 0 (0.0%) |
| $500 to $799 | 32 (42.7%) | 0 (0.0%) |
| $800 to $999 | 0 (0.0%) | 0 (0.0%) |
| $1,000 to $1,499 | 0 (0.0%) | 50 (86.2%) |
| $1,500 to $1,999 | 35 (46.7%) | 8 (13.8%) |
| $2,000 to $2,499 | 0 (0.0%) | 0 (0.0%) |
| $2,500 to $2,999 | 0 (0.0%) | 0 (0.0%) |
| $3,000 or more | 0 (0.0%) | 0 (0.0%) |
| Total | 75 (100.0%) | 58 (100.0%) |
Physical Housing Characteristics in Truchas
Housing Structures in Truchas
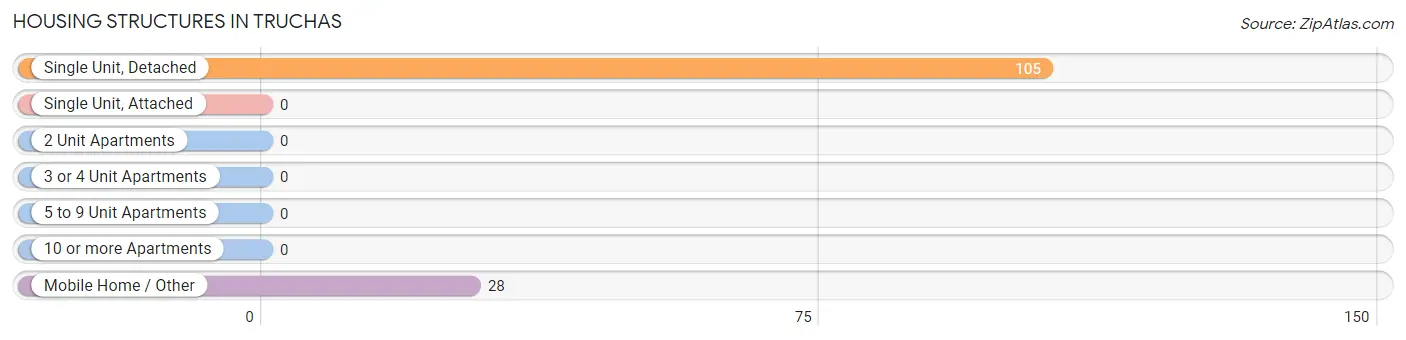
| Structure Type | # Housing Units | % Housing Units |
| Single Unit, Detached | 105 | 78.9% |
| Single Unit, Attached | 0 | 0.0% |
| 2 Unit Apartments | 0 | 0.0% |
| 3 or 4 Unit Apartments | 0 | 0.0% |
| 5 to 9 Unit Apartments | 0 | 0.0% |
| 10 or more Apartments | 0 | 0.0% |
| Mobile Home / Other | 28 | 21.0% |
| Total | 133 | 100.0% |
Housing Structures by Occupancy in Truchas
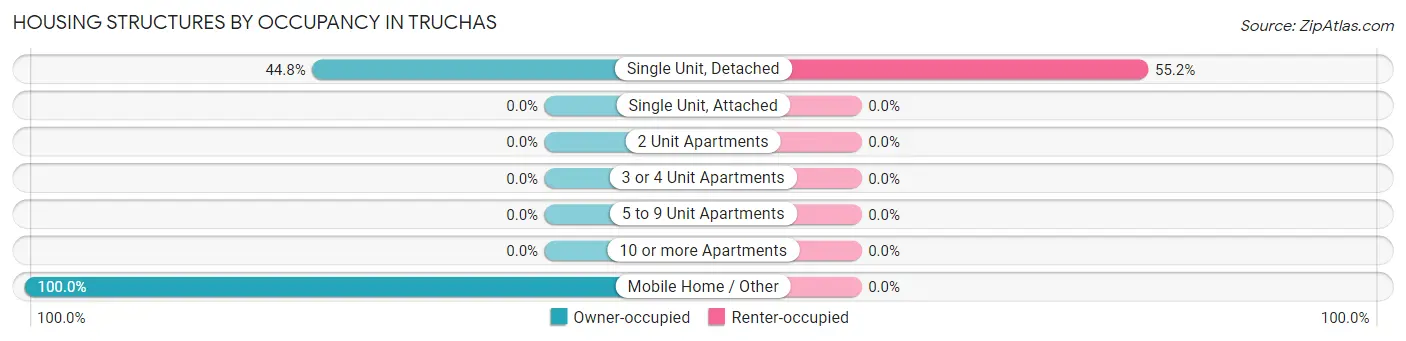
| Structure Type | Owner-occupied | Renter-occupied |
| Single Unit, Detached | 47 (44.8%) | 58 (55.2%) |
| Single Unit, Attached | 0 (0.0%) | 0 (0.0%) |
| 2 Unit Apartments | 0 (0.0%) | 0 (0.0%) |
| 3 or 4 Unit Apartments | 0 (0.0%) | 0 (0.0%) |
| 5 to 9 Unit Apartments | 0 (0.0%) | 0 (0.0%) |
| 10 or more Apartments | 0 (0.0%) | 0 (0.0%) |
| Mobile Home / Other | 28 (100.0%) | 0 (0.0%) |
| Total | 75 (56.4%) | 58 (43.6%) |
Housing Structures by Number of Rooms in Truchas
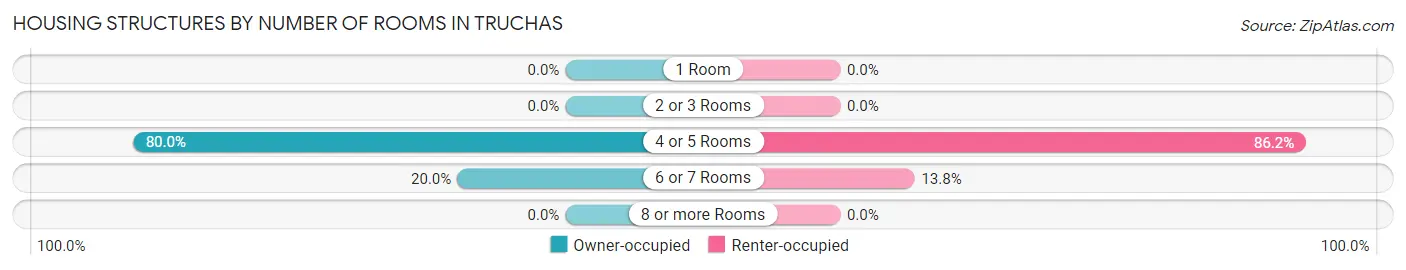
| Number of Rooms | Owner-occupied | Renter-occupied |
| 1 Room | 0 (0.0%) | 0 (0.0%) |
| 2 or 3 Rooms | 0 (0.0%) | 0 (0.0%) |
| 4 or 5 Rooms | 60 (80.0%) | 50 (86.2%) |
| 6 or 7 Rooms | 15 (20.0%) | 8 (13.8%) |
| 8 or more Rooms | 0 (0.0%) | 0 (0.0%) |
| Total | 75 (100.0%) | 58 (100.0%) |
Housing Structure by Heating Type in Truchas
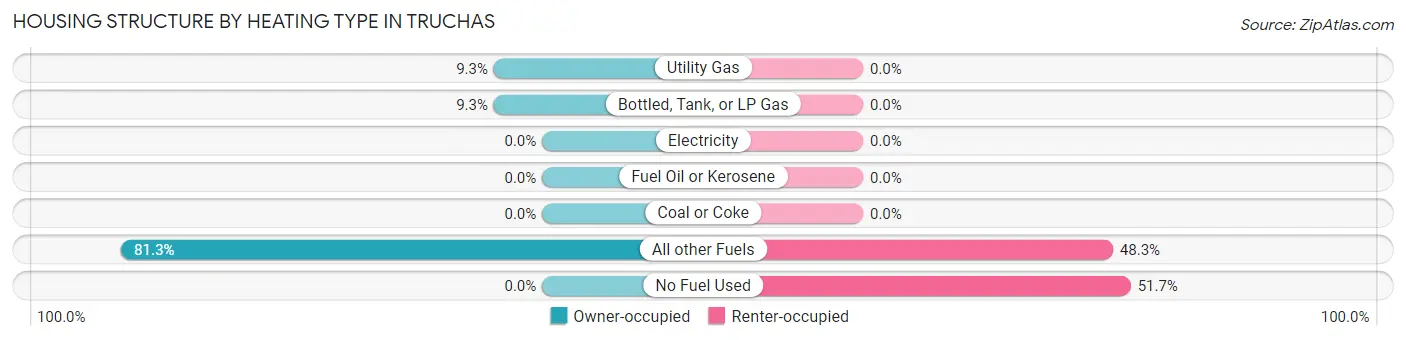
| Heating Type | Owner-occupied | Renter-occupied |
| Utility Gas | 7 (9.3%) | 0 (0.0%) |
| Bottled, Tank, or LP Gas | 7 (9.3%) | 0 (0.0%) |
| Electricity | 0 (0.0%) | 0 (0.0%) |
| Fuel Oil or Kerosene | 0 (0.0%) | 0 (0.0%) |
| Coal or Coke | 0 (0.0%) | 0 (0.0%) |
| All other Fuels | 61 (81.3%) | 28 (48.3%) |
| No Fuel Used | 0 (0.0%) | 30 (51.7%) |
| Total | 75 (100.0%) | 58 (100.0%) |
Household Vehicle Usage in Truchas
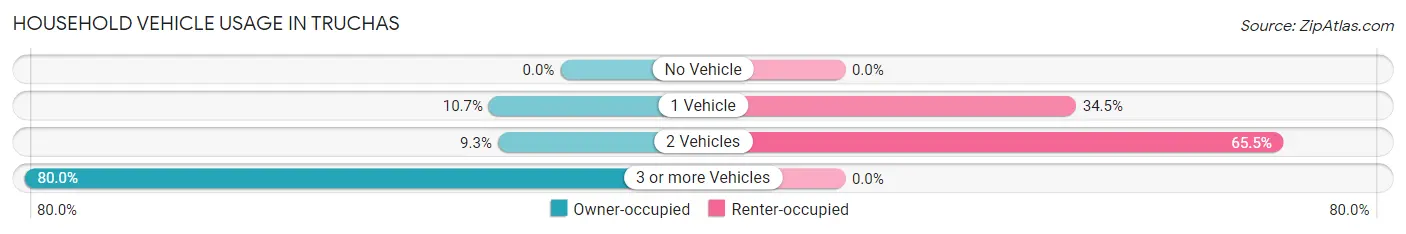
| Vehicles per Household | Owner-occupied | Renter-occupied |
| No Vehicle | 0 (0.0%) | 0 (0.0%) |
| 1 Vehicle | 8 (10.7%) | 20 (34.5%) |
| 2 Vehicles | 7 (9.3%) | 38 (65.5%) |
| 3 or more Vehicles | 60 (80.0%) | 0 (0.0%) |
| Total | 75 (100.0%) | 58 (100.0%) |
Real Estate & Mortgages in Truchas
Real Estate and Mortgage Overview in Truchas
| Characteristic | Without Mortgage | With Mortgage |
| Housing Units | 33 | 42 |
| Median Property Value | - | - |
| Median Household Income | - | - |
| Monthly Housing Costs | - | - |
| Real Estate Taxes | - | - |
Property Value by Mortgage Status in Truchas
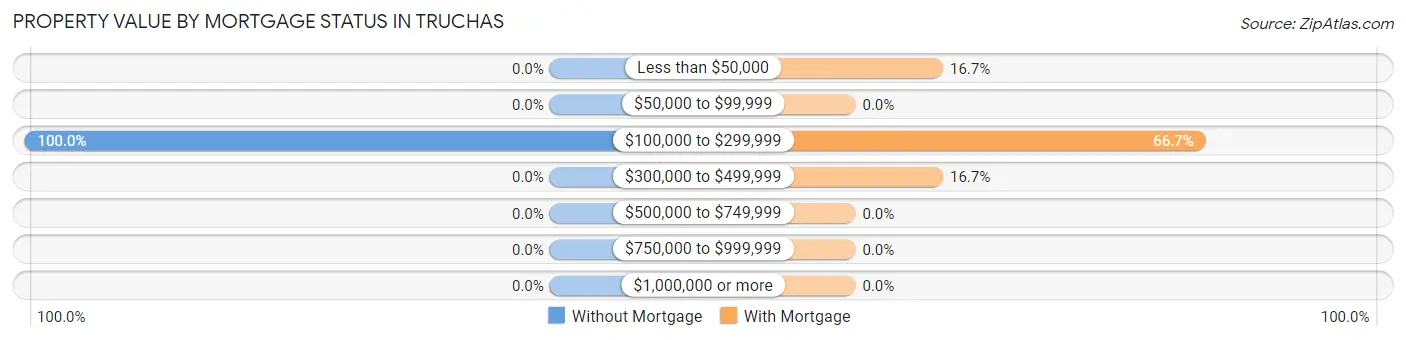
| Property Value | Without Mortgage | With Mortgage |
| Less than $50,000 | 0 (0.0%) | 7 (16.7%) |
| $50,000 to $99,999 | 0 (0.0%) | 0 (0.0%) |
| $100,000 to $299,999 | 33 (100.0%) | 28 (66.7%) |
| $300,000 to $499,999 | 0 (0.0%) | 7 (16.7%) |
| $500,000 to $749,999 | 0 (0.0%) | 0 (0.0%) |
| $750,000 to $999,999 | 0 (0.0%) | 0 (0.0%) |
| $1,000,000 or more | 0 (0.0%) | 0 (0.0%) |
| Total | 33 (100.0%) | 42 (100.0%) |
Household Income by Mortgage Status in Truchas
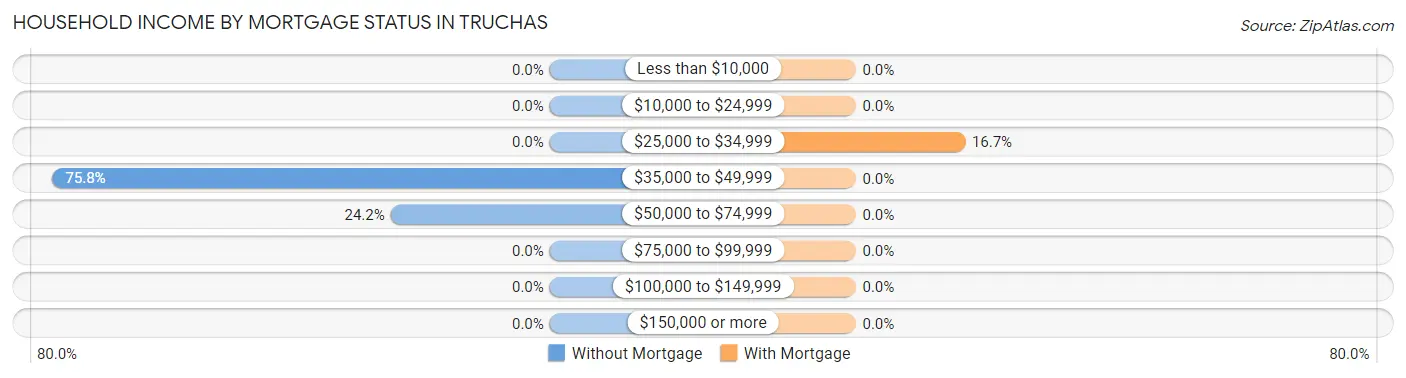
| Household Income | Without Mortgage | With Mortgage |
| Less than $10,000 | 0 (0.0%) | 0 (0.0%) |
| $10,000 to $24,999 | 0 (0.0%) | 0 (0.0%) |
| $25,000 to $34,999 | 0 (0.0%) | 7 (16.7%) |
| $35,000 to $49,999 | 25 (75.8%) | 0 (0.0%) |
| $50,000 to $74,999 | 8 (24.2%) | 0 (0.0%) |
| $75,000 to $99,999 | 0 (0.0%) | 0 (0.0%) |
| $100,000 to $149,999 | 0 (0.0%) | 0 (0.0%) |
| $150,000 or more | 0 (0.0%) | 0 (0.0%) |
| Total | 33 (100.0%) | 42 (100.0%) |
Property Value to Household Income Ratio in Truchas
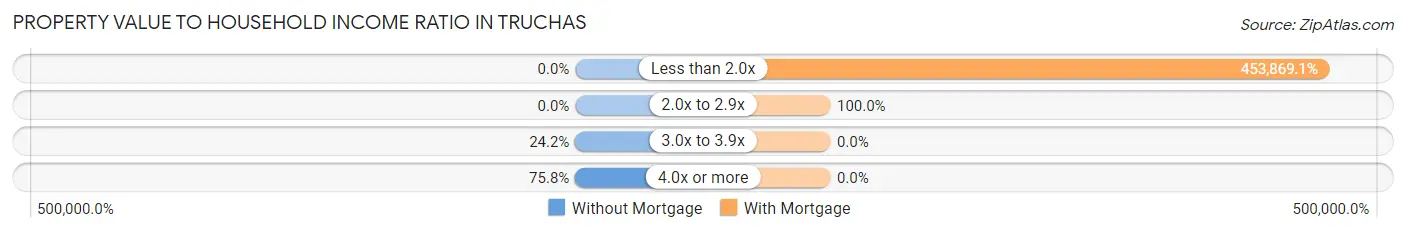
| Value-to-Income Ratio | Without Mortgage | With Mortgage |
| Less than 2.0x | 0 (0.0%) | 190,625 (453,869.0%) |
| 2.0x to 2.9x | 0 (0.0%) | 42 (100.0%) |
| 3.0x to 3.9x | 8 (24.2%) | 0 (0.0%) |
| 4.0x or more | 25 (75.8%) | 0 (0.0%) |
| Total | 33 (100.0%) | 42 (100.0%) |
Real Estate Taxes by Mortgage Status in Truchas
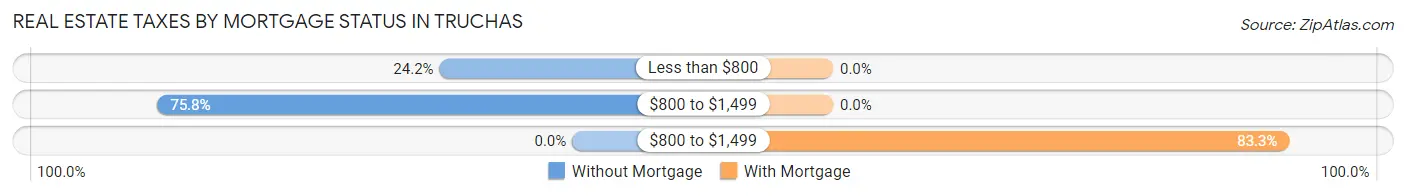
| Property Taxes | Without Mortgage | With Mortgage |
| Less than $800 | 8 (24.2%) | 0 (0.0%) |
| $800 to $1,499 | 25 (75.8%) | 0 (0.0%) |
| $800 to $1,499 | 0 (0.0%) | 35 (83.3%) |
| Total | 33 (100.0%) | 42 (100.0%) |
Health & Disability in Truchas
Health Insurance Coverage by Age in Truchas
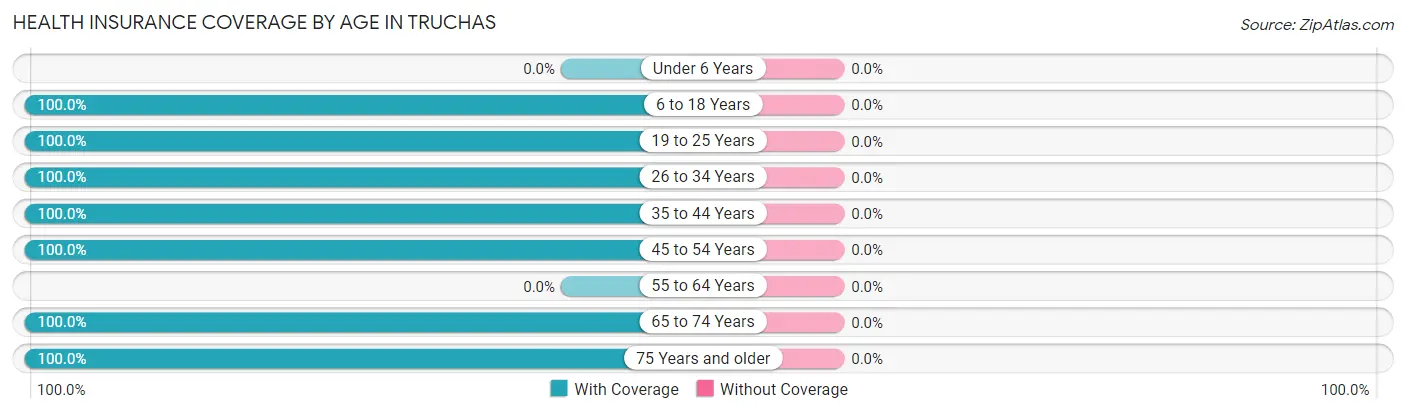
| Age Bracket | With Coverage | Without Coverage |
| Under 6 Years | 0 (0.0%) | 0 (0.0%) |
| 6 to 18 Years | 37 (100.0%) | 0 (0.0%) |
| 19 to 25 Years | 8 (100.0%) | 0 (0.0%) |
| 26 to 34 Years | 9 (100.0%) | 0 (0.0%) |
| 35 to 44 Years | 29 (100.0%) | 0 (0.0%) |
| 45 to 54 Years | 104 (100.0%) | 0 (0.0%) |
| 55 to 64 Years | 0 (0.0%) | 0 (0.0%) |
| 65 to 74 Years | 95 (100.0%) | 0 (0.0%) |
| 75 Years and older | 38 (100.0%) | 0 (0.0%) |
| Total | 320 (100.0%) | 0 (0.0%) |
Health Insurance Coverage by Citizenship Status in Truchas

| Citizenship Status | With Coverage | Without Coverage |
| Native Born | 0 (0.0%) | 0 (0.0%) |
| Foreign Born, Citizen | 37 (100.0%) | 0 (0.0%) |
| Foreign Born, not a Citizen | 8 (100.0%) | 0 (0.0%) |
Health Insurance Coverage by Household Income in Truchas
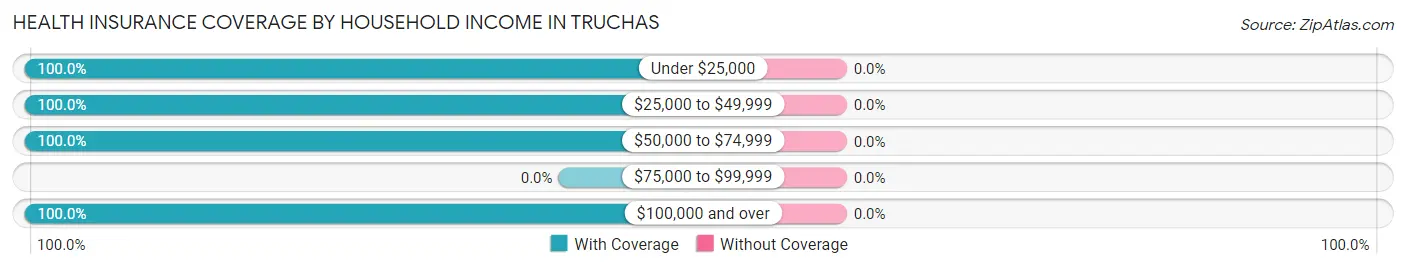
| Household Income | With Coverage | Without Coverage |
| Under $25,000 | 36 (100.0%) | 0 (0.0%) |
| $25,000 to $49,999 | 97 (100.0%) | 0 (0.0%) |
| $50,000 to $74,999 | 102 (100.0%) | 0 (0.0%) |
| $75,000 to $99,999 | 0 (0.0%) | 0 (0.0%) |
| $100,000 and over | 81 (100.0%) | 0 (0.0%) |
Public vs Private Health Insurance Coverage by Age in Truchas
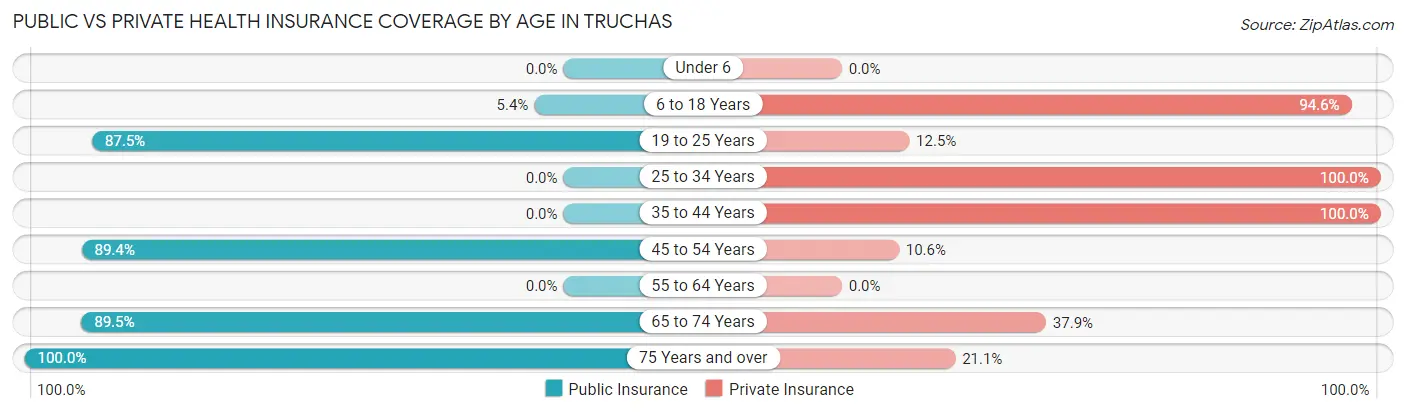
| Age Bracket | Public Insurance | Private Insurance |
| Under 6 | 0 (0.0%) | 0 (0.0%) |
| 6 to 18 Years | 2 (5.4%) | 35 (94.6%) |
| 19 to 25 Years | 7 (87.5%) | 1 (12.5%) |
| 25 to 34 Years | 0 (0.0%) | 9 (100.0%) |
| 35 to 44 Years | 0 (0.0%) | 29 (100.0%) |
| 45 to 54 Years | 93 (89.4%) | 11 (10.6%) |
| 55 to 64 Years | 0 (0.0%) | 0 (0.0%) |
| 65 to 74 Years | 85 (89.5%) | 36 (37.9%) |
| 75 Years and over | 38 (100.0%) | 8 (21.0%) |
| Total | 225 (70.3%) | 129 (40.3%) |
Disability Status by Sex by Age in Truchas
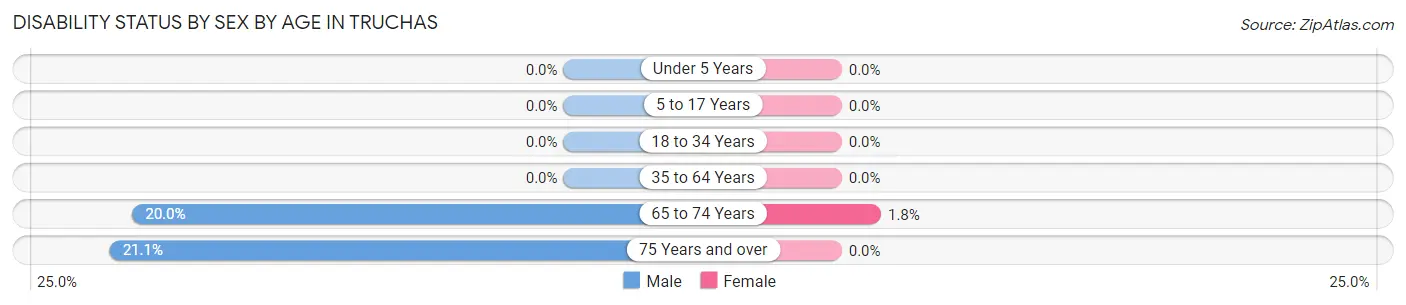
| Age Bracket | Male | Female |
| Under 5 Years | 0 (0.0%) | 0 (0.0%) |
| 5 to 17 Years | 0 (0.0%) | 0 (0.0%) |
| 18 to 34 Years | 0 (0.0%) | 0 (0.0%) |
| 35 to 64 Years | 0 (0.0%) | 0 (0.0%) |
| 65 to 74 Years | 8 (20.0%) | 1 (1.8%) |
| 75 Years and over | 8 (21.0%) | 0 (0.0%) |
Disability Class by Sex by Age in Truchas
Disability Class: Hearing Difficulty
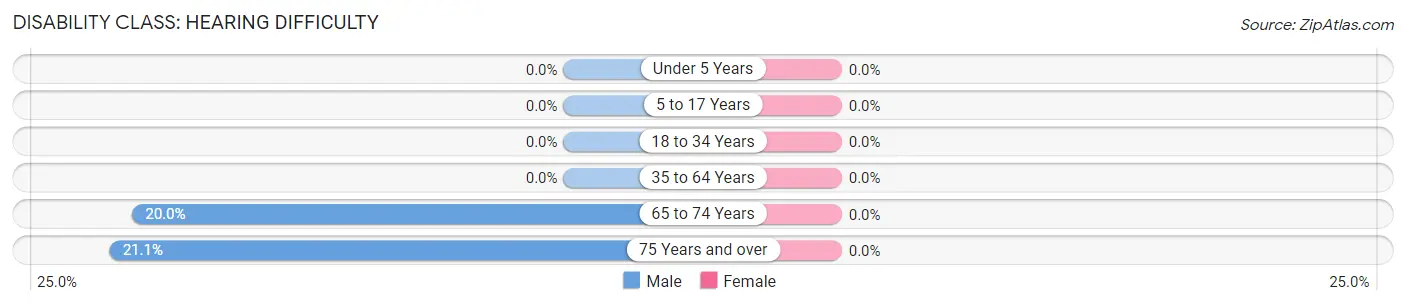
| Age Bracket | Male | Female |
| Under 5 Years | 0 (0.0%) | 0 (0.0%) |
| 5 to 17 Years | 0 (0.0%) | 0 (0.0%) |
| 18 to 34 Years | 0 (0.0%) | 0 (0.0%) |
| 35 to 64 Years | 0 (0.0%) | 0 (0.0%) |
| 65 to 74 Years | 8 (20.0%) | 0 (0.0%) |
| 75 Years and over | 8 (21.0%) | 0 (0.0%) |
Disability Class: Vision Difficulty
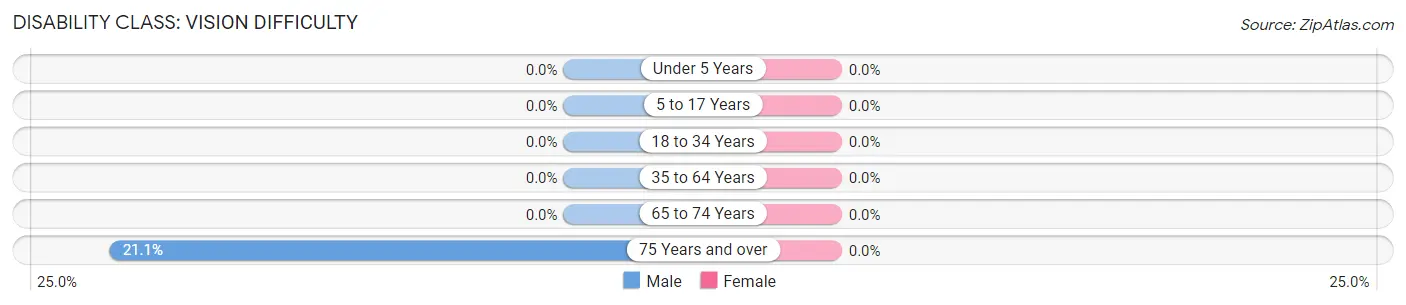
| Age Bracket | Male | Female |
| Under 5 Years | 0 (0.0%) | 0 (0.0%) |
| 5 to 17 Years | 0 (0.0%) | 0 (0.0%) |
| 18 to 34 Years | 0 (0.0%) | 0 (0.0%) |
| 35 to 64 Years | 0 (0.0%) | 0 (0.0%) |
| 65 to 74 Years | 0 (0.0%) | 0 (0.0%) |
| 75 Years and over | 8 (21.0%) | 0 (0.0%) |
Disability Class: Cognitive Difficulty
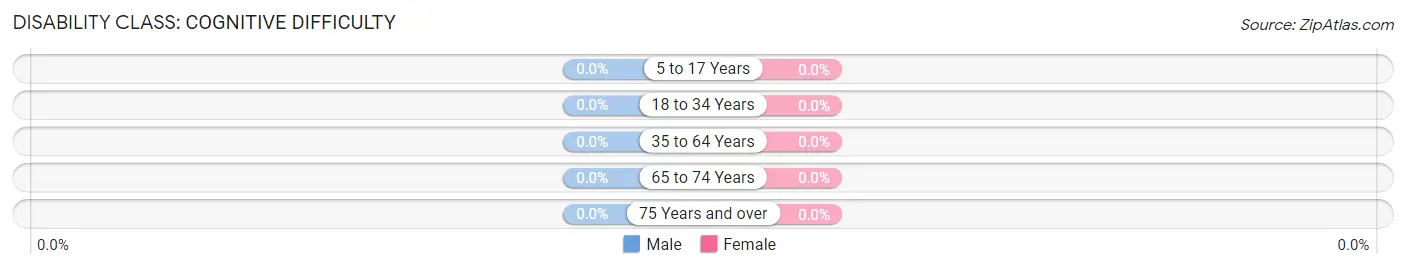
| Age Bracket | Male | Female |
| 5 to 17 Years | 0 (0.0%) | 0 (0.0%) |
| 18 to 34 Years | 0 (0.0%) | 0 (0.0%) |
| 35 to 64 Years | 0 (0.0%) | 0 (0.0%) |
| 65 to 74 Years | 0 (0.0%) | 0 (0.0%) |
| 75 Years and over | 0 (0.0%) | 0 (0.0%) |
Disability Class: Ambulatory Difficulty
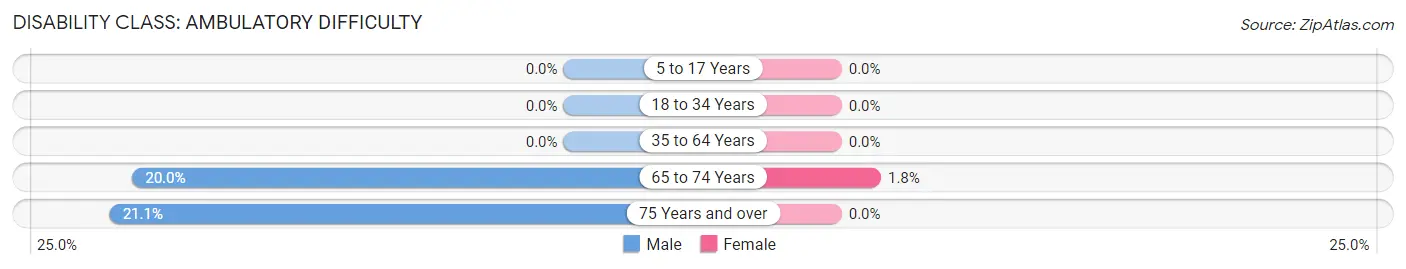
| Age Bracket | Male | Female |
| 5 to 17 Years | 0 (0.0%) | 0 (0.0%) |
| 18 to 34 Years | 0 (0.0%) | 0 (0.0%) |
| 35 to 64 Years | 0 (0.0%) | 0 (0.0%) |
| 65 to 74 Years | 8 (20.0%) | 1 (1.8%) |
| 75 Years and over | 8 (21.0%) | 0 (0.0%) |
Disability Class: Self-Care Difficulty
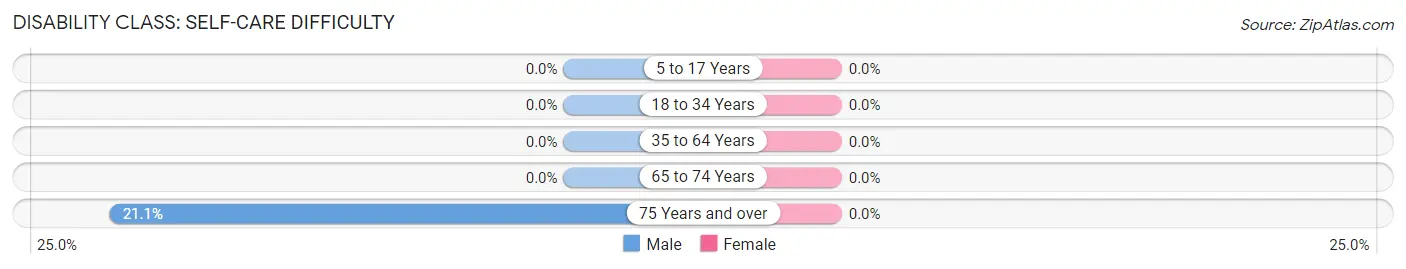
| Age Bracket | Male | Female |
| 5 to 17 Years | 0 (0.0%) | 0 (0.0%) |
| 18 to 34 Years | 0 (0.0%) | 0 (0.0%) |
| 35 to 64 Years | 0 (0.0%) | 0 (0.0%) |
| 65 to 74 Years | 0 (0.0%) | 0 (0.0%) |
| 75 Years and over | 8 (21.0%) | 0 (0.0%) |
Technology Access in Truchas
Computing Device Access in Truchas
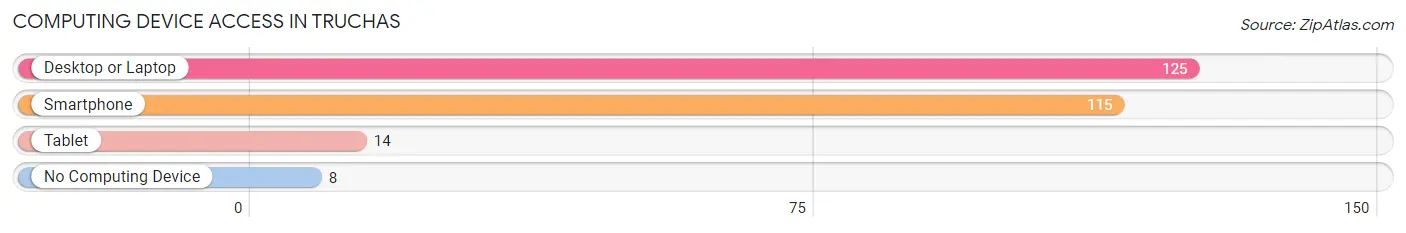
| Device Type | # Households | % Households |
| Desktop or Laptop | 125 | 94.0% |
| Smartphone | 115 | 86.5% |
| Tablet | 14 | 10.5% |
| No Computing Device | 8 | 6.0% |
| Total | 133 | 100.0% |
Internet Access in Truchas
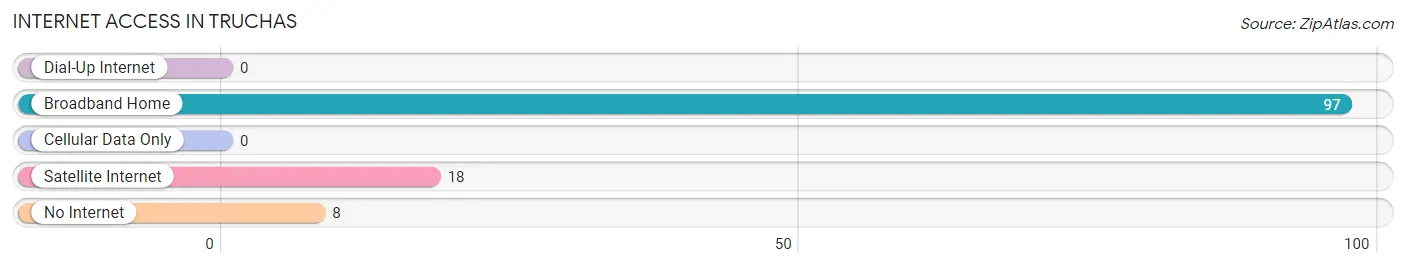
| Internet Type | # Households | % Households |
| Dial-Up Internet | 0 | 0.0% |
| Broadband Home | 97 | 72.9% |
| Cellular Data Only | 0 | 0.0% |
| Satellite Internet | 18 | 13.5% |
| No Internet | 8 | 6.0% |
| Total | 133 | 100.0% |
Truchas Summary
Truchas, New Mexico is a small unincorporated community located in the Sangre de Cristo Mountains of northern New Mexico. It is situated in the Truchas Peaks area of the Santa Fe National Forest, approximately 40 miles northeast of Santa Fe. The town is known for its picturesque mountain scenery, its traditional Hispanic culture, and its proximity to the nearby Pecos Wilderness.
History
Truchas was first settled in the late 1700s by Spanish settlers who were attracted to the area by its abundant natural resources. The town was originally called El Rito de los Truchas, which translates to “the stream of the trout” in English. The name was derived from the abundance of trout in the nearby streams. The town was officially established in 1835 and was initially populated by Spanish settlers and Native Americans.
In the late 1800s, the town began to attract more settlers from the United States, particularly from the Midwest. These settlers brought with them new technologies and farming techniques, which helped to improve the local economy. The town also began to attract artists and writers, who were drawn to the area’s natural beauty and traditional culture.
Geography
Truchas is located in the Sangre de Cristo Mountains of northern New Mexico. The town is situated at an elevation of 8,000 feet, making it one of the highest towns in the United States. The town is surrounded by the Santa Fe National Forest, which is home to a variety of wildlife, including elk, deer, and black bear. The nearby Pecos Wilderness is also a popular destination for hikers and campers.
The climate in Truchas is generally mild, with temperatures ranging from the mid-30s in the winter to the mid-80s in the summer. The town receives an average of 18 inches of precipitation per year, with most of it falling in the form of snow.
Economy
Truchas is a small, rural community with a population of approximately 500 people. The town’s economy is largely based on agriculture, with the main crops being potatoes, hay, and alfalfa. The town also has a small tourism industry, with visitors coming to the area to enjoy the scenery and traditional culture.
Demographics
Truchas is a predominantly Hispanic community, with approximately 95% of the population identifying as Hispanic or Latino. The town also has a small Native American population, with approximately 5% of the population identifying as Native American. The median household income in Truchas is approximately $30,000, which is lower than the national average. The town has a poverty rate of approximately 20%, which is higher than the national average.
Common Questions
What is Per Capita Income in Truchas?
Per Capita income in Truchas is $38,782.
What is the Median Family Income in Truchas?
Median Family Income in Truchas is $190,580.
What is Inequality or Gini Index in Truchas?
Inequality or Gini Index in Truchas is 0.45.
What is the Total Population of Truchas?
Total Population of Truchas is 320.
What is the Total Male Population of Truchas?
Total Male Population of Truchas is 181.
What is the Total Female Population of Truchas?
Total Female Population of Truchas is 139.
What is the Ratio of Males per 100 Females in Truchas?
There are 130.22 Males per 100 Females in Truchas.
What is the Ratio of Females per 100 Males in Truchas?
There are 76.80 Females per 100 Males in Truchas.
What is the Median Population Age in Truchas?
Median Population Age in Truchas is 46.7 Years.
What is the Average Family Size in Truchas
Average Family Size in Truchas is 4.3 People.
What is the Average Household Size in Truchas
Average Household Size in Truchas is 2.4 People.
How Large is the Labor Force in Truchas?
There are 74 People in the Labor Forcein in Truchas.
What is the Percentage of People in the Labor Force in Truchas?
26.0% of People are in the Labor Force in Truchas.