Beatrice, AL Map & Demographics
Beatrice Map
Beatrice Overview
$16,346
PER CAPITA INCOME
$46,563
AVG FAMILY INCOME
$33,214
AVG HOUSEHOLD INCOME
0.48
INEQUALITY / GINI INDEX
175
TOTAL POPULATION
88
MALE POPULATION
87
FEMALE POPULATION
101.15
MALES / 100 FEMALES
98.86
FEMALES / 100 MALES
37.1
MEDIAN AGE
5.2
AVG FAMILY SIZE
2.9
AVG HOUSEHOLD SIZE
26
LABOR FORCE [ PEOPLE ]
21.7%
PERCENT IN LABOR FORCE
26.9%
UNEMPLOYMENT RATE
Beatrice Zip Codes
Beatrice Area Codes
Income in Beatrice
Income Overview in Beatrice
Per Capita Income in Beatrice is $16,346, while median incomes of families and households are $46,563 and $33,214 respectively.
| Characteristic | Number | Measure |
| Per Capita Income | 175 | $16,346 |
| Median Family Income | 27 | $46,563 |
| Mean Family Income | 27 | $67,878 |
| Median Household Income | 60 | $33,214 |
| Mean Household Income | 60 | $41,395 |
| Income Deficit | 27 | $0 |
| Wage / Income Gap (%) | 175 | 0.00% |
| Wage / Income Gap ($) | 175 | 100.00¢ per $1 |
| Gini / Inequality Index | 175 | 0.48 |
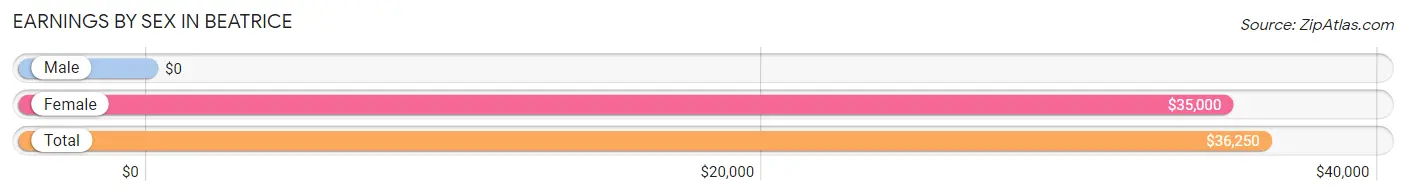
Earnings by Sex in Beatrice
| Sex | Number | Average Earnings |
| Male | 9 (42.9%) | $0 |
| Female | 12 (57.1%) | $35,000 |
| Total | 21 (100.0%) | $36,250 |
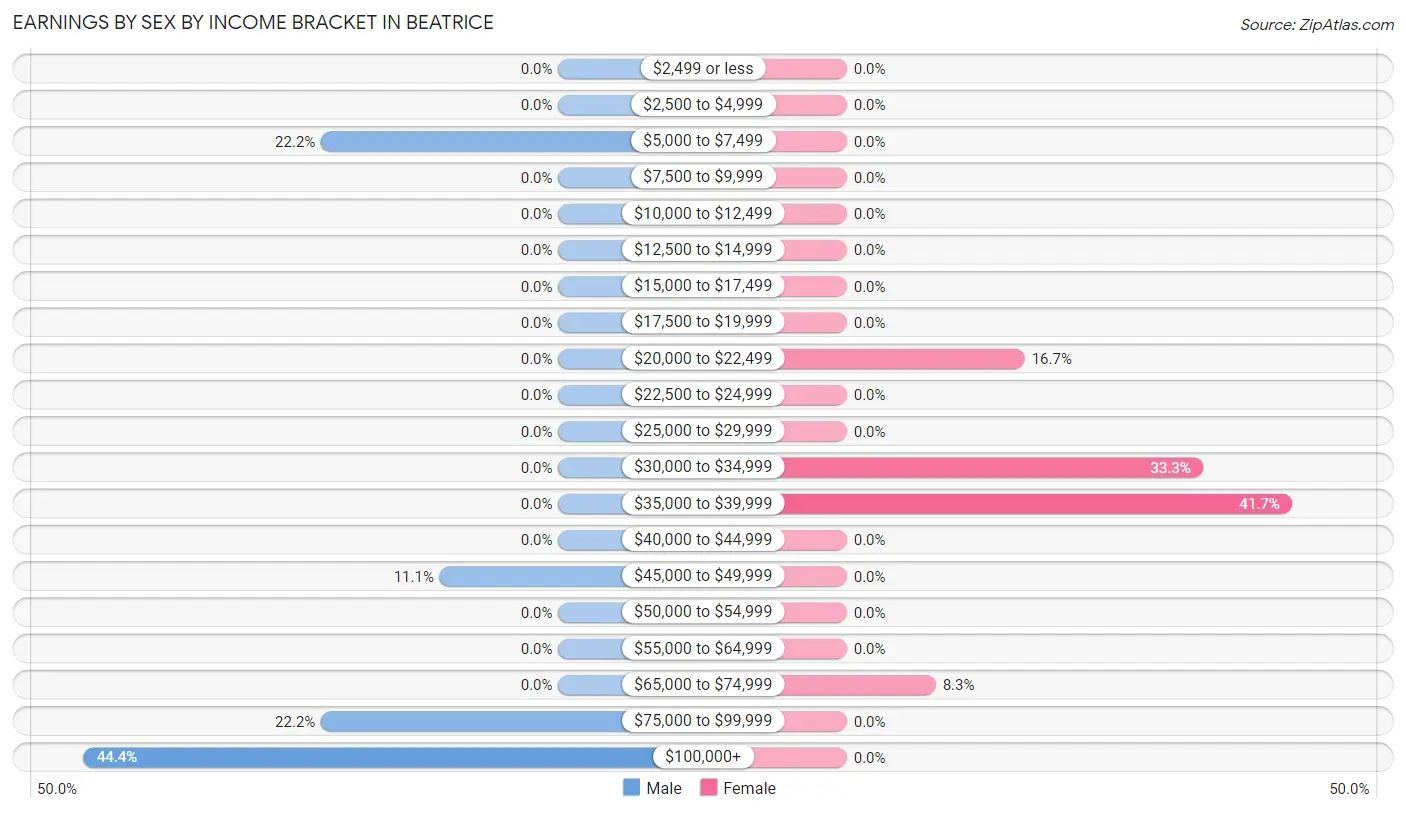
Earnings by Sex by Income Bracket in Beatrice
The most common earnings brackets in Beatrice are $100,000+ for men (4 | 44.4%) and $35,000 to $39,999 for women (5 | 41.7%).
| Income | Male | Female |
| $2,499 or less | 0 (0.0%) | 0 (0.0%) |
| $2,500 to $4,999 | 0 (0.0%) | 0 (0.0%) |
| $5,000 to $7,499 | 2 (22.2%) | 0 (0.0%) |
| $7,500 to $9,999 | 0 (0.0%) | 0 (0.0%) |
| $10,000 to $12,499 | 0 (0.0%) | 0 (0.0%) |
| $12,500 to $14,999 | 0 (0.0%) | 0 (0.0%) |
| $15,000 to $17,499 | 0 (0.0%) | 0 (0.0%) |
| $17,500 to $19,999 | 0 (0.0%) | 0 (0.0%) |
| $20,000 to $22,499 | 0 (0.0%) | 2 (16.7%) |
| $22,500 to $24,999 | 0 (0.0%) | 0 (0.0%) |
| $25,000 to $29,999 | 0 (0.0%) | 0 (0.0%) |
| $30,000 to $34,999 | 0 (0.0%) | 4 (33.3%) |
| $35,000 to $39,999 | 0 (0.0%) | 5 (41.7%) |
| $40,000 to $44,999 | 0 (0.0%) | 0 (0.0%) |
| $45,000 to $49,999 | 1 (11.1%) | 0 (0.0%) |
| $50,000 to $54,999 | 0 (0.0%) | 0 (0.0%) |
| $55,000 to $64,999 | 0 (0.0%) | 0 (0.0%) |
| $65,000 to $74,999 | 0 (0.0%) | 1 (8.3%) |
| $75,000 to $99,999 | 2 (22.2%) | 0 (0.0%) |
| $100,000+ | 4 (44.4%) | 0 (0.0%) |
| Total | 9 (100.0%) | 12 (100.0%) |
Earnings by Sex by Educational Attainment in Beatrice
| Educational Attainment | Male Income | Female Income |
| Less than High School | - | - |
| High School Diploma | - | - |
| College or Associate's Degree | - | - |
| Bachelor's Degree | - | - |
| Graduate Degree | - | - |
| Total | - | - |
Family Income in Beatrice
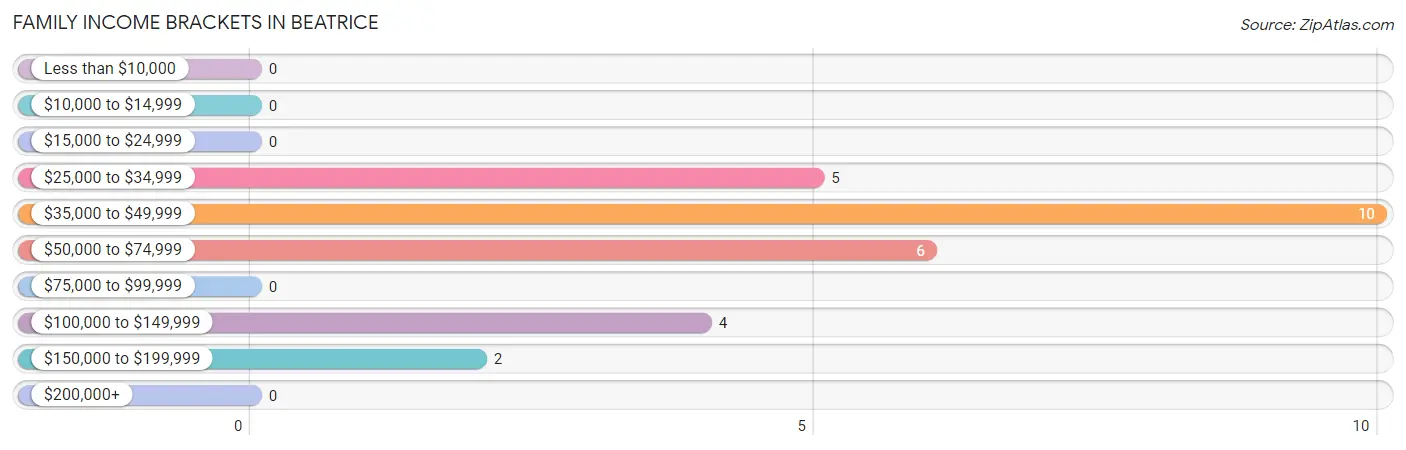
Family Income Brackets in Beatrice
According to the Beatrice family income data, there are 10 families falling into the $35,000 to $49,999 income range, which is the most common income bracket and makes up 37.0% of all families.
| Income Bracket | # Families | % Families |
| Less than $10,000 | 0 | 0.0% |
| $10,000 to $14,999 | 0 | 0.0% |
| $15,000 to $24,999 | 0 | 0.0% |
| $25,000 to $34,999 | 5 | 18.5% |
| $35,000 to $49,999 | 10 | 37.0% |
| $50,000 to $74,999 | 6 | 22.2% |
| $75,000 to $99,999 | 0 | 0.0% |
| $100,000 to $149,999 | 4 | 14.8% |
| $150,000 to $199,999 | 2 | 7.4% |
| $200,000+ | 0 | 0.0% |
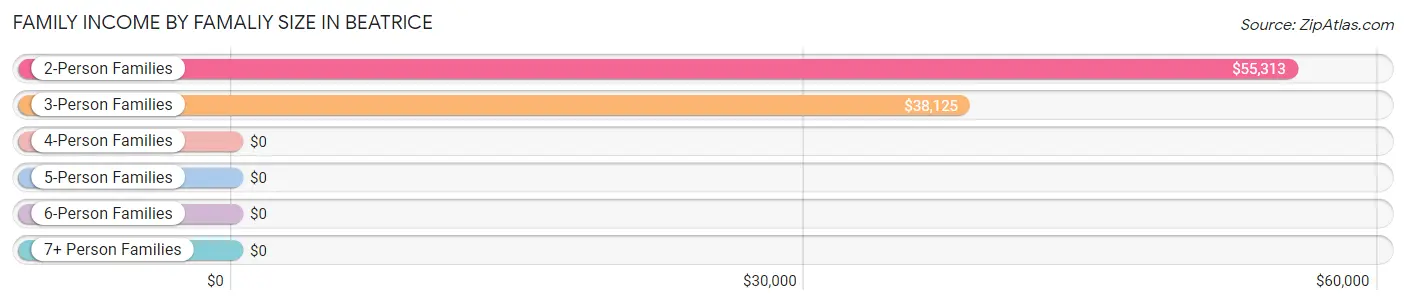
Family Income by Famaliy Size in Beatrice
2-person families (15 | 55.6%) account for the highest median family income in Beatrice with $55,313 per family, while 2-person families (15 | 55.6%) have the highest median income of $27,656 per family member.
| Income Bracket | # Families | Median Income |
| 2-Person Families | 15 (55.6%) | $55,313 |
| 3-Person Families | 9 (33.3%) | $38,125 |
| 4-Person Families | 2 (7.4%) | $0 |
| 5-Person Families | 0 (0.0%) | $0 |
| 6-Person Families | 0 (0.0%) | $0 |
| 7+ Person Families | 1 (3.7%) | $0 |
| Total | 27 (100.0%) | $46,563 |
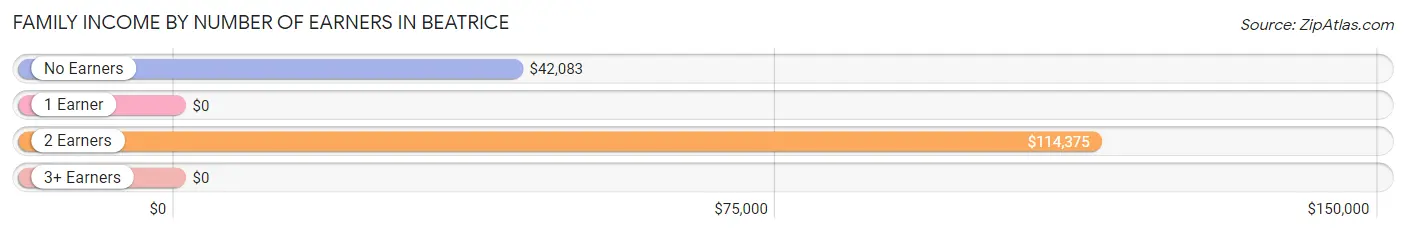
Family Income by Number of Earners in Beatrice
| Number of Earners | # Families | Median Income |
| No Earners | 19 (70.4%) | $42,083 |
| 1 Earner | 3 (11.1%) | $0 |
| 2 Earners | 5 (18.5%) | $114,375 |
| 3+ Earners | 0 (0.0%) | $0 |
| Total | 27 (100.0%) | $46,563 |
Household Income in Beatrice
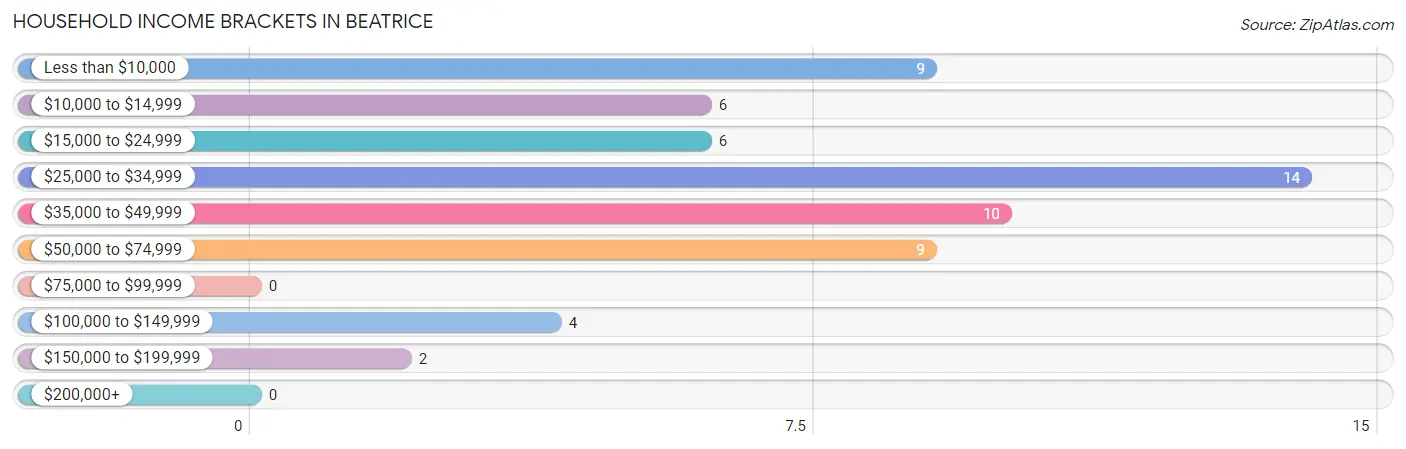
Household Income Brackets in Beatrice
With 14 households falling in the category, the $25,000 to $34,999 income range is the most frequent in Beatrice, accounting for 23.3% of all households.
| Income Bracket | # Households | % Households |
| Less than $10,000 | 9 | 15.0% |
| $10,000 to $14,999 | 6 | 10.0% |
| $15,000 to $24,999 | 6 | 10.0% |
| $25,000 to $34,999 | 14 | 23.3% |
| $35,000 to $49,999 | 10 | 16.7% |
| $50,000 to $74,999 | 9 | 15.0% |
| $75,000 to $99,999 | 0 | 0.0% |
| $100,000 to $149,999 | 4 | 6.7% |
| $150,000 to $199,999 | 2 | 3.3% |
| $200,000+ | 0 | 0.0% |
Household Income by Householder Age in Beatrice
The median household income in Beatrice is $33,214, with the highest median household income of $39,375 found in the 45 to 64 years age bracket for the primary householder. A total of 21 households (35.0%) fall into this category.
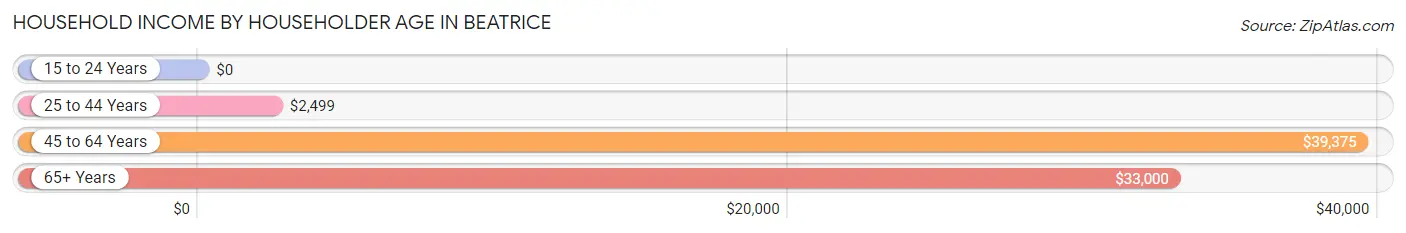
| Income Bracket | # Households | Median Income |
| 15 to 24 Years | 0 (0.0%) | $0 |
| 25 to 44 Years | 13 (21.7%) | $2,499 |
| 45 to 64 Years | 21 (35.0%) | $39,375 |
| 65+ Years | 26 (43.3%) | $33,000 |
| Total | 60 (100.0%) | $33,214 |
Poverty in Beatrice
Income Below Poverty by Sex and Age in Beatrice
With 3.4% poverty level for males and 17.2% for females among the residents of Beatrice, 55 to 64 year old males and 45 to 54 year old females are the most vulnerable to poverty, with 3 males (42.9%) and 6 females (85.7%) in their respective age groups living below the poverty level.
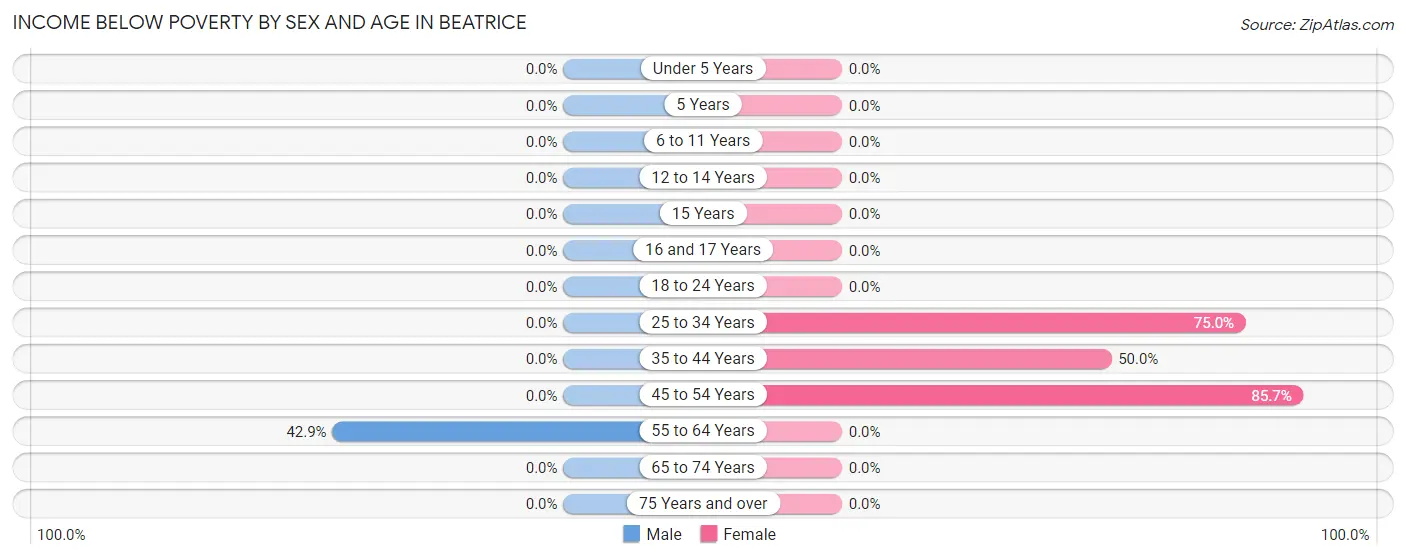
| Age Bracket | Male | Female |
| Under 5 Years | 0 (0.0%) | 0 (0.0%) |
| 5 Years | 0 (0.0%) | 0 (0.0%) |
| 6 to 11 Years | 0 (0.0%) | 0 (0.0%) |
| 12 to 14 Years | 0 (0.0%) | 0 (0.0%) |
| 15 Years | 0 (0.0%) | 0 (0.0%) |
| 16 and 17 Years | 0 (0.0%) | 0 (0.0%) |
| 18 to 24 Years | 0 (0.0%) | 0 (0.0%) |
| 25 to 34 Years | 0 (0.0%) | 3 (75.0%) |
| 35 to 44 Years | 0 (0.0%) | 6 (50.0%) |
| 45 to 54 Years | 0 (0.0%) | 6 (85.7%) |
| 55 to 64 Years | 3 (42.9%) | 0 (0.0%) |
| 65 to 74 Years | 0 (0.0%) | 0 (0.0%) |
| 75 Years and over | 0 (0.0%) | 0 (0.0%) |
| Total | 3 (3.4%) | 15 (17.2%) |
Income Above Poverty by Sex and Age in Beatrice
According to the poverty statistics in Beatrice, males aged 6 to 11 years and females aged 5 years are the age groups that are most secure financially, with 100.0% of males and 100.0% of females in these age groups living above the poverty line.
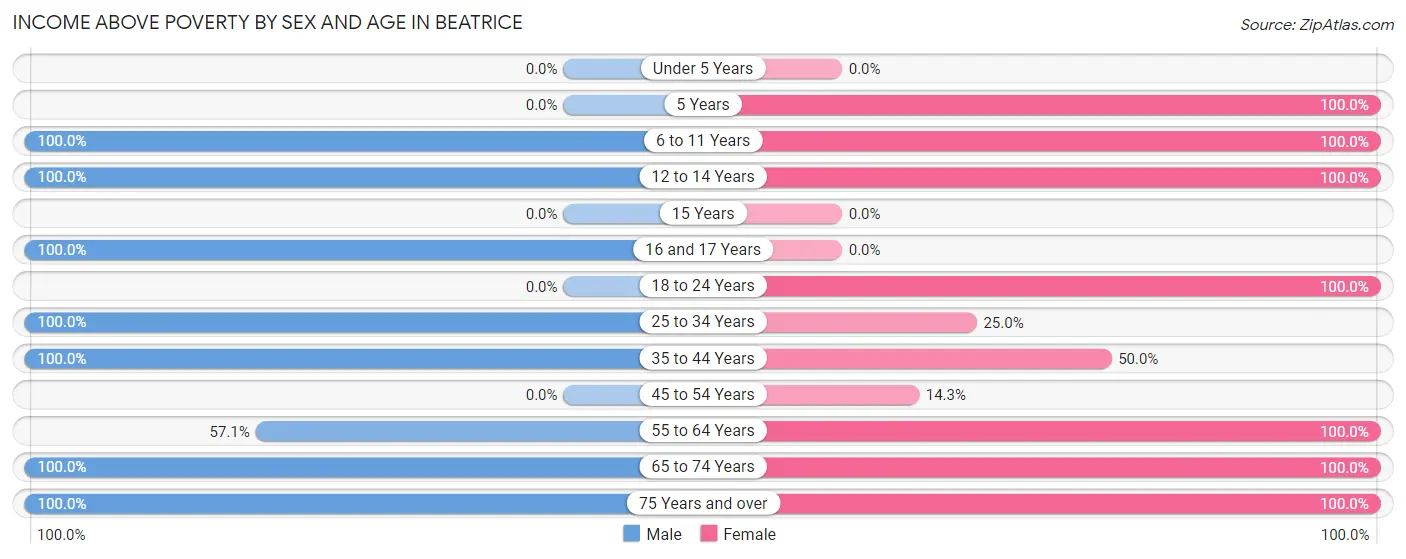
| Age Bracket | Male | Female |
| Under 5 Years | 0 (0.0%) | 0 (0.0%) |
| 5 Years | 0 (0.0%) | 3 (100.0%) |
| 6 to 11 Years | 18 (100.0%) | 13 (100.0%) |
| 12 to 14 Years | 10 (100.0%) | 11 (100.0%) |
| 15 Years | 0 (0.0%) | 0 (0.0%) |
| 16 and 17 Years | 2 (100.0%) | 0 (0.0%) |
| 18 to 24 Years | 0 (0.0%) | 7 (100.0%) |
| 25 to 34 Years | 19 (100.0%) | 1 (25.0%) |
| 35 to 44 Years | 1 (100.0%) | 6 (50.0%) |
| 45 to 54 Years | 0 (0.0%) | 1 (14.3%) |
| 55 to 64 Years | 4 (57.1%) | 14 (100.0%) |
| 65 to 74 Years | 14 (100.0%) | 15 (100.0%) |
| 75 Years and over | 17 (100.0%) | 1 (100.0%) |
| Total | 85 (96.6%) | 72 (82.8%) |
Income Below Poverty Among Married-Couple Families in Beatrice
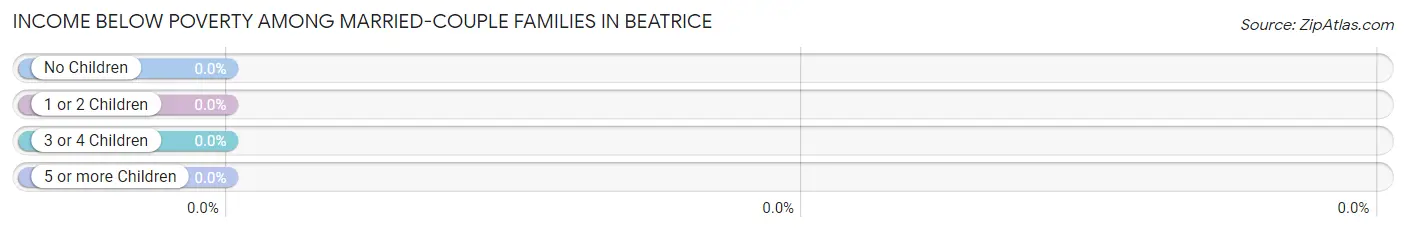
| Children | Above Poverty | Below Poverty |
| No Children | 14 (100.0%) | 0 (0.0%) |
| 1 or 2 Children | 2 (100.0%) | 0 (0.0%) |
| 3 or 4 Children | 0 (0.0%) | 0 (0.0%) |
| 5 or more Children | 1 (100.0%) | 0 (0.0%) |
| Total | 17 (100.0%) | 0 (0.0%) |
Income Below Poverty Among Single-Parent Households in Beatrice
| Children | Single Father | Single Mother |
| No Children | 0 (0.0%) | 0 (0.0%) |
| 1 or 2 Children | 0 (0.0%) | 0 (0.0%) |
| 3 or 4 Children | 0 (0.0%) | 0 (0.0%) |
| 5 or more Children | 0 (0.0%) | 0 (0.0%) |
| Total | 0 (0.0%) | 0 (0.0%) |
Income Below Poverty Among Married-Couple vs Single-Parent Households in Beatrice
| Children | Married-Couple Families | Single-Parent Households |
| No Children | 0 (0.0%) | 0 (0.0%) |
| 1 or 2 Children | 0 (0.0%) | 0 (0.0%) |
| 3 or 4 Children | 0 (0.0%) | 0 (0.0%) |
| 5 or more Children | 0 (0.0%) | 0 (0.0%) |
| Total | 0 (0.0%) | 0 (0.0%) |
Race in Beatrice
The most populous races in Beatrice are Black / African American (135 | 77.1%), and White / Caucasian (40 | 22.9%).
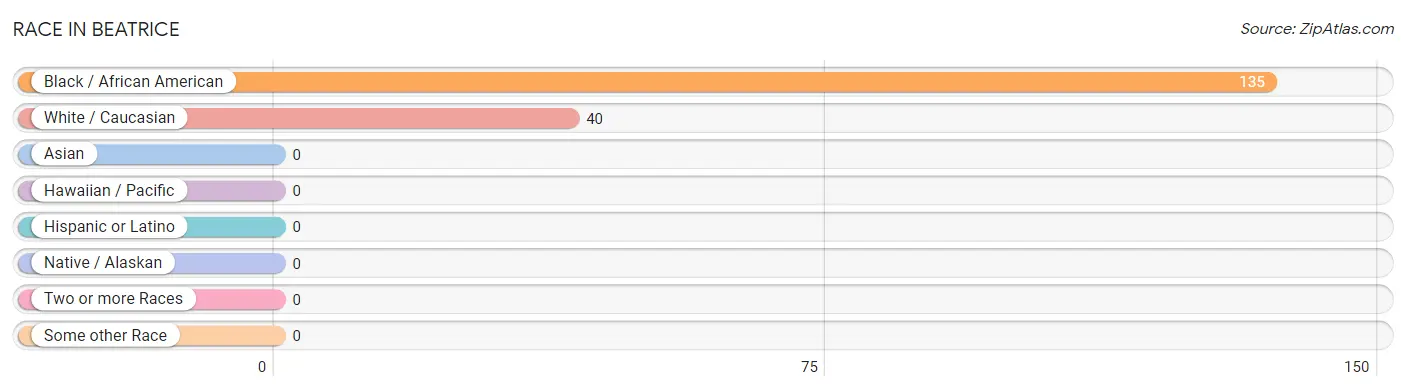
| Race | # Population | % Population |
| Asian | 0 | 0.0% |
| Black / African American | 135 | 77.1% |
| Hawaiian / Pacific | 0 | 0.0% |
| Hispanic or Latino | 0 | 0.0% |
| Native / Alaskan | 0 | 0.0% |
| White / Caucasian | 40 | 22.9% |
| Two or more Races | 0 | 0.0% |
| Some other Race | 0 | 0.0% |
| Total | 175 | 100.0% |
Ancestry in Beatrice
The most populous ancestries reported in Beatrice are African (4 | 2.3%), English (4 | 2.3%), Subsaharan African (4 | 2.3%), American (2 | 1.1%), and Irish (1 | 0.6%), together accounting for 8.6% of all Beatrice residents.
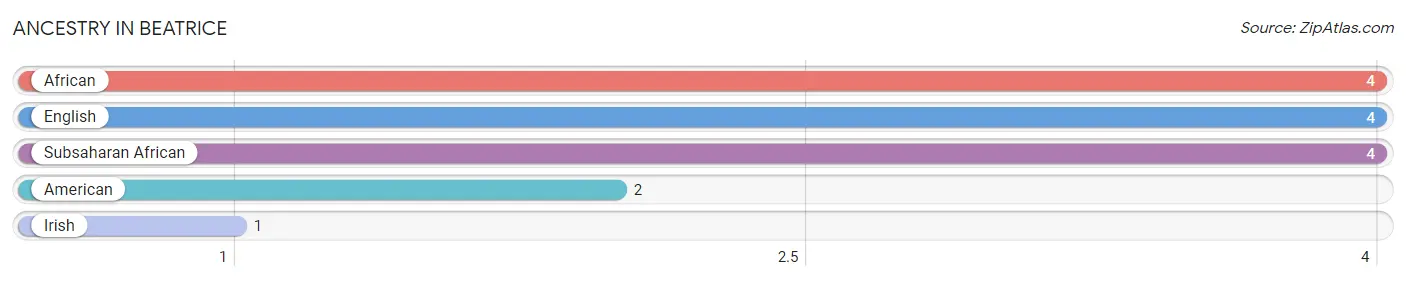
| Ancestry | # Population | % Population |
| African | 4 | 2.3% |
| American | 2 | 1.1% |
| English | 4 | 2.3% |
| Irish | 1 | 0.6% |
| Subsaharan African | 4 | 2.3% | View All 5 Rows |
Immigrants in Beatrice

| Immigration Origin | # Population | % Population | View All 0 Rows |
Sex and Age in Beatrice
Sex and Age in Beatrice
The most populous age groups in Beatrice are 5 to 9 Years (18 | 20.4%) for men and 10 to 14 Years (14 | 16.1%) for women.
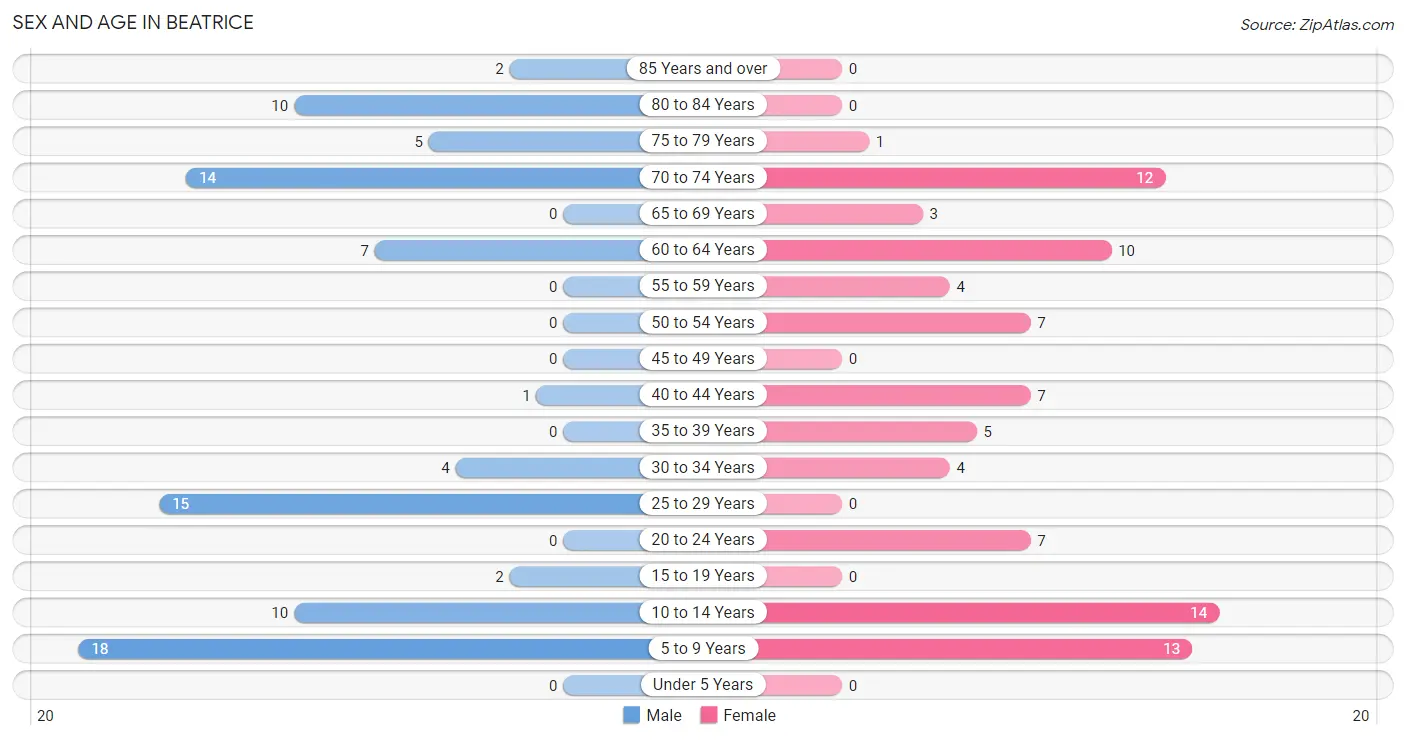
| Age Bracket | Male | Female |
| Under 5 Years | 0 (0.0%) | 0 (0.0%) |
| 5 to 9 Years | 18 (20.4%) | 13 (14.9%) |
| 10 to 14 Years | 10 (11.4%) | 14 (16.1%) |
| 15 to 19 Years | 2 (2.3%) | 0 (0.0%) |
| 20 to 24 Years | 0 (0.0%) | 7 (8.1%) |
| 25 to 29 Years | 15 (17.1%) | 0 (0.0%) |
| 30 to 34 Years | 4 (4.5%) | 4 (4.6%) |
| 35 to 39 Years | 0 (0.0%) | 5 (5.8%) |
| 40 to 44 Years | 1 (1.1%) | 7 (8.1%) |
| 45 to 49 Years | 0 (0.0%) | 0 (0.0%) |
| 50 to 54 Years | 0 (0.0%) | 7 (8.1%) |
| 55 to 59 Years | 0 (0.0%) | 4 (4.6%) |
| 60 to 64 Years | 7 (8.0%) | 10 (11.5%) |
| 65 to 69 Years | 0 (0.0%) | 3 (3.5%) |
| 70 to 74 Years | 14 (15.9%) | 12 (13.8%) |
| 75 to 79 Years | 5 (5.7%) | 1 (1.1%) |
| 80 to 84 Years | 10 (11.4%) | 0 (0.0%) |
| 85 Years and over | 2 (2.3%) | 0 (0.0%) |
| Total | 88 (100.0%) | 87 (100.0%) |
Families and Households in Beatrice
Median Family Size in Beatrice
The median family size in Beatrice is 5.15 persons per family, with single female/mother families (6 | 22.2%) accounting for the largest median family size of 7.33 persons per family. On the other hand, married-couple families (17 | 63.0%) represent the smallest median family size with 4.24 persons per family.
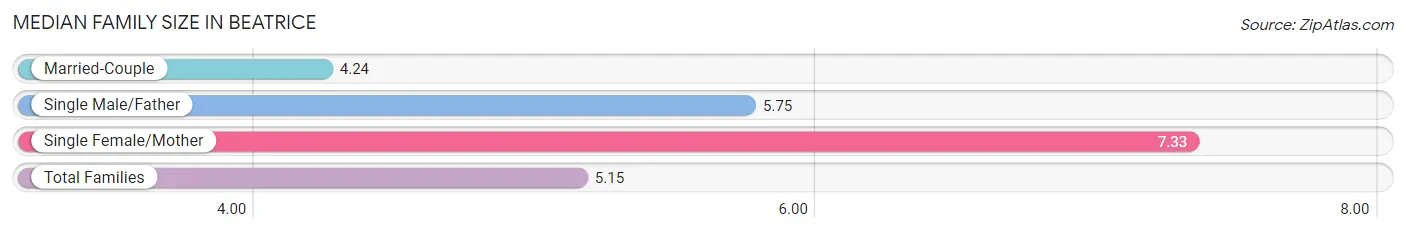
| Family Type | # Families | Family Size |
| Married-Couple | 17 (63.0%) | 4.24 |
| Single Male/Father | 4 (14.8%) | 5.75 |
| Single Female/Mother | 6 (22.2%) | 7.33 |
| Total Families | 27 (100.0%) | 5.15 |
Median Household Size in Beatrice
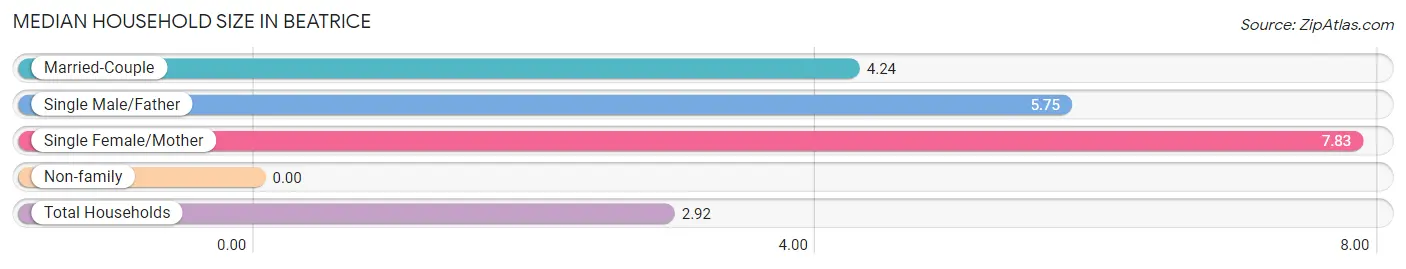
| Household Type | # Households | Household Size |
| Married-Couple | 17 (28.3%) | 4.24 |
| Single Male/Father | 4 (6.7%) | 5.75 |
| Single Female/Mother | 6 (10.0%) | 7.83 |
| Non-family | 33 (55.0%) | - |
| Total Households | 60 (100.0%) | 2.92 |
Household Size by Marriage Status in Beatrice
Out of a total of 60 households in Beatrice, 27 (45.0%) are family households, while 33 (55.0%) are nonfamily households. The most numerous type of family households are 2-person households, comprising 15, and the most common type of nonfamily households are 1-person households, comprising 33.
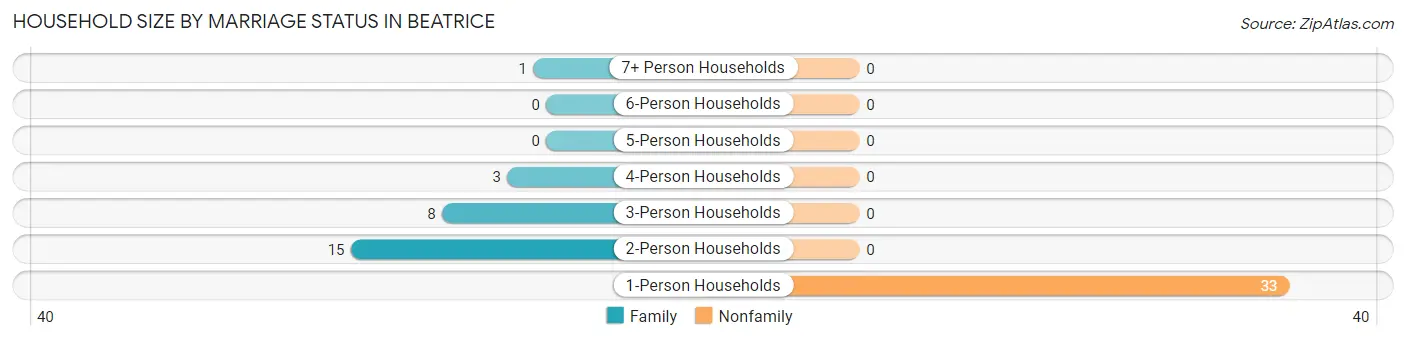
| Household Size | Family Households | Nonfamily Households |
| 1-Person Households | - | 33 (55.0%) |
| 2-Person Households | 15 (25.0%) | 0 (0.0%) |
| 3-Person Households | 8 (13.3%) | 0 (0.0%) |
| 4-Person Households | 3 (5.0%) | 0 (0.0%) |
| 5-Person Households | 0 (0.0%) | 0 (0.0%) |
| 6-Person Households | 0 (0.0%) | 0 (0.0%) |
| 7+ Person Households | 1 (1.7%) | 0 (0.0%) |
| Total | 27 (45.0%) | 33 (55.0%) |
Female Fertility in Beatrice
Fertility by Age in Beatrice
| Age Bracket | Women with Births | Births / 1,000 Women |
| 15 to 19 years | 0 (0.0%) | 0.0 |
| 20 to 34 years | 0 (0.0%) | 0.0 |
| 35 to 50 years | 0 (0.0%) | 0.0 |
| Total | 0 (0.0%) | 0.0 |
Fertility by Age by Marriage Status in Beatrice
| Age Bracket | Married | Unmarried |
| 15 to 19 years | 0 (0.0%) | 0 (0.0%) |
| 20 to 34 years | 0 (0.0%) | 0 (0.0%) |
| 35 to 50 years | 0 (0.0%) | 0 (0.0%) |
| Total | 0 (0.0%) | 0 (0.0%) |
Fertility by Education in Beatrice
| Educational Attainment | Women with Births | Births / 1,000 Women |
| Less than High School | 0 (0.0%) | 0.0 |
| High School Diploma | 0 (0.0%) | 0.0 |
| College or Associate's Degree | 0 (0.0%) | 0.0 |
| Bachelor's Degree | 0 (0.0%) | 0.0 |
| Graduate Degree | 0 (0.0%) | 0.0 |
| Total | 0 (0.0%) | 0.0 |
Fertility by Education by Marriage Status in Beatrice
| Educational Attainment | Married | Unmarried |
| Less than High School | 0 (0.0%) | 0 (0.0%) |
| High School Diploma | 0 (0.0%) | 0 (0.0%) |
| College or Associate's Degree | 0 (0.0%) | 0 (0.0%) |
| Bachelor's Degree | 0 (0.0%) | 0 (0.0%) |
| Graduate Degree | 0 (0.0%) | 0 (0.0%) |
| Total | 0 (0.0%) | 0 (0.0%) |
Employment Characteristics in Beatrice
Employment by Class of Employer in Beatrice
Among the 18 employed individuals in Beatrice, private company employees (12 | 66.7%), state government employees (5 | 27.8%), and not-for-profit organizations (1 | 5.6%) make up the most common classes of employment.
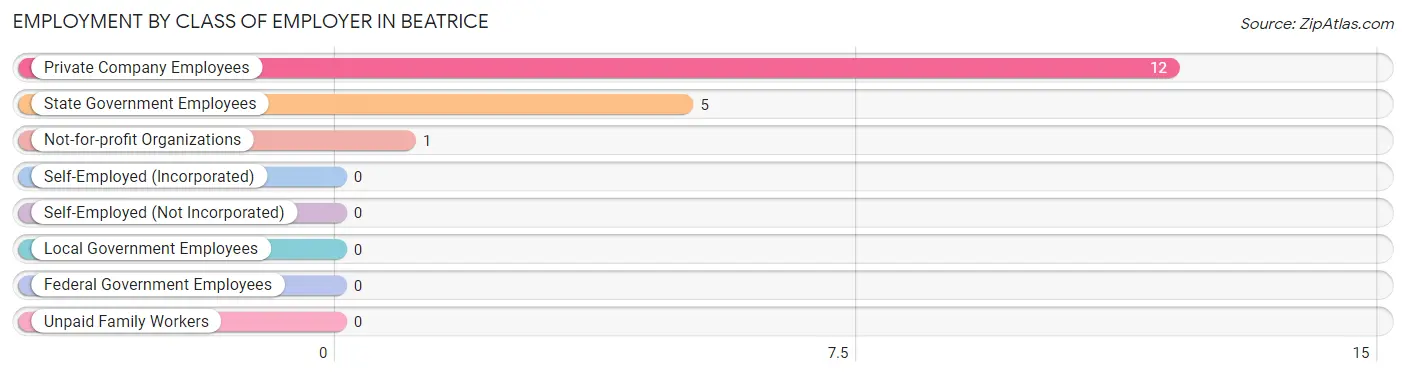
| Employer Class | # Employees | % Employees |
| Private Company Employees | 12 | 66.7% |
| Self-Employed (Incorporated) | 0 | 0.0% |
| Self-Employed (Not Incorporated) | 0 | 0.0% |
| Not-for-profit Organizations | 1 | 5.6% |
| Local Government Employees | 0 | 0.0% |
| State Government Employees | 5 | 27.8% |
| Federal Government Employees | 0 | 0.0% |
| Unpaid Family Workers | 0 | 0.0% |
| Total | 18 | 100.0% |
Employment Status by Age in Beatrice
According to the labor force statistics for Beatrice, out of the total population over 16 years of age (120), 21.7% or 26 individuals are in the labor force, with 26.9% or 7 of them unemployed. The age group with the highest labor force participation rate is 16 to 19 years, with 100.0% or 2 individuals in the labor force. Within the labor force, the 16 to 19 years age range has the highest percentage of unemployed individuals, with 100.0% or 2 of them being unemployed.
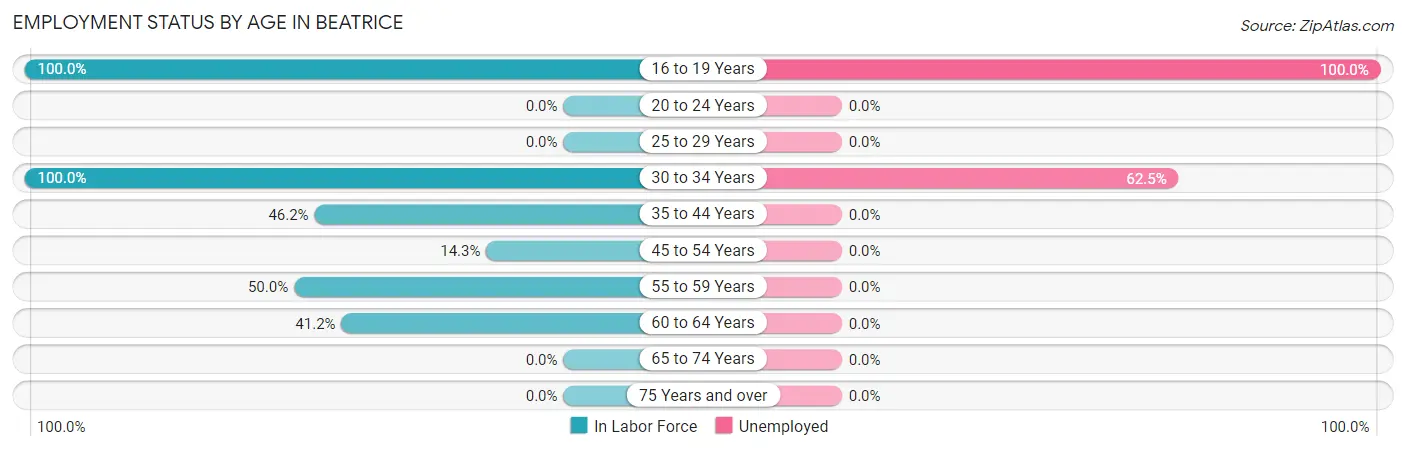
| Age Bracket | In Labor Force | Unemployed |
| 16 to 19 Years | 2 (100.0%) | 2 (100.0%) |
| 20 to 24 Years | 0 (0.0%) | 0 (0.0%) |
| 25 to 29 Years | 0 (0.0%) | 0 (0.0%) |
| 30 to 34 Years | 8 (100.0%) | 5 (62.5%) |
| 35 to 44 Years | 6 (46.2%) | 0 (0.0%) |
| 45 to 54 Years | 1 (14.3%) | 0 (0.0%) |
| 55 to 59 Years | 2 (50.0%) | 0 (0.0%) |
| 60 to 64 Years | 7 (41.2%) | 0 (0.0%) |
| 65 to 74 Years | 0 (0.0%) | 0 (0.0%) |
| 75 Years and over | 0 (0.0%) | 0 (0.0%) |
| Total | 26 (21.7%) | 7 (26.9%) |
Employment Status by Educational Attainment in Beatrice
According to labor force statistics for Beatrice, 37.5% of individuals (24) out of the total population between 25 and 64 years of age (64) are in the labor force, with 20.8% or 5 of them being unemployed. The group with the highest labor force participation rate are those with the educational attainment of bachelor's degree or higher, with 66.7% or 6 individuals in the labor force. Within the labor force, individuals with high school diploma education have the highest percentage of unemployment, with 45.5% or 5 of them being unemployed.
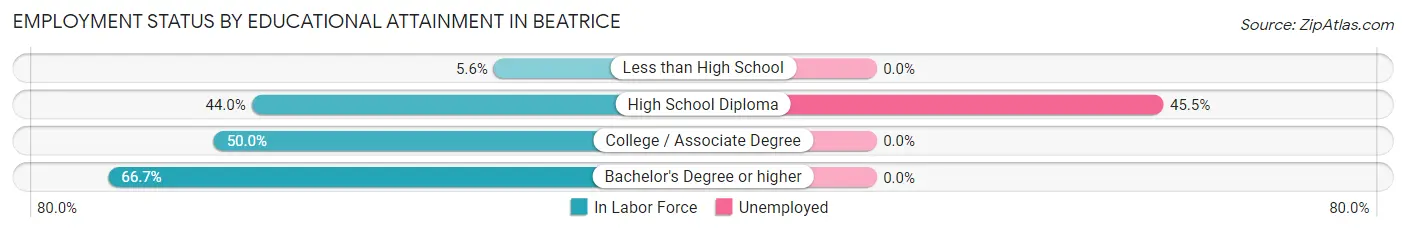
| Educational Attainment | In Labor Force | Unemployed |
| Less than High School | 1 (5.6%) | 0 (0.0%) |
| High School Diploma | 11 (44.0%) | 11 (45.5%) |
| College / Associate Degree | 6 (50.0%) | 0 (0.0%) |
| Bachelor's Degree or higher | 6 (66.7%) | 0 (0.0%) |
| Total | 24 (37.5%) | 13 (20.8%) |
Employment Occupations by Sex in Beatrice
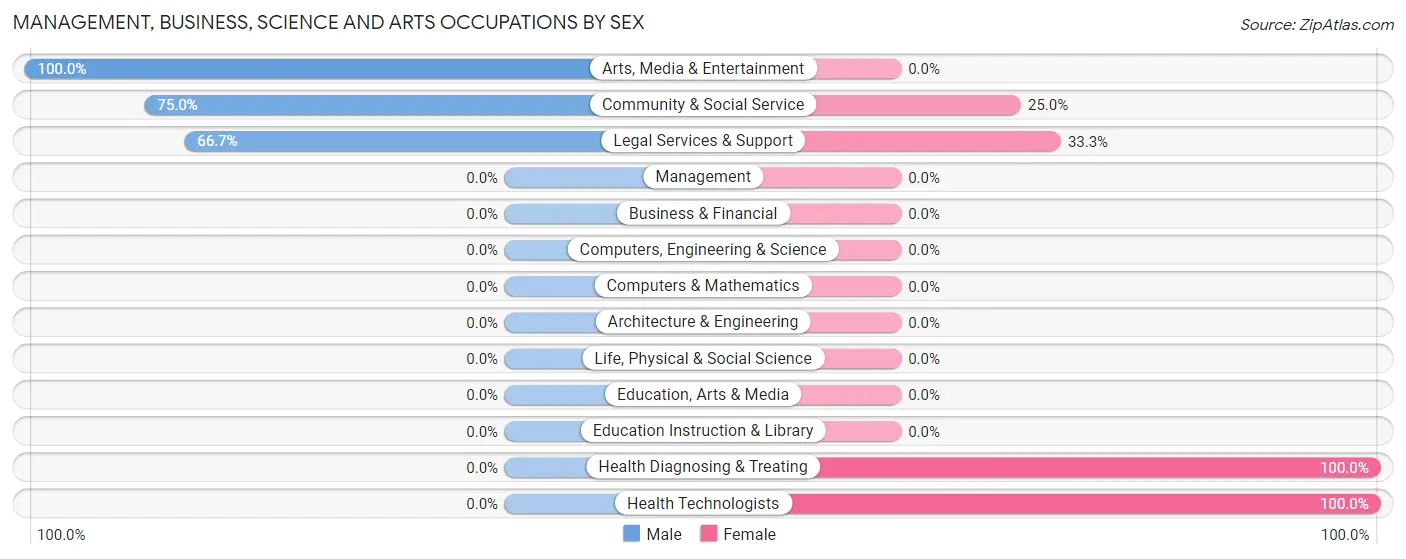
Management, Business, Science and Arts Occupations
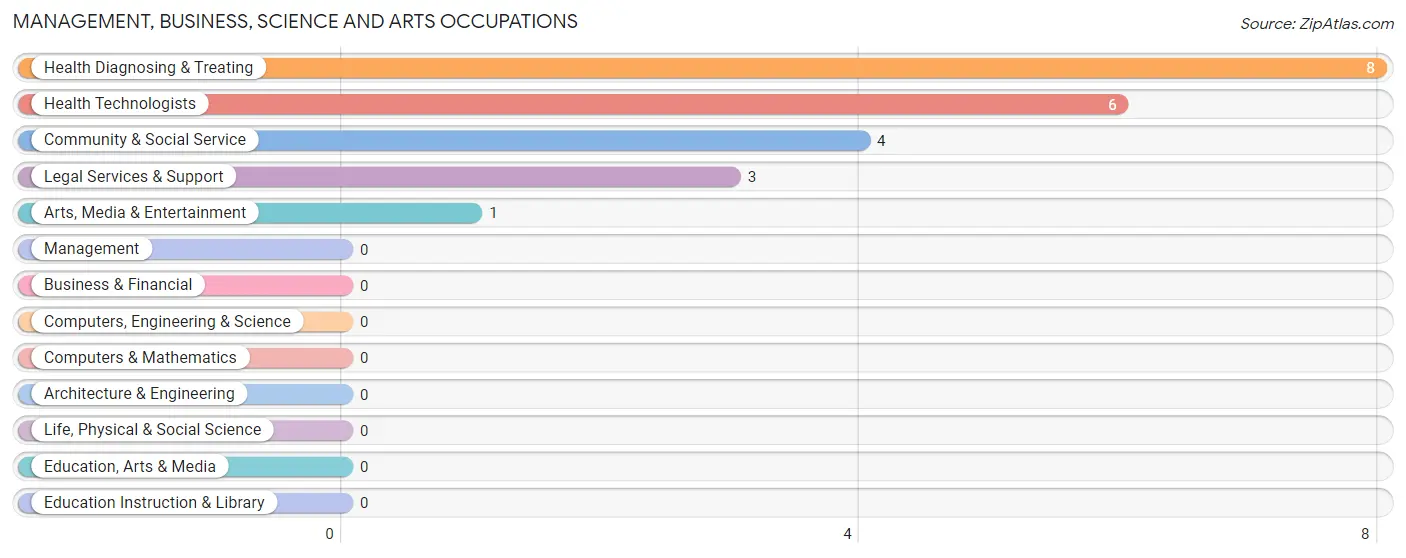
The most common Management, Business, Science and Arts occupations in Beatrice are Health Diagnosing & Treating (8 | 42.1%), Health Technologists (6 | 31.6%), Community & Social Service (4 | 21.0%), Legal Services & Support (3 | 15.8%), and Arts, Media & Entertainment (1 | 5.3%).
Management, Business, Science and Arts Occupations by Sex
Within the Management, Business, Science and Arts occupations in Beatrice, the most male-oriented occupations are Arts, Media & Entertainment (100.0%), Community & Social Service (75.0%), and Legal Services & Support (66.7%), while the most female-oriented occupations are Health Diagnosing & Treating (100.0%), Health Technologists (100.0%), and Legal Services & Support (33.3%).
| Occupation | Male | Female |
| Management | 0 (0.0%) | 0 (0.0%) |
| Business & Financial | 0 (0.0%) | 0 (0.0%) |
| Computers, Engineering & Science | 0 (0.0%) | 0 (0.0%) |
| Computers & Mathematics | 0 (0.0%) | 0 (0.0%) |
| Architecture & Engineering | 0 (0.0%) | 0 (0.0%) |
| Life, Physical & Social Science | 0 (0.0%) | 0 (0.0%) |
| Community & Social Service | 3 (75.0%) | 1 (25.0%) |
| Education, Arts & Media | 0 (0.0%) | 0 (0.0%) |
| Legal Services & Support | 2 (66.7%) | 1 (33.3%) |
| Education Instruction & Library | 0 (0.0%) | 0 (0.0%) |
| Arts, Media & Entertainment | 1 (100.0%) | 0 (0.0%) |
| Health Diagnosing & Treating | 0 (0.0%) | 8 (100.0%) |
| Health Technologists | 0 (0.0%) | 6 (100.0%) |
| Total (Category) | 3 (25.0%) | 9 (75.0%) |
| Total (Overall) | 7 (36.8%) | 12 (63.2%) |
Services Occupations
Services Occupations by Sex
| Occupation | Male | Female |
| Healthcare Support | 0 (0.0%) | 0 (0.0%) |
| Security & Protection | 0 (0.0%) | 0 (0.0%) |
| Firefighting & Prevention | 0 (0.0%) | 0 (0.0%) |
| Law Enforcement | 0 (0.0%) | 0 (0.0%) |
| Food Preparation & Serving | 0 (0.0%) | 0 (0.0%) |
| Cleaning & Maintenance | 0 (0.0%) | 0 (0.0%) |
| Personal Care & Service | 0 (0.0%) | 0 (0.0%) |
| Total (Category) | 0 (0.0%) | 0 (0.0%) |
| Total (Overall) | 7 (36.8%) | 12 (63.2%) |
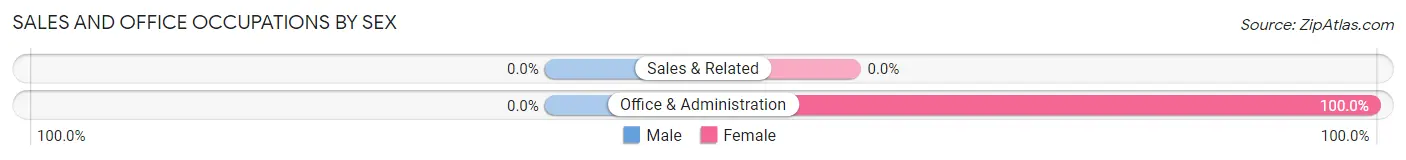
Sales and Office Occupations
The most common Sales and Office occupations in Beatrice are , and Office & Administration (2 | 10.5%).
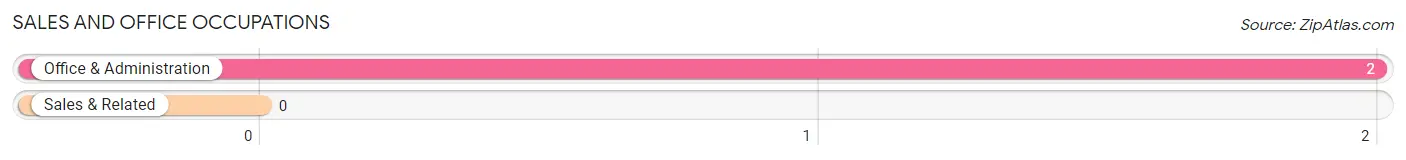
Sales and Office Occupations by Sex
| Occupation | Male | Female |
| Sales & Related | 0 (0.0%) | 0 (0.0%) |
| Office & Administration | 0 (0.0%) | 2 (100.0%) |
| Total (Category) | 0 (0.0%) | 2 (100.0%) |
| Total (Overall) | 7 (36.8%) | 12 (63.2%) |
Natural Resources, Construction and Maintenance Occupations
Natural Resources, Construction and Maintenance Occupations by Sex
| Occupation | Male | Female |
| Farming, Fishing & Forestry | 0 (0.0%) | 0 (0.0%) |
| Construction & Extraction | 0 (0.0%) | 0 (0.0%) |
| Installation, Maintenance & Repair | 0 (0.0%) | 0 (0.0%) |
| Total (Category) | 0 (0.0%) | 0 (0.0%) |
| Total (Overall) | 7 (36.8%) | 12 (63.2%) |
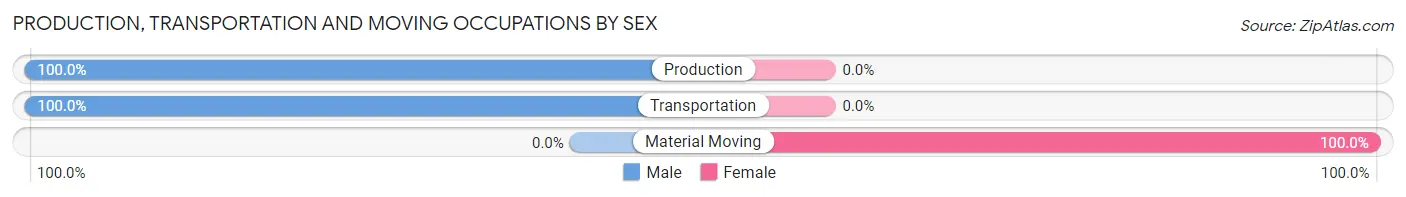
Production, Transportation and Moving Occupations
The most common Production, Transportation and Moving occupations in Beatrice are Production (2 | 10.5%), Transportation (2 | 10.5%), and Material Moving (1 | 5.3%).
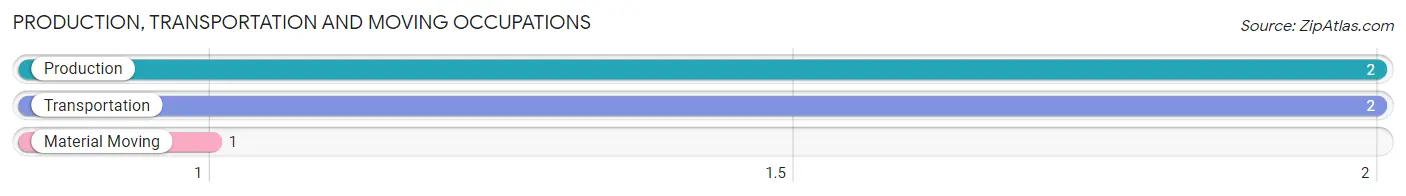
Production, Transportation and Moving Occupations by Sex
| Occupation | Male | Female |
| Production | 2 (100.0%) | 0 (0.0%) |
| Transportation | 2 (100.0%) | 0 (0.0%) |
| Material Moving | 0 (0.0%) | 1 (100.0%) |
| Total (Category) | 4 (80.0%) | 1 (20.0%) |
| Total (Overall) | 7 (36.8%) | 12 (63.2%) |
Employment Industries by Sex in Beatrice
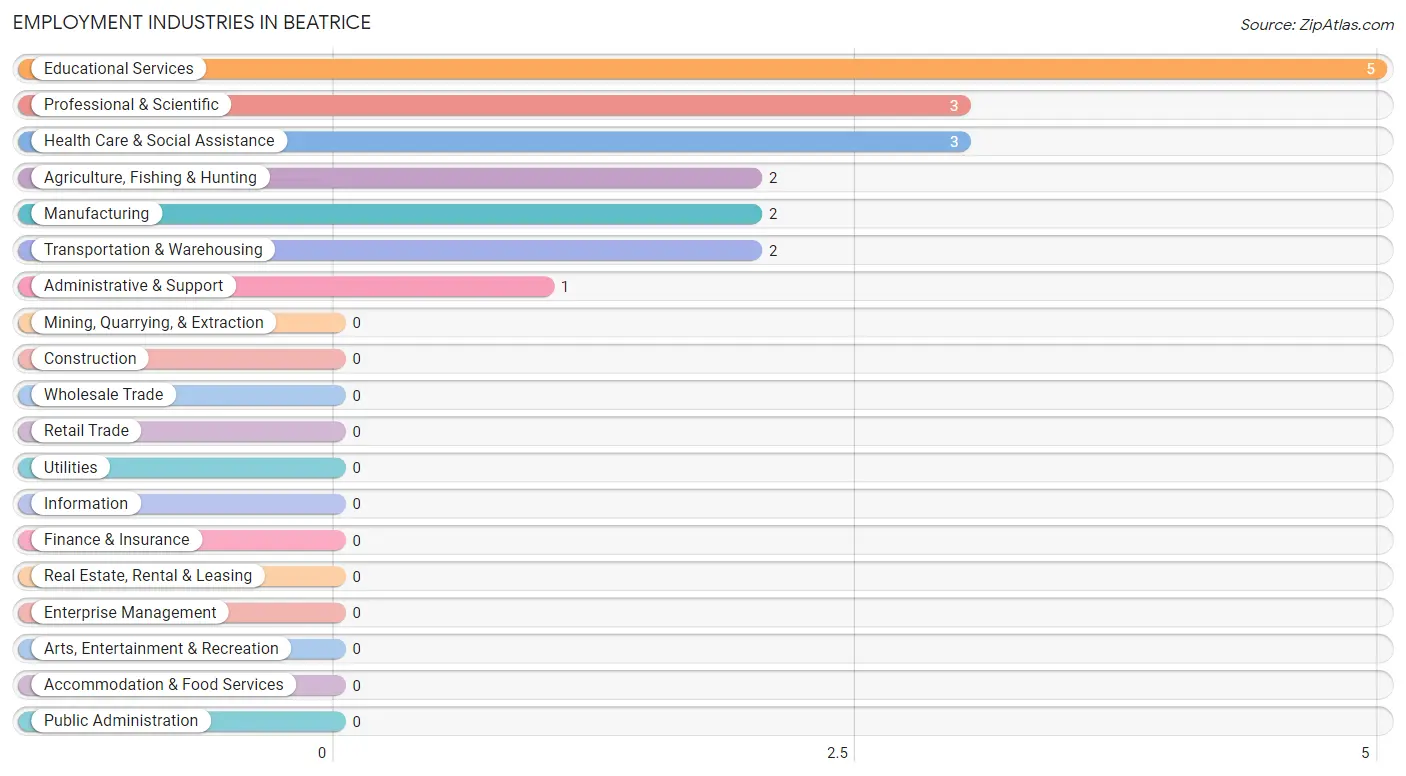
Employment Industries in Beatrice
The major employment industries in Beatrice include Educational Services (5 | 26.3%), Professional & Scientific (3 | 15.8%), Health Care & Social Assistance (3 | 15.8%), Agriculture, Fishing & Hunting (2 | 10.5%), and Manufacturing (2 | 10.5%).
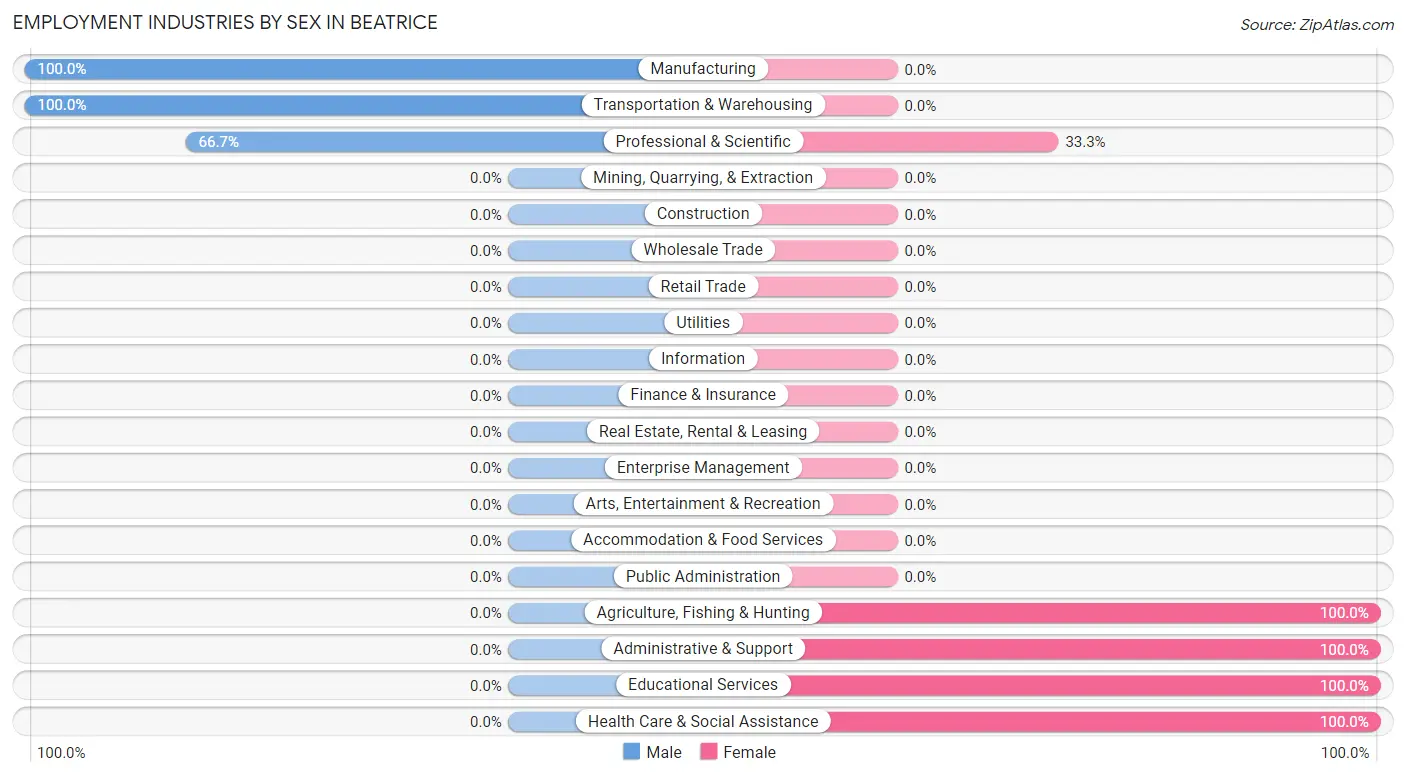
Employment Industries by Sex in Beatrice
The Beatrice industries that see more men than women are Manufacturing (100.0%), Transportation & Warehousing (100.0%), and Professional & Scientific (66.7%), whereas the industries that tend to have a higher number of women are Agriculture, Fishing & Hunting (100.0%), Administrative & Support (100.0%), and Educational Services (100.0%).
| Industry | Male | Female |
| Agriculture, Fishing & Hunting | 0 (0.0%) | 2 (100.0%) |
| Mining, Quarrying, & Extraction | 0 (0.0%) | 0 (0.0%) |
| Construction | 0 (0.0%) | 0 (0.0%) |
| Manufacturing | 2 (100.0%) | 0 (0.0%) |
| Wholesale Trade | 0 (0.0%) | 0 (0.0%) |
| Retail Trade | 0 (0.0%) | 0 (0.0%) |
| Transportation & Warehousing | 2 (100.0%) | 0 (0.0%) |
| Utilities | 0 (0.0%) | 0 (0.0%) |
| Information | 0 (0.0%) | 0 (0.0%) |
| Finance & Insurance | 0 (0.0%) | 0 (0.0%) |
| Real Estate, Rental & Leasing | 0 (0.0%) | 0 (0.0%) |
| Professional & Scientific | 2 (66.7%) | 1 (33.3%) |
| Enterprise Management | 0 (0.0%) | 0 (0.0%) |
| Administrative & Support | 0 (0.0%) | 1 (100.0%) |
| Educational Services | 0 (0.0%) | 5 (100.0%) |
| Health Care & Social Assistance | 0 (0.0%) | 3 (100.0%) |
| Arts, Entertainment & Recreation | 0 (0.0%) | 0 (0.0%) |
| Accommodation & Food Services | 0 (0.0%) | 0 (0.0%) |
| Public Administration | 0 (0.0%) | 0 (0.0%) |
| Total | 7 (36.8%) | 12 (63.2%) |
Education in Beatrice
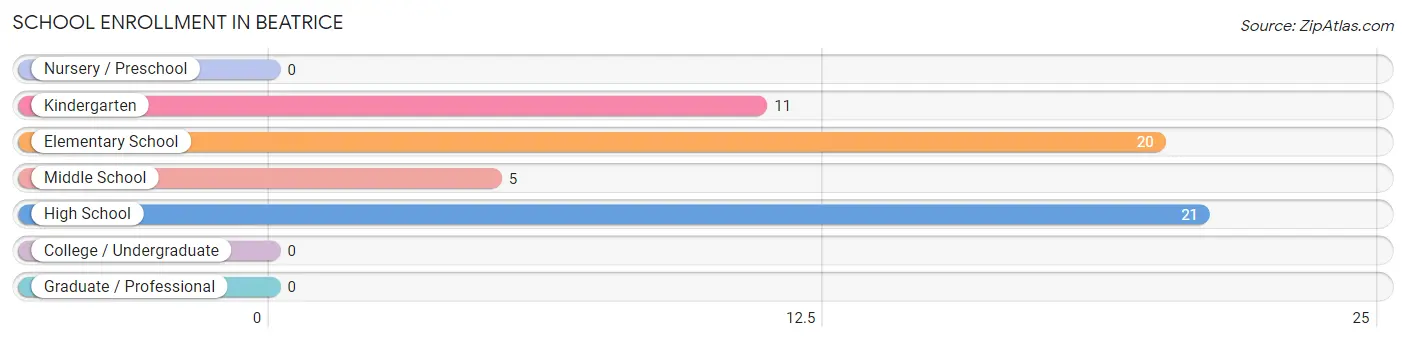
School Enrollment in Beatrice
The most common levels of schooling among the 57 students in Beatrice are high school (21 | 36.8%), elementary school (20 | 35.1%), and kindergarten (11 | 19.3%).
| School Level | # Students | % Students |
| Nursery / Preschool | 0 | 0.0% |
| Kindergarten | 11 | 19.3% |
| Elementary School | 20 | 35.1% |
| Middle School | 5 | 8.8% |
| High School | 21 | 36.8% |
| College / Undergraduate | 0 | 0.0% |
| Graduate / Professional | 0 | 0.0% |
| Total | 57 | 100.0% |
School Enrollment by Age by Funding Source in Beatrice
Out of a total of 57 students who are enrolled in schools in Beatrice, 11 (19.3%) attend a private institution, while the remaining 46 (80.7%) are enrolled in public schools. The age group of 15 to 17 year olds has the highest likelihood of being enrolled in private schools, with 2 (100.0% in the age bracket) enrolled. Conversely, the age group of 5 to 9 year old has the lowest likelihood of being enrolled in a private school, with 27 (87.1% in the age bracket) attending a public institution.
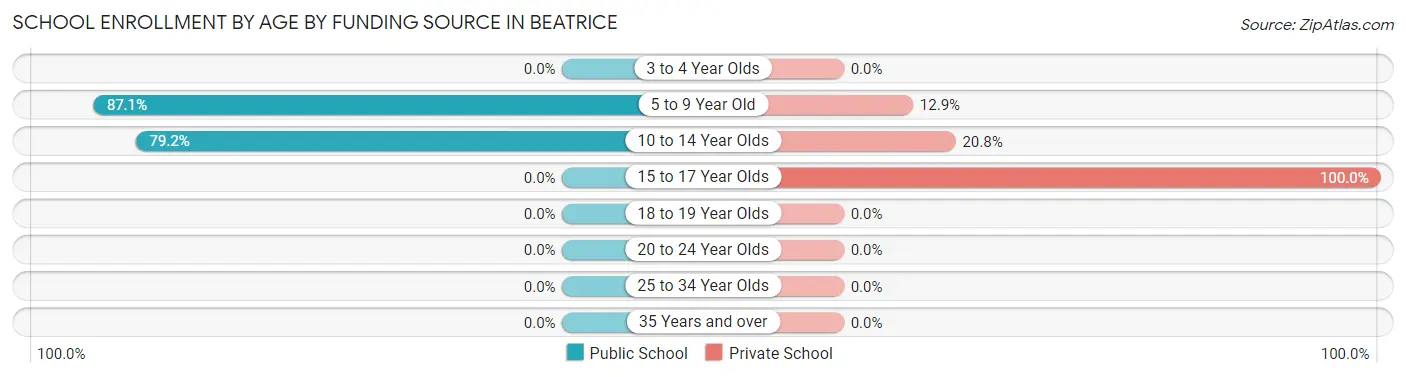
| Age Bracket | Public School | Private School |
| 3 to 4 Year Olds | 0 (0.0%) | 0 (0.0%) |
| 5 to 9 Year Old | 27 (87.1%) | 4 (12.9%) |
| 10 to 14 Year Olds | 19 (79.2%) | 5 (20.8%) |
| 15 to 17 Year Olds | 0 (0.0%) | 2 (100.0%) |
| 18 to 19 Year Olds | 0 (0.0%) | 0 (0.0%) |
| 20 to 24 Year Olds | 0 (0.0%) | 0 (0.0%) |
| 25 to 34 Year Olds | 0 (0.0%) | 0 (0.0%) |
| 35 Years and over | 0 (0.0%) | 0 (0.0%) |
| Total | 46 (80.7%) | 11 (19.3%) |
Educational Attainment by Field of Study in Beatrice
Bio, nature & agricultural (5 | 38.5%), education (4 | 30.8%), business (3 | 23.1%), and science & technology (1 | 7.7%) are the most common fields of study among 13 individuals in Beatrice who have obtained a bachelor's degree or higher.
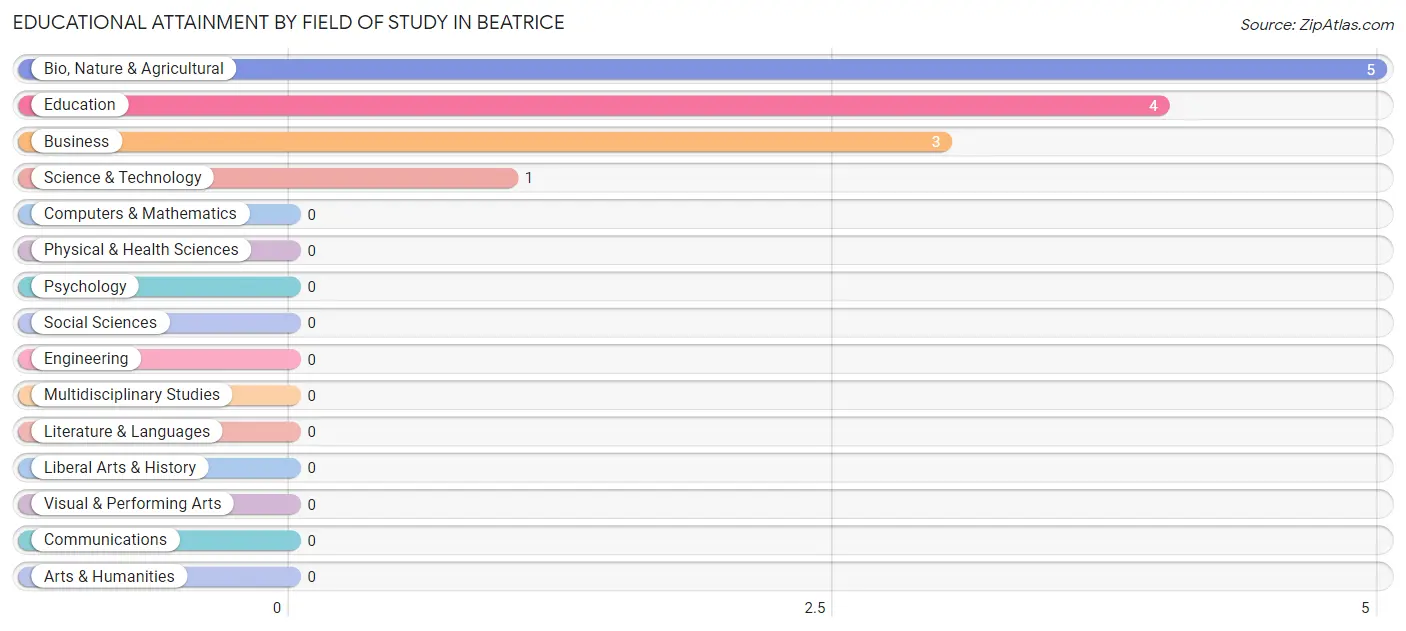
| Field of Study | # Graduates | % Graduates |
| Computers & Mathematics | 0 | 0.0% |
| Bio, Nature & Agricultural | 5 | 38.5% |
| Physical & Health Sciences | 0 | 0.0% |
| Psychology | 0 | 0.0% |
| Social Sciences | 0 | 0.0% |
| Engineering | 0 | 0.0% |
| Multidisciplinary Studies | 0 | 0.0% |
| Science & Technology | 1 | 7.7% |
| Business | 3 | 23.1% |
| Education | 4 | 30.8% |
| Literature & Languages | 0 | 0.0% |
| Liberal Arts & History | 0 | 0.0% |
| Visual & Performing Arts | 0 | 0.0% |
| Communications | 0 | 0.0% |
| Arts & Humanities | 0 | 0.0% |
| Total | 13 | 100.0% |
Transportation & Commute in Beatrice
Vehicle Availability by Sex in Beatrice
The most prevalent vehicle ownership categories in Beatrice are males with 2 vehicles (5, accounting for 71.4%) and females with 2 vehicles (3, making up 45.5%).
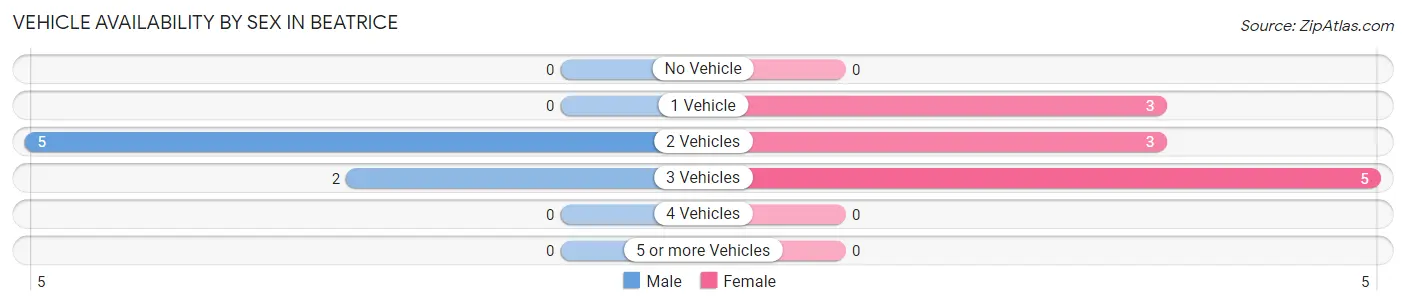
| Vehicles Available | Male | Female |
| No Vehicle | 0 (0.0%) | 0 (0.0%) |
| 1 Vehicle | 0 (0.0%) | 3 (27.3%) |
| 2 Vehicles | 5 (71.4%) | 3 (27.3%) |
| 3 Vehicles | 2 (28.6%) | 5 (45.5%) |
| 4 Vehicles | 0 (0.0%) | 0 (0.0%) |
| 5 or more Vehicles | 0 (0.0%) | 0 (0.0%) |
| Total | 7 (100.0%) | 11 (100.0%) |
Commute Time in Beatrice
The most frequently occuring commute durations in Beatrice are less than 5 minutes (7 commuters, 38.9%), 25 to 29 minutes (5 commuters, 27.8%), and 30 to 34 minutes (3 commuters, 16.7%).
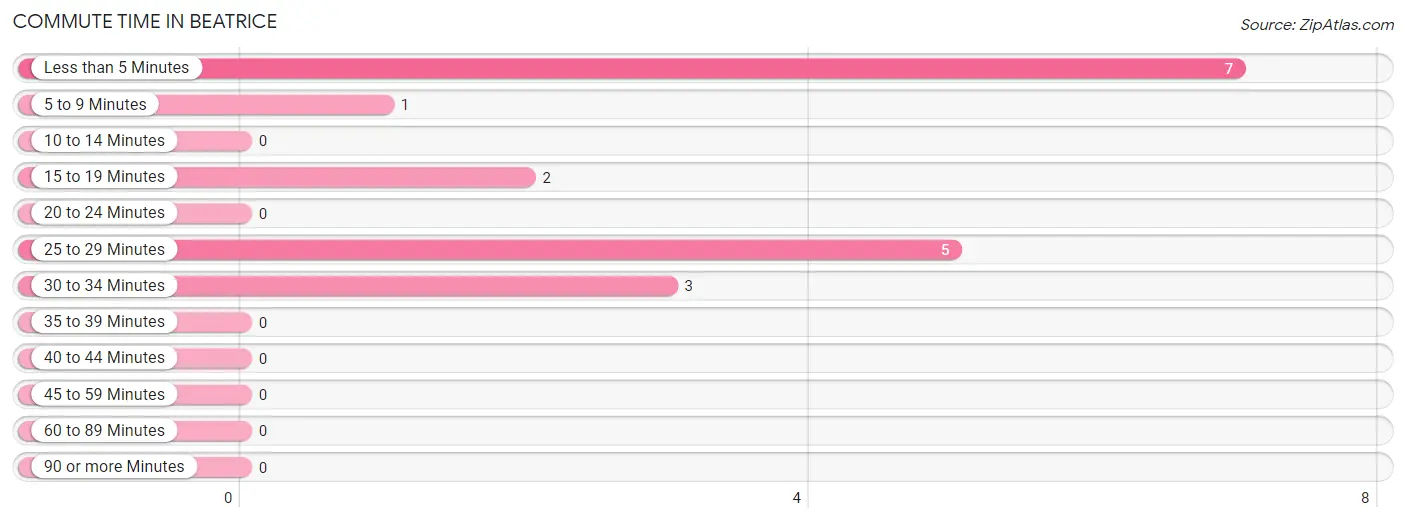
| Commute Time | # Commuters | % Commuters |
| Less than 5 Minutes | 7 | 38.9% |
| 5 to 9 Minutes | 1 | 5.6% |
| 10 to 14 Minutes | 0 | 0.0% |
| 15 to 19 Minutes | 2 | 11.1% |
| 20 to 24 Minutes | 0 | 0.0% |
| 25 to 29 Minutes | 5 | 27.8% |
| 30 to 34 Minutes | 3 | 16.7% |
| 35 to 39 Minutes | 0 | 0.0% |
| 40 to 44 Minutes | 0 | 0.0% |
| 45 to 59 Minutes | 0 | 0.0% |
| 60 to 89 Minutes | 0 | 0.0% |
| 90 or more Minutes | 0 | 0.0% |
Commute Time by Sex in Beatrice
The most common commute times in Beatrice are 25 to 29 minutes (4 commuters, 57.1%) for males and less than 5 minutes (7 commuters, 63.6%) for females.
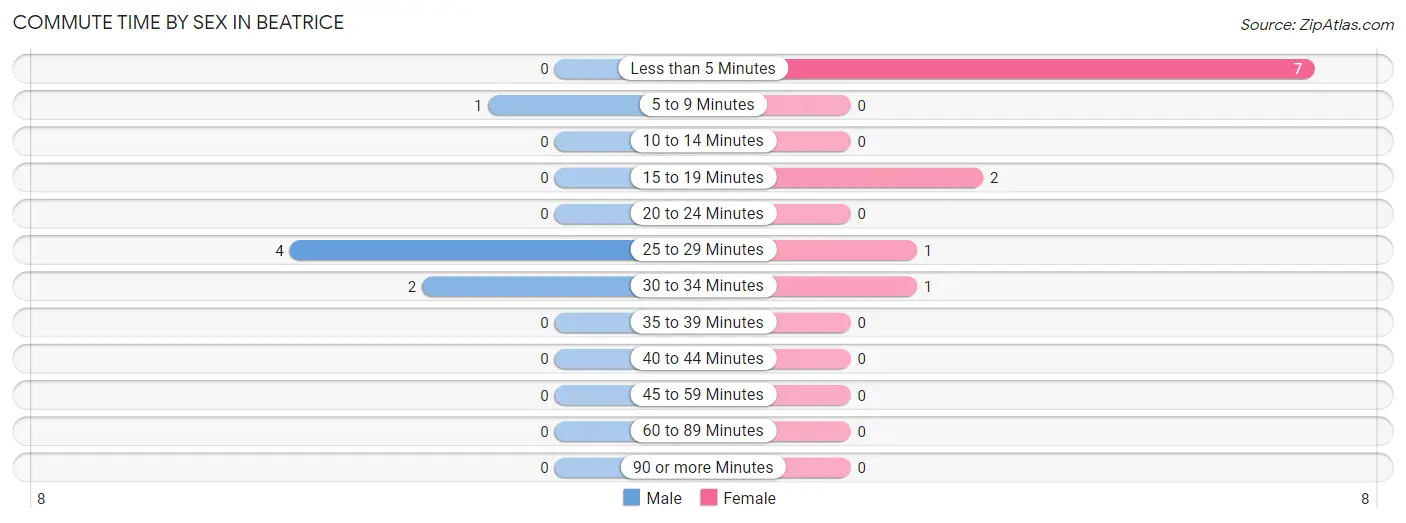
| Commute Time | Male | Female |
| Less than 5 Minutes | 0 (0.0%) | 7 (63.6%) |
| 5 to 9 Minutes | 1 (14.3%) | 0 (0.0%) |
| 10 to 14 Minutes | 0 (0.0%) | 0 (0.0%) |
| 15 to 19 Minutes | 0 (0.0%) | 2 (18.2%) |
| 20 to 24 Minutes | 0 (0.0%) | 0 (0.0%) |
| 25 to 29 Minutes | 4 (57.1%) | 1 (9.1%) |
| 30 to 34 Minutes | 2 (28.6%) | 1 (9.1%) |
| 35 to 39 Minutes | 0 (0.0%) | 0 (0.0%) |
| 40 to 44 Minutes | 0 (0.0%) | 0 (0.0%) |
| 45 to 59 Minutes | 0 (0.0%) | 0 (0.0%) |
| 60 to 89 Minutes | 0 (0.0%) | 0 (0.0%) |
| 90 or more Minutes | 0 (0.0%) | 0 (0.0%) |
Time of Departure to Work by Sex in Beatrice
The most frequent times of departure to work in Beatrice are 12:00 AM to 4:59 AM (4, 57.1%) for males and 7:00 AM to 7:29 AM (5, 45.5%) for females.
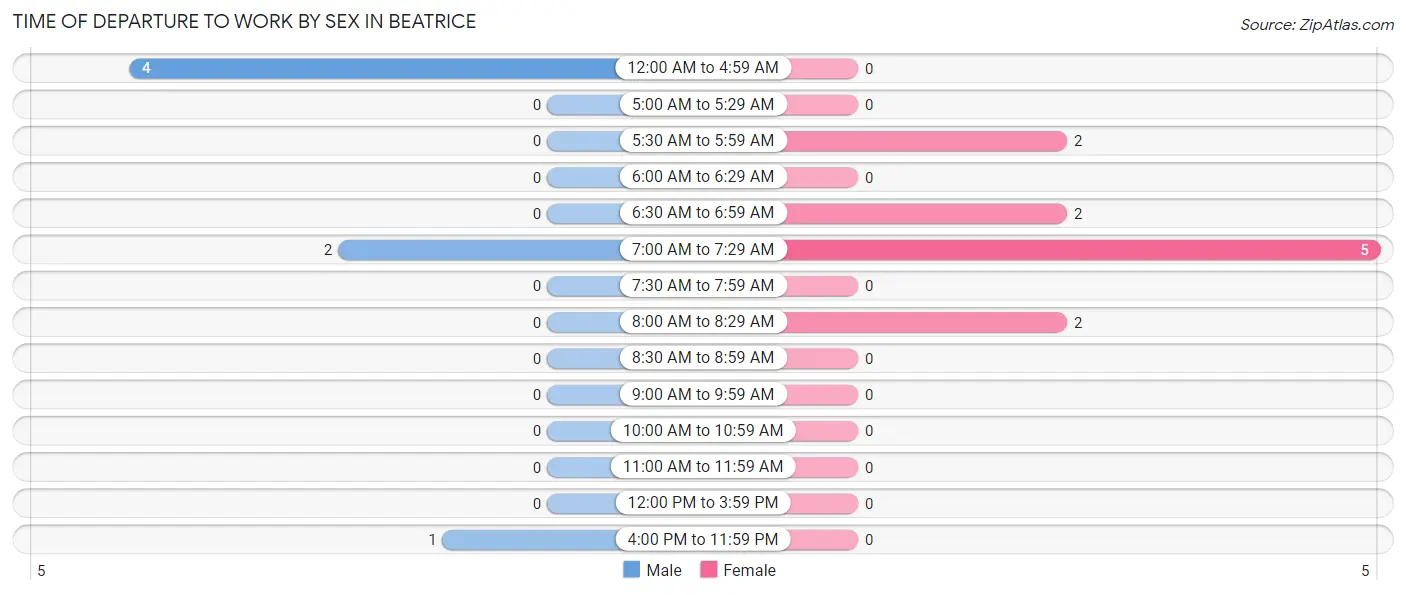
| Time of Departure | Male | Female |
| 12:00 AM to 4:59 AM | 4 (57.1%) | 0 (0.0%) |
| 5:00 AM to 5:29 AM | 0 (0.0%) | 0 (0.0%) |
| 5:30 AM to 5:59 AM | 0 (0.0%) | 2 (18.2%) |
| 6:00 AM to 6:29 AM | 0 (0.0%) | 0 (0.0%) |
| 6:30 AM to 6:59 AM | 0 (0.0%) | 2 (18.2%) |
| 7:00 AM to 7:29 AM | 2 (28.6%) | 5 (45.5%) |
| 7:30 AM to 7:59 AM | 0 (0.0%) | 0 (0.0%) |
| 8:00 AM to 8:29 AM | 0 (0.0%) | 2 (18.2%) |
| 8:30 AM to 8:59 AM | 0 (0.0%) | 0 (0.0%) |
| 9:00 AM to 9:59 AM | 0 (0.0%) | 0 (0.0%) |
| 10:00 AM to 10:59 AM | 0 (0.0%) | 0 (0.0%) |
| 11:00 AM to 11:59 AM | 0 (0.0%) | 0 (0.0%) |
| 12:00 PM to 3:59 PM | 0 (0.0%) | 0 (0.0%) |
| 4:00 PM to 11:59 PM | 1 (14.3%) | 0 (0.0%) |
| Total | 7 (100.0%) | 11 (100.0%) |
Housing Occupancy in Beatrice
Occupancy by Ownership in Beatrice
Of the total 60 dwellings in Beatrice, owner-occupied units account for 46 (76.7%), while renter-occupied units make up 14 (23.3%).
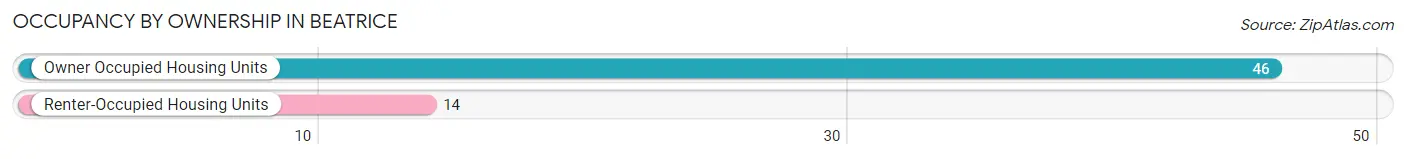
| Occupancy | # Housing Units | % Housing Units |
| Owner Occupied Housing Units | 46 | 76.7% |
| Renter-Occupied Housing Units | 14 | 23.3% |
| Total Occupied Housing Units | 60 | 100.0% |
Occupancy by Household Size in Beatrice
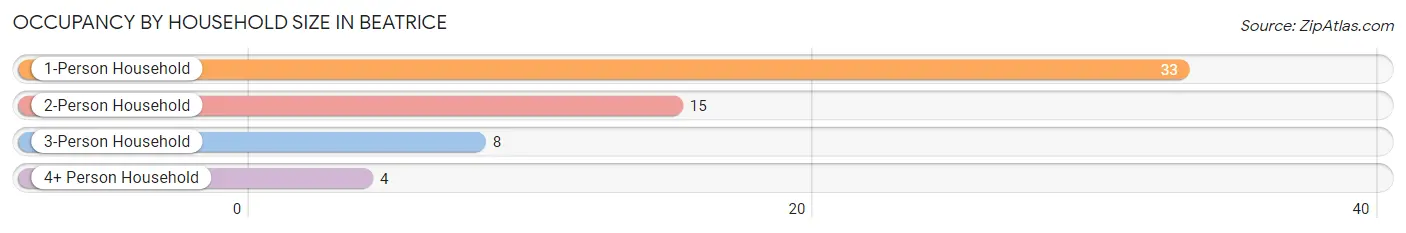
| Household Size | # Housing Units | % Housing Units |
| 1-Person Household | 33 | 55.0% |
| 2-Person Household | 15 | 25.0% |
| 3-Person Household | 8 | 13.3% |
| 4+ Person Household | 4 | 6.7% |
| Total Housing Units | 60 | 100.0% |
Occupancy by Ownership by Household Size in Beatrice
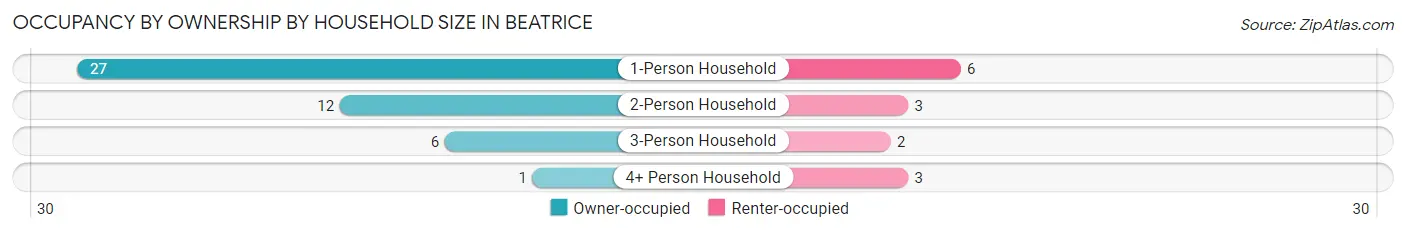
| Household Size | Owner-occupied | Renter-occupied |
| 1-Person Household | 27 (81.8%) | 6 (18.2%) |
| 2-Person Household | 12 (80.0%) | 3 (20.0%) |
| 3-Person Household | 6 (75.0%) | 2 (25.0%) |
| 4+ Person Household | 1 (25.0%) | 3 (75.0%) |
| Total Housing Units | 46 (76.7%) | 14 (23.3%) |
Occupancy by Educational Attainment in Beatrice
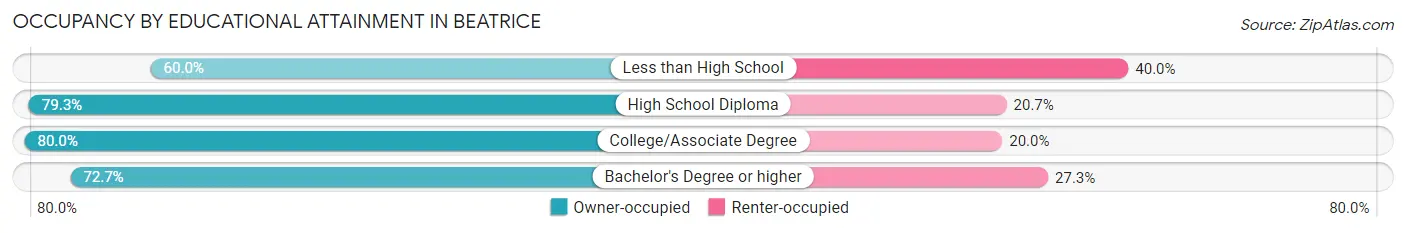
| Household Size | Owner-occupied | Renter-occupied |
| Less than High School | 3 (60.0%) | 2 (40.0%) |
| High School Diploma | 23 (79.3%) | 6 (20.7%) |
| College/Associate Degree | 12 (80.0%) | 3 (20.0%) |
| Bachelor's Degree or higher | 8 (72.7%) | 3 (27.3%) |
Occupancy by Age of Householder in Beatrice
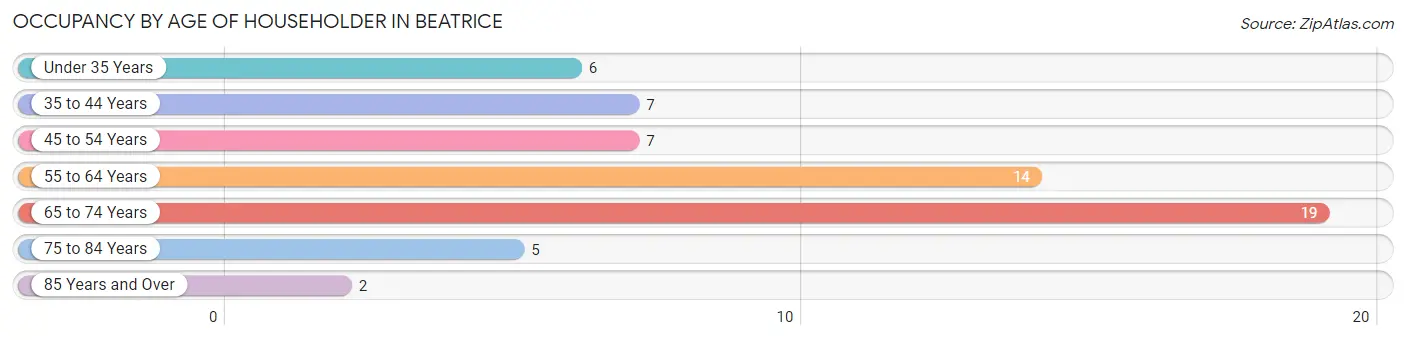
| Age Bracket | # Households | % Households |
| Under 35 Years | 6 | 10.0% |
| 35 to 44 Years | 7 | 11.7% |
| 45 to 54 Years | 7 | 11.7% |
| 55 to 64 Years | 14 | 23.3% |
| 65 to 74 Years | 19 | 31.7% |
| 75 to 84 Years | 5 | 8.3% |
| 85 Years and Over | 2 | 3.3% |
| Total | 60 | 100.0% |
Housing Finances in Beatrice
Median Income by Occupancy in Beatrice
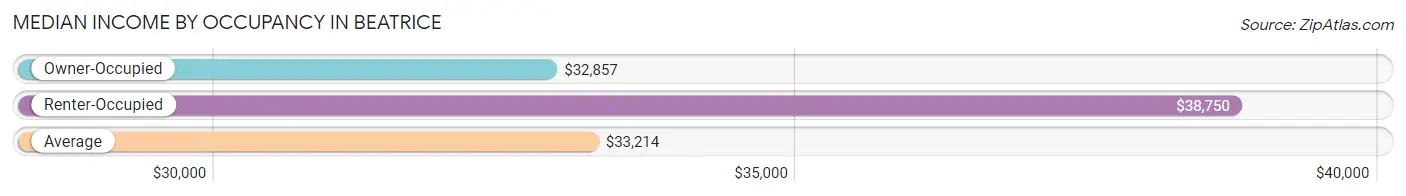
| Occupancy Type | # Households | Median Income |
| Owner-Occupied | 46 (76.7%) | $32,857 |
| Renter-Occupied | 14 (23.3%) | $38,750 |
| Average | 60 (100.0%) | $33,214 |
Occupancy by Householder Income Bracket in Beatrice
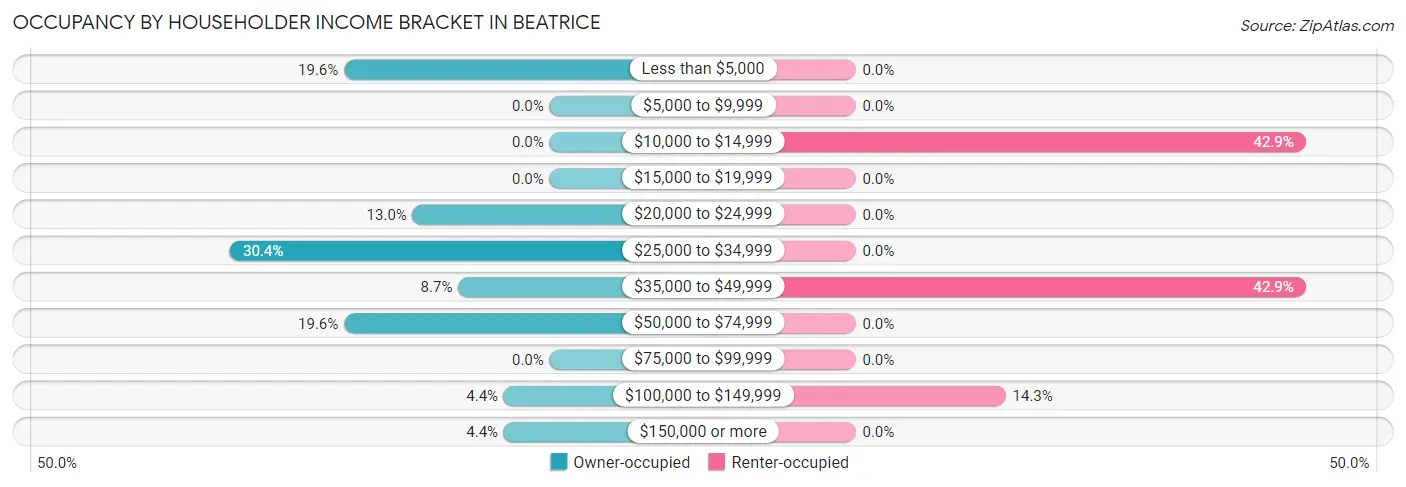
| Income Bracket | Owner-occupied | Renter-occupied |
| Less than $5,000 | 9 (19.6%) | 0 (0.0%) |
| $5,000 to $9,999 | 0 (0.0%) | 0 (0.0%) |
| $10,000 to $14,999 | 0 (0.0%) | 6 (42.9%) |
| $15,000 to $19,999 | 0 (0.0%) | 0 (0.0%) |
| $20,000 to $24,999 | 6 (13.0%) | 0 (0.0%) |
| $25,000 to $34,999 | 14 (30.4%) | 0 (0.0%) |
| $35,000 to $49,999 | 4 (8.7%) | 6 (42.9%) |
| $50,000 to $74,999 | 9 (19.6%) | 0 (0.0%) |
| $75,000 to $99,999 | 0 (0.0%) | 0 (0.0%) |
| $100,000 to $149,999 | 2 (4.3%) | 2 (14.3%) |
| $150,000 or more | 2 (4.3%) | 0 (0.0%) |
| Total | 46 (100.0%) | 14 (100.0%) |
Monthly Housing Cost Tiers in Beatrice
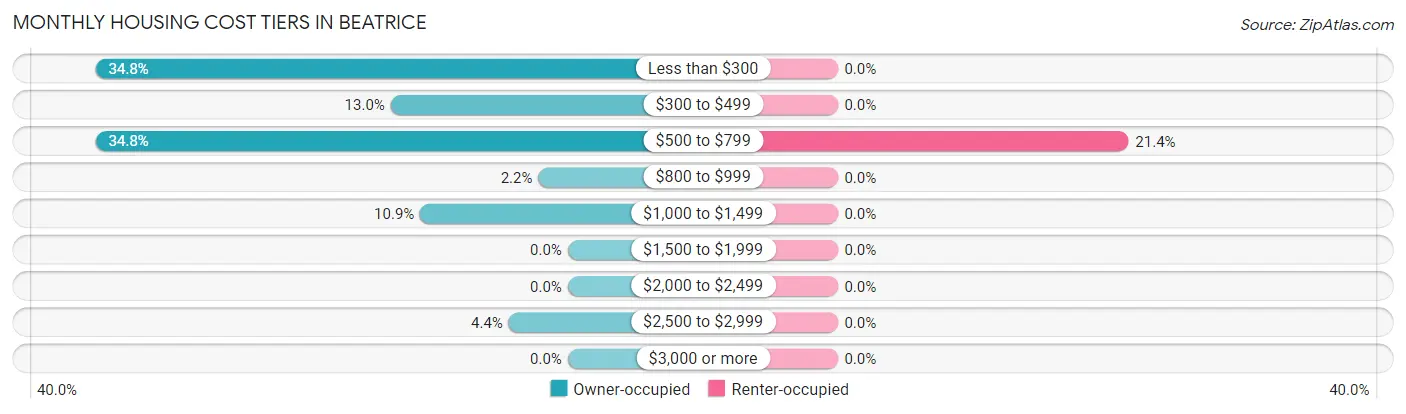
| Monthly Cost | Owner-occupied | Renter-occupied |
| Less than $300 | 16 (34.8%) | 0 (0.0%) |
| $300 to $499 | 6 (13.0%) | 0 (0.0%) |
| $500 to $799 | 16 (34.8%) | 3 (21.4%) |
| $800 to $999 | 1 (2.2%) | 0 (0.0%) |
| $1,000 to $1,499 | 5 (10.9%) | 0 (0.0%) |
| $1,500 to $1,999 | 0 (0.0%) | 0 (0.0%) |
| $2,000 to $2,499 | 0 (0.0%) | 0 (0.0%) |
| $2,500 to $2,999 | 2 (4.3%) | 0 (0.0%) |
| $3,000 or more | 0 (0.0%) | 0 (0.0%) |
| Total | 46 (100.0%) | 14 (100.0%) |
Physical Housing Characteristics in Beatrice
Housing Structures in Beatrice
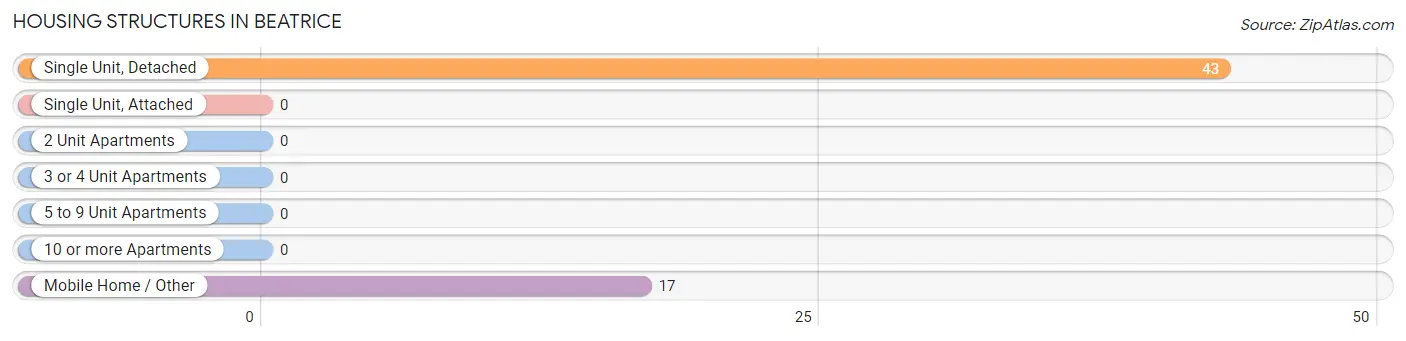
| Structure Type | # Housing Units | % Housing Units |
| Single Unit, Detached | 43 | 71.7% |
| Single Unit, Attached | 0 | 0.0% |
| 2 Unit Apartments | 0 | 0.0% |
| 3 or 4 Unit Apartments | 0 | 0.0% |
| 5 to 9 Unit Apartments | 0 | 0.0% |
| 10 or more Apartments | 0 | 0.0% |
| Mobile Home / Other | 17 | 28.3% |
| Total | 60 | 100.0% |
Housing Structures by Occupancy in Beatrice
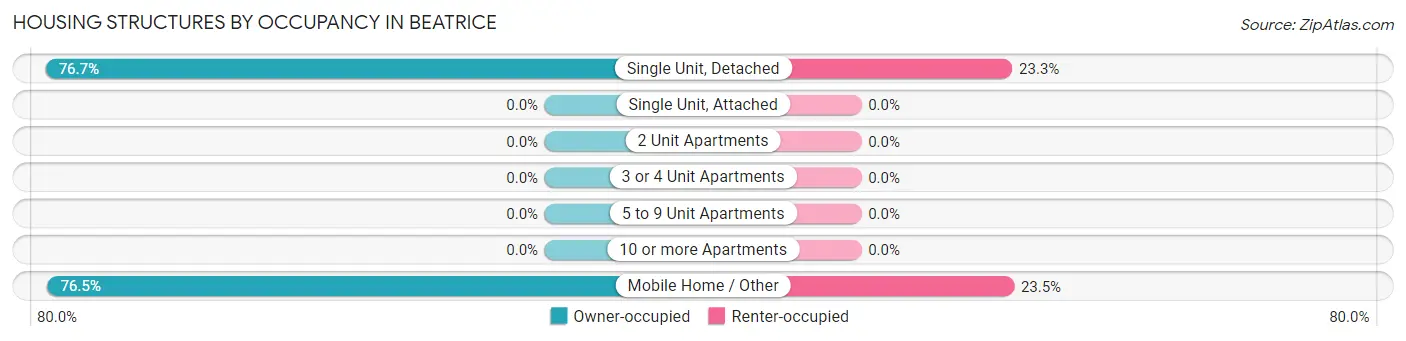
| Structure Type | Owner-occupied | Renter-occupied |
| Single Unit, Detached | 33 (76.7%) | 10 (23.3%) |
| Single Unit, Attached | 0 (0.0%) | 0 (0.0%) |
| 2 Unit Apartments | 0 (0.0%) | 0 (0.0%) |
| 3 or 4 Unit Apartments | 0 (0.0%) | 0 (0.0%) |
| 5 to 9 Unit Apartments | 0 (0.0%) | 0 (0.0%) |
| 10 or more Apartments | 0 (0.0%) | 0 (0.0%) |
| Mobile Home / Other | 13 (76.5%) | 4 (23.5%) |
| Total | 46 (76.7%) | 14 (23.3%) |
Housing Structures by Number of Rooms in Beatrice
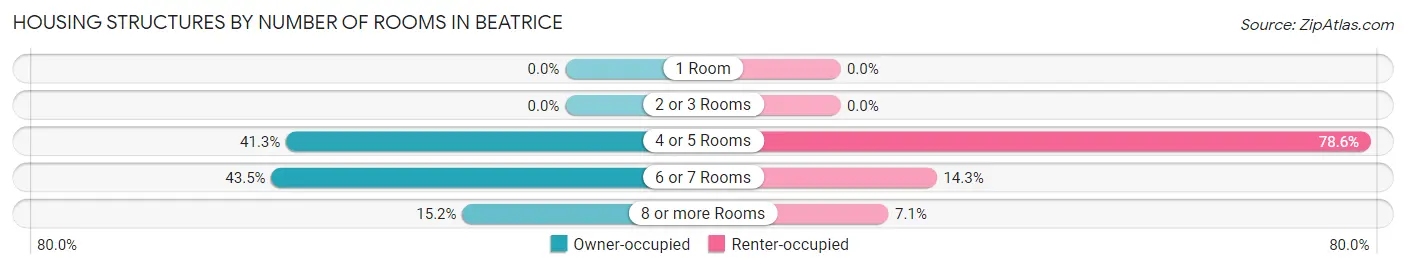
| Number of Rooms | Owner-occupied | Renter-occupied |
| 1 Room | 0 (0.0%) | 0 (0.0%) |
| 2 or 3 Rooms | 0 (0.0%) | 0 (0.0%) |
| 4 or 5 Rooms | 19 (41.3%) | 11 (78.6%) |
| 6 or 7 Rooms | 20 (43.5%) | 2 (14.3%) |
| 8 or more Rooms | 7 (15.2%) | 1 (7.1%) |
| Total | 46 (100.0%) | 14 (100.0%) |
Housing Structure by Heating Type in Beatrice
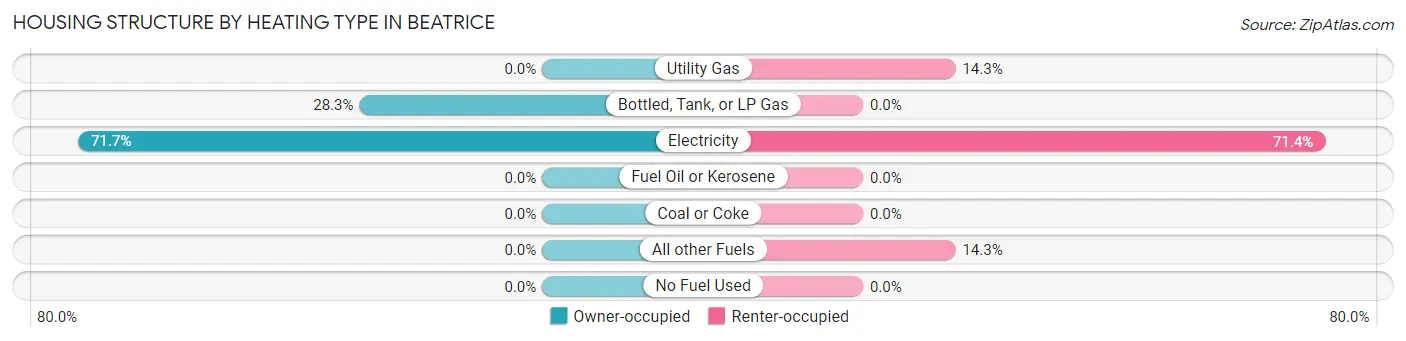
| Heating Type | Owner-occupied | Renter-occupied |
| Utility Gas | 0 (0.0%) | 2 (14.3%) |
| Bottled, Tank, or LP Gas | 13 (28.3%) | 0 (0.0%) |
| Electricity | 33 (71.7%) | 10 (71.4%) |
| Fuel Oil or Kerosene | 0 (0.0%) | 0 (0.0%) |
| Coal or Coke | 0 (0.0%) | 0 (0.0%) |
| All other Fuels | 0 (0.0%) | 2 (14.3%) |
| No Fuel Used | 0 (0.0%) | 0 (0.0%) |
| Total | 46 (100.0%) | 14 (100.0%) |
Household Vehicle Usage in Beatrice
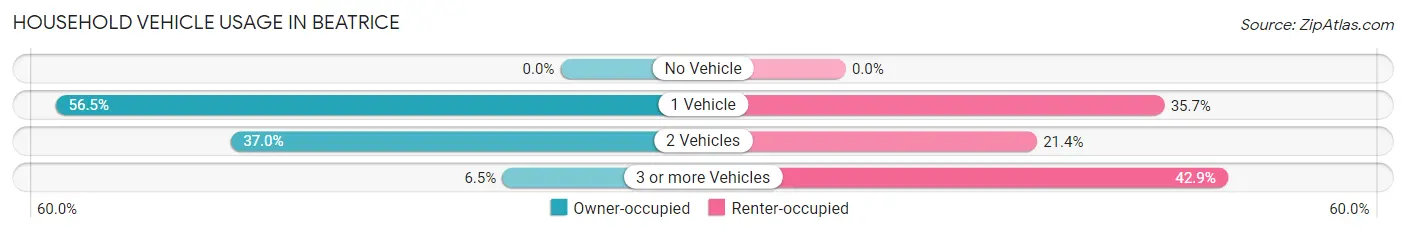
| Vehicles per Household | Owner-occupied | Renter-occupied |
| No Vehicle | 0 (0.0%) | 0 (0.0%) |
| 1 Vehicle | 26 (56.5%) | 5 (35.7%) |
| 2 Vehicles | 17 (37.0%) | 3 (21.4%) |
| 3 or more Vehicles | 3 (6.5%) | 6 (42.9%) |
| Total | 46 (100.0%) | 14 (100.0%) |
Real Estate & Mortgages in Beatrice
Real Estate and Mortgage Overview in Beatrice
| Characteristic | Without Mortgage | With Mortgage |
| Housing Units | 31 | 15 |
| Median Property Value | - | - |
| Median Household Income | $27,813 | $2 |
| Monthly Housing Costs | $288 | $0 |
| Real Estate Taxes | $199 | $4 |
Property Value by Mortgage Status in Beatrice
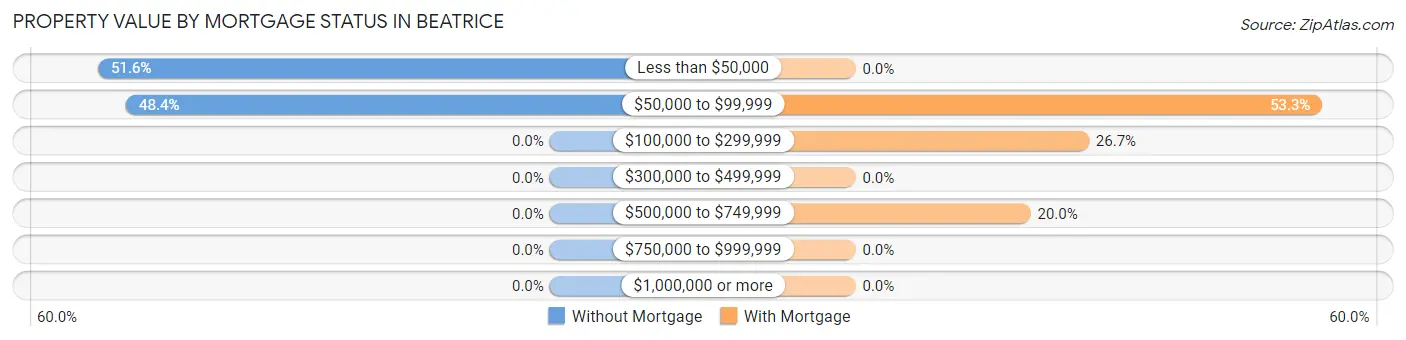
| Property Value | Without Mortgage | With Mortgage |
| Less than $50,000 | 16 (51.6%) | 0 (0.0%) |
| $50,000 to $99,999 | 15 (48.4%) | 8 (53.3%) |
| $100,000 to $299,999 | 0 (0.0%) | 4 (26.7%) |
| $300,000 to $499,999 | 0 (0.0%) | 0 (0.0%) |
| $500,000 to $749,999 | 0 (0.0%) | 3 (20.0%) |
| $750,000 to $999,999 | 0 (0.0%) | 0 (0.0%) |
| $1,000,000 or more | 0 (0.0%) | 0 (0.0%) |
| Total | 31 (100.0%) | 15 (100.0%) |
Household Income by Mortgage Status in Beatrice
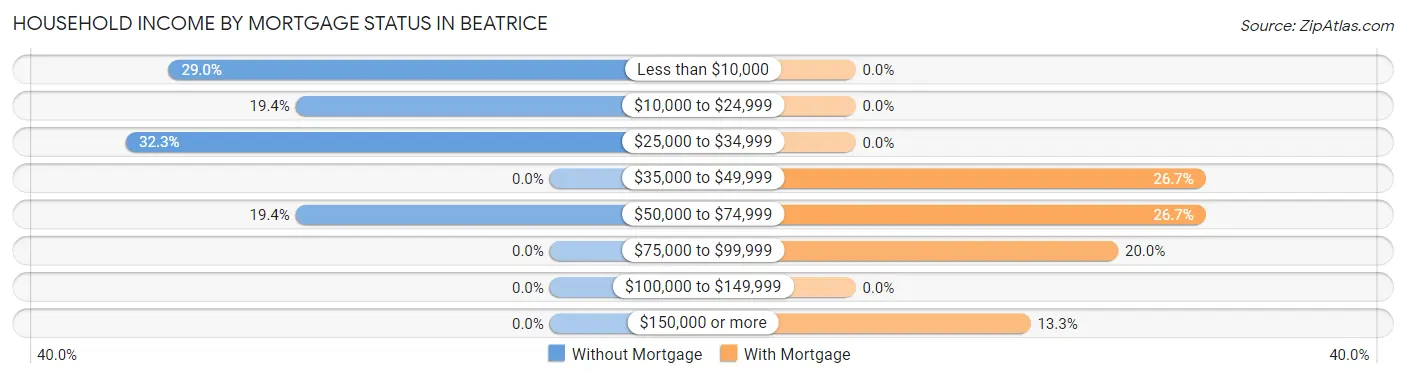
| Household Income | Without Mortgage | With Mortgage |
| Less than $10,000 | 9 (29.0%) | 0 (0.0%) |
| $10,000 to $24,999 | 6 (19.4%) | 0 (0.0%) |
| $25,000 to $34,999 | 10 (32.3%) | 0 (0.0%) |
| $35,000 to $49,999 | 0 (0.0%) | 4 (26.7%) |
| $50,000 to $74,999 | 6 (19.4%) | 4 (26.7%) |
| $75,000 to $99,999 | 0 (0.0%) | 3 (20.0%) |
| $100,000 to $149,999 | 0 (0.0%) | 0 (0.0%) |
| $150,000 or more | 0 (0.0%) | 2 (13.3%) |
| Total | 31 (100.0%) | 15 (100.0%) |
Property Value to Household Income Ratio in Beatrice
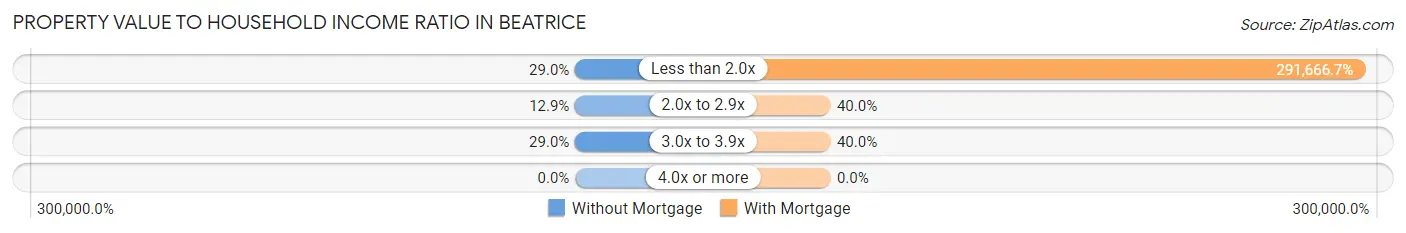
| Value-to-Income Ratio | Without Mortgage | With Mortgage |
| Less than 2.0x | 9 (29.0%) | 43,750 (291,666.7%) |
| 2.0x to 2.9x | 4 (12.9%) | 6 (40.0%) |
| 3.0x to 3.9x | 9 (29.0%) | 6 (40.0%) |
| 4.0x or more | 0 (0.0%) | 0 (0.0%) |
| Total | 31 (100.0%) | 15 (100.0%) |
Real Estate Taxes by Mortgage Status in Beatrice
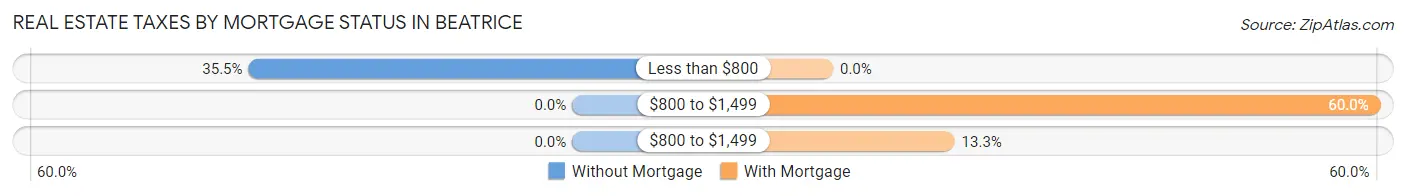
| Property Taxes | Without Mortgage | With Mortgage |
| Less than $800 | 11 (35.5%) | 0 (0.0%) |
| $800 to $1,499 | 0 (0.0%) | 9 (60.0%) |
| $800 to $1,499 | 0 (0.0%) | 2 (13.3%) |
| Total | 31 (100.0%) | 15 (100.0%) |
Health & Disability in Beatrice
Health Insurance Coverage by Age in Beatrice
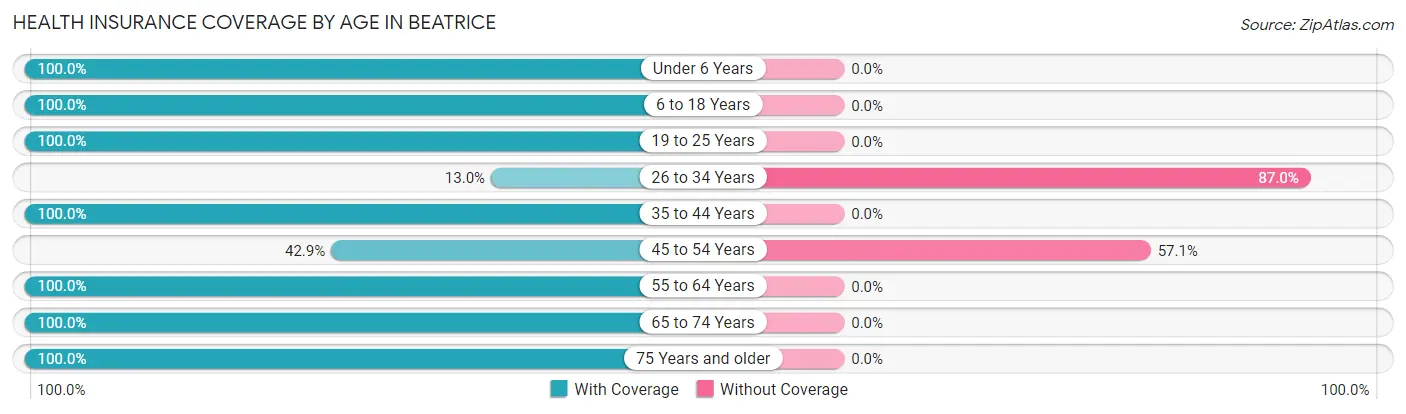
| Age Bracket | With Coverage | Without Coverage |
| Under 6 Years | 3 (100.0%) | 0 (0.0%) |
| 6 to 18 Years | 54 (100.0%) | 0 (0.0%) |
| 19 to 25 Years | 7 (100.0%) | 0 (0.0%) |
| 26 to 34 Years | 3 (13.0%) | 20 (87.0%) |
| 35 to 44 Years | 13 (100.0%) | 0 (0.0%) |
| 45 to 54 Years | 3 (42.9%) | 4 (57.1%) |
| 55 to 64 Years | 21 (100.0%) | 0 (0.0%) |
| 65 to 74 Years | 29 (100.0%) | 0 (0.0%) |
| 75 Years and older | 18 (100.0%) | 0 (0.0%) |
| Total | 151 (86.3%) | 24 (13.7%) |
Health Insurance Coverage by Citizenship Status in Beatrice
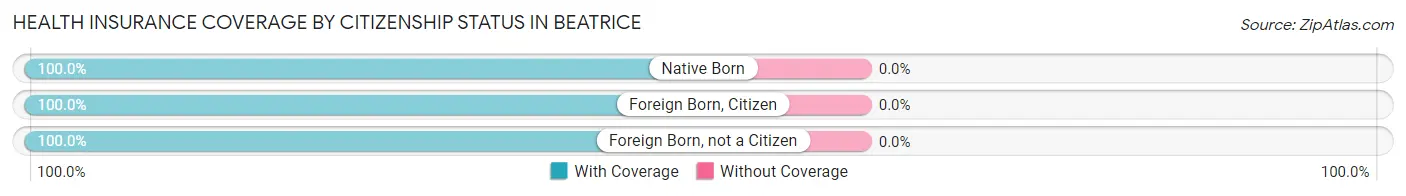
| Citizenship Status | With Coverage | Without Coverage |
| Native Born | 3 (100.0%) | 0 (0.0%) |
| Foreign Born, Citizen | 54 (100.0%) | 0 (0.0%) |
| Foreign Born, not a Citizen | 7 (100.0%) | 0 (0.0%) |
Health Insurance Coverage by Household Income in Beatrice
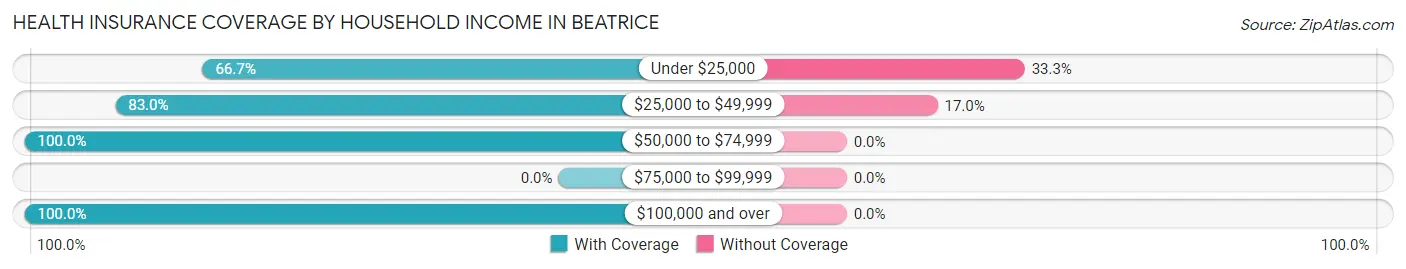
| Household Income | With Coverage | Without Coverage |
| Under $25,000 | 14 (66.7%) | 7 (33.3%) |
| $25,000 to $49,999 | 83 (83.0%) | 17 (17.0%) |
| $50,000 to $74,999 | 24 (100.0%) | 0 (0.0%) |
| $75,000 to $99,999 | 0 (0.0%) | 0 (0.0%) |
| $100,000 and over | 30 (100.0%) | 0 (0.0%) |
Public vs Private Health Insurance Coverage by Age in Beatrice
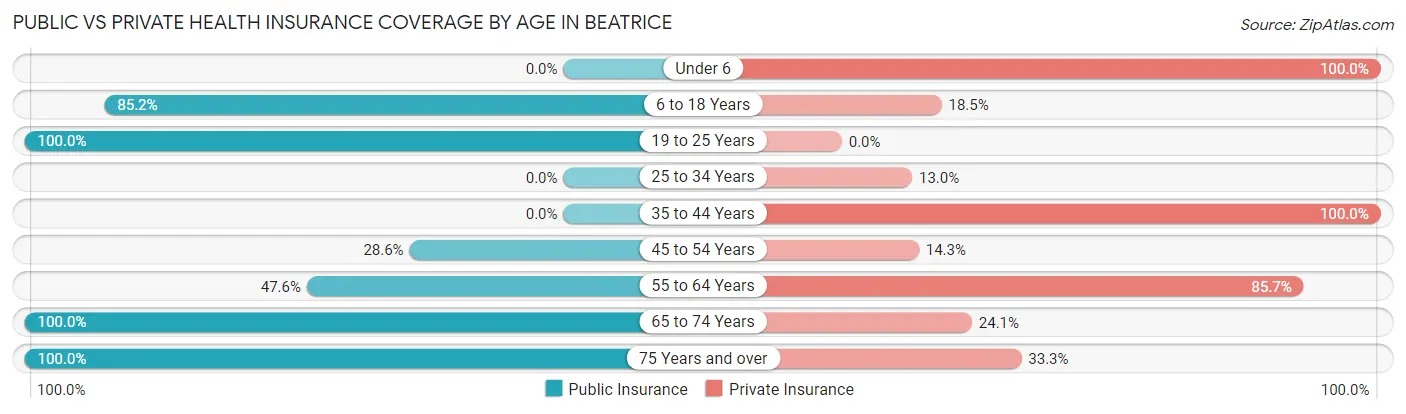
| Age Bracket | Public Insurance | Private Insurance |
| Under 6 | 0 (0.0%) | 3 (100.0%) |
| 6 to 18 Years | 46 (85.2%) | 10 (18.5%) |
| 19 to 25 Years | 7 (100.0%) | 0 (0.0%) |
| 25 to 34 Years | 0 (0.0%) | 3 (13.0%) |
| 35 to 44 Years | 0 (0.0%) | 13 (100.0%) |
| 45 to 54 Years | 2 (28.6%) | 1 (14.3%) |
| 55 to 64 Years | 10 (47.6%) | 18 (85.7%) |
| 65 to 74 Years | 29 (100.0%) | 7 (24.1%) |
| 75 Years and over | 18 (100.0%) | 6 (33.3%) |
| Total | 112 (64.0%) | 61 (34.9%) |
Disability Status by Sex by Age in Beatrice
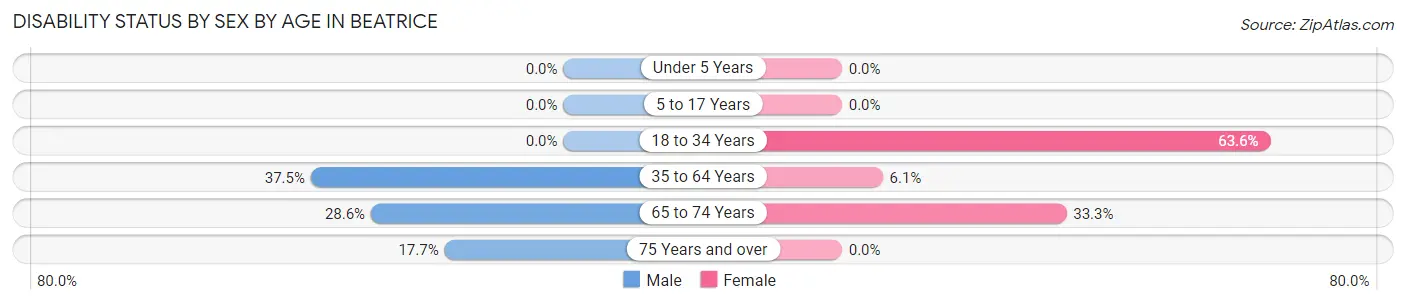
| Age Bracket | Male | Female |
| Under 5 Years | 0 (0.0%) | 0 (0.0%) |
| 5 to 17 Years | 0 (0.0%) | 0 (0.0%) |
| 18 to 34 Years | 0 (0.0%) | 7 (63.6%) |
| 35 to 64 Years | 3 (37.5%) | 2 (6.1%) |
| 65 to 74 Years | 4 (28.6%) | 5 (33.3%) |
| 75 Years and over | 3 (17.6%) | 0 (0.0%) |
Disability Class by Sex by Age in Beatrice
Disability Class: Hearing Difficulty
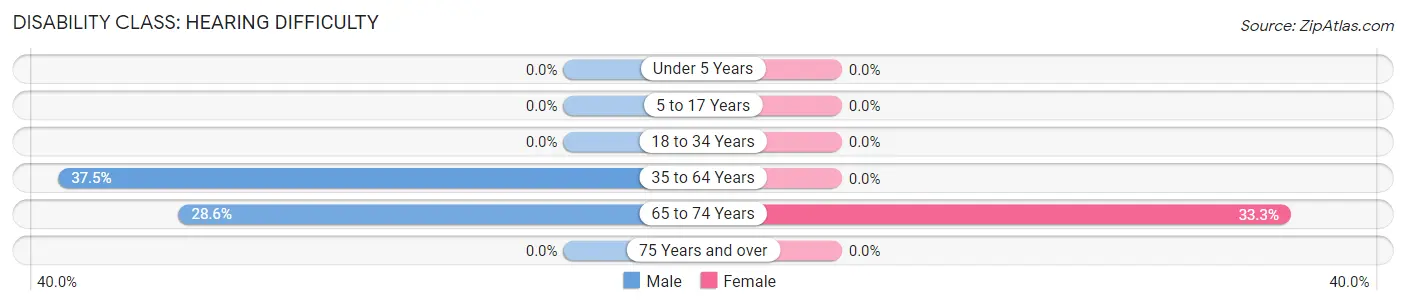
| Age Bracket | Male | Female |
| Under 5 Years | 0 (0.0%) | 0 (0.0%) |
| 5 to 17 Years | 0 (0.0%) | 0 (0.0%) |
| 18 to 34 Years | 0 (0.0%) | 0 (0.0%) |
| 35 to 64 Years | 3 (37.5%) | 0 (0.0%) |
| 65 to 74 Years | 4 (28.6%) | 5 (33.3%) |
| 75 Years and over | 0 (0.0%) | 0 (0.0%) |
Disability Class: Vision Difficulty
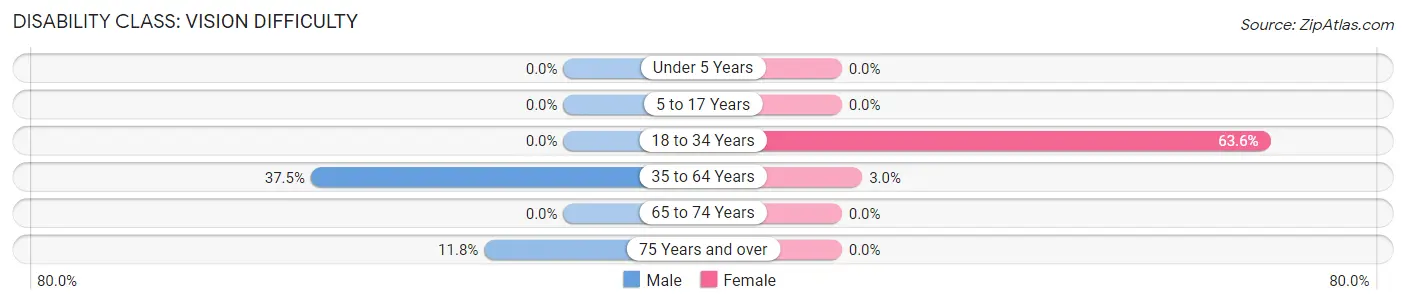
| Age Bracket | Male | Female |
| Under 5 Years | 0 (0.0%) | 0 (0.0%) |
| 5 to 17 Years | 0 (0.0%) | 0 (0.0%) |
| 18 to 34 Years | 0 (0.0%) | 7 (63.6%) |
| 35 to 64 Years | 3 (37.5%) | 1 (3.0%) |
| 65 to 74 Years | 0 (0.0%) | 0 (0.0%) |
| 75 Years and over | 2 (11.8%) | 0 (0.0%) |
Disability Class: Cognitive Difficulty
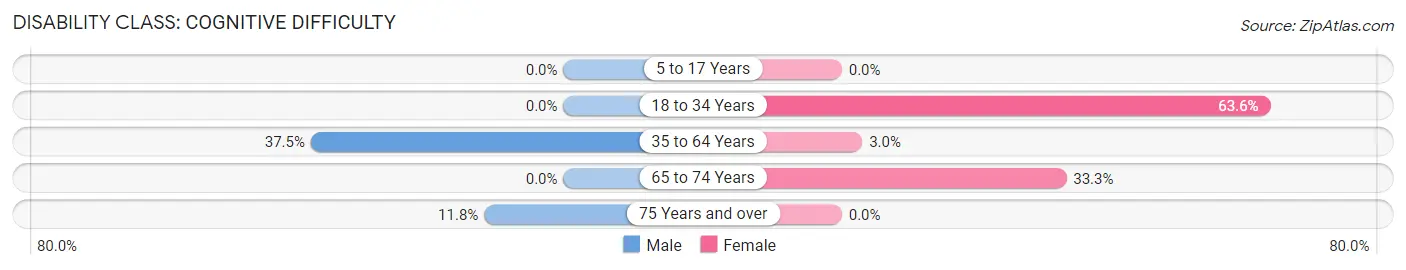
| Age Bracket | Male | Female |
| 5 to 17 Years | 0 (0.0%) | 0 (0.0%) |
| 18 to 34 Years | 0 (0.0%) | 7 (63.6%) |
| 35 to 64 Years | 3 (37.5%) | 1 (3.0%) |
| 65 to 74 Years | 0 (0.0%) | 5 (33.3%) |
| 75 Years and over | 2 (11.8%) | 0 (0.0%) |
Disability Class: Ambulatory Difficulty
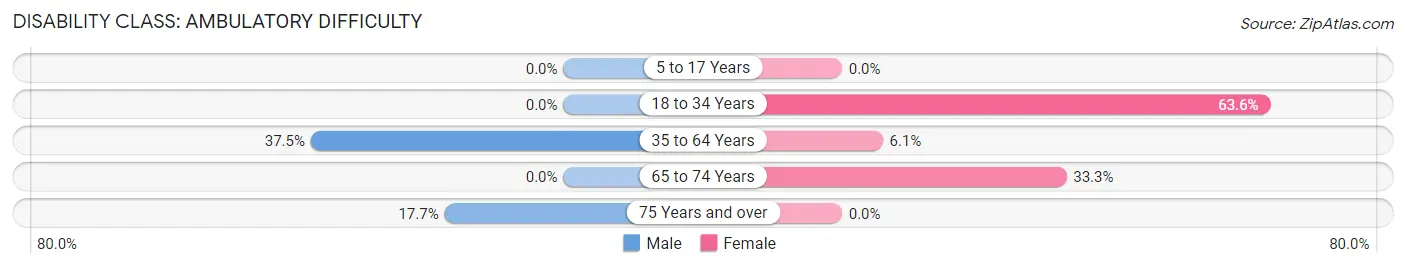
| Age Bracket | Male | Female |
| 5 to 17 Years | 0 (0.0%) | 0 (0.0%) |
| 18 to 34 Years | 0 (0.0%) | 7 (63.6%) |
| 35 to 64 Years | 3 (37.5%) | 2 (6.1%) |
| 65 to 74 Years | 0 (0.0%) | 5 (33.3%) |
| 75 Years and over | 3 (17.6%) | 0 (0.0%) |
Disability Class: Self-Care Difficulty
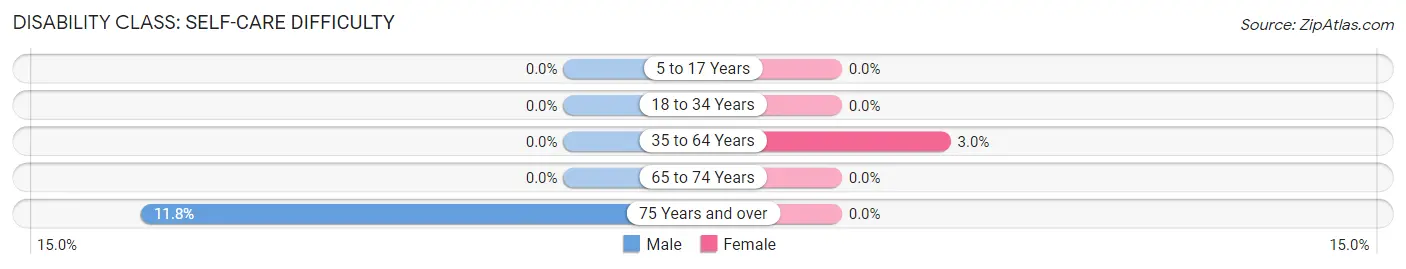
| Age Bracket | Male | Female |
| 5 to 17 Years | 0 (0.0%) | 0 (0.0%) |
| 18 to 34 Years | 0 (0.0%) | 0 (0.0%) |
| 35 to 64 Years | 0 (0.0%) | 1 (3.0%) |
| 65 to 74 Years | 0 (0.0%) | 0 (0.0%) |
| 75 Years and over | 2 (11.8%) | 0 (0.0%) |
Technology Access in Beatrice
Computing Device Access in Beatrice
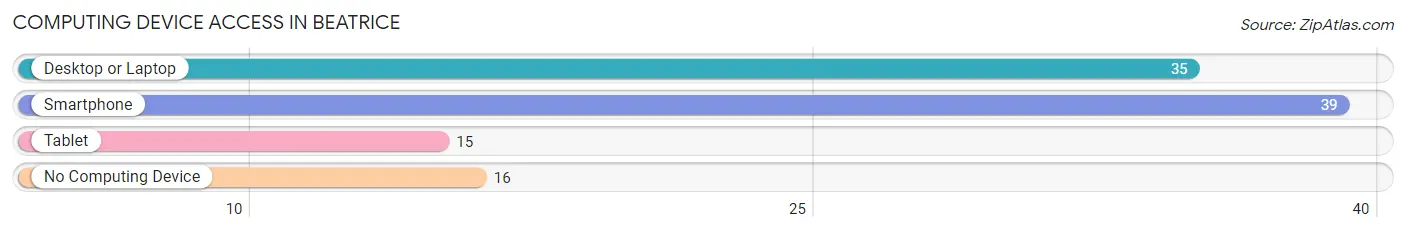
| Device Type | # Households | % Households |
| Desktop or Laptop | 35 | 58.3% |
| Smartphone | 39 | 65.0% |
| Tablet | 15 | 25.0% |
| No Computing Device | 16 | 26.7% |
| Total | 60 | 100.0% |
Internet Access in Beatrice
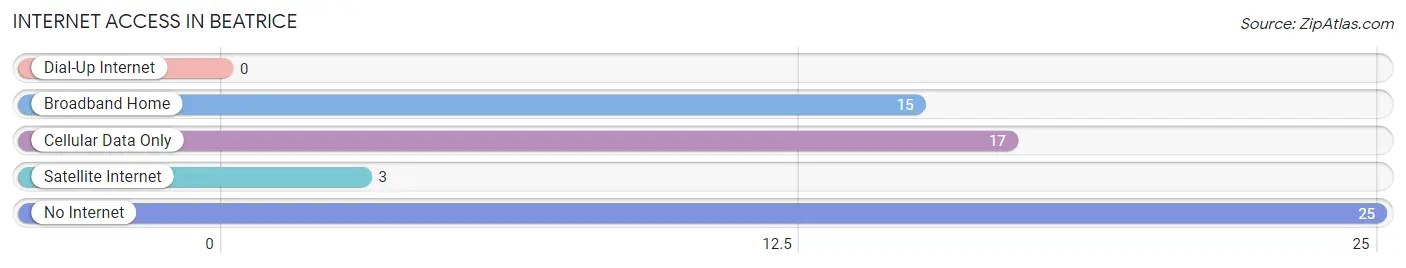
| Internet Type | # Households | % Households |
| Dial-Up Internet | 0 | 0.0% |
| Broadband Home | 15 | 25.0% |
| Cellular Data Only | 17 | 28.3% |
| Satellite Internet | 3 | 5.0% |
| No Internet | 25 | 41.7% |
| Total | 60 | 100.0% |
Beatrice Summary
History
Beatrice, Alabama is a small town located in Monroe County, Alabama. It was founded in 1820 by William Beaty, a settler from North Carolina. Beaty named the town after his daughter, Beatrice. The town was incorporated in 1887 and has a population of approximately 1,000 people.
Beatrice has a rich history that dates back to the early 1800s. During the Civil War, the town was a major supply center for the Confederate Army. After the war, the town experienced a period of growth and prosperity. In the late 1800s, the town was home to several businesses, including a cotton gin, a sawmill, and a grist mill.
In the early 1900s, Beatrice was a thriving agricultural community. The town was home to several cotton plantations and a number of small farms. The town also had a thriving lumber industry, which provided jobs for many of the town’s residents.
In the mid-1900s, Beatrice experienced a period of decline. The town’s economy was heavily dependent on agriculture, and when the cotton industry began to decline, so did the town’s economy. In the late 1900s, the town began to experience a resurgence. The town’s economy is now largely based on tourism, with many visitors coming to the area to enjoy the town’s natural beauty and outdoor activities.
Geography
Beatrice is located in Monroe County, Alabama. The town is situated in the foothills of the Appalachian Mountains, and is surrounded by rolling hills and lush forests. The town is located near the Alabama-Georgia border, and is approximately 30 miles from the city of Columbus, Georgia.
The town is located at an elevation of approximately 1,000 feet above sea level. The climate in Beatrice is mild, with temperatures ranging from the mid-50s in the winter to the mid-80s in the summer. The town receives an average of 48 inches of rain per year.
Economy
The economy of Beatrice is largely based on tourism. The town is home to several outdoor attractions, including hiking trails, fishing spots, and camping sites. The town also has several restaurants, shops, and other businesses that cater to tourists.
In addition to tourism, Beatrice is home to several small businesses. The town is home to a number of small farms, as well as a few small manufacturing companies. The town also has a few small retail stores.
Demographics
As of the 2010 census, the population of Beatrice was 1,000 people. The town is approximately 95% white, 2% African American, and 3% other. The median household income in Beatrice is $35,000, and the median age is 44 years old. The town has a low unemployment rate of 4.5%.
Common Questions
What is Per Capita Income in Beatrice?
Per Capita income in Beatrice is $16,346.
What is the Median Family Income in Beatrice?
Median Family Income in Beatrice is $46,563.
What is the Median Household income in Beatrice?
Median Household Income in Beatrice is $33,214.
What is Inequality or Gini Index in Beatrice?
Inequality or Gini Index in Beatrice is 0.48.
What is the Total Population of Beatrice?
Total Population of Beatrice is 175.
What is the Total Male Population of Beatrice?
Total Male Population of Beatrice is 88.
What is the Total Female Population of Beatrice?
Total Female Population of Beatrice is 87.
What is the Ratio of Males per 100 Females in Beatrice?
There are 101.15 Males per 100 Females in Beatrice.
What is the Ratio of Females per 100 Males in Beatrice?
There are 98.86 Females per 100 Males in Beatrice.
What is the Median Population Age in Beatrice?
Median Population Age in Beatrice is 37.1 Years.
What is the Average Family Size in Beatrice
Average Family Size in Beatrice is 5.2 People.
What is the Average Household Size in Beatrice
Average Household Size in Beatrice is 2.9 People.
How Large is the Labor Force in Beatrice?
There are 26 People in the Labor Forcein in Beatrice.
What is the Percentage of People in the Labor Force in Beatrice?
21.7% of People are in the Labor Force in Beatrice.
What is the Unemployment Rate in Beatrice?
Unemployment Rate in Beatrice is 26.9%.