Wallowa Lake, OR Map & Demographics
Wallowa Lake Map
Wallowa Lake Overview
$68,139
PER CAPITA INCOME
$79,648
AVG HOUSEHOLD INCOME
0.24
INEQUALITY / GINI INDEX
96
TOTAL POPULATION
70
MALE POPULATION
26
FEMALE POPULATION
269.23
MALES / 100 FEMALES
37.14
FEMALES / 100 MALES
55.4
MEDIAN AGE
1.8
AVG FAMILY SIZE
1.4
AVG HOUSEHOLD SIZE
83
LABOR FORCE [ PEOPLE ]
86.5%
PERCENT IN LABOR FORCE
Income in Wallowa Lake
Income Overview in Wallowa Lake
| Characteristic | Number | Measure |
| Per Capita Income | 96 | $68,139 |
| Median Family Income | 31 | $0 |
| Mean Family Income | 31 | $124,110 |
| Median Household Income | 71 | $79,648 |
| Mean Household Income | 71 | $92,889 |
| Income Deficit | 31 | $0 |
| Wage / Income Gap (%) | 96 | 0.00% |
| Wage / Income Gap ($) | 96 | 100.00¢ per $1 |
| Gini / Inequality Index | 96 | 0.24 |
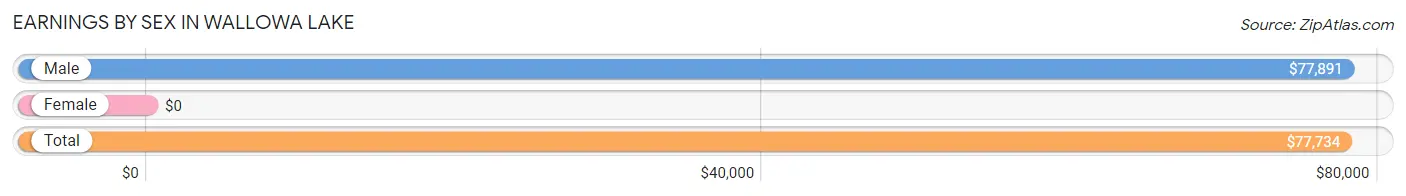
Earnings by Sex in Wallowa Lake
| Sex | Number | Average Earnings |
| Male | 62 (70.5%) | $77,891 |
| Female | 26 (29.5%) | $0 |
| Total | 88 (100.0%) | $77,734 |
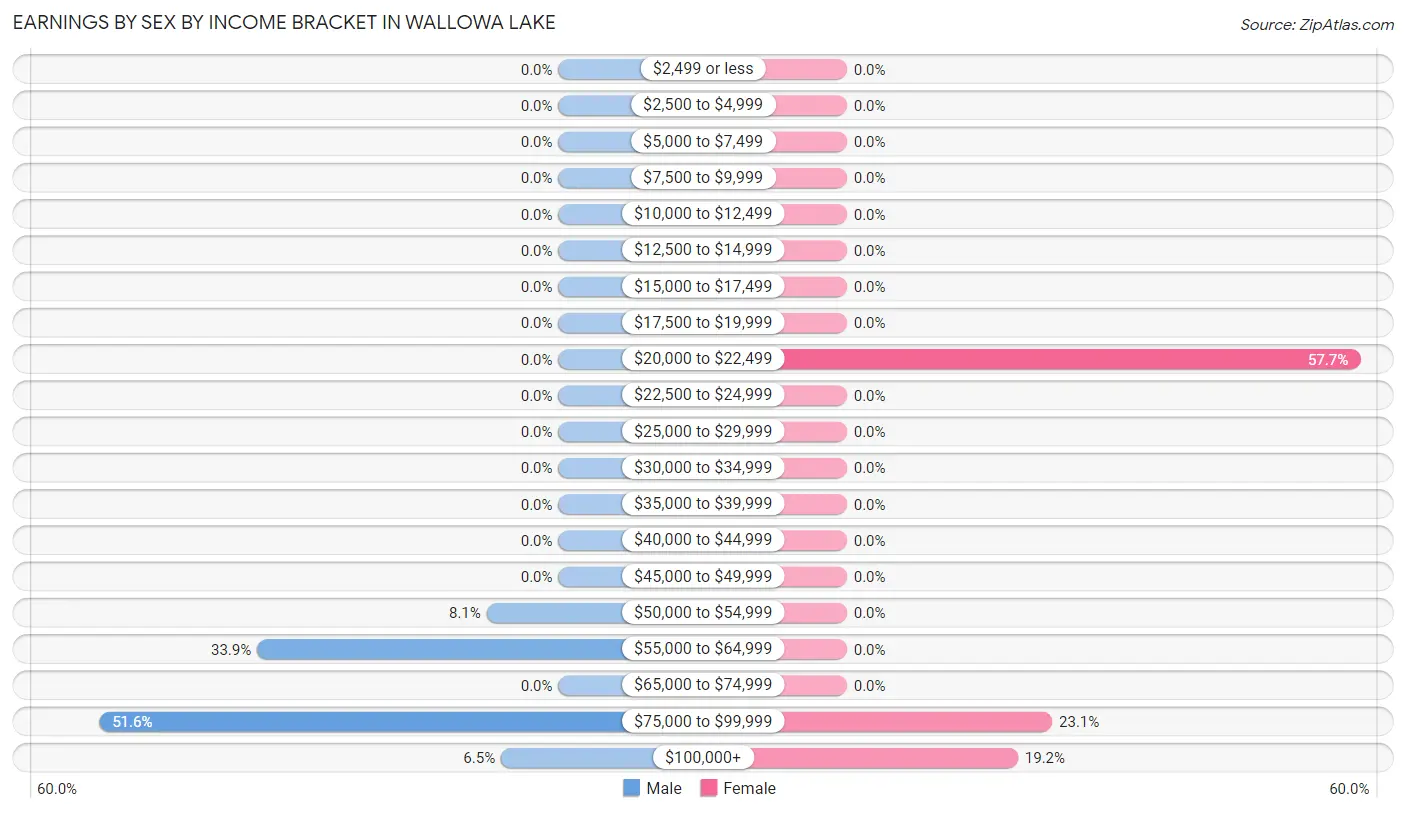
Earnings by Sex by Income Bracket in Wallowa Lake
The most common earnings brackets in Wallowa Lake are $75,000 to $99,999 for men (32 | 51.6%) and $20,000 to $22,499 for women (15 | 57.7%).
| Income | Male | Female |
| $2,499 or less | 0 (0.0%) | 0 (0.0%) |
| $2,500 to $4,999 | 0 (0.0%) | 0 (0.0%) |
| $5,000 to $7,499 | 0 (0.0%) | 0 (0.0%) |
| $7,500 to $9,999 | 0 (0.0%) | 0 (0.0%) |
| $10,000 to $12,499 | 0 (0.0%) | 0 (0.0%) |
| $12,500 to $14,999 | 0 (0.0%) | 0 (0.0%) |
| $15,000 to $17,499 | 0 (0.0%) | 0 (0.0%) |
| $17,500 to $19,999 | 0 (0.0%) | 0 (0.0%) |
| $20,000 to $22,499 | 0 (0.0%) | 15 (57.7%) |
| $22,500 to $24,999 | 0 (0.0%) | 0 (0.0%) |
| $25,000 to $29,999 | 0 (0.0%) | 0 (0.0%) |
| $30,000 to $34,999 | 0 (0.0%) | 0 (0.0%) |
| $35,000 to $39,999 | 0 (0.0%) | 0 (0.0%) |
| $40,000 to $44,999 | 0 (0.0%) | 0 (0.0%) |
| $45,000 to $49,999 | 0 (0.0%) | 0 (0.0%) |
| $50,000 to $54,999 | 5 (8.1%) | 0 (0.0%) |
| $55,000 to $64,999 | 21 (33.9%) | 0 (0.0%) |
| $65,000 to $74,999 | 0 (0.0%) | 0 (0.0%) |
| $75,000 to $99,999 | 32 (51.6%) | 6 (23.1%) |
| $100,000+ | 4 (6.5%) | 5 (19.2%) |
| Total | 62 (100.0%) | 26 (100.0%) |
Earnings by Sex by Educational Attainment in Wallowa Lake
| Educational Attainment | Male Income | Female Income |
| Less than High School | - | - |
| High School Diploma | - | - |
| College or Associate's Degree | - | - |
| Bachelor's Degree | - | - |
| Graduate Degree | - | - |
| Total | $77,891 | $0 |
Family Income in Wallowa Lake
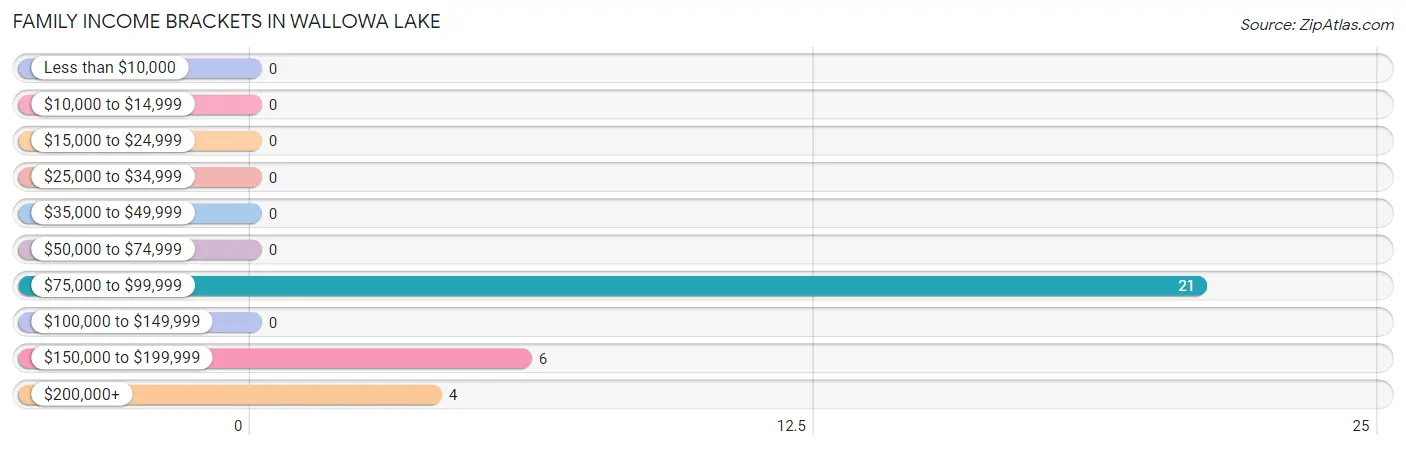
Family Income Brackets in Wallowa Lake
According to the Wallowa Lake family income data, there are 21 families falling into the $75,000 to $99,999 income range, which is the most common income bracket and makes up 67.7% of all families.
| Income Bracket | # Families | % Families |
| Less than $10,000 | 0 | 0.0% |
| $10,000 to $14,999 | 0 | 0.0% |
| $15,000 to $24,999 | 0 | 0.0% |
| $25,000 to $34,999 | 0 | 0.0% |
| $35,000 to $49,999 | 0 | 0.0% |
| $50,000 to $74,999 | 0 | 0.0% |
| $75,000 to $99,999 | 21 | 67.7% |
| $100,000 to $149,999 | 0 | 0.0% |
| $150,000 to $199,999 | 6 | 19.4% |
| $200,000+ | 4 | 12.9% |
Family Income by Famaliy Size in Wallowa Lake
| Income Bracket | # Families | Median Income |
| 2-Person Families | 31 (100.0%) | $0 |
| 3-Person Families | 0 (0.0%) | $0 |
| 4-Person Families | 0 (0.0%) | $0 |
| 5-Person Families | 0 (0.0%) | $0 |
| 6-Person Families | 0 (0.0%) | $0 |
| 7+ Person Families | 0 (0.0%) | $0 |
| Total | 31 (100.0%) | $0 |
Family Income by Number of Earners in Wallowa Lake
| Number of Earners | # Families | Median Income |
| No Earners | 0 (0.0%) | $0 |
| 1 Earner | 0 (0.0%) | $0 |
| 2 Earners | 31 (100.0%) | $0 |
| 3+ Earners | 0 (0.0%) | $0 |
| Total | 31 (100.0%) | $0 |
Household Income in Wallowa Lake
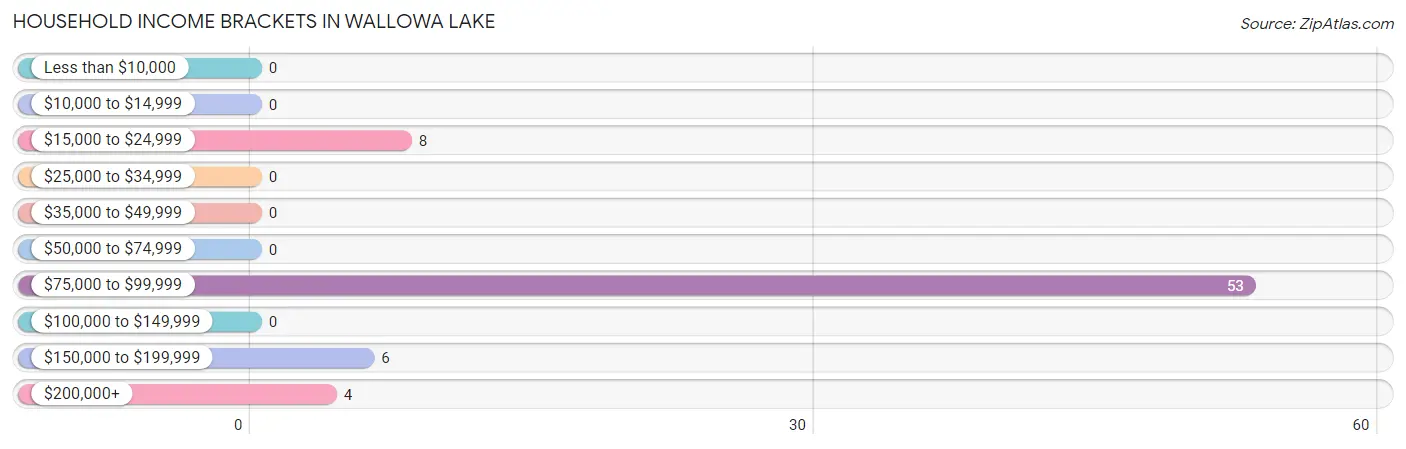
Household Income Brackets in Wallowa Lake
With 53 households falling in the category, the $75,000 to $99,999 income range is the most frequent in Wallowa Lake, accounting for 74.7% of all households.
| Income Bracket | # Households | % Households |
| Less than $10,000 | 0 | 0.0% |
| $10,000 to $14,999 | 0 | 0.0% |
| $15,000 to $24,999 | 8 | 11.3% |
| $25,000 to $34,999 | 0 | 0.0% |
| $35,000 to $49,999 | 0 | 0.0% |
| $50,000 to $74,999 | 0 | 0.0% |
| $75,000 to $99,999 | 53 | 74.6% |
| $100,000 to $149,999 | 0 | 0.0% |
| $150,000 to $199,999 | 6 | 8.5% |
| $200,000+ | 4 | 5.6% |
Household Income by Householder Age in Wallowa Lake
| Income Bracket | # Households | Median Income |
| 15 to 24 Years | 0 (0.0%) | $0 |
| 25 to 44 Years | 21 (29.6%) | $0 |
| 45 to 64 Years | 36 (50.7%) | $0 |
| 65+ Years | 14 (19.7%) | $0 |
| Total | 71 (100.0%) | $79,648 |
Poverty in Wallowa Lake
Income Below Poverty by Sex and Age in Wallowa Lake
| Age Bracket | Male | Female |
| Under 5 Years | 0 (0.0%) | 0 (0.0%) |
| 5 Years | 0 (0.0%) | 0 (0.0%) |
| 6 to 11 Years | 0 (0.0%) | 0 (0.0%) |
| 12 to 14 Years | 0 (0.0%) | 0 (0.0%) |
| 15 Years | 0 (0.0%) | 0 (0.0%) |
| 16 and 17 Years | 0 (0.0%) | 0 (0.0%) |
| 18 to 24 Years | 0 (0.0%) | 0 (0.0%) |
| 25 to 34 Years | 0 (0.0%) | 0 (0.0%) |
| 35 to 44 Years | 0 (0.0%) | 0 (0.0%) |
| 45 to 54 Years | 0 (0.0%) | 0 (0.0%) |
| 55 to 64 Years | 0 (0.0%) | 0 (0.0%) |
| 65 to 74 Years | 0 (0.0%) | 0 (0.0%) |
| 75 Years and over | 0 (0.0%) | 0 (0.0%) |
| Total | 0 (0.0%) | 0 (0.0%) |
Income Above Poverty by Sex and Age in Wallowa Lake
According to the poverty statistics in Wallowa Lake, males aged 35 to 44 years and females aged 35 to 44 years are the age groups that are most secure financially, with 100.0% of males and 100.0% of females in these age groups living above the poverty line.
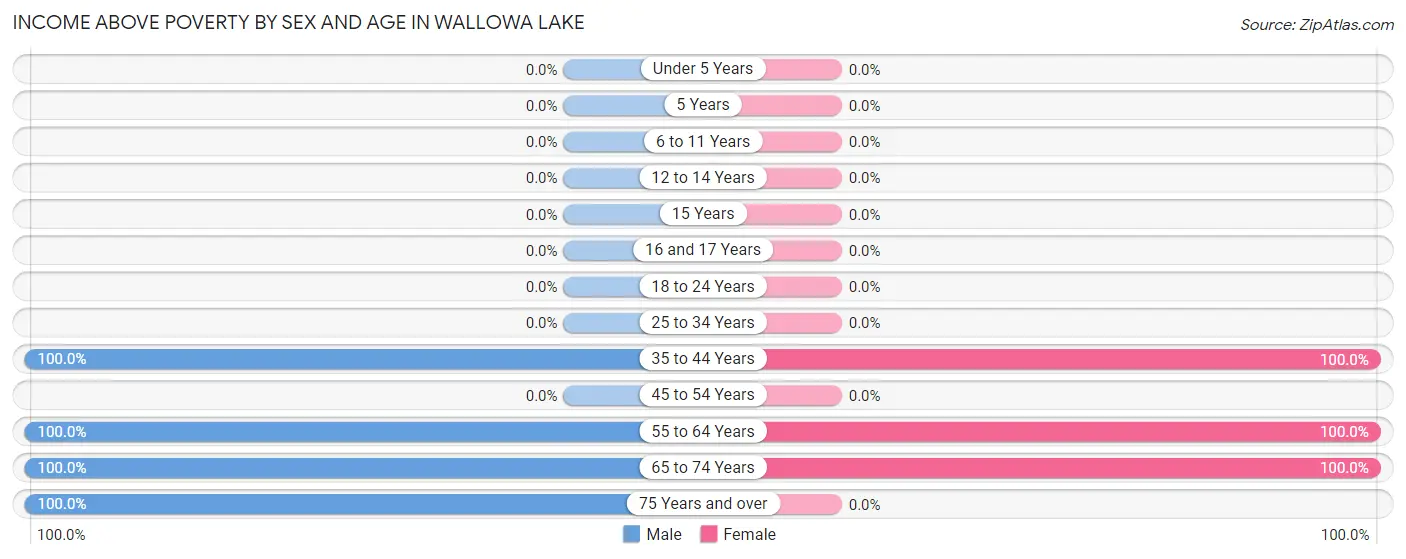
| Age Bracket | Male | Female |
| Under 5 Years | 0 (0.0%) | 0 (0.0%) |
| 5 Years | 0 (0.0%) | 0 (0.0%) |
| 6 to 11 Years | 0 (0.0%) | 0 (0.0%) |
| 12 to 14 Years | 0 (0.0%) | 0 (0.0%) |
| 15 Years | 0 (0.0%) | 0 (0.0%) |
| 16 and 17 Years | 0 (0.0%) | 0 (0.0%) |
| 18 to 24 Years | 0 (0.0%) | 0 (0.0%) |
| 25 to 34 Years | 0 (0.0%) | 0 (0.0%) |
| 35 to 44 Years | 21 (100.0%) | 15 (100.0%) |
| 45 to 54 Years | 0 (0.0%) | 0 (0.0%) |
| 55 to 64 Years | 36 (100.0%) | 5 (100.0%) |
| 65 to 74 Years | 5 (100.0%) | 6 (100.0%) |
| 75 Years and over | 8 (100.0%) | 0 (0.0%) |
| Total | 70 (100.0%) | 26 (100.0%) |
Income Below Poverty Among Married-Couple Families in Wallowa Lake
| Children | Above Poverty | Below Poverty |
| No Children | 31 (100.0%) | 0 (0.0%) |
| 1 or 2 Children | 0 (0.0%) | 0 (0.0%) |
| 3 or 4 Children | 0 (0.0%) | 0 (0.0%) |
| 5 or more Children | 0 (0.0%) | 0 (0.0%) |
| Total | 31 (100.0%) | 0 (0.0%) |
Income Below Poverty Among Single-Parent Households in Wallowa Lake
| Children | Single Father | Single Mother |
| No Children | 0 (0.0%) | 0 (0.0%) |
| 1 or 2 Children | 0 (0.0%) | 0 (0.0%) |
| 3 or 4 Children | 0 (0.0%) | 0 (0.0%) |
| 5 or more Children | 0 (0.0%) | 0 (0.0%) |
| Total | 0 (0.0%) | 0 (0.0%) |
Income Below Poverty Among Married-Couple vs Single-Parent Households in Wallowa Lake
| Children | Married-Couple Families | Single-Parent Households |
| No Children | 0 (0.0%) | 0 (0.0%) |
| 1 or 2 Children | 0 (0.0%) | 0 (0.0%) |
| 3 or 4 Children | 0 (0.0%) | 0 (0.0%) |
| 5 or more Children | 0 (0.0%) | 0 (0.0%) |
| Total | 0 (0.0%) | 0 (0.0%) |
Race in Wallowa Lake
The most populous races in Wallowa Lake are , and White / Caucasian (96 | 100.0%).
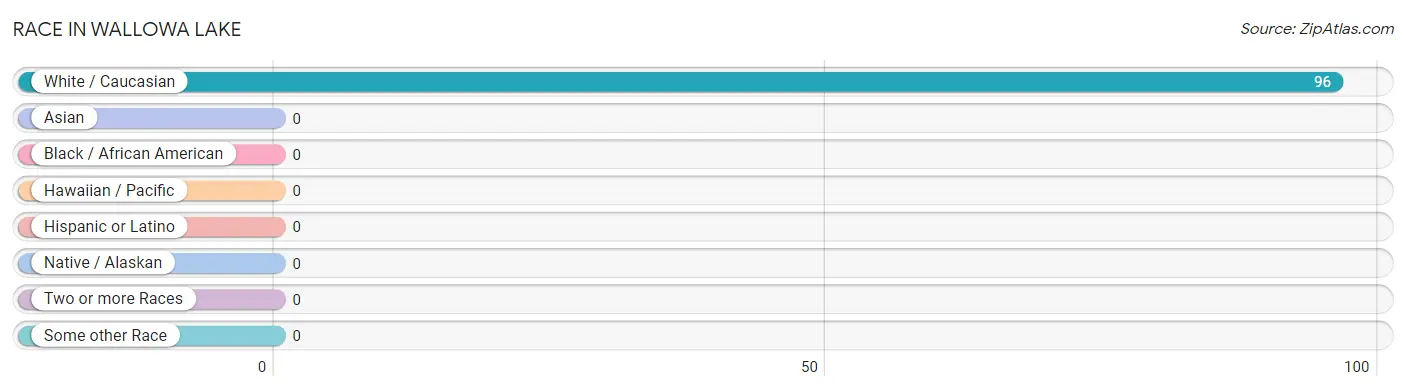
| Race | # Population | % Population |
| Asian | 0 | 0.0% |
| Black / African American | 0 | 0.0% |
| Hawaiian / Pacific | 0 | 0.0% |
| Hispanic or Latino | 0 | 0.0% |
| Native / Alaskan | 0 | 0.0% |
| White / Caucasian | 96 | 100.0% |
| Two or more Races | 0 | 0.0% |
| Some other Race | 0 | 0.0% |
| Total | 96 | 100.0% |
Ancestry in Wallowa Lake
The most populous ancestries reported in Wallowa Lake are European (38 | 39.6%), Danish (5 | 5.2%), and Swedish (5 | 5.2%), together accounting for 50.0% of all Wallowa Lake residents.
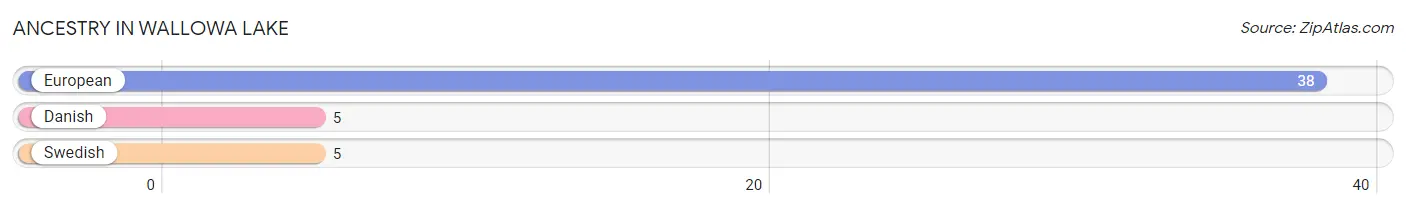
| Ancestry | # Population | % Population |
| Danish | 5 | 5.2% |
| European | 38 | 39.6% |
| Swedish | 5 | 5.2% | View All 3 Rows |
Immigrants in Wallowa Lake

| Immigration Origin | # Population | % Population | View All 0 Rows |
Sex and Age in Wallowa Lake
Sex and Age in Wallowa Lake
The most populous age groups in Wallowa Lake are 55 to 59 Years (36 | 51.4%) for men and 35 to 39 Years (15 | 57.7%) for women.
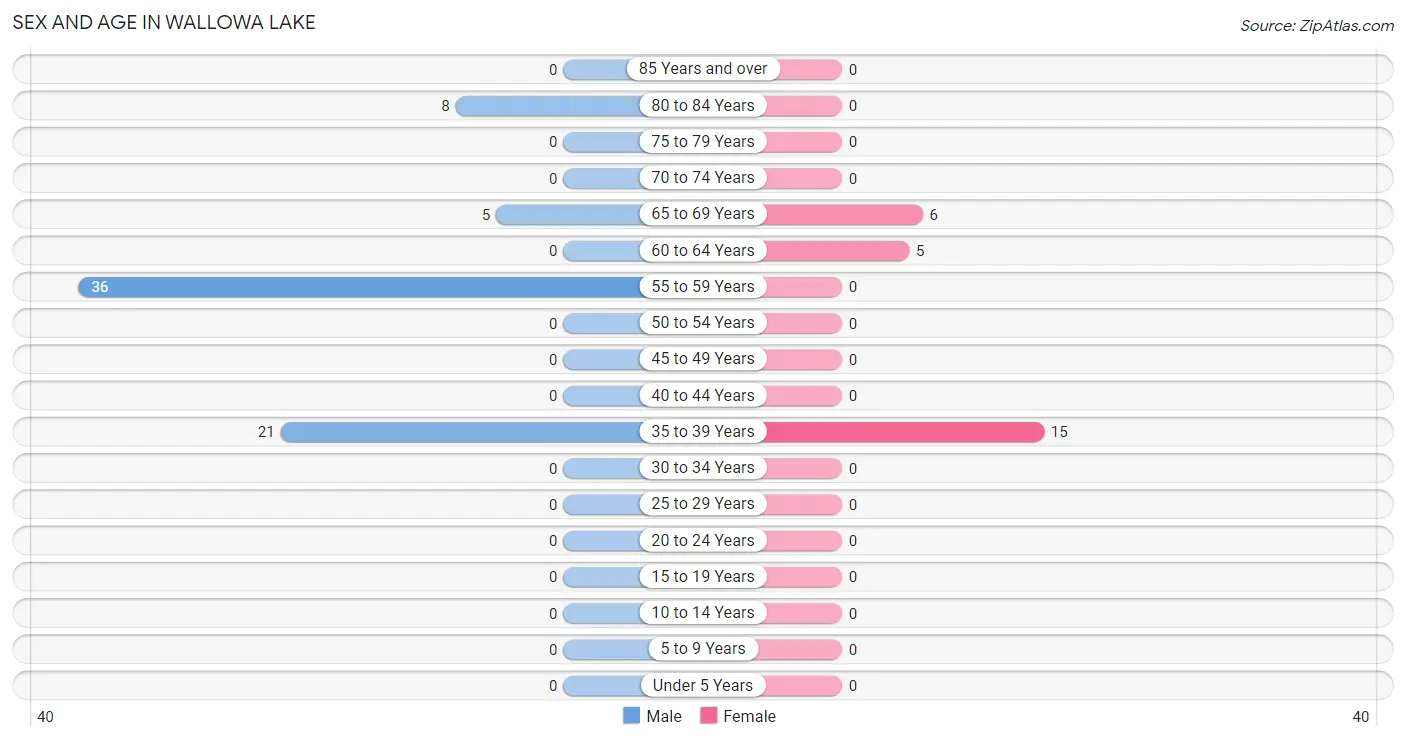
| Age Bracket | Male | Female |
| Under 5 Years | 0 (0.0%) | 0 (0.0%) |
| 5 to 9 Years | 0 (0.0%) | 0 (0.0%) |
| 10 to 14 Years | 0 (0.0%) | 0 (0.0%) |
| 15 to 19 Years | 0 (0.0%) | 0 (0.0%) |
| 20 to 24 Years | 0 (0.0%) | 0 (0.0%) |
| 25 to 29 Years | 0 (0.0%) | 0 (0.0%) |
| 30 to 34 Years | 0 (0.0%) | 0 (0.0%) |
| 35 to 39 Years | 21 (30.0%) | 15 (57.7%) |
| 40 to 44 Years | 0 (0.0%) | 0 (0.0%) |
| 45 to 49 Years | 0 (0.0%) | 0 (0.0%) |
| 50 to 54 Years | 0 (0.0%) | 0 (0.0%) |
| 55 to 59 Years | 36 (51.4%) | 0 (0.0%) |
| 60 to 64 Years | 0 (0.0%) | 5 (19.2%) |
| 65 to 69 Years | 5 (7.1%) | 6 (23.1%) |
| 70 to 74 Years | 0 (0.0%) | 0 (0.0%) |
| 75 to 79 Years | 0 (0.0%) | 0 (0.0%) |
| 80 to 84 Years | 8 (11.4%) | 0 (0.0%) |
| 85 Years and over | 0 (0.0%) | 0 (0.0%) |
| Total | 70 (100.0%) | 26 (100.0%) |
Families and Households in Wallowa Lake
Median Family Size in Wallowa Lake
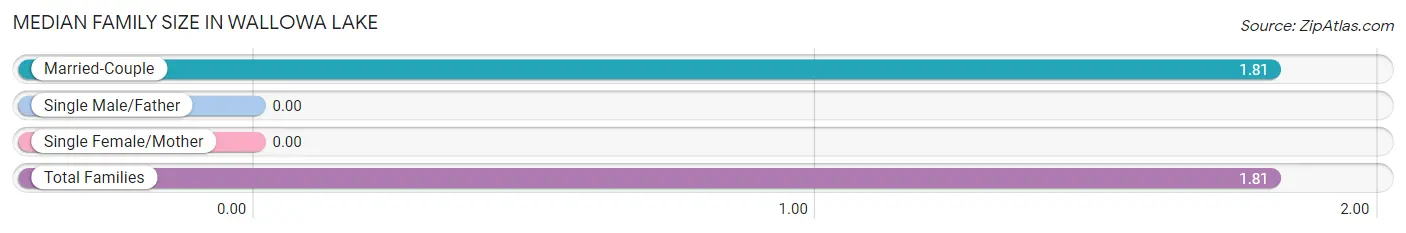
| Family Type | # Families | Family Size |
| Married-Couple | 31 (100.0%) | 1.81 |
| Single Male/Father | 0 (0.0%) | - |
| Single Female/Mother | 0 (0.0%) | - |
| Total Families | 31 (100.0%) | 1.81 |
Median Household Size in Wallowa Lake
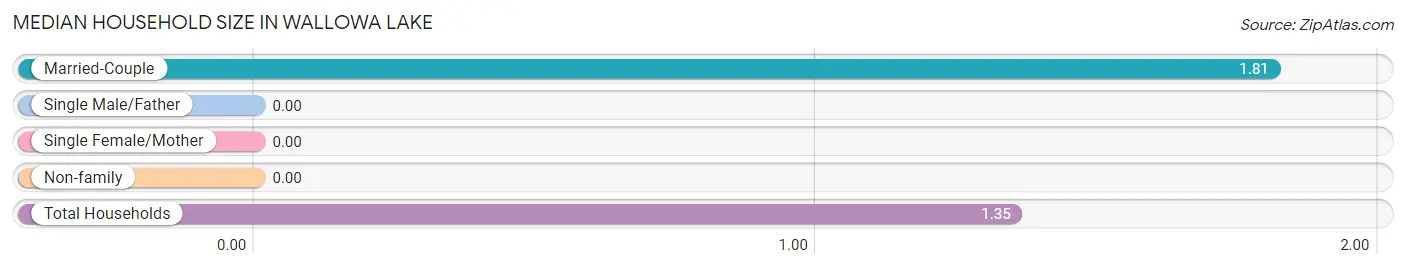
| Household Type | # Households | Household Size |
| Married-Couple | 31 (43.7%) | 1.81 |
| Single Male/Father | 0 (0.0%) | - |
| Single Female/Mother | 0 (0.0%) | - |
| Non-family | 40 (56.3%) | - |
| Total Households | 71 (100.0%) | 1.35 |
Household Size by Marriage Status in Wallowa Lake
Out of a total of 71 households in Wallowa Lake, 31 (43.7%) are family households, while 40 (56.3%) are nonfamily households. The most numerous type of family households are 2-person households, comprising 31, and the most common type of nonfamily households are 1-person households, comprising 40.
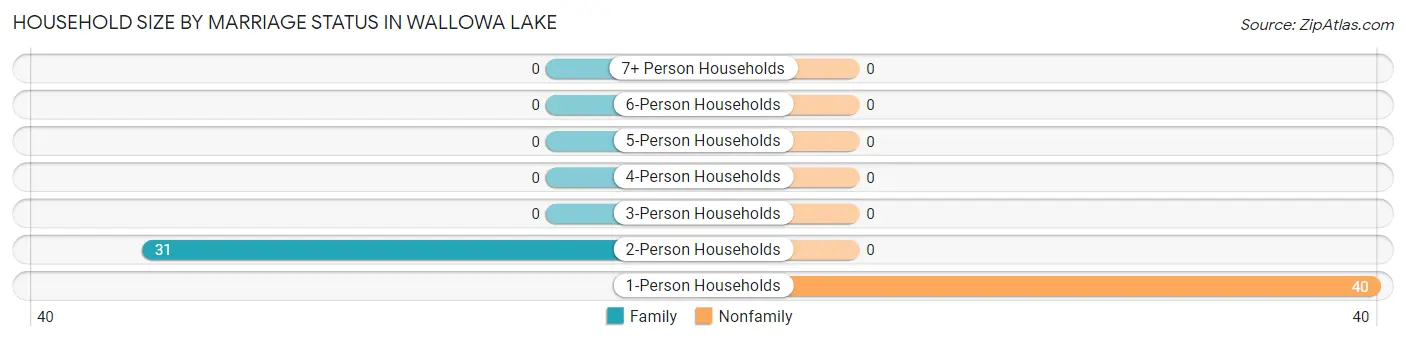
| Household Size | Family Households | Nonfamily Households |
| 1-Person Households | - | 40 (56.3%) |
| 2-Person Households | 31 (43.7%) | 0 (0.0%) |
| 3-Person Households | 0 (0.0%) | 0 (0.0%) |
| 4-Person Households | 0 (0.0%) | 0 (0.0%) |
| 5-Person Households | 0 (0.0%) | 0 (0.0%) |
| 6-Person Households | 0 (0.0%) | 0 (0.0%) |
| 7+ Person Households | 0 (0.0%) | 0 (0.0%) |
| Total | 31 (43.7%) | 40 (56.3%) |
Female Fertility in Wallowa Lake
Fertility by Age in Wallowa Lake
| Age Bracket | Women with Births | Births / 1,000 Women |
| 15 to 19 years | 0 (0.0%) | 0.0 |
| 20 to 34 years | 0 (0.0%) | 0.0 |
| 35 to 50 years | 0 (0.0%) | 0.0 |
| Total | 0 (0.0%) | 0.0 |
Fertility by Age by Marriage Status in Wallowa Lake
| Age Bracket | Married | Unmarried |
| 15 to 19 years | 0 (0.0%) | 0 (0.0%) |
| 20 to 34 years | 0 (0.0%) | 0 (0.0%) |
| 35 to 50 years | 0 (0.0%) | 0 (0.0%) |
| Total | 0 (0.0%) | 0 (0.0%) |
Fertility by Education in Wallowa Lake
| Educational Attainment | Women with Births | Births / 1,000 Women |
| Less than High School | 0 (0.0%) | 0.0 |
| High School Diploma | 0 (0.0%) | 0.0 |
| College or Associate's Degree | 0 (0.0%) | 0.0 |
| Bachelor's Degree | 0 (0.0%) | 0.0 |
| Graduate Degree | 0 (0.0%) | 0.0 |
| Total | 0 (0.0%) | 0.0 |
Fertility by Education by Marriage Status in Wallowa Lake
| Educational Attainment | Married | Unmarried |
| Less than High School | 0 (0.0%) | 0 (0.0%) |
| High School Diploma | 0 (0.0%) | 0 (0.0%) |
| College or Associate's Degree | 0 (0.0%) | 0 (0.0%) |
| Bachelor's Degree | 0 (0.0%) | 0 (0.0%) |
| Graduate Degree | 0 (0.0%) | 0 (0.0%) |
| Total | 0 (0.0%) | 0 (0.0%) |
Employment Characteristics in Wallowa Lake
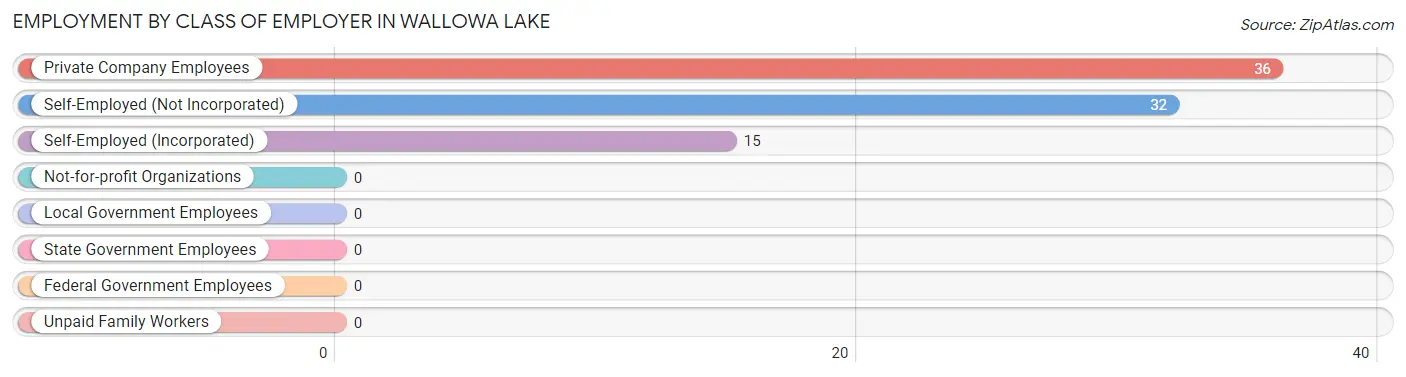
Employment by Class of Employer in Wallowa Lake
Among the 83 employed individuals in Wallowa Lake, private company employees (36 | 43.4%), self-employed (not incorporated) (32 | 38.6%), and self-employed (incorporated) (15 | 18.1%) make up the most common classes of employment.
| Employer Class | # Employees | % Employees |
| Private Company Employees | 36 | 43.4% |
| Self-Employed (Incorporated) | 15 | 18.1% |
| Self-Employed (Not Incorporated) | 32 | 38.6% |
| Not-for-profit Organizations | 0 | 0.0% |
| Local Government Employees | 0 | 0.0% |
| State Government Employees | 0 | 0.0% |
| Federal Government Employees | 0 | 0.0% |
| Unpaid Family Workers | 0 | 0.0% |
| Total | 83 | 100.0% |
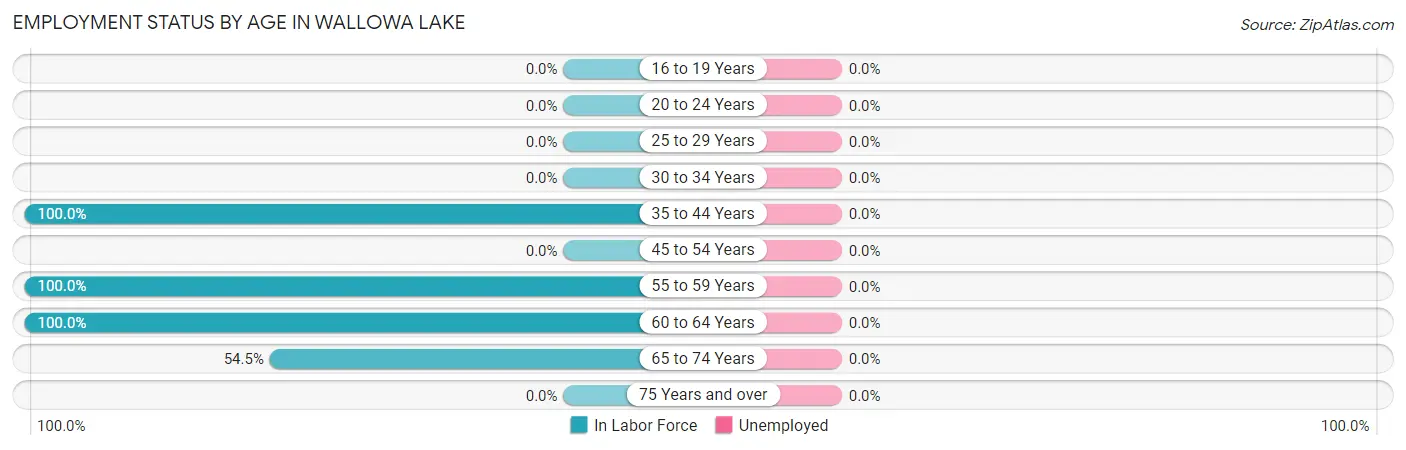
Employment Status by Age in Wallowa Lake
| Age Bracket | In Labor Force | Unemployed |
| 16 to 19 Years | 0 (0.0%) | 0 (0.0%) |
| 20 to 24 Years | 0 (0.0%) | 0 (0.0%) |
| 25 to 29 Years | 0 (0.0%) | 0 (0.0%) |
| 30 to 34 Years | 0 (0.0%) | 0 (0.0%) |
| 35 to 44 Years | 36 (100.0%) | 0 (0.0%) |
| 45 to 54 Years | 0 (0.0%) | 0 (0.0%) |
| 55 to 59 Years | 36 (100.0%) | 0 (0.0%) |
| 60 to 64 Years | 5 (100.0%) | 0 (0.0%) |
| 65 to 74 Years | 6 (54.5%) | 0 (0.0%) |
| 75 Years and over | 0 (0.0%) | 0 (0.0%) |
| Total | 83 (86.5%) | 0 (0.0%) |
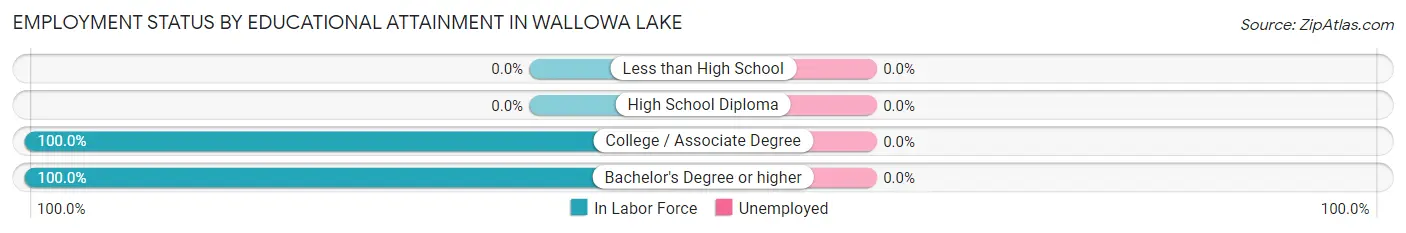
Employment Status by Educational Attainment in Wallowa Lake
| Educational Attainment | In Labor Force | Unemployed |
| Less than High School | 0 (0.0%) | 0 (0.0%) |
| High School Diploma | 0 (0.0%) | 0 (0.0%) |
| College / Associate Degree | 24 (100.0%) | 0 (0.0%) |
| Bachelor's Degree or higher | 53 (100.0%) | 0 (0.0%) |
| Total | 77 (100.0%) | 0 (0.0%) |
Employment Occupations by Sex in Wallowa Lake
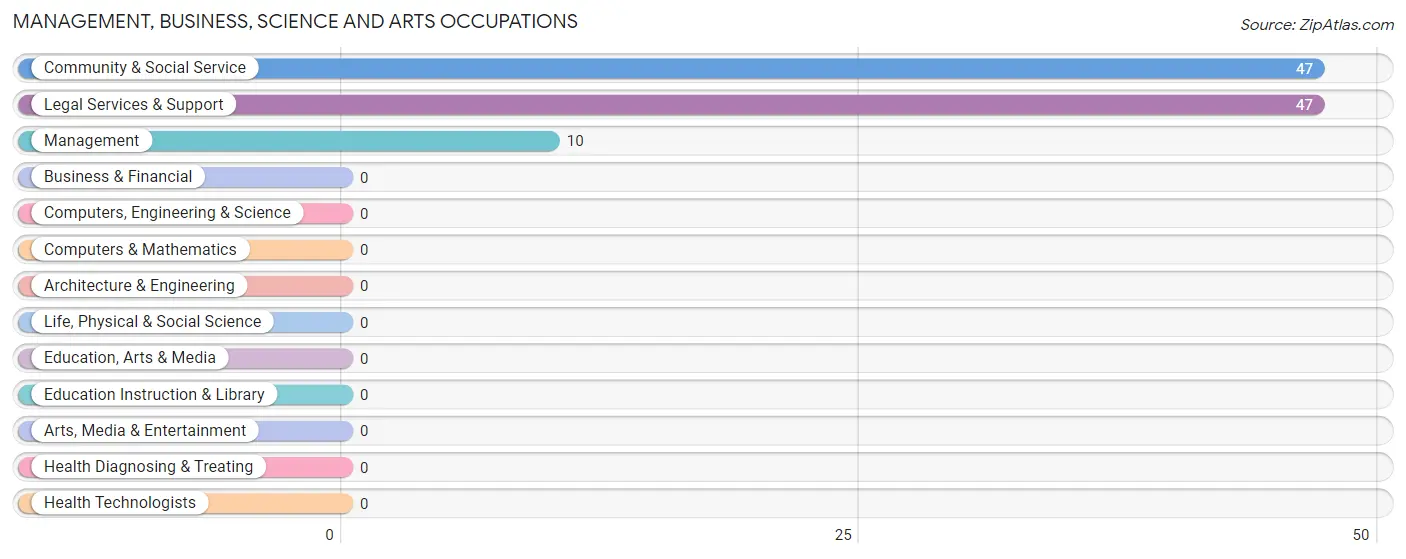
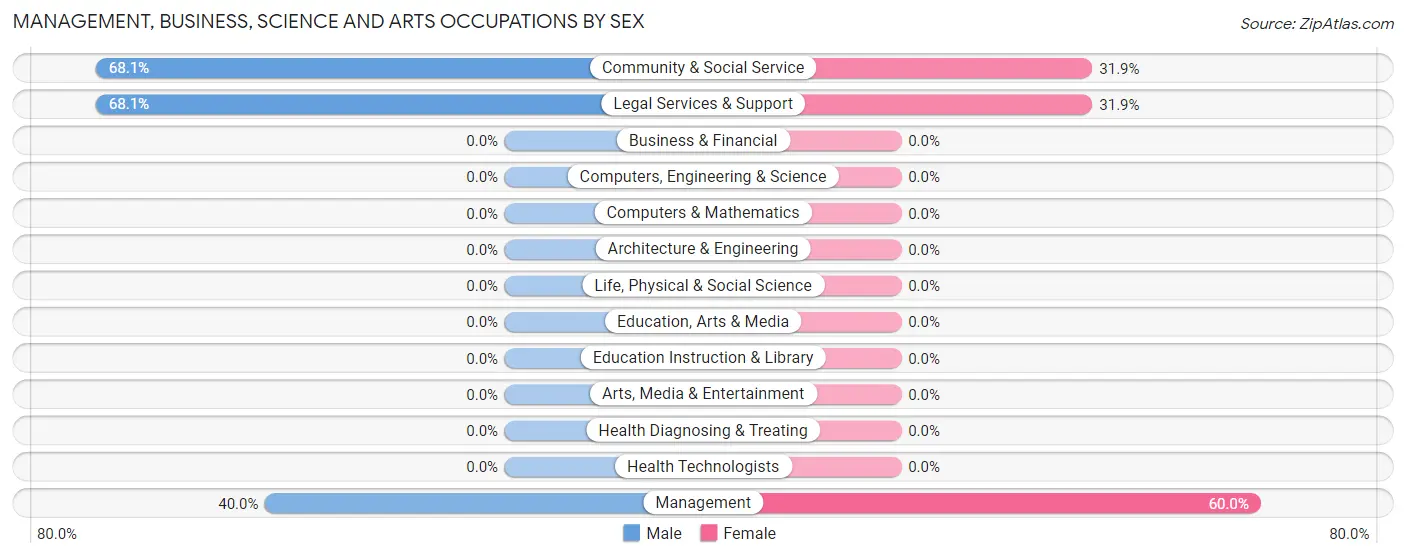
Management, Business, Science and Arts Occupations
The most common Management, Business, Science and Arts occupations in Wallowa Lake are Community & Social Service (47 | 56.6%), Legal Services & Support (47 | 56.6%), and Management (10 | 12.0%).
Management, Business, Science and Arts Occupations by Sex
Within the Management, Business, Science and Arts occupations in Wallowa Lake, the most male-oriented occupations are Community & Social Service (68.1%), Legal Services & Support (68.1%), and Management (40.0%), while the most female-oriented occupations are Management (60.0%), Community & Social Service (31.9%), and Legal Services & Support (31.9%).
| Occupation | Male | Female |
| Management | 4 (40.0%) | 6 (60.0%) |
| Business & Financial | 0 (0.0%) | 0 (0.0%) |
| Computers, Engineering & Science | 0 (0.0%) | 0 (0.0%) |
| Computers & Mathematics | 0 (0.0%) | 0 (0.0%) |
| Architecture & Engineering | 0 (0.0%) | 0 (0.0%) |
| Life, Physical & Social Science | 0 (0.0%) | 0 (0.0%) |
| Community & Social Service | 32 (68.1%) | 15 (31.9%) |
| Education, Arts & Media | 0 (0.0%) | 0 (0.0%) |
| Legal Services & Support | 32 (68.1%) | 15 (31.9%) |
| Education Instruction & Library | 0 (0.0%) | 0 (0.0%) |
| Arts, Media & Entertainment | 0 (0.0%) | 0 (0.0%) |
| Health Diagnosing & Treating | 0 (0.0%) | 0 (0.0%) |
| Health Technologists | 0 (0.0%) | 0 (0.0%) |
| Total (Category) | 36 (63.2%) | 21 (36.8%) |
| Total (Overall) | 57 (68.7%) | 26 (31.3%) |
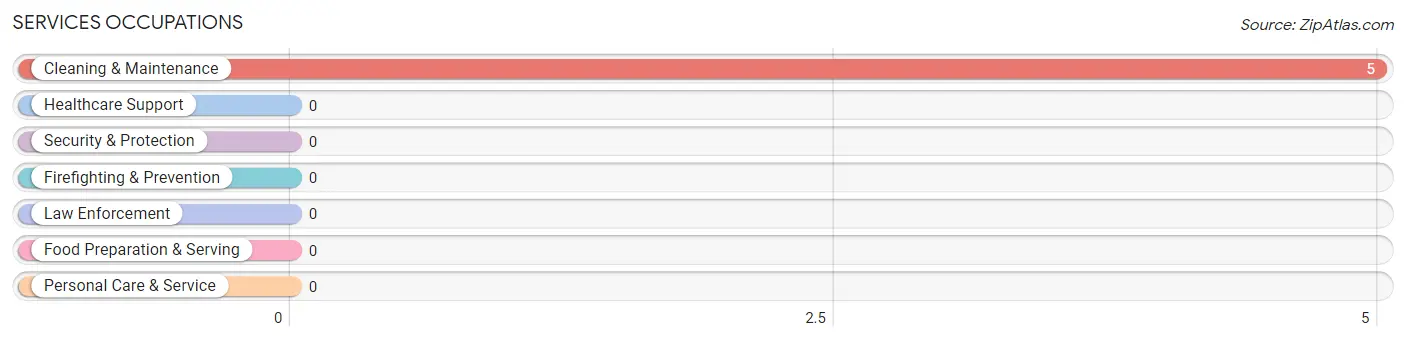
Services Occupations
The most common Services occupations in Wallowa Lake are , and Cleaning & Maintenance (5 | 6.0%).
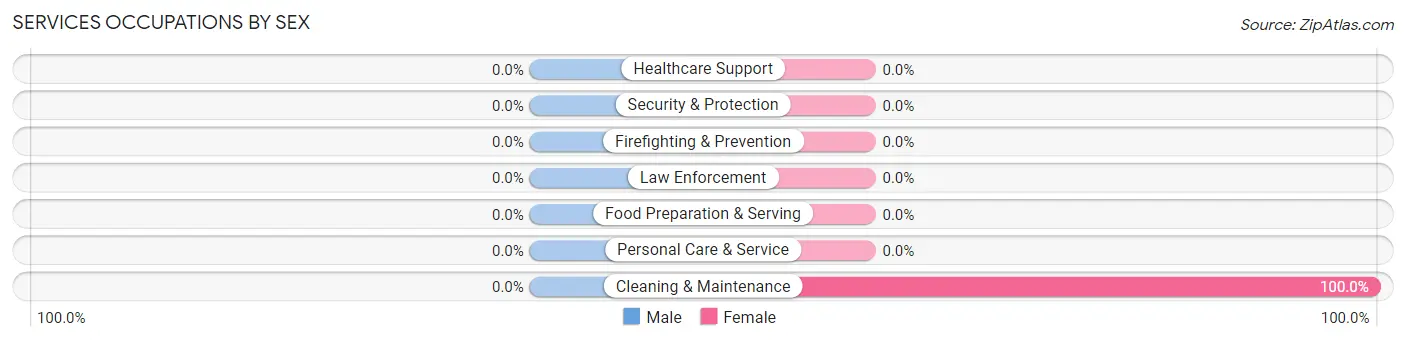
Services Occupations by Sex
| Occupation | Male | Female |
| Healthcare Support | 0 (0.0%) | 0 (0.0%) |
| Security & Protection | 0 (0.0%) | 0 (0.0%) |
| Firefighting & Prevention | 0 (0.0%) | 0 (0.0%) |
| Law Enforcement | 0 (0.0%) | 0 (0.0%) |
| Food Preparation & Serving | 0 (0.0%) | 0 (0.0%) |
| Cleaning & Maintenance | 0 (0.0%) | 5 (100.0%) |
| Personal Care & Service | 0 (0.0%) | 0 (0.0%) |
| Total (Category) | 0 (0.0%) | 5 (100.0%) |
| Total (Overall) | 57 (68.7%) | 26 (31.3%) |
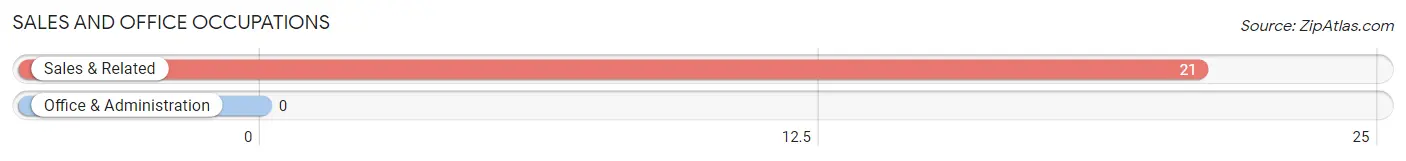
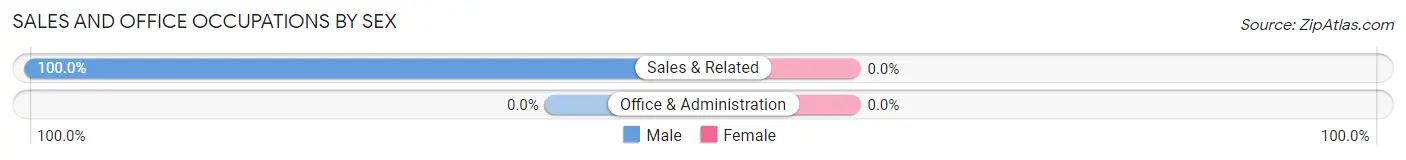
Sales and Office Occupations
The most common Sales and Office occupations in Wallowa Lake are , and Sales & Related (21 | 25.3%).
Sales and Office Occupations by Sex
| Occupation | Male | Female |
| Sales & Related | 21 (100.0%) | 0 (0.0%) |
| Office & Administration | 0 (0.0%) | 0 (0.0%) |
| Total (Category) | 21 (100.0%) | 0 (0.0%) |
| Total (Overall) | 57 (68.7%) | 26 (31.3%) |
Natural Resources, Construction and Maintenance Occupations
Natural Resources, Construction and Maintenance Occupations by Sex
| Occupation | Male | Female |
| Farming, Fishing & Forestry | 0 (0.0%) | 0 (0.0%) |
| Construction & Extraction | 0 (0.0%) | 0 (0.0%) |
| Installation, Maintenance & Repair | 0 (0.0%) | 0 (0.0%) |
| Total (Category) | 0 (0.0%) | 0 (0.0%) |
| Total (Overall) | 57 (68.7%) | 26 (31.3%) |
Production, Transportation and Moving Occupations
Production, Transportation and Moving Occupations by Sex
| Occupation | Male | Female |
| Production | 0 (0.0%) | 0 (0.0%) |
| Transportation | 0 (0.0%) | 0 (0.0%) |
| Material Moving | 0 (0.0%) | 0 (0.0%) |
| Total (Category) | 0 (0.0%) | 0 (0.0%) |
| Total (Overall) | 57 (68.7%) | 26 (31.3%) |
Employment Industries by Sex in Wallowa Lake
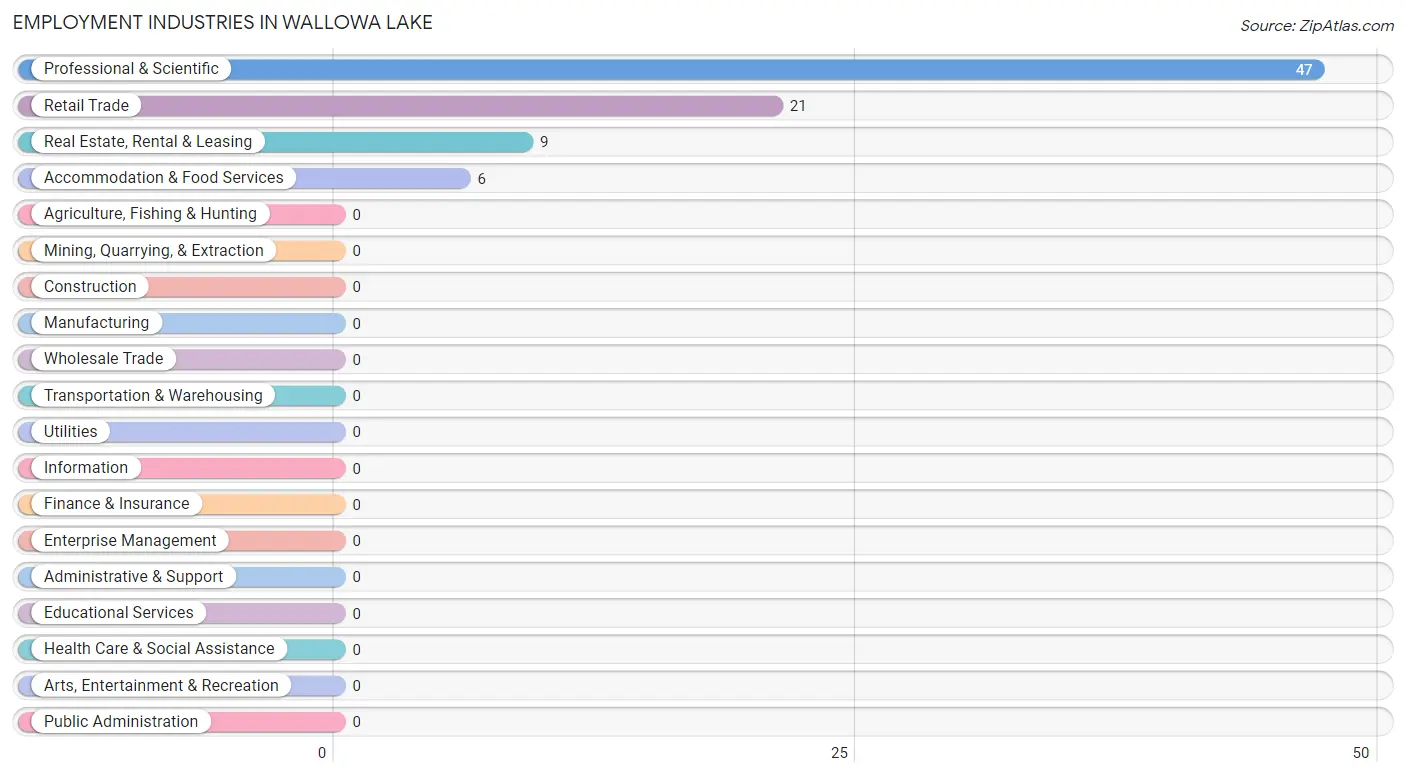
Employment Industries in Wallowa Lake
The major employment industries in Wallowa Lake include Professional & Scientific (47 | 56.6%), Retail Trade (21 | 25.3%), Real Estate, Rental & Leasing (9 | 10.8%), and Accommodation & Food Services (6 | 7.2%).
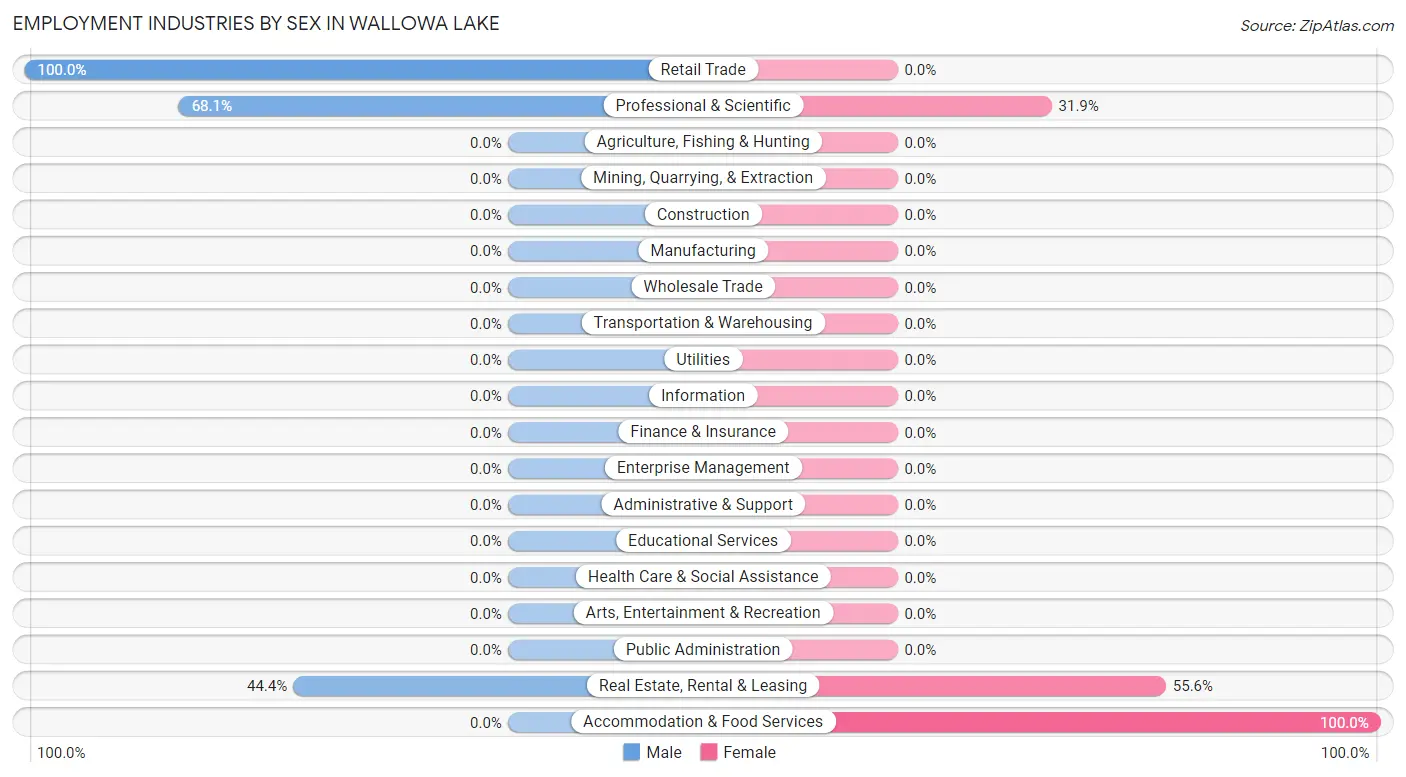
Employment Industries by Sex in Wallowa Lake
The Wallowa Lake industries that see more men than women are Retail Trade (100.0%), Professional & Scientific (68.1%), and Real Estate, Rental & Leasing (44.4%), whereas the industries that tend to have a higher number of women are Accommodation & Food Services (100.0%), Real Estate, Rental & Leasing (55.6%), and Professional & Scientific (31.9%).
| Industry | Male | Female |
| Agriculture, Fishing & Hunting | 0 (0.0%) | 0 (0.0%) |
| Mining, Quarrying, & Extraction | 0 (0.0%) | 0 (0.0%) |
| Construction | 0 (0.0%) | 0 (0.0%) |
| Manufacturing | 0 (0.0%) | 0 (0.0%) |
| Wholesale Trade | 0 (0.0%) | 0 (0.0%) |
| Retail Trade | 21 (100.0%) | 0 (0.0%) |
| Transportation & Warehousing | 0 (0.0%) | 0 (0.0%) |
| Utilities | 0 (0.0%) | 0 (0.0%) |
| Information | 0 (0.0%) | 0 (0.0%) |
| Finance & Insurance | 0 (0.0%) | 0 (0.0%) |
| Real Estate, Rental & Leasing | 4 (44.4%) | 5 (55.6%) |
| Professional & Scientific | 32 (68.1%) | 15 (31.9%) |
| Enterprise Management | 0 (0.0%) | 0 (0.0%) |
| Administrative & Support | 0 (0.0%) | 0 (0.0%) |
| Educational Services | 0 (0.0%) | 0 (0.0%) |
| Health Care & Social Assistance | 0 (0.0%) | 0 (0.0%) |
| Arts, Entertainment & Recreation | 0 (0.0%) | 0 (0.0%) |
| Accommodation & Food Services | 0 (0.0%) | 6 (100.0%) |
| Public Administration | 0 (0.0%) | 0 (0.0%) |
| Total | 57 (68.7%) | 26 (31.3%) |
Education in Wallowa Lake
School Enrollment in Wallowa Lake
| School Level | # Students | % Students |
| Nursery / Preschool | 0 | 0.0% |
| Kindergarten | 0 | 0.0% |
| Elementary School | 0 | 0.0% |
| Middle School | 0 | 0.0% |
| High School | 0 | 0.0% |
| College / Undergraduate | 0 | 0.0% |
| Graduate / Professional | 0 | 0.0% |
| Total | 0 | 0.0% |
School Enrollment by Age by Funding Source in Wallowa Lake
| Age Bracket | Public School | Private School |
| 3 to 4 Year Olds | 0 (0.0%) | 0 (0.0%) |
| 5 to 9 Year Old | 0 (0.0%) | 0 (0.0%) |
| 10 to 14 Year Olds | 0 (0.0%) | 0 (0.0%) |
| 15 to 17 Year Olds | 0 (0.0%) | 0 (0.0%) |
| 18 to 19 Year Olds | 0 (0.0%) | 0 (0.0%) |
| 20 to 24 Year Olds | 0 (0.0%) | 0 (0.0%) |
| 25 to 34 Year Olds | 0 (0.0%) | 0 (0.0%) |
| 35 Years and over | 0 (0.0%) | 0 (0.0%) |
| Total | 0 (0.0%) | 0 (0.0%) |
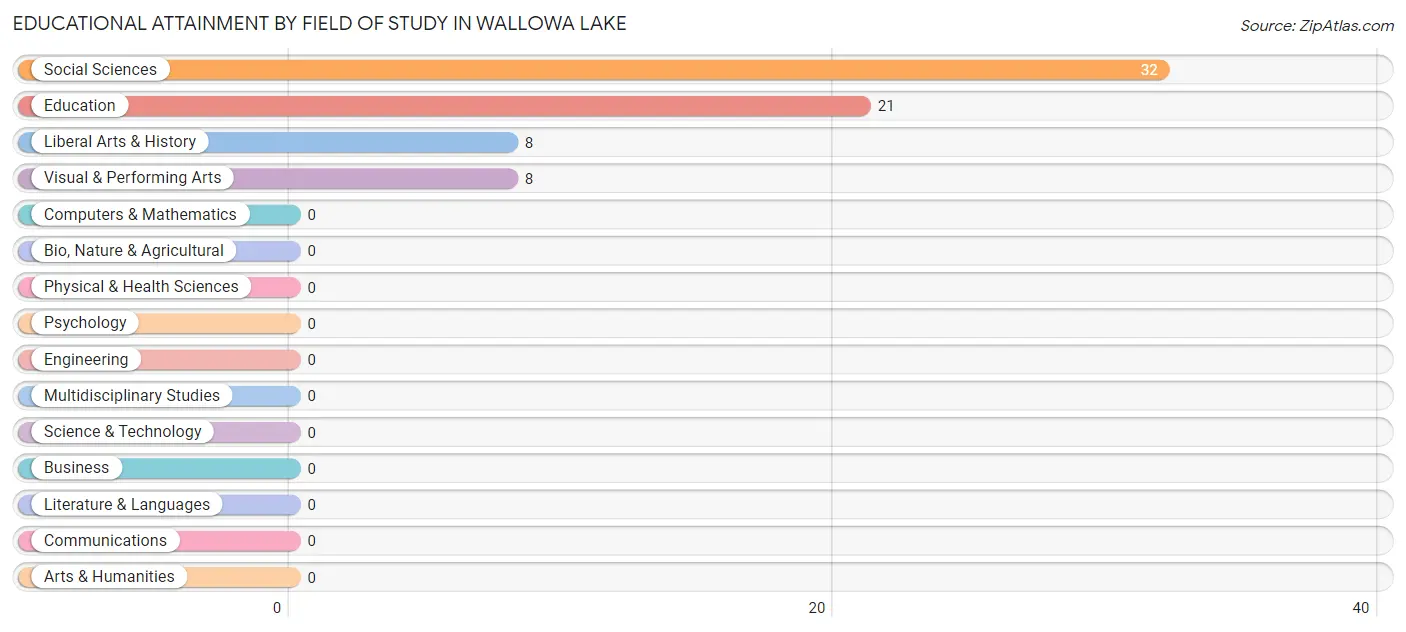
Educational Attainment by Field of Study in Wallowa Lake
Social sciences (32 | 46.4%), education (21 | 30.4%), liberal arts & history (8 | 11.6%), and visual & performing arts (8 | 11.6%) are the most common fields of study among 69 individuals in Wallowa Lake who have obtained a bachelor's degree or higher.
| Field of Study | # Graduates | % Graduates |
| Computers & Mathematics | 0 | 0.0% |
| Bio, Nature & Agricultural | 0 | 0.0% |
| Physical & Health Sciences | 0 | 0.0% |
| Psychology | 0 | 0.0% |
| Social Sciences | 32 | 46.4% |
| Engineering | 0 | 0.0% |
| Multidisciplinary Studies | 0 | 0.0% |
| Science & Technology | 0 | 0.0% |
| Business | 0 | 0.0% |
| Education | 21 | 30.4% |
| Literature & Languages | 0 | 0.0% |
| Liberal Arts & History | 8 | 11.6% |
| Visual & Performing Arts | 8 | 11.6% |
| Communications | 0 | 0.0% |
| Arts & Humanities | 0 | 0.0% |
| Total | 69 | 100.0% |
Transportation & Commute in Wallowa Lake
Vehicle Availability by Sex in Wallowa Lake
The most prevalent vehicle ownership categories in Wallowa Lake are males with 2 vehicles (36, accounting for 63.2%) and females with 2 vehicles (5, making up 138.5%).
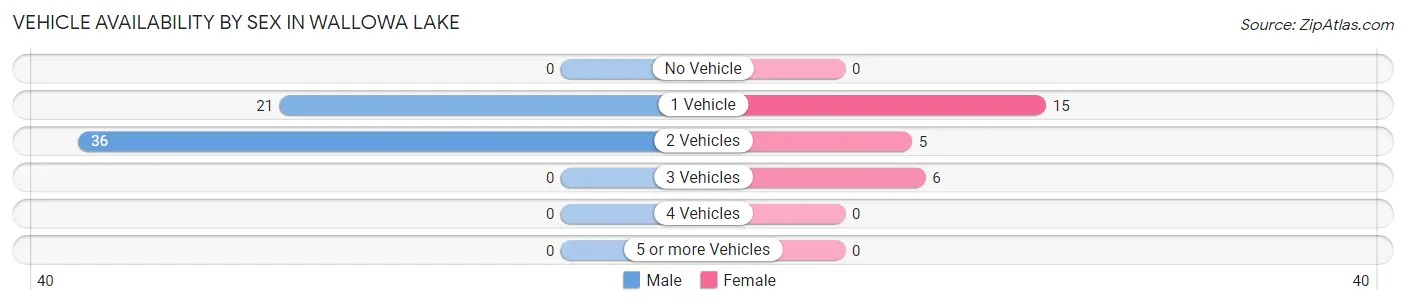
| Vehicles Available | Male | Female |
| No Vehicle | 0 (0.0%) | 0 (0.0%) |
| 1 Vehicle | 21 (36.8%) | 15 (57.7%) |
| 2 Vehicles | 36 (63.2%) | 5 (19.2%) |
| 3 Vehicles | 0 (0.0%) | 6 (23.1%) |
| 4 Vehicles | 0 (0.0%) | 0 (0.0%) |
| 5 or more Vehicles | 0 (0.0%) | 0 (0.0%) |
| Total | 57 (100.0%) | 26 (100.0%) |
Commute Time in Wallowa Lake
The most frequently occuring commute durations in Wallowa Lake are 10 to 14 minutes (21 commuters, 77.8%), less than 5 minutes (6 commuters, 22.2%), and 5 to 9 minutes (0 commuters, 0.0%).
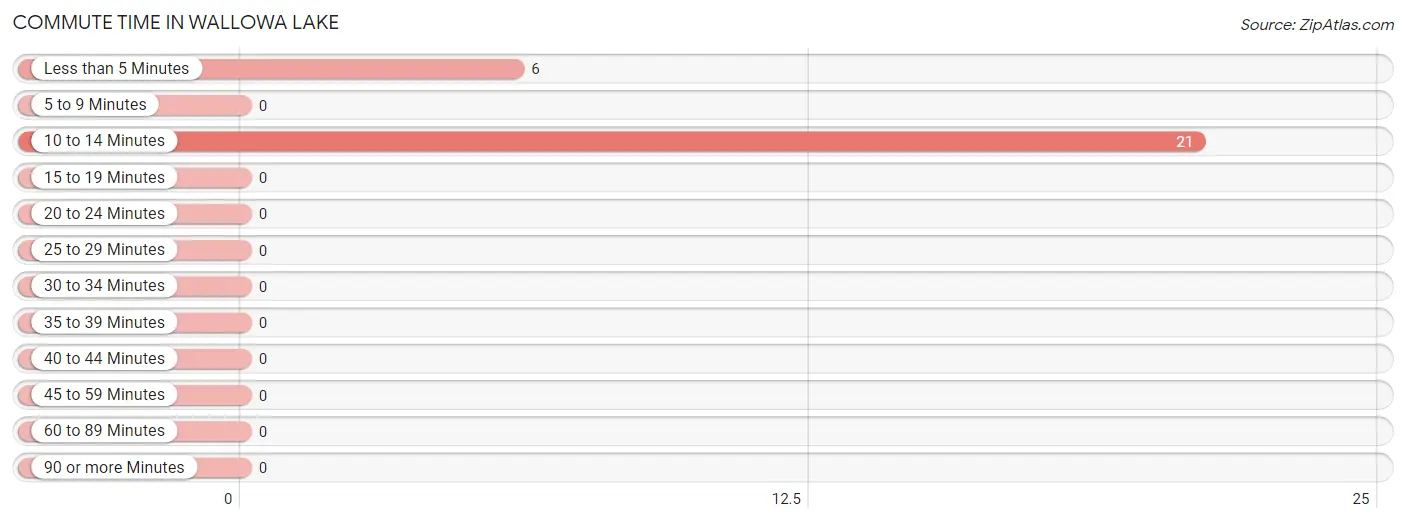
| Commute Time | # Commuters | % Commuters |
| Less than 5 Minutes | 6 | 22.2% |
| 5 to 9 Minutes | 0 | 0.0% |
| 10 to 14 Minutes | 21 | 77.8% |
| 15 to 19 Minutes | 0 | 0.0% |
| 20 to 24 Minutes | 0 | 0.0% |
| 25 to 29 Minutes | 0 | 0.0% |
| 30 to 34 Minutes | 0 | 0.0% |
| 35 to 39 Minutes | 0 | 0.0% |
| 40 to 44 Minutes | 0 | 0.0% |
| 45 to 59 Minutes | 0 | 0.0% |
| 60 to 89 Minutes | 0 | 0.0% |
| 90 or more Minutes | 0 | 0.0% |
Commute Time by Sex in Wallowa Lake
The most common commute times in Wallowa Lake are 10 to 14 minutes (21 commuters, 100.0%) for males and less than 5 minutes (6 commuters, 100.0%) for females.
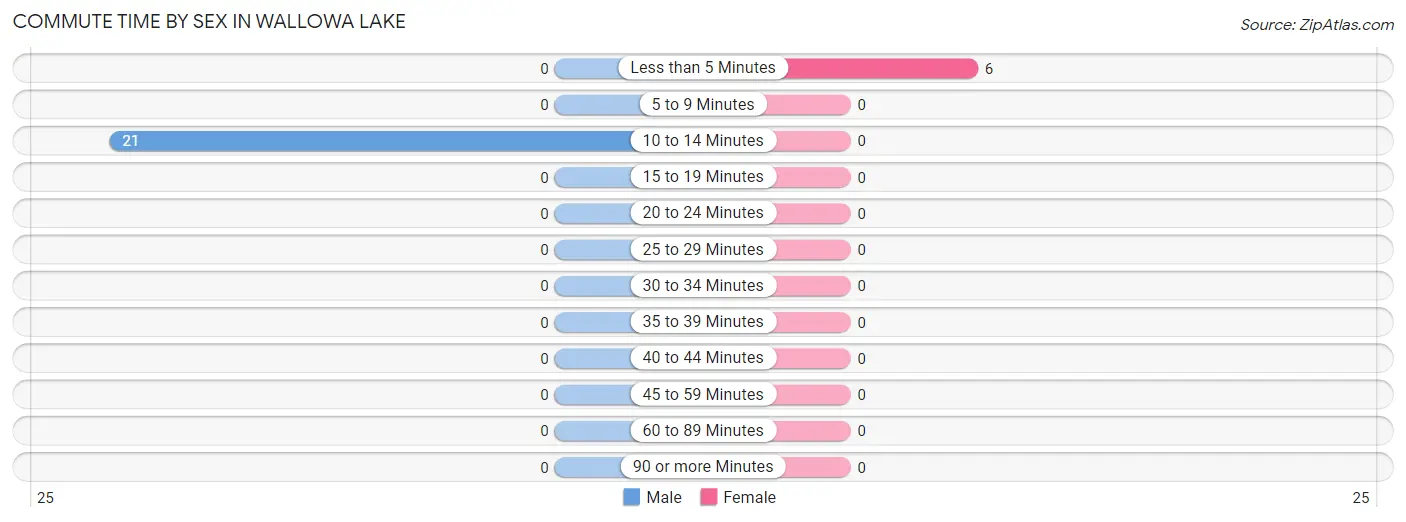
| Commute Time | Male | Female |
| Less than 5 Minutes | 0 (0.0%) | 6 (100.0%) |
| 5 to 9 Minutes | 0 (0.0%) | 0 (0.0%) |
| 10 to 14 Minutes | 21 (100.0%) | 0 (0.0%) |
| 15 to 19 Minutes | 0 (0.0%) | 0 (0.0%) |
| 20 to 24 Minutes | 0 (0.0%) | 0 (0.0%) |
| 25 to 29 Minutes | 0 (0.0%) | 0 (0.0%) |
| 30 to 34 Minutes | 0 (0.0%) | 0 (0.0%) |
| 35 to 39 Minutes | 0 (0.0%) | 0 (0.0%) |
| 40 to 44 Minutes | 0 (0.0%) | 0 (0.0%) |
| 45 to 59 Minutes | 0 (0.0%) | 0 (0.0%) |
| 60 to 89 Minutes | 0 (0.0%) | 0 (0.0%) |
| 90 or more Minutes | 0 (0.0%) | 0 (0.0%) |
Time of Departure to Work by Sex in Wallowa Lake
The most frequent times of departure to work in Wallowa Lake are 7:30 AM to 7:59 AM (21, 100.0%) for males and 10:00 AM to 10:59 AM (6, 100.0%) for females.
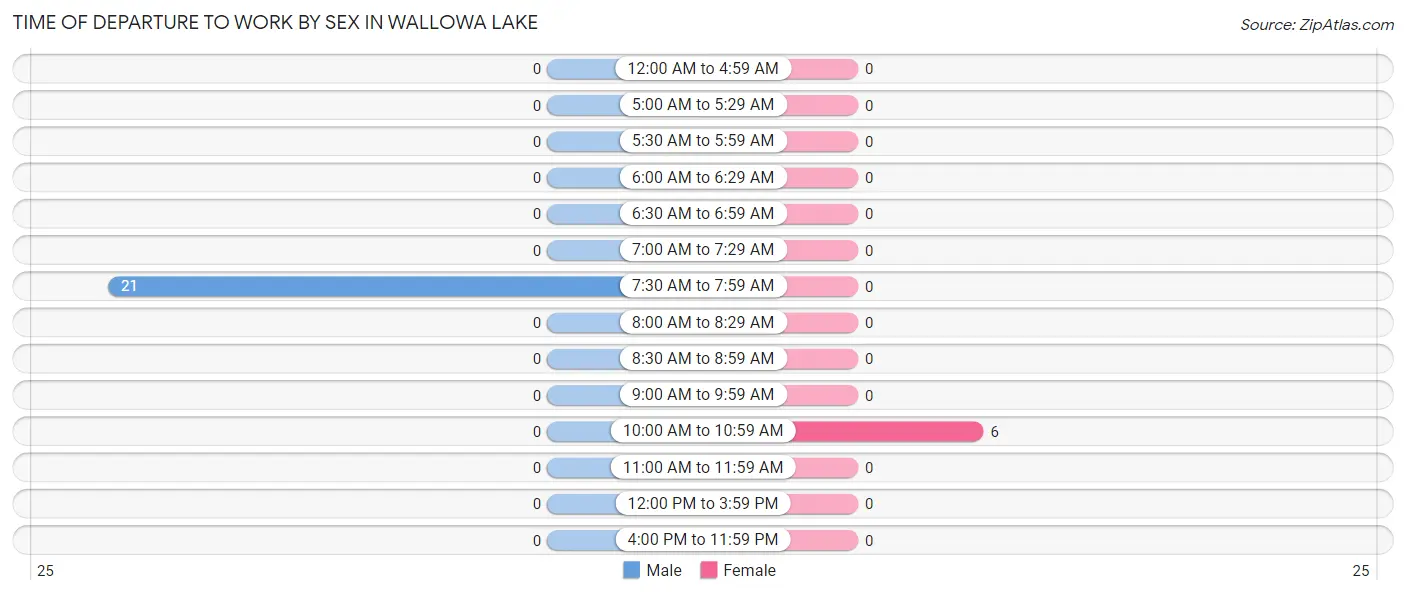
| Time of Departure | Male | Female |
| 12:00 AM to 4:59 AM | 0 (0.0%) | 0 (0.0%) |
| 5:00 AM to 5:29 AM | 0 (0.0%) | 0 (0.0%) |
| 5:30 AM to 5:59 AM | 0 (0.0%) | 0 (0.0%) |
| 6:00 AM to 6:29 AM | 0 (0.0%) | 0 (0.0%) |
| 6:30 AM to 6:59 AM | 0 (0.0%) | 0 (0.0%) |
| 7:00 AM to 7:29 AM | 0 (0.0%) | 0 (0.0%) |
| 7:30 AM to 7:59 AM | 21 (100.0%) | 0 (0.0%) |
| 8:00 AM to 8:29 AM | 0 (0.0%) | 0 (0.0%) |
| 8:30 AM to 8:59 AM | 0 (0.0%) | 0 (0.0%) |
| 9:00 AM to 9:59 AM | 0 (0.0%) | 0 (0.0%) |
| 10:00 AM to 10:59 AM | 0 (0.0%) | 6 (100.0%) |
| 11:00 AM to 11:59 AM | 0 (0.0%) | 0 (0.0%) |
| 12:00 PM to 3:59 PM | 0 (0.0%) | 0 (0.0%) |
| 4:00 PM to 11:59 PM | 0 (0.0%) | 0 (0.0%) |
| Total | 21 (100.0%) | 6 (100.0%) |
Housing Occupancy in Wallowa Lake
Occupancy by Ownership in Wallowa Lake
Of the total 71 dwellings in Wallowa Lake, owner-occupied units account for 50 (70.4%), while renter-occupied units make up 21 (29.6%).
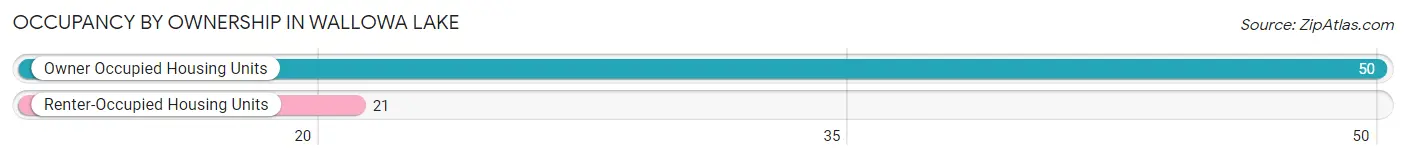
| Occupancy | # Housing Units | % Housing Units |
| Owner Occupied Housing Units | 50 | 70.4% |
| Renter-Occupied Housing Units | 21 | 29.6% |
| Total Occupied Housing Units | 71 | 100.0% |
Occupancy by Household Size in Wallowa Lake
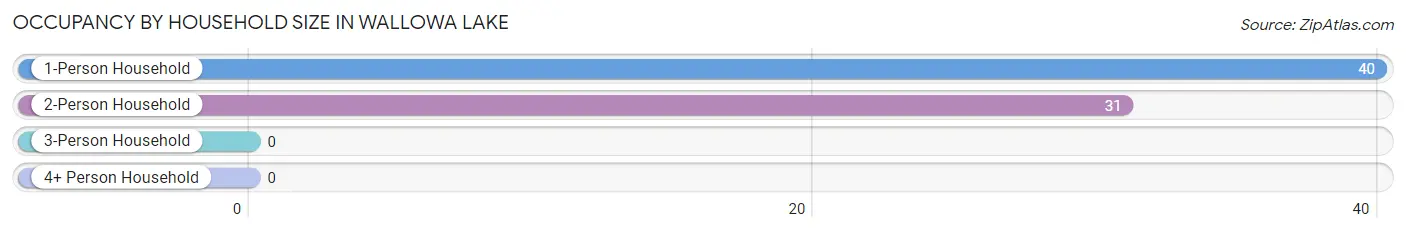
| Household Size | # Housing Units | % Housing Units |
| 1-Person Household | 40 | 56.3% |
| 2-Person Household | 31 | 43.7% |
| 3-Person Household | 0 | 0.0% |
| 4+ Person Household | 0 | 0.0% |
| Total Housing Units | 71 | 100.0% |
Occupancy by Ownership by Household Size in Wallowa Lake
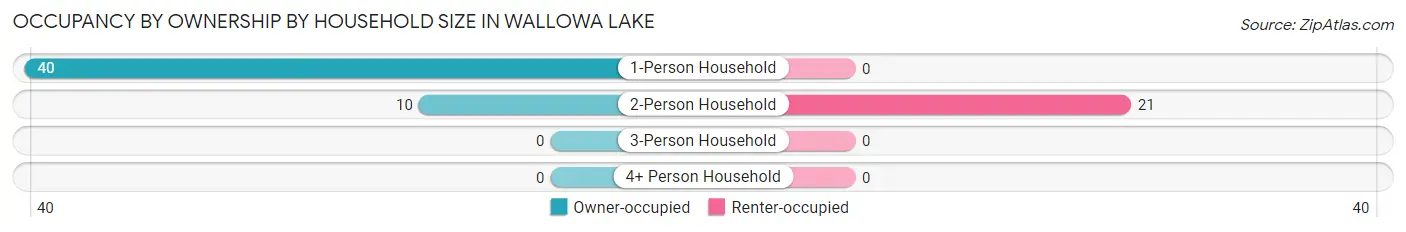
| Household Size | Owner-occupied | Renter-occupied |
| 1-Person Household | 40 (100.0%) | 0 (0.0%) |
| 2-Person Household | 10 (32.3%) | 21 (67.7%) |
| 3-Person Household | 0 (0.0%) | 0 (0.0%) |
| 4+ Person Household | 0 (0.0%) | 0 (0.0%) |
| Total Housing Units | 50 (70.4%) | 21 (29.6%) |
Occupancy by Educational Attainment in Wallowa Lake
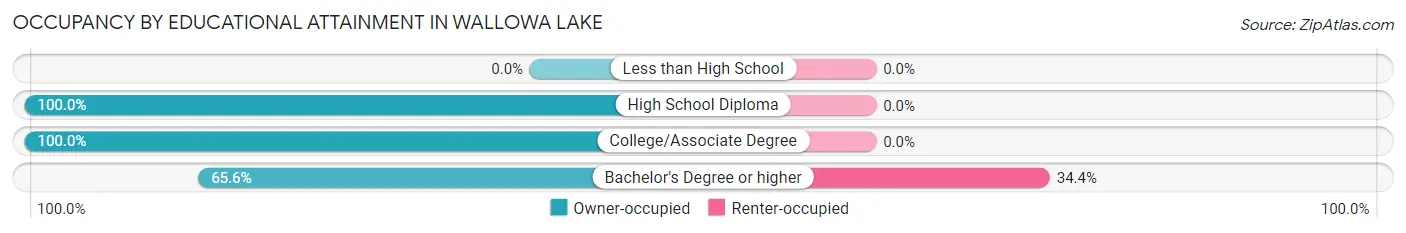
| Household Size | Owner-occupied | Renter-occupied |
| Less than High School | 0 (0.0%) | 0 (0.0%) |
| High School Diploma | 6 (100.0%) | 0 (0.0%) |
| College/Associate Degree | 4 (100.0%) | 0 (0.0%) |
| Bachelor's Degree or higher | 40 (65.6%) | 21 (34.4%) |
Occupancy by Age of Householder in Wallowa Lake
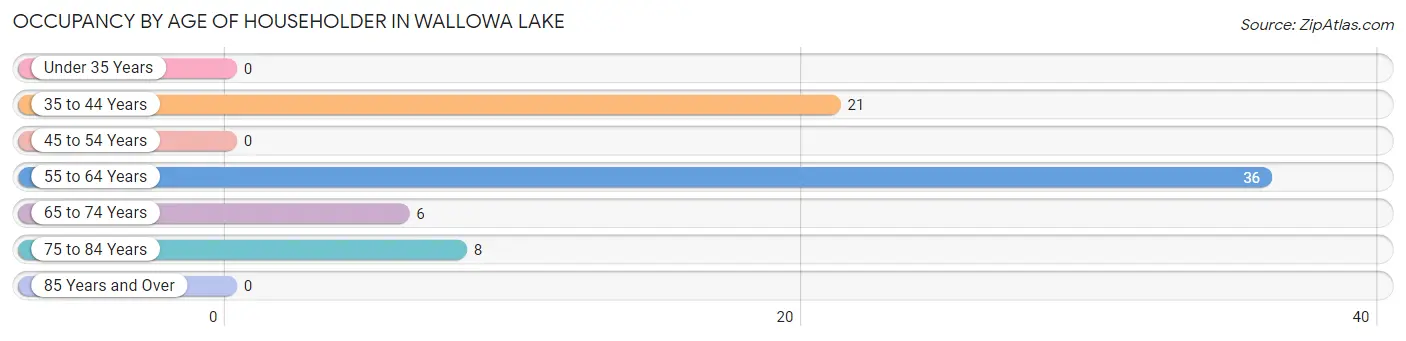
| Age Bracket | # Households | % Households |
| Under 35 Years | 0 | 0.0% |
| 35 to 44 Years | 21 | 29.6% |
| 45 to 54 Years | 0 | 0.0% |
| 55 to 64 Years | 36 | 50.7% |
| 65 to 74 Years | 6 | 8.5% |
| 75 to 84 Years | 8 | 11.3% |
| 85 Years and Over | 0 | 0.0% |
| Total | 71 | 100.0% |
Housing Finances in Wallowa Lake
Median Income by Occupancy in Wallowa Lake
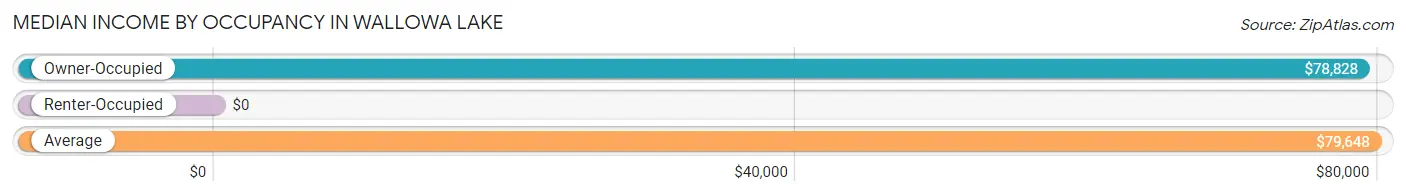
| Occupancy Type | # Households | Median Income |
| Owner-Occupied | 50 (70.4%) | $78,828 |
| Renter-Occupied | 21 (29.6%) | $0 |
| Average | 71 (100.0%) | $79,648 |
Occupancy by Householder Income Bracket in Wallowa Lake
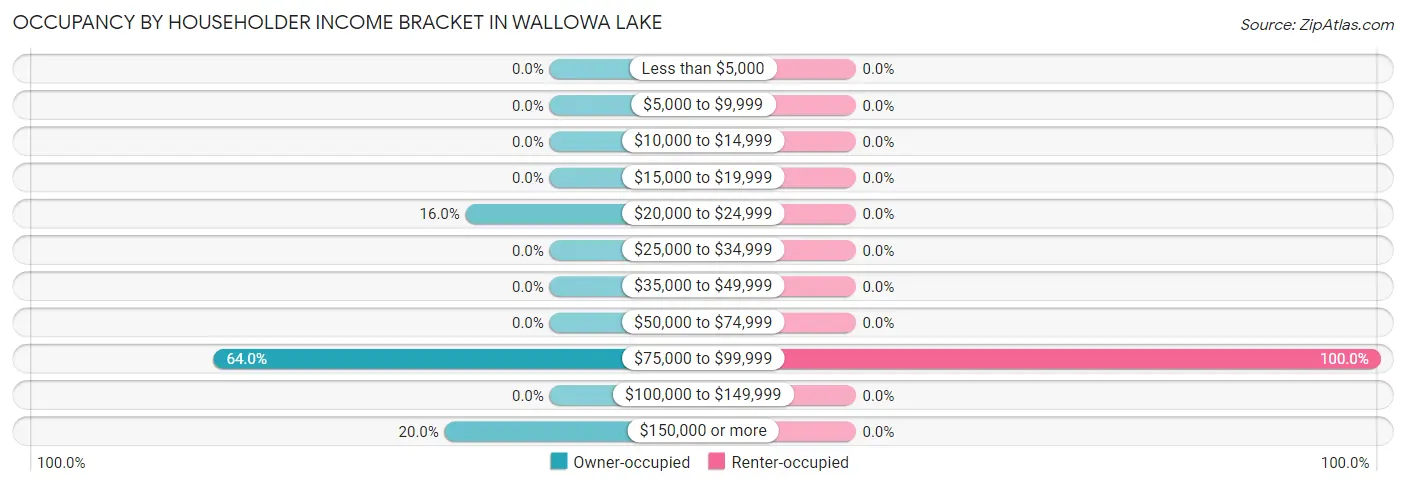
| Income Bracket | Owner-occupied | Renter-occupied |
| Less than $5,000 | 0 (0.0%) | 0 (0.0%) |
| $5,000 to $9,999 | 0 (0.0%) | 0 (0.0%) |
| $10,000 to $14,999 | 0 (0.0%) | 0 (0.0%) |
| $15,000 to $19,999 | 0 (0.0%) | 0 (0.0%) |
| $20,000 to $24,999 | 8 (16.0%) | 0 (0.0%) |
| $25,000 to $34,999 | 0 (0.0%) | 0 (0.0%) |
| $35,000 to $49,999 | 0 (0.0%) | 0 (0.0%) |
| $50,000 to $74,999 | 0 (0.0%) | 0 (0.0%) |
| $75,000 to $99,999 | 32 (64.0%) | 21 (100.0%) |
| $100,000 to $149,999 | 0 (0.0%) | 0 (0.0%) |
| $150,000 or more | 10 (20.0%) | 0 (0.0%) |
| Total | 50 (100.0%) | 21 (100.0%) |
Monthly Housing Cost Tiers in Wallowa Lake
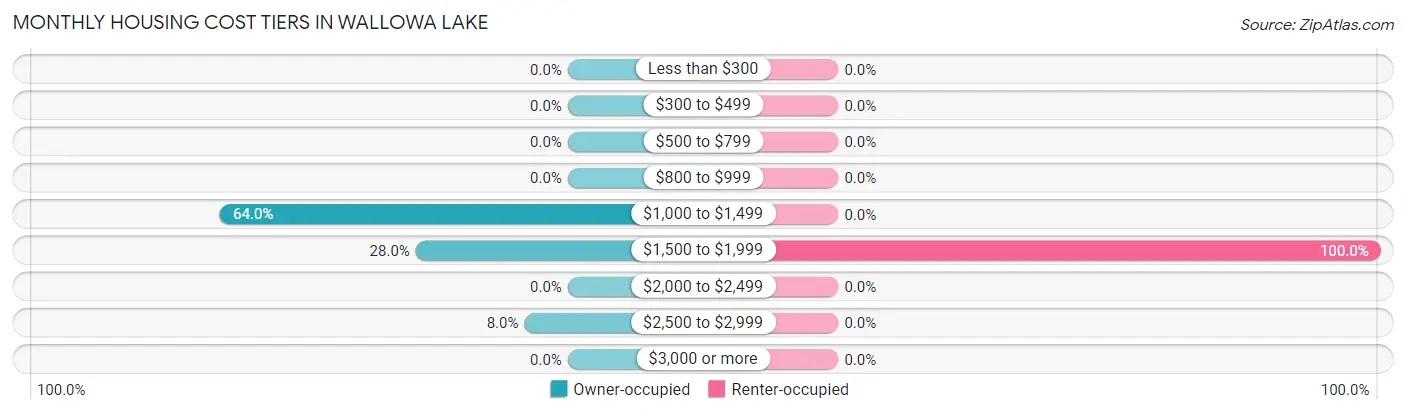
| Monthly Cost | Owner-occupied | Renter-occupied |
| Less than $300 | 0 (0.0%) | 0 (0.0%) |
| $300 to $499 | 0 (0.0%) | 0 (0.0%) |
| $500 to $799 | 0 (0.0%) | 0 (0.0%) |
| $800 to $999 | 0 (0.0%) | 0 (0.0%) |
| $1,000 to $1,499 | 32 (64.0%) | 0 (0.0%) |
| $1,500 to $1,999 | 14 (28.0%) | 21 (100.0%) |
| $2,000 to $2,499 | 0 (0.0%) | 0 (0.0%) |
| $2,500 to $2,999 | 4 (8.0%) | 0 (0.0%) |
| $3,000 or more | 0 (0.0%) | 0 (0.0%) |
| Total | 50 (100.0%) | 21 (100.0%) |
Physical Housing Characteristics in Wallowa Lake
Housing Structures in Wallowa Lake
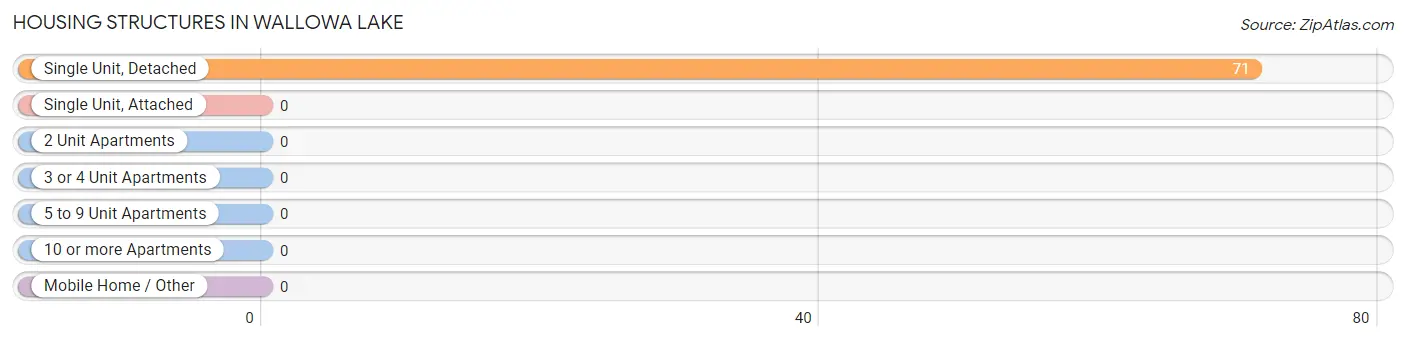
| Structure Type | # Housing Units | % Housing Units |
| Single Unit, Detached | 71 | 100.0% |
| Single Unit, Attached | 0 | 0.0% |
| 2 Unit Apartments | 0 | 0.0% |
| 3 or 4 Unit Apartments | 0 | 0.0% |
| 5 to 9 Unit Apartments | 0 | 0.0% |
| 10 or more Apartments | 0 | 0.0% |
| Mobile Home / Other | 0 | 0.0% |
| Total | 71 | 100.0% |
Housing Structures by Occupancy in Wallowa Lake
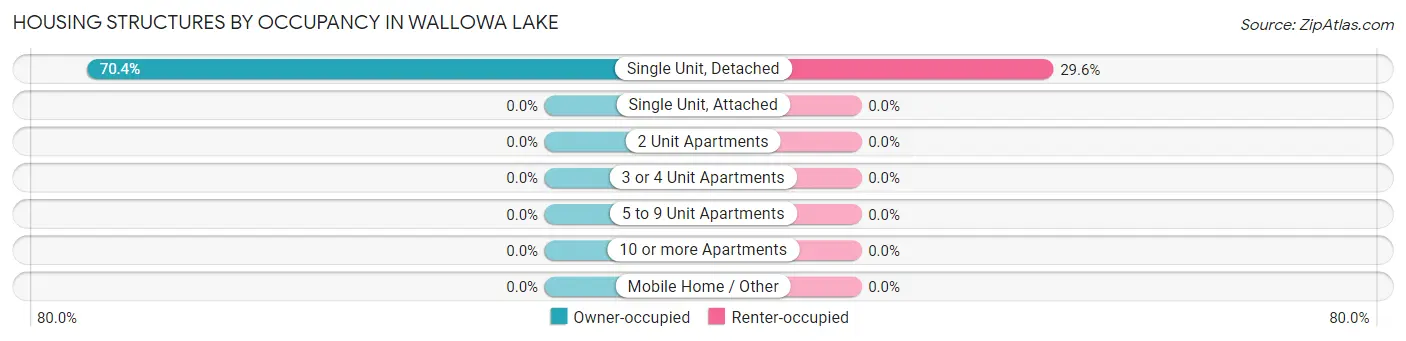
| Structure Type | Owner-occupied | Renter-occupied |
| Single Unit, Detached | 50 (70.4%) | 21 (29.6%) |
| Single Unit, Attached | 0 (0.0%) | 0 (0.0%) |
| 2 Unit Apartments | 0 (0.0%) | 0 (0.0%) |
| 3 or 4 Unit Apartments | 0 (0.0%) | 0 (0.0%) |
| 5 to 9 Unit Apartments | 0 (0.0%) | 0 (0.0%) |
| 10 or more Apartments | 0 (0.0%) | 0 (0.0%) |
| Mobile Home / Other | 0 (0.0%) | 0 (0.0%) |
| Total | 50 (70.4%) | 21 (29.6%) |
Housing Structures by Number of Rooms in Wallowa Lake
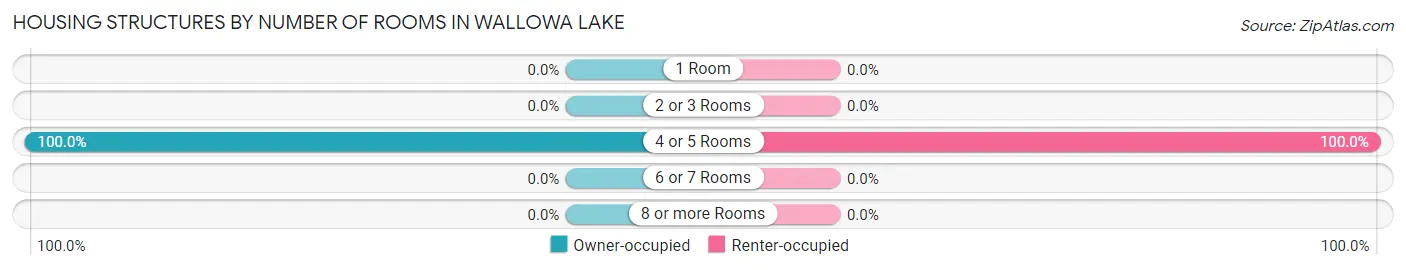
| Number of Rooms | Owner-occupied | Renter-occupied |
| 1 Room | 0 (0.0%) | 0 (0.0%) |
| 2 or 3 Rooms | 0 (0.0%) | 0 (0.0%) |
| 4 or 5 Rooms | 50 (100.0%) | 21 (100.0%) |
| 6 or 7 Rooms | 0 (0.0%) | 0 (0.0%) |
| 8 or more Rooms | 0 (0.0%) | 0 (0.0%) |
| Total | 50 (100.0%) | 21 (100.0%) |
Housing Structure by Heating Type in Wallowa Lake
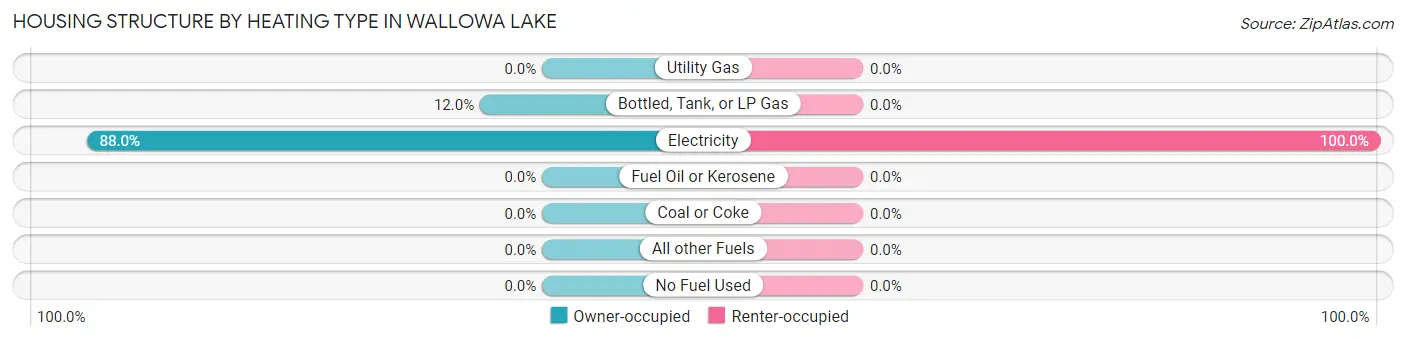
| Heating Type | Owner-occupied | Renter-occupied |
| Utility Gas | 0 (0.0%) | 0 (0.0%) |
| Bottled, Tank, or LP Gas | 6 (12.0%) | 0 (0.0%) |
| Electricity | 44 (88.0%) | 21 (100.0%) |
| Fuel Oil or Kerosene | 0 (0.0%) | 0 (0.0%) |
| Coal or Coke | 0 (0.0%) | 0 (0.0%) |
| All other Fuels | 0 (0.0%) | 0 (0.0%) |
| No Fuel Used | 0 (0.0%) | 0 (0.0%) |
| Total | 50 (100.0%) | 21 (100.0%) |
Household Vehicle Usage in Wallowa Lake
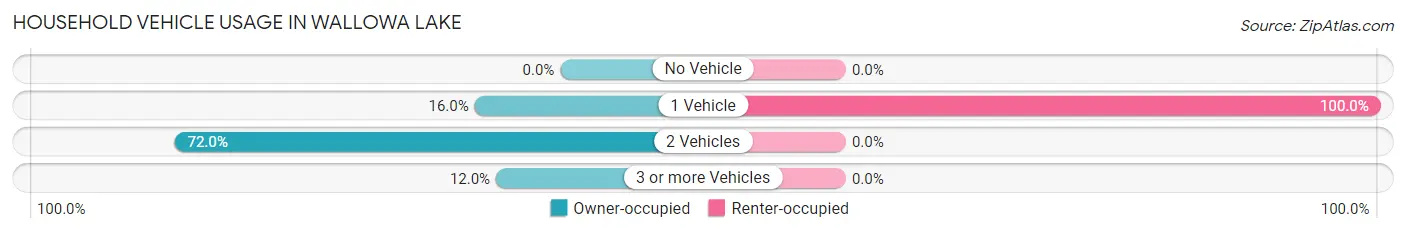
| Vehicles per Household | Owner-occupied | Renter-occupied |
| No Vehicle | 0 (0.0%) | 0 (0.0%) |
| 1 Vehicle | 8 (16.0%) | 21 (100.0%) |
| 2 Vehicles | 36 (72.0%) | 0 (0.0%) |
| 3 or more Vehicles | 6 (12.0%) | 0 (0.0%) |
| Total | 50 (100.0%) | 21 (100.0%) |
Real Estate & Mortgages in Wallowa Lake
Real Estate and Mortgage Overview in Wallowa Lake
| Characteristic | Without Mortgage | With Mortgage |
| Housing Units | 0 | 50 |
| Median Property Value | - | - |
| Median Household Income | - | - |
| Monthly Housing Costs | - | - |
| Real Estate Taxes | - | - |
Property Value by Mortgage Status in Wallowa Lake
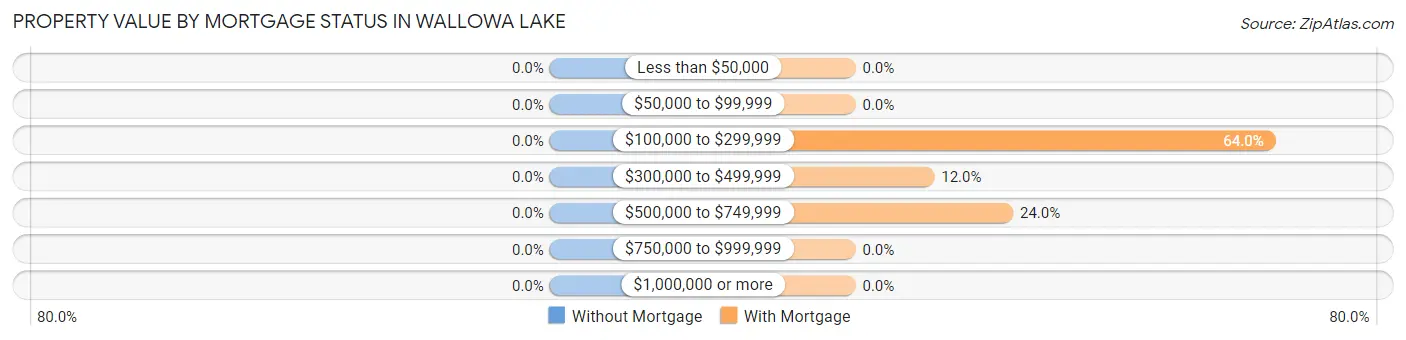
| Property Value | Without Mortgage | With Mortgage |
| Less than $50,000 | 0 (0.0%) | 0 (0.0%) |
| $50,000 to $99,999 | 0 (0.0%) | 0 (0.0%) |
| $100,000 to $299,999 | 0 (0.0%) | 32 (64.0%) |
| $300,000 to $499,999 | 0 (0.0%) | 6 (12.0%) |
| $500,000 to $749,999 | 0 (0.0%) | 12 (24.0%) |
| $750,000 to $999,999 | 0 (0.0%) | 0 (0.0%) |
| $1,000,000 or more | 0 (0.0%) | 0 (0.0%) |
| Total | 0 (0.0%) | 50 (100.0%) |
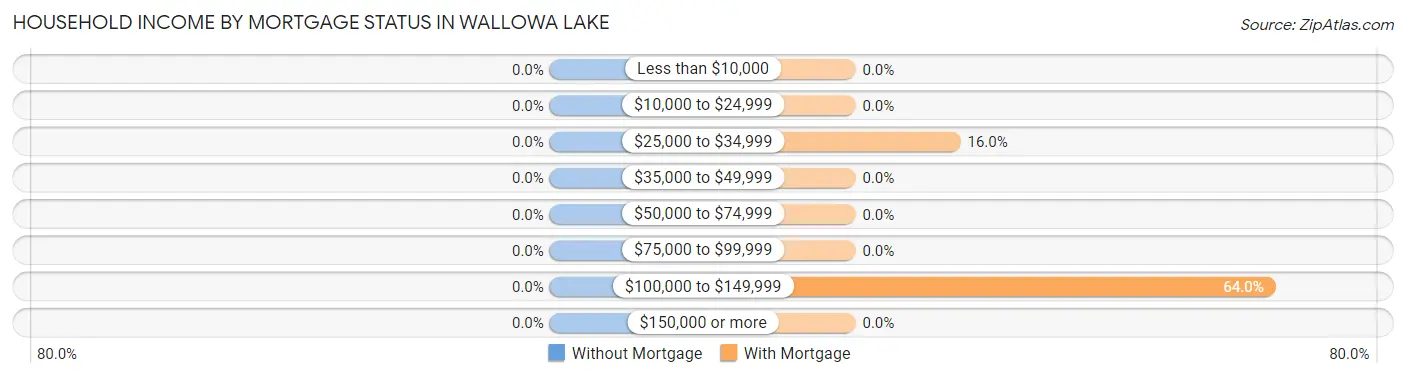
Household Income by Mortgage Status in Wallowa Lake
| Household Income | Without Mortgage | With Mortgage |
| Less than $10,000 | 0 (0.0%) | 0 (0.0%) |
| $10,000 to $24,999 | 0 (0.0%) | 0 (0.0%) |
| $25,000 to $34,999 | 0 (0.0%) | 8 (16.0%) |
| $35,000 to $49,999 | 0 (0.0%) | 0 (0.0%) |
| $50,000 to $74,999 | 0 (0.0%) | 0 (0.0%) |
| $75,000 to $99,999 | 0 (0.0%) | 0 (0.0%) |
| $100,000 to $149,999 | 0 (0.0%) | 32 (64.0%) |
| $150,000 or more | 0 (0.0%) | 0 (0.0%) |
| Total | 0 (0.0%) | 50 (100.0%) |
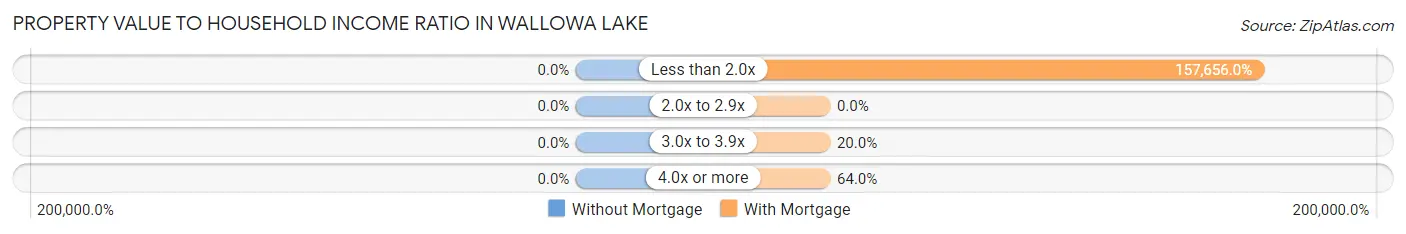
Property Value to Household Income Ratio in Wallowa Lake
| Value-to-Income Ratio | Without Mortgage | With Mortgage |
| Less than 2.0x | 0 (0.0%) | 78,828 (157,656.0%) |
| 2.0x to 2.9x | 0 (0.0%) | 0 (0.0%) |
| 3.0x to 3.9x | 0 (0.0%) | 10 (20.0%) |
| 4.0x or more | 0 (0.0%) | 32 (64.0%) |
| Total | 0 (0.0%) | 50 (100.0%) |
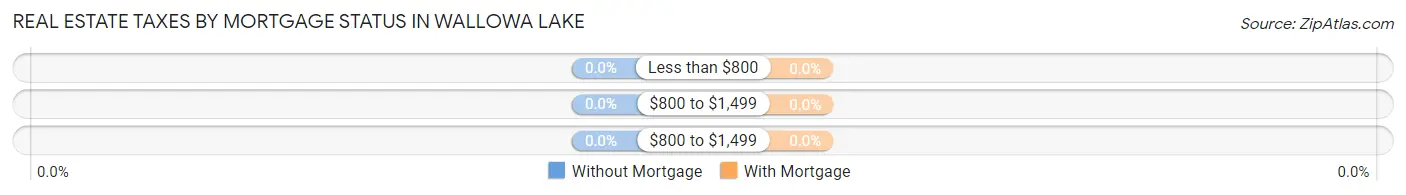
Real Estate Taxes by Mortgage Status in Wallowa Lake
| Property Taxes | Without Mortgage | With Mortgage |
| Less than $800 | 0 (0.0%) | 0 (0.0%) |
| $800 to $1,499 | 0 (0.0%) | 0 (0.0%) |
| $800 to $1,499 | 0 (0.0%) | 0 (0.0%) |
| Total | 0 (0.0%) | 50 (100.0%) |
Health & Disability in Wallowa Lake
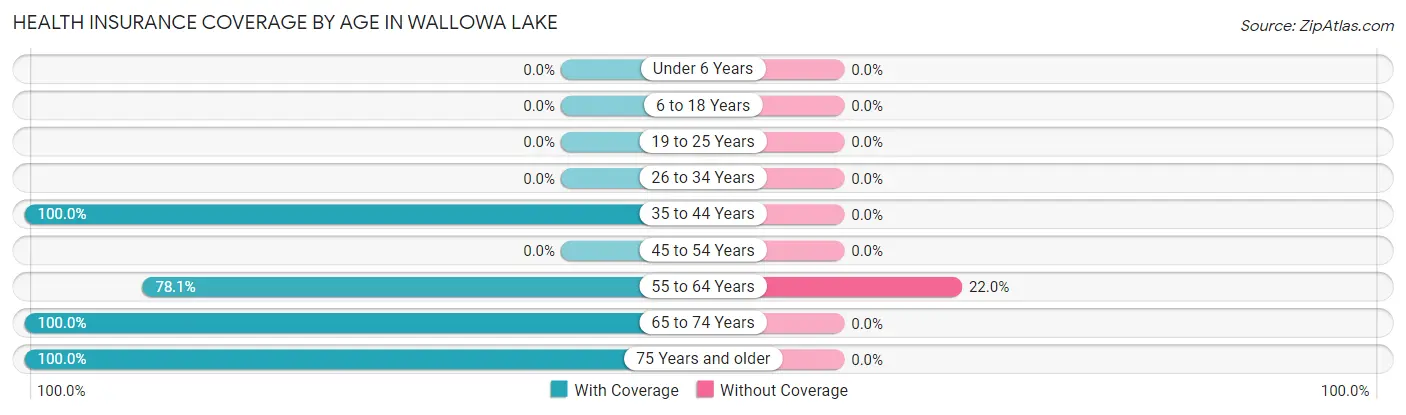
Health Insurance Coverage by Age in Wallowa Lake
| Age Bracket | With Coverage | Without Coverage |
| Under 6 Years | 0 (0.0%) | 0 (0.0%) |
| 6 to 18 Years | 0 (0.0%) | 0 (0.0%) |
| 19 to 25 Years | 0 (0.0%) | 0 (0.0%) |
| 26 to 34 Years | 0 (0.0%) | 0 (0.0%) |
| 35 to 44 Years | 36 (100.0%) | 0 (0.0%) |
| 45 to 54 Years | 0 (0.0%) | 0 (0.0%) |
| 55 to 64 Years | 32 (78.0%) | 9 (22.0%) |
| 65 to 74 Years | 11 (100.0%) | 0 (0.0%) |
| 75 Years and older | 8 (100.0%) | 0 (0.0%) |
| Total | 87 (90.6%) | 9 (9.4%) |
Health Insurance Coverage by Citizenship Status in Wallowa Lake
| Citizenship Status | With Coverage | Without Coverage |
| Native Born | 0 (0.0%) | 0 (0.0%) |
| Foreign Born, Citizen | 0 (0.0%) | 0 (0.0%) |
| Foreign Born, not a Citizen | 0 (0.0%) | 0 (0.0%) |
Health Insurance Coverage by Household Income in Wallowa Lake
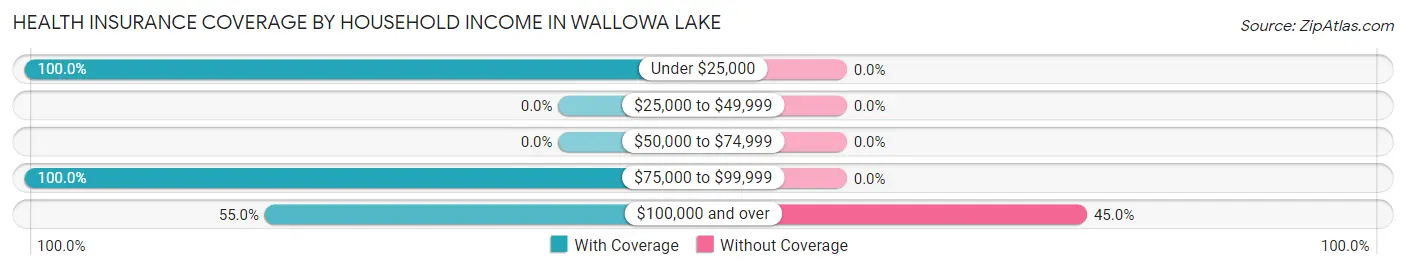
| Household Income | With Coverage | Without Coverage |
| Under $25,000 | 8 (100.0%) | 0 (0.0%) |
| $25,000 to $49,999 | 0 (0.0%) | 0 (0.0%) |
| $50,000 to $74,999 | 0 (0.0%) | 0 (0.0%) |
| $75,000 to $99,999 | 68 (100.0%) | 0 (0.0%) |
| $100,000 and over | 11 (55.0%) | 9 (45.0%) |
Public vs Private Health Insurance Coverage by Age in Wallowa Lake
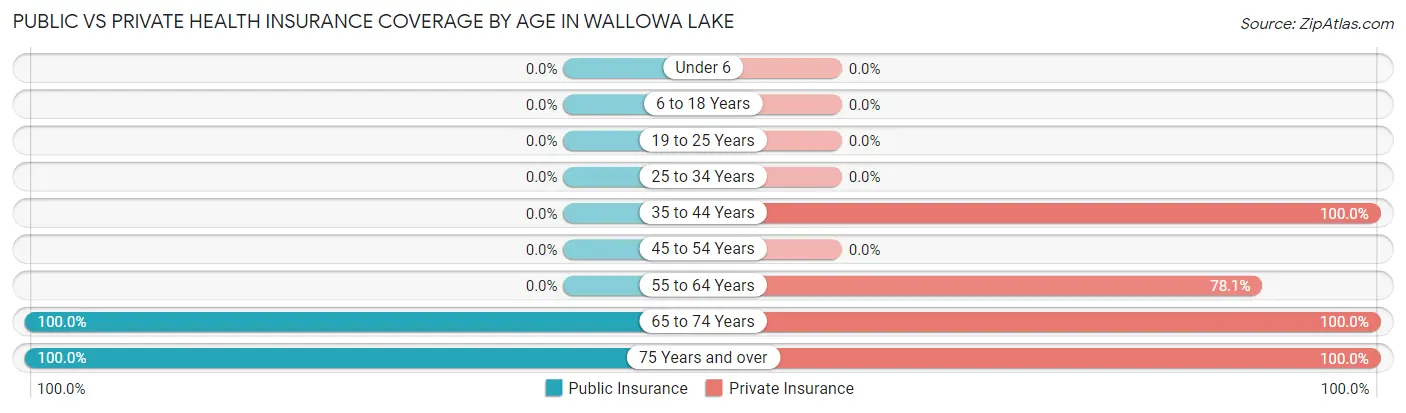
| Age Bracket | Public Insurance | Private Insurance |
| Under 6 | 0 (0.0%) | 0 (0.0%) |
| 6 to 18 Years | 0 (0.0%) | 0 (0.0%) |
| 19 to 25 Years | 0 (0.0%) | 0 (0.0%) |
| 25 to 34 Years | 0 (0.0%) | 0 (0.0%) |
| 35 to 44 Years | 0 (0.0%) | 36 (100.0%) |
| 45 to 54 Years | 0 (0.0%) | 0 (0.0%) |
| 55 to 64 Years | 0 (0.0%) | 32 (78.0%) |
| 65 to 74 Years | 11 (100.0%) | 11 (100.0%) |
| 75 Years and over | 8 (100.0%) | 8 (100.0%) |
| Total | 19 (19.8%) | 87 (90.6%) |
Disability Status by Sex by Age in Wallowa Lake
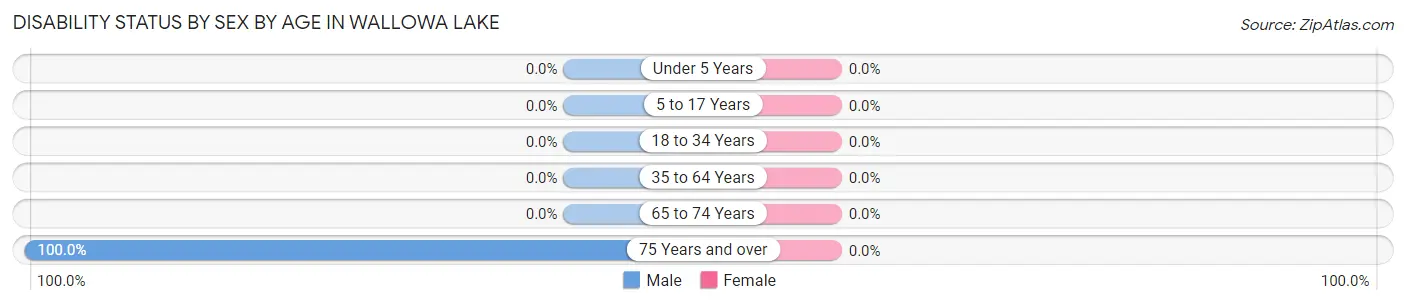
| Age Bracket | Male | Female |
| Under 5 Years | 0 (0.0%) | 0 (0.0%) |
| 5 to 17 Years | 0 (0.0%) | 0 (0.0%) |
| 18 to 34 Years | 0 (0.0%) | 0 (0.0%) |
| 35 to 64 Years | 0 (0.0%) | 0 (0.0%) |
| 65 to 74 Years | 0 (0.0%) | 0 (0.0%) |
| 75 Years and over | 8 (100.0%) | 0 (0.0%) |
Disability Class by Sex by Age in Wallowa Lake
Disability Class: Hearing Difficulty
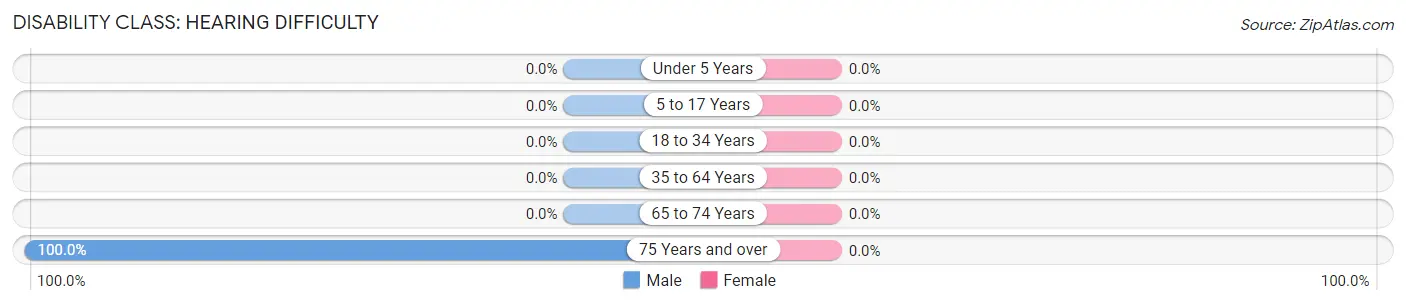
| Age Bracket | Male | Female |
| Under 5 Years | 0 (0.0%) | 0 (0.0%) |
| 5 to 17 Years | 0 (0.0%) | 0 (0.0%) |
| 18 to 34 Years | 0 (0.0%) | 0 (0.0%) |
| 35 to 64 Years | 0 (0.0%) | 0 (0.0%) |
| 65 to 74 Years | 0 (0.0%) | 0 (0.0%) |
| 75 Years and over | 8 (100.0%) | 0 (0.0%) |
Disability Class: Vision Difficulty
| Age Bracket | Male | Female |
| Under 5 Years | 0 (0.0%) | 0 (0.0%) |
| 5 to 17 Years | 0 (0.0%) | 0 (0.0%) |
| 18 to 34 Years | 0 (0.0%) | 0 (0.0%) |
| 35 to 64 Years | 0 (0.0%) | 0 (0.0%) |
| 65 to 74 Years | 0 (0.0%) | 0 (0.0%) |
| 75 Years and over | 0 (0.0%) | 0 (0.0%) |
Disability Class: Cognitive Difficulty
| Age Bracket | Male | Female |
| 5 to 17 Years | 0 (0.0%) | 0 (0.0%) |
| 18 to 34 Years | 0 (0.0%) | 0 (0.0%) |
| 35 to 64 Years | 0 (0.0%) | 0 (0.0%) |
| 65 to 74 Years | 0 (0.0%) | 0 (0.0%) |
| 75 Years and over | 0 (0.0%) | 0 (0.0%) |
Disability Class: Ambulatory Difficulty
| Age Bracket | Male | Female |
| 5 to 17 Years | 0 (0.0%) | 0 (0.0%) |
| 18 to 34 Years | 0 (0.0%) | 0 (0.0%) |
| 35 to 64 Years | 0 (0.0%) | 0 (0.0%) |
| 65 to 74 Years | 0 (0.0%) | 0 (0.0%) |
| 75 Years and over | 0 (0.0%) | 0 (0.0%) |
Disability Class: Self-Care Difficulty
| Age Bracket | Male | Female |
| 5 to 17 Years | 0 (0.0%) | 0 (0.0%) |
| 18 to 34 Years | 0 (0.0%) | 0 (0.0%) |
| 35 to 64 Years | 0 (0.0%) | 0 (0.0%) |
| 65 to 74 Years | 0 (0.0%) | 0 (0.0%) |
| 75 Years and over | 0 (0.0%) | 0 (0.0%) |
Technology Access in Wallowa Lake
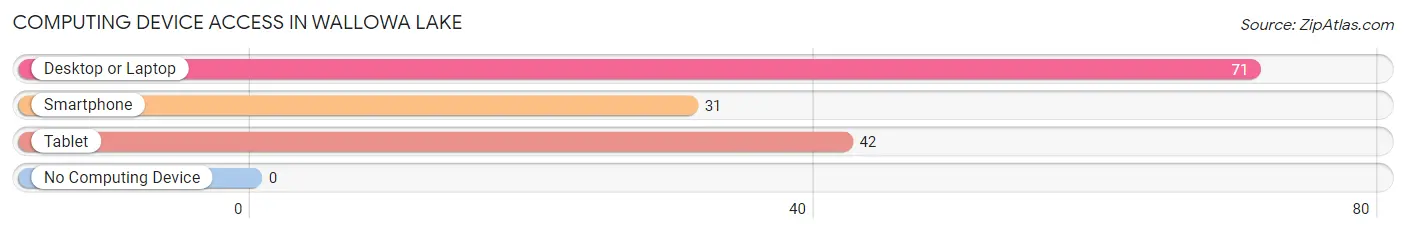
Computing Device Access in Wallowa Lake
| Device Type | # Households | % Households |
| Desktop or Laptop | 71 | 100.0% |
| Smartphone | 31 | 43.7% |
| Tablet | 42 | 59.2% |
| No Computing Device | 0 | 0.0% |
| Total | 71 | 100.0% |
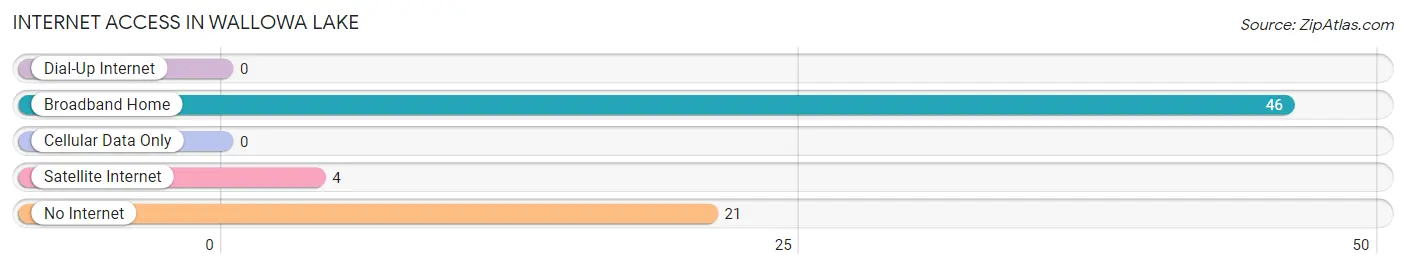
Internet Access in Wallowa Lake
| Internet Type | # Households | % Households |
| Dial-Up Internet | 0 | 0.0% |
| Broadband Home | 46 | 64.8% |
| Cellular Data Only | 0 | 0.0% |
| Satellite Internet | 4 | 5.6% |
| No Internet | 21 | 29.6% |
| Total | 71 | 100.0% |
Wallowa Lake Summary
Wallowa Lake is a small lake located in the northeastern corner of Oregon, in the Wallowa Valley. It is the largest natural lake in the state, and is surrounded by the Wallowa Mountains. The lake is a popular tourist destination, and is known for its stunning scenery and outdoor activities.
History
The Wallowa Lake area has been inhabited by Native Americans for thousands of years. The Nez Perce, Cayuse, and Walla Walla tribes all lived in the area, and the lake was an important part of their culture and lifestyle. The lake was also a popular fishing spot for the tribes, and they would often gather around the lake to trade and socialize.
In the late 1800s, the area was settled by European settlers, who established farms and ranches in the valley. The lake became a popular destination for tourists, and the area began to develop as a resort destination. In the early 1900s, the lake was dammed to create a larger lake, and a resort was built on the north shore.
Geography
Wallowa Lake is located in the Wallowa Valley, in the northeastern corner of Oregon. The lake is surrounded by the Wallowa Mountains, which are part of the Blue Mountains. The lake is approximately 4 miles long and 1 mile wide, and has a maximum depth of about 100 feet. The lake is fed by several small streams, and is drained by the Wallowa River.
The lake is a popular destination for outdoor activities, such as fishing, boating, swimming, and hiking. The lake is also home to several species of fish, including rainbow trout, cutthroat trout, and kokanee salmon.
Economy
The economy of Wallowa Lake is largely based on tourism. The lake is a popular destination for outdoor activities, and the surrounding area is home to several resorts, restaurants, and other tourist attractions. The lake is also a popular fishing spot, and the surrounding area is home to several fishing guides and charters.
The area is also home to several small businesses, such as restaurants, shops, and galleries. The local economy is also supported by agriculture, forestry, and ranching.
Demographics
The population of Wallowa Lake is approximately 1,000 people. The majority of the population is white (95%), with the remaining population being made up of Native Americans (2%), African Americans (1%), and other races (2%). The median household income is $35,000, and the median age is 44.
Conclusion
Wallowa Lake is a beautiful lake located in the northeastern corner of Oregon. The lake is a popular destination for outdoor activities, and is surrounded by stunning scenery. The local economy is largely based on tourism, and the area is home to several small businesses. The population of Wallowa Lake is approximately 1,000 people, and the median household income is $35,000.
Common Questions
What is Per Capita Income in Wallowa Lake?
Per Capita income in Wallowa Lake is $68,139.
What is the Median Household income in Wallowa Lake?
Median Household Income in Wallowa Lake is $79,648.
What is Inequality or Gini Index in Wallowa Lake?
Inequality or Gini Index in Wallowa Lake is 0.24.
What is the Total Population of Wallowa Lake?
Total Population of Wallowa Lake is 96.
What is the Total Male Population of Wallowa Lake?
Total Male Population of Wallowa Lake is 70.
What is the Total Female Population of Wallowa Lake?
Total Female Population of Wallowa Lake is 26.
What is the Ratio of Males per 100 Females in Wallowa Lake?
There are 269.23 Males per 100 Females in Wallowa Lake.
What is the Ratio of Females per 100 Males in Wallowa Lake?
There are 37.14 Females per 100 Males in Wallowa Lake.
What is the Median Population Age in Wallowa Lake?
Median Population Age in Wallowa Lake is 55.4 Years.
What is the Average Family Size in Wallowa Lake
Average Family Size in Wallowa Lake is 1.8 People.
What is the Average Household Size in Wallowa Lake
Average Household Size in Wallowa Lake is 1.4 People.
How Large is the Labor Force in Wallowa Lake?
There are 83 People in the Labor Forcein in Wallowa Lake.
What is the Percentage of People in the Labor Force in Wallowa Lake?
86.5% of People are in the Labor Force in Wallowa Lake.