Longville, LA Map & Demographics
Longville Map
Longville Overview
$24,954
PER CAPITA INCOME
$37,750
AVG FAMILY INCOME
$37,650
AVG HOUSEHOLD INCOME
0.45
INEQUALITY / GINI INDEX
319
TOTAL POPULATION
100
MALE POPULATION
219
FEMALE POPULATION
45.66
MALES / 100 FEMALES
219.00
FEMALES / 100 MALES
68.6
MEDIAN AGE
2.6
AVG FAMILY SIZE
2.6
AVG HOUSEHOLD SIZE
22
LABOR FORCE [ PEOPLE ]
7.3%
PERCENT IN LABOR FORCE
Longville Zip Codes
Longville Area Codes
Income in Longville
Income Overview in Longville
Per Capita Income in Longville is $24,954, while median incomes of families and households are $37,750 and $37,650 respectively.
| Characteristic | Number | Measure |
| Per Capita Income | 319 | $24,954 |
| Median Family Income | 121 | $37,750 |
| Mean Family Income | 121 | $54,209 |
| Median Household Income | 123 | $37,650 |
| Mean Household Income | 123 | $53,534 |
| Income Deficit | 121 | $0 |
| Wage / Income Gap (%) | 319 | 0.00% |
| Wage / Income Gap ($) | 319 | 100.00¢ per $1 |
| Gini / Inequality Index | 319 | 0.45 |
Earnings by Sex in Longville
| Sex | Number | Average Earnings |
| Male | 14 (41.2%) | $0 |
| Female | 20 (58.8%) | $0 |
| Total | 34 (100.0%) | $0 |
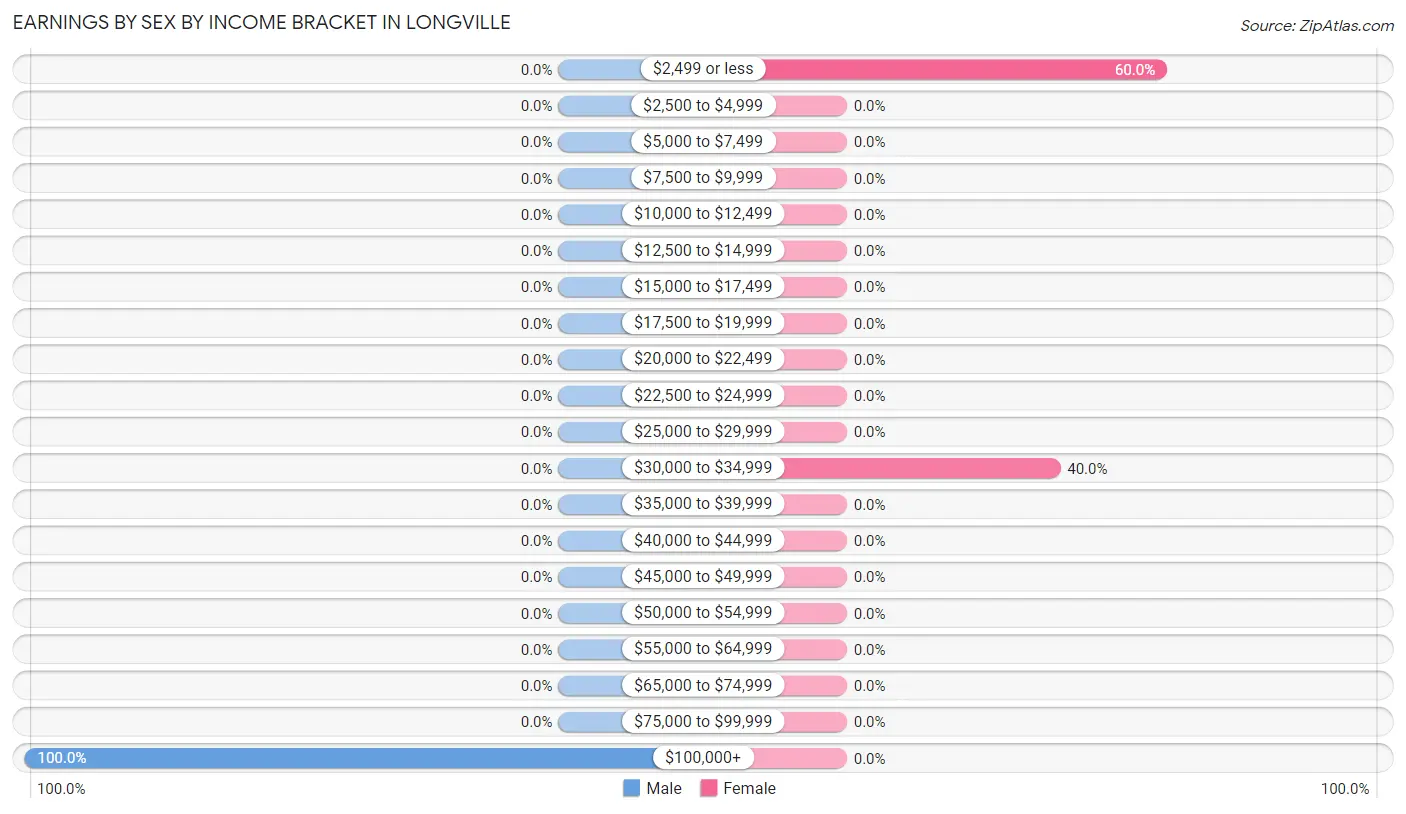
Earnings by Sex by Income Bracket in Longville
The most common earnings brackets in Longville are $100,000+ for men (14 | 100.0%) and $2,499 or less for women (12 | 60.0%).
| Income | Male | Female |
| $2,499 or less | 0 (0.0%) | 12 (60.0%) |
| $2,500 to $4,999 | 0 (0.0%) | 0 (0.0%) |
| $5,000 to $7,499 | 0 (0.0%) | 0 (0.0%) |
| $7,500 to $9,999 | 0 (0.0%) | 0 (0.0%) |
| $10,000 to $12,499 | 0 (0.0%) | 0 (0.0%) |
| $12,500 to $14,999 | 0 (0.0%) | 0 (0.0%) |
| $15,000 to $17,499 | 0 (0.0%) | 0 (0.0%) |
| $17,500 to $19,999 | 0 (0.0%) | 0 (0.0%) |
| $20,000 to $22,499 | 0 (0.0%) | 0 (0.0%) |
| $22,500 to $24,999 | 0 (0.0%) | 0 (0.0%) |
| $25,000 to $29,999 | 0 (0.0%) | 0 (0.0%) |
| $30,000 to $34,999 | 0 (0.0%) | 8 (40.0%) |
| $35,000 to $39,999 | 0 (0.0%) | 0 (0.0%) |
| $40,000 to $44,999 | 0 (0.0%) | 0 (0.0%) |
| $45,000 to $49,999 | 0 (0.0%) | 0 (0.0%) |
| $50,000 to $54,999 | 0 (0.0%) | 0 (0.0%) |
| $55,000 to $64,999 | 0 (0.0%) | 0 (0.0%) |
| $65,000 to $74,999 | 0 (0.0%) | 0 (0.0%) |
| $75,000 to $99,999 | 0 (0.0%) | 0 (0.0%) |
| $100,000+ | 14 (100.0%) | 0 (0.0%) |
| Total | 14 (100.0%) | 20 (100.0%) |
Earnings by Sex by Educational Attainment in Longville
| Educational Attainment | Male Income | Female Income |
| Less than High School | - | - |
| High School Diploma | - | - |
| College or Associate's Degree | - | - |
| Bachelor's Degree | - | - |
| Graduate Degree | - | - |
| Total | - | - |
Family Income in Longville
Family Income Brackets in Longville
According to the Longville family income data, there are 42 families falling into the $15,000 to $24,999 income range, which is the most common income bracket and makes up 34.7% of all families.
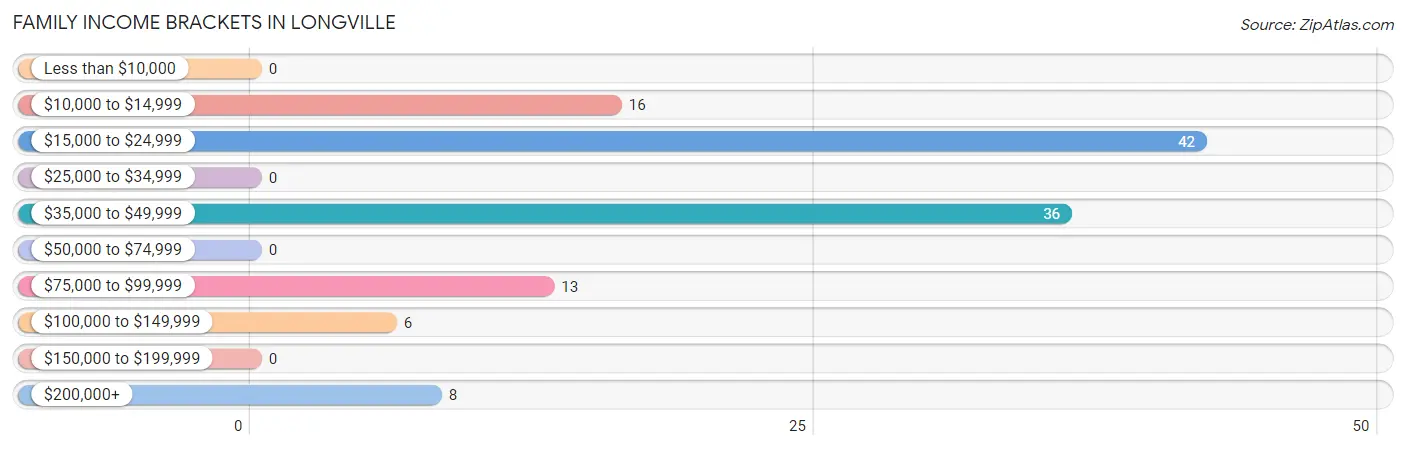
| Income Bracket | # Families | % Families |
| Less than $10,000 | 0 | 0.0% |
| $10,000 to $14,999 | 16 | 13.2% |
| $15,000 to $24,999 | 42 | 34.7% |
| $25,000 to $34,999 | 0 | 0.0% |
| $35,000 to $49,999 | 36 | 29.8% |
| $50,000 to $74,999 | 0 | 0.0% |
| $75,000 to $99,999 | 13 | 10.7% |
| $100,000 to $149,999 | 6 | 5.0% |
| $150,000 to $199,999 | 0 | 0.0% |
| $200,000+ | 8 | 6.6% |
Family Income by Famaliy Size in Longville
2-person families (102 | 84.3%) account for the highest median family income in Longville with $24,583 per family, while 2-person families (102 | 84.3%) have the highest median income of $12,292 per family member.
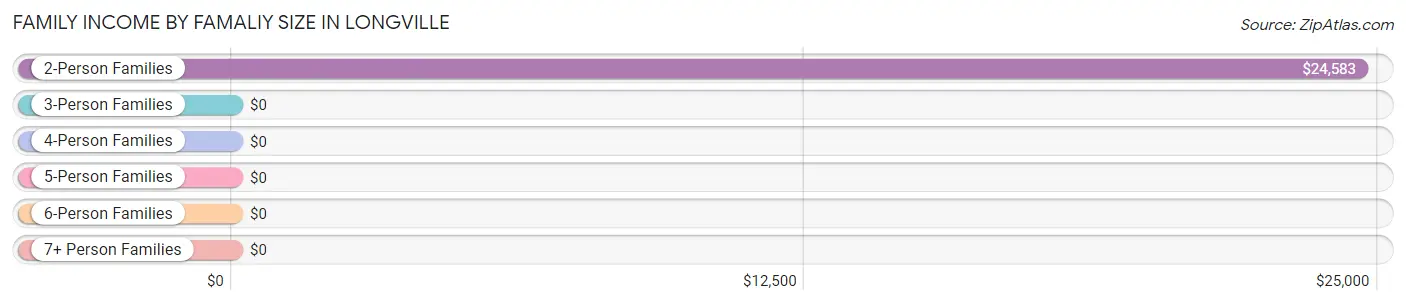
| Income Bracket | # Families | Median Income |
| 2-Person Families | 102 (84.3%) | $24,583 |
| 3-Person Families | 19 (15.7%) | $0 |
| 4-Person Families | 0 (0.0%) | $0 |
| 5-Person Families | 0 (0.0%) | $0 |
| 6-Person Families | 0 (0.0%) | $0 |
| 7+ Person Families | 0 (0.0%) | $0 |
| Total | 121 (100.0%) | $37,750 |
Family Income by Number of Earners in Longville
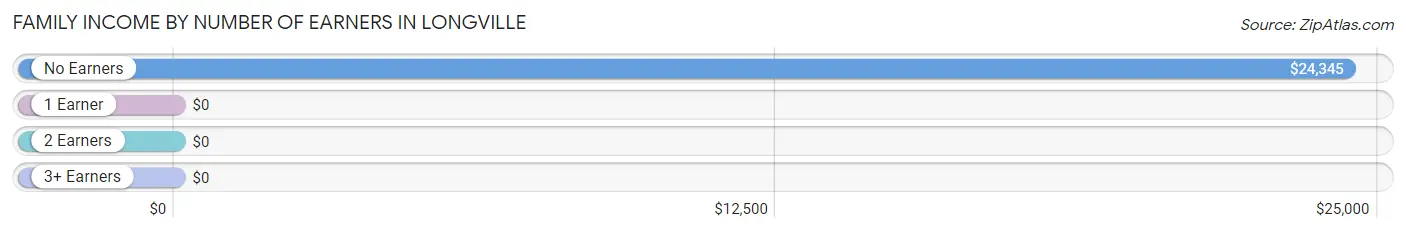
| Number of Earners | # Families | Median Income |
| No Earners | 94 (77.7%) | $24,345 |
| 1 Earner | 21 (17.4%) | $0 |
| 2 Earners | 6 (5.0%) | $0 |
| 3+ Earners | 0 (0.0%) | $0 |
| Total | 121 (100.0%) | $37,750 |
Household Income in Longville
Household Income Brackets in Longville
With 42 households falling in the category, the $15,000 to $24,999 income range is the most frequent in Longville, accounting for 34.2% of all households.
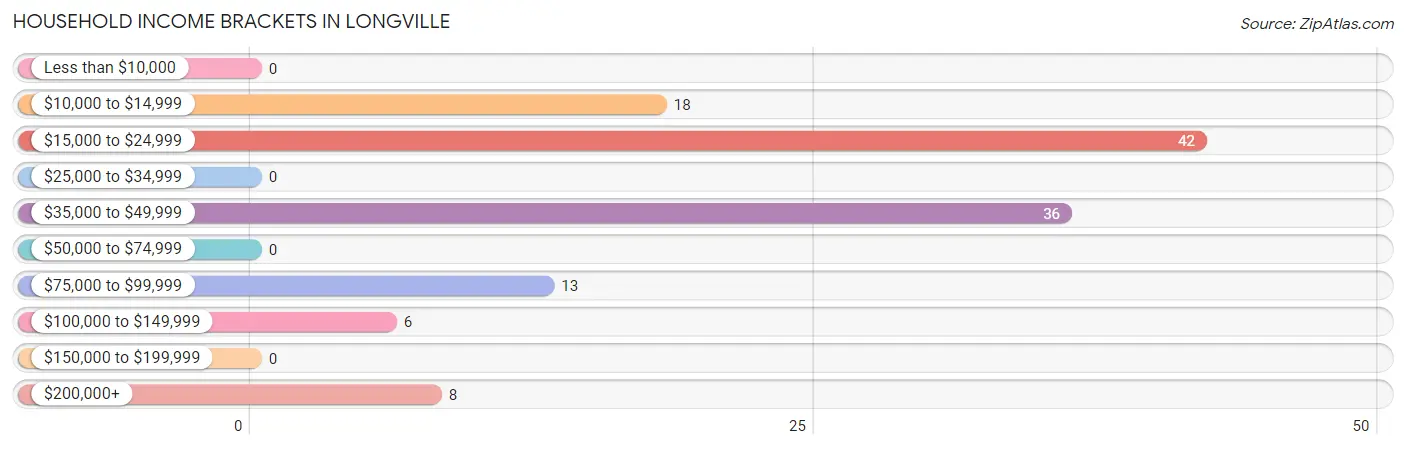
| Income Bracket | # Households | % Households |
| Less than $10,000 | 0 | 0.0% |
| $10,000 to $14,999 | 18 | 14.6% |
| $15,000 to $24,999 | 42 | 34.1% |
| $25,000 to $34,999 | 0 | 0.0% |
| $35,000 to $49,999 | 36 | 29.3% |
| $50,000 to $74,999 | 0 | 0.0% |
| $75,000 to $99,999 | 13 | 10.6% |
| $100,000 to $149,999 | 6 | 4.9% |
| $150,000 to $199,999 | 0 | 0.0% |
| $200,000+ | 8 | 6.5% |
Household Income by Householder Age in Longville
| Income Bracket | # Households | Median Income |
| 15 to 24 Years | 0 (0.0%) | $0 |
| 25 to 44 Years | 0 (0.0%) | $0 |
| 45 to 64 Years | 14 (11.4%) | $0 |
| 65+ Years | 109 (88.6%) | $0 |
| Total | 123 (100.0%) | $37,650 |
Poverty in Longville
Income Below Poverty by Sex and Age in Longville
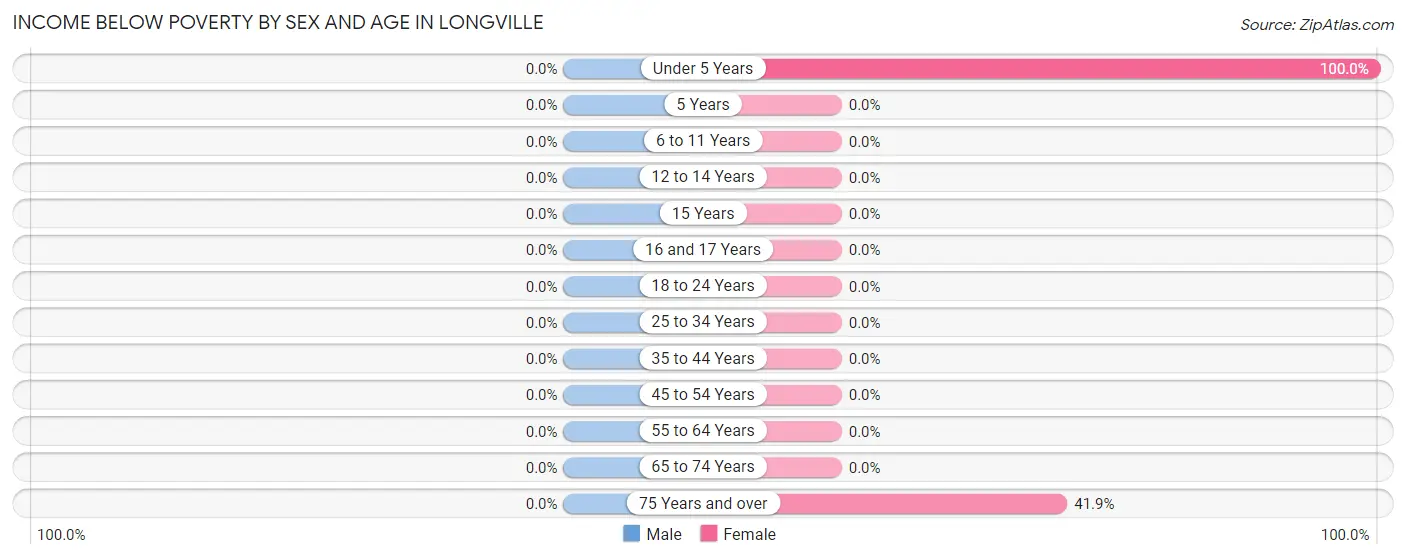
| Age Bracket | Male | Female |
| Under 5 Years | 0 (0.0%) | 17 (100.0%) |
| 5 Years | 0 (0.0%) | 0 (0.0%) |
| 6 to 11 Years | 0 (0.0%) | 0 (0.0%) |
| 12 to 14 Years | 0 (0.0%) | 0 (0.0%) |
| 15 Years | 0 (0.0%) | 0 (0.0%) |
| 16 and 17 Years | 0 (0.0%) | 0 (0.0%) |
| 18 to 24 Years | 0 (0.0%) | 0 (0.0%) |
| 25 to 34 Years | 0 (0.0%) | 0 (0.0%) |
| 35 to 44 Years | 0 (0.0%) | 0 (0.0%) |
| 45 to 54 Years | 0 (0.0%) | 0 (0.0%) |
| 55 to 64 Years | 0 (0.0%) | 0 (0.0%) |
| 65 to 74 Years | 0 (0.0%) | 0 (0.0%) |
| 75 Years and over | 0 (0.0%) | 18 (41.9%) |
| Total | 0 (0.0%) | 35 (16.0%) |
Income Above Poverty by Sex and Age in Longville
According to the poverty statistics in Longville, males aged 45 to 54 years and females aged 16 and 17 years are the age groups that are most secure financially, with 100.0% of males and 100.0% of females in these age groups living above the poverty line.
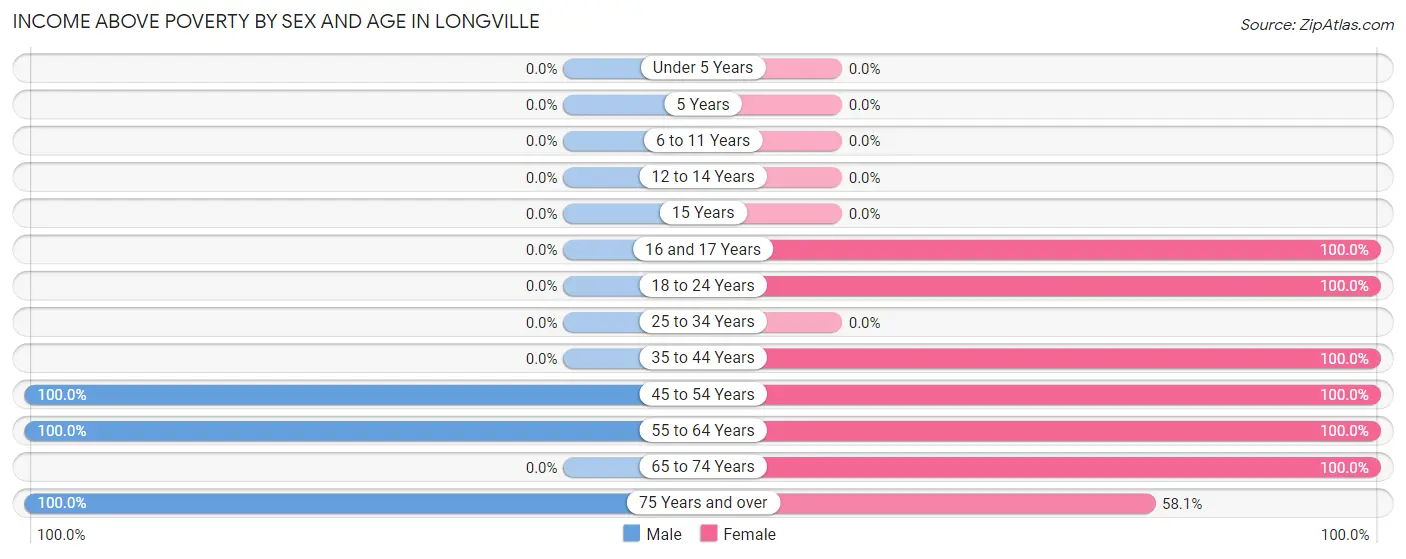
| Age Bracket | Male | Female |
| Under 5 Years | 0 (0.0%) | 0 (0.0%) |
| 5 Years | 0 (0.0%) | 0 (0.0%) |
| 6 to 11 Years | 0 (0.0%) | 0 (0.0%) |
| 12 to 14 Years | 0 (0.0%) | 0 (0.0%) |
| 15 Years | 0 (0.0%) | 0 (0.0%) |
| 16 and 17 Years | 0 (0.0%) | 7 (100.0%) |
| 18 to 24 Years | 0 (0.0%) | 20 (100.0%) |
| 25 to 34 Years | 0 (0.0%) | 0 (0.0%) |
| 35 to 44 Years | 0 (0.0%) | 53 (100.0%) |
| 45 to 54 Years | 8 (100.0%) | 8 (100.0%) |
| 55 to 64 Years | 6 (100.0%) | 6 (100.0%) |
| 65 to 74 Years | 0 (0.0%) | 65 (100.0%) |
| 75 Years and over | 86 (100.0%) | 25 (58.1%) |
| Total | 100 (100.0%) | 184 (84.0%) |
Income Below Poverty Among Married-Couple Families in Longville
| Children | Above Poverty | Below Poverty |
| No Children | 57 (100.0%) | 0 (0.0%) |
| 1 or 2 Children | 6 (100.0%) | 0 (0.0%) |
| 3 or 4 Children | 0 (0.0%) | 0 (0.0%) |
| 5 or more Children | 0 (0.0%) | 0 (0.0%) |
| Total | 63 (100.0%) | 0 (0.0%) |
Income Below Poverty Among Single-Parent Households in Longville
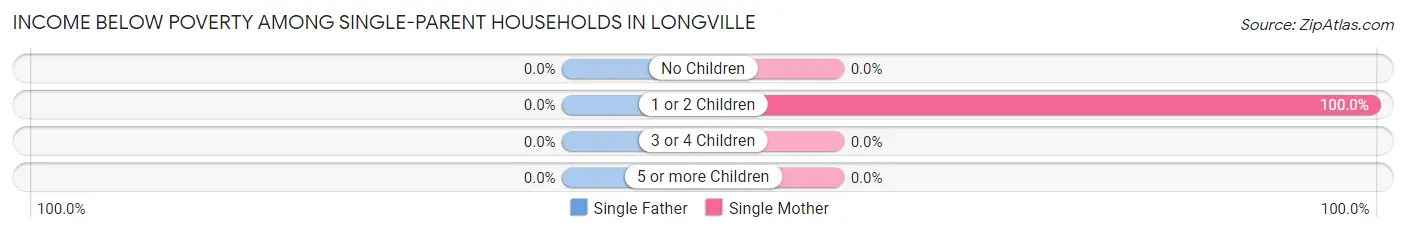
| Children | Single Father | Single Mother |
| No Children | 0 (0.0%) | 0 (0.0%) |
| 1 or 2 Children | 0 (0.0%) | 16 (100.0%) |
| 3 or 4 Children | 0 (0.0%) | 0 (0.0%) |
| 5 or more Children | 0 (0.0%) | 0 (0.0%) |
| Total | 0 (0.0%) | 16 (27.6%) |
Income Below Poverty Among Married-Couple vs Single-Parent Households in Longville
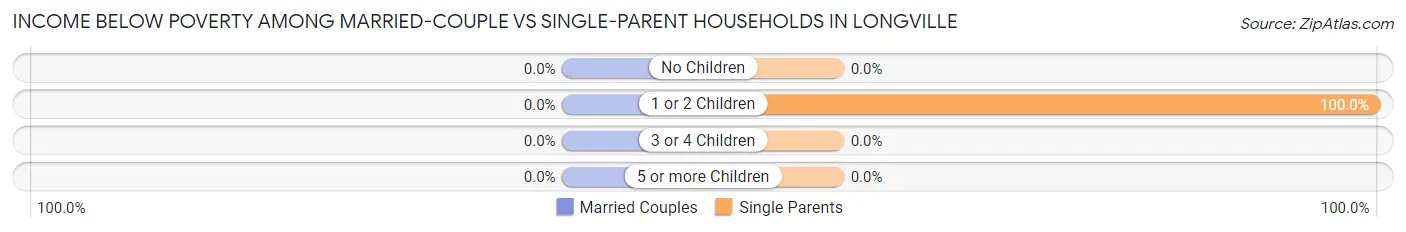
| Children | Married-Couple Families | Single-Parent Households |
| No Children | 0 (0.0%) | 0 (0.0%) |
| 1 or 2 Children | 0 (0.0%) | 16 (100.0%) |
| 3 or 4 Children | 0 (0.0%) | 0 (0.0%) |
| 5 or more Children | 0 (0.0%) | 0 (0.0%) |
| Total | 0 (0.0%) | 16 (27.6%) |
Race in Longville
The most populous races in Longville are White / Caucasian (287 | 90.0%), and Two or more Races (32 | 10.0%).
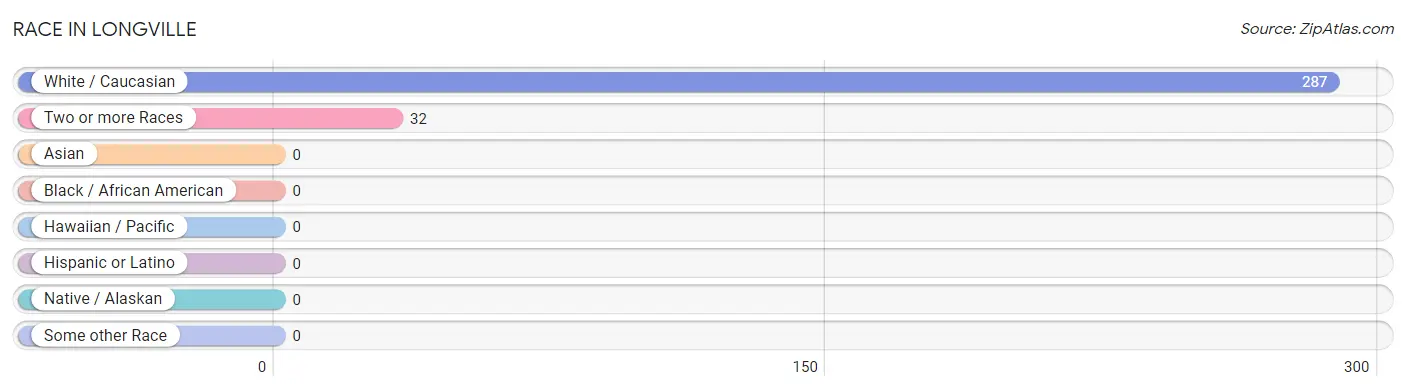
| Race | # Population | % Population |
| Asian | 0 | 0.0% |
| Black / African American | 0 | 0.0% |
| Hawaiian / Pacific | 0 | 0.0% |
| Hispanic or Latino | 0 | 0.0% |
| Native / Alaskan | 0 | 0.0% |
| White / Caucasian | 287 | 90.0% |
| Two or more Races | 32 | 10.0% |
| Some other Race | 0 | 0.0% |
| Total | 319 | 100.0% |
Ancestry in Longville
The most populous ancestries reported in Longville are French (122 | 38.2%), German (79 | 24.8%), Irish (53 | 16.6%), and English (8 | 2.5%), together accounting for 82.1% of all Longville residents.
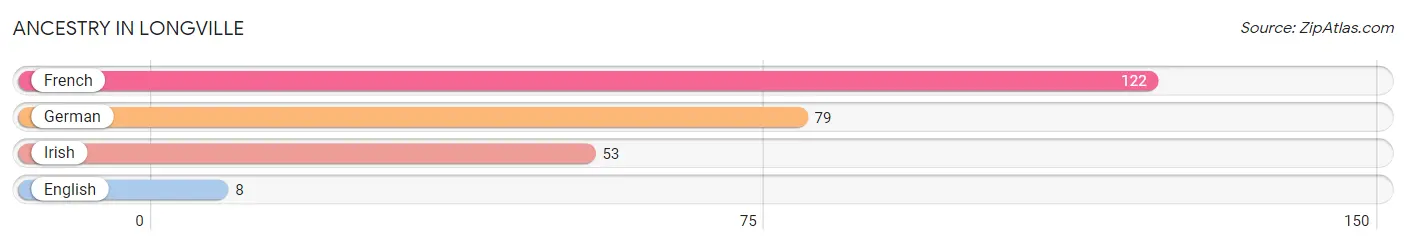
| Ancestry | # Population | % Population |
| English | 8 | 2.5% |
| French | 122 | 38.2% |
| German | 79 | 24.8% |
| Irish | 53 | 16.6% | View All 4 Rows |
Immigrants in Longville

| Immigration Origin | # Population | % Population | View All 0 Rows |
Sex and Age in Longville
Sex and Age in Longville
The most populous age groups in Longville are 80 to 84 Years (65 | 65.0%) for men and 40 to 44 Years (53 | 24.2%) for women.
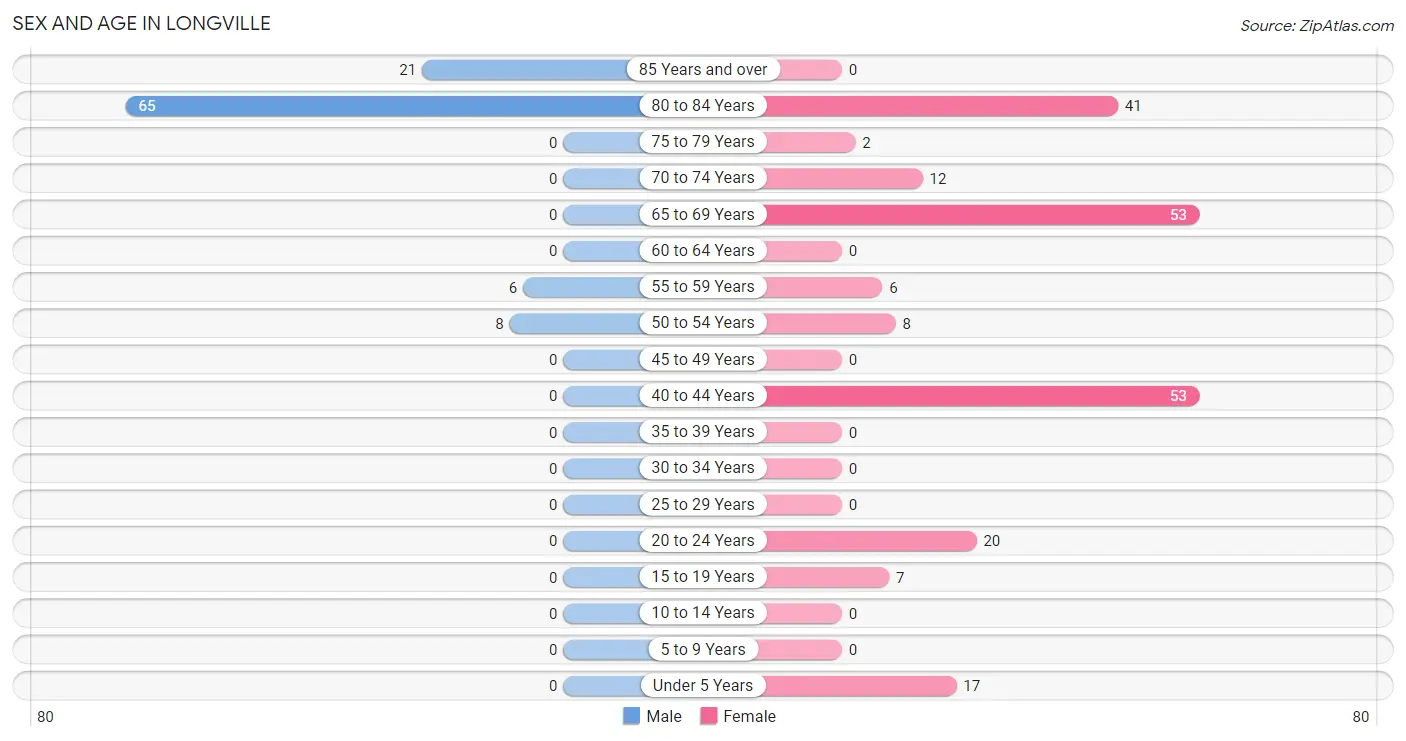
| Age Bracket | Male | Female |
| Under 5 Years | 0 (0.0%) | 17 (7.8%) |
| 5 to 9 Years | 0 (0.0%) | 0 (0.0%) |
| 10 to 14 Years | 0 (0.0%) | 0 (0.0%) |
| 15 to 19 Years | 0 (0.0%) | 7 (3.2%) |
| 20 to 24 Years | 0 (0.0%) | 20 (9.1%) |
| 25 to 29 Years | 0 (0.0%) | 0 (0.0%) |
| 30 to 34 Years | 0 (0.0%) | 0 (0.0%) |
| 35 to 39 Years | 0 (0.0%) | 0 (0.0%) |
| 40 to 44 Years | 0 (0.0%) | 53 (24.2%) |
| 45 to 49 Years | 0 (0.0%) | 0 (0.0%) |
| 50 to 54 Years | 8 (8.0%) | 8 (3.6%) |
| 55 to 59 Years | 6 (6.0%) | 6 (2.7%) |
| 60 to 64 Years | 0 (0.0%) | 0 (0.0%) |
| 65 to 69 Years | 0 (0.0%) | 53 (24.2%) |
| 70 to 74 Years | 0 (0.0%) | 12 (5.5%) |
| 75 to 79 Years | 0 (0.0%) | 2 (0.9%) |
| 80 to 84 Years | 65 (65.0%) | 41 (18.7%) |
| 85 Years and over | 21 (21.0%) | 0 (0.0%) |
| Total | 100 (100.0%) | 219 (100.0%) |
Families and Households in Longville
Median Family Size in Longville
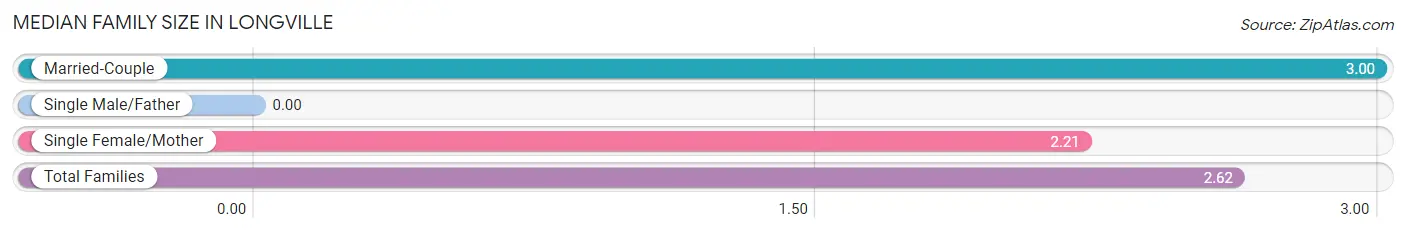
| Family Type | # Families | Family Size |
| Married-Couple | 63 (52.1%) | 3.00 |
| Single Male/Father | 0 (0.0%) | - |
| Single Female/Mother | 58 (47.9%) | 2.21 |
| Total Families | 121 (100.0%) | 2.62 |
Median Household Size in Longville
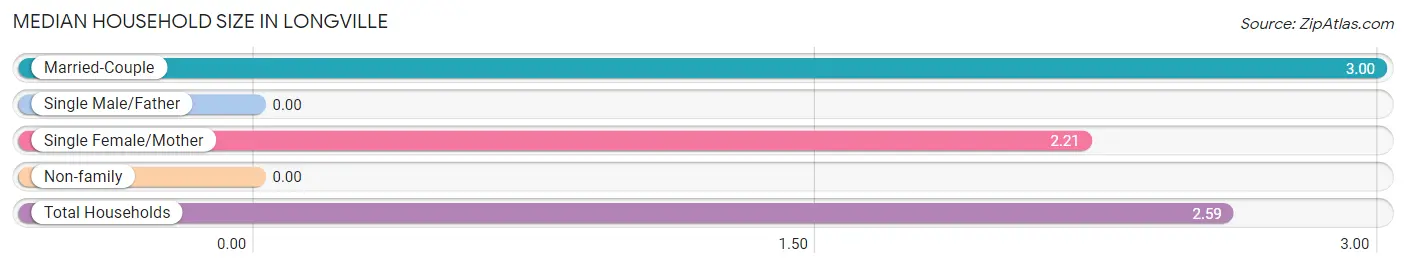
| Household Type | # Households | Household Size |
| Married-Couple | 63 (51.2%) | 3.00 |
| Single Male/Father | 0 (0.0%) | - |
| Single Female/Mother | 58 (47.1%) | 2.21 |
| Non-family | 2 (1.6%) | - |
| Total Households | 123 (100.0%) | 2.59 |
Household Size by Marriage Status in Longville
Out of a total of 123 households in Longville, 121 (98.4%) are family households, while 2 (1.6%) are nonfamily households. The most numerous type of family households are 2-person households, comprising 102, and the most common type of nonfamily households are 1-person households, comprising 2.
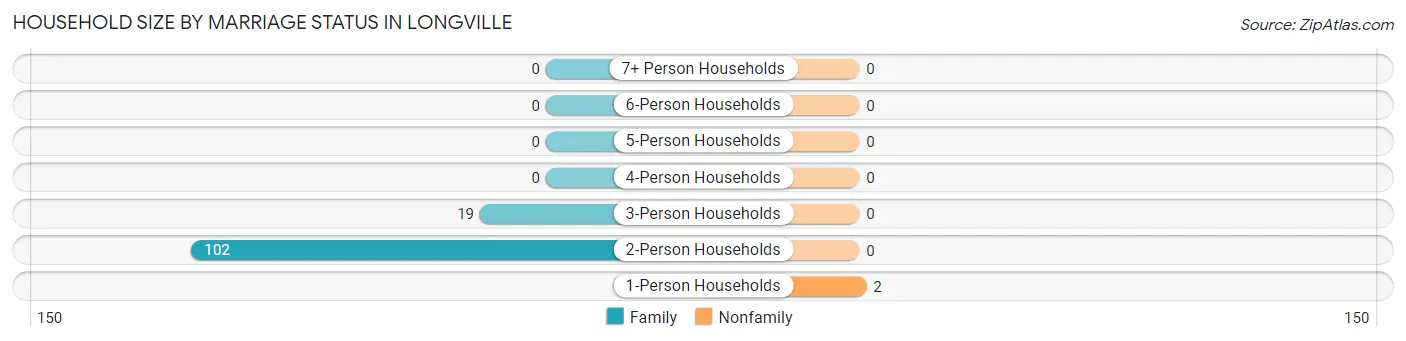
| Household Size | Family Households | Nonfamily Households |
| 1-Person Households | - | 2 (1.6%) |
| 2-Person Households | 102 (82.9%) | 0 (0.0%) |
| 3-Person Households | 19 (15.4%) | 0 (0.0%) |
| 4-Person Households | 0 (0.0%) | 0 (0.0%) |
| 5-Person Households | 0 (0.0%) | 0 (0.0%) |
| 6-Person Households | 0 (0.0%) | 0 (0.0%) |
| 7+ Person Households | 0 (0.0%) | 0 (0.0%) |
| Total | 121 (98.4%) | 2 (1.6%) |
Female Fertility in Longville
Fertility by Age in Longville
| Age Bracket | Women with Births | Births / 1,000 Women |
| 15 to 19 years | 0 (0.0%) | 0.0 |
| 20 to 34 years | 0 (0.0%) | 0.0 |
| 35 to 50 years | 0 (0.0%) | 0.0 |
| Total | 0 (0.0%) | 0.0 |
Fertility by Age by Marriage Status in Longville
| Age Bracket | Married | Unmarried |
| 15 to 19 years | 0 (0.0%) | 0 (0.0%) |
| 20 to 34 years | 0 (0.0%) | 0 (0.0%) |
| 35 to 50 years | 0 (0.0%) | 0 (0.0%) |
| Total | 0 (0.0%) | 0 (0.0%) |
Fertility by Education in Longville
| Educational Attainment | Women with Births | Births / 1,000 Women |
| Less than High School | 0 (0.0%) | 0.0 |
| High School Diploma | 0 (0.0%) | 0.0 |
| College or Associate's Degree | 0 (0.0%) | 0.0 |
| Bachelor's Degree | 0 (0.0%) | 0.0 |
| Graduate Degree | 0 (0.0%) | 0.0 |
| Total | 0 (0.0%) | 0.0 |
Fertility by Education by Marriage Status in Longville
| Educational Attainment | Married | Unmarried |
| Less than High School | 0 (0.0%) | 0 (0.0%) |
| High School Diploma | 0 (0.0%) | 0 (0.0%) |
| College or Associate's Degree | 0 (0.0%) | 0 (0.0%) |
| Bachelor's Degree | 0 (0.0%) | 0 (0.0%) |
| Graduate Degree | 0 (0.0%) | 0 (0.0%) |
| Total | 0 (0.0%) | 0 (0.0%) |
Employment Characteristics in Longville
Employment by Class of Employer in Longville
Among the 22 employed individuals in Longville, private company employees (14 | 63.6%), and self-employed (not incorporated) (8 | 36.4%) make up the most common classes of employment.
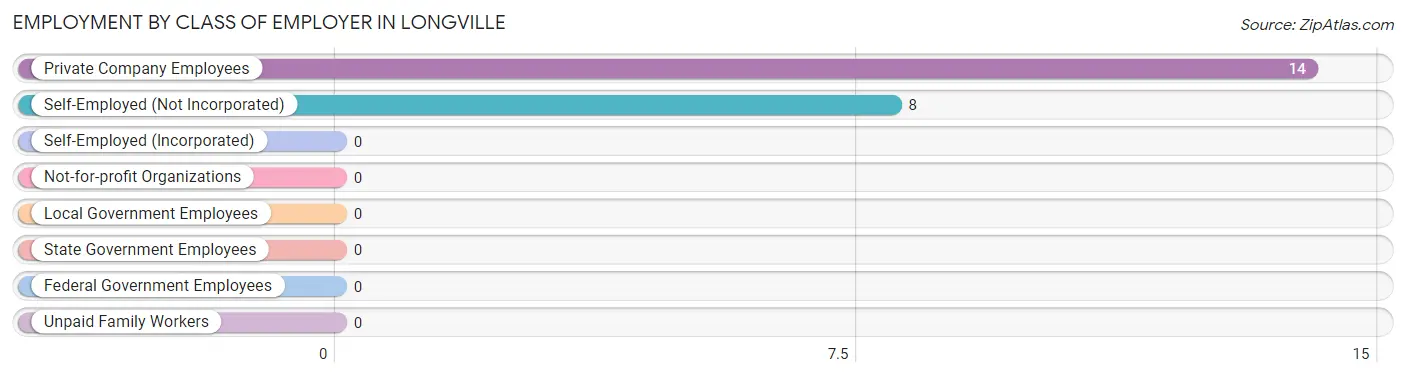
| Employer Class | # Employees | % Employees |
| Private Company Employees | 14 | 63.6% |
| Self-Employed (Incorporated) | 0 | 0.0% |
| Self-Employed (Not Incorporated) | 8 | 36.4% |
| Not-for-profit Organizations | 0 | 0.0% |
| Local Government Employees | 0 | 0.0% |
| State Government Employees | 0 | 0.0% |
| Federal Government Employees | 0 | 0.0% |
| Unpaid Family Workers | 0 | 0.0% |
| Total | 22 | 100.0% |
Employment Status by Age in Longville
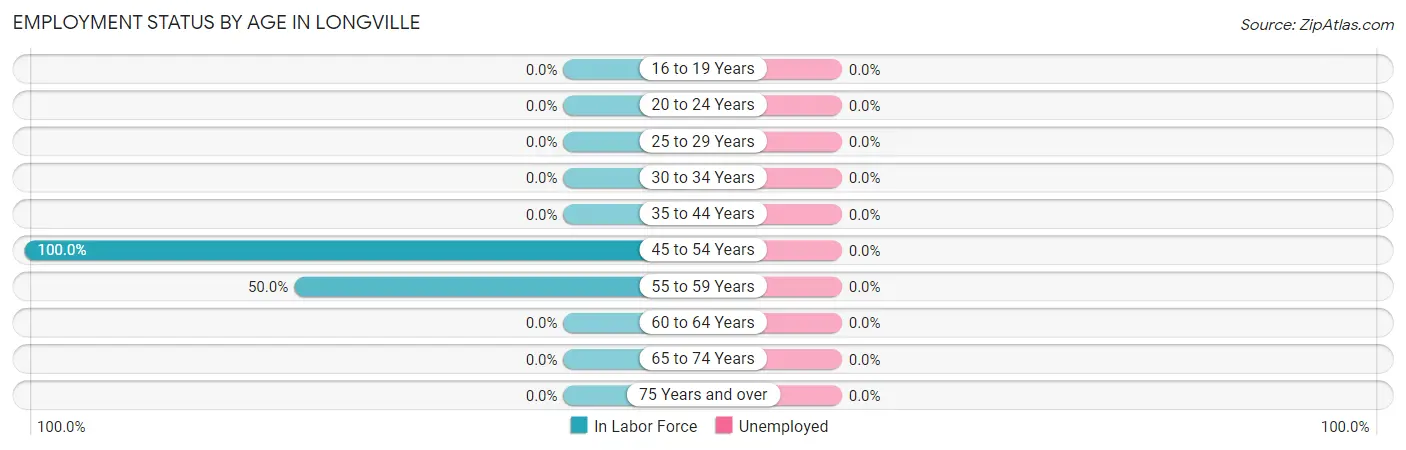
| Age Bracket | In Labor Force | Unemployed |
| 16 to 19 Years | 0 (0.0%) | 0 (0.0%) |
| 20 to 24 Years | 0 (0.0%) | 0 (0.0%) |
| 25 to 29 Years | 0 (0.0%) | 0 (0.0%) |
| 30 to 34 Years | 0 (0.0%) | 0 (0.0%) |
| 35 to 44 Years | 0 (0.0%) | 0 (0.0%) |
| 45 to 54 Years | 16 (100.0%) | 0 (0.0%) |
| 55 to 59 Years | 6 (50.0%) | 0 (0.0%) |
| 60 to 64 Years | 0 (0.0%) | 0 (0.0%) |
| 65 to 74 Years | 0 (0.0%) | 0 (0.0%) |
| 75 Years and over | 0 (0.0%) | 0 (0.0%) |
| Total | 22 (7.3%) | 0 (0.0%) |
Employment Status by Educational Attainment in Longville
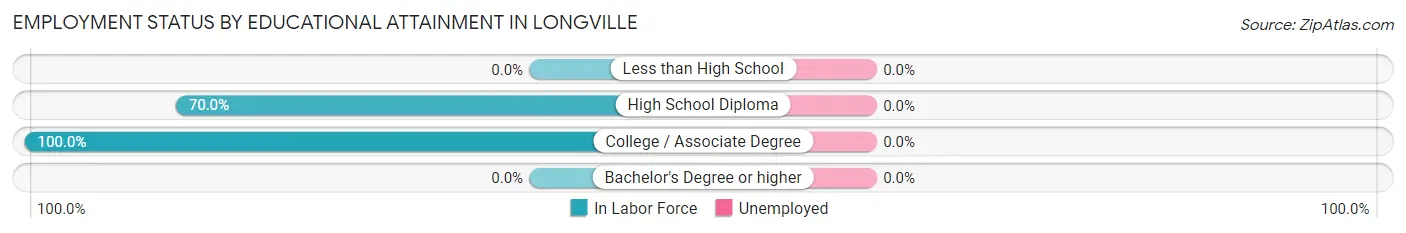
| Educational Attainment | In Labor Force | Unemployed |
| Less than High School | 0 (0.0%) | 0 (0.0%) |
| High School Diploma | 14 (70.0%) | 0 (0.0%) |
| College / Associate Degree | 8 (100.0%) | 0 (0.0%) |
| Bachelor's Degree or higher | 0 (0.0%) | 0 (0.0%) |
| Total | 22 (27.2%) | 0 (0.0%) |
Employment Occupations by Sex in Longville
Management, Business, Science and Arts Occupations
The most common Management, Business, Science and Arts occupations in Longville are Community & Social Service (8 | 36.4%), and Legal Services & Support (8 | 36.4%).
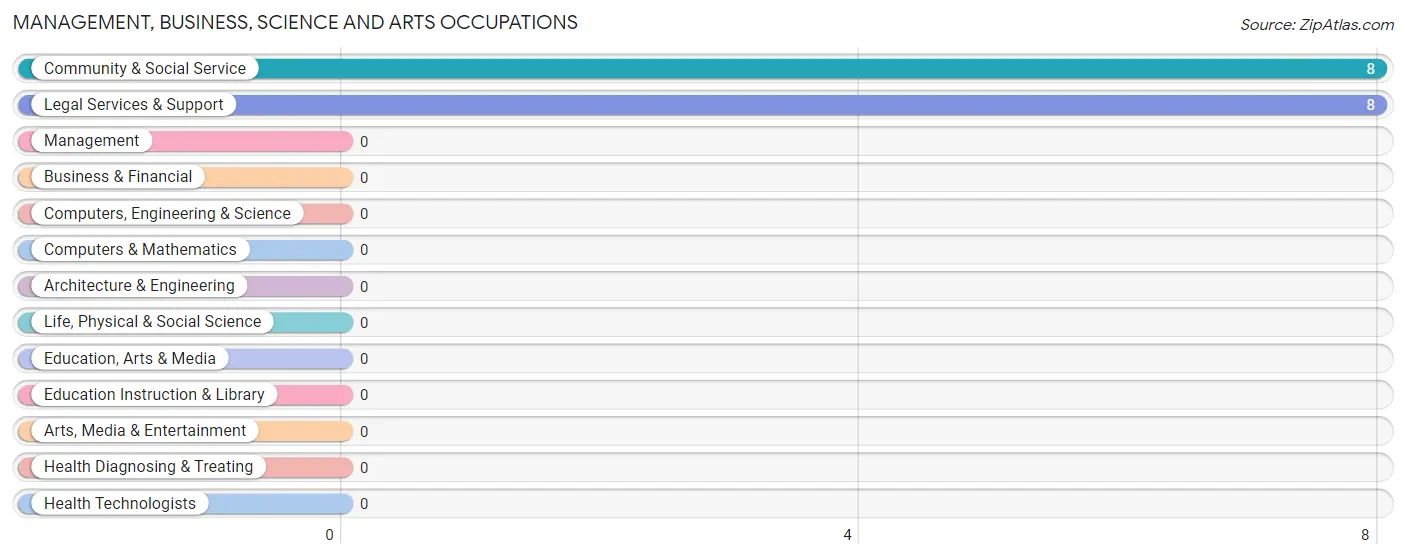
Management, Business, Science and Arts Occupations by Sex
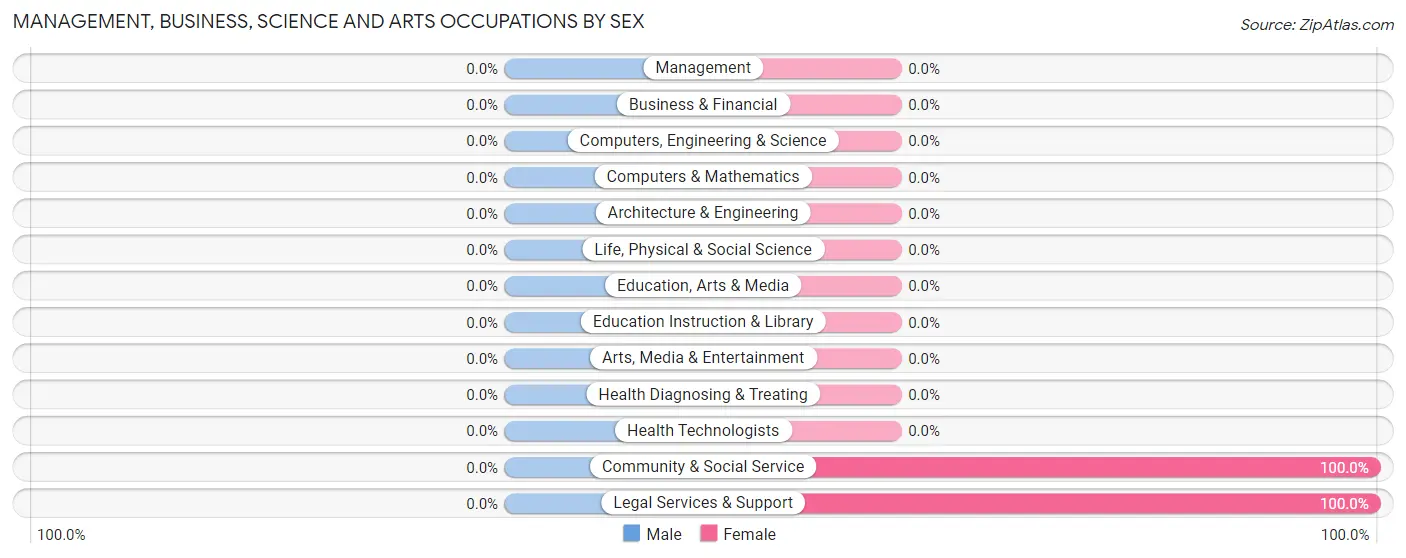
| Occupation | Male | Female |
| Management | 0 (0.0%) | 0 (0.0%) |
| Business & Financial | 0 (0.0%) | 0 (0.0%) |
| Computers, Engineering & Science | 0 (0.0%) | 0 (0.0%) |
| Computers & Mathematics | 0 (0.0%) | 0 (0.0%) |
| Architecture & Engineering | 0 (0.0%) | 0 (0.0%) |
| Life, Physical & Social Science | 0 (0.0%) | 0 (0.0%) |
| Community & Social Service | 0 (0.0%) | 8 (100.0%) |
| Education, Arts & Media | 0 (0.0%) | 0 (0.0%) |
| Legal Services & Support | 0 (0.0%) | 8 (100.0%) |
| Education Instruction & Library | 0 (0.0%) | 0 (0.0%) |
| Arts, Media & Entertainment | 0 (0.0%) | 0 (0.0%) |
| Health Diagnosing & Treating | 0 (0.0%) | 0 (0.0%) |
| Health Technologists | 0 (0.0%) | 0 (0.0%) |
| Total (Category) | 0 (0.0%) | 8 (100.0%) |
| Total (Overall) | 14 (63.6%) | 8 (36.4%) |
Services Occupations
Services Occupations by Sex
| Occupation | Male | Female |
| Healthcare Support | 0 (0.0%) | 0 (0.0%) |
| Security & Protection | 0 (0.0%) | 0 (0.0%) |
| Firefighting & Prevention | 0 (0.0%) | 0 (0.0%) |
| Law Enforcement | 0 (0.0%) | 0 (0.0%) |
| Food Preparation & Serving | 0 (0.0%) | 0 (0.0%) |
| Cleaning & Maintenance | 0 (0.0%) | 0 (0.0%) |
| Personal Care & Service | 0 (0.0%) | 0 (0.0%) |
| Total (Category) | 0 (0.0%) | 0 (0.0%) |
| Total (Overall) | 14 (63.6%) | 8 (36.4%) |
Sales and Office Occupations
Sales and Office Occupations by Sex
| Occupation | Male | Female |
| Sales & Related | 0 (0.0%) | 0 (0.0%) |
| Office & Administration | 0 (0.0%) | 0 (0.0%) |
| Total (Category) | 0 (0.0%) | 0 (0.0%) |
| Total (Overall) | 14 (63.6%) | 8 (36.4%) |
Natural Resources, Construction and Maintenance Occupations

Natural Resources, Construction and Maintenance Occupations by Sex
| Occupation | Male | Female |
| Farming, Fishing & Forestry | 0 (0.0%) | 0 (0.0%) |
| Construction & Extraction | 0 (0.0%) | 0 (0.0%) |
| Installation, Maintenance & Repair | 0 (0.0%) | 0 (0.0%) |
| Total (Category) | 0 (0.0%) | 0 (0.0%) |
| Total (Overall) | 14 (63.6%) | 8 (36.4%) |
Production, Transportation and Moving Occupations
The most common Production, Transportation and Moving occupations in Longville are Transportation (8 | 36.4%), and Production (6 | 27.3%).
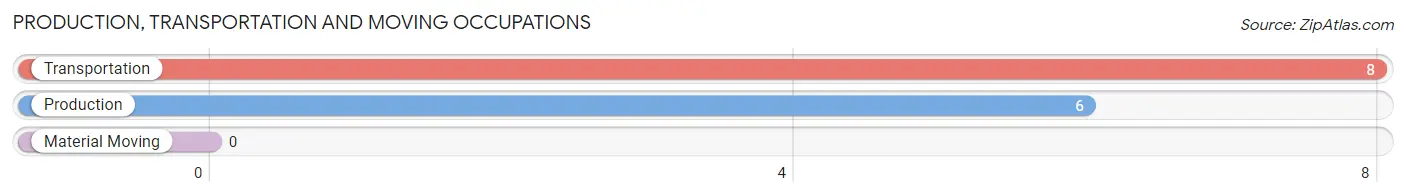
Production, Transportation and Moving Occupations by Sex
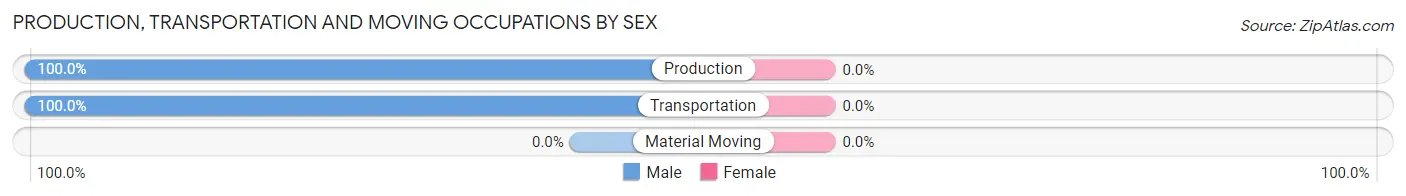
| Occupation | Male | Female |
| Production | 6 (100.0%) | 0 (0.0%) |
| Transportation | 8 (100.0%) | 0 (0.0%) |
| Material Moving | 0 (0.0%) | 0 (0.0%) |
| Total (Category) | 14 (100.0%) | 0 (0.0%) |
| Total (Overall) | 14 (63.6%) | 8 (36.4%) |
Employment Industries by Sex in Longville
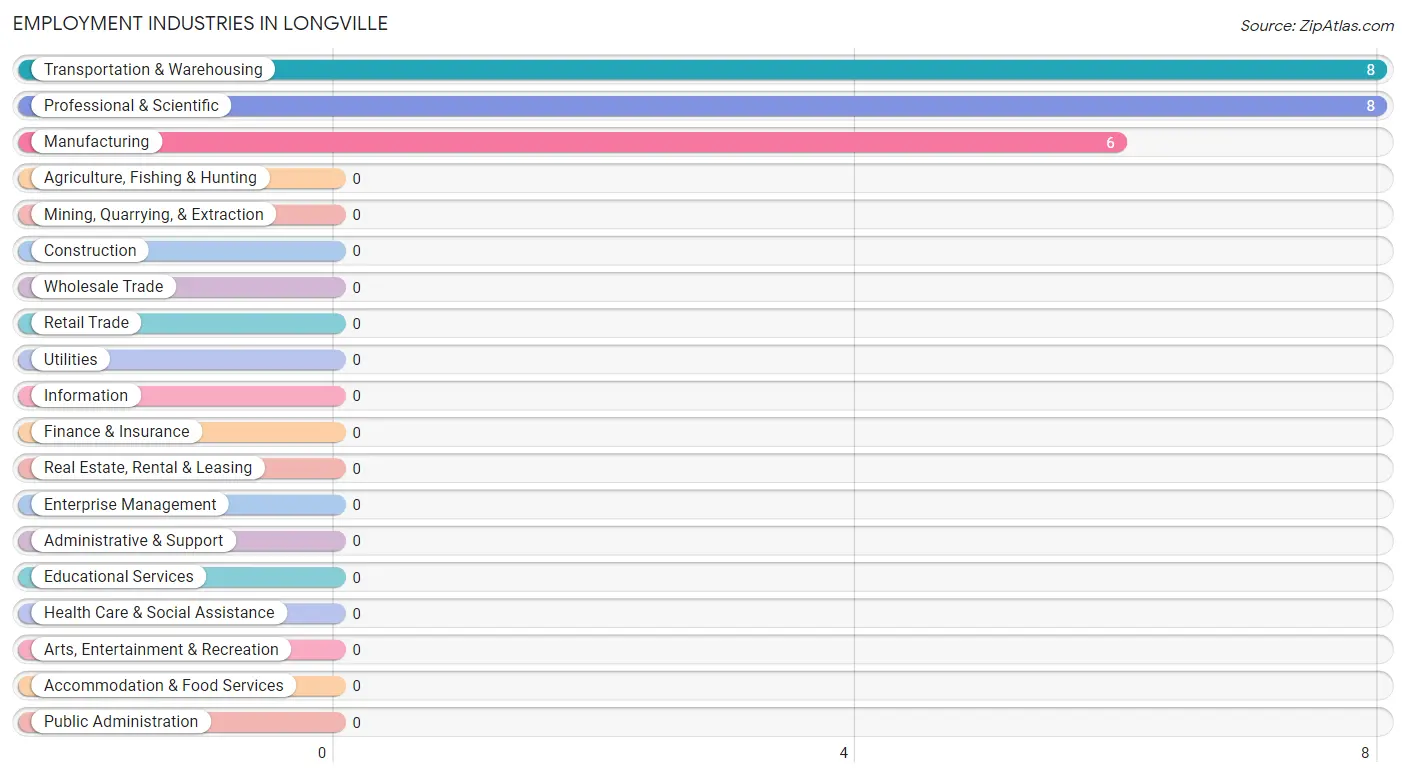
Employment Industries in Longville
The major employment industries in Longville include Transportation & Warehousing (8 | 36.4%), Professional & Scientific (8 | 36.4%), and Manufacturing (6 | 27.3%).
Employment Industries by Sex in Longville
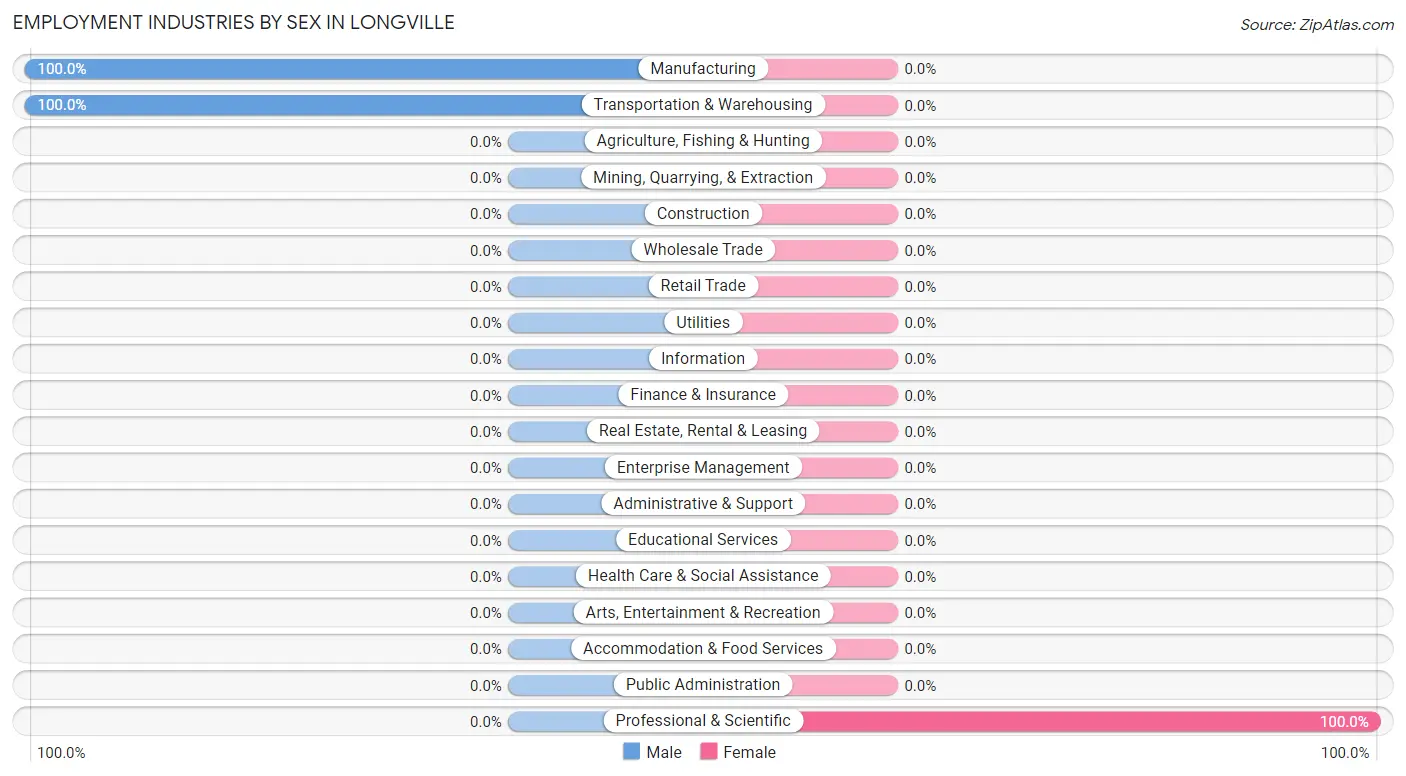
| Industry | Male | Female |
| Agriculture, Fishing & Hunting | 0 (0.0%) | 0 (0.0%) |
| Mining, Quarrying, & Extraction | 0 (0.0%) | 0 (0.0%) |
| Construction | 0 (0.0%) | 0 (0.0%) |
| Manufacturing | 6 (100.0%) | 0 (0.0%) |
| Wholesale Trade | 0 (0.0%) | 0 (0.0%) |
| Retail Trade | 0 (0.0%) | 0 (0.0%) |
| Transportation & Warehousing | 8 (100.0%) | 0 (0.0%) |
| Utilities | 0 (0.0%) | 0 (0.0%) |
| Information | 0 (0.0%) | 0 (0.0%) |
| Finance & Insurance | 0 (0.0%) | 0 (0.0%) |
| Real Estate, Rental & Leasing | 0 (0.0%) | 0 (0.0%) |
| Professional & Scientific | 0 (0.0%) | 8 (100.0%) |
| Enterprise Management | 0 (0.0%) | 0 (0.0%) |
| Administrative & Support | 0 (0.0%) | 0 (0.0%) |
| Educational Services | 0 (0.0%) | 0 (0.0%) |
| Health Care & Social Assistance | 0 (0.0%) | 0 (0.0%) |
| Arts, Entertainment & Recreation | 0 (0.0%) | 0 (0.0%) |
| Accommodation & Food Services | 0 (0.0%) | 0 (0.0%) |
| Public Administration | 0 (0.0%) | 0 (0.0%) |
| Total | 14 (63.6%) | 8 (36.4%) |
Education in Longville
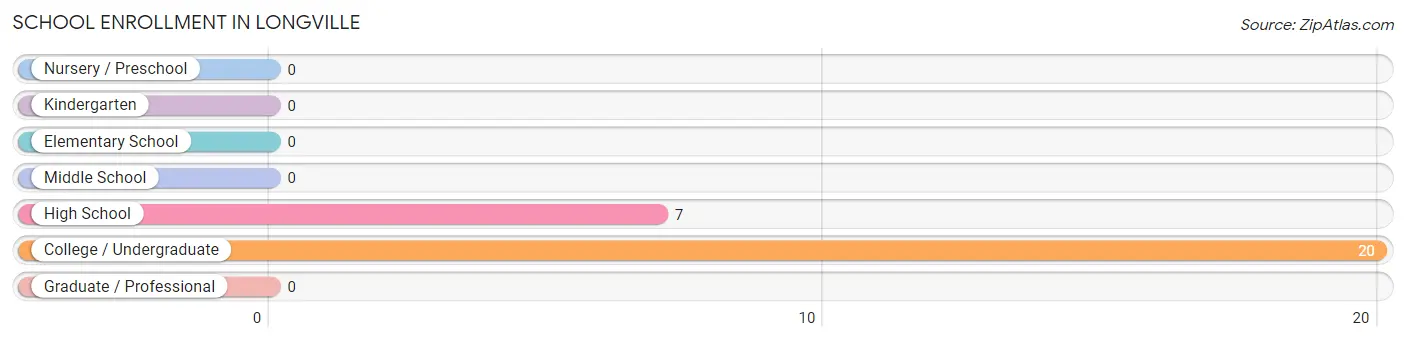
School Enrollment in Longville
The most common levels of schooling among the 27 students in Longville are college / undergraduate (20 | 74.1%), and high school (7 | 25.9%).
| School Level | # Students | % Students |
| Nursery / Preschool | 0 | 0.0% |
| Kindergarten | 0 | 0.0% |
| Elementary School | 0 | 0.0% |
| Middle School | 0 | 0.0% |
| High School | 7 | 25.9% |
| College / Undergraduate | 20 | 74.1% |
| Graduate / Professional | 0 | 0.0% |
| Total | 27 | 100.0% |
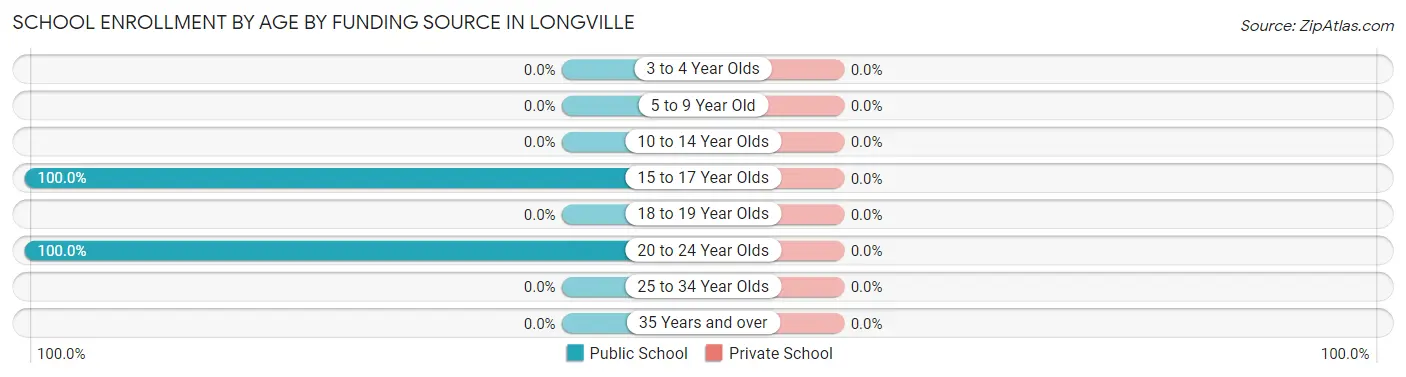
School Enrollment by Age by Funding Source in Longville
| Age Bracket | Public School | Private School |
| 3 to 4 Year Olds | 0 (0.0%) | 0 (0.0%) |
| 5 to 9 Year Old | 0 (0.0%) | 0 (0.0%) |
| 10 to 14 Year Olds | 0 (0.0%) | 0 (0.0%) |
| 15 to 17 Year Olds | 7 (100.0%) | 0 (0.0%) |
| 18 to 19 Year Olds | 0 (0.0%) | 0 (0.0%) |
| 20 to 24 Year Olds | 20 (100.0%) | 0 (0.0%) |
| 25 to 34 Year Olds | 0 (0.0%) | 0 (0.0%) |
| 35 Years and over | 0 (0.0%) | 0 (0.0%) |
| Total | 27 (100.0%) | 0 (0.0%) |
Educational Attainment by Field of Study in Longville
Bio, nature & agricultural (52 | 96.3%), and literature & languages (2 | 3.7%) are the most common fields of study among 54 individuals in Longville who have obtained a bachelor's degree or higher.
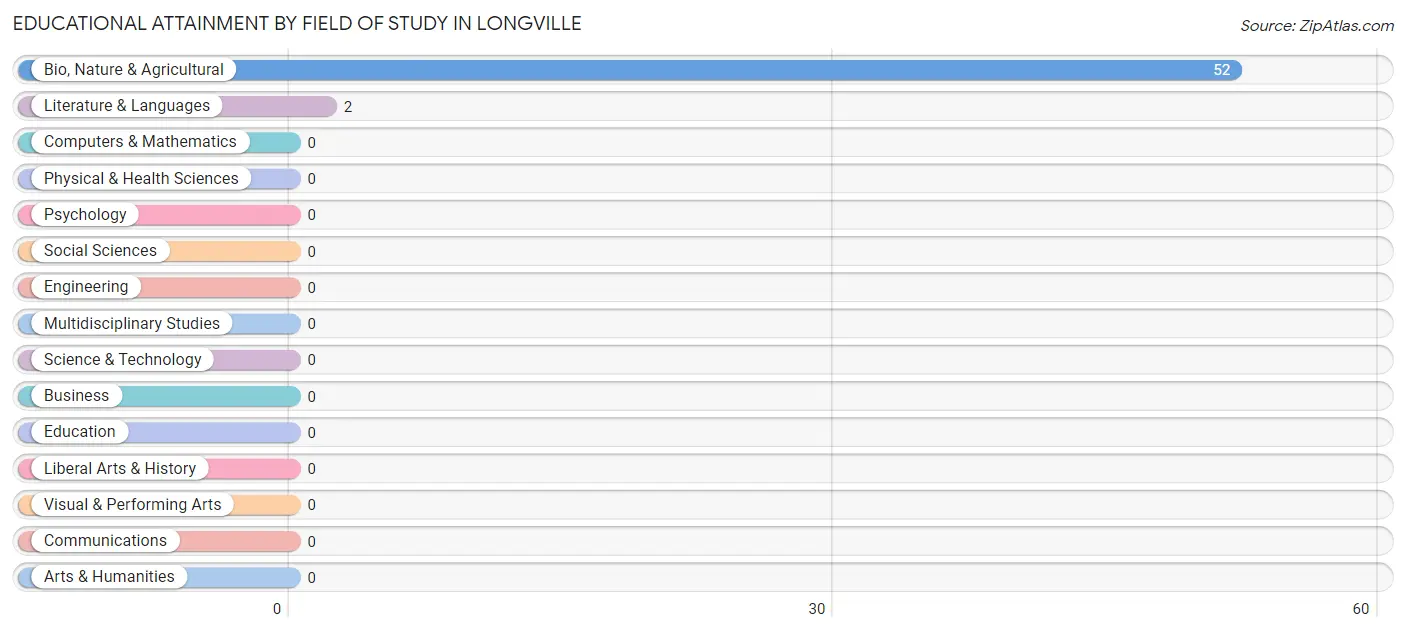
| Field of Study | # Graduates | % Graduates |
| Computers & Mathematics | 0 | 0.0% |
| Bio, Nature & Agricultural | 52 | 96.3% |
| Physical & Health Sciences | 0 | 0.0% |
| Psychology | 0 | 0.0% |
| Social Sciences | 0 | 0.0% |
| Engineering | 0 | 0.0% |
| Multidisciplinary Studies | 0 | 0.0% |
| Science & Technology | 0 | 0.0% |
| Business | 0 | 0.0% |
| Education | 0 | 0.0% |
| Literature & Languages | 2 | 3.7% |
| Liberal Arts & History | 0 | 0.0% |
| Visual & Performing Arts | 0 | 0.0% |
| Communications | 0 | 0.0% |
| Arts & Humanities | 0 | 0.0% |
| Total | 54 | 100.0% |
Transportation & Commute in Longville
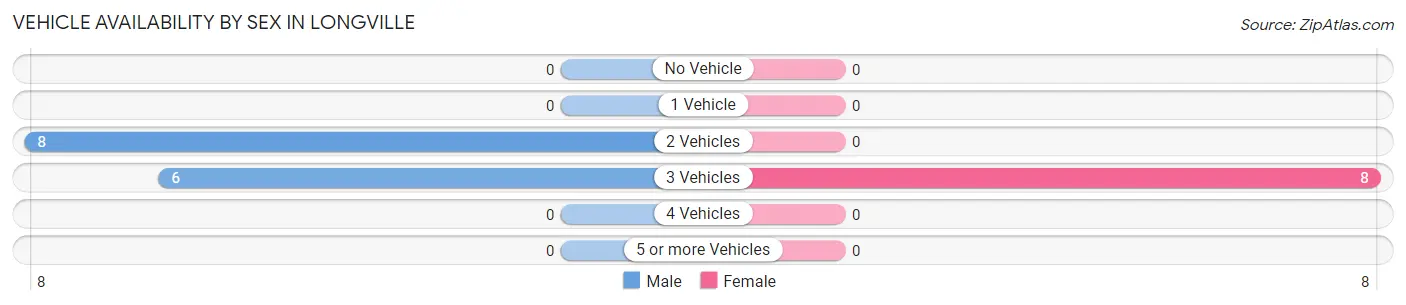
Vehicle Availability by Sex in Longville
The most prevalent vehicle ownership categories in Longville are males with 2 vehicles (8, accounting for 57.1%) and females with 2 vehicles (0, making up 100.0%).
| Vehicles Available | Male | Female |
| No Vehicle | 0 (0.0%) | 0 (0.0%) |
| 1 Vehicle | 0 (0.0%) | 0 (0.0%) |
| 2 Vehicles | 8 (57.1%) | 0 (0.0%) |
| 3 Vehicles | 6 (42.9%) | 8 (100.0%) |
| 4 Vehicles | 0 (0.0%) | 0 (0.0%) |
| 5 or more Vehicles | 0 (0.0%) | 0 (0.0%) |
| Total | 14 (100.0%) | 8 (100.0%) |
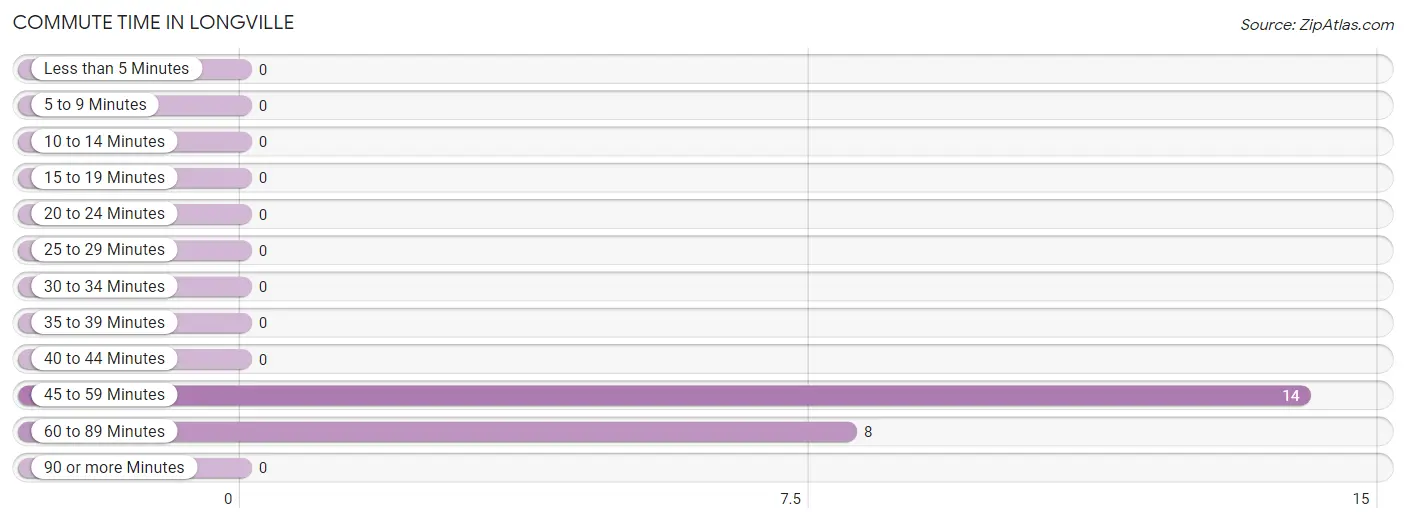
Commute Time in Longville
The most frequently occuring commute durations in Longville are 45 to 59 minutes (14 commuters, 63.6%), 60 to 89 minutes (8 commuters, 36.4%), and less than 5 minutes (0 commuters, 0.0%).
| Commute Time | # Commuters | % Commuters |
| Less than 5 Minutes | 0 | 0.0% |
| 5 to 9 Minutes | 0 | 0.0% |
| 10 to 14 Minutes | 0 | 0.0% |
| 15 to 19 Minutes | 0 | 0.0% |
| 20 to 24 Minutes | 0 | 0.0% |
| 25 to 29 Minutes | 0 | 0.0% |
| 30 to 34 Minutes | 0 | 0.0% |
| 35 to 39 Minutes | 0 | 0.0% |
| 40 to 44 Minutes | 0 | 0.0% |
| 45 to 59 Minutes | 14 | 63.6% |
| 60 to 89 Minutes | 8 | 36.4% |
| 90 or more Minutes | 0 | 0.0% |
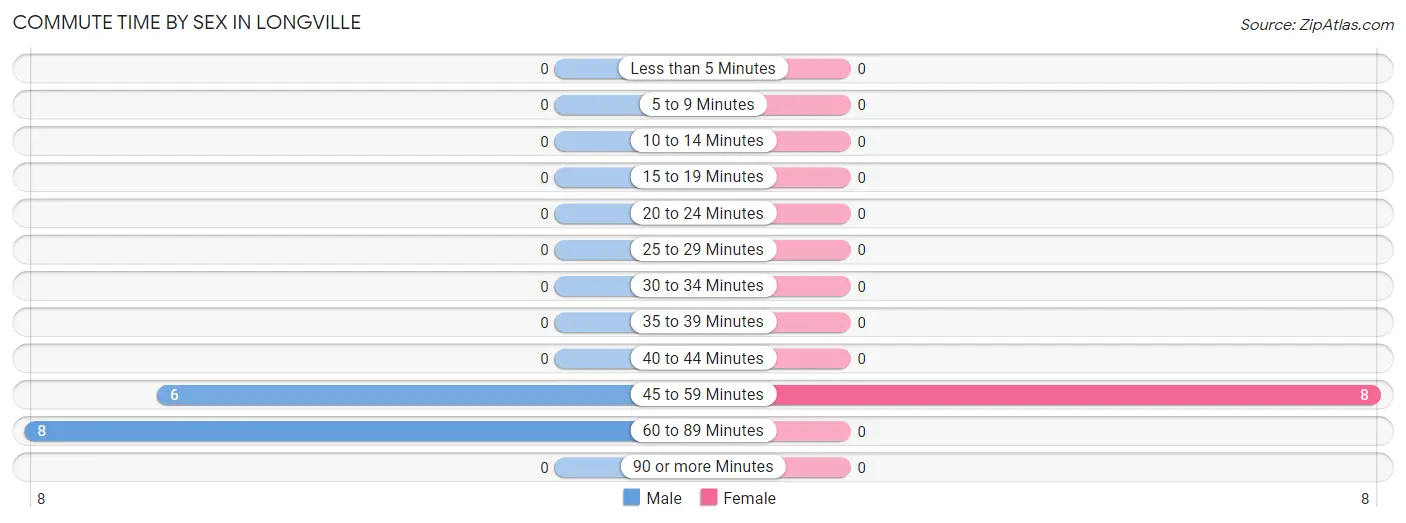
Commute Time by Sex in Longville
The most common commute times in Longville are 60 to 89 minutes (8 commuters, 57.1%) for males and 45 to 59 minutes (8 commuters, 100.0%) for females.
| Commute Time | Male | Female |
| Less than 5 Minutes | 0 (0.0%) | 0 (0.0%) |
| 5 to 9 Minutes | 0 (0.0%) | 0 (0.0%) |
| 10 to 14 Minutes | 0 (0.0%) | 0 (0.0%) |
| 15 to 19 Minutes | 0 (0.0%) | 0 (0.0%) |
| 20 to 24 Minutes | 0 (0.0%) | 0 (0.0%) |
| 25 to 29 Minutes | 0 (0.0%) | 0 (0.0%) |
| 30 to 34 Minutes | 0 (0.0%) | 0 (0.0%) |
| 35 to 39 Minutes | 0 (0.0%) | 0 (0.0%) |
| 40 to 44 Minutes | 0 (0.0%) | 0 (0.0%) |
| 45 to 59 Minutes | 6 (42.9%) | 8 (100.0%) |
| 60 to 89 Minutes | 8 (57.1%) | 0 (0.0%) |
| 90 or more Minutes | 0 (0.0%) | 0 (0.0%) |
Time of Departure to Work by Sex in Longville
The most frequent times of departure to work in Longville are 6:00 AM to 6:29 AM (8, 57.1%) for males and 7:30 AM to 7:59 AM (8, 100.0%) for females.
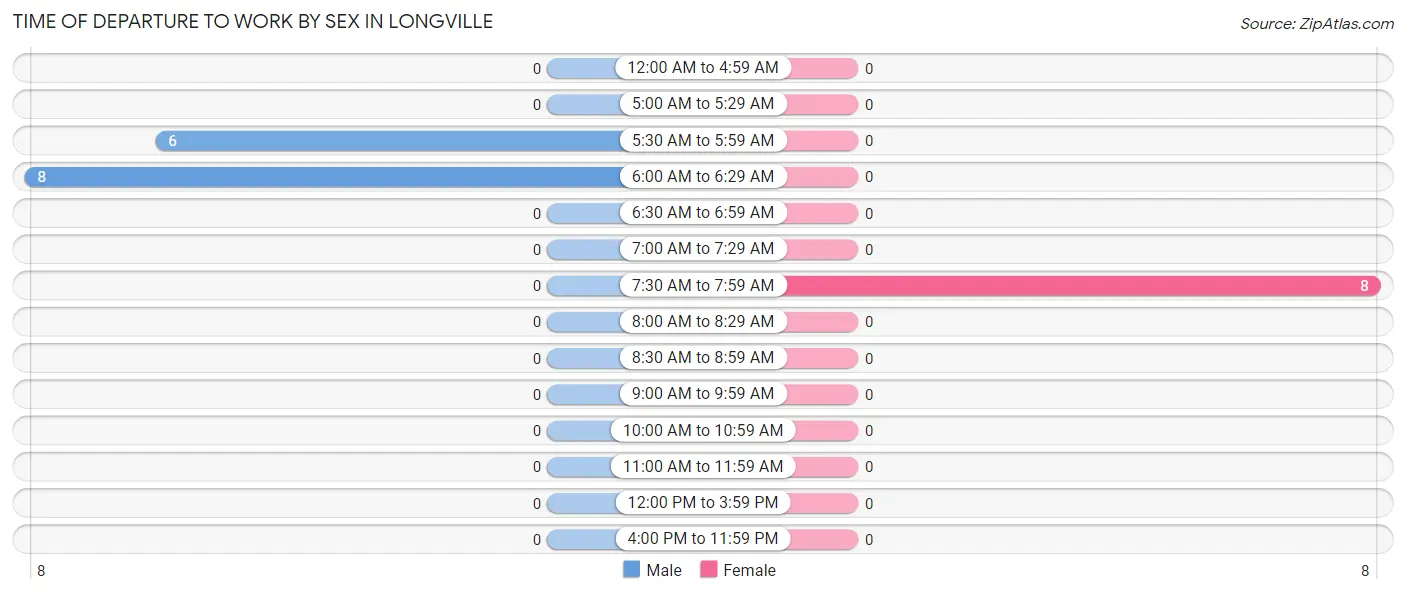
| Time of Departure | Male | Female |
| 12:00 AM to 4:59 AM | 0 (0.0%) | 0 (0.0%) |
| 5:00 AM to 5:29 AM | 0 (0.0%) | 0 (0.0%) |
| 5:30 AM to 5:59 AM | 6 (42.9%) | 0 (0.0%) |
| 6:00 AM to 6:29 AM | 8 (57.1%) | 0 (0.0%) |
| 6:30 AM to 6:59 AM | 0 (0.0%) | 0 (0.0%) |
| 7:00 AM to 7:29 AM | 0 (0.0%) | 0 (0.0%) |
| 7:30 AM to 7:59 AM | 0 (0.0%) | 8 (100.0%) |
| 8:00 AM to 8:29 AM | 0 (0.0%) | 0 (0.0%) |
| 8:30 AM to 8:59 AM | 0 (0.0%) | 0 (0.0%) |
| 9:00 AM to 9:59 AM | 0 (0.0%) | 0 (0.0%) |
| 10:00 AM to 10:59 AM | 0 (0.0%) | 0 (0.0%) |
| 11:00 AM to 11:59 AM | 0 (0.0%) | 0 (0.0%) |
| 12:00 PM to 3:59 PM | 0 (0.0%) | 0 (0.0%) |
| 4:00 PM to 11:59 PM | 0 (0.0%) | 0 (0.0%) |
| Total | 14 (100.0%) | 8 (100.0%) |
Housing Occupancy in Longville
Occupancy by Ownership in Longville
Of the total 123 dwellings in Longville, owner-occupied units account for 107 (87.0%), while renter-occupied units make up 16 (13.0%).
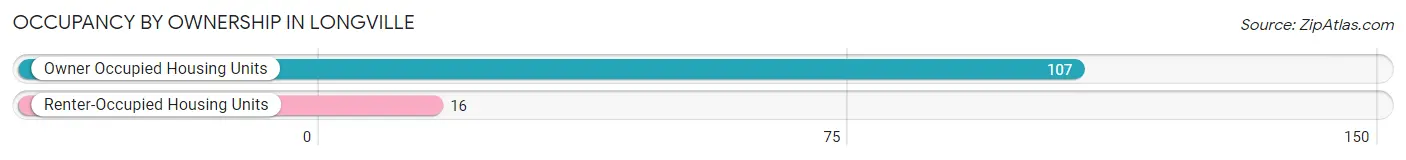
| Occupancy | # Housing Units | % Housing Units |
| Owner Occupied Housing Units | 107 | 87.0% |
| Renter-Occupied Housing Units | 16 | 13.0% |
| Total Occupied Housing Units | 123 | 100.0% |
Occupancy by Household Size in Longville
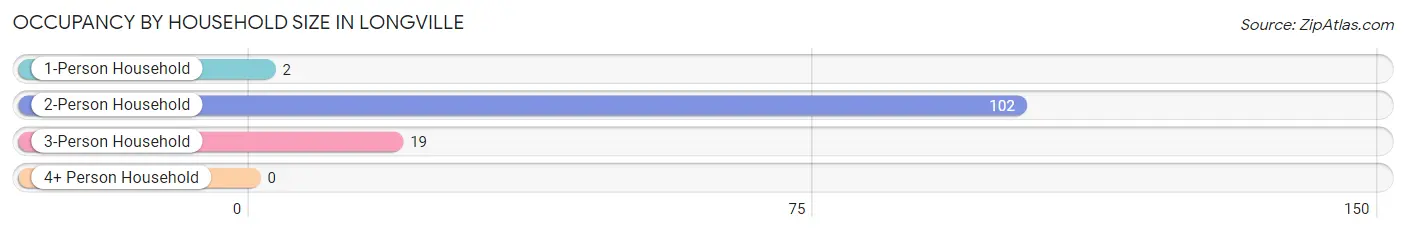
| Household Size | # Housing Units | % Housing Units |
| 1-Person Household | 2 | 1.6% |
| 2-Person Household | 102 | 82.9% |
| 3-Person Household | 19 | 15.4% |
| 4+ Person Household | 0 | 0.0% |
| Total Housing Units | 123 | 100.0% |
Occupancy by Ownership by Household Size in Longville
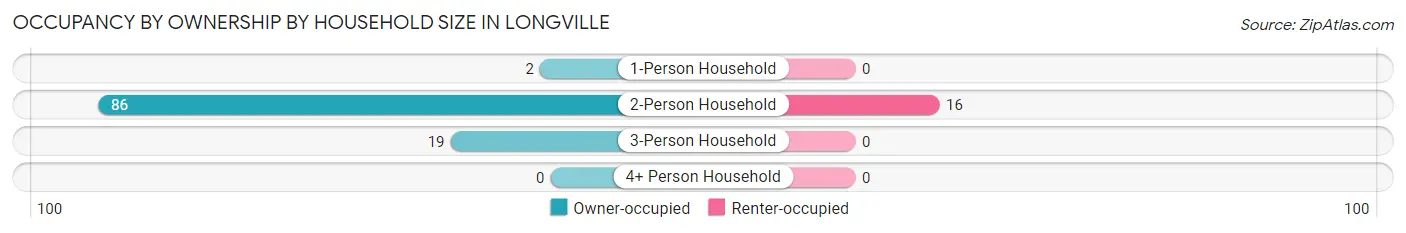
| Household Size | Owner-occupied | Renter-occupied |
| 1-Person Household | 2 (100.0%) | 0 (0.0%) |
| 2-Person Household | 86 (84.3%) | 16 (15.7%) |
| 3-Person Household | 19 (100.0%) | 0 (0.0%) |
| 4+ Person Household | 0 (0.0%) | 0 (0.0%) |
| Total Housing Units | 107 (87.0%) | 16 (13.0%) |
Occupancy by Educational Attainment in Longville
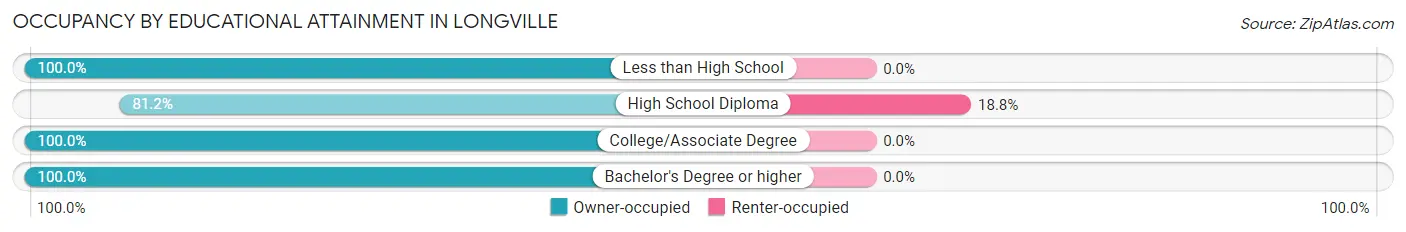
| Household Size | Owner-occupied | Renter-occupied |
| Less than High School | 11 (100.0%) | 0 (0.0%) |
| High School Diploma | 69 (81.2%) | 16 (18.8%) |
| College/Associate Degree | 25 (100.0%) | 0 (0.0%) |
| Bachelor's Degree or higher | 2 (100.0%) | 0 (0.0%) |
Occupancy by Age of Householder in Longville
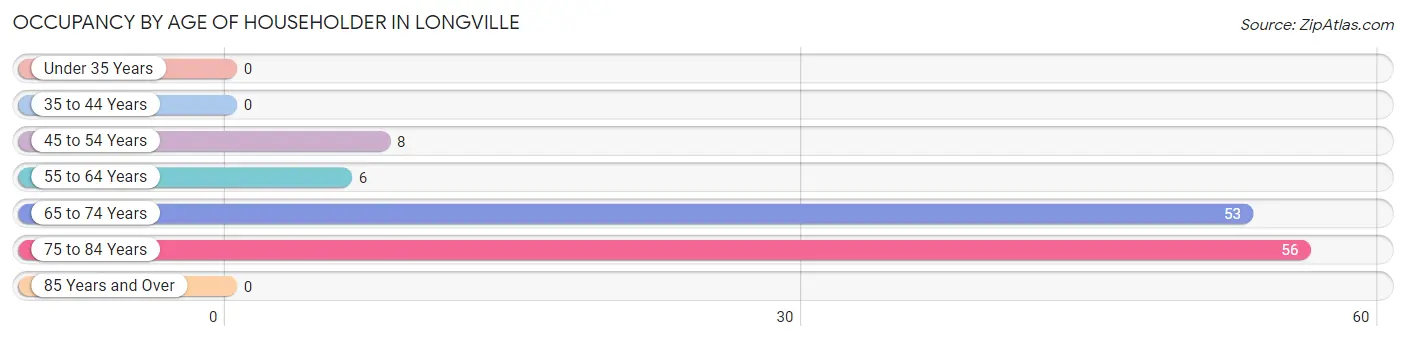
| Age Bracket | # Households | % Households |
| Under 35 Years | 0 | 0.0% |
| 35 to 44 Years | 0 | 0.0% |
| 45 to 54 Years | 8 | 6.5% |
| 55 to 64 Years | 6 | 4.9% |
| 65 to 74 Years | 53 | 43.1% |
| 75 to 84 Years | 56 | 45.5% |
| 85 Years and Over | 0 | 0.0% |
| Total | 123 | 100.0% |
Housing Finances in Longville
Median Income by Occupancy in Longville
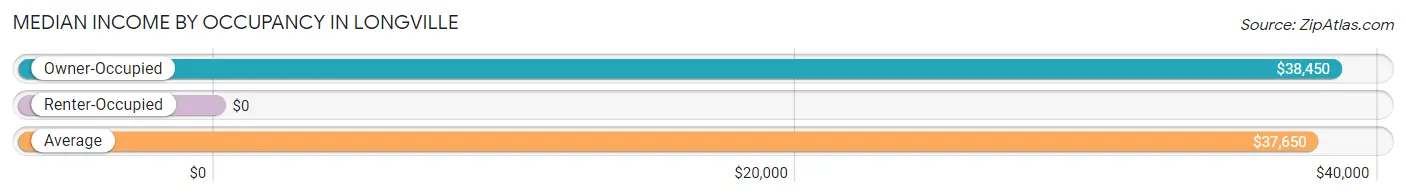
| Occupancy Type | # Households | Median Income |
| Owner-Occupied | 107 (87.0%) | $38,450 |
| Renter-Occupied | 16 (13.0%) | $0 |
| Average | 123 (100.0%) | $37,650 |
Occupancy by Householder Income Bracket in Longville
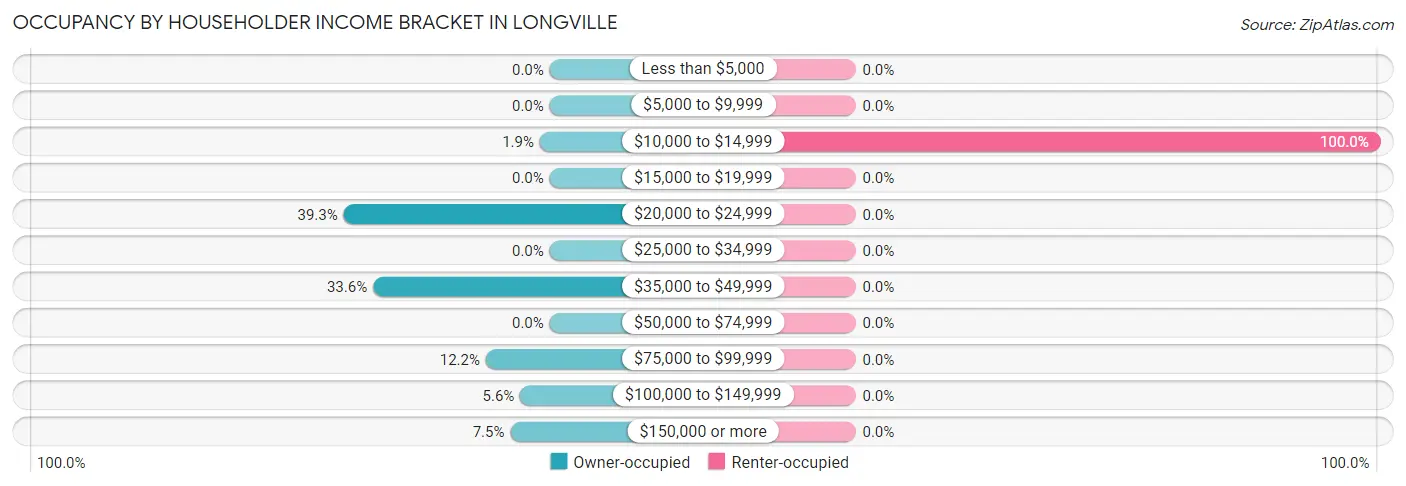
| Income Bracket | Owner-occupied | Renter-occupied |
| Less than $5,000 | 0 (0.0%) | 0 (0.0%) |
| $5,000 to $9,999 | 0 (0.0%) | 0 (0.0%) |
| $10,000 to $14,999 | 2 (1.9%) | 16 (100.0%) |
| $15,000 to $19,999 | 0 (0.0%) | 0 (0.0%) |
| $20,000 to $24,999 | 42 (39.3%) | 0 (0.0%) |
| $25,000 to $34,999 | 0 (0.0%) | 0 (0.0%) |
| $35,000 to $49,999 | 36 (33.6%) | 0 (0.0%) |
| $50,000 to $74,999 | 0 (0.0%) | 0 (0.0%) |
| $75,000 to $99,999 | 13 (12.1%) | 0 (0.0%) |
| $100,000 to $149,999 | 6 (5.6%) | 0 (0.0%) |
| $150,000 or more | 8 (7.5%) | 0 (0.0%) |
| Total | 107 (100.0%) | 16 (100.0%) |
Monthly Housing Cost Tiers in Longville
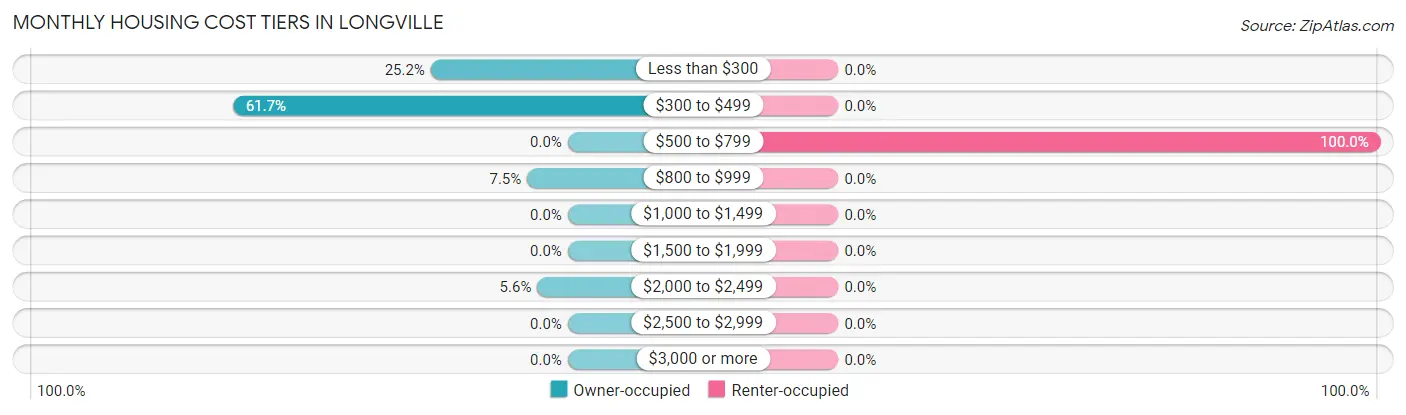
| Monthly Cost | Owner-occupied | Renter-occupied |
| Less than $300 | 27 (25.2%) | 0 (0.0%) |
| $300 to $499 | 66 (61.7%) | 0 (0.0%) |
| $500 to $799 | 0 (0.0%) | 16 (100.0%) |
| $800 to $999 | 8 (7.5%) | 0 (0.0%) |
| $1,000 to $1,499 | 0 (0.0%) | 0 (0.0%) |
| $1,500 to $1,999 | 0 (0.0%) | 0 (0.0%) |
| $2,000 to $2,499 | 6 (5.6%) | 0 (0.0%) |
| $2,500 to $2,999 | 0 (0.0%) | 0 (0.0%) |
| $3,000 or more | 0 (0.0%) | 0 (0.0%) |
| Total | 107 (100.0%) | 16 (100.0%) |
Physical Housing Characteristics in Longville
Housing Structures in Longville
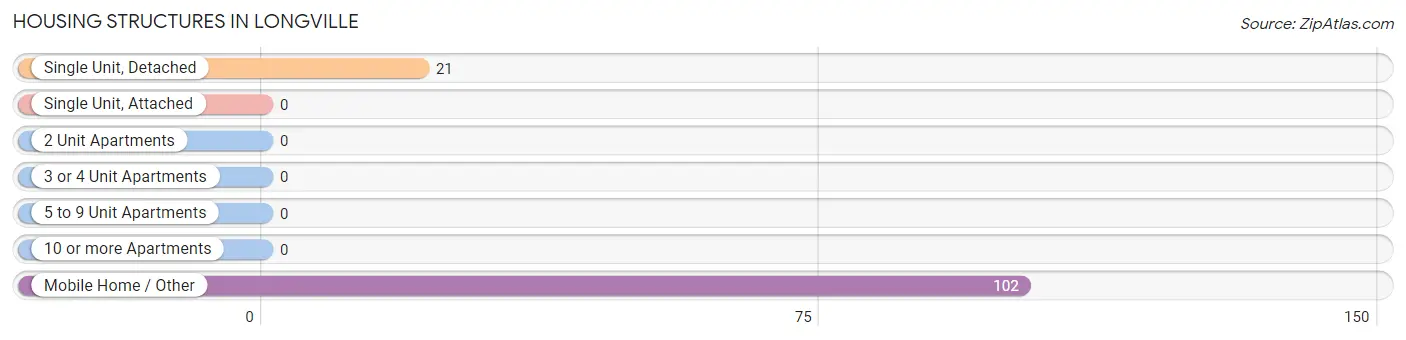
| Structure Type | # Housing Units | % Housing Units |
| Single Unit, Detached | 21 | 17.1% |
| Single Unit, Attached | 0 | 0.0% |
| 2 Unit Apartments | 0 | 0.0% |
| 3 or 4 Unit Apartments | 0 | 0.0% |
| 5 to 9 Unit Apartments | 0 | 0.0% |
| 10 or more Apartments | 0 | 0.0% |
| Mobile Home / Other | 102 | 82.9% |
| Total | 123 | 100.0% |
Housing Structures by Occupancy in Longville
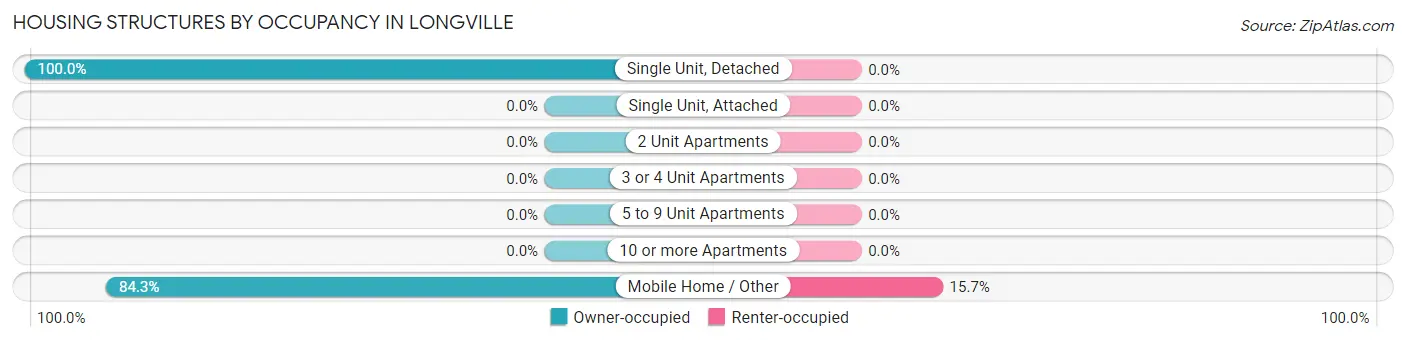
| Structure Type | Owner-occupied | Renter-occupied |
| Single Unit, Detached | 21 (100.0%) | 0 (0.0%) |
| Single Unit, Attached | 0 (0.0%) | 0 (0.0%) |
| 2 Unit Apartments | 0 (0.0%) | 0 (0.0%) |
| 3 or 4 Unit Apartments | 0 (0.0%) | 0 (0.0%) |
| 5 to 9 Unit Apartments | 0 (0.0%) | 0 (0.0%) |
| 10 or more Apartments | 0 (0.0%) | 0 (0.0%) |
| Mobile Home / Other | 86 (84.3%) | 16 (15.7%) |
| Total | 107 (87.0%) | 16 (13.0%) |
Housing Structures by Number of Rooms in Longville
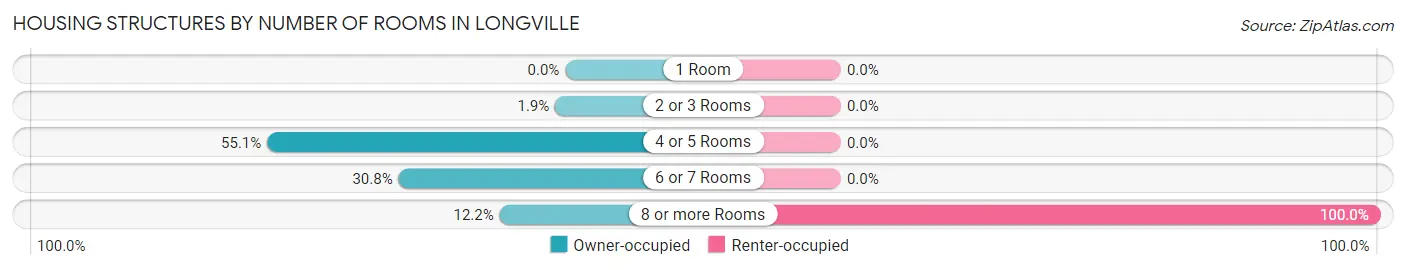
| Number of Rooms | Owner-occupied | Renter-occupied |
| 1 Room | 0 (0.0%) | 0 (0.0%) |
| 2 or 3 Rooms | 2 (1.9%) | 0 (0.0%) |
| 4 or 5 Rooms | 59 (55.1%) | 0 (0.0%) |
| 6 or 7 Rooms | 33 (30.8%) | 0 (0.0%) |
| 8 or more Rooms | 13 (12.1%) | 16 (100.0%) |
| Total | 107 (100.0%) | 16 (100.0%) |
Housing Structure by Heating Type in Longville
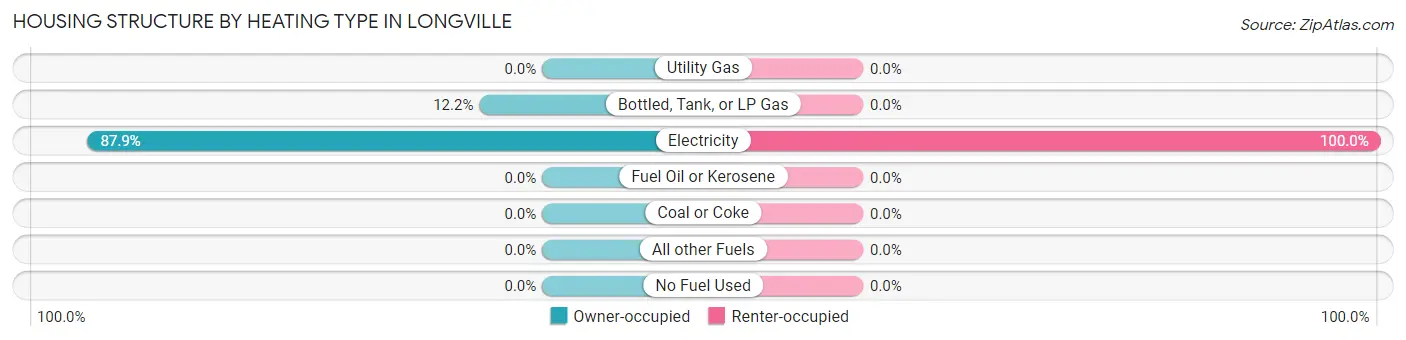
| Heating Type | Owner-occupied | Renter-occupied |
| Utility Gas | 0 (0.0%) | 0 (0.0%) |
| Bottled, Tank, or LP Gas | 13 (12.1%) | 0 (0.0%) |
| Electricity | 94 (87.8%) | 16 (100.0%) |
| Fuel Oil or Kerosene | 0 (0.0%) | 0 (0.0%) |
| Coal or Coke | 0 (0.0%) | 0 (0.0%) |
| All other Fuels | 0 (0.0%) | 0 (0.0%) |
| No Fuel Used | 0 (0.0%) | 0 (0.0%) |
| Total | 107 (100.0%) | 16 (100.0%) |
Household Vehicle Usage in Longville
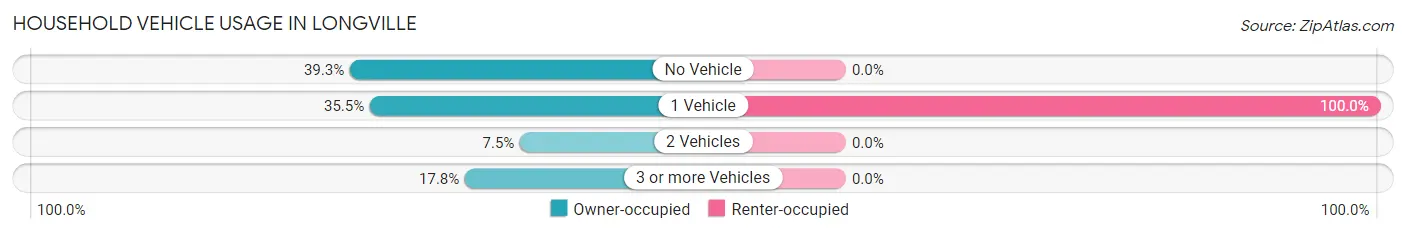
| Vehicles per Household | Owner-occupied | Renter-occupied |
| No Vehicle | 42 (39.3%) | 0 (0.0%) |
| 1 Vehicle | 38 (35.5%) | 16 (100.0%) |
| 2 Vehicles | 8 (7.5%) | 0 (0.0%) |
| 3 or more Vehicles | 19 (17.8%) | 0 (0.0%) |
| Total | 107 (100.0%) | 16 (100.0%) |
Real Estate & Mortgages in Longville
Real Estate and Mortgage Overview in Longville
| Characteristic | Without Mortgage | With Mortgage |
| Housing Units | 93 | 14 |
| Median Property Value | - | - |
| Median Household Income | $37,750 | $8 |
| Monthly Housing Costs | $430 | $0 |
| Real Estate Taxes | - | - |
Property Value by Mortgage Status in Longville
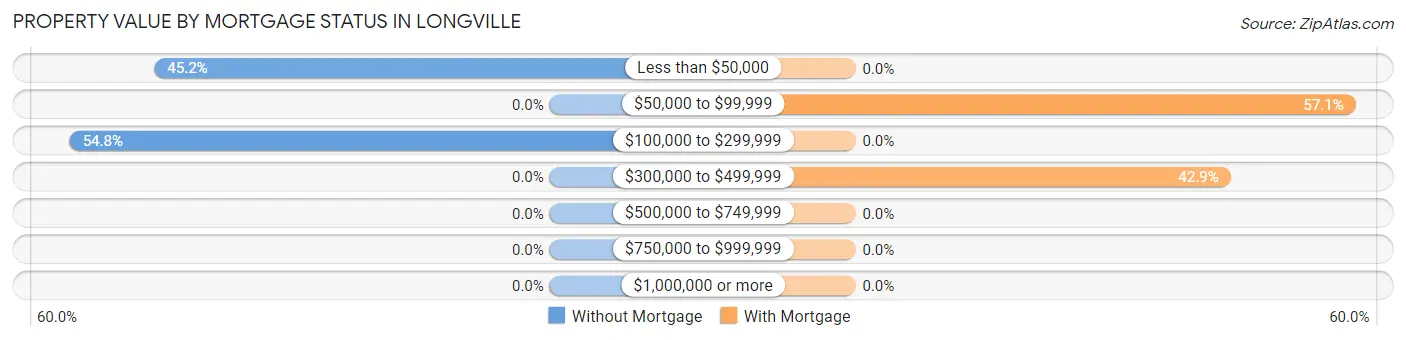
| Property Value | Without Mortgage | With Mortgage |
| Less than $50,000 | 42 (45.2%) | 0 (0.0%) |
| $50,000 to $99,999 | 0 (0.0%) | 8 (57.1%) |
| $100,000 to $299,999 | 51 (54.8%) | 0 (0.0%) |
| $300,000 to $499,999 | 0 (0.0%) | 6 (42.9%) |
| $500,000 to $749,999 | 0 (0.0%) | 0 (0.0%) |
| $750,000 to $999,999 | 0 (0.0%) | 0 (0.0%) |
| $1,000,000 or more | 0 (0.0%) | 0 (0.0%) |
| Total | 93 (100.0%) | 14 (100.0%) |
Household Income by Mortgage Status in Longville
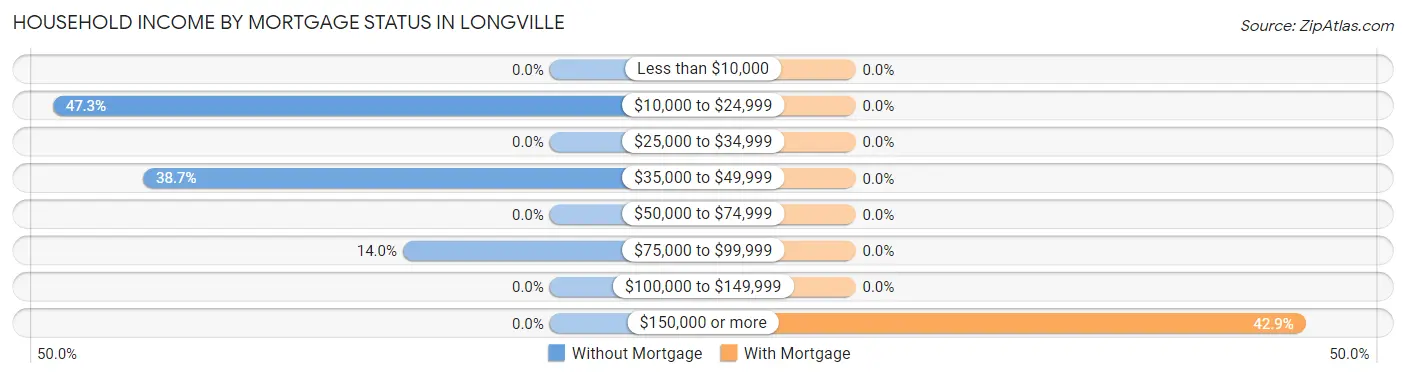
| Household Income | Without Mortgage | With Mortgage |
| Less than $10,000 | 0 (0.0%) | 0 (0.0%) |
| $10,000 to $24,999 | 44 (47.3%) | 0 (0.0%) |
| $25,000 to $34,999 | 0 (0.0%) | 0 (0.0%) |
| $35,000 to $49,999 | 36 (38.7%) | 0 (0.0%) |
| $50,000 to $74,999 | 0 (0.0%) | 0 (0.0%) |
| $75,000 to $99,999 | 13 (14.0%) | 0 (0.0%) |
| $100,000 to $149,999 | 0 (0.0%) | 0 (0.0%) |
| $150,000 or more | 0 (0.0%) | 6 (42.9%) |
| Total | 93 (100.0%) | 14 (100.0%) |
Property Value to Household Income Ratio in Longville
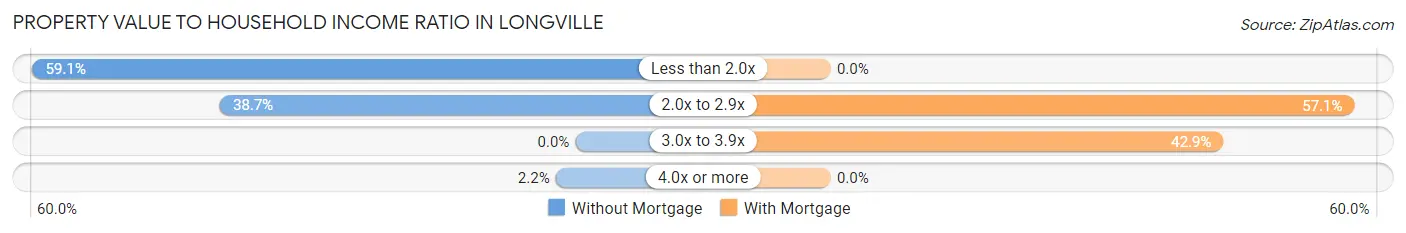
| Value-to-Income Ratio | Without Mortgage | With Mortgage |
| Less than 2.0x | 55 (59.1%) | 0 (0.0%) |
| 2.0x to 2.9x | 36 (38.7%) | 8 (57.1%) |
| 3.0x to 3.9x | 0 (0.0%) | 6 (42.9%) |
| 4.0x or more | 2 (2.1%) | 0 (0.0%) |
| Total | 93 (100.0%) | 14 (100.0%) |
Real Estate Taxes by Mortgage Status in Longville
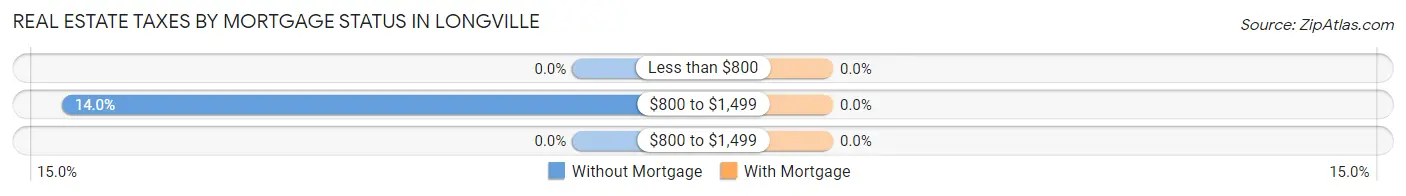
| Property Taxes | Without Mortgage | With Mortgage |
| Less than $800 | 0 (0.0%) | 0 (0.0%) |
| $800 to $1,499 | 13 (14.0%) | 0 (0.0%) |
| $800 to $1,499 | 0 (0.0%) | 0 (0.0%) |
| Total | 93 (100.0%) | 14 (100.0%) |
Health & Disability in Longville
Health Insurance Coverage by Age in Longville
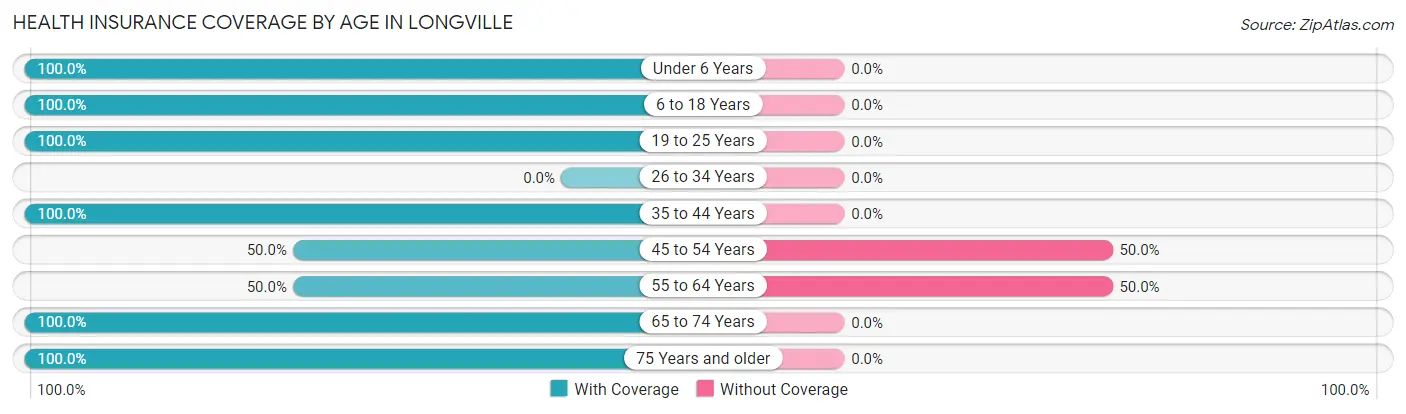
| Age Bracket | With Coverage | Without Coverage |
| Under 6 Years | 17 (100.0%) | 0 (0.0%) |
| 6 to 18 Years | 7 (100.0%) | 0 (0.0%) |
| 19 to 25 Years | 20 (100.0%) | 0 (0.0%) |
| 26 to 34 Years | 0 (0.0%) | 0 (0.0%) |
| 35 to 44 Years | 53 (100.0%) | 0 (0.0%) |
| 45 to 54 Years | 8 (50.0%) | 8 (50.0%) |
| 55 to 64 Years | 6 (50.0%) | 6 (50.0%) |
| 65 to 74 Years | 65 (100.0%) | 0 (0.0%) |
| 75 Years and older | 129 (100.0%) | 0 (0.0%) |
| Total | 305 (95.6%) | 14 (4.4%) |
Health Insurance Coverage by Citizenship Status in Longville
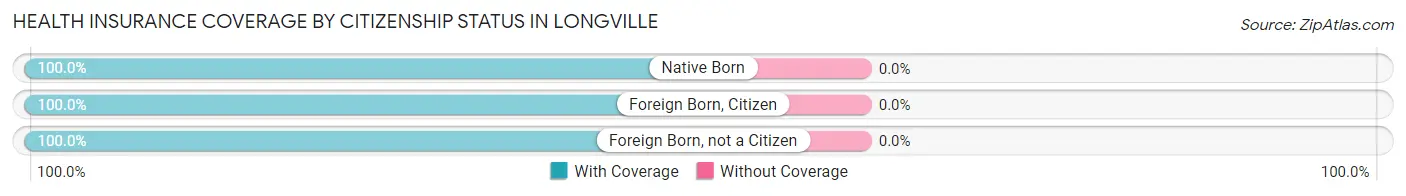
| Citizenship Status | With Coverage | Without Coverage |
| Native Born | 17 (100.0%) | 0 (0.0%) |
| Foreign Born, Citizen | 7 (100.0%) | 0 (0.0%) |
| Foreign Born, not a Citizen | 20 (100.0%) | 0 (0.0%) |
Health Insurance Coverage by Household Income in Longville
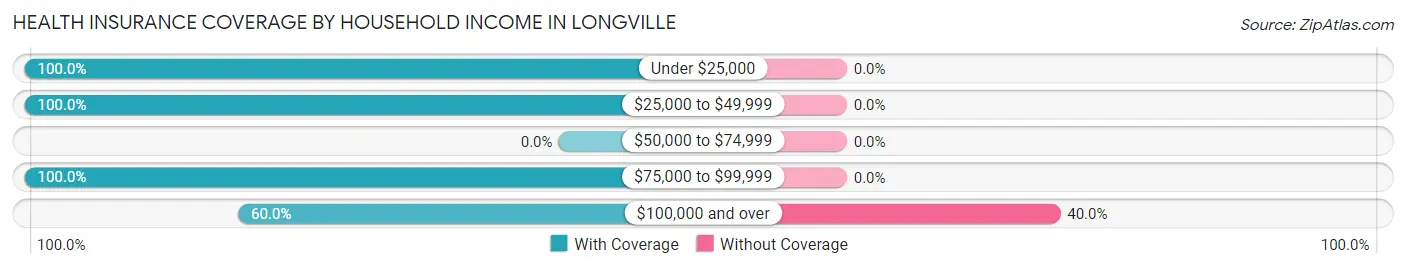
| Household Income | With Coverage | Without Coverage |
| Under $25,000 | 130 (100.0%) | 0 (0.0%) |
| $25,000 to $49,999 | 109 (100.0%) | 0 (0.0%) |
| $50,000 to $74,999 | 0 (0.0%) | 0 (0.0%) |
| $75,000 to $99,999 | 45 (100.0%) | 0 (0.0%) |
| $100,000 and over | 21 (60.0%) | 14 (40.0%) |
Public vs Private Health Insurance Coverage by Age in Longville
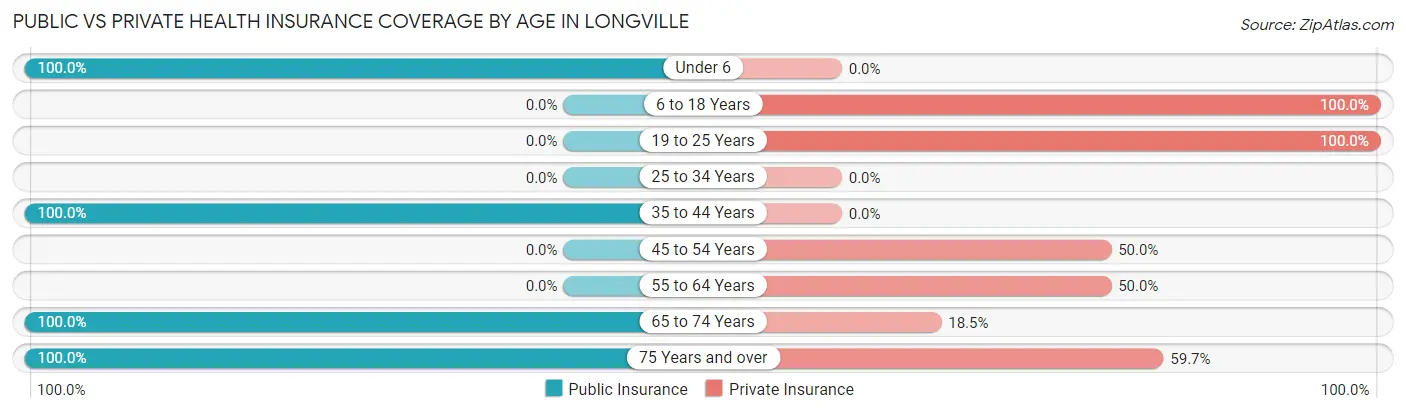
| Age Bracket | Public Insurance | Private Insurance |
| Under 6 | 17 (100.0%) | 0 (0.0%) |
| 6 to 18 Years | 0 (0.0%) | 7 (100.0%) |
| 19 to 25 Years | 0 (0.0%) | 20 (100.0%) |
| 25 to 34 Years | 0 (0.0%) | 0 (0.0%) |
| 35 to 44 Years | 53 (100.0%) | 0 (0.0%) |
| 45 to 54 Years | 0 (0.0%) | 8 (50.0%) |
| 55 to 64 Years | 0 (0.0%) | 6 (50.0%) |
| 65 to 74 Years | 65 (100.0%) | 12 (18.5%) |
| 75 Years and over | 129 (100.0%) | 77 (59.7%) |
| Total | 264 (82.8%) | 130 (40.7%) |
Disability Status by Sex by Age in Longville
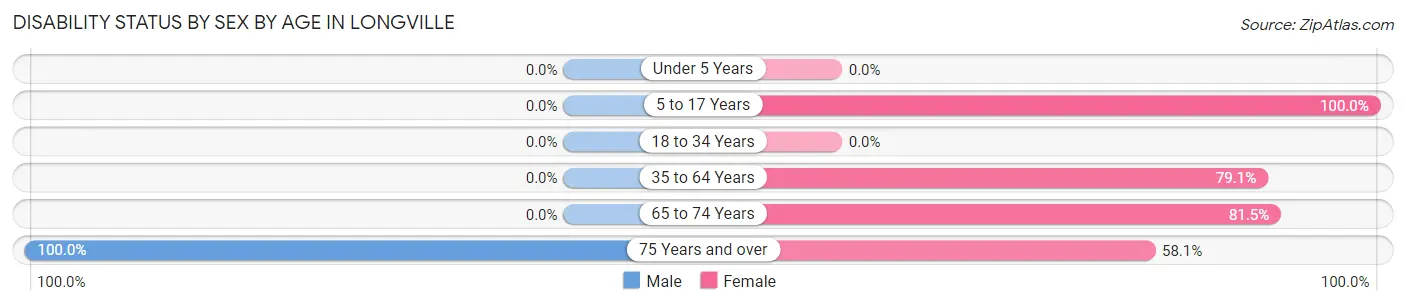
| Age Bracket | Male | Female |
| Under 5 Years | 0 (0.0%) | 0 (0.0%) |
| 5 to 17 Years | 0 (0.0%) | 7 (100.0%) |
| 18 to 34 Years | 0 (0.0%) | 0 (0.0%) |
| 35 to 64 Years | 0 (0.0%) | 53 (79.1%) |
| 65 to 74 Years | 0 (0.0%) | 53 (81.5%) |
| 75 Years and over | 86 (100.0%) | 25 (58.1%) |
Disability Class by Sex by Age in Longville
Disability Class: Hearing Difficulty
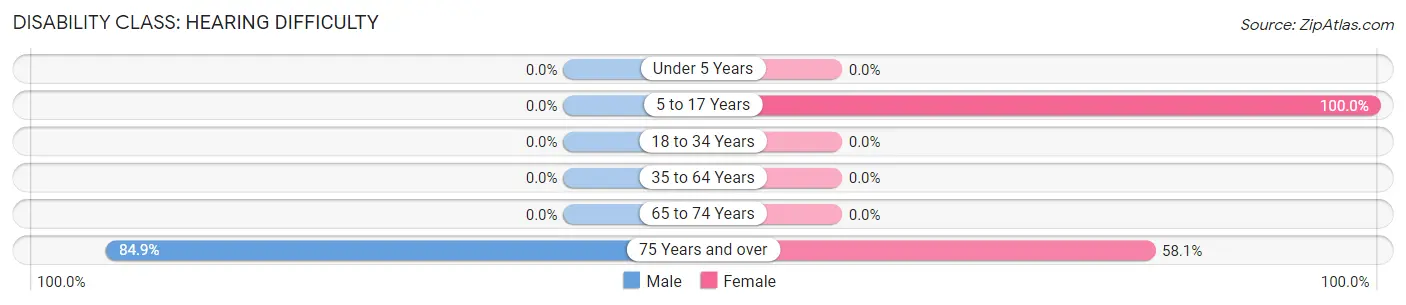
| Age Bracket | Male | Female |
| Under 5 Years | 0 (0.0%) | 0 (0.0%) |
| 5 to 17 Years | 0 (0.0%) | 7 (100.0%) |
| 18 to 34 Years | 0 (0.0%) | 0 (0.0%) |
| 35 to 64 Years | 0 (0.0%) | 0 (0.0%) |
| 65 to 74 Years | 0 (0.0%) | 0 (0.0%) |
| 75 Years and over | 73 (84.9%) | 25 (58.1%) |
Disability Class: Vision Difficulty
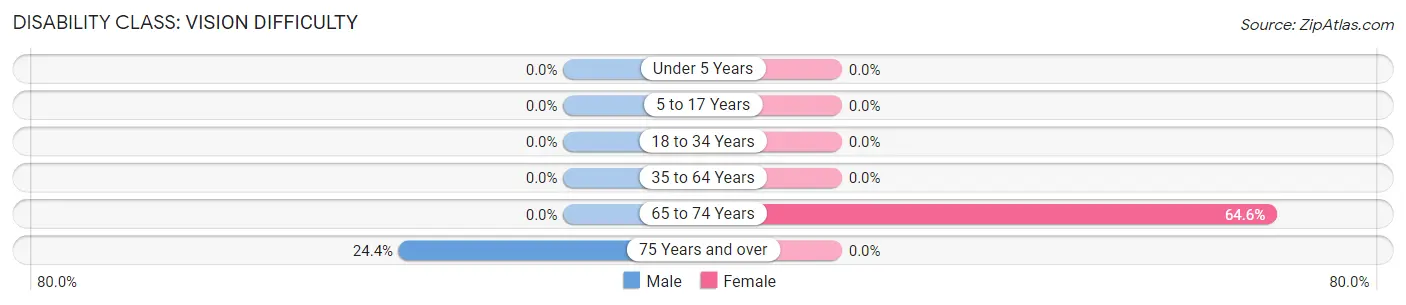
| Age Bracket | Male | Female |
| Under 5 Years | 0 (0.0%) | 0 (0.0%) |
| 5 to 17 Years | 0 (0.0%) | 0 (0.0%) |
| 18 to 34 Years | 0 (0.0%) | 0 (0.0%) |
| 35 to 64 Years | 0 (0.0%) | 0 (0.0%) |
| 65 to 74 Years | 0 (0.0%) | 42 (64.6%) |
| 75 Years and over | 21 (24.4%) | 0 (0.0%) |
Disability Class: Cognitive Difficulty
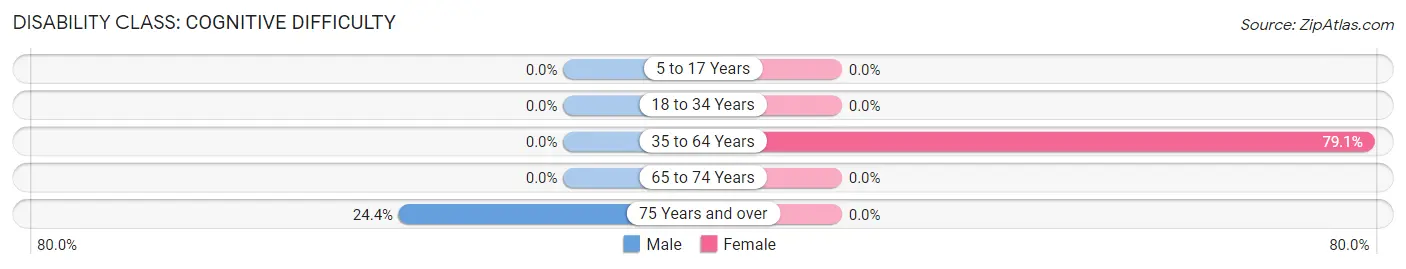
| Age Bracket | Male | Female |
| 5 to 17 Years | 0 (0.0%) | 0 (0.0%) |
| 18 to 34 Years | 0 (0.0%) | 0 (0.0%) |
| 35 to 64 Years | 0 (0.0%) | 53 (79.1%) |
| 65 to 74 Years | 0 (0.0%) | 0 (0.0%) |
| 75 Years and over | 21 (24.4%) | 0 (0.0%) |
Disability Class: Ambulatory Difficulty
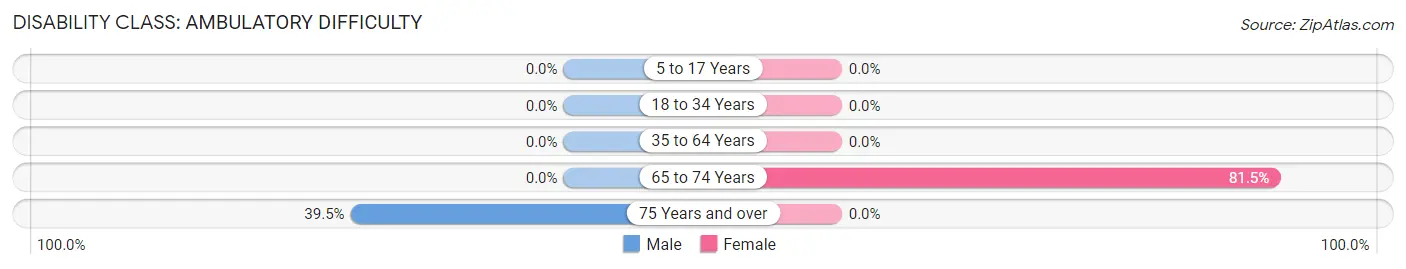
| Age Bracket | Male | Female |
| 5 to 17 Years | 0 (0.0%) | 0 (0.0%) |
| 18 to 34 Years | 0 (0.0%) | 0 (0.0%) |
| 35 to 64 Years | 0 (0.0%) | 0 (0.0%) |
| 65 to 74 Years | 0 (0.0%) | 53 (81.5%) |
| 75 Years and over | 34 (39.5%) | 0 (0.0%) |
Disability Class: Self-Care Difficulty
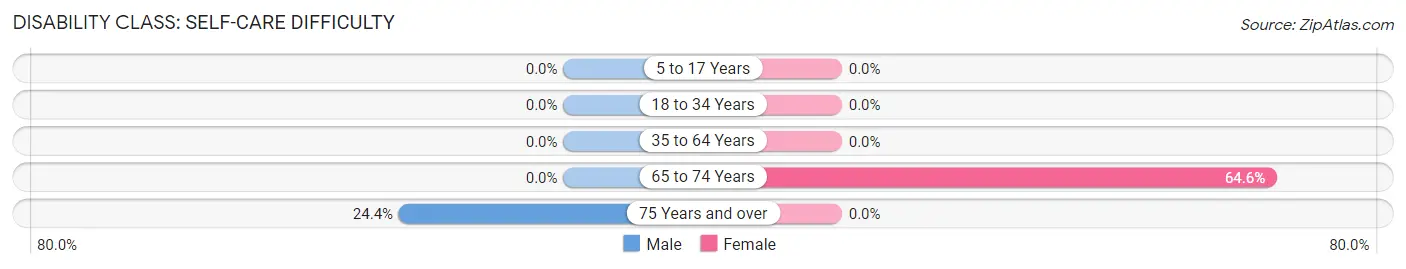
| Age Bracket | Male | Female |
| 5 to 17 Years | 0 (0.0%) | 0 (0.0%) |
| 18 to 34 Years | 0 (0.0%) | 0 (0.0%) |
| 35 to 64 Years | 0 (0.0%) | 0 (0.0%) |
| 65 to 74 Years | 0 (0.0%) | 42 (64.6%) |
| 75 Years and over | 21 (24.4%) | 0 (0.0%) |
Technology Access in Longville
Computing Device Access in Longville
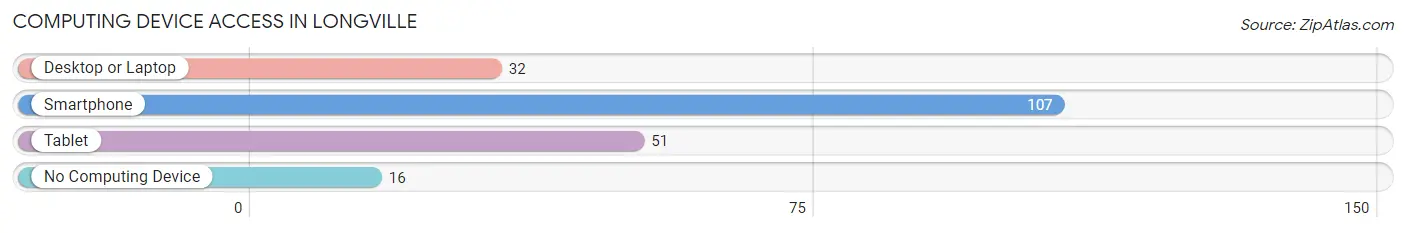
| Device Type | # Households | % Households |
| Desktop or Laptop | 32 | 26.0% |
| Smartphone | 107 | 87.0% |
| Tablet | 51 | 41.5% |
| No Computing Device | 16 | 13.0% |
| Total | 123 | 100.0% |
Internet Access in Longville
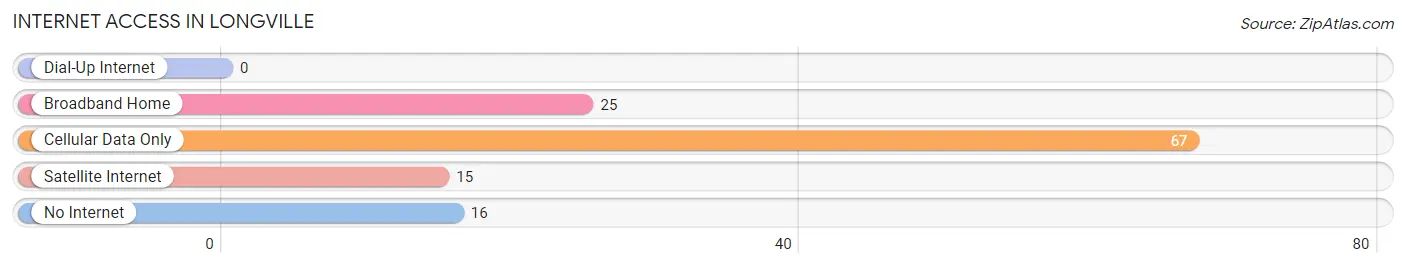
| Internet Type | # Households | % Households |
| Dial-Up Internet | 0 | 0.0% |
| Broadband Home | 25 | 20.3% |
| Cellular Data Only | 67 | 54.5% |
| Satellite Internet | 15 | 12.2% |
| No Internet | 16 | 13.0% |
| Total | 123 | 100.0% |
Longville Summary
Longville, Louisiana is a small town located in Beauregard Parish in the southwestern part of the state. It is situated on the banks of the Calcasieu River, about 25 miles south of Lake Charles. The town was founded in 1883 and has a population of approximately 1,000 people.
Longville is a rural community with a rich history and culture. The town was originally settled by French-speaking settlers from Canada, who were attracted to the area by the abundance of timber and the availability of land. The town was named after the Long family, who were among the first settlers.
The economy of Longville is largely based on agriculture and timber. The town is home to several large timber companies, including Weyerhaeuser and International Paper. The timber industry provides employment for many of the town’s residents. In addition, the town is home to several small businesses, including a grocery store, a hardware store, and a few restaurants.
Longville is also home to a number of recreational activities. The town is located near several lakes, including Lake Charles, which is a popular destination for fishing, boating, and swimming. The town also has several parks, including the Longville City Park, which features a playground, picnic areas, and a walking trail.
The demographics of Longville are largely white, with a small African American population. The median household income is approximately $30,000, and the median age is around 40 years old. The town is served by the Beauregard Parish School District, which includes two elementary schools, a middle school, and a high school.
Longville is a small town with a rich history and culture. The town is home to a number of businesses and recreational activities, and the economy is largely based on agriculture and timber. The town is also home to a diverse population, with a median household income of around $30,000 and a median age of 40 years old. Longville is a great place to live and work, and it is a great place to visit.
Common Questions
What is Per Capita Income in Longville?
Per Capita income in Longville is $24,954.
What is the Median Family Income in Longville?
Median Family Income in Longville is $37,750.
What is the Median Household income in Longville?
Median Household Income in Longville is $37,650.
What is Inequality or Gini Index in Longville?
Inequality or Gini Index in Longville is 0.45.
What is the Total Population of Longville?
Total Population of Longville is 319.
What is the Total Male Population of Longville?
Total Male Population of Longville is 100.
What is the Total Female Population of Longville?
Total Female Population of Longville is 219.
What is the Ratio of Males per 100 Females in Longville?
There are 45.66 Males per 100 Females in Longville.
What is the Ratio of Females per 100 Males in Longville?
There are 219.00 Females per 100 Males in Longville.
What is the Median Population Age in Longville?
Median Population Age in Longville is 68.6 Years.
What is the Average Family Size in Longville
Average Family Size in Longville is 2.6 People.
What is the Average Household Size in Longville
Average Household Size in Longville is 2.6 People.
How Large is the Labor Force in Longville?
There are 22 People in the Labor Forcein in Longville.
What is the Percentage of People in the Labor Force in Longville?
7.3% of People are in the Labor Force in Longville.