Lindisfarne, MT Map & Demographics
Lindisfarne Map
Lindisfarne Overview
$55,082
PER CAPITA INCOME
$183,179
AVG FAMILY INCOME
$136,691
AVG HOUSEHOLD INCOME
0.34
INEQUALITY / GINI INDEX
495
TOTAL POPULATION
266
MALE POPULATION
229
FEMALE POPULATION
116.16
MALES / 100 FEMALES
86.09
FEMALES / 100 MALES
60.8
MEDIAN AGE
2.4
AVG FAMILY SIZE
2.3
AVG HOUSEHOLD SIZE
300
LABOR FORCE [ PEOPLE ]
60.6%
PERCENT IN LABOR FORCE
5.3%
UNEMPLOYMENT RATE
Income in Lindisfarne
Income Overview in Lindisfarne
Per Capita Income in Lindisfarne is $55,082, while median incomes of families and households are $183,179 and $136,691 respectively.
| Characteristic | Number | Measure |
| Per Capita Income | 495 | $55,082 |
| Median Family Income | 189 | $183,179 |
| Mean Family Income | 189 | $135,841 |
| Median Household Income | 219 | $136,691 |
| Mean Household Income | 219 | $121,303 |
| Income Deficit | 189 | $0 |
| Wage / Income Gap (%) | 495 | 0.00% |
| Wage / Income Gap ($) | 495 | 100.00¢ per $1 |
| Gini / Inequality Index | 495 | 0.34 |
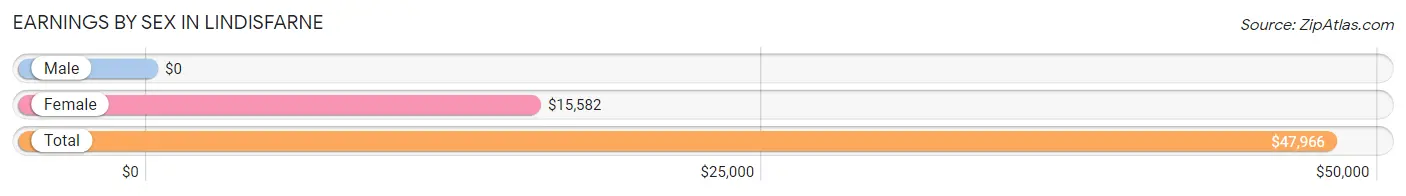
Earnings by Sex in Lindisfarne
| Sex | Number | Average Earnings |
| Male | 189 (58.2%) | $0 |
| Female | 136 (41.8%) | $15,582 |
| Total | 325 (100.0%) | $47,966 |
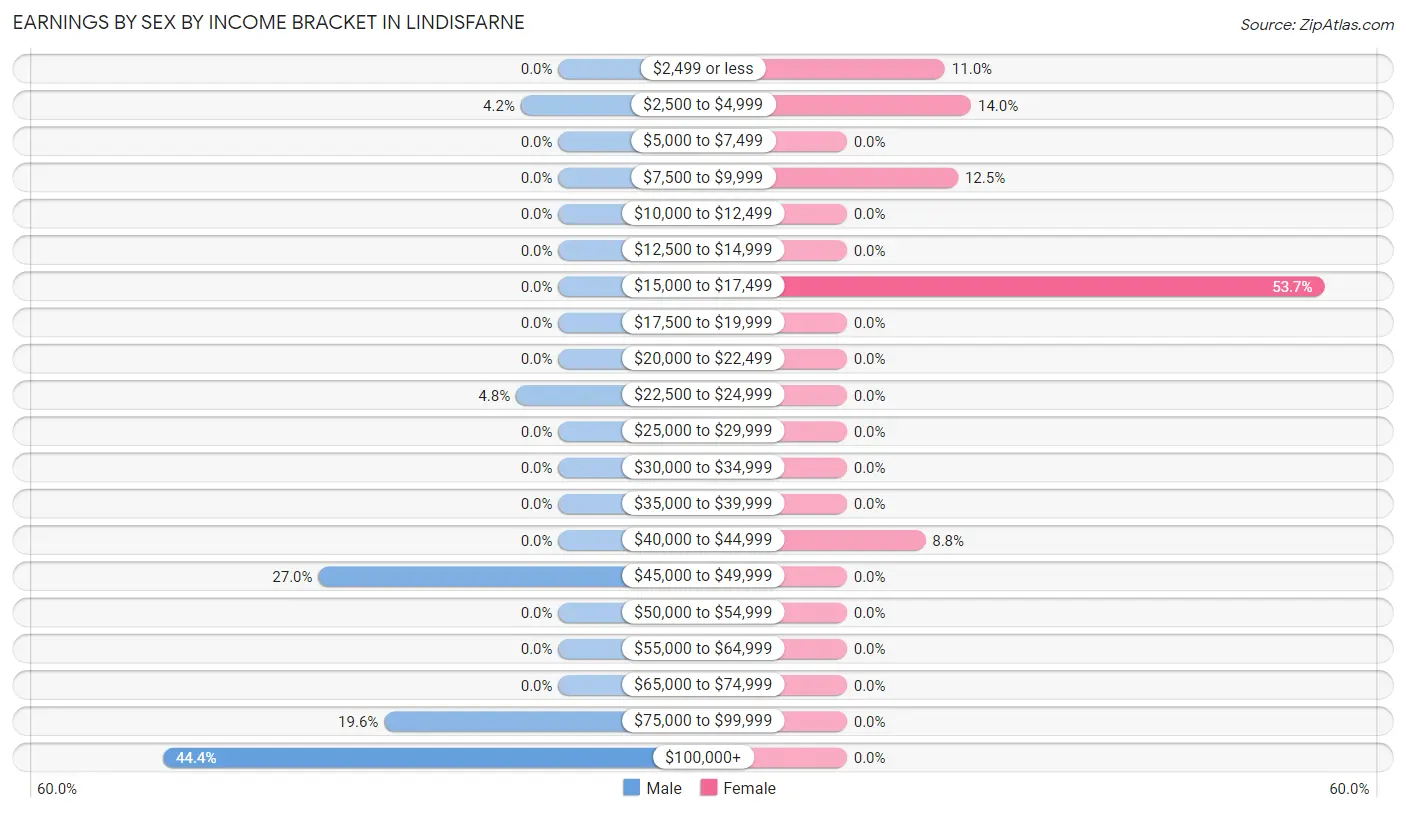
Earnings by Sex by Income Bracket in Lindisfarne
The most common earnings brackets in Lindisfarne are $100,000+ for men (84 | 44.4%) and $15,000 to $17,499 for women (73 | 53.7%).
| Income | Male | Female |
| $2,499 or less | 0 (0.0%) | 15 (11.0%) |
| $2,500 to $4,999 | 8 (4.2%) | 19 (14.0%) |
| $5,000 to $7,499 | 0 (0.0%) | 0 (0.0%) |
| $7,500 to $9,999 | 0 (0.0%) | 17 (12.5%) |
| $10,000 to $12,499 | 0 (0.0%) | 0 (0.0%) |
| $12,500 to $14,999 | 0 (0.0%) | 0 (0.0%) |
| $15,000 to $17,499 | 0 (0.0%) | 73 (53.7%) |
| $17,500 to $19,999 | 0 (0.0%) | 0 (0.0%) |
| $20,000 to $22,499 | 0 (0.0%) | 0 (0.0%) |
| $22,500 to $24,999 | 9 (4.8%) | 0 (0.0%) |
| $25,000 to $29,999 | 0 (0.0%) | 0 (0.0%) |
| $30,000 to $34,999 | 0 (0.0%) | 0 (0.0%) |
| $35,000 to $39,999 | 0 (0.0%) | 0 (0.0%) |
| $40,000 to $44,999 | 0 (0.0%) | 12 (8.8%) |
| $45,000 to $49,999 | 51 (27.0%) | 0 (0.0%) |
| $50,000 to $54,999 | 0 (0.0%) | 0 (0.0%) |
| $55,000 to $64,999 | 0 (0.0%) | 0 (0.0%) |
| $65,000 to $74,999 | 0 (0.0%) | 0 (0.0%) |
| $75,000 to $99,999 | 37 (19.6%) | 0 (0.0%) |
| $100,000+ | 84 (44.4%) | 0 (0.0%) |
| Total | 189 (100.0%) | 136 (100.0%) |
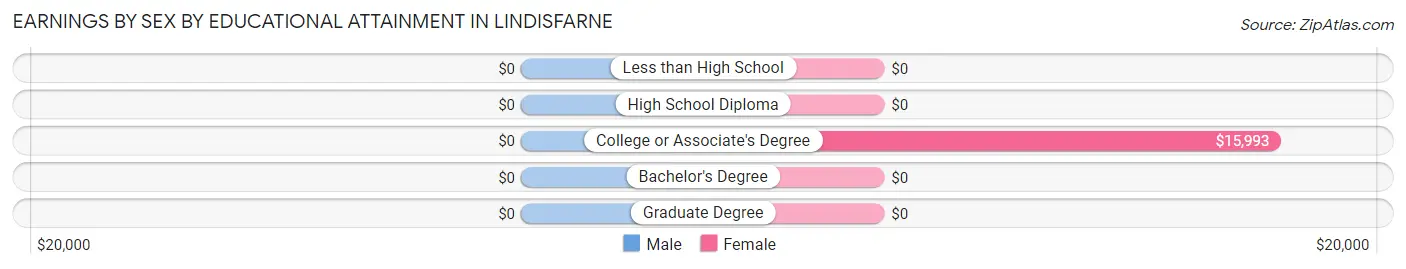
Earnings by Sex by Educational Attainment in Lindisfarne
| Educational Attainment | Male Income | Female Income |
| Less than High School | - | - |
| High School Diploma | - | - |
| College or Associate's Degree | - | - |
| Bachelor's Degree | - | - |
| Graduate Degree | - | - |
| Total | - | - |
Family Income in Lindisfarne
Family Income Brackets in Lindisfarne
According to the Lindisfarne family income data, there are 104 families falling into the $150,000 to $199,999 income range, which is the most common income bracket and makes up 55.0% of all families.
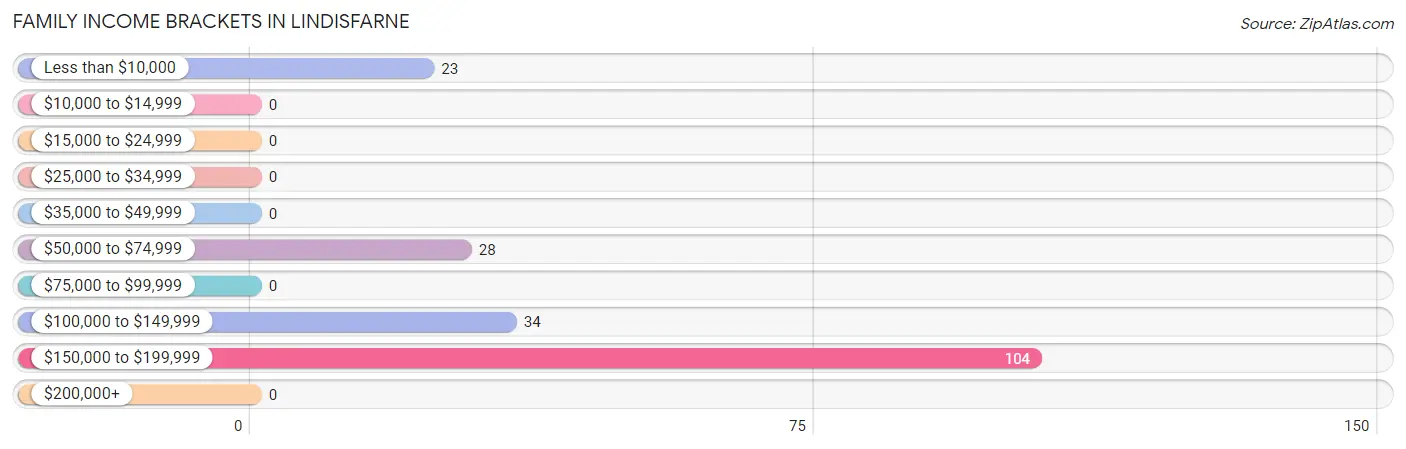
| Income Bracket | # Families | % Families |
| Less than $10,000 | 23 | 12.2% |
| $10,000 to $14,999 | 0 | 0.0% |
| $15,000 to $24,999 | 0 | 0.0% |
| $25,000 to $34,999 | 0 | 0.0% |
| $35,000 to $49,999 | 0 | 0.0% |
| $50,000 to $74,999 | 28 | 14.8% |
| $75,000 to $99,999 | 0 | 0.0% |
| $100,000 to $149,999 | 34 | 18.0% |
| $150,000 to $199,999 | 104 | 55.0% |
| $200,000+ | 0 | 0.0% |
Family Income by Famaliy Size in Lindisfarne
2-person families (124 | 65.6%) account for the highest median family income in Lindisfarne with $192,754 per family, while 2-person families (124 | 65.6%) have the highest median income of $96,377 per family member.
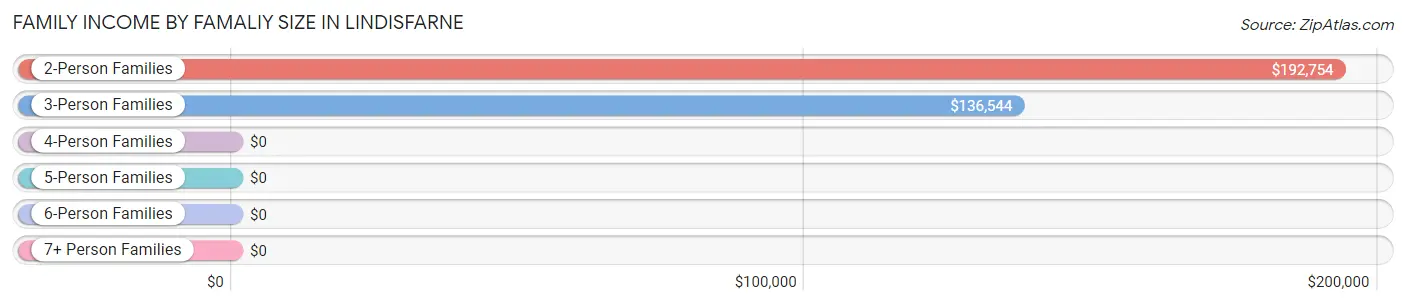
| Income Bracket | # Families | Median Income |
| 2-Person Families | 124 (65.6%) | $192,754 |
| 3-Person Families | 53 (28.0%) | $136,544 |
| 4-Person Families | 12 (6.4%) | $0 |
| 5-Person Families | 0 (0.0%) | $0 |
| 6-Person Families | 0 (0.0%) | $0 |
| 7+ Person Families | 0 (0.0%) | $0 |
| Total | 189 (100.0%) | $183,179 |
Family Income by Number of Earners in Lindisfarne
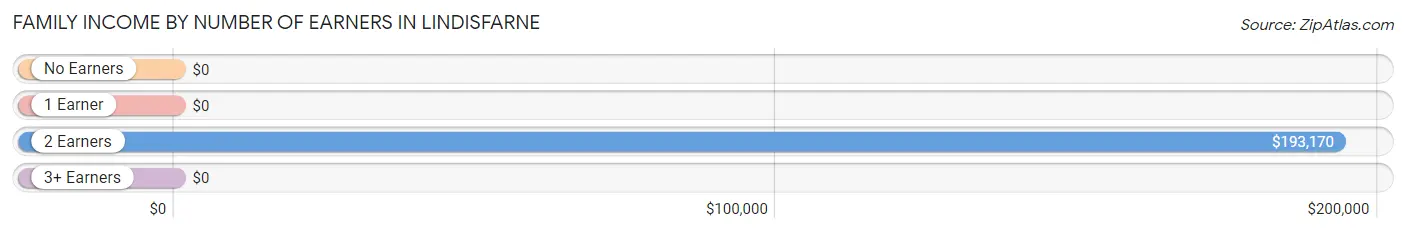
| Number of Earners | # Families | Median Income |
| No Earners | 23 (12.2%) | $0 |
| 1 Earner | 32 (16.9%) | $0 |
| 2 Earners | 101 (53.4%) | $193,170 |
| 3+ Earners | 33 (17.5%) | $0 |
| Total | 189 (100.0%) | $183,179 |
Household Income in Lindisfarne
Household Income Brackets in Lindisfarne
With 104 households falling in the category, the $150,000 to $199,999 income range is the most frequent in Lindisfarne, accounting for 47.5% of all households.
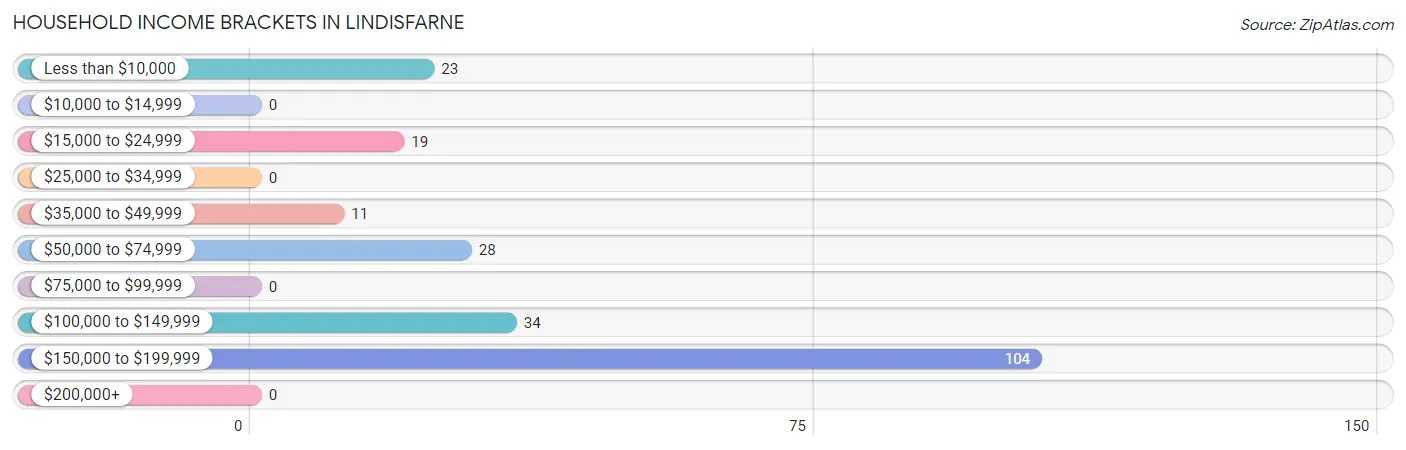
| Income Bracket | # Households | % Households |
| Less than $10,000 | 23 | 10.5% |
| $10,000 to $14,999 | 0 | 0.0% |
| $15,000 to $24,999 | 19 | 8.7% |
| $25,000 to $34,999 | 0 | 0.0% |
| $35,000 to $49,999 | 11 | 5.0% |
| $50,000 to $74,999 | 28 | 12.8% |
| $75,000 to $99,999 | 0 | 0.0% |
| $100,000 to $149,999 | 34 | 15.5% |
| $150,000 to $199,999 | 104 | 47.5% |
| $200,000+ | 0 | 0.0% |
Household Income by Householder Age in Lindisfarne
The median household income in Lindisfarne is $136,691, with the highest median household income of $192,917 found in the 45 to 64 years age bracket for the primary householder. A total of 115 households (52.5%) fall into this category.
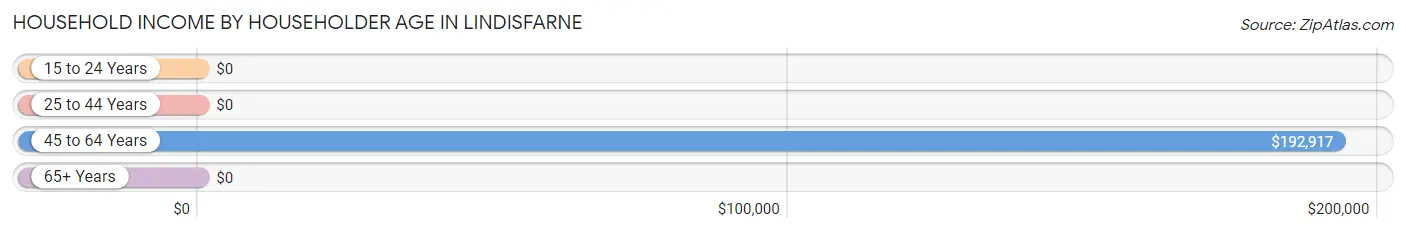
| Income Bracket | # Households | Median Income |
| 15 to 24 Years | 0 (0.0%) | $0 |
| 25 to 44 Years | 16 (7.3%) | $0 |
| 45 to 64 Years | 115 (52.5%) | $192,917 |
| 65+ Years | 88 (40.2%) | $0 |
| Total | 219 (100.0%) | $136,691 |
Poverty in Lindisfarne
Income Below Poverty by Sex and Age in Lindisfarne
With 15.8% poverty level for males and 7.4% for females among the residents of Lindisfarne, 75 year old and over males and 75 year old and over females are the most vulnerable to poverty, with 23 males (100.0%) and 17 females (60.7%) in their respective age groups living below the poverty level.
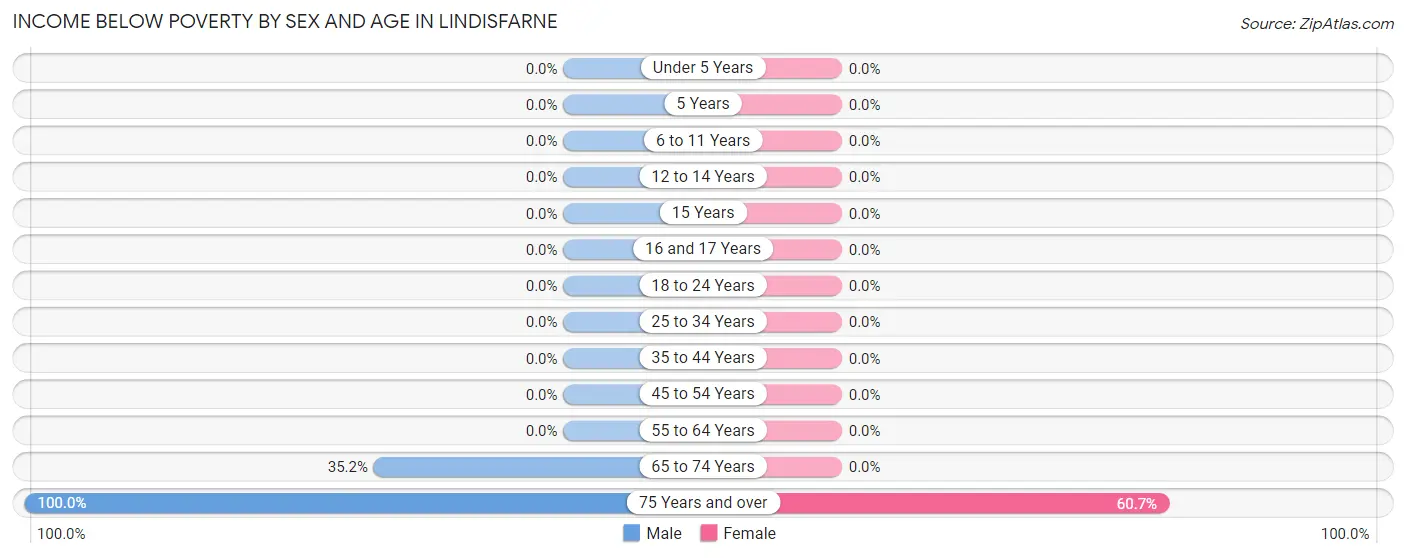
| Age Bracket | Male | Female |
| Under 5 Years | 0 (0.0%) | 0 (0.0%) |
| 5 Years | 0 (0.0%) | 0 (0.0%) |
| 6 to 11 Years | 0 (0.0%) | 0 (0.0%) |
| 12 to 14 Years | 0 (0.0%) | 0 (0.0%) |
| 15 Years | 0 (0.0%) | 0 (0.0%) |
| 16 and 17 Years | 0 (0.0%) | 0 (0.0%) |
| 18 to 24 Years | 0 (0.0%) | 0 (0.0%) |
| 25 to 34 Years | 0 (0.0%) | 0 (0.0%) |
| 35 to 44 Years | 0 (0.0%) | 0 (0.0%) |
| 45 to 54 Years | 0 (0.0%) | 0 (0.0%) |
| 55 to 64 Years | 0 (0.0%) | 0 (0.0%) |
| 65 to 74 Years | 19 (35.2%) | 0 (0.0%) |
| 75 Years and over | 23 (100.0%) | 17 (60.7%) |
| Total | 42 (15.8%) | 17 (7.4%) |
Income Above Poverty by Sex and Age in Lindisfarne
According to the poverty statistics in Lindisfarne, males aged 16 and 17 years and females aged 35 to 44 years are the age groups that are most secure financially, with 100.0% of males and 100.0% of females in these age groups living above the poverty line.
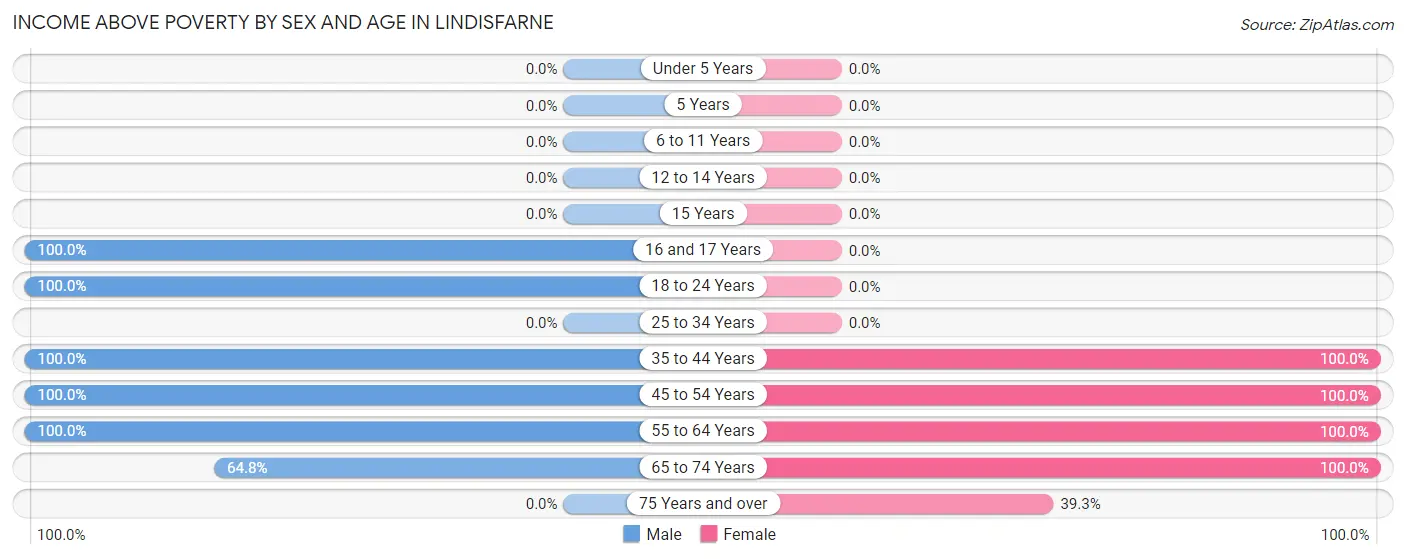
| Age Bracket | Male | Female |
| Under 5 Years | 0 (0.0%) | 0 (0.0%) |
| 5 Years | 0 (0.0%) | 0 (0.0%) |
| 6 to 11 Years | 0 (0.0%) | 0 (0.0%) |
| 12 to 14 Years | 0 (0.0%) | 0 (0.0%) |
| 15 Years | 0 (0.0%) | 0 (0.0%) |
| 16 and 17 Years | 21 (100.0%) | 0 (0.0%) |
| 18 to 24 Years | 17 (100.0%) | 0 (0.0%) |
| 25 to 34 Years | 0 (0.0%) | 0 (0.0%) |
| 35 to 44 Years | 16 (100.0%) | 19 (100.0%) |
| 45 to 54 Years | 66 (100.0%) | 55 (100.0%) |
| 55 to 64 Years | 69 (100.0%) | 32 (100.0%) |
| 65 to 74 Years | 35 (64.8%) | 95 (100.0%) |
| 75 Years and over | 0 (0.0%) | 11 (39.3%) |
| Total | 224 (84.2%) | 212 (92.6%) |
Income Below Poverty Among Married-Couple Families in Lindisfarne
The poverty statistics for married-couple families in Lindisfarne show that 13.6% or 23 of the total 169 families live below the poverty line. Families with no children have the highest poverty rate of 14.6%, comprising of 23 families. On the other hand, families with 1 or 2 children have the lowest poverty rate of 0.0%, which includes 0 families.
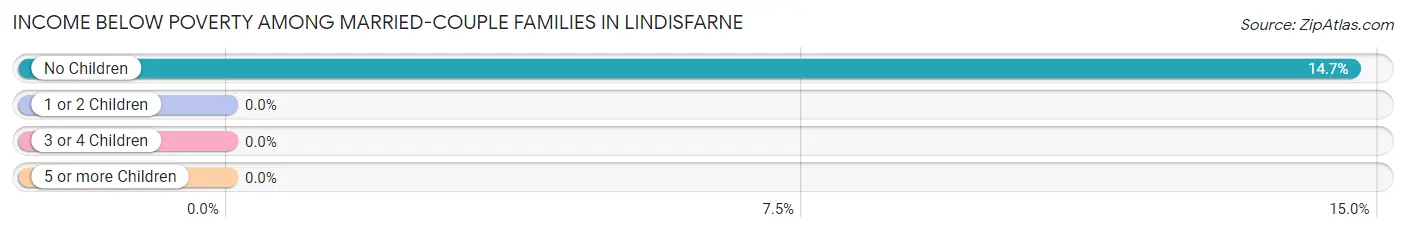
| Children | Above Poverty | Below Poverty |
| No Children | 134 (85.4%) | 23 (14.6%) |
| 1 or 2 Children | 12 (100.0%) | 0 (0.0%) |
| 3 or 4 Children | 0 (0.0%) | 0 (0.0%) |
| 5 or more Children | 0 (0.0%) | 0 (0.0%) |
| Total | 146 (86.4%) | 23 (13.6%) |
Income Below Poverty Among Single-Parent Households in Lindisfarne
| Children | Single Father | Single Mother |
| No Children | 0 (0.0%) | 0 (0.0%) |
| 1 or 2 Children | 0 (0.0%) | 0 (0.0%) |
| 3 or 4 Children | 0 (0.0%) | 0 (0.0%) |
| 5 or more Children | 0 (0.0%) | 0 (0.0%) |
| Total | 0 (0.0%) | 0 (0.0%) |
Income Below Poverty Among Married-Couple vs Single-Parent Households in Lindisfarne
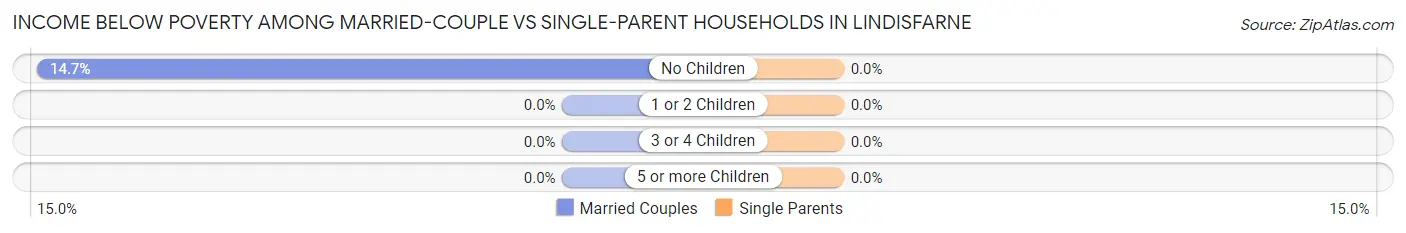
| Children | Married-Couple Families | Single-Parent Households |
| No Children | 23 (14.6%) | 0 (0.0%) |
| 1 or 2 Children | 0 (0.0%) | 0 (0.0%) |
| 3 or 4 Children | 0 (0.0%) | 0 (0.0%) |
| 5 or more Children | 0 (0.0%) | 0 (0.0%) |
| Total | 23 (13.6%) | 0 (0.0%) |
Race in Lindisfarne
The most populous races in Lindisfarne are White / Caucasian (481 | 97.2%), and Two or more Races (14 | 2.8%).
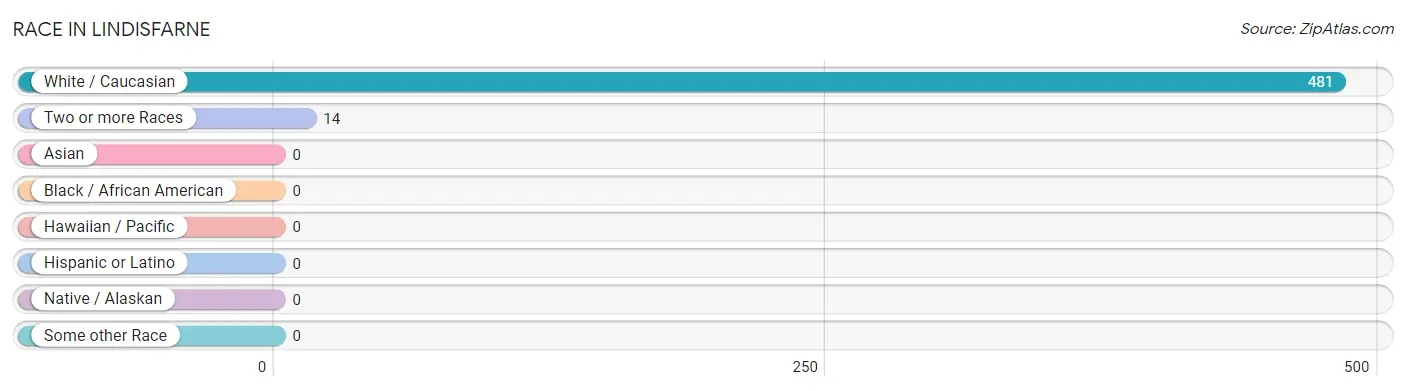
| Race | # Population | % Population |
| Asian | 0 | 0.0% |
| Black / African American | 0 | 0.0% |
| Hawaiian / Pacific | 0 | 0.0% |
| Hispanic or Latino | 0 | 0.0% |
| Native / Alaskan | 0 | 0.0% |
| White / Caucasian | 481 | 97.2% |
| Two or more Races | 14 | 2.8% |
| Some other Race | 0 | 0.0% |
| Total | 495 | 100.0% |
Ancestry in Lindisfarne
The most populous ancestries reported in Lindisfarne are English (124 | 25.1%), German (77 | 15.6%), Danish (69 | 13.9%), French (37 | 7.5%), and American (30 | 6.1%), together accounting for 68.1% of all Lindisfarne residents.
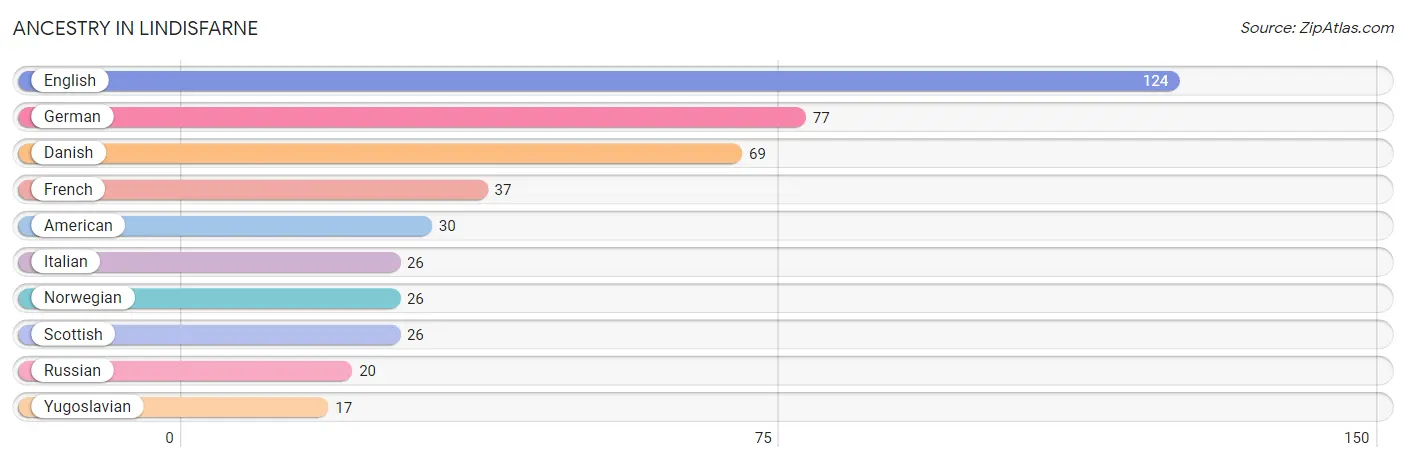
| Ancestry | # Population | % Population |
| American | 30 | 6.1% |
| Danish | 69 | 13.9% |
| English | 124 | 25.1% |
| French | 37 | 7.5% |
| German | 77 | 15.6% |
| Italian | 26 | 5.2% |
| Norwegian | 26 | 5.2% |
| Russian | 20 | 4.0% |
| Scottish | 26 | 5.2% |
| Yugoslavian | 17 | 3.4% | View All 10 Rows |
Immigrants in Lindisfarne

| Immigration Origin | # Population | % Population | View All 0 Rows |
Sex and Age in Lindisfarne
Sex and Age in Lindisfarne
The most populous age groups in Lindisfarne are 60 to 64 Years (69 | 25.9%) for men and 65 to 69 Years (56 | 24.4%) for women.
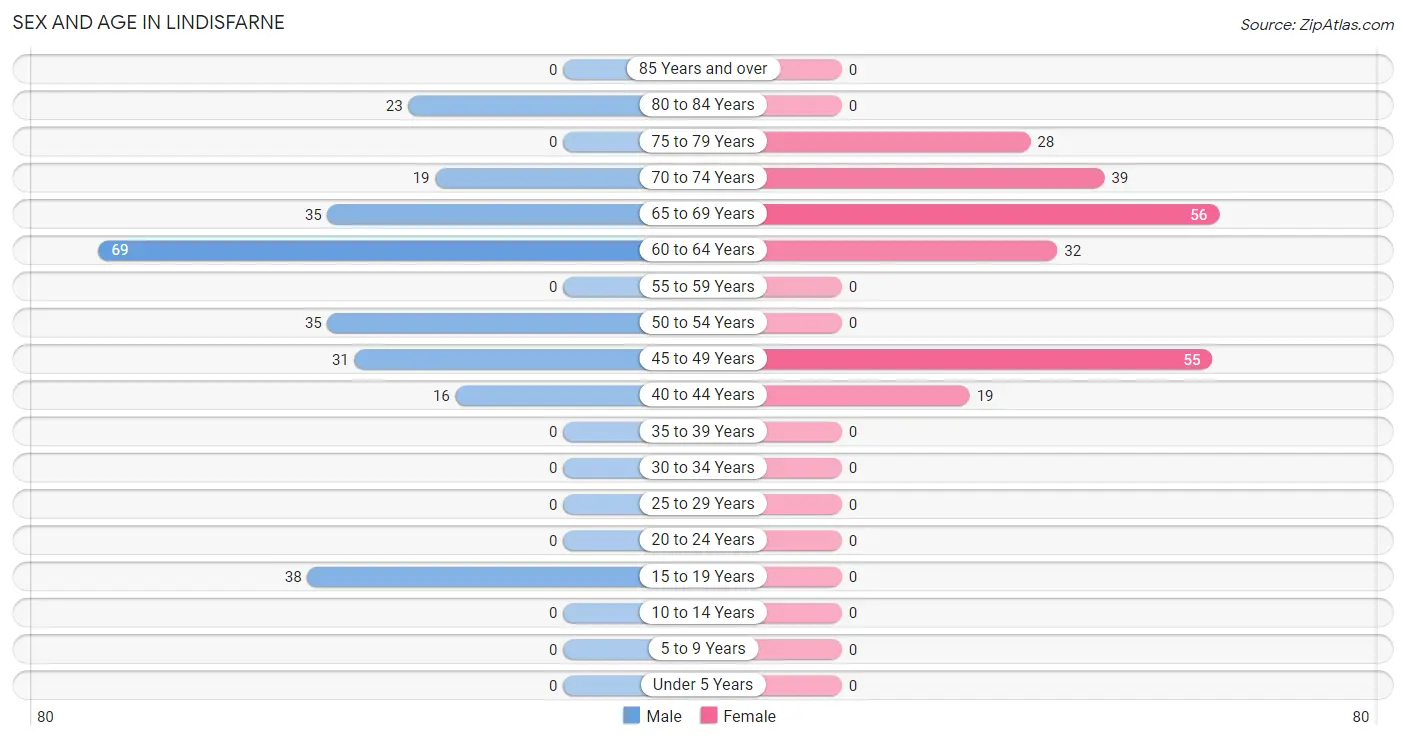
| Age Bracket | Male | Female |
| Under 5 Years | 0 (0.0%) | 0 (0.0%) |
| 5 to 9 Years | 0 (0.0%) | 0 (0.0%) |
| 10 to 14 Years | 0 (0.0%) | 0 (0.0%) |
| 15 to 19 Years | 38 (14.3%) | 0 (0.0%) |
| 20 to 24 Years | 0 (0.0%) | 0 (0.0%) |
| 25 to 29 Years | 0 (0.0%) | 0 (0.0%) |
| 30 to 34 Years | 0 (0.0%) | 0 (0.0%) |
| 35 to 39 Years | 0 (0.0%) | 0 (0.0%) |
| 40 to 44 Years | 16 (6.0%) | 19 (8.3%) |
| 45 to 49 Years | 31 (11.7%) | 55 (24.0%) |
| 50 to 54 Years | 35 (13.2%) | 0 (0.0%) |
| 55 to 59 Years | 0 (0.0%) | 0 (0.0%) |
| 60 to 64 Years | 69 (25.9%) | 32 (14.0%) |
| 65 to 69 Years | 35 (13.2%) | 56 (24.4%) |
| 70 to 74 Years | 19 (7.1%) | 39 (17.0%) |
| 75 to 79 Years | 0 (0.0%) | 28 (12.2%) |
| 80 to 84 Years | 23 (8.6%) | 0 (0.0%) |
| 85 Years and over | 0 (0.0%) | 0 (0.0%) |
| Total | 266 (100.0%) | 229 (100.0%) |
Families and Households in Lindisfarne
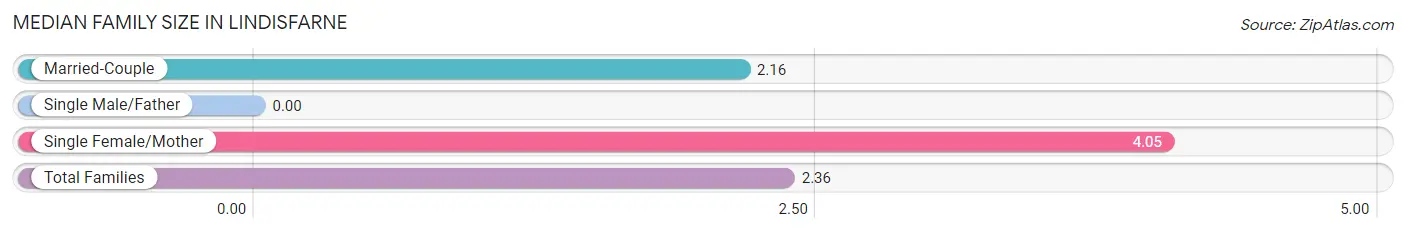
Median Family Size in Lindisfarne
| Family Type | # Families | Family Size |
| Married-Couple | 169 (89.4%) | 2.16 |
| Single Male/Father | 0 (0.0%) | - |
| Single Female/Mother | 20 (10.6%) | 4.05 |
| Total Families | 189 (100.0%) | 2.36 |
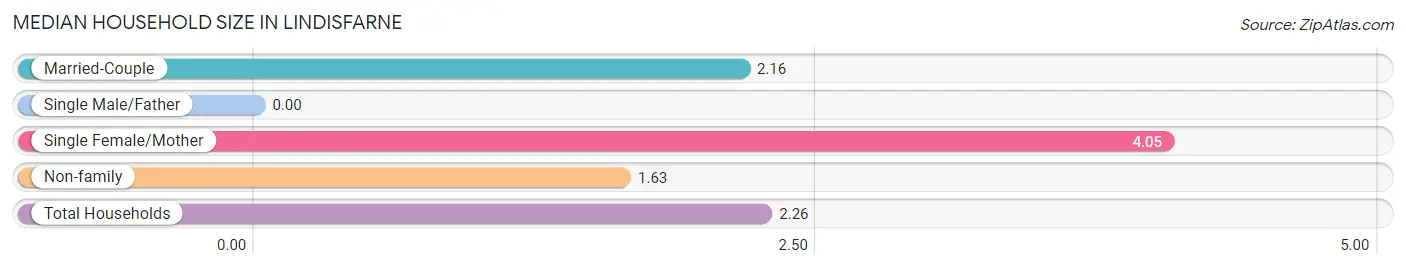
Median Household Size in Lindisfarne
| Household Type | # Households | Household Size |
| Married-Couple | 169 (77.2%) | 2.16 |
| Single Male/Father | 0 (0.0%) | - |
| Single Female/Mother | 20 (9.1%) | 4.05 |
| Non-family | 30 (13.7%) | 1.63 |
| Total Households | 219 (100.0%) | 2.26 |
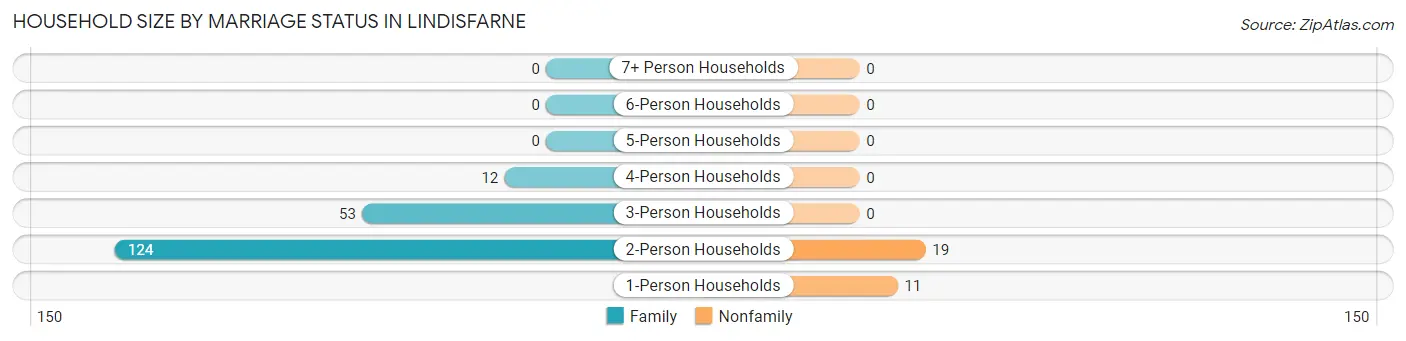
Household Size by Marriage Status in Lindisfarne
Out of a total of 219 households in Lindisfarne, 189 (86.3%) are family households, while 30 (13.7%) are nonfamily households. The most numerous type of family households are 2-person households, comprising 124, and the most common type of nonfamily households are 2-person households, comprising 19.
| Household Size | Family Households | Nonfamily Households |
| 1-Person Households | - | 11 (5.0%) |
| 2-Person Households | 124 (56.6%) | 19 (8.7%) |
| 3-Person Households | 53 (24.2%) | 0 (0.0%) |
| 4-Person Households | 12 (5.5%) | 0 (0.0%) |
| 5-Person Households | 0 (0.0%) | 0 (0.0%) |
| 6-Person Households | 0 (0.0%) | 0 (0.0%) |
| 7+ Person Households | 0 (0.0%) | 0 (0.0%) |
| Total | 189 (86.3%) | 30 (13.7%) |
Female Fertility in Lindisfarne
Fertility by Age in Lindisfarne
| Age Bracket | Women with Births | Births / 1,000 Women |
| 15 to 19 years | 0 (0.0%) | 0.0 |
| 20 to 34 years | 0 (0.0%) | 0.0 |
| 35 to 50 years | 0 (0.0%) | 0.0 |
| Total | 0 (0.0%) | 0.0 |
Fertility by Age by Marriage Status in Lindisfarne
| Age Bracket | Married | Unmarried |
| 15 to 19 years | 0 (0.0%) | 0 (0.0%) |
| 20 to 34 years | 0 (0.0%) | 0 (0.0%) |
| 35 to 50 years | 0 (0.0%) | 0 (0.0%) |
| Total | 0 (0.0%) | 0 (0.0%) |
Fertility by Education in Lindisfarne
| Educational Attainment | Women with Births | Births / 1,000 Women |
| Less than High School | 0 (0.0%) | 0.0 |
| High School Diploma | 0 (0.0%) | 0.0 |
| College or Associate's Degree | 0 (0.0%) | 0.0 |
| Bachelor's Degree | 0 (0.0%) | 0.0 |
| Graduate Degree | 0 (0.0%) | 0.0 |
| Total | 0 (0.0%) | 0.0 |
Fertility by Education by Marriage Status in Lindisfarne
| Educational Attainment | Married | Unmarried |
| Less than High School | 0 (0.0%) | 0 (0.0%) |
| High School Diploma | 0 (0.0%) | 0 (0.0%) |
| College or Associate's Degree | 0 (0.0%) | 0 (0.0%) |
| Bachelor's Degree | 0 (0.0%) | 0 (0.0%) |
| Graduate Degree | 0 (0.0%) | 0 (0.0%) |
| Total | 0 (0.0%) | 0 (0.0%) |
Employment Characteristics in Lindisfarne
Employment by Class of Employer in Lindisfarne
Among the 284 employed individuals in Lindisfarne, private company employees (152 | 53.5%), state government employees (69 | 24.3%), and local government employees (32 | 11.3%) make up the most common classes of employment.
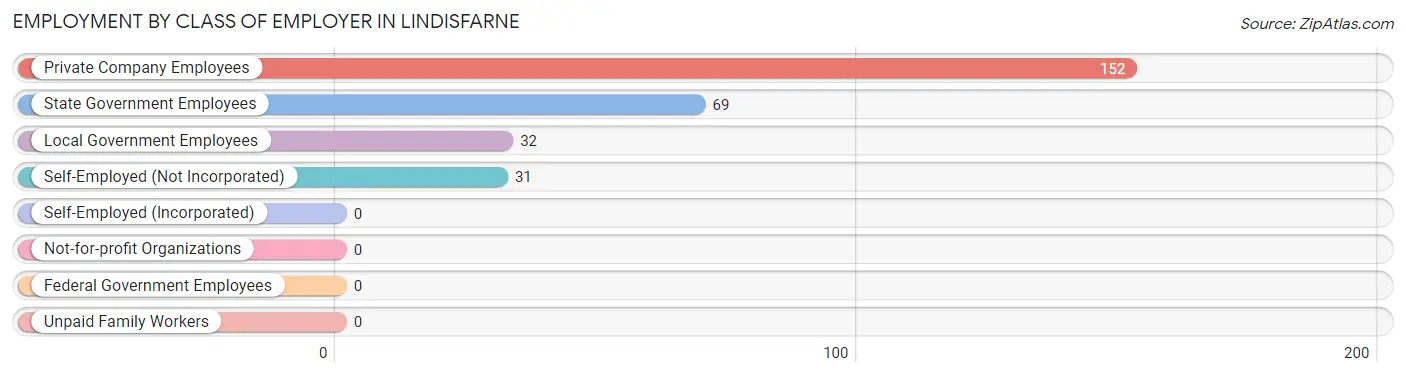
| Employer Class | # Employees | % Employees |
| Private Company Employees | 152 | 53.5% |
| Self-Employed (Incorporated) | 0 | 0.0% |
| Self-Employed (Not Incorporated) | 31 | 10.9% |
| Not-for-profit Organizations | 0 | 0.0% |
| Local Government Employees | 32 | 11.3% |
| State Government Employees | 69 | 24.3% |
| Federal Government Employees | 0 | 0.0% |
| Unpaid Family Workers | 0 | 0.0% |
| Total | 284 | 100.0% |
Employment Status by Age in Lindisfarne
According to the labor force statistics for Lindisfarne, out of the total population over 16 years of age (495), 60.6% or 300 individuals are in the labor force, with 5.3% or 16 of them unemployed. The age group with the highest labor force participation rate is 35 to 44 years, with 100.0% or 35 individuals in the labor force. Within the labor force, the 35 to 44 years age range has the highest percentage of unemployed individuals, with 45.7% or 16 of them being unemployed.
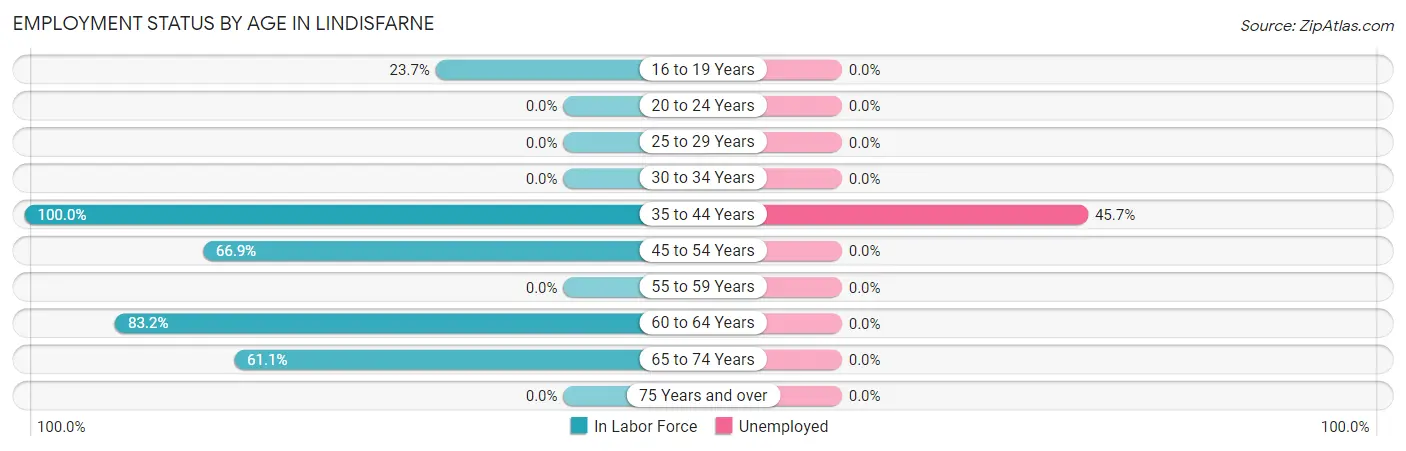
| Age Bracket | In Labor Force | Unemployed |
| 16 to 19 Years | 9 (23.7%) | 0 (0.0%) |
| 20 to 24 Years | 0 (0.0%) | 0 (0.0%) |
| 25 to 29 Years | 0 (0.0%) | 0 (0.0%) |
| 30 to 34 Years | 0 (0.0%) | 0 (0.0%) |
| 35 to 44 Years | 35 (100.0%) | 16 (45.7%) |
| 45 to 54 Years | 81 (66.9%) | 0 (0.0%) |
| 55 to 59 Years | 0 (0.0%) | 0 (0.0%) |
| 60 to 64 Years | 84 (83.2%) | 0 (0.0%) |
| 65 to 74 Years | 91 (61.1%) | 0 (0.0%) |
| 75 Years and over | 0 (0.0%) | 0 (0.0%) |
| Total | 300 (60.6%) | 16 (5.3%) |
Employment Status by Educational Attainment in Lindisfarne
According to labor force statistics for Lindisfarne, 77.8% of individuals (200) out of the total population between 25 and 64 years of age (257) are in the labor force, with 8.0% or 16 of them being unemployed. The group with the highest labor force participation rate are those with the educational attainment of high school diploma, with 100.0% or 19 individuals in the labor force. Within the labor force, individuals with college / associate degree education have the highest percentage of unemployment, with 24.6% or 16 of them being unemployed.
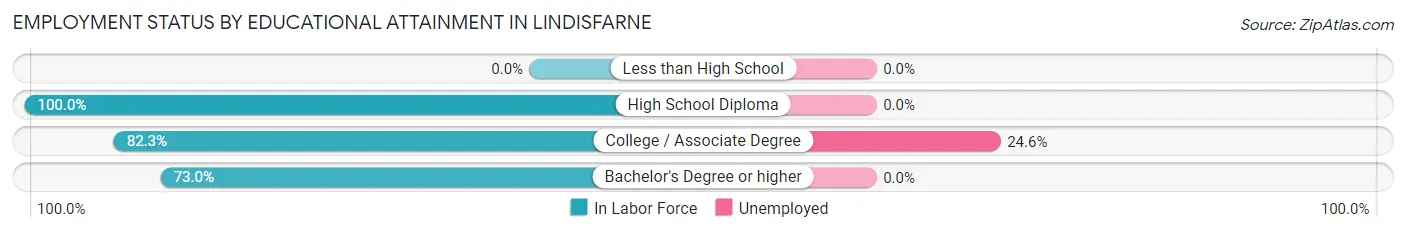
| Educational Attainment | In Labor Force | Unemployed |
| Less than High School | 0 (0.0%) | 0 (0.0%) |
| High School Diploma | 19 (100.0%) | 0 (0.0%) |
| College / Associate Degree | 65 (82.3%) | 19 (24.6%) |
| Bachelor's Degree or higher | 116 (73.0%) | 0 (0.0%) |
| Total | 200 (77.8%) | 21 (8.0%) |
Employment Occupations by Sex in Lindisfarne
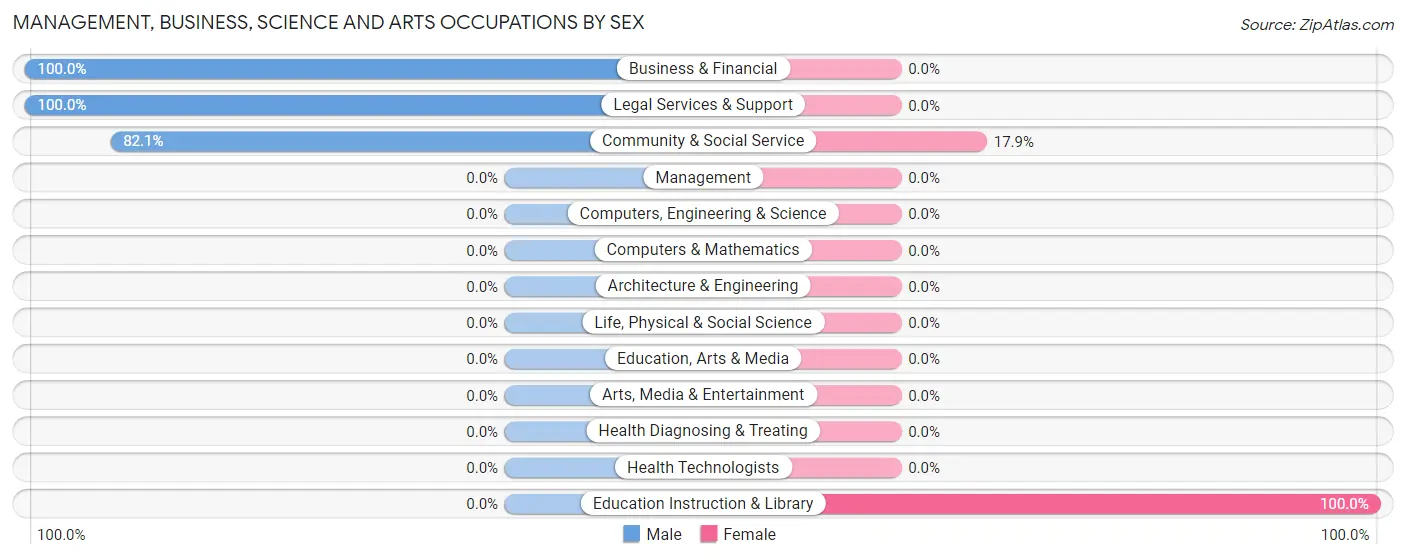
Management, Business, Science and Arts Occupations
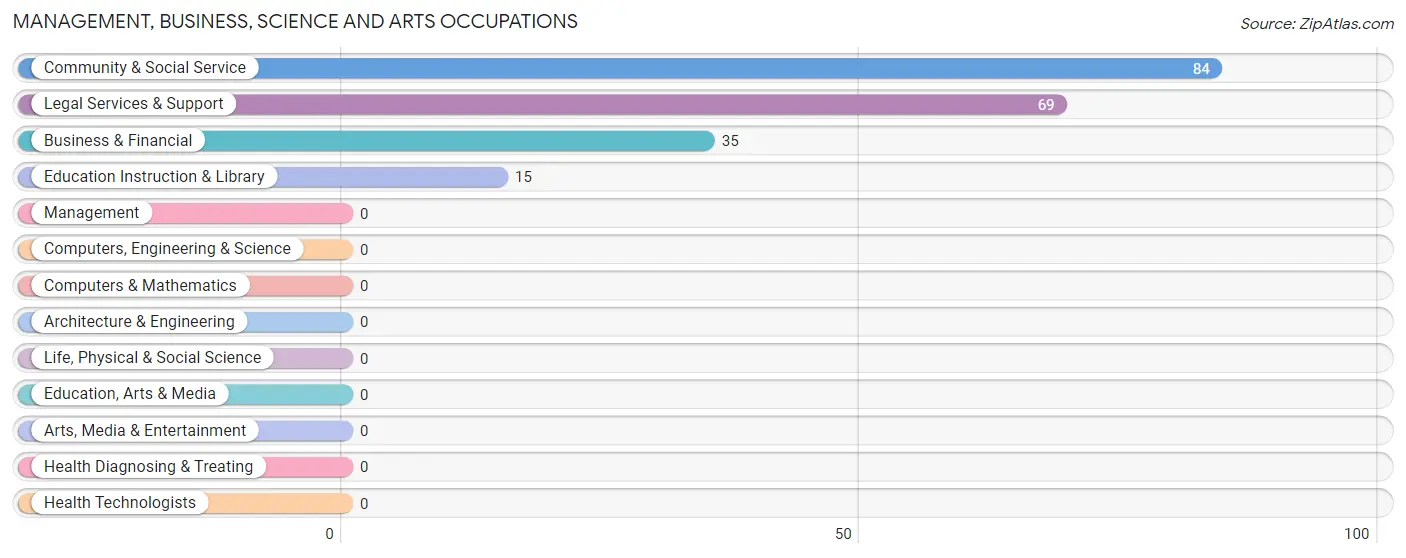
The most common Management, Business, Science and Arts occupations in Lindisfarne are Community & Social Service (84 | 29.6%), Legal Services & Support (69 | 24.3%), Business & Financial (35 | 12.3%), and Education Instruction & Library (15 | 5.3%).
Management, Business, Science and Arts Occupations by Sex
Within the Management, Business, Science and Arts occupations in Lindisfarne, the most male-oriented occupations are Business & Financial (100.0%), Legal Services & Support (100.0%), and Community & Social Service (82.1%), while the most female-oriented occupations are Education Instruction & Library (100.0%), and Community & Social Service (17.9%).
| Occupation | Male | Female |
| Management | 0 (0.0%) | 0 (0.0%) |
| Business & Financial | 35 (100.0%) | 0 (0.0%) |
| Computers, Engineering & Science | 0 (0.0%) | 0 (0.0%) |
| Computers & Mathematics | 0 (0.0%) | 0 (0.0%) |
| Architecture & Engineering | 0 (0.0%) | 0 (0.0%) |
| Life, Physical & Social Science | 0 (0.0%) | 0 (0.0%) |
| Community & Social Service | 69 (82.1%) | 15 (17.9%) |
| Education, Arts & Media | 0 (0.0%) | 0 (0.0%) |
| Legal Services & Support | 69 (100.0%) | 0 (0.0%) |
| Education Instruction & Library | 0 (0.0%) | 15 (100.0%) |
| Arts, Media & Entertainment | 0 (0.0%) | 0 (0.0%) |
| Health Diagnosing & Treating | 0 (0.0%) | 0 (0.0%) |
| Health Technologists | 0 (0.0%) | 0 (0.0%) |
| Total (Category) | 104 (87.4%) | 15 (12.6%) |
| Total (Overall) | 165 (58.1%) | 119 (41.9%) |
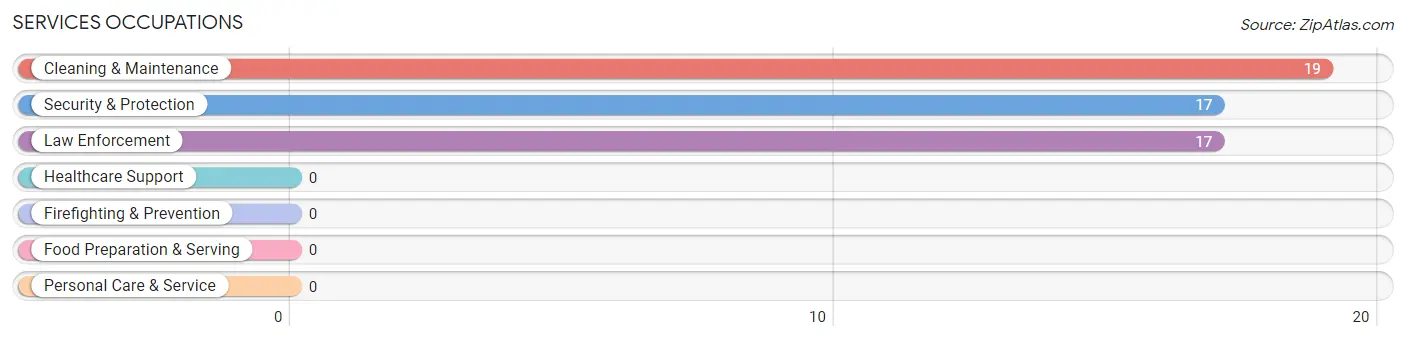
Services Occupations
The most common Services occupations in Lindisfarne are Cleaning & Maintenance (19 | 6.7%), Security & Protection (17 | 6.0%), and Law Enforcement (17 | 6.0%).
Services Occupations by Sex
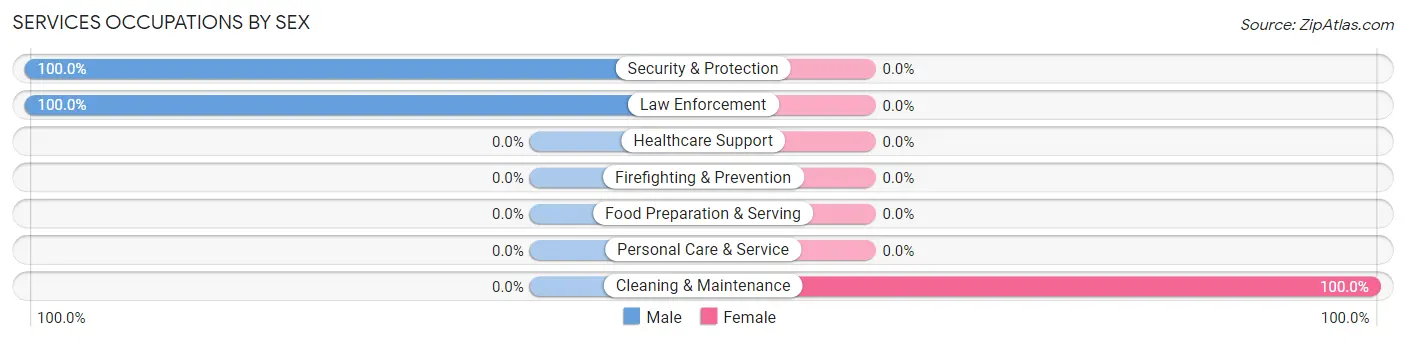
| Occupation | Male | Female |
| Healthcare Support | 0 (0.0%) | 0 (0.0%) |
| Security & Protection | 17 (100.0%) | 0 (0.0%) |
| Firefighting & Prevention | 0 (0.0%) | 0 (0.0%) |
| Law Enforcement | 17 (100.0%) | 0 (0.0%) |
| Food Preparation & Serving | 0 (0.0%) | 0 (0.0%) |
| Cleaning & Maintenance | 0 (0.0%) | 19 (100.0%) |
| Personal Care & Service | 0 (0.0%) | 0 (0.0%) |
| Total (Category) | 17 (47.2%) | 19 (52.8%) |
| Total (Overall) | 165 (58.1%) | 119 (41.9%) |
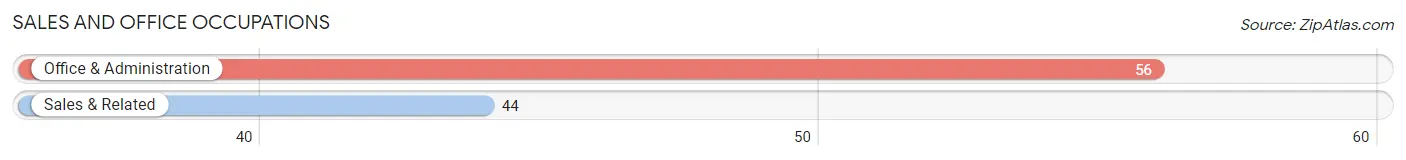
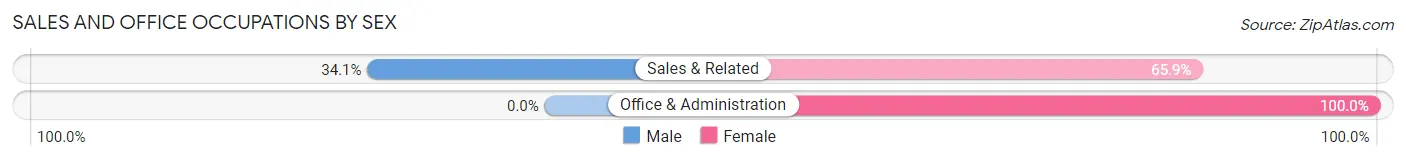
Sales and Office Occupations
The most common Sales and Office occupations in Lindisfarne are Office & Administration (56 | 19.7%), and Sales & Related (44 | 15.5%).
Sales and Office Occupations by Sex
| Occupation | Male | Female |
| Sales & Related | 15 (34.1%) | 29 (65.9%) |
| Office & Administration | 0 (0.0%) | 56 (100.0%) |
| Total (Category) | 15 (15.0%) | 85 (85.0%) |
| Total (Overall) | 165 (58.1%) | 119 (41.9%) |
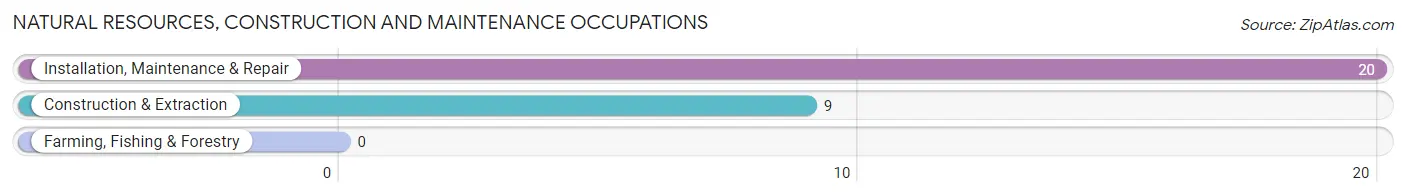
Natural Resources, Construction and Maintenance Occupations
The most common Natural Resources, Construction and Maintenance occupations in Lindisfarne are Installation, Maintenance & Repair (20 | 7.0%), and Construction & Extraction (9 | 3.2%).
Natural Resources, Construction and Maintenance Occupations by Sex
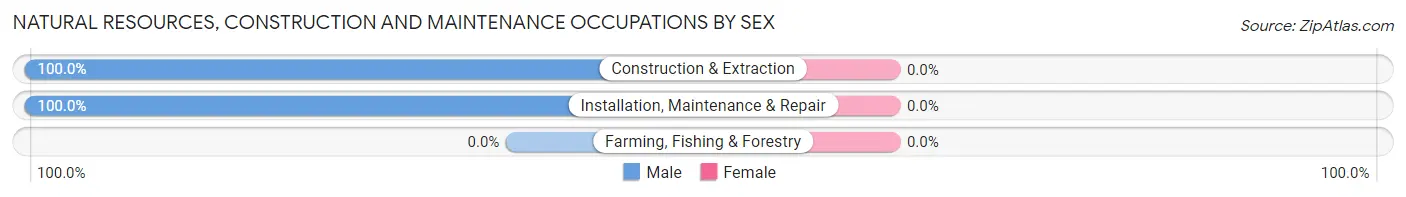
| Occupation | Male | Female |
| Farming, Fishing & Forestry | 0 (0.0%) | 0 (0.0%) |
| Construction & Extraction | 9 (100.0%) | 0 (0.0%) |
| Installation, Maintenance & Repair | 20 (100.0%) | 0 (0.0%) |
| Total (Category) | 29 (100.0%) | 0 (0.0%) |
| Total (Overall) | 165 (58.1%) | 119 (41.9%) |
Production, Transportation and Moving Occupations
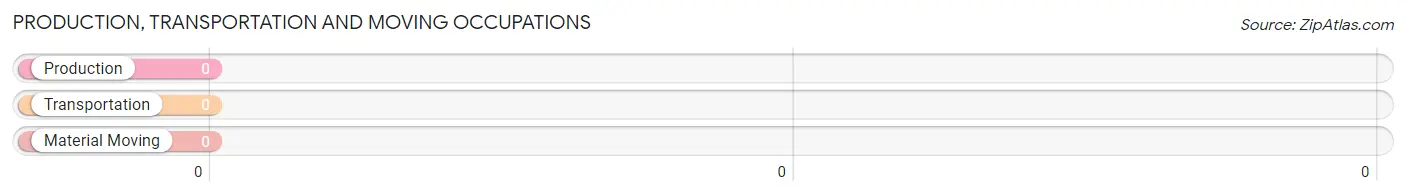
Production, Transportation and Moving Occupations by Sex
| Occupation | Male | Female |
| Production | 0 (0.0%) | 0 (0.0%) |
| Transportation | 0 (0.0%) | 0 (0.0%) |
| Material Moving | 0 (0.0%) | 0 (0.0%) |
| Total (Category) | 0 (0.0%) | 0 (0.0%) |
| Total (Overall) | 165 (58.1%) | 119 (41.9%) |
Employment Industries by Sex in Lindisfarne
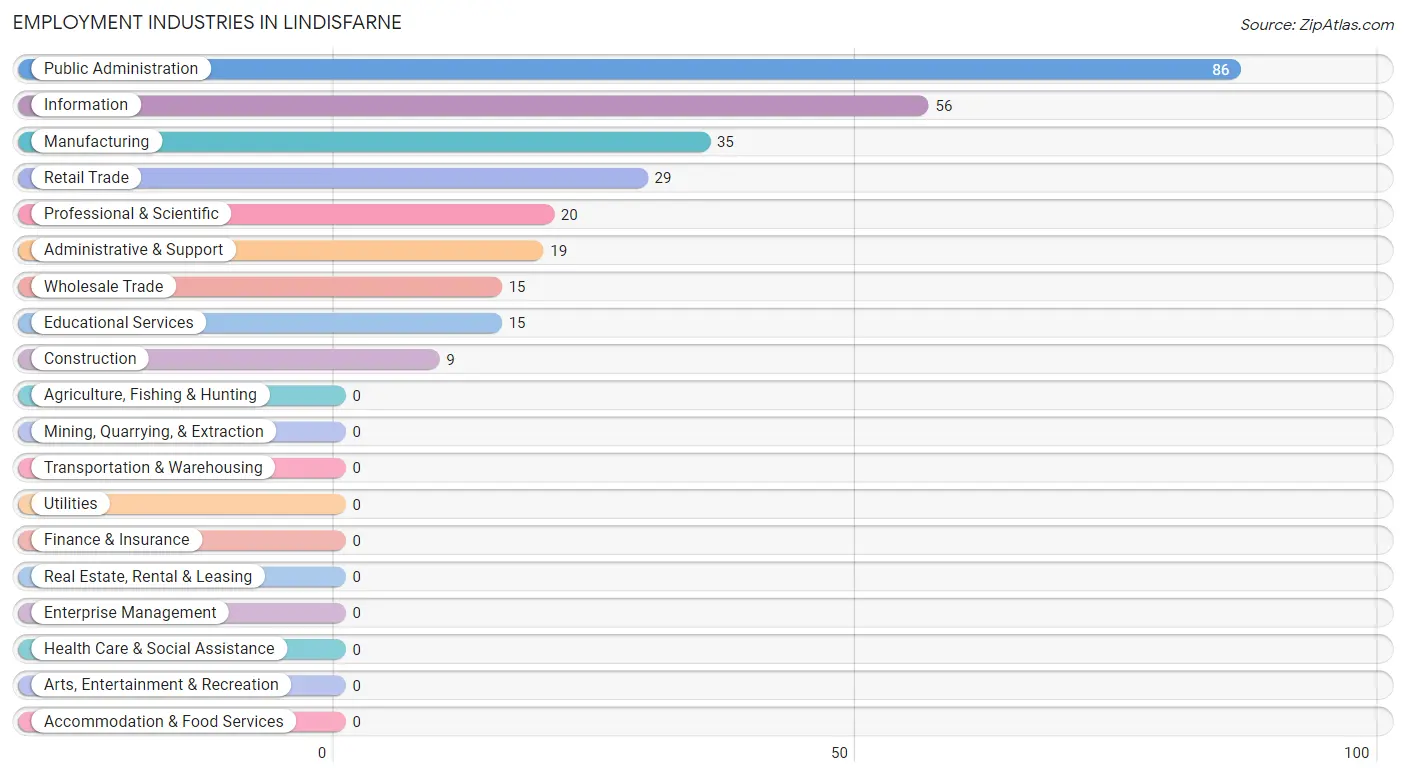
Employment Industries in Lindisfarne
The major employment industries in Lindisfarne include Public Administration (86 | 30.3%), Information (56 | 19.7%), Manufacturing (35 | 12.3%), Retail Trade (29 | 10.2%), and Professional & Scientific (20 | 7.0%).
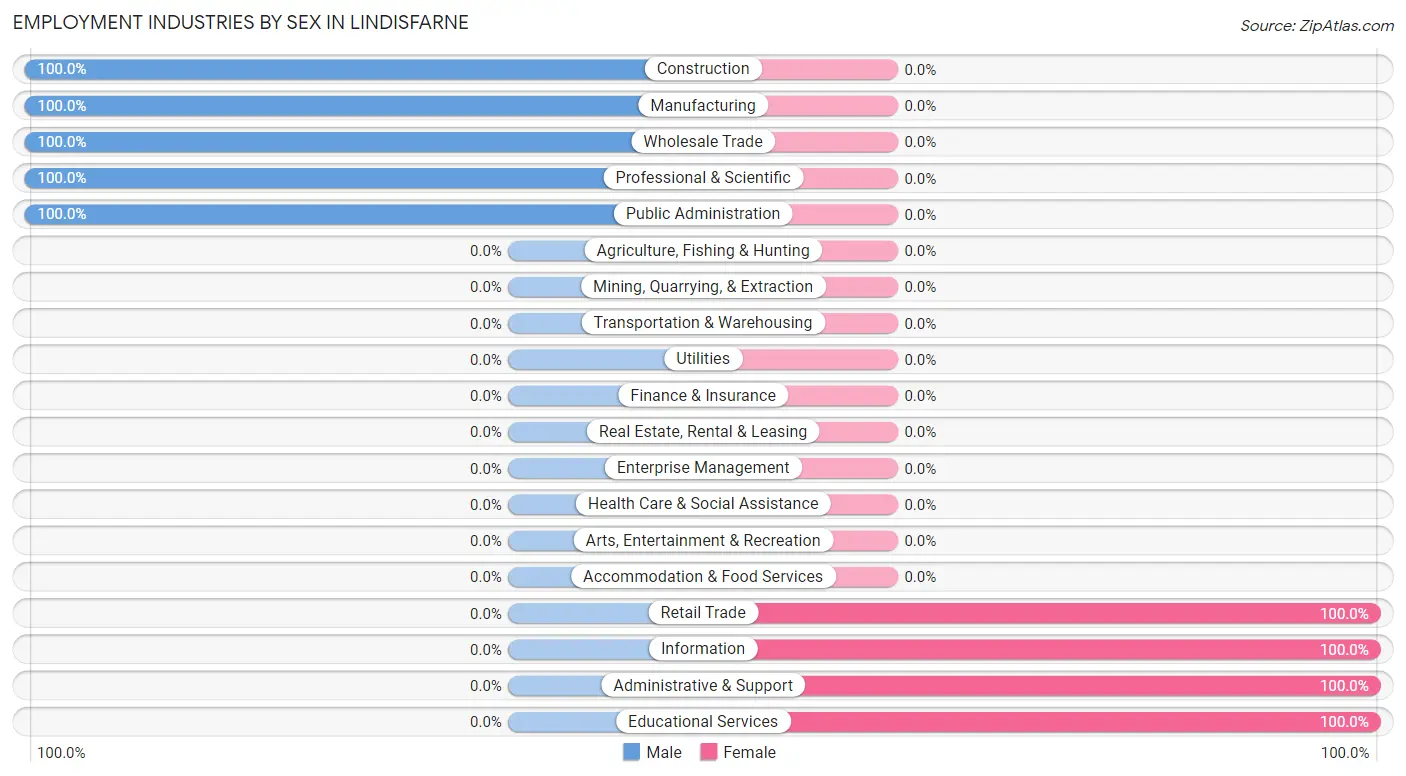
Employment Industries by Sex in Lindisfarne
The Lindisfarne industries that see more men than women are Construction (100.0%), Manufacturing (100.0%), and Wholesale Trade (100.0%), whereas the industries that tend to have a higher number of women are Retail Trade (100.0%), Information (100.0%), and Administrative & Support (100.0%).
| Industry | Male | Female |
| Agriculture, Fishing & Hunting | 0 (0.0%) | 0 (0.0%) |
| Mining, Quarrying, & Extraction | 0 (0.0%) | 0 (0.0%) |
| Construction | 9 (100.0%) | 0 (0.0%) |
| Manufacturing | 35 (100.0%) | 0 (0.0%) |
| Wholesale Trade | 15 (100.0%) | 0 (0.0%) |
| Retail Trade | 0 (0.0%) | 29 (100.0%) |
| Transportation & Warehousing | 0 (0.0%) | 0 (0.0%) |
| Utilities | 0 (0.0%) | 0 (0.0%) |
| Information | 0 (0.0%) | 56 (100.0%) |
| Finance & Insurance | 0 (0.0%) | 0 (0.0%) |
| Real Estate, Rental & Leasing | 0 (0.0%) | 0 (0.0%) |
| Professional & Scientific | 20 (100.0%) | 0 (0.0%) |
| Enterprise Management | 0 (0.0%) | 0 (0.0%) |
| Administrative & Support | 0 (0.0%) | 19 (100.0%) |
| Educational Services | 0 (0.0%) | 15 (100.0%) |
| Health Care & Social Assistance | 0 (0.0%) | 0 (0.0%) |
| Arts, Entertainment & Recreation | 0 (0.0%) | 0 (0.0%) |
| Accommodation & Food Services | 0 (0.0%) | 0 (0.0%) |
| Public Administration | 86 (100.0%) | 0 (0.0%) |
| Total | 165 (58.1%) | 119 (41.9%) |
Education in Lindisfarne
School Enrollment in Lindisfarne
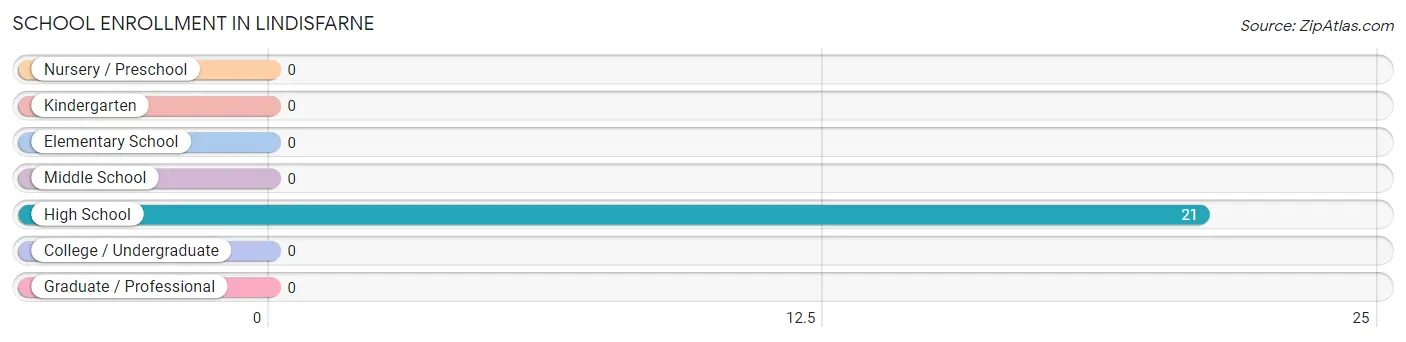
| School Level | # Students | % Students |
| Nursery / Preschool | 0 | 0.0% |
| Kindergarten | 0 | 0.0% |
| Elementary School | 0 | 0.0% |
| Middle School | 0 | 0.0% |
| High School | 21 | 100.0% |
| College / Undergraduate | 0 | 0.0% |
| Graduate / Professional | 0 | 0.0% |
| Total | 21 | 100.0% |
School Enrollment by Age by Funding Source in Lindisfarne
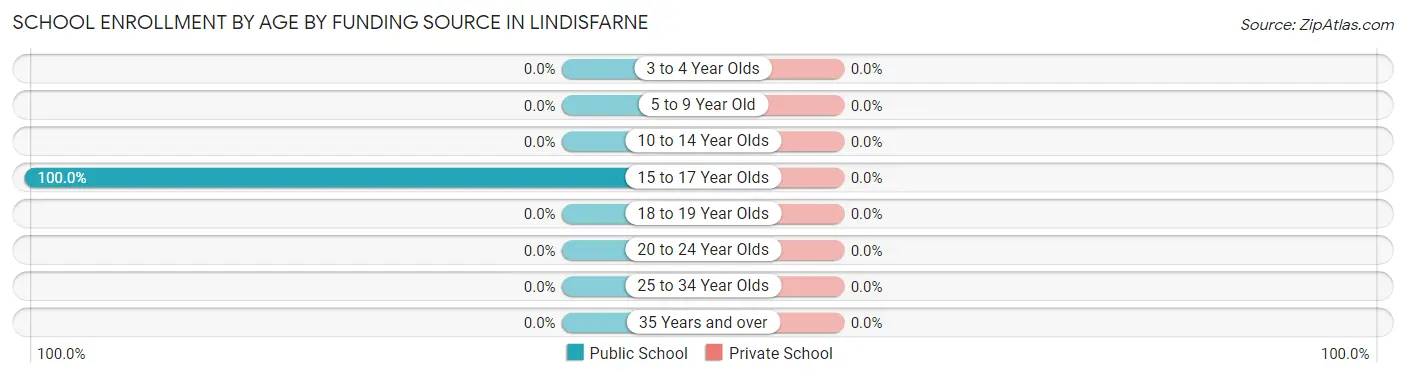
| Age Bracket | Public School | Private School |
| 3 to 4 Year Olds | 0 (0.0%) | 0 (0.0%) |
| 5 to 9 Year Old | 0 (0.0%) | 0 (0.0%) |
| 10 to 14 Year Olds | 0 (0.0%) | 0 (0.0%) |
| 15 to 17 Year Olds | 21 (100.0%) | 0 (0.0%) |
| 18 to 19 Year Olds | 0 (0.0%) | 0 (0.0%) |
| 20 to 24 Year Olds | 0 (0.0%) | 0 (0.0%) |
| 25 to 34 Year Olds | 0 (0.0%) | 0 (0.0%) |
| 35 Years and over | 0 (0.0%) | 0 (0.0%) |
| Total | 21 (100.0%) | 0 (0.0%) |
Educational Attainment by Field of Study in Lindisfarne
Business (104 | 48.8%), physical & health sciences (26 | 12.2%), communications (20 | 9.4%), engineering (19 | 8.9%), and education (17 | 8.0%) are the most common fields of study among 213 individuals in Lindisfarne who have obtained a bachelor's degree or higher.
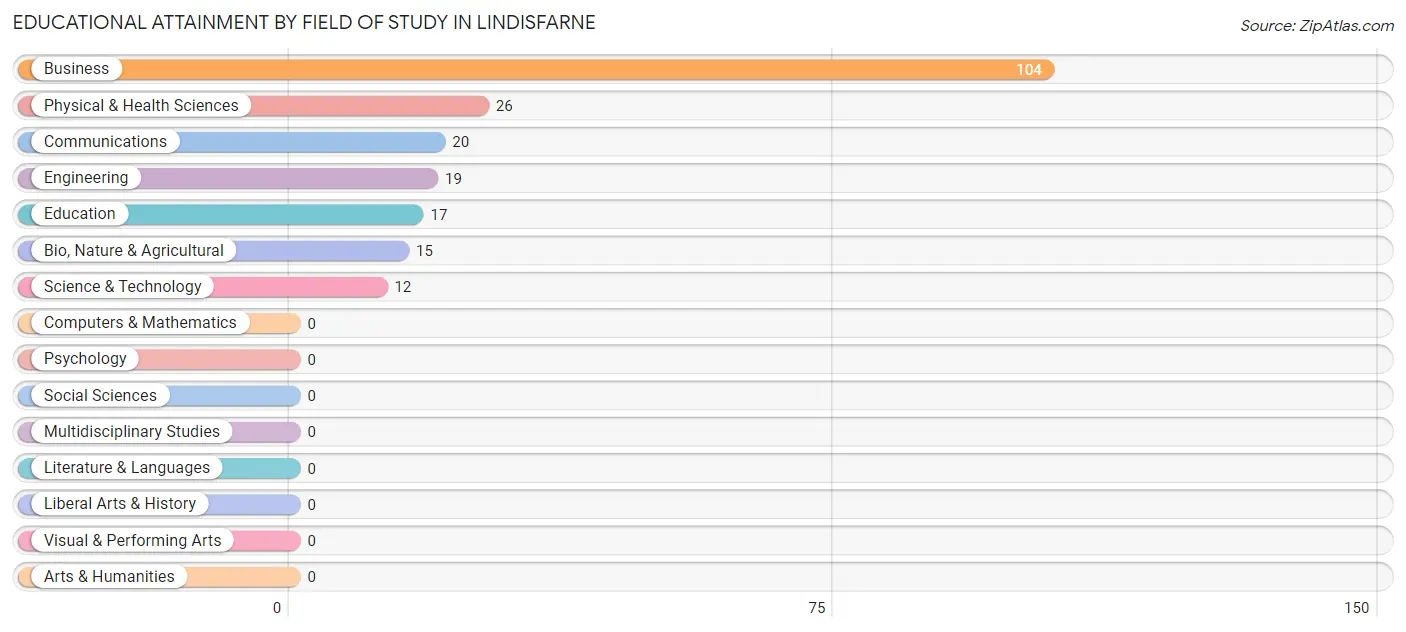
| Field of Study | # Graduates | % Graduates |
| Computers & Mathematics | 0 | 0.0% |
| Bio, Nature & Agricultural | 15 | 7.0% |
| Physical & Health Sciences | 26 | 12.2% |
| Psychology | 0 | 0.0% |
| Social Sciences | 0 | 0.0% |
| Engineering | 19 | 8.9% |
| Multidisciplinary Studies | 0 | 0.0% |
| Science & Technology | 12 | 5.6% |
| Business | 104 | 48.8% |
| Education | 17 | 8.0% |
| Literature & Languages | 0 | 0.0% |
| Liberal Arts & History | 0 | 0.0% |
| Visual & Performing Arts | 0 | 0.0% |
| Communications | 20 | 9.4% |
| Arts & Humanities | 0 | 0.0% |
| Total | 213 | 100.0% |
Transportation & Commute in Lindisfarne
Vehicle Availability by Sex in Lindisfarne
The most prevalent vehicle ownership categories in Lindisfarne are males with 3 vehicles (89, accounting for 53.9%) and females with 3 vehicles (56, making up 74.8%).
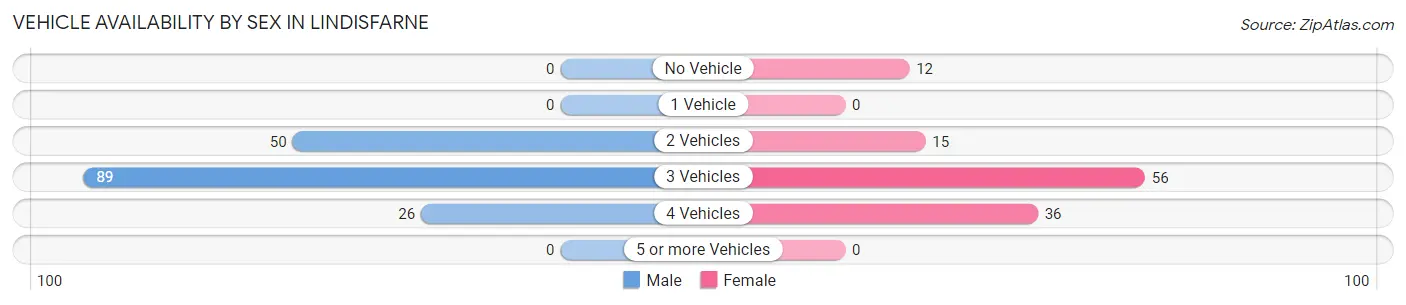
| Vehicles Available | Male | Female |
| No Vehicle | 0 (0.0%) | 12 (10.1%) |
| 1 Vehicle | 0 (0.0%) | 0 (0.0%) |
| 2 Vehicles | 50 (30.3%) | 15 (12.6%) |
| 3 Vehicles | 89 (53.9%) | 56 (47.1%) |
| 4 Vehicles | 26 (15.8%) | 36 (30.2%) |
| 5 or more Vehicles | 0 (0.0%) | 0 (0.0%) |
| Total | 165 (100.0%) | 119 (100.0%) |
Commute Time in Lindisfarne
The most frequently occuring commute durations in Lindisfarne are 10 to 14 minutes (81 commuters, 30.1%), 45 to 59 minutes (64 commuters, 23.8%), and 35 to 39 minutes (56 commuters, 20.8%).
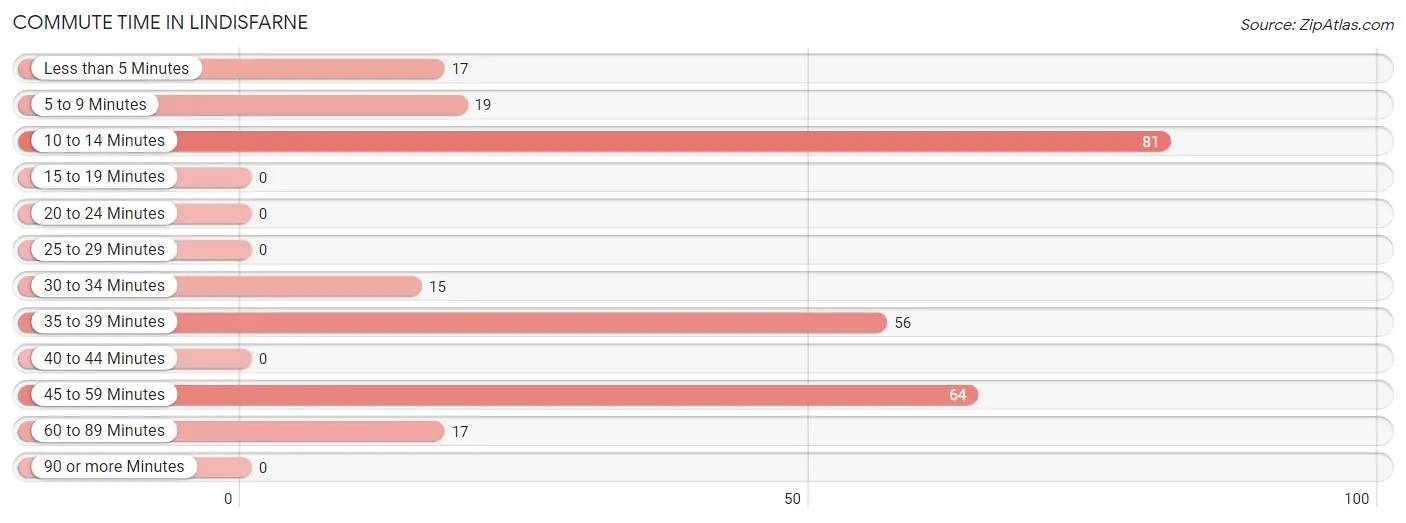
| Commute Time | # Commuters | % Commuters |
| Less than 5 Minutes | 17 | 6.3% |
| 5 to 9 Minutes | 19 | 7.1% |
| 10 to 14 Minutes | 81 | 30.1% |
| 15 to 19 Minutes | 0 | 0.0% |
| 20 to 24 Minutes | 0 | 0.0% |
| 25 to 29 Minutes | 0 | 0.0% |
| 30 to 34 Minutes | 15 | 5.6% |
| 35 to 39 Minutes | 56 | 20.8% |
| 40 to 44 Minutes | 0 | 0.0% |
| 45 to 59 Minutes | 64 | 23.8% |
| 60 to 89 Minutes | 17 | 6.3% |
| 90 or more Minutes | 0 | 0.0% |
Commute Time by Sex in Lindisfarne
The most common commute times in Lindisfarne are 10 to 14 minutes (69 commuters, 46.0%) for males and 35 to 39 minutes (56 commuters, 47.1%) for females.
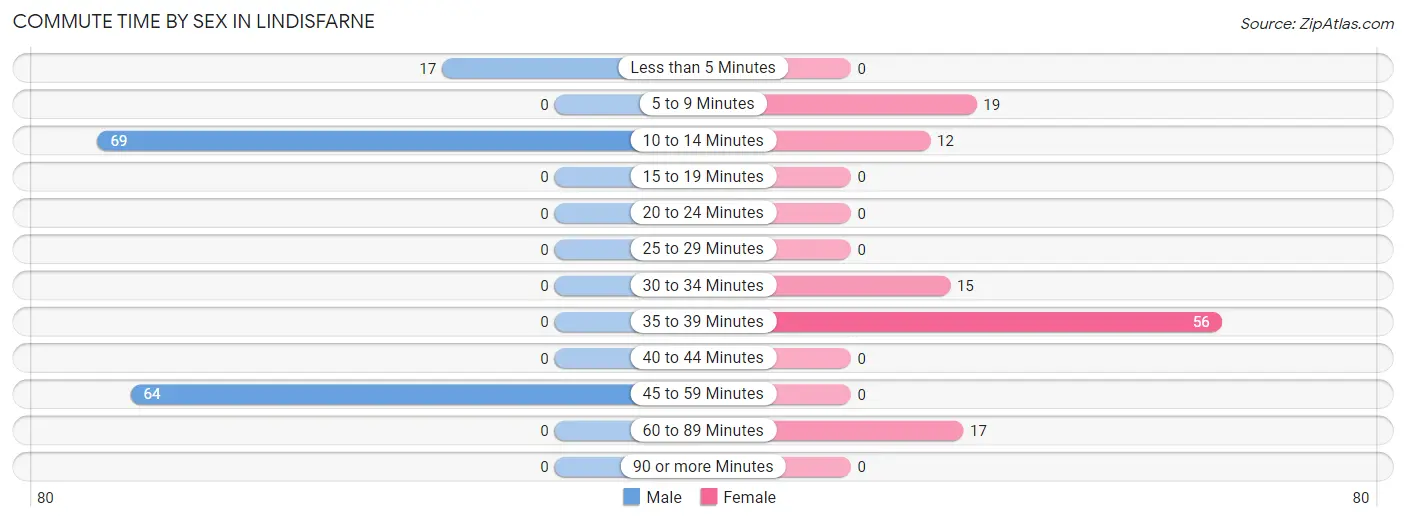
| Commute Time | Male | Female |
| Less than 5 Minutes | 17 (11.3%) | 0 (0.0%) |
| 5 to 9 Minutes | 0 (0.0%) | 19 (16.0%) |
| 10 to 14 Minutes | 69 (46.0%) | 12 (10.1%) |
| 15 to 19 Minutes | 0 (0.0%) | 0 (0.0%) |
| 20 to 24 Minutes | 0 (0.0%) | 0 (0.0%) |
| 25 to 29 Minutes | 0 (0.0%) | 0 (0.0%) |
| 30 to 34 Minutes | 0 (0.0%) | 15 (12.6%) |
| 35 to 39 Minutes | 0 (0.0%) | 56 (47.1%) |
| 40 to 44 Minutes | 0 (0.0%) | 0 (0.0%) |
| 45 to 59 Minutes | 64 (42.7%) | 0 (0.0%) |
| 60 to 89 Minutes | 0 (0.0%) | 17 (14.3%) |
| 90 or more Minutes | 0 (0.0%) | 0 (0.0%) |
Time of Departure to Work by Sex in Lindisfarne
The most frequent times of departure to work in Lindisfarne are 8:30 AM to 8:59 AM (104, 69.3%) for males and 8:00 AM to 8:29 AM (75, 63.0%) for females.
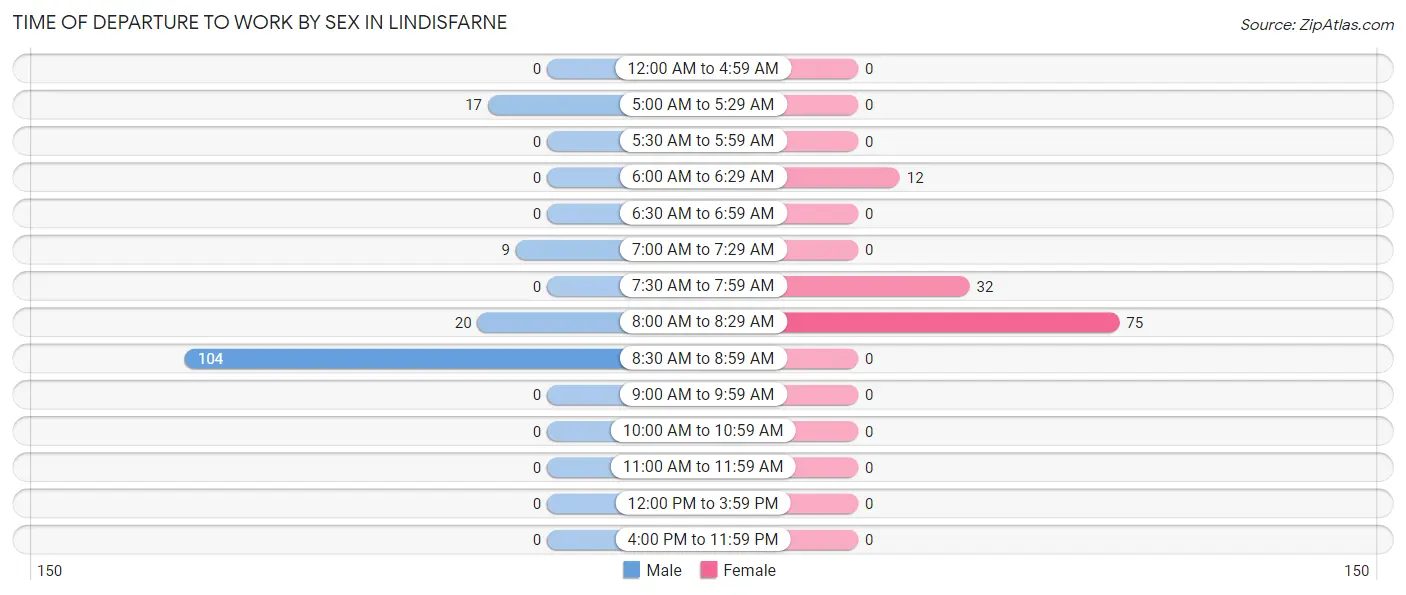
| Time of Departure | Male | Female |
| 12:00 AM to 4:59 AM | 0 (0.0%) | 0 (0.0%) |
| 5:00 AM to 5:29 AM | 17 (11.3%) | 0 (0.0%) |
| 5:30 AM to 5:59 AM | 0 (0.0%) | 0 (0.0%) |
| 6:00 AM to 6:29 AM | 0 (0.0%) | 12 (10.1%) |
| 6:30 AM to 6:59 AM | 0 (0.0%) | 0 (0.0%) |
| 7:00 AM to 7:29 AM | 9 (6.0%) | 0 (0.0%) |
| 7:30 AM to 7:59 AM | 0 (0.0%) | 32 (26.9%) |
| 8:00 AM to 8:29 AM | 20 (13.3%) | 75 (63.0%) |
| 8:30 AM to 8:59 AM | 104 (69.3%) | 0 (0.0%) |
| 9:00 AM to 9:59 AM | 0 (0.0%) | 0 (0.0%) |
| 10:00 AM to 10:59 AM | 0 (0.0%) | 0 (0.0%) |
| 11:00 AM to 11:59 AM | 0 (0.0%) | 0 (0.0%) |
| 12:00 PM to 3:59 PM | 0 (0.0%) | 0 (0.0%) |
| 4:00 PM to 11:59 PM | 0 (0.0%) | 0 (0.0%) |
| Total | 150 (100.0%) | 119 (100.0%) |
Housing Occupancy in Lindisfarne
Occupancy by Ownership in Lindisfarne
Of the total 219 dwellings in Lindisfarne, owner-occupied units account for 184 (84.0%), while renter-occupied units make up 35 (16.0%).
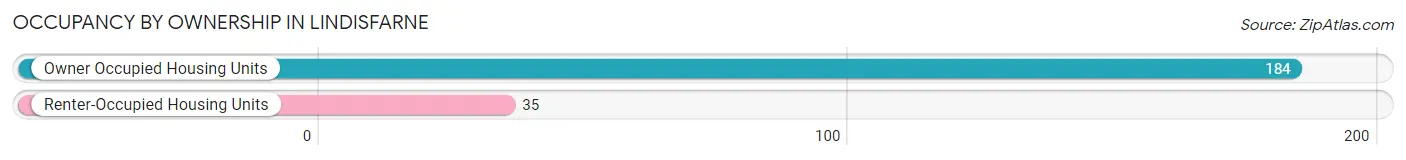
| Occupancy | # Housing Units | % Housing Units |
| Owner Occupied Housing Units | 184 | 84.0% |
| Renter-Occupied Housing Units | 35 | 16.0% |
| Total Occupied Housing Units | 219 | 100.0% |
Occupancy by Household Size in Lindisfarne
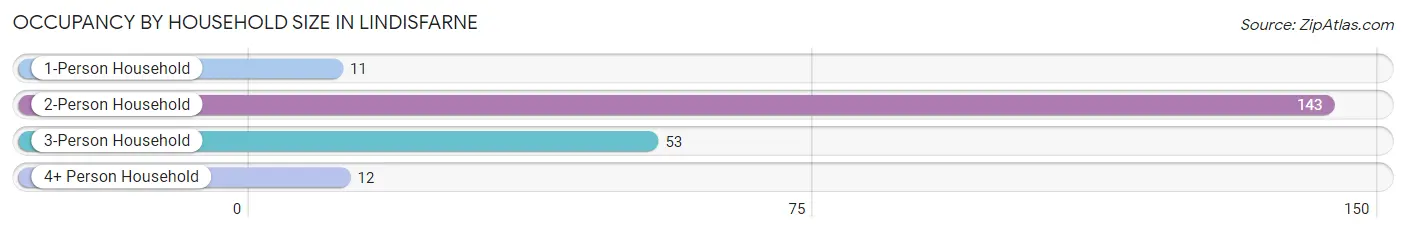
| Household Size | # Housing Units | % Housing Units |
| 1-Person Household | 11 | 5.0% |
| 2-Person Household | 143 | 65.3% |
| 3-Person Household | 53 | 24.2% |
| 4+ Person Household | 12 | 5.5% |
| Total Housing Units | 219 | 100.0% |
Occupancy by Ownership by Household Size in Lindisfarne
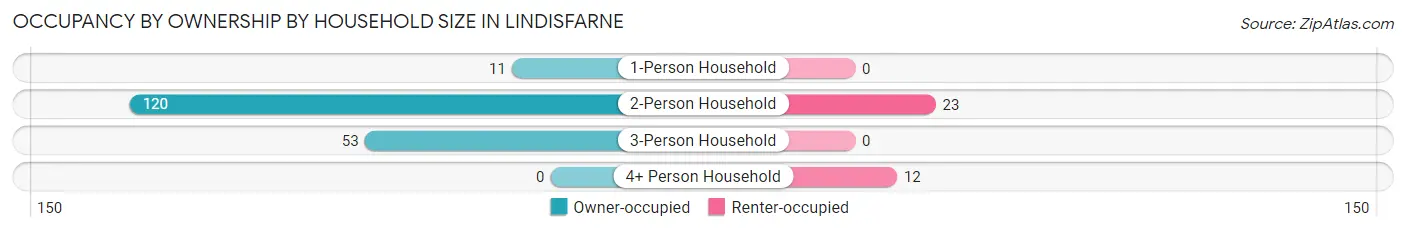
| Household Size | Owner-occupied | Renter-occupied |
| 1-Person Household | 11 (100.0%) | 0 (0.0%) |
| 2-Person Household | 120 (83.9%) | 23 (16.1%) |
| 3-Person Household | 53 (100.0%) | 0 (0.0%) |
| 4+ Person Household | 0 (0.0%) | 12 (100.0%) |
| Total Housing Units | 184 (84.0%) | 35 (16.0%) |
Occupancy by Educational Attainment in Lindisfarne
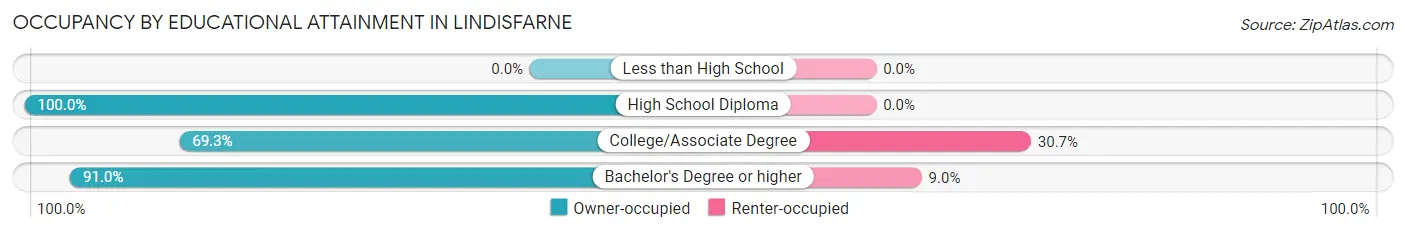
| Household Size | Owner-occupied | Renter-occupied |
| Less than High School | 0 (0.0%) | 0 (0.0%) |
| High School Diploma | 11 (100.0%) | 0 (0.0%) |
| College/Associate Degree | 52 (69.3%) | 23 (30.7%) |
| Bachelor's Degree or higher | 121 (91.0%) | 12 (9.0%) |
Occupancy by Age of Householder in Lindisfarne
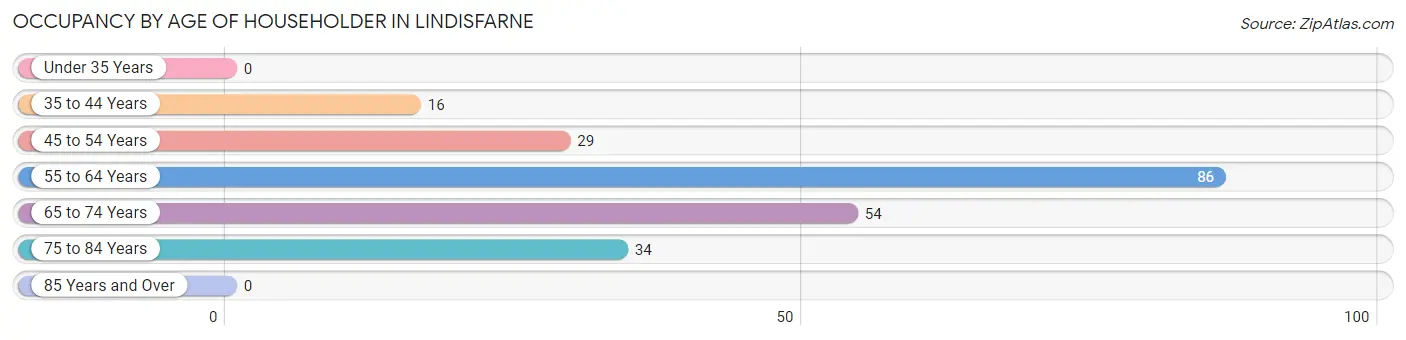
| Age Bracket | # Households | % Households |
| Under 35 Years | 0 | 0.0% |
| 35 to 44 Years | 16 | 7.3% |
| 45 to 54 Years | 29 | 13.2% |
| 55 to 64 Years | 86 | 39.3% |
| 65 to 74 Years | 54 | 24.7% |
| 75 to 84 Years | 34 | 15.5% |
| 85 Years and Over | 0 | 0.0% |
| Total | 219 | 100.0% |
Housing Finances in Lindisfarne
Median Income by Occupancy in Lindisfarne
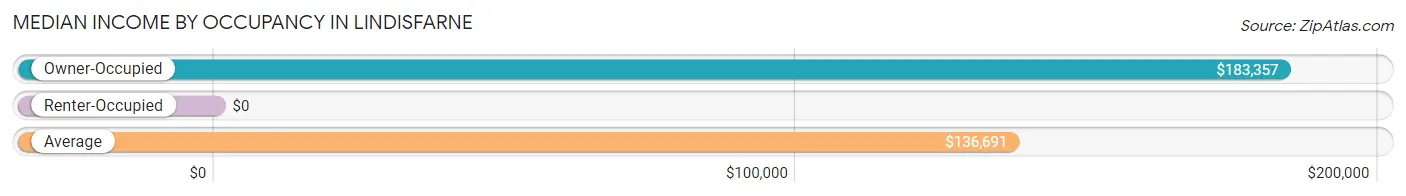
| Occupancy Type | # Households | Median Income |
| Owner-Occupied | 184 (84.0%) | $183,357 |
| Renter-Occupied | 35 (16.0%) | $0 |
| Average | 219 (100.0%) | $136,691 |
Occupancy by Householder Income Bracket in Lindisfarne
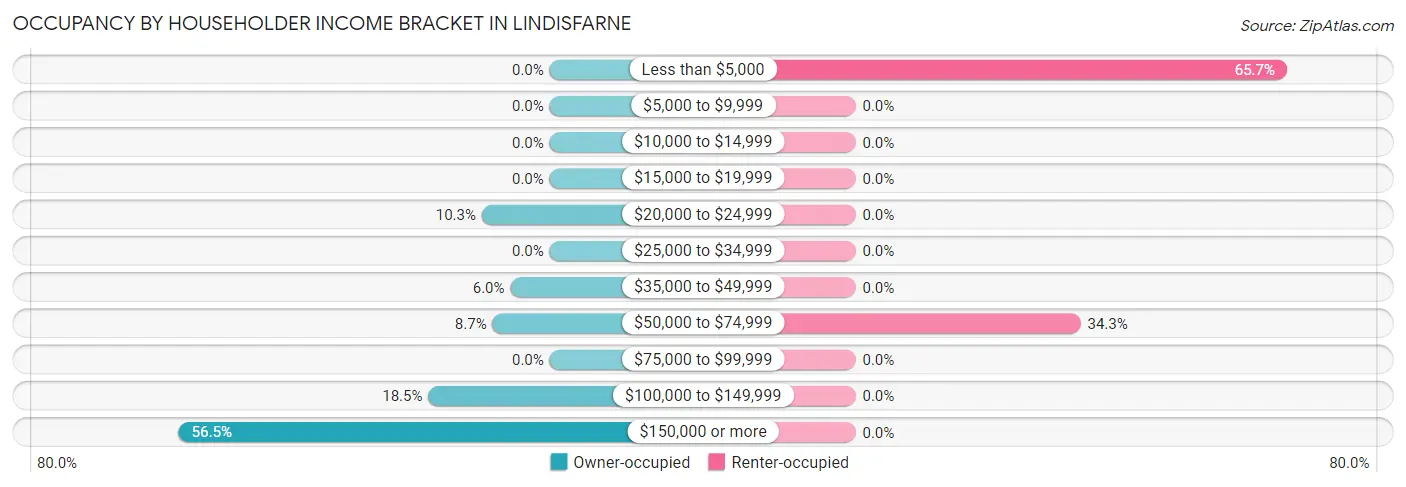
| Income Bracket | Owner-occupied | Renter-occupied |
| Less than $5,000 | 0 (0.0%) | 23 (65.7%) |
| $5,000 to $9,999 | 0 (0.0%) | 0 (0.0%) |
| $10,000 to $14,999 | 0 (0.0%) | 0 (0.0%) |
| $15,000 to $19,999 | 0 (0.0%) | 0 (0.0%) |
| $20,000 to $24,999 | 19 (10.3%) | 0 (0.0%) |
| $25,000 to $34,999 | 0 (0.0%) | 0 (0.0%) |
| $35,000 to $49,999 | 11 (6.0%) | 0 (0.0%) |
| $50,000 to $74,999 | 16 (8.7%) | 12 (34.3%) |
| $75,000 to $99,999 | 0 (0.0%) | 0 (0.0%) |
| $100,000 to $149,999 | 34 (18.5%) | 0 (0.0%) |
| $150,000 or more | 104 (56.5%) | 0 (0.0%) |
| Total | 184 (100.0%) | 35 (100.0%) |
Monthly Housing Cost Tiers in Lindisfarne
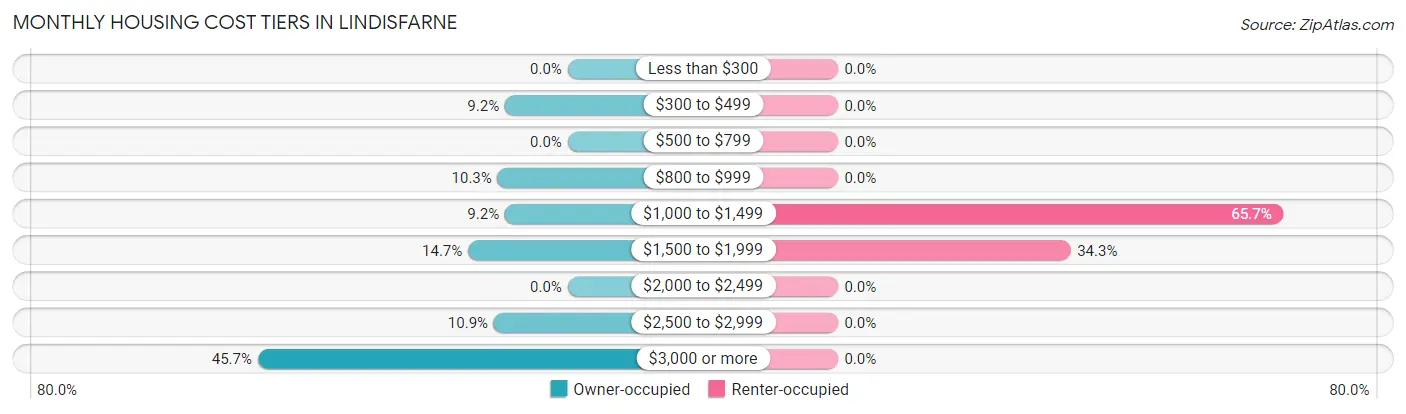
| Monthly Cost | Owner-occupied | Renter-occupied |
| Less than $300 | 0 (0.0%) | 0 (0.0%) |
| $300 to $499 | 17 (9.2%) | 0 (0.0%) |
| $500 to $799 | 0 (0.0%) | 0 (0.0%) |
| $800 to $999 | 19 (10.3%) | 0 (0.0%) |
| $1,000 to $1,499 | 17 (9.2%) | 23 (65.7%) |
| $1,500 to $1,999 | 27 (14.7%) | 12 (34.3%) |
| $2,000 to $2,499 | 0 (0.0%) | 0 (0.0%) |
| $2,500 to $2,999 | 20 (10.9%) | 0 (0.0%) |
| $3,000 or more | 84 (45.7%) | 0 (0.0%) |
| Total | 184 (100.0%) | 35 (100.0%) |
Physical Housing Characteristics in Lindisfarne
Housing Structures in Lindisfarne
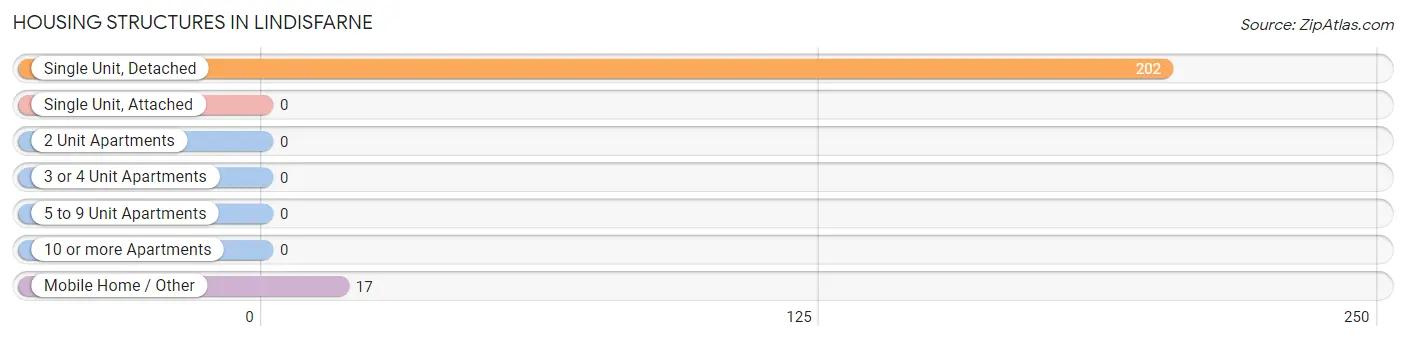
| Structure Type | # Housing Units | % Housing Units |
| Single Unit, Detached | 202 | 92.2% |
| Single Unit, Attached | 0 | 0.0% |
| 2 Unit Apartments | 0 | 0.0% |
| 3 or 4 Unit Apartments | 0 | 0.0% |
| 5 to 9 Unit Apartments | 0 | 0.0% |
| 10 or more Apartments | 0 | 0.0% |
| Mobile Home / Other | 17 | 7.8% |
| Total | 219 | 100.0% |
Housing Structures by Occupancy in Lindisfarne
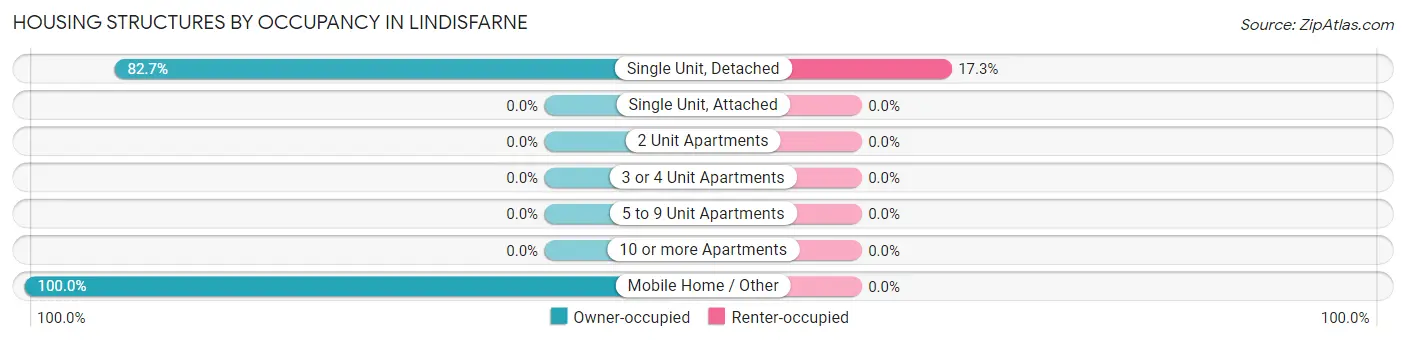
| Structure Type | Owner-occupied | Renter-occupied |
| Single Unit, Detached | 167 (82.7%) | 35 (17.3%) |
| Single Unit, Attached | 0 (0.0%) | 0 (0.0%) |
| 2 Unit Apartments | 0 (0.0%) | 0 (0.0%) |
| 3 or 4 Unit Apartments | 0 (0.0%) | 0 (0.0%) |
| 5 to 9 Unit Apartments | 0 (0.0%) | 0 (0.0%) |
| 10 or more Apartments | 0 (0.0%) | 0 (0.0%) |
| Mobile Home / Other | 17 (100.0%) | 0 (0.0%) |
| Total | 184 (84.0%) | 35 (16.0%) |
Housing Structures by Number of Rooms in Lindisfarne
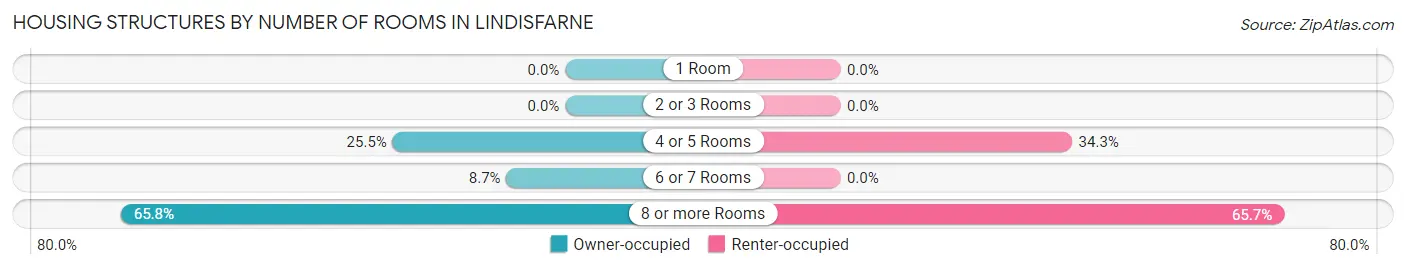
| Number of Rooms | Owner-occupied | Renter-occupied |
| 1 Room | 0 (0.0%) | 0 (0.0%) |
| 2 or 3 Rooms | 0 (0.0%) | 0 (0.0%) |
| 4 or 5 Rooms | 47 (25.5%) | 12 (34.3%) |
| 6 or 7 Rooms | 16 (8.7%) | 0 (0.0%) |
| 8 or more Rooms | 121 (65.8%) | 23 (65.7%) |
| Total | 184 (100.0%) | 35 (100.0%) |
Housing Structure by Heating Type in Lindisfarne
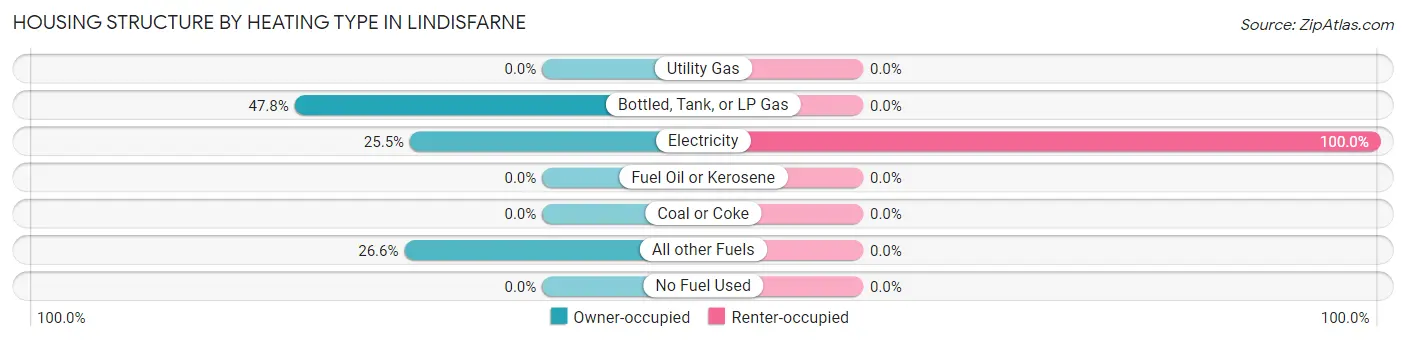
| Heating Type | Owner-occupied | Renter-occupied |
| Utility Gas | 0 (0.0%) | 0 (0.0%) |
| Bottled, Tank, or LP Gas | 88 (47.8%) | 0 (0.0%) |
| Electricity | 47 (25.5%) | 35 (100.0%) |
| Fuel Oil or Kerosene | 0 (0.0%) | 0 (0.0%) |
| Coal or Coke | 0 (0.0%) | 0 (0.0%) |
| All other Fuels | 49 (26.6%) | 0 (0.0%) |
| No Fuel Used | 0 (0.0%) | 0 (0.0%) |
| Total | 184 (100.0%) | 35 (100.0%) |
Household Vehicle Usage in Lindisfarne
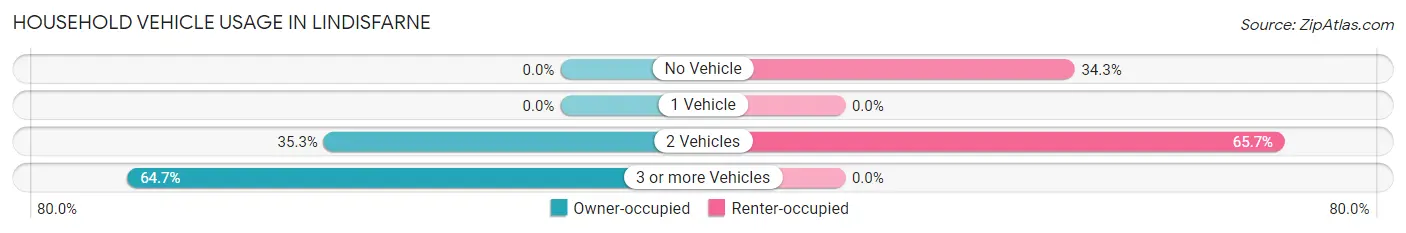
| Vehicles per Household | Owner-occupied | Renter-occupied |
| No Vehicle | 0 (0.0%) | 12 (34.3%) |
| 1 Vehicle | 0 (0.0%) | 0 (0.0%) |
| 2 Vehicles | 65 (35.3%) | 23 (65.7%) |
| 3 or more Vehicles | 119 (64.7%) | 0 (0.0%) |
| Total | 184 (100.0%) | 35 (100.0%) |
Real Estate & Mortgages in Lindisfarne
Real Estate and Mortgage Overview in Lindisfarne
| Characteristic | Without Mortgage | With Mortgage |
| Housing Units | 17 | 167 |
| Median Property Value | - | - |
| Median Household Income | - | - |
| Monthly Housing Costs | - | - |
| Real Estate Taxes | - | - |
Property Value by Mortgage Status in Lindisfarne
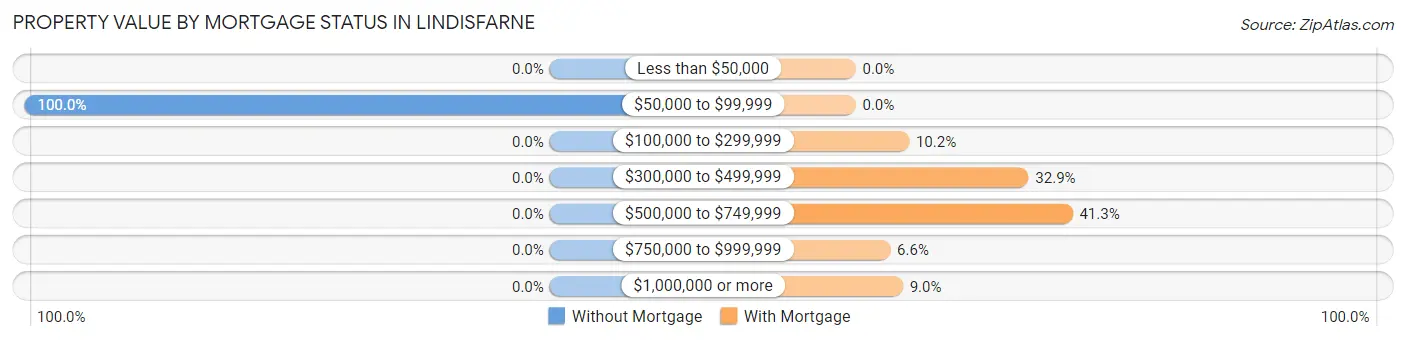
| Property Value | Without Mortgage | With Mortgage |
| Less than $50,000 | 0 (0.0%) | 0 (0.0%) |
| $50,000 to $99,999 | 17 (100.0%) | 0 (0.0%) |
| $100,000 to $299,999 | 0 (0.0%) | 17 (10.2%) |
| $300,000 to $499,999 | 0 (0.0%) | 55 (32.9%) |
| $500,000 to $749,999 | 0 (0.0%) | 69 (41.3%) |
| $750,000 to $999,999 | 0 (0.0%) | 11 (6.6%) |
| $1,000,000 or more | 0 (0.0%) | 15 (9.0%) |
| Total | 17 (100.0%) | 167 (100.0%) |
Household Income by Mortgage Status in Lindisfarne
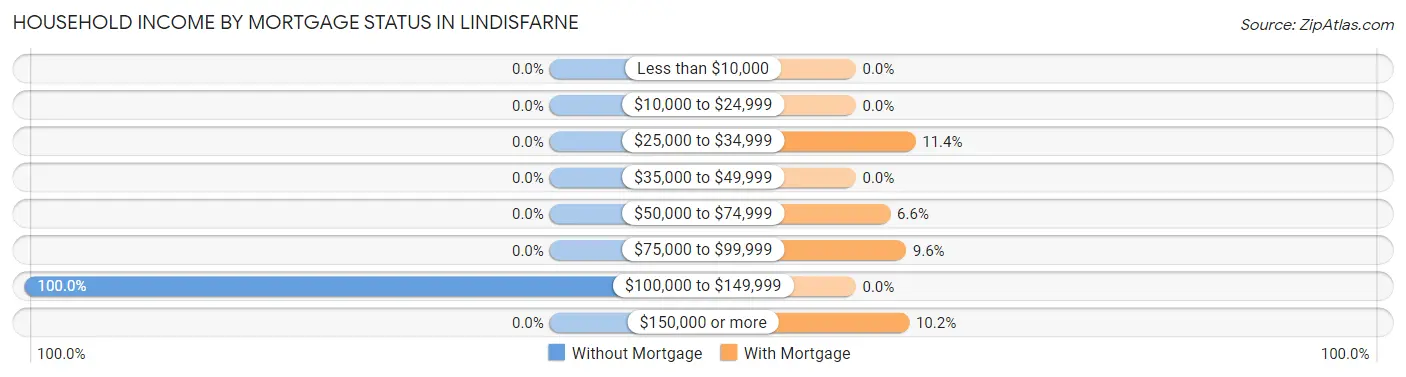
| Household Income | Without Mortgage | With Mortgage |
| Less than $10,000 | 0 (0.0%) | 0 (0.0%) |
| $10,000 to $24,999 | 0 (0.0%) | 0 (0.0%) |
| $25,000 to $34,999 | 0 (0.0%) | 19 (11.4%) |
| $35,000 to $49,999 | 0 (0.0%) | 0 (0.0%) |
| $50,000 to $74,999 | 0 (0.0%) | 11 (6.6%) |
| $75,000 to $99,999 | 0 (0.0%) | 16 (9.6%) |
| $100,000 to $149,999 | 17 (100.0%) | 0 (0.0%) |
| $150,000 or more | 0 (0.0%) | 17 (10.2%) |
| Total | 17 (100.0%) | 167 (100.0%) |
Property Value to Household Income Ratio in Lindisfarne
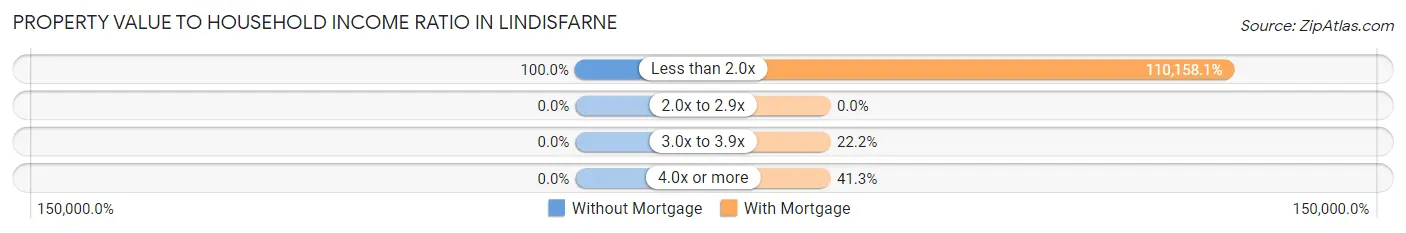
| Value-to-Income Ratio | Without Mortgage | With Mortgage |
| Less than 2.0x | 17 (100.0%) | 183,964 (110,158.1%) |
| 2.0x to 2.9x | 0 (0.0%) | 0 (0.0%) |
| 3.0x to 3.9x | 0 (0.0%) | 37 (22.2%) |
| 4.0x or more | 0 (0.0%) | 69 (41.3%) |
| Total | 17 (100.0%) | 167 (100.0%) |
Real Estate Taxes by Mortgage Status in Lindisfarne
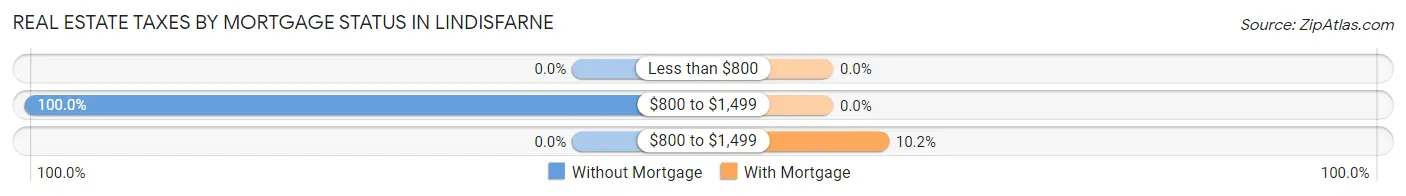
| Property Taxes | Without Mortgage | With Mortgage |
| Less than $800 | 0 (0.0%) | 0 (0.0%) |
| $800 to $1,499 | 17 (100.0%) | 0 (0.0%) |
| $800 to $1,499 | 0 (0.0%) | 17 (10.2%) |
| Total | 17 (100.0%) | 167 (100.0%) |
Health & Disability in Lindisfarne
Health Insurance Coverage by Age in Lindisfarne
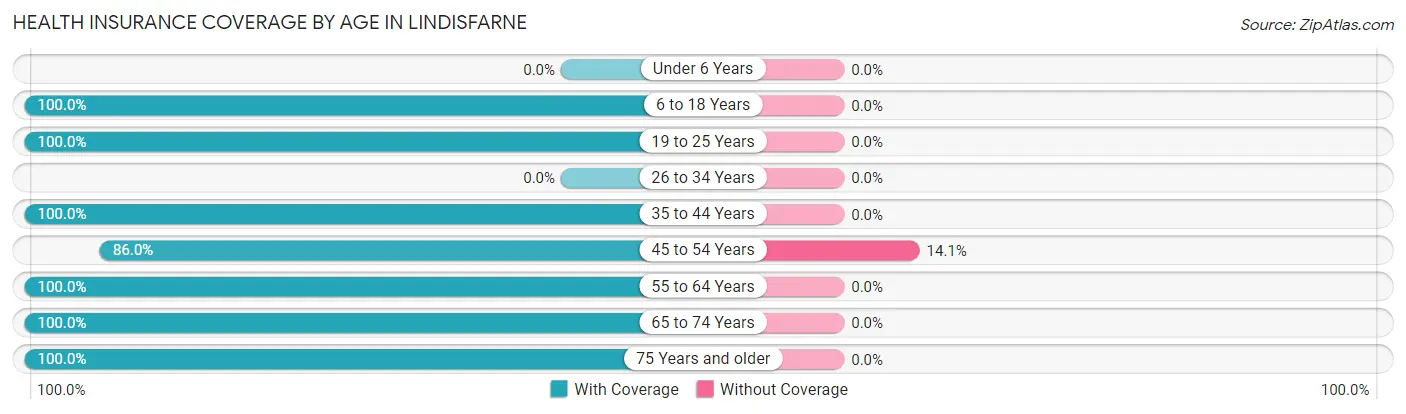
| Age Bracket | With Coverage | Without Coverage |
| Under 6 Years | 0 (0.0%) | 0 (0.0%) |
| 6 to 18 Years | 30 (100.0%) | 0 (0.0%) |
| 19 to 25 Years | 8 (100.0%) | 0 (0.0%) |
| 26 to 34 Years | 0 (0.0%) | 0 (0.0%) |
| 35 to 44 Years | 35 (100.0%) | 0 (0.0%) |
| 45 to 54 Years | 104 (86.0%) | 17 (14.1%) |
| 55 to 64 Years | 101 (100.0%) | 0 (0.0%) |
| 65 to 74 Years | 149 (100.0%) | 0 (0.0%) |
| 75 Years and older | 51 (100.0%) | 0 (0.0%) |
| Total | 478 (96.6%) | 17 (3.4%) |
Health Insurance Coverage by Citizenship Status in Lindisfarne
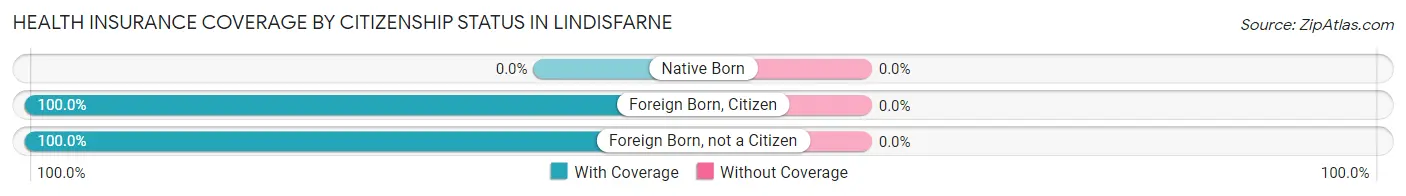
| Citizenship Status | With Coverage | Without Coverage |
| Native Born | 0 (0.0%) | 0 (0.0%) |
| Foreign Born, Citizen | 30 (100.0%) | 0 (0.0%) |
| Foreign Born, not a Citizen | 8 (100.0%) | 0 (0.0%) |
Health Insurance Coverage by Household Income in Lindisfarne
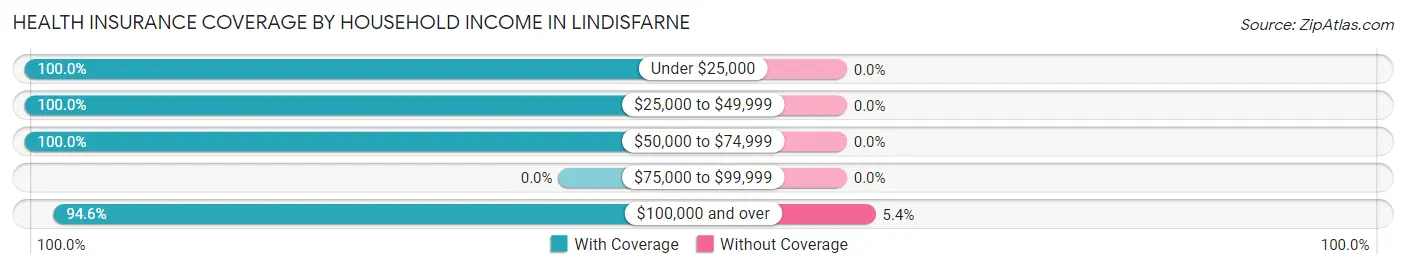
| Household Income | With Coverage | Without Coverage |
| Under $25,000 | 78 (100.0%) | 0 (0.0%) |
| $25,000 to $49,999 | 11 (100.0%) | 0 (0.0%) |
| $50,000 to $74,999 | 90 (100.0%) | 0 (0.0%) |
| $75,000 to $99,999 | 0 (0.0%) | 0 (0.0%) |
| $100,000 and over | 299 (94.6%) | 17 (5.4%) |
Public vs Private Health Insurance Coverage by Age in Lindisfarne
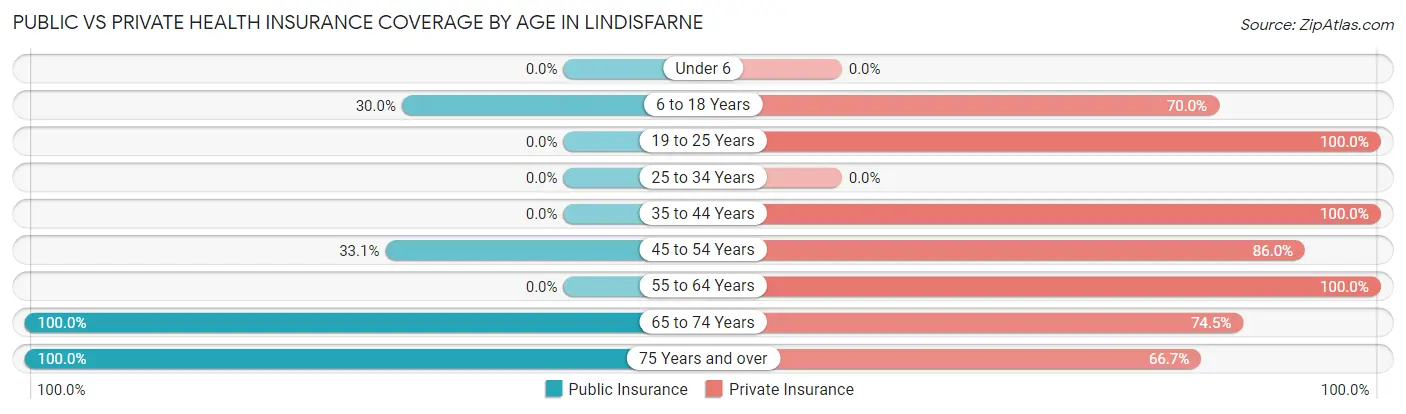
| Age Bracket | Public Insurance | Private Insurance |
| Under 6 | 0 (0.0%) | 0 (0.0%) |
| 6 to 18 Years | 9 (30.0%) | 21 (70.0%) |
| 19 to 25 Years | 0 (0.0%) | 8 (100.0%) |
| 25 to 34 Years | 0 (0.0%) | 0 (0.0%) |
| 35 to 44 Years | 0 (0.0%) | 35 (100.0%) |
| 45 to 54 Years | 40 (33.1%) | 104 (86.0%) |
| 55 to 64 Years | 0 (0.0%) | 101 (100.0%) |
| 65 to 74 Years | 149 (100.0%) | 111 (74.5%) |
| 75 Years and over | 51 (100.0%) | 34 (66.7%) |
| Total | 249 (50.3%) | 414 (83.6%) |
Disability Status by Sex by Age in Lindisfarne
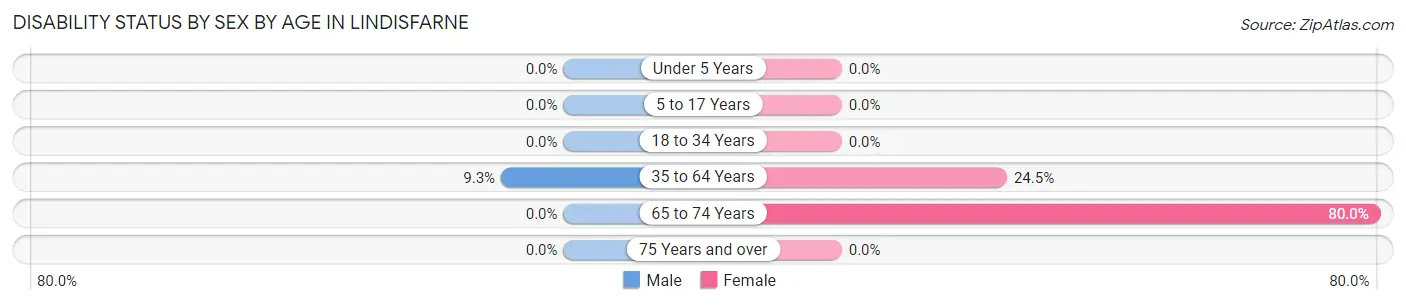
| Age Bracket | Male | Female |
| Under 5 Years | 0 (0.0%) | 0 (0.0%) |
| 5 to 17 Years | 0 (0.0%) | 0 (0.0%) |
| 18 to 34 Years | 0 (0.0%) | 0 (0.0%) |
| 35 to 64 Years | 14 (9.3%) | 26 (24.5%) |
| 65 to 74 Years | 0 (0.0%) | 76 (80.0%) |
| 75 Years and over | 0 (0.0%) | 0 (0.0%) |
Disability Class by Sex by Age in Lindisfarne
Disability Class: Hearing Difficulty
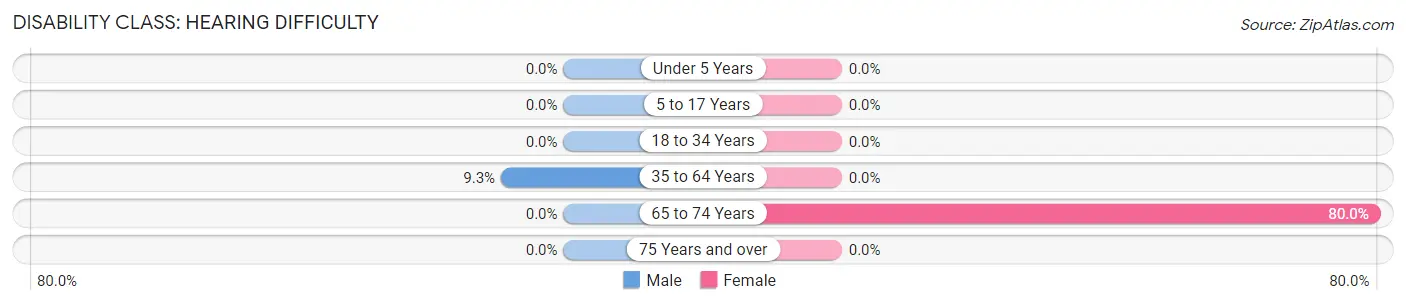
| Age Bracket | Male | Female |
| Under 5 Years | 0 (0.0%) | 0 (0.0%) |
| 5 to 17 Years | 0 (0.0%) | 0 (0.0%) |
| 18 to 34 Years | 0 (0.0%) | 0 (0.0%) |
| 35 to 64 Years | 14 (9.3%) | 0 (0.0%) |
| 65 to 74 Years | 0 (0.0%) | 76 (80.0%) |
| 75 Years and over | 0 (0.0%) | 0 (0.0%) |
Disability Class: Vision Difficulty
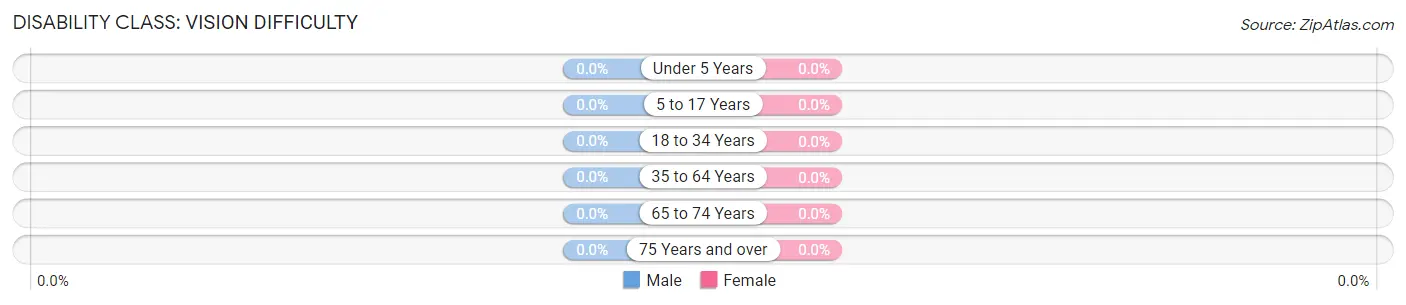
| Age Bracket | Male | Female |
| Under 5 Years | 0 (0.0%) | 0 (0.0%) |
| 5 to 17 Years | 0 (0.0%) | 0 (0.0%) |
| 18 to 34 Years | 0 (0.0%) | 0 (0.0%) |
| 35 to 64 Years | 0 (0.0%) | 0 (0.0%) |
| 65 to 74 Years | 0 (0.0%) | 0 (0.0%) |
| 75 Years and over | 0 (0.0%) | 0 (0.0%) |
Disability Class: Cognitive Difficulty
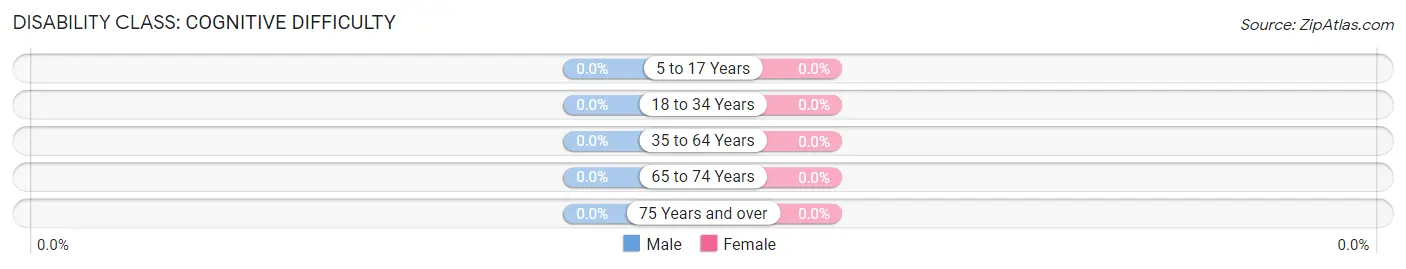
| Age Bracket | Male | Female |
| 5 to 17 Years | 0 (0.0%) | 0 (0.0%) |
| 18 to 34 Years | 0 (0.0%) | 0 (0.0%) |
| 35 to 64 Years | 0 (0.0%) | 0 (0.0%) |
| 65 to 74 Years | 0 (0.0%) | 0 (0.0%) |
| 75 Years and over | 0 (0.0%) | 0 (0.0%) |
Disability Class: Ambulatory Difficulty

| Age Bracket | Male | Female |
| 5 to 17 Years | 0 (0.0%) | 0 (0.0%) |
| 18 to 34 Years | 0 (0.0%) | 0 (0.0%) |
| 35 to 64 Years | 0 (0.0%) | 26 (24.5%) |
| 65 to 74 Years | 0 (0.0%) | 0 (0.0%) |
| 75 Years and over | 0 (0.0%) | 0 (0.0%) |
Disability Class: Self-Care Difficulty
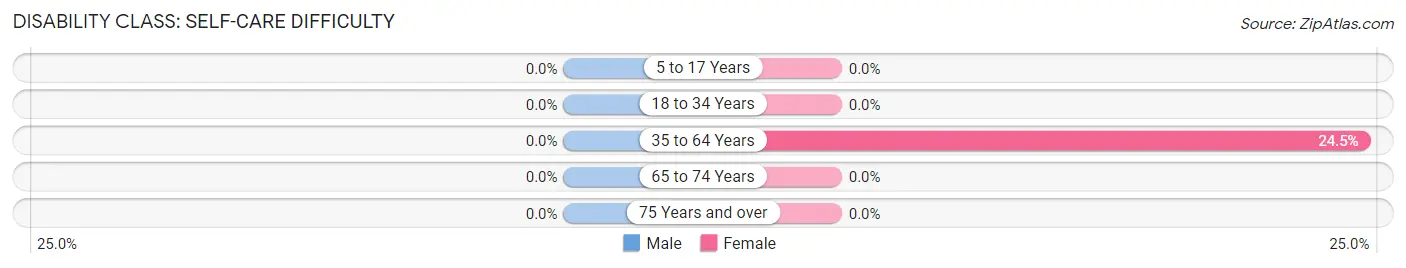
| Age Bracket | Male | Female |
| 5 to 17 Years | 0 (0.0%) | 0 (0.0%) |
| 18 to 34 Years | 0 (0.0%) | 0 (0.0%) |
| 35 to 64 Years | 0 (0.0%) | 26 (24.5%) |
| 65 to 74 Years | 0 (0.0%) | 0 (0.0%) |
| 75 Years and over | 0 (0.0%) | 0 (0.0%) |
Technology Access in Lindisfarne
Computing Device Access in Lindisfarne
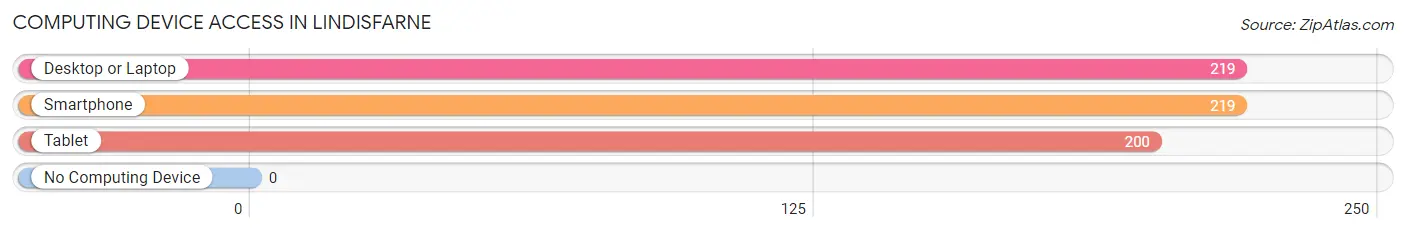
| Device Type | # Households | % Households |
| Desktop or Laptop | 219 | 100.0% |
| Smartphone | 219 | 100.0% |
| Tablet | 200 | 91.3% |
| No Computing Device | 0 | 0.0% |
| Total | 219 | 100.0% |
Internet Access in Lindisfarne
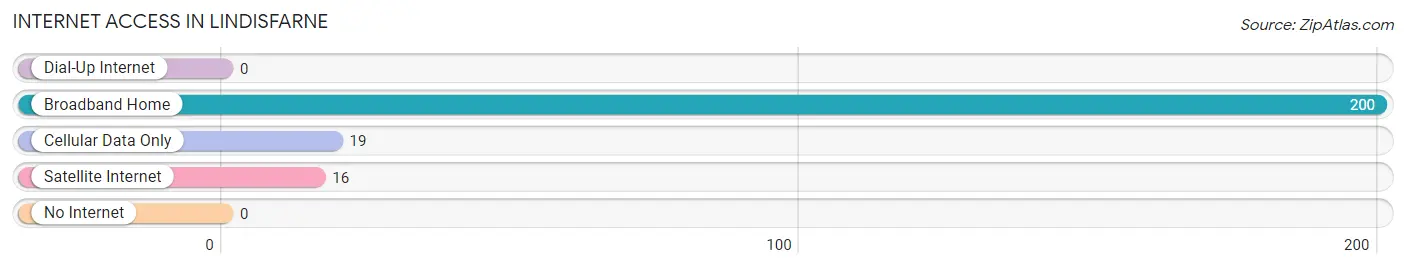
| Internet Type | # Households | % Households |
| Dial-Up Internet | 0 | 0.0% |
| Broadband Home | 200 | 91.3% |
| Cellular Data Only | 19 | 8.7% |
| Satellite Internet | 16 | 7.3% |
| No Internet | 0 | 0.0% |
| Total | 219 | 100.0% |
Lindisfarne Summary
Lindisfarne is a small town located in the state of Montana, in the United States. It is situated in the south-central part of the state, in the foothills of the Rocky Mountains. The town is located in the county of Lewis and Clark, and is part of the Helena Metropolitan Statistical Area. The population of Lindisfarne was estimated to be 1,845 in the year 2000.
History
The town of Lindisfarne was founded in 1883 by a group of settlers from the Midwest. The settlers were looking for a place to settle and start a new life, and they chose the area around Lindisfarne because of its natural beauty and abundance of resources. The town was named after the island of Lindisfarne, which is located off the coast of England.
The town quickly grew and prospered, and by the early 1900s it had become a thriving community. The town was home to a variety of businesses, including a sawmill, a flour mill, a blacksmith shop, and a general store. The town also had a school, a post office, and a church.
In the early 1900s, the town was also home to a large number of immigrants from Europe, particularly from Germany and Scandinavia. These immigrants brought with them their own culture and traditions, which helped to shape the culture of Lindisfarne.
Geography
Lindisfarne is located in the south-central part of Montana, in the foothills of the Rocky Mountains. The town is situated in the county of Lewis and Clark, and is part of the Helena Metropolitan Statistical Area. The town is located at an elevation of 4,890 feet above sea level.
The town is surrounded by mountains and forests, and is located near several rivers and streams. The nearest major city is Helena, which is located about 40 miles to the north. The nearest airport is the Helena Regional Airport, which is located about 25 miles away.
Economy
The economy of Lindisfarne is largely based on agriculture and tourism. The town is home to several farms, which produce a variety of crops, including wheat, barley, oats, and hay. The town is also home to several tourist attractions, including the Lewis and Clark National Historic Trail, the Lewis and Clark Caverns State Park, and the Helena National Forest.
The town is also home to several businesses, including a sawmill, a flour mill, a blacksmith shop, and a general store. The town also has a post office, a school, and a church.
Demographics
The population of Lindisfarne was estimated to be 1,845 in the year 2000. The town is predominantly white, with a small minority of African Americans, Native Americans, and Hispanics. The median household income in the town is $35,000, and the median age is 37. The town has a high rate of poverty, with nearly 20% of the population living below the poverty line.
Common Questions
What is Per Capita Income in Lindisfarne?
Per Capita income in Lindisfarne is $55,082.
What is the Median Family Income in Lindisfarne?
Median Family Income in Lindisfarne is $183,179.
What is the Median Household income in Lindisfarne?
Median Household Income in Lindisfarne is $136,691.
What is Inequality or Gini Index in Lindisfarne?
Inequality or Gini Index in Lindisfarne is 0.34.
What is the Total Population of Lindisfarne?
Total Population of Lindisfarne is 495.
What is the Total Male Population of Lindisfarne?
Total Male Population of Lindisfarne is 266.
What is the Total Female Population of Lindisfarne?
Total Female Population of Lindisfarne is 229.
What is the Ratio of Males per 100 Females in Lindisfarne?
There are 116.16 Males per 100 Females in Lindisfarne.
What is the Ratio of Females per 100 Males in Lindisfarne?
There are 86.09 Females per 100 Males in Lindisfarne.
What is the Median Population Age in Lindisfarne?
Median Population Age in Lindisfarne is 60.8 Years.
What is the Average Family Size in Lindisfarne
Average Family Size in Lindisfarne is 2.4 People.
What is the Average Household Size in Lindisfarne
Average Household Size in Lindisfarne is 2.3 People.
How Large is the Labor Force in Lindisfarne?
There are 300 People in the Labor Forcein in Lindisfarne.
What is the Percentage of People in the Labor Force in Lindisfarne?
60.6% of People are in the Labor Force in Lindisfarne.
What is the Unemployment Rate in Lindisfarne?
Unemployment Rate in Lindisfarne is 5.3%.