Livingston Wheeler, NM Map & Demographics
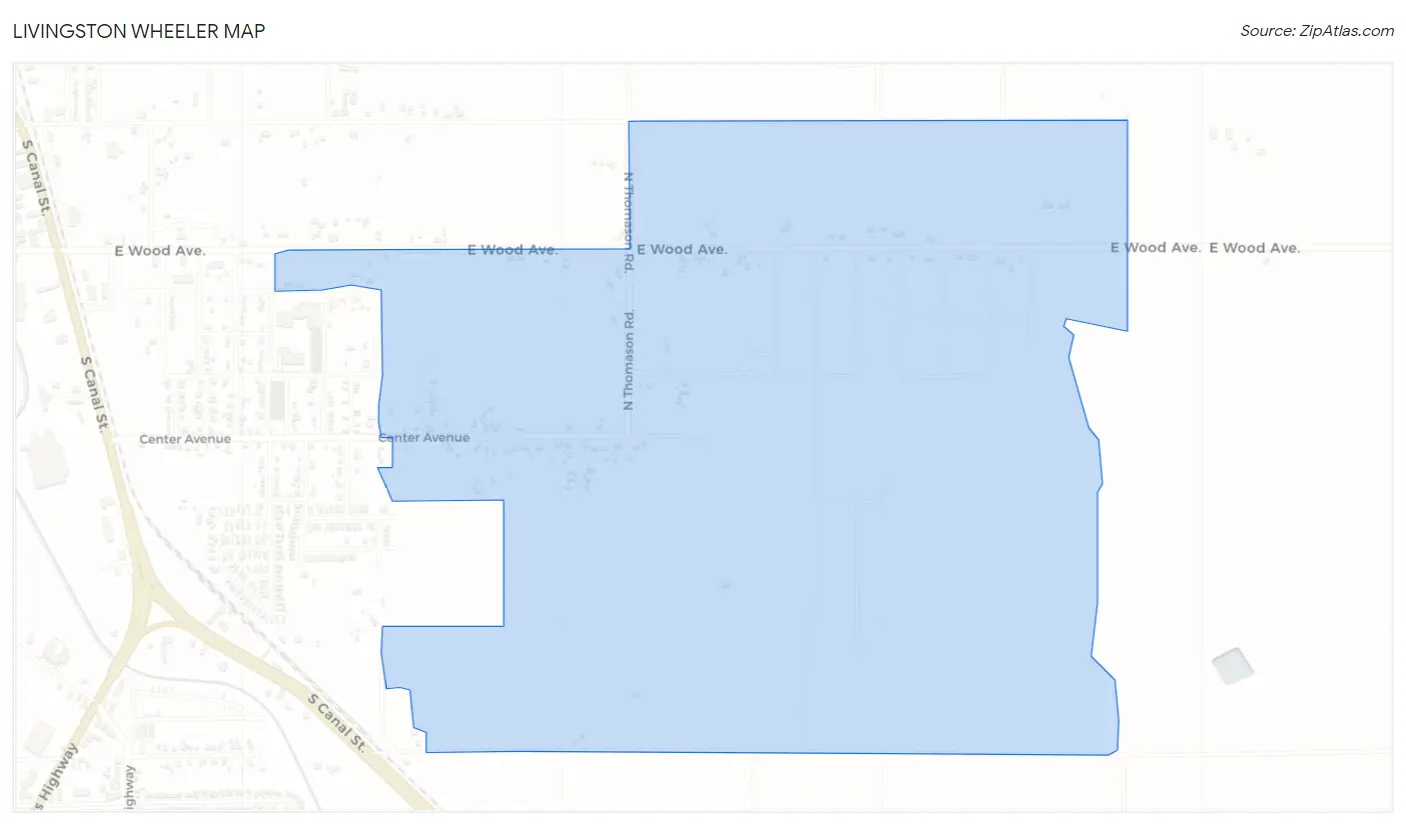
Livingston Wheeler Map
Livingston Wheeler Overview
$29,970
PER CAPITA INCOME
$87,440
AVG FAMILY INCOME
$74,464
AVG HOUSEHOLD INCOME
0.26
INEQUALITY / GINI INDEX
1,070
TOTAL POPULATION
617
MALE POPULATION
453
FEMALE POPULATION
136.20
MALES / 100 FEMALES
73.42
FEMALES / 100 MALES
35.6
MEDIAN AGE
3.6
AVG FAMILY SIZE
2.9
AVG HOUSEHOLD SIZE
309
LABOR FORCE [ PEOPLE ]
41.7%
PERCENT IN LABOR FORCE
9.4%
UNEMPLOYMENT RATE
Income in Livingston Wheeler
Income Overview in Livingston Wheeler
Per Capita Income in Livingston Wheeler is $29,970, while median incomes of families and households are $87,440 and $74,464 respectively.
| Characteristic | Number | Measure |
| Per Capita Income | 1,070 | $29,970 |
| Median Family Income | 264 | $87,440 |
| Mean Family Income | 264 | $95,005 |
| Median Household Income | 364 | $74,464 |
| Mean Household Income | 364 | $83,642 |
| Income Deficit | 264 | $0 |
| Wage / Income Gap (%) | 1,070 | 0.00% |
| Wage / Income Gap ($) | 1,070 | 100.00¢ per $1 |
| Gini / Inequality Index | 1,070 | 0.26 |
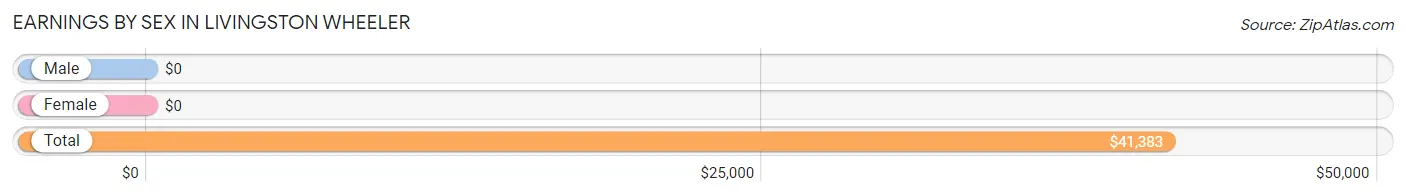
Earnings by Sex in Livingston Wheeler
| Sex | Number | Average Earnings |
| Male | 223 (72.2%) | $0 |
| Female | 86 (27.8%) | $0 |
| Total | 309 (100.0%) | $41,383 |
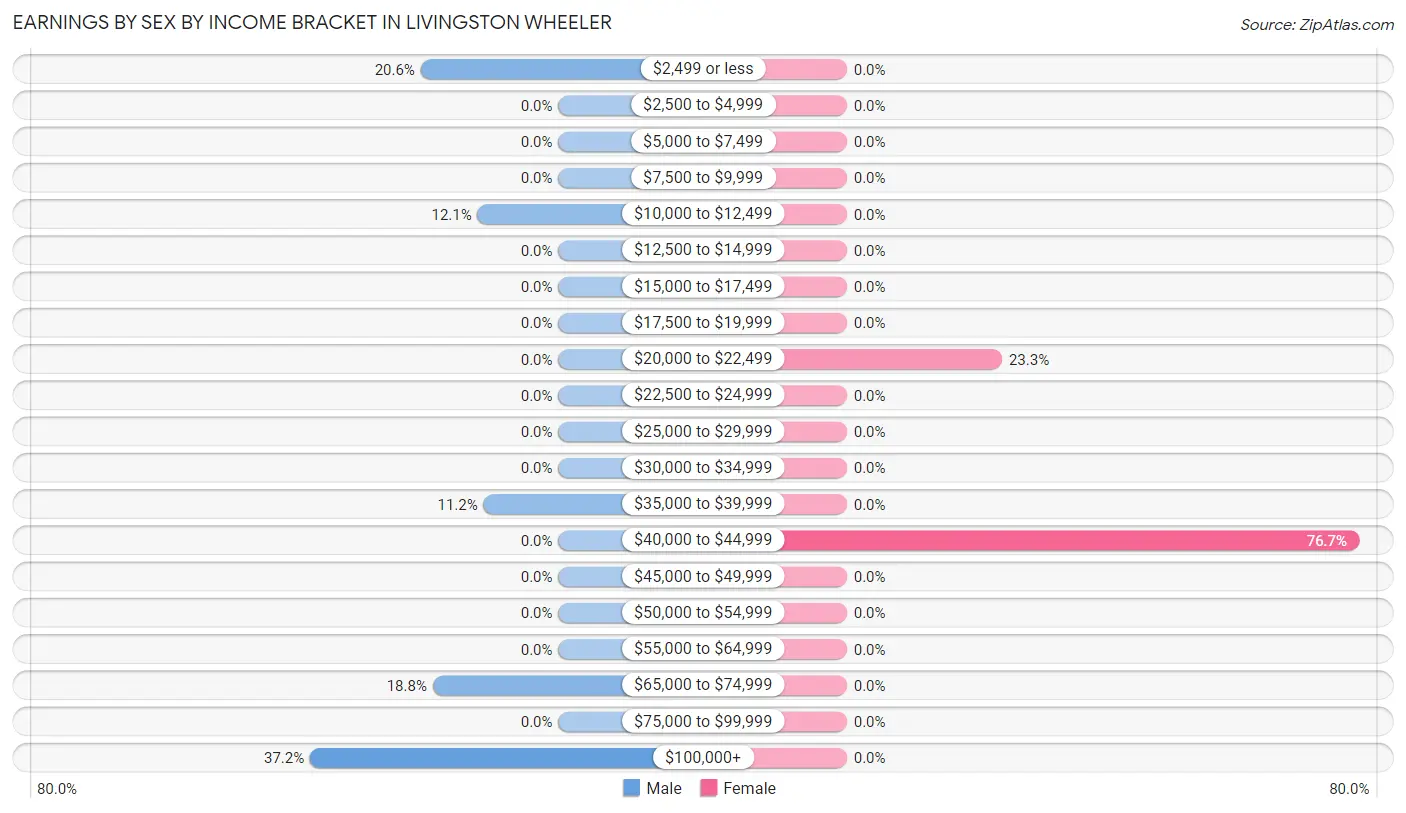
Earnings by Sex by Income Bracket in Livingston Wheeler
The most common earnings brackets in Livingston Wheeler are $100,000+ for men (83 | 37.2%) and $40,000 to $44,999 for women (66 | 76.7%).
| Income | Male | Female |
| $2,499 or less | 46 (20.6%) | 0 (0.0%) |
| $2,500 to $4,999 | 0 (0.0%) | 0 (0.0%) |
| $5,000 to $7,499 | 0 (0.0%) | 0 (0.0%) |
| $7,500 to $9,999 | 0 (0.0%) | 0 (0.0%) |
| $10,000 to $12,499 | 27 (12.1%) | 0 (0.0%) |
| $12,500 to $14,999 | 0 (0.0%) | 0 (0.0%) |
| $15,000 to $17,499 | 0 (0.0%) | 0 (0.0%) |
| $17,500 to $19,999 | 0 (0.0%) | 0 (0.0%) |
| $20,000 to $22,499 | 0 (0.0%) | 20 (23.3%) |
| $22,500 to $24,999 | 0 (0.0%) | 0 (0.0%) |
| $25,000 to $29,999 | 0 (0.0%) | 0 (0.0%) |
| $30,000 to $34,999 | 0 (0.0%) | 0 (0.0%) |
| $35,000 to $39,999 | 25 (11.2%) | 0 (0.0%) |
| $40,000 to $44,999 | 0 (0.0%) | 66 (76.7%) |
| $45,000 to $49,999 | 0 (0.0%) | 0 (0.0%) |
| $50,000 to $54,999 | 0 (0.0%) | 0 (0.0%) |
| $55,000 to $64,999 | 0 (0.0%) | 0 (0.0%) |
| $65,000 to $74,999 | 42 (18.8%) | 0 (0.0%) |
| $75,000 to $99,999 | 0 (0.0%) | 0 (0.0%) |
| $100,000+ | 83 (37.2%) | 0 (0.0%) |
| Total | 223 (100.0%) | 86 (100.0%) |
Earnings by Sex by Educational Attainment in Livingston Wheeler
| Educational Attainment | Male Income | Female Income |
| Less than High School | - | - |
| High School Diploma | - | - |
| College or Associate's Degree | - | - |
| Bachelor's Degree | - | - |
| Graduate Degree | - | - |
| Total | - | - |
Family Income in Livingston Wheeler
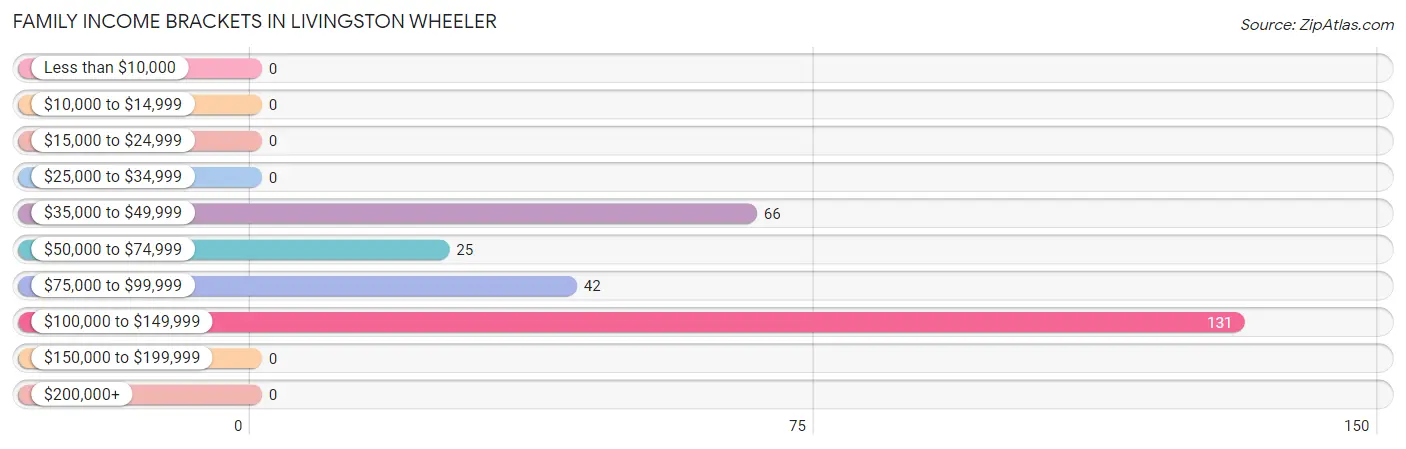
Family Income Brackets in Livingston Wheeler
According to the Livingston Wheeler family income data, there are 131 families falling into the $100,000 to $149,999 income range, which is the most common income bracket and makes up 49.6% of all families.
| Income Bracket | # Families | % Families |
| Less than $10,000 | 0 | 0.0% |
| $10,000 to $14,999 | 0 | 0.0% |
| $15,000 to $24,999 | 0 | 0.0% |
| $25,000 to $34,999 | 0 | 0.0% |
| $35,000 to $49,999 | 66 | 25.0% |
| $50,000 to $74,999 | 25 | 9.5% |
| $75,000 to $99,999 | 42 | 15.9% |
| $100,000 to $149,999 | 131 | 49.6% |
| $150,000 to $199,999 | 0 | 0.0% |
| $200,000+ | 0 | 0.0% |
Family Income by Famaliy Size in Livingston Wheeler
| Income Bracket | # Families | Median Income |
| 2-Person Families | 70 (26.5%) | $0 |
| 3-Person Families | 66 (25.0%) | $0 |
| 4-Person Families | 20 (7.6%) | $0 |
| 5-Person Families | 83 (31.4%) | $0 |
| 6-Person Families | 0 (0.0%) | $0 |
| 7+ Person Families | 25 (9.5%) | $0 |
| Total | 264 (100.0%) | $87,440 |
Family Income by Number of Earners in Livingston Wheeler
| Number of Earners | # Families | Median Income |
| No Earners | 70 (26.5%) | $0 |
| 1 Earner | 169 (64.0%) | $0 |
| 2 Earners | 0 (0.0%) | $0 |
| 3+ Earners | 25 (9.5%) | $0 |
| Total | 264 (100.0%) | $87,440 |
Household Income in Livingston Wheeler
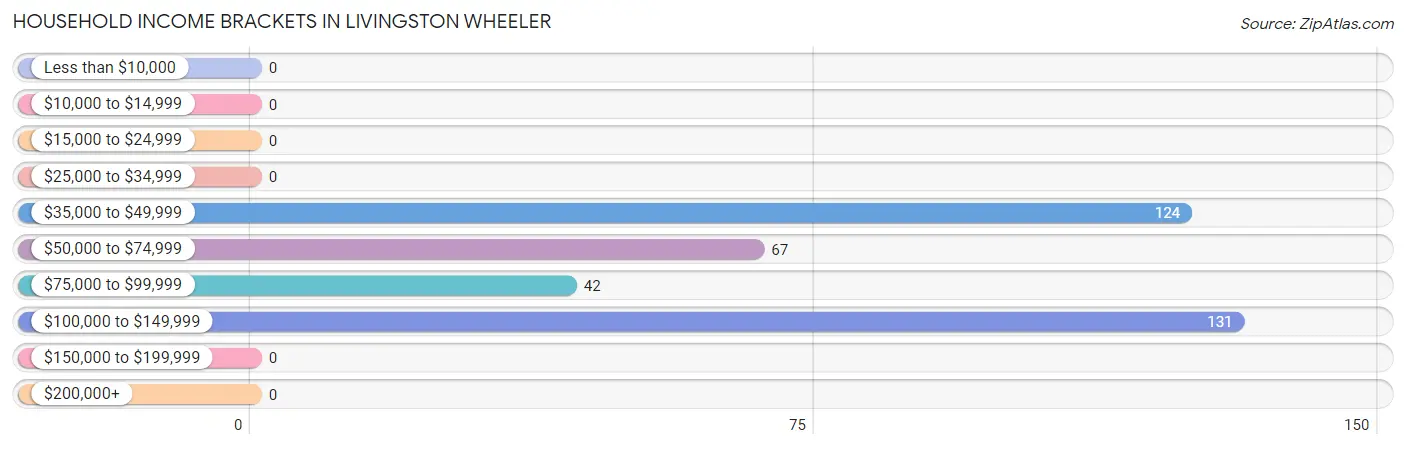
Household Income Brackets in Livingston Wheeler
With 131 households falling in the category, the $100,000 to $149,999 income range is the most frequent in Livingston Wheeler, accounting for 36.0% of all households.
| Income Bracket | # Households | % Households |
| Less than $10,000 | 0 | 0.0% |
| $10,000 to $14,999 | 0 | 0.0% |
| $15,000 to $24,999 | 0 | 0.0% |
| $25,000 to $34,999 | 0 | 0.0% |
| $35,000 to $49,999 | 124 | 34.1% |
| $50,000 to $74,999 | 67 | 18.4% |
| $75,000 to $99,999 | 42 | 11.5% |
| $100,000 to $149,999 | 131 | 36.0% |
| $150,000 to $199,999 | 0 | 0.0% |
| $200,000+ | 0 | 0.0% |
Household Income by Householder Age in Livingston Wheeler
The median household income in Livingston Wheeler is $74,464, with the highest median household income of $85,952 found in the 65+ years age bracket for the primary householder. A total of 148 households (40.7%) fall into this category.
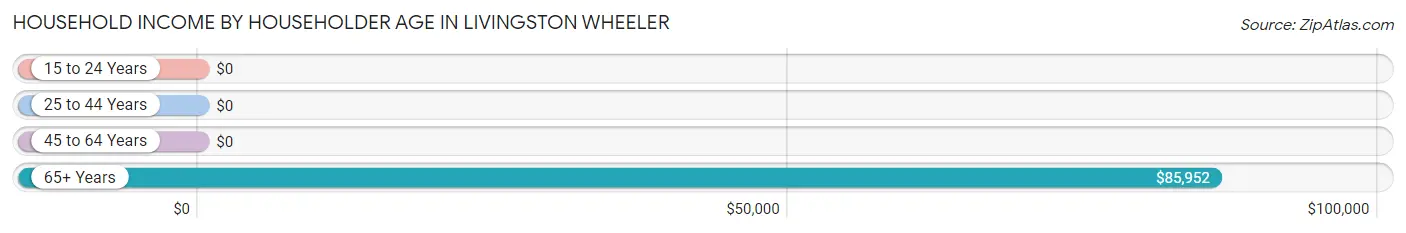
| Income Bracket | # Households | Median Income |
| 15 to 24 Years | 0 (0.0%) | $0 |
| 25 to 44 Years | 216 (59.3%) | $0 |
| 45 to 64 Years | 0 (0.0%) | $0 |
| 65+ Years | 148 (40.7%) | $85,952 |
| Total | 364 (100.0%) | $74,464 |
Poverty in Livingston Wheeler
Income Below Poverty by Sex and Age in Livingston Wheeler
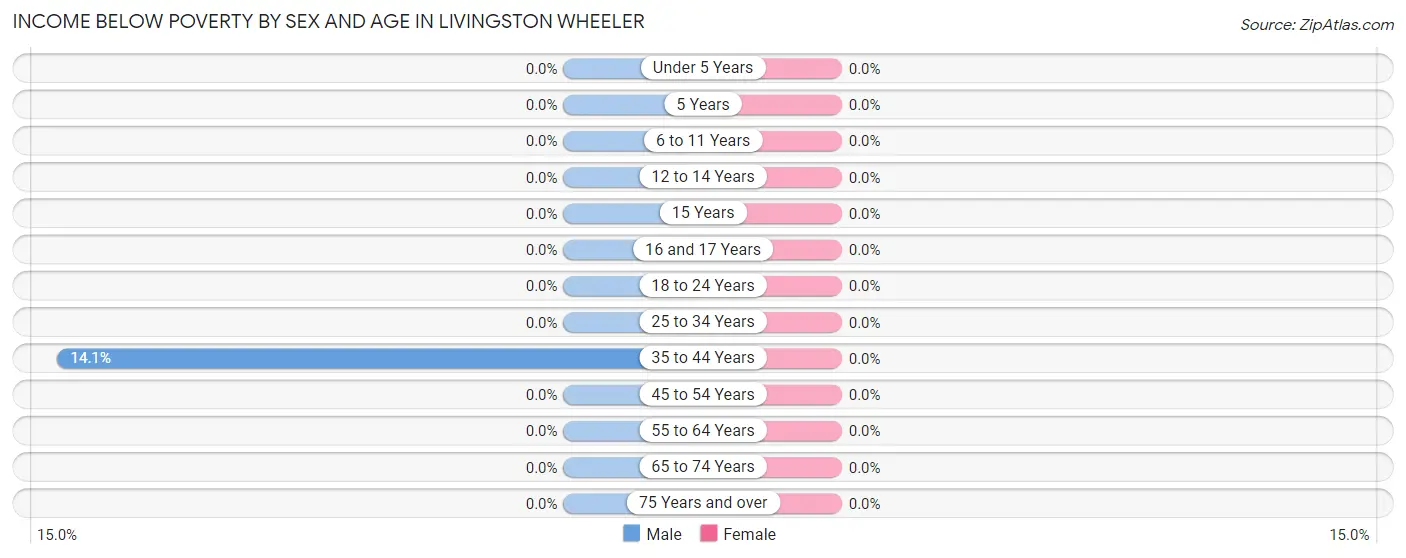
| Age Bracket | Male | Female |
| Under 5 Years | 0 (0.0%) | 0 (0.0%) |
| 5 Years | 0 (0.0%) | 0 (0.0%) |
| 6 to 11 Years | 0 (0.0%) | 0 (0.0%) |
| 12 to 14 Years | 0 (0.0%) | 0 (0.0%) |
| 15 Years | 0 (0.0%) | 0 (0.0%) |
| 16 and 17 Years | 0 (0.0%) | 0 (0.0%) |
| 18 to 24 Years | 0 (0.0%) | 0 (0.0%) |
| 25 to 34 Years | 0 (0.0%) | 0 (0.0%) |
| 35 to 44 Years | 29 (14.1%) | 0 (0.0%) |
| 45 to 54 Years | 0 (0.0%) | 0 (0.0%) |
| 55 to 64 Years | 0 (0.0%) | 0 (0.0%) |
| 65 to 74 Years | 0 (0.0%) | 0 (0.0%) |
| 75 Years and over | 0 (0.0%) | 0 (0.0%) |
| Total | 29 (4.7%) | 0 (0.0%) |
Income Above Poverty by Sex and Age in Livingston Wheeler
According to the poverty statistics in Livingston Wheeler, males aged under 5 years and females aged 6 to 11 years are the age groups that are most secure financially, with 100.0% of males and 100.0% of females in these age groups living above the poverty line.
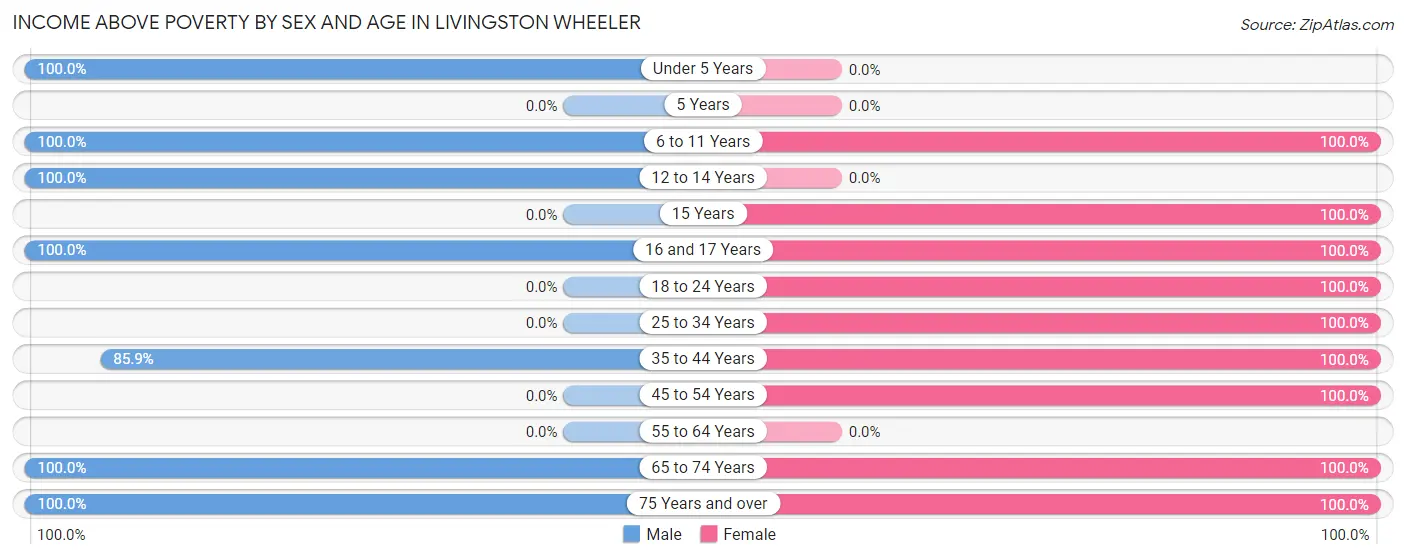
| Age Bracket | Male | Female |
| Under 5 Years | 69 (100.0%) | 0 (0.0%) |
| 5 Years | 0 (0.0%) | 0 (0.0%) |
| 6 to 11 Years | 107 (100.0%) | 44 (100.0%) |
| 12 to 14 Years | 87 (100.0%) | 0 (0.0%) |
| 15 Years | 0 (0.0%) | 22 (100.0%) |
| 16 and 17 Years | 17 (100.0%) | 22 (100.0%) |
| 18 to 24 Years | 0 (0.0%) | 60 (100.0%) |
| 25 to 34 Years | 0 (0.0%) | 66 (100.0%) |
| 35 to 44 Years | 177 (85.9%) | 20 (100.0%) |
| 45 to 54 Years | 0 (0.0%) | 89 (100.0%) |
| 55 to 64 Years | 0 (0.0%) | 0 (0.0%) |
| 65 to 74 Years | 38 (100.0%) | 102 (100.0%) |
| 75 Years and over | 93 (100.0%) | 28 (100.0%) |
| Total | 588 (95.3%) | 453 (100.0%) |
Income Below Poverty Among Married-Couple Families in Livingston Wheeler
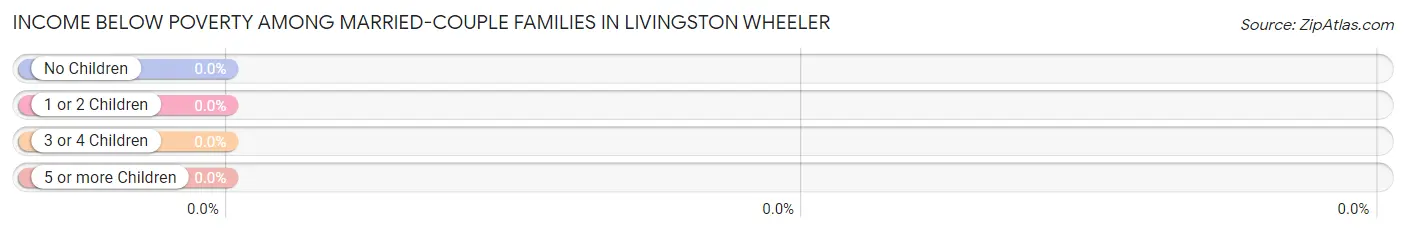
| Children | Above Poverty | Below Poverty |
| No Children | 90 (100.0%) | 0 (0.0%) |
| 1 or 2 Children | 83 (100.0%) | 0 (0.0%) |
| 3 or 4 Children | 0 (0.0%) | 0 (0.0%) |
| 5 or more Children | 25 (100.0%) | 0 (0.0%) |
| Total | 198 (100.0%) | 0 (0.0%) |
Income Below Poverty Among Single-Parent Households in Livingston Wheeler
| Children | Single Father | Single Mother |
| No Children | 0 (0.0%) | 0 (0.0%) |
| 1 or 2 Children | 0 (0.0%) | 0 (0.0%) |
| 3 or 4 Children | 0 (0.0%) | 0 (0.0%) |
| 5 or more Children | 0 (0.0%) | 0 (0.0%) |
| Total | 0 (0.0%) | 0 (0.0%) |
Income Below Poverty Among Married-Couple vs Single-Parent Households in Livingston Wheeler
| Children | Married-Couple Families | Single-Parent Households |
| No Children | 0 (0.0%) | 0 (0.0%) |
| 1 or 2 Children | 0 (0.0%) | 0 (0.0%) |
| 3 or 4 Children | 0 (0.0%) | 0 (0.0%) |
| 5 or more Children | 0 (0.0%) | 0 (0.0%) |
| Total | 0 (0.0%) | 0 (0.0%) |
Race in Livingston Wheeler
The most populous races in Livingston Wheeler are White / Caucasian (777 | 72.6%), Hispanic or Latino (293 | 27.4%), and Some other Race (293 | 27.4%).
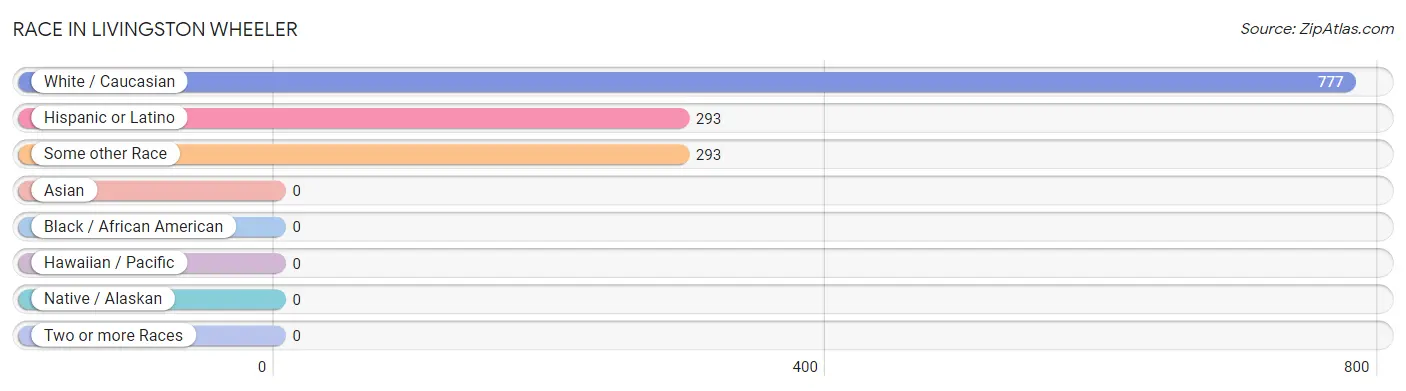
| Race | # Population | % Population |
| Asian | 0 | 0.0% |
| Black / African American | 0 | 0.0% |
| Hawaiian / Pacific | 0 | 0.0% |
| Hispanic or Latino | 293 | 27.4% |
| Native / Alaskan | 0 | 0.0% |
| White / Caucasian | 777 | 72.6% |
| Two or more Races | 0 | 0.0% |
| Some other Race | 293 | 27.4% |
| Total | 1,070 | 100.0% |
Ancestry in Livingston Wheeler
The most populous ancestries reported in Livingston Wheeler are Mexican (207 | 19.4%), American (123 | 11.5%), and German (29 | 2.7%), together accounting for 33.6% of all Livingston Wheeler residents.
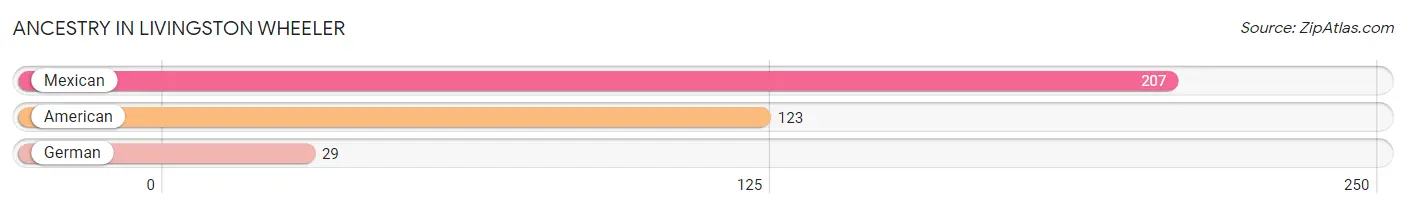
| Ancestry | # Population | % Population |
| American | 123 | 11.5% |
| German | 29 | 2.7% |
| Mexican | 207 | 19.4% | View All 3 Rows |
Immigrants in Livingston Wheeler

| Immigration Origin | # Population | % Population | View All 0 Rows |
Sex and Age in Livingston Wheeler
Sex and Age in Livingston Wheeler
The most populous age groups in Livingston Wheeler are 40 to 44 Years (110 | 17.8%) for men and 15 to 19 Years (104 | 23.0%) for women.
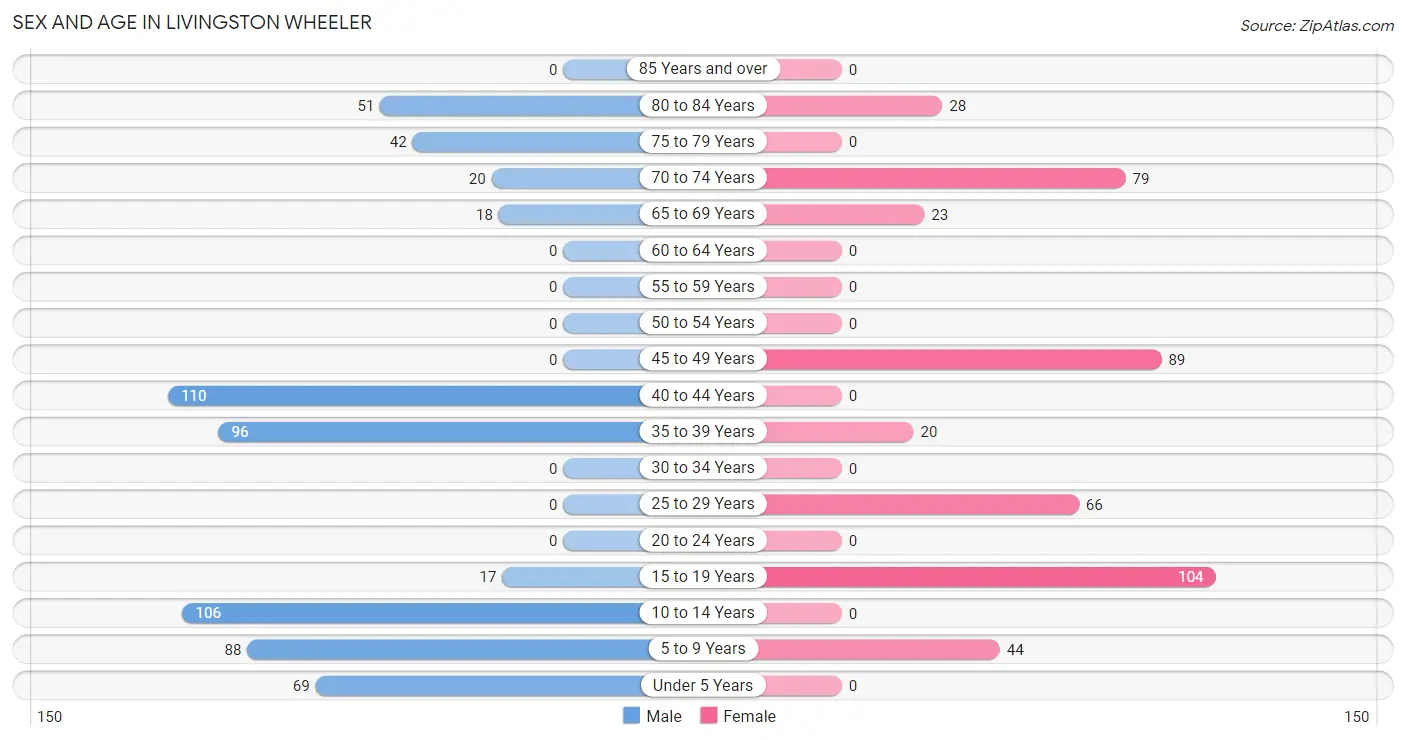
| Age Bracket | Male | Female |
| Under 5 Years | 69 (11.2%) | 0 (0.0%) |
| 5 to 9 Years | 88 (14.3%) | 44 (9.7%) |
| 10 to 14 Years | 106 (17.2%) | 0 (0.0%) |
| 15 to 19 Years | 17 (2.8%) | 104 (23.0%) |
| 20 to 24 Years | 0 (0.0%) | 0 (0.0%) |
| 25 to 29 Years | 0 (0.0%) | 66 (14.6%) |
| 30 to 34 Years | 0 (0.0%) | 0 (0.0%) |
| 35 to 39 Years | 96 (15.6%) | 20 (4.4%) |
| 40 to 44 Years | 110 (17.8%) | 0 (0.0%) |
| 45 to 49 Years | 0 (0.0%) | 89 (19.7%) |
| 50 to 54 Years | 0 (0.0%) | 0 (0.0%) |
| 55 to 59 Years | 0 (0.0%) | 0 (0.0%) |
| 60 to 64 Years | 0 (0.0%) | 0 (0.0%) |
| 65 to 69 Years | 18 (2.9%) | 23 (5.1%) |
| 70 to 74 Years | 20 (3.2%) | 79 (17.4%) |
| 75 to 79 Years | 42 (6.8%) | 0 (0.0%) |
| 80 to 84 Years | 51 (8.3%) | 28 (6.2%) |
| 85 Years and over | 0 (0.0%) | 0 (0.0%) |
| Total | 617 (100.0%) | 453 (100.0%) |
Families and Households in Livingston Wheeler
Median Family Size in Livingston Wheeler
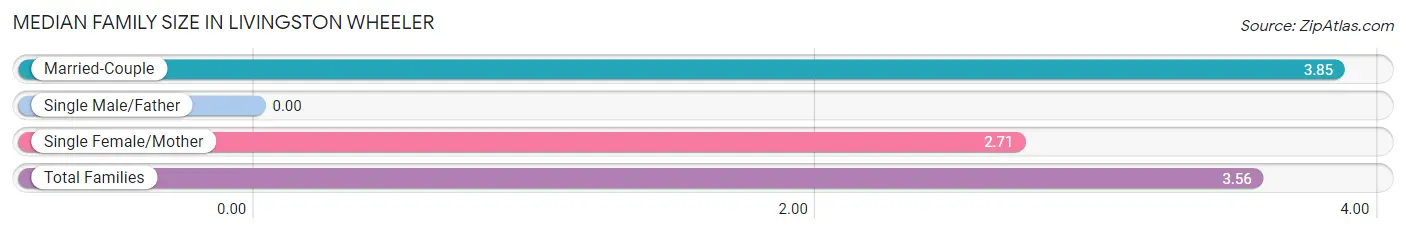
| Family Type | # Families | Family Size |
| Married-Couple | 198 (75.0%) | 3.85 |
| Single Male/Father | 0 (0.0%) | - |
| Single Female/Mother | 66 (25.0%) | 2.71 |
| Total Families | 264 (100.0%) | 3.56 |
Median Household Size in Livingston Wheeler
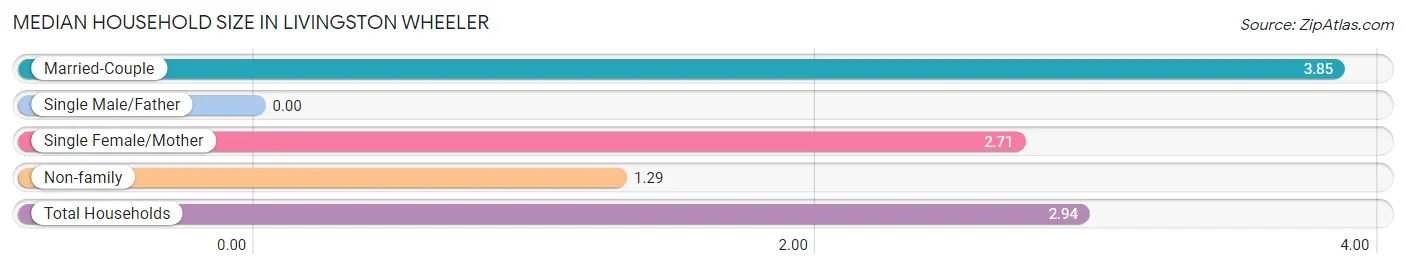
| Household Type | # Households | Household Size |
| Married-Couple | 198 (54.4%) | 3.85 |
| Single Male/Father | 0 (0.0%) | - |
| Single Female/Mother | 66 (18.1%) | 2.71 |
| Non-family | 100 (27.5%) | 1.29 |
| Total Households | 364 (100.0%) | 2.94 |
Household Size by Marriage Status in Livingston Wheeler
Out of a total of 364 households in Livingston Wheeler, 264 (72.5%) are family households, while 100 (27.5%) are nonfamily households. The most numerous type of family households are 5-person households, comprising 83, and the most common type of nonfamily households are 1-person households, comprising 58.
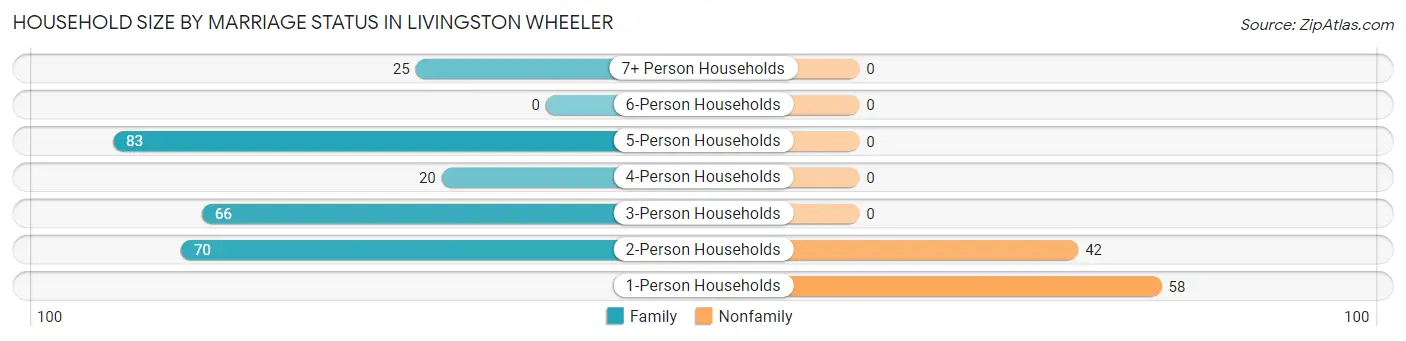
| Household Size | Family Households | Nonfamily Households |
| 1-Person Households | - | 58 (15.9%) |
| 2-Person Households | 70 (19.2%) | 42 (11.5%) |
| 3-Person Households | 66 (18.1%) | 0 (0.0%) |
| 4-Person Households | 20 (5.5%) | 0 (0.0%) |
| 5-Person Households | 83 (22.8%) | 0 (0.0%) |
| 6-Person Households | 0 (0.0%) | 0 (0.0%) |
| 7+ Person Households | 25 (6.9%) | 0 (0.0%) |
| Total | 264 (72.5%) | 100 (27.5%) |
Female Fertility in Livingston Wheeler
Fertility by Age in Livingston Wheeler
| Age Bracket | Women with Births | Births / 1,000 Women |
| 15 to 19 years | 0 (0.0%) | 0.0 |
| 20 to 34 years | 0 (0.0%) | 0.0 |
| 35 to 50 years | 0 (0.0%) | 0.0 |
| Total | 0 (0.0%) | 0.0 |
Fertility by Age by Marriage Status in Livingston Wheeler
| Age Bracket | Married | Unmarried |
| 15 to 19 years | 0 (0.0%) | 0 (0.0%) |
| 20 to 34 years | 0 (0.0%) | 0 (0.0%) |
| 35 to 50 years | 0 (0.0%) | 0 (0.0%) |
| Total | 0 (0.0%) | 0 (0.0%) |
Fertility by Education in Livingston Wheeler
| Educational Attainment | Women with Births | Births / 1,000 Women |
| Less than High School | 0 (0.0%) | 0.0 |
| High School Diploma | 0 (0.0%) | 0.0 |
| College or Associate's Degree | 0 (0.0%) | 0.0 |
| Bachelor's Degree | 0 (0.0%) | 0.0 |
| Graduate Degree | 0 (0.0%) | 0.0 |
| Total | 0 (0.0%) | 0.0 |
Fertility by Education by Marriage Status in Livingston Wheeler
| Educational Attainment | Married | Unmarried |
| Less than High School | 0 (0.0%) | 0 (0.0%) |
| High School Diploma | 0 (0.0%) | 0 (0.0%) |
| College or Associate's Degree | 0 (0.0%) | 0 (0.0%) |
| Bachelor's Degree | 0 (0.0%) | 0 (0.0%) |
| Graduate Degree | 0 (0.0%) | 0 (0.0%) |
| Total | 0 (0.0%) | 0 (0.0%) |
Employment Characteristics in Livingston Wheeler
Employment by Class of Employer in Livingston Wheeler
Among the 280 employed individuals in Livingston Wheeler, private company employees (214 | 76.4%), and state government employees (66 | 23.6%) make up the most common classes of employment.
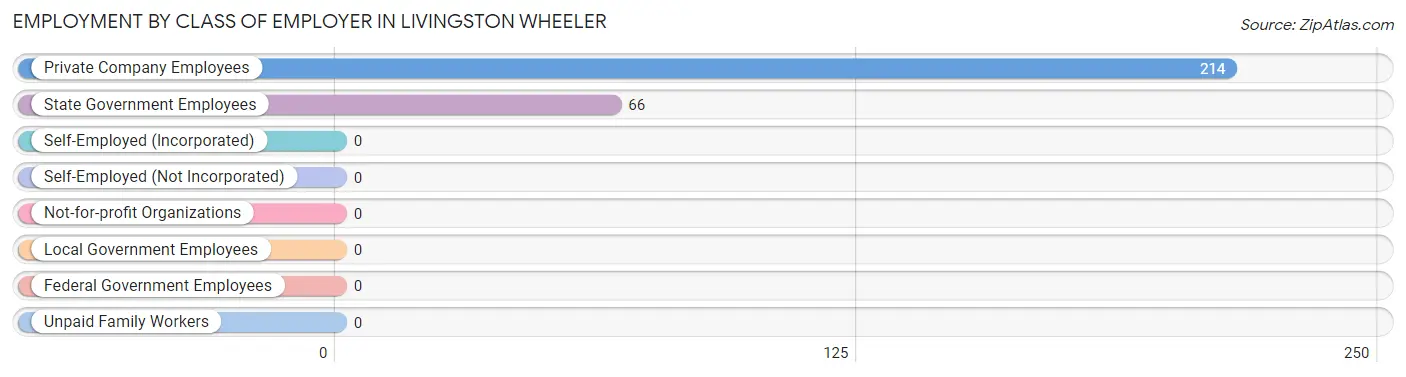
| Employer Class | # Employees | % Employees |
| Private Company Employees | 214 | 76.4% |
| Self-Employed (Incorporated) | 0 | 0.0% |
| Self-Employed (Not Incorporated) | 0 | 0.0% |
| Not-for-profit Organizations | 0 | 0.0% |
| Local Government Employees | 0 | 0.0% |
| State Government Employees | 66 | 23.6% |
| Federal Government Employees | 0 | 0.0% |
| Unpaid Family Workers | 0 | 0.0% |
| Total | 280 | 100.0% |
Employment Status by Age in Livingston Wheeler
According to the labor force statistics for Livingston Wheeler, out of the total population over 16 years of age (741), 41.7% or 309 individuals are in the labor force, with 9.4% or 29 of them unemployed. The age group with the highest labor force participation rate is 25 to 29 years, with 100.0% or 66 individuals in the labor force. Within the labor force, the 35 to 44 years age range has the highest percentage of unemployed individuals, with 12.8% or 29 of them being unemployed.
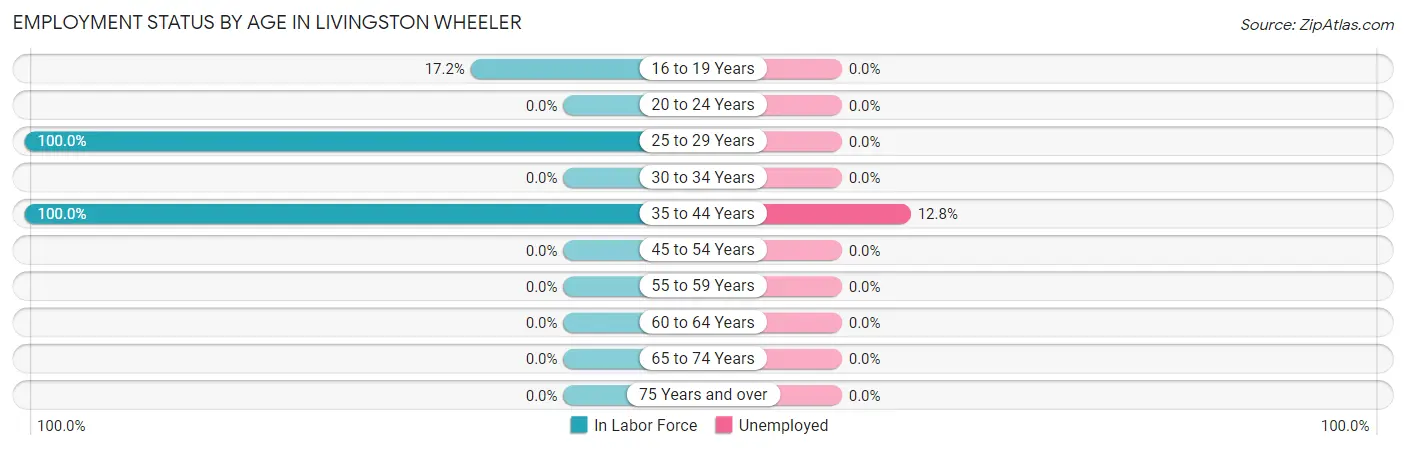
| Age Bracket | In Labor Force | Unemployed |
| 16 to 19 Years | 17 (17.2%) | 0 (0.0%) |
| 20 to 24 Years | 0 (0.0%) | 0 (0.0%) |
| 25 to 29 Years | 66 (100.0%) | 0 (0.0%) |
| 30 to 34 Years | 0 (0.0%) | 0 (0.0%) |
| 35 to 44 Years | 226 (100.0%) | 29 (12.8%) |
| 45 to 54 Years | 0 (0.0%) | 0 (0.0%) |
| 55 to 59 Years | 0 (0.0%) | 0 (0.0%) |
| 60 to 64 Years | 0 (0.0%) | 0 (0.0%) |
| 65 to 74 Years | 0 (0.0%) | 0 (0.0%) |
| 75 Years and over | 0 (0.0%) | 0 (0.0%) |
| Total | 309 (41.7%) | 29 (9.4%) |
Employment Status by Educational Attainment in Livingston Wheeler
According to labor force statistics for Livingston Wheeler, 76.6% of individuals (292) out of the total population between 25 and 64 years of age (381) are in the labor force, with 9.9% or 29 of them being unemployed. The group with the highest labor force participation rate are those with the educational attainment of less than high school, with 100.0% or 42 individuals in the labor force. Within the labor force, individuals with college / associate degree education have the highest percentage of unemployment, with 13.0% or 29 of them being unemployed.
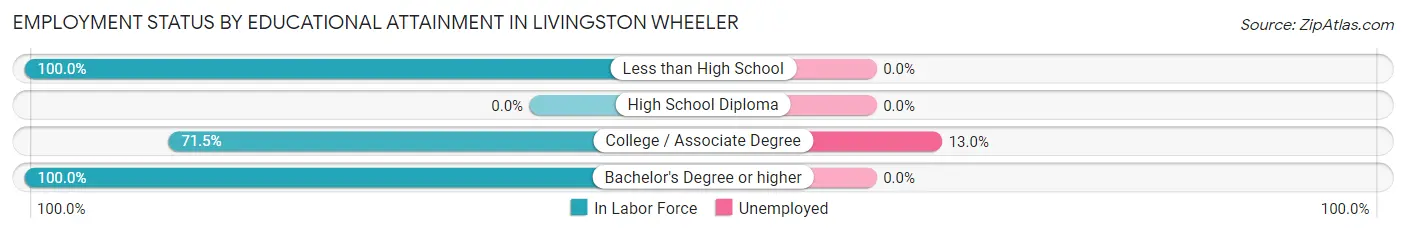
| Educational Attainment | In Labor Force | Unemployed |
| Less than High School | 42 (100.0%) | 0 (0.0%) |
| High School Diploma | 0 (0.0%) | 0 (0.0%) |
| College / Associate Degree | 223 (71.5%) | 41 (13.0%) |
| Bachelor's Degree or higher | 27 (100.0%) | 0 (0.0%) |
| Total | 292 (76.6%) | 38 (9.9%) |
Employment Occupations by Sex in Livingston Wheeler
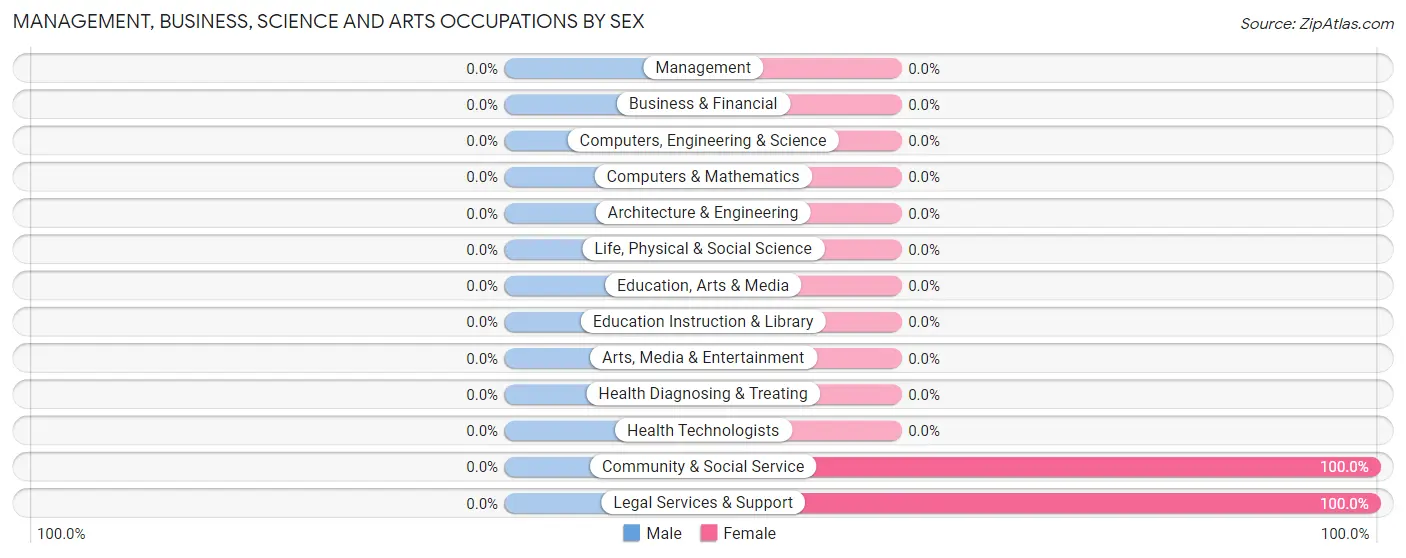
Management, Business, Science and Arts Occupations
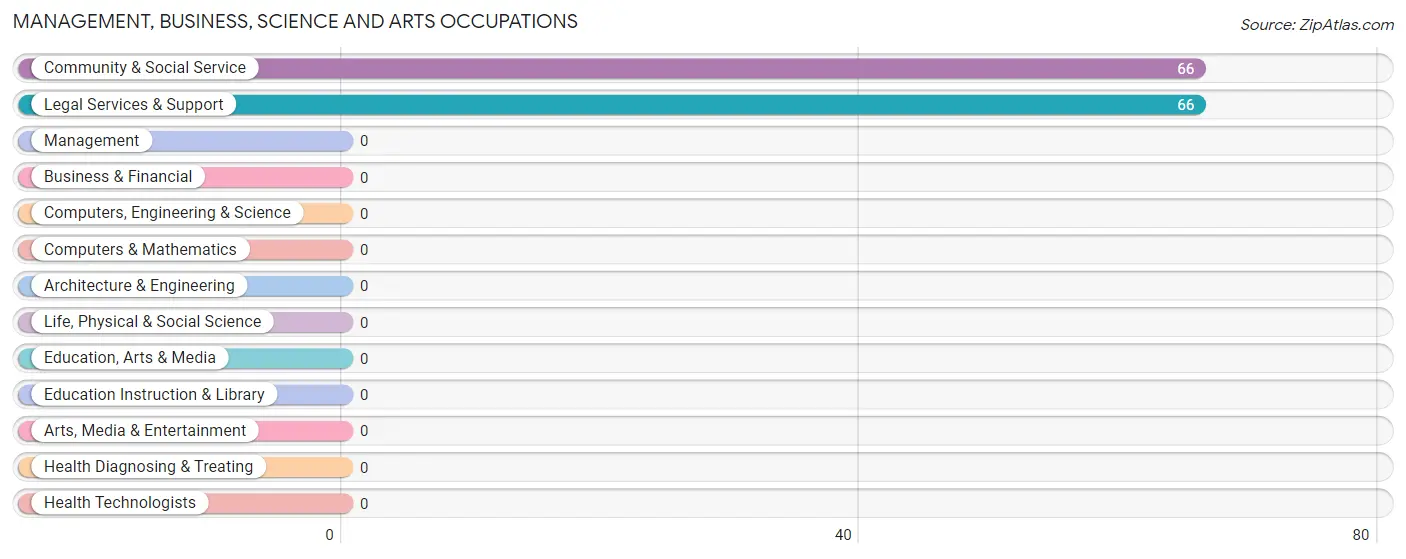
The most common Management, Business, Science and Arts occupations in Livingston Wheeler are Community & Social Service (66 | 23.6%), and Legal Services & Support (66 | 23.6%).
Management, Business, Science and Arts Occupations by Sex
| Occupation | Male | Female |
| Management | 0 (0.0%) | 0 (0.0%) |
| Business & Financial | 0 (0.0%) | 0 (0.0%) |
| Computers, Engineering & Science | 0 (0.0%) | 0 (0.0%) |
| Computers & Mathematics | 0 (0.0%) | 0 (0.0%) |
| Architecture & Engineering | 0 (0.0%) | 0 (0.0%) |
| Life, Physical & Social Science | 0 (0.0%) | 0 (0.0%) |
| Community & Social Service | 0 (0.0%) | 66 (100.0%) |
| Education, Arts & Media | 0 (0.0%) | 0 (0.0%) |
| Legal Services & Support | 0 (0.0%) | 66 (100.0%) |
| Education Instruction & Library | 0 (0.0%) | 0 (0.0%) |
| Arts, Media & Entertainment | 0 (0.0%) | 0 (0.0%) |
| Health Diagnosing & Treating | 0 (0.0%) | 0 (0.0%) |
| Health Technologists | 0 (0.0%) | 0 (0.0%) |
| Total (Category) | 0 (0.0%) | 66 (100.0%) |
| Total (Overall) | 194 (69.3%) | 86 (30.7%) |
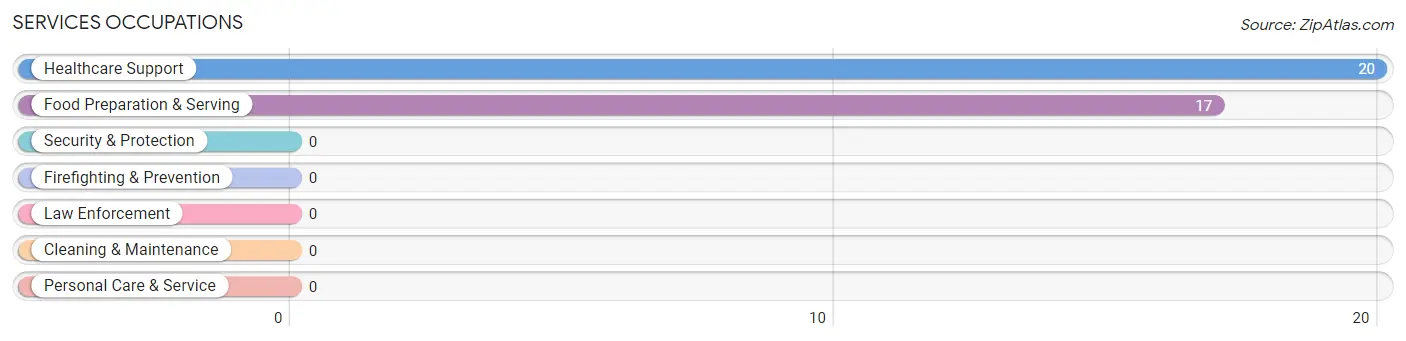
Services Occupations
The most common Services occupations in Livingston Wheeler are Healthcare Support (20 | 7.1%), and Food Preparation & Serving (17 | 6.1%).
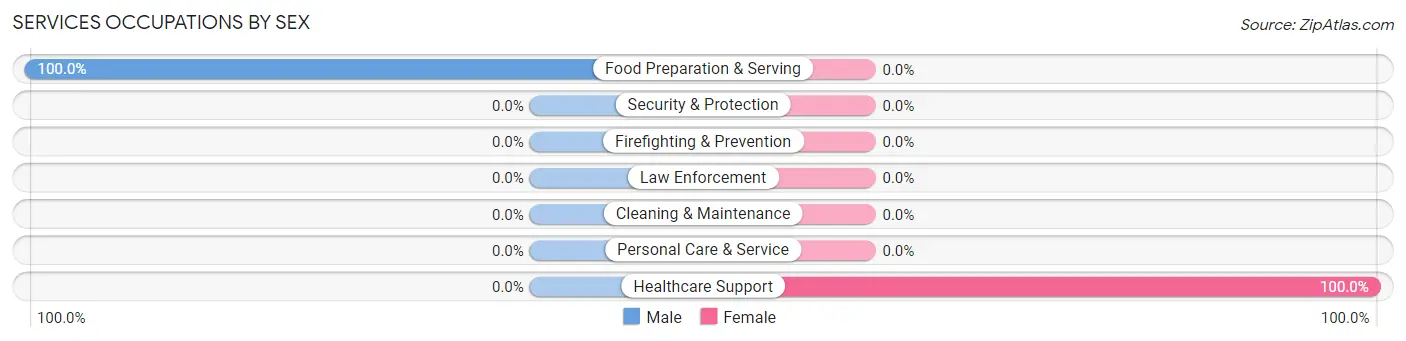
Services Occupations by Sex
| Occupation | Male | Female |
| Healthcare Support | 0 (0.0%) | 20 (100.0%) |
| Security & Protection | 0 (0.0%) | 0 (0.0%) |
| Firefighting & Prevention | 0 (0.0%) | 0 (0.0%) |
| Law Enforcement | 0 (0.0%) | 0 (0.0%) |
| Food Preparation & Serving | 17 (100.0%) | 0 (0.0%) |
| Cleaning & Maintenance | 0 (0.0%) | 0 (0.0%) |
| Personal Care & Service | 0 (0.0%) | 0 (0.0%) |
| Total (Category) | 17 (46.0%) | 20 (54.0%) |
| Total (Overall) | 194 (69.3%) | 86 (30.7%) |
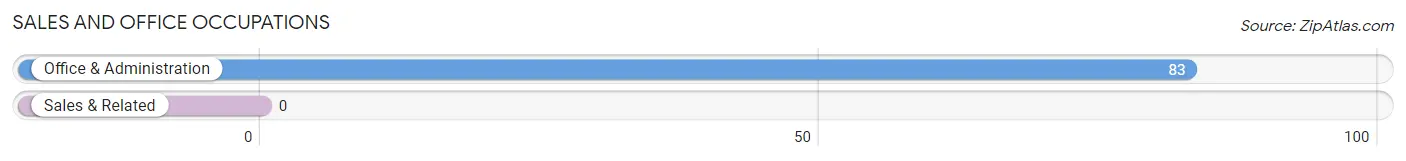
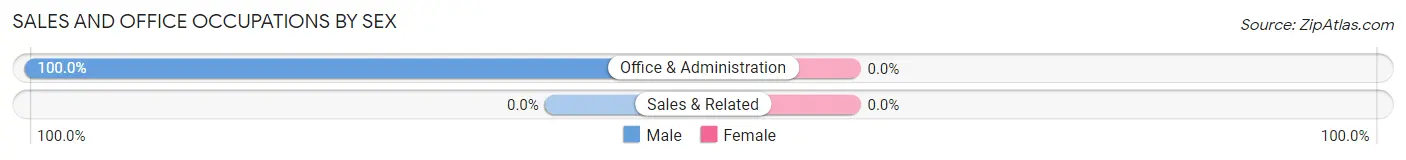
Sales and Office Occupations
The most common Sales and Office occupations in Livingston Wheeler are , and Office & Administration (83 | 29.6%).
Sales and Office Occupations by Sex
| Occupation | Male | Female |
| Sales & Related | 0 (0.0%) | 0 (0.0%) |
| Office & Administration | 83 (100.0%) | 0 (0.0%) |
| Total (Category) | 83 (100.0%) | 0 (0.0%) |
| Total (Overall) | 194 (69.3%) | 86 (30.7%) |
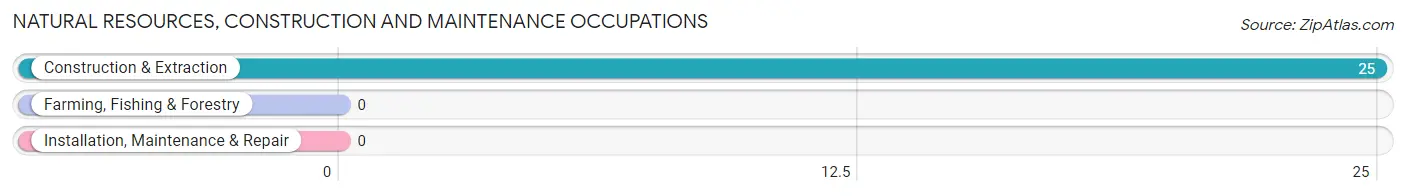
Natural Resources, Construction and Maintenance Occupations
The most common Natural Resources, Construction and Maintenance occupations in Livingston Wheeler are , and Construction & Extraction (25 | 8.9%).
Natural Resources, Construction and Maintenance Occupations by Sex
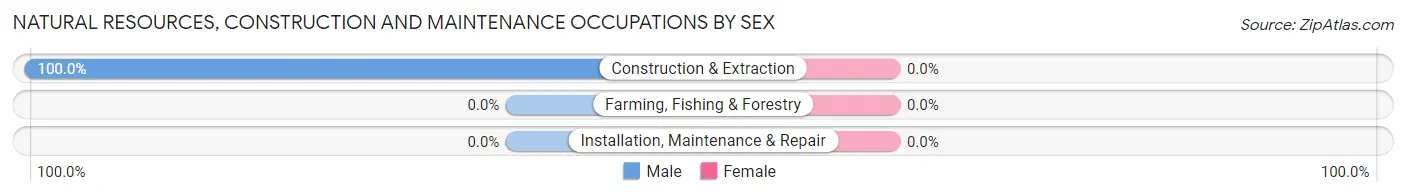
| Occupation | Male | Female |
| Farming, Fishing & Forestry | 0 (0.0%) | 0 (0.0%) |
| Construction & Extraction | 25 (100.0%) | 0 (0.0%) |
| Installation, Maintenance & Repair | 0 (0.0%) | 0 (0.0%) |
| Total (Category) | 25 (100.0%) | 0 (0.0%) |
| Total (Overall) | 194 (69.3%) | 86 (30.7%) |
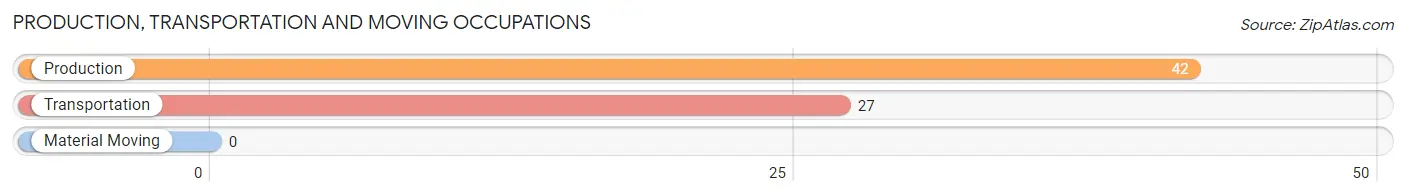
Production, Transportation and Moving Occupations
The most common Production, Transportation and Moving occupations in Livingston Wheeler are Production (42 | 15.0%), and Transportation (27 | 9.6%).
Production, Transportation and Moving Occupations by Sex
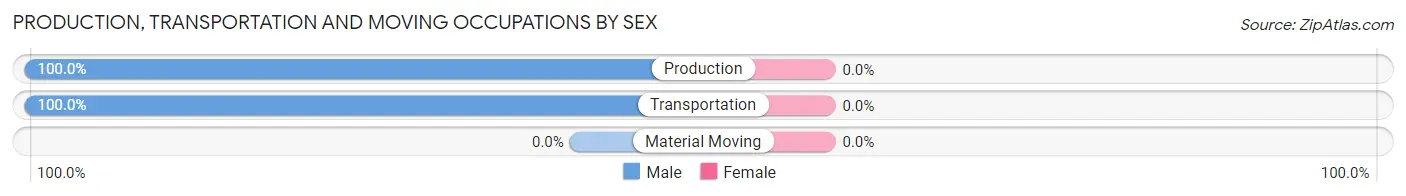
| Occupation | Male | Female |
| Production | 42 (100.0%) | 0 (0.0%) |
| Transportation | 27 (100.0%) | 0 (0.0%) |
| Material Moving | 0 (0.0%) | 0 (0.0%) |
| Total (Category) | 69 (100.0%) | 0 (0.0%) |
| Total (Overall) | 194 (69.3%) | 86 (30.7%) |
Employment Industries by Sex in Livingston Wheeler
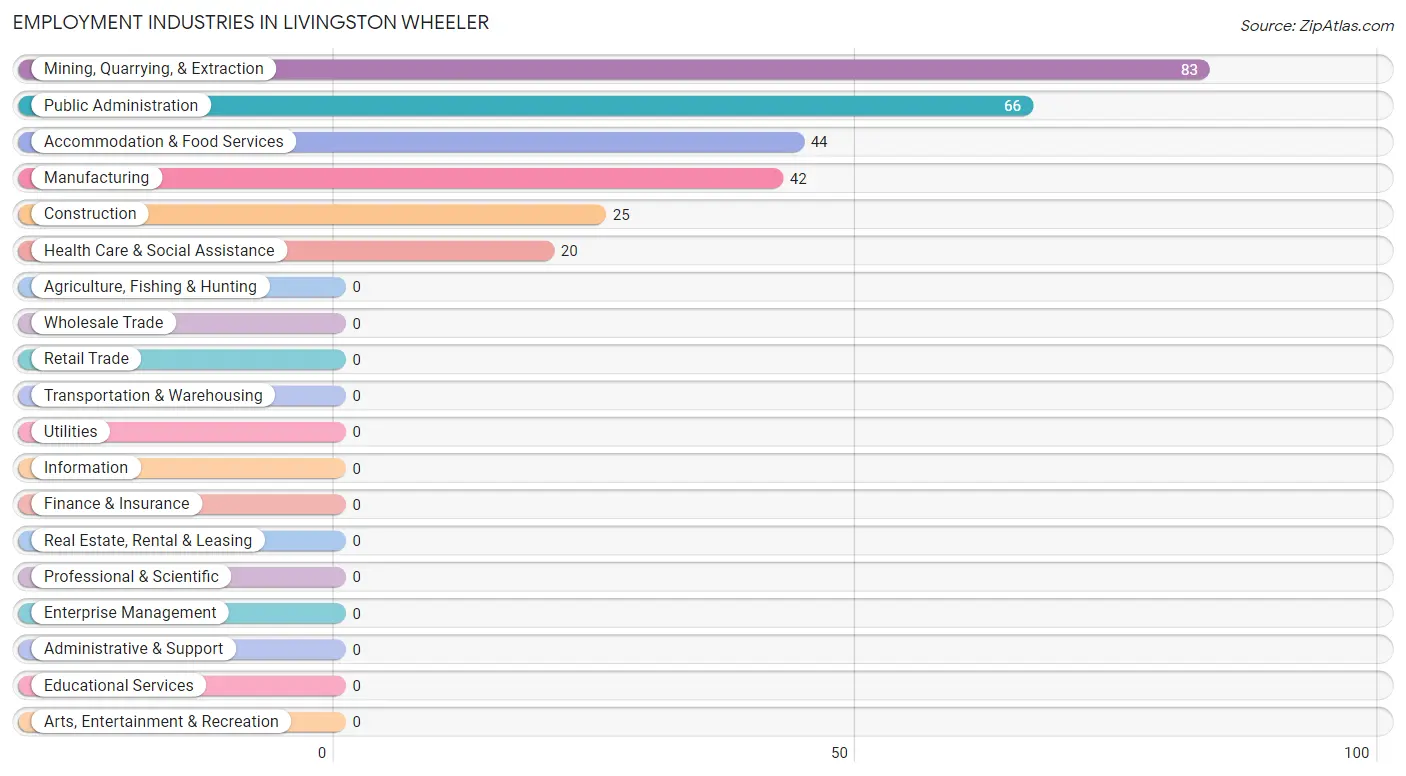
Employment Industries in Livingston Wheeler
The major employment industries in Livingston Wheeler include Mining, Quarrying, & Extraction (83 | 29.6%), Public Administration (66 | 23.6%), Accommodation & Food Services (44 | 15.7%), Manufacturing (42 | 15.0%), and Construction (25 | 8.9%).
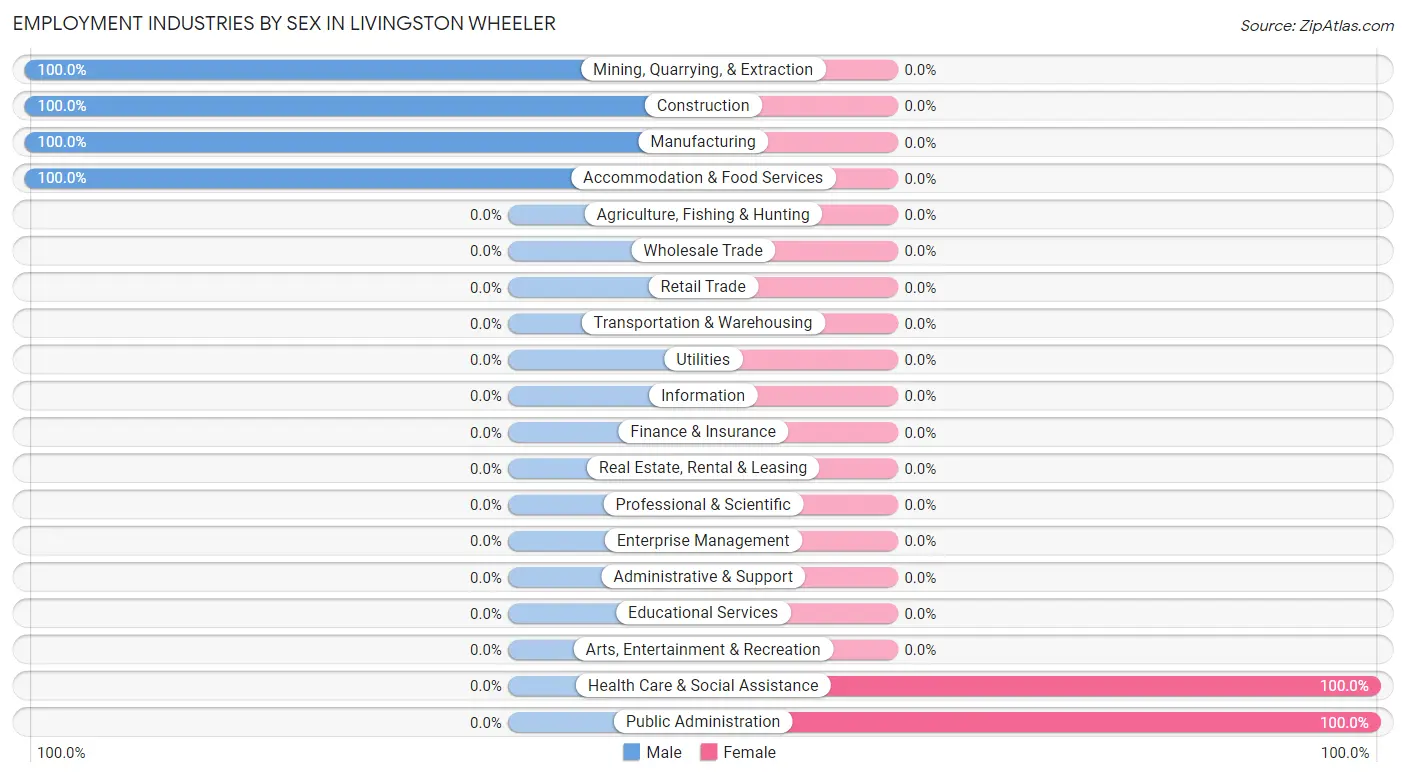
Employment Industries by Sex in Livingston Wheeler
The Livingston Wheeler industries that see more men than women are Mining, Quarrying, & Extraction (100.0%), Construction (100.0%), and Manufacturing (100.0%), whereas the industries that tend to have a higher number of women are Health Care & Social Assistance (100.0%), and Public Administration (100.0%).
| Industry | Male | Female |
| Agriculture, Fishing & Hunting | 0 (0.0%) | 0 (0.0%) |
| Mining, Quarrying, & Extraction | 83 (100.0%) | 0 (0.0%) |
| Construction | 25 (100.0%) | 0 (0.0%) |
| Manufacturing | 42 (100.0%) | 0 (0.0%) |
| Wholesale Trade | 0 (0.0%) | 0 (0.0%) |
| Retail Trade | 0 (0.0%) | 0 (0.0%) |
| Transportation & Warehousing | 0 (0.0%) | 0 (0.0%) |
| Utilities | 0 (0.0%) | 0 (0.0%) |
| Information | 0 (0.0%) | 0 (0.0%) |
| Finance & Insurance | 0 (0.0%) | 0 (0.0%) |
| Real Estate, Rental & Leasing | 0 (0.0%) | 0 (0.0%) |
| Professional & Scientific | 0 (0.0%) | 0 (0.0%) |
| Enterprise Management | 0 (0.0%) | 0 (0.0%) |
| Administrative & Support | 0 (0.0%) | 0 (0.0%) |
| Educational Services | 0 (0.0%) | 0 (0.0%) |
| Health Care & Social Assistance | 0 (0.0%) | 20 (100.0%) |
| Arts, Entertainment & Recreation | 0 (0.0%) | 0 (0.0%) |
| Accommodation & Food Services | 44 (100.0%) | 0 (0.0%) |
| Public Administration | 0 (0.0%) | 66 (100.0%) |
| Total | 194 (69.3%) | 86 (30.7%) |
Education in Livingston Wheeler
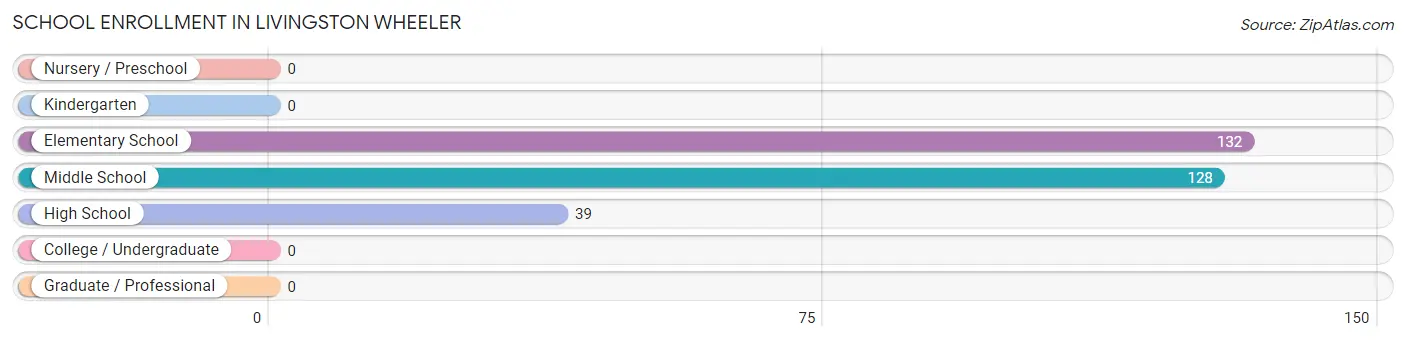
School Enrollment in Livingston Wheeler
The most common levels of schooling among the 299 students in Livingston Wheeler are elementary school (132 | 44.2%), middle school (128 | 42.8%), and high school (39 | 13.0%).
| School Level | # Students | % Students |
| Nursery / Preschool | 0 | 0.0% |
| Kindergarten | 0 | 0.0% |
| Elementary School | 132 | 44.2% |
| Middle School | 128 | 42.8% |
| High School | 39 | 13.0% |
| College / Undergraduate | 0 | 0.0% |
| Graduate / Professional | 0 | 0.0% |
| Total | 299 | 100.0% |
School Enrollment by Age by Funding Source in Livingston Wheeler
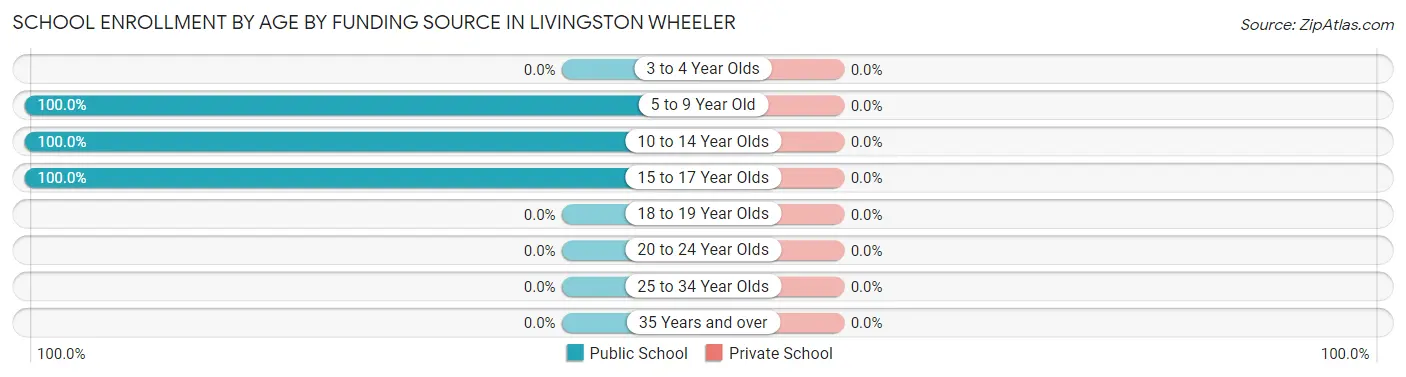
| Age Bracket | Public School | Private School |
| 3 to 4 Year Olds | 0 (0.0%) | 0 (0.0%) |
| 5 to 9 Year Old | 132 (100.0%) | 0 (0.0%) |
| 10 to 14 Year Olds | 106 (100.0%) | 0 (0.0%) |
| 15 to 17 Year Olds | 61 (100.0%) | 0 (0.0%) |
| 18 to 19 Year Olds | 0 (0.0%) | 0 (0.0%) |
| 20 to 24 Year Olds | 0 (0.0%) | 0 (0.0%) |
| 25 to 34 Year Olds | 0 (0.0%) | 0 (0.0%) |
| 35 Years and over | 0 (0.0%) | 0 (0.0%) |
| Total | 299 (100.0%) | 0 (0.0%) |
Educational Attainment by Field of Study in Livingston Wheeler
, and engineering (27 | 100.0%) are the most common fields of study among 27 individuals in Livingston Wheeler who have obtained a bachelor's degree or higher.
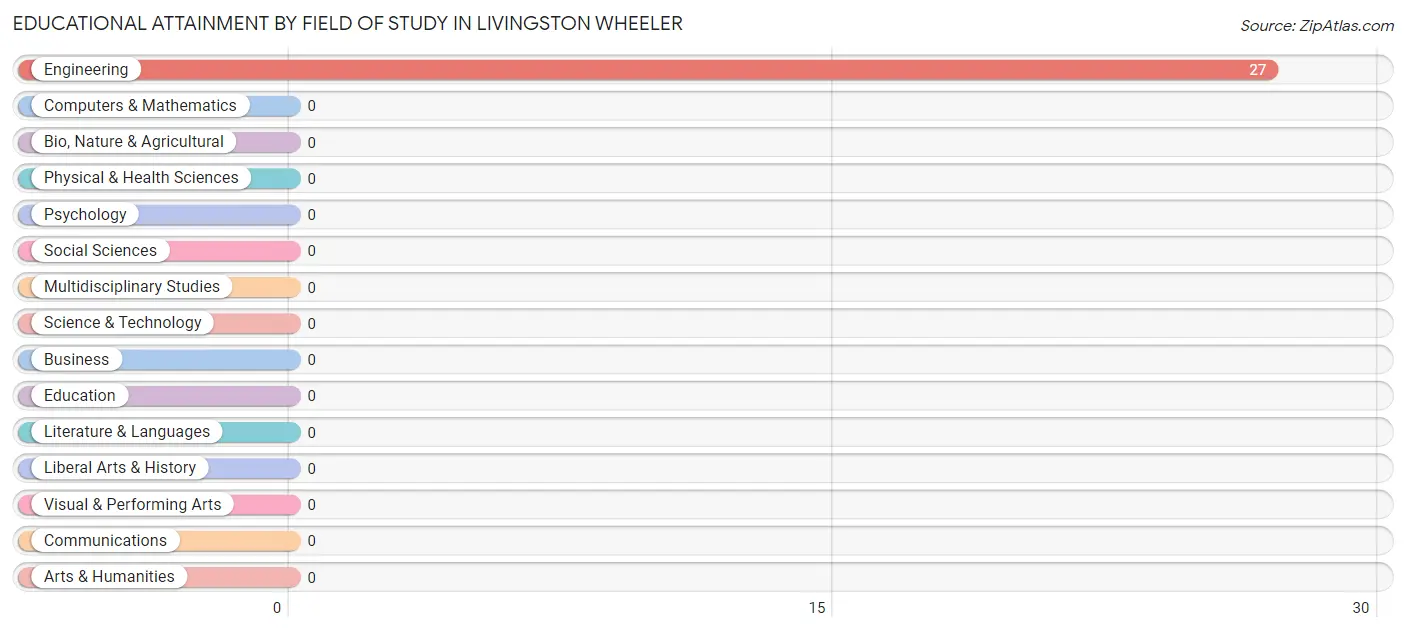
| Field of Study | # Graduates | % Graduates |
| Computers & Mathematics | 0 | 0.0% |
| Bio, Nature & Agricultural | 0 | 0.0% |
| Physical & Health Sciences | 0 | 0.0% |
| Psychology | 0 | 0.0% |
| Social Sciences | 0 | 0.0% |
| Engineering | 27 | 100.0% |
| Multidisciplinary Studies | 0 | 0.0% |
| Science & Technology | 0 | 0.0% |
| Business | 0 | 0.0% |
| Education | 0 | 0.0% |
| Literature & Languages | 0 | 0.0% |
| Liberal Arts & History | 0 | 0.0% |
| Visual & Performing Arts | 0 | 0.0% |
| Communications | 0 | 0.0% |
| Arts & Humanities | 0 | 0.0% |
| Total | 27 | 100.0% |
Transportation & Commute in Livingston Wheeler
Vehicle Availability by Sex in Livingston Wheeler
The most prevalent vehicle ownership categories in Livingston Wheeler are males with 4 vehicles (83, accounting for 42.8%) and females with 4 vehicles (0, making up 96.5%).
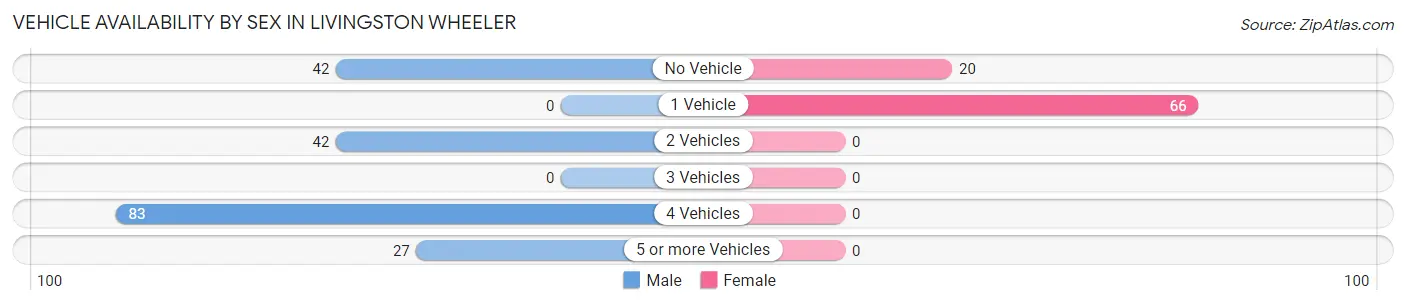
| Vehicles Available | Male | Female |
| No Vehicle | 42 (21.6%) | 20 (23.3%) |
| 1 Vehicle | 0 (0.0%) | 66 (76.7%) |
| 2 Vehicles | 42 (21.6%) | 0 (0.0%) |
| 3 Vehicles | 0 (0.0%) | 0 (0.0%) |
| 4 Vehicles | 83 (42.8%) | 0 (0.0%) |
| 5 or more Vehicles | 27 (13.9%) | 0 (0.0%) |
| Total | 194 (100.0%) | 86 (100.0%) |
Commute Time in Livingston Wheeler
The most frequently occuring commute durations in Livingston Wheeler are 15 to 19 minutes (194 commuters, 69.3%), 10 to 14 minutes (42 commuters, 15.0%), and 5 to 9 minutes (27 commuters, 9.6%).
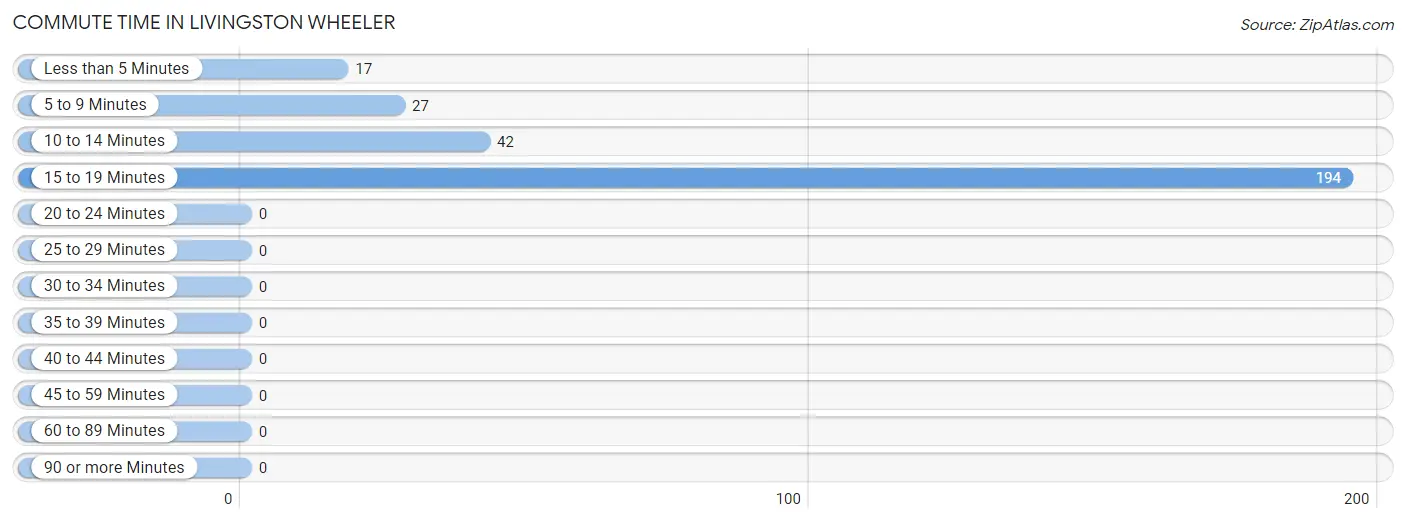
| Commute Time | # Commuters | % Commuters |
| Less than 5 Minutes | 17 | 6.1% |
| 5 to 9 Minutes | 27 | 9.6% |
| 10 to 14 Minutes | 42 | 15.0% |
| 15 to 19 Minutes | 194 | 69.3% |
| 20 to 24 Minutes | 0 | 0.0% |
| 25 to 29 Minutes | 0 | 0.0% |
| 30 to 34 Minutes | 0 | 0.0% |
| 35 to 39 Minutes | 0 | 0.0% |
| 40 to 44 Minutes | 0 | 0.0% |
| 45 to 59 Minutes | 0 | 0.0% |
| 60 to 89 Minutes | 0 | 0.0% |
| 90 or more Minutes | 0 | 0.0% |
Commute Time by Sex in Livingston Wheeler
The most common commute times in Livingston Wheeler are 15 to 19 minutes (108 commuters, 55.7%) for males and 15 to 19 minutes (86 commuters, 100.0%) for females.
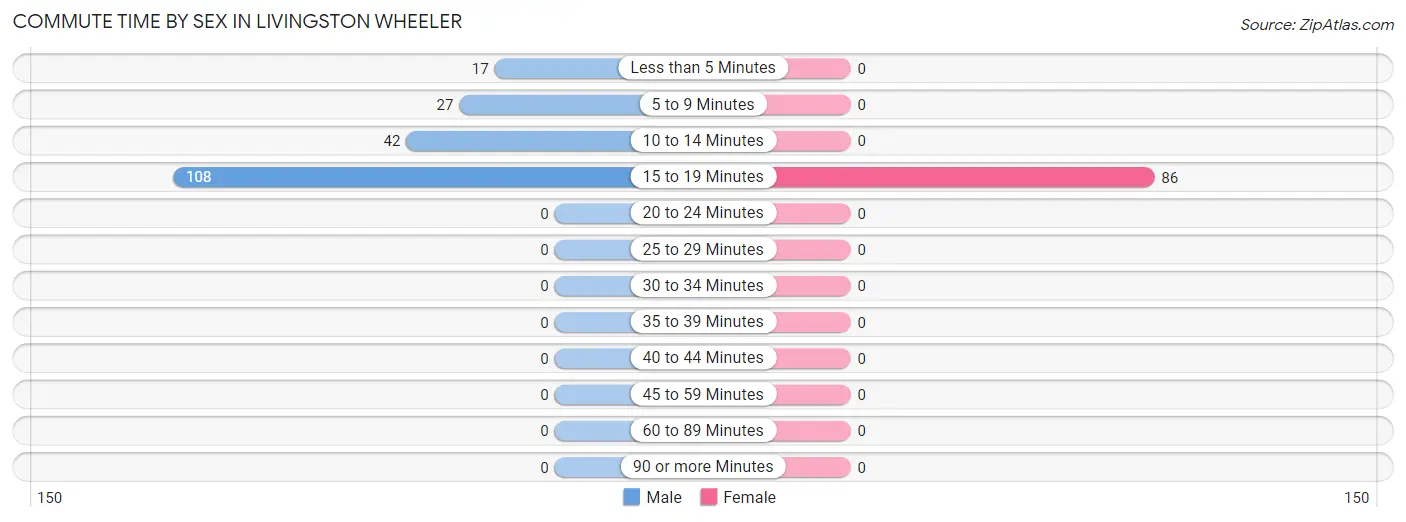
| Commute Time | Male | Female |
| Less than 5 Minutes | 17 (8.8%) | 0 (0.0%) |
| 5 to 9 Minutes | 27 (13.9%) | 0 (0.0%) |
| 10 to 14 Minutes | 42 (21.6%) | 0 (0.0%) |
| 15 to 19 Minutes | 108 (55.7%) | 86 (100.0%) |
| 20 to 24 Minutes | 0 (0.0%) | 0 (0.0%) |
| 25 to 29 Minutes | 0 (0.0%) | 0 (0.0%) |
| 30 to 34 Minutes | 0 (0.0%) | 0 (0.0%) |
| 35 to 39 Minutes | 0 (0.0%) | 0 (0.0%) |
| 40 to 44 Minutes | 0 (0.0%) | 0 (0.0%) |
| 45 to 59 Minutes | 0 (0.0%) | 0 (0.0%) |
| 60 to 89 Minutes | 0 (0.0%) | 0 (0.0%) |
| 90 or more Minutes | 0 (0.0%) | 0 (0.0%) |
Time of Departure to Work by Sex in Livingston Wheeler
The most frequent times of departure to work in Livingston Wheeler are 6:00 AM to 6:29 AM (83, 42.8%) for males and 7:30 AM to 7:59 AM (66, 76.7%) for females.
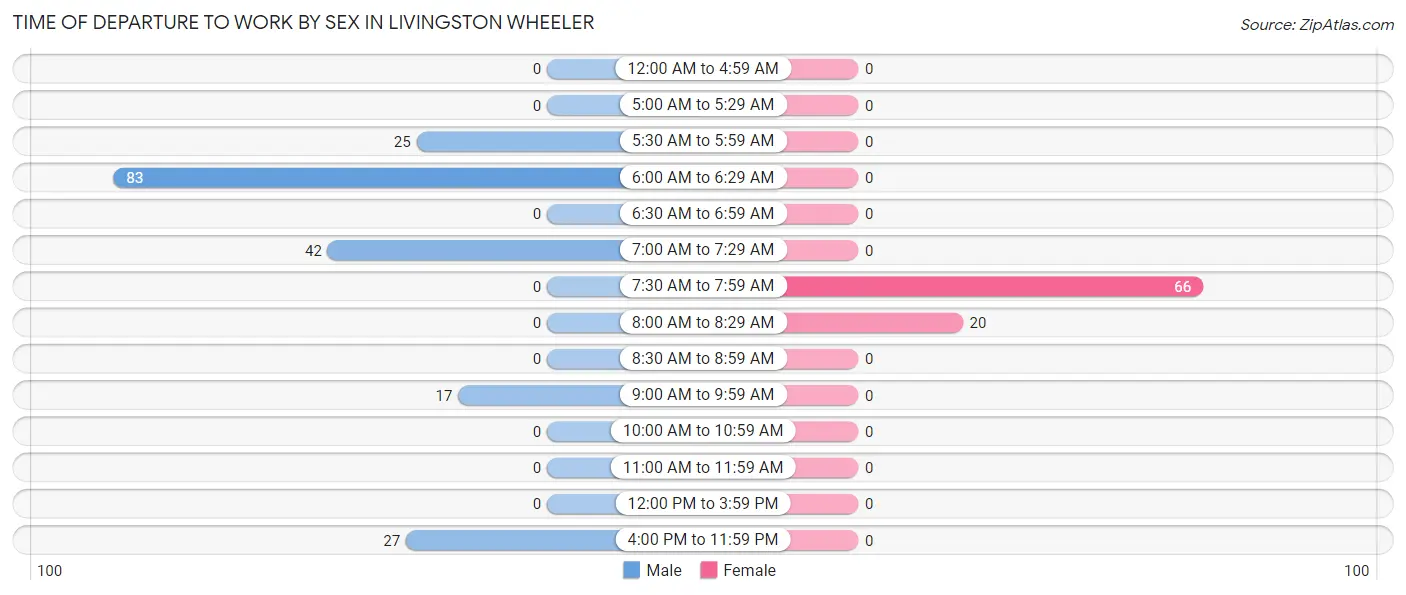
| Time of Departure | Male | Female |
| 12:00 AM to 4:59 AM | 0 (0.0%) | 0 (0.0%) |
| 5:00 AM to 5:29 AM | 0 (0.0%) | 0 (0.0%) |
| 5:30 AM to 5:59 AM | 25 (12.9%) | 0 (0.0%) |
| 6:00 AM to 6:29 AM | 83 (42.8%) | 0 (0.0%) |
| 6:30 AM to 6:59 AM | 0 (0.0%) | 0 (0.0%) |
| 7:00 AM to 7:29 AM | 42 (21.6%) | 0 (0.0%) |
| 7:30 AM to 7:59 AM | 0 (0.0%) | 66 (76.7%) |
| 8:00 AM to 8:29 AM | 0 (0.0%) | 20 (23.3%) |
| 8:30 AM to 8:59 AM | 0 (0.0%) | 0 (0.0%) |
| 9:00 AM to 9:59 AM | 17 (8.8%) | 0 (0.0%) |
| 10:00 AM to 10:59 AM | 0 (0.0%) | 0 (0.0%) |
| 11:00 AM to 11:59 AM | 0 (0.0%) | 0 (0.0%) |
| 12:00 PM to 3:59 PM | 0 (0.0%) | 0 (0.0%) |
| 4:00 PM to 11:59 PM | 27 (13.9%) | 0 (0.0%) |
| Total | 194 (100.0%) | 86 (100.0%) |
Housing Occupancy in Livingston Wheeler
Occupancy by Ownership in Livingston Wheeler
Of the total 364 dwellings in Livingston Wheeler, owner-occupied units account for 298 (81.9%), while renter-occupied units make up 66 (18.1%).

| Occupancy | # Housing Units | % Housing Units |
| Owner Occupied Housing Units | 298 | 81.9% |
| Renter-Occupied Housing Units | 66 | 18.1% |
| Total Occupied Housing Units | 364 | 100.0% |
Occupancy by Household Size in Livingston Wheeler
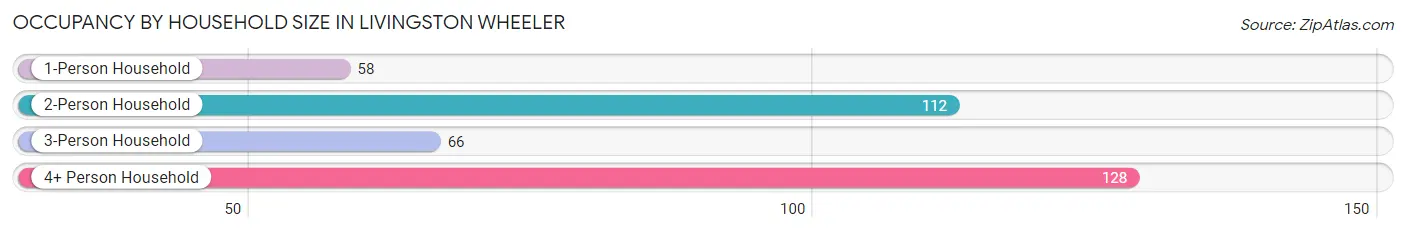
| Household Size | # Housing Units | % Housing Units |
| 1-Person Household | 58 | 15.9% |
| 2-Person Household | 112 | 30.8% |
| 3-Person Household | 66 | 18.1% |
| 4+ Person Household | 128 | 35.2% |
| Total Housing Units | 364 | 100.0% |
Occupancy by Ownership by Household Size in Livingston Wheeler
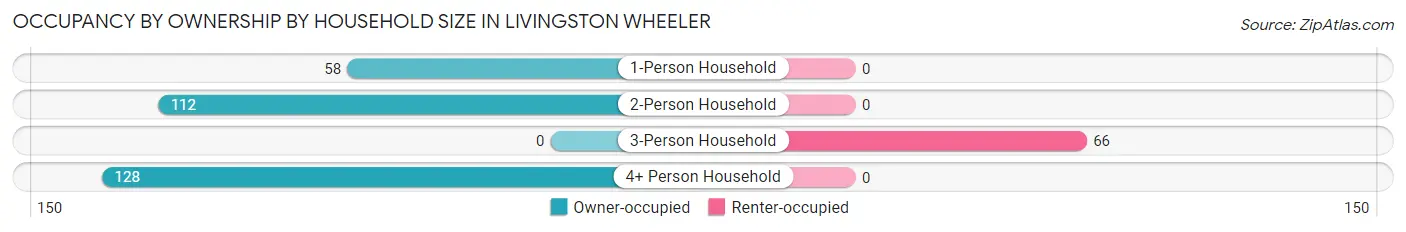
| Household Size | Owner-occupied | Renter-occupied |
| 1-Person Household | 58 (100.0%) | 0 (0.0%) |
| 2-Person Household | 112 (100.0%) | 0 (0.0%) |
| 3-Person Household | 0 (0.0%) | 66 (100.0%) |
| 4+ Person Household | 128 (100.0%) | 0 (0.0%) |
| Total Housing Units | 298 (81.9%) | 66 (18.1%) |
Occupancy by Educational Attainment in Livingston Wheeler
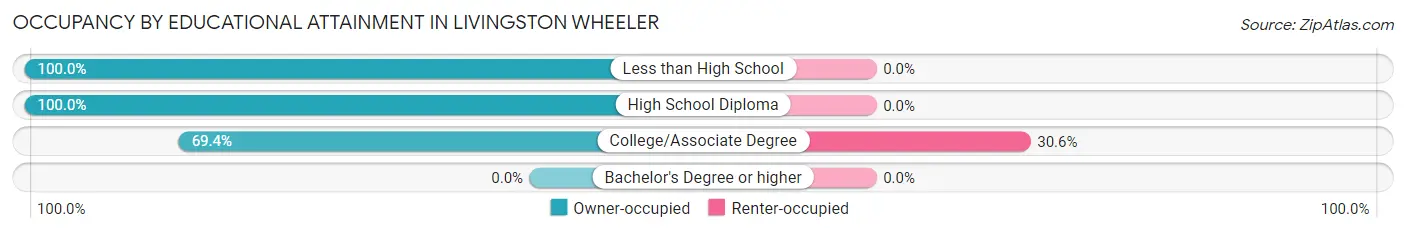
| Household Size | Owner-occupied | Renter-occupied |
| Less than High School | 42 (100.0%) | 0 (0.0%) |
| High School Diploma | 106 (100.0%) | 0 (0.0%) |
| College/Associate Degree | 150 (69.4%) | 66 (30.6%) |
| Bachelor's Degree or higher | 0 (0.0%) | 0 (0.0%) |
Occupancy by Age of Householder in Livingston Wheeler
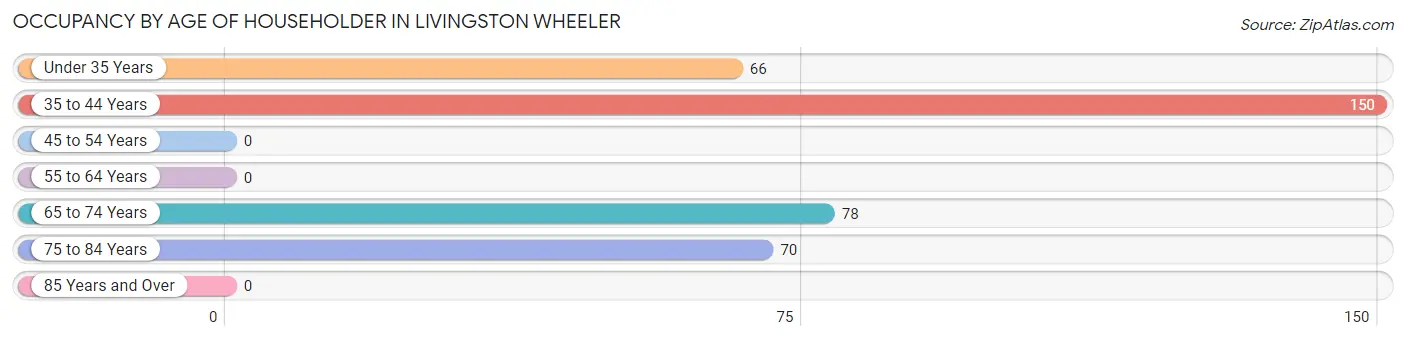
| Age Bracket | # Households | % Households |
| Under 35 Years | 66 | 18.1% |
| 35 to 44 Years | 150 | 41.2% |
| 45 to 54 Years | 0 | 0.0% |
| 55 to 64 Years | 0 | 0.0% |
| 65 to 74 Years | 78 | 21.4% |
| 75 to 84 Years | 70 | 19.2% |
| 85 Years and Over | 0 | 0.0% |
| Total | 364 | 100.0% |
Housing Finances in Livingston Wheeler
Median Income by Occupancy in Livingston Wheeler
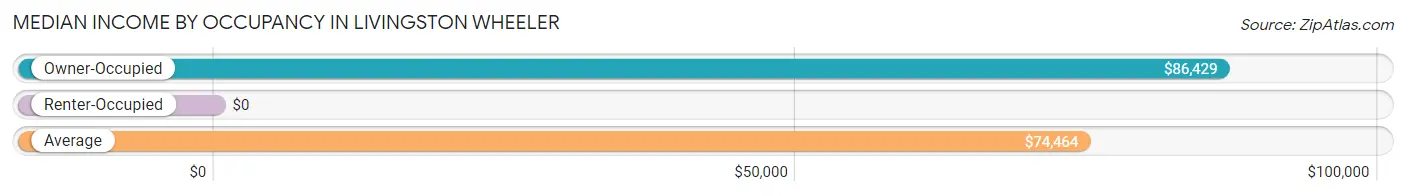
| Occupancy Type | # Households | Median Income |
| Owner-Occupied | 298 (81.9%) | $86,429 |
| Renter-Occupied | 66 (18.1%) | $0 |
| Average | 364 (100.0%) | $74,464 |
Occupancy by Householder Income Bracket in Livingston Wheeler
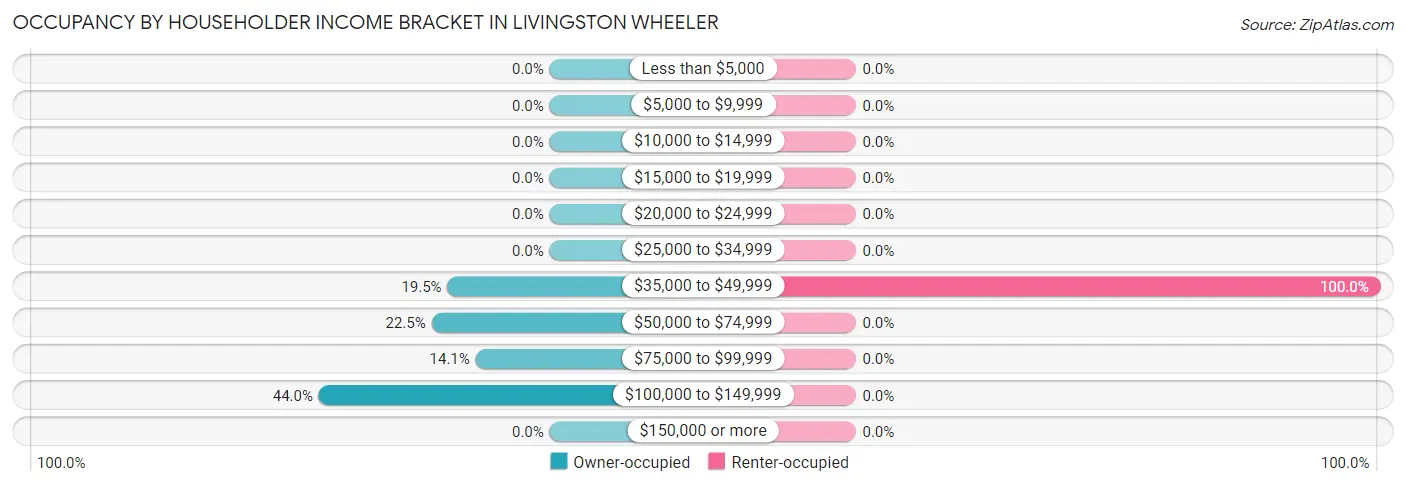
| Income Bracket | Owner-occupied | Renter-occupied |
| Less than $5,000 | 0 (0.0%) | 0 (0.0%) |
| $5,000 to $9,999 | 0 (0.0%) | 0 (0.0%) |
| $10,000 to $14,999 | 0 (0.0%) | 0 (0.0%) |
| $15,000 to $19,999 | 0 (0.0%) | 0 (0.0%) |
| $20,000 to $24,999 | 0 (0.0%) | 0 (0.0%) |
| $25,000 to $34,999 | 0 (0.0%) | 0 (0.0%) |
| $35,000 to $49,999 | 58 (19.5%) | 66 (100.0%) |
| $50,000 to $74,999 | 67 (22.5%) | 0 (0.0%) |
| $75,000 to $99,999 | 42 (14.1%) | 0 (0.0%) |
| $100,000 to $149,999 | 131 (44.0%) | 0 (0.0%) |
| $150,000 or more | 0 (0.0%) | 0 (0.0%) |
| Total | 298 (100.0%) | 66 (100.0%) |
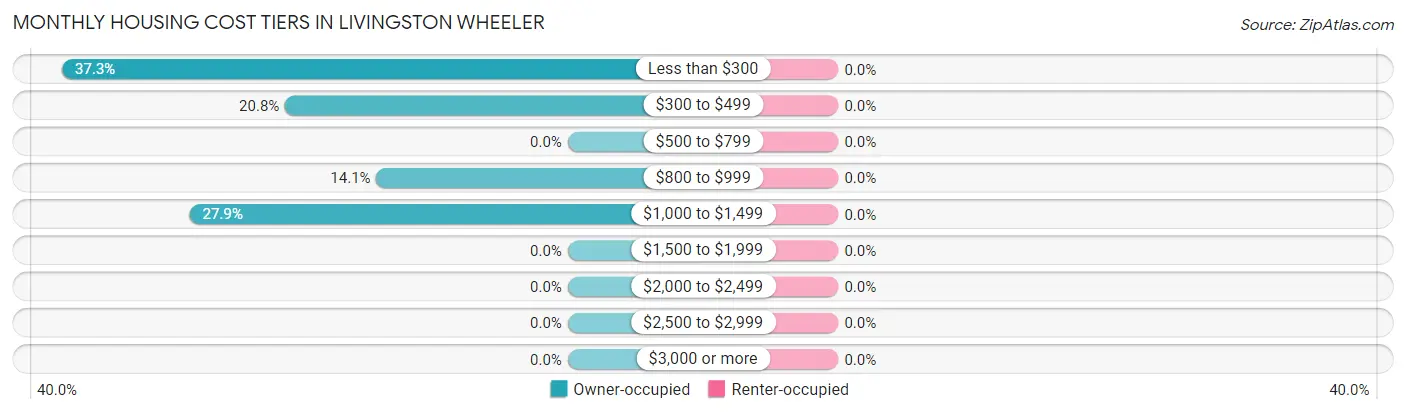
Monthly Housing Cost Tiers in Livingston Wheeler
| Monthly Cost | Owner-occupied | Renter-occupied |
| Less than $300 | 111 (37.2%) | 0 (0.0%) |
| $300 to $499 | 62 (20.8%) | 0 (0.0%) |
| $500 to $799 | 0 (0.0%) | 0 (0.0%) |
| $800 to $999 | 42 (14.1%) | 0 (0.0%) |
| $1,000 to $1,499 | 83 (27.9%) | 0 (0.0%) |
| $1,500 to $1,999 | 0 (0.0%) | 0 (0.0%) |
| $2,000 to $2,499 | 0 (0.0%) | 0 (0.0%) |
| $2,500 to $2,999 | 0 (0.0%) | 0 (0.0%) |
| $3,000 or more | 0 (0.0%) | 0 (0.0%) |
| Total | 298 (100.0%) | 66 (100.0%) |
Physical Housing Characteristics in Livingston Wheeler
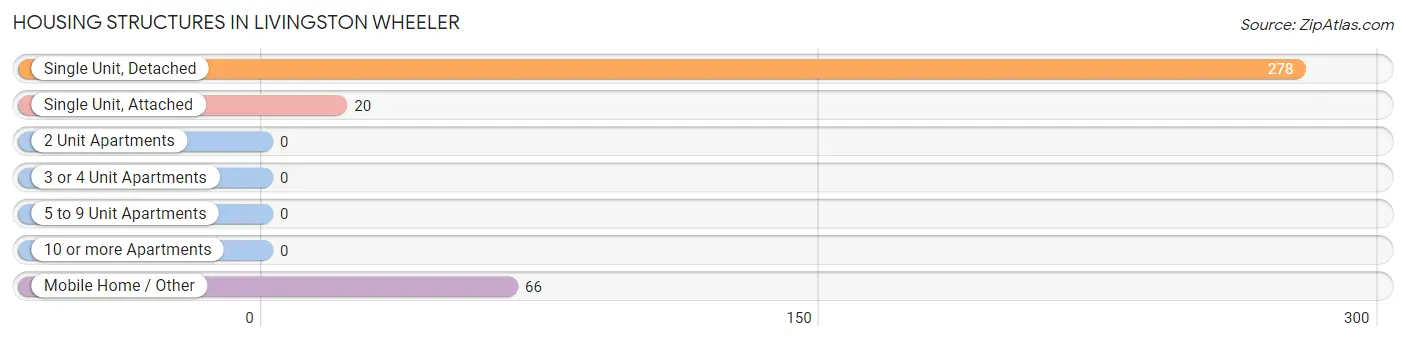
Housing Structures in Livingston Wheeler
| Structure Type | # Housing Units | % Housing Units |
| Single Unit, Detached | 278 | 76.4% |
| Single Unit, Attached | 20 | 5.5% |
| 2 Unit Apartments | 0 | 0.0% |
| 3 or 4 Unit Apartments | 0 | 0.0% |
| 5 to 9 Unit Apartments | 0 | 0.0% |
| 10 or more Apartments | 0 | 0.0% |
| Mobile Home / Other | 66 | 18.1% |
| Total | 364 | 100.0% |
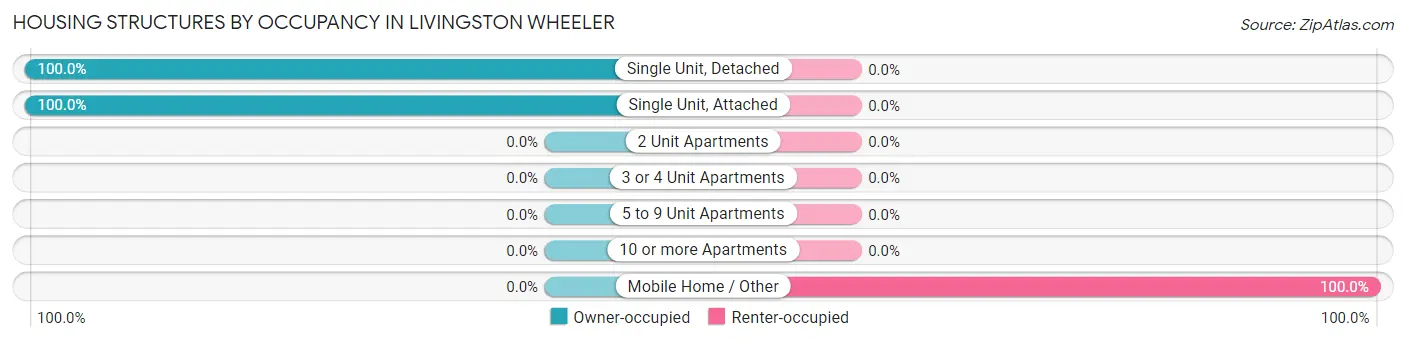
Housing Structures by Occupancy in Livingston Wheeler
| Structure Type | Owner-occupied | Renter-occupied |
| Single Unit, Detached | 278 (100.0%) | 0 (0.0%) |
| Single Unit, Attached | 20 (100.0%) | 0 (0.0%) |
| 2 Unit Apartments | 0 (0.0%) | 0 (0.0%) |
| 3 or 4 Unit Apartments | 0 (0.0%) | 0 (0.0%) |
| 5 to 9 Unit Apartments | 0 (0.0%) | 0 (0.0%) |
| 10 or more Apartments | 0 (0.0%) | 0 (0.0%) |
| Mobile Home / Other | 0 (0.0%) | 66 (100.0%) |
| Total | 298 (81.9%) | 66 (18.1%) |
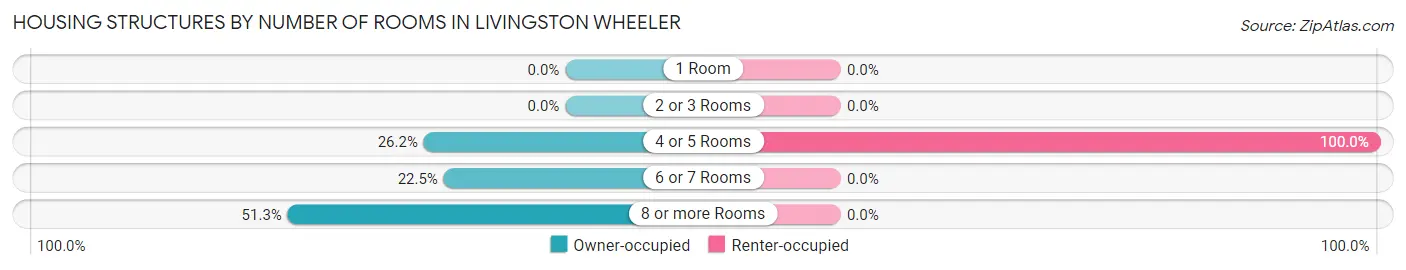
Housing Structures by Number of Rooms in Livingston Wheeler
| Number of Rooms | Owner-occupied | Renter-occupied |
| 1 Room | 0 (0.0%) | 0 (0.0%) |
| 2 or 3 Rooms | 0 (0.0%) | 0 (0.0%) |
| 4 or 5 Rooms | 78 (26.2%) | 66 (100.0%) |
| 6 or 7 Rooms | 67 (22.5%) | 0 (0.0%) |
| 8 or more Rooms | 153 (51.3%) | 0 (0.0%) |
| Total | 298 (100.0%) | 66 (100.0%) |
Housing Structure by Heating Type in Livingston Wheeler
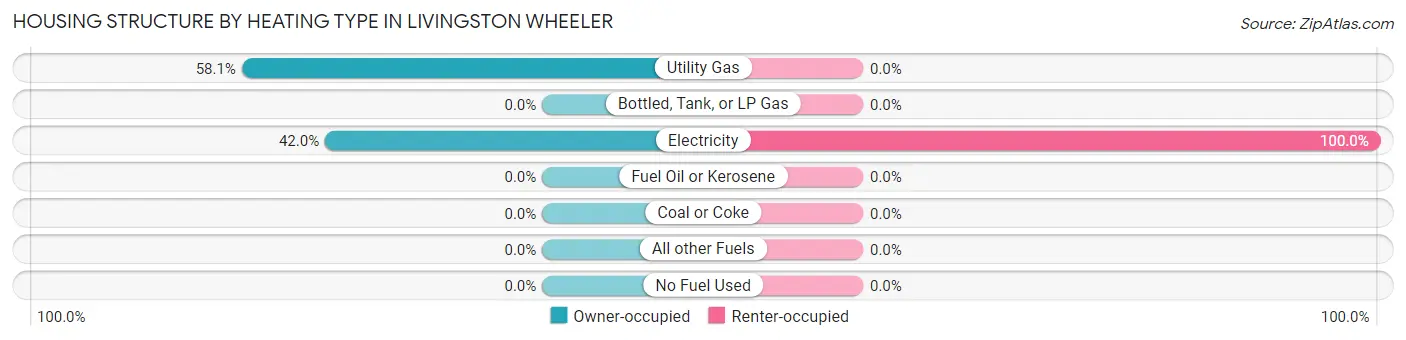
| Heating Type | Owner-occupied | Renter-occupied |
| Utility Gas | 173 (58.1%) | 0 (0.0%) |
| Bottled, Tank, or LP Gas | 0 (0.0%) | 0 (0.0%) |
| Electricity | 125 (41.9%) | 66 (100.0%) |
| Fuel Oil or Kerosene | 0 (0.0%) | 0 (0.0%) |
| Coal or Coke | 0 (0.0%) | 0 (0.0%) |
| All other Fuels | 0 (0.0%) | 0 (0.0%) |
| No Fuel Used | 0 (0.0%) | 0 (0.0%) |
| Total | 298 (100.0%) | 66 (100.0%) |
Household Vehicle Usage in Livingston Wheeler
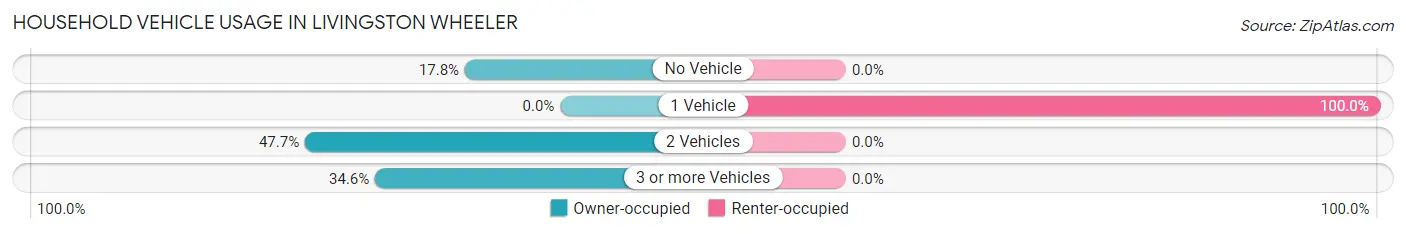
| Vehicles per Household | Owner-occupied | Renter-occupied |
| No Vehicle | 53 (17.8%) | 0 (0.0%) |
| 1 Vehicle | 0 (0.0%) | 66 (100.0%) |
| 2 Vehicles | 142 (47.6%) | 0 (0.0%) |
| 3 or more Vehicles | 103 (34.6%) | 0 (0.0%) |
| Total | 298 (100.0%) | 66 (100.0%) |
Real Estate & Mortgages in Livingston Wheeler
Real Estate and Mortgage Overview in Livingston Wheeler
| Characteristic | Without Mortgage | With Mortgage |
| Housing Units | 173 | 125 |
| Median Property Value | $164,400 | $0 |
| Median Household Income | $85,208 | $0 |
| Monthly Housing Costs | $256 | $0 |
| Real Estate Taxes | $486 | $42 |
Property Value by Mortgage Status in Livingston Wheeler
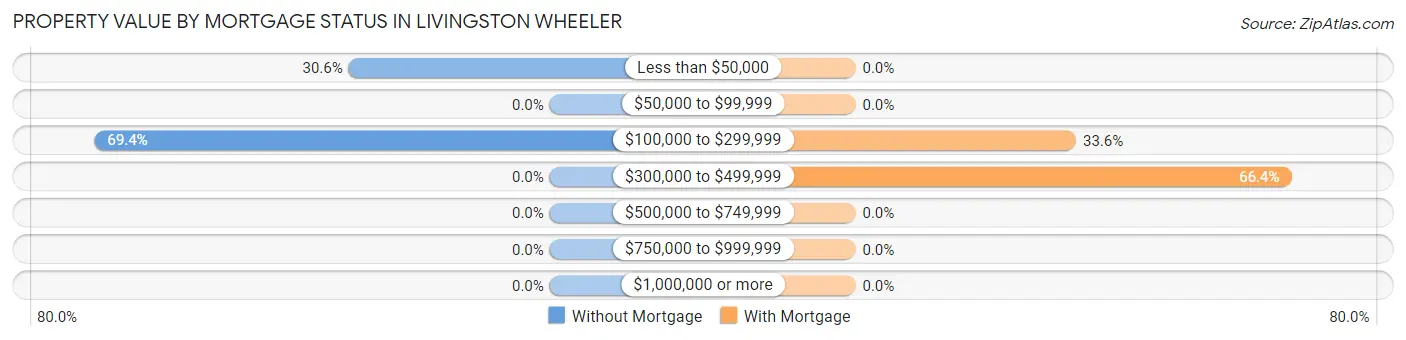
| Property Value | Without Mortgage | With Mortgage |
| Less than $50,000 | 53 (30.6%) | 0 (0.0%) |
| $50,000 to $99,999 | 0 (0.0%) | 0 (0.0%) |
| $100,000 to $299,999 | 120 (69.4%) | 42 (33.6%) |
| $300,000 to $499,999 | 0 (0.0%) | 83 (66.4%) |
| $500,000 to $749,999 | 0 (0.0%) | 0 (0.0%) |
| $750,000 to $999,999 | 0 (0.0%) | 0 (0.0%) |
| $1,000,000 or more | 0 (0.0%) | 0 (0.0%) |
| Total | 173 (100.0%) | 125 (100.0%) |
Household Income by Mortgage Status in Livingston Wheeler
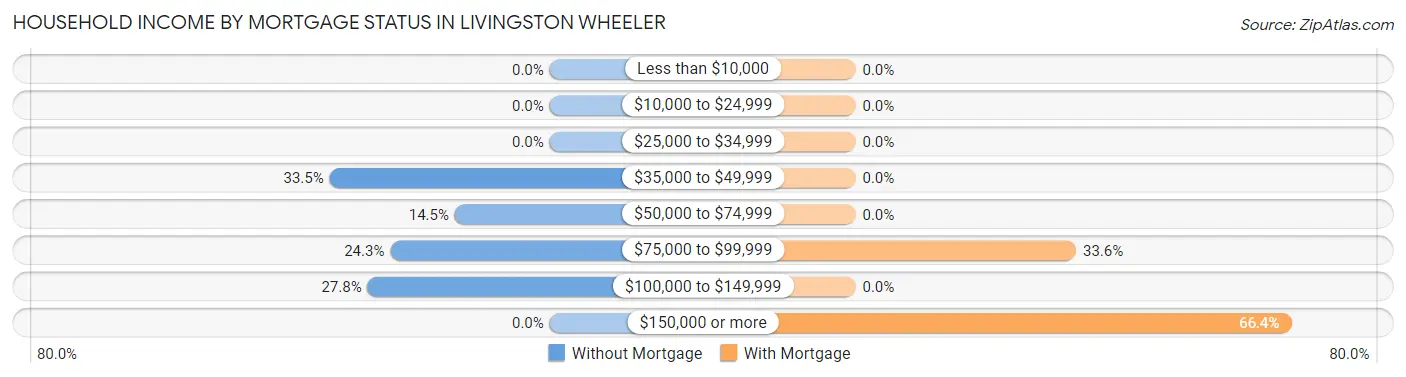
| Household Income | Without Mortgage | With Mortgage |
| Less than $10,000 | 0 (0.0%) | 0 (0.0%) |
| $10,000 to $24,999 | 0 (0.0%) | 0 (0.0%) |
| $25,000 to $34,999 | 0 (0.0%) | 0 (0.0%) |
| $35,000 to $49,999 | 58 (33.5%) | 0 (0.0%) |
| $50,000 to $74,999 | 25 (14.4%) | 0 (0.0%) |
| $75,000 to $99,999 | 42 (24.3%) | 42 (33.6%) |
| $100,000 to $149,999 | 48 (27.8%) | 0 (0.0%) |
| $150,000 or more | 0 (0.0%) | 83 (66.4%) |
| Total | 173 (100.0%) | 125 (100.0%) |
Property Value to Household Income Ratio in Livingston Wheeler
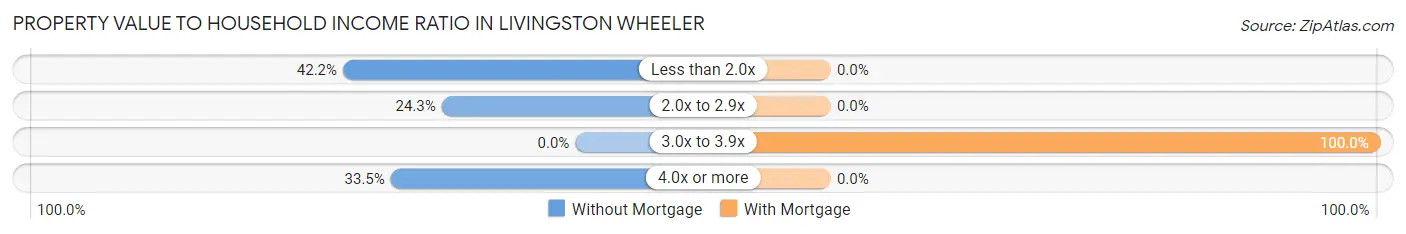
| Value-to-Income Ratio | Without Mortgage | With Mortgage |
| Less than 2.0x | 73 (42.2%) | 0 (0.0%) |
| 2.0x to 2.9x | 42 (24.3%) | 0 (0.0%) |
| 3.0x to 3.9x | 0 (0.0%) | 125 (100.0%) |
| 4.0x or more | 58 (33.5%) | 0 (0.0%) |
| Total | 173 (100.0%) | 125 (100.0%) |
Real Estate Taxes by Mortgage Status in Livingston Wheeler
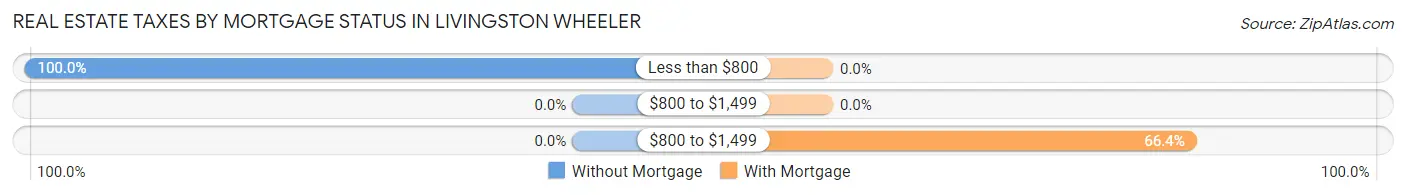
| Property Taxes | Without Mortgage | With Mortgage |
| Less than $800 | 173 (100.0%) | 0 (0.0%) |
| $800 to $1,499 | 0 (0.0%) | 0 (0.0%) |
| $800 to $1,499 | 0 (0.0%) | 83 (66.4%) |
| Total | 173 (100.0%) | 125 (100.0%) |
Health & Disability in Livingston Wheeler
Health Insurance Coverage by Age in Livingston Wheeler
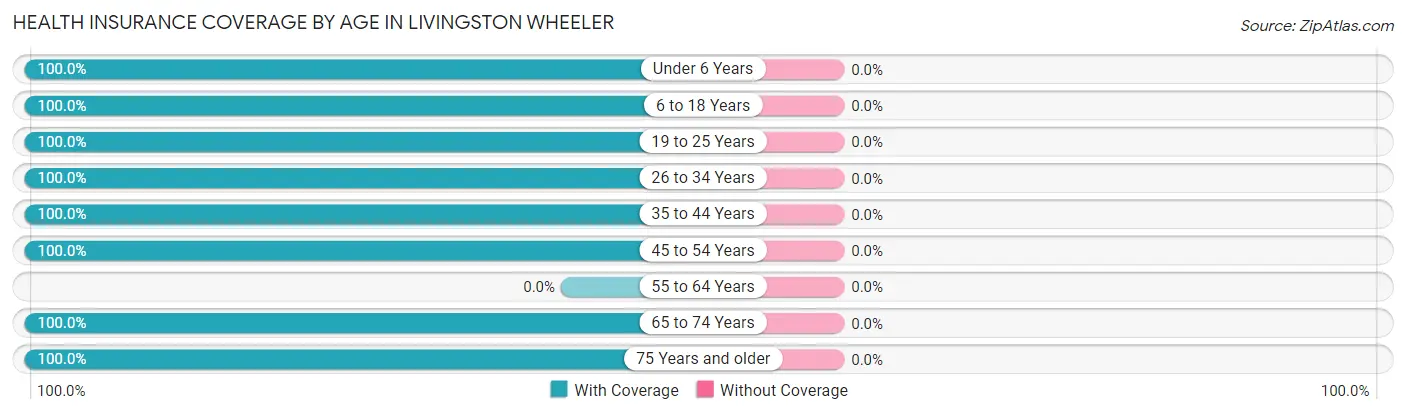
| Age Bracket | With Coverage | Without Coverage |
| Under 6 Years | 69 (100.0%) | 0 (0.0%) |
| 6 to 18 Years | 299 (100.0%) | 0 (0.0%) |
| 19 to 25 Years | 60 (100.0%) | 0 (0.0%) |
| 26 to 34 Years | 66 (100.0%) | 0 (0.0%) |
| 35 to 44 Years | 226 (100.0%) | 0 (0.0%) |
| 45 to 54 Years | 89 (100.0%) | 0 (0.0%) |
| 55 to 64 Years | 0 (0.0%) | 0 (0.0%) |
| 65 to 74 Years | 140 (100.0%) | 0 (0.0%) |
| 75 Years and older | 121 (100.0%) | 0 (0.0%) |
| Total | 1,070 (100.0%) | 0 (0.0%) |
Health Insurance Coverage by Citizenship Status in Livingston Wheeler
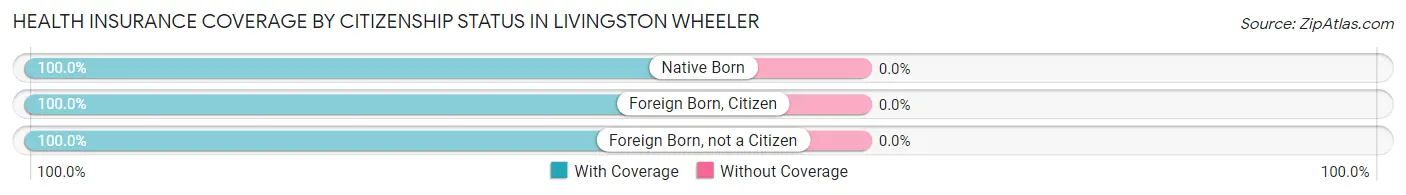
| Citizenship Status | With Coverage | Without Coverage |
| Native Born | 69 (100.0%) | 0 (0.0%) |
| Foreign Born, Citizen | 299 (100.0%) | 0 (0.0%) |
| Foreign Born, not a Citizen | 60 (100.0%) | 0 (0.0%) |
Health Insurance Coverage by Household Income in Livingston Wheeler
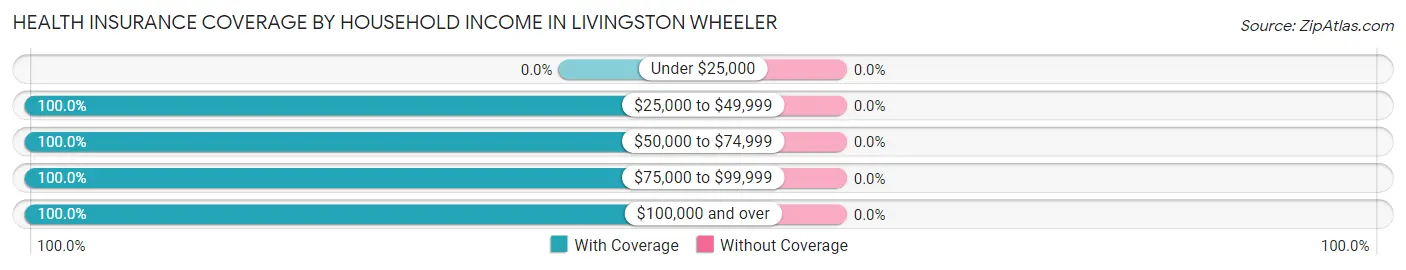
| Household Income | With Coverage | Without Coverage |
| Under $25,000 | 0 (0.0%) | 0 (0.0%) |
| $25,000 to $49,999 | 237 (100.0%) | 0 (0.0%) |
| $50,000 to $74,999 | 236 (100.0%) | 0 (0.0%) |
| $75,000 to $99,999 | 65 (100.0%) | 0 (0.0%) |
| $100,000 and over | 532 (100.0%) | 0 (0.0%) |
Public vs Private Health Insurance Coverage by Age in Livingston Wheeler
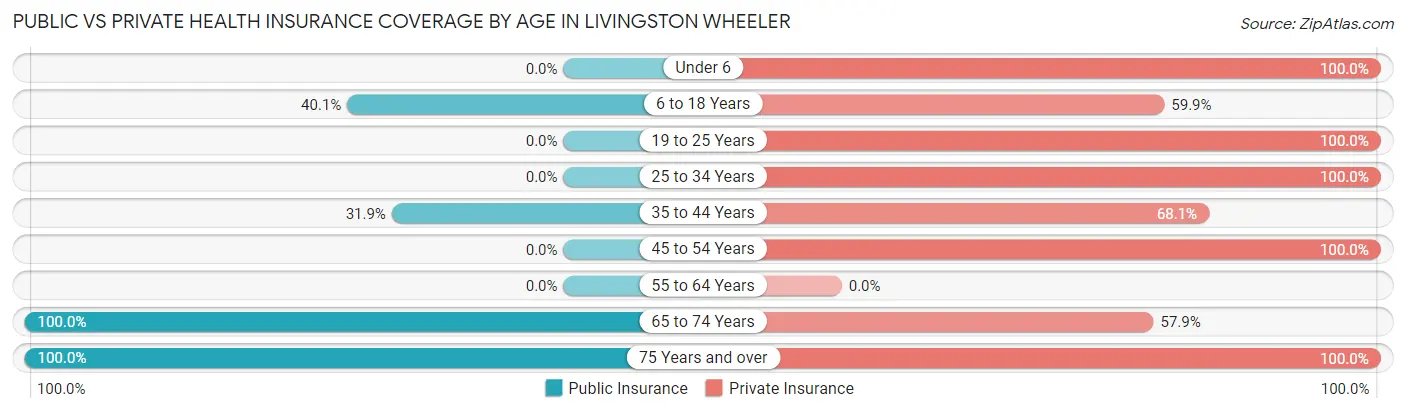
| Age Bracket | Public Insurance | Private Insurance |
| Under 6 | 0 (0.0%) | 69 (100.0%) |
| 6 to 18 Years | 120 (40.1%) | 179 (59.9%) |
| 19 to 25 Years | 0 (0.0%) | 60 (100.0%) |
| 25 to 34 Years | 0 (0.0%) | 66 (100.0%) |
| 35 to 44 Years | 72 (31.9%) | 154 (68.1%) |
| 45 to 54 Years | 0 (0.0%) | 89 (100.0%) |
| 55 to 64 Years | 0 (0.0%) | 0 (0.0%) |
| 65 to 74 Years | 140 (100.0%) | 81 (57.9%) |
| 75 Years and over | 121 (100.0%) | 121 (100.0%) |
| Total | 453 (42.3%) | 819 (76.5%) |
Disability Status by Sex by Age in Livingston Wheeler
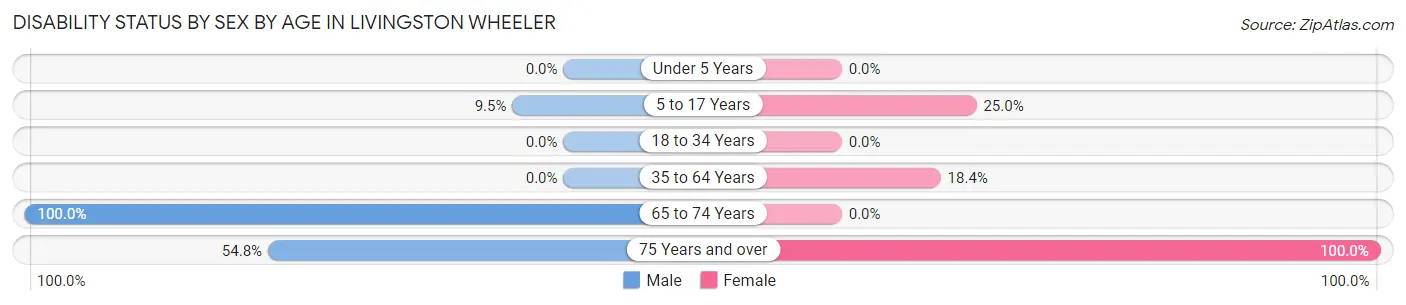
| Age Bracket | Male | Female |
| Under 5 Years | 0 (0.0%) | 0 (0.0%) |
| 5 to 17 Years | 20 (9.5%) | 22 (25.0%) |
| 18 to 34 Years | 0 (0.0%) | 0 (0.0%) |
| 35 to 64 Years | 0 (0.0%) | 20 (18.3%) |
| 65 to 74 Years | 38 (100.0%) | 0 (0.0%) |
| 75 Years and over | 51 (54.8%) | 28 (100.0%) |
Disability Class by Sex by Age in Livingston Wheeler
Disability Class: Hearing Difficulty
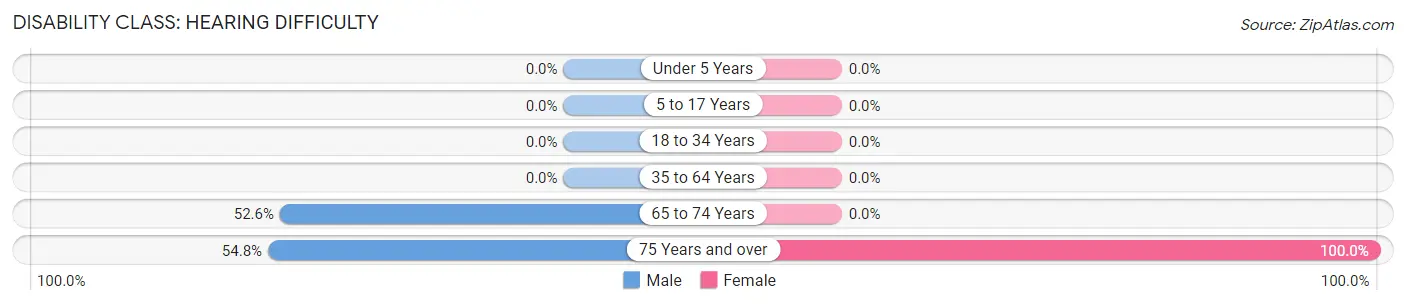
| Age Bracket | Male | Female |
| Under 5 Years | 0 (0.0%) | 0 (0.0%) |
| 5 to 17 Years | 0 (0.0%) | 0 (0.0%) |
| 18 to 34 Years | 0 (0.0%) | 0 (0.0%) |
| 35 to 64 Years | 0 (0.0%) | 0 (0.0%) |
| 65 to 74 Years | 20 (52.6%) | 0 (0.0%) |
| 75 Years and over | 51 (54.8%) | 28 (100.0%) |
Disability Class: Vision Difficulty
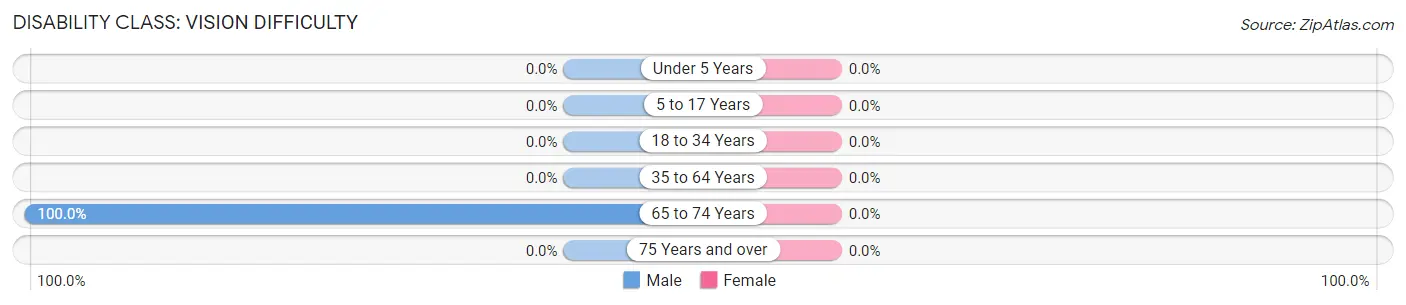
| Age Bracket | Male | Female |
| Under 5 Years | 0 (0.0%) | 0 (0.0%) |
| 5 to 17 Years | 0 (0.0%) | 0 (0.0%) |
| 18 to 34 Years | 0 (0.0%) | 0 (0.0%) |
| 35 to 64 Years | 0 (0.0%) | 0 (0.0%) |
| 65 to 74 Years | 38 (100.0%) | 0 (0.0%) |
| 75 Years and over | 0 (0.0%) | 0 (0.0%) |
Disability Class: Cognitive Difficulty
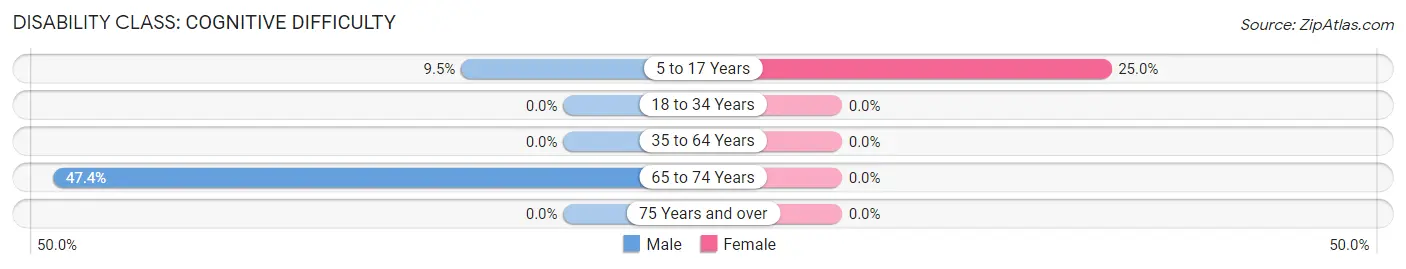
| Age Bracket | Male | Female |
| 5 to 17 Years | 20 (9.5%) | 22 (25.0%) |
| 18 to 34 Years | 0 (0.0%) | 0 (0.0%) |
| 35 to 64 Years | 0 (0.0%) | 0 (0.0%) |
| 65 to 74 Years | 18 (47.4%) | 0 (0.0%) |
| 75 Years and over | 0 (0.0%) | 0 (0.0%) |
Disability Class: Ambulatory Difficulty
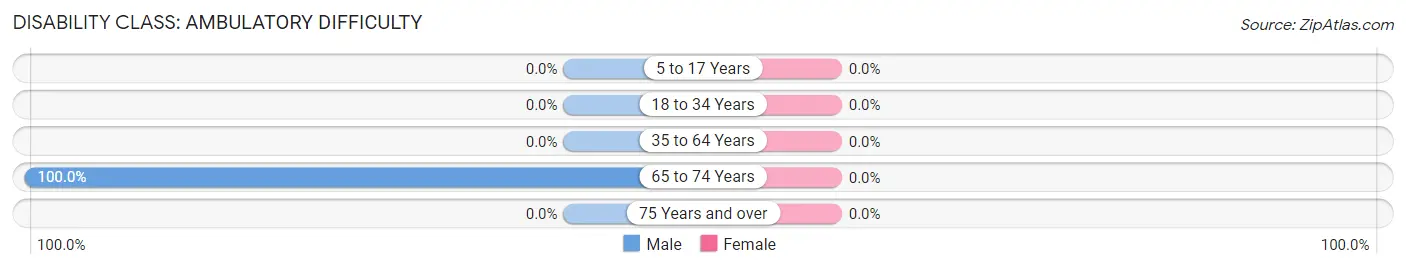
| Age Bracket | Male | Female |
| 5 to 17 Years | 0 (0.0%) | 0 (0.0%) |
| 18 to 34 Years | 0 (0.0%) | 0 (0.0%) |
| 35 to 64 Years | 0 (0.0%) | 0 (0.0%) |
| 65 to 74 Years | 38 (100.0%) | 0 (0.0%) |
| 75 Years and over | 0 (0.0%) | 0 (0.0%) |
Disability Class: Self-Care Difficulty
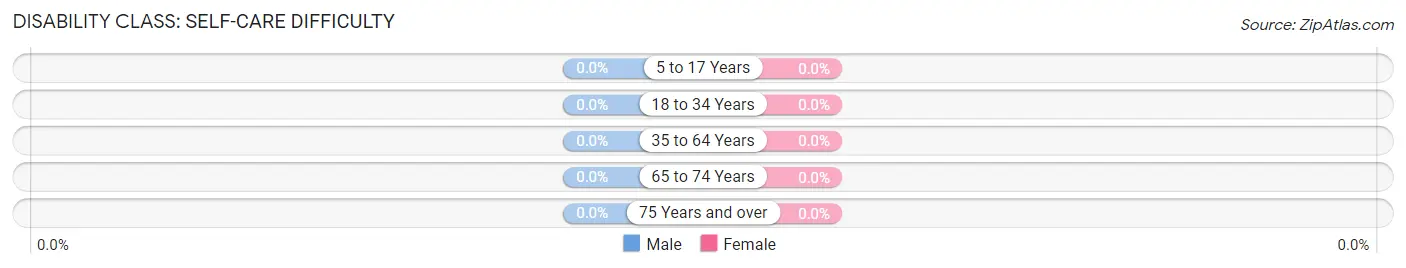
| Age Bracket | Male | Female |
| 5 to 17 Years | 0 (0.0%) | 0 (0.0%) |
| 18 to 34 Years | 0 (0.0%) | 0 (0.0%) |
| 35 to 64 Years | 0 (0.0%) | 0 (0.0%) |
| 65 to 74 Years | 0 (0.0%) | 0 (0.0%) |
| 75 Years and over | 0 (0.0%) | 0 (0.0%) |
Technology Access in Livingston Wheeler
Computing Device Access in Livingston Wheeler
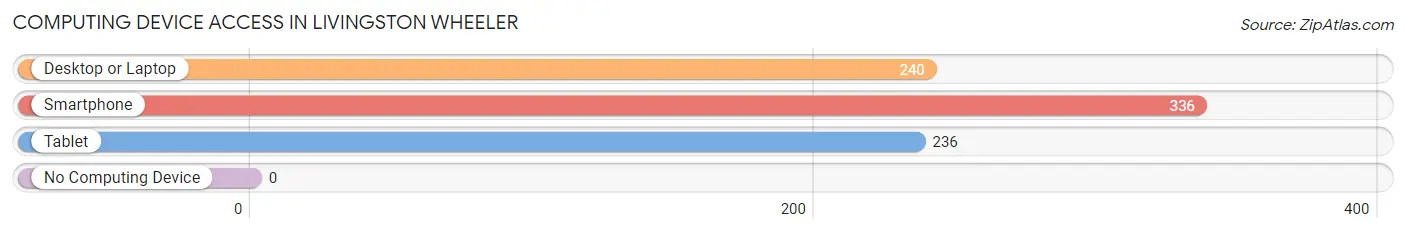
| Device Type | # Households | % Households |
| Desktop or Laptop | 240 | 65.9% |
| Smartphone | 336 | 92.3% |
| Tablet | 236 | 64.8% |
| No Computing Device | 0 | 0.0% |
| Total | 364 | 100.0% |
Internet Access in Livingston Wheeler
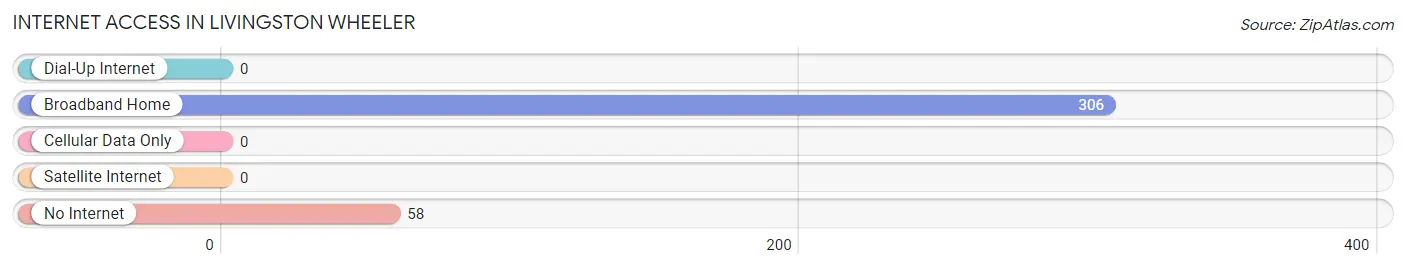
| Internet Type | # Households | % Households |
| Dial-Up Internet | 0 | 0.0% |
| Broadband Home | 306 | 84.1% |
| Cellular Data Only | 0 | 0.0% |
| Satellite Internet | 0 | 0.0% |
| No Internet | 58 | 15.9% |
| Total | 364 | 100.0% |
Livingston Wheeler Summary
Livingston Wheeler is a small unincorporated community located in the state of New Mexico. It is situated in the southeastern corner of the state, near the border with Texas. The community is located in the Chaves County, and is part of the Roswell Micropolitan Statistical Area. The population of Livingston Wheeler was estimated to be around 200 people in 2020.
History
Livingston Wheeler was founded in the late 19th century by a group of settlers from Texas. The settlers were looking for a place to settle and start a new life, and they chose the area around Livingston Wheeler. The town was named after a prominent local rancher, William Livingston Wheeler. The town was officially incorporated in 1891.
Geography
Livingston Wheeler is located in the southeastern corner of New Mexico, near the border with Texas. The town is situated in the Chaves County, and is part of the Roswell Micropolitan Statistical Area. The town is located at an elevation of 4,000 feet above sea level. The climate in the area is semi-arid, with hot summers and cold winters.
Economy
The economy of Livingston Wheeler is largely based on agriculture. The town is home to several farms and ranches, which produce a variety of crops and livestock. The town also has a few small businesses, including a grocery store, a gas station, and a few restaurants.
Demographics
As of the 2020 census, the population of Livingston Wheeler was estimated to be around 200 people. The racial makeup of the town was 94.5% White, 0.5% African American, 0.5% Native American, 0.5% Asian, and 4% from other races. The median household income in the town was $35,000, and the median home value was $90,000.
Conclusion
Livingston Wheeler is a small unincorporated community located in the southeastern corner of New Mexico. The town was founded in the late 19th century by a group of settlers from Texas, and was named after a prominent local rancher. The economy of the town is largely based on agriculture, and the population was estimated to be around 200 people in 2020.
Common Questions
What is Per Capita Income in Livingston Wheeler?
Per Capita income in Livingston Wheeler is $29,970.
What is the Median Family Income in Livingston Wheeler?
Median Family Income in Livingston Wheeler is $87,440.
What is the Median Household income in Livingston Wheeler?
Median Household Income in Livingston Wheeler is $74,464.
What is Inequality or Gini Index in Livingston Wheeler?
Inequality or Gini Index in Livingston Wheeler is 0.26.
What is the Total Population of Livingston Wheeler?
Total Population of Livingston Wheeler is 1,070.
What is the Total Male Population of Livingston Wheeler?
Total Male Population of Livingston Wheeler is 617.
What is the Total Female Population of Livingston Wheeler?
Total Female Population of Livingston Wheeler is 453.
What is the Ratio of Males per 100 Females in Livingston Wheeler?
There are 136.20 Males per 100 Females in Livingston Wheeler.
What is the Ratio of Females per 100 Males in Livingston Wheeler?
There are 73.42 Females per 100 Males in Livingston Wheeler.
What is the Median Population Age in Livingston Wheeler?
Median Population Age in Livingston Wheeler is 35.6 Years.
What is the Average Family Size in Livingston Wheeler
Average Family Size in Livingston Wheeler is 3.6 People.
What is the Average Household Size in Livingston Wheeler
Average Household Size in Livingston Wheeler is 2.9 People.
How Large is the Labor Force in Livingston Wheeler?
There are 309 People in the Labor Forcein in Livingston Wheeler.
What is the Percentage of People in the Labor Force in Livingston Wheeler?
41.7% of People are in the Labor Force in Livingston Wheeler.
What is the Unemployment Rate in Livingston Wheeler?
Unemployment Rate in Livingston Wheeler is 9.4%.