Spring Valley Village, TX Map & Demographics
Spring Valley Village Map
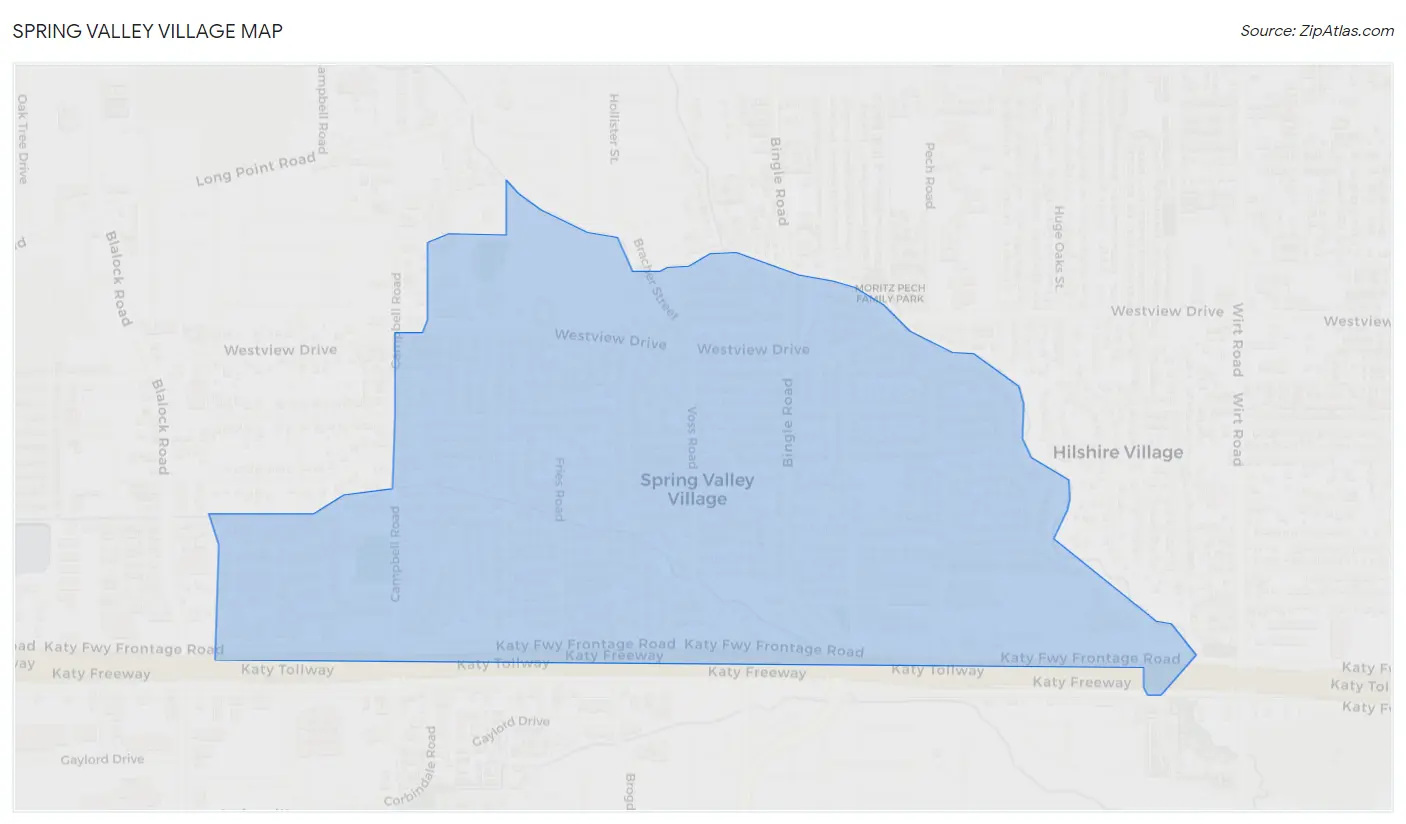
Spring Valley Village Overview
$95,097
PER CAPITA INCOME
$237,667
AVG FAMILY INCOME
$229,702
AVG HOUSEHOLD INCOME
46.1%
WAGE / INCOME GAP [ % ]
53.9¢/ $1
WAGE / INCOME GAP [ $ ]
0.45
INEQUALITY / GINI INDEX
4,222
TOTAL POPULATION
2,024
MALE POPULATION
2,198
FEMALE POPULATION
92.08
MALES / 100 FEMALES
108.60
FEMALES / 100 MALES
37.2
MEDIAN AGE
3.6
AVG FAMILY SIZE
3.4
AVG HOUSEHOLD SIZE
2,021
LABOR FORCE [ PEOPLE ]
66.6%
PERCENT IN LABOR FORCE
1.4%
UNEMPLOYMENT RATE
Income in Spring Valley Village
Income Overview in Spring Valley Village
Per Capita Income in Spring Valley Village is $95,097, while median incomes of families and households are $237,667 and $229,702 respectively.
| Characteristic | Number | Measure |
| Per Capita Income | 4,222 | $95,097 |
| Median Family Income | 1,120 | $237,667 |
| Mean Family Income | 1,120 | $318,926 |
| Median Household Income | 1,261 | $229,702 |
| Mean Household Income | 1,261 | $310,600 |
| Income Deficit | 1,120 | $0 |
| Wage / Income Gap (%) | 4,222 | 46.06% |
| Wage / Income Gap ($) | 4,222 | 53.94¢ per $1 |
| Gini / Inequality Index | 4,222 | 0.45 |
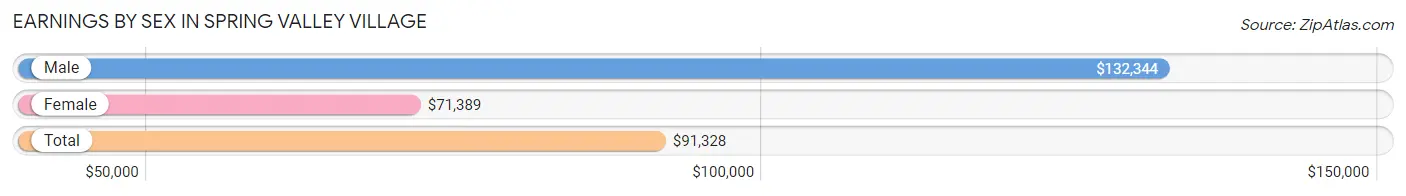
Earnings by Sex in Spring Valley Village
Average Earnings in Spring Valley Village are $91,328, $132,344 for men and $71,389 for women, a difference of 46.1%.
| Sex | Number | Average Earnings |
| Male | 1,139 (51.0%) | $132,344 |
| Female | 1,096 (49.0%) | $71,389 |
| Total | 2,235 (100.0%) | $91,328 |
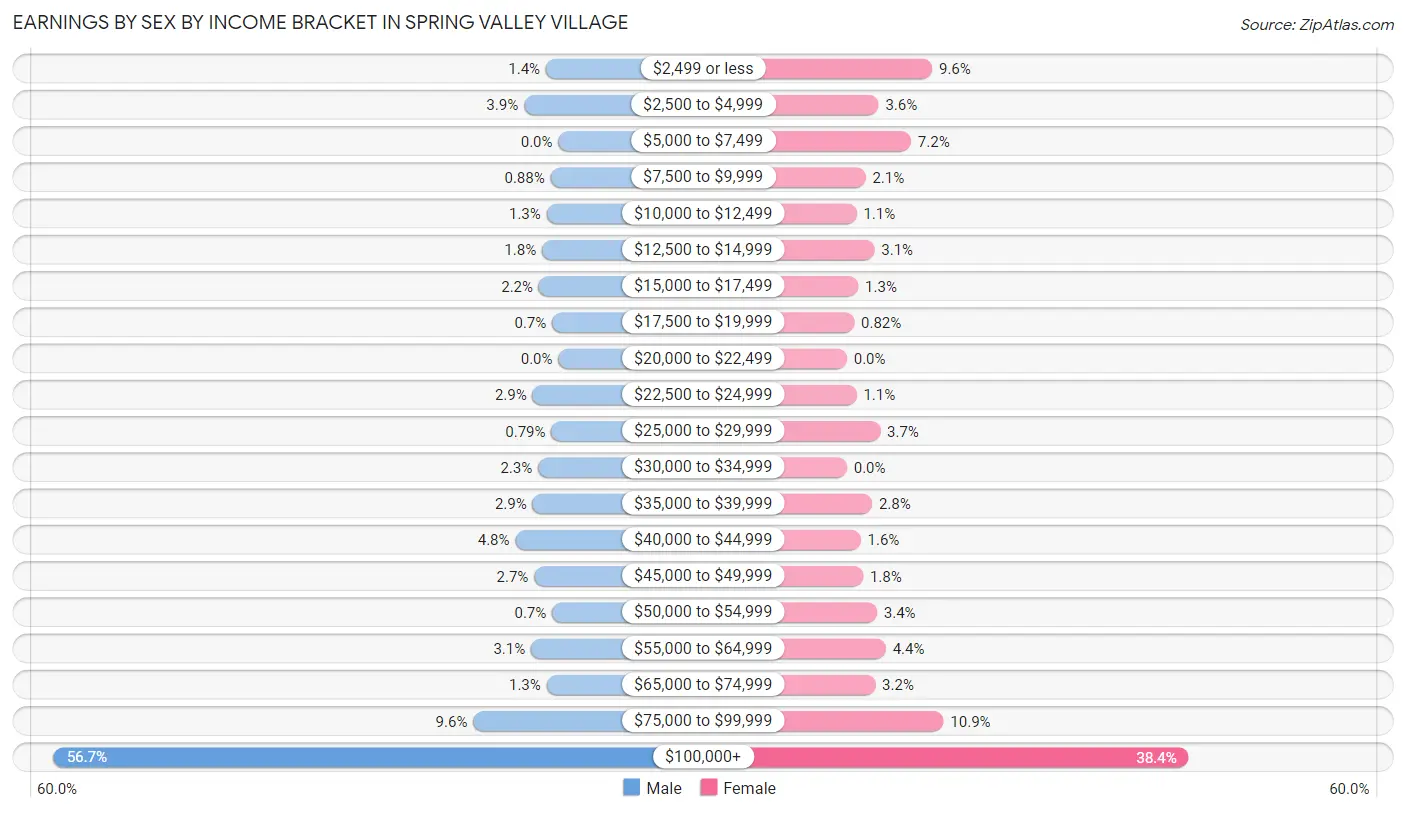
Earnings by Sex by Income Bracket in Spring Valley Village
The most common earnings brackets in Spring Valley Village are $100,000+ for men (646 | 56.7%) and $100,000+ for women (421 | 38.4%).
| Income | Male | Female |
| $2,499 or less | 16 (1.4%) | 105 (9.6%) |
| $2,500 to $4,999 | 44 (3.9%) | 39 (3.6%) |
| $5,000 to $7,499 | 0 (0.0%) | 79 (7.2%) |
| $7,500 to $9,999 | 10 (0.9%) | 23 (2.1%) |
| $10,000 to $12,499 | 15 (1.3%) | 12 (1.1%) |
| $12,500 to $14,999 | 21 (1.8%) | 34 (3.1%) |
| $15,000 to $17,499 | 25 (2.2%) | 14 (1.3%) |
| $17,500 to $19,999 | 8 (0.7%) | 9 (0.8%) |
| $20,000 to $22,499 | 0 (0.0%) | 0 (0.0%) |
| $22,500 to $24,999 | 33 (2.9%) | 12 (1.1%) |
| $25,000 to $29,999 | 9 (0.8%) | 41 (3.7%) |
| $30,000 to $34,999 | 26 (2.3%) | 0 (0.0%) |
| $35,000 to $39,999 | 33 (2.9%) | 31 (2.8%) |
| $40,000 to $44,999 | 55 (4.8%) | 17 (1.5%) |
| $45,000 to $49,999 | 31 (2.7%) | 20 (1.8%) |
| $50,000 to $54,999 | 8 (0.7%) | 37 (3.4%) |
| $55,000 to $64,999 | 35 (3.1%) | 48 (4.4%) |
| $65,000 to $74,999 | 15 (1.3%) | 35 (3.2%) |
| $75,000 to $99,999 | 109 (9.6%) | 119 (10.9%) |
| $100,000+ | 646 (56.7%) | 421 (38.4%) |
| Total | 1,139 (100.0%) | 1,096 (100.0%) |
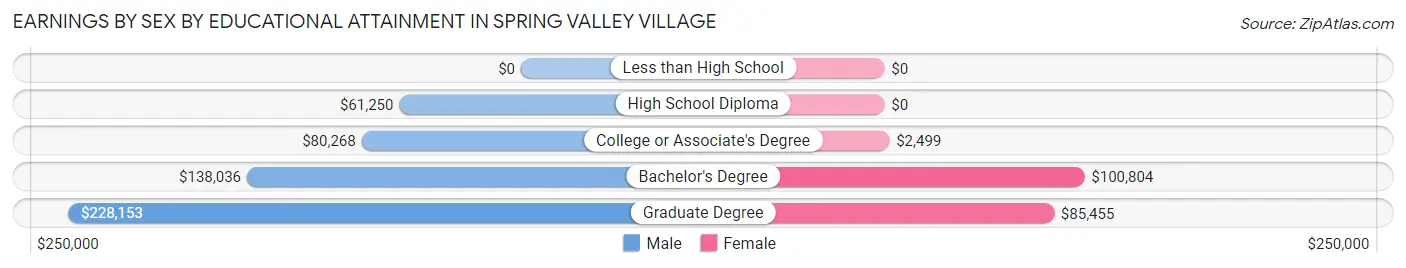
Earnings by Sex by Educational Attainment in Spring Valley Village
Average earnings in Spring Valley Village are $138,565 for men and $90,598 for women, a difference of 34.6%. Men with an educational attainment of graduate degree enjoy the highest average annual earnings of $228,153, while those with high school diploma education earn the least with $61,250. Women with an educational attainment of bachelor's degree earn the most with the average annual earnings of $100,804, while those with college or associate's degree education have the smallest earnings of $2,499.
| Educational Attainment | Male Income | Female Income |
| Less than High School | - | - |
| High School Diploma | $61,250 | $0 |
| College or Associate's Degree | $80,268 | $2,499 |
| Bachelor's Degree | $138,036 | $100,804 |
| Graduate Degree | $228,153 | $85,455 |
| Total | $138,565 | $90,598 |
Family Income in Spring Valley Village
Family Income Brackets in Spring Valley Village
According to the Spring Valley Village family income data, there are 629 families falling into the $200,000+ income range, which is the most common income bracket and makes up 56.2% of all families.
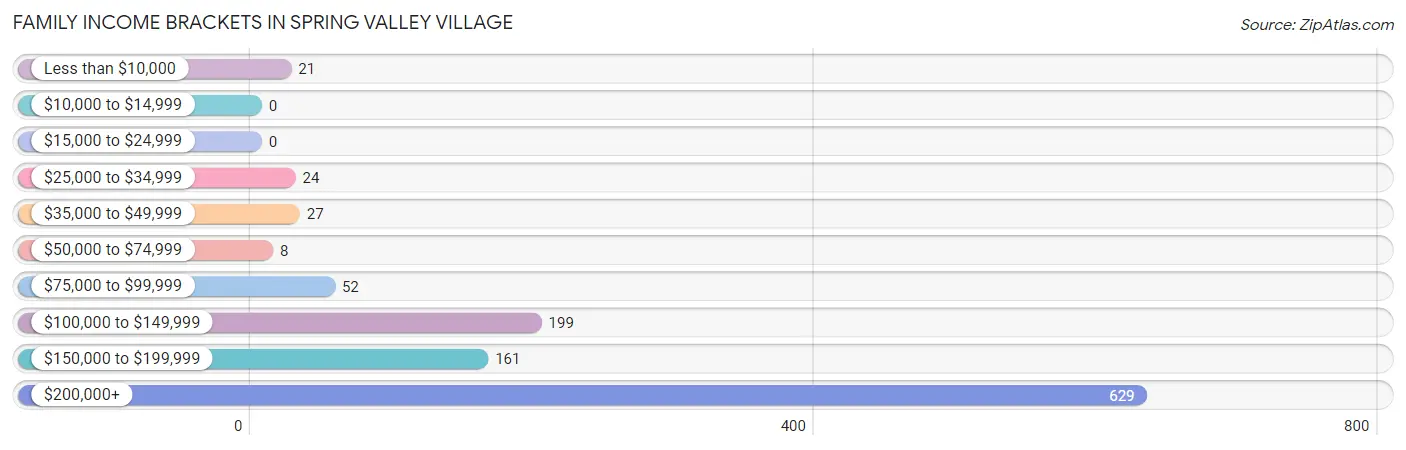
| Income Bracket | # Families | % Families |
| Less than $10,000 | 21 | 1.9% |
| $10,000 to $14,999 | 0 | 0.0% |
| $15,000 to $24,999 | 0 | 0.0% |
| $25,000 to $34,999 | 24 | 2.1% |
| $35,000 to $49,999 | 27 | 2.4% |
| $50,000 to $74,999 | 8 | 0.7% |
| $75,000 to $99,999 | 52 | 4.6% |
| $100,000 to $149,999 | 199 | 17.8% |
| $150,000 to $199,999 | 161 | 14.4% |
| $200,000+ | 629 | 56.2% |
Family Income by Famaliy Size in Spring Valley Village
4-person families (339 | 30.3%) account for the highest median family income in Spring Valley Village with $250,001 per family, while 3-person families (210 | 18.8%) have the highest median income of $76,250 per family member.
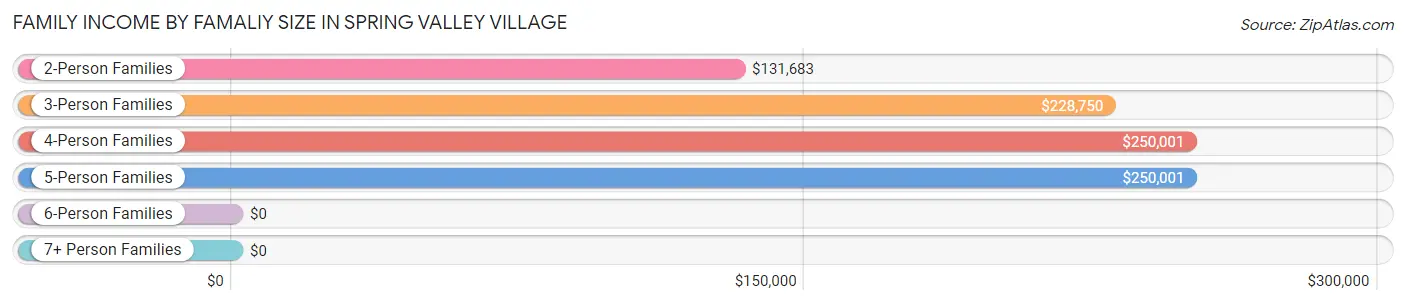
| Income Bracket | # Families | Median Income |
| 2-Person Families | 375 (33.5%) | $131,683 |
| 3-Person Families | 210 (18.8%) | $228,750 |
| 4-Person Families | 339 (30.3%) | $250,001 |
| 5-Person Families | 144 (12.9%) | $250,001 |
| 6-Person Families | 13 (1.2%) | $0 |
| 7+ Person Families | 39 (3.5%) | $0 |
| Total | 1,120 (100.0%) | $237,667 |
Family Income by Number of Earners in Spring Valley Village
The median family income in Spring Valley Village is $237,667, with families comprising 2 earners (550) having the highest median family income of $250,001, while families with 1 earner (296) have the lowest median family income of $118,611, accounting for 49.1% and 26.4% of families, respectively.
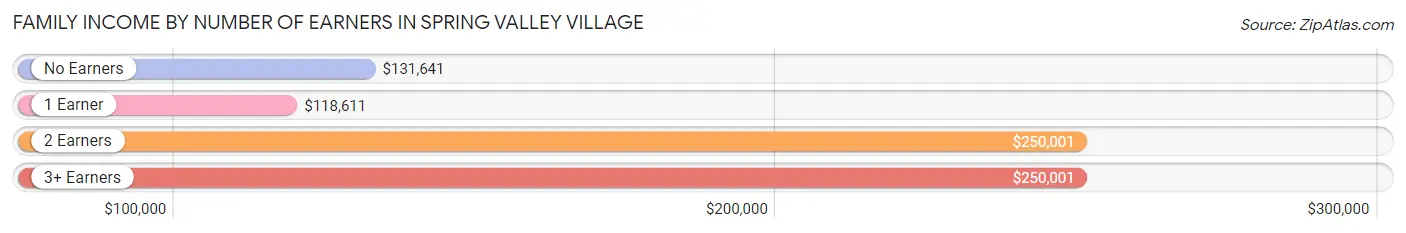
| Number of Earners | # Families | Median Income |
| No Earners | 93 (8.3%) | $131,641 |
| 1 Earner | 296 (26.4%) | $118,611 |
| 2 Earners | 550 (49.1%) | $250,001 |
| 3+ Earners | 181 (16.2%) | $250,001 |
| Total | 1,120 (100.0%) | $237,667 |
Household Income in Spring Valley Village
Household Income Brackets in Spring Valley Village
With 695 households falling in the category, the $200,000+ income range is the most frequent in Spring Valley Village, accounting for 55.1% of all households. In contrast, only 9 households (0.7%) fall into the $10,000 to $14,999 income bracket, making it the least populous group.
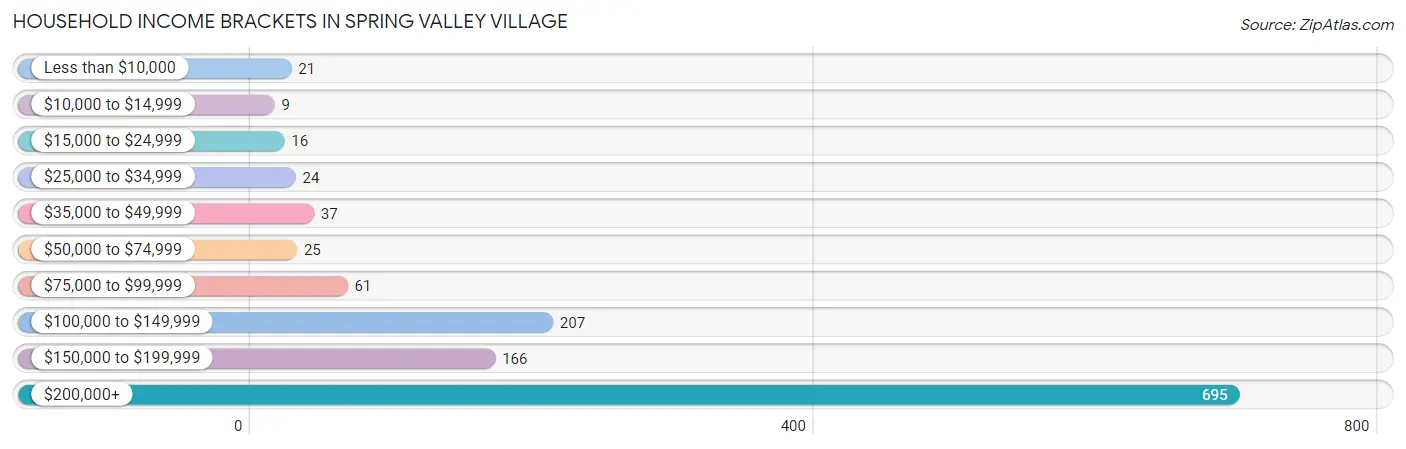
| Income Bracket | # Households | % Households |
| Less than $10,000 | 21 | 1.7% |
| $10,000 to $14,999 | 9 | 0.7% |
| $15,000 to $24,999 | 16 | 1.3% |
| $25,000 to $34,999 | 24 | 1.9% |
| $35,000 to $49,999 | 37 | 2.9% |
| $50,000 to $74,999 | 25 | 2.0% |
| $75,000 to $99,999 | 61 | 4.8% |
| $100,000 to $149,999 | 207 | 16.4% |
| $150,000 to $199,999 | 166 | 13.2% |
| $200,000+ | 695 | 55.1% |
Household Income by Householder Age in Spring Valley Village
The median household income in Spring Valley Village is $229,702, with the highest median household income of $250,001 found in the 25 to 44 years age bracket for the primary householder. A total of 372 households (29.5%) fall into this category.
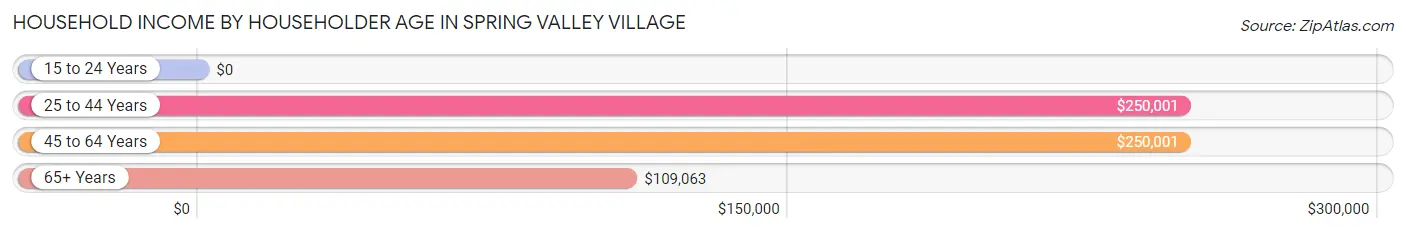
| Income Bracket | # Households | Median Income |
| 15 to 24 Years | 0 (0.0%) | $0 |
| 25 to 44 Years | 372 (29.5%) | $250,001 |
| 45 to 64 Years | 533 (42.3%) | $250,001 |
| 65+ Years | 356 (28.2%) | $109,063 |
| Total | 1,261 (100.0%) | $229,702 |
Poverty in Spring Valley Village
Income Below Poverty by Sex and Age in Spring Valley Village
With 1.5% poverty level for males and 2.1% for females among the residents of Spring Valley Village, 18 to 24 year old males and 18 to 24 year old females are the most vulnerable to poverty, with 10 males (10.5%) and 20 females (12.1%) in their respective age groups living below the poverty level.
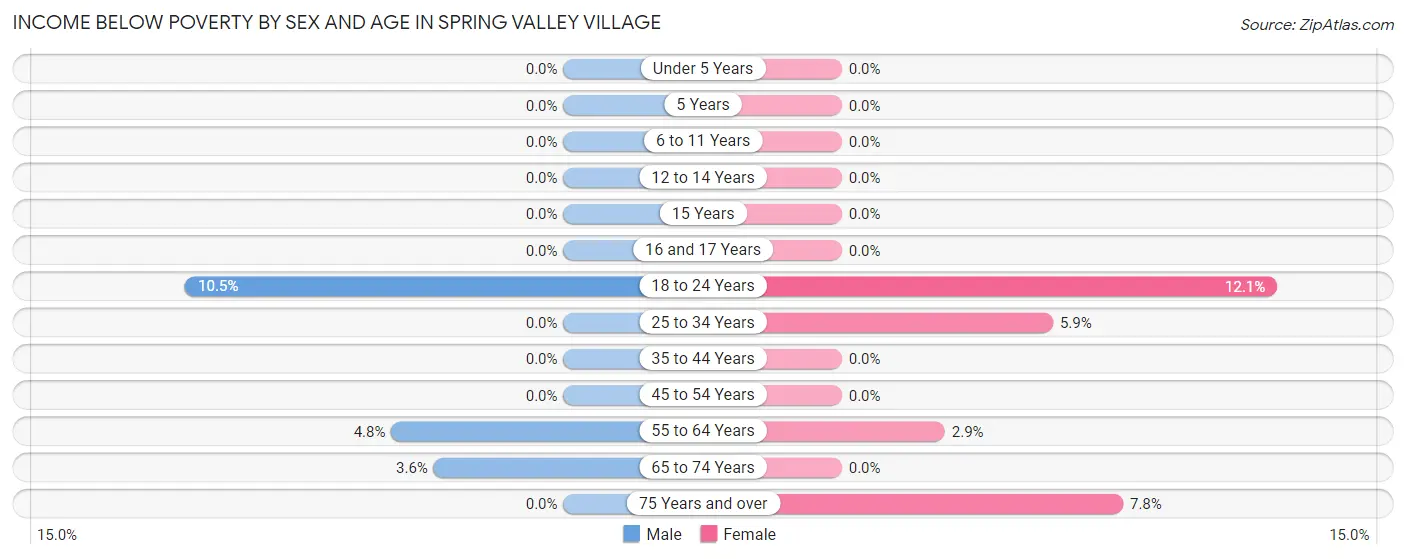
| Age Bracket | Male | Female |
| Under 5 Years | 0 (0.0%) | 0 (0.0%) |
| 5 Years | 0 (0.0%) | 0 (0.0%) |
| 6 to 11 Years | 0 (0.0%) | 0 (0.0%) |
| 12 to 14 Years | 0 (0.0%) | 0 (0.0%) |
| 15 Years | 0 (0.0%) | 0 (0.0%) |
| 16 and 17 Years | 0 (0.0%) | 0 (0.0%) |
| 18 to 24 Years | 10 (10.5%) | 20 (12.1%) |
| 25 to 34 Years | 0 (0.0%) | 9 (5.9%) |
| 35 to 44 Years | 0 (0.0%) | 0 (0.0%) |
| 45 to 54 Years | 0 (0.0%) | 0 (0.0%) |
| 55 to 64 Years | 14 (4.8%) | 7 (2.9%) |
| 65 to 74 Years | 7 (3.6%) | 0 (0.0%) |
| 75 Years and over | 0 (0.0%) | 9 (7.8%) |
| Total | 31 (1.5%) | 45 (2.1%) |
Income Above Poverty by Sex and Age in Spring Valley Village
According to the poverty statistics in Spring Valley Village, males aged under 5 years and females aged under 5 years are the age groups that are most secure financially, with 100.0% of males and 100.0% of females in these age groups living above the poverty line.
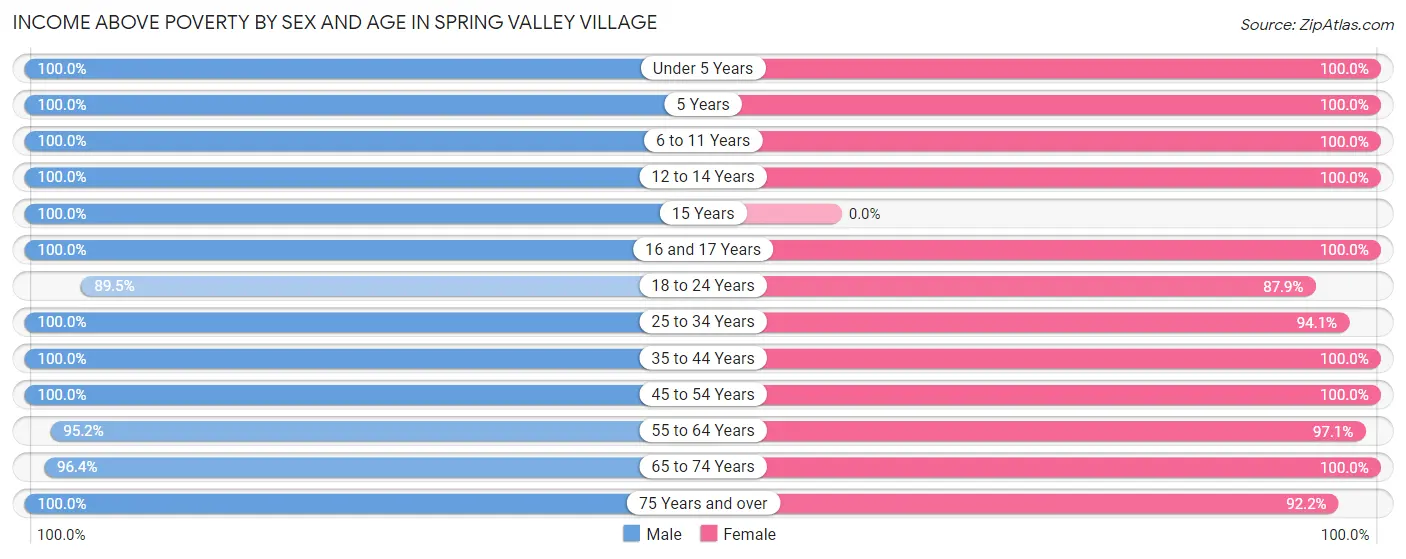
| Age Bracket | Male | Female |
| Under 5 Years | 147 (100.0%) | 139 (100.0%) |
| 5 Years | 77 (100.0%) | 80 (100.0%) |
| 6 to 11 Years | 110 (100.0%) | 355 (100.0%) |
| 12 to 14 Years | 188 (100.0%) | 53 (100.0%) |
| 15 Years | 38 (100.0%) | 0 (0.0%) |
| 16 and 17 Years | 108 (100.0%) | 105 (100.0%) |
| 18 to 24 Years | 85 (89.5%) | 145 (87.9%) |
| 25 to 34 Years | 110 (100.0%) | 144 (94.1%) |
| 35 to 44 Years | 337 (100.0%) | 300 (100.0%) |
| 45 to 54 Years | 231 (100.0%) | 297 (100.0%) |
| 55 to 64 Years | 278 (95.2%) | 237 (97.1%) |
| 65 to 74 Years | 187 (96.4%) | 192 (100.0%) |
| 75 Years and over | 97 (100.0%) | 106 (92.2%) |
| Total | 1,993 (98.5%) | 2,153 (98.0%) |
Income Below Poverty Among Married-Couple Families in Spring Valley Village
The poverty statistics for married-couple families in Spring Valley Village show that 0.7% or 7 of the total 954 families live below the poverty line. Families with no children have the highest poverty rate of 2.0%, comprising of 7 families. On the other hand, families with 1 or 2 children have the lowest poverty rate of 0.0%, which includes 0 families.
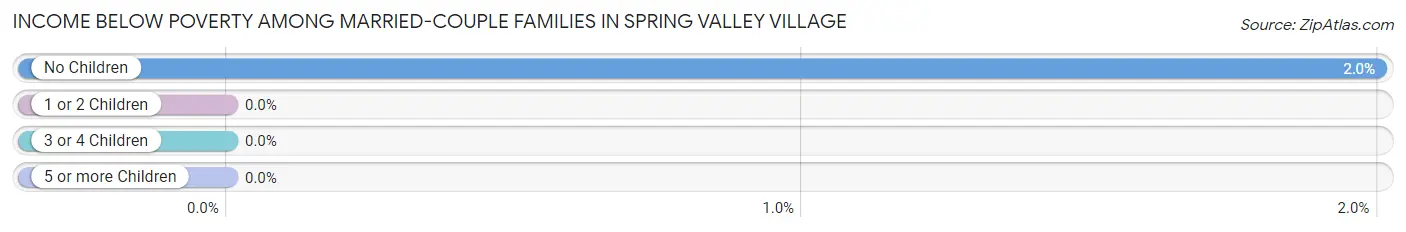
| Children | Above Poverty | Below Poverty |
| No Children | 343 (98.0%) | 7 (2.0%) |
| 1 or 2 Children | 479 (100.0%) | 0 (0.0%) |
| 3 or 4 Children | 97 (100.0%) | 0 (0.0%) |
| 5 or more Children | 28 (100.0%) | 0 (0.0%) |
| Total | 947 (99.3%) | 7 (0.7%) |
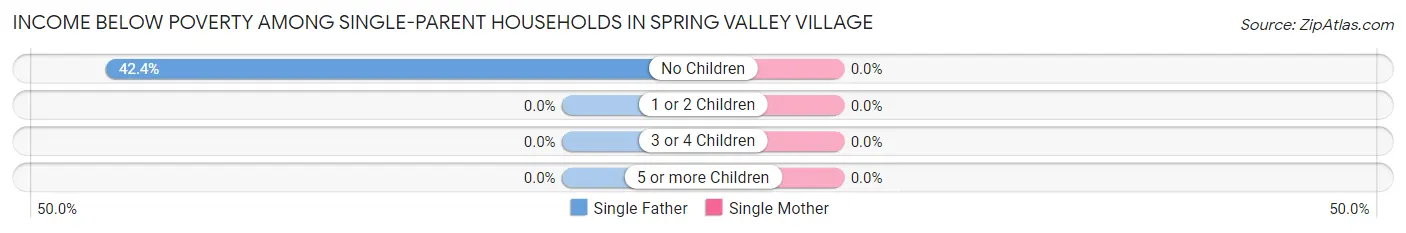
Income Below Poverty Among Single-Parent Households in Spring Valley Village
| Children | Single Father | Single Mother |
| No Children | 14 (42.4%) | 0 (0.0%) |
| 1 or 2 Children | 0 (0.0%) | 0 (0.0%) |
| 3 or 4 Children | 0 (0.0%) | 0 (0.0%) |
| 5 or more Children | 0 (0.0%) | 0 (0.0%) |
| Total | 14 (42.4%) | 0 (0.0%) |
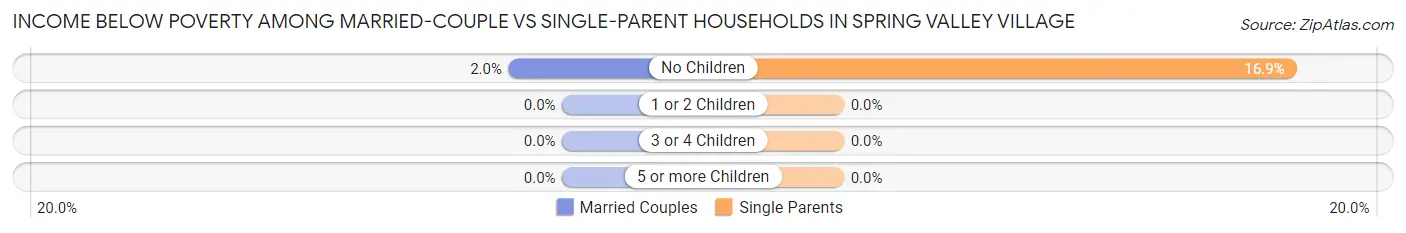
Income Below Poverty Among Married-Couple vs Single-Parent Households in Spring Valley Village
The poverty data for Spring Valley Village shows that 7 of the married-couple family households (0.7%) and 14 of the single-parent households (8.4%) are living below the poverty level. Within the married-couple family households, those with no children have the highest poverty rate, with 7 households (2.0%) falling below the poverty line. Among the single-parent households, those with no children have the highest poverty rate, with 14 household (16.9%) living below poverty.
| Children | Married-Couple Families | Single-Parent Households |
| No Children | 7 (2.0%) | 14 (16.9%) |
| 1 or 2 Children | 0 (0.0%) | 0 (0.0%) |
| 3 or 4 Children | 0 (0.0%) | 0 (0.0%) |
| 5 or more Children | 0 (0.0%) | 0 (0.0%) |
| Total | 7 (0.7%) | 14 (8.4%) |
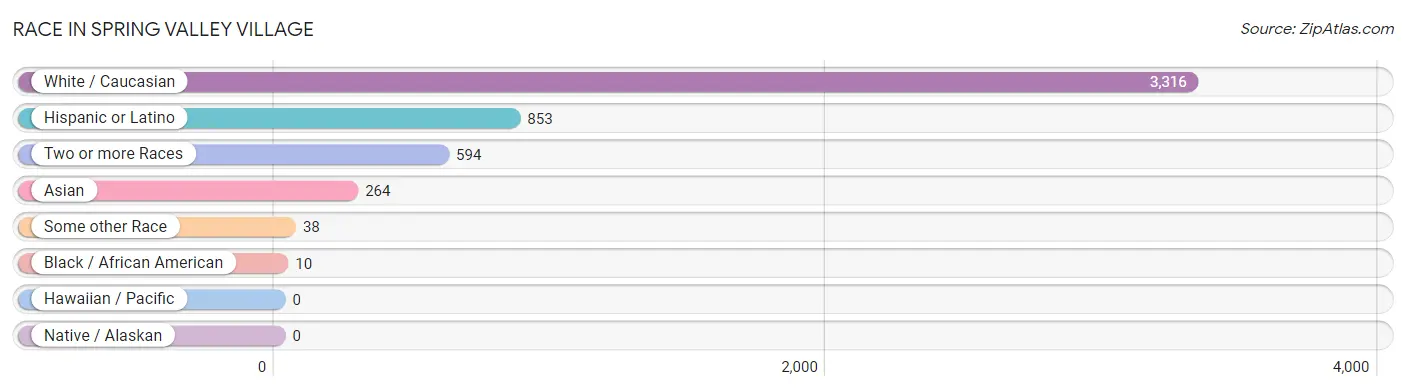
Race in Spring Valley Village
The most populous races in Spring Valley Village are White / Caucasian (3,316 | 78.5%), Hispanic or Latino (853 | 20.2%), and Two or more Races (594 | 14.1%).
| Race | # Population | % Population |
| Asian | 264 | 6.2% |
| Black / African American | 10 | 0.2% |
| Hawaiian / Pacific | 0 | 0.0% |
| Hispanic or Latino | 853 | 20.2% |
| Native / Alaskan | 0 | 0.0% |
| White / Caucasian | 3,316 | 78.5% |
| Two or more Races | 594 | 14.1% |
| Some other Race | 38 | 0.9% |
| Total | 4,222 | 100.0% |
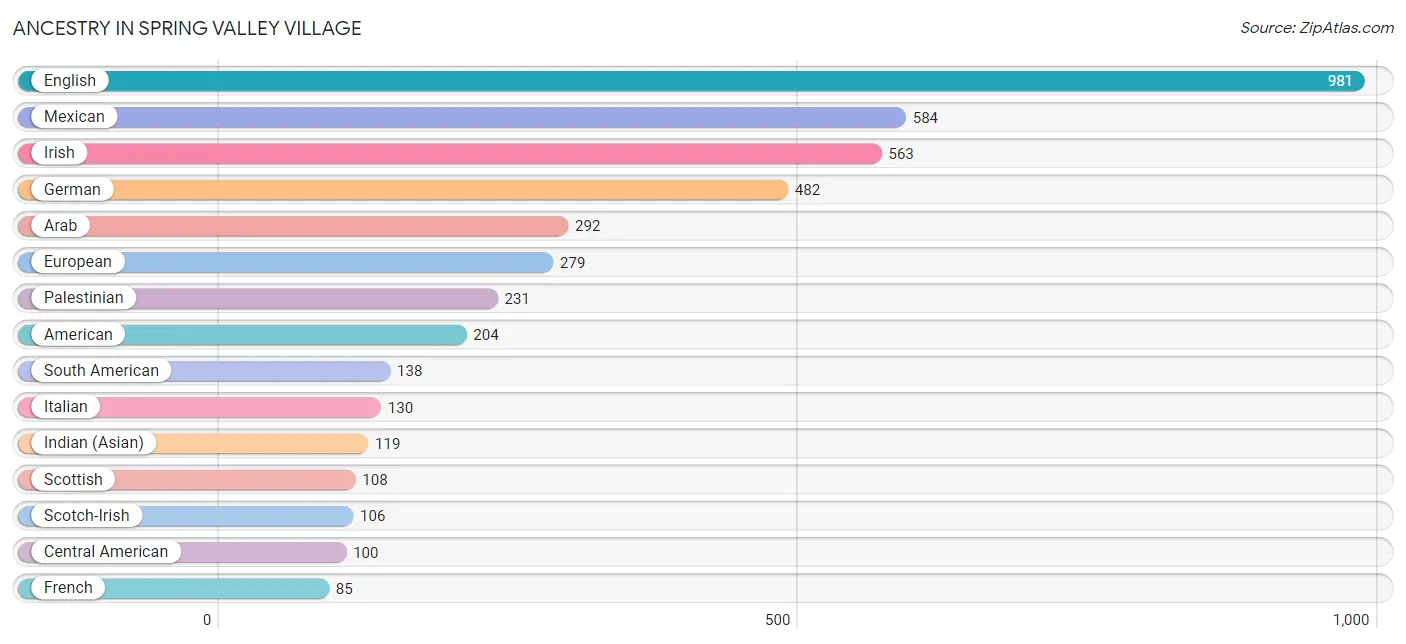
Ancestry in Spring Valley Village
The most populous ancestries reported in Spring Valley Village are English (981 | 23.2%), Mexican (584 | 13.8%), Irish (563 | 13.3%), German (482 | 11.4%), and Arab (292 | 6.9%), together accounting for 68.7% of all Spring Valley Village residents.
| Ancestry | # Population | % Population |
| American | 204 | 4.8% |
| Arab | 292 | 6.9% |
| Bhutanese | 13 | 0.3% |
| British | 65 | 1.5% |
| Burmese | 26 | 0.6% |
| Cajun | 8 | 0.2% |
| Canadian | 18 | 0.4% |
| Central American | 100 | 2.4% |
| Choctaw | 23 | 0.5% |
| Colombian | 44 | 1.0% |
| Cuban | 8 | 0.2% |
| Czech | 31 | 0.7% |
| Dutch | 34 | 0.8% |
| Eastern European | 42 | 1.0% |
| Ecuadorian | 16 | 0.4% |
| Egyptian | 13 | 0.3% |
| English | 981 | 23.2% |
| European | 279 | 6.6% |
| Filipino | 53 | 1.3% |
| Finnish | 28 | 0.7% |
| French | 85 | 2.0% |
| German | 482 | 11.4% |
| Hungarian | 4 | 0.1% |
| Indian (Asian) | 119 | 2.8% |
| Iranian | 46 | 1.1% |
| Irish | 563 | 13.3% |
| Italian | 130 | 3.1% |
| Korean | 20 | 0.5% |
| Lebanese | 48 | 1.1% |
| Mexican | 584 | 13.8% |
| Nicaraguan | 46 | 1.1% |
| Northern European | 9 | 0.2% |
| Norwegian | 40 | 0.9% |
| Pakistani | 21 | 0.5% |
| Palestinian | 231 | 5.5% |
| Panamanian | 45 | 1.1% |
| Polish | 19 | 0.4% |
| Portuguese | 19 | 0.4% |
| Puerto Rican | 6 | 0.1% |
| Romanian | 4 | 0.1% |
| Russian | 27 | 0.6% |
| Salvadoran | 9 | 0.2% |
| Scandinavian | 12 | 0.3% |
| Scotch-Irish | 106 | 2.5% |
| Scottish | 108 | 2.6% |
| South American | 138 | 3.3% |
| Spanish | 4 | 0.1% |
| Sri Lankan | 67 | 1.6% |
| Swedish | 6 | 0.1% |
| Swiss | 10 | 0.2% |
| Syrian | 59 | 1.4% |
| Venezuelan | 78 | 1.8% | View All 52 Rows |
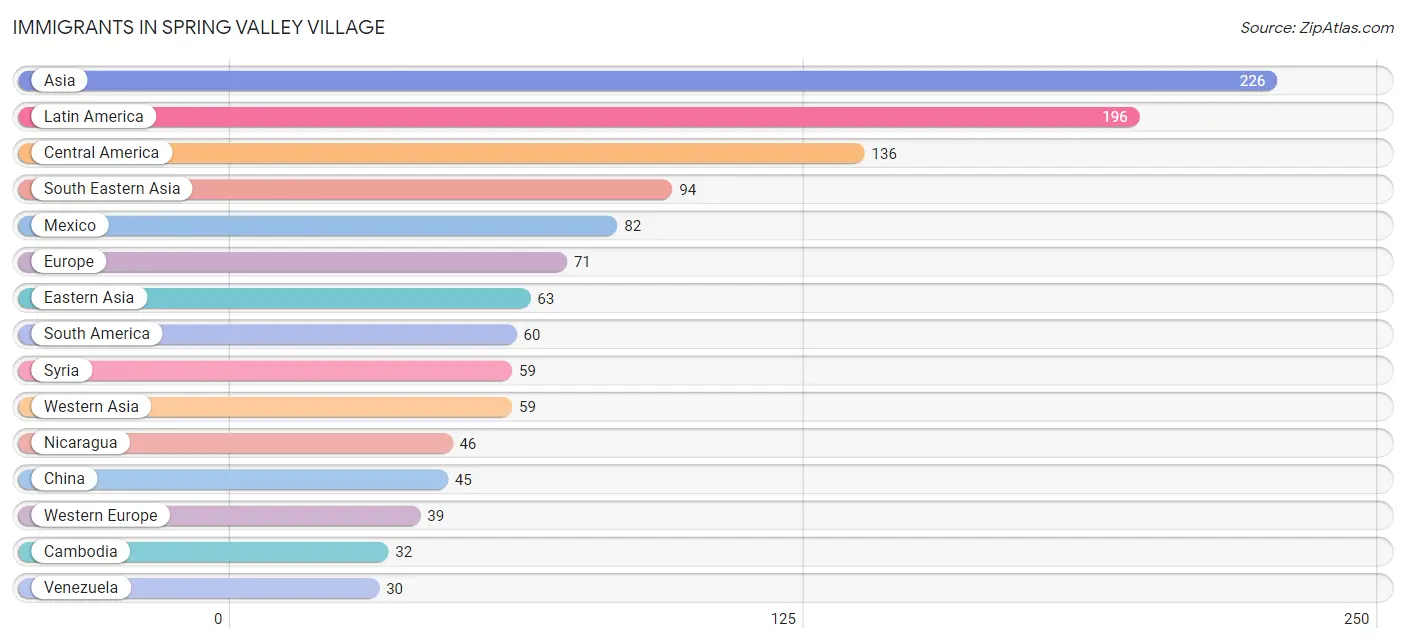
Immigrants in Spring Valley Village
The most numerous immigrant groups reported in Spring Valley Village came from Asia (226 | 5.3%), Latin America (196 | 4.6%), Central America (136 | 3.2%), South Eastern Asia (94 | 2.2%), and Mexico (82 | 1.9%), together accounting for 17.4% of all Spring Valley Village residents.
| Immigration Origin | # Population | % Population |
| Asia | 226 | 5.3% |
| Brazil | 7 | 0.2% |
| Cambodia | 32 | 0.8% |
| Canada | 8 | 0.2% |
| Central America | 136 | 3.2% |
| China | 45 | 1.1% |
| Colombia | 15 | 0.4% |
| Eastern Asia | 63 | 1.5% |
| Ecuador | 8 | 0.2% |
| Europe | 71 | 1.7% |
| France | 15 | 0.4% |
| Germany | 10 | 0.2% |
| Hong Kong | 6 | 0.1% |
| Indonesia | 20 | 0.5% |
| Iran | 10 | 0.2% |
| Italy | 12 | 0.3% |
| Japan | 6 | 0.1% |
| Korea | 12 | 0.3% |
| Latin America | 196 | 4.6% |
| Mexico | 82 | 1.9% |
| Netherlands | 14 | 0.3% |
| Nicaragua | 46 | 1.1% |
| Northern Europe | 20 | 0.5% |
| Panama | 8 | 0.2% |
| Singapore | 18 | 0.4% |
| South America | 60 | 1.4% |
| South Central Asia | 10 | 0.2% |
| South Eastern Asia | 94 | 2.2% |
| Southern Europe | 12 | 0.3% |
| Syria | 59 | 1.4% |
| Taiwan | 28 | 0.7% |
| Thailand | 7 | 0.2% |
| Venezuela | 30 | 0.7% |
| Vietnam | 17 | 0.4% |
| Western Asia | 59 | 1.4% |
| Western Europe | 39 | 0.9% | View All 36 Rows |
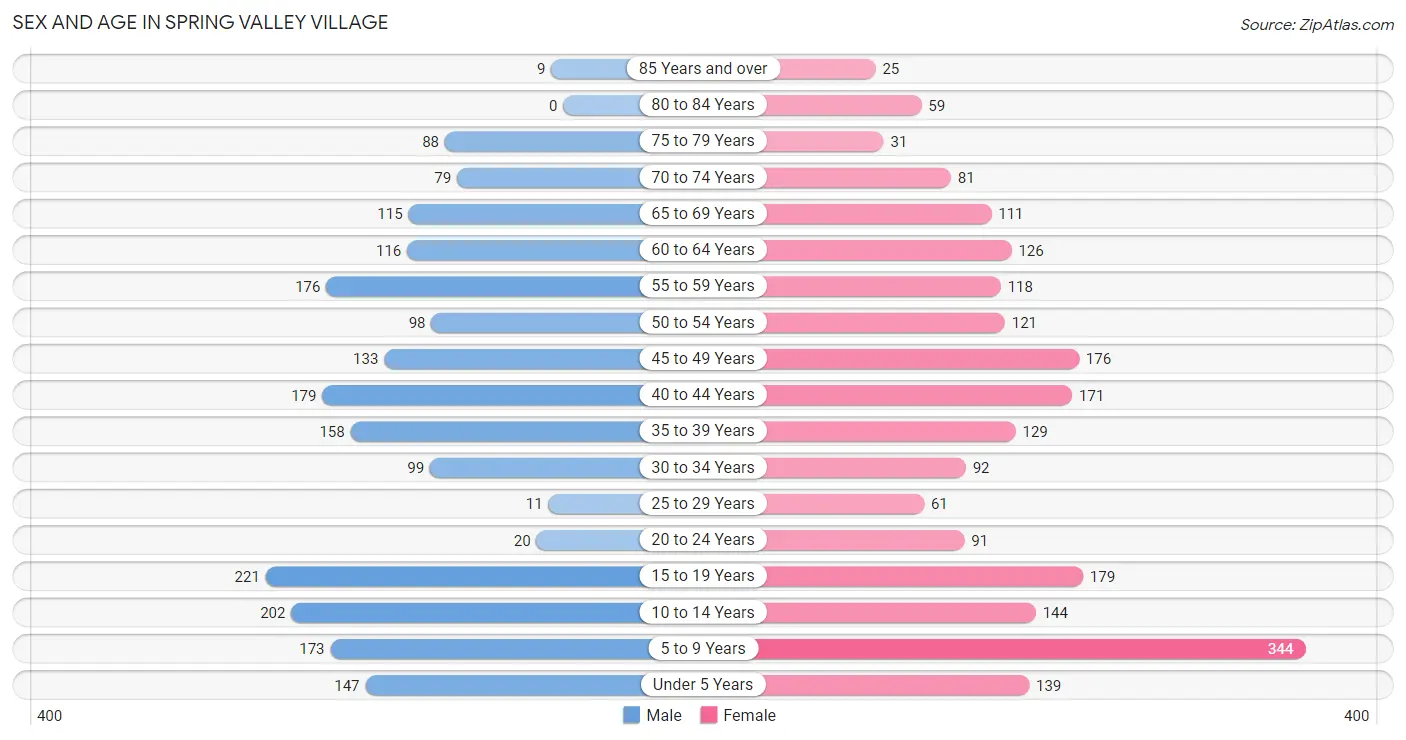
Sex and Age in Spring Valley Village
Sex and Age in Spring Valley Village
The most populous age groups in Spring Valley Village are 15 to 19 Years (221 | 10.9%) for men and 5 to 9 Years (344 | 15.7%) for women.
| Age Bracket | Male | Female |
| Under 5 Years | 147 (7.3%) | 139 (6.3%) |
| 5 to 9 Years | 173 (8.6%) | 344 (15.7%) |
| 10 to 14 Years | 202 (10.0%) | 144 (6.6%) |
| 15 to 19 Years | 221 (10.9%) | 179 (8.1%) |
| 20 to 24 Years | 20 (1.0%) | 91 (4.1%) |
| 25 to 29 Years | 11 (0.5%) | 61 (2.8%) |
| 30 to 34 Years | 99 (4.9%) | 92 (4.2%) |
| 35 to 39 Years | 158 (7.8%) | 129 (5.9%) |
| 40 to 44 Years | 179 (8.8%) | 171 (7.8%) |
| 45 to 49 Years | 133 (6.6%) | 176 (8.0%) |
| 50 to 54 Years | 98 (4.8%) | 121 (5.5%) |
| 55 to 59 Years | 176 (8.7%) | 118 (5.4%) |
| 60 to 64 Years | 116 (5.7%) | 126 (5.7%) |
| 65 to 69 Years | 115 (5.7%) | 111 (5.1%) |
| 70 to 74 Years | 79 (3.9%) | 81 (3.7%) |
| 75 to 79 Years | 88 (4.3%) | 31 (1.4%) |
| 80 to 84 Years | 0 (0.0%) | 59 (2.7%) |
| 85 Years and over | 9 (0.4%) | 25 (1.1%) |
| Total | 2,024 (100.0%) | 2,198 (100.0%) |
Families and Households in Spring Valley Village
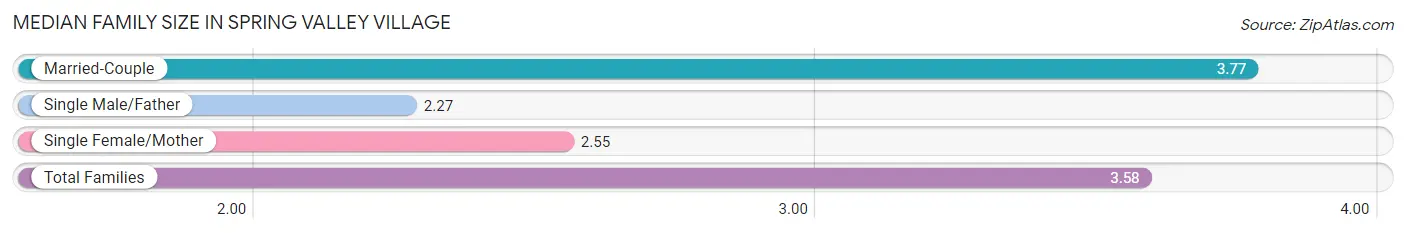
Median Family Size in Spring Valley Village
The median family size in Spring Valley Village is 3.58 persons per family, with married-couple families (954 | 85.2%) accounting for the largest median family size of 3.77 persons per family. On the other hand, single male/father families (33 | 2.9%) represent the smallest median family size with 2.27 persons per family.
| Family Type | # Families | Family Size |
| Married-Couple | 954 (85.2%) | 3.77 |
| Single Male/Father | 33 (2.9%) | 2.27 |
| Single Female/Mother | 133 (11.9%) | 2.55 |
| Total Families | 1,120 (100.0%) | 3.58 |
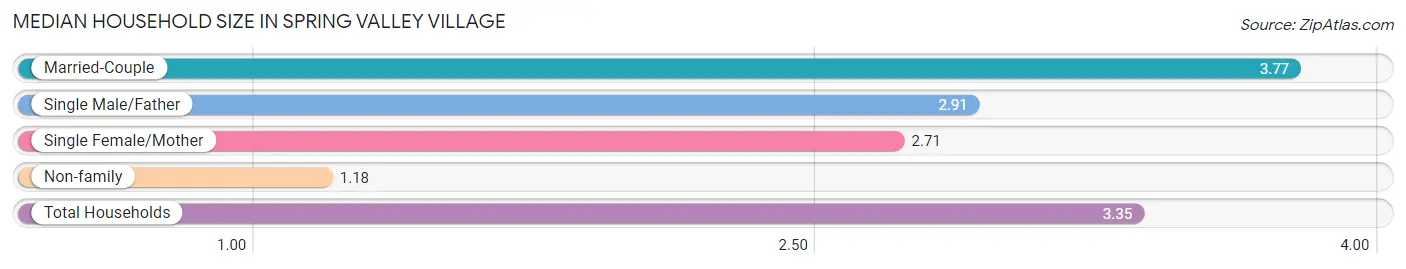
Median Household Size in Spring Valley Village
The median household size in Spring Valley Village is 3.35 persons per household, with married-couple households (954 | 75.6%) accounting for the largest median household size of 3.77 persons per household. non-family households (141 | 11.2%) represent the smallest median household size with 1.18 persons per household.
| Household Type | # Households | Household Size |
| Married-Couple | 954 (75.6%) | 3.77 |
| Single Male/Father | 33 (2.6%) | 2.91 |
| Single Female/Mother | 133 (10.5%) | 2.71 |
| Non-family | 141 (11.2%) | 1.18 |
| Total Households | 1,261 (100.0%) | 3.35 |
Household Size by Marriage Status in Spring Valley Village
Out of a total of 1,261 households in Spring Valley Village, 1,120 (88.8%) are family households, while 141 (11.2%) are nonfamily households. The most numerous type of family households are 4-person households, comprising 350, and the most common type of nonfamily households are 1-person households, comprising 130.
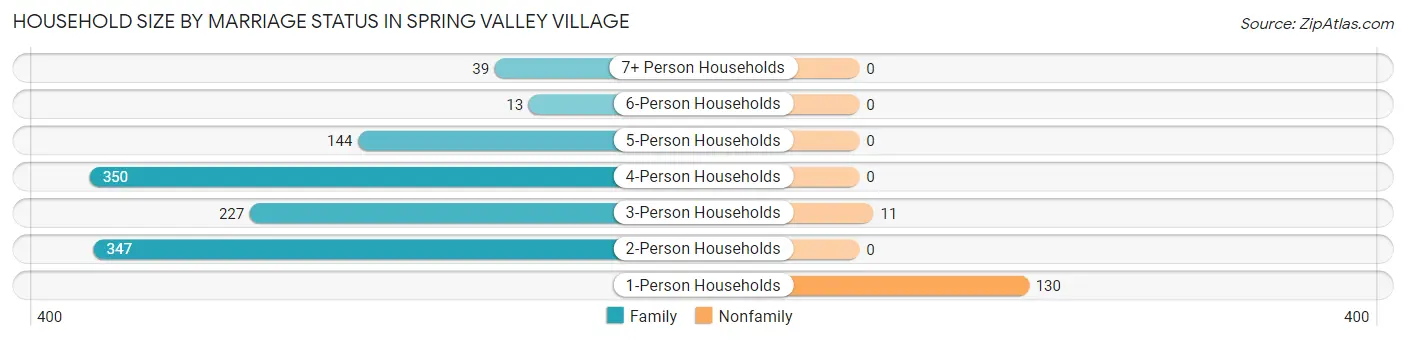
| Household Size | Family Households | Nonfamily Households |
| 1-Person Households | - | 130 (10.3%) |
| 2-Person Households | 347 (27.5%) | 0 (0.0%) |
| 3-Person Households | 227 (18.0%) | 11 (0.9%) |
| 4-Person Households | 350 (27.8%) | 0 (0.0%) |
| 5-Person Households | 144 (11.4%) | 0 (0.0%) |
| 6-Person Households | 13 (1.0%) | 0 (0.0%) |
| 7+ Person Households | 39 (3.1%) | 0 (0.0%) |
| Total | 1,120 (88.8%) | 141 (11.2%) |
Female Fertility in Spring Valley Village
Fertility by Age in Spring Valley Village
Average fertility rate in Spring Valley Village is 50.0 births per 1,000 women. Women in the age bracket of 20 to 34 years have the highest fertility rate with 148.0 births per 1,000 women. Women in the age bracket of 20 to 34 years acount for 76.6% of all women with births.
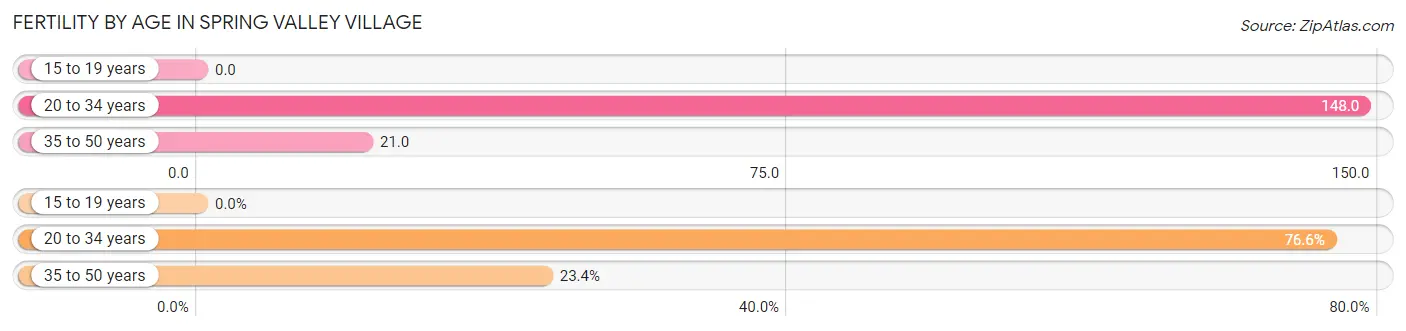
| Age Bracket | Women with Births | Births / 1,000 Women |
| 15 to 19 years | 0 (0.0%) | 0.0 |
| 20 to 34 years | 36 (76.6%) | 148.0 |
| 35 to 50 years | 11 (23.4%) | 21.0 |
| Total | 47 (100.0%) | 50.0 |
Fertility by Age by Marriage Status in Spring Valley Village
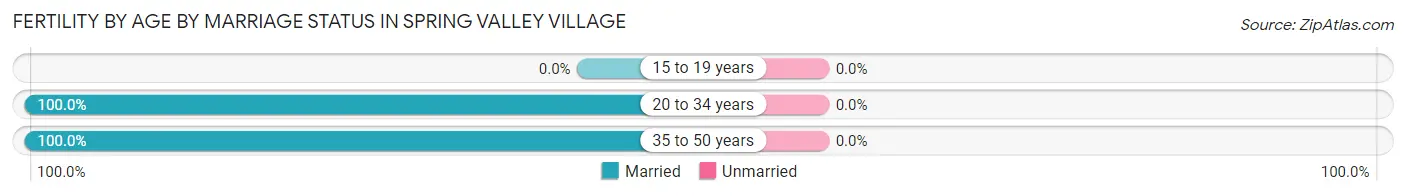
| Age Bracket | Married | Unmarried |
| 15 to 19 years | 0 (0.0%) | 0 (0.0%) |
| 20 to 34 years | 36 (100.0%) | 0 (0.0%) |
| 35 to 50 years | 11 (100.0%) | 0 (0.0%) |
| Total | 47 (100.0%) | 0 (0.0%) |
Fertility by Education in Spring Valley Village
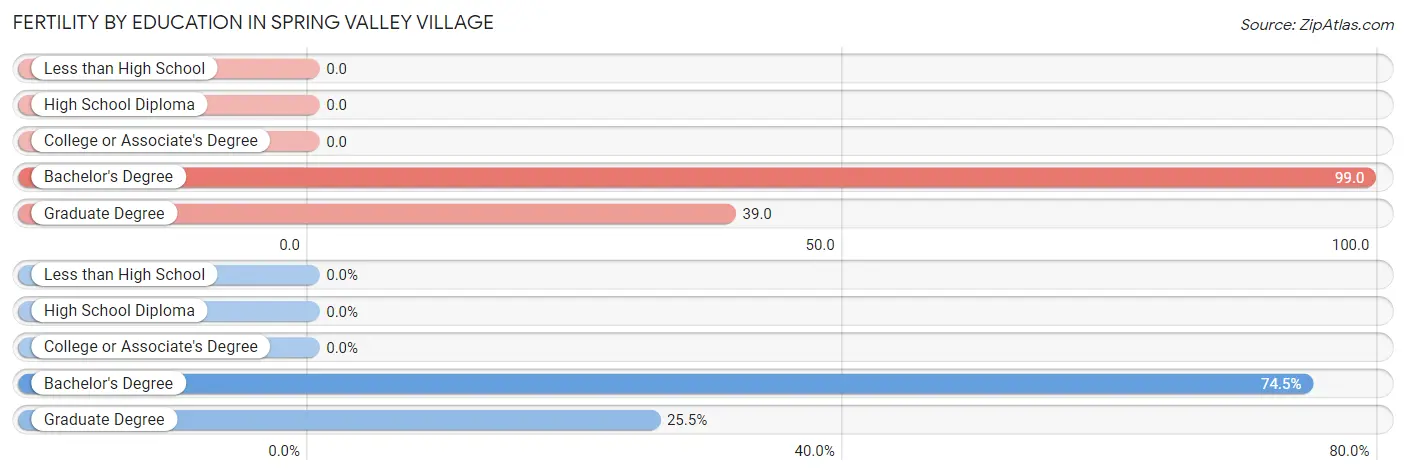
| Educational Attainment | Women with Births | Births / 1,000 Women |
| Less than High School | 0 (0.0%) | 0.0 |
| High School Diploma | 0 (0.0%) | 0.0 |
| College or Associate's Degree | 0 (0.0%) | 0.0 |
| Bachelor's Degree | 35 (74.5%) | 99.0 |
| Graduate Degree | 12 (25.5%) | 39.0 |
| Total | 47 (100.0%) | 50.0 |
Fertility by Education by Marriage Status in Spring Valley Village
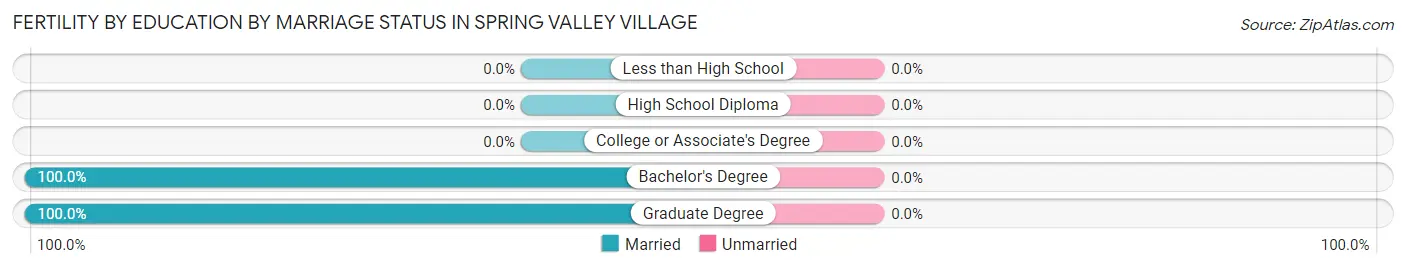
| Educational Attainment | Married | Unmarried |
| Less than High School | 0 (0.0%) | 0 (0.0%) |
| High School Diploma | 0 (0.0%) | 0 (0.0%) |
| College or Associate's Degree | 0 (0.0%) | 0 (0.0%) |
| Bachelor's Degree | 35 (100.0%) | 0 (0.0%) |
| Graduate Degree | 12 (100.0%) | 0 (0.0%) |
| Total | 47 (100.0%) | 0 (0.0%) |
Employment Characteristics in Spring Valley Village
Employment by Class of Employer in Spring Valley Village
Among the 1,976 employed individuals in Spring Valley Village, private company employees (1,369 | 69.3%), self-employed (incorporated) (250 | 12.7%), and self-employed (not incorporated) (190 | 9.6%) make up the most common classes of employment.
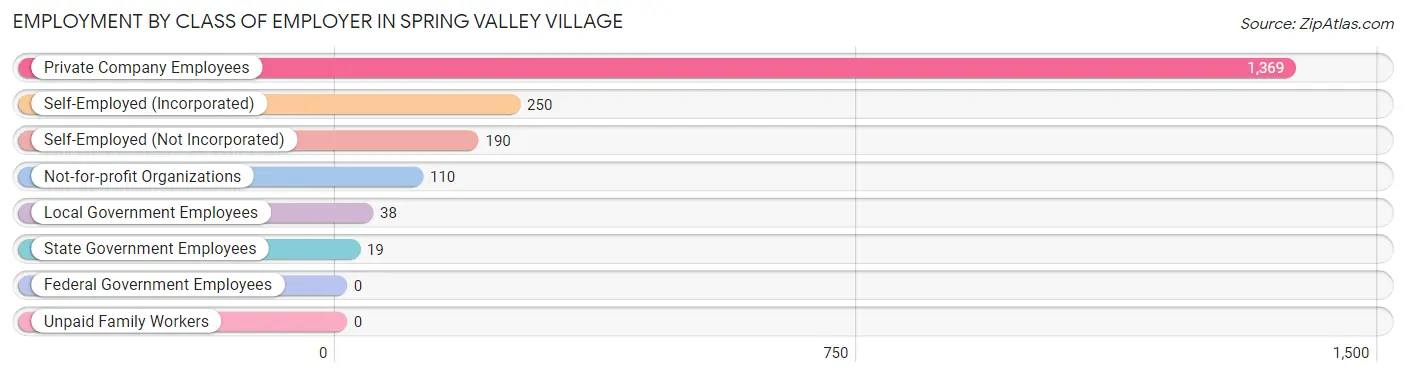
| Employer Class | # Employees | % Employees |
| Private Company Employees | 1,369 | 69.3% |
| Self-Employed (Incorporated) | 250 | 12.7% |
| Self-Employed (Not Incorporated) | 190 | 9.6% |
| Not-for-profit Organizations | 110 | 5.6% |
| Local Government Employees | 38 | 1.9% |
| State Government Employees | 19 | 1.0% |
| Federal Government Employees | 0 | 0.0% |
| Unpaid Family Workers | 0 | 0.0% |
| Total | 1,976 | 100.0% |
Employment Status by Age in Spring Valley Village
According to the labor force statistics for Spring Valley Village, out of the total population over 16 years of age (3,035), 66.6% or 2,021 individuals are in the labor force, with 1.4% or 28 of them unemployed. The age group with the highest labor force participation rate is 25 to 29 years, with 100.0% or 72 individuals in the labor force. Within the labor force, the 45 to 54 years age range has the highest percentage of unemployed individuals, with 6.3% or 28 of them being unemployed.
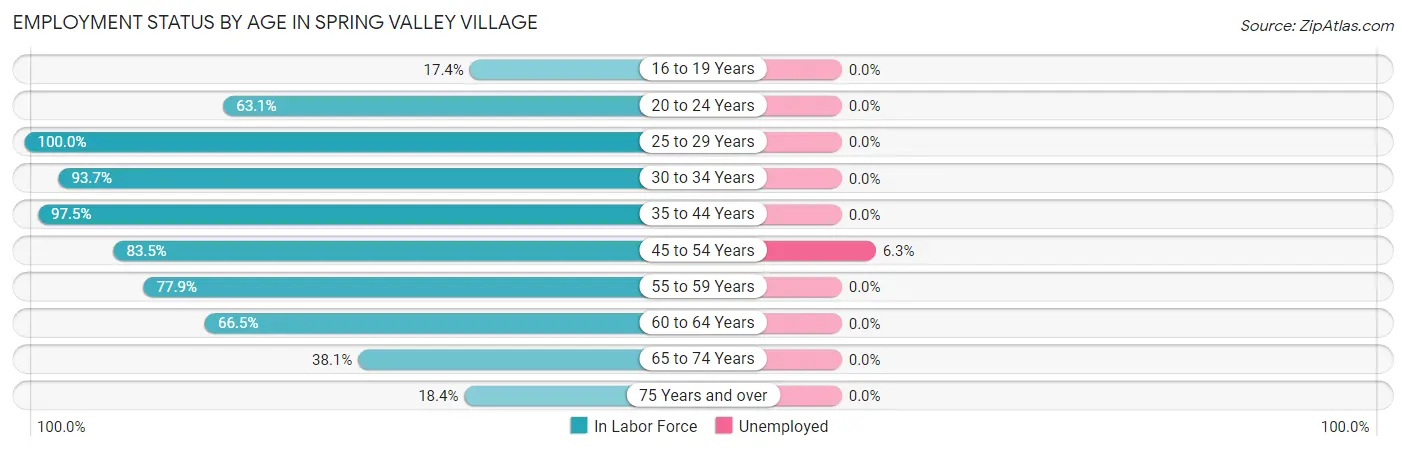
| Age Bracket | In Labor Force | Unemployed |
| 16 to 19 Years | 63 (17.4%) | 0 (0.0%) |
| 20 to 24 Years | 70 (63.1%) | 0 (0.0%) |
| 25 to 29 Years | 72 (100.0%) | 0 (0.0%) |
| 30 to 34 Years | 179 (93.7%) | 0 (0.0%) |
| 35 to 44 Years | 621 (97.5%) | 0 (0.0%) |
| 45 to 54 Years | 441 (83.5%) | 28 (6.3%) |
| 55 to 59 Years | 229 (77.9%) | 0 (0.0%) |
| 60 to 64 Years | 161 (66.5%) | 0 (0.0%) |
| 65 to 74 Years | 147 (38.1%) | 0 (0.0%) |
| 75 Years and over | 39 (18.4%) | 0 (0.0%) |
| Total | 2,021 (66.6%) | 28 (1.4%) |
Employment Status by Educational Attainment in Spring Valley Village
According to labor force statistics for Spring Valley Village, 86.7% of individuals (1,703) out of the total population between 25 and 64 years of age (1,964) are in the labor force, with 1.6% or 27 of them being unemployed. The group with the highest labor force participation rate are those with the educational attainment of less than high school, with 100.0% or 15 individuals in the labor force. Within the labor force, individuals with bachelor's degree or higher education have the highest percentage of unemployment, with 1.8% or 27 of them being unemployed.
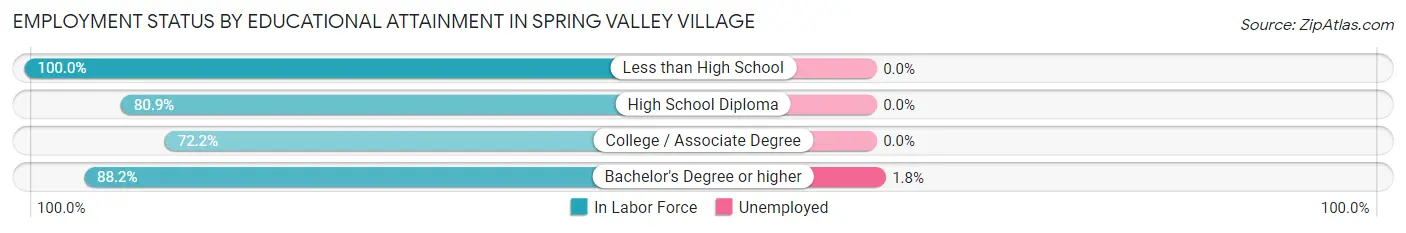
| Educational Attainment | In Labor Force | Unemployed |
| Less than High School | 15 (100.0%) | 0 (0.0%) |
| High School Diploma | 55 (80.9%) | 0 (0.0%) |
| College / Associate Degree | 117 (72.2%) | 0 (0.0%) |
| Bachelor's Degree or higher | 1,516 (88.2%) | 31 (1.8%) |
| Total | 1,703 (86.7%) | 31 (1.6%) |
Employment Occupations by Sex in Spring Valley Village
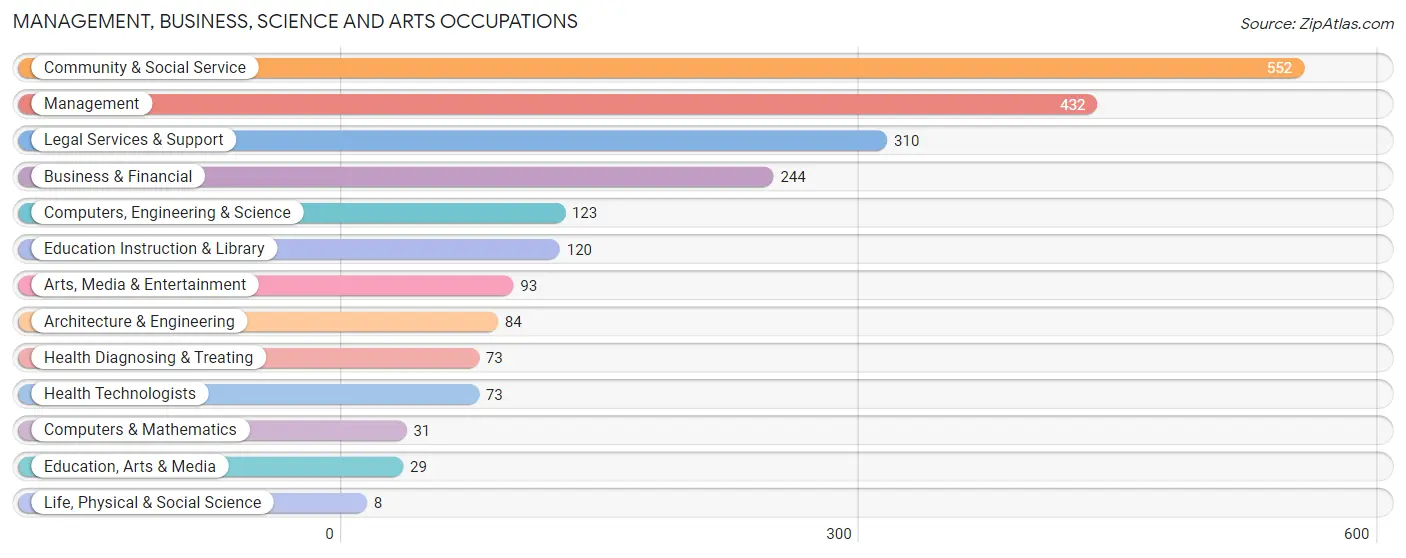
Management, Business, Science and Arts Occupations
The most common Management, Business, Science and Arts occupations in Spring Valley Village are Community & Social Service (552 | 27.7%), Management (432 | 21.7%), Legal Services & Support (310 | 15.5%), Business & Financial (244 | 12.2%), and Computers, Engineering & Science (123 | 6.2%).
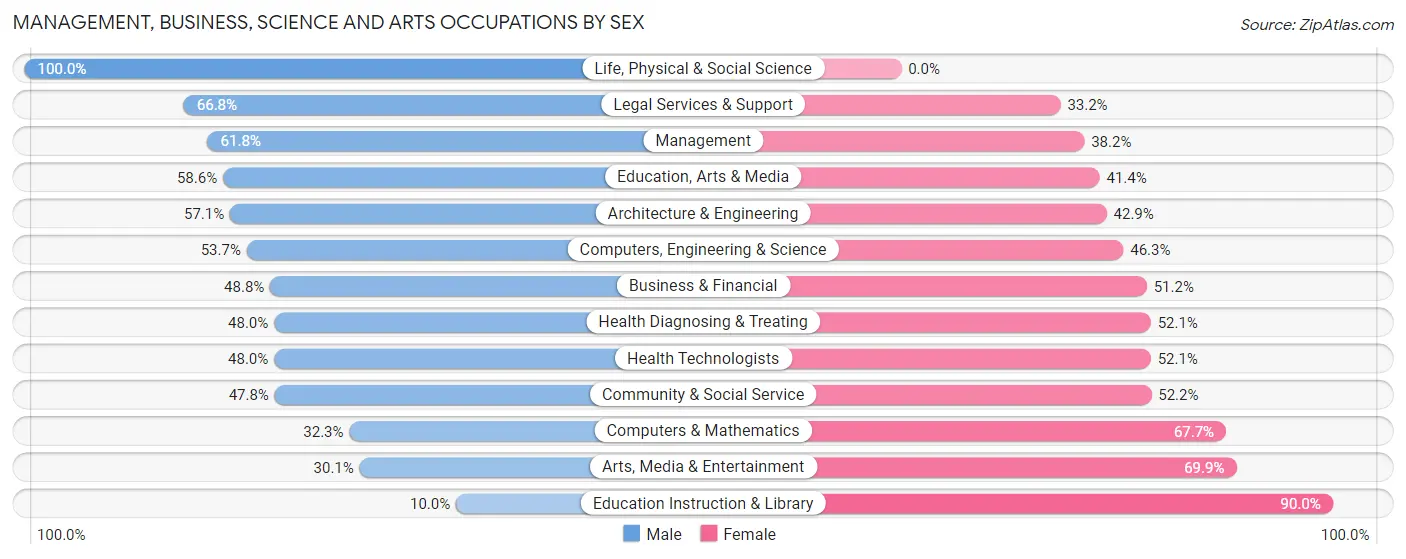
Management, Business, Science and Arts Occupations by Sex
Within the Management, Business, Science and Arts occupations in Spring Valley Village, the most male-oriented occupations are Life, Physical & Social Science (100.0%), Legal Services & Support (66.8%), and Management (61.8%), while the most female-oriented occupations are Education Instruction & Library (90.0%), Arts, Media & Entertainment (69.9%), and Computers & Mathematics (67.7%).
| Occupation | Male | Female |
| Management | 267 (61.8%) | 165 (38.2%) |
| Business & Financial | 119 (48.8%) | 125 (51.2%) |
| Computers, Engineering & Science | 66 (53.7%) | 57 (46.3%) |
| Computers & Mathematics | 10 (32.3%) | 21 (67.7%) |
| Architecture & Engineering | 48 (57.1%) | 36 (42.9%) |
| Life, Physical & Social Science | 8 (100.0%) | 0 (0.0%) |
| Community & Social Service | 264 (47.8%) | 288 (52.2%) |
| Education, Arts & Media | 17 (58.6%) | 12 (41.4%) |
| Legal Services & Support | 207 (66.8%) | 103 (33.2%) |
| Education Instruction & Library | 12 (10.0%) | 108 (90.0%) |
| Arts, Media & Entertainment | 28 (30.1%) | 65 (69.9%) |
| Health Diagnosing & Treating | 35 (47.9%) | 38 (52.0%) |
| Health Technologists | 35 (47.9%) | 38 (52.0%) |
| Total (Category) | 751 (52.7%) | 673 (47.3%) |
| Total (Overall) | 1,026 (51.4%) | 968 (48.5%) |
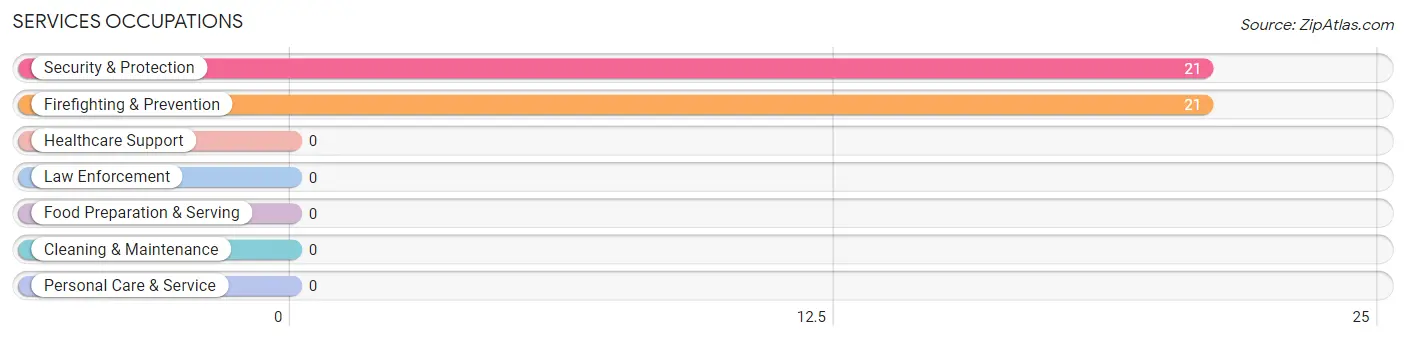
Services Occupations
The most common Services occupations in Spring Valley Village are Security & Protection (21 | 1.1%), and Firefighting & Prevention (21 | 1.1%).
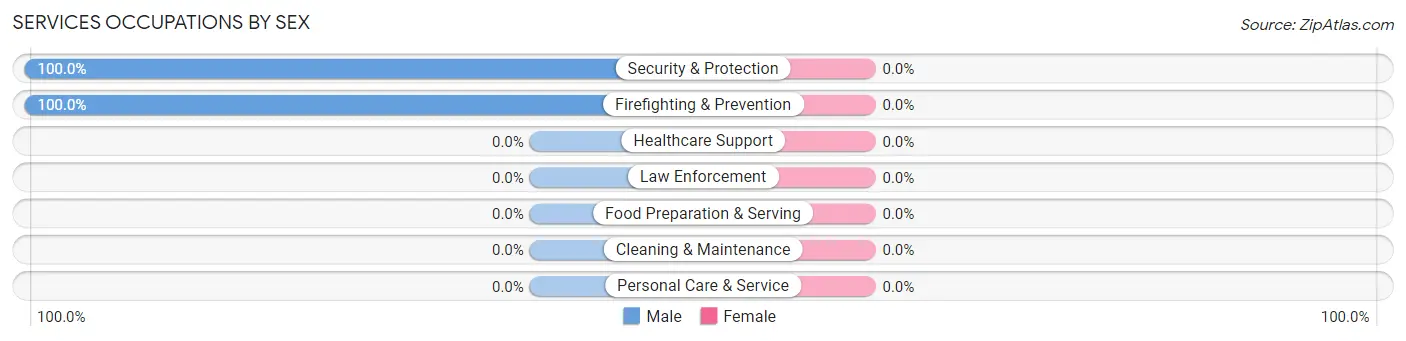
Services Occupations by Sex
| Occupation | Male | Female |
| Healthcare Support | 0 (0.0%) | 0 (0.0%) |
| Security & Protection | 21 (100.0%) | 0 (0.0%) |
| Firefighting & Prevention | 21 (100.0%) | 0 (0.0%) |
| Law Enforcement | 0 (0.0%) | 0 (0.0%) |
| Food Preparation & Serving | 0 (0.0%) | 0 (0.0%) |
| Cleaning & Maintenance | 0 (0.0%) | 0 (0.0%) |
| Personal Care & Service | 0 (0.0%) | 0 (0.0%) |
| Total (Category) | 21 (100.0%) | 0 (0.0%) |
| Total (Overall) | 1,026 (51.4%) | 968 (48.5%) |
Sales and Office Occupations
The most common Sales and Office occupations in Spring Valley Village are Sales & Related (266 | 13.3%), and Office & Administration (151 | 7.6%).
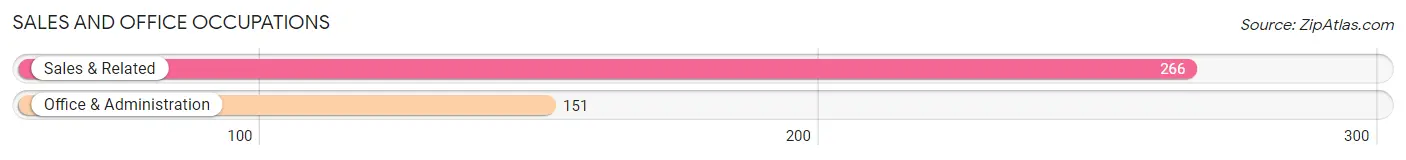
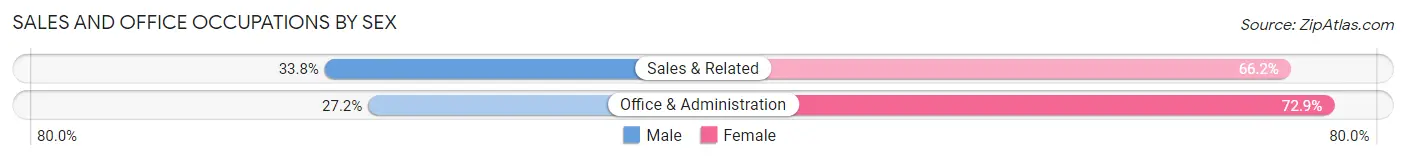
Sales and Office Occupations by Sex
| Occupation | Male | Female |
| Sales & Related | 90 (33.8%) | 176 (66.2%) |
| Office & Administration | 41 (27.2%) | 110 (72.9%) |
| Total (Category) | 131 (31.4%) | 286 (68.6%) |
| Total (Overall) | 1,026 (51.4%) | 968 (48.5%) |
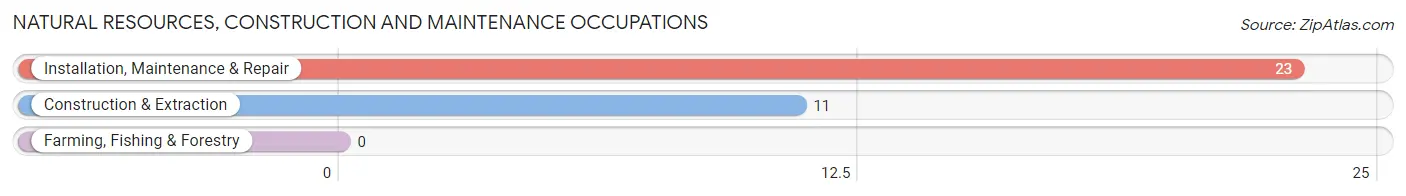
Natural Resources, Construction and Maintenance Occupations
The most common Natural Resources, Construction and Maintenance occupations in Spring Valley Village are Installation, Maintenance & Repair (23 | 1.1%), and Construction & Extraction (11 | 0.5%).
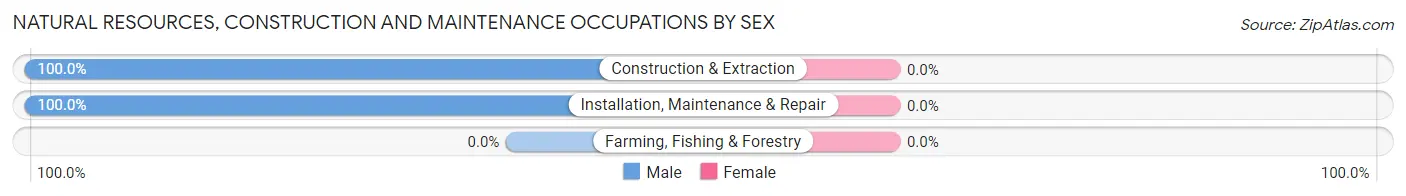
Natural Resources, Construction and Maintenance Occupations by Sex
| Occupation | Male | Female |
| Farming, Fishing & Forestry | 0 (0.0%) | 0 (0.0%) |
| Construction & Extraction | 11 (100.0%) | 0 (0.0%) |
| Installation, Maintenance & Repair | 23 (100.0%) | 0 (0.0%) |
| Total (Category) | 34 (100.0%) | 0 (0.0%) |
| Total (Overall) | 1,026 (51.4%) | 968 (48.5%) |
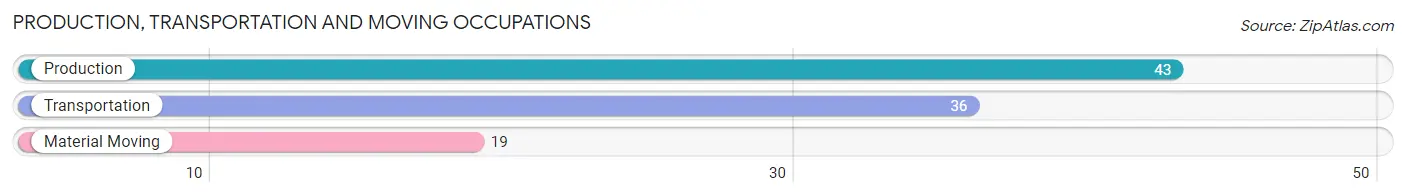
Production, Transportation and Moving Occupations
The most common Production, Transportation and Moving occupations in Spring Valley Village are Production (43 | 2.2%), Transportation (36 | 1.8%), and Material Moving (19 | 0.9%).
Production, Transportation and Moving Occupations by Sex
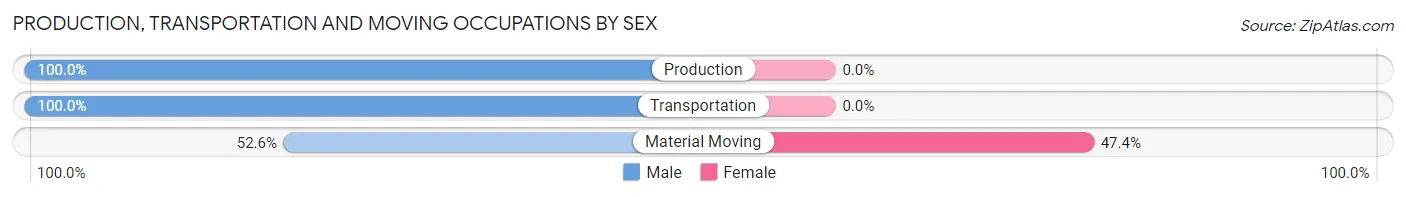
| Occupation | Male | Female |
| Production | 43 (100.0%) | 0 (0.0%) |
| Transportation | 36 (100.0%) | 0 (0.0%) |
| Material Moving | 10 (52.6%) | 9 (47.4%) |
| Total (Category) | 89 (90.8%) | 9 (9.2%) |
| Total (Overall) | 1,026 (51.4%) | 968 (48.5%) |
Employment Industries by Sex in Spring Valley Village
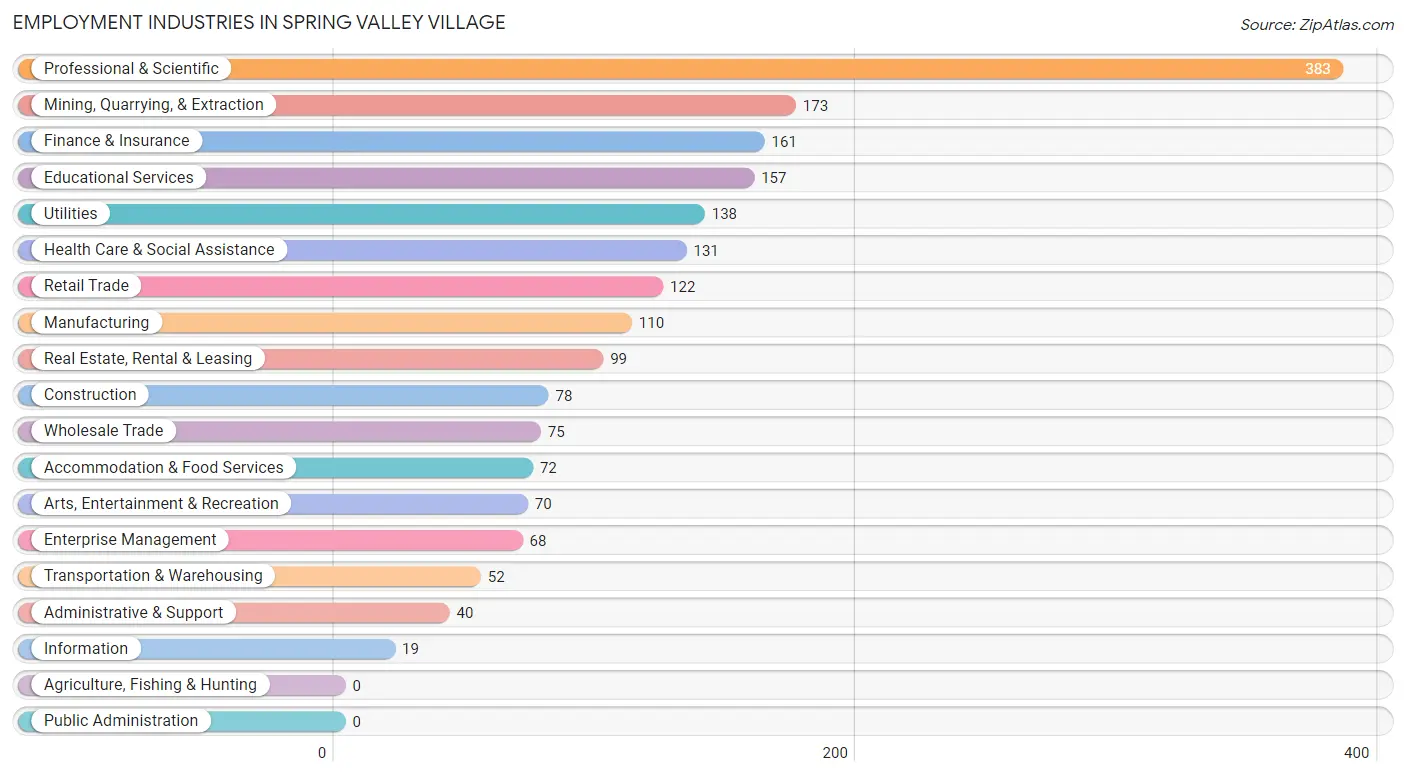
Employment Industries in Spring Valley Village
The major employment industries in Spring Valley Village include Professional & Scientific (383 | 19.2%), Mining, Quarrying, & Extraction (173 | 8.7%), Finance & Insurance (161 | 8.1%), Educational Services (157 | 7.9%), and Utilities (138 | 6.9%).
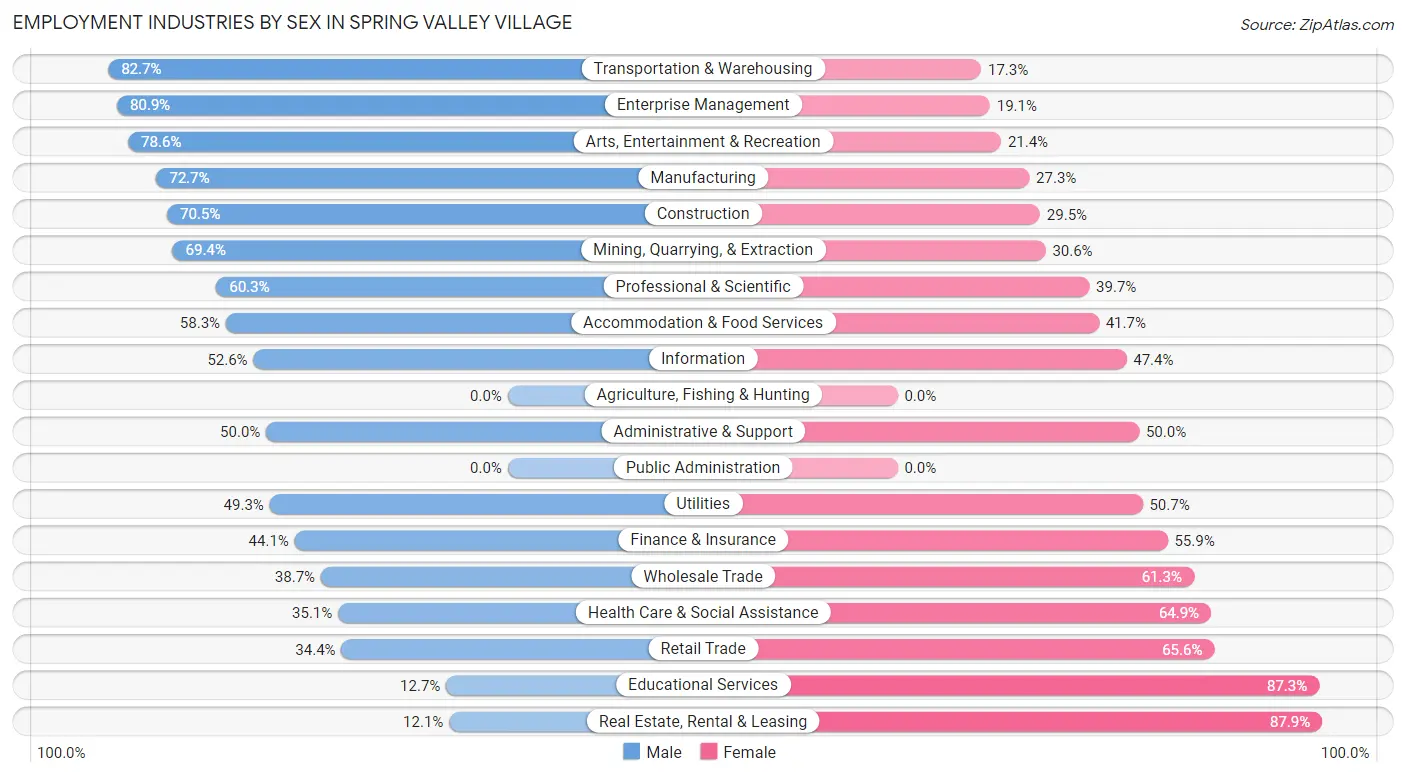
Employment Industries by Sex in Spring Valley Village
The Spring Valley Village industries that see more men than women are Transportation & Warehousing (82.7%), Enterprise Management (80.9%), and Arts, Entertainment & Recreation (78.6%), whereas the industries that tend to have a higher number of women are Real Estate, Rental & Leasing (87.9%), Educational Services (87.3%), and Retail Trade (65.6%).
| Industry | Male | Female |
| Agriculture, Fishing & Hunting | 0 (0.0%) | 0 (0.0%) |
| Mining, Quarrying, & Extraction | 120 (69.4%) | 53 (30.6%) |
| Construction | 55 (70.5%) | 23 (29.5%) |
| Manufacturing | 80 (72.7%) | 30 (27.3%) |
| Wholesale Trade | 29 (38.7%) | 46 (61.3%) |
| Retail Trade | 42 (34.4%) | 80 (65.6%) |
| Transportation & Warehousing | 43 (82.7%) | 9 (17.3%) |
| Utilities | 68 (49.3%) | 70 (50.7%) |
| Information | 10 (52.6%) | 9 (47.4%) |
| Finance & Insurance | 71 (44.1%) | 90 (55.9%) |
| Real Estate, Rental & Leasing | 12 (12.1%) | 87 (87.9%) |
| Professional & Scientific | 231 (60.3%) | 152 (39.7%) |
| Enterprise Management | 55 (80.9%) | 13 (19.1%) |
| Administrative & Support | 20 (50.0%) | 20 (50.0%) |
| Educational Services | 20 (12.7%) | 137 (87.3%) |
| Health Care & Social Assistance | 46 (35.1%) | 85 (64.9%) |
| Arts, Entertainment & Recreation | 55 (78.6%) | 15 (21.4%) |
| Accommodation & Food Services | 42 (58.3%) | 30 (41.7%) |
| Public Administration | 0 (0.0%) | 0 (0.0%) |
| Total | 1,026 (51.4%) | 968 (48.5%) |
Education in Spring Valley Village
School Enrollment in Spring Valley Village
The most common levels of schooling among the 1,428 students in Spring Valley Village are elementary school (371 | 26.0%), high school (350 | 24.5%), and middle school (294 | 20.6%).
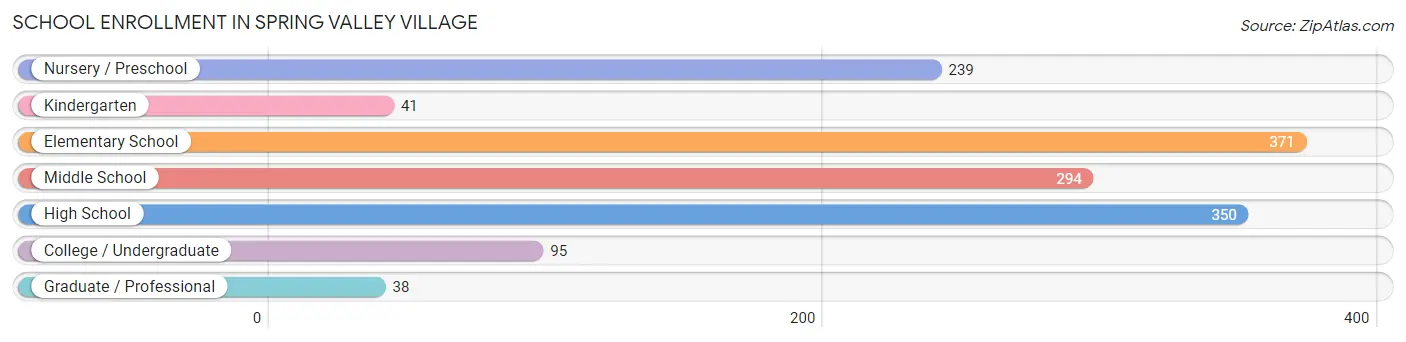
| School Level | # Students | % Students |
| Nursery / Preschool | 239 | 16.7% |
| Kindergarten | 41 | 2.9% |
| Elementary School | 371 | 26.0% |
| Middle School | 294 | 20.6% |
| High School | 350 | 24.5% |
| College / Undergraduate | 95 | 6.7% |
| Graduate / Professional | 38 | 2.7% |
| Total | 1,428 | 100.0% |
School Enrollment by Age by Funding Source in Spring Valley Village
Out of a total of 1,428 students who are enrolled in schools in Spring Valley Village, 326 (22.8%) attend a private institution, while the remaining 1,102 (77.2%) are enrolled in public schools. The age group of 35 years and over has the highest likelihood of being enrolled in private schools, with 18 (100.0% in the age bracket) enrolled. Conversely, the age group of 18 to 19 year olds has the lowest likelihood of being enrolled in a private school, with 115 (89.8% in the age bracket) attending a public institution.
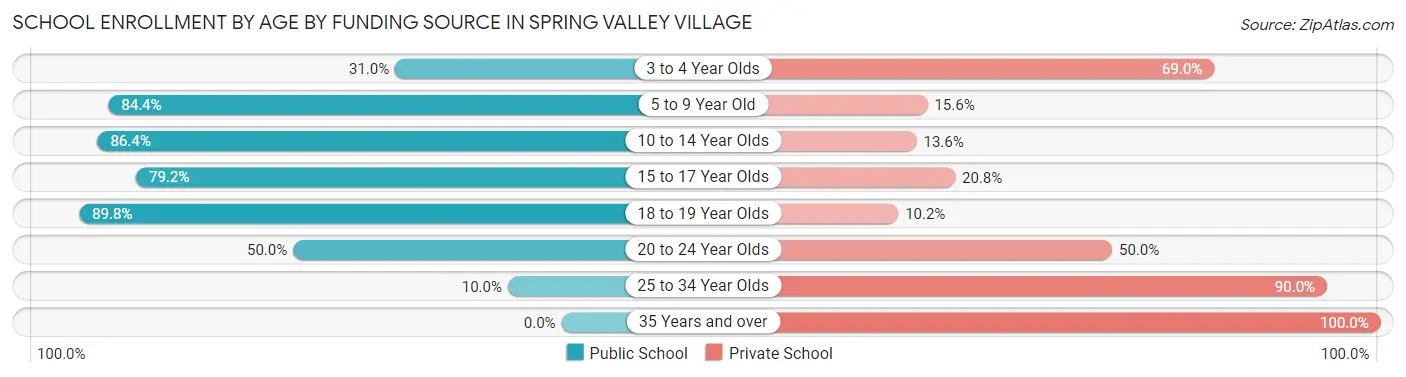
| Age Bracket | Public School | Private School |
| 3 to 4 Year Olds | 31 (31.0%) | 69 (69.0%) |
| 5 to 9 Year Old | 427 (84.4%) | 79 (15.6%) |
| 10 to 14 Year Olds | 299 (86.4%) | 47 (13.6%) |
| 15 to 17 Year Olds | 187 (79.2%) | 49 (20.8%) |
| 18 to 19 Year Olds | 115 (89.8%) | 13 (10.2%) |
| 20 to 24 Year Olds | 42 (50.0%) | 42 (50.0%) |
| 25 to 34 Year Olds | 1 (10.0%) | 9 (90.0%) |
| 35 Years and over | 0 (0.0%) | 18 (100.0%) |
| Total | 1,102 (77.2%) | 326 (22.8%) |
Educational Attainment by Field of Study in Spring Valley Village
Business (712 | 30.6%), engineering (303 | 13.0%), social sciences (185 | 7.9%), education (165 | 7.1%), and liberal arts & history (149 | 6.4%) are the most common fields of study among 2,329 individuals in Spring Valley Village who have obtained a bachelor's degree or higher.
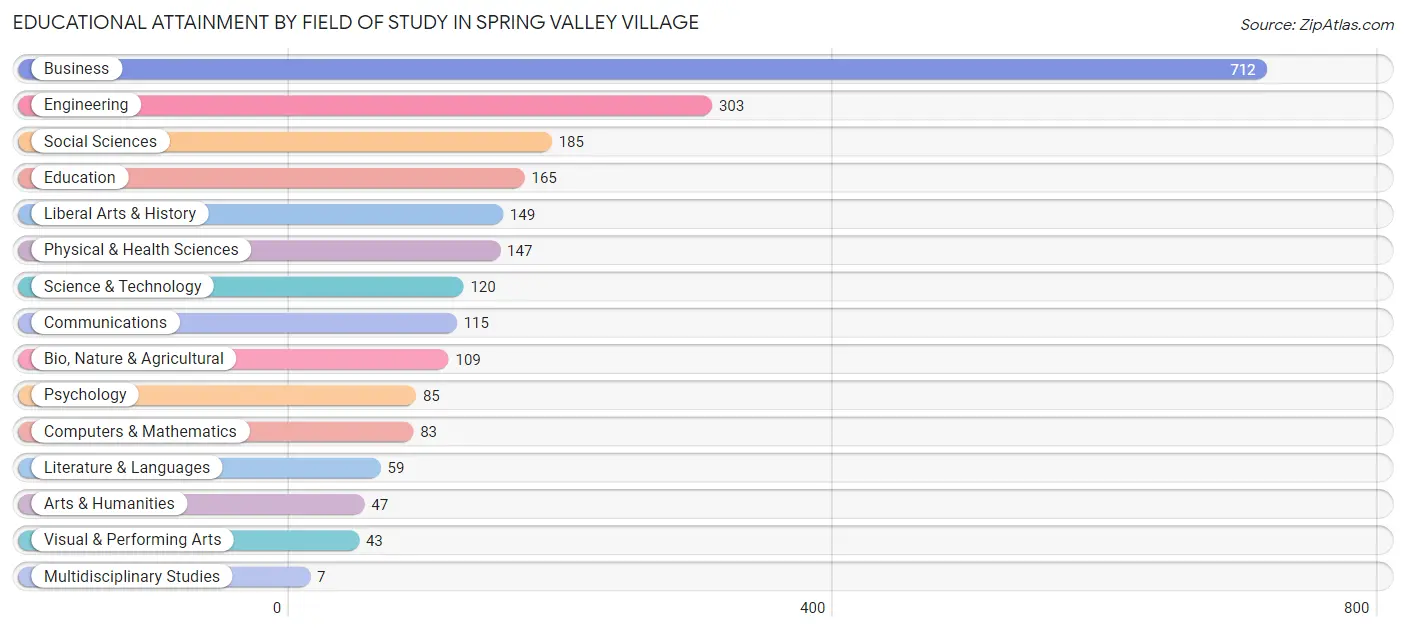
| Field of Study | # Graduates | % Graduates |
| Computers & Mathematics | 83 | 3.6% |
| Bio, Nature & Agricultural | 109 | 4.7% |
| Physical & Health Sciences | 147 | 6.3% |
| Psychology | 85 | 3.6% |
| Social Sciences | 185 | 7.9% |
| Engineering | 303 | 13.0% |
| Multidisciplinary Studies | 7 | 0.3% |
| Science & Technology | 120 | 5.1% |
| Business | 712 | 30.6% |
| Education | 165 | 7.1% |
| Literature & Languages | 59 | 2.5% |
| Liberal Arts & History | 149 | 6.4% |
| Visual & Performing Arts | 43 | 1.8% |
| Communications | 115 | 4.9% |
| Arts & Humanities | 47 | 2.0% |
| Total | 2,329 | 100.0% |
Transportation & Commute in Spring Valley Village
Vehicle Availability by Sex in Spring Valley Village
The most prevalent vehicle ownership categories in Spring Valley Village are males with 2 vehicles (524, accounting for 51.6%) and females with 2 vehicles (458, making up 54.6%).
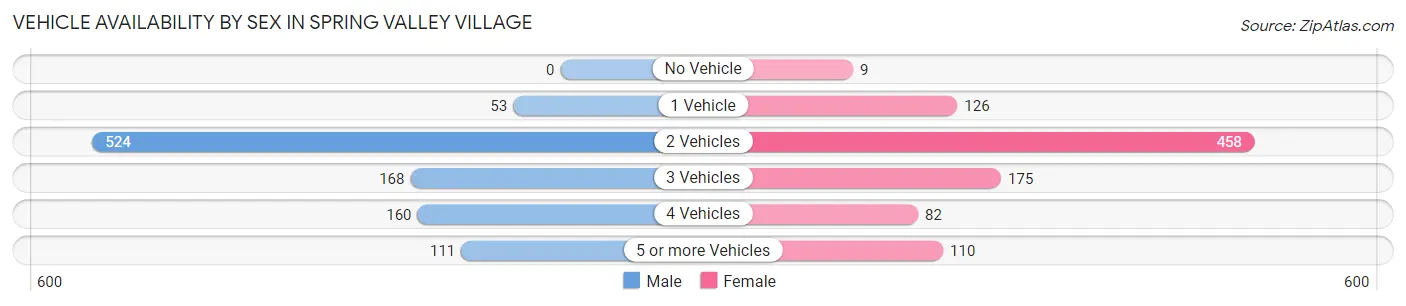
| Vehicles Available | Male | Female |
| No Vehicle | 0 (0.0%) | 9 (0.9%) |
| 1 Vehicle | 53 (5.2%) | 126 (13.1%) |
| 2 Vehicles | 524 (51.6%) | 458 (47.7%) |
| 3 Vehicles | 168 (16.5%) | 175 (18.2%) |
| 4 Vehicles | 160 (15.8%) | 82 (8.5%) |
| 5 or more Vehicles | 111 (10.9%) | 110 (11.5%) |
| Total | 1,016 (100.0%) | 960 (100.0%) |
Commute Time in Spring Valley Village
The most frequently occuring commute durations in Spring Valley Village are 20 to 24 minutes (313 commuters, 18.8%), 30 to 34 minutes (285 commuters, 17.2%), and 15 to 19 minutes (260 commuters, 15.6%).
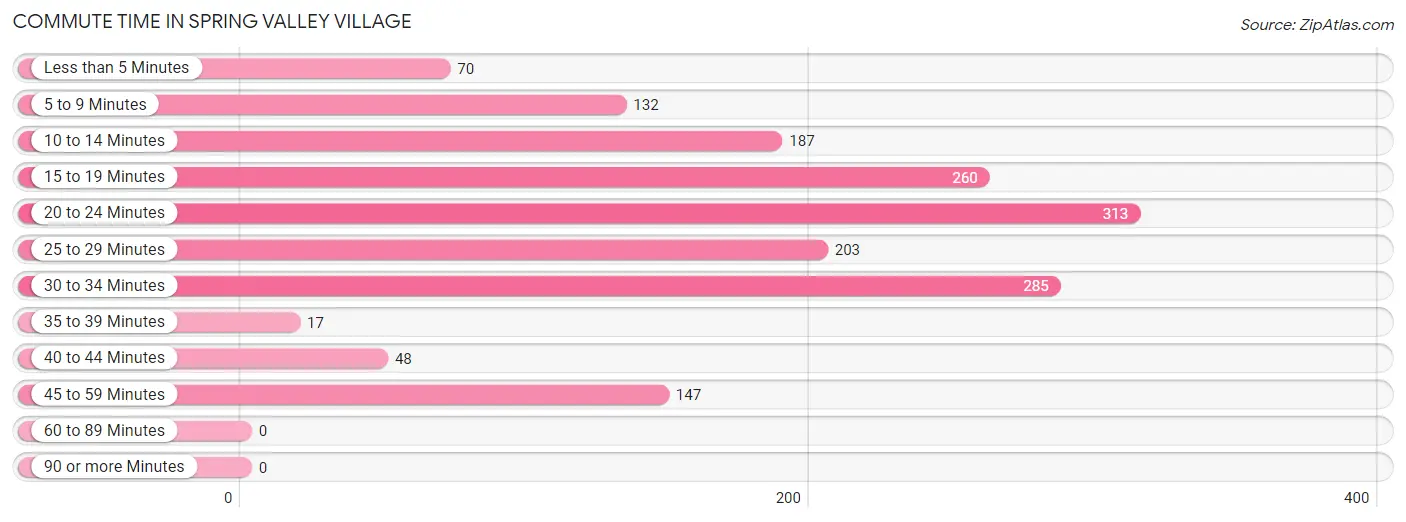
| Commute Time | # Commuters | % Commuters |
| Less than 5 Minutes | 70 | 4.2% |
| 5 to 9 Minutes | 132 | 7.9% |
| 10 to 14 Minutes | 187 | 11.3% |
| 15 to 19 Minutes | 260 | 15.6% |
| 20 to 24 Minutes | 313 | 18.8% |
| 25 to 29 Minutes | 203 | 12.2% |
| 30 to 34 Minutes | 285 | 17.2% |
| 35 to 39 Minutes | 17 | 1.0% |
| 40 to 44 Minutes | 48 | 2.9% |
| 45 to 59 Minutes | 147 | 8.8% |
| 60 to 89 Minutes | 0 | 0.0% |
| 90 or more Minutes | 0 | 0.0% |
Commute Time by Sex in Spring Valley Village
The most common commute times in Spring Valley Village are 20 to 24 minutes (225 commuters, 26.3%) for males and 30 to 34 minutes (160 commuters, 19.9%) for females.
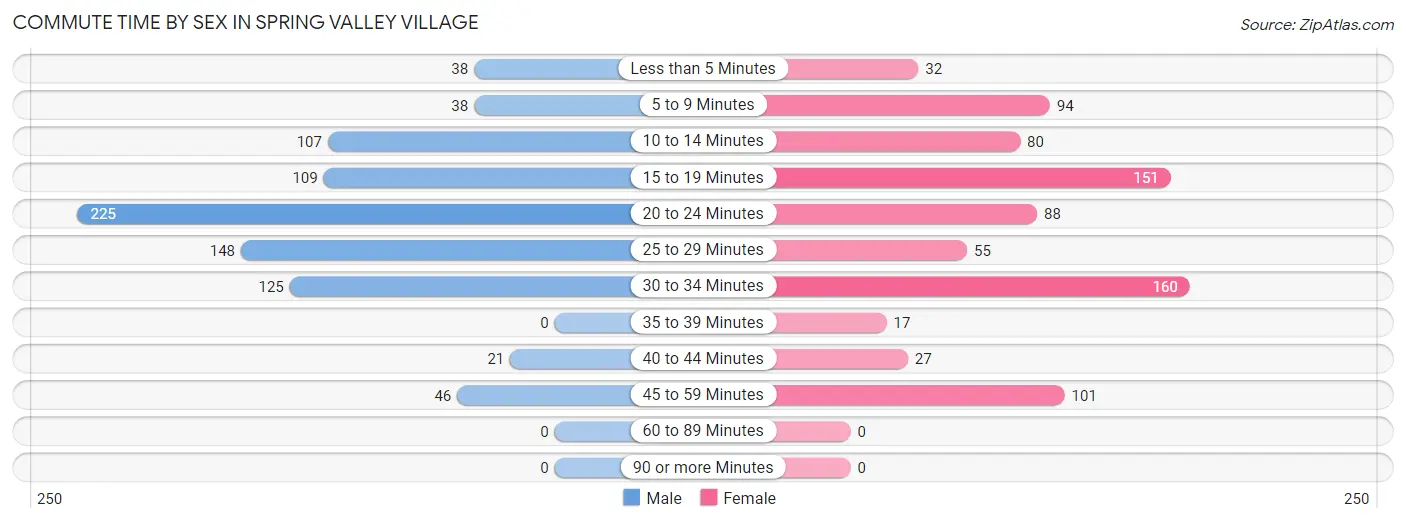
| Commute Time | Male | Female |
| Less than 5 Minutes | 38 (4.4%) | 32 (4.0%) |
| 5 to 9 Minutes | 38 (4.4%) | 94 (11.7%) |
| 10 to 14 Minutes | 107 (12.5%) | 80 (9.9%) |
| 15 to 19 Minutes | 109 (12.7%) | 151 (18.8%) |
| 20 to 24 Minutes | 225 (26.3%) | 88 (10.9%) |
| 25 to 29 Minutes | 148 (17.3%) | 55 (6.8%) |
| 30 to 34 Minutes | 125 (14.6%) | 160 (19.9%) |
| 35 to 39 Minutes | 0 (0.0%) | 17 (2.1%) |
| 40 to 44 Minutes | 21 (2.5%) | 27 (3.4%) |
| 45 to 59 Minutes | 46 (5.4%) | 101 (12.6%) |
| 60 to 89 Minutes | 0 (0.0%) | 0 (0.0%) |
| 90 or more Minutes | 0 (0.0%) | 0 (0.0%) |
Time of Departure to Work by Sex in Spring Valley Village
The most frequent times of departure to work in Spring Valley Village are 8:00 AM to 8:29 AM (159, 18.5%) for males and 7:00 AM to 7:29 AM (185, 23.0%) for females.
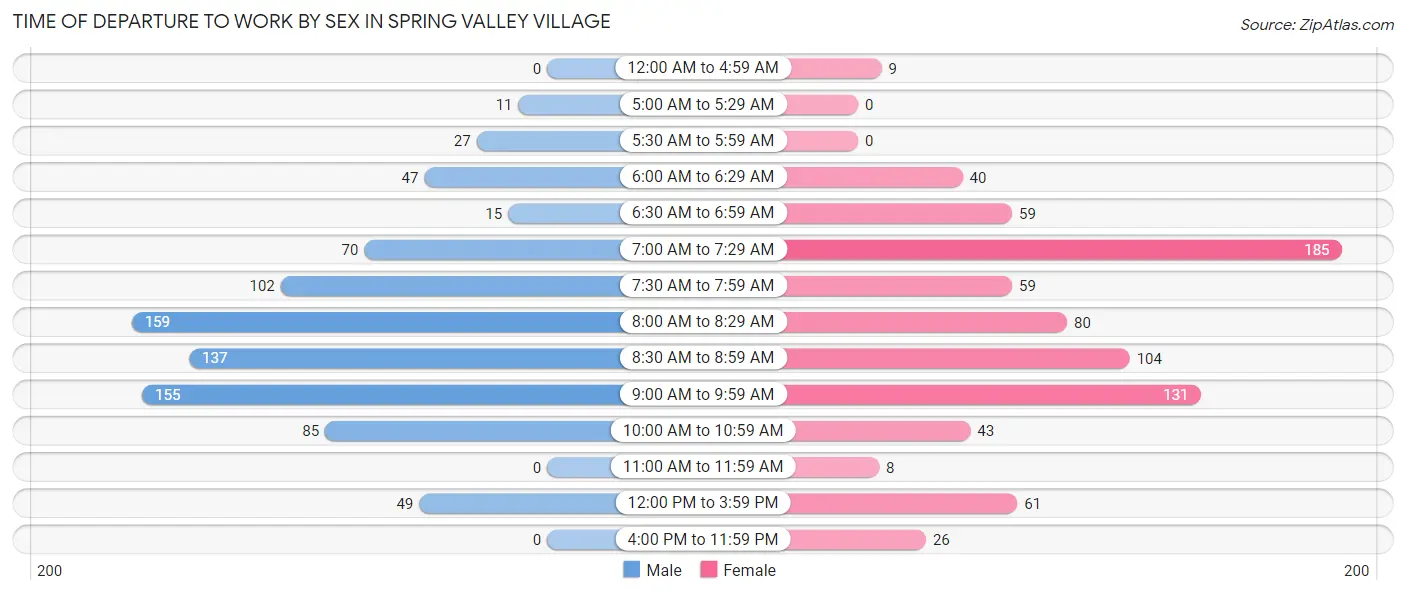
| Time of Departure | Male | Female |
| 12:00 AM to 4:59 AM | 0 (0.0%) | 9 (1.1%) |
| 5:00 AM to 5:29 AM | 11 (1.3%) | 0 (0.0%) |
| 5:30 AM to 5:59 AM | 27 (3.2%) | 0 (0.0%) |
| 6:00 AM to 6:29 AM | 47 (5.5%) | 40 (5.0%) |
| 6:30 AM to 6:59 AM | 15 (1.8%) | 59 (7.3%) |
| 7:00 AM to 7:29 AM | 70 (8.2%) | 185 (23.0%) |
| 7:30 AM to 7:59 AM | 102 (11.9%) | 59 (7.3%) |
| 8:00 AM to 8:29 AM | 159 (18.5%) | 80 (9.9%) |
| 8:30 AM to 8:59 AM | 137 (16.0%) | 104 (12.9%) |
| 9:00 AM to 9:59 AM | 155 (18.1%) | 131 (16.3%) |
| 10:00 AM to 10:59 AM | 85 (9.9%) | 43 (5.3%) |
| 11:00 AM to 11:59 AM | 0 (0.0%) | 8 (1.0%) |
| 12:00 PM to 3:59 PM | 49 (5.7%) | 61 (7.6%) |
| 4:00 PM to 11:59 PM | 0 (0.0%) | 26 (3.2%) |
| Total | 857 (100.0%) | 805 (100.0%) |
Housing Occupancy in Spring Valley Village
Occupancy by Ownership in Spring Valley Village
Of the total 1,261 dwellings in Spring Valley Village, owner-occupied units account for 1,212 (96.1%), while renter-occupied units make up 49 (3.9%).
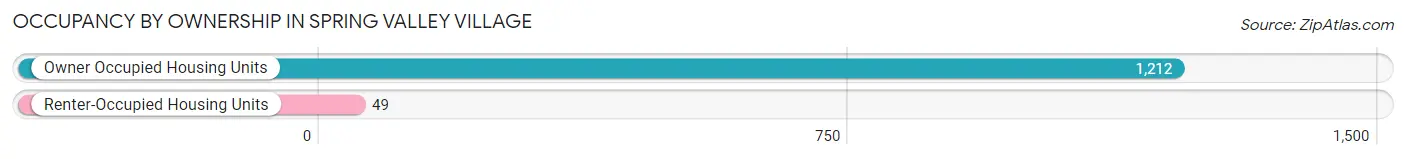
| Occupancy | # Housing Units | % Housing Units |
| Owner Occupied Housing Units | 1,212 | 96.1% |
| Renter-Occupied Housing Units | 49 | 3.9% |
| Total Occupied Housing Units | 1,261 | 100.0% |
Occupancy by Household Size in Spring Valley Village
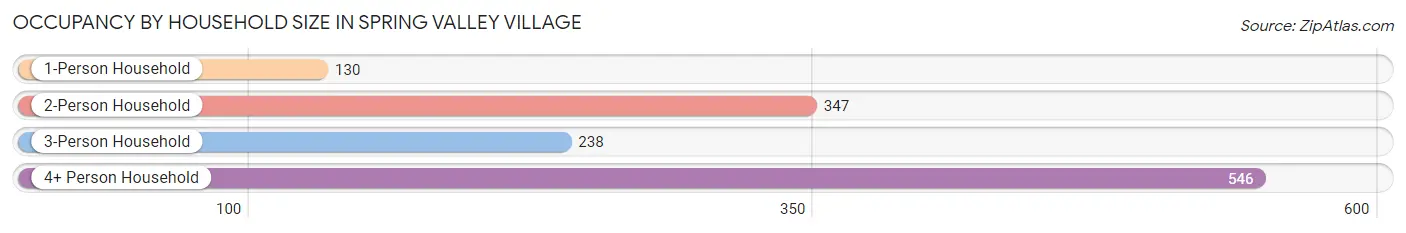
| Household Size | # Housing Units | % Housing Units |
| 1-Person Household | 130 | 10.3% |
| 2-Person Household | 347 | 27.5% |
| 3-Person Household | 238 | 18.9% |
| 4+ Person Household | 546 | 43.3% |
| Total Housing Units | 1,261 | 100.0% |
Occupancy by Ownership by Household Size in Spring Valley Village
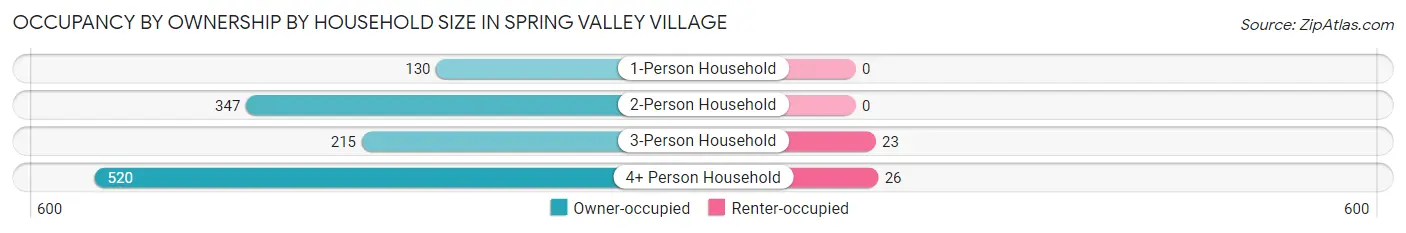
| Household Size | Owner-occupied | Renter-occupied |
| 1-Person Household | 130 (100.0%) | 0 (0.0%) |
| 2-Person Household | 347 (100.0%) | 0 (0.0%) |
| 3-Person Household | 215 (90.3%) | 23 (9.7%) |
| 4+ Person Household | 520 (95.2%) | 26 (4.8%) |
| Total Housing Units | 1,212 (96.1%) | 49 (3.9%) |
Occupancy by Educational Attainment in Spring Valley Village
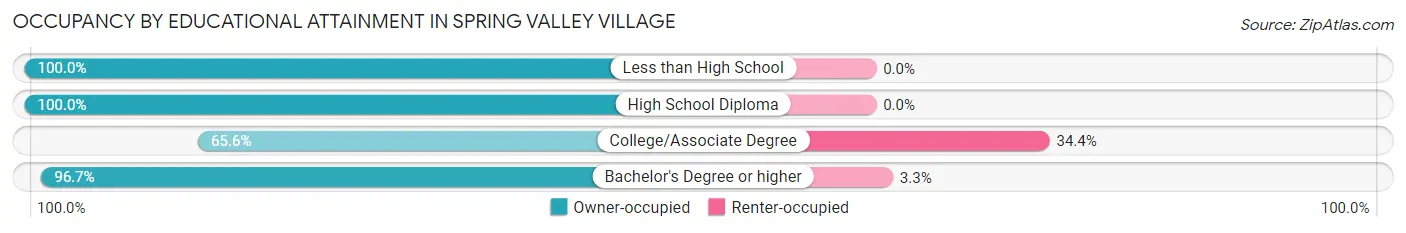
| Household Size | Owner-occupied | Renter-occupied |
| Less than High School | 24 (100.0%) | 0 (0.0%) |
| High School Diploma | 60 (100.0%) | 0 (0.0%) |
| College/Associate Degree | 21 (65.6%) | 11 (34.4%) |
| Bachelor's Degree or higher | 1,107 (96.7%) | 38 (3.3%) |
Occupancy by Age of Householder in Spring Valley Village
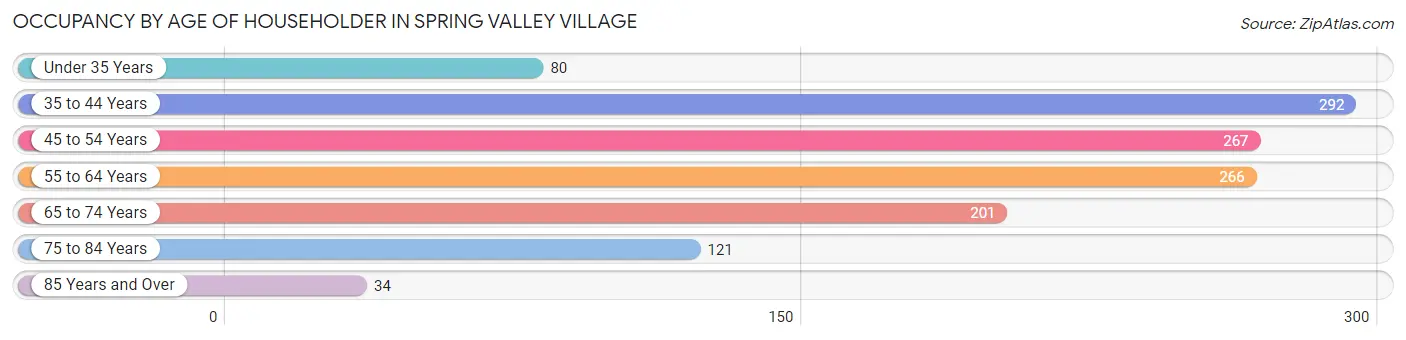
| Age Bracket | # Households | % Households |
| Under 35 Years | 80 | 6.3% |
| 35 to 44 Years | 292 | 23.2% |
| 45 to 54 Years | 267 | 21.2% |
| 55 to 64 Years | 266 | 21.1% |
| 65 to 74 Years | 201 | 15.9% |
| 75 to 84 Years | 121 | 9.6% |
| 85 Years and Over | 34 | 2.7% |
| Total | 1,261 | 100.0% |
Housing Finances in Spring Valley Village
Median Income by Occupancy in Spring Valley Village
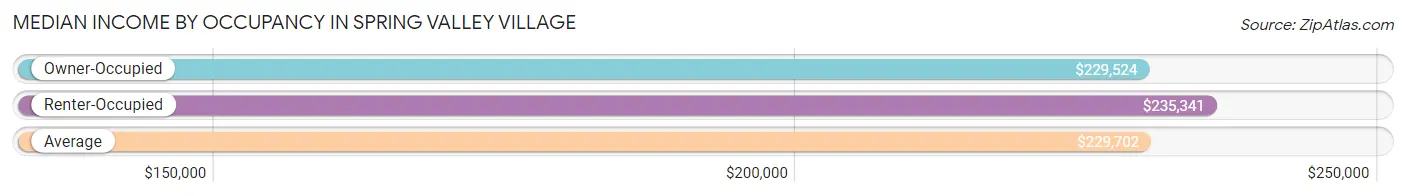
| Occupancy Type | # Households | Median Income |
| Owner-Occupied | 1,212 (96.1%) | $229,524 |
| Renter-Occupied | 49 (3.9%) | $235,341 |
| Average | 1,261 (100.0%) | $229,702 |
Occupancy by Householder Income Bracket in Spring Valley Village
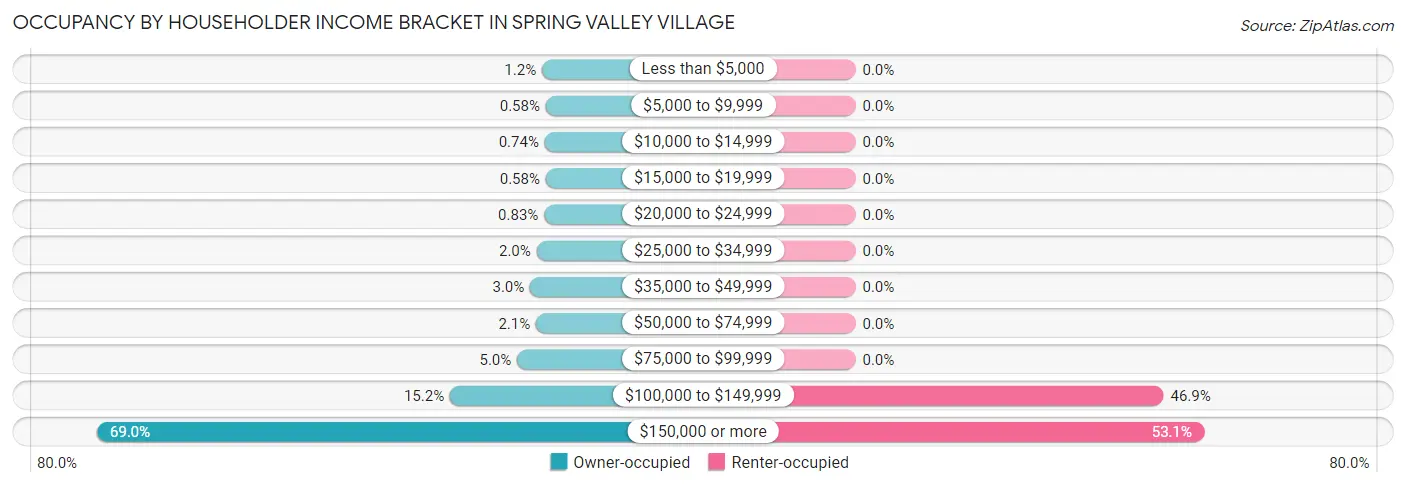
| Income Bracket | Owner-occupied | Renter-occupied |
| Less than $5,000 | 14 (1.2%) | 0 (0.0%) |
| $5,000 to $9,999 | 7 (0.6%) | 0 (0.0%) |
| $10,000 to $14,999 | 9 (0.7%) | 0 (0.0%) |
| $15,000 to $19,999 | 7 (0.6%) | 0 (0.0%) |
| $20,000 to $24,999 | 10 (0.8%) | 0 (0.0%) |
| $25,000 to $34,999 | 24 (2.0%) | 0 (0.0%) |
| $35,000 to $49,999 | 36 (3.0%) | 0 (0.0%) |
| $50,000 to $74,999 | 25 (2.1%) | 0 (0.0%) |
| $75,000 to $99,999 | 60 (5.0%) | 0 (0.0%) |
| $100,000 to $149,999 | 184 (15.2%) | 23 (46.9%) |
| $150,000 or more | 836 (69.0%) | 26 (53.1%) |
| Total | 1,212 (100.0%) | 49 (100.0%) |
Monthly Housing Cost Tiers in Spring Valley Village
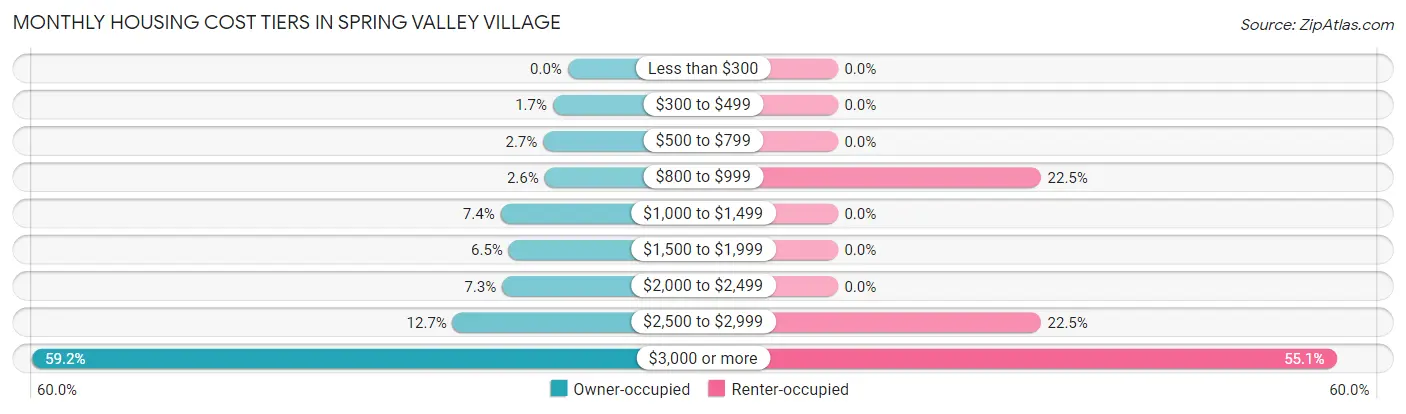
| Monthly Cost | Owner-occupied | Renter-occupied |
| Less than $300 | 0 (0.0%) | 0 (0.0%) |
| $300 to $499 | 20 (1.7%) | 0 (0.0%) |
| $500 to $799 | 33 (2.7%) | 0 (0.0%) |
| $800 to $999 | 31 (2.6%) | 11 (22.5%) |
| $1,000 to $1,499 | 90 (7.4%) | 0 (0.0%) |
| $1,500 to $1,999 | 79 (6.5%) | 0 (0.0%) |
| $2,000 to $2,499 | 88 (7.3%) | 0 (0.0%) |
| $2,500 to $2,999 | 154 (12.7%) | 11 (22.5%) |
| $3,000 or more | 717 (59.2%) | 27 (55.1%) |
| Total | 1,212 (100.0%) | 49 (100.0%) |
Physical Housing Characteristics in Spring Valley Village
Housing Structures in Spring Valley Village
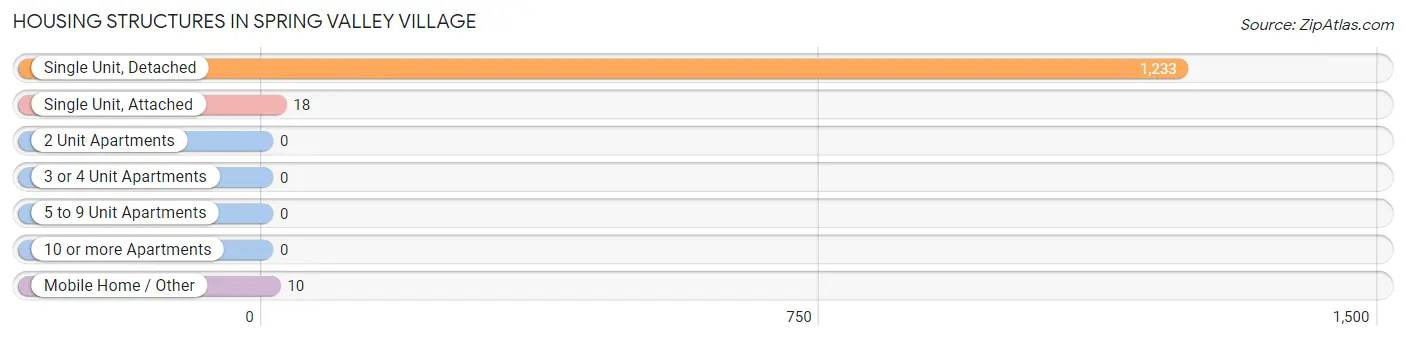
| Structure Type | # Housing Units | % Housing Units |
| Single Unit, Detached | 1,233 | 97.8% |
| Single Unit, Attached | 18 | 1.4% |
| 2 Unit Apartments | 0 | 0.0% |
| 3 or 4 Unit Apartments | 0 | 0.0% |
| 5 to 9 Unit Apartments | 0 | 0.0% |
| 10 or more Apartments | 0 | 0.0% |
| Mobile Home / Other | 10 | 0.8% |
| Total | 1,261 | 100.0% |
Housing Structures by Occupancy in Spring Valley Village
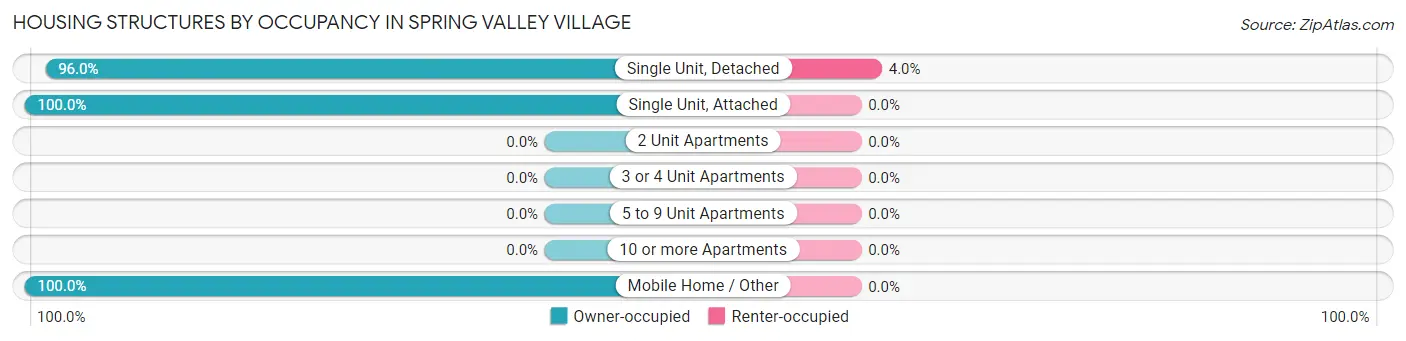
| Structure Type | Owner-occupied | Renter-occupied |
| Single Unit, Detached | 1,184 (96.0%) | 49 (4.0%) |
| Single Unit, Attached | 18 (100.0%) | 0 (0.0%) |
| 2 Unit Apartments | 0 (0.0%) | 0 (0.0%) |
| 3 or 4 Unit Apartments | 0 (0.0%) | 0 (0.0%) |
| 5 to 9 Unit Apartments | 0 (0.0%) | 0 (0.0%) |
| 10 or more Apartments | 0 (0.0%) | 0 (0.0%) |
| Mobile Home / Other | 10 (100.0%) | 0 (0.0%) |
| Total | 1,212 (96.1%) | 49 (3.9%) |
Housing Structures by Number of Rooms in Spring Valley Village
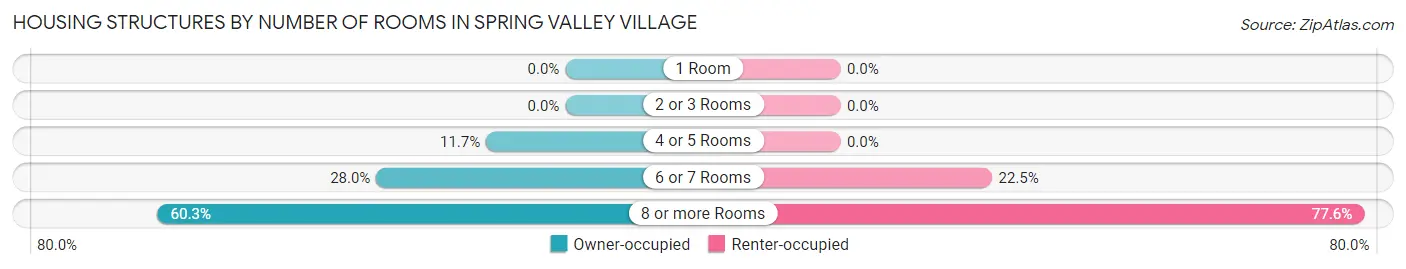
| Number of Rooms | Owner-occupied | Renter-occupied |
| 1 Room | 0 (0.0%) | 0 (0.0%) |
| 2 or 3 Rooms | 0 (0.0%) | 0 (0.0%) |
| 4 or 5 Rooms | 142 (11.7%) | 0 (0.0%) |
| 6 or 7 Rooms | 339 (28.0%) | 11 (22.5%) |
| 8 or more Rooms | 731 (60.3%) | 38 (77.5%) |
| Total | 1,212 (100.0%) | 49 (100.0%) |
Housing Structure by Heating Type in Spring Valley Village
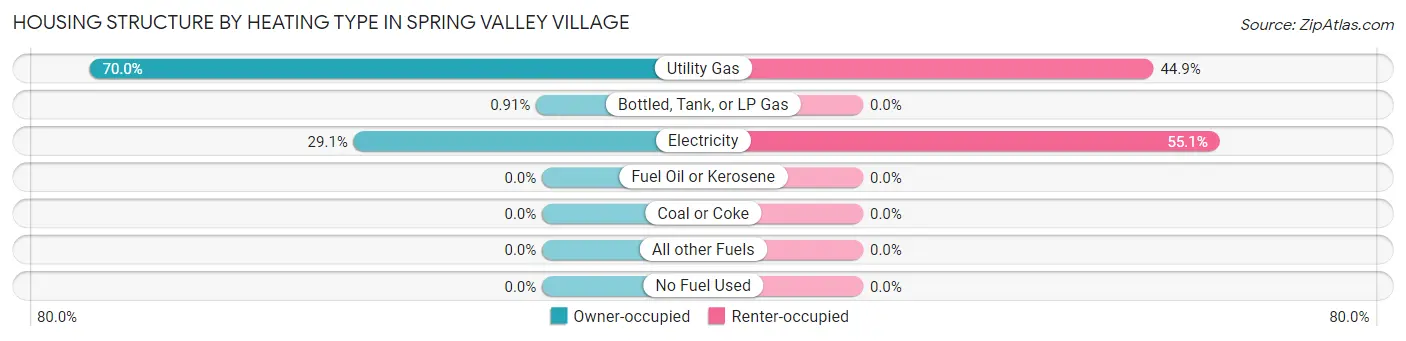
| Heating Type | Owner-occupied | Renter-occupied |
| Utility Gas | 848 (70.0%) | 22 (44.9%) |
| Bottled, Tank, or LP Gas | 11 (0.9%) | 0 (0.0%) |
| Electricity | 353 (29.1%) | 27 (55.1%) |
| Fuel Oil or Kerosene | 0 (0.0%) | 0 (0.0%) |
| Coal or Coke | 0 (0.0%) | 0 (0.0%) |
| All other Fuels | 0 (0.0%) | 0 (0.0%) |
| No Fuel Used | 0 (0.0%) | 0 (0.0%) |
| Total | 1,212 (100.0%) | 49 (100.0%) |
Household Vehicle Usage in Spring Valley Village
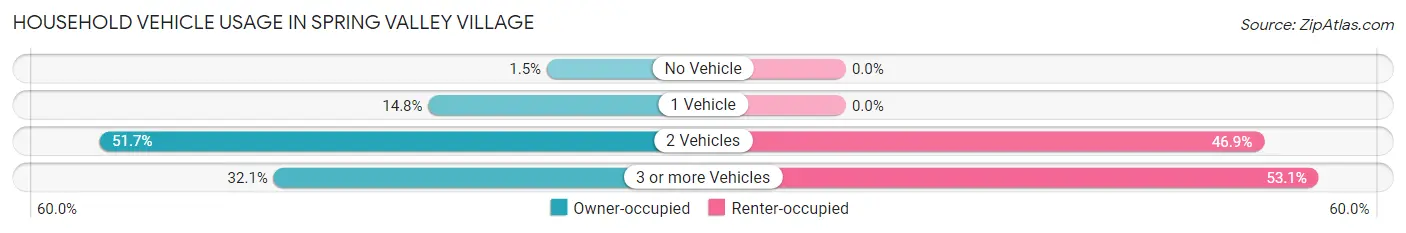
| Vehicles per Household | Owner-occupied | Renter-occupied |
| No Vehicle | 18 (1.5%) | 0 (0.0%) |
| 1 Vehicle | 179 (14.8%) | 0 (0.0%) |
| 2 Vehicles | 626 (51.6%) | 23 (46.9%) |
| 3 or more Vehicles | 389 (32.1%) | 26 (53.1%) |
| Total | 1,212 (100.0%) | 49 (100.0%) |
Real Estate & Mortgages in Spring Valley Village
Real Estate and Mortgage Overview in Spring Valley Village
| Characteristic | Without Mortgage | With Mortgage |
| Housing Units | 437 | 775 |
| Median Property Value | $994,300 | $1,097,900 |
| Median Household Income | $143,693 | $629 |
| Monthly Housing Costs | $1,501 | $687 |
| Real Estate Taxes | $10,001 | $0 |
Property Value by Mortgage Status in Spring Valley Village
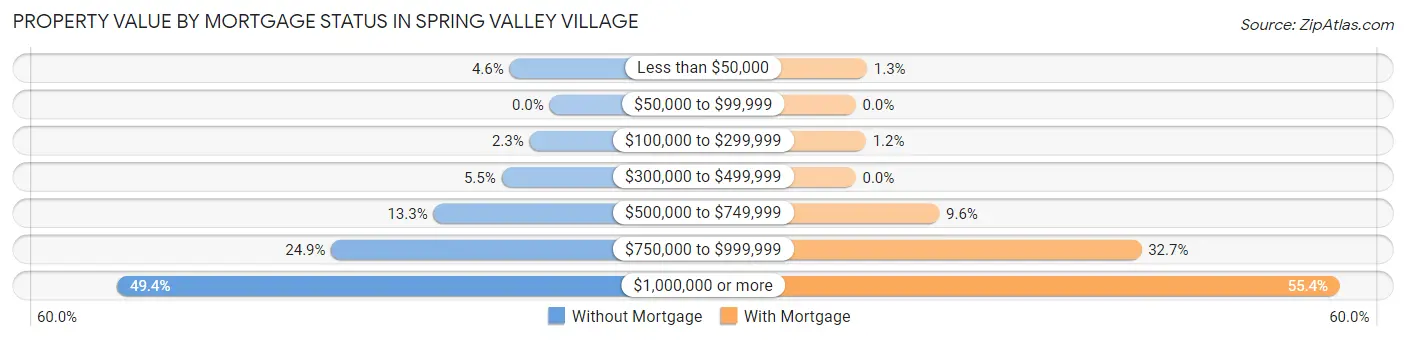
| Property Value | Without Mortgage | With Mortgage |
| Less than $50,000 | 20 (4.6%) | 10 (1.3%) |
| $50,000 to $99,999 | 0 (0.0%) | 0 (0.0%) |
| $100,000 to $299,999 | 10 (2.3%) | 9 (1.2%) |
| $300,000 to $499,999 | 24 (5.5%) | 0 (0.0%) |
| $500,000 to $749,999 | 58 (13.3%) | 74 (9.6%) |
| $750,000 to $999,999 | 109 (24.9%) | 253 (32.7%) |
| $1,000,000 or more | 216 (49.4%) | 429 (55.3%) |
| Total | 437 (100.0%) | 775 (100.0%) |
Household Income by Mortgage Status in Spring Valley Village
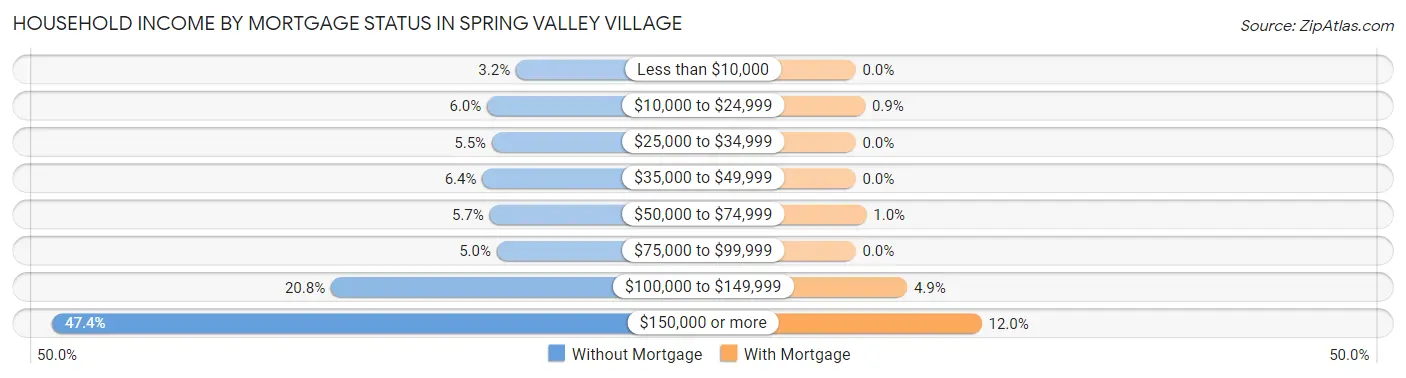
| Household Income | Without Mortgage | With Mortgage |
| Less than $10,000 | 14 (3.2%) | 0 (0.0%) |
| $10,000 to $24,999 | 26 (5.9%) | 7 (0.9%) |
| $25,000 to $34,999 | 24 (5.5%) | 0 (0.0%) |
| $35,000 to $49,999 | 28 (6.4%) | 0 (0.0%) |
| $50,000 to $74,999 | 25 (5.7%) | 8 (1.0%) |
| $75,000 to $99,999 | 22 (5.0%) | 0 (0.0%) |
| $100,000 to $149,999 | 91 (20.8%) | 38 (4.9%) |
| $150,000 or more | 207 (47.4%) | 93 (12.0%) |
| Total | 437 (100.0%) | 775 (100.0%) |
Property Value to Household Income Ratio in Spring Valley Village
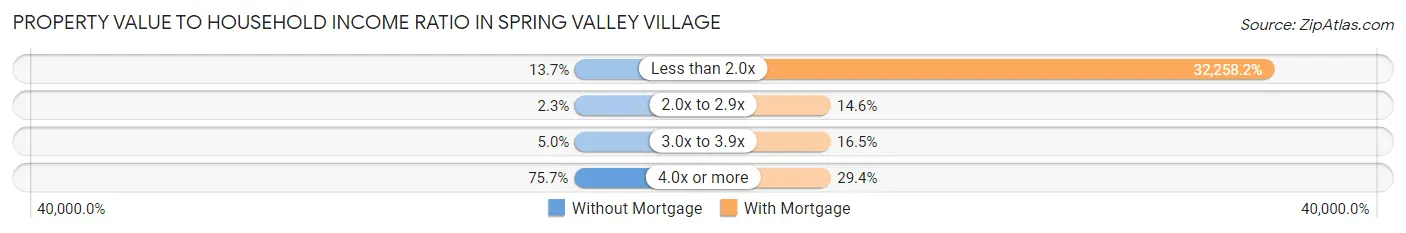
| Value-to-Income Ratio | Without Mortgage | With Mortgage |
| Less than 2.0x | 60 (13.7%) | 250,001 (32,258.2%) |
| 2.0x to 2.9x | 10 (2.3%) | 113 (14.6%) |
| 3.0x to 3.9x | 22 (5.0%) | 128 (16.5%) |
| 4.0x or more | 331 (75.7%) | 228 (29.4%) |
| Total | 437 (100.0%) | 775 (100.0%) |
Real Estate Taxes by Mortgage Status in Spring Valley Village
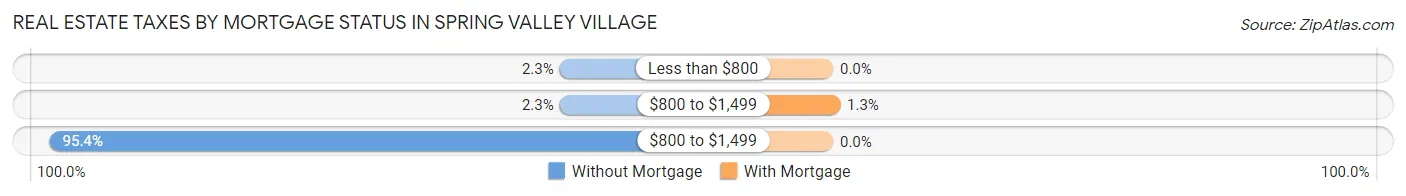
| Property Taxes | Without Mortgage | With Mortgage |
| Less than $800 | 10 (2.3%) | 0 (0.0%) |
| $800 to $1,499 | 10 (2.3%) | 10 (1.3%) |
| $800 to $1,499 | 417 (95.4%) | 0 (0.0%) |
| Total | 437 (100.0%) | 775 (100.0%) |
Health & Disability in Spring Valley Village
Health Insurance Coverage by Age in Spring Valley Village
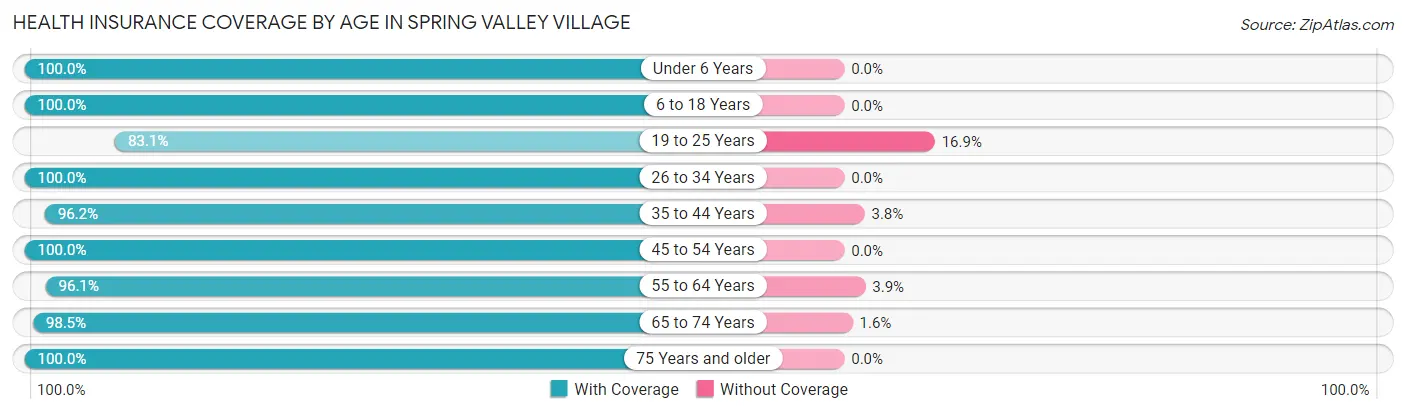
| Age Bracket | With Coverage | Without Coverage |
| Under 6 Years | 443 (100.0%) | 0 (0.0%) |
| 6 to 18 Years | 1,064 (100.0%) | 0 (0.0%) |
| 19 to 25 Years | 143 (83.1%) | 29 (16.9%) |
| 26 to 34 Years | 244 (100.0%) | 0 (0.0%) |
| 35 to 44 Years | 613 (96.2%) | 24 (3.8%) |
| 45 to 54 Years | 528 (100.0%) | 0 (0.0%) |
| 55 to 64 Years | 515 (96.1%) | 21 (3.9%) |
| 65 to 74 Years | 380 (98.5%) | 6 (1.5%) |
| 75 Years and older | 212 (100.0%) | 0 (0.0%) |
| Total | 4,142 (98.1%) | 80 (1.9%) |
Health Insurance Coverage by Citizenship Status in Spring Valley Village
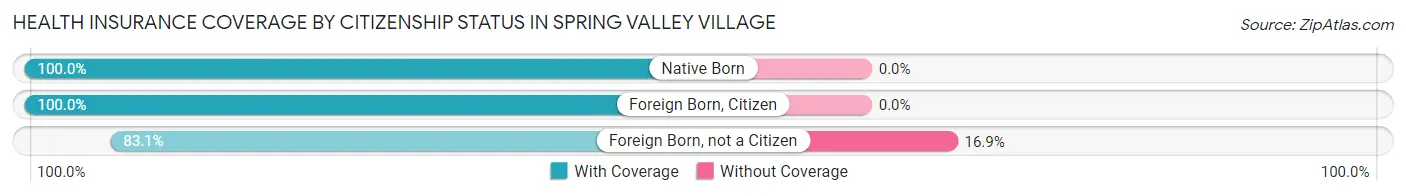
| Citizenship Status | With Coverage | Without Coverage |
| Native Born | 443 (100.0%) | 0 (0.0%) |
| Foreign Born, Citizen | 1,064 (100.0%) | 0 (0.0%) |
| Foreign Born, not a Citizen | 143 (83.1%) | 29 (16.9%) |
Health Insurance Coverage by Household Income in Spring Valley Village
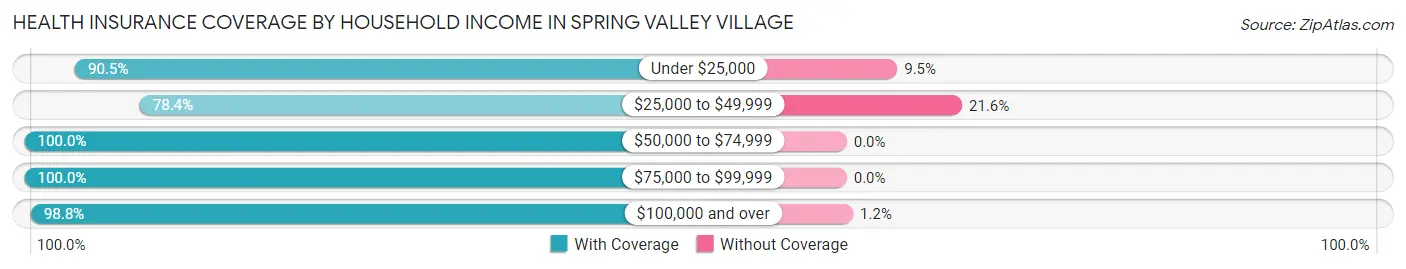
| Household Income | With Coverage | Without Coverage |
| Under $25,000 | 67 (90.5%) | 7 (9.5%) |
| $25,000 to $49,999 | 98 (78.4%) | 27 (21.6%) |
| $50,000 to $74,999 | 33 (100.0%) | 0 (0.0%) |
| $75,000 to $99,999 | 122 (100.0%) | 0 (0.0%) |
| $100,000 and over | 3,822 (98.8%) | 46 (1.2%) |
Public vs Private Health Insurance Coverage by Age in Spring Valley Village
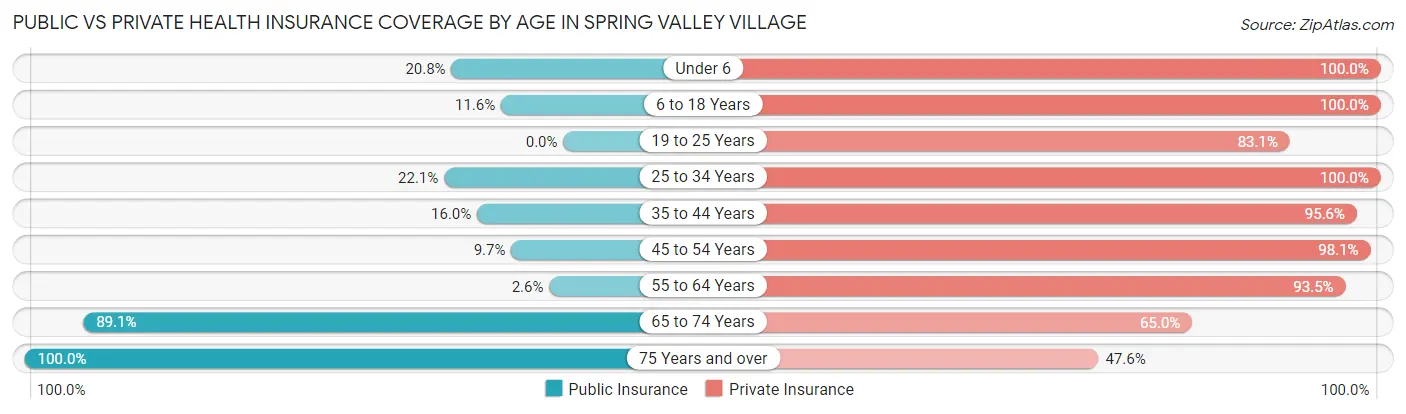
| Age Bracket | Public Insurance | Private Insurance |
| Under 6 | 92 (20.8%) | 443 (100.0%) |
| 6 to 18 Years | 123 (11.6%) | 1,064 (100.0%) |
| 19 to 25 Years | 0 (0.0%) | 143 (83.1%) |
| 25 to 34 Years | 54 (22.1%) | 244 (100.0%) |
| 35 to 44 Years | 102 (16.0%) | 609 (95.6%) |
| 45 to 54 Years | 51 (9.7%) | 518 (98.1%) |
| 55 to 64 Years | 14 (2.6%) | 501 (93.5%) |
| 65 to 74 Years | 344 (89.1%) | 251 (65.0%) |
| 75 Years and over | 212 (100.0%) | 101 (47.6%) |
| Total | 992 (23.5%) | 3,874 (91.8%) |
Disability Status by Sex by Age in Spring Valley Village
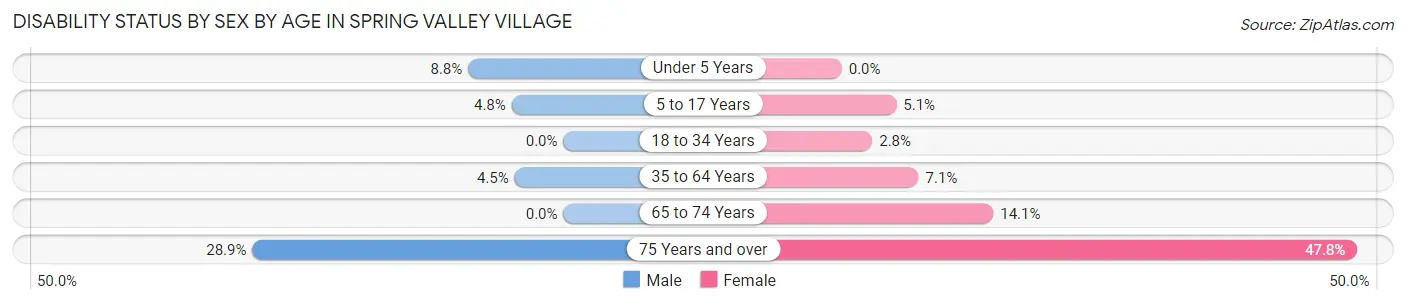
| Age Bracket | Male | Female |
| Under 5 Years | 13 (8.8%) | 0 (0.0%) |
| 5 to 17 Years | 25 (4.8%) | 30 (5.1%) |
| 18 to 34 Years | 0 (0.0%) | 9 (2.8%) |
| 35 to 64 Years | 39 (4.5%) | 60 (7.1%) |
| 65 to 74 Years | 0 (0.0%) | 27 (14.1%) |
| 75 Years and over | 28 (28.9%) | 55 (47.8%) |
Disability Class by Sex by Age in Spring Valley Village
Disability Class: Hearing Difficulty
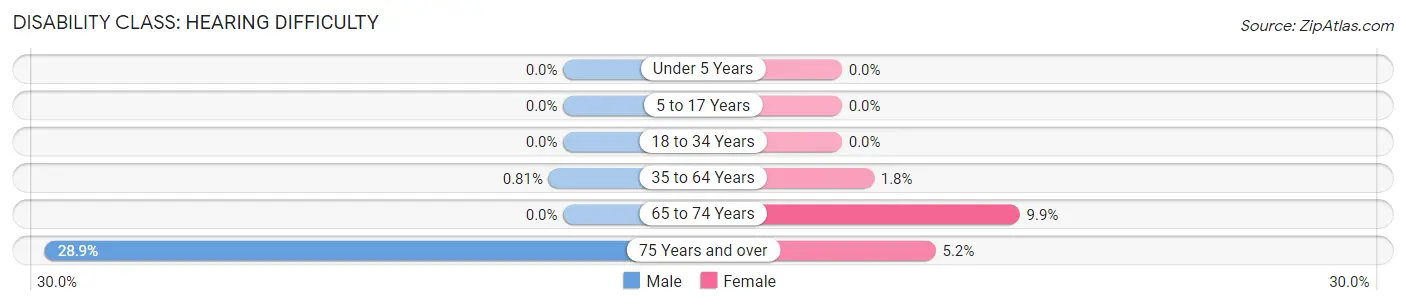
| Age Bracket | Male | Female |
| Under 5 Years | 0 (0.0%) | 0 (0.0%) |
| 5 to 17 Years | 0 (0.0%) | 0 (0.0%) |
| 18 to 34 Years | 0 (0.0%) | 0 (0.0%) |
| 35 to 64 Years | 7 (0.8%) | 15 (1.8%) |
| 65 to 74 Years | 0 (0.0%) | 19 (9.9%) |
| 75 Years and over | 28 (28.9%) | 6 (5.2%) |
Disability Class: Vision Difficulty
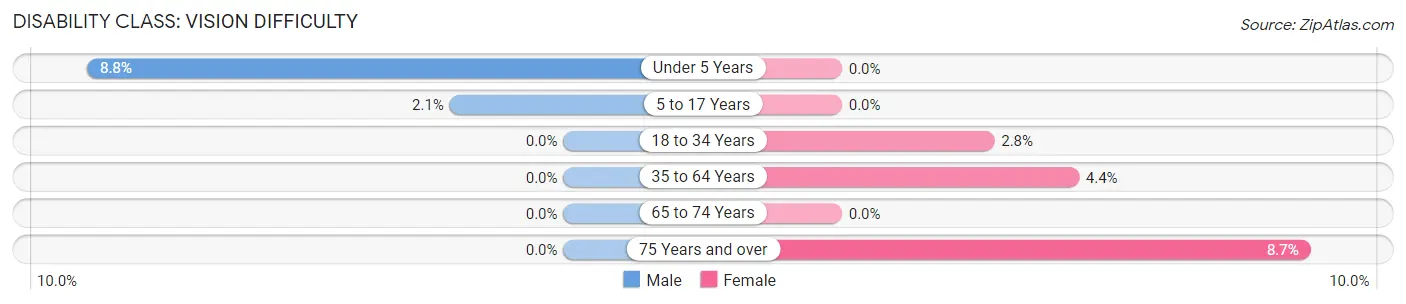
| Age Bracket | Male | Female |
| Under 5 Years | 13 (8.8%) | 0 (0.0%) |
| 5 to 17 Years | 11 (2.1%) | 0 (0.0%) |
| 18 to 34 Years | 0 (0.0%) | 9 (2.8%) |
| 35 to 64 Years | 0 (0.0%) | 37 (4.4%) |
| 65 to 74 Years | 0 (0.0%) | 0 (0.0%) |
| 75 Years and over | 0 (0.0%) | 10 (8.7%) |
Disability Class: Cognitive Difficulty
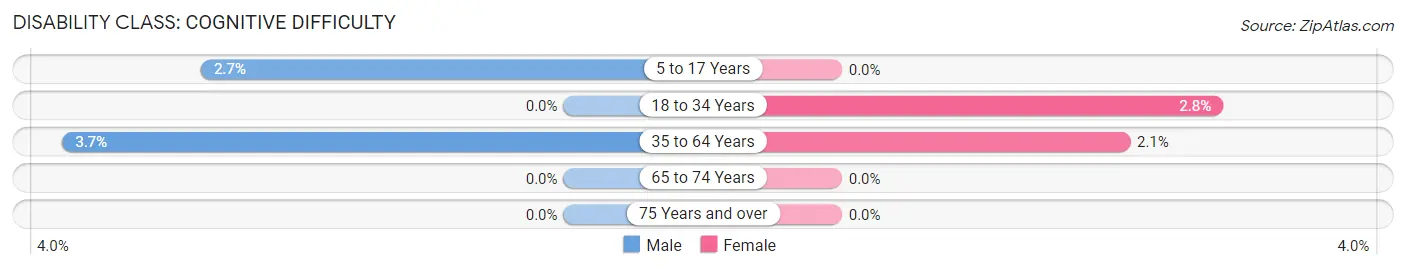
| Age Bracket | Male | Female |
| 5 to 17 Years | 14 (2.7%) | 0 (0.0%) |
| 18 to 34 Years | 0 (0.0%) | 9 (2.8%) |
| 35 to 64 Years | 32 (3.7%) | 18 (2.1%) |
| 65 to 74 Years | 0 (0.0%) | 0 (0.0%) |
| 75 Years and over | 0 (0.0%) | 0 (0.0%) |
Disability Class: Ambulatory Difficulty
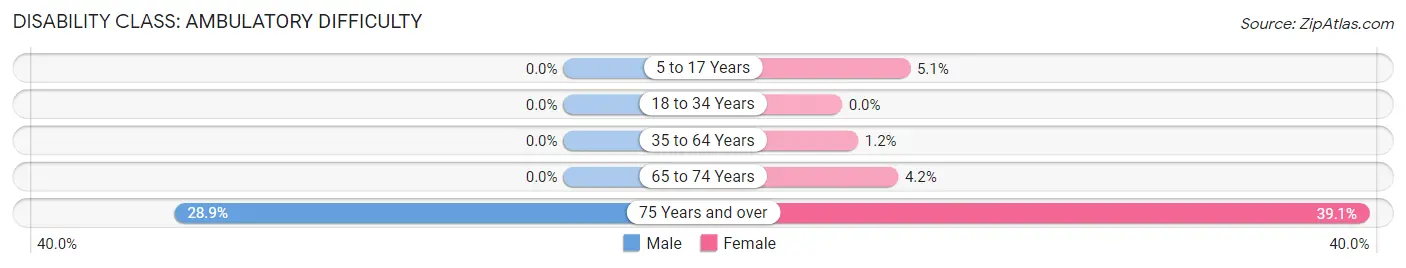
| Age Bracket | Male | Female |
| 5 to 17 Years | 0 (0.0%) | 30 (5.1%) |
| 18 to 34 Years | 0 (0.0%) | 0 (0.0%) |
| 35 to 64 Years | 0 (0.0%) | 10 (1.2%) |
| 65 to 74 Years | 0 (0.0%) | 8 (4.2%) |
| 75 Years and over | 28 (28.9%) | 45 (39.1%) |
Disability Class: Self-Care Difficulty
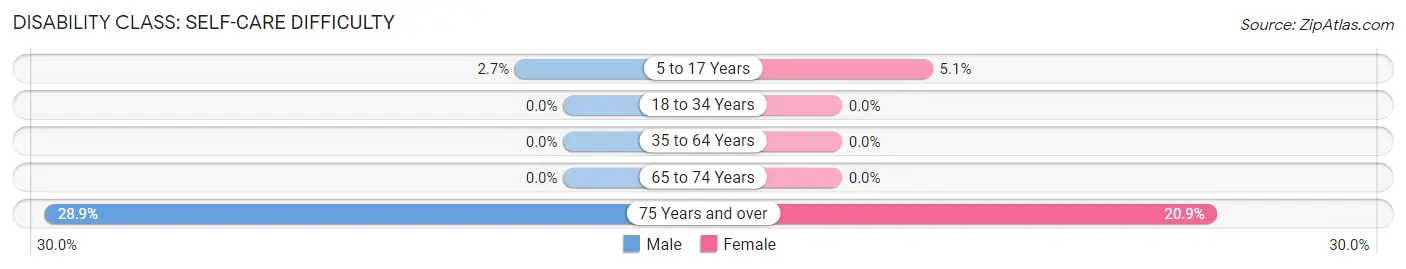
| Age Bracket | Male | Female |
| 5 to 17 Years | 14 (2.7%) | 30 (5.1%) |
| 18 to 34 Years | 0 (0.0%) | 0 (0.0%) |
| 35 to 64 Years | 0 (0.0%) | 0 (0.0%) |
| 65 to 74 Years | 0 (0.0%) | 0 (0.0%) |
| 75 Years and over | 28 (28.9%) | 24 (20.9%) |
Technology Access in Spring Valley Village
Computing Device Access in Spring Valley Village
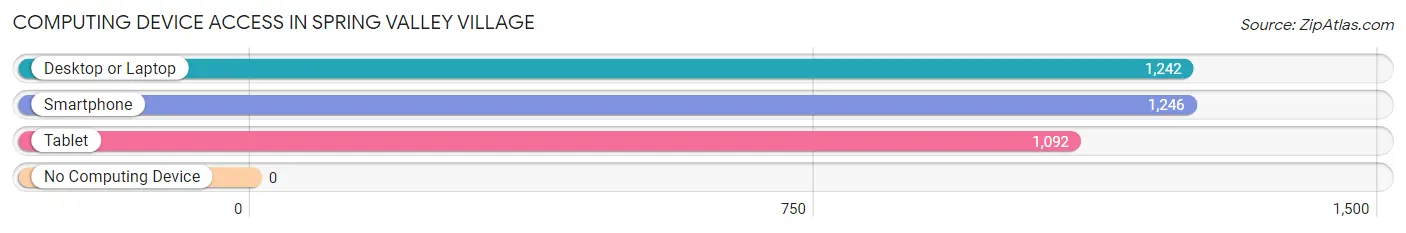
| Device Type | # Households | % Households |
| Desktop or Laptop | 1,242 | 98.5% |
| Smartphone | 1,246 | 98.8% |
| Tablet | 1,092 | 86.6% |
| No Computing Device | 0 | 0.0% |
| Total | 1,261 | 100.0% |
Internet Access in Spring Valley Village
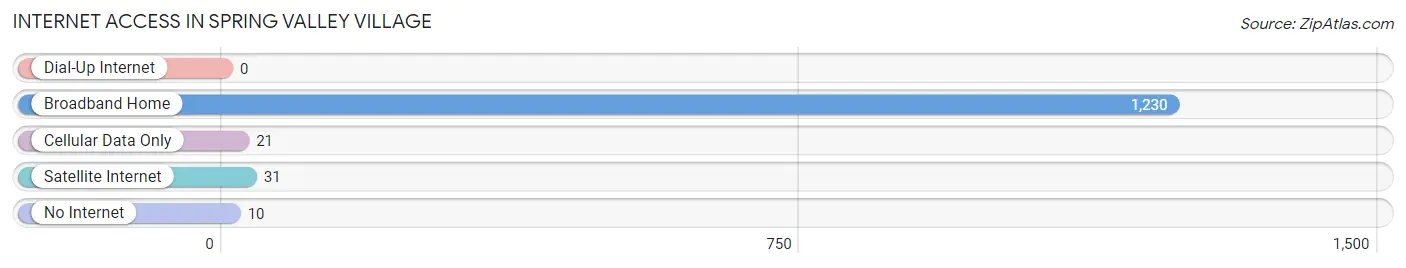
| Internet Type | # Households | % Households |
| Dial-Up Internet | 0 | 0.0% |
| Broadband Home | 1,230 | 97.5% |
| Cellular Data Only | 21 | 1.7% |
| Satellite Internet | 31 | 2.5% |
| No Internet | 10 | 0.8% |
| Total | 1,261 | 100.0% |
Spring Valley Village Summary
Introduction
Spring Valley Village is a small city located in Harris County, Texas. It is a part of the Houston-The Woodlands-Sugar Land metropolitan area. The city has a population of approximately 7,000 people and is located just north of Houston. The city is known for its small-town charm and its close proximity to the city of Houston.
Geography
Spring Valley Village is located in the southeastern part of Harris County, Texas. It is bordered by the cities of Houston, Bellaire, and West University Place. The city is situated on a flat plain, with an elevation of approximately 40 feet above sea level. The city is located in the Houston-The Woodlands-Sugar Land metropolitan area, which is the fifth-largest metropolitan area in the United States.
The city is located in a humid subtropical climate zone, with hot summers and mild winters. The average annual temperature is around 70 degrees Fahrenheit, with an average high of around 90 degrees Fahrenheit in the summer and an average low of around 50 degrees Fahrenheit in the winter. The city receives an average of 48 inches of precipitation per year, with most of the precipitation occurring in the summer months.
Demographics
As of the 2010 census, the population of Spring Valley Village was 6,973. The racial makeup of the city was 79.3% White, 8.2% African American, 0.3% Native American, 5.2% Asian, 0.1% Pacific Islander, 4.2% from other races, and 2.9% from two or more races. Hispanic or Latino of any race were 16.3% of the population.
The median household income in Spring Valley Village was $68,945 in 2019, with a poverty rate of 8.2%. The median age of the population was 40.7 years, with a gender ratio of 49.3% male and 50.7% female.
Economy
Spring Valley Village is home to a variety of businesses, including retail stores, restaurants, and professional services. The city is also home to several corporate headquarters, including the headquarters of the Houston-based oil and gas company, Apache Corporation.
The city is served by the Houston Independent School District, which provides public education to the city's residents. The city is also home to several private schools, including the Houston Christian High School and the Houston Christian Academy.
Conclusion
Spring Valley Village is a small city located in Harris County, Texas. It is a part of the Houston-The Woodlands-Sugar Land metropolitan area and has a population of approximately 7,000 people. The city is known for its small-town charm and its close proximity to the city of Houston. The city has a humid subtropical climate, with hot summers and mild winters. The city has a diverse population, with a median household income of $68,945 and a poverty rate of 8.2%. The city is home to a variety of businesses, including retail stores, restaurants, and professional services. The city is served by the Houston Independent School District and is home to several private schools.
Common Questions
What is Per Capita Income in Spring Valley Village?
Per Capita income in Spring Valley Village is $95,097.
What is the Median Family Income in Spring Valley Village?
Median Family Income in Spring Valley Village is $237,667.
What is the Median Household income in Spring Valley Village?
Median Household Income in Spring Valley Village is $229,702.
What is Income or Wage Gap in Spring Valley Village?
Income or Wage Gap in Spring Valley Village is 46.1%.
Women in Spring Valley Village earn 53.9 cents for every dollar earned by a man.
What is Inequality or Gini Index in Spring Valley Village?
Inequality or Gini Index in Spring Valley Village is 0.45.
What is the Total Population of Spring Valley Village?
Total Population of Spring Valley Village is 4,222.
What is the Total Male Population of Spring Valley Village?
Total Male Population of Spring Valley Village is 2,024.
What is the Total Female Population of Spring Valley Village?
Total Female Population of Spring Valley Village is 2,198.
What is the Ratio of Males per 100 Females in Spring Valley Village?
There are 92.08 Males per 100 Females in Spring Valley Village.
What is the Ratio of Females per 100 Males in Spring Valley Village?
There are 108.60 Females per 100 Males in Spring Valley Village.
What is the Median Population Age in Spring Valley Village?
Median Population Age in Spring Valley Village is 37.2 Years.
What is the Average Family Size in Spring Valley Village
Average Family Size in Spring Valley Village is 3.6 People.
What is the Average Household Size in Spring Valley Village
Average Household Size in Spring Valley Village is 3.4 People.
How Large is the Labor Force in Spring Valley Village?
There are 2,021 People in the Labor Forcein in Spring Valley Village.
What is the Percentage of People in the Labor Force in Spring Valley Village?
66.6% of People are in the Labor Force in Spring Valley Village.
What is the Unemployment Rate in Spring Valley Village?
Unemployment Rate in Spring Valley Village is 1.4%.