Birmingham, AL Map & Demographics
Birmingham Map
Birmingham Overview
$29,289
PER CAPITA INCOME
$55,541
AVG FAMILY INCOME
$42,464
AVG HOUSEHOLD INCOME
16.6%
WAGE / INCOME GAP [ % ]
83.4¢/ $1
WAGE / INCOME GAP [ $ ]
$11,704
FAMILY INCOME DEFICIT
0.52
INEQUALITY / GINI INDEX
200,431
TOTAL POPULATION
94,413
MALE POPULATION
106,018
FEMALE POPULATION
89.05
MALES / 100 FEMALES
112.29
FEMALES / 100 MALES
35.9
MEDIAN AGE
3.2
AVG FAMILY SIZE
2.2
AVG HOUSEHOLD SIZE
95,869
LABOR FORCE [ PEOPLE ]
57.9%
PERCENT IN LABOR FORCE
7.5%
UNEMPLOYMENT RATE
Birmingham Zip Codes
Birmingham Area Codes
Income in Birmingham
Income Overview in Birmingham
Per Capita Income in Birmingham is $29,289, while median incomes of families and households are $55,541 and $42,464 respectively.
| Characteristic | Number | Measure |
| Per Capita Income | 200,431 | $29,289 |
| Median Family Income | 40,704 | $55,541 |
| Mean Family Income | 40,704 | $82,087 |
| Median Household Income | 84,999 | $42,464 |
| Mean Household Income | 84,999 | $65,123 |
| Income Deficit | 40,704 | $11,704 |
| Wage / Income Gap (%) | 200,431 | 16.57% |
| Wage / Income Gap ($) | 200,431 | 83.43¢ per $1 |
| Gini / Inequality Index | 200,431 | 0.52 |
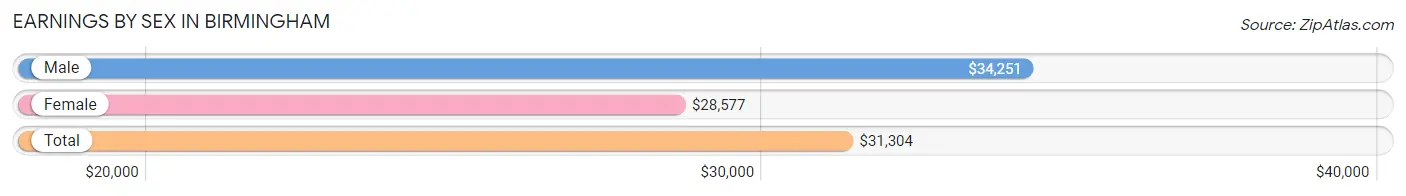
Earnings by Sex in Birmingham
Average Earnings in Birmingham are $31,304, $34,251 for men and $28,577 for women, a difference of 16.6%.
| Sex | Number | Average Earnings |
| Male | 48,326 (48.0%) | $34,251 |
| Female | 52,264 (52.0%) | $28,577 |
| Total | 100,590 (100.0%) | $31,304 |
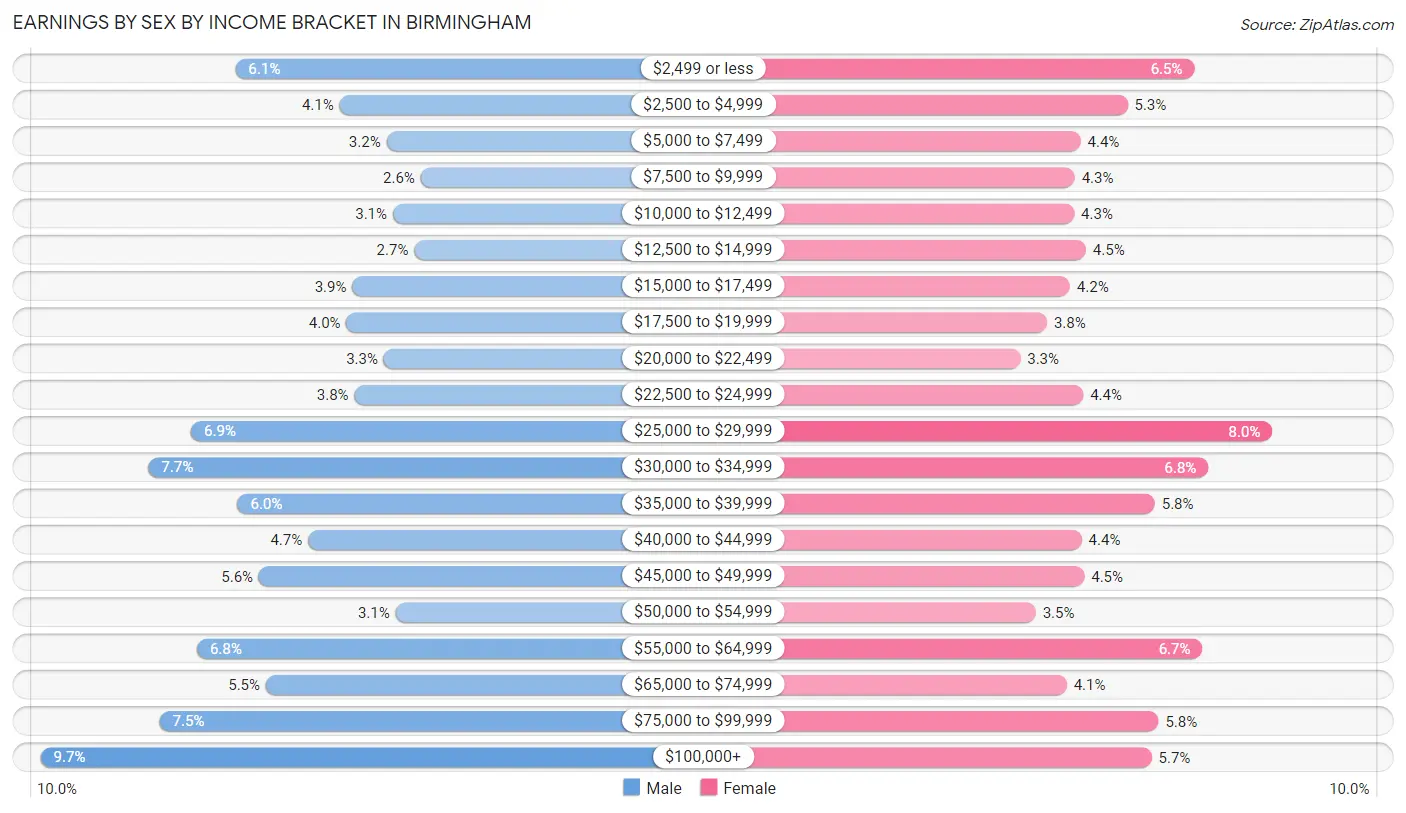
Earnings by Sex by Income Bracket in Birmingham
The most common earnings brackets in Birmingham are $100,000+ for men (4,690 | 9.7%) and $25,000 to $29,999 for women (4,164 | 8.0%).
| Income | Male | Female |
| $2,499 or less | 2,922 (6.0%) | 3,400 (6.5%) |
| $2,500 to $4,999 | 1,979 (4.1%) | 2,747 (5.3%) |
| $5,000 to $7,499 | 1,555 (3.2%) | 2,287 (4.4%) |
| $7,500 to $9,999 | 1,246 (2.6%) | 2,231 (4.3%) |
| $10,000 to $12,499 | 1,497 (3.1%) | 2,227 (4.3%) |
| $12,500 to $14,999 | 1,303 (2.7%) | 2,344 (4.5%) |
| $15,000 to $17,499 | 1,866 (3.9%) | 2,186 (4.2%) |
| $17,500 to $19,999 | 1,917 (4.0%) | 1,961 (3.7%) |
| $20,000 to $22,499 | 1,580 (3.3%) | 1,698 (3.3%) |
| $22,500 to $24,999 | 1,844 (3.8%) | 2,315 (4.4%) |
| $25,000 to $29,999 | 3,324 (6.9%) | 4,164 (8.0%) |
| $30,000 to $34,999 | 3,711 (7.7%) | 3,536 (6.8%) |
| $35,000 to $39,999 | 2,903 (6.0%) | 3,018 (5.8%) |
| $40,000 to $44,999 | 2,268 (4.7%) | 2,300 (4.4%) |
| $45,000 to $49,999 | 2,712 (5.6%) | 2,328 (4.4%) |
| $50,000 to $54,999 | 1,476 (3.0%) | 1,849 (3.5%) |
| $55,000 to $64,999 | 3,274 (6.8%) | 3,481 (6.7%) |
| $65,000 to $74,999 | 2,648 (5.5%) | 2,154 (4.1%) |
| $75,000 to $99,999 | 3,611 (7.5%) | 3,052 (5.8%) |
| $100,000+ | 4,690 (9.7%) | 2,986 (5.7%) |
| Total | 48,326 (100.0%) | 52,264 (100.0%) |
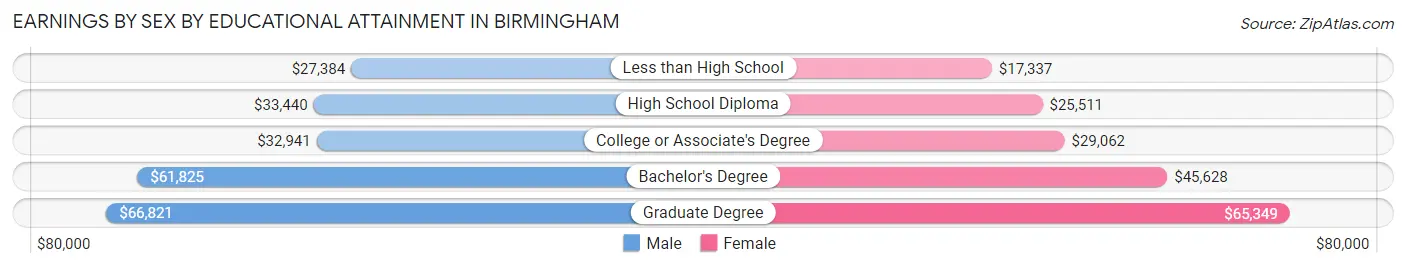
Earnings by Sex by Educational Attainment in Birmingham
Average earnings in Birmingham are $39,419 for men and $33,736 for women, a difference of 14.4%. Men with an educational attainment of graduate degree enjoy the highest average annual earnings of $66,821, while those with less than high school education earn the least with $27,384. Women with an educational attainment of graduate degree earn the most with the average annual earnings of $65,349, while those with less than high school education have the smallest earnings of $17,337.
| Educational Attainment | Male Income | Female Income |
| Less than High School | $27,384 | $17,337 |
| High School Diploma | $33,440 | $25,511 |
| College or Associate's Degree | $32,941 | $29,062 |
| Bachelor's Degree | $61,825 | $45,628 |
| Graduate Degree | $66,821 | $65,349 |
| Total | $39,419 | $33,736 |
Family Income in Birmingham
Family Income Brackets in Birmingham
According to the Birmingham family income data, there are 7,449 families falling into the $50,000 to $74,999 income range, which is the most common income bracket and makes up 18.3% of all families. Conversely, the $10,000 to $14,999 income bracket is the least frequent group with only 2,157 families (5.3%) belonging to this category.
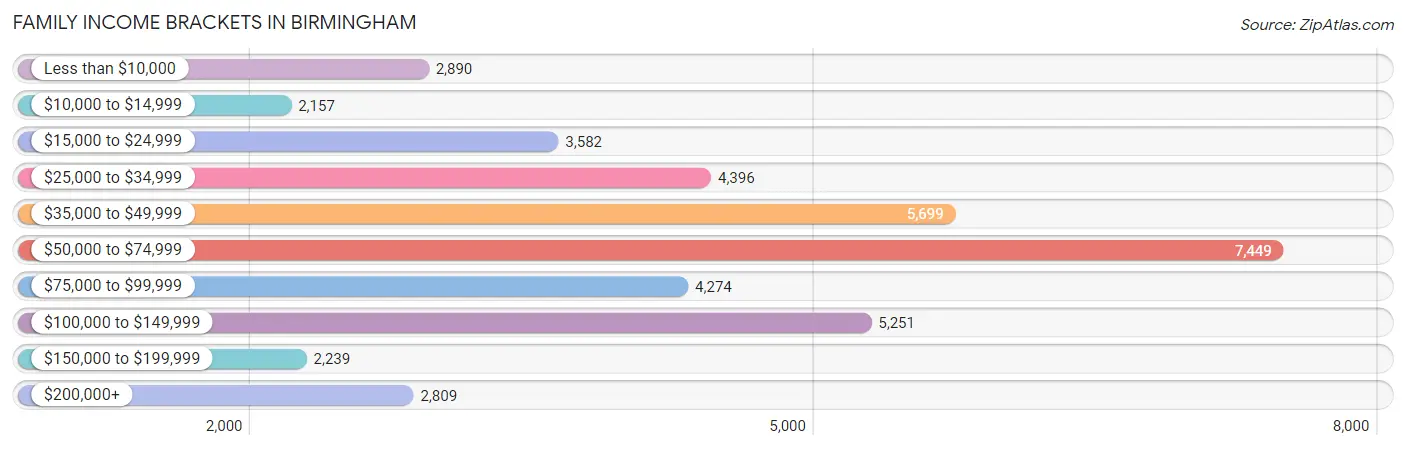
| Income Bracket | # Families | % Families |
| Less than $10,000 | 2,890 | 7.1% |
| $10,000 to $14,999 | 2,157 | 5.3% |
| $15,000 to $24,999 | 3,582 | 8.8% |
| $25,000 to $34,999 | 4,396 | 10.8% |
| $35,000 to $49,999 | 5,699 | 14.0% |
| $50,000 to $74,999 | 7,449 | 18.3% |
| $75,000 to $99,999 | 4,274 | 10.5% |
| $100,000 to $149,999 | 5,251 | 12.9% |
| $150,000 to $199,999 | 2,239 | 5.5% |
| $200,000+ | 2,809 | 6.9% |
Family Income by Famaliy Size in Birmingham
7+ person families (586 | 1.4%) account for the highest median family income in Birmingham with $90,598 per family, while 2-person families (22,129 | 54.4%) have the highest median income of $28,102 per family member.
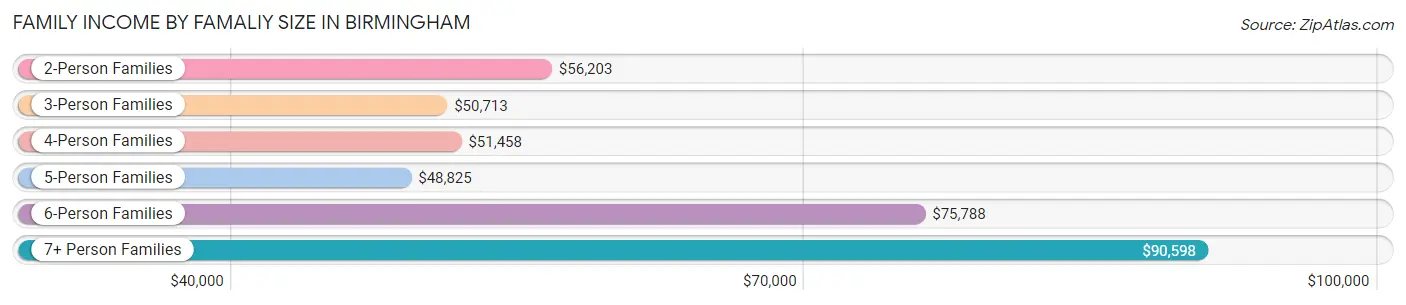
| Income Bracket | # Families | Median Income |
| 2-Person Families | 22,129 (54.4%) | $56,203 |
| 3-Person Families | 9,163 (22.5%) | $50,713 |
| 4-Person Families | 5,092 (12.5%) | $51,458 |
| 5-Person Families | 2,763 (6.8%) | $48,825 |
| 6-Person Families | 971 (2.4%) | $75,788 |
| 7+ Person Families | 586 (1.4%) | $90,598 |
| Total | 40,704 (100.0%) | $55,541 |
Family Income by Number of Earners in Birmingham
The median family income in Birmingham is $55,541, with families comprising 3+ earners (2,606) having the highest median family income of $119,750, while families with no earners (7,495) have the lowest median family income of $30,806, accounting for 6.4% and 18.4% of families, respectively.
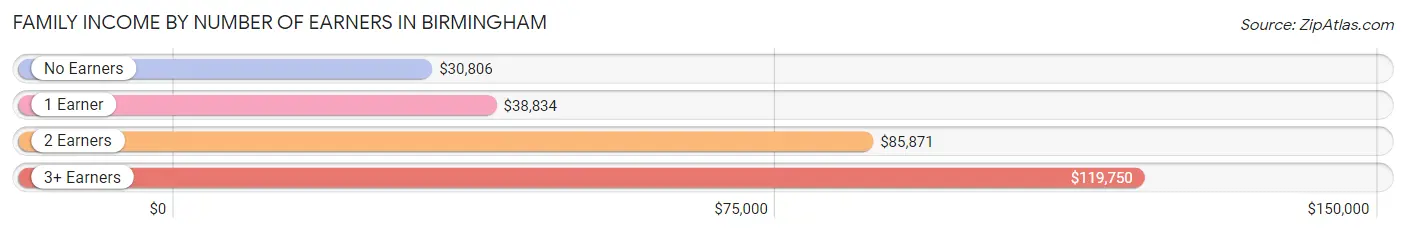
| Number of Earners | # Families | Median Income |
| No Earners | 7,495 (18.4%) | $30,806 |
| 1 Earner | 16,352 (40.2%) | $38,834 |
| 2 Earners | 14,251 (35.0%) | $85,871 |
| 3+ Earners | 2,606 (6.4%) | $119,750 |
| Total | 40,704 (100.0%) | $55,541 |
Household Income in Birmingham
Household Income Brackets in Birmingham
With 14,620 households falling in the category, the $50,000 to $74,999 income range is the most frequent in Birmingham, accounting for 17.2% of all households. In contrast, only 3,230 households (3.8%) fall into the $150,000 to $199,999 income bracket, making it the least populous group.
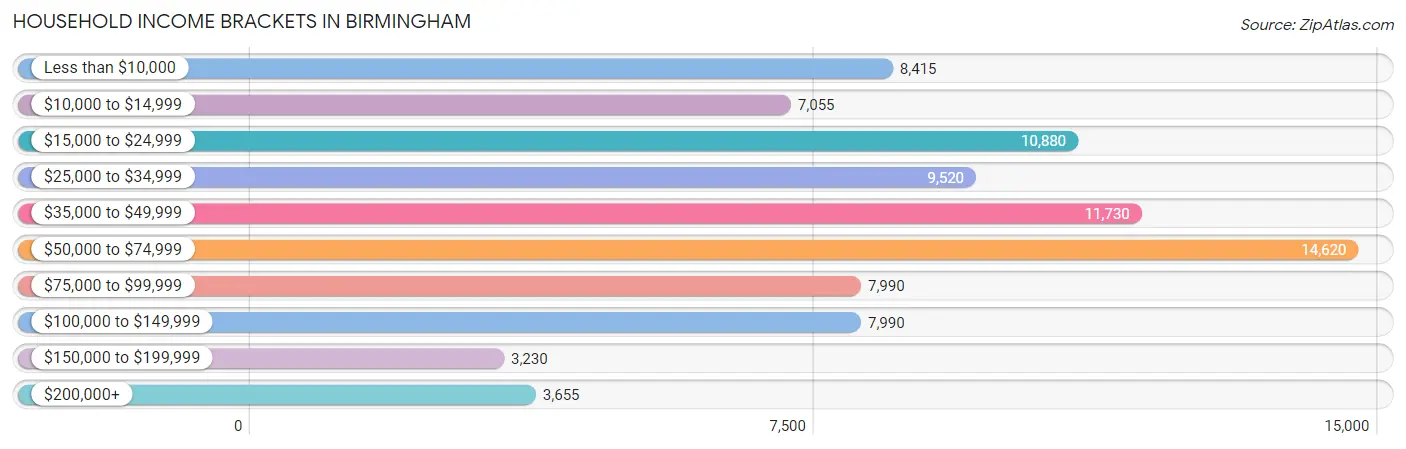
| Income Bracket | # Households | % Households |
| Less than $10,000 | 8,415 | 9.9% |
| $10,000 to $14,999 | 7,055 | 8.3% |
| $15,000 to $24,999 | 10,880 | 12.8% |
| $25,000 to $34,999 | 9,520 | 11.2% |
| $35,000 to $49,999 | 11,730 | 13.8% |
| $50,000 to $74,999 | 14,620 | 17.2% |
| $75,000 to $99,999 | 7,990 | 9.4% |
| $100,000 to $149,999 | 7,990 | 9.4% |
| $150,000 to $199,999 | 3,230 | 3.8% |
| $200,000+ | 3,655 | 4.3% |
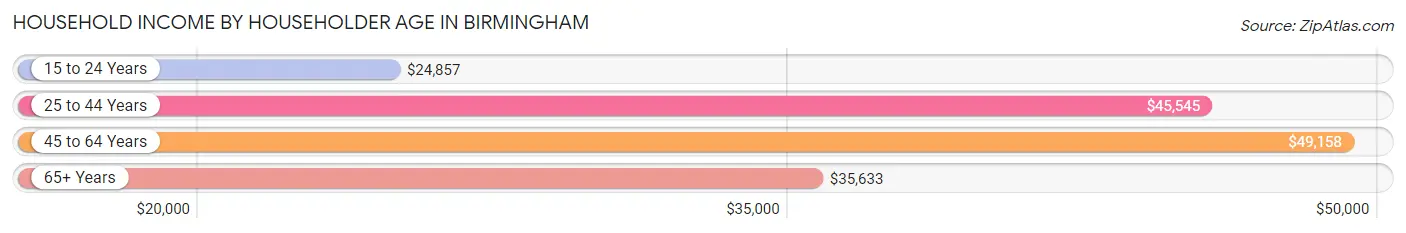
Household Income by Householder Age in Birmingham
The median household income in Birmingham is $42,464, with the highest median household income of $49,158 found in the 45 to 64 years age bracket for the primary householder. A total of 28,182 households (33.2%) fall into this category. Meanwhile, the 15 to 24 years age bracket for the primary householder has the lowest median household income of $24,857, with 4,863 households (5.7%) in this group.
| Income Bracket | # Households | Median Income |
| 15 to 24 Years | 4,863 (5.7%) | $24,857 |
| 25 to 44 Years | 29,728 (35.0%) | $45,545 |
| 45 to 64 Years | 28,182 (33.2%) | $49,158 |
| 65+ Years | 22,226 (26.2%) | $35,633 |
| Total | 84,999 (100.0%) | $42,464 |
Poverty in Birmingham
Income Below Poverty by Sex and Age in Birmingham
With 23.5% poverty level for males and 28.4% for females among the residents of Birmingham, 5 year old males and 5 year old females are the most vulnerable to poverty, with 657 males (52.0%) and 455 females (48.6%) in their respective age groups living below the poverty level.
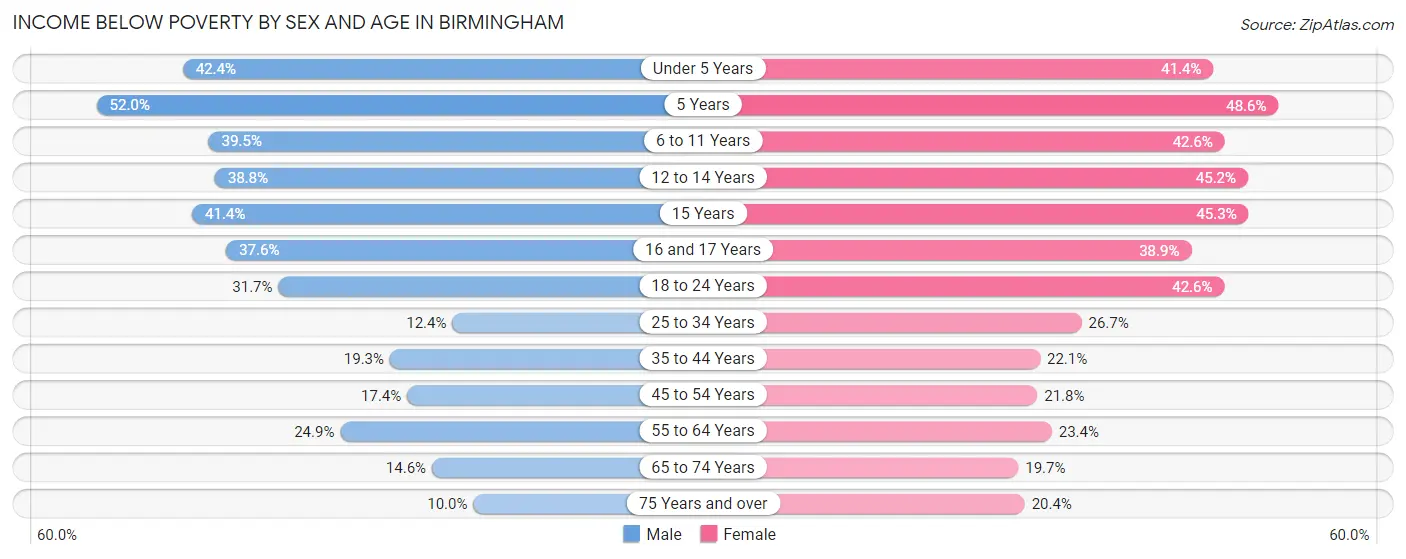
| Age Bracket | Male | Female |
| Under 5 Years | 2,265 (42.4%) | 2,154 (41.4%) |
| 5 Years | 657 (52.0%) | 455 (48.6%) |
| 6 to 11 Years | 2,551 (39.5%) | 2,707 (42.6%) |
| 12 to 14 Years | 1,371 (38.8%) | 1,394 (45.2%) |
| 15 Years | 538 (41.3%) | 375 (45.3%) |
| 16 and 17 Years | 694 (37.6%) | 853 (38.9%) |
| 18 to 24 Years | 2,592 (31.7%) | 4,147 (42.6%) |
| 25 to 34 Years | 2,094 (12.4%) | 4,696 (26.7%) |
| 35 to 44 Years | 2,089 (19.3%) | 2,755 (22.1%) |
| 45 to 54 Years | 1,731 (17.4%) | 2,353 (21.8%) |
| 55 to 64 Years | 2,893 (24.8%) | 3,226 (23.4%) |
| 65 to 74 Years | 1,314 (14.6%) | 2,144 (19.7%) |
| 75 Years and over | 398 (10.0%) | 1,475 (20.4%) |
| Total | 21,187 (23.5%) | 28,734 (28.4%) |
Income Above Poverty by Sex and Age in Birmingham
According to the poverty statistics in Birmingham, males aged 75 years and over and females aged 65 to 74 years are the age groups that are most secure financially, with 90.0% of males and 80.3% of females in these age groups living above the poverty line.
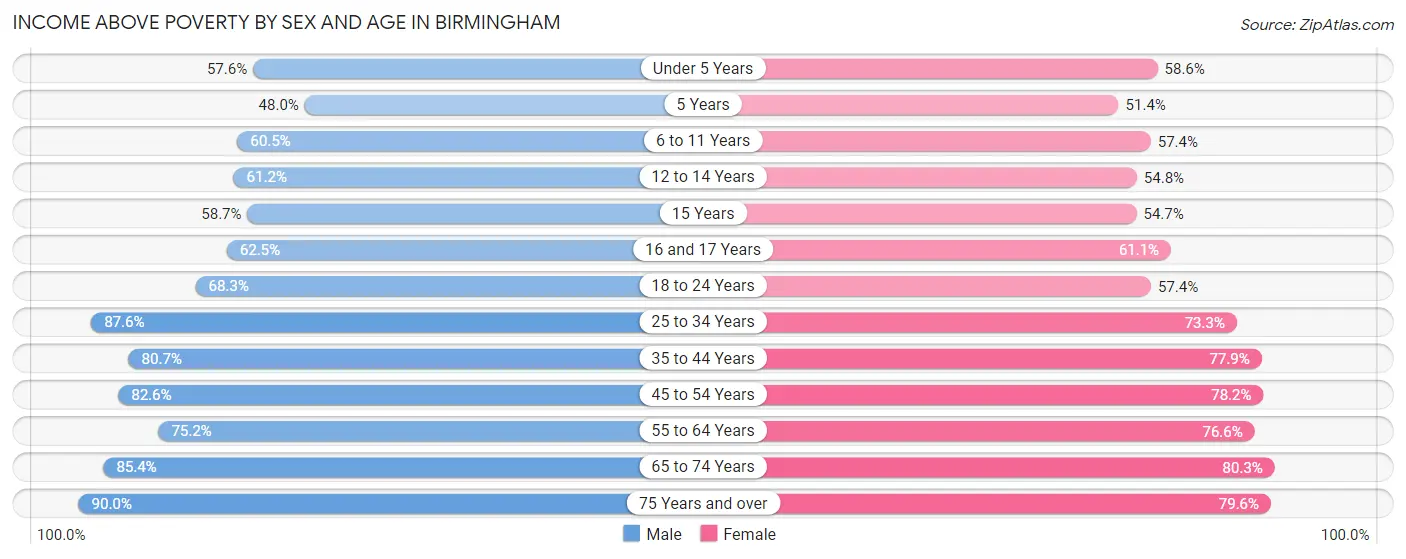
| Age Bracket | Male | Female |
| Under 5 Years | 3,078 (57.6%) | 3,052 (58.6%) |
| 5 Years | 607 (48.0%) | 481 (51.4%) |
| 6 to 11 Years | 3,906 (60.5%) | 3,642 (57.4%) |
| 12 to 14 Years | 2,162 (61.2%) | 1,689 (54.8%) |
| 15 Years | 763 (58.7%) | 453 (54.7%) |
| 16 and 17 Years | 1,154 (62.5%) | 1,339 (61.1%) |
| 18 to 24 Years | 5,574 (68.3%) | 5,591 (57.4%) |
| 25 to 34 Years | 14,828 (87.6%) | 12,891 (73.3%) |
| 35 to 44 Years | 8,725 (80.7%) | 9,723 (77.9%) |
| 45 to 54 Years | 8,218 (82.6%) | 8,455 (78.2%) |
| 55 to 64 Years | 8,747 (75.1%) | 10,564 (76.6%) |
| 65 to 74 Years | 7,664 (85.4%) | 8,759 (80.3%) |
| 75 Years and over | 3,570 (90.0%) | 5,766 (79.6%) |
| Total | 68,996 (76.5%) | 72,405 (71.6%) |
Income Below Poverty Among Married-Couple Families in Birmingham
The poverty statistics for married-couple families in Birmingham show that 6.7% or 1,320 of the total 19,747 families live below the poverty line. Families with 3 or 4 children have the highest poverty rate of 30.4%, comprising of 351 families. On the other hand, families with no children have the lowest poverty rate of 4.9%, which includes 663 families.
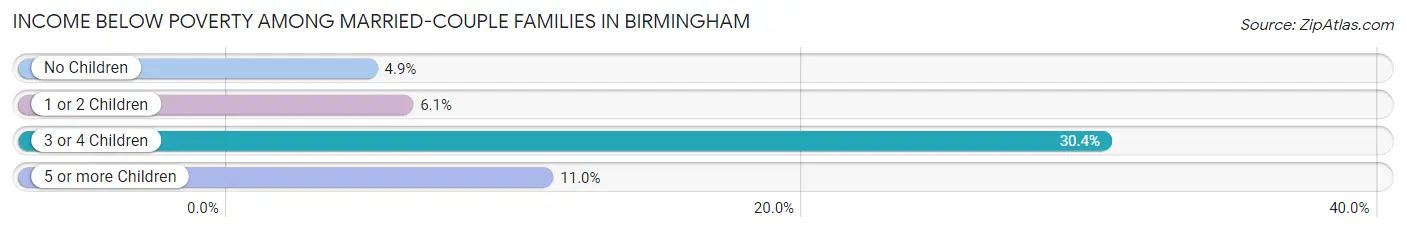
| Children | Above Poverty | Below Poverty |
| No Children | 12,982 (95.1%) | 663 (4.9%) |
| 1 or 2 Children | 4,569 (93.9%) | 297 (6.1%) |
| 3 or 4 Children | 803 (69.6%) | 351 (30.4%) |
| 5 or more Children | 73 (89.0%) | 9 (11.0%) |
| Total | 18,427 (93.3%) | 1,320 (6.7%) |
Income Below Poverty Among Single-Parent Households in Birmingham
According to the poverty data in Birmingham, 26.5% or 965 single-father households and 33.1% or 5,723 single-mother households are living below the poverty line. Among single-father households, those with 3 or 4 children have the highest poverty rate, with 144 households (68.9%) experiencing poverty. Likewise, among single-mother households, those with 5 or more children have the highest poverty rate, with 223 households (86.1%) falling below the poverty line.
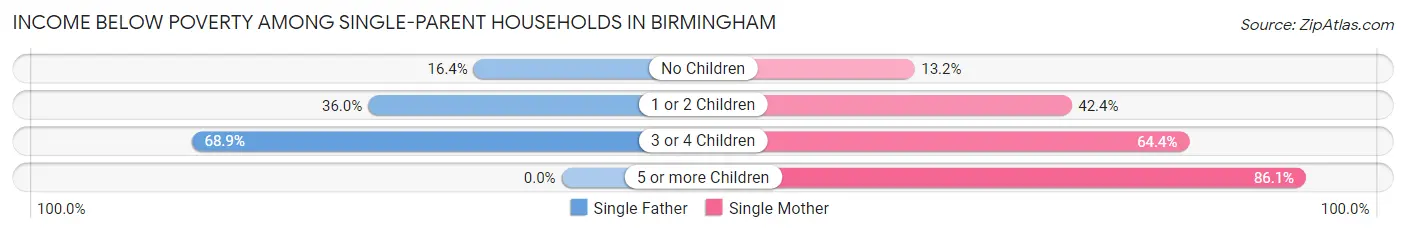
| Children | Single Father | Single Mother |
| No Children | 345 (16.4%) | 980 (13.2%) |
| 1 or 2 Children | 476 (36.0%) | 3,209 (42.4%) |
| 3 or 4 Children | 144 (68.9%) | 1,311 (64.4%) |
| 5 or more Children | 0 (0.0%) | 223 (86.1%) |
| Total | 965 (26.5%) | 5,723 (33.1%) |
Income Below Poverty Among Married-Couple vs Single-Parent Households in Birmingham
The poverty data for Birmingham shows that 1,320 of the married-couple family households (6.7%) and 6,688 of the single-parent households (31.9%) are living below the poverty level. Within the married-couple family households, those with 3 or 4 children have the highest poverty rate, with 351 households (30.4%) falling below the poverty line. Among the single-parent households, those with 5 or more children have the highest poverty rate, with 223 household (83.5%) living below poverty.
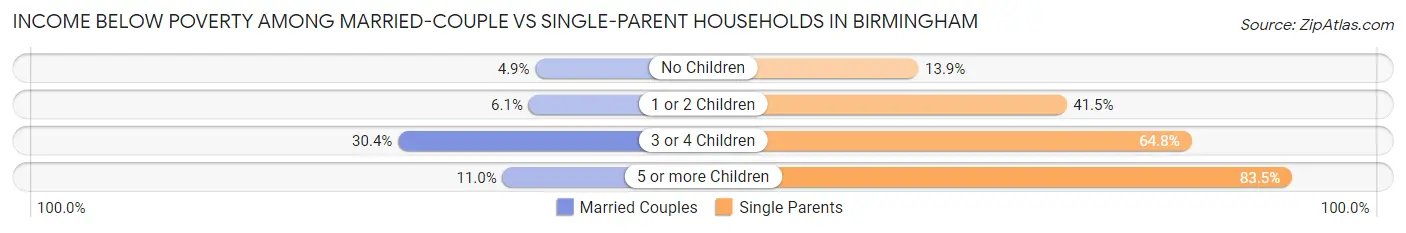
| Children | Married-Couple Families | Single-Parent Households |
| No Children | 663 (4.9%) | 1,325 (13.9%) |
| 1 or 2 Children | 297 (6.1%) | 3,685 (41.5%) |
| 3 or 4 Children | 351 (30.4%) | 1,455 (64.8%) |
| 5 or more Children | 9 (11.0%) | 223 (83.5%) |
| Total | 1,320 (6.7%) | 6,688 (31.9%) |
Race in Birmingham
The most populous races in Birmingham are Black / African American (137,487 | 68.6%), White / Caucasian (49,861 | 24.9%), and Hispanic or Latino (8,039 | 4.0%).
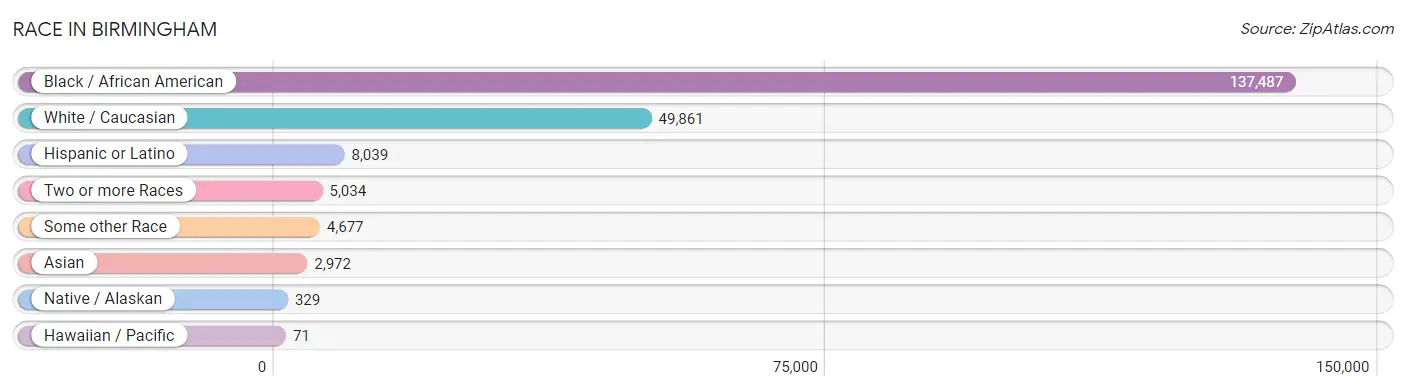
| Race | # Population | % Population |
| Asian | 2,972 | 1.5% |
| Black / African American | 137,487 | 68.6% |
| Hawaiian / Pacific | 71 | 0.0% |
| Hispanic or Latino | 8,039 | 4.0% |
| Native / Alaskan | 329 | 0.2% |
| White / Caucasian | 49,861 | 24.9% |
| Two or more Races | 5,034 | 2.5% |
| Some other Race | 4,677 | 2.3% |
| Total | 200,431 | 100.0% |
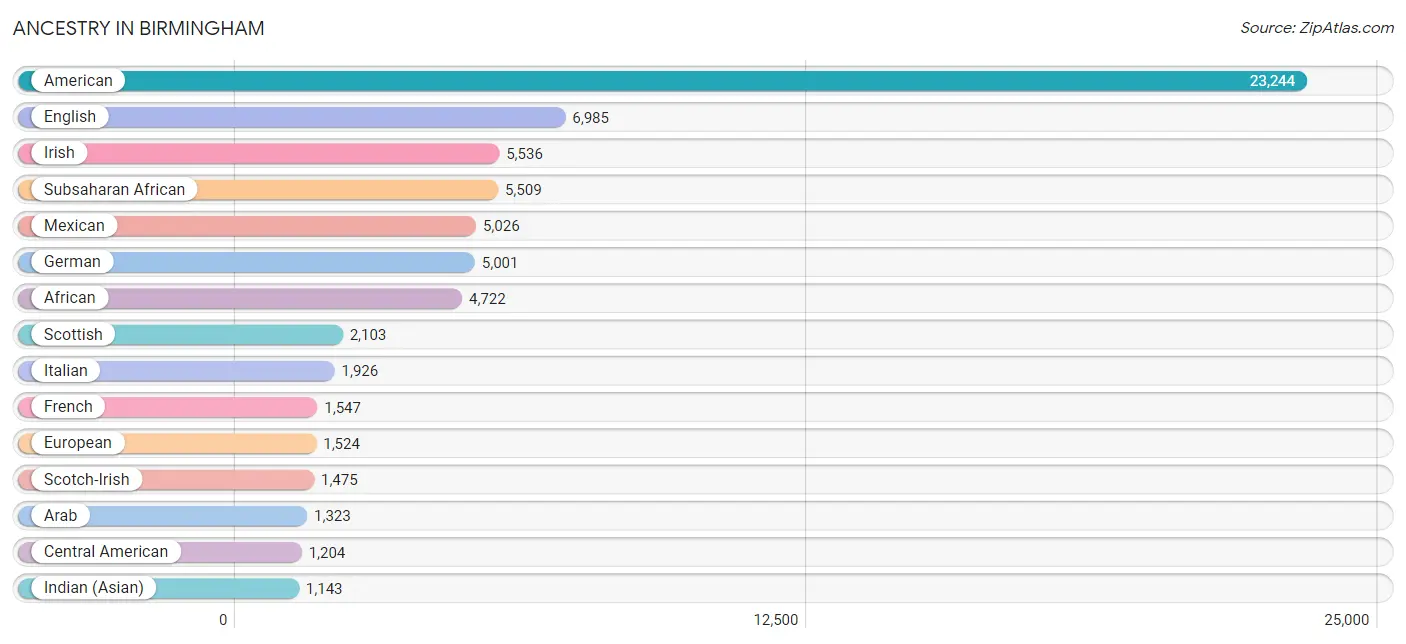
Ancestry in Birmingham
The most populous ancestries reported in Birmingham are American (23,244 | 11.6%), English (6,985 | 3.5%), Irish (5,536 | 2.8%), Subsaharan African (5,509 | 2.8%), and Mexican (5,026 | 2.5%), together accounting for 23.1% of all Birmingham residents.
| Ancestry | # Population | % Population |
| African | 4,722 | 2.4% |
| Aleut | 21 | 0.0% |
| American | 23,244 | 11.6% |
| Arab | 1,323 | 0.7% |
| Argentinean | 22 | 0.0% |
| Australian | 15 | 0.0% |
| Austrian | 80 | 0.0% |
| Bahamian | 72 | 0.0% |
| Bangladeshi | 21 | 0.0% |
| Belgian | 99 | 0.1% |
| Belizean | 8 | 0.0% |
| Bhutanese | 104 | 0.1% |
| Blackfeet | 49 | 0.0% |
| Brazilian | 124 | 0.1% |
| British | 799 | 0.4% |
| British West Indian | 13 | 0.0% |
| Burmese | 193 | 0.1% |
| Cajun | 22 | 0.0% |
| Canadian | 45 | 0.0% |
| Celtic | 9 | 0.0% |
| Central American | 1,204 | 0.6% |
| Central American Indian | 11 | 0.0% |
| Cherokee | 175 | 0.1% |
| Chickasaw | 6 | 0.0% |
| Chilean | 54 | 0.0% |
| Choctaw | 23 | 0.0% |
| Colombian | 4 | 0.0% |
| Costa Rican | 20 | 0.0% |
| Creek | 60 | 0.0% |
| Croatian | 21 | 0.0% |
| Cuban | 203 | 0.1% |
| Czech | 111 | 0.1% |
| Czechoslovakian | 34 | 0.0% |
| Danish | 267 | 0.1% |
| Dominican | 27 | 0.0% |
| Dutch | 403 | 0.2% |
| Eastern European | 195 | 0.1% |
| Egyptian | 128 | 0.1% |
| English | 6,985 | 3.5% |
| Ethiopian | 11 | 0.0% |
| European | 1,524 | 0.8% |
| Filipino | 112 | 0.1% |
| Finnish | 514 | 0.3% |
| French | 1,547 | 0.8% |
| French Canadian | 62 | 0.0% |
| German | 5,001 | 2.5% |
| Greek | 323 | 0.2% |
| Guatemalan | 341 | 0.2% |
| Haitian | 215 | 0.1% |
| Honduran | 464 | 0.2% |
| Hungarian | 177 | 0.1% |
| Icelander | 14 | 0.0% |
| Indian (Asian) | 1,143 | 0.6% |
| Inupiat | 86 | 0.0% |
| Iranian | 54 | 0.0% |
| Iraqi | 7 | 0.0% |
| Irish | 5,536 | 2.8% |
| Israeli | 18 | 0.0% |
| Italian | 1,926 | 1.0% |
| Jamaican | 265 | 0.1% |
| Jordanian | 51 | 0.0% |
| Kenyan | 76 | 0.0% |
| Korean | 127 | 0.1% |
| Laotian | 24 | 0.0% |
| Latvian | 14 | 0.0% |
| Lebanese | 224 | 0.1% |
| Lithuanian | 49 | 0.0% |
| Lumbee | 5 | 0.0% |
| Mexican | 5,026 | 2.5% |
| Mexican American Indian | 10 | 0.0% |
| Moroccan | 805 | 0.4% |
| Native Hawaiian | 33 | 0.0% |
| Navajo | 72 | 0.0% |
| New Zealander | 8 | 0.0% |
| Nicaraguan | 90 | 0.0% |
| Nigerian | 490 | 0.2% |
| Northern European | 214 | 0.1% |
| Norwegian | 266 | 0.1% |
| Pakistani | 83 | 0.0% |
| Palestinian | 19 | 0.0% |
| Panamanian | 74 | 0.0% |
| Paraguayan | 10 | 0.0% |
| Pennsylvania German | 3 | 0.0% |
| Peruvian | 23 | 0.0% |
| Polish | 632 | 0.3% |
| Portuguese | 37 | 0.0% |
| Potawatomi | 1 | 0.0% |
| Puerto Rican | 481 | 0.2% |
| Romanian | 43 | 0.0% |
| Russian | 256 | 0.1% |
| Salvadoran | 132 | 0.1% |
| Samoan | 38 | 0.0% |
| Scandinavian | 392 | 0.2% |
| Scotch-Irish | 1,475 | 0.7% |
| Scottish | 2,103 | 1.1% |
| Seminole | 7 | 0.0% |
| Slavic | 54 | 0.0% |
| Slovak | 6 | 0.0% |
| Slovene | 12 | 0.0% |
| South African | 113 | 0.1% |
| South American | 341 | 0.2% |
| South American Indian | 7 | 0.0% |
| Spaniard | 48 | 0.0% |
| Spanish | 198 | 0.1% |
| Sri Lankan | 479 | 0.2% |
| Subsaharan African | 5,509 | 2.8% |
| Swedish | 176 | 0.1% |
| Swiss | 181 | 0.1% |
| Syrian | 47 | 0.0% |
| Thai | 875 | 0.4% |
| Turkish | 54 | 0.0% |
| Ugandan | 40 | 0.0% |
| Ukrainian | 121 | 0.1% |
| Venezuelan | 228 | 0.1% |
| Vietnamese | 110 | 0.1% |
| Welsh | 460 | 0.2% |
| West Indian | 308 | 0.2% |
| Yugoslavian | 21 | 0.0% | View All 118 Rows |
Immigrants in Birmingham
The most numerous immigrant groups reported in Birmingham came from Latin America (3,944 | 2.0%), Central America (3,351 | 1.7%), Mexico (2,449 | 1.2%), Asia (2,278 | 1.1%), and South Central Asia (963 | 0.5%), together accounting for 6.5% of all Birmingham residents.
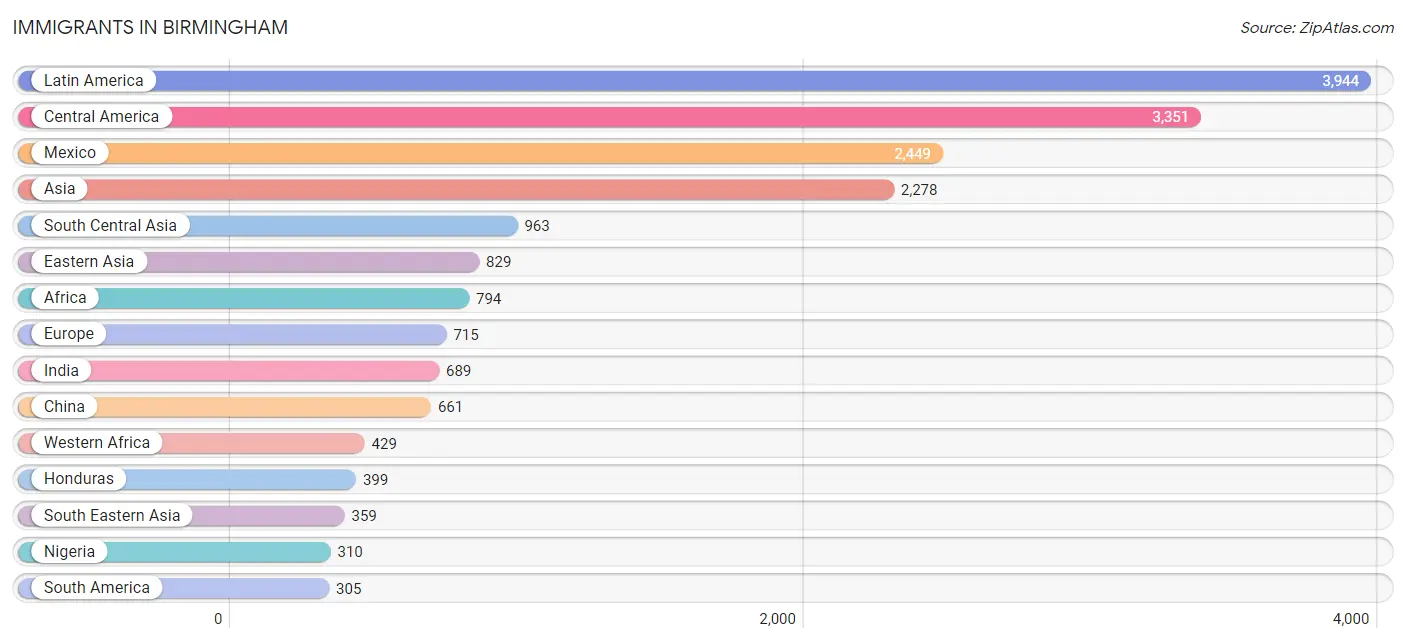
| Immigration Origin | # Population | % Population |
| Africa | 794 | 0.4% |
| Argentina | 7 | 0.0% |
| Asia | 2,278 | 1.1% |
| Australia | 71 | 0.0% |
| Bahamas | 12 | 0.0% |
| Bangladesh | 134 | 0.1% |
| Belgium | 9 | 0.0% |
| Brazil | 111 | 0.1% |
| Canada | 21 | 0.0% |
| Caribbean | 288 | 0.1% |
| Central America | 3,351 | 1.7% |
| Chile | 16 | 0.0% |
| China | 661 | 0.3% |
| Colombia | 9 | 0.0% |
| Cuba | 8 | 0.0% |
| Czechoslovakia | 38 | 0.0% |
| Dominican Republic | 20 | 0.0% |
| Eastern Africa | 213 | 0.1% |
| Eastern Asia | 829 | 0.4% |
| Eastern Europe | 238 | 0.1% |
| Egypt | 50 | 0.0% |
| El Salvador | 145 | 0.1% |
| England | 68 | 0.0% |
| Europe | 715 | 0.4% |
| France | 16 | 0.0% |
| Germany | 141 | 0.1% |
| Guatemala | 270 | 0.1% |
| Haiti | 12 | 0.0% |
| Honduras | 399 | 0.2% |
| Hungary | 63 | 0.0% |
| India | 689 | 0.3% |
| Indonesia | 21 | 0.0% |
| Iran | 23 | 0.0% |
| Iraq | 21 | 0.0% |
| Italy | 18 | 0.0% |
| Jamaica | 199 | 0.1% |
| Japan | 59 | 0.0% |
| Kenya | 173 | 0.1% |
| Korea | 109 | 0.1% |
| Latin America | 3,944 | 2.0% |
| Latvia | 36 | 0.0% |
| Lithuania | 10 | 0.0% |
| Malaysia | 25 | 0.0% |
| Mexico | 2,449 | 1.2% |
| Moldova | 9 | 0.0% |
| Nepal | 75 | 0.0% |
| Nicaragua | 52 | 0.0% |
| Nigeria | 310 | 0.2% |
| Northern Africa | 50 | 0.0% |
| Northern Europe | 228 | 0.1% |
| Norway | 54 | 0.0% |
| Oceania | 90 | 0.0% |
| Pakistan | 42 | 0.0% |
| Panama | 25 | 0.0% |
| Peru | 23 | 0.0% |
| Philippines | 53 | 0.0% |
| Russia | 50 | 0.0% |
| Saudi Arabia | 11 | 0.0% |
| Scotland | 37 | 0.0% |
| Sierra Leone | 9 | 0.0% |
| South Africa | 81 | 0.0% |
| South America | 305 | 0.2% |
| South Central Asia | 963 | 0.5% |
| South Eastern Asia | 359 | 0.2% |
| Southern Europe | 59 | 0.0% |
| Spain | 41 | 0.0% |
| Switzerland | 24 | 0.0% |
| Taiwan | 140 | 0.1% |
| Thailand | 61 | 0.0% |
| Trinidad and Tobago | 16 | 0.0% |
| Turkey | 54 | 0.0% |
| Uganda | 33 | 0.0% |
| Ukraine | 16 | 0.0% |
| Venezuela | 132 | 0.1% |
| Vietnam | 199 | 0.1% |
| West Indies | 3 | 0.0% |
| Western Africa | 429 | 0.2% |
| Western Asia | 120 | 0.1% |
| Western Europe | 190 | 0.1% | View All 79 Rows |
Sex and Age in Birmingham
Sex and Age in Birmingham
The most populous age groups in Birmingham are 25 to 29 Years (9,409 | 10.0%) for men and 25 to 29 Years (9,404 | 8.9%) for women.
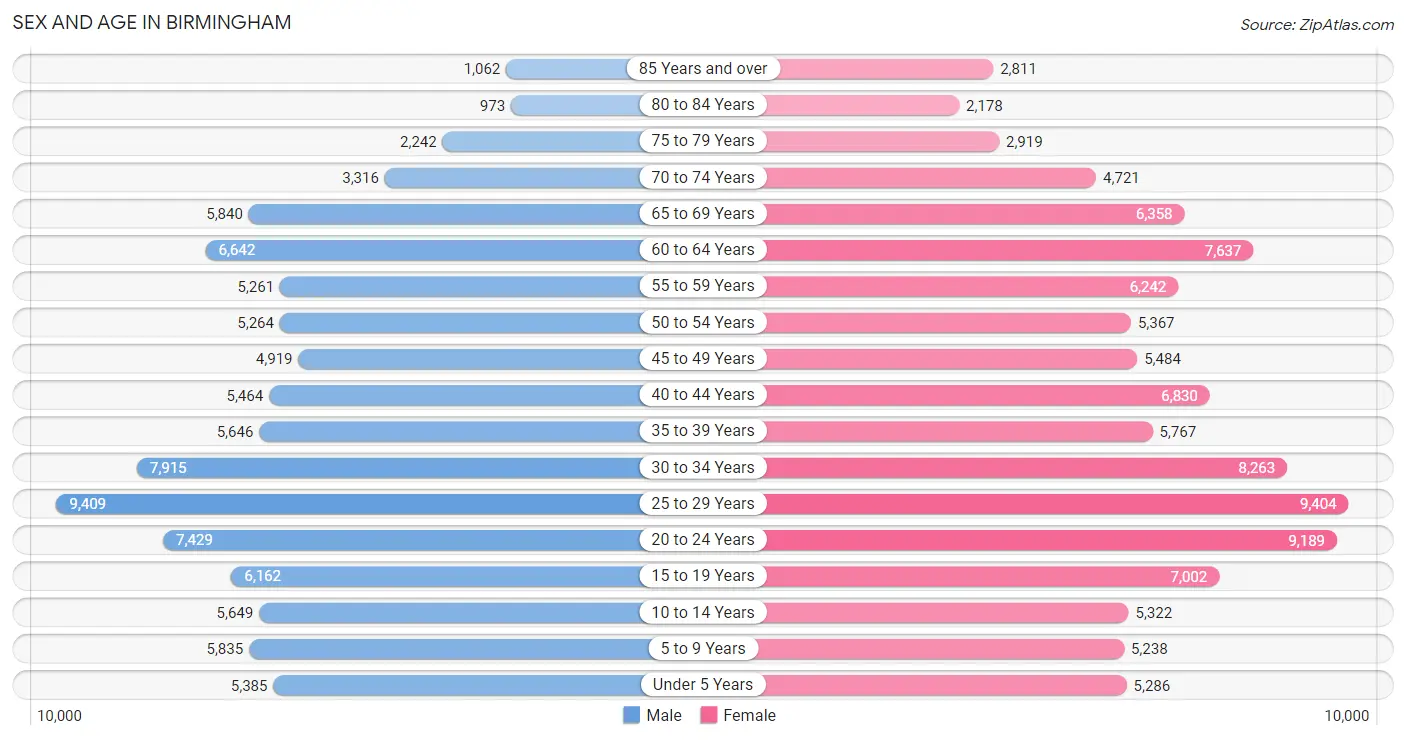
| Age Bracket | Male | Female |
| Under 5 Years | 5,385 (5.7%) | 5,286 (5.0%) |
| 5 to 9 Years | 5,835 (6.2%) | 5,238 (4.9%) |
| 10 to 14 Years | 5,649 (6.0%) | 5,322 (5.0%) |
| 15 to 19 Years | 6,162 (6.5%) | 7,002 (6.6%) |
| 20 to 24 Years | 7,429 (7.9%) | 9,189 (8.7%) |
| 25 to 29 Years | 9,409 (10.0%) | 9,404 (8.9%) |
| 30 to 34 Years | 7,915 (8.4%) | 8,263 (7.8%) |
| 35 to 39 Years | 5,646 (6.0%) | 5,767 (5.4%) |
| 40 to 44 Years | 5,464 (5.8%) | 6,830 (6.4%) |
| 45 to 49 Years | 4,919 (5.2%) | 5,484 (5.2%) |
| 50 to 54 Years | 5,264 (5.6%) | 5,367 (5.1%) |
| 55 to 59 Years | 5,261 (5.6%) | 6,242 (5.9%) |
| 60 to 64 Years | 6,642 (7.0%) | 7,637 (7.2%) |
| 65 to 69 Years | 5,840 (6.2%) | 6,358 (6.0%) |
| 70 to 74 Years | 3,316 (3.5%) | 4,721 (4.4%) |
| 75 to 79 Years | 2,242 (2.4%) | 2,919 (2.8%) |
| 80 to 84 Years | 973 (1.0%) | 2,178 (2.1%) |
| 85 Years and over | 1,062 (1.1%) | 2,811 (2.6%) |
| Total | 94,413 (100.0%) | 106,018 (100.0%) |
Families and Households in Birmingham
Median Family Size in Birmingham
The median family size in Birmingham is 3.25 persons per family, with single female/mother families (17,311 | 42.5%) accounting for the largest median family size of 3.51 persons per family. On the other hand, single male/father families (3,646 | 9.0%) represent the smallest median family size with 2.81 persons per family.
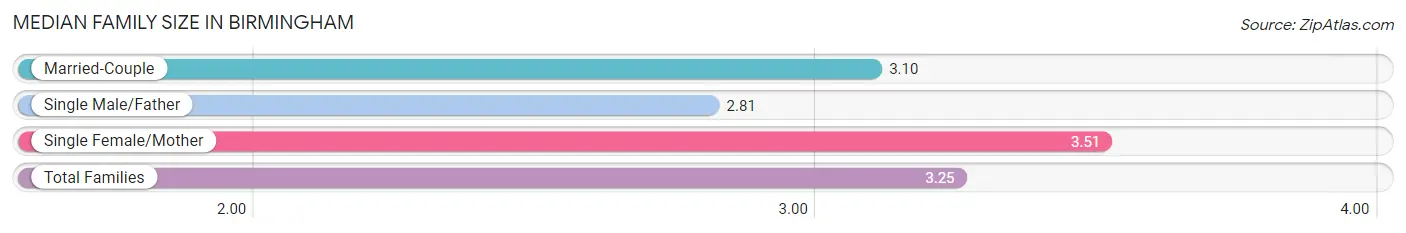
| Family Type | # Families | Family Size |
| Married-Couple | 19,747 (48.5%) | 3.10 |
| Single Male/Father | 3,646 (9.0%) | 2.81 |
| Single Female/Mother | 17,311 (42.5%) | 3.51 |
| Total Families | 40,704 (100.0%) | 3.25 |
Median Household Size in Birmingham
The median household size in Birmingham is 2.23 persons per household, with single female/mother households (17,311 | 20.4%) accounting for the largest median household size of 3.63 persons per household. non-family households (44,295 | 52.1%) represent the smallest median household size with 1.20 persons per household.
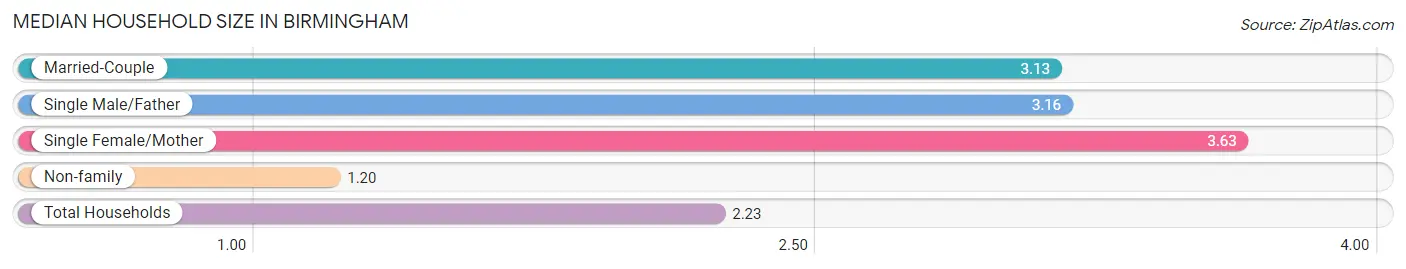
| Household Type | # Households | Household Size |
| Married-Couple | 19,747 (23.2%) | 3.13 |
| Single Male/Father | 3,646 (4.3%) | 3.16 |
| Single Female/Mother | 17,311 (20.4%) | 3.63 |
| Non-family | 44,295 (52.1%) | 1.20 |
| Total Households | 84,999 (100.0%) | 2.23 |
Household Size by Marriage Status in Birmingham
Out of a total of 84,999 households in Birmingham, 40,704 (47.9%) are family households, while 44,295 (52.1%) are nonfamily households. The most numerous type of family households are 2-person households, comprising 20,353, and the most common type of nonfamily households are 1-person households, comprising 38,116.
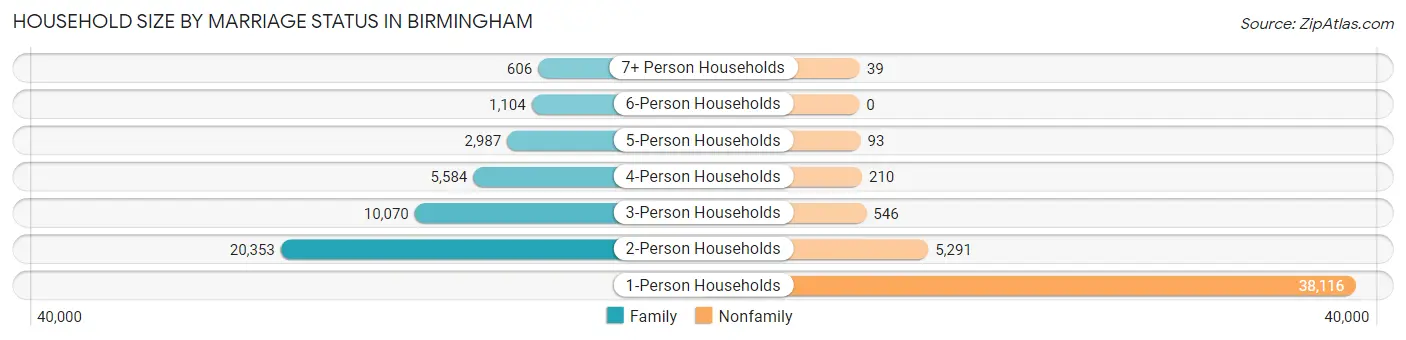
| Household Size | Family Households | Nonfamily Households |
| 1-Person Households | - | 38,116 (44.8%) |
| 2-Person Households | 20,353 (23.9%) | 5,291 (6.2%) |
| 3-Person Households | 10,070 (11.8%) | 546 (0.6%) |
| 4-Person Households | 5,584 (6.6%) | 210 (0.3%) |
| 5-Person Households | 2,987 (3.5%) | 93 (0.1%) |
| 6-Person Households | 1,104 (1.3%) | 0 (0.0%) |
| 7+ Person Households | 606 (0.7%) | 39 (0.1%) |
| Total | 40,704 (47.9%) | 44,295 (52.1%) |
Female Fertility in Birmingham
Fertility by Age in Birmingham
Average fertility rate in Birmingham is 41.0 births per 1,000 women. Women in the age bracket of 20 to 34 years have the highest fertility rate with 61.0 births per 1,000 women. Women in the age bracket of 20 to 34 years acount for 75.2% of all women with births.
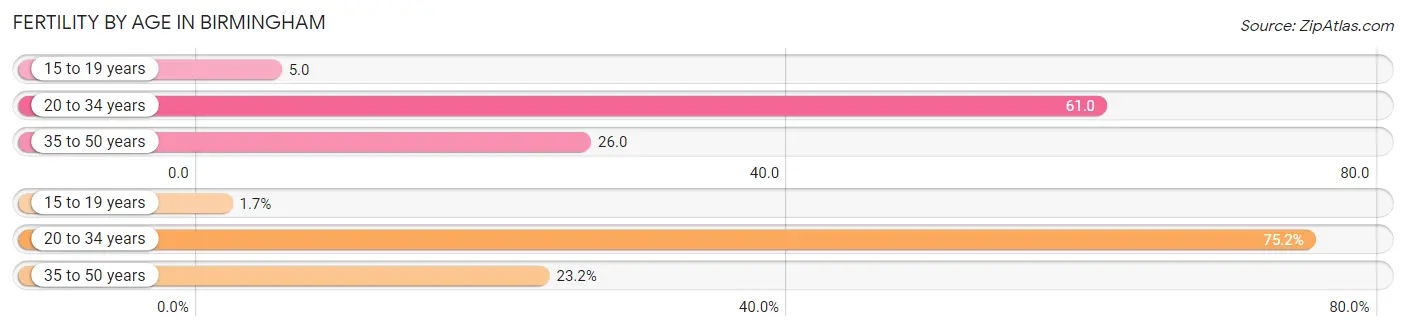
| Age Bracket | Women with Births | Births / 1,000 Women |
| 15 to 19 years | 36 (1.7%) | 5.0 |
| 20 to 34 years | 1,634 (75.2%) | 61.0 |
| 35 to 50 years | 504 (23.2%) | 26.0 |
| Total | 2,174 (100.0%) | 41.0 |
Fertility by Age by Marriage Status in Birmingham
52.2% of women with births (2,174) in Birmingham are married. The highest percentage of unmarried women with births falls into 15 to 19 years age bracket with 83.3% of them unmarried at the time of birth, while the lowest percentage of unmarried women with births belong to 35 to 50 years age bracket with 26.8% of them unmarried.
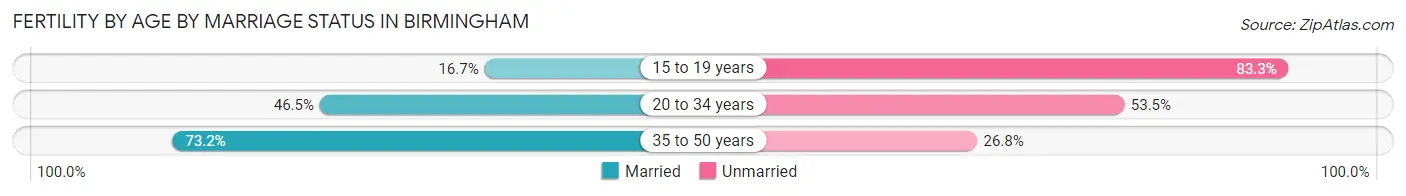
| Age Bracket | Married | Unmarried |
| 15 to 19 years | 6 (16.7%) | 30 (83.3%) |
| 20 to 34 years | 760 (46.5%) | 874 (53.5%) |
| 35 to 50 years | 369 (73.2%) | 135 (26.8%) |
| Total | 1,135 (52.2%) | 1,039 (47.8%) |
Fertility by Education in Birmingham
Average fertility rate in Birmingham is 41.0 births per 1,000 women. Women with the education attainment of high school diploma have the highest fertility rate of 58.0 births per 1,000 women, while women with the education attainment of bachelor's degree have the lowest fertility at 24.0 births per 1,000 women. Women with the education attainment of high school diploma represent 35.7% of all women with births.
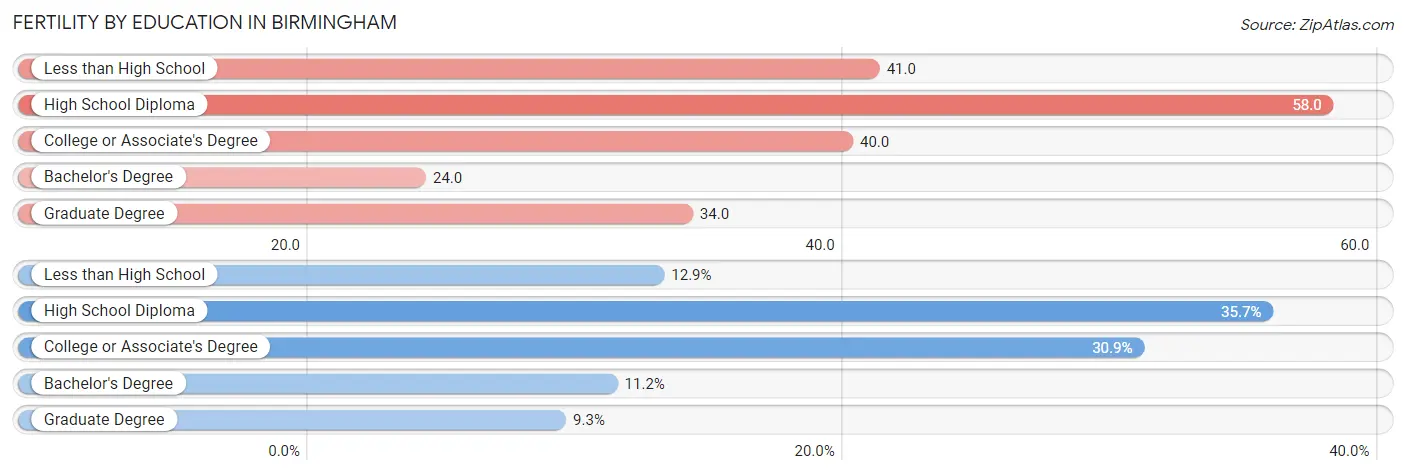
| Educational Attainment | Women with Births | Births / 1,000 Women |
| Less than High School | 281 (12.9%) | 41.0 |
| High School Diploma | 777 (35.7%) | 58.0 |
| College or Associate's Degree | 672 (30.9%) | 40.0 |
| Bachelor's Degree | 243 (11.2%) | 24.0 |
| Graduate Degree | 201 (9.2%) | 34.0 |
| Total | 2,174 (100.0%) | 41.0 |
Fertility by Education by Marriage Status in Birmingham
47.8% of women with births in Birmingham are unmarried. Women with the educational attainment of bachelor's degree are most likely to be married with 87.6% of them married at childbirth, while women with the educational attainment of high school diploma are least likely to be married with 69.9% of them unmarried at childbirth.
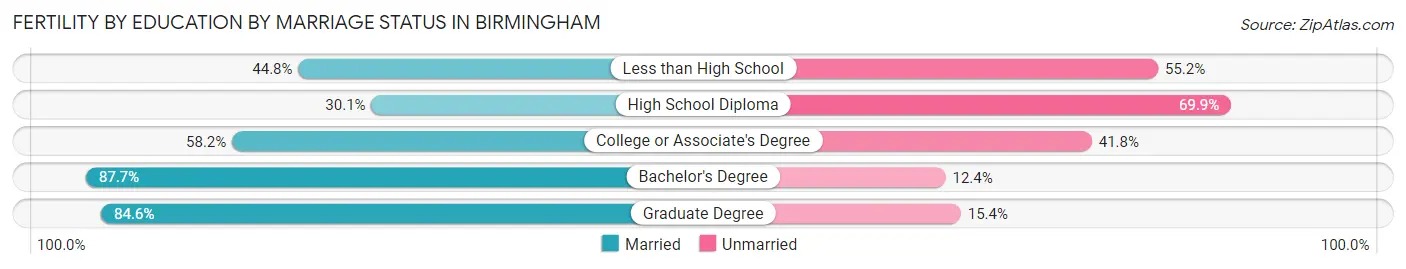
| Educational Attainment | Married | Unmarried |
| Less than High School | 126 (44.8%) | 155 (55.2%) |
| High School Diploma | 234 (30.1%) | 543 (69.9%) |
| College or Associate's Degree | 391 (58.2%) | 281 (41.8%) |
| Bachelor's Degree | 213 (87.6%) | 30 (12.3%) |
| Graduate Degree | 170 (84.6%) | 31 (15.4%) |
| Total | 1,135 (52.2%) | 1,039 (47.8%) |
Employment Characteristics in Birmingham
Employment by Class of Employer in Birmingham
Among the 86,826 employed individuals in Birmingham, private company employees (58,987 | 67.9%), not-for-profit organizations (8,324 | 9.6%), and state government employees (6,181 | 7.1%) make up the most common classes of employment.
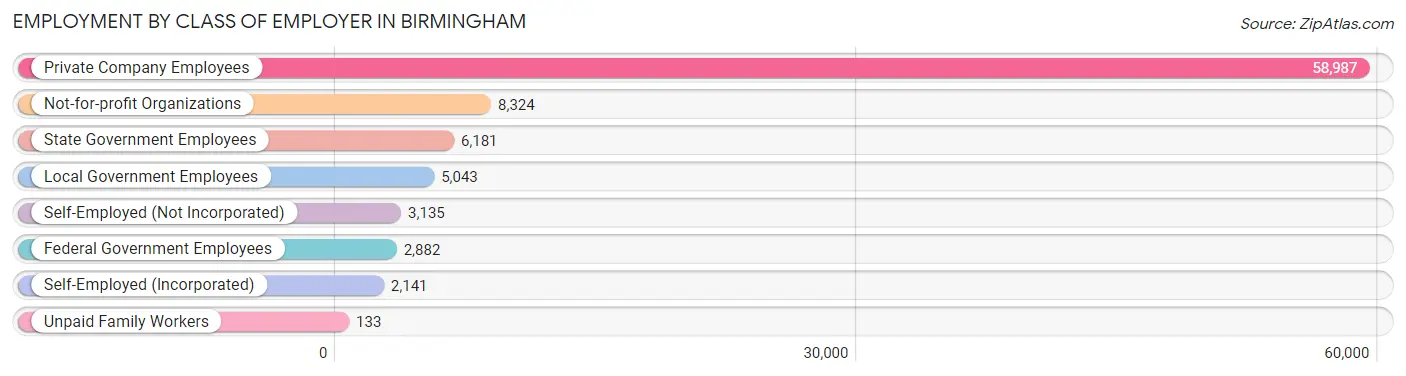
| Employer Class | # Employees | % Employees |
| Private Company Employees | 58,987 | 67.9% |
| Self-Employed (Incorporated) | 2,141 | 2.5% |
| Self-Employed (Not Incorporated) | 3,135 | 3.6% |
| Not-for-profit Organizations | 8,324 | 9.6% |
| Local Government Employees | 5,043 | 5.8% |
| State Government Employees | 6,181 | 7.1% |
| Federal Government Employees | 2,882 | 3.3% |
| Unpaid Family Workers | 133 | 0.2% |
| Total | 86,826 | 100.0% |
Employment Status by Age in Birmingham
According to the labor force statistics for Birmingham, out of the total population over 16 years of age (165,576), 57.9% or 95,869 individuals are in the labor force, with 7.5% or 7,190 of them unemployed. The age group with the highest labor force participation rate is 25 to 29 years, with 81.5% or 15,333 individuals in the labor force. Within the labor force, the 16 to 19 years age range has the highest percentage of unemployed individuals, with 17.1% or 575 of them being unemployed.
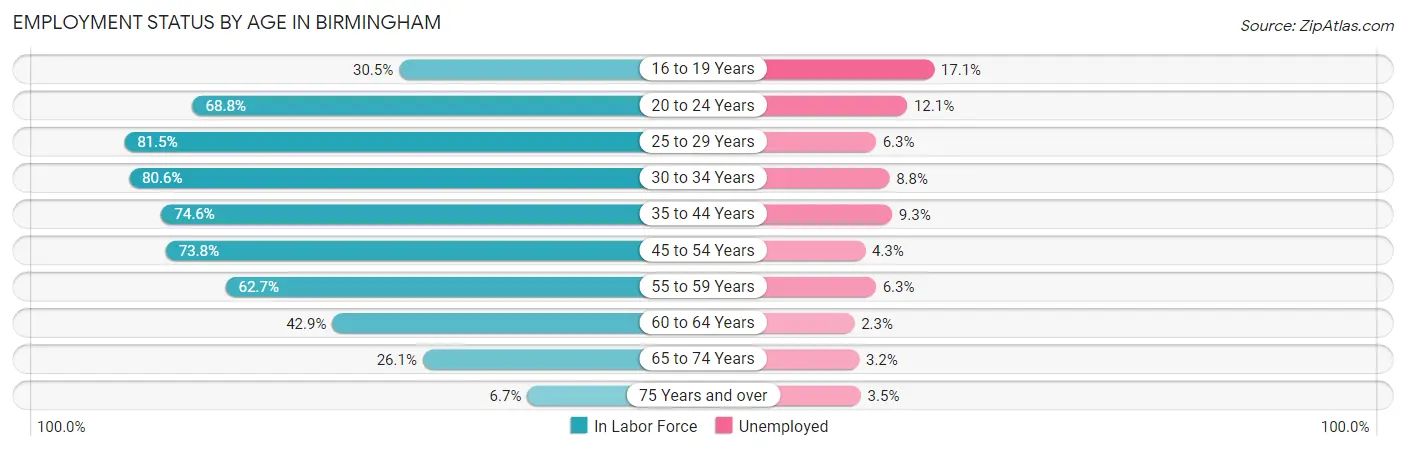
| Age Bracket | In Labor Force | Unemployed |
| 16 to 19 Years | 3,362 (30.5%) | 575 (17.1%) |
| 20 to 24 Years | 11,433 (68.8%) | 1,383 (12.1%) |
| 25 to 29 Years | 15,333 (81.5%) | 966 (6.3%) |
| 30 to 34 Years | 13,039 (80.6%) | 1,147 (8.8%) |
| 35 to 44 Years | 17,685 (74.6%) | 1,645 (9.3%) |
| 45 to 54 Years | 15,523 (73.8%) | 667 (4.3%) |
| 55 to 59 Years | 7,212 (62.7%) | 454 (6.3%) |
| 60 to 64 Years | 6,126 (42.9%) | 141 (2.3%) |
| 65 to 74 Years | 5,281 (26.1%) | 169 (3.2%) |
| 75 Years and over | 816 (6.7%) | 29 (3.5%) |
| Total | 95,869 (57.9%) | 7,190 (7.5%) |
Employment Status by Educational Attainment in Birmingham
According to labor force statistics for Birmingham, 71.0% of individuals (74,915) out of the total population between 25 and 64 years of age (105,514) are in the labor force, with 6.7% or 5,019 of them being unemployed. The group with the highest labor force participation rate are those with the educational attainment of bachelor's degree or higher, with 86.7% or 28,200 individuals in the labor force. Within the labor force, individuals with less than high school education have the highest percentage of unemployment, with 15.0% or 831 of them being unemployed.
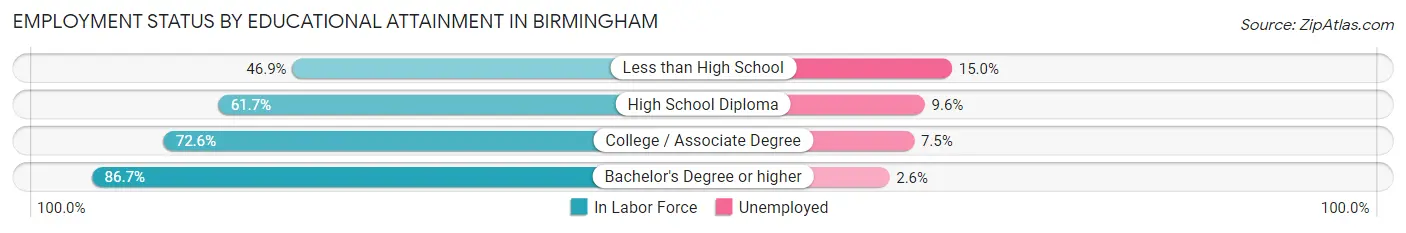
| Educational Attainment | In Labor Force | Unemployed |
| Less than High School | 5,538 (46.9%) | 1,771 (15.0%) |
| High School Diploma | 18,188 (61.7%) | 2,830 (9.6%) |
| College / Associate Degree | 23,015 (72.6%) | 2,378 (7.5%) |
| Bachelor's Degree or higher | 28,200 (86.7%) | 846 (2.6%) |
| Total | 74,915 (71.0%) | 7,069 (6.7%) |
Employment Occupations by Sex in Birmingham
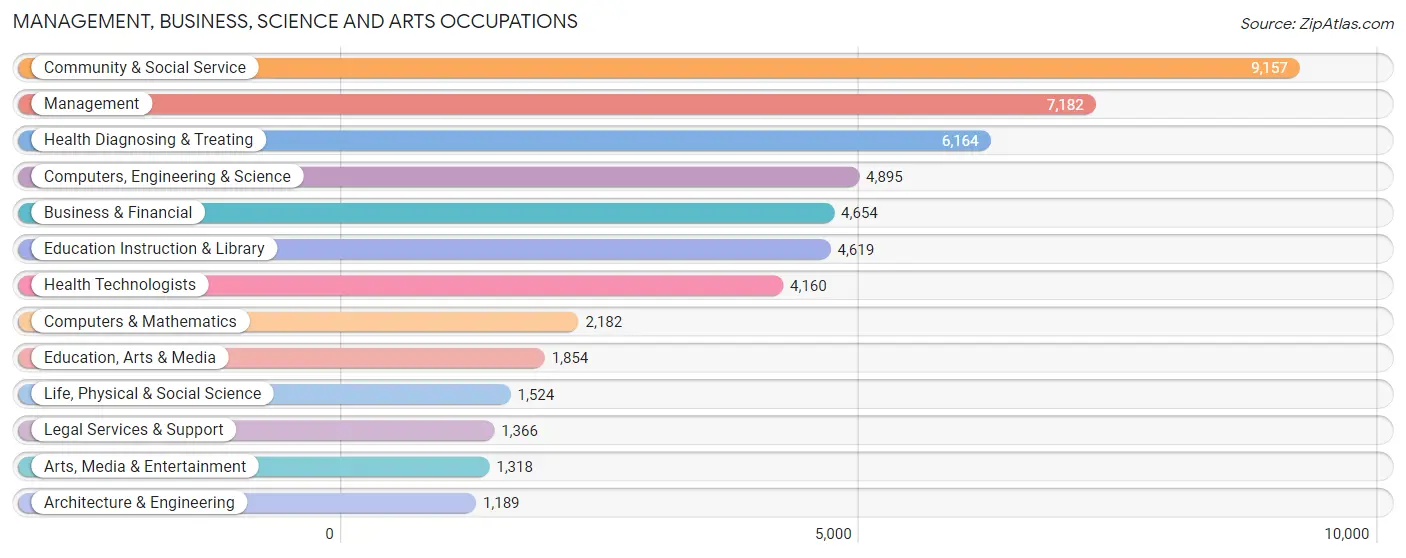
Management, Business, Science and Arts Occupations
The most common Management, Business, Science and Arts occupations in Birmingham are Community & Social Service (9,157 | 10.3%), Management (7,182 | 8.1%), Health Diagnosing & Treating (6,164 | 7.0%), Computers, Engineering & Science (4,895 | 5.5%), and Business & Financial (4,654 | 5.3%).
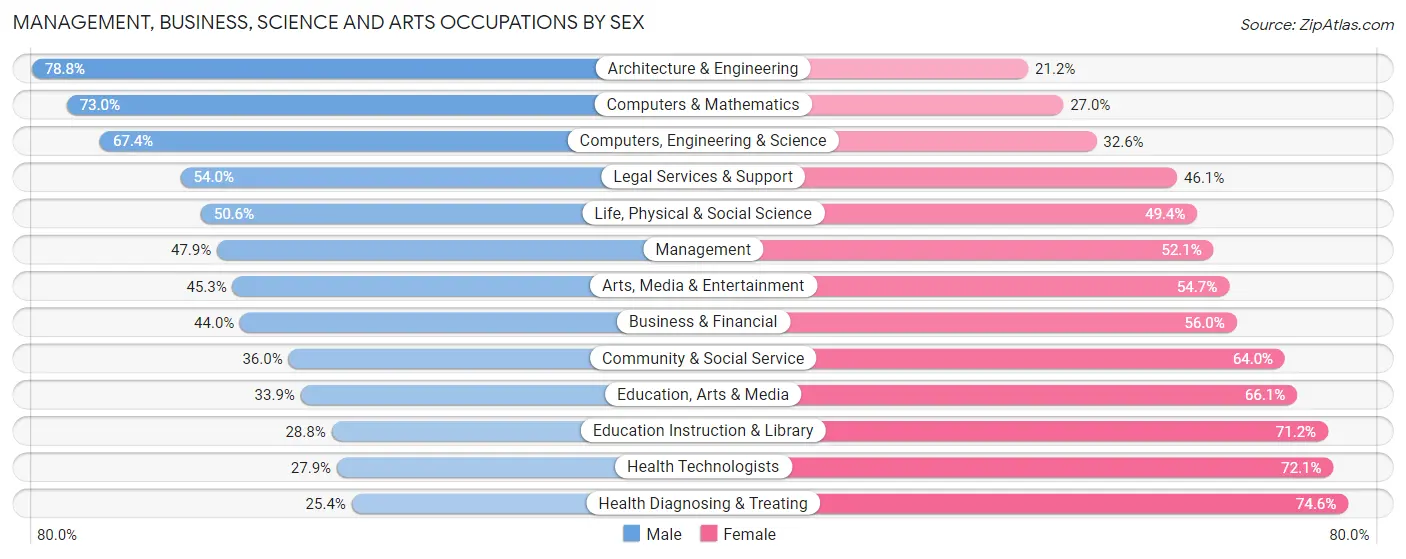
Management, Business, Science and Arts Occupations by Sex
Within the Management, Business, Science and Arts occupations in Birmingham, the most male-oriented occupations are Architecture & Engineering (78.8%), Computers & Mathematics (73.0%), and Computers, Engineering & Science (67.4%), while the most female-oriented occupations are Health Diagnosing & Treating (74.6%), Health Technologists (72.1%), and Education Instruction & Library (71.2%).
| Occupation | Male | Female |
| Management | 3,439 (47.9%) | 3,743 (52.1%) |
| Business & Financial | 2,049 (44.0%) | 2,605 (56.0%) |
| Computers, Engineering & Science | 3,300 (67.4%) | 1,595 (32.6%) |
| Computers & Mathematics | 1,592 (73.0%) | 590 (27.0%) |
| Architecture & Engineering | 937 (78.8%) | 252 (21.2%) |
| Life, Physical & Social Science | 771 (50.6%) | 753 (49.4%) |
| Community & Social Service | 3,293 (36.0%) | 5,864 (64.0%) |
| Education, Arts & Media | 629 (33.9%) | 1,225 (66.1%) |
| Legal Services & Support | 737 (53.9%) | 629 (46.1%) |
| Education Instruction & Library | 1,330 (28.8%) | 3,289 (71.2%) |
| Arts, Media & Entertainment | 597 (45.3%) | 721 (54.7%) |
| Health Diagnosing & Treating | 1,567 (25.4%) | 4,597 (74.6%) |
| Health Technologists | 1,160 (27.9%) | 3,000 (72.1%) |
| Total (Category) | 13,648 (42.6%) | 18,404 (57.4%) |
| Total (Overall) | 42,476 (48.0%) | 45,979 (52.0%) |
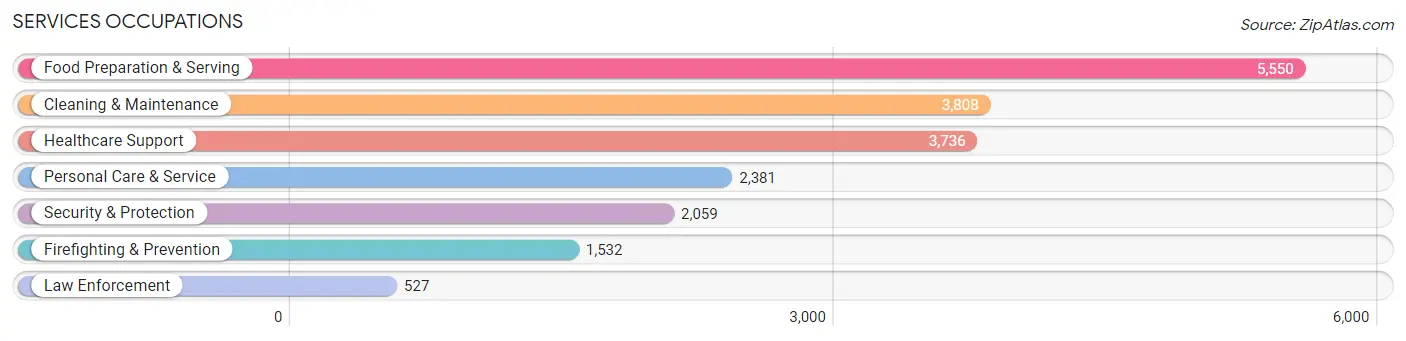
Services Occupations
The most common Services occupations in Birmingham are Food Preparation & Serving (5,550 | 6.3%), Cleaning & Maintenance (3,808 | 4.3%), Healthcare Support (3,736 | 4.2%), Personal Care & Service (2,381 | 2.7%), and Security & Protection (2,059 | 2.3%).
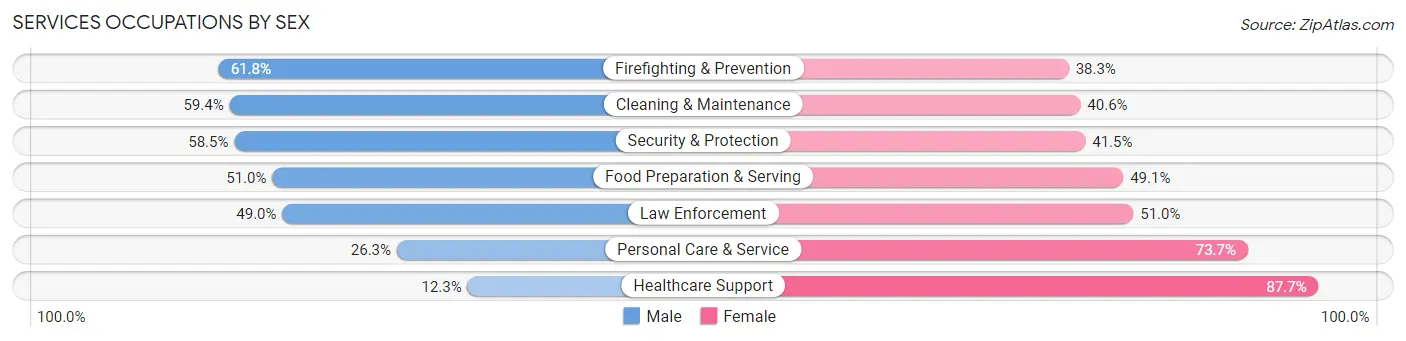
Services Occupations by Sex
Within the Services occupations in Birmingham, the most male-oriented occupations are Firefighting & Prevention (61.8%), Cleaning & Maintenance (59.4%), and Security & Protection (58.5%), while the most female-oriented occupations are Healthcare Support (87.7%), Personal Care & Service (73.7%), and Law Enforcement (51.0%).
| Occupation | Male | Female |
| Healthcare Support | 459 (12.3%) | 3,277 (87.7%) |
| Security & Protection | 1,204 (58.5%) | 855 (41.5%) |
| Firefighting & Prevention | 946 (61.8%) | 586 (38.3%) |
| Law Enforcement | 258 (49.0%) | 269 (51.0%) |
| Food Preparation & Serving | 2,828 (50.9%) | 2,722 (49.0%) |
| Cleaning & Maintenance | 2,263 (59.4%) | 1,545 (40.6%) |
| Personal Care & Service | 626 (26.3%) | 1,755 (73.7%) |
| Total (Category) | 7,380 (42.1%) | 10,154 (57.9%) |
| Total (Overall) | 42,476 (48.0%) | 45,979 (52.0%) |
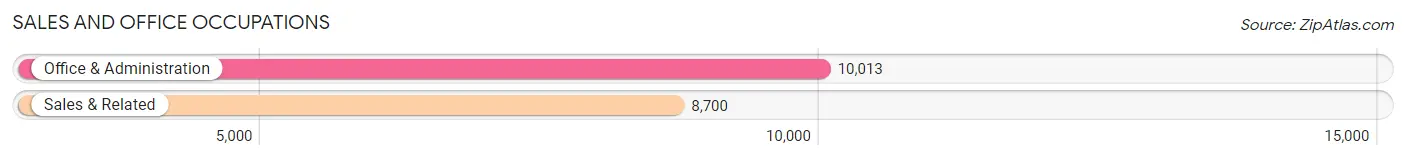
Sales and Office Occupations
The most common Sales and Office occupations in Birmingham are Office & Administration (10,013 | 11.3%), and Sales & Related (8,700 | 9.8%).
Sales and Office Occupations by Sex
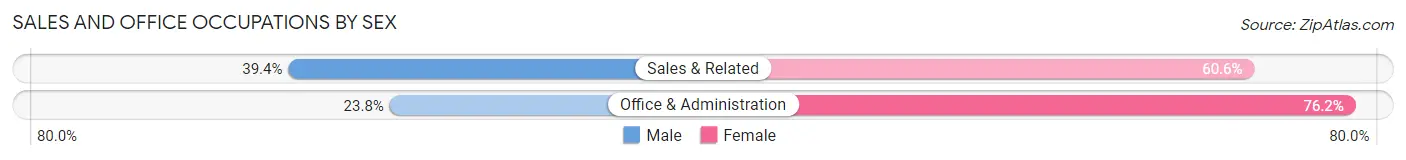
| Occupation | Male | Female |
| Sales & Related | 3,430 (39.4%) | 5,270 (60.6%) |
| Office & Administration | 2,387 (23.8%) | 7,626 (76.2%) |
| Total (Category) | 5,817 (31.1%) | 12,896 (68.9%) |
| Total (Overall) | 42,476 (48.0%) | 45,979 (52.0%) |
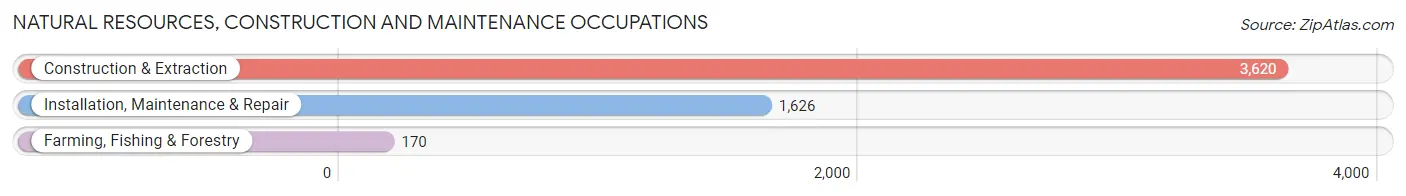
Natural Resources, Construction and Maintenance Occupations
The most common Natural Resources, Construction and Maintenance occupations in Birmingham are Construction & Extraction (3,620 | 4.1%), Installation, Maintenance & Repair (1,626 | 1.8%), and Farming, Fishing & Forestry (170 | 0.2%).
Natural Resources, Construction and Maintenance Occupations by Sex
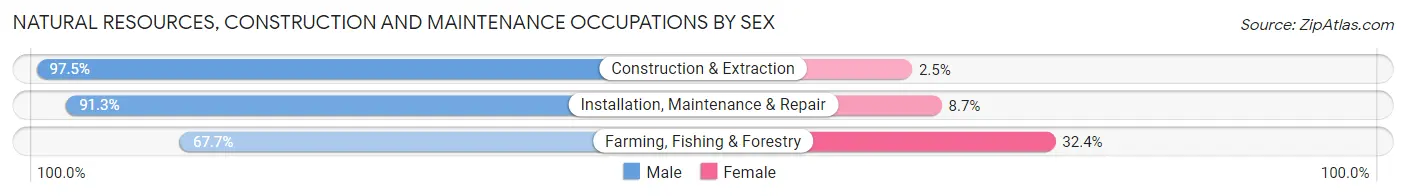
| Occupation | Male | Female |
| Farming, Fishing & Forestry | 115 (67.6%) | 55 (32.4%) |
| Construction & Extraction | 3,529 (97.5%) | 91 (2.5%) |
| Installation, Maintenance & Repair | 1,485 (91.3%) | 141 (8.7%) |
| Total (Category) | 5,129 (94.7%) | 287 (5.3%) |
| Total (Overall) | 42,476 (48.0%) | 45,979 (52.0%) |
Production, Transportation and Moving Occupations
The most common Production, Transportation and Moving occupations in Birmingham are Material Moving (5,762 | 6.5%), Production (5,545 | 6.3%), and Transportation (3,433 | 3.9%).
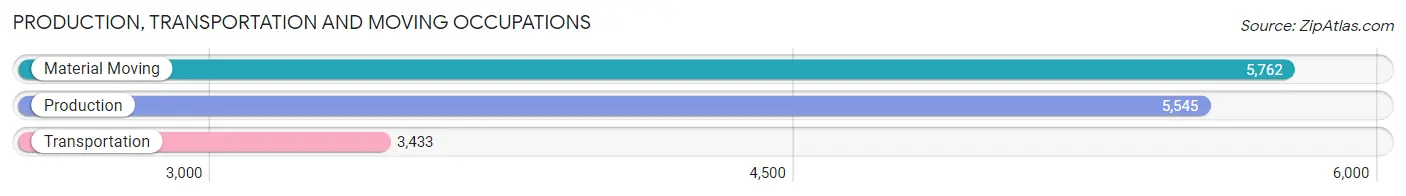
Production, Transportation and Moving Occupations by Sex
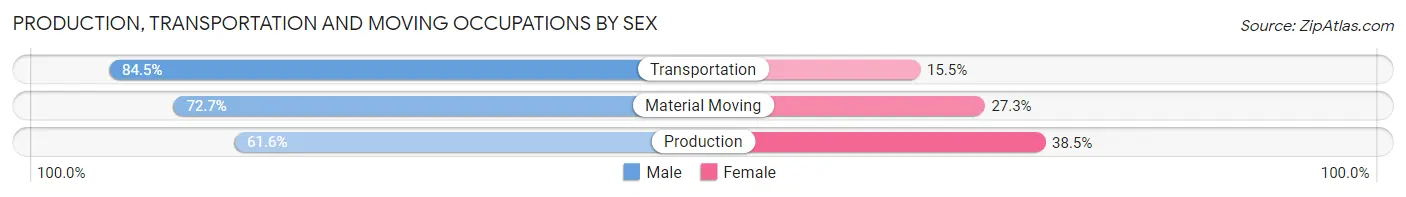
| Occupation | Male | Female |
| Production | 3,413 (61.6%) | 2,132 (38.5%) |
| Transportation | 2,901 (84.5%) | 532 (15.5%) |
| Material Moving | 4,188 (72.7%) | 1,574 (27.3%) |
| Total (Category) | 10,502 (71.3%) | 4,238 (28.7%) |
| Total (Overall) | 42,476 (48.0%) | 45,979 (52.0%) |
Employment Industries by Sex in Birmingham
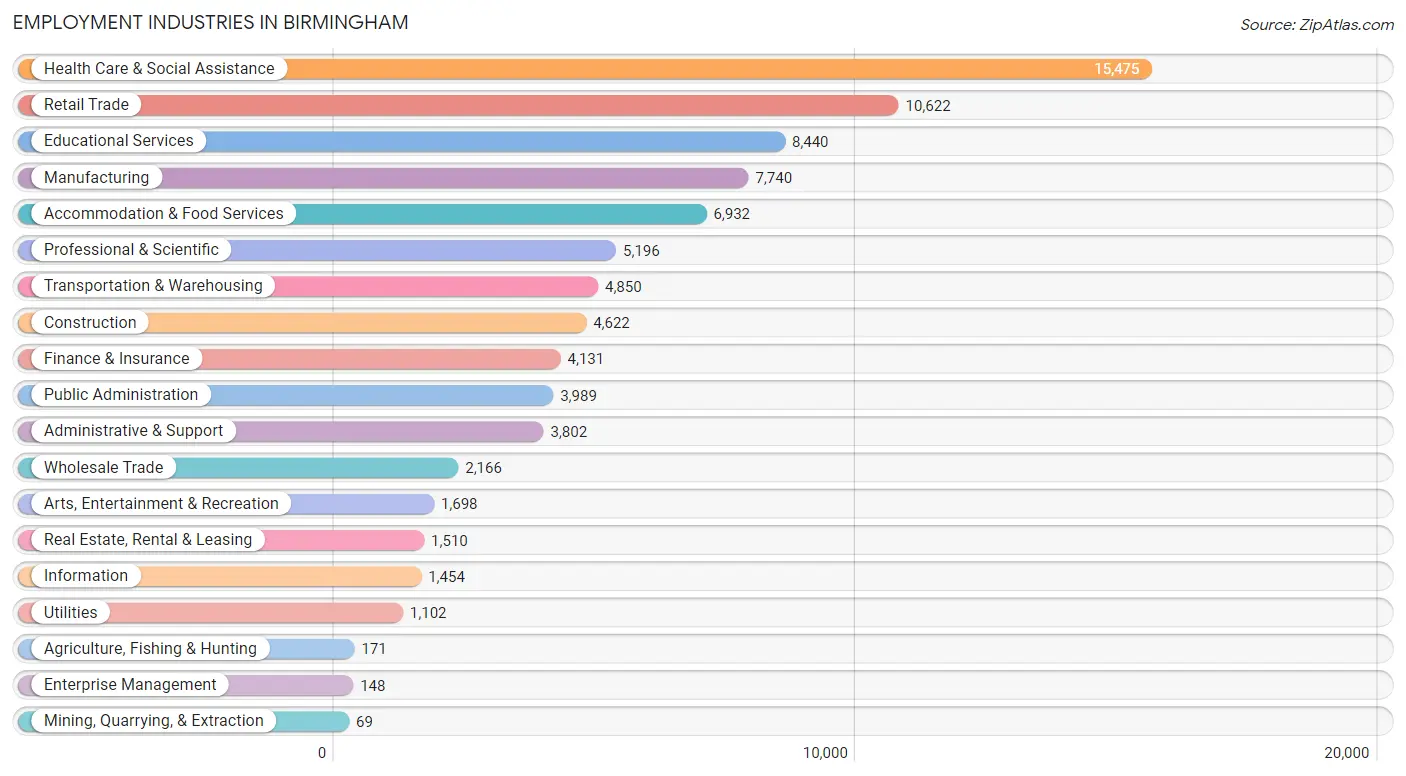
Employment Industries in Birmingham
The major employment industries in Birmingham include Health Care & Social Assistance (15,475 | 17.5%), Retail Trade (10,622 | 12.0%), Educational Services (8,440 | 9.5%), Manufacturing (7,740 | 8.7%), and Accommodation & Food Services (6,932 | 7.8%).
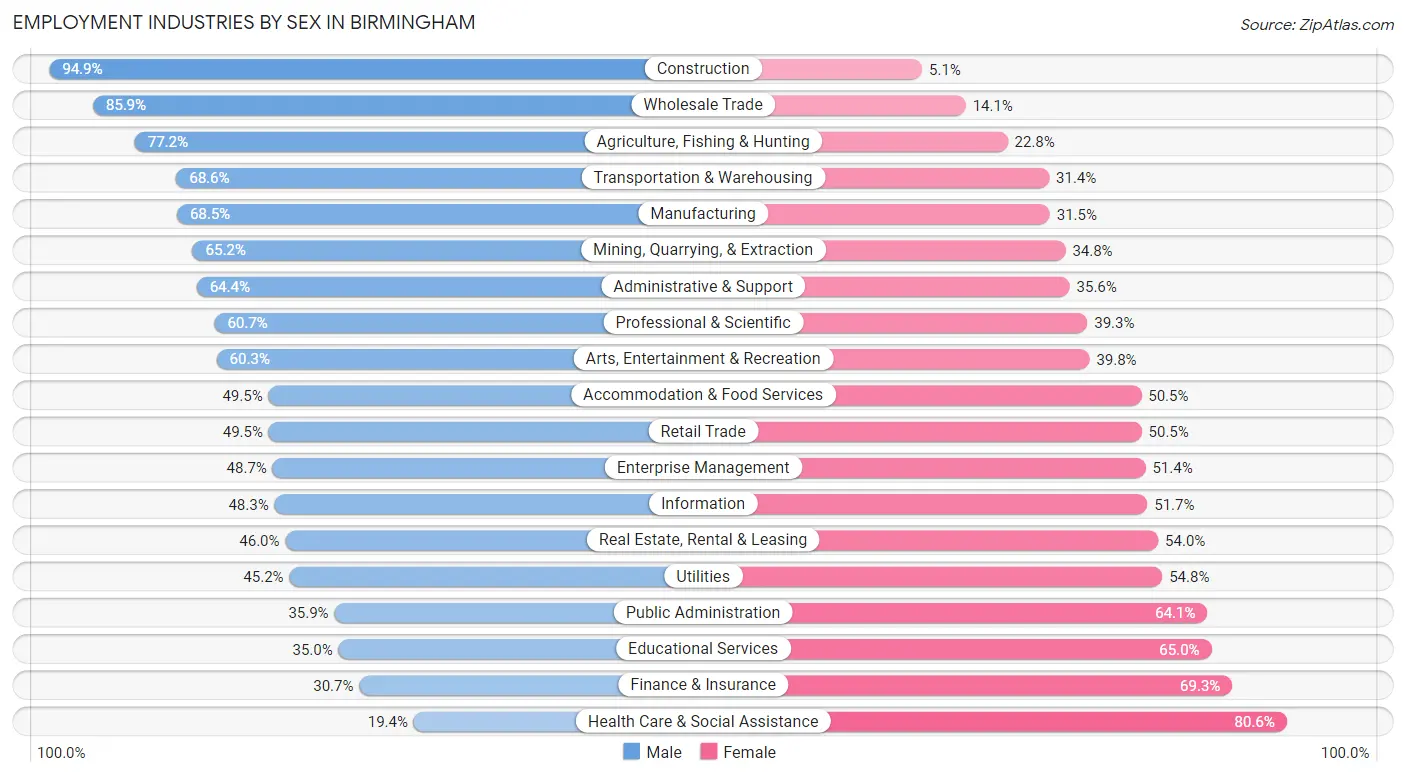
Employment Industries by Sex in Birmingham
The Birmingham industries that see more men than women are Construction (94.9%), Wholesale Trade (85.9%), and Agriculture, Fishing & Hunting (77.2%), whereas the industries that tend to have a higher number of women are Health Care & Social Assistance (80.6%), Finance & Insurance (69.3%), and Educational Services (65.0%).
| Industry | Male | Female |
| Agriculture, Fishing & Hunting | 132 (77.2%) | 39 (22.8%) |
| Mining, Quarrying, & Extraction | 45 (65.2%) | 24 (34.8%) |
| Construction | 4,386 (94.9%) | 236 (5.1%) |
| Manufacturing | 5,299 (68.5%) | 2,441 (31.5%) |
| Wholesale Trade | 1,860 (85.9%) | 306 (14.1%) |
| Retail Trade | 5,254 (49.5%) | 5,368 (50.5%) |
| Transportation & Warehousing | 3,327 (68.6%) | 1,523 (31.4%) |
| Utilities | 498 (45.2%) | 604 (54.8%) |
| Information | 702 (48.3%) | 752 (51.7%) |
| Finance & Insurance | 1,269 (30.7%) | 2,862 (69.3%) |
| Real Estate, Rental & Leasing | 695 (46.0%) | 815 (54.0%) |
| Professional & Scientific | 3,154 (60.7%) | 2,042 (39.3%) |
| Enterprise Management | 72 (48.6%) | 76 (51.3%) |
| Administrative & Support | 2,447 (64.4%) | 1,355 (35.6%) |
| Educational Services | 2,956 (35.0%) | 5,484 (65.0%) |
| Health Care & Social Assistance | 3,009 (19.4%) | 12,466 (80.6%) |
| Arts, Entertainment & Recreation | 1,023 (60.3%) | 675 (39.8%) |
| Accommodation & Food Services | 3,433 (49.5%) | 3,499 (50.5%) |
| Public Administration | 1,431 (35.9%) | 2,558 (64.1%) |
| Total | 42,476 (48.0%) | 45,979 (52.0%) |
Education in Birmingham
School Enrollment in Birmingham
The most common levels of schooling among the 48,190 students in Birmingham are college / undergraduate (13,829 | 28.7%), elementary school (8,723 | 18.1%), and middle school (8,179 | 17.0%).
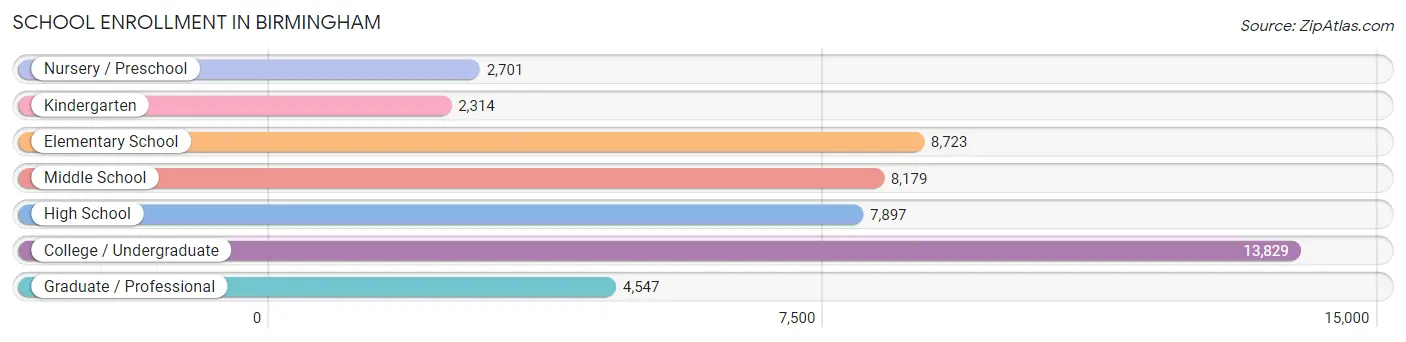
| School Level | # Students | % Students |
| Nursery / Preschool | 2,701 | 5.6% |
| Kindergarten | 2,314 | 4.8% |
| Elementary School | 8,723 | 18.1% |
| Middle School | 8,179 | 17.0% |
| High School | 7,897 | 16.4% |
| College / Undergraduate | 13,829 | 28.7% |
| Graduate / Professional | 4,547 | 9.4% |
| Total | 48,190 | 100.0% |
School Enrollment by Age by Funding Source in Birmingham
Out of a total of 48,190 students who are enrolled in schools in Birmingham, 8,000 (16.6%) attend a private institution, while the remaining 40,190 (83.4%) are enrolled in public schools. The age group of 20 to 24 year olds has the highest likelihood of being enrolled in private schools, with 1,731 (24.3% in the age bracket) enrolled. Conversely, the age group of 18 to 19 year olds has the lowest likelihood of being enrolled in a private school, with 4,951 (87.7% in the age bracket) attending a public institution.
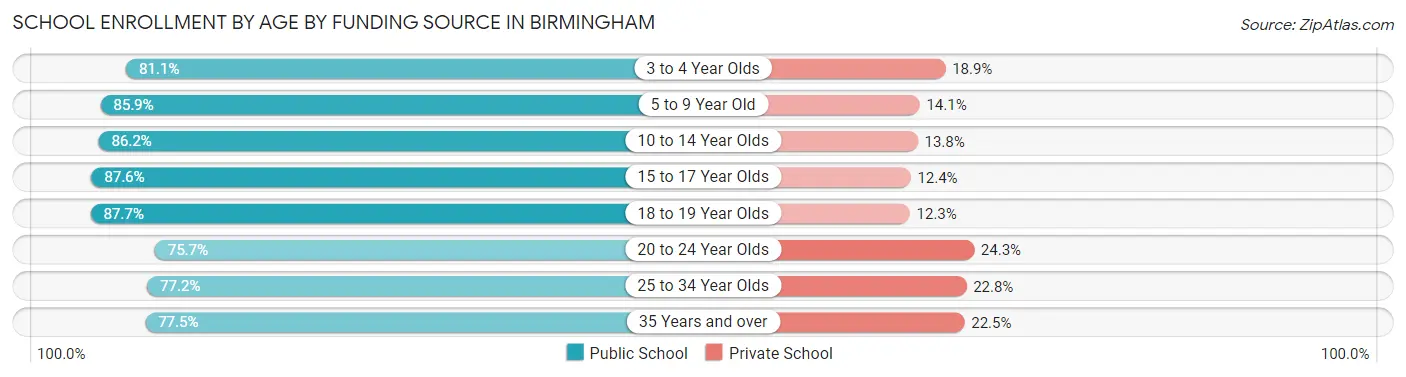
| Age Bracket | Public School | Private School |
| 3 to 4 Year Olds | 1,831 (81.1%) | 427 (18.9%) |
| 5 to 9 Year Old | 8,957 (85.9%) | 1,473 (14.1%) |
| 10 to 14 Year Olds | 8,758 (86.2%) | 1,397 (13.8%) |
| 15 to 17 Year Olds | 4,814 (87.6%) | 684 (12.4%) |
| 18 to 19 Year Olds | 4,951 (87.7%) | 693 (12.3%) |
| 20 to 24 Year Olds | 5,405 (75.7%) | 1,731 (24.3%) |
| 25 to 34 Year Olds | 3,003 (77.2%) | 888 (22.8%) |
| 35 Years and over | 2,464 (77.5%) | 714 (22.5%) |
| Total | 40,190 (83.4%) | 8,000 (16.6%) |
Educational Attainment by Field of Study in Birmingham
Business (10,260 | 23.5%), bio, nature & agricultural (4,213 | 9.7%), science & technology (4,094 | 9.4%), education (3,924 | 9.0%), and social sciences (2,637 | 6.0%) are the most common fields of study among 43,597 individuals in Birmingham who have obtained a bachelor's degree or higher.
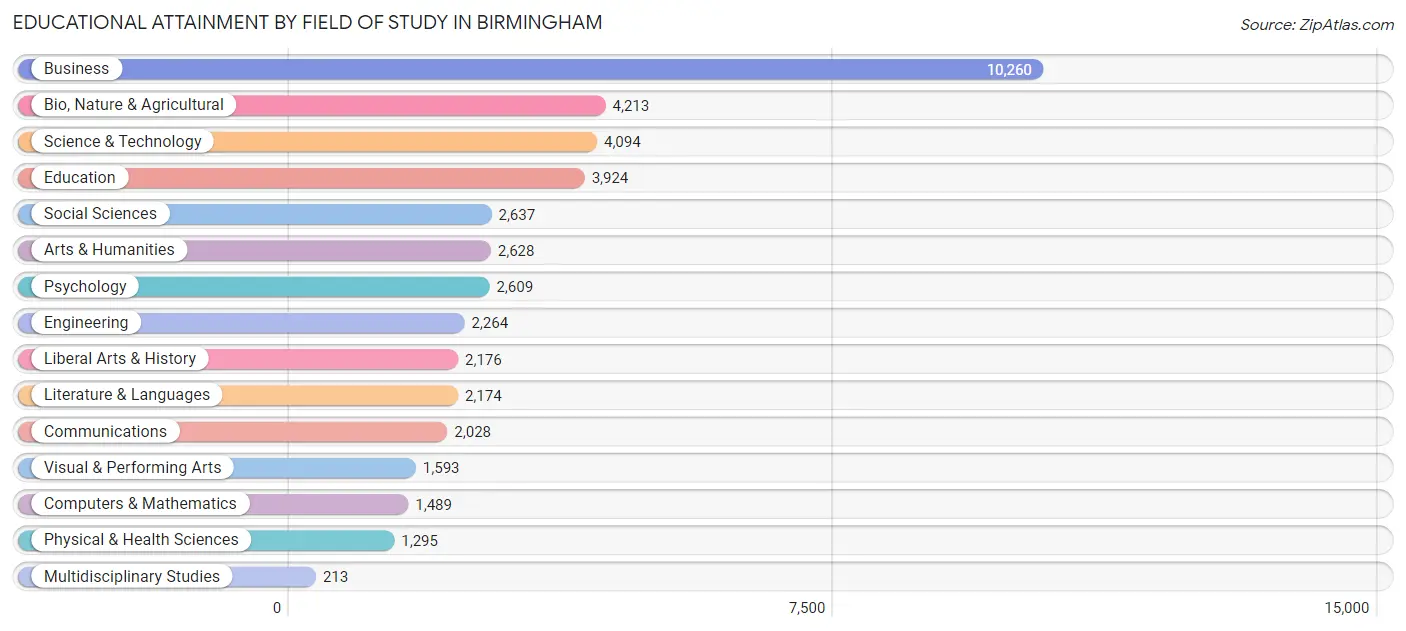
| Field of Study | # Graduates | % Graduates |
| Computers & Mathematics | 1,489 | 3.4% |
| Bio, Nature & Agricultural | 4,213 | 9.7% |
| Physical & Health Sciences | 1,295 | 3.0% |
| Psychology | 2,609 | 6.0% |
| Social Sciences | 2,637 | 6.0% |
| Engineering | 2,264 | 5.2% |
| Multidisciplinary Studies | 213 | 0.5% |
| Science & Technology | 4,094 | 9.4% |
| Business | 10,260 | 23.5% |
| Education | 3,924 | 9.0% |
| Literature & Languages | 2,174 | 5.0% |
| Liberal Arts & History | 2,176 | 5.0% |
| Visual & Performing Arts | 1,593 | 3.6% |
| Communications | 2,028 | 4.6% |
| Arts & Humanities | 2,628 | 6.0% |
| Total | 43,597 | 100.0% |
Transportation & Commute in Birmingham
Vehicle Availability by Sex in Birmingham
The most prevalent vehicle ownership categories in Birmingham are males with 2 vehicles (16,297, accounting for 39.5%) and females with 2 vehicles (15,588, making up 37.1%).
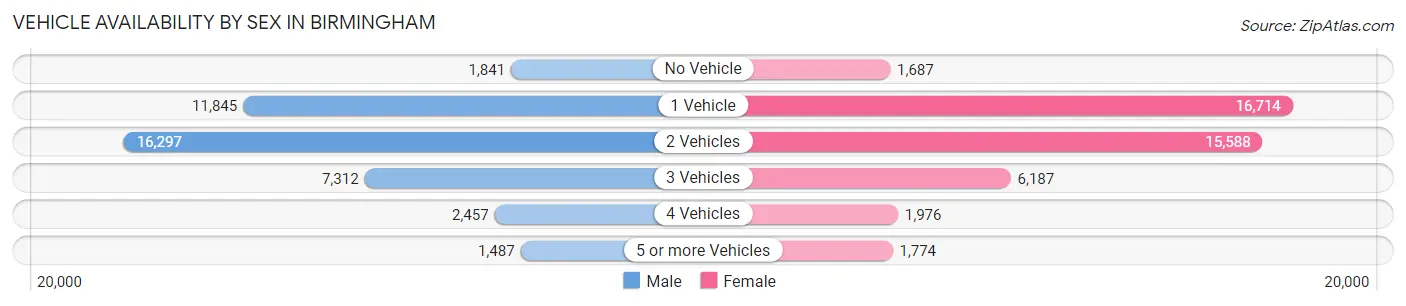
| Vehicles Available | Male | Female |
| No Vehicle | 1,841 (4.5%) | 1,687 (3.8%) |
| 1 Vehicle | 11,845 (28.7%) | 16,714 (38.1%) |
| 2 Vehicles | 16,297 (39.5%) | 15,588 (35.5%) |
| 3 Vehicles | 7,312 (17.7%) | 6,187 (14.1%) |
| 4 Vehicles | 2,457 (6.0%) | 1,976 (4.5%) |
| 5 or more Vehicles | 1,487 (3.6%) | 1,774 (4.0%) |
| Total | 41,239 (100.0%) | 43,926 (100.0%) |
Commute Time in Birmingham
The most frequently occuring commute durations in Birmingham are 15 to 19 minutes (17,660 commuters, 22.0%), 20 to 24 minutes (16,707 commuters, 20.8%), and 10 to 14 minutes (12,535 commuters, 15.6%).
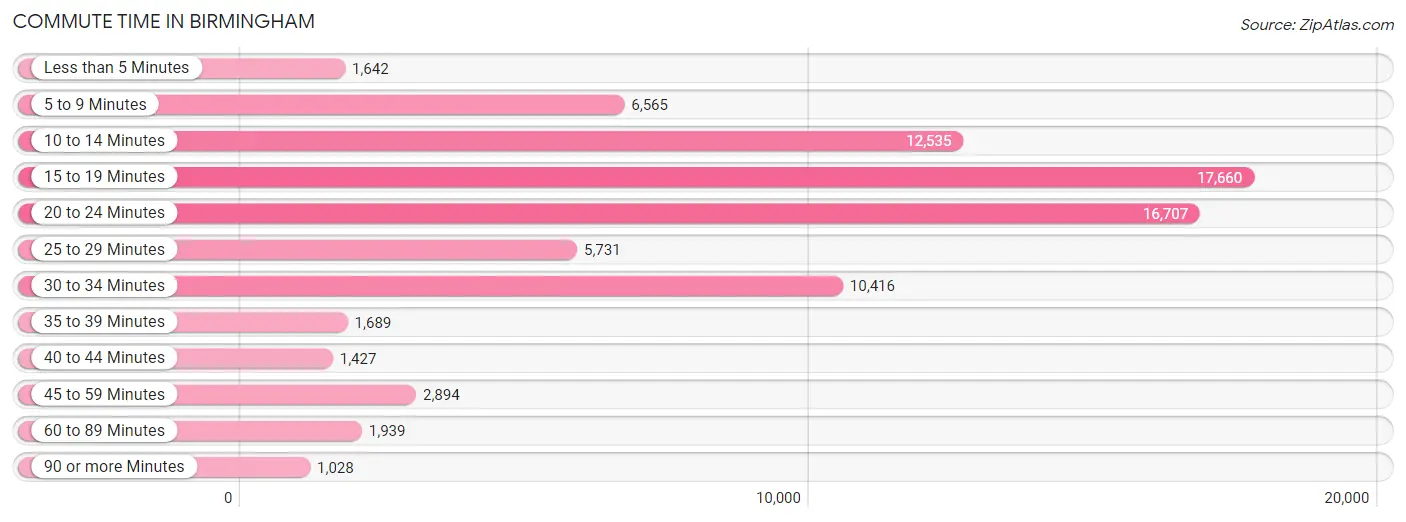
| Commute Time | # Commuters | % Commuters |
| Less than 5 Minutes | 1,642 | 2.1% |
| 5 to 9 Minutes | 6,565 | 8.2% |
| 10 to 14 Minutes | 12,535 | 15.6% |
| 15 to 19 Minutes | 17,660 | 22.0% |
| 20 to 24 Minutes | 16,707 | 20.8% |
| 25 to 29 Minutes | 5,731 | 7.1% |
| 30 to 34 Minutes | 10,416 | 13.0% |
| 35 to 39 Minutes | 1,689 | 2.1% |
| 40 to 44 Minutes | 1,427 | 1.8% |
| 45 to 59 Minutes | 2,894 | 3.6% |
| 60 to 89 Minutes | 1,939 | 2.4% |
| 90 or more Minutes | 1,028 | 1.3% |
Commute Time by Sex in Birmingham
The most common commute times in Birmingham are 15 to 19 minutes (8,096 commuters, 20.8%) for males and 15 to 19 minutes (9,564 commuters, 23.1%) for females.
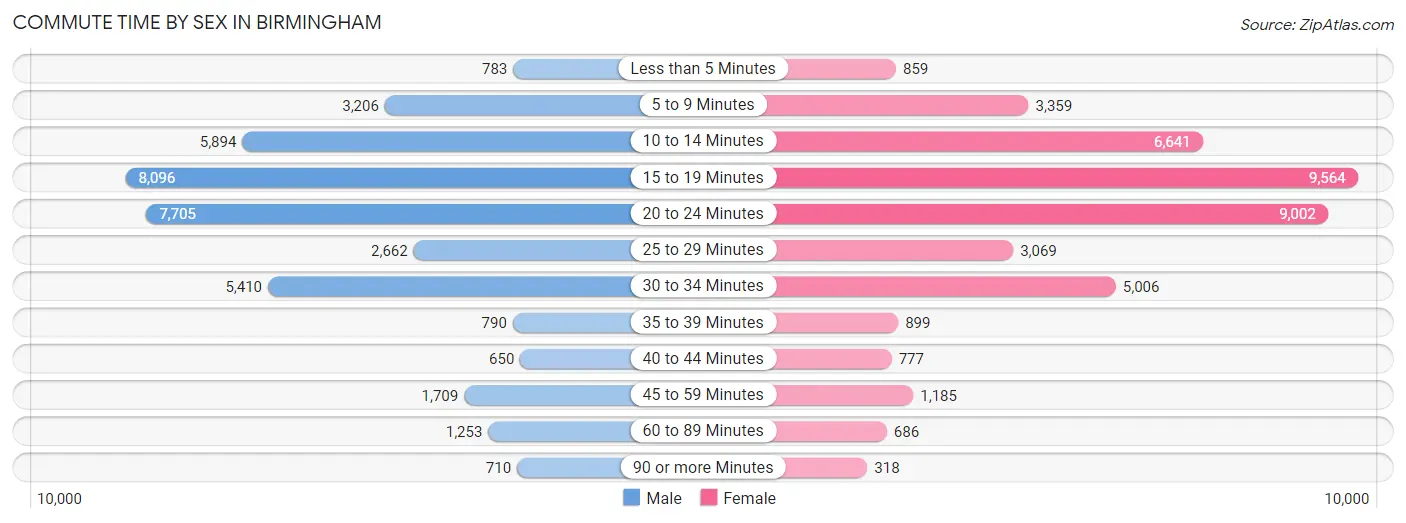
| Commute Time | Male | Female |
| Less than 5 Minutes | 783 (2.0%) | 859 (2.1%) |
| 5 to 9 Minutes | 3,206 (8.3%) | 3,359 (8.1%) |
| 10 to 14 Minutes | 5,894 (15.2%) | 6,641 (16.1%) |
| 15 to 19 Minutes | 8,096 (20.8%) | 9,564 (23.1%) |
| 20 to 24 Minutes | 7,705 (19.8%) | 9,002 (21.8%) |
| 25 to 29 Minutes | 2,662 (6.9%) | 3,069 (7.4%) |
| 30 to 34 Minutes | 5,410 (13.9%) | 5,006 (12.1%) |
| 35 to 39 Minutes | 790 (2.0%) | 899 (2.2%) |
| 40 to 44 Minutes | 650 (1.7%) | 777 (1.9%) |
| 45 to 59 Minutes | 1,709 (4.4%) | 1,185 (2.9%) |
| 60 to 89 Minutes | 1,253 (3.2%) | 686 (1.7%) |
| 90 or more Minutes | 710 (1.8%) | 318 (0.8%) |
Time of Departure to Work by Sex in Birmingham
The most frequent times of departure to work in Birmingham are 7:00 AM to 7:29 AM (5,247, 13.5%) for males and 7:30 AM to 7:59 AM (5,877, 14.2%) for females.
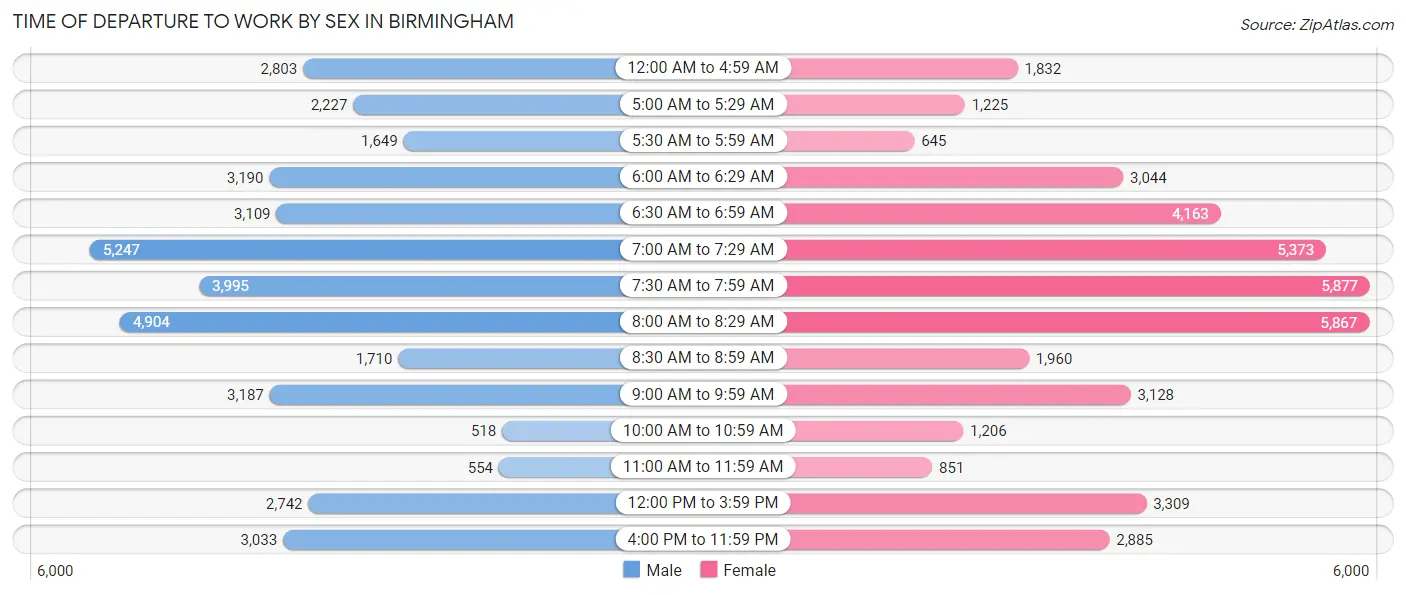
| Time of Departure | Male | Female |
| 12:00 AM to 4:59 AM | 2,803 (7.2%) | 1,832 (4.4%) |
| 5:00 AM to 5:29 AM | 2,227 (5.7%) | 1,225 (3.0%) |
| 5:30 AM to 5:59 AM | 1,649 (4.2%) | 645 (1.6%) |
| 6:00 AM to 6:29 AM | 3,190 (8.2%) | 3,044 (7.4%) |
| 6:30 AM to 6:59 AM | 3,109 (8.0%) | 4,163 (10.1%) |
| 7:00 AM to 7:29 AM | 5,247 (13.5%) | 5,373 (13.0%) |
| 7:30 AM to 7:59 AM | 3,995 (10.3%) | 5,877 (14.2%) |
| 8:00 AM to 8:29 AM | 4,904 (12.6%) | 5,867 (14.2%) |
| 8:30 AM to 8:59 AM | 1,710 (4.4%) | 1,960 (4.7%) |
| 9:00 AM to 9:59 AM | 3,187 (8.2%) | 3,128 (7.6%) |
| 10:00 AM to 10:59 AM | 518 (1.3%) | 1,206 (2.9%) |
| 11:00 AM to 11:59 AM | 554 (1.4%) | 851 (2.1%) |
| 12:00 PM to 3:59 PM | 2,742 (7.0%) | 3,309 (8.0%) |
| 4:00 PM to 11:59 PM | 3,033 (7.8%) | 2,885 (7.0%) |
| Total | 38,868 (100.0%) | 41,365 (100.0%) |
Housing Occupancy in Birmingham
Occupancy by Ownership in Birmingham
Of the total 84,999 dwellings in Birmingham, owner-occupied units account for 39,033 (45.9%), while renter-occupied units make up 45,966 (54.1%).
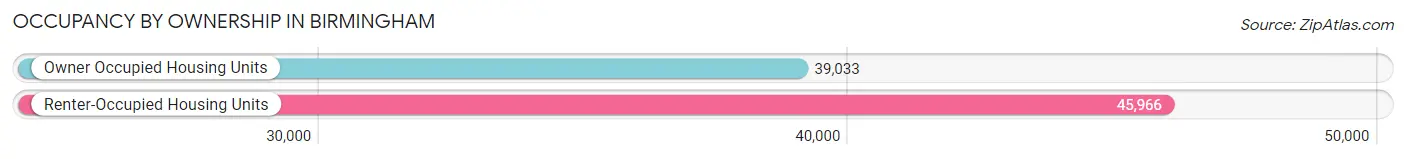
| Occupancy | # Housing Units | % Housing Units |
| Owner Occupied Housing Units | 39,033 | 45.9% |
| Renter-Occupied Housing Units | 45,966 | 54.1% |
| Total Occupied Housing Units | 84,999 | 100.0% |
Occupancy by Household Size in Birmingham
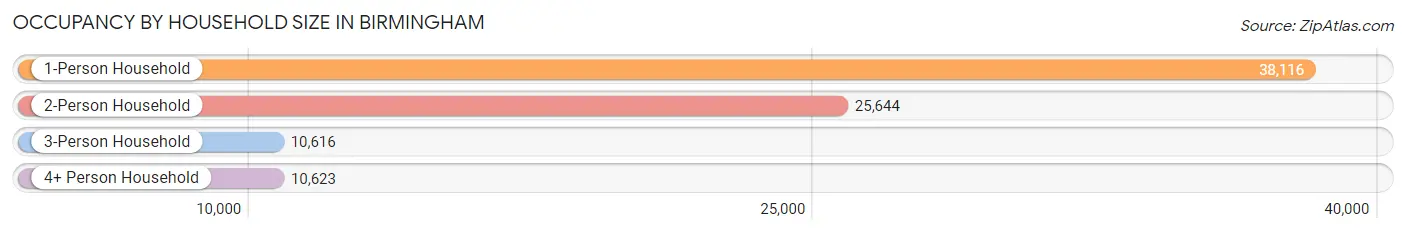
| Household Size | # Housing Units | % Housing Units |
| 1-Person Household | 38,116 | 44.8% |
| 2-Person Household | 25,644 | 30.2% |
| 3-Person Household | 10,616 | 12.5% |
| 4+ Person Household | 10,623 | 12.5% |
| Total Housing Units | 84,999 | 100.0% |
Occupancy by Ownership by Household Size in Birmingham
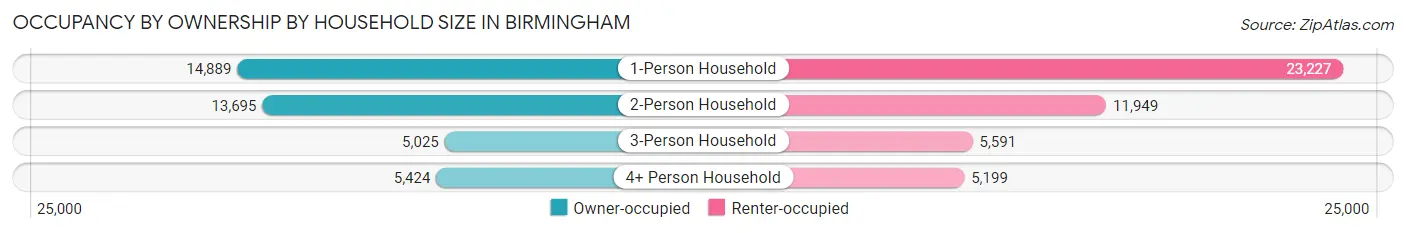
| Household Size | Owner-occupied | Renter-occupied |
| 1-Person Household | 14,889 (39.1%) | 23,227 (60.9%) |
| 2-Person Household | 13,695 (53.4%) | 11,949 (46.6%) |
| 3-Person Household | 5,025 (47.3%) | 5,591 (52.7%) |
| 4+ Person Household | 5,424 (51.1%) | 5,199 (48.9%) |
| Total Housing Units | 39,033 (45.9%) | 45,966 (54.1%) |
Occupancy by Educational Attainment in Birmingham
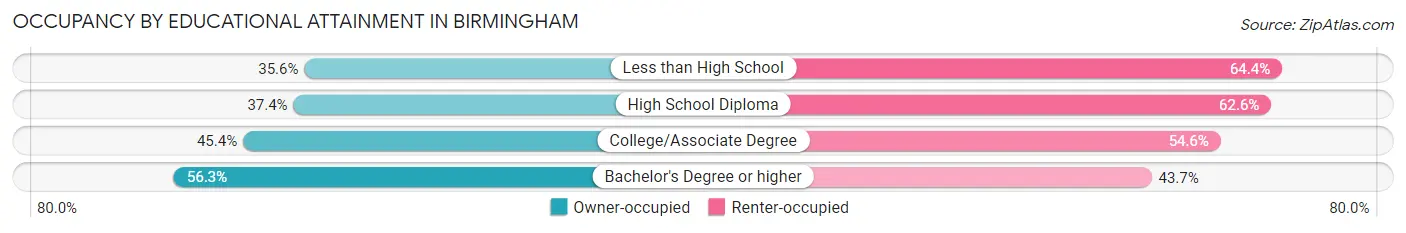
| Household Size | Owner-occupied | Renter-occupied |
| Less than High School | 3,131 (35.6%) | 5,654 (64.4%) |
| High School Diploma | 7,902 (37.4%) | 13,249 (62.6%) |
| College/Associate Degree | 12,470 (45.4%) | 15,019 (54.6%) |
| Bachelor's Degree or higher | 15,530 (56.3%) | 12,044 (43.7%) |
Occupancy by Age of Householder in Birmingham
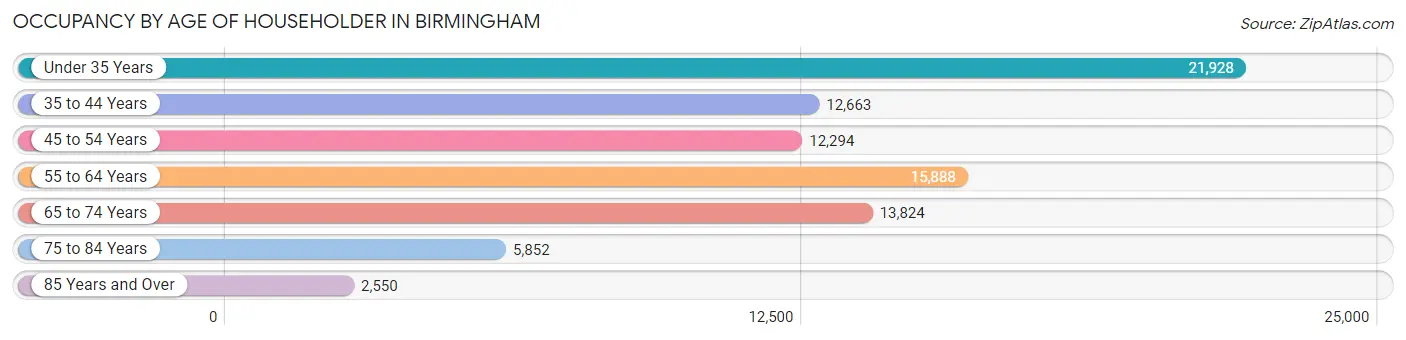
| Age Bracket | # Households | % Households |
| Under 35 Years | 21,928 | 25.8% |
| 35 to 44 Years | 12,663 | 14.9% |
| 45 to 54 Years | 12,294 | 14.5% |
| 55 to 64 Years | 15,888 | 18.7% |
| 65 to 74 Years | 13,824 | 16.3% |
| 75 to 84 Years | 5,852 | 6.9% |
| 85 Years and Over | 2,550 | 3.0% |
| Total | 84,999 | 100.0% |
Housing Finances in Birmingham
Median Income by Occupancy in Birmingham
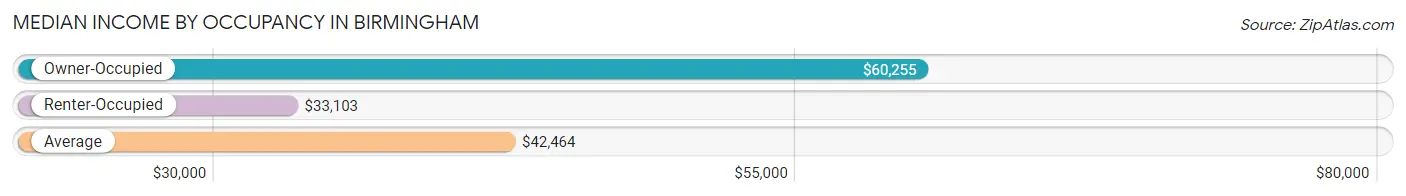
| Occupancy Type | # Households | Median Income |
| Owner-Occupied | 39,033 (45.9%) | $60,255 |
| Renter-Occupied | 45,966 (54.1%) | $33,103 |
| Average | 84,999 (100.0%) | $42,464 |
Occupancy by Householder Income Bracket in Birmingham
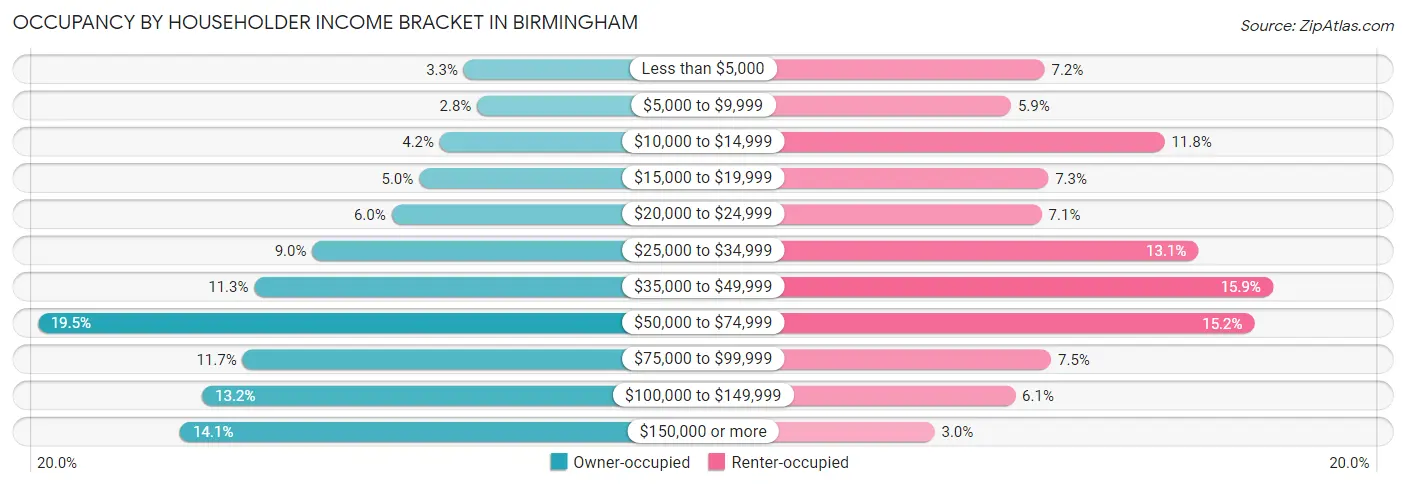
| Income Bracket | Owner-occupied | Renter-occupied |
| Less than $5,000 | 1,276 (3.3%) | 3,311 (7.2%) |
| $5,000 to $9,999 | 1,077 (2.8%) | 2,722 (5.9%) |
| $10,000 to $14,999 | 1,632 (4.2%) | 5,411 (11.8%) |
| $15,000 to $19,999 | 1,940 (5.0%) | 3,372 (7.3%) |
| $20,000 to $24,999 | 2,349 (6.0%) | 3,259 (7.1%) |
| $25,000 to $34,999 | 3,528 (9.0%) | 6,000 (13.1%) |
| $35,000 to $49,999 | 4,393 (11.3%) | 7,306 (15.9%) |
| $50,000 to $74,999 | 7,611 (19.5%) | 6,982 (15.2%) |
| $75,000 to $99,999 | 4,565 (11.7%) | 3,426 (7.4%) |
| $100,000 to $149,999 | 5,168 (13.2%) | 2,793 (6.1%) |
| $150,000 or more | 5,494 (14.1%) | 1,384 (3.0%) |
| Total | 39,033 (100.0%) | 45,966 (100.0%) |
Monthly Housing Cost Tiers in Birmingham
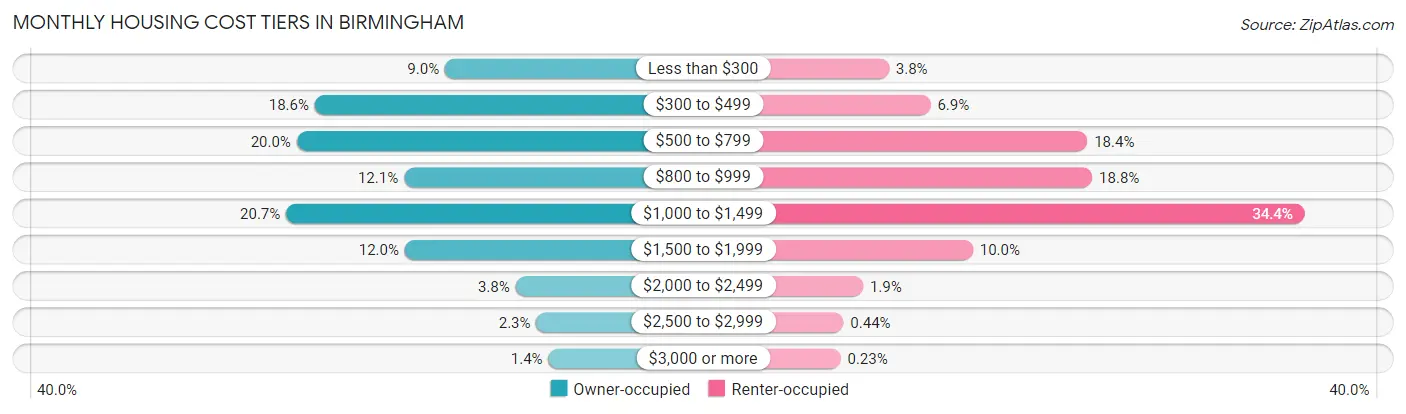
| Monthly Cost | Owner-occupied | Renter-occupied |
| Less than $300 | 3,528 (9.0%) | 1,742 (3.8%) |
| $300 to $499 | 7,272 (18.6%) | 3,147 (6.9%) |
| $500 to $799 | 7,790 (20.0%) | 8,459 (18.4%) |
| $800 to $999 | 4,709 (12.1%) | 8,625 (18.8%) |
| $1,000 to $1,499 | 8,096 (20.7%) | 15,817 (34.4%) |
| $1,500 to $1,999 | 4,683 (12.0%) | 4,581 (10.0%) |
| $2,000 to $2,499 | 1,498 (3.8%) | 863 (1.9%) |
| $2,500 to $2,999 | 903 (2.3%) | 204 (0.4%) |
| $3,000 or more | 554 (1.4%) | 106 (0.2%) |
| Total | 39,033 (100.0%) | 45,966 (100.0%) |
Physical Housing Characteristics in Birmingham
Housing Structures in Birmingham
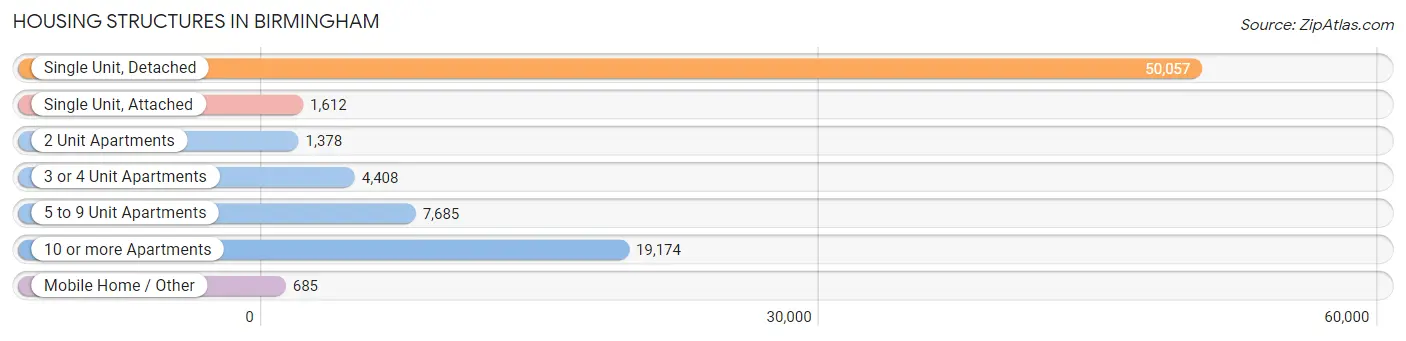
| Structure Type | # Housing Units | % Housing Units |
| Single Unit, Detached | 50,057 | 58.9% |
| Single Unit, Attached | 1,612 | 1.9% |
| 2 Unit Apartments | 1,378 | 1.6% |
| 3 or 4 Unit Apartments | 4,408 | 5.2% |
| 5 to 9 Unit Apartments | 7,685 | 9.0% |
| 10 or more Apartments | 19,174 | 22.6% |
| Mobile Home / Other | 685 | 0.8% |
| Total | 84,999 | 100.0% |
Housing Structures by Occupancy in Birmingham
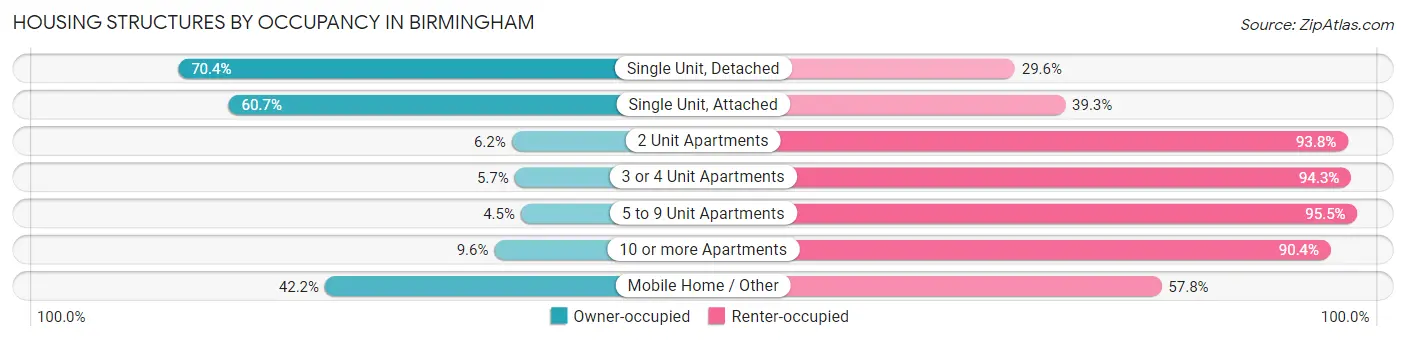
| Structure Type | Owner-occupied | Renter-occupied |
| Single Unit, Detached | 35,251 (70.4%) | 14,806 (29.6%) |
| Single Unit, Attached | 979 (60.7%) | 633 (39.3%) |
| 2 Unit Apartments | 86 (6.2%) | 1,292 (93.8%) |
| 3 or 4 Unit Apartments | 250 (5.7%) | 4,158 (94.3%) |
| 5 to 9 Unit Apartments | 343 (4.5%) | 7,342 (95.5%) |
| 10 or more Apartments | 1,835 (9.6%) | 17,339 (90.4%) |
| Mobile Home / Other | 289 (42.2%) | 396 (57.8%) |
| Total | 39,033 (45.9%) | 45,966 (54.1%) |
Housing Structures by Number of Rooms in Birmingham
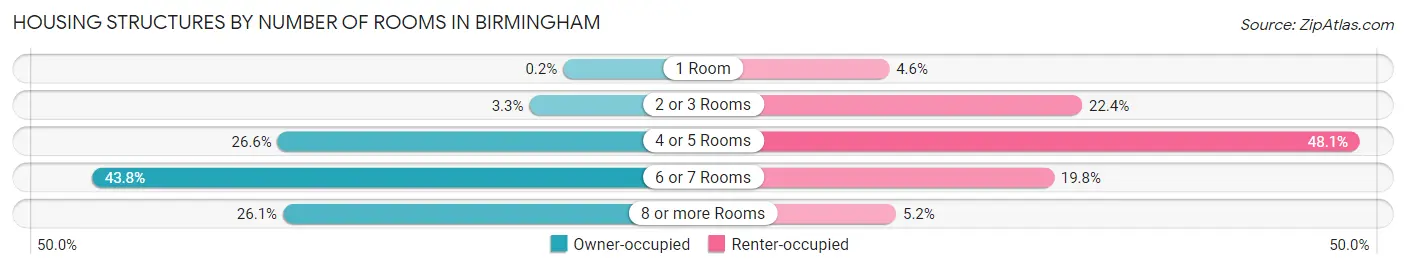
| Number of Rooms | Owner-occupied | Renter-occupied |
| 1 Room | 77 (0.2%) | 2,094 (4.6%) |
| 2 or 3 Rooms | 1,296 (3.3%) | 10,290 (22.4%) |
| 4 or 5 Rooms | 10,381 (26.6%) | 22,104 (48.1%) |
| 6 or 7 Rooms | 17,089 (43.8%) | 9,091 (19.8%) |
| 8 or more Rooms | 10,190 (26.1%) | 2,387 (5.2%) |
| Total | 39,033 (100.0%) | 45,966 (100.0%) |
Housing Structure by Heating Type in Birmingham
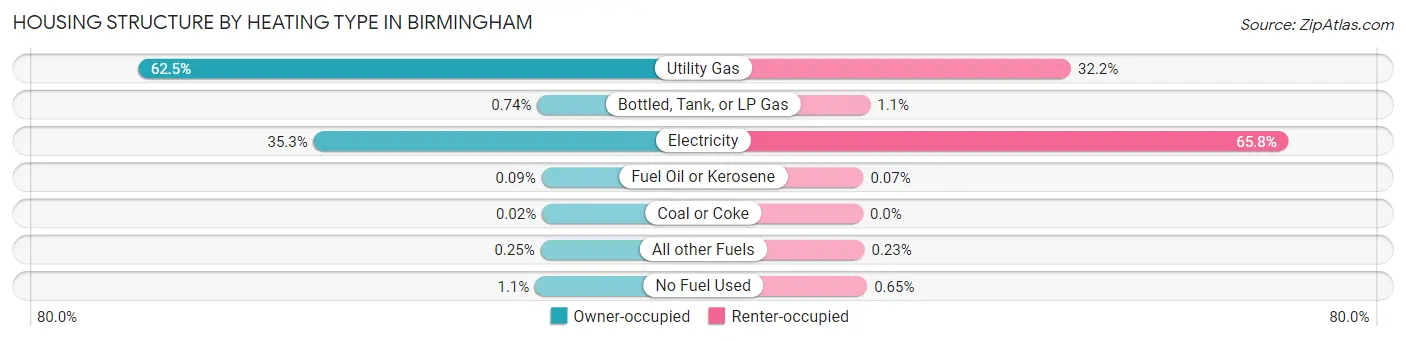
| Heating Type | Owner-occupied | Renter-occupied |
| Utility Gas | 24,394 (62.5%) | 14,778 (32.2%) |
| Bottled, Tank, or LP Gas | 287 (0.7%) | 513 (1.1%) |
| Electricity | 13,792 (35.3%) | 30,232 (65.8%) |
| Fuel Oil or Kerosene | 35 (0.1%) | 34 (0.1%) |
| Coal or Coke | 7 (0.0%) | 0 (0.0%) |
| All other Fuels | 96 (0.3%) | 108 (0.2%) |
| No Fuel Used | 422 (1.1%) | 301 (0.6%) |
| Total | 39,033 (100.0%) | 45,966 (100.0%) |
Household Vehicle Usage in Birmingham
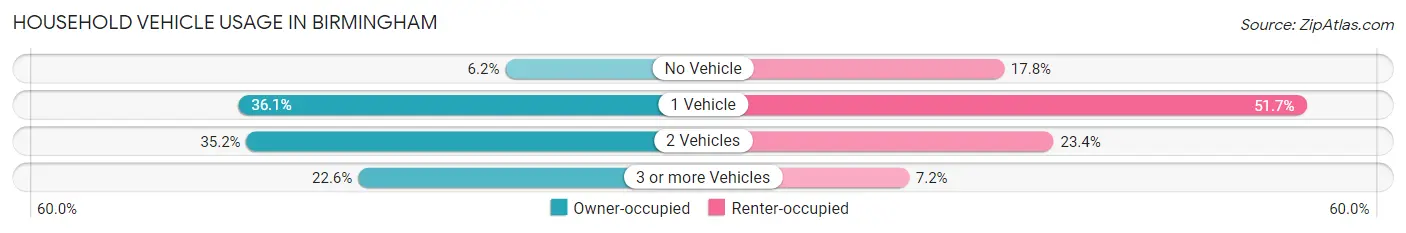
| Vehicles per Household | Owner-occupied | Renter-occupied |
| No Vehicle | 2,403 (6.2%) | 8,186 (17.8%) |
| 1 Vehicle | 14,075 (36.1%) | 23,750 (51.7%) |
| 2 Vehicles | 13,719 (35.1%) | 10,740 (23.4%) |
| 3 or more Vehicles | 8,836 (22.6%) | 3,290 (7.2%) |
| Total | 39,033 (100.0%) | 45,966 (100.0%) |
Real Estate & Mortgages in Birmingham
Real Estate and Mortgage Overview in Birmingham
| Characteristic | Without Mortgage | With Mortgage |
| Housing Units | 17,704 | 21,329 |
| Median Property Value | $92,300 | $156,000 |
| Median Household Income | $49,545 | $3,720 |
| Monthly Housing Costs | $447 | $535 |
| Real Estate Taxes | $673 | $3,365 |
Property Value by Mortgage Status in Birmingham
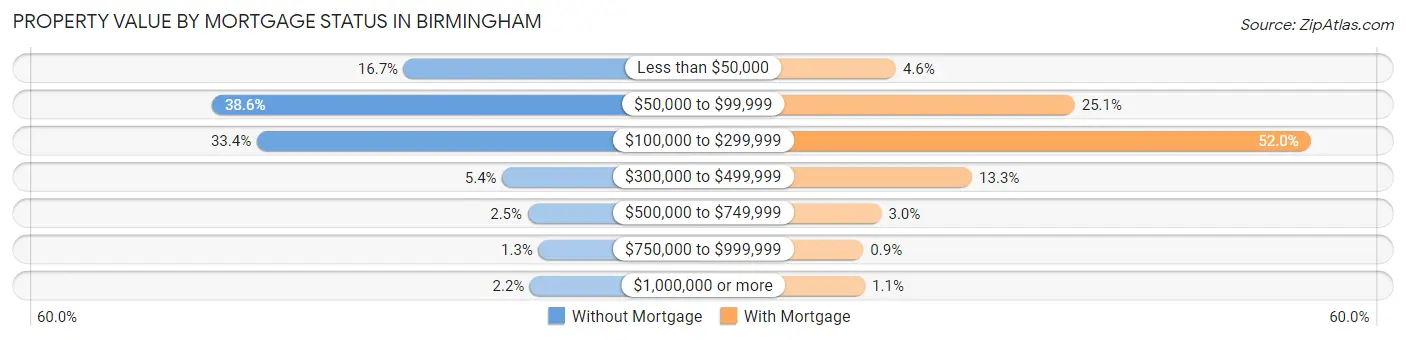
| Property Value | Without Mortgage | With Mortgage |
| Less than $50,000 | 2,947 (16.7%) | 985 (4.6%) |
| $50,000 to $99,999 | 6,830 (38.6%) | 5,346 (25.1%) |
| $100,000 to $299,999 | 5,920 (33.4%) | 11,093 (52.0%) |
| $300,000 to $499,999 | 954 (5.4%) | 2,844 (13.3%) |
| $500,000 to $749,999 | 439 (2.5%) | 634 (3.0%) |
| $750,000 to $999,999 | 221 (1.3%) | 193 (0.9%) |
| $1,000,000 or more | 393 (2.2%) | 234 (1.1%) |
| Total | 17,704 (100.0%) | 21,329 (100.0%) |
Household Income by Mortgage Status in Birmingham
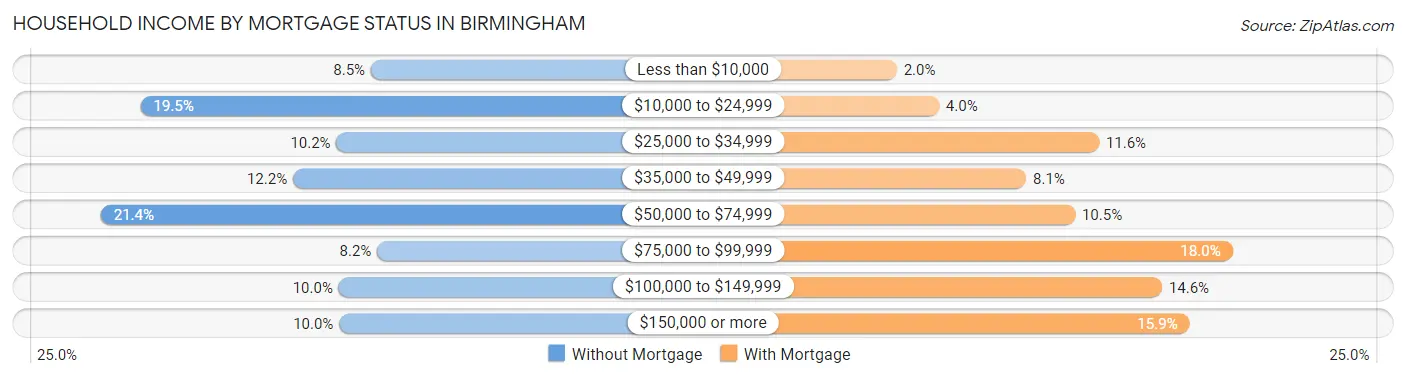
| Household Income | Without Mortgage | With Mortgage |
| Less than $10,000 | 1,506 (8.5%) | 418 (2.0%) |
| $10,000 to $24,999 | 3,449 (19.5%) | 847 (4.0%) |
| $25,000 to $34,999 | 1,797 (10.2%) | 2,472 (11.6%) |
| $35,000 to $49,999 | 2,164 (12.2%) | 1,731 (8.1%) |
| $50,000 to $74,999 | 3,783 (21.4%) | 2,229 (10.4%) |
| $75,000 to $99,999 | 1,454 (8.2%) | 3,828 (17.9%) |
| $100,000 to $149,999 | 1,777 (10.0%) | 3,111 (14.6%) |
| $150,000 or more | 1,774 (10.0%) | 3,391 (15.9%) |
| Total | 17,704 (100.0%) | 21,329 (100.0%) |
Property Value to Household Income Ratio in Birmingham
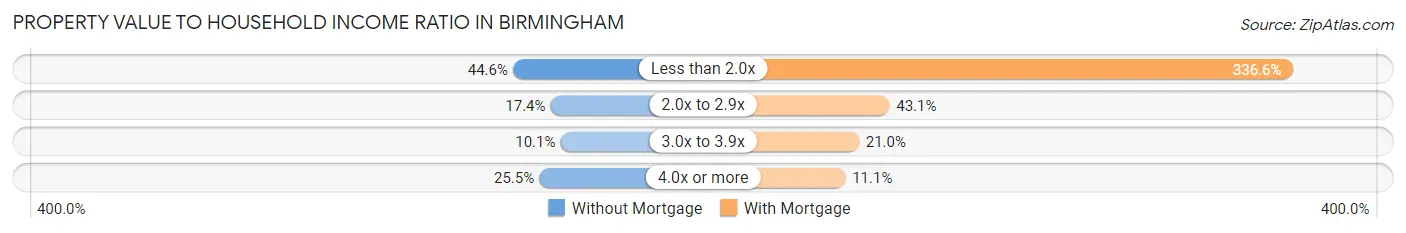
| Value-to-Income Ratio | Without Mortgage | With Mortgage |
| Less than 2.0x | 7,903 (44.6%) | 71,802 (336.6%) |
| 2.0x to 2.9x | 3,072 (17.3%) | 9,202 (43.1%) |
| 3.0x to 3.9x | 1,796 (10.1%) | 4,474 (21.0%) |
| 4.0x or more | 4,519 (25.5%) | 2,372 (11.1%) |
| Total | 17,704 (100.0%) | 21,329 (100.0%) |
Real Estate Taxes by Mortgage Status in Birmingham
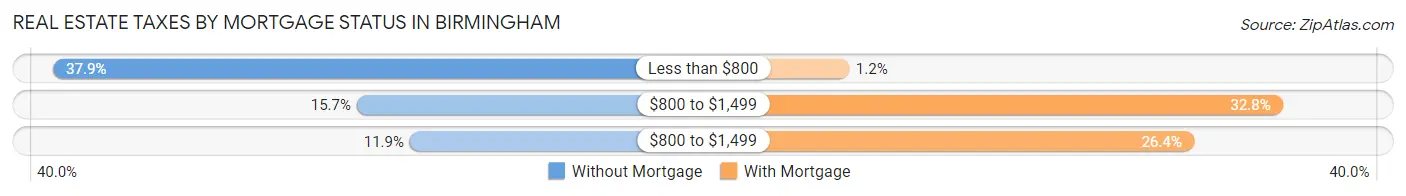
| Property Taxes | Without Mortgage | With Mortgage |
| Less than $800 | 6,711 (37.9%) | 247 (1.2%) |
| $800 to $1,499 | 2,784 (15.7%) | 7,005 (32.8%) |
| $800 to $1,499 | 2,100 (11.9%) | 5,621 (26.4%) |
| Total | 17,704 (100.0%) | 21,329 (100.0%) |
Health & Disability in Birmingham
Health Insurance Coverage by Age in Birmingham
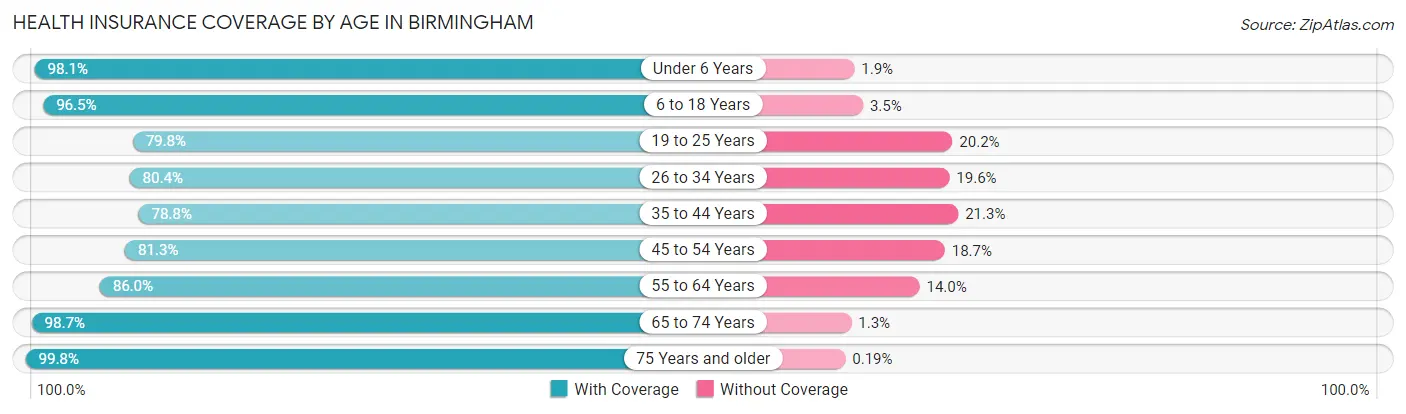
| Age Bracket | With Coverage | Without Coverage |
| Under 6 Years | 12,682 (98.1%) | 243 (1.9%) |
| 6 to 18 Years | 28,540 (96.5%) | 1,029 (3.5%) |
| 19 to 25 Years | 18,511 (79.8%) | 4,675 (20.2%) |
| 26 to 34 Years | 24,818 (80.4%) | 6,052 (19.6%) |
| 35 to 44 Years | 18,338 (78.7%) | 4,947 (21.2%) |
| 45 to 54 Years | 16,852 (81.3%) | 3,886 (18.7%) |
| 55 to 64 Years | 21,855 (86.0%) | 3,568 (14.0%) |
| 65 to 74 Years | 19,619 (98.7%) | 262 (1.3%) |
| 75 Years and older | 11,188 (99.8%) | 21 (0.2%) |
| Total | 172,403 (87.5%) | 24,683 (12.5%) |
Health Insurance Coverage by Citizenship Status in Birmingham
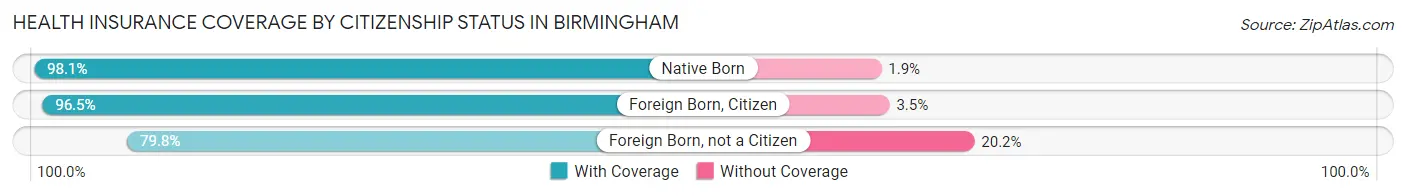
| Citizenship Status | With Coverage | Without Coverage |
| Native Born | 12,682 (98.1%) | 243 (1.9%) |
| Foreign Born, Citizen | 28,540 (96.5%) | 1,029 (3.5%) |
| Foreign Born, not a Citizen | 18,511 (79.8%) | 4,675 (20.2%) |
Health Insurance Coverage by Household Income in Birmingham
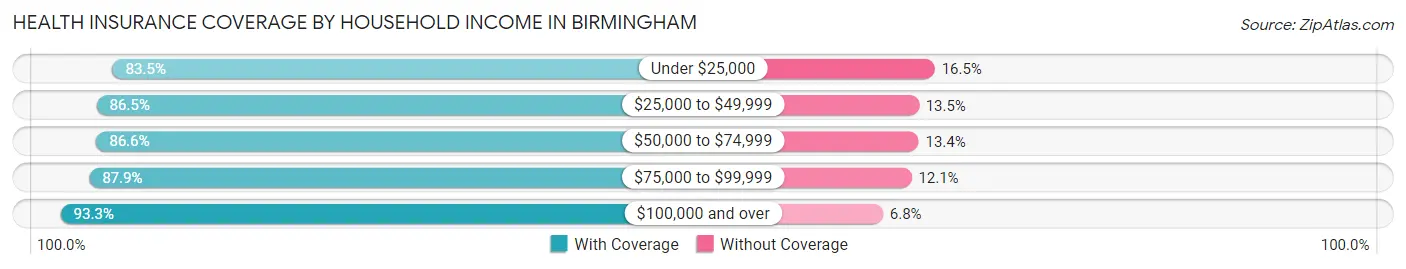
| Household Income | With Coverage | Without Coverage |
| Under $25,000 | 39,648 (83.5%) | 7,817 (16.5%) |
| $25,000 to $49,999 | 40,252 (86.5%) | 6,268 (13.5%) |
| $50,000 to $74,999 | 27,398 (86.6%) | 4,254 (13.4%) |
| $75,000 to $99,999 | 17,754 (87.9%) | 2,447 (12.1%) |
| $100,000 and over | 40,394 (93.2%) | 2,925 (6.8%) |
Public vs Private Health Insurance Coverage by Age in Birmingham

| Age Bracket | Public Insurance | Private Insurance |
| Under 6 | 10,017 (77.5%) | 2,978 (23.0%) |
| 6 to 18 Years | 20,172 (68.2%) | 9,537 (32.3%) |
| 19 to 25 Years | 3,080 (13.3%) | 15,807 (68.2%) |
| 25 to 34 Years | 5,159 (16.7%) | 20,846 (67.5%) |
| 35 to 44 Years | 5,775 (24.8%) | 13,697 (58.8%) |
| 45 to 54 Years | 4,959 (23.9%) | 12,805 (61.8%) |
| 55 to 64 Years | 9,021 (35.5%) | 14,835 (58.4%) |
| 65 to 74 Years | 18,619 (93.6%) | 9,724 (48.9%) |
| 75 Years and over | 11,100 (99.0%) | 5,049 (45.0%) |
| Total | 87,902 (44.6%) | 105,278 (53.4%) |
Disability Status by Sex by Age in Birmingham
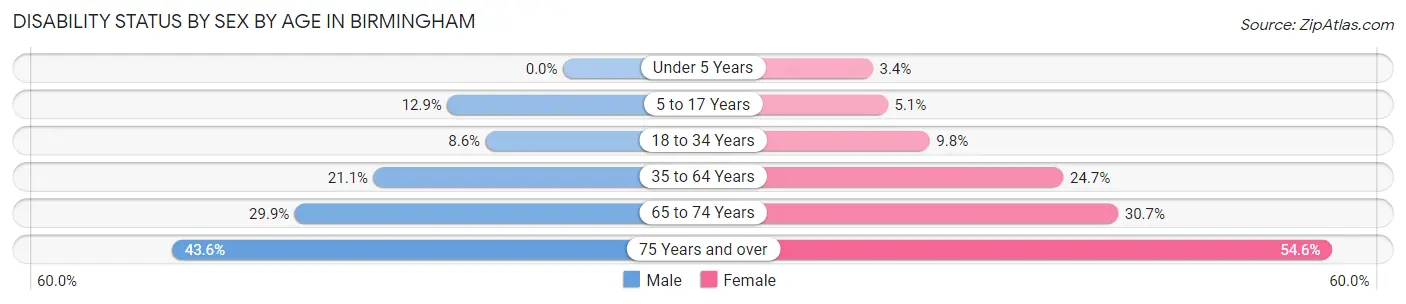
| Age Bracket | Male | Female |
| Under 5 Years | 0 (0.0%) | 181 (3.4%) |
| 5 to 17 Years | 1,879 (12.9%) | 692 (5.1%) |
| 18 to 34 Years | 2,324 (8.6%) | 2,999 (9.8%) |
| 35 to 64 Years | 6,831 (21.1%) | 9,140 (24.6%) |
| 65 to 74 Years | 2,682 (29.9%) | 3,352 (30.7%) |
| 75 Years and over | 1,730 (43.6%) | 3,955 (54.6%) |
Disability Class by Sex by Age in Birmingham
Disability Class: Hearing Difficulty
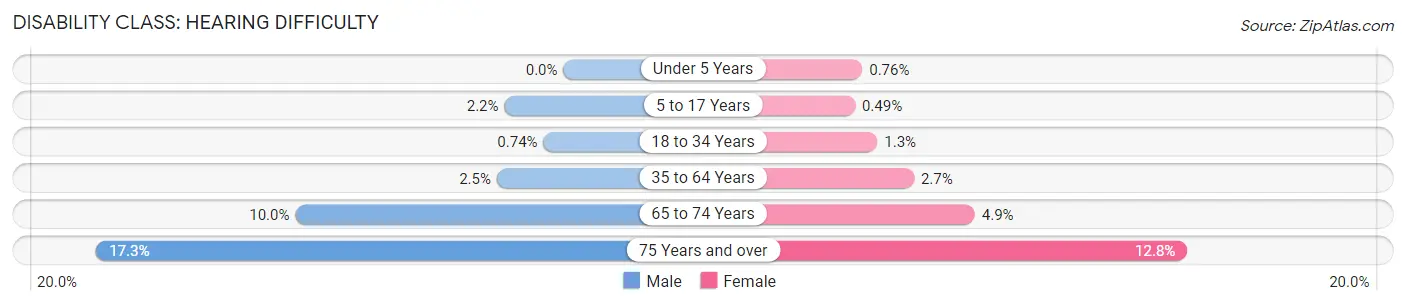
| Age Bracket | Male | Female |
| Under 5 Years | 0 (0.0%) | 40 (0.8%) |
| 5 to 17 Years | 319 (2.2%) | 66 (0.5%) |
| 18 to 34 Years | 200 (0.7%) | 405 (1.3%) |
| 35 to 64 Years | 799 (2.5%) | 993 (2.7%) |
| 65 to 74 Years | 893 (10.0%) | 539 (4.9%) |
| 75 Years and over | 688 (17.3%) | 928 (12.8%) |
Disability Class: Vision Difficulty
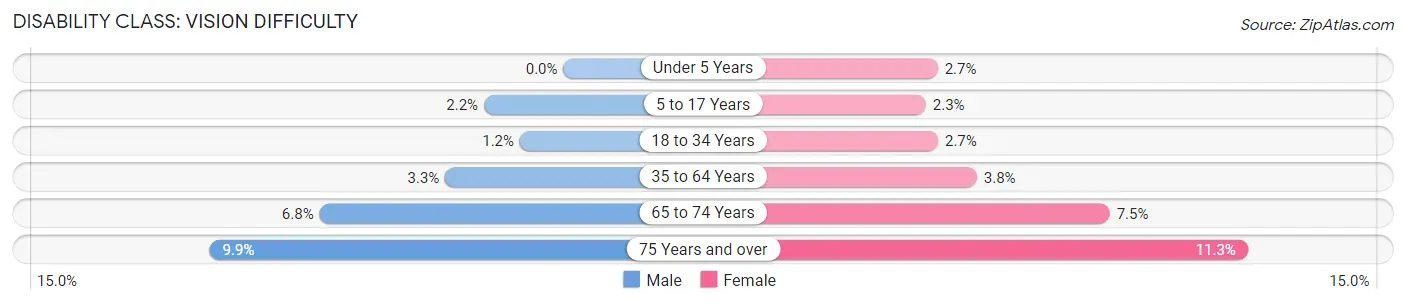
| Age Bracket | Male | Female |
| Under 5 Years | 0 (0.0%) | 141 (2.7%) |
| 5 to 17 Years | 322 (2.2%) | 318 (2.3%) |
| 18 to 34 Years | 327 (1.2%) | 824 (2.7%) |
| 35 to 64 Years | 1,065 (3.3%) | 1,395 (3.8%) |
| 65 to 74 Years | 610 (6.8%) | 813 (7.5%) |
| 75 Years and over | 391 (9.9%) | 818 (11.3%) |
Disability Class: Cognitive Difficulty
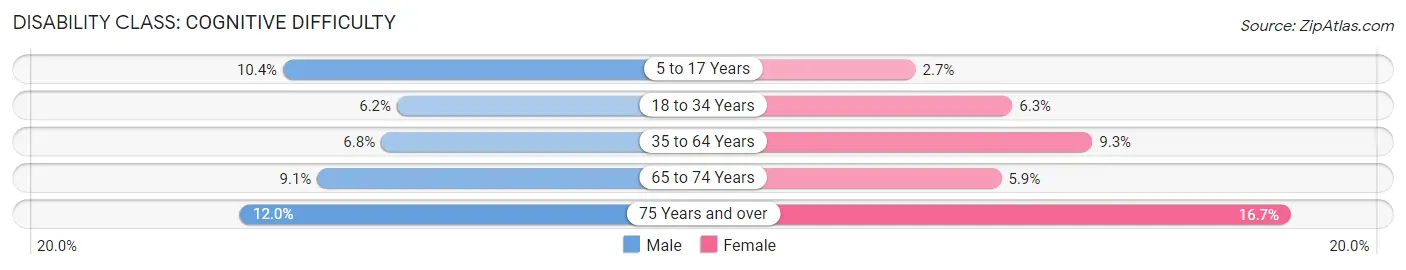
| Age Bracket | Male | Female |
| 5 to 17 Years | 1,518 (10.4%) | 373 (2.7%) |
| 18 to 34 Years | 1,666 (6.2%) | 1,946 (6.3%) |
| 35 to 64 Years | 2,193 (6.8%) | 3,448 (9.3%) |
| 65 to 74 Years | 821 (9.1%) | 647 (5.9%) |
| 75 Years and over | 476 (12.0%) | 1,207 (16.7%) |
Disability Class: Ambulatory Difficulty
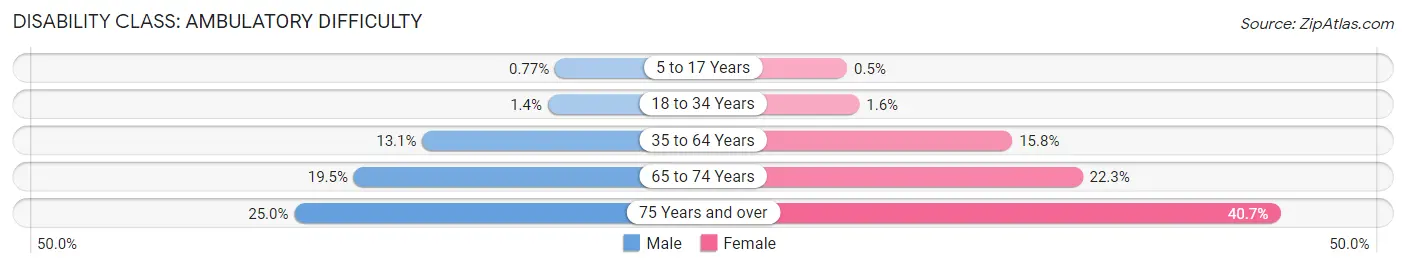
| Age Bracket | Male | Female |
| 5 to 17 Years | 113 (0.8%) | 68 (0.5%) |
| 18 to 34 Years | 388 (1.4%) | 501 (1.6%) |
| 35 to 64 Years | 4,238 (13.1%) | 5,866 (15.8%) |
| 65 to 74 Years | 1,746 (19.5%) | 2,436 (22.3%) |
| 75 Years and over | 991 (25.0%) | 2,945 (40.7%) |
Disability Class: Self-Care Difficulty
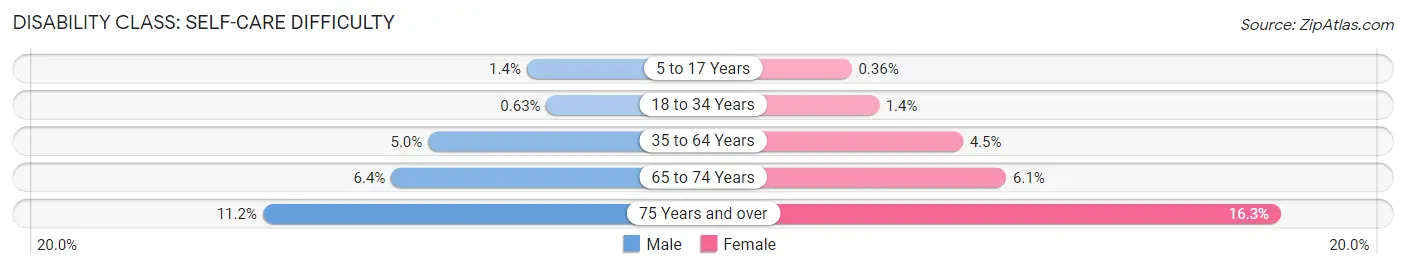
| Age Bracket | Male | Female |
| 5 to 17 Years | 199 (1.4%) | 49 (0.4%) |
| 18 to 34 Years | 171 (0.6%) | 420 (1.4%) |
| 35 to 64 Years | 1,624 (5.0%) | 1,666 (4.5%) |
| 65 to 74 Years | 574 (6.4%) | 665 (6.1%) |
| 75 Years and over | 443 (11.2%) | 1,180 (16.3%) |
Technology Access in Birmingham
Computing Device Access in Birmingham
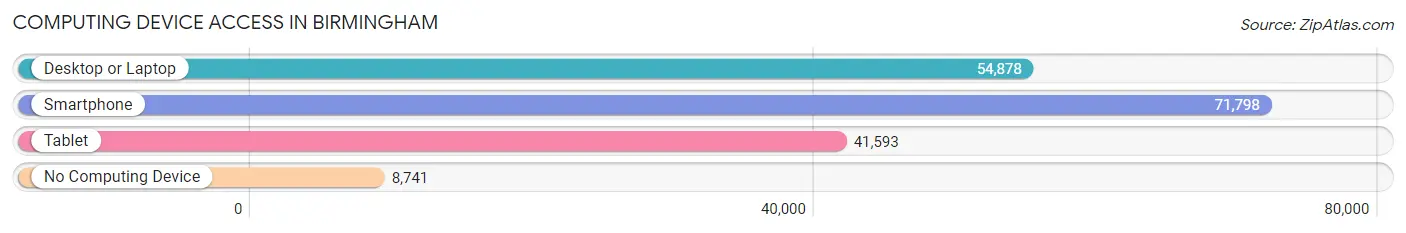
| Device Type | # Households | % Households |
| Desktop or Laptop | 54,878 | 64.6% |
| Smartphone | 71,798 | 84.5% |
| Tablet | 41,593 | 48.9% |
| No Computing Device | 8,741 | 10.3% |
| Total | 84,999 | 100.0% |
Internet Access in Birmingham
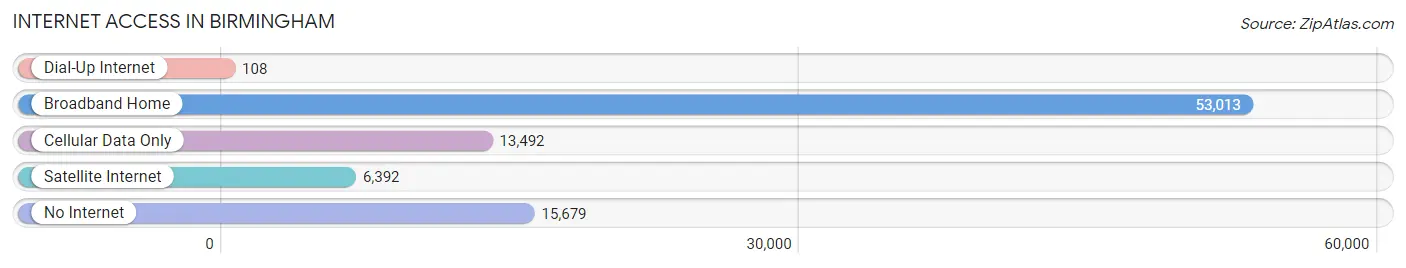
| Internet Type | # Households | % Households |
| Dial-Up Internet | 108 | 0.1% |
| Broadband Home | 53,013 | 62.4% |
| Cellular Data Only | 13,492 | 15.9% |
| Satellite Internet | 6,392 | 7.5% |
| No Internet | 15,679 | 18.4% |
| Total | 84,999 | 100.0% |
Birmingham Summary
Birmingham, Alabama is the largest city in the state and the county seat of Jefferson County. It is located in the north-central part of the state, in the foothills of the Appalachian Mountains. Birmingham is the cultural and economic center of the Birmingham-Hoover Metropolitan Statistical Area, which is the most populous metropolitan area in Alabama and the 49th-most populous in the United States. Birmingham is the hub of many industries, including banking, transportation, manufacturing, and healthcare.
Birmingham was founded in 1871, after the Civil War, as an industrial center. It was named after Birmingham, England, and was the first major industrial city in the South. The city quickly grew, and by the early 1900s, it was the largest city in Alabama. Birmingham was a major center of the civil rights movement in the 1960s, and it was the site of several major protests and demonstrations.
Geography
Birmingham is located in the north-central part of Alabama, in the foothills of the Appalachian Mountains. The city is situated on the banks of the Black Warrior River, and is surrounded by several smaller rivers and streams. The city has a total area of 151.1 square miles, of which 149.9 square miles is land and 1.2 square miles is water. Birmingham is located in the humid subtropical climate zone, and has hot, humid summers and mild winters.
Economy
Birmingham is the economic and cultural center of the Birmingham-Hoover Metropolitan Statistical Area, which is the most populous metropolitan area in Alabama and the 49th-most populous in the United States. The city is home to several major corporations, including Regions Financial Corporation, HealthSouth Corporation, and Vulcan Materials Company. Birmingham is also a major banking center, with several large banks and financial institutions located in the city.
Birmingham is a major center for manufacturing, with several large factories located in the city. The city is home to several automotive plants, including the Mercedes-Benz U.S. International plant, which is the largest automotive plant in the United States. Birmingham is also a major center for healthcare, with several major hospitals and medical centers located in the city.
Demographics
As of the 2010 census, Birmingham had a population of 212,237. The racial makeup of the city was 63.4% African American, 29.2% White, 0.4% Native American, 1.7% Asian, 0.1% Pacific Islander, 2.7% from other races, and 2.5% from two or more races. The median household income was $31,945, and the median family income was $37,811.
Birmingham is home to several large universities, including the University of Alabama at Birmingham, Birmingham-Southern College, and Miles College. The city is also home to several museums, including the Birmingham Museum of Art, the Birmingham Civil Rights Institute, and the Birmingham Zoo.
Birmingham is a major cultural center, with several major festivals and events held in the city each year. The city is home to several professional sports teams, including the Birmingham Barons (baseball), the Birmingham Bulls (hockey), and the Birmingham Iron (football). Birmingham is also home to several major music venues, including the Alabama Theatre and the BJCC Arena.
Common Questions
What is Per Capita Income in Birmingham?
Per Capita income in Birmingham is $29,289.
What is the Median Family Income in Birmingham?
Median Family Income in Birmingham is $55,541.
What is the Median Household income in Birmingham?
Median Household Income in Birmingham is $42,464.
What is Income or Wage Gap in Birmingham?
Income or Wage Gap in Birmingham is 16.6%.
Women in Birmingham earn 83.4 cents for every dollar earned by a man.
What is Family Income Deficit in Birmingham?
Family Income Deficit in Birmingham is $11,704.
Families that are below poverty line in Birmingham earn $11,704 less on average than the poverty threshold level.
What is Inequality or Gini Index in Birmingham?
Inequality or Gini Index in Birmingham is 0.52.
What is the Total Population of Birmingham?
Total Population of Birmingham is 200,431.
What is the Total Male Population of Birmingham?
Total Male Population of Birmingham is 94,413.
What is the Total Female Population of Birmingham?
Total Female Population of Birmingham is 106,018.
What is the Ratio of Males per 100 Females in Birmingham?
There are 89.05 Males per 100 Females in Birmingham.
What is the Ratio of Females per 100 Males in Birmingham?
There are 112.29 Females per 100 Males in Birmingham.
What is the Median Population Age in Birmingham?
Median Population Age in Birmingham is 35.9 Years.
What is the Average Family Size in Birmingham
Average Family Size in Birmingham is 3.2 People.
What is the Average Household Size in Birmingham
Average Household Size in Birmingham is 2.2 People.
How Large is the Labor Force in Birmingham?
There are 95,869 People in the Labor Forcein in Birmingham.
What is the Percentage of People in the Labor Force in Birmingham?
57.9% of People are in the Labor Force in Birmingham.
What is the Unemployment Rate in Birmingham?
Unemployment Rate in Birmingham is 7.5%.