Riverview, FL Map & Demographics
Riverview Map
Riverview Overview
$37,092
PER CAPITA INCOME
$99,720
AVG FAMILY INCOME
$87,383
AVG HOUSEHOLD INCOME
21.2%
WAGE / INCOME GAP [ % ]
78.8¢/ $1
WAGE / INCOME GAP [ $ ]
$11,071
FAMILY INCOME DEFICIT
0.39
INEQUALITY / GINI INDEX
102,467
TOTAL POPULATION
49,120
MALE POPULATION
53,347
FEMALE POPULATION
92.08
MALES / 100 FEMALES
108.61
FEMALES / 100 MALES
36.3
MEDIAN AGE
3.4
AVG FAMILY SIZE
2.9
AVG HOUSEHOLD SIZE
55,852
LABOR FORCE [ PEOPLE ]
70.8%
PERCENT IN LABOR FORCE
5.6%
UNEMPLOYMENT RATE
Riverview Area Codes
Income in Riverview
Income Overview in Riverview
Per Capita Income in Riverview is $37,092, while median incomes of families and households are $99,720 and $87,383 respectively.
| Characteristic | Number | Measure |
| Per Capita Income | 102,467 | $37,092 |
| Median Family Income | 25,695 | $99,720 |
| Mean Family Income | 25,695 | $113,023 |
| Median Household Income | 35,948 | $87,383 |
| Mean Household Income | 35,948 | $102,710 |
| Income Deficit | 25,695 | $11,071 |
| Wage / Income Gap (%) | 102,467 | 21.24% |
| Wage / Income Gap ($) | 102,467 | 78.76¢ per $1 |
| Gini / Inequality Index | 102,467 | 0.39 |
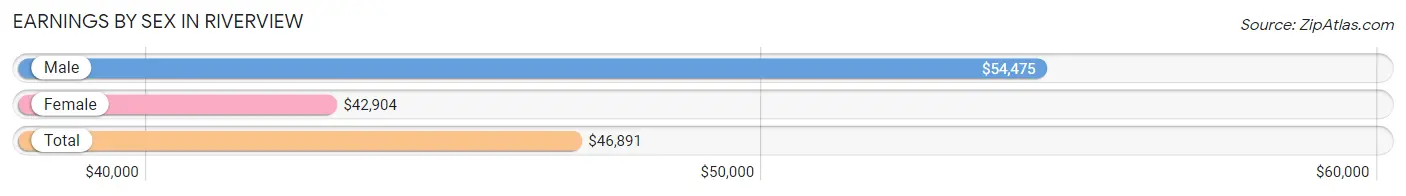
Earnings by Sex in Riverview
Average Earnings in Riverview are $46,891, $54,475 for men and $42,904 for women, a difference of 21.2%.
| Sex | Number | Average Earnings |
| Male | 27,446 (49.0%) | $54,475 |
| Female | 28,574 (51.0%) | $42,904 |
| Total | 56,020 (100.0%) | $46,891 |
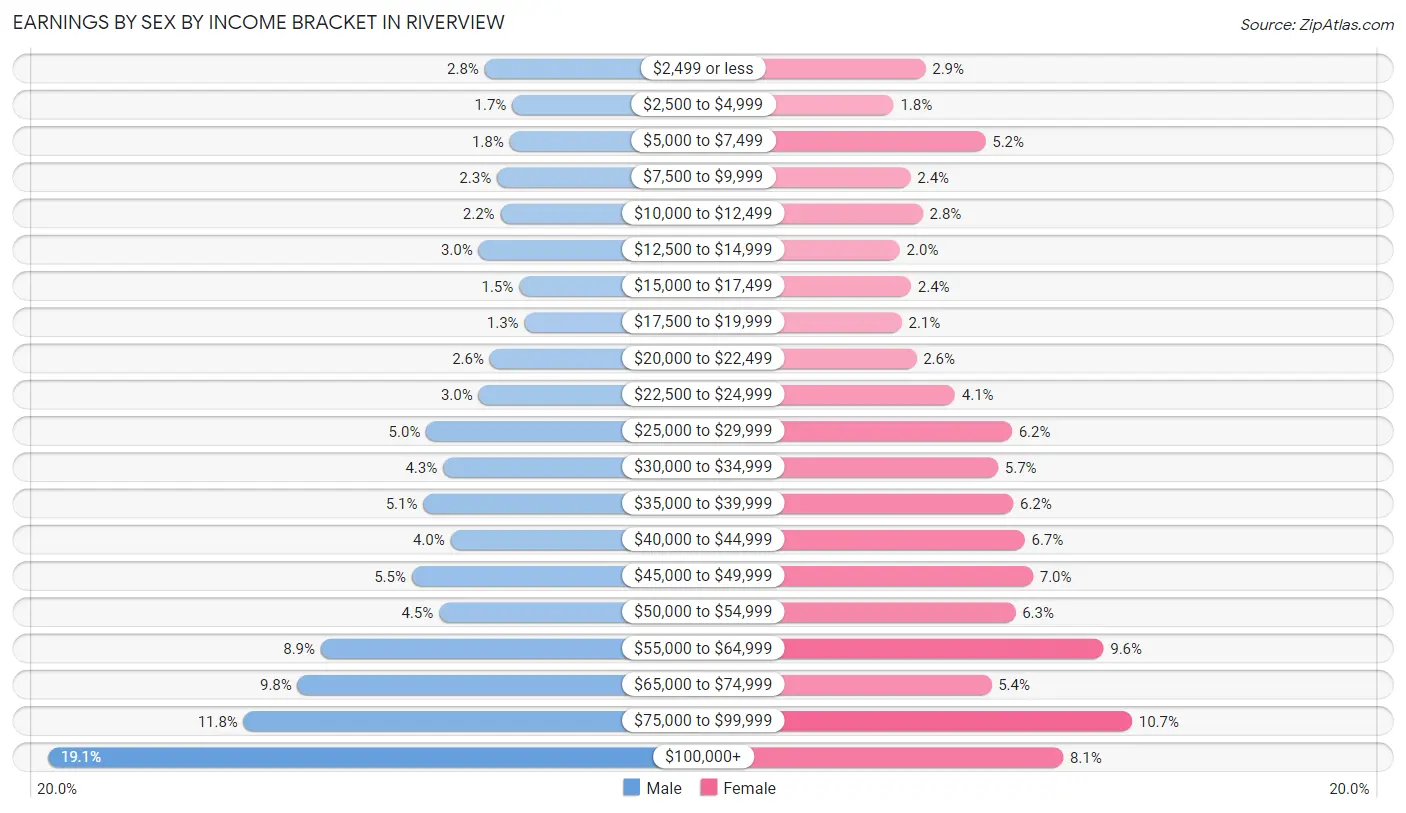
Earnings by Sex by Income Bracket in Riverview
The most common earnings brackets in Riverview are $100,000+ for men (5,251 | 19.1%) and $75,000 to $99,999 for women (3,053 | 10.7%).
| Income | Male | Female |
| $2,499 or less | 757 (2.8%) | 839 (2.9%) |
| $2,500 to $4,999 | 475 (1.7%) | 500 (1.8%) |
| $5,000 to $7,499 | 502 (1.8%) | 1,484 (5.2%) |
| $7,500 to $9,999 | 631 (2.3%) | 680 (2.4%) |
| $10,000 to $12,499 | 596 (2.2%) | 811 (2.8%) |
| $12,500 to $14,999 | 822 (3.0%) | 565 (2.0%) |
| $15,000 to $17,499 | 403 (1.5%) | 687 (2.4%) |
| $17,500 to $19,999 | 348 (1.3%) | 587 (2.1%) |
| $20,000 to $22,499 | 704 (2.6%) | 743 (2.6%) |
| $22,500 to $24,999 | 820 (3.0%) | 1,156 (4.1%) |
| $25,000 to $29,999 | 1,359 (5.0%) | 1,766 (6.2%) |
| $30,000 to $34,999 | 1,186 (4.3%) | 1,617 (5.7%) |
| $35,000 to $39,999 | 1,390 (5.1%) | 1,780 (6.2%) |
| $40,000 to $44,999 | 1,108 (4.0%) | 1,902 (6.7%) |
| $45,000 to $49,999 | 1,506 (5.5%) | 1,992 (7.0%) |
| $50,000 to $54,999 | 1,226 (4.5%) | 1,803 (6.3%) |
| $55,000 to $64,999 | 2,444 (8.9%) | 2,747 (9.6%) |
| $65,000 to $74,999 | 2,681 (9.8%) | 1,547 (5.4%) |
| $75,000 to $99,999 | 3,237 (11.8%) | 3,053 (10.7%) |
| $100,000+ | 5,251 (19.1%) | 2,315 (8.1%) |
| Total | 27,446 (100.0%) | 28,574 (100.0%) |
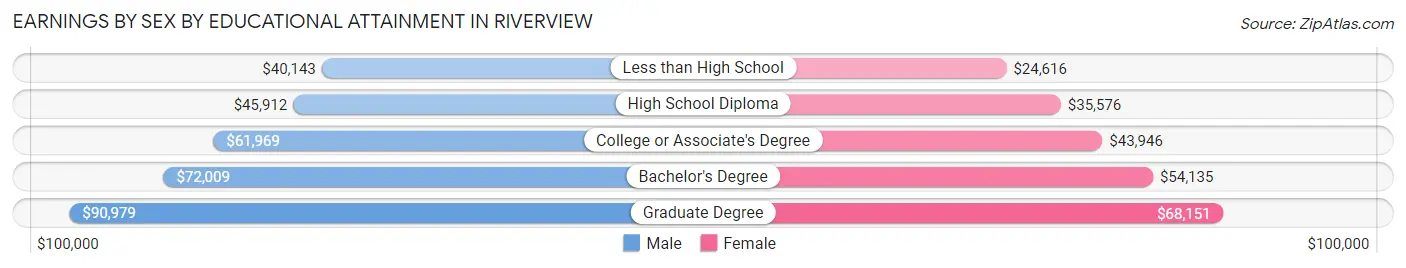
Earnings by Sex by Educational Attainment in Riverview
Average earnings in Riverview are $60,802 for men and $46,155 for women, a difference of 24.1%. Men with an educational attainment of graduate degree enjoy the highest average annual earnings of $90,979, while those with less than high school education earn the least with $40,143. Women with an educational attainment of graduate degree earn the most with the average annual earnings of $68,151, while those with less than high school education have the smallest earnings of $24,616.
| Educational Attainment | Male Income | Female Income |
| Less than High School | $40,143 | $24,616 |
| High School Diploma | $45,912 | $35,576 |
| College or Associate's Degree | $61,969 | $43,946 |
| Bachelor's Degree | $72,009 | $54,135 |
| Graduate Degree | $90,979 | $68,151 |
| Total | $60,802 | $46,155 |
Family Income in Riverview
Family Income Brackets in Riverview
According to the Riverview family income data, there are 6,604 families falling into the $100,000 to $149,999 income range, which is the most common income bracket and makes up 25.7% of all families. Conversely, the less than $10,000 income bracket is the least frequent group with only 488 families (1.9%) belonging to this category.
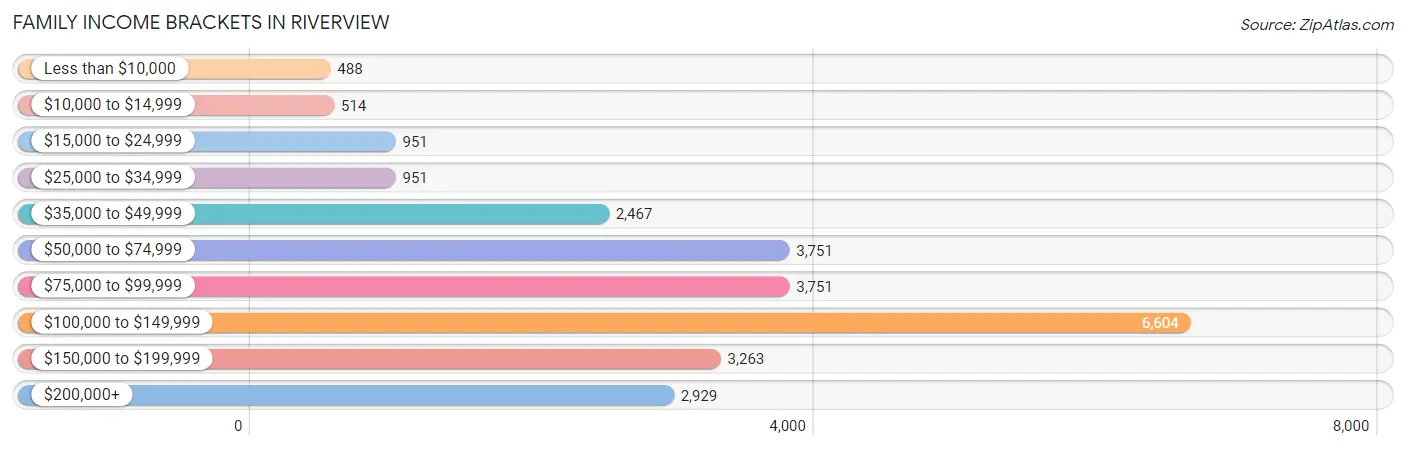
| Income Bracket | # Families | % Families |
| Less than $10,000 | 488 | 1.9% |
| $10,000 to $14,999 | 514 | 2.0% |
| $15,000 to $24,999 | 951 | 3.7% |
| $25,000 to $34,999 | 951 | 3.7% |
| $35,000 to $49,999 | 2,467 | 9.6% |
| $50,000 to $74,999 | 3,751 | 14.6% |
| $75,000 to $99,999 | 3,751 | 14.6% |
| $100,000 to $149,999 | 6,604 | 25.7% |
| $150,000 to $199,999 | 3,263 | 12.7% |
| $200,000+ | 2,929 | 11.4% |
Family Income by Famaliy Size in Riverview
7+ person families (396 | 1.5%) account for the highest median family income in Riverview with $171,389 per family, while 2-person families (10,254 | 39.9%) have the highest median income of $42,448 per family member.
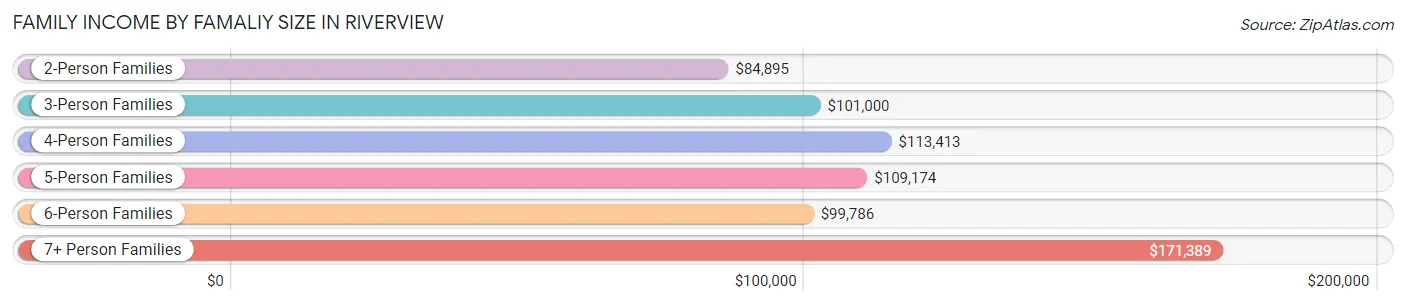
| Income Bracket | # Families | Median Income |
| 2-Person Families | 10,254 (39.9%) | $84,895 |
| 3-Person Families | 6,772 (26.4%) | $101,000 |
| 4-Person Families | 4,749 (18.5%) | $113,413 |
| 5-Person Families | 2,410 (9.4%) | $109,174 |
| 6-Person Families | 1,114 (4.3%) | $99,786 |
| 7+ Person Families | 396 (1.5%) | $171,389 |
| Total | 25,695 (100.0%) | $99,720 |
Family Income by Number of Earners in Riverview
The median family income in Riverview is $99,720, with families comprising 3+ earners (2,945) having the highest median family income of $153,831, while families with no earners (2,404) have the lowest median family income of $46,729, accounting for 11.5% and 9.4% of families, respectively.
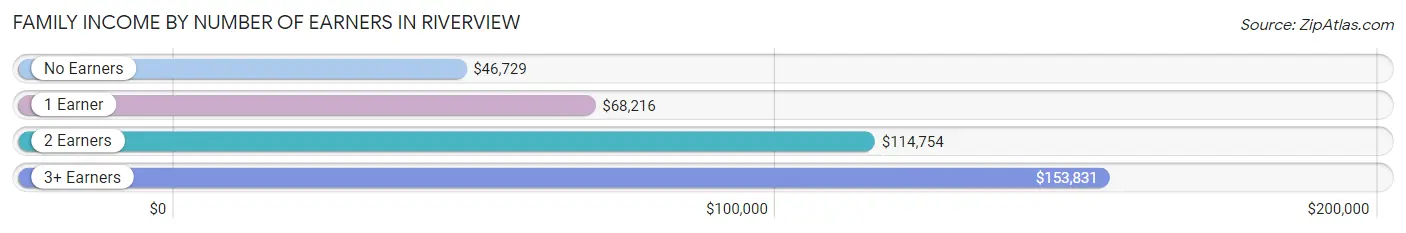
| Number of Earners | # Families | Median Income |
| No Earners | 2,404 (9.4%) | $46,729 |
| 1 Earner | 8,190 (31.9%) | $68,216 |
| 2 Earners | 12,156 (47.3%) | $114,754 |
| 3+ Earners | 2,945 (11.5%) | $153,831 |
| Total | 25,695 (100.0%) | $99,720 |
Household Income in Riverview
Household Income Brackets in Riverview
With 8,268 households falling in the category, the $100,000 to $149,999 income range is the most frequent in Riverview, accounting for 23.0% of all households. In contrast, only 827 households (2.3%) fall into the $10,000 to $14,999 income bracket, making it the least populous group.
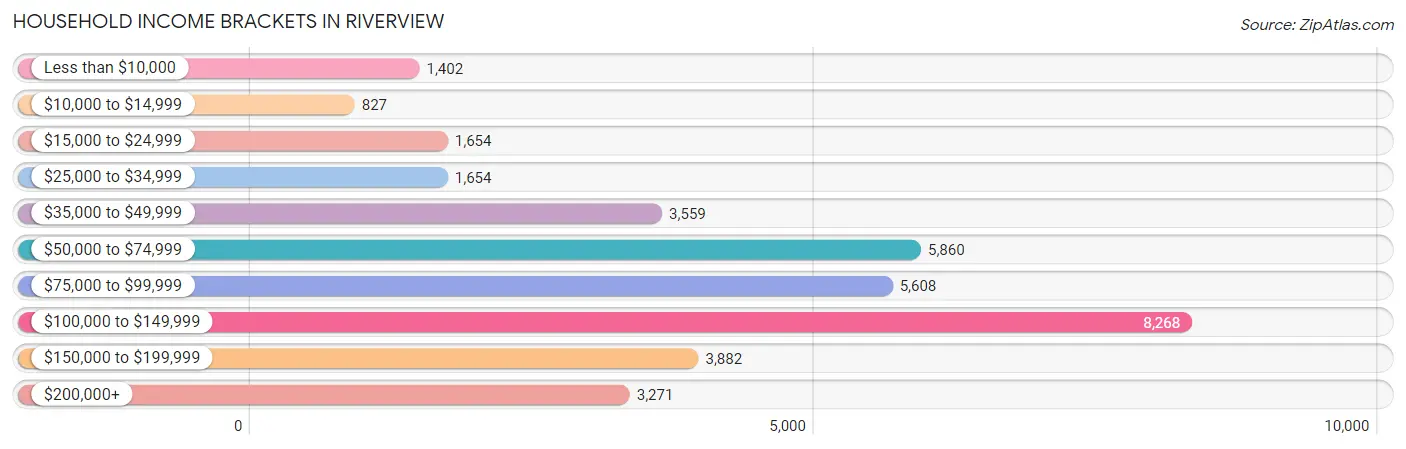
| Income Bracket | # Households | % Households |
| Less than $10,000 | 1,402 | 3.9% |
| $10,000 to $14,999 | 827 | 2.3% |
| $15,000 to $24,999 | 1,654 | 4.6% |
| $25,000 to $34,999 | 1,654 | 4.6% |
| $35,000 to $49,999 | 3,559 | 9.9% |
| $50,000 to $74,999 | 5,860 | 16.3% |
| $75,000 to $99,999 | 5,608 | 15.6% |
| $100,000 to $149,999 | 8,268 | 23.0% |
| $150,000 to $199,999 | 3,882 | 10.8% |
| $200,000+ | 3,271 | 9.1% |
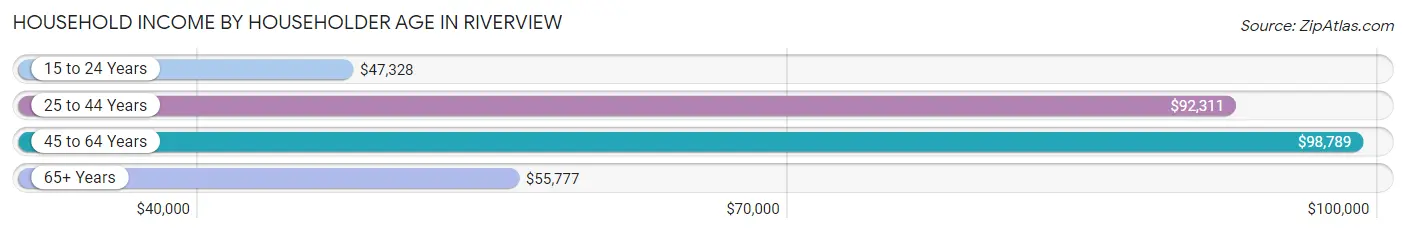
Household Income by Householder Age in Riverview
The median household income in Riverview is $87,383, with the highest median household income of $98,789 found in the 45 to 64 years age bracket for the primary householder. A total of 14,101 households (39.2%) fall into this category. Meanwhile, the 15 to 24 years age bracket for the primary householder has the lowest median household income of $47,328, with 538 households (1.5%) in this group.
| Income Bracket | # Households | Median Income |
| 15 to 24 Years | 538 (1.5%) | $47,328 |
| 25 to 44 Years | 15,548 (43.2%) | $92,311 |
| 45 to 64 Years | 14,101 (39.2%) | $98,789 |
| 65+ Years | 5,761 (16.0%) | $55,777 |
| Total | 35,948 (100.0%) | $87,383 |
Poverty in Riverview
Income Below Poverty by Sex and Age in Riverview
With 6.9% poverty level for males and 9.4% for females among the residents of Riverview, under 5 year old males and 55 to 64 year old females are the most vulnerable to poverty, with 494 males (13.8%) and 1,192 females (18.7%) in their respective age groups living below the poverty level.
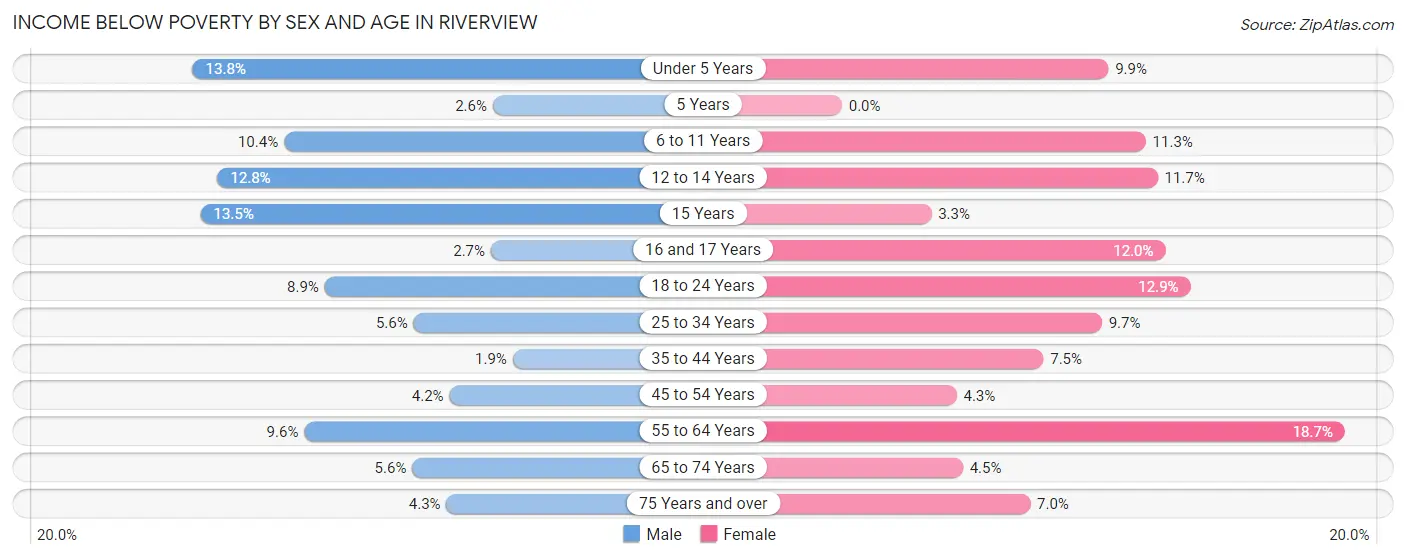
| Age Bracket | Male | Female |
| Under 5 Years | 494 (13.8%) | 291 (9.9%) |
| 5 Years | 15 (2.6%) | 0 (0.0%) |
| 6 to 11 Years | 494 (10.4%) | 553 (11.3%) |
| 12 to 14 Years | 343 (12.8%) | 234 (11.7%) |
| 15 Years | 83 (13.5%) | 23 (3.3%) |
| 16 and 17 Years | 35 (2.7%) | 173 (12.0%) |
| 18 to 24 Years | 355 (8.9%) | 449 (12.9%) |
| 25 to 34 Years | 359 (5.6%) | 812 (9.7%) |
| 35 to 44 Years | 157 (1.9%) | 653 (7.5%) |
| 45 to 54 Years | 285 (4.2%) | 309 (4.3%) |
| 55 to 64 Years | 500 (9.6%) | 1,192 (18.7%) |
| 65 to 74 Years | 158 (5.6%) | 193 (4.5%) |
| 75 Years and over | 81 (4.3%) | 147 (7.0%) |
| Total | 3,359 (6.9%) | 5,029 (9.4%) |
Income Above Poverty by Sex and Age in Riverview
According to the poverty statistics in Riverview, males aged 35 to 44 years and females aged 5 years are the age groups that are most secure financially, with 98.1% of males and 100.0% of females in these age groups living above the poverty line.
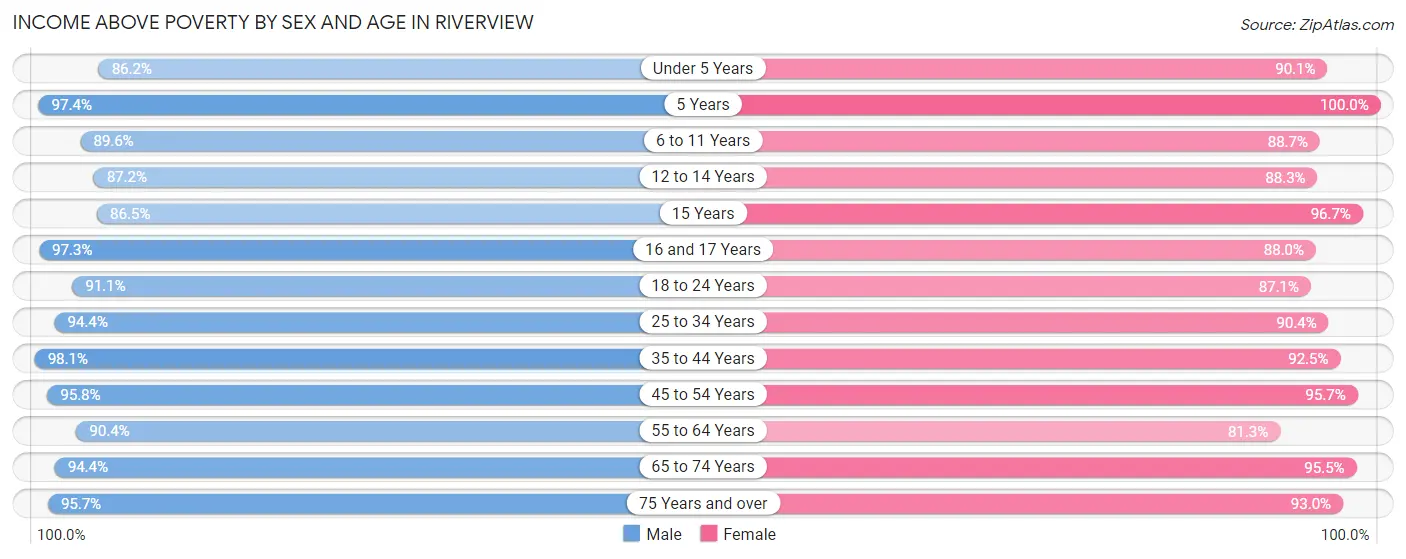
| Age Bracket | Male | Female |
| Under 5 Years | 3,097 (86.2%) | 2,650 (90.1%) |
| 5 Years | 558 (97.4%) | 659 (100.0%) |
| 6 to 11 Years | 4,269 (89.6%) | 4,348 (88.7%) |
| 12 to 14 Years | 2,329 (87.2%) | 1,763 (88.3%) |
| 15 Years | 533 (86.5%) | 670 (96.7%) |
| 16 and 17 Years | 1,264 (97.3%) | 1,268 (88.0%) |
| 18 to 24 Years | 3,650 (91.1%) | 3,020 (87.1%) |
| 25 to 34 Years | 6,103 (94.4%) | 7,605 (90.3%) |
| 35 to 44 Years | 8,209 (98.1%) | 8,078 (92.5%) |
| 45 to 54 Years | 6,459 (95.8%) | 6,953 (95.7%) |
| 55 to 64 Years | 4,696 (90.4%) | 5,194 (81.3%) |
| 65 to 74 Years | 2,660 (94.4%) | 4,110 (95.5%) |
| 75 Years and over | 1,786 (95.7%) | 1,955 (93.0%) |
| Total | 45,613 (93.1%) | 48,273 (90.6%) |
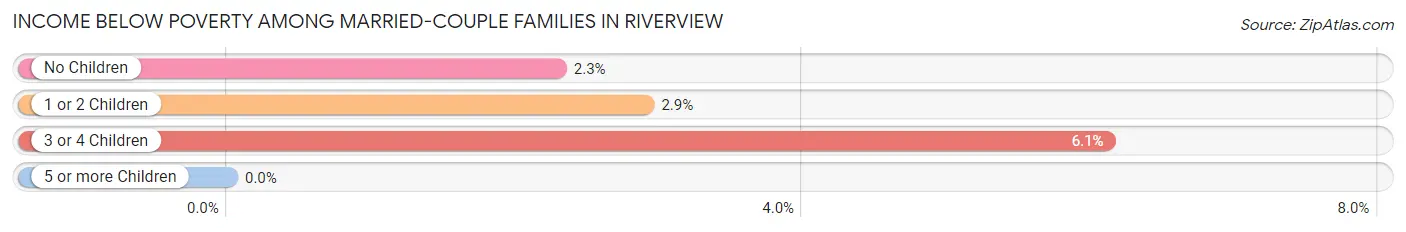
Income Below Poverty Among Married-Couple Families in Riverview
The poverty statistics for married-couple families in Riverview show that 2.8% or 531 of the total 18,666 families live below the poverty line. Families with 3 or 4 children have the highest poverty rate of 6.1%, comprising of 93 families. On the other hand, families with 5 or more children have the lowest poverty rate of 0.0%, which includes 0 families.
| Children | Above Poverty | Below Poverty |
| No Children | 9,281 (97.7%) | 218 (2.3%) |
| 1 or 2 Children | 7,372 (97.1%) | 220 (2.9%) |
| 3 or 4 Children | 1,429 (93.9%) | 93 (6.1%) |
| 5 or more Children | 53 (100.0%) | 0 (0.0%) |
| Total | 18,135 (97.2%) | 531 (2.8%) |
Income Below Poverty Among Single-Parent Households in Riverview
According to the poverty data in Riverview, 4.0% or 58 single-father households and 22.1% or 1,233 single-mother households are living below the poverty line. Among single-father households, those with 1 or 2 children have the highest poverty rate, with 42 households (5.6%) experiencing poverty. Likewise, among single-mother households, those with 5 or more children have the highest poverty rate, with 97 households (100.0%) falling below the poverty line.
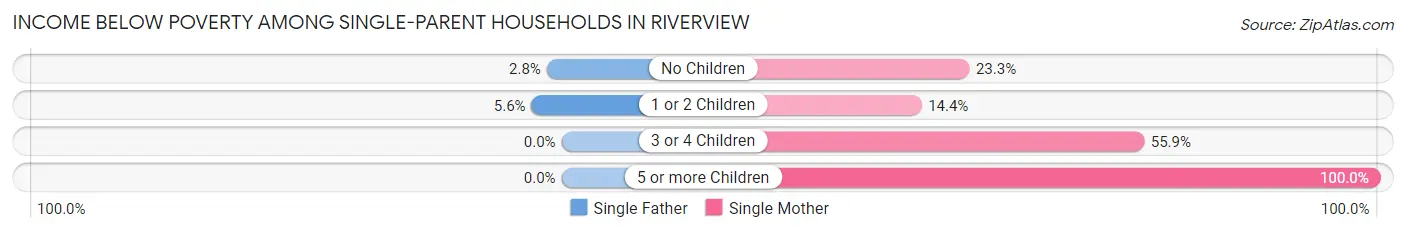
| Children | Single Father | Single Mother |
| No Children | 16 (2.8%) | 445 (23.3%) |
| 1 or 2 Children | 42 (5.6%) | 454 (14.4%) |
| 3 or 4 Children | 0 (0.0%) | 237 (55.9%) |
| 5 or more Children | 0 (0.0%) | 97 (100.0%) |
| Total | 58 (4.0%) | 1,233 (22.1%) |
Income Below Poverty Among Married-Couple vs Single-Parent Households in Riverview
The poverty data for Riverview shows that 531 of the married-couple family households (2.8%) and 1,291 of the single-parent households (18.4%) are living below the poverty level. Within the married-couple family households, those with 3 or 4 children have the highest poverty rate, with 93 households (6.1%) falling below the poverty line. Among the single-parent households, those with 5 or more children have the highest poverty rate, with 97 household (100.0%) living below poverty.
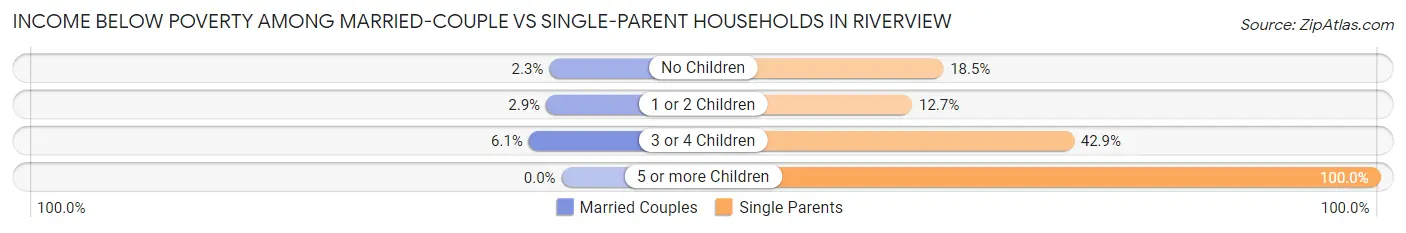
| Children | Married-Couple Families | Single-Parent Households |
| No Children | 218 (2.3%) | 461 (18.5%) |
| 1 or 2 Children | 220 (2.9%) | 496 (12.7%) |
| 3 or 4 Children | 93 (6.1%) | 237 (42.9%) |
| 5 or more Children | 0 (0.0%) | 97 (100.0%) |
| Total | 531 (2.8%) | 1,291 (18.4%) |
Race in Riverview
The most populous races in Riverview are White / Caucasian (59,796 | 58.4%), Hispanic or Latino (25,896 | 25.3%), and Black / African American (22,339 | 21.8%).
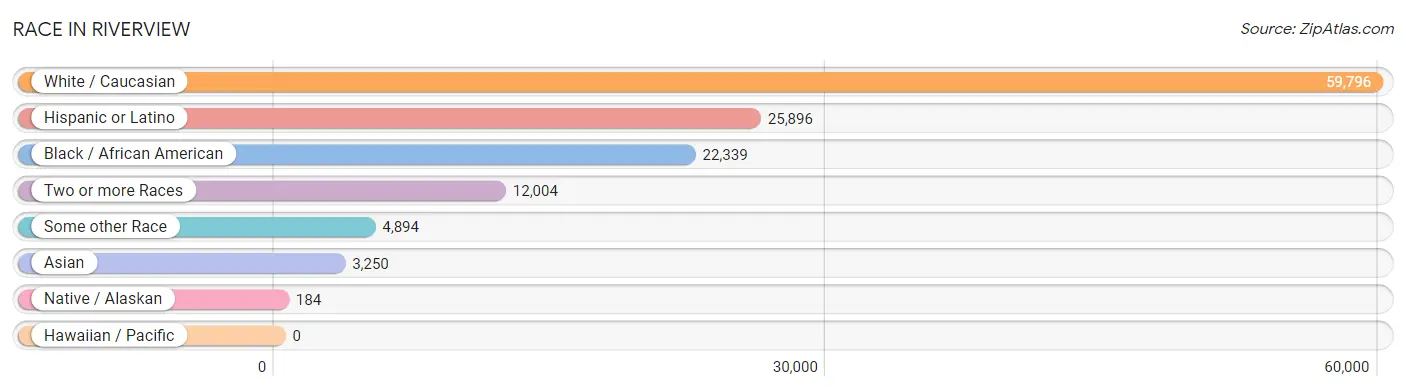
| Race | # Population | % Population |
| Asian | 3,250 | 3.2% |
| Black / African American | 22,339 | 21.8% |
| Hawaiian / Pacific | 0 | 0.0% |
| Hispanic or Latino | 25,896 | 25.3% |
| Native / Alaskan | 184 | 0.2% |
| White / Caucasian | 59,796 | 58.4% |
| Two or more Races | 12,004 | 11.7% |
| Some other Race | 4,894 | 4.8% |
| Total | 102,467 | 100.0% |
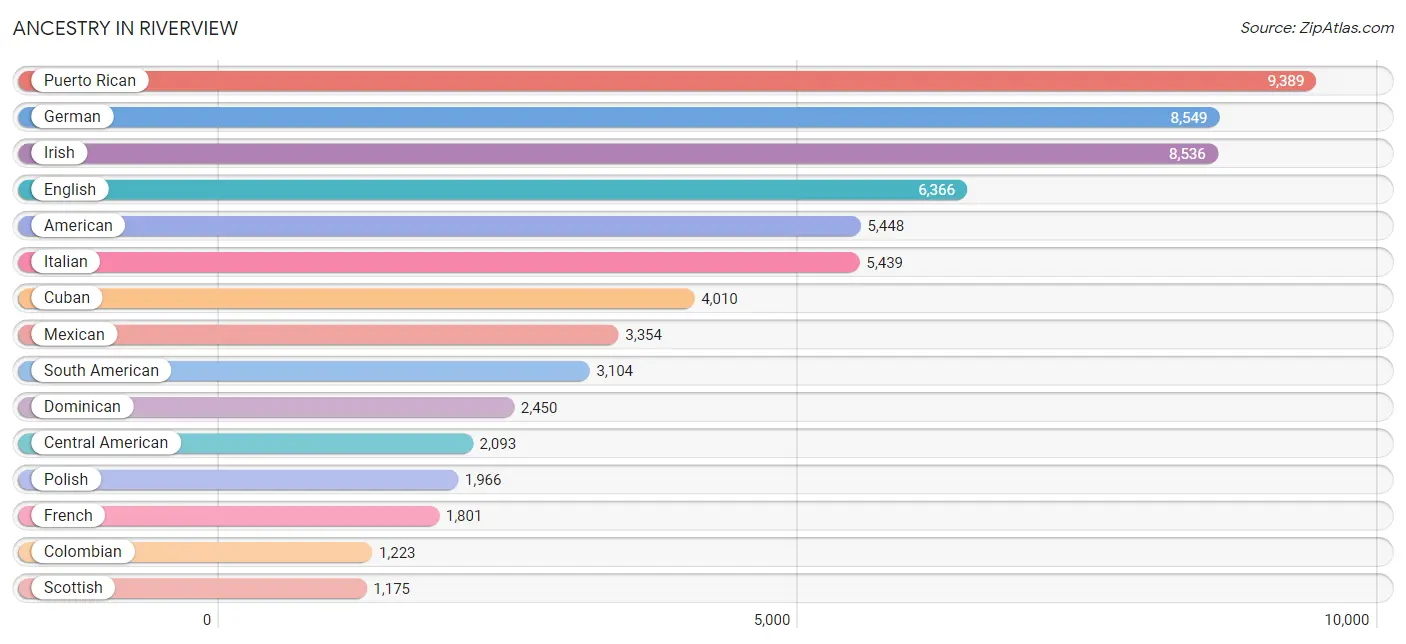
Ancestry in Riverview
The most populous ancestries reported in Riverview are Puerto Rican (9,389 | 9.2%), German (8,549 | 8.3%), Irish (8,536 | 8.3%), English (6,366 | 6.2%), and American (5,448 | 5.3%), together accounting for 37.4% of all Riverview residents.
| Ancestry | # Population | % Population |
| Afghan | 322 | 0.3% |
| African | 527 | 0.5% |
| American | 5,448 | 5.3% |
| Arab | 565 | 0.5% |
| Argentinean | 162 | 0.2% |
| Armenian | 72 | 0.1% |
| Australian | 47 | 0.1% |
| Austrian | 42 | 0.0% |
| Bahamian | 84 | 0.1% |
| Barbadian | 16 | 0.0% |
| Belgian | 119 | 0.1% |
| Belizean | 312 | 0.3% |
| Bhutanese | 226 | 0.2% |
| Blackfeet | 27 | 0.0% |
| Bolivian | 97 | 0.1% |
| Brazilian | 211 | 0.2% |
| British | 385 | 0.4% |
| British West Indian | 129 | 0.1% |
| Bulgarian | 37 | 0.0% |
| Burmese | 237 | 0.2% |
| Cajun | 13 | 0.0% |
| Cambodian | 8 | 0.0% |
| Canadian | 198 | 0.2% |
| Cape Verdean | 11 | 0.0% |
| Celtic | 5 | 0.0% |
| Central American | 2,093 | 2.0% |
| Central American Indian | 224 | 0.2% |
| Cherokee | 352 | 0.3% |
| Chilean | 55 | 0.1% |
| Chippewa | 19 | 0.0% |
| Colombian | 1,223 | 1.2% |
| Costa Rican | 130 | 0.1% |
| Croatian | 106 | 0.1% |
| Cuban | 4,010 | 3.9% |
| Czech | 160 | 0.2% |
| Czechoslovakian | 60 | 0.1% |
| Danish | 79 | 0.1% |
| Dominican | 2,450 | 2.4% |
| Dutch | 549 | 0.5% |
| Eastern European | 138 | 0.1% |
| Ecuadorian | 190 | 0.2% |
| Egyptian | 152 | 0.2% |
| English | 6,366 | 6.2% |
| Ethiopian | 32 | 0.0% |
| European | 1,156 | 1.1% |
| Finnish | 103 | 0.1% |
| French | 1,801 | 1.8% |
| French American Indian | 7 | 0.0% |
| French Canadian | 519 | 0.5% |
| German | 8,549 | 8.3% |
| German Russian | 66 | 0.1% |
| Greek | 478 | 0.5% |
| Guamanian / Chamorro | 17 | 0.0% |
| Guatemalan | 394 | 0.4% |
| Guyanese | 190 | 0.2% |
| Haitian | 1,112 | 1.1% |
| Honduran | 472 | 0.5% |
| Houma | 30 | 0.0% |
| Hungarian | 245 | 0.2% |
| Indian (Asian) | 507 | 0.5% |
| Iranian | 10 | 0.0% |
| Iraqi | 12 | 0.0% |
| Irish | 8,536 | 8.3% |
| Iroquois | 130 | 0.1% |
| Israeli | 154 | 0.2% |
| Italian | 5,439 | 5.3% |
| Jamaican | 1,069 | 1.0% |
| Japanese | 63 | 0.1% |
| Korean | 938 | 0.9% |
| Laotian | 16 | 0.0% |
| Lebanese | 85 | 0.1% |
| Lithuanian | 95 | 0.1% |
| Malaysian | 19 | 0.0% |
| Mexican | 3,354 | 3.3% |
| Moroccan | 55 | 0.1% |
| Native Hawaiian | 60 | 0.1% |
| Nicaraguan | 165 | 0.2% |
| Nigerian | 292 | 0.3% |
| Northern European | 212 | 0.2% |
| Norwegian | 587 | 0.6% |
| Pakistani | 109 | 0.1% |
| Palestinian | 165 | 0.2% |
| Panamanian | 549 | 0.5% |
| Paraguayan | 38 | 0.0% |
| Peruvian | 480 | 0.5% |
| Polish | 1,966 | 1.9% |
| Portuguese | 119 | 0.1% |
| Puerto Rican | 9,389 | 9.2% |
| Romanian | 74 | 0.1% |
| Russian | 332 | 0.3% |
| Salvadoran | 383 | 0.4% |
| Samoan | 12 | 0.0% |
| Scandinavian | 194 | 0.2% |
| Scotch-Irish | 432 | 0.4% |
| Scottish | 1,175 | 1.1% |
| Serbian | 4 | 0.0% |
| Shoshone | 16 | 0.0% |
| Sierra Leonean | 23 | 0.0% |
| Slavic | 11 | 0.0% |
| Slovak | 200 | 0.2% |
| Slovene | 467 | 0.5% |
| South American | 3,104 | 3.0% |
| Spaniard | 392 | 0.4% |
| Spanish | 95 | 0.1% |
| Spanish American | 12 | 0.0% |
| Sri Lankan | 310 | 0.3% |
| Subsaharan African | 902 | 0.9% |
| Swedish | 612 | 0.6% |
| Swiss | 119 | 0.1% |
| Syrian | 9 | 0.0% |
| Thai | 931 | 0.9% |
| Trinidadian and Tobagonian | 148 | 0.1% |
| Turkish | 82 | 0.1% |
| U.S. Virgin Islander | 86 | 0.1% |
| Ukrainian | 143 | 0.1% |
| Uruguayan | 86 | 0.1% |
| Venezuelan | 773 | 0.7% |
| Vietnamese | 10 | 0.0% |
| Welsh | 249 | 0.2% |
| West Indian | 406 | 0.4% |
| Yugoslavian | 17 | 0.0% |
| Zimbabwean | 17 | 0.0% | View All 122 Rows |
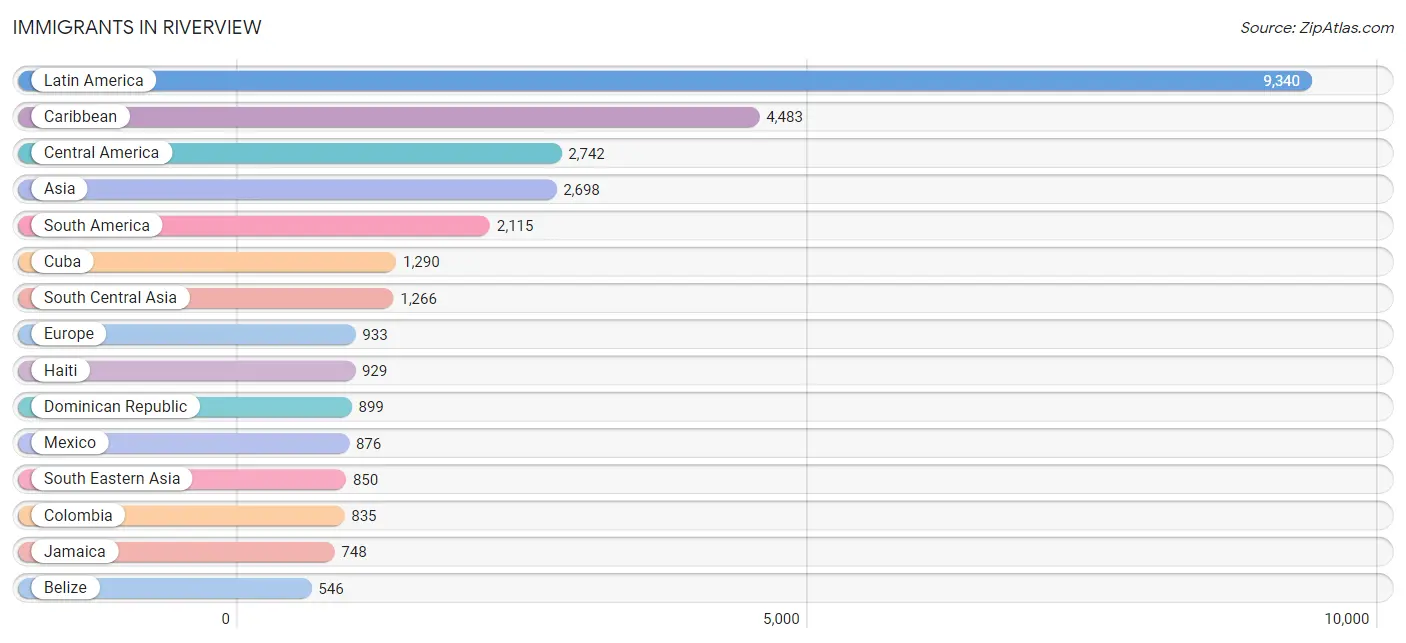
Immigrants in Riverview
The most numerous immigrant groups reported in Riverview came from Latin America (9,340 | 9.1%), Caribbean (4,483 | 4.4%), Central America (2,742 | 2.7%), Asia (2,698 | 2.6%), and South America (2,115 | 2.1%), together accounting for 20.9% of all Riverview residents.
| Immigration Origin | # Population | % Population |
| Afghanistan | 322 | 0.3% |
| Africa | 507 | 0.5% |
| Asia | 2,698 | 2.6% |
| Australia | 23 | 0.0% |
| Bangladesh | 10 | 0.0% |
| Barbados | 16 | 0.0% |
| Belize | 546 | 0.5% |
| Bolivia | 23 | 0.0% |
| Brazil | 203 | 0.2% |
| Bulgaria | 26 | 0.0% |
| Cambodia | 9 | 0.0% |
| Cameroon | 67 | 0.1% |
| Canada | 401 | 0.4% |
| Caribbean | 4,483 | 4.4% |
| Central America | 2,742 | 2.7% |
| Chile | 55 | 0.1% |
| China | 161 | 0.2% |
| Colombia | 835 | 0.8% |
| Costa Rica | 38 | 0.0% |
| Cuba | 1,290 | 1.3% |
| Denmark | 12 | 0.0% |
| Dominica | 63 | 0.1% |
| Dominican Republic | 899 | 0.9% |
| Eastern Africa | 56 | 0.1% |
| Eastern Asia | 358 | 0.4% |
| Eastern Europe | 161 | 0.2% |
| Ecuador | 68 | 0.1% |
| Egypt | 36 | 0.0% |
| El Salvador | 207 | 0.2% |
| England | 153 | 0.2% |
| Ethiopia | 56 | 0.1% |
| Europe | 933 | 0.9% |
| Germany | 151 | 0.2% |
| Greece | 20 | 0.0% |
| Grenada | 17 | 0.0% |
| Guatemala | 336 | 0.3% |
| Guyana | 162 | 0.2% |
| Haiti | 929 | 0.9% |
| Honduras | 182 | 0.2% |
| Hong Kong | 8 | 0.0% |
| Hungary | 5 | 0.0% |
| India | 526 | 0.5% |
| Indonesia | 16 | 0.0% |
| Iran | 5 | 0.0% |
| Ireland | 69 | 0.1% |
| Italy | 35 | 0.0% |
| Jamaica | 748 | 0.7% |
| Japan | 74 | 0.1% |
| Korea | 123 | 0.1% |
| Kuwait | 86 | 0.1% |
| Laos | 9 | 0.0% |
| Latin America | 9,340 | 9.1% |
| Lithuania | 29 | 0.0% |
| Malaysia | 41 | 0.0% |
| Mexico | 876 | 0.9% |
| Middle Africa | 67 | 0.1% |
| Morocco | 9 | 0.0% |
| Netherlands | 61 | 0.1% |
| Nicaragua | 91 | 0.1% |
| Nigeria | 280 | 0.3% |
| Northern Africa | 45 | 0.0% |
| Northern Europe | 459 | 0.4% |
| Oceania | 23 | 0.0% |
| Pakistan | 56 | 0.1% |
| Panama | 466 | 0.4% |
| Peru | 315 | 0.3% |
| Philippines | 502 | 0.5% |
| Poland | 35 | 0.0% |
| Portugal | 20 | 0.0% |
| Romania | 13 | 0.0% |
| Russia | 53 | 0.1% |
| Scotland | 15 | 0.0% |
| Sierra Leone | 23 | 0.0% |
| South Africa | 36 | 0.0% |
| South America | 2,115 | 2.1% |
| South Central Asia | 1,266 | 1.2% |
| South Eastern Asia | 850 | 0.8% |
| Southern Europe | 101 | 0.1% |
| Spain | 26 | 0.0% |
| Sri Lanka | 333 | 0.3% |
| St. Vincent and the Grenadines | 76 | 0.1% |
| Taiwan | 9 | 0.0% |
| Thailand | 16 | 0.0% |
| Trinidad and Tobago | 222 | 0.2% |
| Turkey | 82 | 0.1% |
| Uruguay | 99 | 0.1% |
| Uzbekistan | 14 | 0.0% |
| Venezuela | 317 | 0.3% |
| Vietnam | 257 | 0.3% |
| Western Africa | 303 | 0.3% |
| Western Asia | 168 | 0.2% |
| Western Europe | 212 | 0.2% | View All 92 Rows |
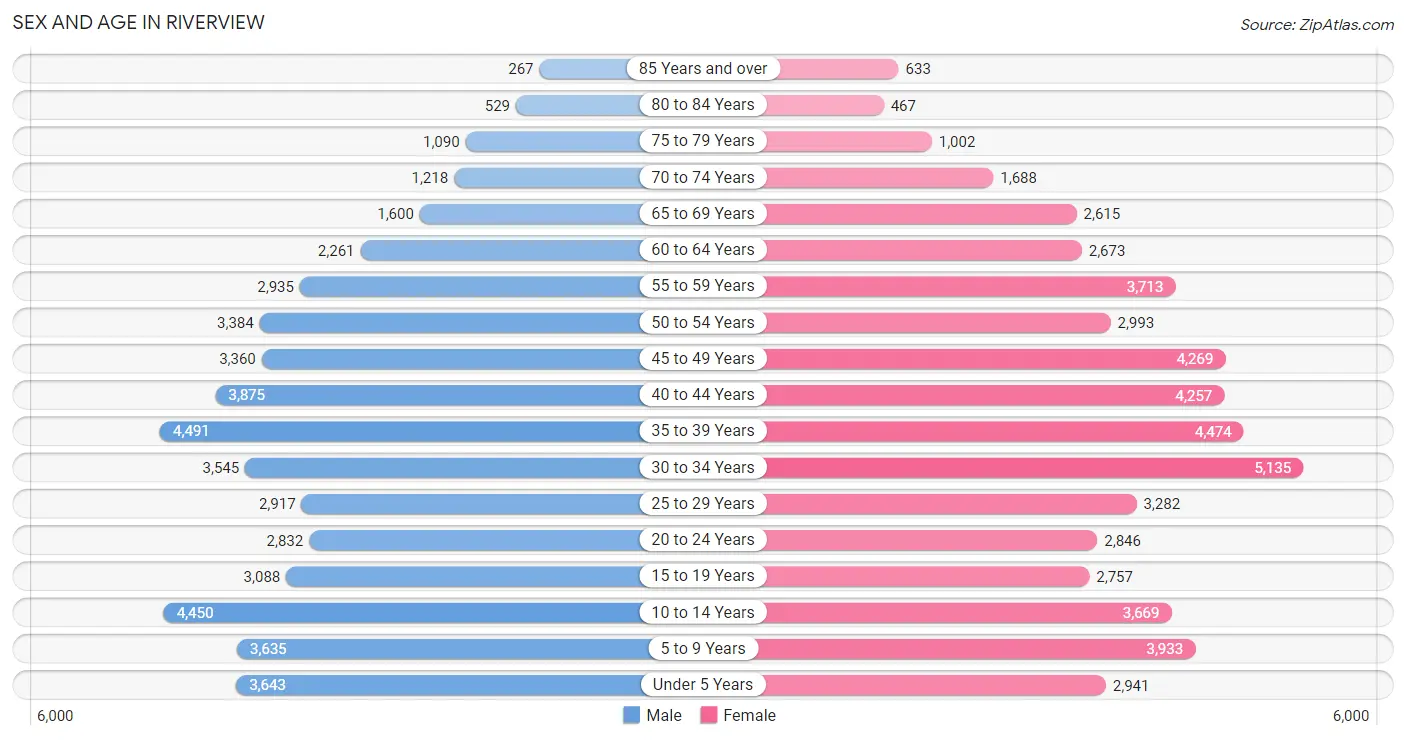
Sex and Age in Riverview
Sex and Age in Riverview
The most populous age groups in Riverview are 35 to 39 Years (4,491 | 9.1%) for men and 30 to 34 Years (5,135 | 9.6%) for women.
| Age Bracket | Male | Female |
| Under 5 Years | 3,643 (7.4%) | 2,941 (5.5%) |
| 5 to 9 Years | 3,635 (7.4%) | 3,933 (7.4%) |
| 10 to 14 Years | 4,450 (9.1%) | 3,669 (6.9%) |
| 15 to 19 Years | 3,088 (6.3%) | 2,757 (5.2%) |
| 20 to 24 Years | 2,832 (5.8%) | 2,846 (5.3%) |
| 25 to 29 Years | 2,917 (5.9%) | 3,282 (6.1%) |
| 30 to 34 Years | 3,545 (7.2%) | 5,135 (9.6%) |
| 35 to 39 Years | 4,491 (9.1%) | 4,474 (8.4%) |
| 40 to 44 Years | 3,875 (7.9%) | 4,257 (8.0%) |
| 45 to 49 Years | 3,360 (6.8%) | 4,269 (8.0%) |
| 50 to 54 Years | 3,384 (6.9%) | 2,993 (5.6%) |
| 55 to 59 Years | 2,935 (6.0%) | 3,713 (7.0%) |
| 60 to 64 Years | 2,261 (4.6%) | 2,673 (5.0%) |
| 65 to 69 Years | 1,600 (3.3%) | 2,615 (4.9%) |
| 70 to 74 Years | 1,218 (2.5%) | 1,688 (3.2%) |
| 75 to 79 Years | 1,090 (2.2%) | 1,002 (1.9%) |
| 80 to 84 Years | 529 (1.1%) | 467 (0.9%) |
| 85 Years and over | 267 (0.5%) | 633 (1.2%) |
| Total | 49,120 (100.0%) | 53,347 (100.0%) |
Families and Households in Riverview
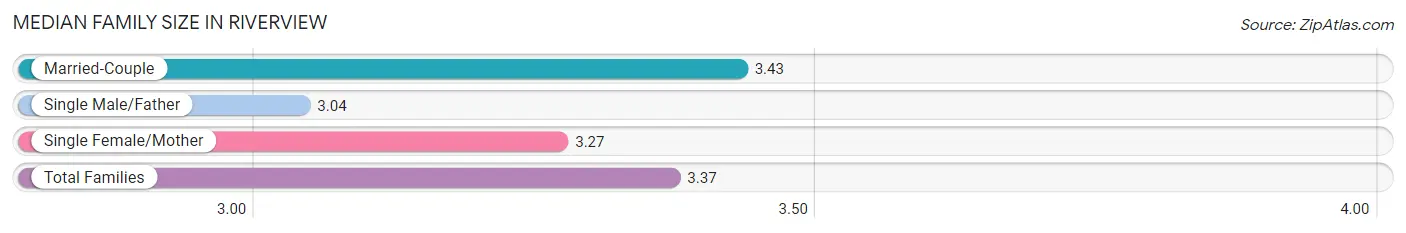
Median Family Size in Riverview
The median family size in Riverview is 3.37 persons per family, with married-couple families (18,666 | 72.6%) accounting for the largest median family size of 3.43 persons per family. On the other hand, single male/father families (1,458 | 5.7%) represent the smallest median family size with 3.04 persons per family.
| Family Type | # Families | Family Size |
| Married-Couple | 18,666 (72.6%) | 3.43 |
| Single Male/Father | 1,458 (5.7%) | 3.04 |
| Single Female/Mother | 5,571 (21.7%) | 3.27 |
| Total Families | 25,695 (100.0%) | 3.37 |
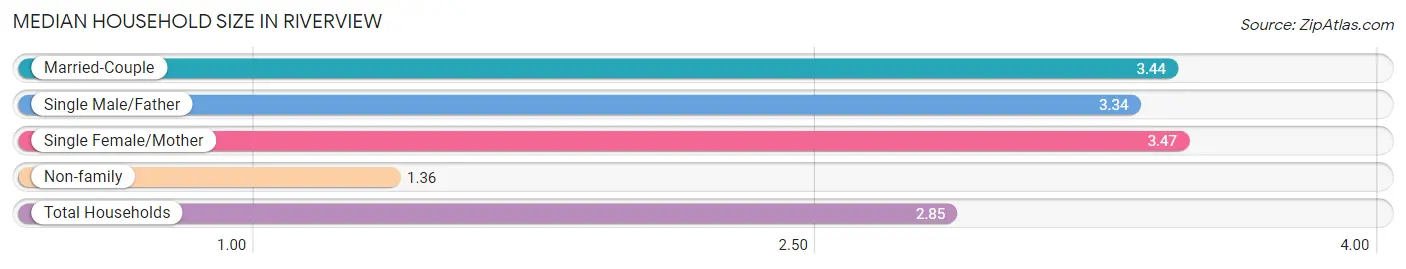
Median Household Size in Riverview
The median household size in Riverview is 2.85 persons per household, with single female/mother households (5,571 | 15.5%) accounting for the largest median household size of 3.47 persons per household. non-family households (10,253 | 28.5%) represent the smallest median household size with 1.36 persons per household.
| Household Type | # Households | Household Size |
| Married-Couple | 18,666 (51.9%) | 3.44 |
| Single Male/Father | 1,458 (4.1%) | 3.34 |
| Single Female/Mother | 5,571 (15.5%) | 3.47 |
| Non-family | 10,253 (28.5%) | 1.36 |
| Total Households | 35,948 (100.0%) | 2.85 |
Household Size by Marriage Status in Riverview
Out of a total of 35,948 households in Riverview, 25,695 (71.5%) are family households, while 10,253 (28.5%) are nonfamily households. The most numerous type of family households are 2-person households, comprising 9,402, and the most common type of nonfamily households are 1-person households, comprising 7,758.
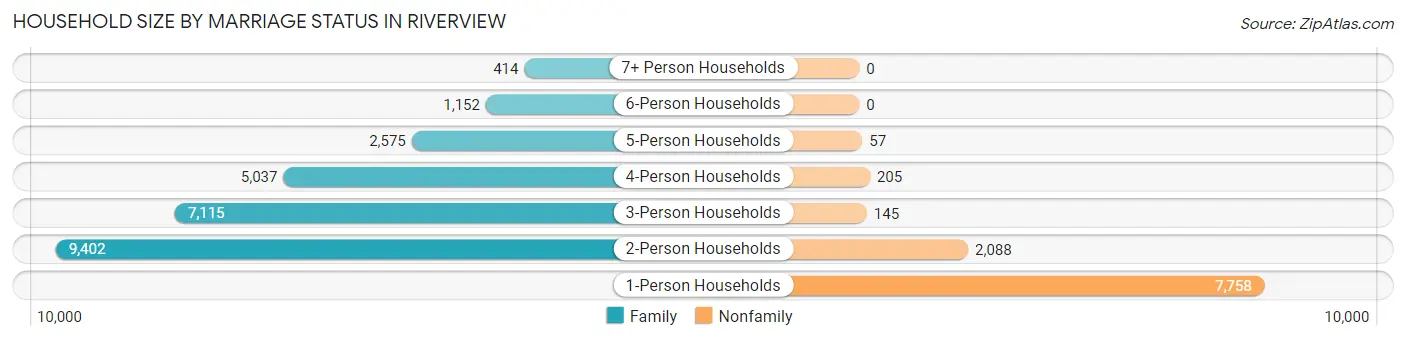
| Household Size | Family Households | Nonfamily Households |
| 1-Person Households | - | 7,758 (21.6%) |
| 2-Person Households | 9,402 (26.2%) | 2,088 (5.8%) |
| 3-Person Households | 7,115 (19.8%) | 145 (0.4%) |
| 4-Person Households | 5,037 (14.0%) | 205 (0.6%) |
| 5-Person Households | 2,575 (7.2%) | 57 (0.2%) |
| 6-Person Households | 1,152 (3.2%) | 0 (0.0%) |
| 7+ Person Households | 414 (1.1%) | 0 (0.0%) |
| Total | 25,695 (71.5%) | 10,253 (28.5%) |
Female Fertility in Riverview
Fertility by Age in Riverview
Average fertility rate in Riverview is 39.0 births per 1,000 women. Women in the age bracket of 20 to 34 years have the highest fertility rate with 73.0 births per 1,000 women. Women in the age bracket of 20 to 34 years acount for 75.9% of all women with births.
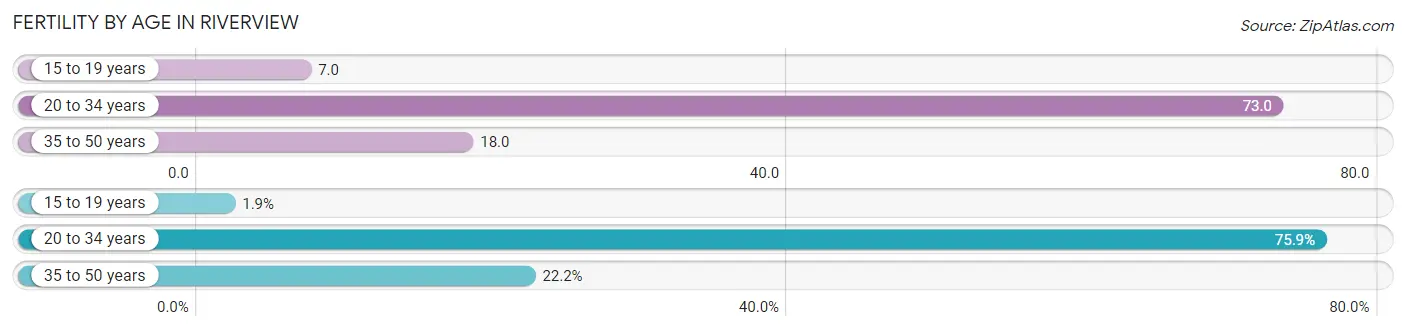
| Age Bracket | Women with Births | Births / 1,000 Women |
| 15 to 19 years | 20 (1.8%) | 7.0 |
| 20 to 34 years | 820 (75.9%) | 73.0 |
| 35 to 50 years | 240 (22.2%) | 18.0 |
| Total | 1,080 (100.0%) | 39.0 |
Fertility by Age by Marriage Status in Riverview
76.3% of women with births (1,080) in Riverview are married. The highest percentage of unmarried women with births falls into 15 to 19 years age bracket with 65.0% of them unmarried at the time of birth, while the lowest percentage of unmarried women with births belong to 35 to 50 years age bracket with 20.8% of them unmarried.
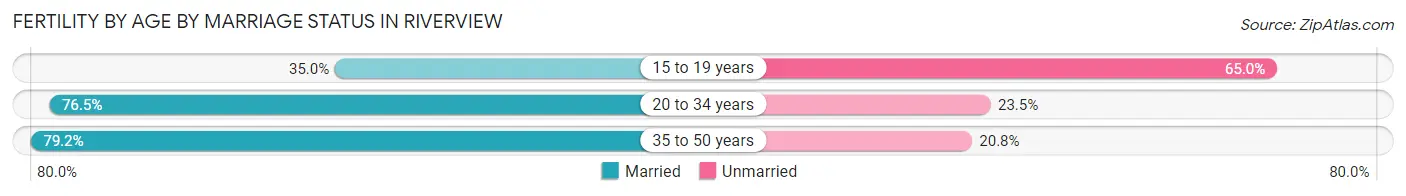
| Age Bracket | Married | Unmarried |
| 15 to 19 years | 7 (35.0%) | 13 (65.0%) |
| 20 to 34 years | 627 (76.5%) | 193 (23.5%) |
| 35 to 50 years | 190 (79.2%) | 50 (20.8%) |
| Total | 824 (76.3%) | 256 (23.7%) |
Fertility by Education in Riverview
Average fertility rate in Riverview is 39.0 births per 1,000 women. Women with the education attainment of graduate degree have the highest fertility rate of 77.0 births per 1,000 women, while women with the education attainment of high school diploma have the lowest fertility at 24.0 births per 1,000 women. Women with the education attainment of college or associate's degree represent 30.6% of all women with births.
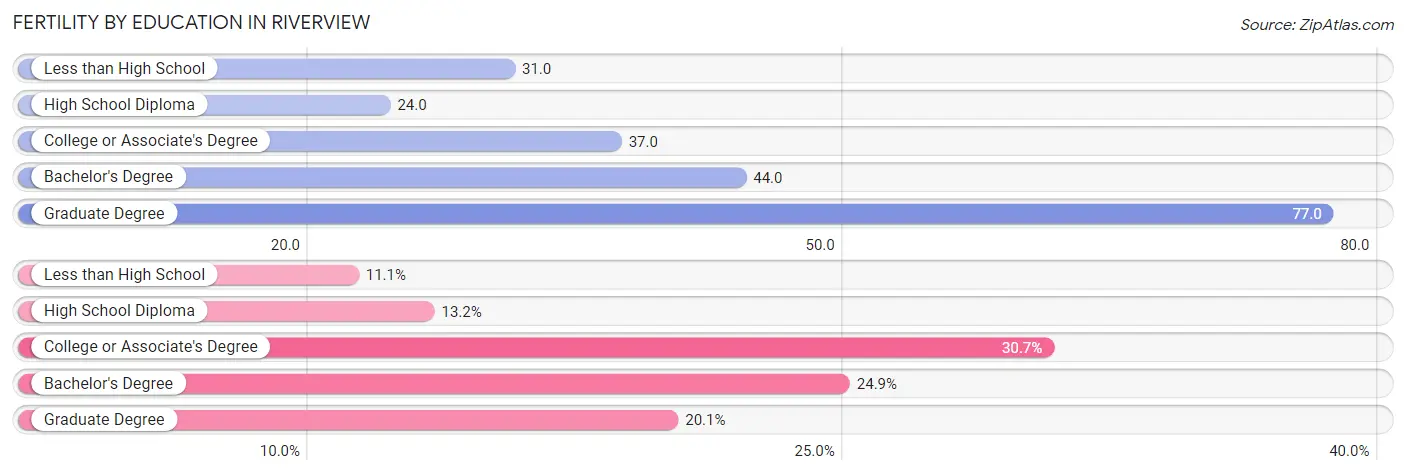
| Educational Attainment | Women with Births | Births / 1,000 Women |
| Less than High School | 120 (11.1%) | 31.0 |
| High School Diploma | 143 (13.2%) | 24.0 |
| College or Associate's Degree | 331 (30.6%) | 37.0 |
| Bachelor's Degree | 269 (24.9%) | 44.0 |
| Graduate Degree | 217 (20.1%) | 77.0 |
| Total | 1,080 (100.0%) | 39.0 |
Fertility by Education by Marriage Status in Riverview
23.7% of women with births in Riverview are unmarried. Women with the educational attainment of graduate degree are most likely to be married with 100.0% of them married at childbirth, while women with the educational attainment of high school diploma are least likely to be married with 74.1% of them unmarried at childbirth.
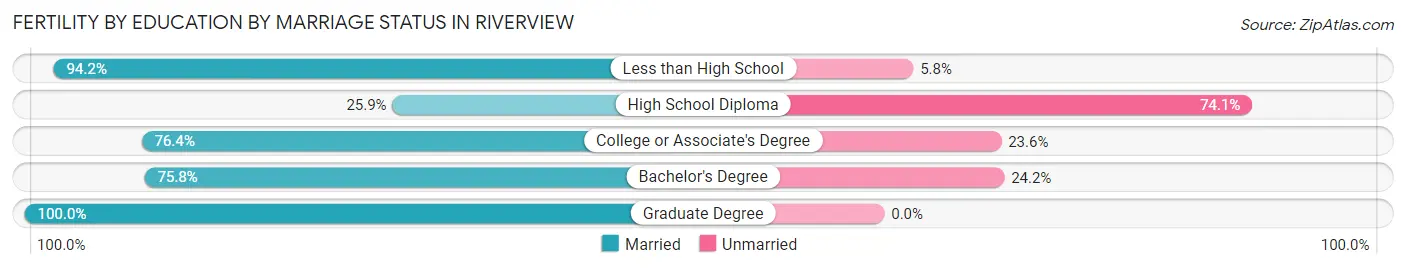
| Educational Attainment | Married | Unmarried |
| Less than High School | 113 (94.2%) | 7 (5.8%) |
| High School Diploma | 37 (25.9%) | 106 (74.1%) |
| College or Associate's Degree | 253 (76.4%) | 78 (23.6%) |
| Bachelor's Degree | 204 (75.8%) | 65 (24.2%) |
| Graduate Degree | 217 (100.0%) | 0 (0.0%) |
| Total | 824 (76.3%) | 256 (23.7%) |
Employment Characteristics in Riverview
Employment by Class of Employer in Riverview
Among the 51,780 employed individuals in Riverview, private company employees (38,115 | 73.6%), local government employees (3,043 | 5.9%), and not-for-profit organizations (3,027 | 5.9%) make up the most common classes of employment.
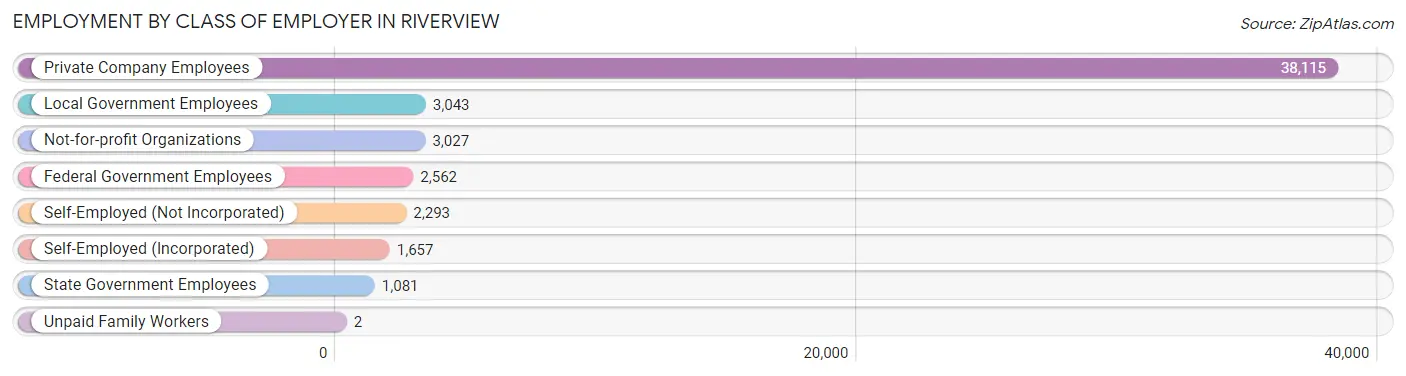
| Employer Class | # Employees | % Employees |
| Private Company Employees | 38,115 | 73.6% |
| Self-Employed (Incorporated) | 1,657 | 3.2% |
| Self-Employed (Not Incorporated) | 2,293 | 4.4% |
| Not-for-profit Organizations | 3,027 | 5.9% |
| Local Government Employees | 3,043 | 5.9% |
| State Government Employees | 1,081 | 2.1% |
| Federal Government Employees | 2,562 | 5.0% |
| Unpaid Family Workers | 2 | 0.0% |
| Total | 51,780 | 100.0% |
Employment Status by Age in Riverview
According to the labor force statistics for Riverview, out of the total population over 16 years of age (78,887), 70.8% or 55,852 individuals are in the labor force, with 5.6% or 3,128 of them unemployed. The age group with the highest labor force participation rate is 25 to 29 years, with 90.2% or 5,591 individuals in the labor force. Within the labor force, the 16 to 19 years age range has the highest percentage of unemployed individuals, with 23.3% or 462 of them being unemployed.
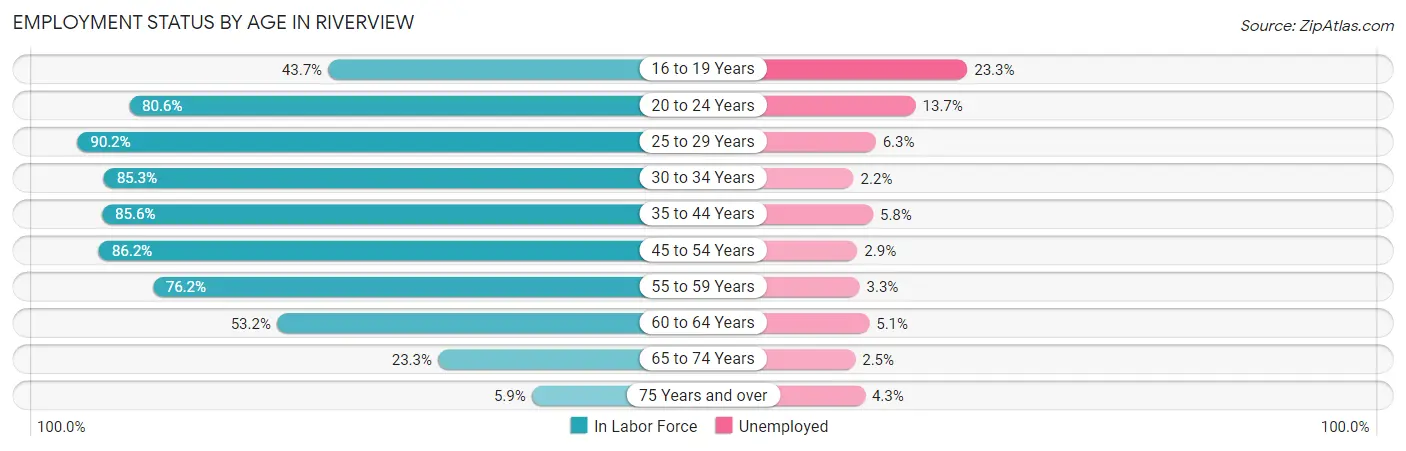
| Age Bracket | In Labor Force | Unemployed |
| 16 to 19 Years | 1,982 (43.7%) | 462 (23.3%) |
| 20 to 24 Years | 4,576 (80.6%) | 627 (13.7%) |
| 25 to 29 Years | 5,591 (90.2%) | 352 (6.3%) |
| 30 to 34 Years | 7,404 (85.3%) | 163 (2.2%) |
| 35 to 44 Years | 14,635 (85.6%) | 849 (5.8%) |
| 45 to 54 Years | 12,073 (86.2%) | 350 (2.9%) |
| 55 to 59 Years | 5,066 (76.2%) | 167 (3.3%) |
| 60 to 64 Years | 2,625 (53.2%) | 134 (5.1%) |
| 65 to 74 Years | 1,659 (23.3%) | 41 (2.5%) |
| 75 Years and over | 235 (5.9%) | 10 (4.3%) |
| Total | 55,852 (70.8%) | 3,128 (5.6%) |
Employment Status by Educational Attainment in Riverview
According to labor force statistics for Riverview, 82.3% of individuals (47,375) out of the total population between 25 and 64 years of age (57,564) are in the labor force, with 4.2% or 1,990 of them being unemployed. The group with the highest labor force participation rate are those with the educational attainment of bachelor's degree or higher, with 88.5% or 17,505 individuals in the labor force. Within the labor force, individuals with less than high school education have the highest percentage of unemployment, with 8.6% or 246 of them being unemployed.

| Educational Attainment | In Labor Force | Unemployed |
| Less than High School | 2,865 (64.5%) | 382 (8.6%) |
| High School Diploma | 10,620 (78.1%) | 748 (5.5%) |
| College / Associate Degree | 16,388 (83.0%) | 849 (4.3%) |
| Bachelor's Degree or higher | 17,505 (88.5%) | 514 (2.6%) |
| Total | 47,375 (82.3%) | 2,418 (4.2%) |
Employment Occupations by Sex in Riverview
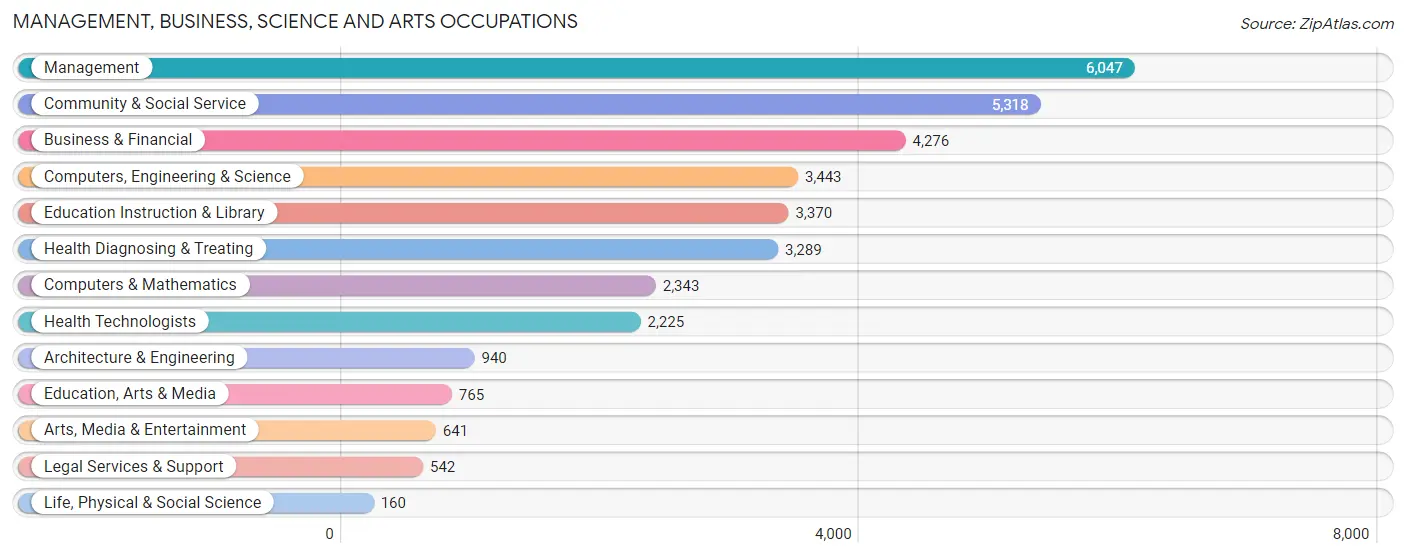
Management, Business, Science and Arts Occupations
The most common Management, Business, Science and Arts occupations in Riverview are Management (6,047 | 11.6%), Community & Social Service (5,318 | 10.2%), Business & Financial (4,276 | 8.2%), Computers, Engineering & Science (3,443 | 6.6%), and Education Instruction & Library (3,370 | 6.5%).
Management, Business, Science and Arts Occupations by Sex
Within the Management, Business, Science and Arts occupations in Riverview, the most male-oriented occupations are Arts, Media & Entertainment (81.4%), Architecture & Engineering (78.0%), and Computers, Engineering & Science (67.6%), while the most female-oriented occupations are Legal Services & Support (91.5%), Education Instruction & Library (79.4%), and Education, Arts & Media (78.7%).
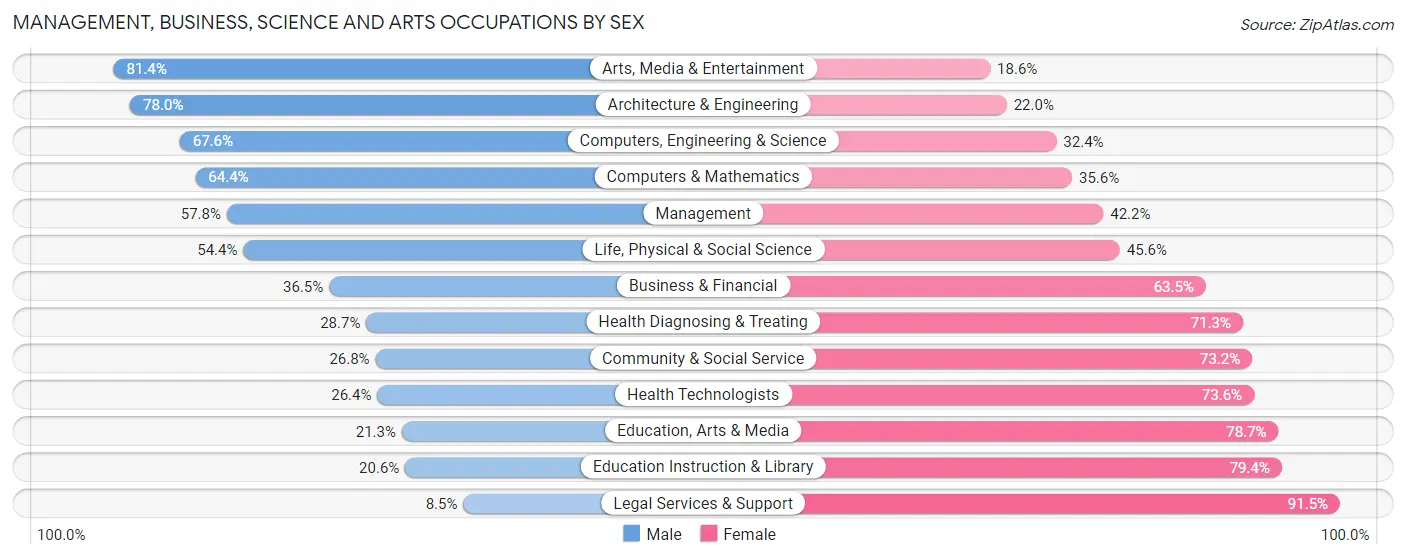
| Occupation | Male | Female |
| Management | 3,497 (57.8%) | 2,550 (42.2%) |
| Business & Financial | 1,560 (36.5%) | 2,716 (63.5%) |
| Computers, Engineering & Science | 2,328 (67.6%) | 1,115 (32.4%) |
| Computers & Mathematics | 1,508 (64.4%) | 835 (35.6%) |
| Architecture & Engineering | 733 (78.0%) | 207 (22.0%) |
| Life, Physical & Social Science | 87 (54.4%) | 73 (45.6%) |
| Community & Social Service | 1,426 (26.8%) | 3,892 (73.2%) |
| Education, Arts & Media | 163 (21.3%) | 602 (78.7%) |
| Legal Services & Support | 46 (8.5%) | 496 (91.5%) |
| Education Instruction & Library | 695 (20.6%) | 2,675 (79.4%) |
| Arts, Media & Entertainment | 522 (81.4%) | 119 (18.6%) |
| Health Diagnosing & Treating | 945 (28.7%) | 2,344 (71.3%) |
| Health Technologists | 588 (26.4%) | 1,637 (73.6%) |
| Total (Category) | 9,756 (43.6%) | 12,617 (56.4%) |
| Total (Overall) | 25,185 (48.4%) | 26,812 (51.6%) |
Services Occupations
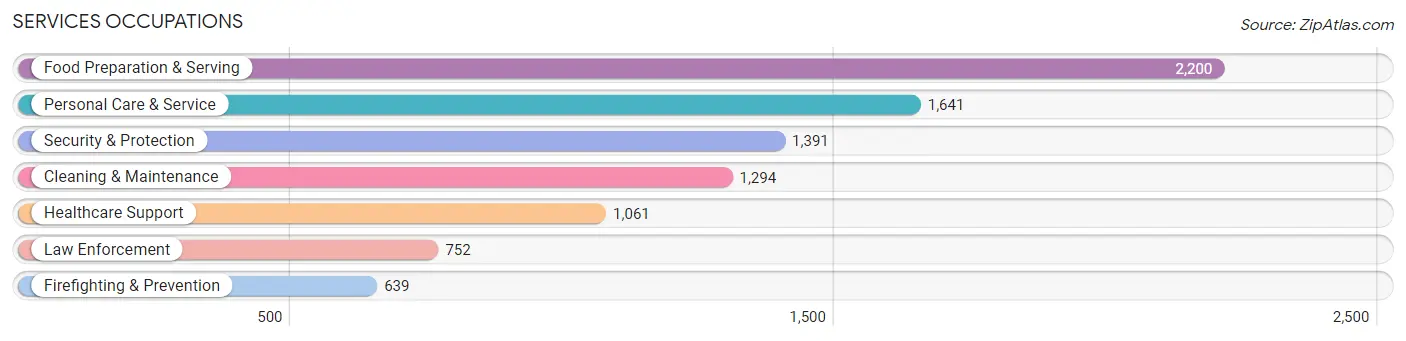
The most common Services occupations in Riverview are Food Preparation & Serving (2,200 | 4.2%), Personal Care & Service (1,641 | 3.2%), Security & Protection (1,391 | 2.7%), Cleaning & Maintenance (1,294 | 2.5%), and Healthcare Support (1,061 | 2.0%).
Services Occupations by Sex
Within the Services occupations in Riverview, the most male-oriented occupations are Law Enforcement (63.3%), Security & Protection (63.3%), and Firefighting & Prevention (63.2%), while the most female-oriented occupations are Healthcare Support (86.6%), Personal Care & Service (74.1%), and Food Preparation & Serving (49.2%).
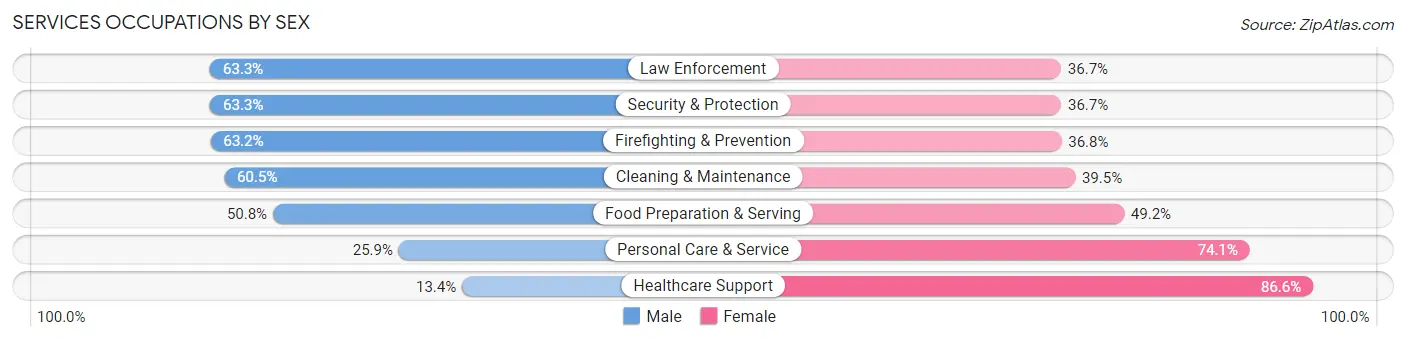
| Occupation | Male | Female |
| Healthcare Support | 142 (13.4%) | 919 (86.6%) |
| Security & Protection | 880 (63.3%) | 511 (36.7%) |
| Firefighting & Prevention | 404 (63.2%) | 235 (36.8%) |
| Law Enforcement | 476 (63.3%) | 276 (36.7%) |
| Food Preparation & Serving | 1,118 (50.8%) | 1,082 (49.2%) |
| Cleaning & Maintenance | 783 (60.5%) | 511 (39.5%) |
| Personal Care & Service | 425 (25.9%) | 1,216 (74.1%) |
| Total (Category) | 3,348 (44.1%) | 4,239 (55.9%) |
| Total (Overall) | 25,185 (48.4%) | 26,812 (51.6%) |
Sales and Office Occupations
The most common Sales and Office occupations in Riverview are Office & Administration (7,386 | 14.2%), and Sales & Related (5,798 | 11.2%).

Sales and Office Occupations by Sex
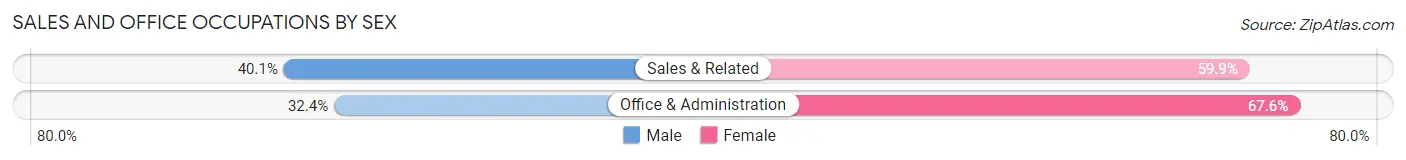
| Occupation | Male | Female |
| Sales & Related | 2,327 (40.1%) | 3,471 (59.9%) |
| Office & Administration | 2,393 (32.4%) | 4,993 (67.6%) |
| Total (Category) | 4,720 (35.8%) | 8,464 (64.2%) |
| Total (Overall) | 25,185 (48.4%) | 26,812 (51.6%) |
Natural Resources, Construction and Maintenance Occupations
The most common Natural Resources, Construction and Maintenance occupations in Riverview are Construction & Extraction (2,024 | 3.9%), Installation, Maintenance & Repair (1,299 | 2.5%), and Farming, Fishing & Forestry (120 | 0.2%).

Natural Resources, Construction and Maintenance Occupations by Sex
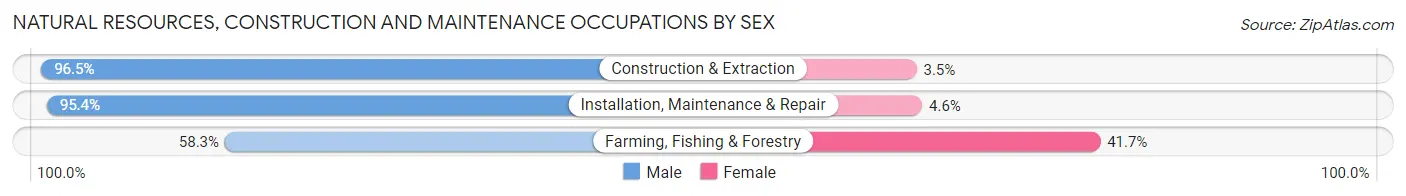
| Occupation | Male | Female |
| Farming, Fishing & Forestry | 70 (58.3%) | 50 (41.7%) |
| Construction & Extraction | 1,954 (96.5%) | 70 (3.5%) |
| Installation, Maintenance & Repair | 1,239 (95.4%) | 60 (4.6%) |
| Total (Category) | 3,263 (94.8%) | 180 (5.2%) |
| Total (Overall) | 25,185 (48.4%) | 26,812 (51.6%) |
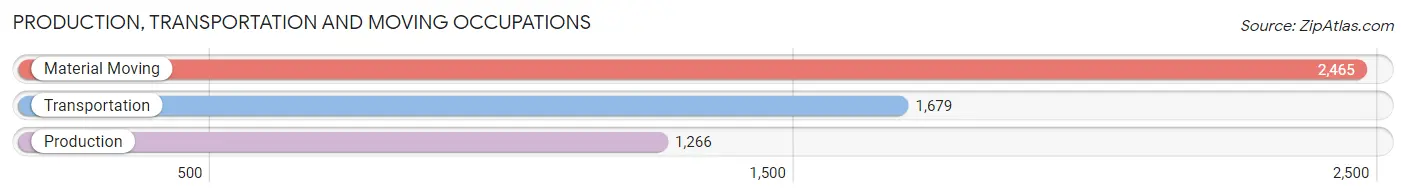
Production, Transportation and Moving Occupations
The most common Production, Transportation and Moving occupations in Riverview are Material Moving (2,465 | 4.7%), Transportation (1,679 | 3.2%), and Production (1,266 | 2.4%).
Production, Transportation and Moving Occupations by Sex
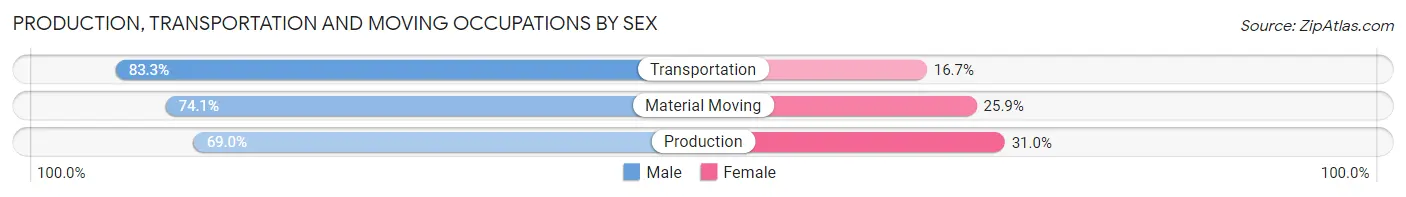
| Occupation | Male | Female |
| Production | 873 (69.0%) | 393 (31.0%) |
| Transportation | 1,398 (83.3%) | 281 (16.7%) |
| Material Moving | 1,827 (74.1%) | 638 (25.9%) |
| Total (Category) | 4,098 (75.7%) | 1,312 (24.2%) |
| Total (Overall) | 25,185 (48.4%) | 26,812 (51.6%) |
Employment Industries by Sex in Riverview
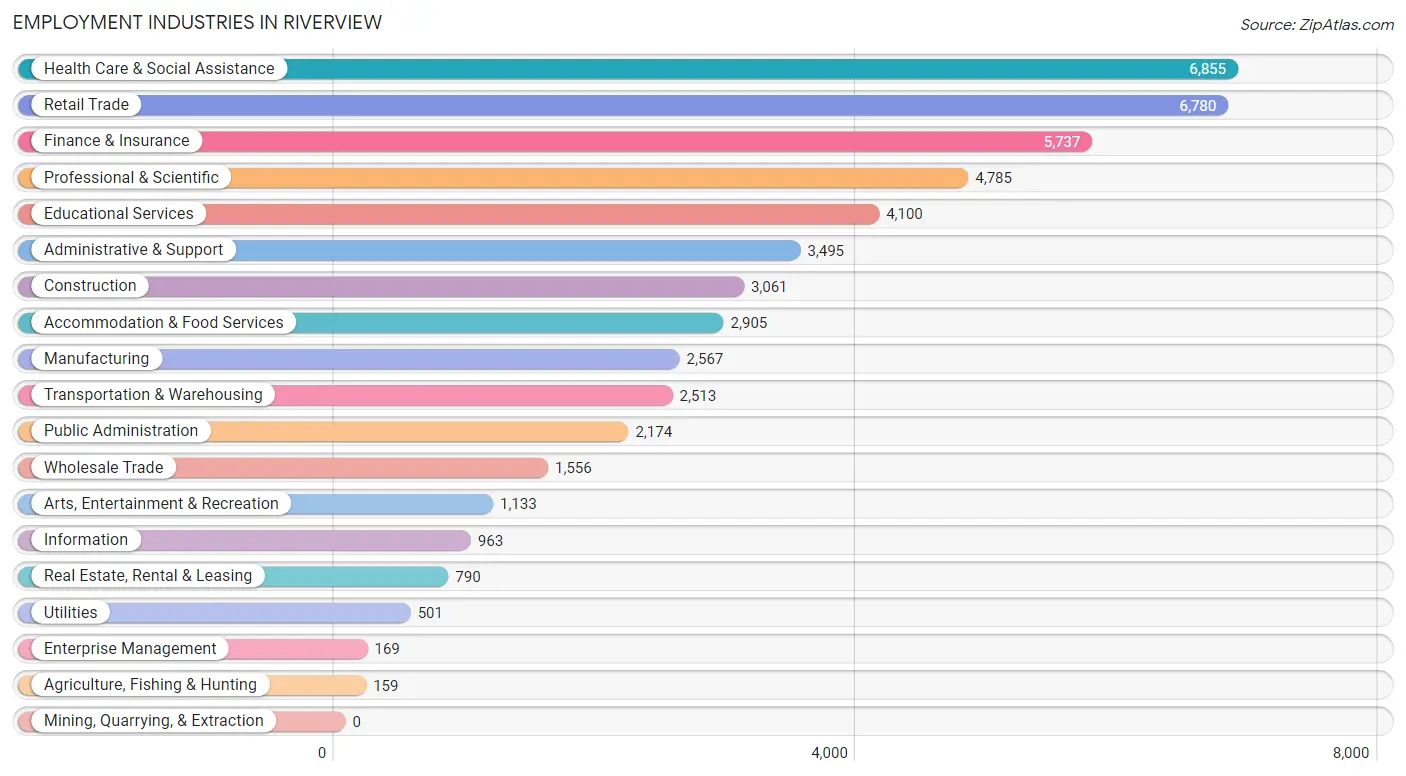
Employment Industries in Riverview
The major employment industries in Riverview include Health Care & Social Assistance (6,855 | 13.2%), Retail Trade (6,780 | 13.0%), Finance & Insurance (5,737 | 11.0%), Professional & Scientific (4,785 | 9.2%), and Educational Services (4,100 | 7.9%).
Employment Industries by Sex in Riverview
The Riverview industries that see more men than women are Transportation & Warehousing (88.7%), Construction (84.7%), and Agriculture, Fishing & Hunting (74.8%), whereas the industries that tend to have a higher number of women are Enterprise Management (86.4%), Health Care & Social Assistance (75.1%), and Educational Services (74.5%).
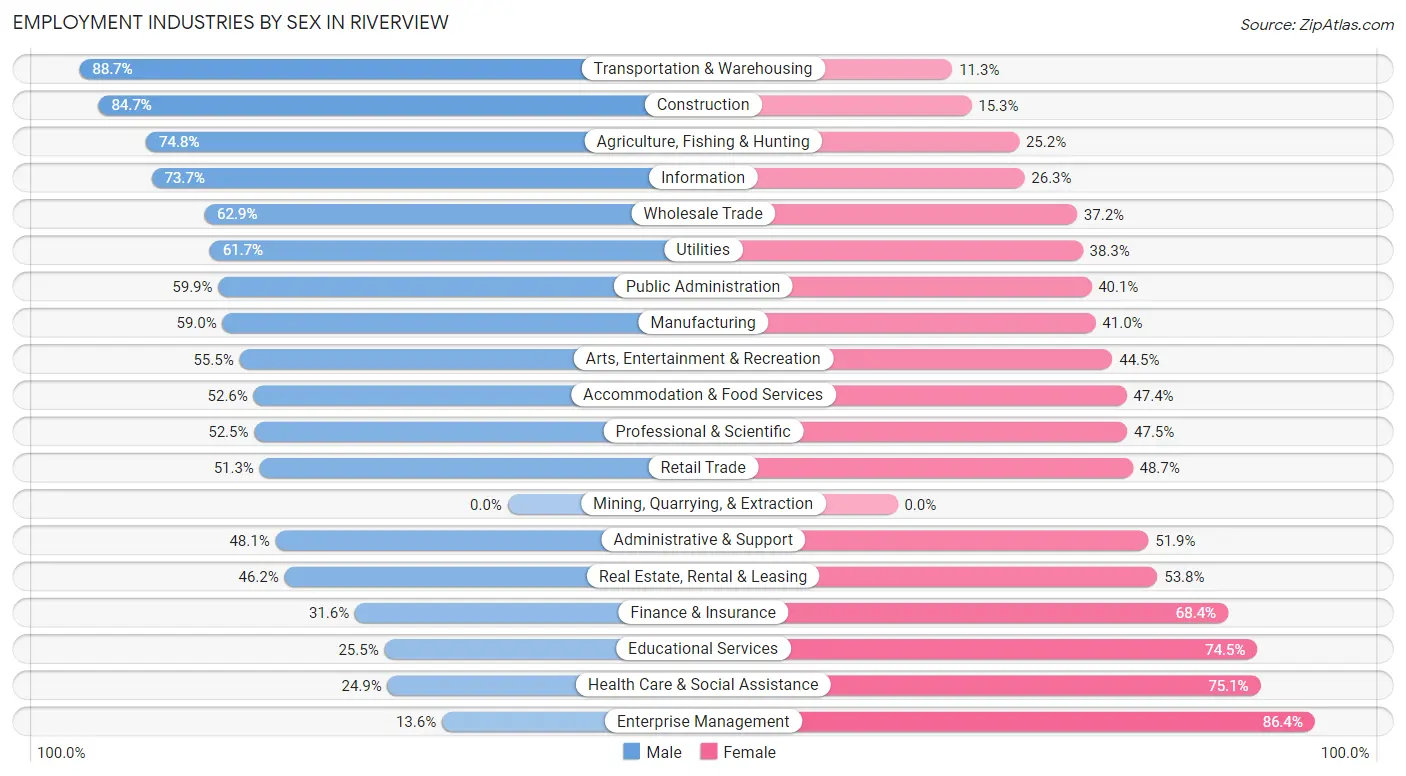
| Industry | Male | Female |
| Agriculture, Fishing & Hunting | 119 (74.8%) | 40 (25.2%) |
| Mining, Quarrying, & Extraction | 0 (0.0%) | 0 (0.0%) |
| Construction | 2,593 (84.7%) | 468 (15.3%) |
| Manufacturing | 1,515 (59.0%) | 1,052 (41.0%) |
| Wholesale Trade | 978 (62.8%) | 578 (37.1%) |
| Retail Trade | 3,481 (51.3%) | 3,299 (48.7%) |
| Transportation & Warehousing | 2,228 (88.7%) | 285 (11.3%) |
| Utilities | 309 (61.7%) | 192 (38.3%) |
| Information | 710 (73.7%) | 253 (26.3%) |
| Finance & Insurance | 1,813 (31.6%) | 3,924 (68.4%) |
| Real Estate, Rental & Leasing | 365 (46.2%) | 425 (53.8%) |
| Professional & Scientific | 2,510 (52.5%) | 2,275 (47.5%) |
| Enterprise Management | 23 (13.6%) | 146 (86.4%) |
| Administrative & Support | 1,680 (48.1%) | 1,815 (51.9%) |
| Educational Services | 1,046 (25.5%) | 3,054 (74.5%) |
| Health Care & Social Assistance | 1,705 (24.9%) | 5,150 (75.1%) |
| Arts, Entertainment & Recreation | 629 (55.5%) | 504 (44.5%) |
| Accommodation & Food Services | 1,528 (52.6%) | 1,377 (47.4%) |
| Public Administration | 1,302 (59.9%) | 872 (40.1%) |
| Total | 25,185 (48.4%) | 26,812 (51.6%) |
Education in Riverview
School Enrollment in Riverview
The most common levels of schooling among the 26,649 students in Riverview are middle school (6,480 | 24.3%), elementary school (6,134 | 23.0%), and high school (5,137 | 19.3%).
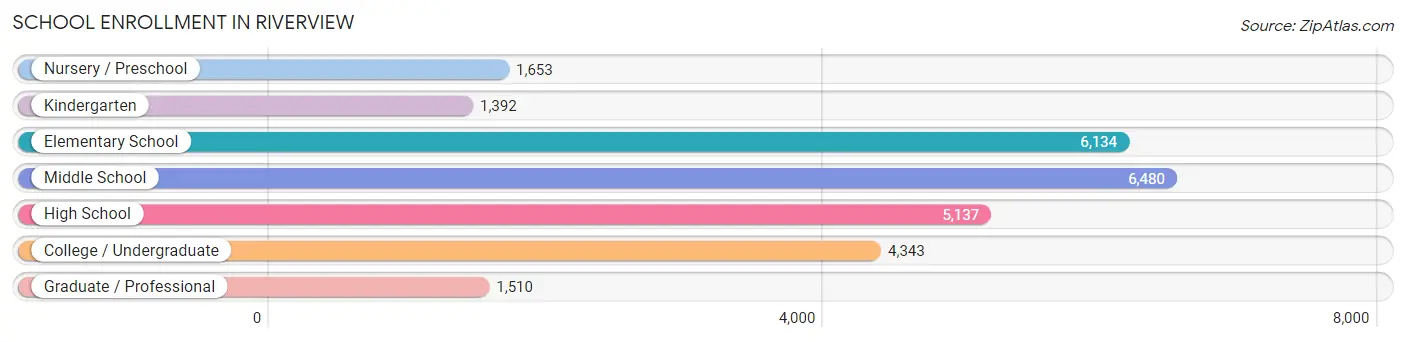
| School Level | # Students | % Students |
| Nursery / Preschool | 1,653 | 6.2% |
| Kindergarten | 1,392 | 5.2% |
| Elementary School | 6,134 | 23.0% |
| Middle School | 6,480 | 24.3% |
| High School | 5,137 | 19.3% |
| College / Undergraduate | 4,343 | 16.3% |
| Graduate / Professional | 1,510 | 5.7% |
| Total | 26,649 | 100.0% |
School Enrollment by Age by Funding Source in Riverview
Out of a total of 26,649 students who are enrolled in schools in Riverview, 4,424 (16.6%) attend a private institution, while the remaining 22,225 (83.4%) are enrolled in public schools. The age group of 25 to 34 year olds has the highest likelihood of being enrolled in private schools, with 750 (44.7% in the age bracket) enrolled. Conversely, the age group of 18 to 19 year olds has the lowest likelihood of being enrolled in a private school, with 1,166 (95.7% in the age bracket) attending a public institution.
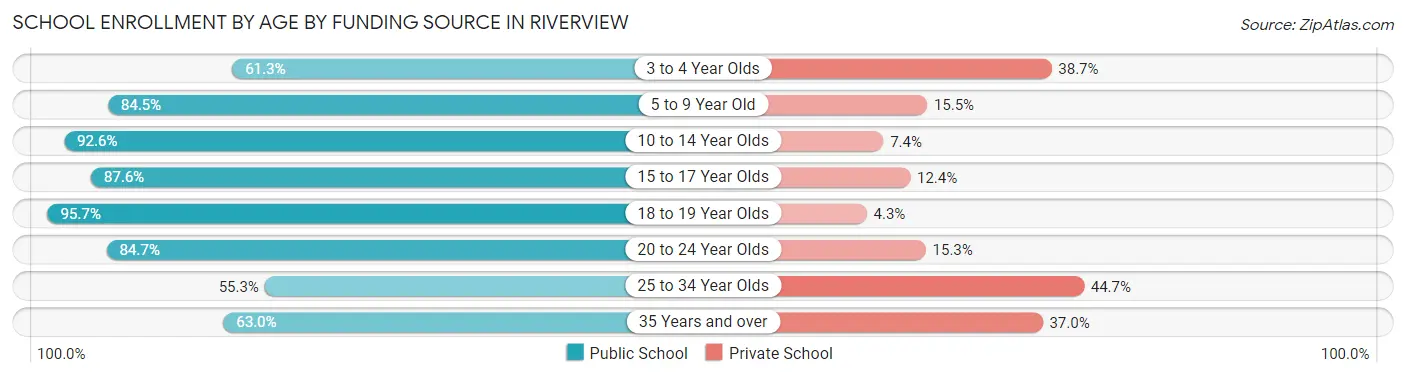
| Age Bracket | Public School | Private School |
| 3 to 4 Year Olds | 875 (61.3%) | 552 (38.7%) |
| 5 to 9 Year Old | 5,947 (84.5%) | 1,092 (15.5%) |
| 10 to 14 Year Olds | 7,324 (92.6%) | 583 (7.4%) |
| 15 to 17 Year Olds | 3,390 (87.6%) | 478 (12.4%) |
| 18 to 19 Year Olds | 1,166 (95.7%) | 52 (4.3%) |
| 20 to 24 Year Olds | 1,455 (84.7%) | 262 (15.3%) |
| 25 to 34 Year Olds | 927 (55.3%) | 750 (44.7%) |
| 35 Years and over | 1,131 (63.0%) | 665 (37.0%) |
| Total | 22,225 (83.4%) | 4,424 (16.6%) |
Educational Attainment by Field of Study in Riverview
Business (5,687 | 24.2%), arts & humanities (2,543 | 10.8%), education (2,250 | 9.6%), science & technology (2,104 | 8.9%), and social sciences (2,066 | 8.8%) are the most common fields of study among 23,521 individuals in Riverview who have obtained a bachelor's degree or higher.
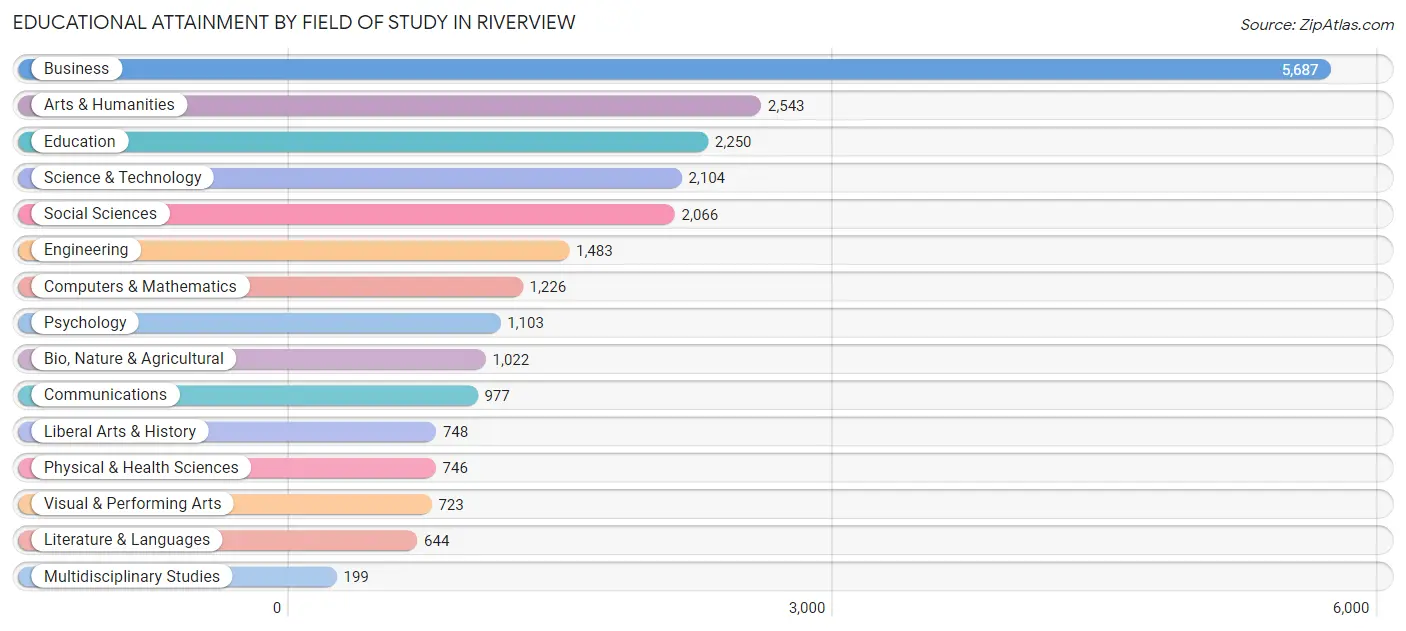
| Field of Study | # Graduates | % Graduates |
| Computers & Mathematics | 1,226 | 5.2% |
| Bio, Nature & Agricultural | 1,022 | 4.3% |
| Physical & Health Sciences | 746 | 3.2% |
| Psychology | 1,103 | 4.7% |
| Social Sciences | 2,066 | 8.8% |
| Engineering | 1,483 | 6.3% |
| Multidisciplinary Studies | 199 | 0.9% |
| Science & Technology | 2,104 | 8.9% |
| Business | 5,687 | 24.2% |
| Education | 2,250 | 9.6% |
| Literature & Languages | 644 | 2.7% |
| Liberal Arts & History | 748 | 3.2% |
| Visual & Performing Arts | 723 | 3.1% |
| Communications | 977 | 4.2% |
| Arts & Humanities | 2,543 | 10.8% |
| Total | 23,521 | 100.0% |
Transportation & Commute in Riverview
Vehicle Availability by Sex in Riverview
The most prevalent vehicle ownership categories in Riverview are males with 2 vehicles (12,334, accounting for 48.5%) and females with 2 vehicles (12,080, making up 46.9%).
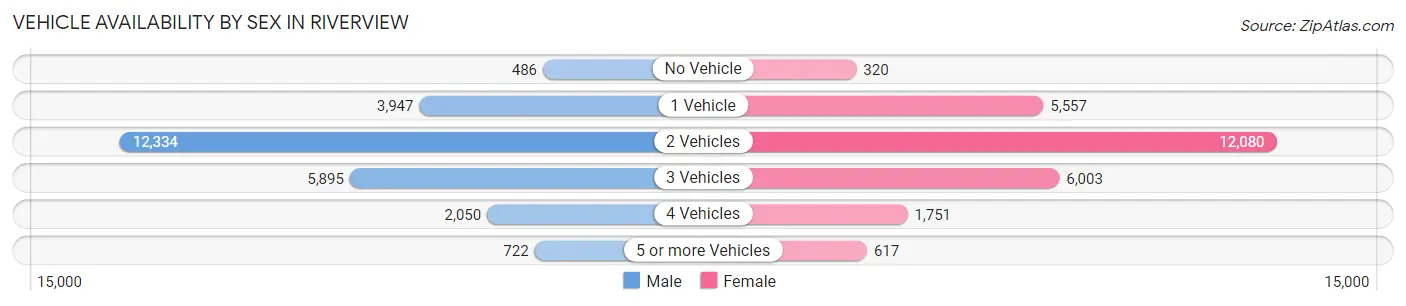
| Vehicles Available | Male | Female |
| No Vehicle | 486 (1.9%) | 320 (1.2%) |
| 1 Vehicle | 3,947 (15.5%) | 5,557 (21.1%) |
| 2 Vehicles | 12,334 (48.5%) | 12,080 (45.9%) |
| 3 Vehicles | 5,895 (23.2%) | 6,003 (22.8%) |
| 4 Vehicles | 2,050 (8.1%) | 1,751 (6.7%) |
| 5 or more Vehicles | 722 (2.8%) | 617 (2.3%) |
| Total | 25,434 (100.0%) | 26,328 (100.0%) |
Commute Time in Riverview
The most frequently occuring commute durations in Riverview are 30 to 34 minutes (7,627 commuters, 17.8%), 45 to 59 minutes (7,374 commuters, 17.2%), and 20 to 24 minutes (5,232 commuters, 12.2%).
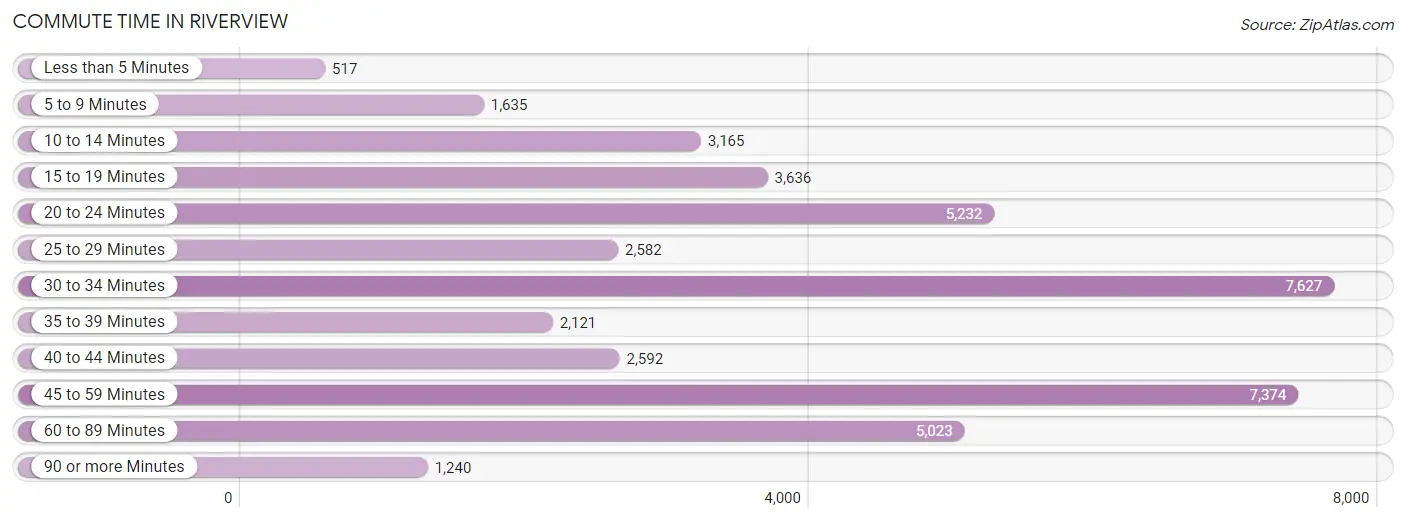
| Commute Time | # Commuters | % Commuters |
| Less than 5 Minutes | 517 | 1.2% |
| 5 to 9 Minutes | 1,635 | 3.8% |
| 10 to 14 Minutes | 3,165 | 7.4% |
| 15 to 19 Minutes | 3,636 | 8.5% |
| 20 to 24 Minutes | 5,232 | 12.2% |
| 25 to 29 Minutes | 2,582 | 6.0% |
| 30 to 34 Minutes | 7,627 | 17.8% |
| 35 to 39 Minutes | 2,121 | 5.0% |
| 40 to 44 Minutes | 2,592 | 6.1% |
| 45 to 59 Minutes | 7,374 | 17.2% |
| 60 to 89 Minutes | 5,023 | 11.7% |
| 90 or more Minutes | 1,240 | 2.9% |
Commute Time by Sex in Riverview
The most common commute times in Riverview are 45 to 59 minutes (3,844 commuters, 18.1%) for males and 30 to 34 minutes (3,848 commuters, 17.9%) for females.
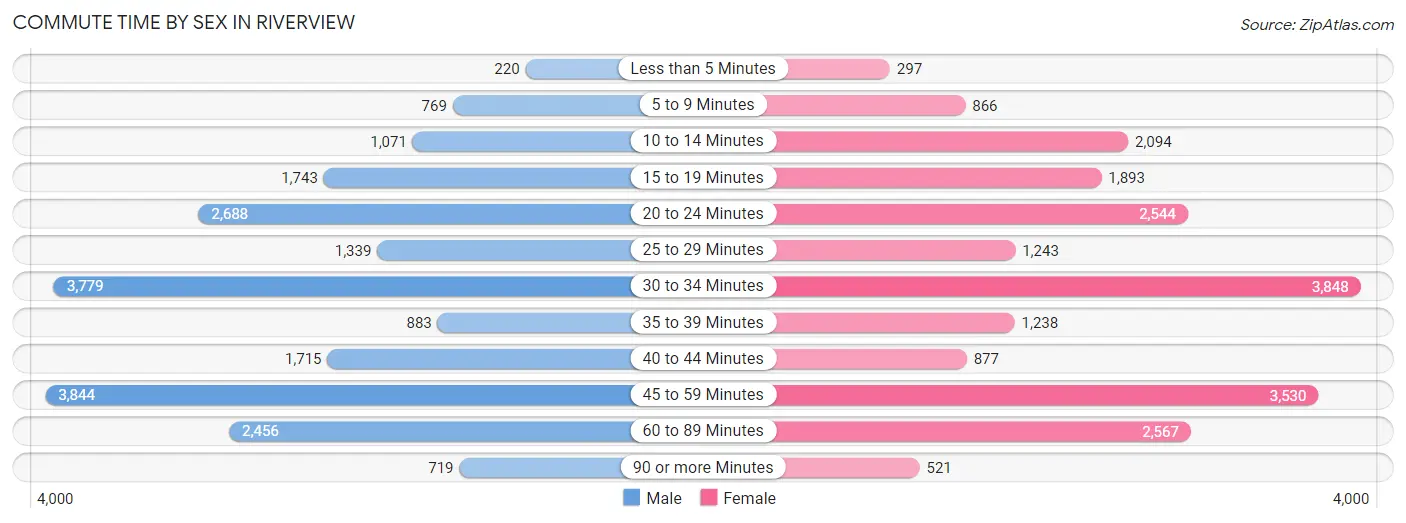
| Commute Time | Male | Female |
| Less than 5 Minutes | 220 (1.0%) | 297 (1.4%) |
| 5 to 9 Minutes | 769 (3.6%) | 866 (4.0%) |
| 10 to 14 Minutes | 1,071 (5.1%) | 2,094 (9.7%) |
| 15 to 19 Minutes | 1,743 (8.2%) | 1,893 (8.8%) |
| 20 to 24 Minutes | 2,688 (12.7%) | 2,544 (11.8%) |
| 25 to 29 Minutes | 1,339 (6.3%) | 1,243 (5.8%) |
| 30 to 34 Minutes | 3,779 (17.8%) | 3,848 (17.9%) |
| 35 to 39 Minutes | 883 (4.2%) | 1,238 (5.8%) |
| 40 to 44 Minutes | 1,715 (8.1%) | 877 (4.1%) |
| 45 to 59 Minutes | 3,844 (18.1%) | 3,530 (16.4%) |
| 60 to 89 Minutes | 2,456 (11.6%) | 2,567 (11.9%) |
| 90 or more Minutes | 719 (3.4%) | 521 (2.4%) |
Time of Departure to Work by Sex in Riverview
The most frequent times of departure to work in Riverview are 6:00 AM to 6:29 AM (3,255, 15.3%) for males and 7:00 AM to 7:29 AM (3,454, 16.1%) for females.
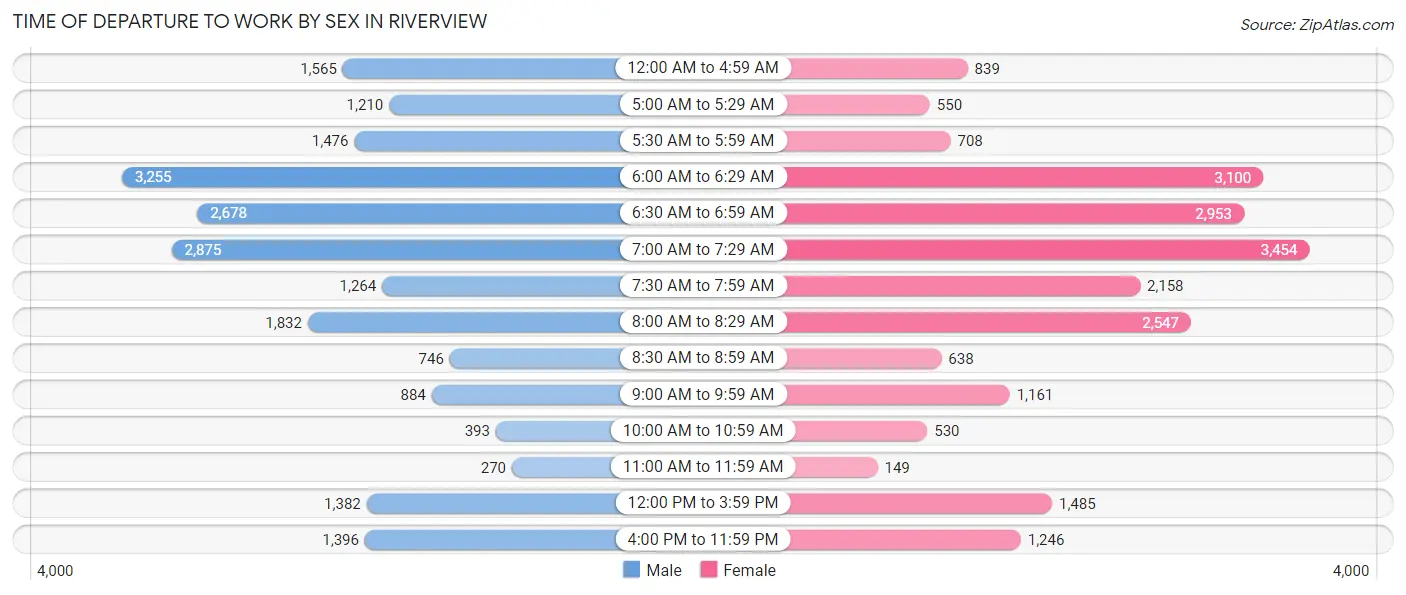
| Time of Departure | Male | Female |
| 12:00 AM to 4:59 AM | 1,565 (7.4%) | 839 (3.9%) |
| 5:00 AM to 5:29 AM | 1,210 (5.7%) | 550 (2.6%) |
| 5:30 AM to 5:59 AM | 1,476 (7.0%) | 708 (3.3%) |
| 6:00 AM to 6:29 AM | 3,255 (15.3%) | 3,100 (14.4%) |
| 6:30 AM to 6:59 AM | 2,678 (12.6%) | 2,953 (13.7%) |
| 7:00 AM to 7:29 AM | 2,875 (13.5%) | 3,454 (16.1%) |
| 7:30 AM to 7:59 AM | 1,264 (5.9%) | 2,158 (10.0%) |
| 8:00 AM to 8:29 AM | 1,832 (8.6%) | 2,547 (11.8%) |
| 8:30 AM to 8:59 AM | 746 (3.5%) | 638 (3.0%) |
| 9:00 AM to 9:59 AM | 884 (4.2%) | 1,161 (5.4%) |
| 10:00 AM to 10:59 AM | 393 (1.8%) | 530 (2.5%) |
| 11:00 AM to 11:59 AM | 270 (1.3%) | 149 (0.7%) |
| 12:00 PM to 3:59 PM | 1,382 (6.5%) | 1,485 (6.9%) |
| 4:00 PM to 11:59 PM | 1,396 (6.6%) | 1,246 (5.8%) |
| Total | 21,226 (100.0%) | 21,518 (100.0%) |
Housing Occupancy in Riverview
Occupancy by Ownership in Riverview
Of the total 35,948 dwellings in Riverview, owner-occupied units account for 26,095 (72.6%), while renter-occupied units make up 9,853 (27.4%).
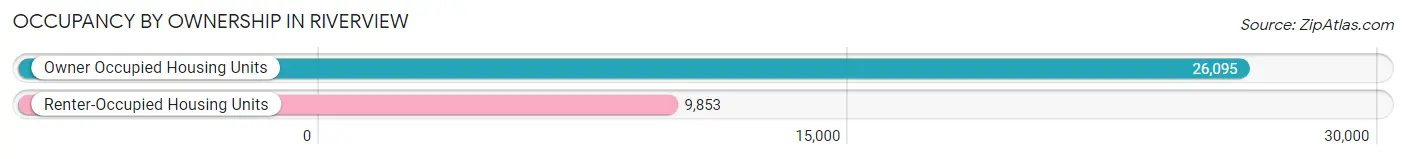
| Occupancy | # Housing Units | % Housing Units |
| Owner Occupied Housing Units | 26,095 | 72.6% |
| Renter-Occupied Housing Units | 9,853 | 27.4% |
| Total Occupied Housing Units | 35,948 | 100.0% |
Occupancy by Household Size in Riverview
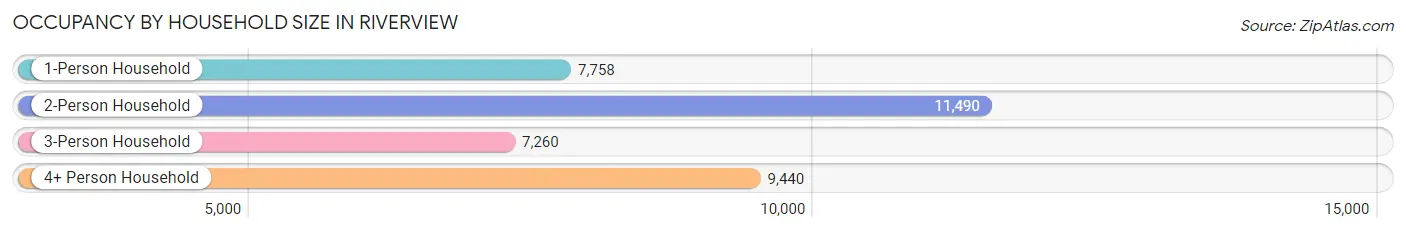
| Household Size | # Housing Units | % Housing Units |
| 1-Person Household | 7,758 | 21.6% |
| 2-Person Household | 11,490 | 32.0% |
| 3-Person Household | 7,260 | 20.2% |
| 4+ Person Household | 9,440 | 26.3% |
| Total Housing Units | 35,948 | 100.0% |
Occupancy by Ownership by Household Size in Riverview
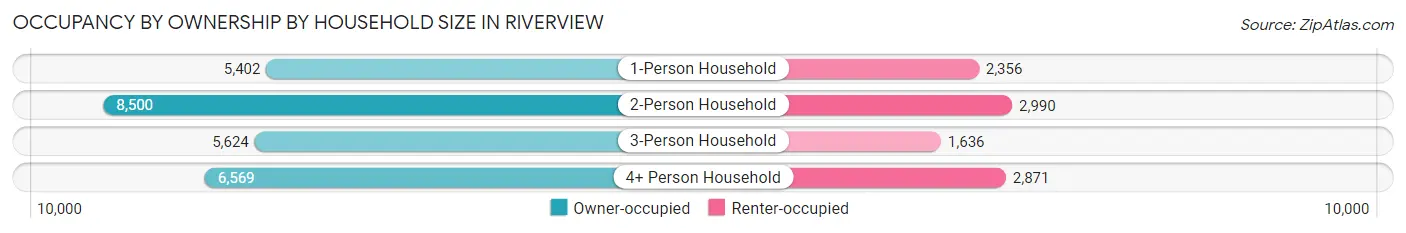
| Household Size | Owner-occupied | Renter-occupied |
| 1-Person Household | 5,402 (69.6%) | 2,356 (30.4%) |
| 2-Person Household | 8,500 (74.0%) | 2,990 (26.0%) |
| 3-Person Household | 5,624 (77.5%) | 1,636 (22.5%) |
| 4+ Person Household | 6,569 (69.6%) | 2,871 (30.4%) |
| Total Housing Units | 26,095 (72.6%) | 9,853 (27.4%) |
Occupancy by Educational Attainment in Riverview
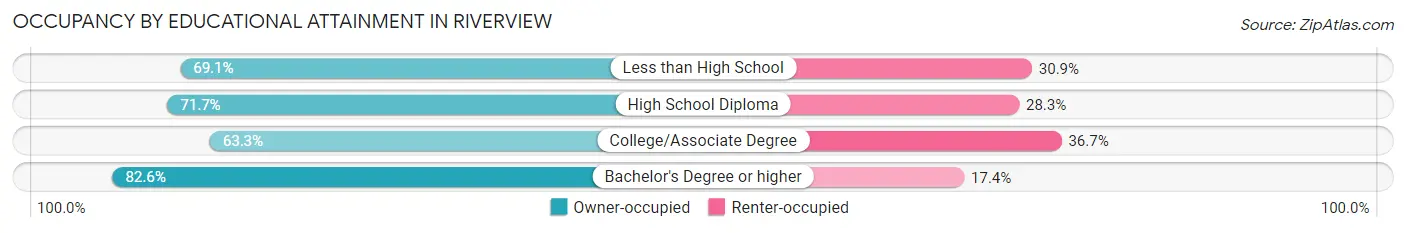
| Household Size | Owner-occupied | Renter-occupied |
| Less than High School | 1,359 (69.1%) | 607 (30.9%) |
| High School Diploma | 5,901 (71.7%) | 2,331 (28.3%) |
| College/Associate Degree | 7,950 (63.3%) | 4,617 (36.7%) |
| Bachelor's Degree or higher | 10,885 (82.6%) | 2,298 (17.4%) |
Occupancy by Age of Householder in Riverview
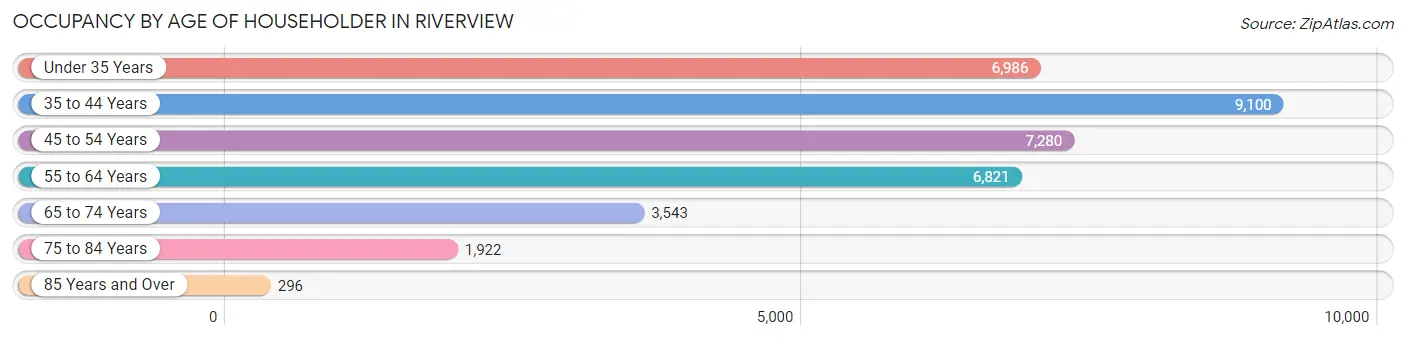
| Age Bracket | # Households | % Households |
| Under 35 Years | 6,986 | 19.4% |
| 35 to 44 Years | 9,100 | 25.3% |
| 45 to 54 Years | 7,280 | 20.3% |
| 55 to 64 Years | 6,821 | 19.0% |
| 65 to 74 Years | 3,543 | 9.9% |
| 75 to 84 Years | 1,922 | 5.3% |
| 85 Years and Over | 296 | 0.8% |
| Total | 35,948 | 100.0% |
Housing Finances in Riverview
Median Income by Occupancy in Riverview
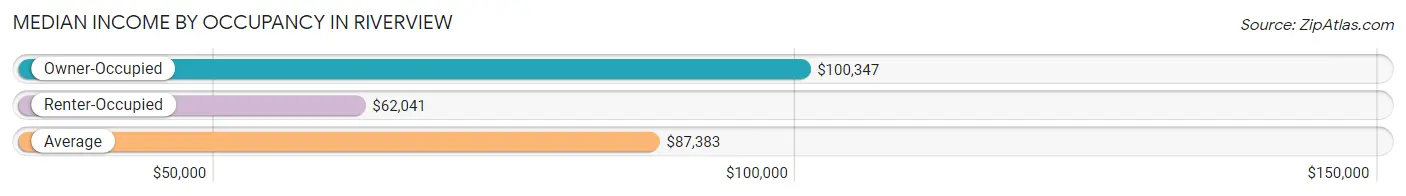
| Occupancy Type | # Households | Median Income |
| Owner-Occupied | 26,095 (72.6%) | $100,347 |
| Renter-Occupied | 9,853 (27.4%) | $62,041 |
| Average | 35,948 (100.0%) | $87,383 |
Occupancy by Householder Income Bracket in Riverview
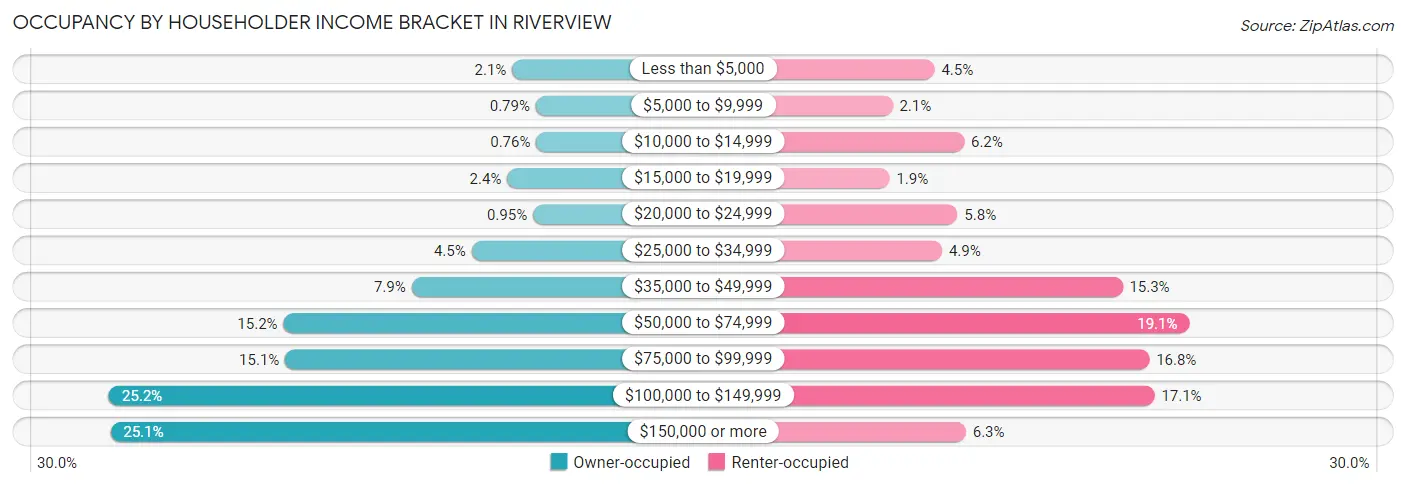
| Income Bracket | Owner-occupied | Renter-occupied |
| Less than $5,000 | 558 (2.1%) | 444 (4.5%) |
| $5,000 to $9,999 | 205 (0.8%) | 208 (2.1%) |
| $10,000 to $14,999 | 199 (0.8%) | 611 (6.2%) |
| $15,000 to $19,999 | 632 (2.4%) | 191 (1.9%) |
| $20,000 to $24,999 | 248 (0.9%) | 573 (5.8%) |
| $25,000 to $34,999 | 1,163 (4.5%) | 487 (4.9%) |
| $35,000 to $49,999 | 2,059 (7.9%) | 1,503 (15.2%) |
| $50,000 to $74,999 | 3,969 (15.2%) | 1,879 (19.1%) |
| $75,000 to $99,999 | 3,942 (15.1%) | 1,653 (16.8%) |
| $100,000 to $149,999 | 6,571 (25.2%) | 1,683 (17.1%) |
| $150,000 or more | 6,549 (25.1%) | 621 (6.3%) |
| Total | 26,095 (100.0%) | 9,853 (100.0%) |
Monthly Housing Cost Tiers in Riverview
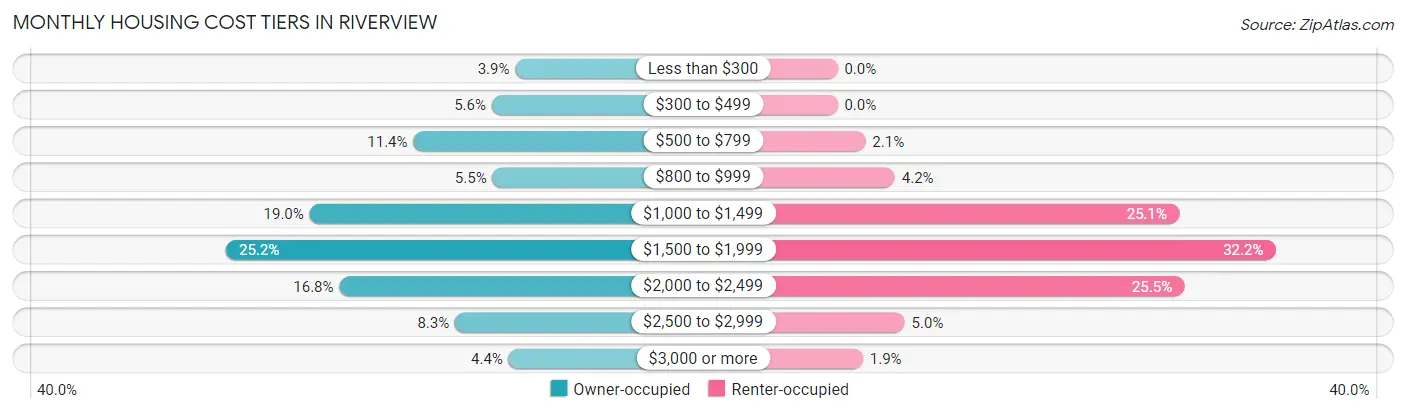
| Monthly Cost | Owner-occupied | Renter-occupied |
| Less than $300 | 1,006 (3.9%) | 0 (0.0%) |
| $300 to $499 | 1,460 (5.6%) | 0 (0.0%) |
| $500 to $799 | 2,968 (11.4%) | 203 (2.1%) |
| $800 to $999 | 1,446 (5.5%) | 417 (4.2%) |
| $1,000 to $1,499 | 4,961 (19.0%) | 2,477 (25.1%) |
| $1,500 to $1,999 | 6,565 (25.2%) | 3,177 (32.2%) |
| $2,000 to $2,499 | 4,388 (16.8%) | 2,514 (25.5%) |
| $2,500 to $2,999 | 2,166 (8.3%) | 488 (5.0%) |
| $3,000 or more | 1,135 (4.3%) | 184 (1.9%) |
| Total | 26,095 (100.0%) | 9,853 (100.0%) |
Physical Housing Characteristics in Riverview
Housing Structures in Riverview
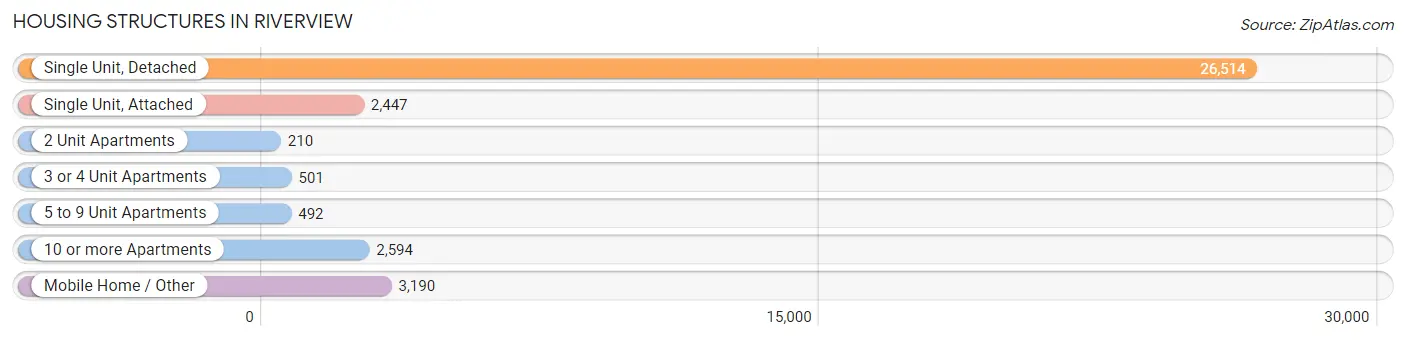
| Structure Type | # Housing Units | % Housing Units |
| Single Unit, Detached | 26,514 | 73.8% |
| Single Unit, Attached | 2,447 | 6.8% |
| 2 Unit Apartments | 210 | 0.6% |
| 3 or 4 Unit Apartments | 501 | 1.4% |
| 5 to 9 Unit Apartments | 492 | 1.4% |
| 10 or more Apartments | 2,594 | 7.2% |
| Mobile Home / Other | 3,190 | 8.9% |
| Total | 35,948 | 100.0% |
Housing Structures by Occupancy in Riverview
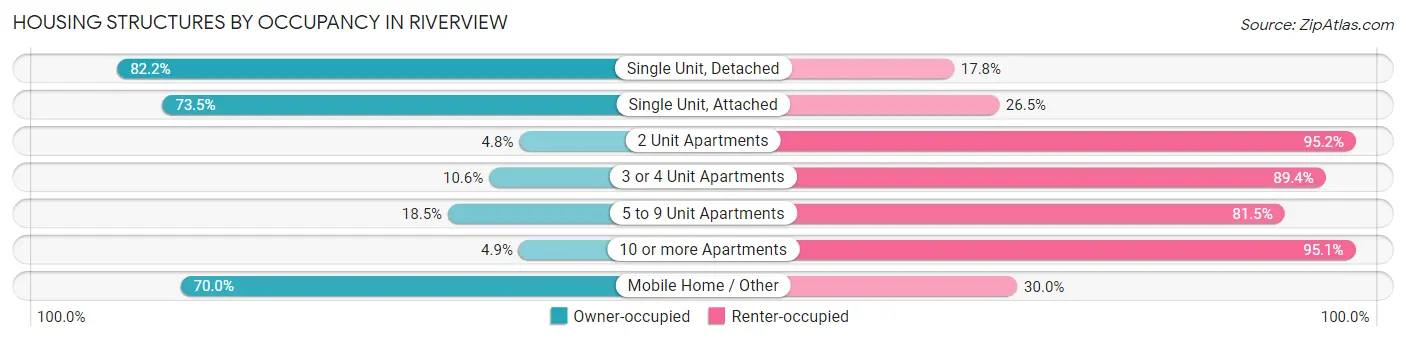
| Structure Type | Owner-occupied | Renter-occupied |
| Single Unit, Detached | 21,785 (82.2%) | 4,729 (17.8%) |
| Single Unit, Attached | 1,798 (73.5%) | 649 (26.5%) |
| 2 Unit Apartments | 10 (4.8%) | 200 (95.2%) |
| 3 or 4 Unit Apartments | 53 (10.6%) | 448 (89.4%) |
| 5 to 9 Unit Apartments | 91 (18.5%) | 401 (81.5%) |
| 10 or more Apartments | 126 (4.9%) | 2,468 (95.1%) |
| Mobile Home / Other | 2,232 (70.0%) | 958 (30.0%) |
| Total | 26,095 (72.6%) | 9,853 (27.4%) |
Housing Structures by Number of Rooms in Riverview
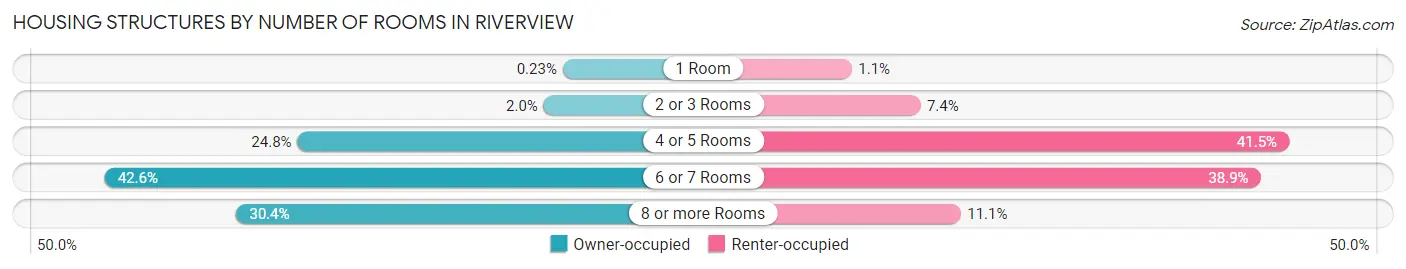
| Number of Rooms | Owner-occupied | Renter-occupied |
| 1 Room | 60 (0.2%) | 104 (1.1%) |
| 2 or 3 Rooms | 518 (2.0%) | 729 (7.4%) |
| 4 or 5 Rooms | 6,464 (24.8%) | 4,091 (41.5%) |
| 6 or 7 Rooms | 11,115 (42.6%) | 3,832 (38.9%) |
| 8 or more Rooms | 7,938 (30.4%) | 1,097 (11.1%) |
| Total | 26,095 (100.0%) | 9,853 (100.0%) |
Housing Structure by Heating Type in Riverview
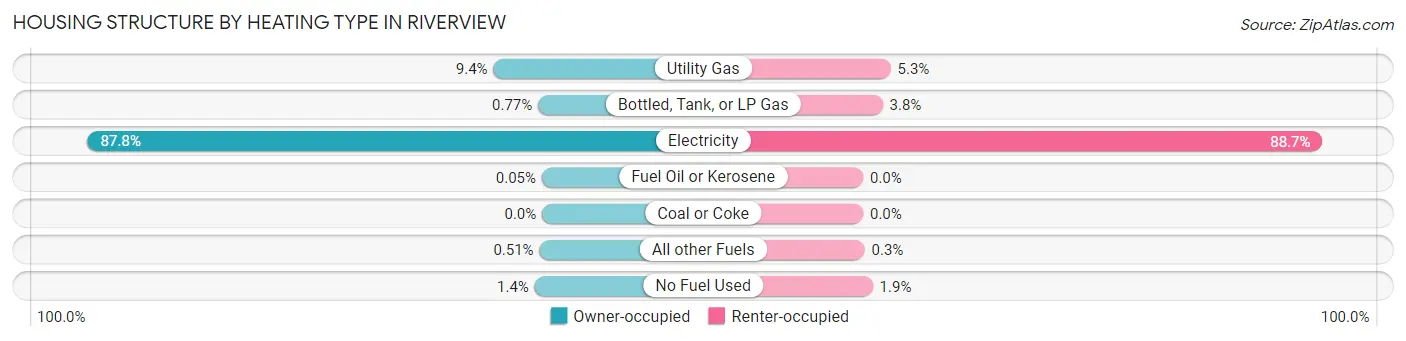
| Heating Type | Owner-occupied | Renter-occupied |
| Utility Gas | 2,455 (9.4%) | 524 (5.3%) |
| Bottled, Tank, or LP Gas | 200 (0.8%) | 372 (3.8%) |
| Electricity | 22,921 (87.8%) | 8,744 (88.7%) |
| Fuel Oil or Kerosene | 12 (0.1%) | 0 (0.0%) |
| Coal or Coke | 0 (0.0%) | 0 (0.0%) |
| All other Fuels | 133 (0.5%) | 30 (0.3%) |
| No Fuel Used | 374 (1.4%) | 183 (1.9%) |
| Total | 26,095 (100.0%) | 9,853 (100.0%) |
Household Vehicle Usage in Riverview
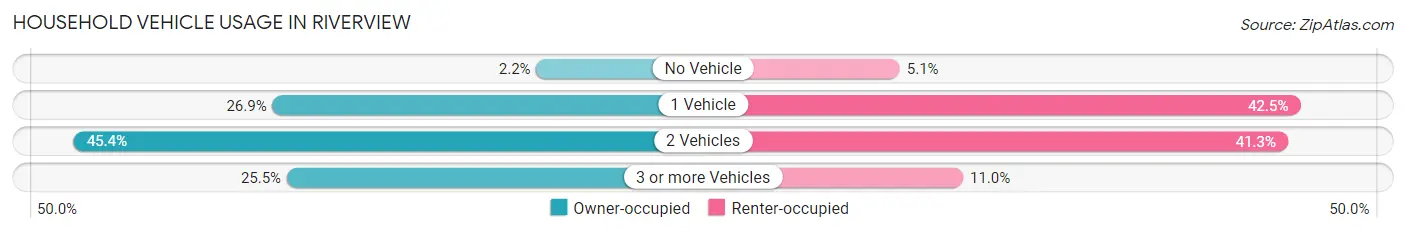
| Vehicles per Household | Owner-occupied | Renter-occupied |
| No Vehicle | 579 (2.2%) | 505 (5.1%) |
| 1 Vehicle | 7,008 (26.9%) | 4,188 (42.5%) |
| 2 Vehicles | 11,850 (45.4%) | 4,073 (41.3%) |
| 3 or more Vehicles | 6,658 (25.5%) | 1,087 (11.0%) |
| Total | 26,095 (100.0%) | 9,853 (100.0%) |
Real Estate & Mortgages in Riverview
Real Estate and Mortgage Overview in Riverview
| Characteristic | Without Mortgage | With Mortgage |
| Housing Units | 6,330 | 19,765 |
| Median Property Value | $269,500 | $298,300 |
| Median Household Income | $72,962 | $5,229 |
| Monthly Housing Costs | $576 | $1,127 |
| Real Estate Taxes | $2,611 | $1,095 |
Property Value by Mortgage Status in Riverview
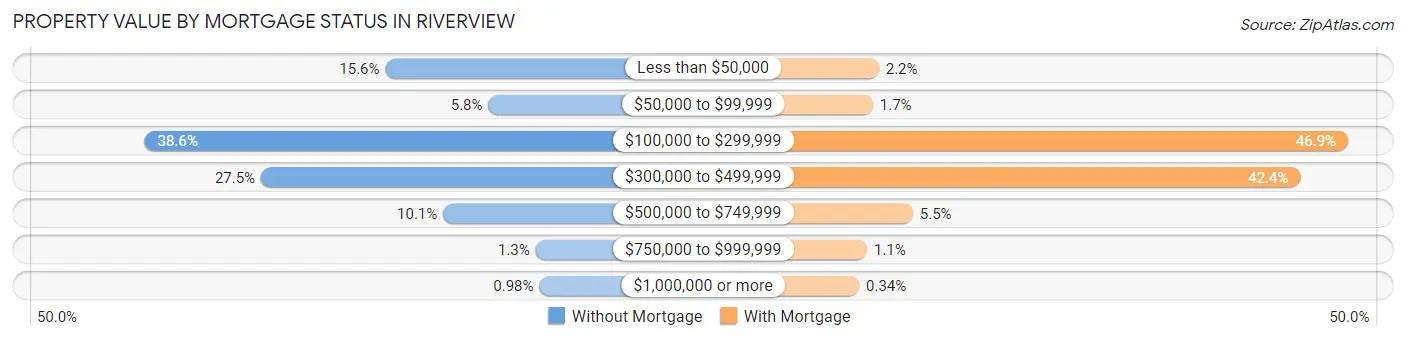
| Property Value | Without Mortgage | With Mortgage |
| Less than $50,000 | 990 (15.6%) | 436 (2.2%) |
| $50,000 to $99,999 | 369 (5.8%) | 327 (1.7%) |
| $100,000 to $299,999 | 2,442 (38.6%) | 9,268 (46.9%) |
| $300,000 to $499,999 | 1,740 (27.5%) | 8,371 (42.3%) |
| $500,000 to $749,999 | 642 (10.1%) | 1,079 (5.5%) |
| $750,000 to $999,999 | 85 (1.3%) | 216 (1.1%) |
| $1,000,000 or more | 62 (1.0%) | 68 (0.3%) |
| Total | 6,330 (100.0%) | 19,765 (100.0%) |
Household Income by Mortgage Status in Riverview
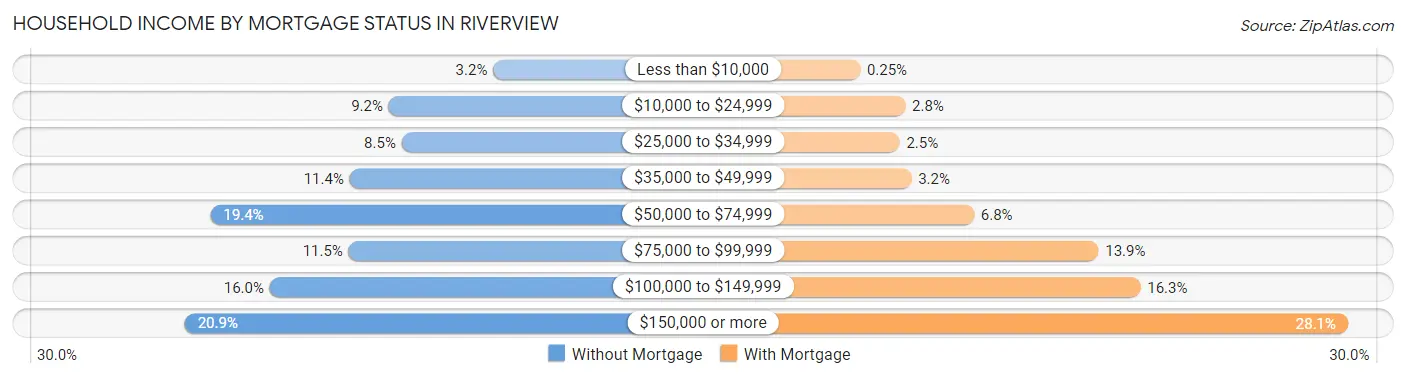
| Household Income | Without Mortgage | With Mortgage |
| Less than $10,000 | 204 (3.2%) | 49 (0.3%) |
| $10,000 to $24,999 | 582 (9.2%) | 559 (2.8%) |
| $25,000 to $34,999 | 535 (8.5%) | 497 (2.5%) |
| $35,000 to $49,999 | 723 (11.4%) | 628 (3.2%) |
| $50,000 to $74,999 | 1,227 (19.4%) | 1,336 (6.8%) |
| $75,000 to $99,999 | 727 (11.5%) | 2,742 (13.9%) |
| $100,000 to $149,999 | 1,012 (16.0%) | 3,215 (16.3%) |
| $150,000 or more | 1,320 (20.8%) | 5,559 (28.1%) |
| Total | 6,330 (100.0%) | 19,765 (100.0%) |
Property Value to Household Income Ratio in Riverview
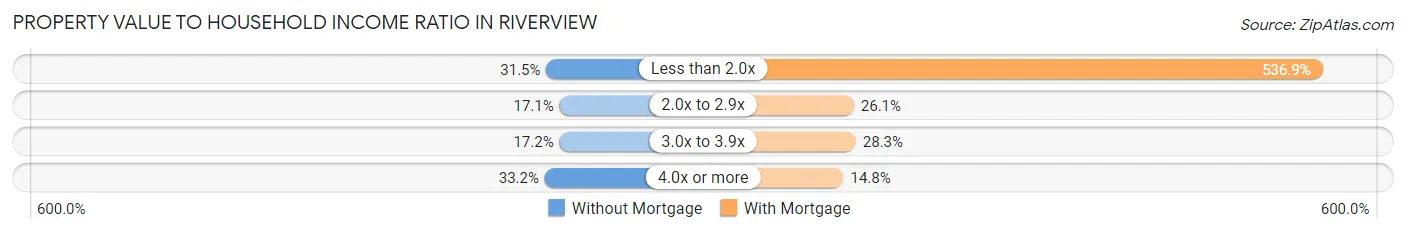
| Value-to-Income Ratio | Without Mortgage | With Mortgage |
| Less than 2.0x | 1,991 (31.5%) | 106,117 (536.9%) |
| 2.0x to 2.9x | 1,080 (17.1%) | 5,155 (26.1%) |
| 3.0x to 3.9x | 1,086 (17.2%) | 5,587 (28.3%) |
| 4.0x or more | 2,099 (33.2%) | 2,934 (14.8%) |
| Total | 6,330 (100.0%) | 19,765 (100.0%) |
Real Estate Taxes by Mortgage Status in Riverview
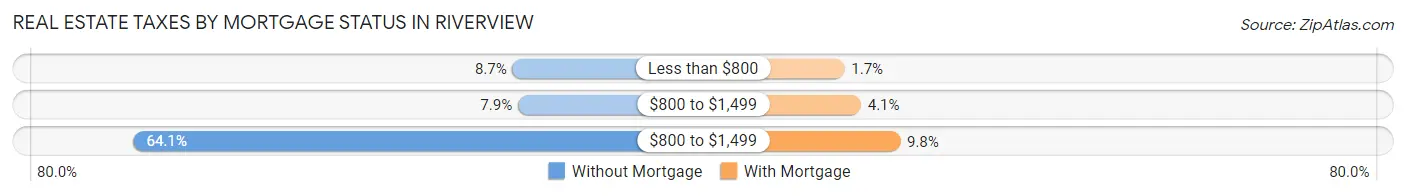
| Property Taxes | Without Mortgage | With Mortgage |
| Less than $800 | 551 (8.7%) | 327 (1.7%) |
| $800 to $1,499 | 501 (7.9%) | 800 (4.1%) |
| $800 to $1,499 | 4,056 (64.1%) | 1,935 (9.8%) |
| Total | 6,330 (100.0%) | 19,765 (100.0%) |
Health & Disability in Riverview
Health Insurance Coverage by Age in Riverview
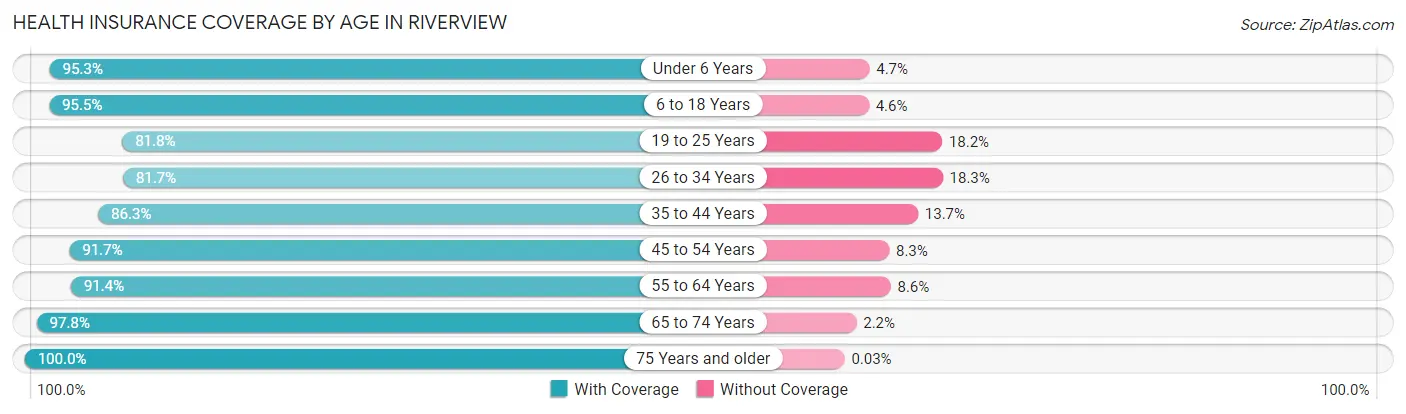
| Age Bracket | With Coverage | Without Coverage |
| Under 6 Years | 7,452 (95.3%) | 364 (4.7%) |
| 6 to 18 Years | 18,619 (95.5%) | 888 (4.5%) |
| 19 to 25 Years | 6,320 (81.8%) | 1,407 (18.2%) |
| 26 to 34 Years | 10,914 (81.7%) | 2,449 (18.3%) |
| 35 to 44 Years | 14,359 (86.3%) | 2,283 (13.7%) |
| 45 to 54 Years | 12,824 (91.7%) | 1,167 (8.3%) |
| 55 to 64 Years | 10,568 (91.4%) | 997 (8.6%) |
| 65 to 74 Years | 6,962 (97.8%) | 159 (2.2%) |
| 75 Years and older | 3,968 (100.0%) | 1 (0.0%) |
| Total | 91,986 (90.4%) | 9,715 (9.6%) |
Health Insurance Coverage by Citizenship Status in Riverview
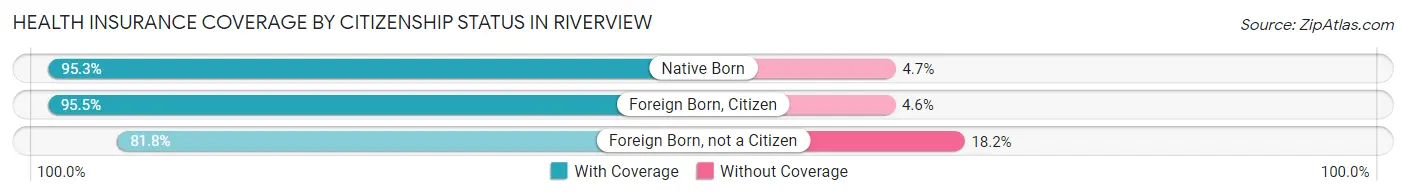
| Citizenship Status | With Coverage | Without Coverage |
| Native Born | 7,452 (95.3%) | 364 (4.7%) |
| Foreign Born, Citizen | 18,619 (95.5%) | 888 (4.5%) |
| Foreign Born, not a Citizen | 6,320 (81.8%) | 1,407 (18.2%) |
Health Insurance Coverage by Household Income in Riverview
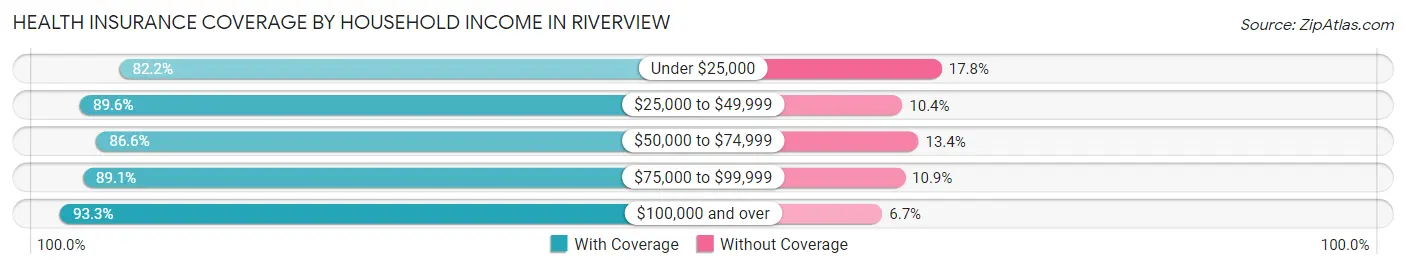
| Household Income | With Coverage | Without Coverage |
| Under $25,000 | 6,344 (82.2%) | 1,374 (17.8%) |
| $25,000 to $49,999 | 11,355 (89.6%) | 1,319 (10.4%) |
| $50,000 to $74,999 | 12,370 (86.6%) | 1,920 (13.4%) |
| $75,000 to $99,999 | 13,279 (89.1%) | 1,629 (10.9%) |
| $100,000 and over | 48,587 (93.3%) | 3,464 (6.7%) |
Public vs Private Health Insurance Coverage by Age in Riverview
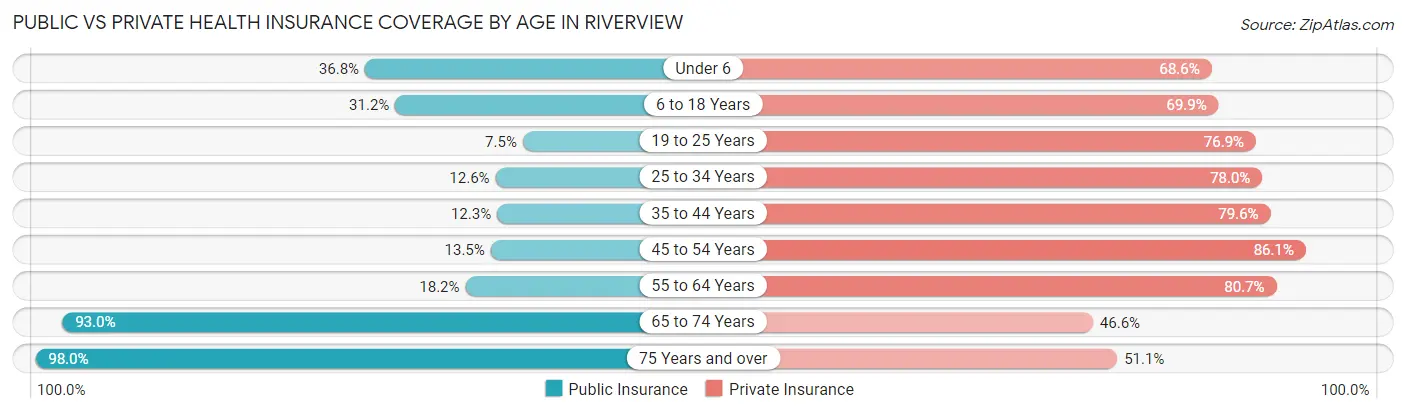
| Age Bracket | Public Insurance | Private Insurance |
| Under 6 | 2,879 (36.8%) | 5,364 (68.6%) |
| 6 to 18 Years | 6,090 (31.2%) | 13,641 (69.9%) |
| 19 to 25 Years | 583 (7.5%) | 5,940 (76.9%) |
| 25 to 34 Years | 1,685 (12.6%) | 10,427 (78.0%) |
| 35 to 44 Years | 2,050 (12.3%) | 13,239 (79.5%) |
| 45 to 54 Years | 1,889 (13.5%) | 12,047 (86.1%) |
| 55 to 64 Years | 2,104 (18.2%) | 9,328 (80.7%) |
| 65 to 74 Years | 6,623 (93.0%) | 3,319 (46.6%) |
| 75 Years and over | 3,890 (98.0%) | 2,029 (51.1%) |
| Total | 27,793 (27.3%) | 75,334 (74.1%) |
Disability Status by Sex by Age in Riverview

| Age Bracket | Male | Female |
| Under 5 Years | 0 (0.0%) | 10 (0.3%) |
| 5 to 17 Years | 906 (9.1%) | 480 (4.9%) |
| 18 to 34 Years | 579 (5.6%) | 817 (6.9%) |
| 35 to 64 Years | 2,568 (12.9%) | 2,277 (10.2%) |
| 65 to 74 Years | 1,040 (36.9%) | 923 (21.4%) |
| 75 Years and over | 840 (45.0%) | 1,251 (59.5%) |
Disability Class by Sex by Age in Riverview
Disability Class: Hearing Difficulty
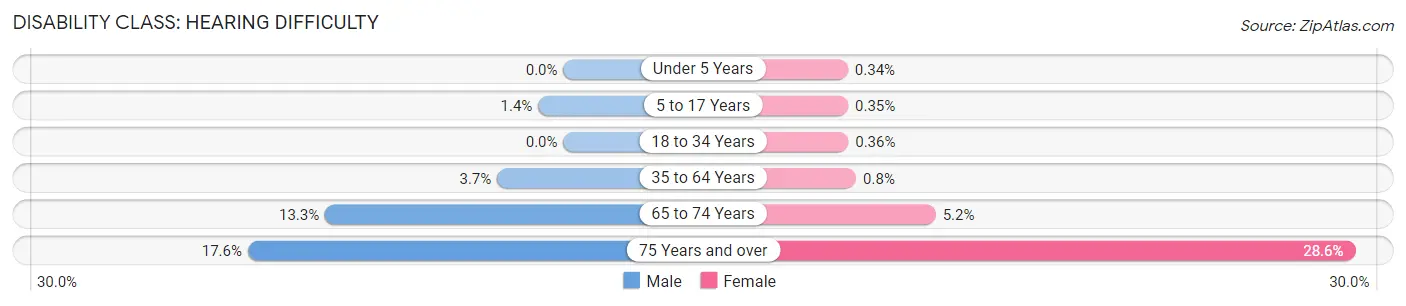
| Age Bracket | Male | Female |
| Under 5 Years | 0 (0.0%) | 10 (0.3%) |
| 5 to 17 Years | 140 (1.4%) | 34 (0.4%) |
| 18 to 34 Years | 0 (0.0%) | 42 (0.4%) |
| 35 to 64 Years | 733 (3.7%) | 178 (0.8%) |
| 65 to 74 Years | 374 (13.3%) | 225 (5.2%) |
| 75 Years and over | 328 (17.6%) | 601 (28.6%) |
Disability Class: Vision Difficulty
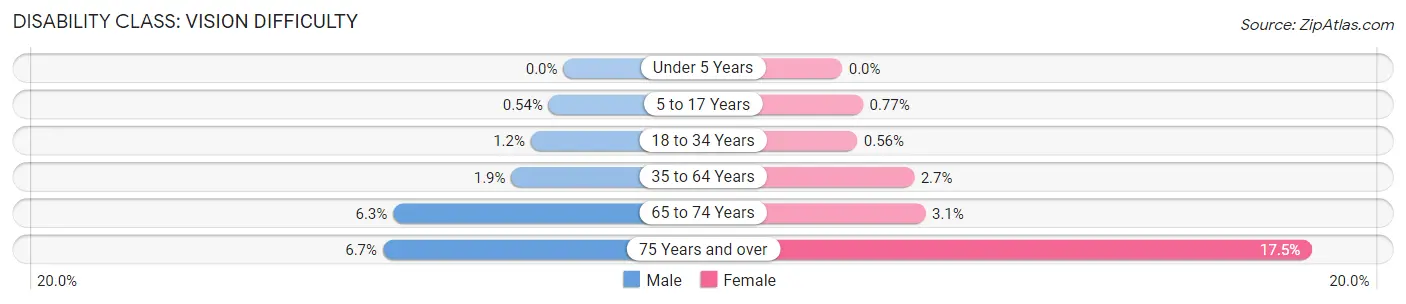
| Age Bracket | Male | Female |
| Under 5 Years | 0 (0.0%) | 0 (0.0%) |
| 5 to 17 Years | 54 (0.5%) | 75 (0.8%) |
| 18 to 34 Years | 125 (1.2%) | 66 (0.6%) |
| 35 to 64 Years | 384 (1.9%) | 596 (2.7%) |
| 65 to 74 Years | 178 (6.3%) | 133 (3.1%) |
| 75 Years and over | 125 (6.7%) | 367 (17.5%) |
Disability Class: Cognitive Difficulty
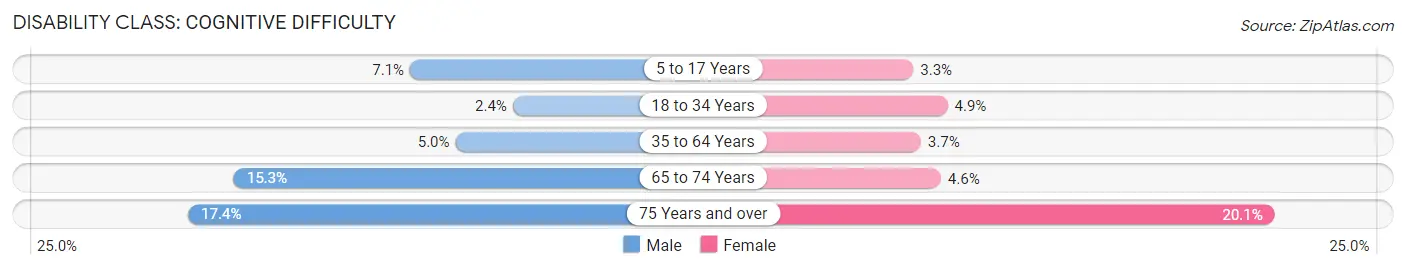
| Age Bracket | Male | Female |
| 5 to 17 Years | 712 (7.1%) | 323 (3.3%) |
| 18 to 34 Years | 243 (2.4%) | 578 (4.9%) |
| 35 to 64 Years | 995 (5.0%) | 819 (3.7%) |
| 65 to 74 Years | 431 (15.3%) | 198 (4.6%) |
| 75 Years and over | 325 (17.4%) | 422 (20.1%) |
Disability Class: Ambulatory Difficulty
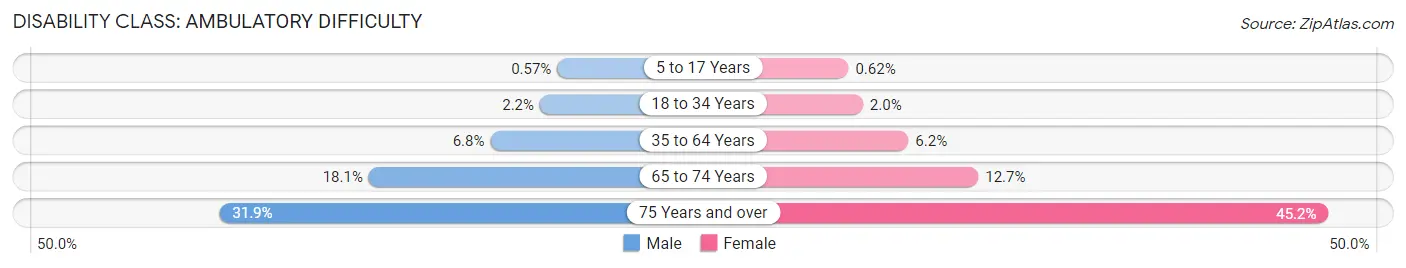
| Age Bracket | Male | Female |
| 5 to 17 Years | 57 (0.6%) | 60 (0.6%) |
| 18 to 34 Years | 225 (2.2%) | 231 (2.0%) |
| 35 to 64 Years | 1,348 (6.8%) | 1,381 (6.2%) |
| 65 to 74 Years | 509 (18.1%) | 545 (12.7%) |
| 75 Years and over | 596 (31.9%) | 949 (45.2%) |
Disability Class: Self-Care Difficulty
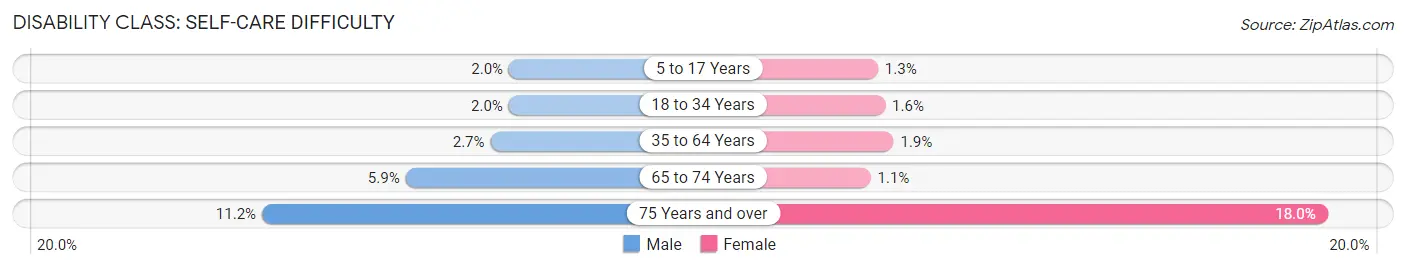
| Age Bracket | Male | Female |
| 5 to 17 Years | 202 (2.0%) | 130 (1.3%) |
| 18 to 34 Years | 210 (2.0%) | 190 (1.6%) |
| 35 to 64 Years | 538 (2.7%) | 429 (1.9%) |
| 65 to 74 Years | 165 (5.9%) | 46 (1.1%) |
| 75 Years and over | 209 (11.2%) | 379 (18.0%) |
Technology Access in Riverview
Computing Device Access in Riverview
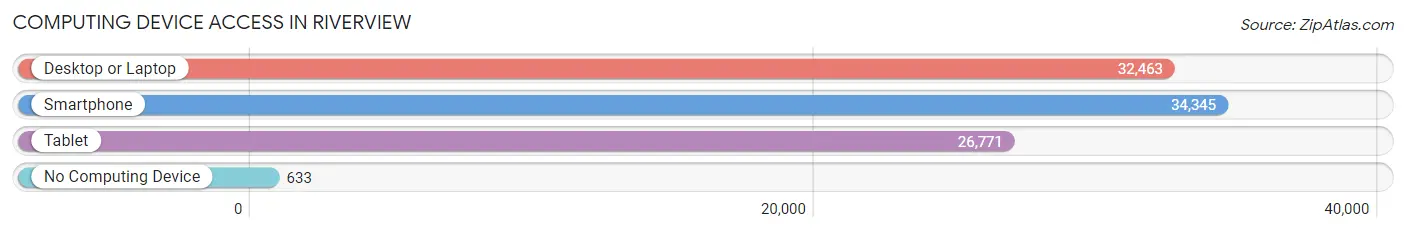
| Device Type | # Households | % Households |
| Desktop or Laptop | 32,463 | 90.3% |
| Smartphone | 34,345 | 95.5% |
| Tablet | 26,771 | 74.5% |
| No Computing Device | 633 | 1.8% |
| Total | 35,948 | 100.0% |
Internet Access in Riverview
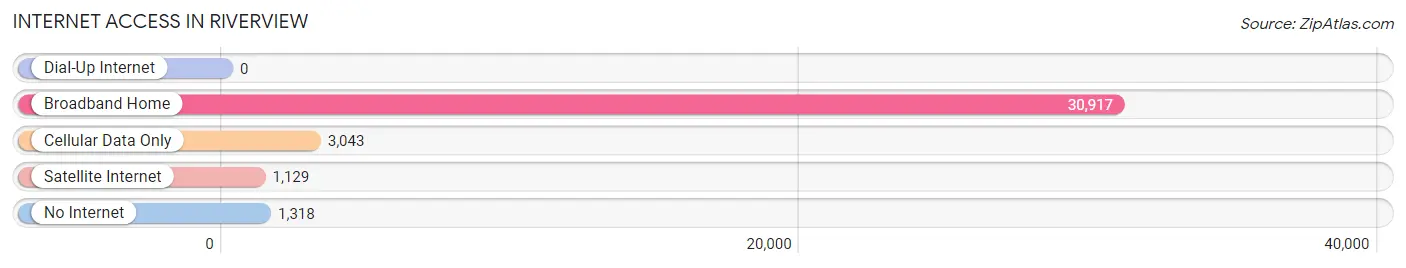
| Internet Type | # Households | % Households |
| Dial-Up Internet | 0 | 0.0% |
| Broadband Home | 30,917 | 86.0% |
| Cellular Data Only | 3,043 | 8.5% |
| Satellite Internet | 1,129 | 3.1% |
| No Internet | 1,318 | 3.7% |
| Total | 35,948 | 100.0% |
Riverview Summary
Riverview, FL is a census-designated place located in Hillsborough County, Florida. It is located just south of Tampa and is part of the Tampa-St. Petersburg-Clearwater metropolitan area. The population of Riverview was estimated to be 78,811 in 2019.
History
The area that is now Riverview was originally inhabited by the Tocobaga people, who were part of the larger Timucua tribe. The area was first settled by Europeans in the early 19th century, when settlers from the United States began to move into the area. The first post office in the area was established in 1885, and the town was officially incorporated in 1959.
Geography
Riverview is located in Hillsborough County, Florida, and is situated just south of Tampa. It is bordered by the Alafia River to the east and the Little Manatee River to the west. The town covers an area of approximately 25 square miles and has a total population of 78,811.
The terrain of Riverview is mostly flat, with some rolling hills in the northern part of the town. The town is located in a humid subtropical climate zone, with hot, humid summers and mild winters. The average annual temperature is around 73 degrees Fahrenheit, and the average annual precipitation is around 50 inches.
Economy
Riverview’s economy is largely based on the service industry, with many residents employed in retail, hospitality, and healthcare. The town is also home to several large employers, including Amazon, Publix, and Walmart. The town is also home to several small businesses, including restaurants, shops, and other services.
Demographics
As of 2019, the population of Riverview was estimated to be 78,811. The racial makeup of the town was 77.3% White, 11.2% African American, 5.2% Hispanic or Latino, and 4.3% Asian. The median household income was $63,945, and the median home value was $212,400.
Riverview is a diverse community, with a variety of cultures and backgrounds represented. The town is home to a large number of immigrants, with many coming from Latin America, Asia, and the Caribbean. The town is also home to a large number of retirees, with many choosing to settle in the area due to its warm climate and proximity to Tampa.
Conclusion
Riverview, FL is a census-designated place located in Hillsborough County, Florida. It is located just south of Tampa and is part of the Tampa-St. Petersburg-Clearwater metropolitan area. The population of Riverview was estimated to be 78,811 in 2019. The town has a diverse population, with a variety of cultures and backgrounds represented. The economy of Riverview is largely based on the service industry, with many residents employed in retail, hospitality, and healthcare. The town is also home to several large employers, including Amazon, Publix, and Walmart.
Common Questions
What is Per Capita Income in Riverview?
Per Capita income in Riverview is $37,092.
What is the Median Family Income in Riverview?
Median Family Income in Riverview is $99,720.
What is the Median Household income in Riverview?
Median Household Income in Riverview is $87,383.
What is Income or Wage Gap in Riverview?
Income or Wage Gap in Riverview is 21.2%.
Women in Riverview earn 78.8 cents for every dollar earned by a man.
What is Family Income Deficit in Riverview?
Family Income Deficit in Riverview is $11,071.
Families that are below poverty line in Riverview earn $11,071 less on average than the poverty threshold level.
What is Inequality or Gini Index in Riverview?
Inequality or Gini Index in Riverview is 0.39.
What is the Total Population of Riverview?
Total Population of Riverview is 102,467.
What is the Total Male Population of Riverview?
Total Male Population of Riverview is 49,120.
What is the Total Female Population of Riverview?
Total Female Population of Riverview is 53,347.
What is the Ratio of Males per 100 Females in Riverview?
There are 92.08 Males per 100 Females in Riverview.
What is the Ratio of Females per 100 Males in Riverview?
There are 108.61 Females per 100 Males in Riverview.
What is the Median Population Age in Riverview?
Median Population Age in Riverview is 36.3 Years.
What is the Average Family Size in Riverview
Average Family Size in Riverview is 3.4 People.
What is the Average Household Size in Riverview
Average Household Size in Riverview is 2.9 People.
How Large is the Labor Force in Riverview?
There are 55,852 People in the Labor Forcein in Riverview.
What is the Percentage of People in the Labor Force in Riverview?
70.8% of People are in the Labor Force in Riverview.
What is the Unemployment Rate in Riverview?
Unemployment Rate in Riverview is 5.6%.