Silver Springs Shores, FL Map & Demographics
Silver Springs Shores Map
Silver Springs Shores Overview
$27,193
PER CAPITA INCOME
$62,513
AVG FAMILY INCOME
$52,899
AVG HOUSEHOLD INCOME
20.0%
WAGE / INCOME GAP [ % ]
80.0¢/ $1
WAGE / INCOME GAP [ $ ]
0.48
INEQUALITY / GINI INDEX
25,453
TOTAL POPULATION
12,697
MALE POPULATION
12,756
FEMALE POPULATION
99.54
MALES / 100 FEMALES
100.46
FEMALES / 100 MALES
39.3
MEDIAN AGE
3.3
AVG FAMILY SIZE
2.7
AVG HOUSEHOLD SIZE
11,090
LABOR FORCE [ PEOPLE ]
54.5%
PERCENT IN LABOR FORCE
3.9%
UNEMPLOYMENT RATE
Income in Silver Springs Shores
Income Overview in Silver Springs Shores
Per Capita Income in Silver Springs Shores is $27,193, while median incomes of families and households are $62,513 and $52,899 respectively.
| Characteristic | Number | Measure |
| Per Capita Income | 25,453 | $27,193 |
| Median Family Income | 6,105 | $62,513 |
| Mean Family Income | 6,105 | $74,671 |
| Median Household Income | 9,410 | $52,899 |
| Mean Household Income | 9,410 | $72,173 |
| Income Deficit | 6,105 | $0 |
| Wage / Income Gap (%) | 25,453 | 19.97% |
| Wage / Income Gap ($) | 25,453 | 80.03¢ per $1 |
| Gini / Inequality Index | 25,453 | 0.48 |
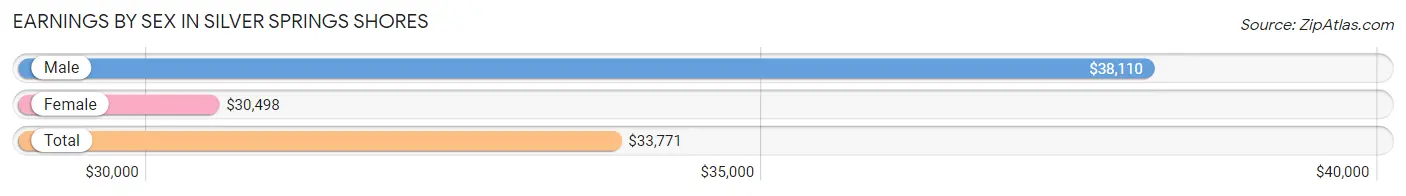
Earnings by Sex in Silver Springs Shores
Average Earnings in Silver Springs Shores are $33,771, $38,110 for men and $30,498 for women, a difference of 20.0%.
| Sex | Number | Average Earnings |
| Male | 5,876 (51.5%) | $38,110 |
| Female | 5,538 (48.5%) | $30,498 |
| Total | 11,414 (100.0%) | $33,771 |
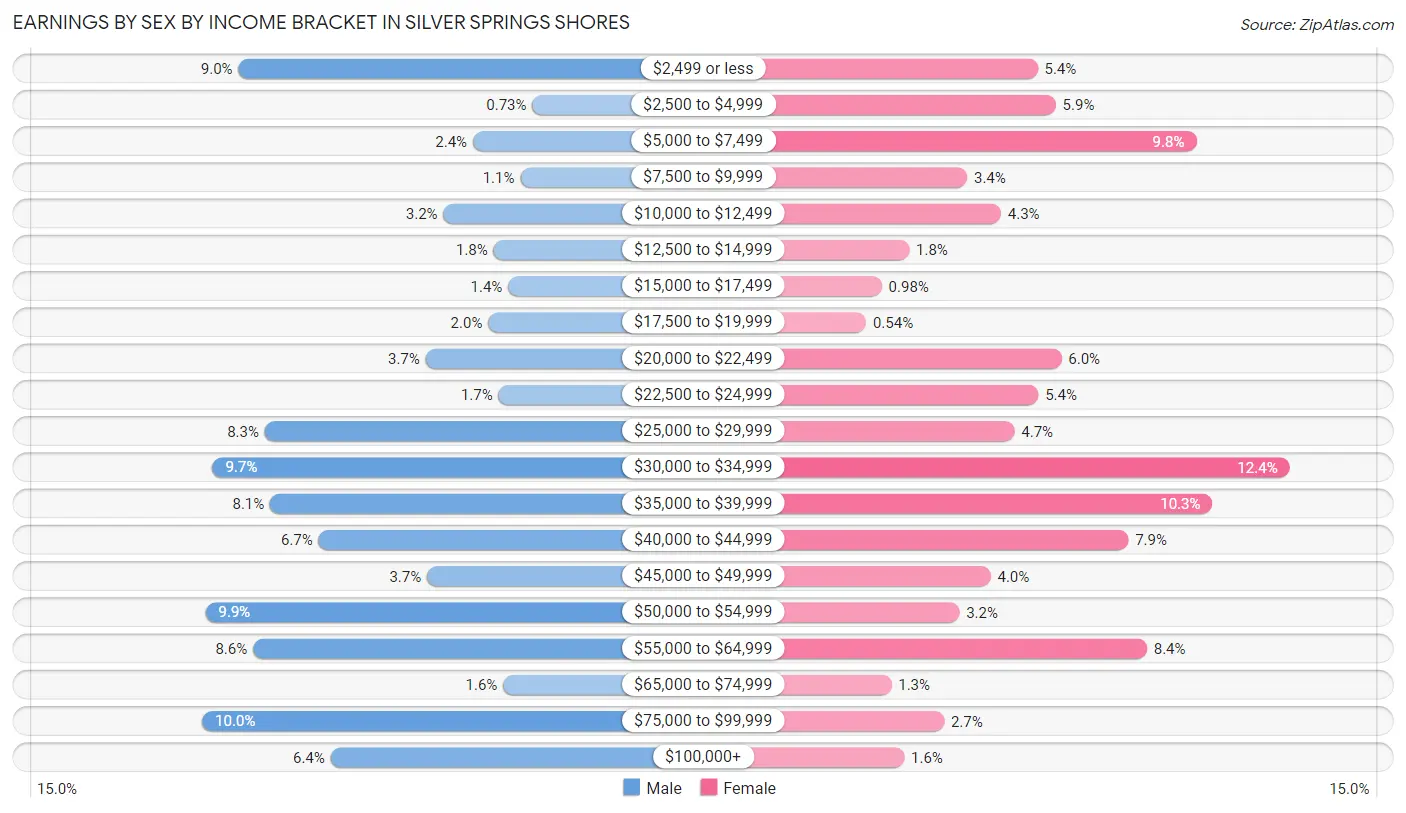
Earnings by Sex by Income Bracket in Silver Springs Shores
The most common earnings brackets in Silver Springs Shores are $75,000 to $99,999 for men (588 | 10.0%) and $30,000 to $34,999 for women (689 | 12.4%).
| Income | Male | Female |
| $2,499 or less | 528 (9.0%) | 297 (5.4%) |
| $2,500 to $4,999 | 43 (0.7%) | 325 (5.9%) |
| $5,000 to $7,499 | 141 (2.4%) | 544 (9.8%) |
| $7,500 to $9,999 | 63 (1.1%) | 187 (3.4%) |
| $10,000 to $12,499 | 190 (3.2%) | 240 (4.3%) |
| $12,500 to $14,999 | 107 (1.8%) | 97 (1.8%) |
| $15,000 to $17,499 | 83 (1.4%) | 54 (1.0%) |
| $17,500 to $19,999 | 116 (2.0%) | 30 (0.5%) |
| $20,000 to $22,499 | 219 (3.7%) | 334 (6.0%) |
| $22,500 to $24,999 | 99 (1.7%) | 298 (5.4%) |
| $25,000 to $29,999 | 485 (8.3%) | 261 (4.7%) |
| $30,000 to $34,999 | 571 (9.7%) | 689 (12.4%) |
| $35,000 to $39,999 | 476 (8.1%) | 569 (10.3%) |
| $40,000 to $44,999 | 396 (6.7%) | 438 (7.9%) |
| $45,000 to $49,999 | 217 (3.7%) | 224 (4.0%) |
| $50,000 to $54,999 | 583 (9.9%) | 175 (3.2%) |
| $55,000 to $64,999 | 504 (8.6%) | 467 (8.4%) |
| $65,000 to $74,999 | 91 (1.5%) | 69 (1.3%) |
| $75,000 to $99,999 | 588 (10.0%) | 151 (2.7%) |
| $100,000+ | 376 (6.4%) | 89 (1.6%) |
| Total | 5,876 (100.0%) | 5,538 (100.0%) |
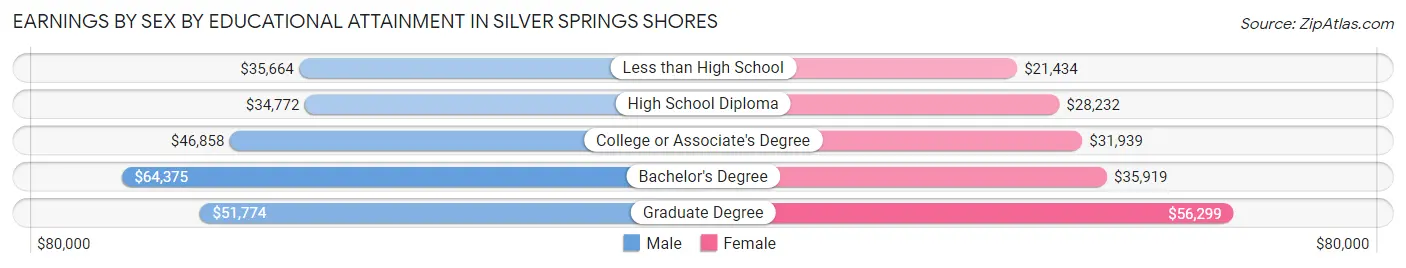
Earnings by Sex by Educational Attainment in Silver Springs Shores
Average earnings in Silver Springs Shores are $40,947 for men and $31,658 for women, a difference of 22.7%. Men with an educational attainment of bachelor's degree enjoy the highest average annual earnings of $64,375, while those with high school diploma education earn the least with $34,772. Women with an educational attainment of graduate degree earn the most with the average annual earnings of $56,299, while those with less than high school education have the smallest earnings of $21,434.
| Educational Attainment | Male Income | Female Income |
| Less than High School | $35,664 | $21,434 |
| High School Diploma | $34,772 | $28,232 |
| College or Associate's Degree | $46,858 | $31,939 |
| Bachelor's Degree | $64,375 | $35,919 |
| Graduate Degree | $51,774 | $56,299 |
| Total | $40,947 | $31,658 |
Family Income in Silver Springs Shores
Family Income Brackets in Silver Springs Shores
According to the Silver Springs Shores family income data, there are 1,844 families falling into the $50,000 to $74,999 income range, which is the most common income bracket and makes up 30.2% of all families. Conversely, the $200,000+ income bracket is the least frequent group with only 79 families (1.3%) belonging to this category.
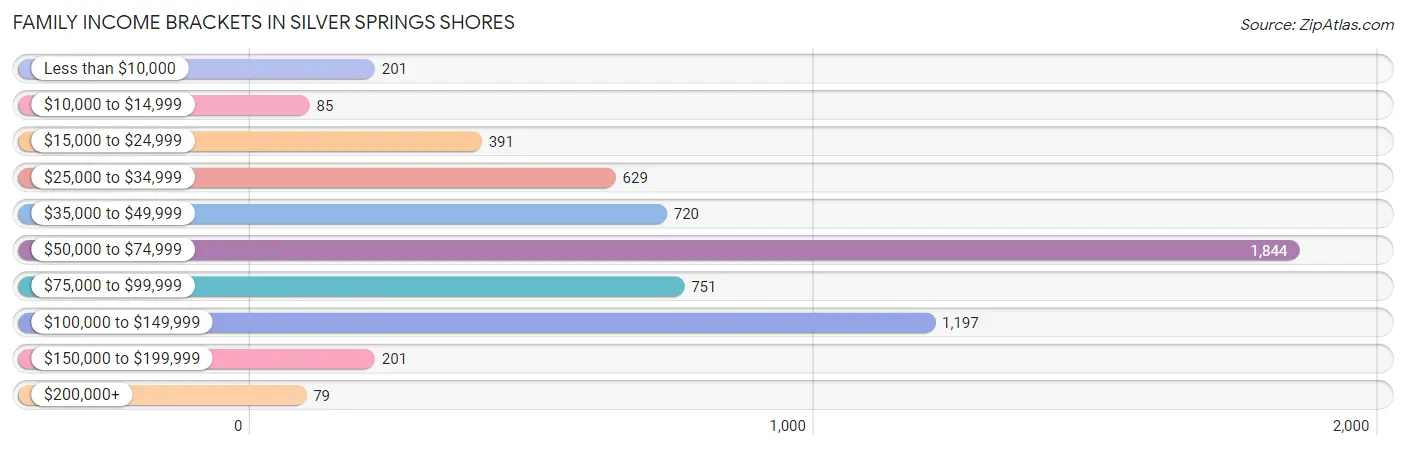
| Income Bracket | # Families | % Families |
| Less than $10,000 | 201 | 3.3% |
| $10,000 to $14,999 | 85 | 1.4% |
| $15,000 to $24,999 | 391 | 6.4% |
| $25,000 to $34,999 | 629 | 10.3% |
| $35,000 to $49,999 | 720 | 11.8% |
| $50,000 to $74,999 | 1,844 | 30.2% |
| $75,000 to $99,999 | 751 | 12.3% |
| $100,000 to $149,999 | 1,197 | 19.6% |
| $150,000 to $199,999 | 201 | 3.3% |
| $200,000+ | 79 | 1.3% |
Family Income by Famaliy Size in Silver Springs Shores
6-person families (44 | 0.7%) account for the highest median family income in Silver Springs Shores with $100,700 per family, while 2-person families (2,392 | 39.2%) have the highest median income of $31,499 per family member.
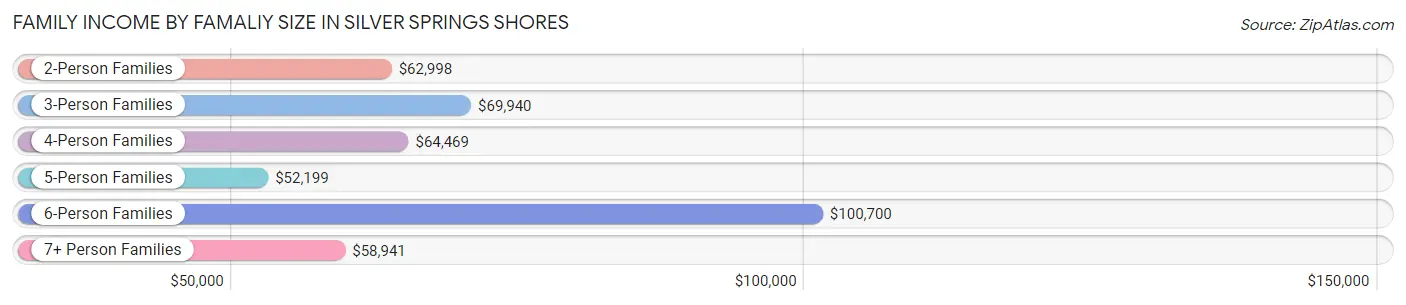
| Income Bracket | # Families | Median Income |
| 2-Person Families | 2,392 (39.2%) | $62,998 |
| 3-Person Families | 1,713 (28.1%) | $69,940 |
| 4-Person Families | 1,192 (19.5%) | $64,469 |
| 5-Person Families | 438 (7.2%) | $52,199 |
| 6-Person Families | 44 (0.7%) | $100,700 |
| 7+ Person Families | 326 (5.3%) | $58,941 |
| Total | 6,105 (100.0%) | $62,513 |
Family Income by Number of Earners in Silver Springs Shores
The median family income in Silver Springs Shores is $62,513, with families comprising 3+ earners (653) having the highest median family income of $120,062, while families with no earners (954) have the lowest median family income of $47,182, accounting for 10.7% and 15.6% of families, respectively.
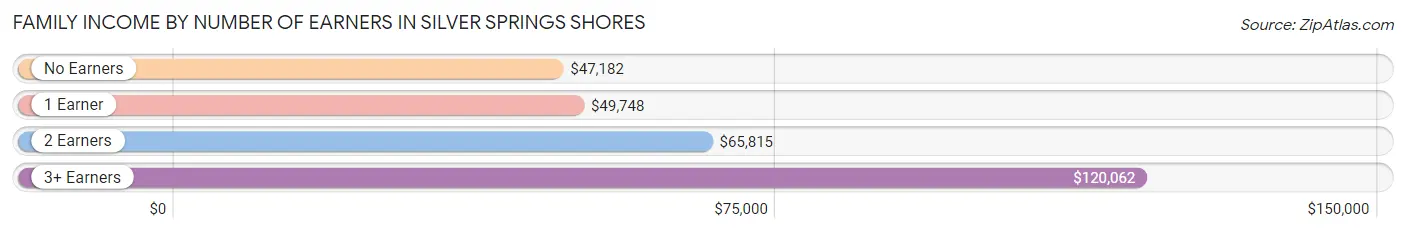
| Number of Earners | # Families | Median Income |
| No Earners | 954 (15.6%) | $47,182 |
| 1 Earner | 2,077 (34.0%) | $49,748 |
| 2 Earners | 2,421 (39.7%) | $65,815 |
| 3+ Earners | 653 (10.7%) | $120,062 |
| Total | 6,105 (100.0%) | $62,513 |
Household Income in Silver Springs Shores
Household Income Brackets in Silver Springs Shores
With 2,004 households falling in the category, the $50,000 to $74,999 income range is the most frequent in Silver Springs Shores, accounting for 21.3% of all households. In contrast, only 160 households (1.7%) fall into the $200,000+ income bracket, making it the least populous group.
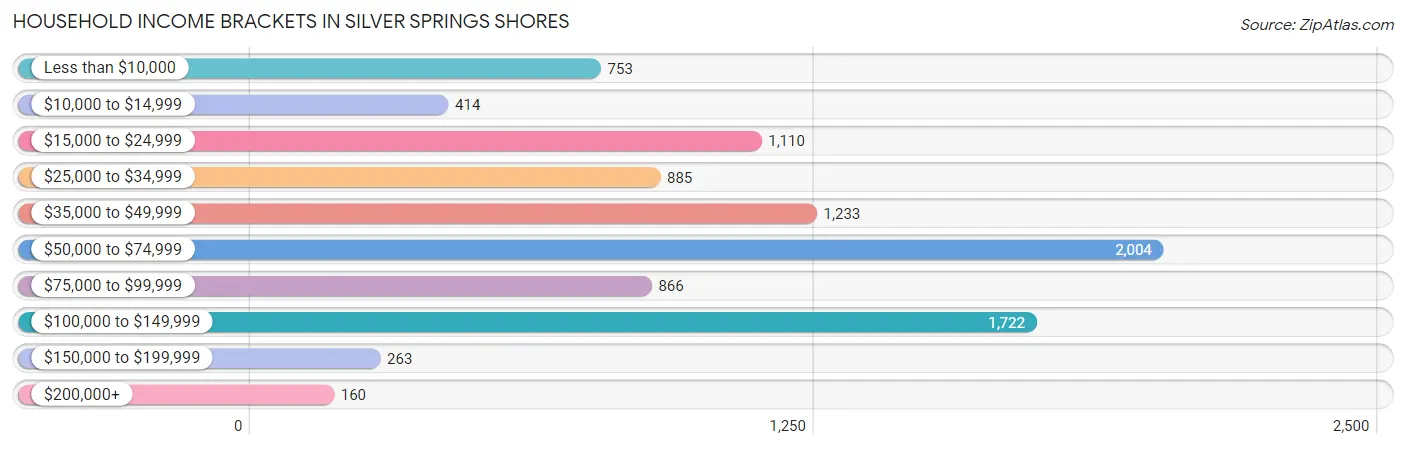
| Income Bracket | # Households | % Households |
| Less than $10,000 | 753 | 8.0% |
| $10,000 to $14,999 | 414 | 4.4% |
| $15,000 to $24,999 | 1,110 | 11.8% |
| $25,000 to $34,999 | 885 | 9.4% |
| $35,000 to $49,999 | 1,233 | 13.1% |
| $50,000 to $74,999 | 2,004 | 21.3% |
| $75,000 to $99,999 | 866 | 9.2% |
| $100,000 to $149,999 | 1,722 | 18.3% |
| $150,000 to $199,999 | 263 | 2.8% |
| $200,000+ | 160 | 1.7% |
Household Income by Householder Age in Silver Springs Shores
The median household income in Silver Springs Shores is $52,899, with the highest median household income of $62,405 found in the 45 to 64 years age bracket for the primary householder. A total of 4,023 households (42.7%) fall into this category. Meanwhile, the 15 to 24 years age bracket for the primary householder has the lowest median household income of $0, with 139 households (1.5%) in this group.
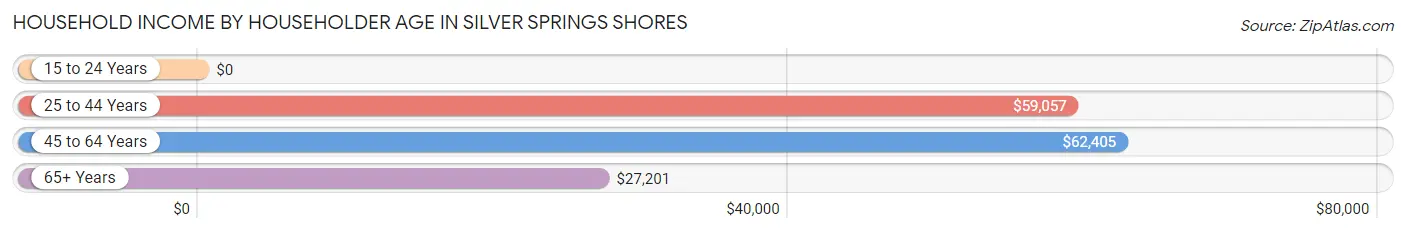
| Income Bracket | # Households | Median Income |
| 15 to 24 Years | 139 (1.5%) | $0 |
| 25 to 44 Years | 2,710 (28.8%) | $59,057 |
| 45 to 64 Years | 4,023 (42.7%) | $62,405 |
| 65+ Years | 2,538 (27.0%) | $27,201 |
| Total | 9,410 (100.0%) | $52,899 |
Poverty in Silver Springs Shores
Income Below Poverty by Sex and Age in Silver Springs Shores
With 11.3% poverty level for males and 19.6% for females among the residents of Silver Springs Shores, 15 year old males and 75 year old and over females are the most vulnerable to poverty, with 72 males (38.3%) and 439 females (39.2%) in their respective age groups living below the poverty level.
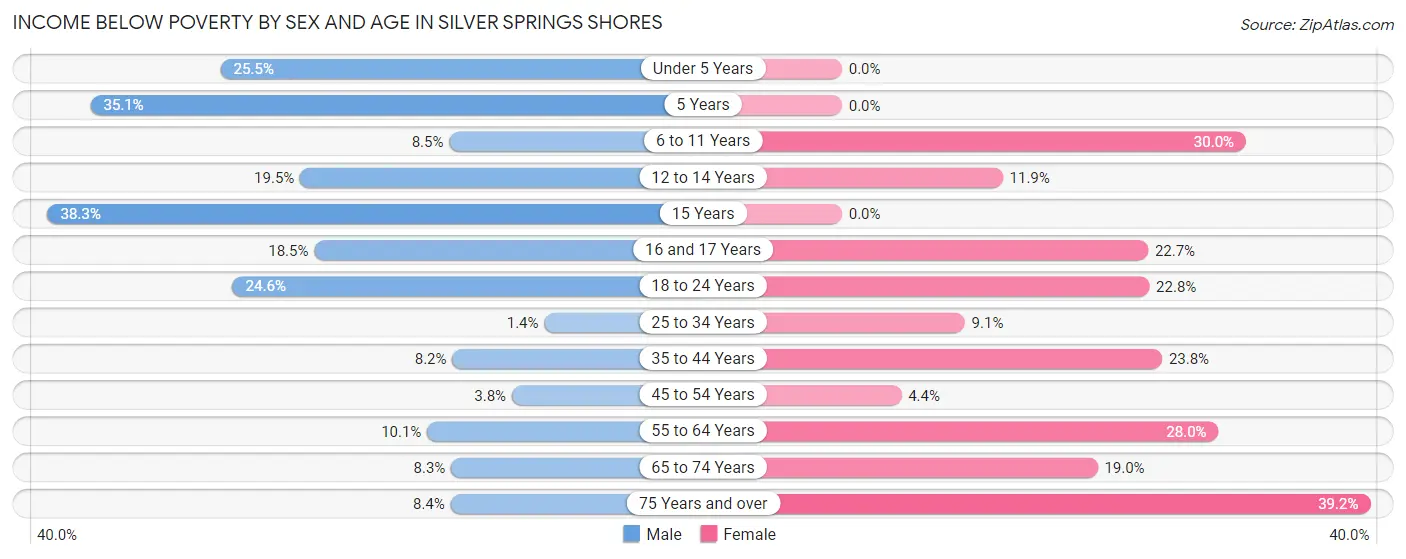
| Age Bracket | Male | Female |
| Under 5 Years | 210 (25.5%) | 0 (0.0%) |
| 5 Years | 46 (35.1%) | 0 (0.0%) |
| 6 to 11 Years | 92 (8.5%) | 210 (30.0%) |
| 12 to 14 Years | 169 (19.5%) | 75 (11.9%) |
| 15 Years | 72 (38.3%) | 0 (0.0%) |
| 16 and 17 Years | 54 (18.5%) | 130 (22.7%) |
| 18 to 24 Years | 259 (24.5%) | 278 (22.8%) |
| 25 to 34 Years | 22 (1.4%) | 144 (9.1%) |
| 35 to 44 Years | 152 (8.2%) | 422 (23.8%) |
| 45 to 54 Years | 57 (3.8%) | 70 (4.4%) |
| 55 to 64 Years | 142 (10.1%) | 529 (28.0%) |
| 65 to 74 Years | 85 (8.3%) | 200 (19.0%) |
| 75 Years and over | 73 (8.4%) | 439 (39.2%) |
| Total | 1,433 (11.3%) | 2,497 (19.6%) |
Income Above Poverty by Sex and Age in Silver Springs Shores
According to the poverty statistics in Silver Springs Shores, males aged 25 to 34 years and females aged under 5 years are the age groups that are most secure financially, with 98.6% of males and 100.0% of females in these age groups living above the poverty line.
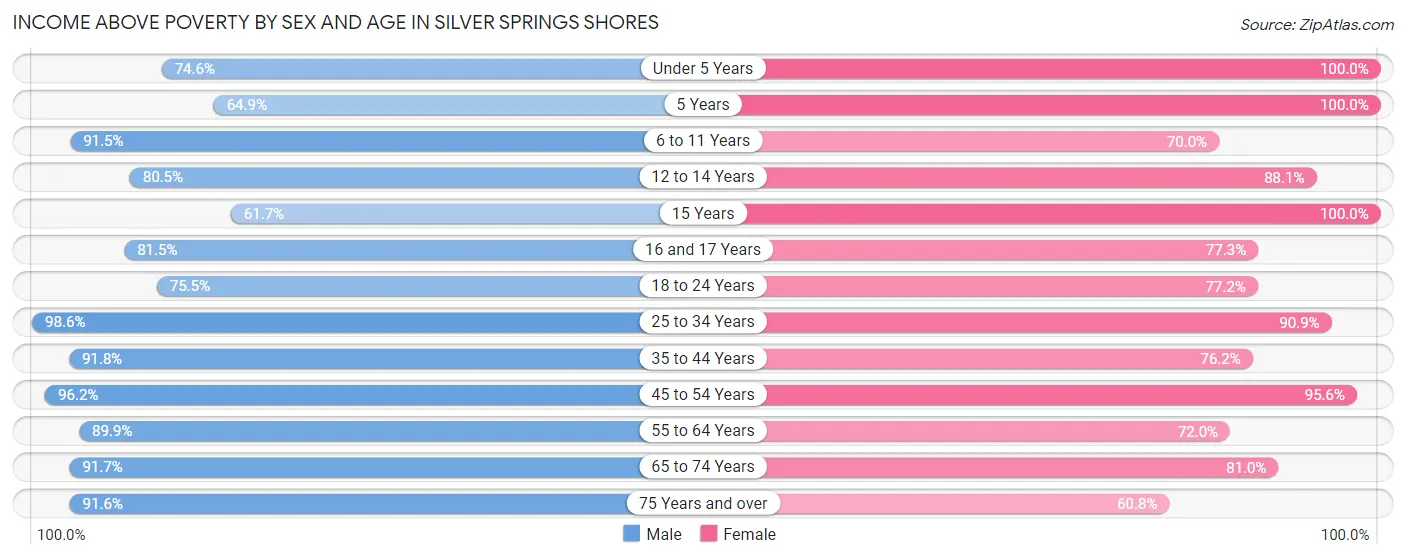
| Age Bracket | Male | Female |
| Under 5 Years | 615 (74.6%) | 452 (100.0%) |
| 5 Years | 85 (64.9%) | 101 (100.0%) |
| 6 to 11 Years | 994 (91.5%) | 490 (70.0%) |
| 12 to 14 Years | 696 (80.5%) | 553 (88.1%) |
| 15 Years | 116 (61.7%) | 77 (100.0%) |
| 16 and 17 Years | 238 (81.5%) | 442 (77.3%) |
| 18 to 24 Years | 796 (75.4%) | 940 (77.2%) |
| 25 to 34 Years | 1,536 (98.6%) | 1,435 (90.9%) |
| 35 to 44 Years | 1,692 (91.8%) | 1,353 (76.2%) |
| 45 to 54 Years | 1,435 (96.2%) | 1,519 (95.6%) |
| 55 to 64 Years | 1,262 (89.9%) | 1,363 (72.0%) |
| 65 to 74 Years | 935 (91.7%) | 854 (81.0%) |
| 75 Years and over | 799 (91.6%) | 680 (60.8%) |
| Total | 11,199 (88.7%) | 10,259 (80.4%) |
Income Below Poverty Among Married-Couple Families in Silver Springs Shores
The poverty statistics for married-couple families in Silver Springs Shores show that 7.1% or 316 of the total 4,441 families live below the poverty line. Families with 1 or 2 children have the highest poverty rate of 11.5%, comprising of 150 families. On the other hand, families with no children have the lowest poverty rate of 4.3%, which includes 112 families.
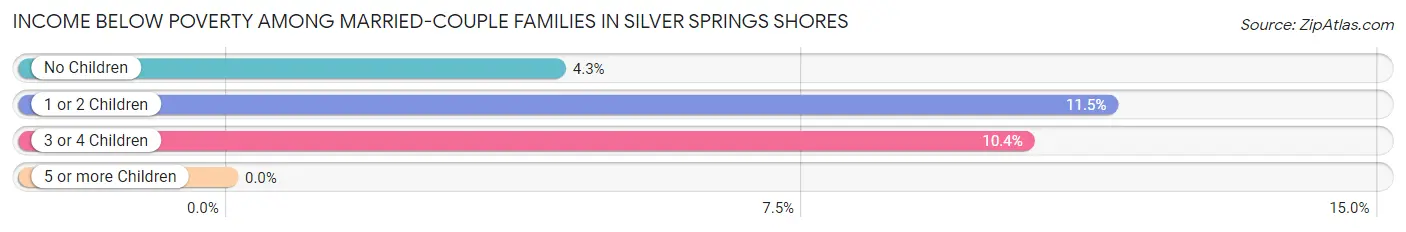
| Children | Above Poverty | Below Poverty |
| No Children | 2,505 (95.7%) | 112 (4.3%) |
| 1 or 2 Children | 1,155 (88.5%) | 150 (11.5%) |
| 3 or 4 Children | 465 (89.6%) | 54 (10.4%) |
| 5 or more Children | 0 (0.0%) | 0 (0.0%) |
| Total | 4,125 (92.9%) | 316 (7.1%) |
Income Below Poverty Among Single-Parent Households in Silver Springs Shores
According to the poverty data in Silver Springs Shores, 5.2% or 25 single-father households and 22.6% or 267 single-mother households are living below the poverty line. Among single-father households, those with 1 or 2 children have the highest poverty rate, with 25 households (11.7%) experiencing poverty. Likewise, among single-mother households, those with 5 or more children have the highest poverty rate, with 31 households (100.0%) falling below the poverty line.
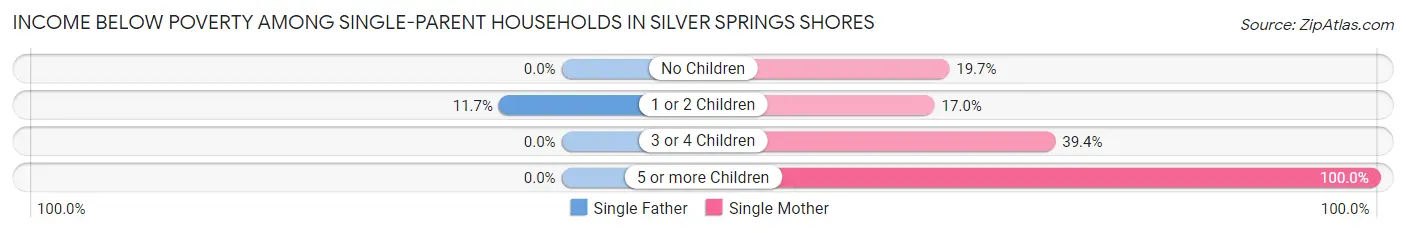
| Children | Single Father | Single Mother |
| No Children | 0 (0.0%) | 73 (19.7%) |
| 1 or 2 Children | 25 (11.7%) | 109 (17.0%) |
| 3 or 4 Children | 0 (0.0%) | 54 (39.4%) |
| 5 or more Children | 0 (0.0%) | 31 (100.0%) |
| Total | 25 (5.2%) | 267 (22.6%) |
Income Below Poverty Among Married-Couple vs Single-Parent Households in Silver Springs Shores
The poverty data for Silver Springs Shores shows that 316 of the married-couple family households (7.1%) and 292 of the single-parent households (17.5%) are living below the poverty level. Within the married-couple family households, those with 1 or 2 children have the highest poverty rate, with 150 households (11.5%) falling below the poverty line. Among the single-parent households, those with 5 or more children have the highest poverty rate, with 31 household (100.0%) living below poverty.
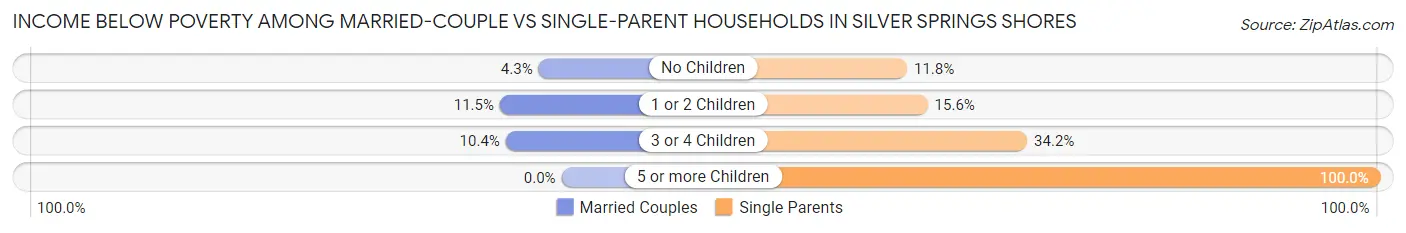
| Children | Married-Couple Families | Single-Parent Households |
| No Children | 112 (4.3%) | 73 (11.8%) |
| 1 or 2 Children | 150 (11.5%) | 134 (15.6%) |
| 3 or 4 Children | 54 (10.4%) | 54 (34.2%) |
| 5 or more Children | 0 (0.0%) | 31 (100.0%) |
| Total | 316 (7.1%) | 292 (17.5%) |
Race in Silver Springs Shores
The most populous races in Silver Springs Shores are White / Caucasian (13,246 | 52.0%), Hispanic or Latino (6,710 | 26.4%), and Black / African American (6,122 | 24.0%).
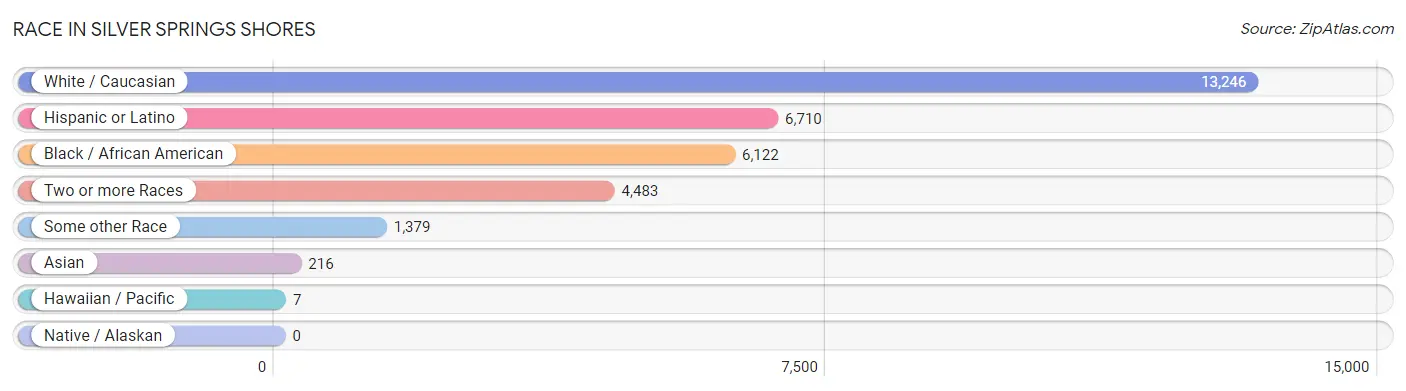
| Race | # Population | % Population |
| Asian | 216 | 0.9% |
| Black / African American | 6,122 | 24.0% |
| Hawaiian / Pacific | 7 | 0.0% |
| Hispanic or Latino | 6,710 | 26.4% |
| Native / Alaskan | 0 | 0.0% |
| White / Caucasian | 13,246 | 52.0% |
| Two or more Races | 4,483 | 17.6% |
| Some other Race | 1,379 | 5.4% |
| Total | 25,453 | 100.0% |
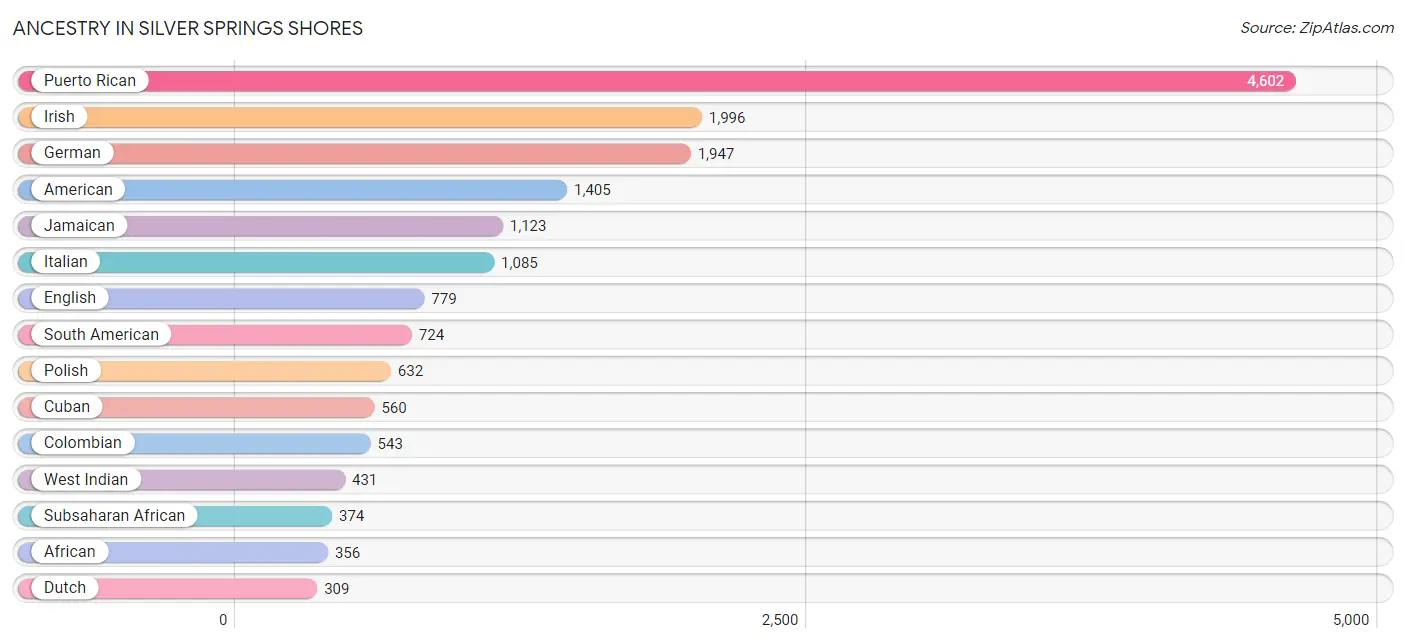
Ancestry in Silver Springs Shores
The most populous ancestries reported in Silver Springs Shores are Puerto Rican (4,602 | 18.1%), Irish (1,996 | 7.8%), German (1,947 | 7.6%), American (1,405 | 5.5%), and Jamaican (1,123 | 4.4%), together accounting for 43.5% of all Silver Springs Shores residents.
| Ancestry | # Population | % Population |
| African | 356 | 1.4% |
| American | 1,405 | 5.5% |
| Arab | 9 | 0.0% |
| Argentinean | 87 | 0.3% |
| Armenian | 2 | 0.0% |
| Austrian | 58 | 0.2% |
| Barbadian | 5 | 0.0% |
| Bhutanese | 28 | 0.1% |
| Brazilian | 99 | 0.4% |
| British | 12 | 0.1% |
| Burmese | 33 | 0.1% |
| Cajun | 9 | 0.0% |
| Canadian | 168 | 0.7% |
| Cape Verdean | 10 | 0.0% |
| Central American | 85 | 0.3% |
| Central American Indian | 276 | 1.1% |
| Cherokee | 31 | 0.1% |
| Chilean | 15 | 0.1% |
| Colombian | 543 | 2.1% |
| Crow | 3 | 0.0% |
| Cuban | 560 | 2.2% |
| Czech | 17 | 0.1% |
| Dominican | 262 | 1.0% |
| Dutch | 309 | 1.2% |
| Ecuadorian | 6 | 0.0% |
| English | 779 | 3.1% |
| European | 75 | 0.3% |
| French | 224 | 0.9% |
| French Canadian | 41 | 0.2% |
| German | 1,947 | 7.6% |
| Guamanian / Chamorro | 7 | 0.0% |
| Guyanese | 119 | 0.5% |
| Honduran | 18 | 0.1% |
| Hungarian | 173 | 0.7% |
| Icelander | 20 | 0.1% |
| Indian (Asian) | 163 | 0.6% |
| Irish | 1,996 | 7.8% |
| Italian | 1,085 | 4.3% |
| Jamaican | 1,123 | 4.4% |
| Korean | 184 | 0.7% |
| Laotian | 22 | 0.1% |
| Lebanese | 9 | 0.0% |
| Lithuanian | 33 | 0.1% |
| Mexican | 234 | 0.9% |
| Nigerian | 8 | 0.0% |
| Norwegian | 85 | 0.3% |
| Pakistani | 39 | 0.2% |
| Panamanian | 54 | 0.2% |
| Polish | 632 | 2.5% |
| Portuguese | 135 | 0.5% |
| Puerto Rican | 4,602 | 18.1% |
| Romanian | 11 | 0.0% |
| Russian | 142 | 0.6% |
| Salvadoran | 13 | 0.1% |
| Scotch-Irish | 89 | 0.4% |
| Scottish | 299 | 1.2% |
| Slovak | 146 | 0.6% |
| South American | 724 | 2.8% |
| Spaniard | 77 | 0.3% |
| Subsaharan African | 374 | 1.5% |
| Swedish | 127 | 0.5% |
| Swiss | 63 | 0.3% |
| Thai | 115 | 0.4% |
| Turkish | 25 | 0.1% |
| Ukrainian | 70 | 0.3% |
| Uruguayan | 31 | 0.1% |
| Venezuelan | 42 | 0.2% |
| Welsh | 102 | 0.4% |
| West Indian | 431 | 1.7% | View All 69 Rows |
Immigrants in Silver Springs Shores
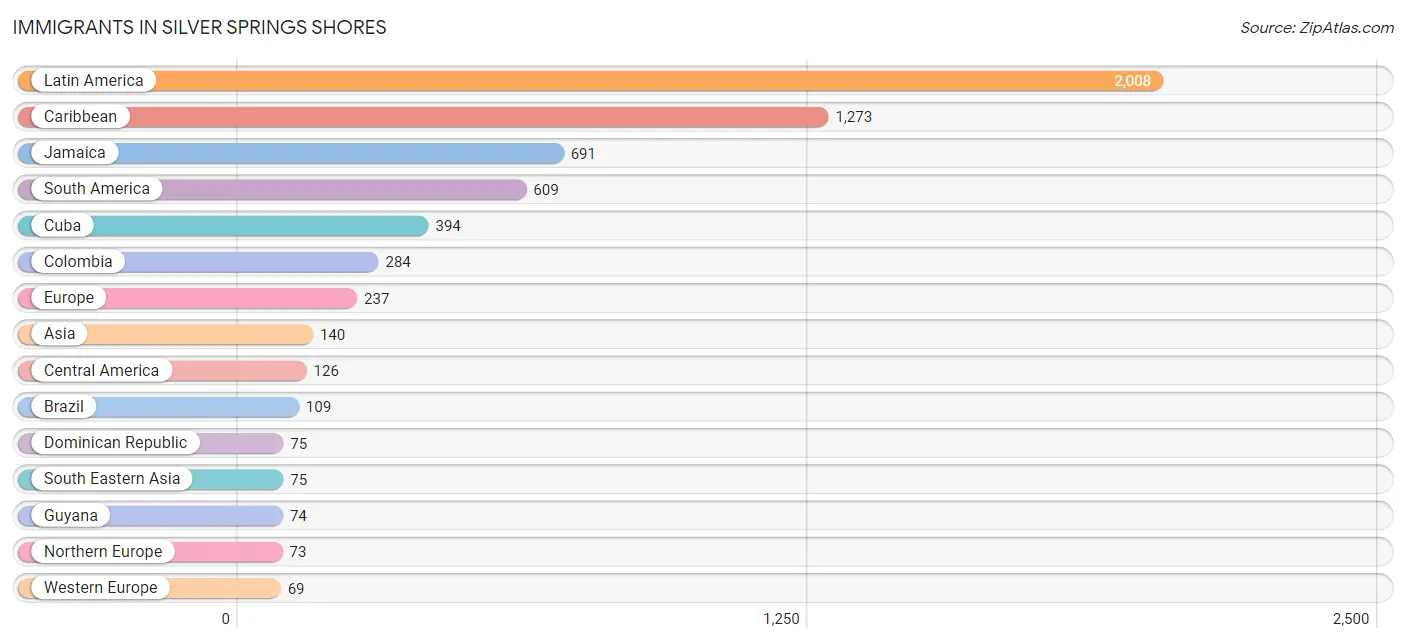
The most numerous immigrant groups reported in Silver Springs Shores came from Latin America (2,008 | 7.9%), Caribbean (1,273 | 5.0%), Jamaica (691 | 2.7%), South America (609 | 2.4%), and Cuba (394 | 1.5%), together accounting for 19.5% of all Silver Springs Shores residents.
| Immigration Origin | # Population | % Population |
| Africa | 27 | 0.1% |
| Argentina | 28 | 0.1% |
| Asia | 140 | 0.5% |
| Austria | 25 | 0.1% |
| Brazil | 109 | 0.4% |
| Caribbean | 1,273 | 5.0% |
| Central America | 126 | 0.5% |
| Chile | 15 | 0.1% |
| China | 38 | 0.2% |
| Colombia | 284 | 1.1% |
| Cuba | 394 | 1.5% |
| Dominican Republic | 75 | 0.3% |
| Eastern Asia | 38 | 0.2% |
| Eastern Europe | 58 | 0.2% |
| Ecuador | 6 | 0.0% |
| England | 29 | 0.1% |
| Europe | 237 | 0.9% |
| Germany | 44 | 0.2% |
| Grenada | 18 | 0.1% |
| Guyana | 74 | 0.3% |
| Honduras | 25 | 0.1% |
| Hungary | 24 | 0.1% |
| Indonesia | 22 | 0.1% |
| Italy | 37 | 0.2% |
| Jamaica | 691 | 2.7% |
| Latin America | 2,008 | 7.9% |
| Lebanon | 2 | 0.0% |
| Mexico | 47 | 0.2% |
| Nigeria | 8 | 0.0% |
| Northern Europe | 73 | 0.3% |
| Panama | 54 | 0.2% |
| Philippines | 11 | 0.0% |
| Russia | 34 | 0.1% |
| South America | 609 | 2.4% |
| South Eastern Asia | 75 | 0.3% |
| Southern Europe | 37 | 0.2% |
| St. Vincent and the Grenadines | 20 | 0.1% |
| Thailand | 39 | 0.2% |
| Turkey | 25 | 0.1% |
| Uruguay | 31 | 0.1% |
| Venezuela | 62 | 0.2% |
| Vietnam | 3 | 0.0% |
| West Indies | 61 | 0.2% |
| Western Africa | 27 | 0.1% |
| Western Asia | 27 | 0.1% |
| Western Europe | 69 | 0.3% | View All 46 Rows |
Sex and Age in Silver Springs Shores
Sex and Age in Silver Springs Shores
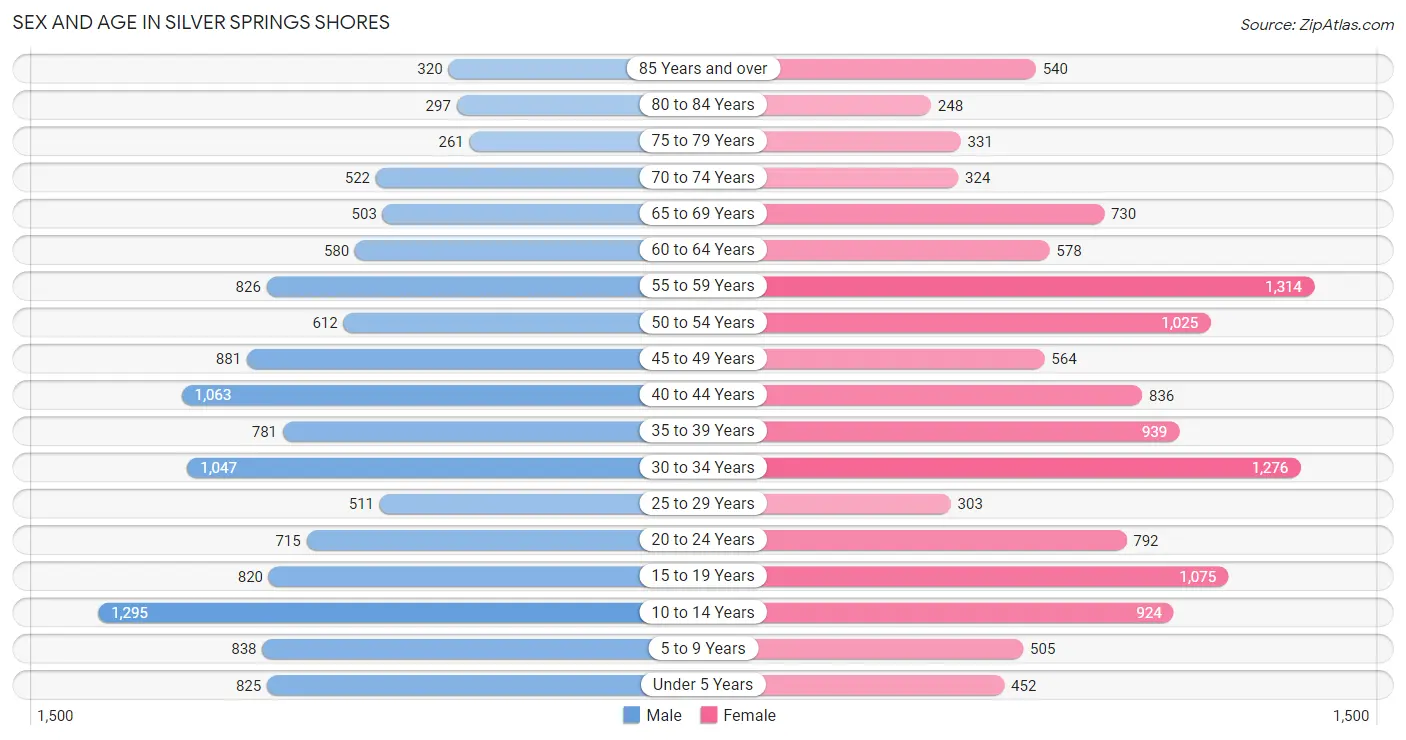
The most populous age groups in Silver Springs Shores are 10 to 14 Years (1,295 | 10.2%) for men and 55 to 59 Years (1,314 | 10.3%) for women.
| Age Bracket | Male | Female |
| Under 5 Years | 825 (6.5%) | 452 (3.5%) |
| 5 to 9 Years | 838 (6.6%) | 505 (4.0%) |
| 10 to 14 Years | 1,295 (10.2%) | 924 (7.2%) |
| 15 to 19 Years | 820 (6.5%) | 1,075 (8.4%) |
| 20 to 24 Years | 715 (5.6%) | 792 (6.2%) |
| 25 to 29 Years | 511 (4.0%) | 303 (2.4%) |
| 30 to 34 Years | 1,047 (8.3%) | 1,276 (10.0%) |
| 35 to 39 Years | 781 (6.1%) | 939 (7.4%) |
| 40 to 44 Years | 1,063 (8.4%) | 836 (6.6%) |
| 45 to 49 Years | 881 (6.9%) | 564 (4.4%) |
| 50 to 54 Years | 612 (4.8%) | 1,025 (8.0%) |
| 55 to 59 Years | 826 (6.5%) | 1,314 (10.3%) |
| 60 to 64 Years | 580 (4.6%) | 578 (4.5%) |
| 65 to 69 Years | 503 (4.0%) | 730 (5.7%) |
| 70 to 74 Years | 522 (4.1%) | 324 (2.5%) |
| 75 to 79 Years | 261 (2.1%) | 331 (2.6%) |
| 80 to 84 Years | 297 (2.3%) | 248 (1.9%) |
| 85 Years and over | 320 (2.5%) | 540 (4.2%) |
| Total | 12,697 (100.0%) | 12,756 (100.0%) |
Families and Households in Silver Springs Shores
Median Family Size in Silver Springs Shores
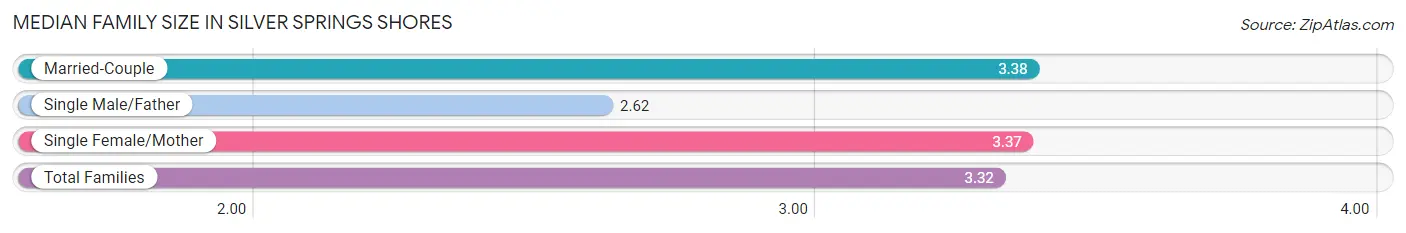
The median family size in Silver Springs Shores is 3.32 persons per family, with married-couple families (4,441 | 72.7%) accounting for the largest median family size of 3.38 persons per family. On the other hand, single male/father families (482 | 7.9%) represent the smallest median family size with 2.62 persons per family.
| Family Type | # Families | Family Size |
| Married-Couple | 4,441 (72.7%) | 3.38 |
| Single Male/Father | 482 (7.9%) | 2.62 |
| Single Female/Mother | 1,182 (19.4%) | 3.37 |
| Total Families | 6,105 (100.0%) | 3.32 |
Median Household Size in Silver Springs Shores
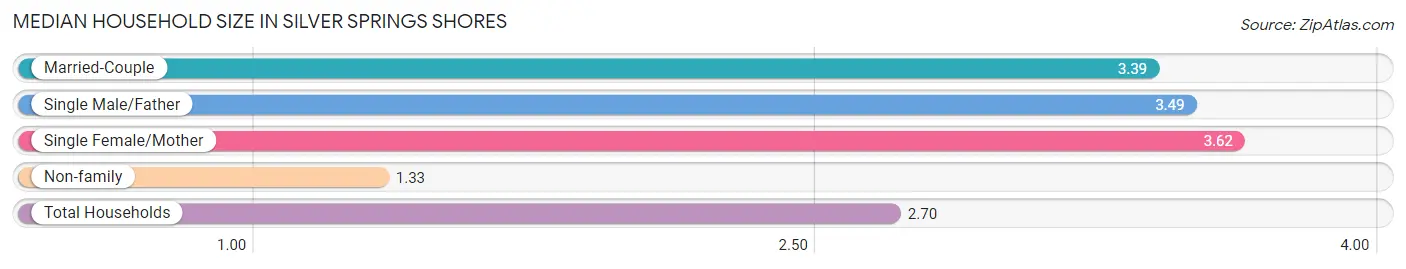
The median household size in Silver Springs Shores is 2.70 persons per household, with single female/mother households (1,182 | 12.6%) accounting for the largest median household size of 3.62 persons per household. non-family households (3,305 | 35.1%) represent the smallest median household size with 1.33 persons per household.
| Household Type | # Households | Household Size |
| Married-Couple | 4,441 (47.2%) | 3.39 |
| Single Male/Father | 482 (5.1%) | 3.49 |
| Single Female/Mother | 1,182 (12.6%) | 3.62 |
| Non-family | 3,305 (35.1%) | 1.33 |
| Total Households | 9,410 (100.0%) | 2.70 |
Household Size by Marriage Status in Silver Springs Shores
Out of a total of 9,410 households in Silver Springs Shores, 6,105 (64.9%) are family households, while 3,305 (35.1%) are nonfamily households. The most numerous type of family households are 2-person households, comprising 2,113, and the most common type of nonfamily households are 1-person households, comprising 2,642.
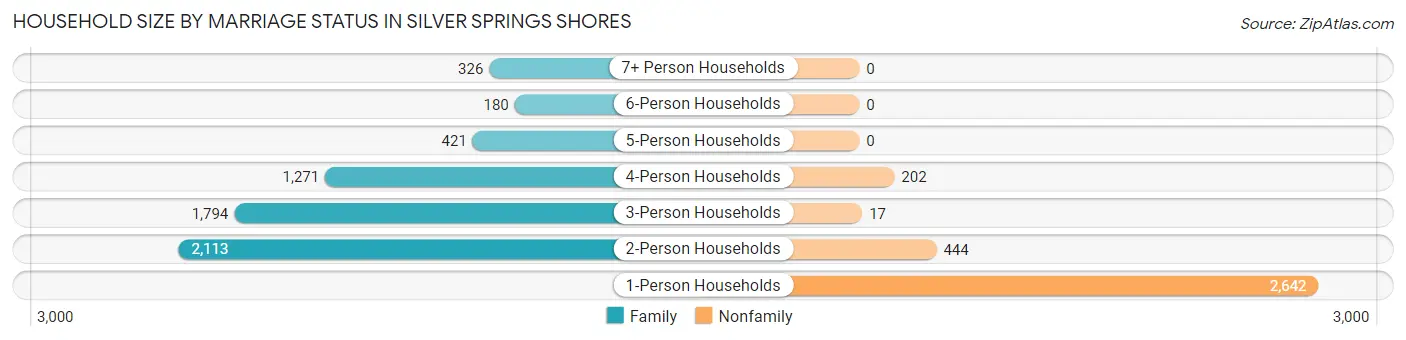
| Household Size | Family Households | Nonfamily Households |
| 1-Person Households | - | 2,642 (28.1%) |
| 2-Person Households | 2,113 (22.5%) | 444 (4.7%) |
| 3-Person Households | 1,794 (19.1%) | 17 (0.2%) |
| 4-Person Households | 1,271 (13.5%) | 202 (2.1%) |
| 5-Person Households | 421 (4.5%) | 0 (0.0%) |
| 6-Person Households | 180 (1.9%) | 0 (0.0%) |
| 7+ Person Households | 326 (3.5%) | 0 (0.0%) |
| Total | 6,105 (64.9%) | 3,305 (35.1%) |
Female Fertility in Silver Springs Shores
Fertility by Age in Silver Springs Shores
Average fertility rate in Silver Springs Shores is 21.0 births per 1,000 women. Women in the age bracket of 15 to 19 years have the highest fertility rate with 39.0 births per 1,000 women. Women in the age bracket of 20 to 34 years acount for 59.7% of all women with births.
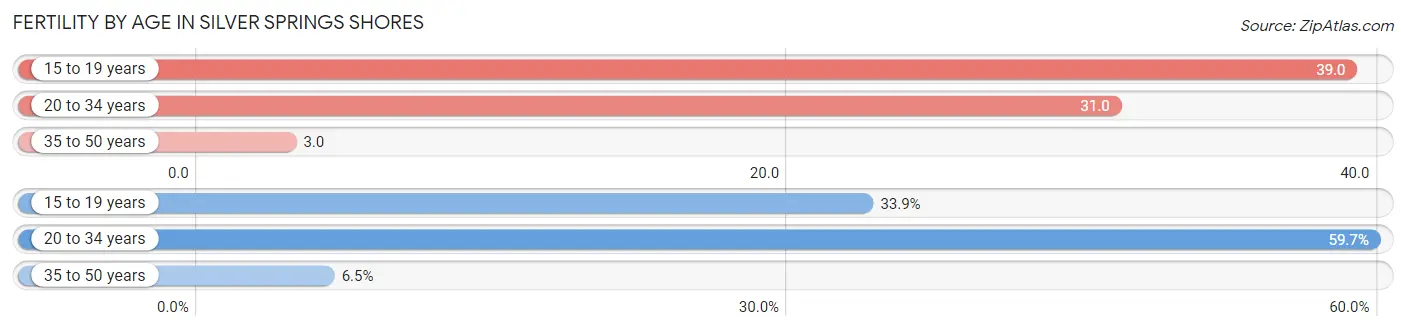
| Age Bracket | Women with Births | Births / 1,000 Women |
| 15 to 19 years | 42 (33.9%) | 39.0 |
| 20 to 34 years | 74 (59.7%) | 31.0 |
| 35 to 50 years | 8 (6.5%) | 3.0 |
| Total | 124 (100.0%) | 21.0 |
Fertility by Age by Marriage Status in Silver Springs Shores
75.8% of women with births (124) in Silver Springs Shores are married. The highest percentage of unmarried women with births falls into 15 to 19 years age bracket with 71.4% of them unmarried at the time of birth, while the lowest percentage of unmarried women with births belong to 20 to 34 years age bracket with 0.0% of them unmarried.
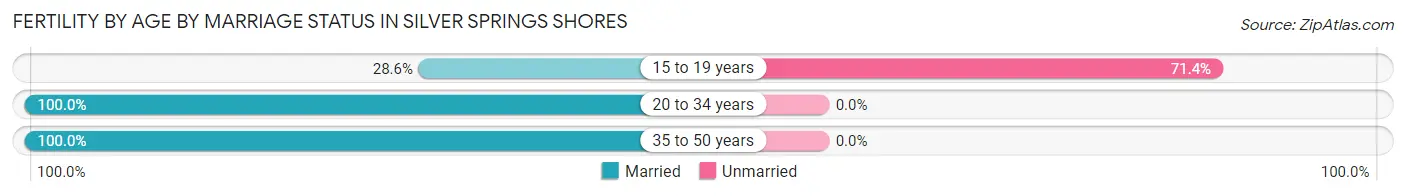
| Age Bracket | Married | Unmarried |
| 15 to 19 years | 12 (28.6%) | 30 (71.4%) |
| 20 to 34 years | 74 (100.0%) | 0 (0.0%) |
| 35 to 50 years | 8 (100.0%) | 0 (0.0%) |
| Total | 94 (75.8%) | 30 (24.2%) |
Fertility by Education in Silver Springs Shores
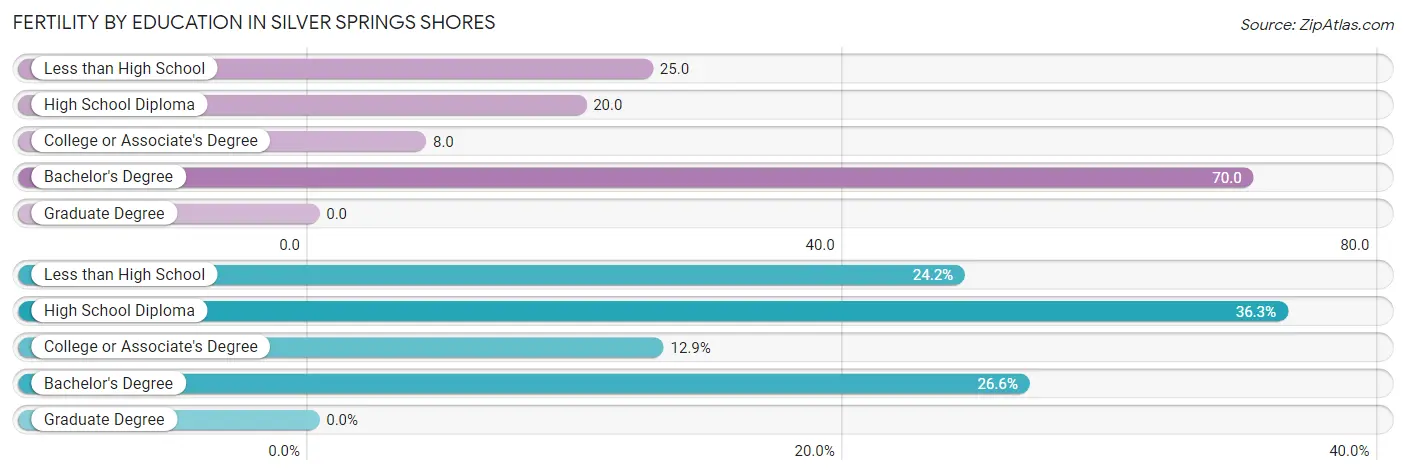
| Educational Attainment | Women with Births | Births / 1,000 Women |
| Less than High School | 30 (24.2%) | 25.0 |
| High School Diploma | 45 (36.3%) | 20.0 |
| College or Associate's Degree | 16 (12.9%) | 8.0 |
| Bachelor's Degree | 33 (26.6%) | 70.0 |
| Graduate Degree | 0 (0.0%) | 0.0 |
| Total | 124 (100.0%) | 21.0 |
Fertility by Education by Marriage Status in Silver Springs Shores
24.2% of women with births in Silver Springs Shores are unmarried. Women with the educational attainment of high school diploma are most likely to be married with 100.0% of them married at childbirth, while women with the educational attainment of less than high school are least likely to be married with 100.0% of them unmarried at childbirth.
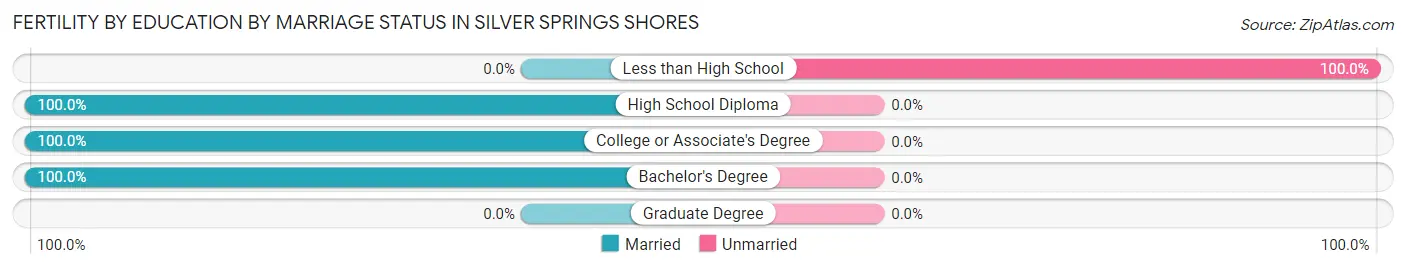
| Educational Attainment | Married | Unmarried |
| Less than High School | 0 (0.0%) | 30 (100.0%) |
| High School Diploma | 45 (100.0%) | 0 (0.0%) |
| College or Associate's Degree | 16 (100.0%) | 0 (0.0%) |
| Bachelor's Degree | 33 (100.0%) | 0 (0.0%) |
| Graduate Degree | 0 (0.0%) | 0 (0.0%) |
| Total | 94 (75.8%) | 30 (24.2%) |
Employment Characteristics in Silver Springs Shores
Employment by Class of Employer in Silver Springs Shores
Among the 10,428 employed individuals in Silver Springs Shores, private company employees (7,988 | 76.6%), local government employees (807 | 7.7%), and self-employed (not incorporated) (541 | 5.2%) make up the most common classes of employment.
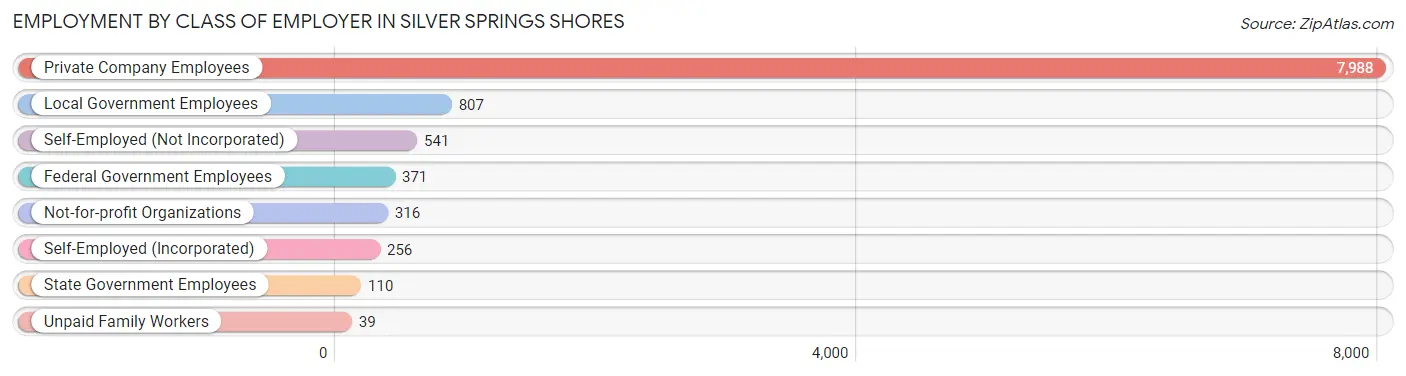
| Employer Class | # Employees | % Employees |
| Private Company Employees | 7,988 | 76.6% |
| Self-Employed (Incorporated) | 256 | 2.5% |
| Self-Employed (Not Incorporated) | 541 | 5.2% |
| Not-for-profit Organizations | 316 | 3.0% |
| Local Government Employees | 807 | 7.7% |
| State Government Employees | 110 | 1.1% |
| Federal Government Employees | 371 | 3.6% |
| Unpaid Family Workers | 39 | 0.4% |
| Total | 10,428 | 100.0% |
Employment Status by Age in Silver Springs Shores
According to the labor force statistics for Silver Springs Shores, out of the total population over 16 years of age (20,349), 54.5% or 11,090 individuals are in the labor force, with 3.9% or 433 of them unemployed. The age group with the highest labor force participation rate is 25 to 29 years, with 88.6% or 721 individuals in the labor force. Within the labor force, the 30 to 34 years age range has the highest percentage of unemployed individuals, with 5.5% or 78 of them being unemployed.
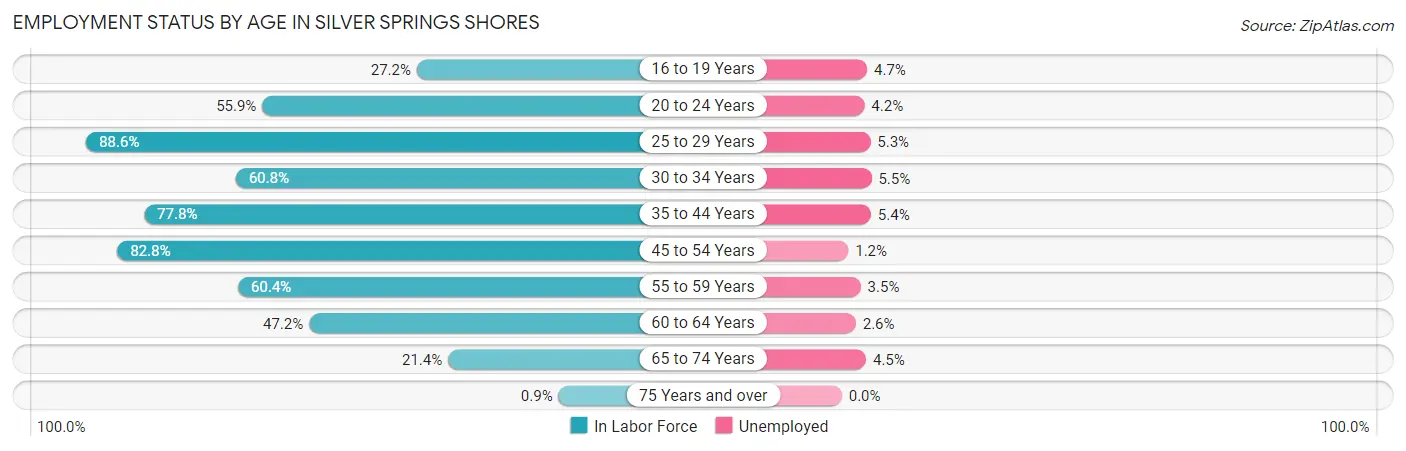
| Age Bracket | In Labor Force | Unemployed |
| 16 to 19 Years | 443 (27.2%) | 21 (4.7%) |
| 20 to 24 Years | 842 (55.9%) | 35 (4.2%) |
| 25 to 29 Years | 721 (88.6%) | 38 (5.3%) |
| 30 to 34 Years | 1,412 (60.8%) | 78 (5.5%) |
| 35 to 44 Years | 2,816 (77.8%) | 152 (5.4%) |
| 45 to 54 Years | 2,552 (82.8%) | 31 (1.2%) |
| 55 to 59 Years | 1,293 (60.4%) | 45 (3.5%) |
| 60 to 64 Years | 547 (47.2%) | 14 (2.6%) |
| 65 to 74 Years | 445 (21.4%) | 20 (4.5%) |
| 75 Years and over | 18 (0.9%) | 0 (0.0%) |
| Total | 11,090 (54.5%) | 433 (3.9%) |
Employment Status by Educational Attainment in Silver Springs Shores
According to labor force statistics for Silver Springs Shores, 71.1% of individuals (9,340) out of the total population between 25 and 64 years of age (13,136) are in the labor force, with 3.8% or 355 of them being unemployed. The group with the highest labor force participation rate are those with the educational attainment of bachelor's degree or higher, with 89.3% or 1,664 individuals in the labor force. Within the labor force, individuals with less than high school education have the highest percentage of unemployment, with 8.3% or 48 of them being unemployed.
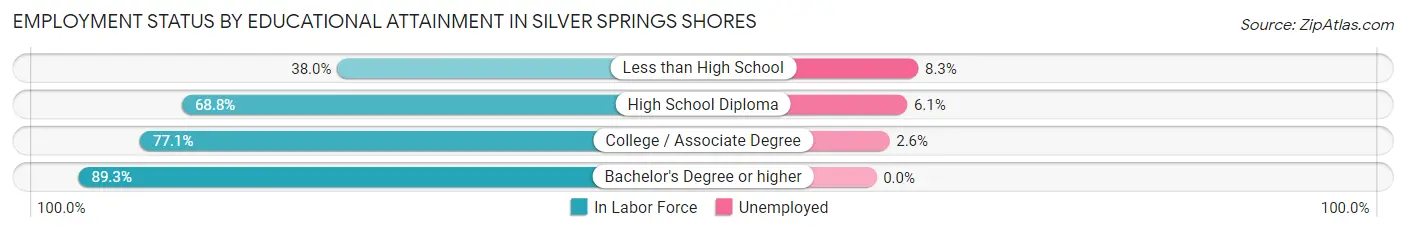
| Educational Attainment | In Labor Force | Unemployed |
| Less than High School | 575 (38.0%) | 126 (8.3%) |
| High School Diploma | 3,527 (68.8%) | 313 (6.1%) |
| College / Associate Degree | 3,572 (77.1%) | 120 (2.6%) |
| Bachelor's Degree or higher | 1,664 (89.3%) | 0 (0.0%) |
| Total | 9,340 (71.1%) | 499 (3.8%) |
Employment Occupations by Sex in Silver Springs Shores
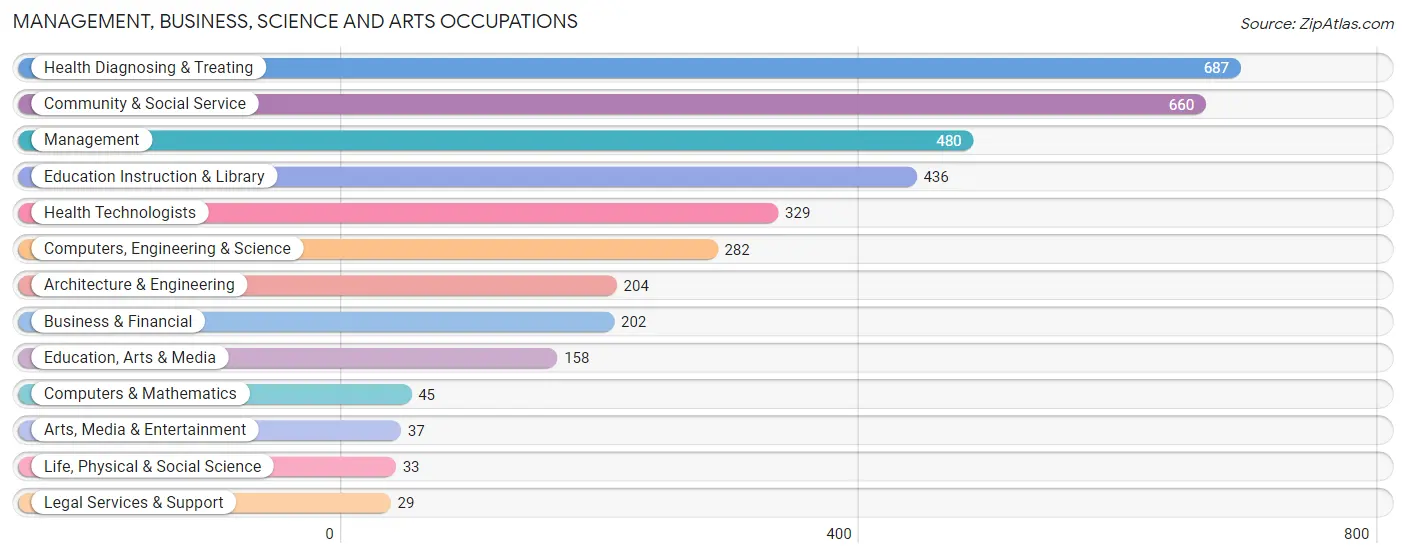
Management, Business, Science and Arts Occupations
The most common Management, Business, Science and Arts occupations in Silver Springs Shores are Health Diagnosing & Treating (687 | 6.5%), Community & Social Service (660 | 6.2%), Management (480 | 4.5%), Education Instruction & Library (436 | 4.1%), and Health Technologists (329 | 3.1%).
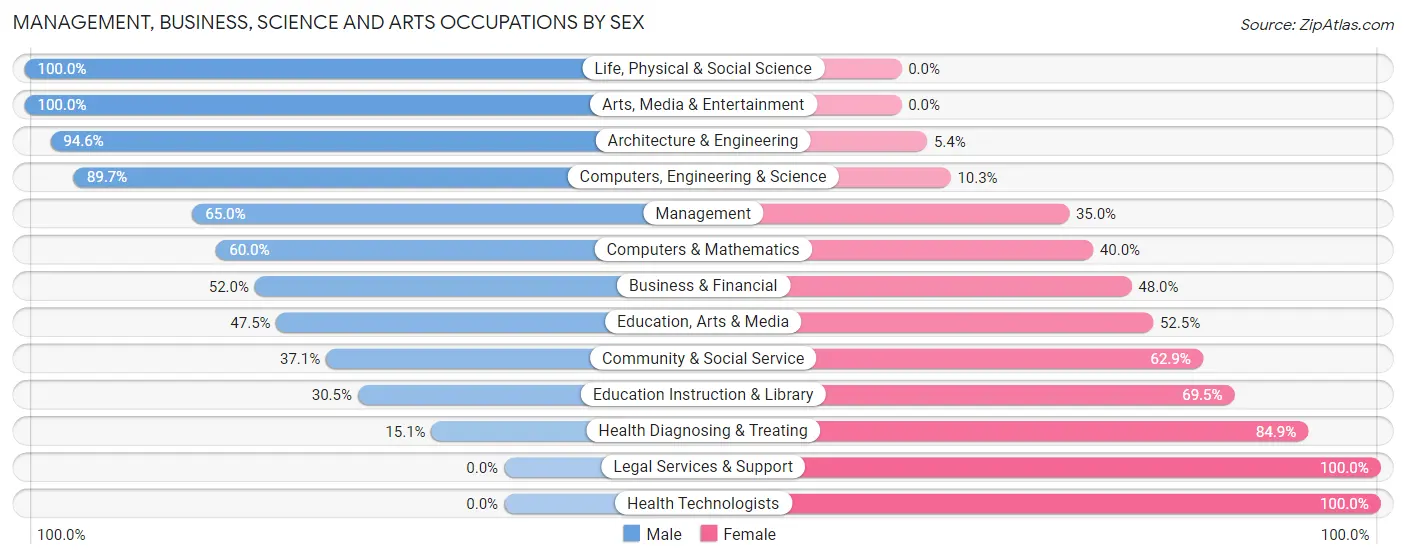
Management, Business, Science and Arts Occupations by Sex
Within the Management, Business, Science and Arts occupations in Silver Springs Shores, the most male-oriented occupations are Life, Physical & Social Science (100.0%), Arts, Media & Entertainment (100.0%), and Architecture & Engineering (94.6%), while the most female-oriented occupations are Legal Services & Support (100.0%), Health Technologists (100.0%), and Health Diagnosing & Treating (84.9%).
| Occupation | Male | Female |
| Management | 312 (65.0%) | 168 (35.0%) |
| Business & Financial | 105 (52.0%) | 97 (48.0%) |
| Computers, Engineering & Science | 253 (89.7%) | 29 (10.3%) |
| Computers & Mathematics | 27 (60.0%) | 18 (40.0%) |
| Architecture & Engineering | 193 (94.6%) | 11 (5.4%) |
| Life, Physical & Social Science | 33 (100.0%) | 0 (0.0%) |
| Community & Social Service | 245 (37.1%) | 415 (62.9%) |
| Education, Arts & Media | 75 (47.5%) | 83 (52.5%) |
| Legal Services & Support | 0 (0.0%) | 29 (100.0%) |
| Education Instruction & Library | 133 (30.5%) | 303 (69.5%) |
| Arts, Media & Entertainment | 37 (100.0%) | 0 (0.0%) |
| Health Diagnosing & Treating | 104 (15.1%) | 583 (84.9%) |
| Health Technologists | 0 (0.0%) | 329 (100.0%) |
| Total (Category) | 1,019 (44.1%) | 1,292 (55.9%) |
| Total (Overall) | 5,450 (51.1%) | 5,204 (48.8%) |
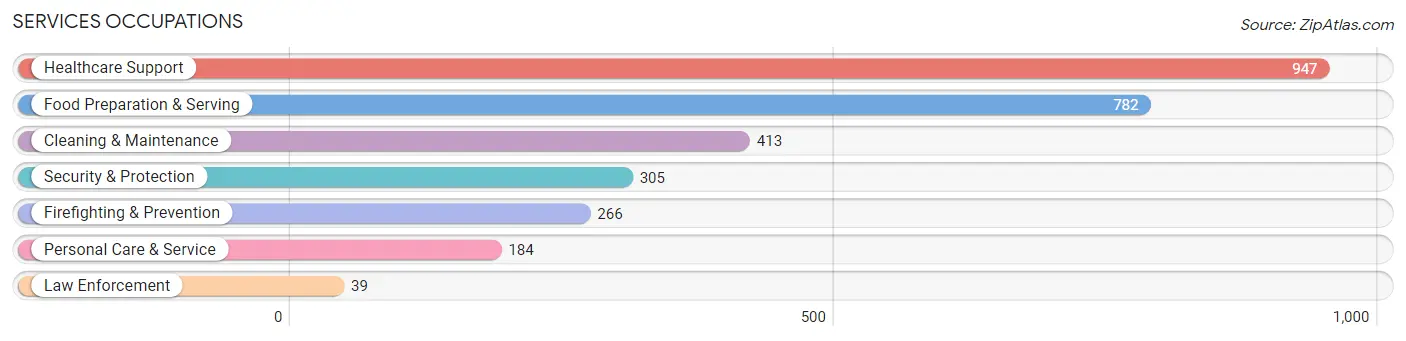
Services Occupations
The most common Services occupations in Silver Springs Shores are Healthcare Support (947 | 8.9%), Food Preparation & Serving (782 | 7.3%), Cleaning & Maintenance (413 | 3.9%), Security & Protection (305 | 2.9%), and Firefighting & Prevention (266 | 2.5%).
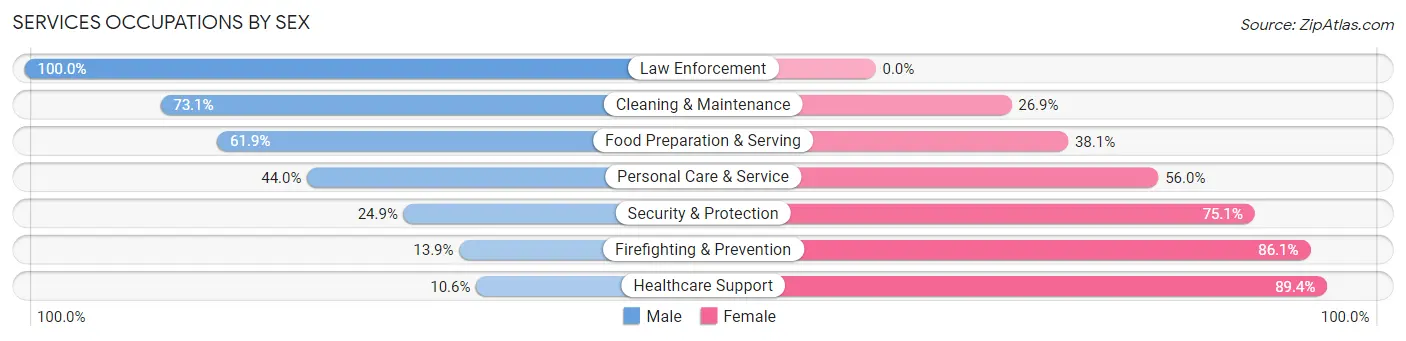
Services Occupations by Sex
Within the Services occupations in Silver Springs Shores, the most male-oriented occupations are Law Enforcement (100.0%), Cleaning & Maintenance (73.1%), and Food Preparation & Serving (61.9%), while the most female-oriented occupations are Healthcare Support (89.4%), Firefighting & Prevention (86.1%), and Security & Protection (75.1%).
| Occupation | Male | Female |
| Healthcare Support | 100 (10.6%) | 847 (89.4%) |
| Security & Protection | 76 (24.9%) | 229 (75.1%) |
| Firefighting & Prevention | 37 (13.9%) | 229 (86.1%) |
| Law Enforcement | 39 (100.0%) | 0 (0.0%) |
| Food Preparation & Serving | 484 (61.9%) | 298 (38.1%) |
| Cleaning & Maintenance | 302 (73.1%) | 111 (26.9%) |
| Personal Care & Service | 81 (44.0%) | 103 (56.0%) |
| Total (Category) | 1,043 (39.6%) | 1,588 (60.4%) |
| Total (Overall) | 5,450 (51.1%) | 5,204 (48.8%) |
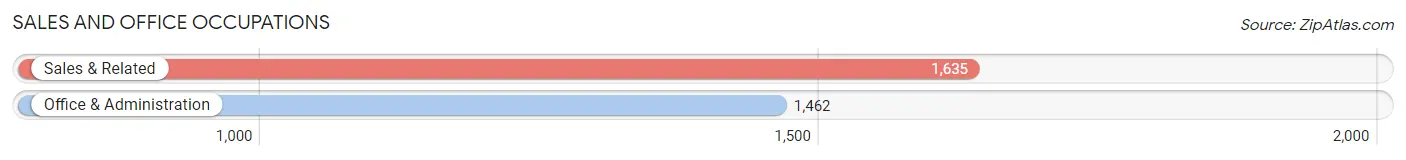
Sales and Office Occupations
The most common Sales and Office occupations in Silver Springs Shores are Sales & Related (1,635 | 15.3%), and Office & Administration (1,462 | 13.7%).
Sales and Office Occupations by Sex
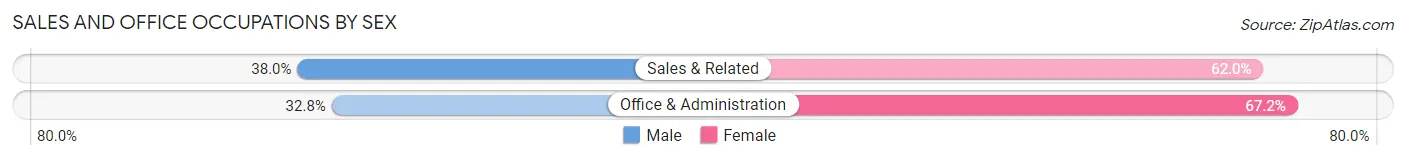
| Occupation | Male | Female |
| Sales & Related | 622 (38.0%) | 1,013 (62.0%) |
| Office & Administration | 479 (32.8%) | 983 (67.2%) |
| Total (Category) | 1,101 (35.5%) | 1,996 (64.4%) |
| Total (Overall) | 5,450 (51.1%) | 5,204 (48.8%) |
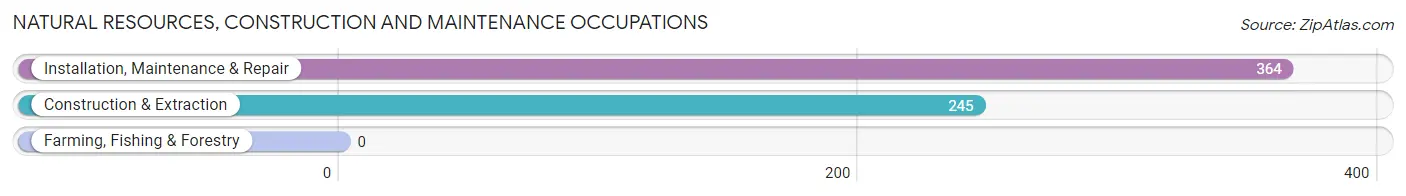
Natural Resources, Construction and Maintenance Occupations
The most common Natural Resources, Construction and Maintenance occupations in Silver Springs Shores are Installation, Maintenance & Repair (364 | 3.4%), and Construction & Extraction (245 | 2.3%).
Natural Resources, Construction and Maintenance Occupations by Sex
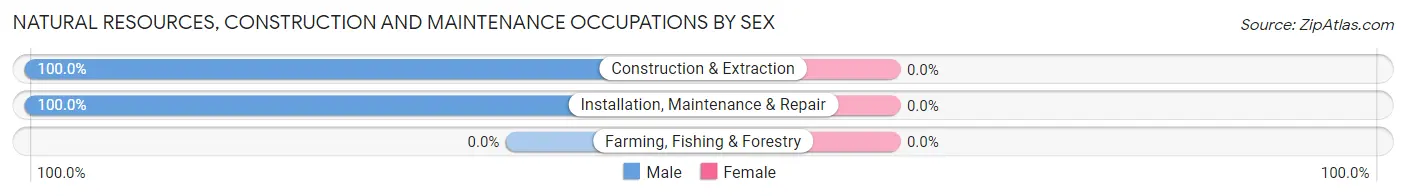
| Occupation | Male | Female |
| Farming, Fishing & Forestry | 0 (0.0%) | 0 (0.0%) |
| Construction & Extraction | 245 (100.0%) | 0 (0.0%) |
| Installation, Maintenance & Repair | 364 (100.0%) | 0 (0.0%) |
| Total (Category) | 609 (100.0%) | 0 (0.0%) |
| Total (Overall) | 5,450 (51.1%) | 5,204 (48.8%) |
Production, Transportation and Moving Occupations
The most common Production, Transportation and Moving occupations in Silver Springs Shores are Material Moving (720 | 6.8%), Production (663 | 6.2%), and Transportation (623 | 5.9%).
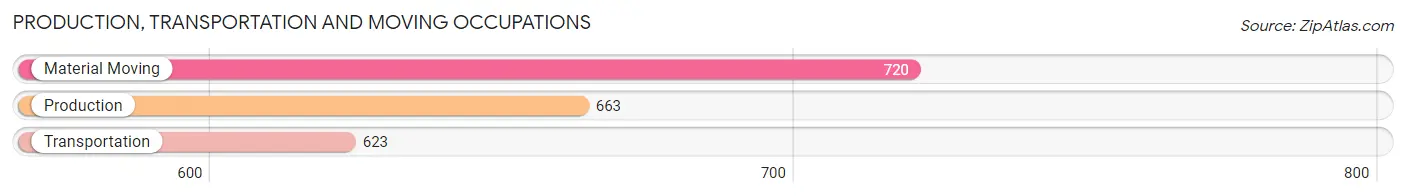
Production, Transportation and Moving Occupations by Sex
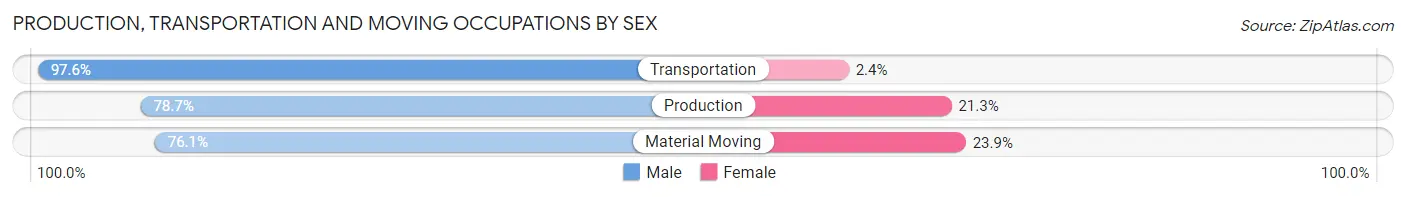
| Occupation | Male | Female |
| Production | 522 (78.7%) | 141 (21.3%) |
| Transportation | 608 (97.6%) | 15 (2.4%) |
| Material Moving | 548 (76.1%) | 172 (23.9%) |
| Total (Category) | 1,678 (83.7%) | 328 (16.4%) |
| Total (Overall) | 5,450 (51.1%) | 5,204 (48.8%) |
Employment Industries by Sex in Silver Springs Shores
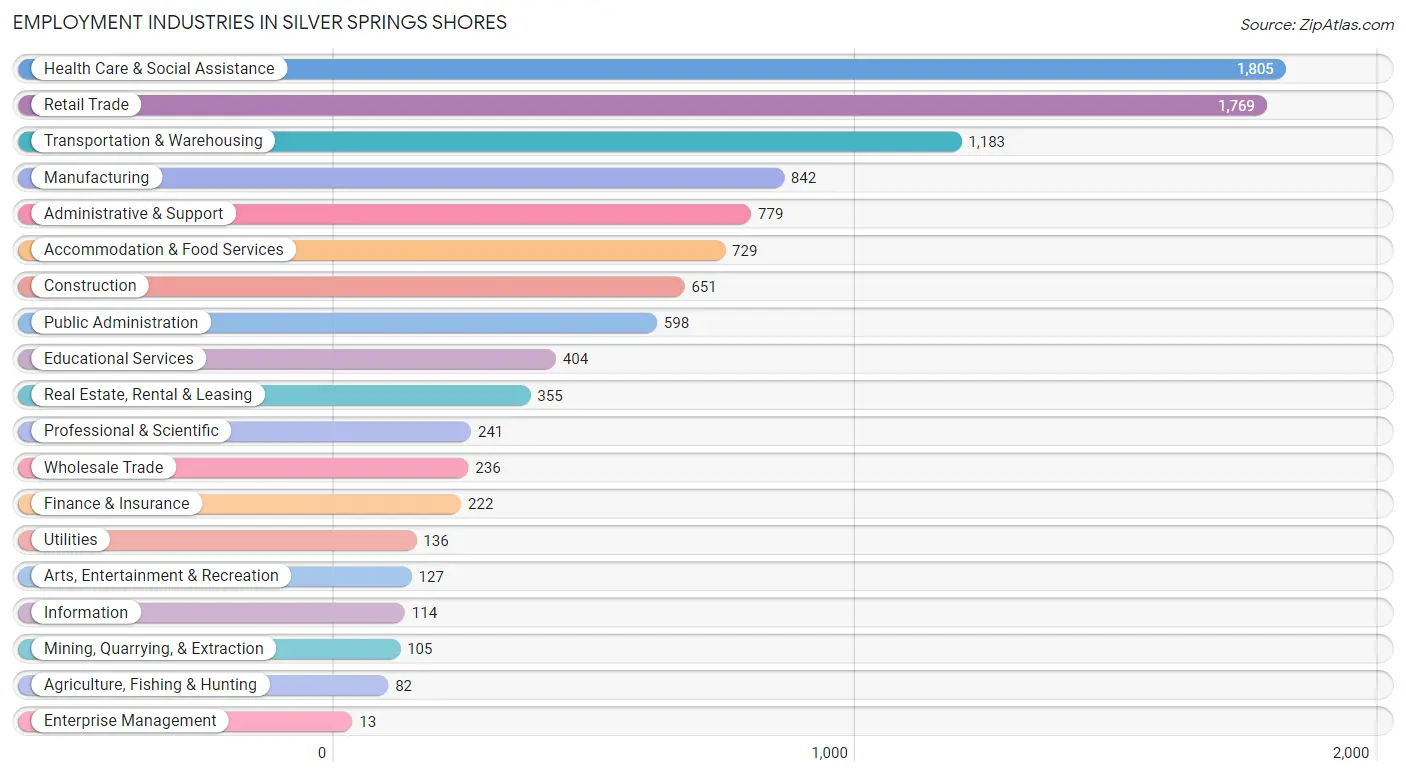
Employment Industries in Silver Springs Shores
The major employment industries in Silver Springs Shores include Health Care & Social Assistance (1,805 | 16.9%), Retail Trade (1,769 | 16.6%), Transportation & Warehousing (1,183 | 11.1%), Manufacturing (842 | 7.9%), and Administrative & Support (779 | 7.3%).
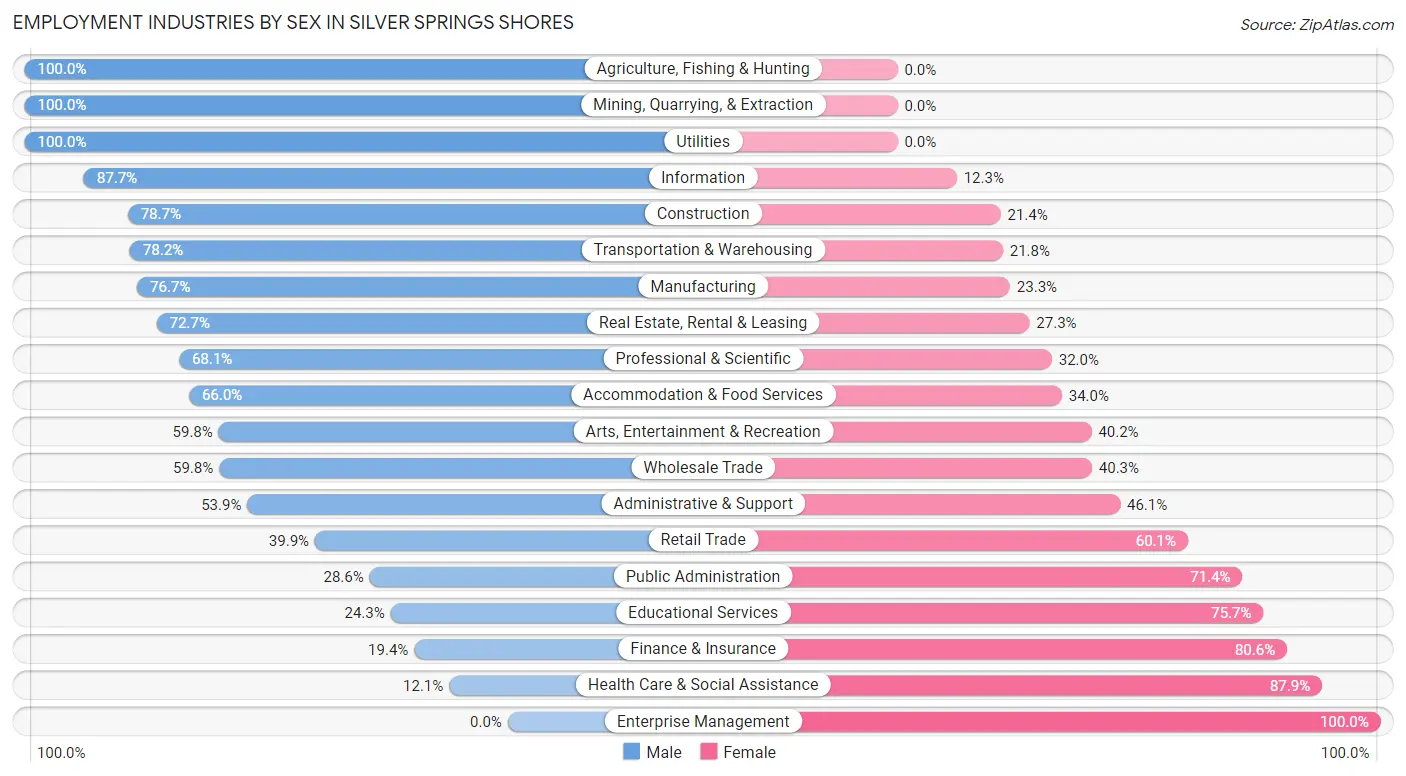
Employment Industries by Sex in Silver Springs Shores
The Silver Springs Shores industries that see more men than women are Agriculture, Fishing & Hunting (100.0%), Mining, Quarrying, & Extraction (100.0%), and Utilities (100.0%), whereas the industries that tend to have a higher number of women are Enterprise Management (100.0%), Health Care & Social Assistance (87.9%), and Finance & Insurance (80.6%).
| Industry | Male | Female |
| Agriculture, Fishing & Hunting | 82 (100.0%) | 0 (0.0%) |
| Mining, Quarrying, & Extraction | 105 (100.0%) | 0 (0.0%) |
| Construction | 512 (78.6%) | 139 (21.3%) |
| Manufacturing | 646 (76.7%) | 196 (23.3%) |
| Wholesale Trade | 141 (59.8%) | 95 (40.3%) |
| Retail Trade | 706 (39.9%) | 1,063 (60.1%) |
| Transportation & Warehousing | 925 (78.2%) | 258 (21.8%) |
| Utilities | 136 (100.0%) | 0 (0.0%) |
| Information | 100 (87.7%) | 14 (12.3%) |
| Finance & Insurance | 43 (19.4%) | 179 (80.6%) |
| Real Estate, Rental & Leasing | 258 (72.7%) | 97 (27.3%) |
| Professional & Scientific | 164 (68.0%) | 77 (32.0%) |
| Enterprise Management | 0 (0.0%) | 13 (100.0%) |
| Administrative & Support | 420 (53.9%) | 359 (46.1%) |
| Educational Services | 98 (24.3%) | 306 (75.7%) |
| Health Care & Social Assistance | 219 (12.1%) | 1,586 (87.9%) |
| Arts, Entertainment & Recreation | 76 (59.8%) | 51 (40.2%) |
| Accommodation & Food Services | 481 (66.0%) | 248 (34.0%) |
| Public Administration | 171 (28.6%) | 427 (71.4%) |
| Total | 5,450 (51.1%) | 5,204 (48.8%) |
Education in Silver Springs Shores
School Enrollment in Silver Springs Shores
The most common levels of schooling among the 6,295 students in Silver Springs Shores are middle school (1,677 | 26.6%), high school (1,523 | 24.2%), and elementary school (1,130 | 17.9%).
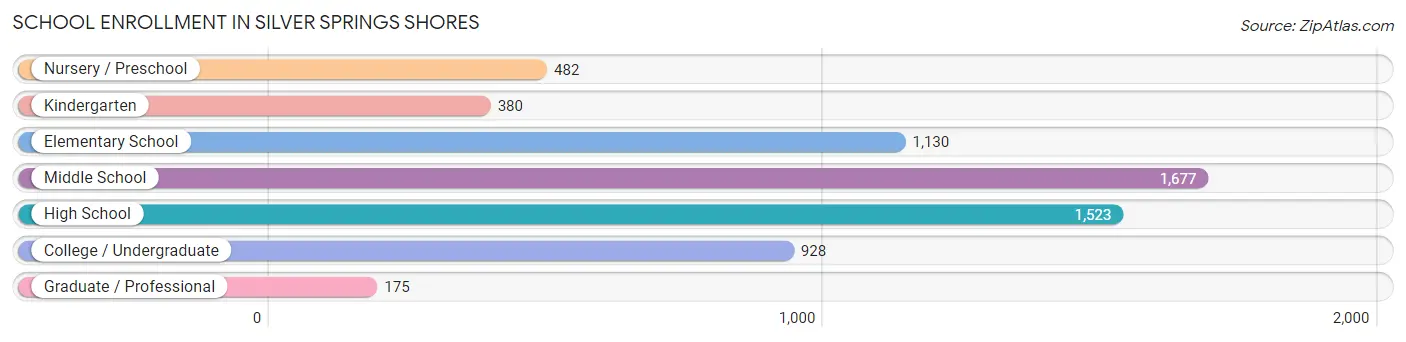
| School Level | # Students | % Students |
| Nursery / Preschool | 482 | 7.7% |
| Kindergarten | 380 | 6.0% |
| Elementary School | 1,130 | 17.9% |
| Middle School | 1,677 | 26.6% |
| High School | 1,523 | 24.2% |
| College / Undergraduate | 928 | 14.7% |
| Graduate / Professional | 175 | 2.8% |
| Total | 6,295 | 100.0% |
School Enrollment by Age by Funding Source in Silver Springs Shores
Out of a total of 6,295 students who are enrolled in schools in Silver Springs Shores, 957 (15.2%) attend a private institution, while the remaining 5,338 (84.8%) are enrolled in public schools. The age group of 3 to 4 year olds has the highest likelihood of being enrolled in private schools, with 252 (54.5% in the age bracket) enrolled. Conversely, the age group of 5 to 9 year old has the lowest likelihood of being enrolled in a private school, with 1,193 (95.4% in the age bracket) attending a public institution.
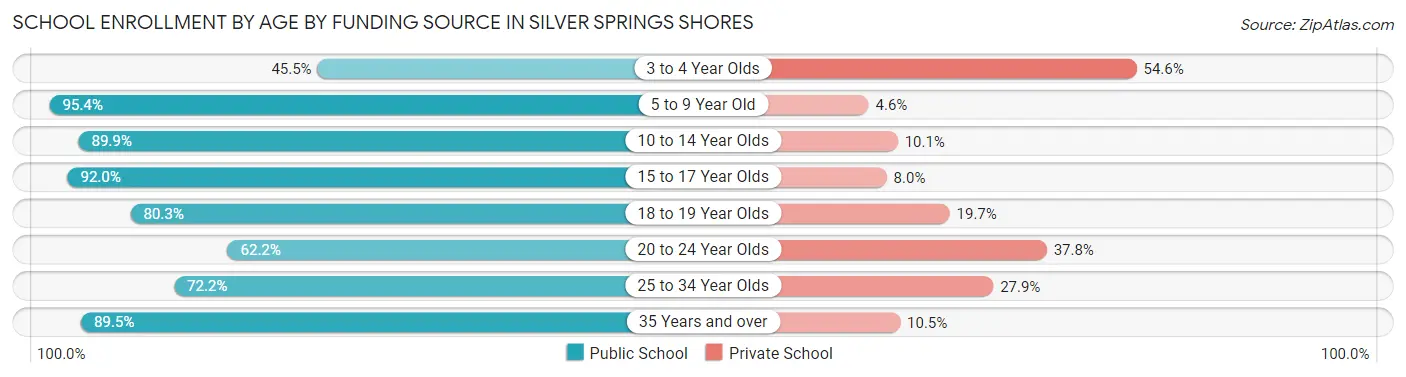
| Age Bracket | Public School | Private School |
| 3 to 4 Year Olds | 210 (45.5%) | 252 (54.5%) |
| 5 to 9 Year Old | 1,193 (95.4%) | 58 (4.6%) |
| 10 to 14 Year Olds | 1,923 (89.9%) | 215 (10.1%) |
| 15 to 17 Year Olds | 1,033 (92.0%) | 90 (8.0%) |
| 18 to 19 Year Olds | 236 (80.3%) | 58 (19.7%) |
| 20 to 24 Year Olds | 319 (62.2%) | 194 (37.8%) |
| 25 to 34 Year Olds | 158 (72.2%) | 61 (27.9%) |
| 35 Years and over | 264 (89.5%) | 31 (10.5%) |
| Total | 5,338 (84.8%) | 957 (15.2%) |
Educational Attainment by Field of Study in Silver Springs Shores
Business (519 | 19.7%), science & technology (490 | 18.6%), education (378 | 14.3%), arts & humanities (270 | 10.2%), and psychology (169 | 6.4%) are the most common fields of study among 2,635 individuals in Silver Springs Shores who have obtained a bachelor's degree or higher.
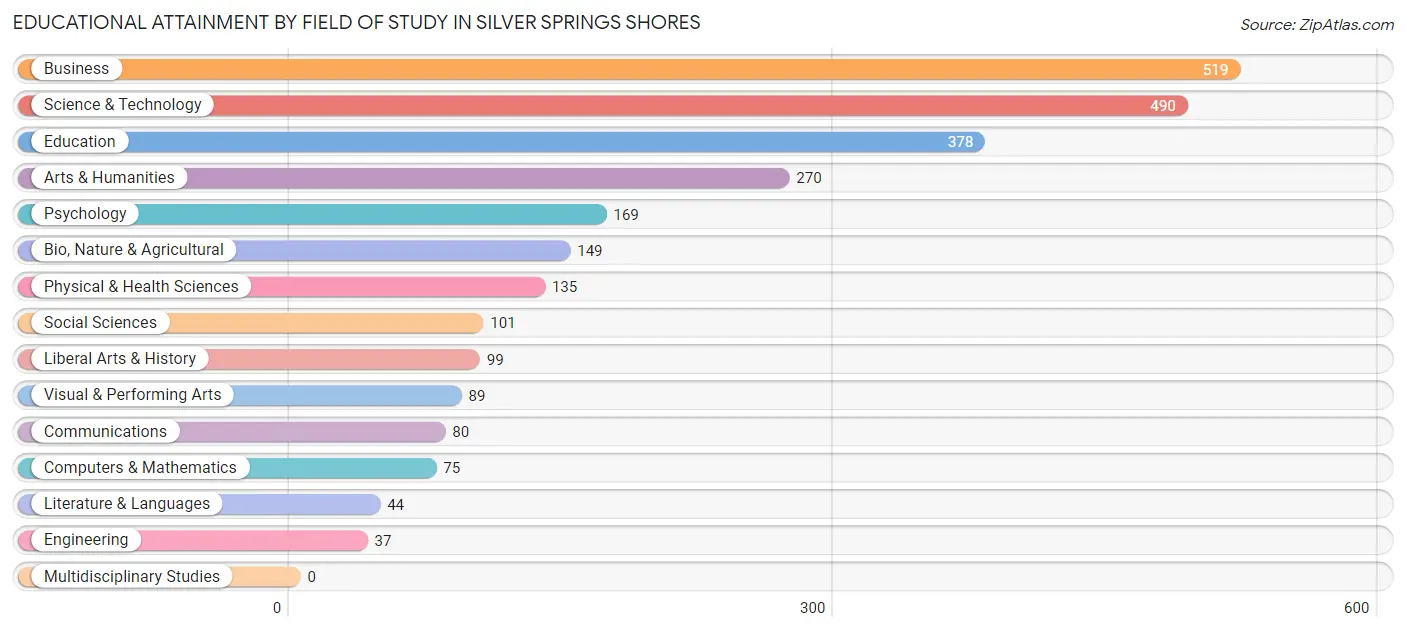
| Field of Study | # Graduates | % Graduates |
| Computers & Mathematics | 75 | 2.9% |
| Bio, Nature & Agricultural | 149 | 5.7% |
| Physical & Health Sciences | 135 | 5.1% |
| Psychology | 169 | 6.4% |
| Social Sciences | 101 | 3.8% |
| Engineering | 37 | 1.4% |
| Multidisciplinary Studies | 0 | 0.0% |
| Science & Technology | 490 | 18.6% |
| Business | 519 | 19.7% |
| Education | 378 | 14.3% |
| Literature & Languages | 44 | 1.7% |
| Liberal Arts & History | 99 | 3.8% |
| Visual & Performing Arts | 89 | 3.4% |
| Communications | 80 | 3.0% |
| Arts & Humanities | 270 | 10.2% |
| Total | 2,635 | 100.0% |
Transportation & Commute in Silver Springs Shores
Vehicle Availability by Sex in Silver Springs Shores
The most prevalent vehicle ownership categories in Silver Springs Shores are males with 2 vehicles (2,697, accounting for 50.4%) and females with 2 vehicles (2,179, making up 53.1%).
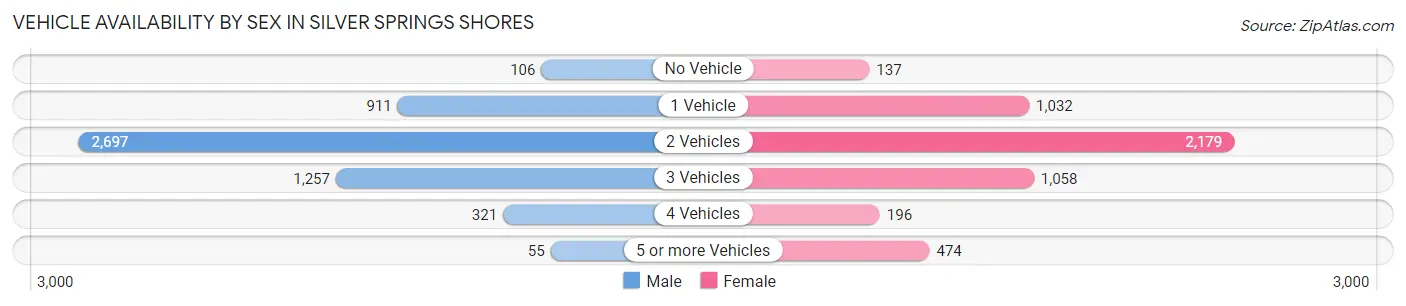
| Vehicles Available | Male | Female |
| No Vehicle | 106 (2.0%) | 137 (2.7%) |
| 1 Vehicle | 911 (17.0%) | 1,032 (20.3%) |
| 2 Vehicles | 2,697 (50.4%) | 2,179 (42.9%) |
| 3 Vehicles | 1,257 (23.5%) | 1,058 (20.8%) |
| 4 Vehicles | 321 (6.0%) | 196 (3.9%) |
| 5 or more Vehicles | 55 (1.0%) | 474 (9.3%) |
| Total | 5,347 (100.0%) | 5,076 (100.0%) |
Commute Time in Silver Springs Shores
The most frequently occuring commute durations in Silver Springs Shores are 20 to 24 minutes (1,919 commuters, 20.2%), 30 to 34 minutes (1,783 commuters, 18.8%), and 15 to 19 minutes (1,453 commuters, 15.3%).
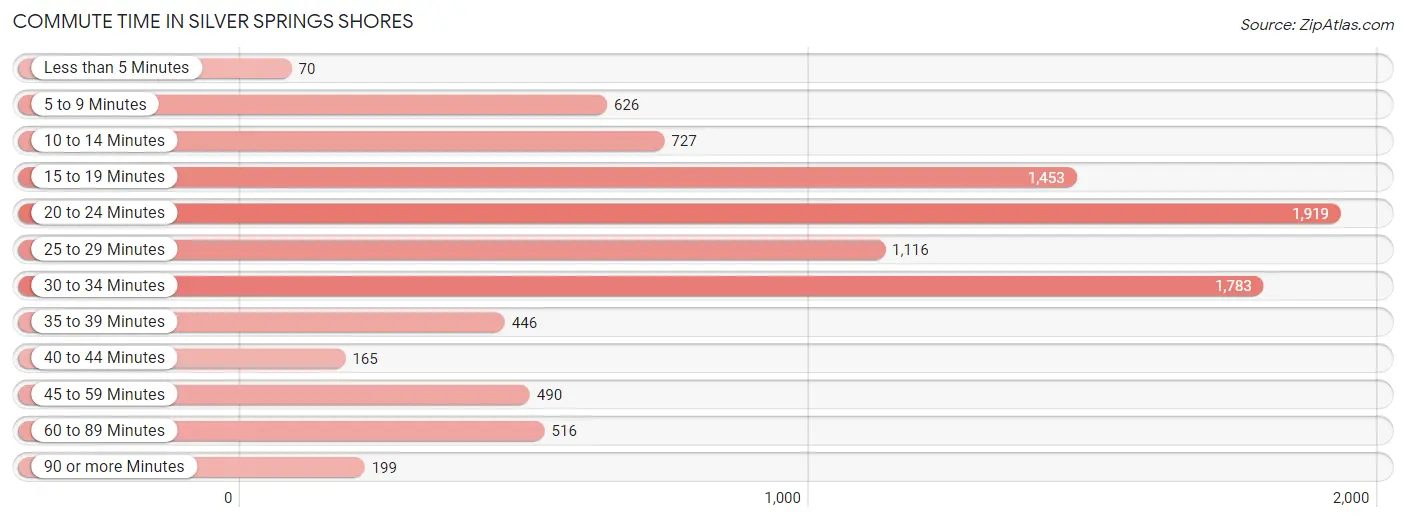
| Commute Time | # Commuters | % Commuters |
| Less than 5 Minutes | 70 | 0.7% |
| 5 to 9 Minutes | 626 | 6.6% |
| 10 to 14 Minutes | 727 | 7.6% |
| 15 to 19 Minutes | 1,453 | 15.3% |
| 20 to 24 Minutes | 1,919 | 20.2% |
| 25 to 29 Minutes | 1,116 | 11.7% |
| 30 to 34 Minutes | 1,783 | 18.8% |
| 35 to 39 Minutes | 446 | 4.7% |
| 40 to 44 Minutes | 165 | 1.7% |
| 45 to 59 Minutes | 490 | 5.1% |
| 60 to 89 Minutes | 516 | 5.4% |
| 90 or more Minutes | 199 | 2.1% |
Commute Time by Sex in Silver Springs Shores
The most common commute times in Silver Springs Shores are 20 to 24 minutes (1,005 commuters, 20.3%) for males and 20 to 24 minutes (914 commuters, 20.1%) for females.
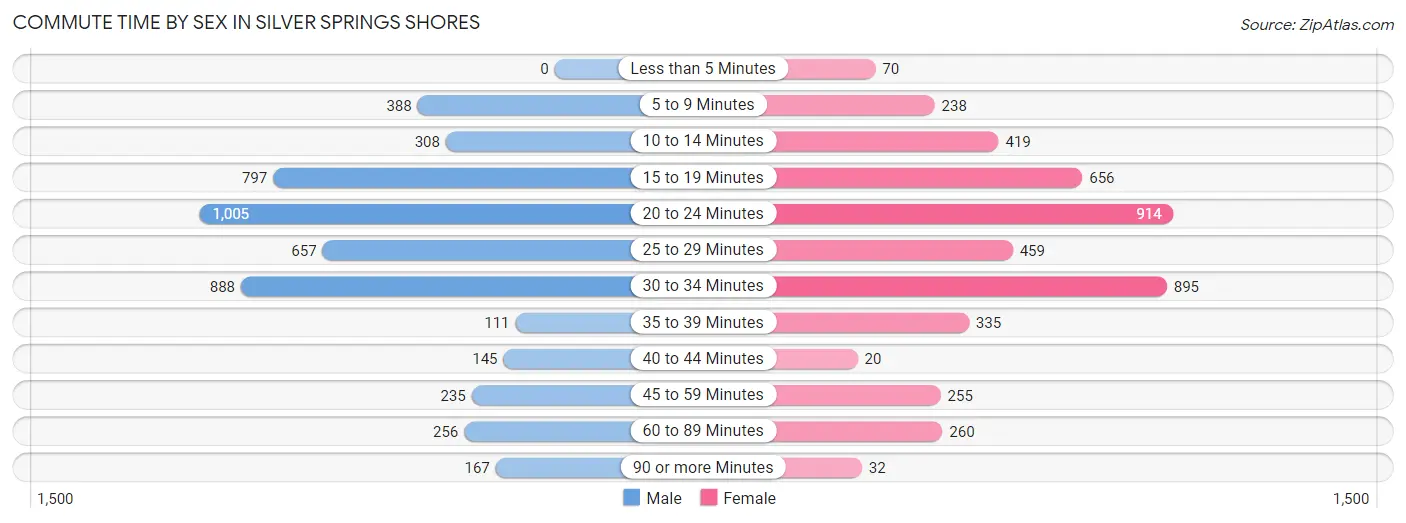
| Commute Time | Male | Female |
| Less than 5 Minutes | 0 (0.0%) | 70 (1.5%) |
| 5 to 9 Minutes | 388 (7.8%) | 238 (5.2%) |
| 10 to 14 Minutes | 308 (6.2%) | 419 (9.2%) |
| 15 to 19 Minutes | 797 (16.1%) | 656 (14.4%) |
| 20 to 24 Minutes | 1,005 (20.3%) | 914 (20.1%) |
| 25 to 29 Minutes | 657 (13.3%) | 459 (10.1%) |
| 30 to 34 Minutes | 888 (17.9%) | 895 (19.7%) |
| 35 to 39 Minutes | 111 (2.2%) | 335 (7.4%) |
| 40 to 44 Minutes | 145 (2.9%) | 20 (0.4%) |
| 45 to 59 Minutes | 235 (4.7%) | 255 (5.6%) |
| 60 to 89 Minutes | 256 (5.2%) | 260 (5.7%) |
| 90 or more Minutes | 167 (3.4%) | 32 (0.7%) |
Time of Departure to Work by Sex in Silver Springs Shores
The most frequent times of departure to work in Silver Springs Shores are 7:00 AM to 7:29 AM (764, 15.4%) for males and 7:00 AM to 7:29 AM (1,265, 27.8%) for females.
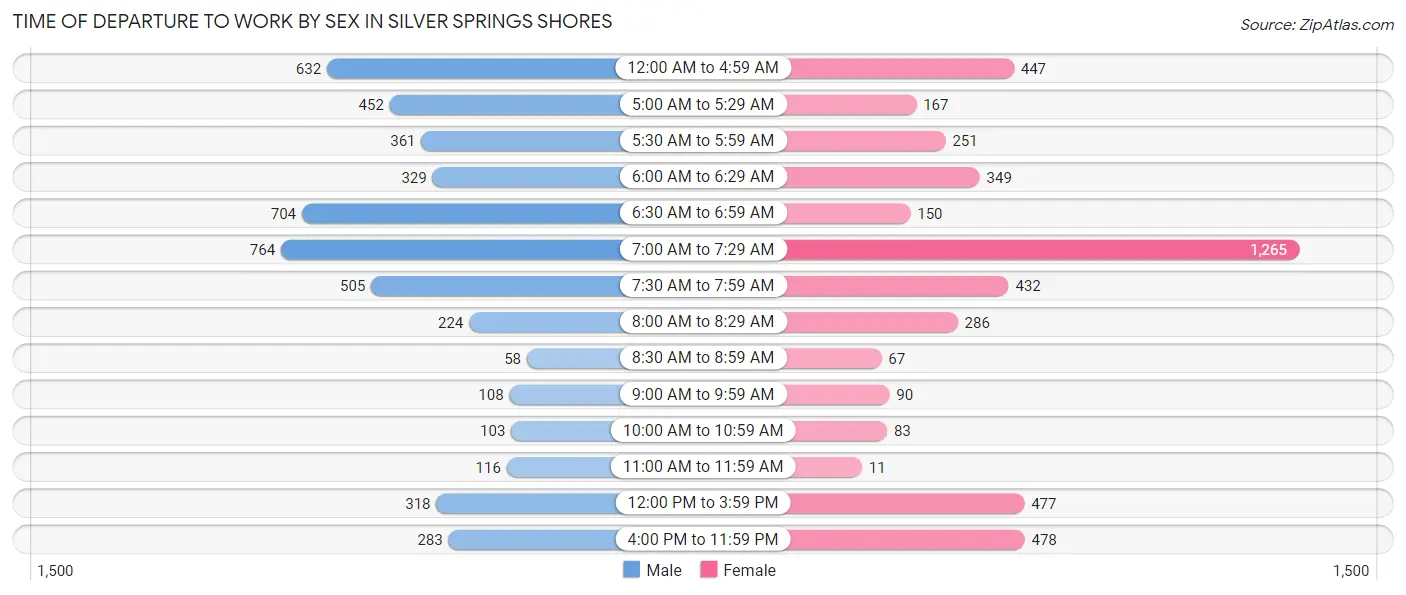
| Time of Departure | Male | Female |
| 12:00 AM to 4:59 AM | 632 (12.8%) | 447 (9.8%) |
| 5:00 AM to 5:29 AM | 452 (9.1%) | 167 (3.7%) |
| 5:30 AM to 5:59 AM | 361 (7.3%) | 251 (5.5%) |
| 6:00 AM to 6:29 AM | 329 (6.6%) | 349 (7.7%) |
| 6:30 AM to 6:59 AM | 704 (14.2%) | 150 (3.3%) |
| 7:00 AM to 7:29 AM | 764 (15.4%) | 1,265 (27.8%) |
| 7:30 AM to 7:59 AM | 505 (10.2%) | 432 (9.5%) |
| 8:00 AM to 8:29 AM | 224 (4.5%) | 286 (6.3%) |
| 8:30 AM to 8:59 AM | 58 (1.2%) | 67 (1.5%) |
| 9:00 AM to 9:59 AM | 108 (2.2%) | 90 (2.0%) |
| 10:00 AM to 10:59 AM | 103 (2.1%) | 83 (1.8%) |
| 11:00 AM to 11:59 AM | 116 (2.3%) | 11 (0.2%) |
| 12:00 PM to 3:59 PM | 318 (6.4%) | 477 (10.5%) |
| 4:00 PM to 11:59 PM | 283 (5.7%) | 478 (10.5%) |
| Total | 4,957 (100.0%) | 4,553 (100.0%) |
Housing Occupancy in Silver Springs Shores
Occupancy by Ownership in Silver Springs Shores
Of the total 9,410 dwellings in Silver Springs Shores, owner-occupied units account for 6,969 (74.1%), while renter-occupied units make up 2,441 (25.9%).
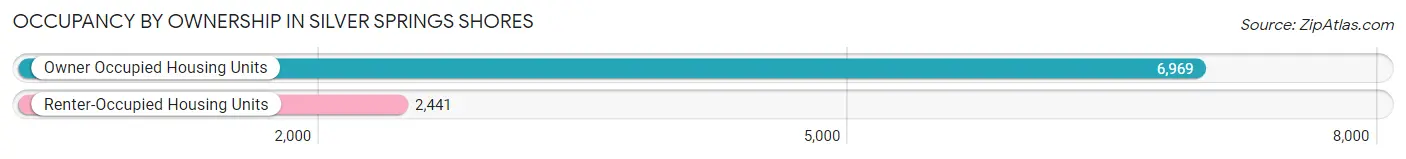
| Occupancy | # Housing Units | % Housing Units |
| Owner Occupied Housing Units | 6,969 | 74.1% |
| Renter-Occupied Housing Units | 2,441 | 25.9% |
| Total Occupied Housing Units | 9,410 | 100.0% |
Occupancy by Household Size in Silver Springs Shores
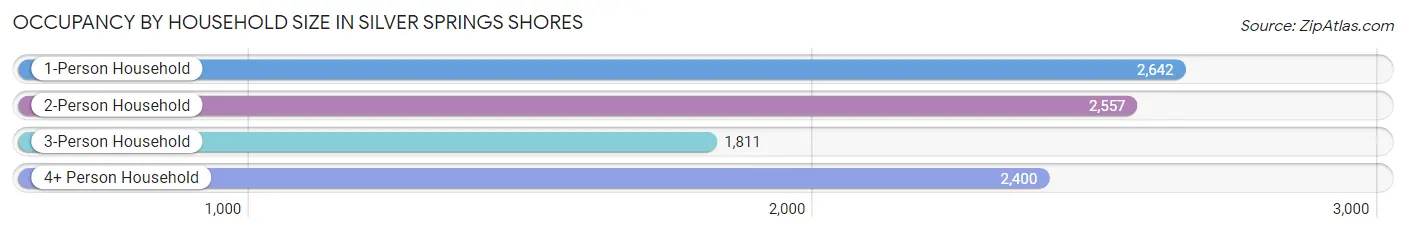
| Household Size | # Housing Units | % Housing Units |
| 1-Person Household | 2,642 | 28.1% |
| 2-Person Household | 2,557 | 27.2% |
| 3-Person Household | 1,811 | 19.3% |
| 4+ Person Household | 2,400 | 25.5% |
| Total Housing Units | 9,410 | 100.0% |
Occupancy by Ownership by Household Size in Silver Springs Shores
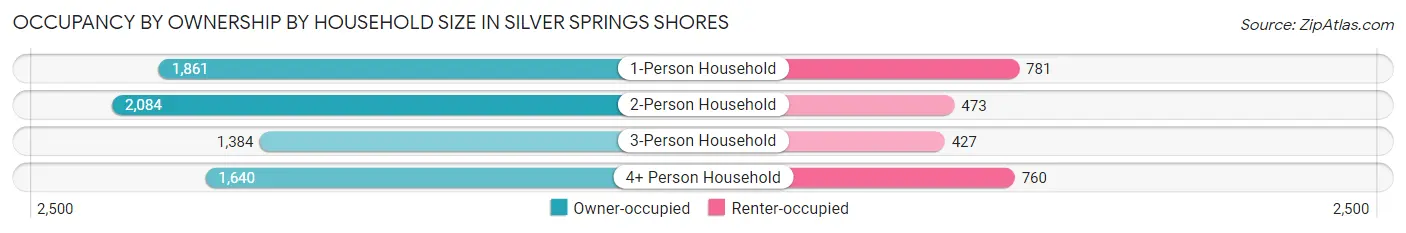
| Household Size | Owner-occupied | Renter-occupied |
| 1-Person Household | 1,861 (70.4%) | 781 (29.6%) |
| 2-Person Household | 2,084 (81.5%) | 473 (18.5%) |
| 3-Person Household | 1,384 (76.4%) | 427 (23.6%) |
| 4+ Person Household | 1,640 (68.3%) | 760 (31.7%) |
| Total Housing Units | 6,969 (74.1%) | 2,441 (25.9%) |
Occupancy by Educational Attainment in Silver Springs Shores
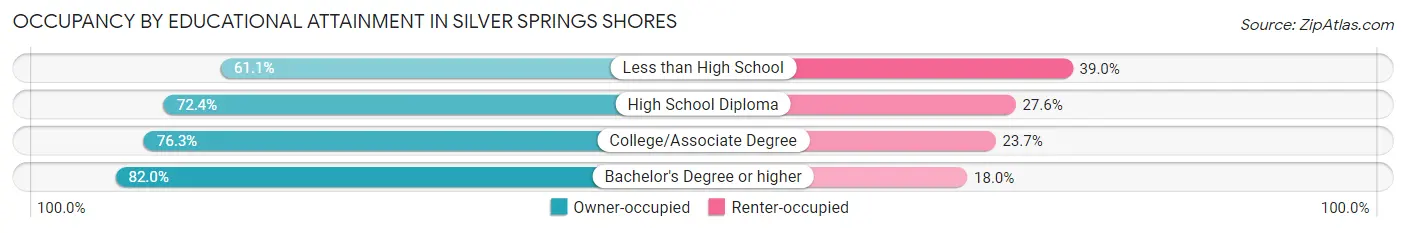
| Household Size | Owner-occupied | Renter-occupied |
| Less than High School | 881 (61.1%) | 562 (39.0%) |
| High School Diploma | 1,667 (72.4%) | 636 (27.6%) |
| College/Associate Degree | 3,007 (76.3%) | 932 (23.7%) |
| Bachelor's Degree or higher | 1,414 (82.0%) | 311 (18.0%) |
Occupancy by Age of Householder in Silver Springs Shores
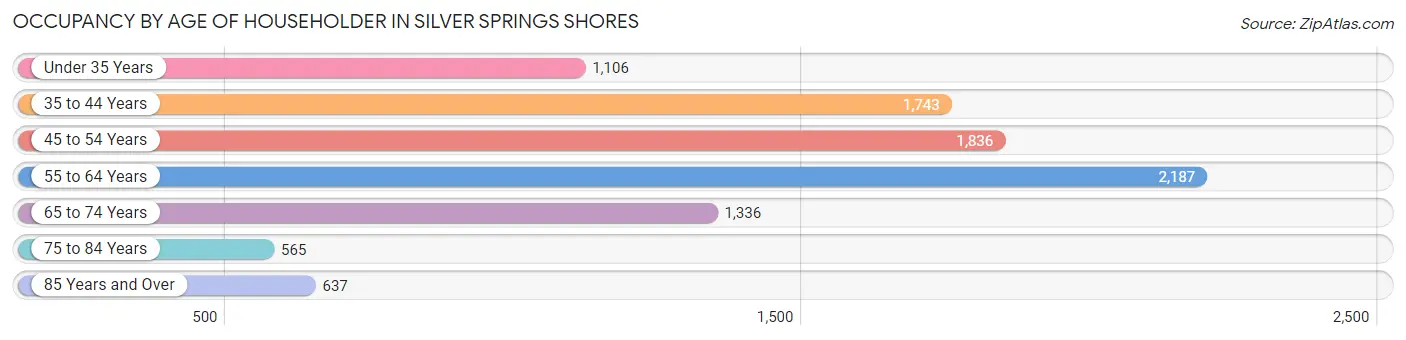
| Age Bracket | # Households | % Households |
| Under 35 Years | 1,106 | 11.7% |
| 35 to 44 Years | 1,743 | 18.5% |
| 45 to 54 Years | 1,836 | 19.5% |
| 55 to 64 Years | 2,187 | 23.2% |
| 65 to 74 Years | 1,336 | 14.2% |
| 75 to 84 Years | 565 | 6.0% |
| 85 Years and Over | 637 | 6.8% |
| Total | 9,410 | 100.0% |
Housing Finances in Silver Springs Shores
Median Income by Occupancy in Silver Springs Shores
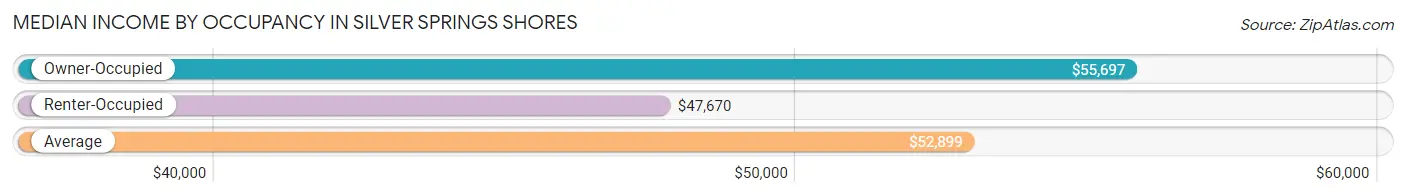
| Occupancy Type | # Households | Median Income |
| Owner-Occupied | 6,969 (74.1%) | $55,697 |
| Renter-Occupied | 2,441 (25.9%) | $47,670 |
| Average | 9,410 (100.0%) | $52,899 |
Occupancy by Householder Income Bracket in Silver Springs Shores
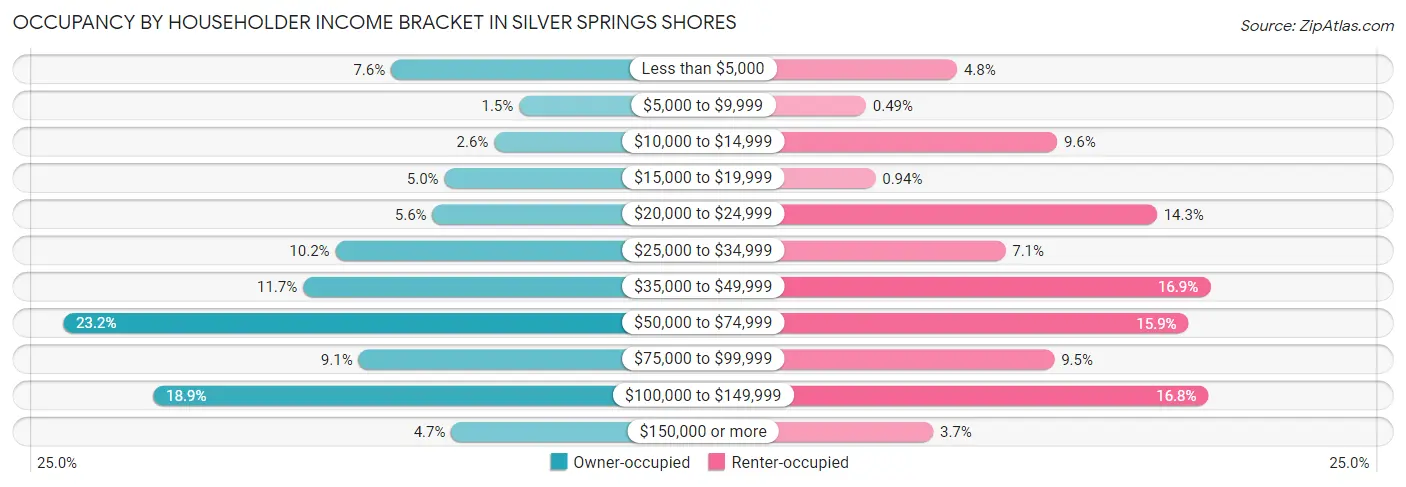
| Income Bracket | Owner-occupied | Renter-occupied |
| Less than $5,000 | 526 (7.5%) | 118 (4.8%) |
| $5,000 to $9,999 | 101 (1.5%) | 12 (0.5%) |
| $10,000 to $14,999 | 184 (2.6%) | 234 (9.6%) |
| $15,000 to $19,999 | 349 (5.0%) | 23 (0.9%) |
| $20,000 to $24,999 | 389 (5.6%) | 350 (14.3%) |
| $25,000 to $34,999 | 711 (10.2%) | 174 (7.1%) |
| $35,000 to $49,999 | 818 (11.7%) | 412 (16.9%) |
| $50,000 to $74,999 | 1,615 (23.2%) | 387 (15.9%) |
| $75,000 to $99,999 | 634 (9.1%) | 231 (9.5%) |
| $100,000 to $149,999 | 1,316 (18.9%) | 410 (16.8%) |
| $150,000 or more | 326 (4.7%) | 90 (3.7%) |
| Total | 6,969 (100.0%) | 2,441 (100.0%) |
Monthly Housing Cost Tiers in Silver Springs Shores
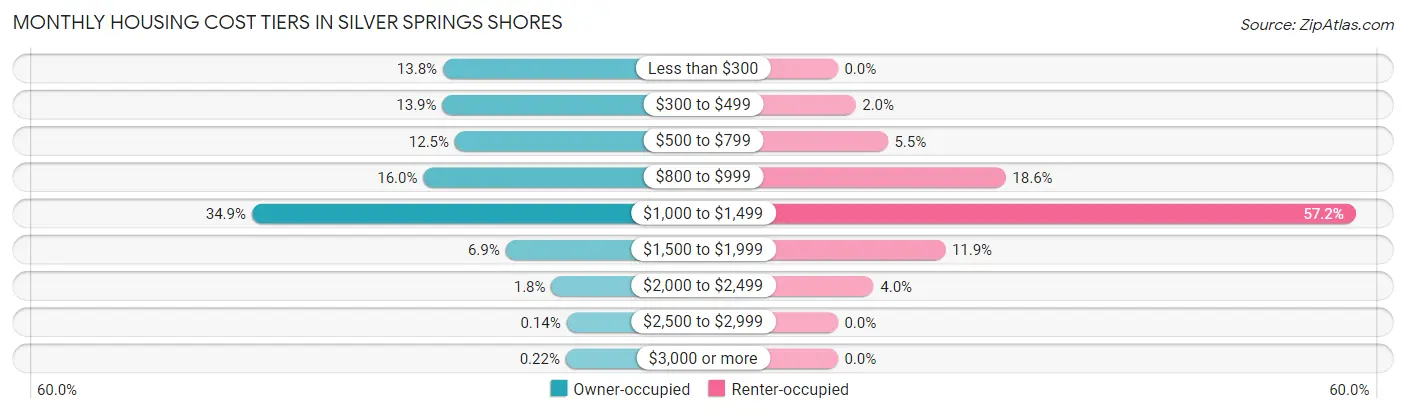
| Monthly Cost | Owner-occupied | Renter-occupied |
| Less than $300 | 961 (13.8%) | 0 (0.0%) |
| $300 to $499 | 965 (13.9%) | 48 (2.0%) |
| $500 to $799 | 869 (12.5%) | 135 (5.5%) |
| $800 to $999 | 1,112 (16.0%) | 453 (18.6%) |
| $1,000 to $1,499 | 2,432 (34.9%) | 1,397 (57.2%) |
| $1,500 to $1,999 | 479 (6.9%) | 290 (11.9%) |
| $2,000 to $2,499 | 126 (1.8%) | 97 (4.0%) |
| $2,500 to $2,999 | 10 (0.1%) | 0 (0.0%) |
| $3,000 or more | 15 (0.2%) | 0 (0.0%) |
| Total | 6,969 (100.0%) | 2,441 (100.0%) |
Physical Housing Characteristics in Silver Springs Shores
Housing Structures in Silver Springs Shores
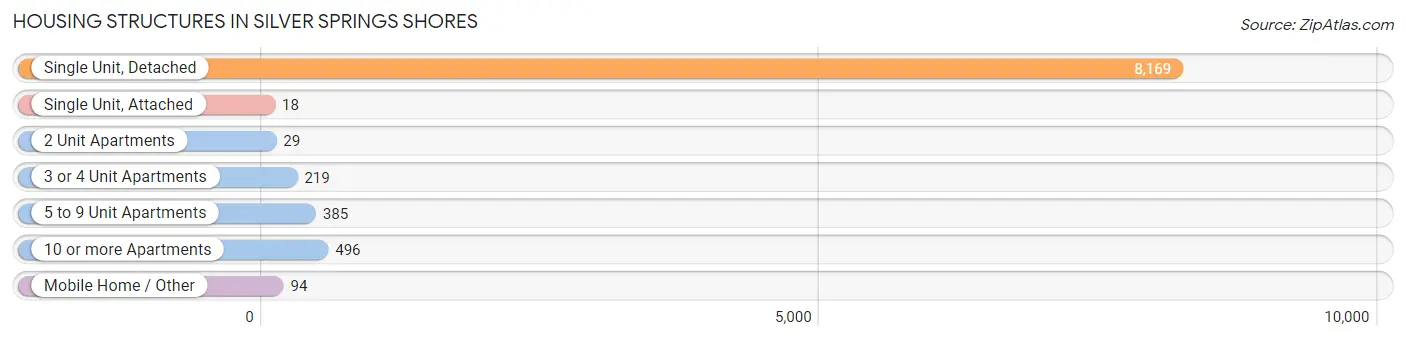
| Structure Type | # Housing Units | % Housing Units |
| Single Unit, Detached | 8,169 | 86.8% |
| Single Unit, Attached | 18 | 0.2% |
| 2 Unit Apartments | 29 | 0.3% |
| 3 or 4 Unit Apartments | 219 | 2.3% |
| 5 to 9 Unit Apartments | 385 | 4.1% |
| 10 or more Apartments | 496 | 5.3% |
| Mobile Home / Other | 94 | 1.0% |
| Total | 9,410 | 100.0% |
Housing Structures by Occupancy in Silver Springs Shores
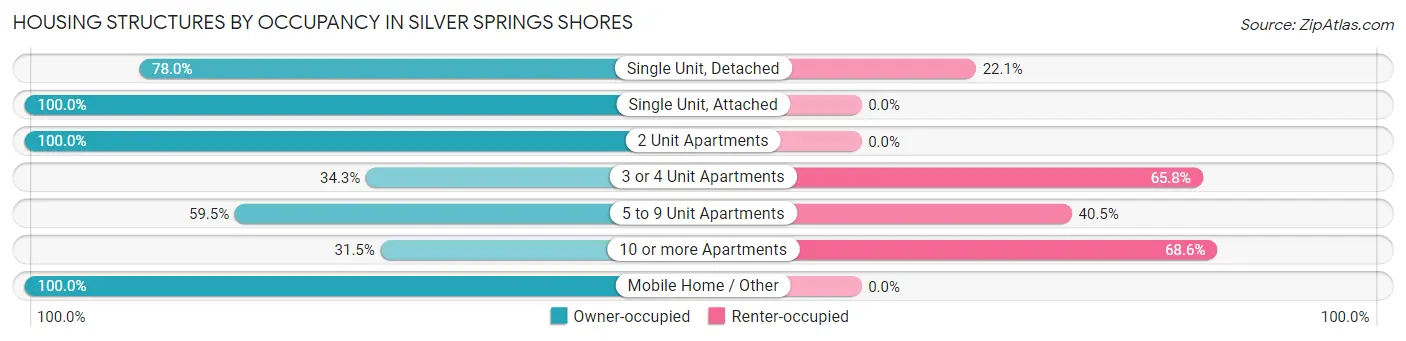
| Structure Type | Owner-occupied | Renter-occupied |
| Single Unit, Detached | 6,368 (77.9%) | 1,801 (22.1%) |
| Single Unit, Attached | 18 (100.0%) | 0 (0.0%) |
| 2 Unit Apartments | 29 (100.0%) | 0 (0.0%) |
| 3 or 4 Unit Apartments | 75 (34.3%) | 144 (65.7%) |
| 5 to 9 Unit Apartments | 229 (59.5%) | 156 (40.5%) |
| 10 or more Apartments | 156 (31.5%) | 340 (68.5%) |
| Mobile Home / Other | 94 (100.0%) | 0 (0.0%) |
| Total | 6,969 (74.1%) | 2,441 (25.9%) |
Housing Structures by Number of Rooms in Silver Springs Shores
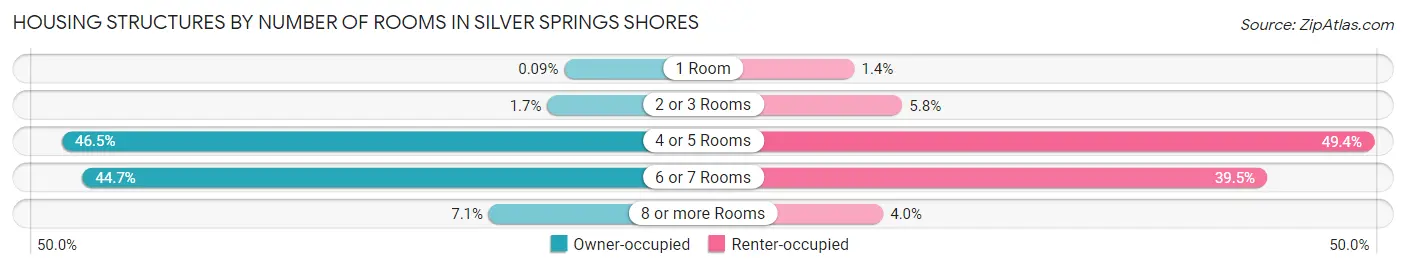
| Number of Rooms | Owner-occupied | Renter-occupied |
| 1 Room | 6 (0.1%) | 33 (1.3%) |
| 2 or 3 Rooms | 116 (1.7%) | 141 (5.8%) |
| 4 or 5 Rooms | 3,243 (46.5%) | 1,205 (49.4%) |
| 6 or 7 Rooms | 3,112 (44.7%) | 964 (39.5%) |
| 8 or more Rooms | 492 (7.1%) | 98 (4.0%) |
| Total | 6,969 (100.0%) | 2,441 (100.0%) |
Housing Structure by Heating Type in Silver Springs Shores
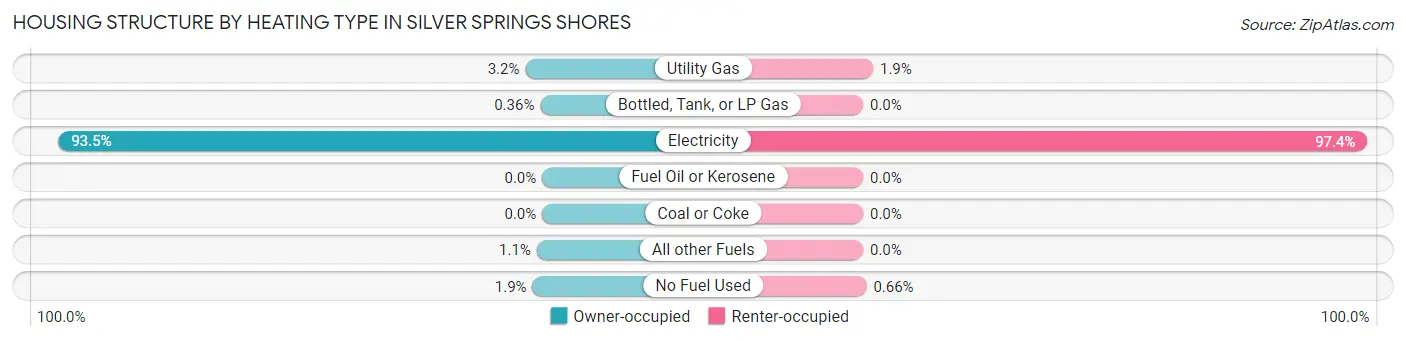
| Heating Type | Owner-occupied | Renter-occupied |
| Utility Gas | 226 (3.2%) | 47 (1.9%) |
| Bottled, Tank, or LP Gas | 25 (0.4%) | 0 (0.0%) |
| Electricity | 6,515 (93.5%) | 2,378 (97.4%) |
| Fuel Oil or Kerosene | 0 (0.0%) | 0 (0.0%) |
| Coal or Coke | 0 (0.0%) | 0 (0.0%) |
| All other Fuels | 73 (1.1%) | 0 (0.0%) |
| No Fuel Used | 130 (1.9%) | 16 (0.7%) |
| Total | 6,969 (100.0%) | 2,441 (100.0%) |
Household Vehicle Usage in Silver Springs Shores
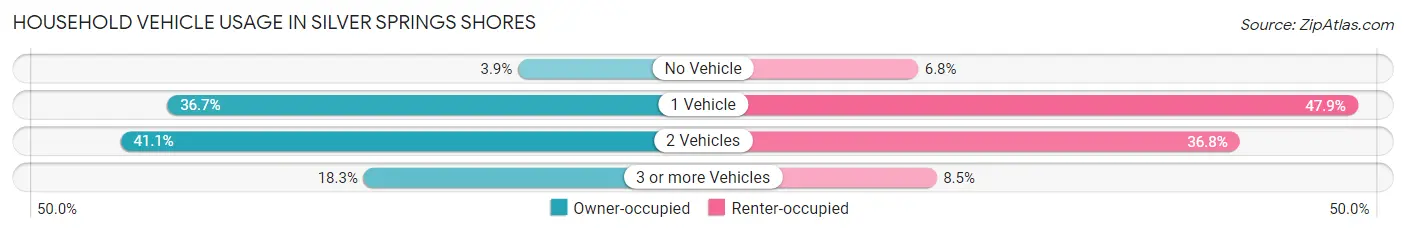
| Vehicles per Household | Owner-occupied | Renter-occupied |
| No Vehicle | 274 (3.9%) | 166 (6.8%) |
| 1 Vehicle | 2,556 (36.7%) | 1,168 (47.8%) |
| 2 Vehicles | 2,861 (41.0%) | 899 (36.8%) |
| 3 or more Vehicles | 1,278 (18.3%) | 208 (8.5%) |
| Total | 6,969 (100.0%) | 2,441 (100.0%) |
Real Estate & Mortgages in Silver Springs Shores
Real Estate and Mortgage Overview in Silver Springs Shores
| Characteristic | Without Mortgage | With Mortgage |
| Housing Units | 2,155 | 4,814 |
| Median Property Value | $137,700 | $172,700 |
| Median Household Income | $32,215 | $258 |
| Monthly Housing Costs | $323 | $15 |
| Real Estate Taxes | $925 | $339 |
Property Value by Mortgage Status in Silver Springs Shores
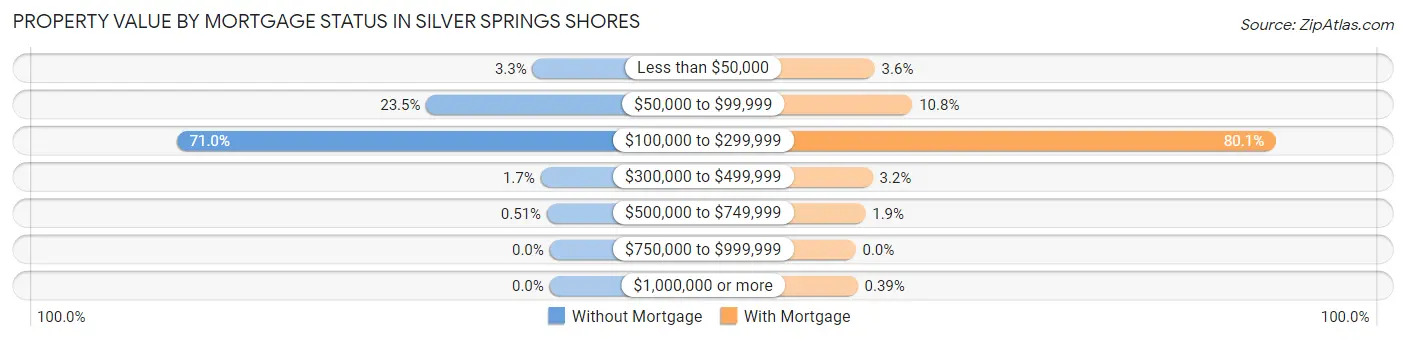
| Property Value | Without Mortgage | With Mortgage |
| Less than $50,000 | 70 (3.3%) | 175 (3.6%) |
| $50,000 to $99,999 | 506 (23.5%) | 520 (10.8%) |
| $100,000 to $299,999 | 1,531 (71.0%) | 3,855 (80.1%) |
| $300,000 to $499,999 | 37 (1.7%) | 156 (3.2%) |
| $500,000 to $749,999 | 11 (0.5%) | 89 (1.8%) |
| $750,000 to $999,999 | 0 (0.0%) | 0 (0.0%) |
| $1,000,000 or more | 0 (0.0%) | 19 (0.4%) |
| Total | 2,155 (100.0%) | 4,814 (100.0%) |
Household Income by Mortgage Status in Silver Springs Shores
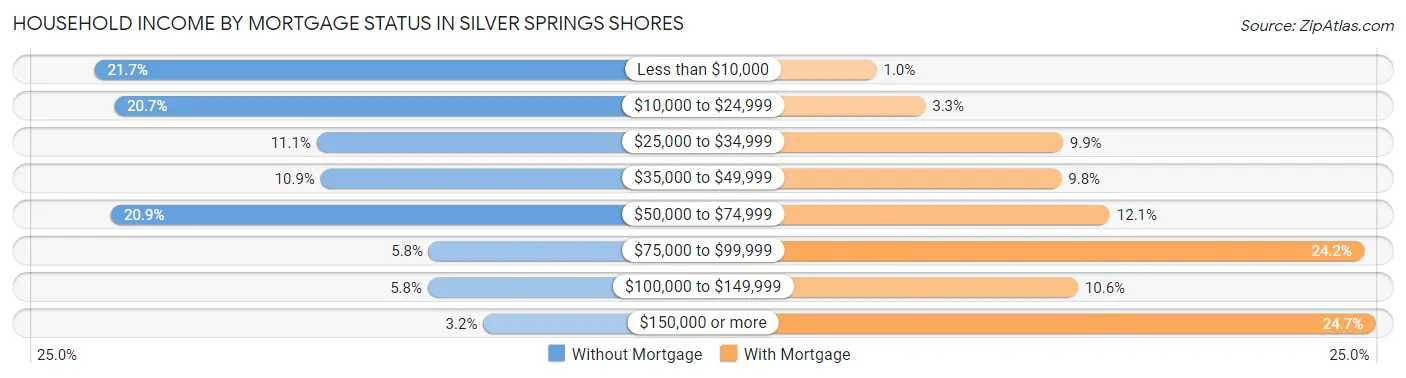
| Household Income | Without Mortgage | With Mortgage |
| Less than $10,000 | 467 (21.7%) | 48 (1.0%) |
| $10,000 to $24,999 | 447 (20.7%) | 160 (3.3%) |
| $25,000 to $34,999 | 239 (11.1%) | 475 (9.9%) |
| $35,000 to $49,999 | 235 (10.9%) | 472 (9.8%) |
| $50,000 to $74,999 | 450 (20.9%) | 583 (12.1%) |
| $75,000 to $99,999 | 124 (5.8%) | 1,165 (24.2%) |
| $100,000 to $149,999 | 125 (5.8%) | 510 (10.6%) |
| $150,000 or more | 68 (3.2%) | 1,191 (24.7%) |
| Total | 2,155 (100.0%) | 4,814 (100.0%) |
Property Value to Household Income Ratio in Silver Springs Shores
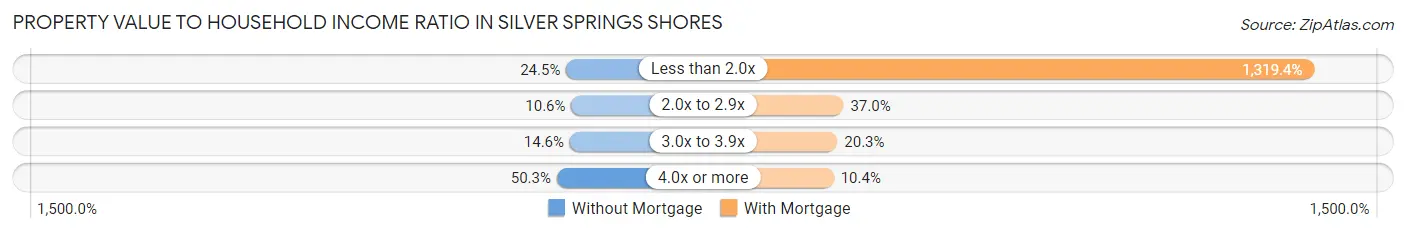
| Value-to-Income Ratio | Without Mortgage | With Mortgage |
| Less than 2.0x | 528 (24.5%) | 63,515 (1,319.4%) |
| 2.0x to 2.9x | 228 (10.6%) | 1,781 (37.0%) |
| 3.0x to 3.9x | 315 (14.6%) | 975 (20.3%) |
| 4.0x or more | 1,084 (50.3%) | 499 (10.4%) |
| Total | 2,155 (100.0%) | 4,814 (100.0%) |
Real Estate Taxes by Mortgage Status in Silver Springs Shores
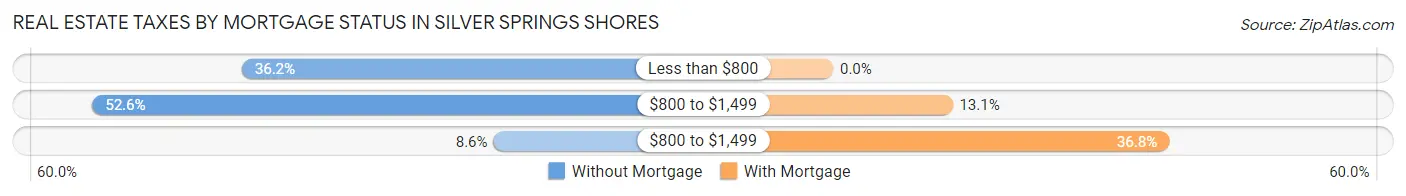
| Property Taxes | Without Mortgage | With Mortgage |
| Less than $800 | 780 (36.2%) | 0 (0.0%) |
| $800 to $1,499 | 1,133 (52.6%) | 630 (13.1%) |
| $800 to $1,499 | 186 (8.6%) | 1,773 (36.8%) |
| Total | 2,155 (100.0%) | 4,814 (100.0%) |
Health & Disability in Silver Springs Shores
Health Insurance Coverage by Age in Silver Springs Shores
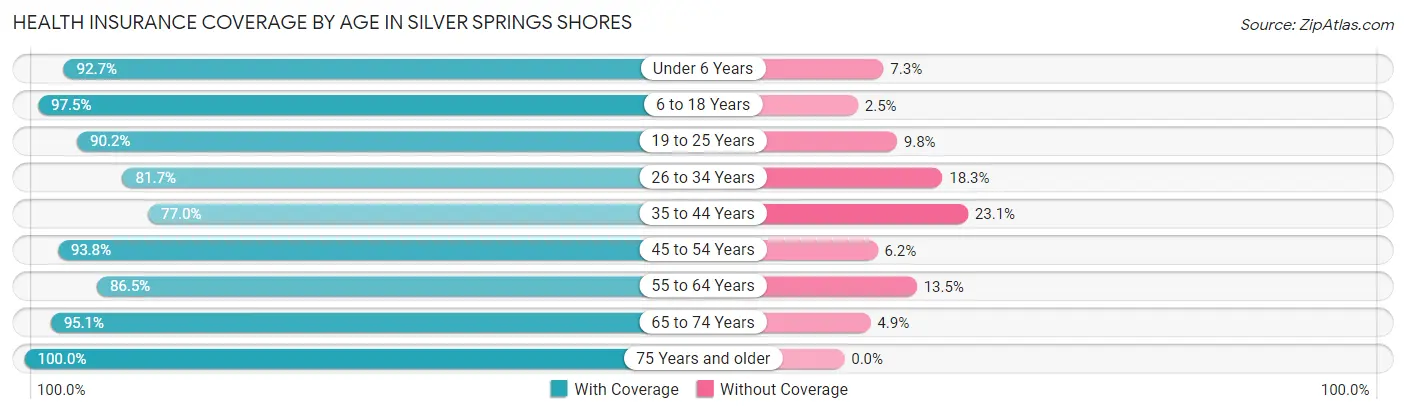
| Age Bracket | With Coverage | Without Coverage |
| Under 6 Years | 1,399 (92.7%) | 110 (7.3%) |
| 6 to 18 Years | 4,658 (97.5%) | 121 (2.5%) |
| 19 to 25 Years | 1,987 (90.2%) | 216 (9.8%) |
| 26 to 34 Years | 2,359 (81.7%) | 528 (18.3%) |
| 35 to 44 Years | 2,785 (76.9%) | 834 (23.1%) |
| 45 to 54 Years | 2,890 (93.8%) | 191 (6.2%) |
| 55 to 64 Years | 2,851 (86.5%) | 445 (13.5%) |
| 65 to 74 Years | 1,973 (95.1%) | 101 (4.9%) |
| 75 Years and older | 1,991 (100.0%) | 0 (0.0%) |
| Total | 22,893 (90.0%) | 2,546 (10.0%) |
Health Insurance Coverage by Citizenship Status in Silver Springs Shores
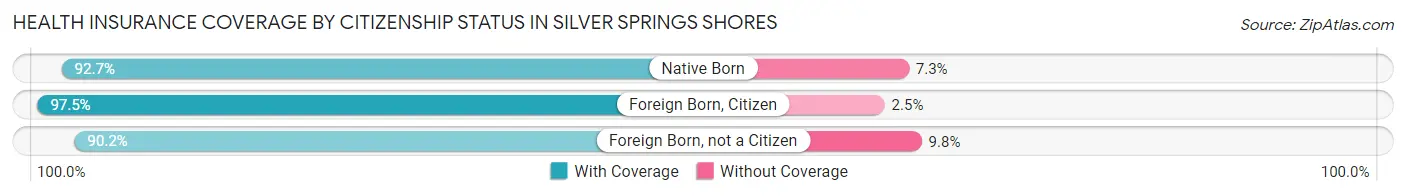
| Citizenship Status | With Coverage | Without Coverage |
| Native Born | 1,399 (92.7%) | 110 (7.3%) |
| Foreign Born, Citizen | 4,658 (97.5%) | 121 (2.5%) |
| Foreign Born, not a Citizen | 1,987 (90.2%) | 216 (9.8%) |
Health Insurance Coverage by Household Income in Silver Springs Shores
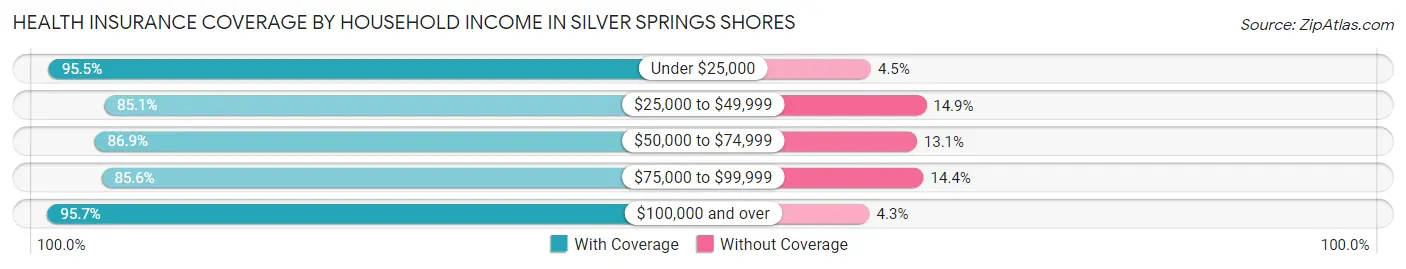
| Household Income | With Coverage | Without Coverage |
| Under $25,000 | 3,428 (95.5%) | 163 (4.5%) |
| $25,000 to $49,999 | 5,037 (85.1%) | 882 (14.9%) |
| $50,000 to $74,999 | 5,678 (86.9%) | 858 (13.1%) |
| $75,000 to $99,999 | 1,992 (85.6%) | 335 (14.4%) |
| $100,000 and over | 6,737 (95.7%) | 301 (4.3%) |
Public vs Private Health Insurance Coverage by Age in Silver Springs Shores
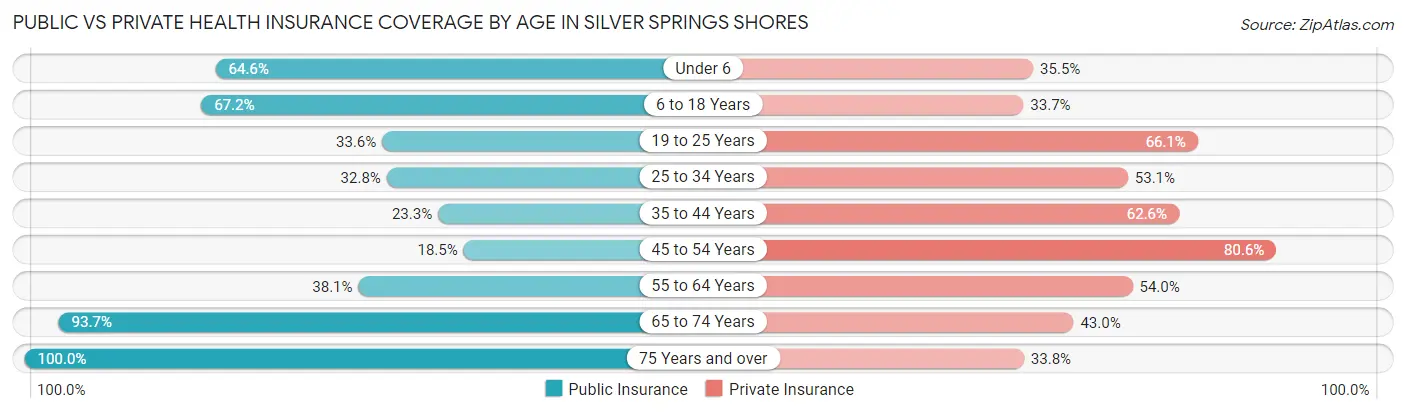
| Age Bracket | Public Insurance | Private Insurance |
| Under 6 | 974 (64.5%) | 536 (35.5%) |
| 6 to 18 Years | 3,212 (67.2%) | 1,611 (33.7%) |
| 19 to 25 Years | 741 (33.6%) | 1,455 (66.0%) |
| 25 to 34 Years | 947 (32.8%) | 1,533 (53.1%) |
| 35 to 44 Years | 842 (23.3%) | 2,264 (62.6%) |
| 45 to 54 Years | 571 (18.5%) | 2,484 (80.6%) |
| 55 to 64 Years | 1,254 (38.1%) | 1,779 (54.0%) |
| 65 to 74 Years | 1,943 (93.7%) | 892 (43.0%) |
| 75 Years and over | 1,991 (100.0%) | 673 (33.8%) |
| Total | 12,475 (49.0%) | 13,227 (52.0%) |
Disability Status by Sex by Age in Silver Springs Shores
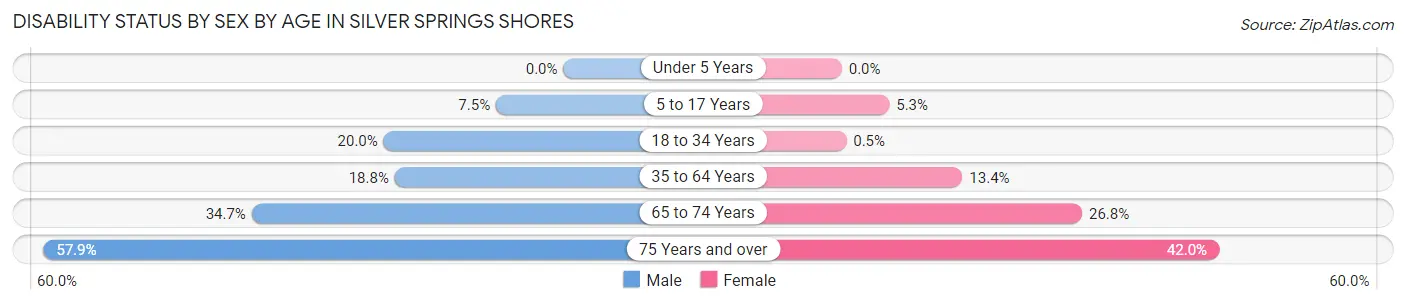
| Age Bracket | Male | Female |
| Under 5 Years | 0 (0.0%) | 0 (0.0%) |
| 5 to 17 Years | 196 (7.5%) | 110 (5.3%) |
| 18 to 34 Years | 523 (20.0%) | 14 (0.5%) |
| 35 to 64 Years | 890 (18.8%) | 706 (13.4%) |
| 65 to 74 Years | 354 (34.7%) | 282 (26.8%) |
| 75 Years and over | 505 (57.9%) | 470 (42.0%) |
Disability Class by Sex by Age in Silver Springs Shores
Disability Class: Hearing Difficulty
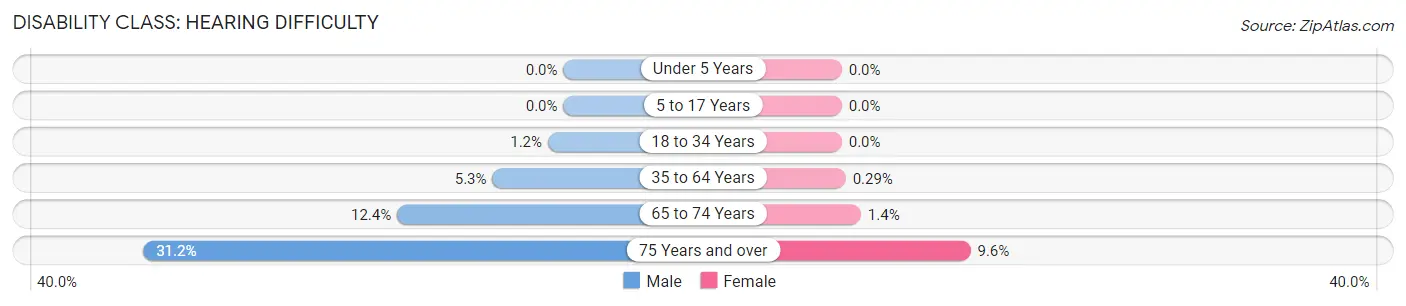
| Age Bracket | Male | Female |
| Under 5 Years | 0 (0.0%) | 0 (0.0%) |
| 5 to 17 Years | 0 (0.0%) | 0 (0.0%) |
| 18 to 34 Years | 30 (1.1%) | 0 (0.0%) |
| 35 to 64 Years | 250 (5.3%) | 15 (0.3%) |
| 65 to 74 Years | 126 (12.3%) | 15 (1.4%) |
| 75 Years and over | 272 (31.2%) | 107 (9.6%) |
Disability Class: Vision Difficulty
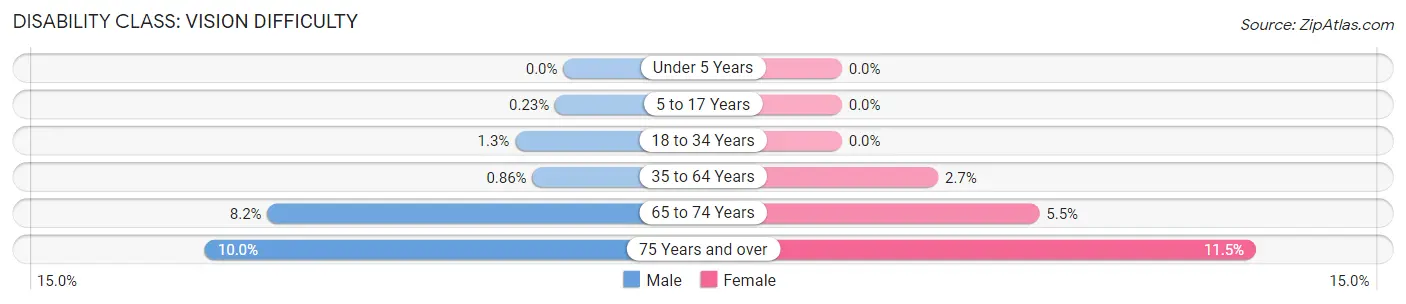
| Age Bracket | Male | Female |
| Under 5 Years | 0 (0.0%) | 0 (0.0%) |
| 5 to 17 Years | 6 (0.2%) | 0 (0.0%) |
| 18 to 34 Years | 35 (1.3%) | 0 (0.0%) |
| 35 to 64 Years | 41 (0.9%) | 141 (2.7%) |
| 65 to 74 Years | 84 (8.2%) | 58 (5.5%) |
| 75 Years and over | 87 (10.0%) | 129 (11.5%) |
Disability Class: Cognitive Difficulty
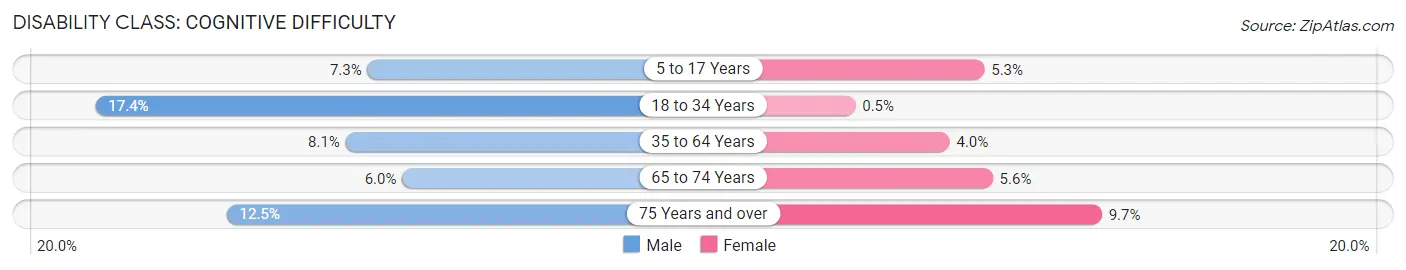
| Age Bracket | Male | Female |
| 5 to 17 Years | 190 (7.3%) | 110 (5.3%) |
| 18 to 34 Years | 454 (17.4%) | 14 (0.5%) |
| 35 to 64 Years | 383 (8.1%) | 210 (4.0%) |
| 65 to 74 Years | 61 (6.0%) | 59 (5.6%) |
| 75 Years and over | 109 (12.5%) | 108 (9.7%) |
Disability Class: Ambulatory Difficulty
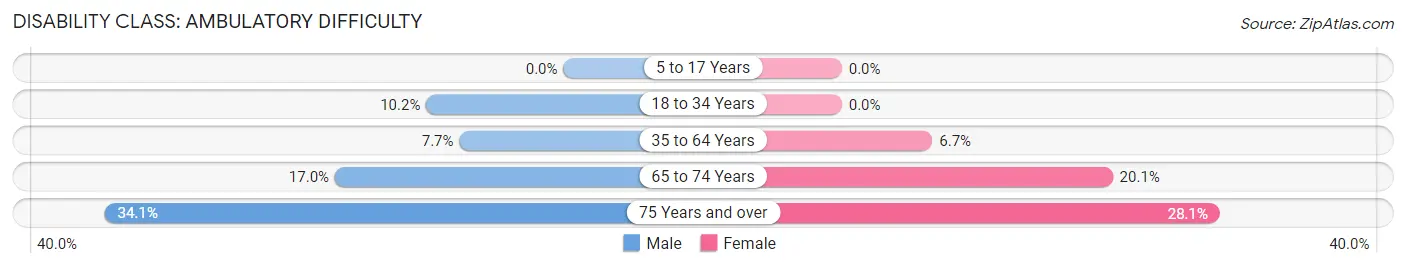
| Age Bracket | Male | Female |
| 5 to 17 Years | 0 (0.0%) | 0 (0.0%) |
| 18 to 34 Years | 266 (10.2%) | 0 (0.0%) |
| 35 to 64 Years | 366 (7.7%) | 353 (6.7%) |
| 65 to 74 Years | 173 (17.0%) | 212 (20.1%) |
| 75 Years and over | 297 (34.1%) | 314 (28.1%) |
Disability Class: Self-Care Difficulty
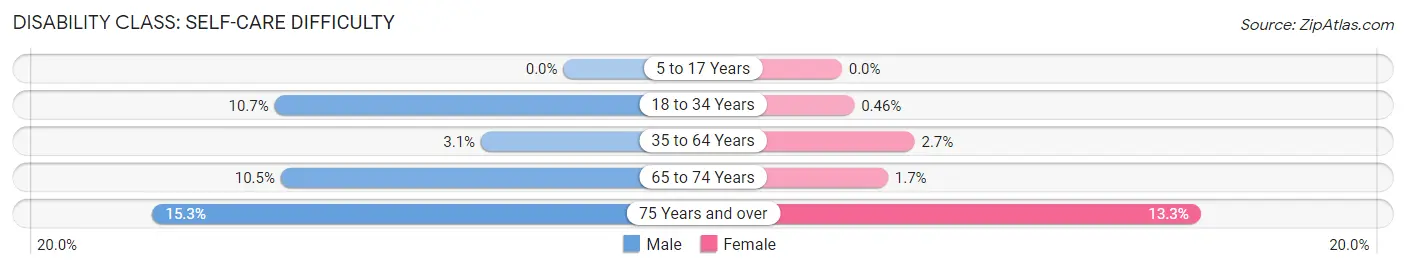
| Age Bracket | Male | Female |
| 5 to 17 Years | 0 (0.0%) | 0 (0.0%) |
| 18 to 34 Years | 280 (10.7%) | 13 (0.5%) |
| 35 to 64 Years | 145 (3.1%) | 142 (2.7%) |
| 65 to 74 Years | 107 (10.5%) | 18 (1.7%) |
| 75 Years and over | 133 (15.2%) | 149 (13.3%) |
Technology Access in Silver Springs Shores
Computing Device Access in Silver Springs Shores
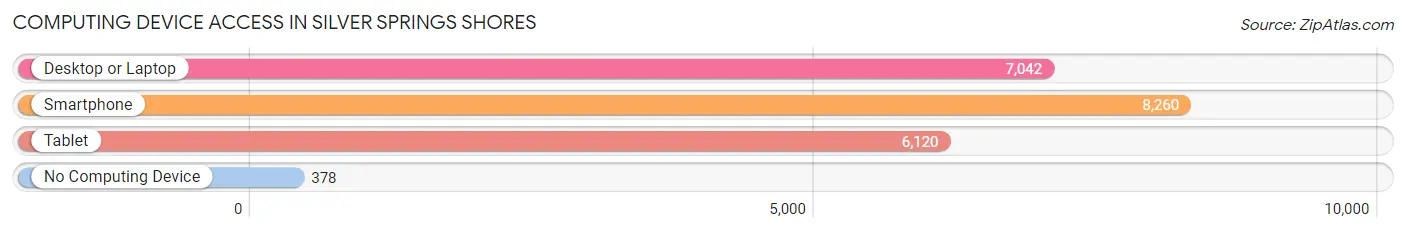
| Device Type | # Households | % Households |
| Desktop or Laptop | 7,042 | 74.8% |
| Smartphone | 8,260 | 87.8% |
| Tablet | 6,120 | 65.0% |
| No Computing Device | 378 | 4.0% |
| Total | 9,410 | 100.0% |
Internet Access in Silver Springs Shores
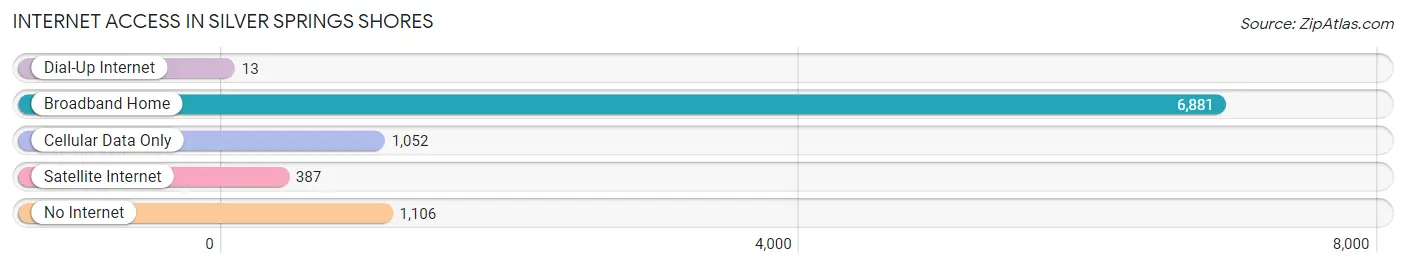
| Internet Type | # Households | % Households |
| Dial-Up Internet | 13 | 0.1% |
| Broadband Home | 6,881 | 73.1% |
| Cellular Data Only | 1,052 | 11.2% |
| Satellite Internet | 387 | 4.1% |
| No Internet | 1,106 | 11.7% |
| Total | 9,410 | 100.0% |
Silver Springs Shores Summary
Introduction
Silver Springs Shores is a census-designated place (CDP) located in Marion County, Florida. It is part of the Ocala Metropolitan Statistical Area. The population was estimated to be 11,845 in 2019. Silver Springs Shores is a relatively new community, having been established in the late 1970s. It is located just south of the city of Ocala and is a popular destination for retirees and families alike.
History
Silver Springs Shores was established in the late 1970s as a planned community. The area was originally part of the Silver Springs State Park, which was established in 1878. The park was home to a variety of wildlife, including the Florida panther, black bear, and alligator. In the early 1900s, the area was developed for agriculture and timber production.
In the late 1970s, the area was developed as a planned community. The community was designed to be a self-contained residential area with its own shopping centers, schools, and recreational facilities. The first homes were built in 1979 and the community has grown steadily since then.
Geography
Silver Springs Shores is located in Marion County, Florida. It is part of the Ocala Metropolitan Statistical Area. The community is located just south of the city of Ocala and is bordered by the Silver River to the east and the Ocklawaha River to the west. The community is located in a flat, low-lying area and is surrounded by pine forests and wetlands.
The climate in Silver Springs Shores is humid subtropical, with hot, humid summers and mild winters. The average temperature in the summer is around 90°F and the average temperature in the winter is around 60°F. The area receives an average of 54 inches of rain per year.
Economy
Silver Springs Shores is a primarily residential community, but there are a few businesses located in the area. The largest employer in the area is the Ocala Regional Medical Center, which employs over 1,000 people. Other major employers include the Ocala International Airport, the Ocala National Forest, and the Silver Springs State Park.
The area is also home to a variety of retail stores, restaurants, and other businesses. The community is served by the Ocala International Airport, which provides air service to the area.
Demographics
As of the 2019 census, the population of Silver Springs Shores was estimated to be 11,845. The population is primarily white (83.3%) and Hispanic (11.2%). The median household income is $45,845 and the median home value is $164,400.
Conclusion
Silver Springs Shores is a census-designated place located in Marion County, Florida. It is part of the Ocala Metropolitan Statistical Area and is a popular destination for retirees and families alike. The area was established in the late 1970s as a planned community and has grown steadily since then. The economy is primarily based on the Ocala Regional Medical Center and other businesses in the area. The population is primarily white and Hispanic and the median household income is $45,845.
Common Questions
What is Per Capita Income in Silver Springs Shores?
Per Capita income in Silver Springs Shores is $27,193.
What is the Median Family Income in Silver Springs Shores?
Median Family Income in Silver Springs Shores is $62,513.
What is the Median Household income in Silver Springs Shores?
Median Household Income in Silver Springs Shores is $52,899.
What is Income or Wage Gap in Silver Springs Shores?
Income or Wage Gap in Silver Springs Shores is 20.0%.
Women in Silver Springs Shores earn 80.0 cents for every dollar earned by a man.
What is Inequality or Gini Index in Silver Springs Shores?
Inequality or Gini Index in Silver Springs Shores is 0.48.
What is the Total Population of Silver Springs Shores?
Total Population of Silver Springs Shores is 25,453.
What is the Total Male Population of Silver Springs Shores?
Total Male Population of Silver Springs Shores is 12,697.
What is the Total Female Population of Silver Springs Shores?
Total Female Population of Silver Springs Shores is 12,756.
What is the Ratio of Males per 100 Females in Silver Springs Shores?
There are 99.54 Males per 100 Females in Silver Springs Shores.
What is the Ratio of Females per 100 Males in Silver Springs Shores?
There are 100.46 Females per 100 Males in Silver Springs Shores.
What is the Median Population Age in Silver Springs Shores?
Median Population Age in Silver Springs Shores is 39.3 Years.
What is the Average Family Size in Silver Springs Shores
Average Family Size in Silver Springs Shores is 3.3 People.
What is the Average Household Size in Silver Springs Shores
Average Household Size in Silver Springs Shores is 2.7 People.
How Large is the Labor Force in Silver Springs Shores?
There are 11,090 People in the Labor Forcein in Silver Springs Shores.
What is the Percentage of People in the Labor Force in Silver Springs Shores?
54.5% of People are in the Labor Force in Silver Springs Shores.
What is the Unemployment Rate in Silver Springs Shores?
Unemployment Rate in Silver Springs Shores is 3.9%.