Elizabethtown, KY Map & Demographics
Elizabethtown Map
Elizabethtown Overview
$34,216
PER CAPITA INCOME
$73,527
AVG FAMILY INCOME
$54,493
AVG HOUSEHOLD INCOME
22.8%
WAGE / INCOME GAP [ % ]
77.2¢/ $1
WAGE / INCOME GAP [ $ ]
0.47
INEQUALITY / GINI INDEX
31,425
TOTAL POPULATION
14,867
MALE POPULATION
16,558
FEMALE POPULATION
89.79
MALES / 100 FEMALES
111.37
FEMALES / 100 MALES
37.4
MEDIAN AGE
2.9
AVG FAMILY SIZE
2.2
AVG HOUSEHOLD SIZE
15,281
LABOR FORCE [ PEOPLE ]
61.7%
PERCENT IN LABOR FORCE
5.8%
UNEMPLOYMENT RATE
Elizabethtown Zip Codes
Elizabethtown Area Codes
Income in Elizabethtown
Income Overview in Elizabethtown
Per Capita Income in Elizabethtown is $34,216, while median incomes of families and households are $73,527 and $54,493 respectively.
| Characteristic | Number | Measure |
| Per Capita Income | 31,425 | $34,216 |
| Median Family Income | 7,634 | $73,527 |
| Mean Family Income | 7,634 | $100,725 |
| Median Household Income | 13,463 | $54,493 |
| Mean Household Income | 13,463 | $78,624 |
| Income Deficit | 7,634 | $0 |
| Wage / Income Gap (%) | 31,425 | 22.84% |
| Wage / Income Gap ($) | 31,425 | 77.16¢ per $1 |
| Gini / Inequality Index | 31,425 | 0.47 |
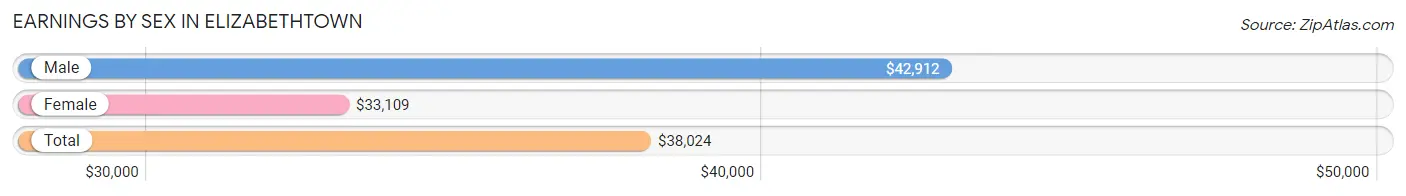
Earnings by Sex in Elizabethtown
Average Earnings in Elizabethtown are $38,024, $42,912 for men and $33,109 for women, a difference of 22.8%.
| Sex | Number | Average Earnings |
| Male | 7,751 (49.2%) | $42,912 |
| Female | 7,998 (50.8%) | $33,109 |
| Total | 15,749 (100.0%) | $38,024 |
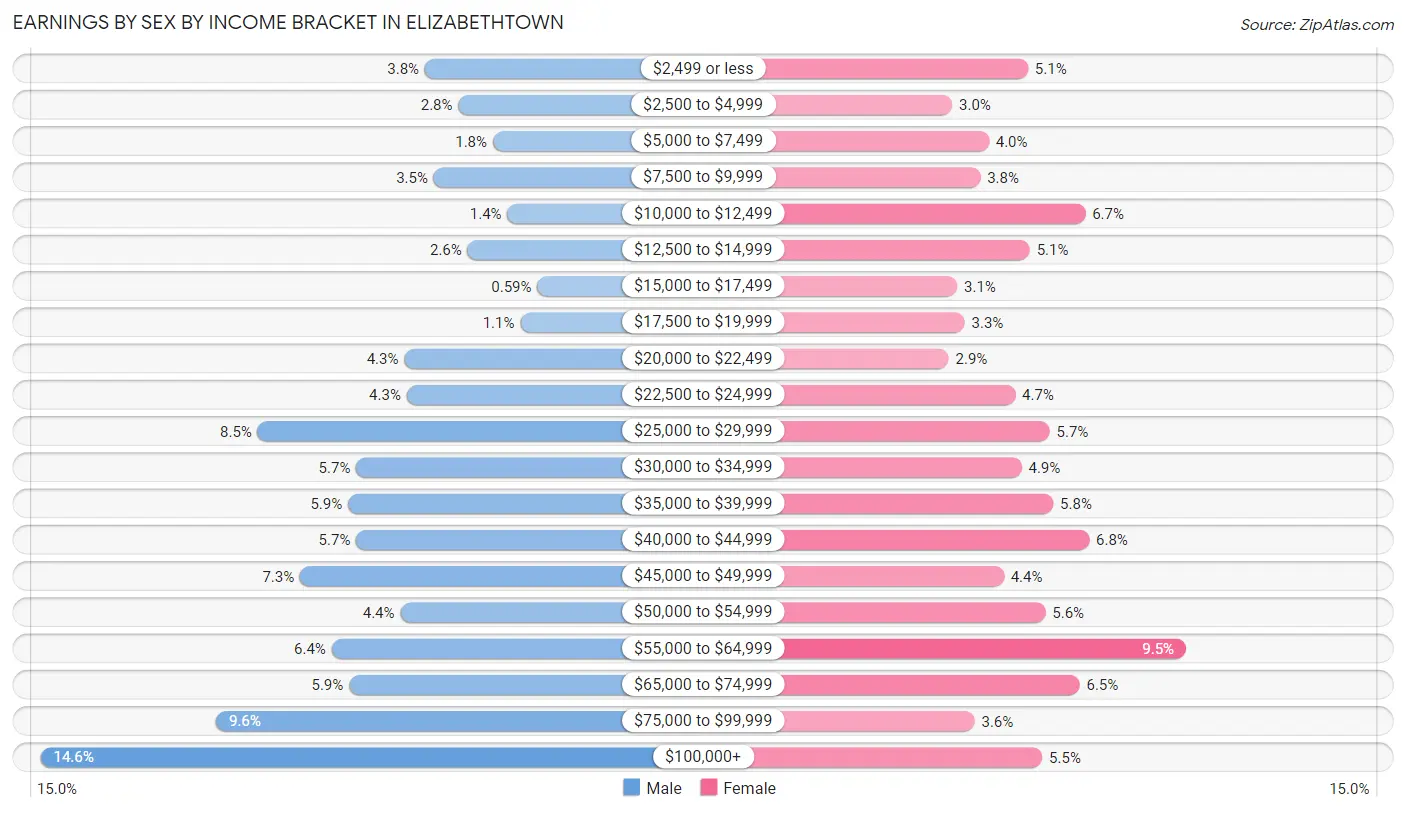
Earnings by Sex by Income Bracket in Elizabethtown
The most common earnings brackets in Elizabethtown are $100,000+ for men (1,128 | 14.5%) and $55,000 to $64,999 for women (762 | 9.5%).
| Income | Male | Female |
| $2,499 or less | 291 (3.7%) | 407 (5.1%) |
| $2,500 to $4,999 | 218 (2.8%) | 237 (3.0%) |
| $5,000 to $7,499 | 143 (1.8%) | 319 (4.0%) |
| $7,500 to $9,999 | 271 (3.5%) | 300 (3.7%) |
| $10,000 to $12,499 | 111 (1.4%) | 536 (6.7%) |
| $12,500 to $14,999 | 198 (2.5%) | 411 (5.1%) |
| $15,000 to $17,499 | 46 (0.6%) | 248 (3.1%) |
| $17,500 to $19,999 | 83 (1.1%) | 265 (3.3%) |
| $20,000 to $22,499 | 336 (4.3%) | 229 (2.9%) |
| $22,500 to $24,999 | 330 (4.3%) | 378 (4.7%) |
| $25,000 to $29,999 | 655 (8.5%) | 456 (5.7%) |
| $30,000 to $34,999 | 440 (5.7%) | 393 (4.9%) |
| $35,000 to $39,999 | 458 (5.9%) | 464 (5.8%) |
| $40,000 to $44,999 | 440 (5.7%) | 545 (6.8%) |
| $45,000 to $49,999 | 563 (7.3%) | 353 (4.4%) |
| $50,000 to $54,999 | 344 (4.4%) | 446 (5.6%) |
| $55,000 to $64,999 | 494 (6.4%) | 762 (9.5%) |
| $65,000 to $74,999 | 456 (5.9%) | 523 (6.5%) |
| $75,000 to $99,999 | 746 (9.6%) | 287 (3.6%) |
| $100,000+ | 1,128 (14.5%) | 439 (5.5%) |
| Total | 7,751 (100.0%) | 7,998 (100.0%) |
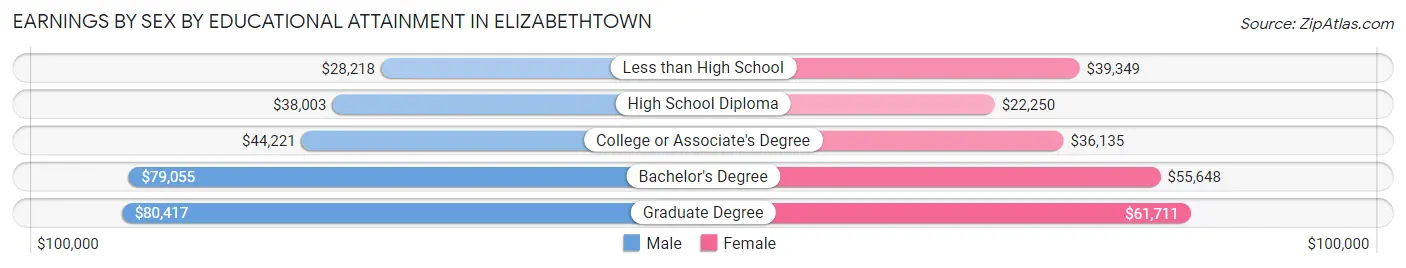
Earnings by Sex by Educational Attainment in Elizabethtown
Average earnings in Elizabethtown are $46,941 for men and $39,339 for women, a difference of 16.2%. Men with an educational attainment of graduate degree enjoy the highest average annual earnings of $80,417, while those with less than high school education earn the least with $28,218. Women with an educational attainment of graduate degree earn the most with the average annual earnings of $61,711, while those with high school diploma education have the smallest earnings of $22,250.
| Educational Attainment | Male Income | Female Income |
| Less than High School | $28,218 | $39,349 |
| High School Diploma | $38,003 | $22,250 |
| College or Associate's Degree | $44,221 | $36,135 |
| Bachelor's Degree | $79,055 | $55,648 |
| Graduate Degree | $80,417 | $61,711 |
| Total | $46,941 | $39,339 |
Family Income in Elizabethtown
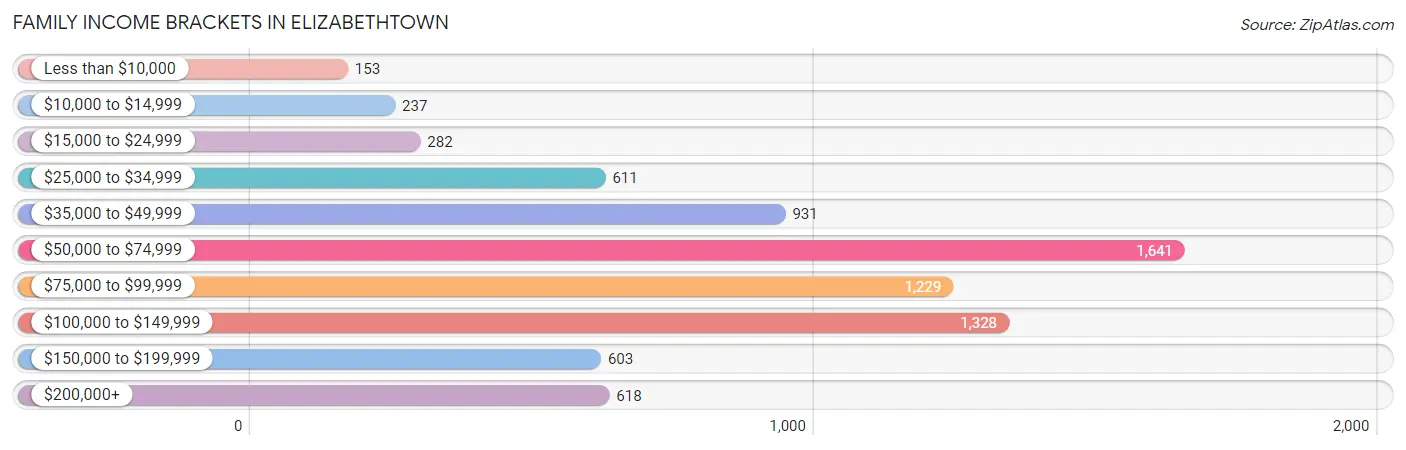
Family Income Brackets in Elizabethtown
According to the Elizabethtown family income data, there are 1,641 families falling into the $50,000 to $74,999 income range, which is the most common income bracket and makes up 21.5% of all families. Conversely, the less than $10,000 income bracket is the least frequent group with only 153 families (2.0%) belonging to this category.
| Income Bracket | # Families | % Families |
| Less than $10,000 | 153 | 2.0% |
| $10,000 to $14,999 | 237 | 3.1% |
| $15,000 to $24,999 | 282 | 3.7% |
| $25,000 to $34,999 | 611 | 8.0% |
| $35,000 to $49,999 | 931 | 12.2% |
| $50,000 to $74,999 | 1,641 | 21.5% |
| $75,000 to $99,999 | 1,229 | 16.1% |
| $100,000 to $149,999 | 1,328 | 17.4% |
| $150,000 to $199,999 | 603 | 7.9% |
| $200,000+ | 618 | 8.1% |
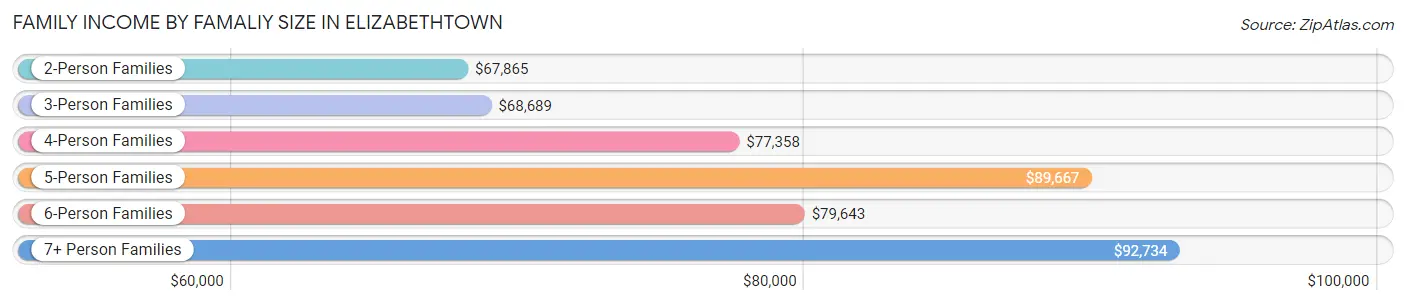
Family Income by Famaliy Size in Elizabethtown
7+ person families (77 | 1.0%) account for the highest median family income in Elizabethtown with $92,734 per family, while 2-person families (4,013 | 52.6%) have the highest median income of $33,932 per family member.
| Income Bracket | # Families | Median Income |
| 2-Person Families | 4,013 (52.6%) | $67,865 |
| 3-Person Families | 1,776 (23.3%) | $68,689 |
| 4-Person Families | 747 (9.8%) | $77,358 |
| 5-Person Families | 703 (9.2%) | $89,667 |
| 6-Person Families | 318 (4.2%) | $79,643 |
| 7+ Person Families | 77 (1.0%) | $92,734 |
| Total | 7,634 (100.0%) | $73,527 |
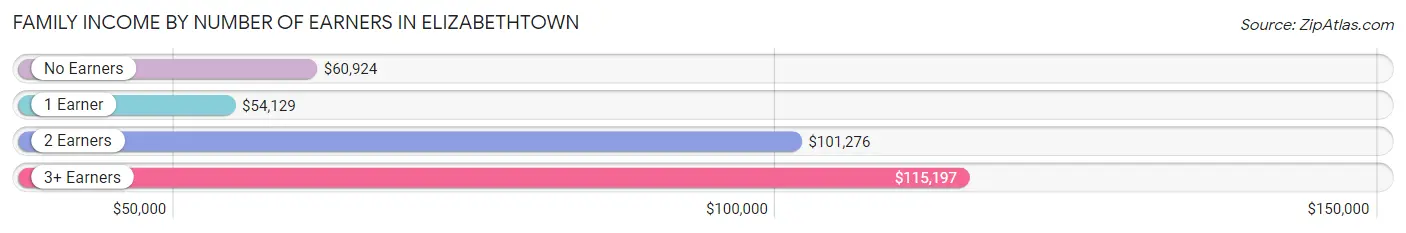
Family Income by Number of Earners in Elizabethtown
The median family income in Elizabethtown is $73,527, with families comprising 3+ earners (647) having the highest median family income of $115,197, while families with 1 earner (3,068) have the lowest median family income of $54,129, accounting for 8.5% and 40.2% of families, respectively.
| Number of Earners | # Families | Median Income |
| No Earners | 1,200 (15.7%) | $60,924 |
| 1 Earner | 3,068 (40.2%) | $54,129 |
| 2 Earners | 2,719 (35.6%) | $101,276 |
| 3+ Earners | 647 (8.5%) | $115,197 |
| Total | 7,634 (100.0%) | $73,527 |
Household Income in Elizabethtown
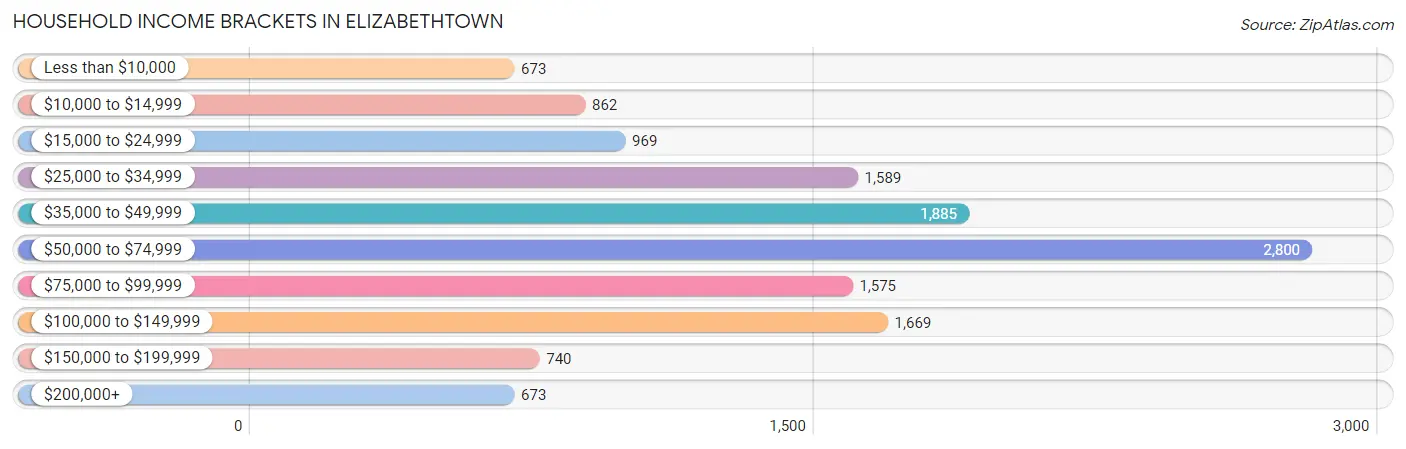
Household Income Brackets in Elizabethtown
With 2,800 households falling in the category, the $50,000 to $74,999 income range is the most frequent in Elizabethtown, accounting for 20.8% of all households. In contrast, only 673 households (5.0%) fall into the less than $10,000 income bracket, making it the least populous group.
| Income Bracket | # Households | % Households |
| Less than $10,000 | 673 | 5.0% |
| $10,000 to $14,999 | 862 | 6.4% |
| $15,000 to $24,999 | 969 | 7.2% |
| $25,000 to $34,999 | 1,589 | 11.8% |
| $35,000 to $49,999 | 1,885 | 14.0% |
| $50,000 to $74,999 | 2,800 | 20.8% |
| $75,000 to $99,999 | 1,575 | 11.7% |
| $100,000 to $149,999 | 1,669 | 12.4% |
| $150,000 to $199,999 | 740 | 5.5% |
| $200,000+ | 673 | 5.0% |
Household Income by Householder Age in Elizabethtown
The median household income in Elizabethtown is $54,493, with the highest median household income of $63,764 found in the 45 to 64 years age bracket for the primary householder. A total of 4,570 households (33.9%) fall into this category. Meanwhile, the 15 to 24 years age bracket for the primary householder has the lowest median household income of $33,692, with 658 households (4.9%) in this group.
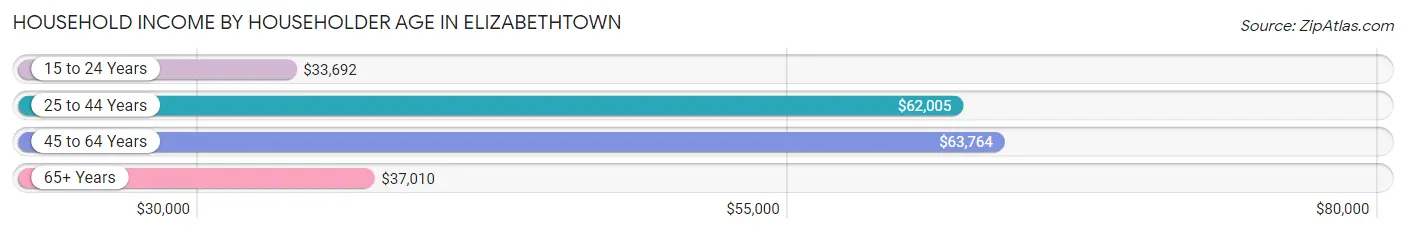
| Income Bracket | # Households | Median Income |
| 15 to 24 Years | 658 (4.9%) | $33,692 |
| 25 to 44 Years | 4,987 (37.0%) | $62,005 |
| 45 to 64 Years | 4,570 (33.9%) | $63,764 |
| 65+ Years | 3,248 (24.1%) | $37,010 |
| Total | 13,463 (100.0%) | $54,493 |
Poverty in Elizabethtown
Income Below Poverty by Sex and Age in Elizabethtown
With 11.0% poverty level for males and 16.9% for females among the residents of Elizabethtown, 5 year old males and 15 year old females are the most vulnerable to poverty, with 19 males (33.3%) and 130 females (52.6%) in their respective age groups living below the poverty level.
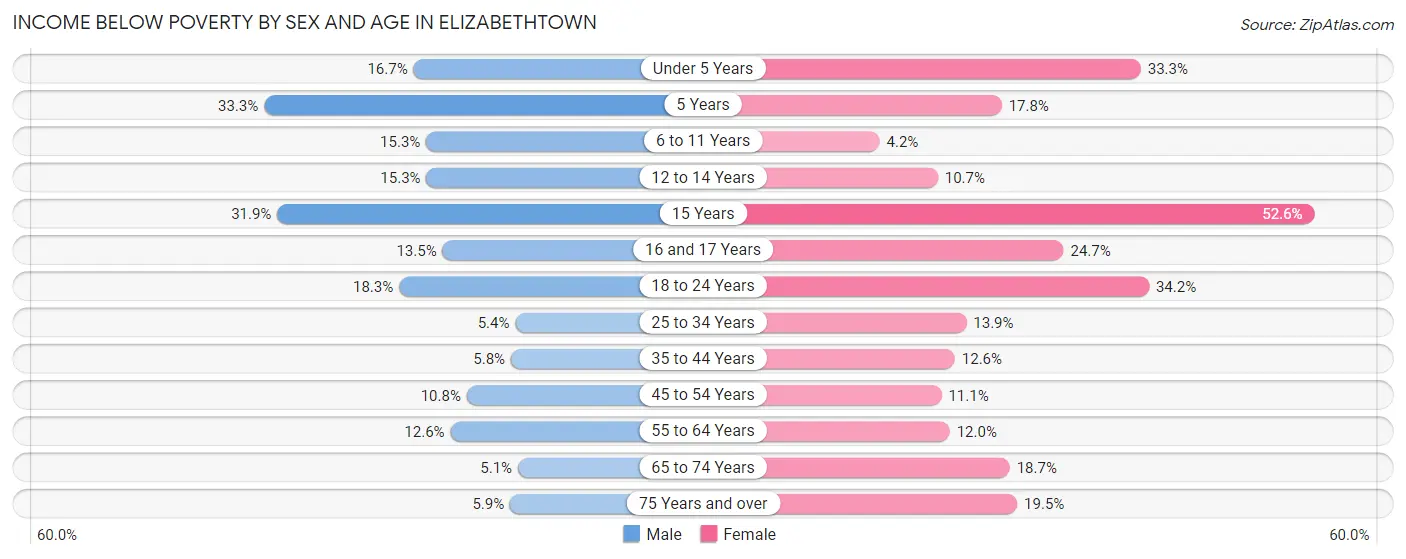
| Age Bracket | Male | Female |
| Under 5 Years | 145 (16.7%) | 324 (33.3%) |
| 5 Years | 19 (33.3%) | 44 (17.8%) |
| 6 to 11 Years | 223 (15.3%) | 51 (4.2%) |
| 12 to 14 Years | 117 (15.2%) | 68 (10.7%) |
| 15 Years | 29 (31.9%) | 130 (52.6%) |
| 16 and 17 Years | 51 (13.5%) | 83 (24.7%) |
| 18 to 24 Years | 247 (18.3%) | 440 (34.2%) |
| 25 to 34 Years | 95 (5.3%) | 333 (13.9%) |
| 35 to 44 Years | 129 (5.8%) | 306 (12.6%) |
| 45 to 54 Years | 189 (10.8%) | 185 (11.1%) |
| 55 to 64 Years | 226 (12.6%) | 240 (12.0%) |
| 65 to 74 Years | 47 (5.1%) | 221 (18.7%) |
| 75 Years and over | 46 (5.9%) | 302 (19.5%) |
| Total | 1,563 (11.0%) | 2,727 (16.9%) |
Income Above Poverty by Sex and Age in Elizabethtown
According to the poverty statistics in Elizabethtown, males aged 65 to 74 years and females aged 6 to 11 years are the age groups that are most secure financially, with 94.9% of males and 95.8% of females in these age groups living above the poverty line.
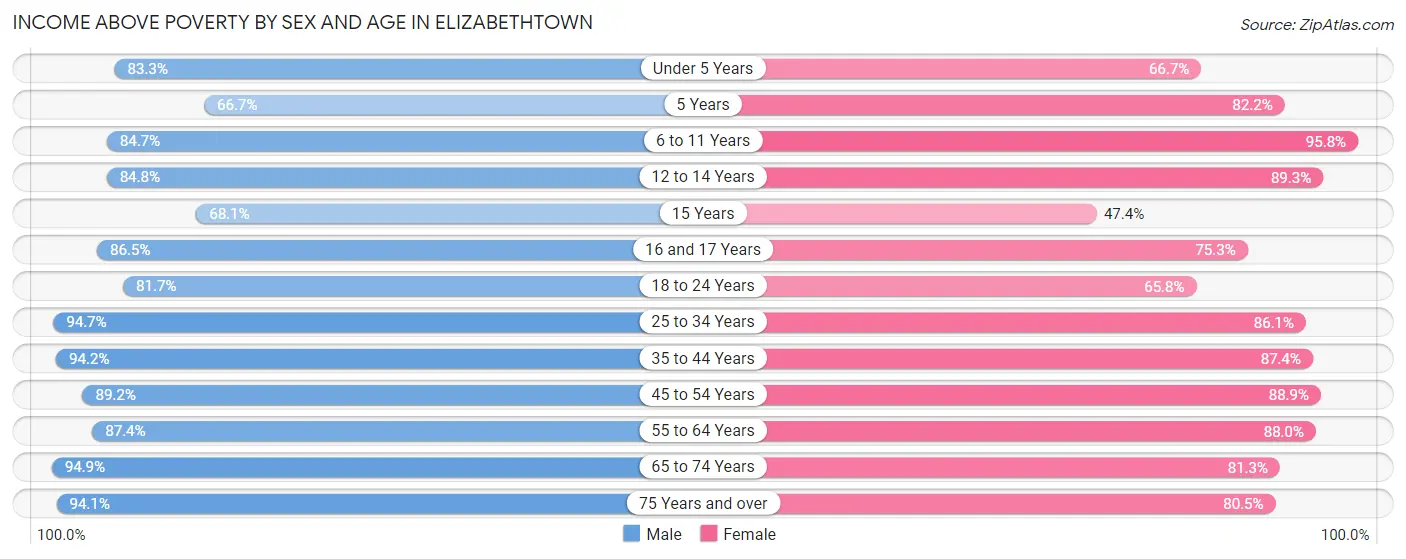
| Age Bracket | Male | Female |
| Under 5 Years | 724 (83.3%) | 649 (66.7%) |
| 5 Years | 38 (66.7%) | 203 (82.2%) |
| 6 to 11 Years | 1,236 (84.7%) | 1,161 (95.8%) |
| 12 to 14 Years | 650 (84.8%) | 568 (89.3%) |
| 15 Years | 62 (68.1%) | 117 (47.4%) |
| 16 and 17 Years | 328 (86.5%) | 253 (75.3%) |
| 18 to 24 Years | 1,103 (81.7%) | 846 (65.8%) |
| 25 to 34 Years | 1,681 (94.7%) | 2,068 (86.1%) |
| 35 to 44 Years | 2,081 (94.2%) | 2,125 (87.4%) |
| 45 to 54 Years | 1,567 (89.2%) | 1,482 (88.9%) |
| 55 to 64 Years | 1,571 (87.4%) | 1,756 (88.0%) |
| 65 to 74 Years | 882 (94.9%) | 961 (81.3%) |
| 75 Years and over | 729 (94.1%) | 1,244 (80.5%) |
| Total | 12,652 (89.0%) | 13,433 (83.1%) |
Income Below Poverty Among Married-Couple Families in Elizabethtown
The poverty statistics for married-couple families in Elizabethtown show that 4.0% or 201 of the total 5,027 families live below the poverty line. Families with 1 or 2 children have the highest poverty rate of 7.2%, comprising of 108 families. On the other hand, families with 5 or more children have the lowest poverty rate of 0.0%, which includes 0 families.
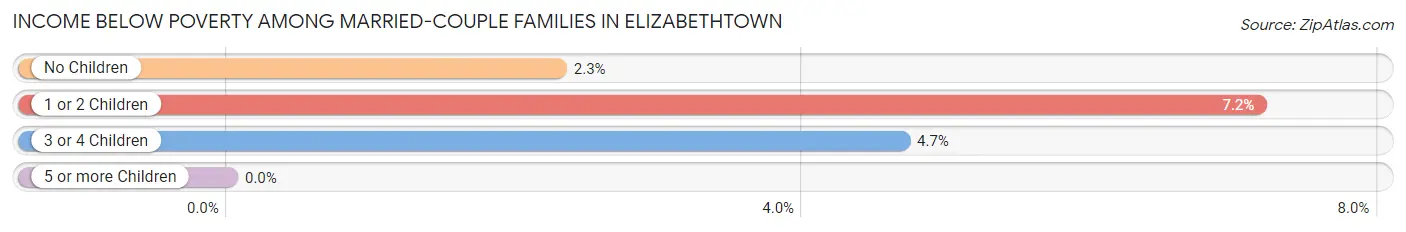
| Children | Above Poverty | Below Poverty |
| No Children | 2,864 (97.7%) | 67 (2.3%) |
| 1 or 2 Children | 1,401 (92.8%) | 108 (7.2%) |
| 3 or 4 Children | 530 (95.3%) | 26 (4.7%) |
| 5 or more Children | 31 (100.0%) | 0 (0.0%) |
| Total | 4,826 (96.0%) | 201 (4.0%) |
Income Below Poverty Among Single-Parent Households in Elizabethtown
According to the poverty data in Elizabethtown, 3.3% or 23 single-father households and 23.3% or 447 single-mother households are living below the poverty line. Among single-father households, those with 1 or 2 children have the highest poverty rate, with 23 households (6.0%) experiencing poverty. Likewise, among single-mother households, those with 5 or more children have the highest poverty rate, with 50 households (100.0%) falling below the poverty line.
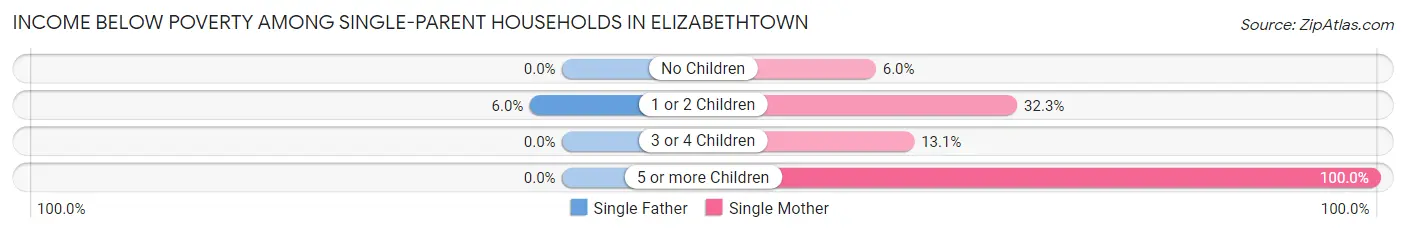
| Children | Single Father | Single Mother |
| No Children | 0 (0.0%) | 35 (6.0%) |
| 1 or 2 Children | 23 (6.0%) | 326 (32.3%) |
| 3 or 4 Children | 0 (0.0%) | 36 (13.1%) |
| 5 or more Children | 0 (0.0%) | 50 (100.0%) |
| Total | 23 (3.3%) | 447 (23.3%) |
Income Below Poverty Among Married-Couple vs Single-Parent Households in Elizabethtown
The poverty data for Elizabethtown shows that 201 of the married-couple family households (4.0%) and 470 of the single-parent households (18.0%) are living below the poverty level. Within the married-couple family households, those with 1 or 2 children have the highest poverty rate, with 108 households (7.2%) falling below the poverty line. Among the single-parent households, those with 5 or more children have the highest poverty rate, with 50 household (100.0%) living below poverty.
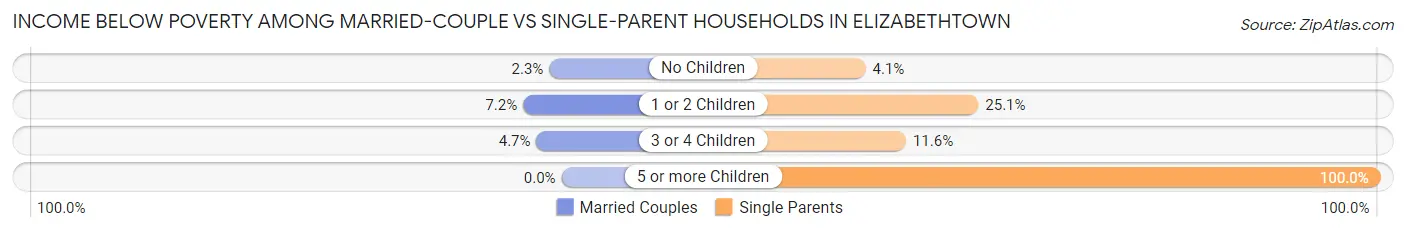
| Children | Married-Couple Families | Single-Parent Households |
| No Children | 67 (2.3%) | 35 (4.1%) |
| 1 or 2 Children | 108 (7.2%) | 349 (25.1%) |
| 3 or 4 Children | 26 (4.7%) | 36 (11.6%) |
| 5 or more Children | 0 (0.0%) | 50 (100.0%) |
| Total | 201 (4.0%) | 470 (18.0%) |
Race in Elizabethtown
The most populous races in Elizabethtown are White / Caucasian (24,404 | 77.7%), Black / African American (3,505 | 11.2%), and Two or more Races (2,016 | 6.4%).
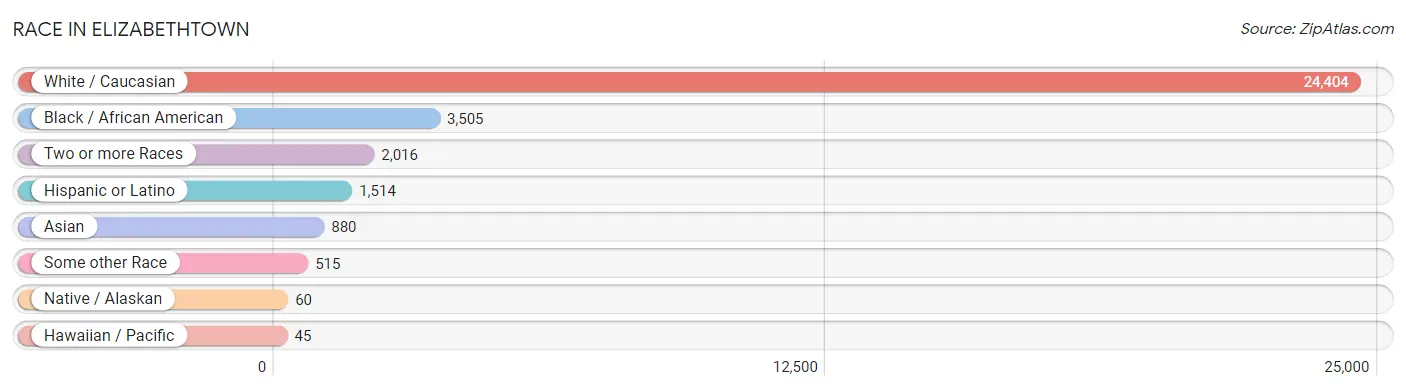
| Race | # Population | % Population |
| Asian | 880 | 2.8% |
| Black / African American | 3,505 | 11.2% |
| Hawaiian / Pacific | 45 | 0.1% |
| Hispanic or Latino | 1,514 | 4.8% |
| Native / Alaskan | 60 | 0.2% |
| White / Caucasian | 24,404 | 77.7% |
| Two or more Races | 2,016 | 6.4% |
| Some other Race | 515 | 1.6% |
| Total | 31,425 | 100.0% |
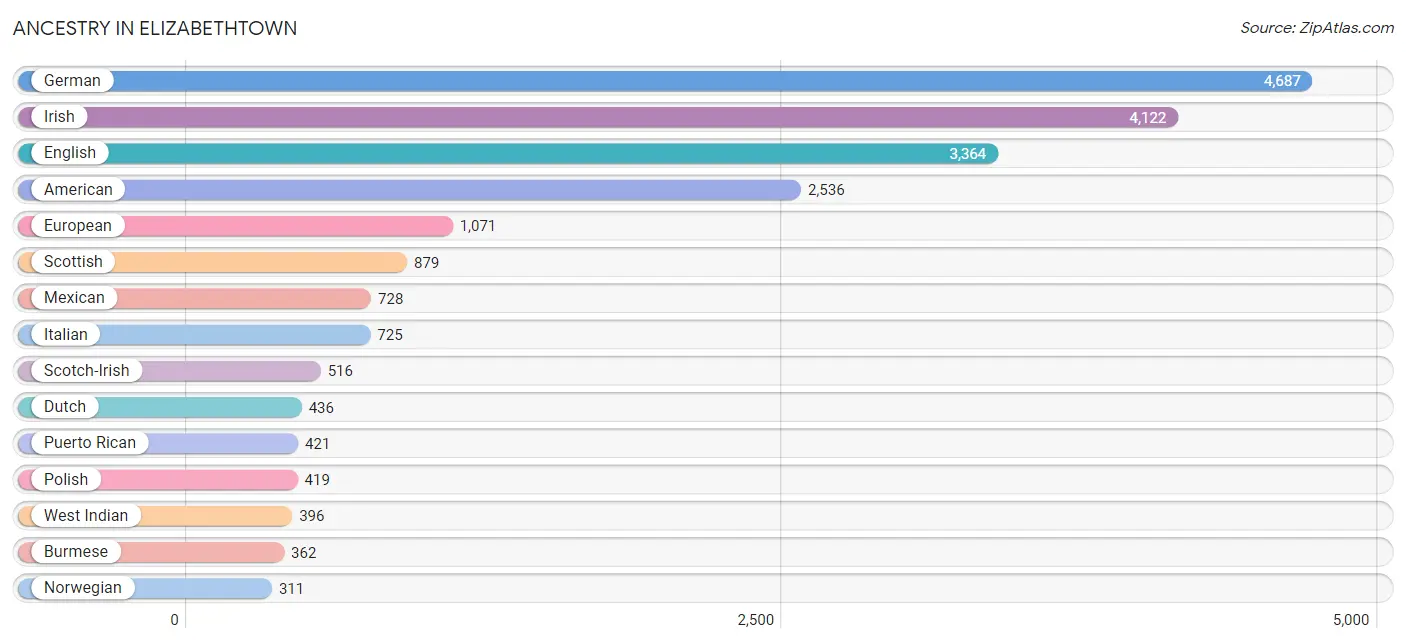
Ancestry in Elizabethtown
The most populous ancestries reported in Elizabethtown are German (4,687 | 14.9%), Irish (4,122 | 13.1%), English (3,364 | 10.7%), American (2,536 | 8.1%), and European (1,071 | 3.4%), together accounting for 50.2% of all Elizabethtown residents.
| Ancestry | # Population | % Population |
| African | 162 | 0.5% |
| American | 2,536 | 8.1% |
| Arab | 28 | 0.1% |
| Armenian | 59 | 0.2% |
| Austrian | 15 | 0.1% |
| Belgian | 115 | 0.4% |
| Bhutanese | 256 | 0.8% |
| Blackfeet | 25 | 0.1% |
| British | 171 | 0.5% |
| Burmese | 362 | 1.1% |
| Cajun | 15 | 0.1% |
| Canadian | 79 | 0.3% |
| Central American | 53 | 0.2% |
| Cherokee | 94 | 0.3% |
| Chippewa | 10 | 0.0% |
| Colombian | 26 | 0.1% |
| Cuban | 145 | 0.5% |
| Czech | 35 | 0.1% |
| Czechoslovakian | 17 | 0.1% |
| Danish | 12 | 0.0% |
| Dutch | 436 | 1.4% |
| Eastern European | 9 | 0.0% |
| English | 3,364 | 10.7% |
| European | 1,071 | 3.4% |
| Filipino | 42 | 0.1% |
| Finnish | 38 | 0.1% |
| French | 235 | 0.7% |
| French Canadian | 118 | 0.4% |
| German | 4,687 | 14.9% |
| Haitian | 18 | 0.1% |
| Indian (Asian) | 103 | 0.3% |
| Irish | 4,122 | 13.1% |
| Iroquois | 27 | 0.1% |
| Italian | 725 | 2.3% |
| Japanese | 49 | 0.2% |
| Korean | 288 | 0.9% |
| Lebanese | 28 | 0.1% |
| Mexican | 728 | 2.3% |
| Native Hawaiian | 110 | 0.4% |
| Navajo | 4 | 0.0% |
| Nicaraguan | 22 | 0.1% |
| Nigerian | 92 | 0.3% |
| Northern European | 23 | 0.1% |
| Norwegian | 311 | 1.0% |
| Pakistani | 43 | 0.1% |
| Panamanian | 31 | 0.1% |
| Polish | 419 | 1.3% |
| Portuguese | 97 | 0.3% |
| Puerto Rican | 421 | 1.3% |
| Romanian | 231 | 0.7% |
| Russian | 170 | 0.5% |
| Samoan | 11 | 0.0% |
| Scotch-Irish | 516 | 1.6% |
| Scottish | 879 | 2.8% |
| Serbian | 22 | 0.1% |
| Slavic | 14 | 0.0% |
| Somali | 23 | 0.1% |
| South American | 26 | 0.1% |
| Spaniard | 14 | 0.0% |
| Spanish | 68 | 0.2% |
| Sri Lankan | 17 | 0.1% |
| Subsaharan African | 277 | 0.9% |
| Swedish | 106 | 0.3% |
| Swiss | 56 | 0.2% |
| Thai | 209 | 0.7% |
| Turkish | 39 | 0.1% |
| Ukrainian | 92 | 0.3% |
| Welsh | 284 | 0.9% |
| West Indian | 396 | 1.3% |
| Yugoslavian | 14 | 0.0% | View All 70 Rows |
Immigrants in Elizabethtown
The most numerous immigrant groups reported in Elizabethtown came from Asia (664 | 2.1%), Europe (335 | 1.1%), Latin America (305 | 1.0%), South Central Asia (270 | 0.9%), and Western Europe (241 | 0.8%), together accounting for 5.8% of all Elizabethtown residents.
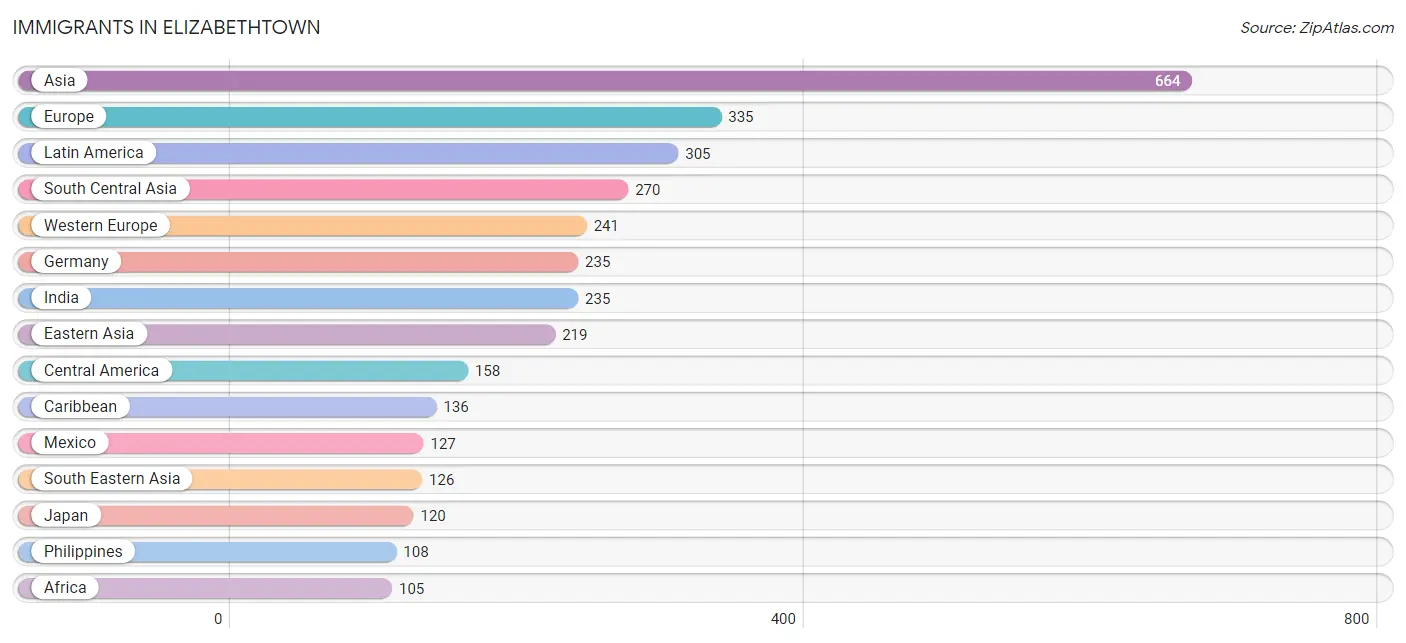
| Immigration Origin | # Population | % Population |
| Africa | 105 | 0.3% |
| Asia | 664 | 2.1% |
| Canada | 10 | 0.0% |
| Caribbean | 136 | 0.4% |
| Central America | 158 | 0.5% |
| China | 22 | 0.1% |
| Colombia | 11 | 0.0% |
| Cuba | 88 | 0.3% |
| Dominican Republic | 41 | 0.1% |
| Eastern Africa | 23 | 0.1% |
| Eastern Asia | 219 | 0.7% |
| Eastern Europe | 63 | 0.2% |
| Europe | 335 | 1.1% |
| Germany | 235 | 0.7% |
| Hong Kong | 22 | 0.1% |
| India | 235 | 0.7% |
| Indonesia | 16 | 0.1% |
| Israel | 49 | 0.2% |
| Japan | 120 | 0.4% |
| Korea | 77 | 0.3% |
| Latin America | 305 | 1.0% |
| Liberia | 42 | 0.1% |
| Mexico | 127 | 0.4% |
| Nigeria | 40 | 0.1% |
| Northern Europe | 31 | 0.1% |
| Oceania | 34 | 0.1% |
| Pakistan | 35 | 0.1% |
| Panama | 31 | 0.1% |
| Philippines | 108 | 0.3% |
| Poland | 14 | 0.0% |
| Russia | 12 | 0.0% |
| Somalia | 23 | 0.1% |
| South America | 11 | 0.0% |
| South Central Asia | 270 | 0.9% |
| South Eastern Asia | 126 | 0.4% |
| Switzerland | 6 | 0.0% |
| Thailand | 2 | 0.0% |
| Ukraine | 37 | 0.1% |
| Western Africa | 82 | 0.3% |
| Western Asia | 49 | 0.2% |
| Western Europe | 241 | 0.8% | View All 41 Rows |
Sex and Age in Elizabethtown
Sex and Age in Elizabethtown
The most populous age groups in Elizabethtown are 35 to 39 Years (1,456 | 9.8%) for men and 35 to 39 Years (1,524 | 9.2%) for women.
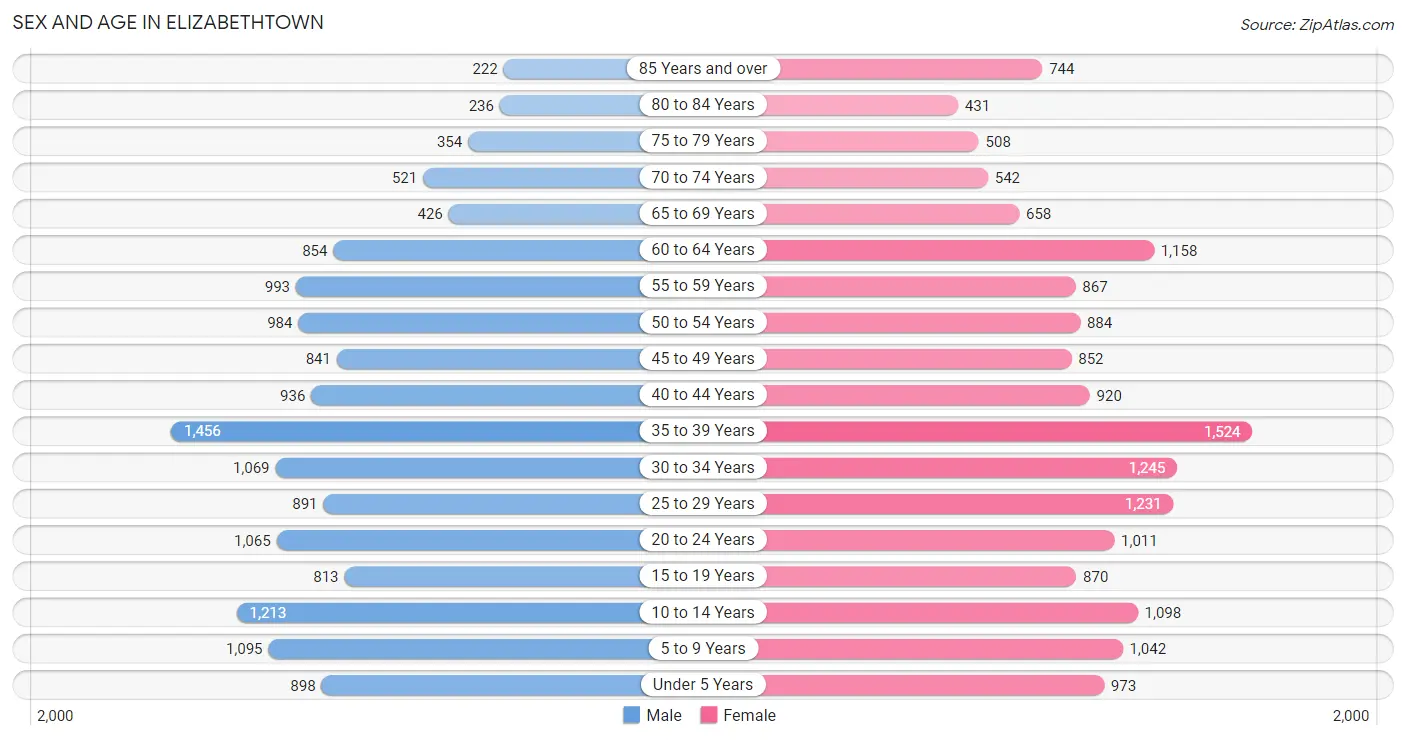
| Age Bracket | Male | Female |
| Under 5 Years | 898 (6.0%) | 973 (5.9%) |
| 5 to 9 Years | 1,095 (7.4%) | 1,042 (6.3%) |
| 10 to 14 Years | 1,213 (8.2%) | 1,098 (6.6%) |
| 15 to 19 Years | 813 (5.5%) | 870 (5.2%) |
| 20 to 24 Years | 1,065 (7.2%) | 1,011 (6.1%) |
| 25 to 29 Years | 891 (6.0%) | 1,231 (7.4%) |
| 30 to 34 Years | 1,069 (7.2%) | 1,245 (7.5%) |
| 35 to 39 Years | 1,456 (9.8%) | 1,524 (9.2%) |
| 40 to 44 Years | 936 (6.3%) | 920 (5.6%) |
| 45 to 49 Years | 841 (5.7%) | 852 (5.1%) |
| 50 to 54 Years | 984 (6.6%) | 884 (5.3%) |
| 55 to 59 Years | 993 (6.7%) | 867 (5.2%) |
| 60 to 64 Years | 854 (5.7%) | 1,158 (7.0%) |
| 65 to 69 Years | 426 (2.9%) | 658 (4.0%) |
| 70 to 74 Years | 521 (3.5%) | 542 (3.3%) |
| 75 to 79 Years | 354 (2.4%) | 508 (3.1%) |
| 80 to 84 Years | 236 (1.6%) | 431 (2.6%) |
| 85 Years and over | 222 (1.5%) | 744 (4.5%) |
| Total | 14,867 (100.0%) | 16,558 (100.0%) |
Families and Households in Elizabethtown
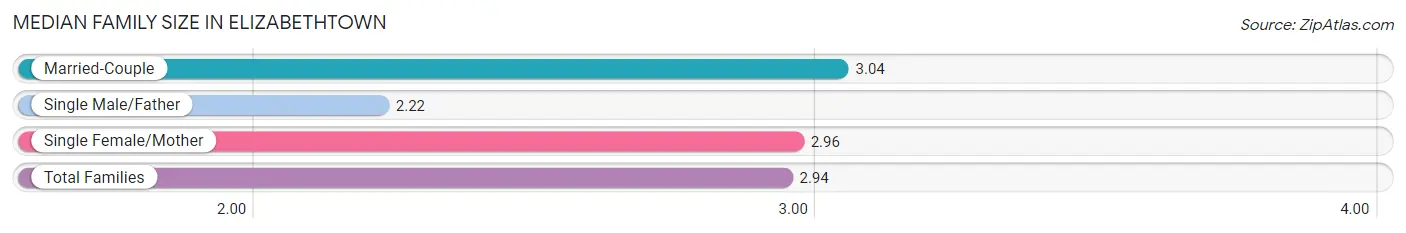
Median Family Size in Elizabethtown
The median family size in Elizabethtown is 2.94 persons per family, with married-couple families (5,027 | 65.8%) accounting for the largest median family size of 3.04 persons per family. On the other hand, single male/father families (689 | 9.0%) represent the smallest median family size with 2.22 persons per family.
| Family Type | # Families | Family Size |
| Married-Couple | 5,027 (65.8%) | 3.04 |
| Single Male/Father | 689 (9.0%) | 2.22 |
| Single Female/Mother | 1,918 (25.1%) | 2.96 |
| Total Families | 7,634 (100.0%) | 2.94 |
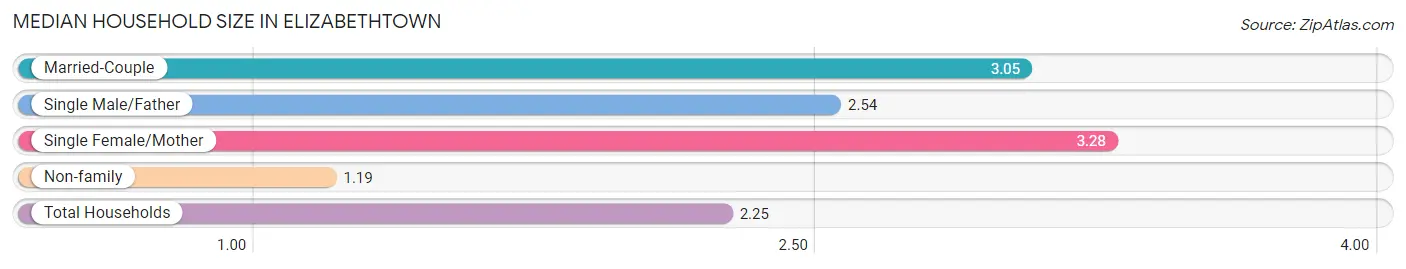
Median Household Size in Elizabethtown
The median household size in Elizabethtown is 2.25 persons per household, with single female/mother households (1,918 | 14.2%) accounting for the largest median household size of 3.28 persons per household. non-family households (5,829 | 43.3%) represent the smallest median household size with 1.19 persons per household.
| Household Type | # Households | Household Size |
| Married-Couple | 5,027 (37.3%) | 3.05 |
| Single Male/Father | 689 (5.1%) | 2.54 |
| Single Female/Mother | 1,918 (14.2%) | 3.28 |
| Non-family | 5,829 (43.3%) | 1.19 |
| Total Households | 13,463 (100.0%) | 2.25 |
Household Size by Marriage Status in Elizabethtown
Out of a total of 13,463 households in Elizabethtown, 7,634 (56.7%) are family households, while 5,829 (43.3%) are nonfamily households. The most numerous type of family households are 2-person households, comprising 3,675, and the most common type of nonfamily households are 1-person households, comprising 4,871.
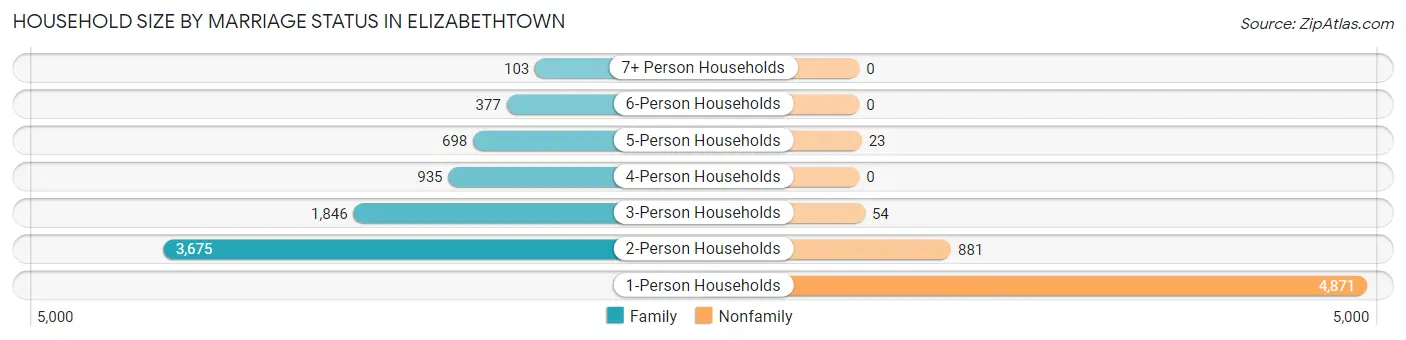
| Household Size | Family Households | Nonfamily Households |
| 1-Person Households | - | 4,871 (36.2%) |
| 2-Person Households | 3,675 (27.3%) | 881 (6.5%) |
| 3-Person Households | 1,846 (13.7%) | 54 (0.4%) |
| 4-Person Households | 935 (6.9%) | 0 (0.0%) |
| 5-Person Households | 698 (5.2%) | 23 (0.2%) |
| 6-Person Households | 377 (2.8%) | 0 (0.0%) |
| 7+ Person Households | 103 (0.8%) | 0 (0.0%) |
| Total | 7,634 (56.7%) | 5,829 (43.3%) |
Female Fertility in Elizabethtown
Fertility by Age in Elizabethtown
Average fertility rate in Elizabethtown is 42.0 births per 1,000 women. Women in the age bracket of 20 to 34 years have the highest fertility rate with 75.0 births per 1,000 women. Women in the age bracket of 20 to 34 years acount for 79.8% of all women with births.
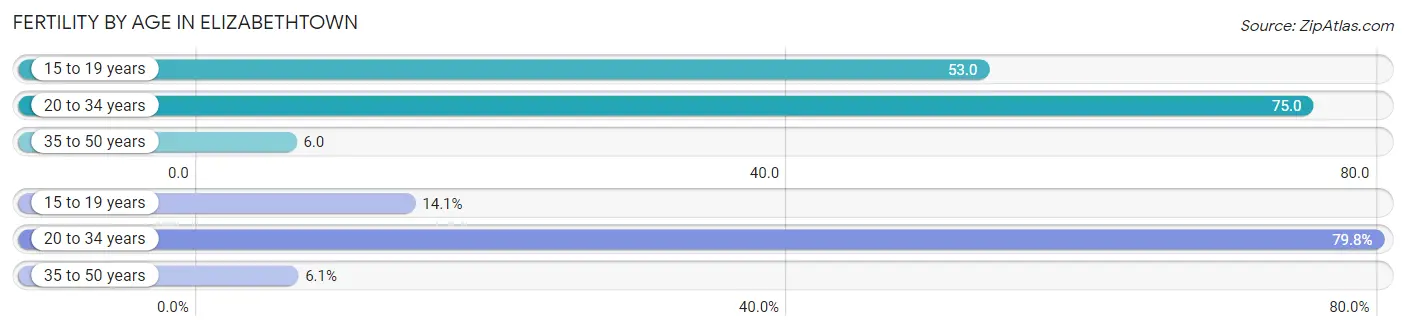
| Age Bracket | Women with Births | Births / 1,000 Women |
| 15 to 19 years | 46 (14.1%) | 53.0 |
| 20 to 34 years | 261 (79.8%) | 75.0 |
| 35 to 50 years | 20 (6.1%) | 6.0 |
| Total | 327 (100.0%) | 42.0 |
Fertility by Age by Marriage Status in Elizabethtown
49.2% of women with births (327) in Elizabethtown are married. The highest percentage of unmarried women with births falls into 20 to 34 years age bracket with 63.6% of them unmarried at the time of birth, while the lowest percentage of unmarried women with births belong to 15 to 19 years age bracket with 0.0% of them unmarried.
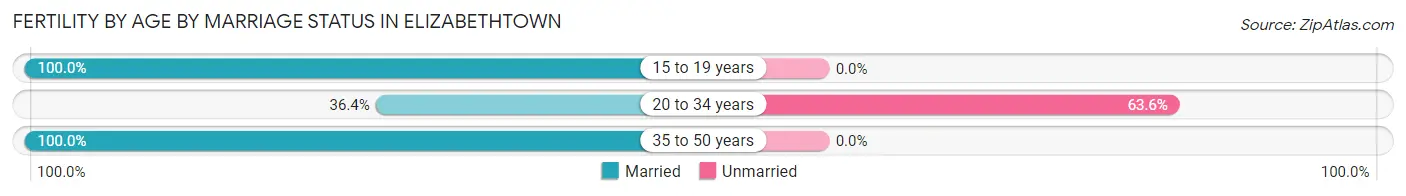
| Age Bracket | Married | Unmarried |
| 15 to 19 years | 46 (100.0%) | 0 (0.0%) |
| 20 to 34 years | 95 (36.4%) | 166 (63.6%) |
| 35 to 50 years | 20 (100.0%) | 0 (0.0%) |
| Total | 161 (49.2%) | 166 (50.8%) |
Fertility by Education in Elizabethtown
Average fertility rate in Elizabethtown is 42.0 births per 1,000 women. Women with the education attainment of less than high school have the highest fertility rate of 63.0 births per 1,000 women, while women with the education attainment of bachelor's degree have the lowest fertility at 15.0 births per 1,000 women. Women with the education attainment of college or associate's degree represent 47.4% of all women with births.
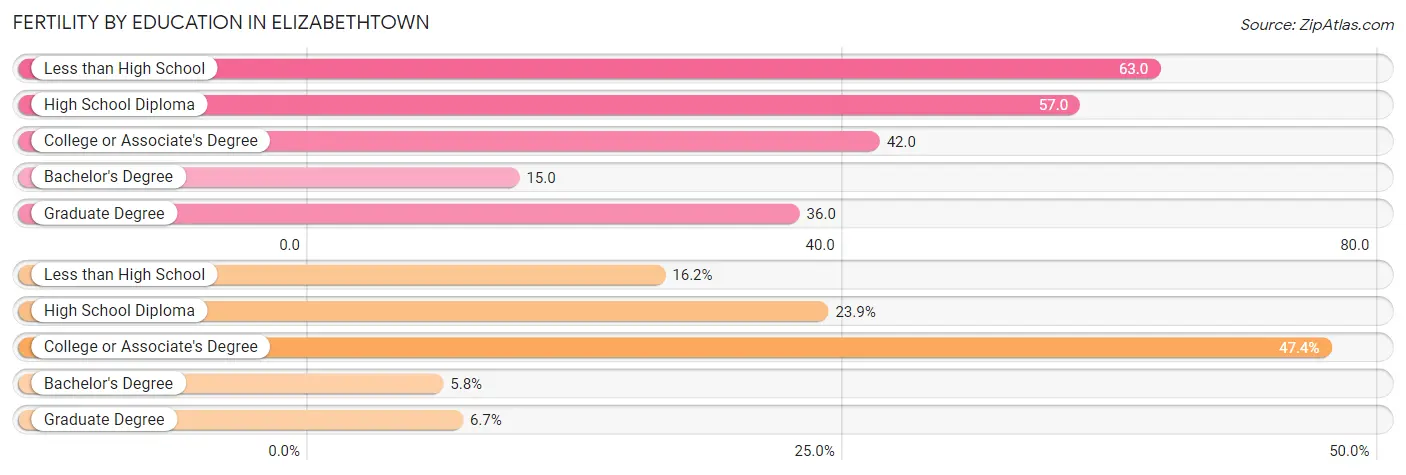
| Educational Attainment | Women with Births | Births / 1,000 Women |
| Less than High School | 53 (16.2%) | 63.0 |
| High School Diploma | 78 (23.8%) | 57.0 |
| College or Associate's Degree | 155 (47.4%) | 42.0 |
| Bachelor's Degree | 19 (5.8%) | 15.0 |
| Graduate Degree | 22 (6.7%) | 36.0 |
| Total | 327 (100.0%) | 42.0 |
Fertility by Education by Marriage Status in Elizabethtown
50.8% of women with births in Elizabethtown are unmarried. Women with the educational attainment of bachelor's degree are most likely to be married with 100.0% of them married at childbirth, while women with the educational attainment of less than high school are least likely to be married with 100.0% of them unmarried at childbirth.
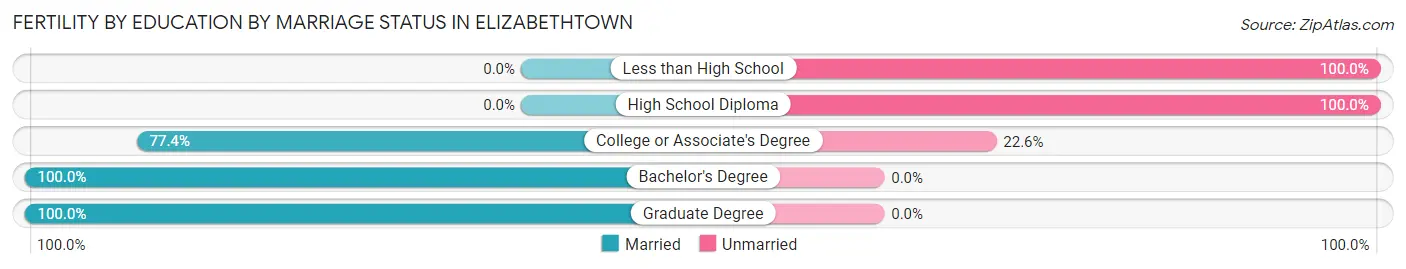
| Educational Attainment | Married | Unmarried |
| Less than High School | 0 (0.0%) | 53 (100.0%) |
| High School Diploma | 0 (0.0%) | 78 (100.0%) |
| College or Associate's Degree | 120 (77.4%) | 35 (22.6%) |
| Bachelor's Degree | 19 (100.0%) | 0 (0.0%) |
| Graduate Degree | 22 (100.0%) | 0 (0.0%) |
| Total | 161 (49.2%) | 166 (50.8%) |
Employment Characteristics in Elizabethtown
Employment by Class of Employer in Elizabethtown
Among the 14,243 employed individuals in Elizabethtown, private company employees (9,446 | 66.3%), federal government employees (1,452 | 10.2%), and not-for-profit organizations (991 | 7.0%) make up the most common classes of employment.
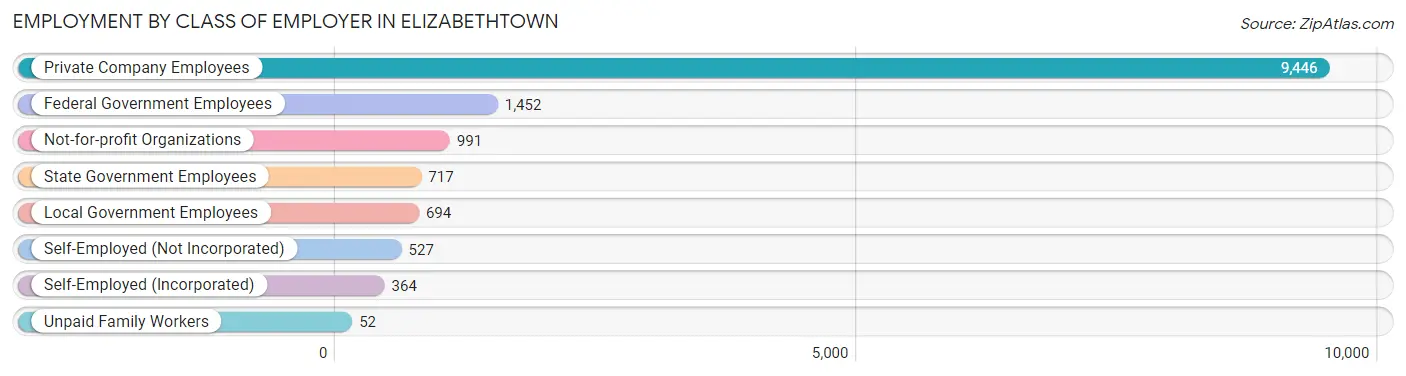
| Employer Class | # Employees | % Employees |
| Private Company Employees | 9,446 | 66.3% |
| Self-Employed (Incorporated) | 364 | 2.6% |
| Self-Employed (Not Incorporated) | 527 | 3.7% |
| Not-for-profit Organizations | 991 | 7.0% |
| Local Government Employees | 694 | 4.9% |
| State Government Employees | 717 | 5.0% |
| Federal Government Employees | 1,452 | 10.2% |
| Unpaid Family Workers | 52 | 0.4% |
| Total | 14,243 | 100.0% |
Employment Status by Age in Elizabethtown
According to the labor force statistics for Elizabethtown, out of the total population over 16 years of age (24,767), 61.7% or 15,281 individuals are in the labor force, with 5.8% or 886 of them unemployed. The age group with the highest labor force participation rate is 25 to 29 years, with 83.1% or 1,763 individuals in the labor force. Within the labor force, the 20 to 24 years age range has the highest percentage of unemployed individuals, with 12.9% or 216 of them being unemployed.
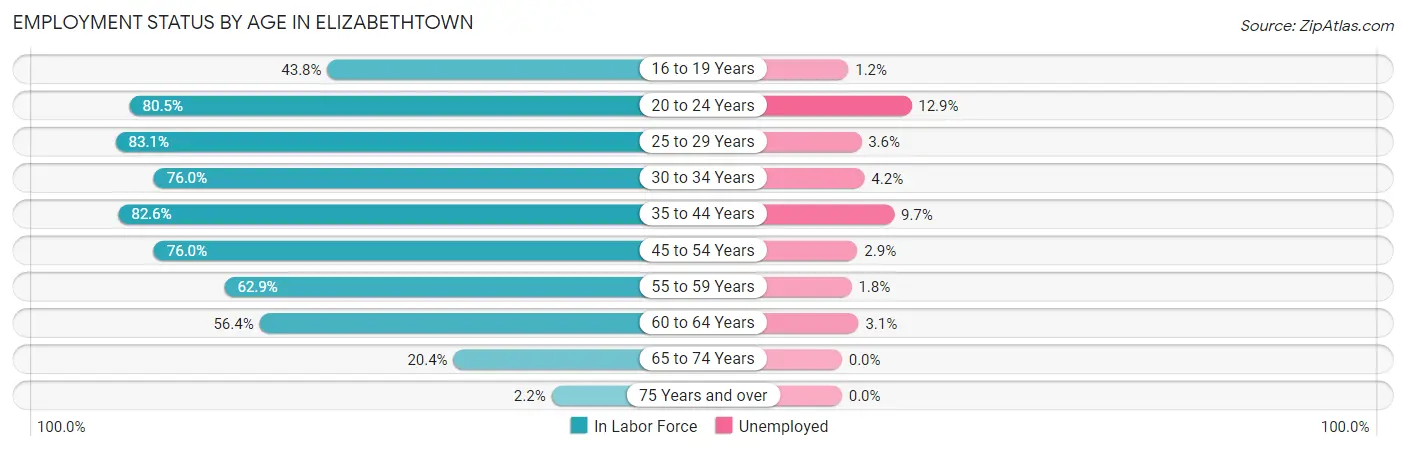
| Age Bracket | In Labor Force | Unemployed |
| 16 to 19 Years | 589 (43.8%) | 7 (1.2%) |
| 20 to 24 Years | 1,671 (80.5%) | 216 (12.9%) |
| 25 to 29 Years | 1,763 (83.1%) | 63 (3.6%) |
| 30 to 34 Years | 1,759 (76.0%) | 74 (4.2%) |
| 35 to 44 Years | 3,995 (82.6%) | 388 (9.7%) |
| 45 to 54 Years | 2,706 (76.0%) | 78 (2.9%) |
| 55 to 59 Years | 1,170 (62.9%) | 21 (1.8%) |
| 60 to 64 Years | 1,135 (56.4%) | 35 (3.1%) |
| 65 to 74 Years | 438 (20.4%) | 0 (0.0%) |
| 75 Years and over | 55 (2.2%) | 0 (0.0%) |
| Total | 15,281 (61.7%) | 886 (5.8%) |
Employment Status by Educational Attainment in Elizabethtown
According to labor force statistics for Elizabethtown, 75.0% of individuals (12,529) out of the total population between 25 and 64 years of age (16,705) are in the labor force, with 5.3% or 664 of them being unemployed. The group with the highest labor force participation rate are those with the educational attainment of bachelor's degree or higher, with 84.9% or 4,193 individuals in the labor force. Within the labor force, individuals with college / associate degree education have the highest percentage of unemployment, with 8.1% or 433 of them being unemployed.
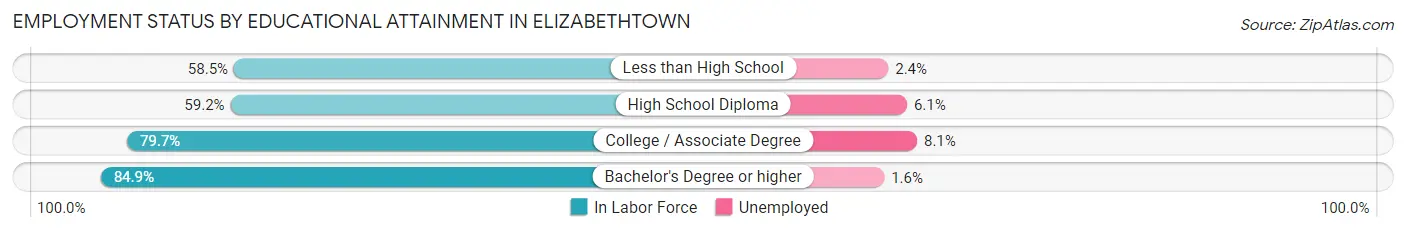
| Educational Attainment | In Labor Force | Unemployed |
| Less than High School | 635 (58.5%) | 26 (2.4%) |
| High School Diploma | 2,352 (59.2%) | 242 (6.1%) |
| College / Associate Degree | 5,345 (79.7%) | 543 (8.1%) |
| Bachelor's Degree or higher | 4,193 (84.9%) | 79 (1.6%) |
| Total | 12,529 (75.0%) | 885 (5.3%) |
Employment Occupations by Sex in Elizabethtown
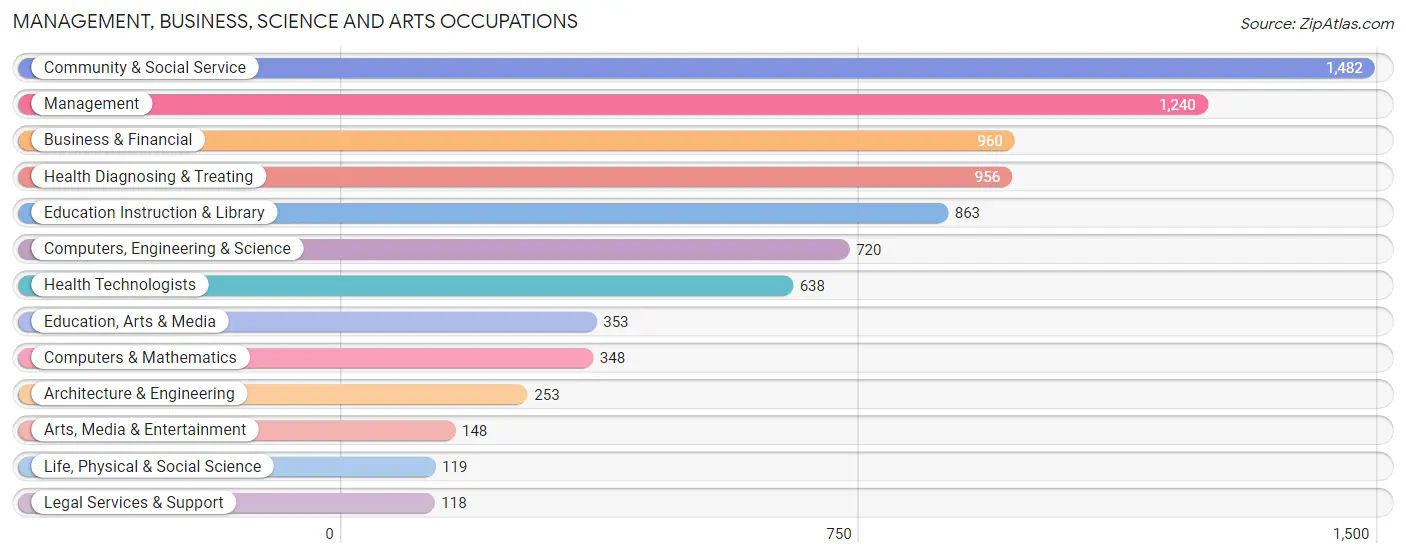
Management, Business, Science and Arts Occupations
The most common Management, Business, Science and Arts occupations in Elizabethtown are Community & Social Service (1,482 | 10.5%), Management (1,240 | 8.7%), Business & Financial (960 | 6.8%), Health Diagnosing & Treating (956 | 6.8%), and Education Instruction & Library (863 | 6.1%).
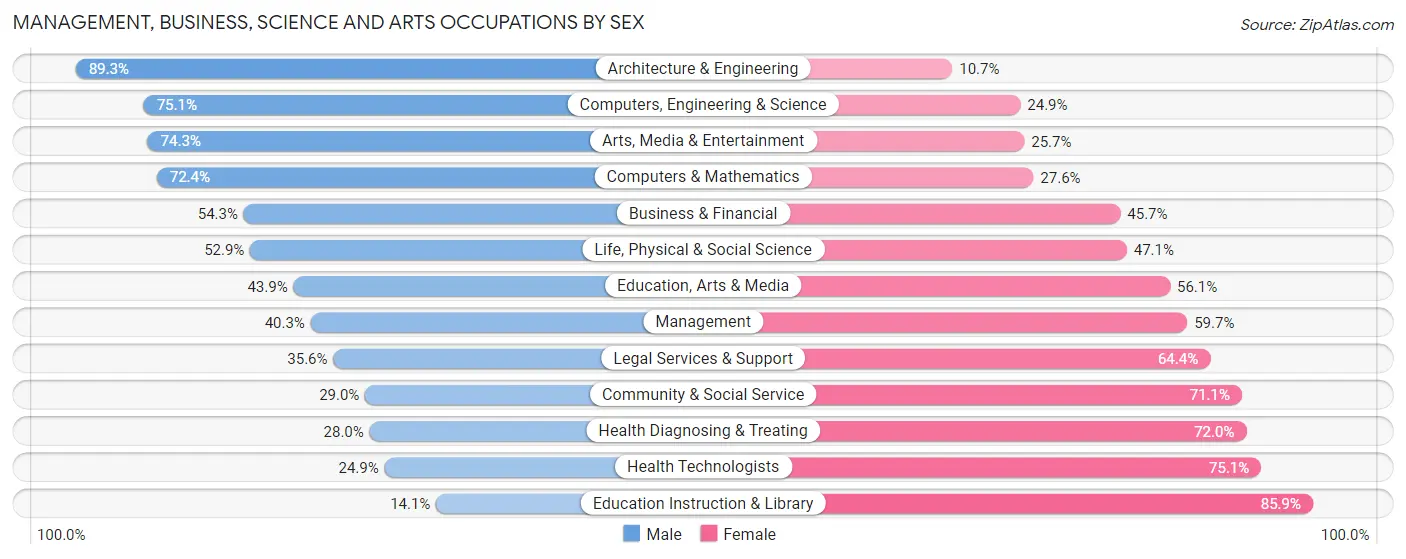
Management, Business, Science and Arts Occupations by Sex
Within the Management, Business, Science and Arts occupations in Elizabethtown, the most male-oriented occupations are Architecture & Engineering (89.3%), Computers, Engineering & Science (75.1%), and Arts, Media & Entertainment (74.3%), while the most female-oriented occupations are Education Instruction & Library (85.9%), Health Technologists (75.1%), and Health Diagnosing & Treating (72.0%).
| Occupation | Male | Female |
| Management | 500 (40.3%) | 740 (59.7%) |
| Business & Financial | 521 (54.3%) | 439 (45.7%) |
| Computers, Engineering & Science | 541 (75.1%) | 179 (24.9%) |
| Computers & Mathematics | 252 (72.4%) | 96 (27.6%) |
| Architecture & Engineering | 226 (89.3%) | 27 (10.7%) |
| Life, Physical & Social Science | 63 (52.9%) | 56 (47.1%) |
| Community & Social Service | 429 (28.9%) | 1,053 (71.1%) |
| Education, Arts & Media | 155 (43.9%) | 198 (56.1%) |
| Legal Services & Support | 42 (35.6%) | 76 (64.4%) |
| Education Instruction & Library | 122 (14.1%) | 741 (85.9%) |
| Arts, Media & Entertainment | 110 (74.3%) | 38 (25.7%) |
| Health Diagnosing & Treating | 268 (28.0%) | 688 (72.0%) |
| Health Technologists | 159 (24.9%) | 479 (75.1%) |
| Total (Category) | 2,259 (42.2%) | 3,099 (57.8%) |
| Total (Overall) | 6,994 (49.4%) | 7,170 (50.6%) |
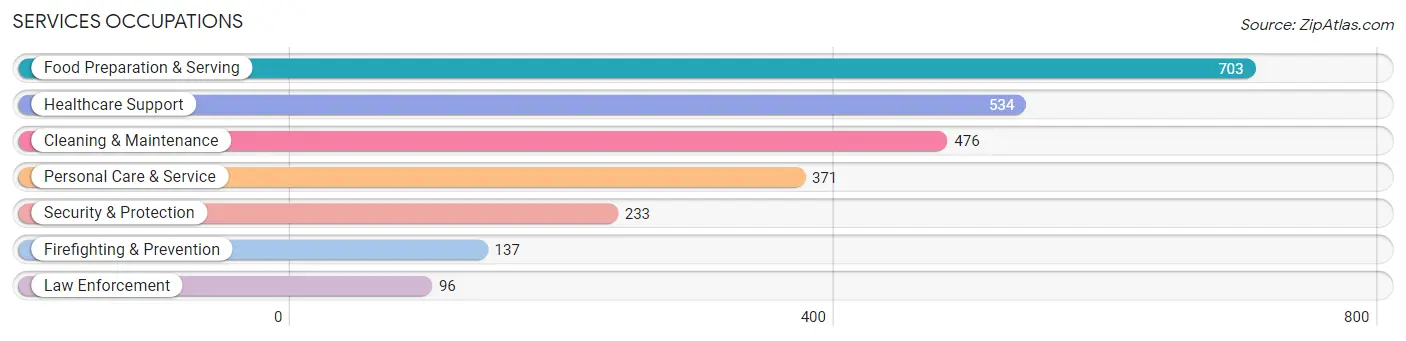
Services Occupations
The most common Services occupations in Elizabethtown are Food Preparation & Serving (703 | 5.0%), Healthcare Support (534 | 3.8%), Cleaning & Maintenance (476 | 3.4%), Personal Care & Service (371 | 2.6%), and Security & Protection (233 | 1.7%).
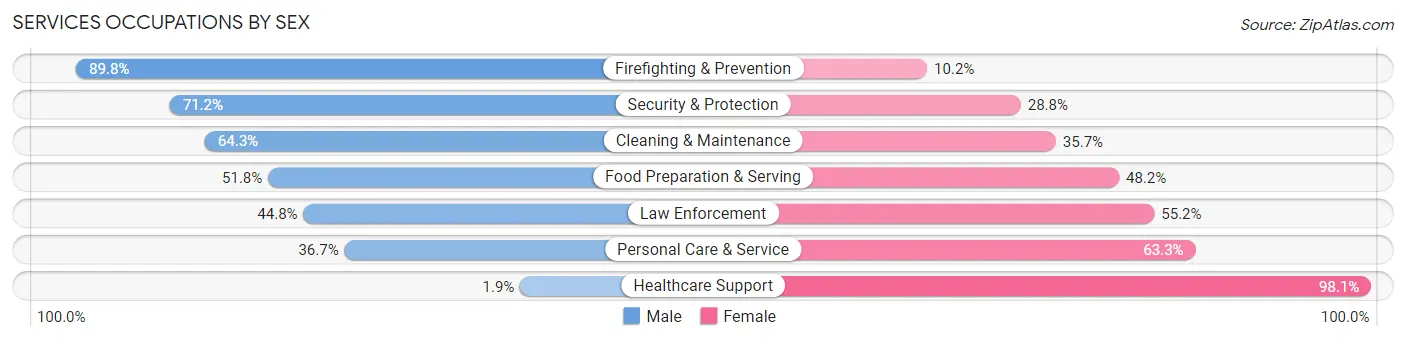
Services Occupations by Sex
Within the Services occupations in Elizabethtown, the most male-oriented occupations are Firefighting & Prevention (89.8%), Security & Protection (71.2%), and Cleaning & Maintenance (64.3%), while the most female-oriented occupations are Healthcare Support (98.1%), Personal Care & Service (63.3%), and Law Enforcement (55.2%).
| Occupation | Male | Female |
| Healthcare Support | 10 (1.9%) | 524 (98.1%) |
| Security & Protection | 166 (71.2%) | 67 (28.8%) |
| Firefighting & Prevention | 123 (89.8%) | 14 (10.2%) |
| Law Enforcement | 43 (44.8%) | 53 (55.2%) |
| Food Preparation & Serving | 364 (51.8%) | 339 (48.2%) |
| Cleaning & Maintenance | 306 (64.3%) | 170 (35.7%) |
| Personal Care & Service | 136 (36.7%) | 235 (63.3%) |
| Total (Category) | 982 (42.4%) | 1,335 (57.6%) |
| Total (Overall) | 6,994 (49.4%) | 7,170 (50.6%) |
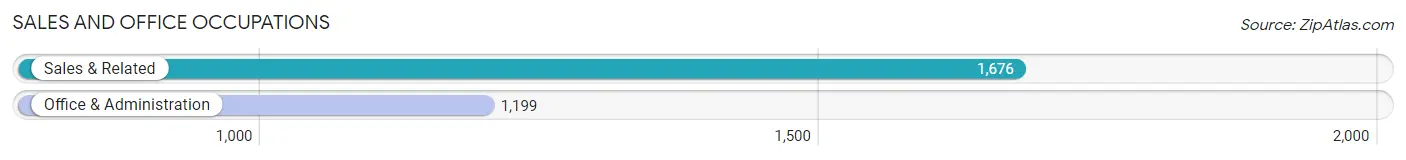
Sales and Office Occupations
The most common Sales and Office occupations in Elizabethtown are Sales & Related (1,676 | 11.8%), and Office & Administration (1,199 | 8.5%).
Sales and Office Occupations by Sex
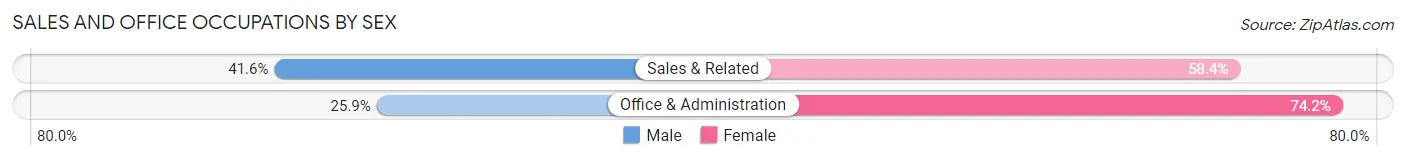
| Occupation | Male | Female |
| Sales & Related | 697 (41.6%) | 979 (58.4%) |
| Office & Administration | 310 (25.9%) | 889 (74.2%) |
| Total (Category) | 1,007 (35.0%) | 1,868 (65.0%) |
| Total (Overall) | 6,994 (49.4%) | 7,170 (50.6%) |
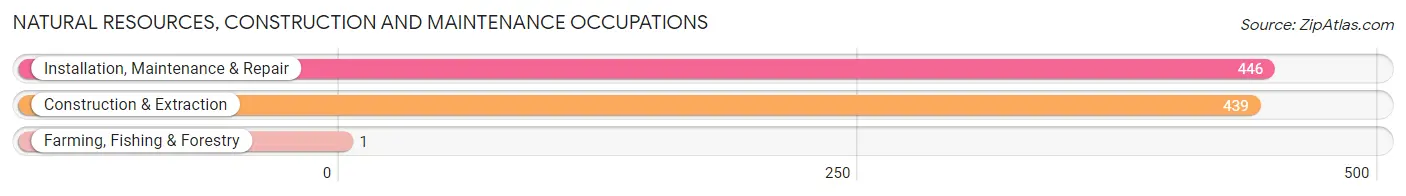
Natural Resources, Construction and Maintenance Occupations
The most common Natural Resources, Construction and Maintenance occupations in Elizabethtown are Installation, Maintenance & Repair (446 | 3.2%), Construction & Extraction (439 | 3.1%), and Farming, Fishing & Forestry (1 | 0.0%).
Natural Resources, Construction and Maintenance Occupations by Sex
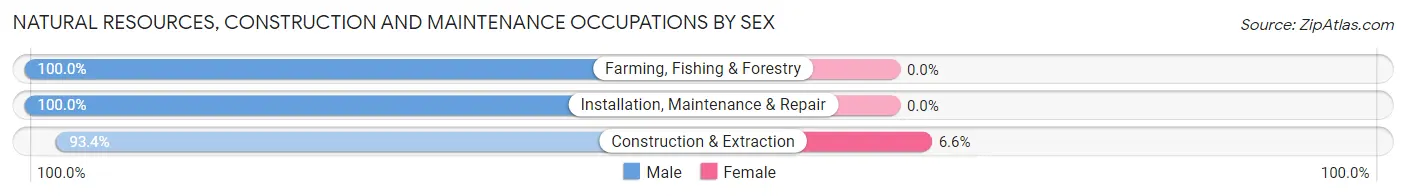
| Occupation | Male | Female |
| Farming, Fishing & Forestry | 1 (100.0%) | 0 (0.0%) |
| Construction & Extraction | 410 (93.4%) | 29 (6.6%) |
| Installation, Maintenance & Repair | 446 (100.0%) | 0 (0.0%) |
| Total (Category) | 857 (96.7%) | 29 (3.3%) |
| Total (Overall) | 6,994 (49.4%) | 7,170 (50.6%) |
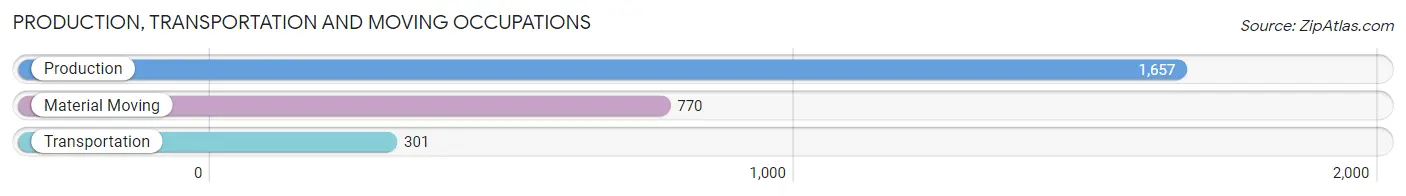
Production, Transportation and Moving Occupations
The most common Production, Transportation and Moving occupations in Elizabethtown are Production (1,657 | 11.7%), Material Moving (770 | 5.4%), and Transportation (301 | 2.1%).
Production, Transportation and Moving Occupations by Sex
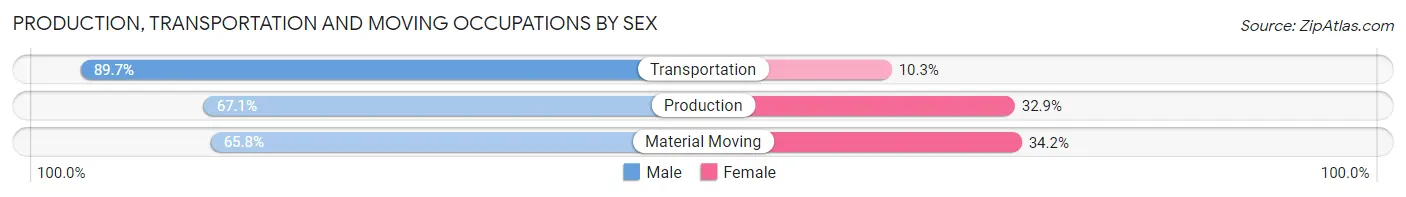
| Occupation | Male | Female |
| Production | 1,112 (67.1%) | 545 (32.9%) |
| Transportation | 270 (89.7%) | 31 (10.3%) |
| Material Moving | 507 (65.8%) | 263 (34.2%) |
| Total (Category) | 1,889 (69.2%) | 839 (30.8%) |
| Total (Overall) | 6,994 (49.4%) | 7,170 (50.6%) |
Employment Industries by Sex in Elizabethtown
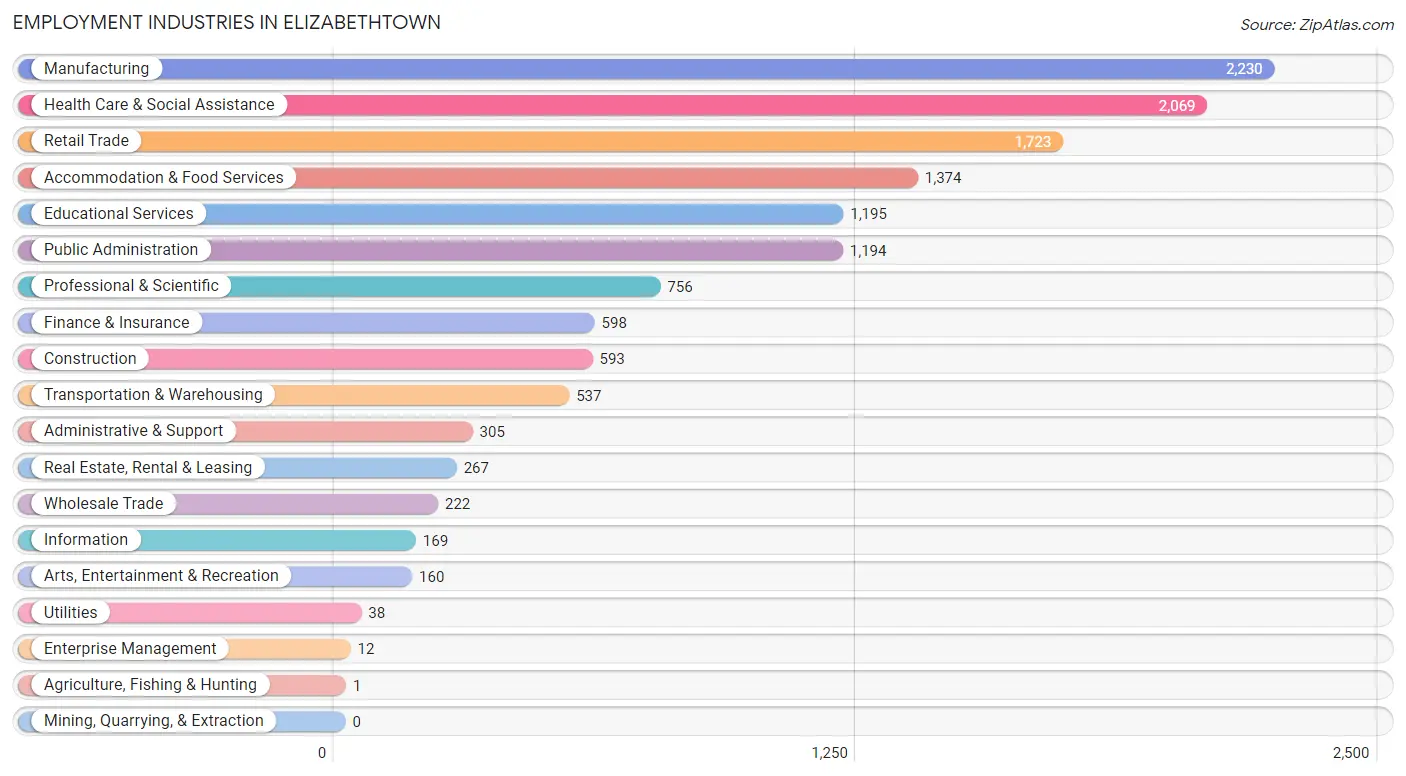
Employment Industries in Elizabethtown
The major employment industries in Elizabethtown include Manufacturing (2,230 | 15.7%), Health Care & Social Assistance (2,069 | 14.6%), Retail Trade (1,723 | 12.2%), Accommodation & Food Services (1,374 | 9.7%), and Educational Services (1,195 | 8.4%).
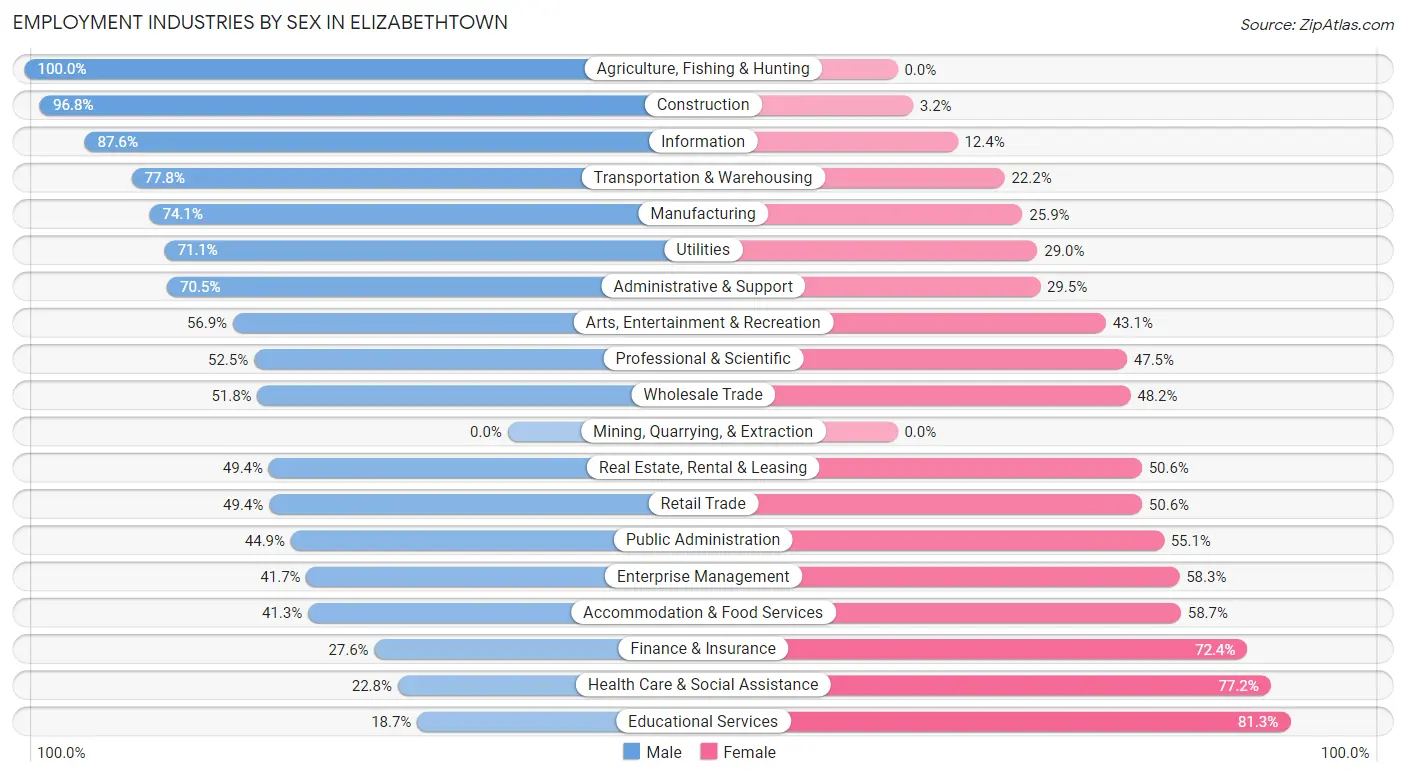
Employment Industries by Sex in Elizabethtown
The Elizabethtown industries that see more men than women are Agriculture, Fishing & Hunting (100.0%), Construction (96.8%), and Information (87.6%), whereas the industries that tend to have a higher number of women are Educational Services (81.3%), Health Care & Social Assistance (77.2%), and Finance & Insurance (72.4%).
| Industry | Male | Female |
| Agriculture, Fishing & Hunting | 1 (100.0%) | 0 (0.0%) |
| Mining, Quarrying, & Extraction | 0 (0.0%) | 0 (0.0%) |
| Construction | 574 (96.8%) | 19 (3.2%) |
| Manufacturing | 1,653 (74.1%) | 577 (25.9%) |
| Wholesale Trade | 115 (51.8%) | 107 (48.2%) |
| Retail Trade | 851 (49.4%) | 872 (50.6%) |
| Transportation & Warehousing | 418 (77.8%) | 119 (22.2%) |
| Utilities | 27 (71.1%) | 11 (28.9%) |
| Information | 148 (87.6%) | 21 (12.4%) |
| Finance & Insurance | 165 (27.6%) | 433 (72.4%) |
| Real Estate, Rental & Leasing | 132 (49.4%) | 135 (50.6%) |
| Professional & Scientific | 397 (52.5%) | 359 (47.5%) |
| Enterprise Management | 5 (41.7%) | 7 (58.3%) |
| Administrative & Support | 215 (70.5%) | 90 (29.5%) |
| Educational Services | 224 (18.7%) | 971 (81.3%) |
| Health Care & Social Assistance | 471 (22.8%) | 1,598 (77.2%) |
| Arts, Entertainment & Recreation | 91 (56.9%) | 69 (43.1%) |
| Accommodation & Food Services | 568 (41.3%) | 806 (58.7%) |
| Public Administration | 536 (44.9%) | 658 (55.1%) |
| Total | 6,994 (49.4%) | 7,170 (50.6%) |
Education in Elizabethtown
School Enrollment in Elizabethtown
The most common levels of schooling among the 7,460 students in Elizabethtown are middle school (1,687 | 22.6%), high school (1,646 | 22.1%), and elementary school (1,585 | 21.2%).
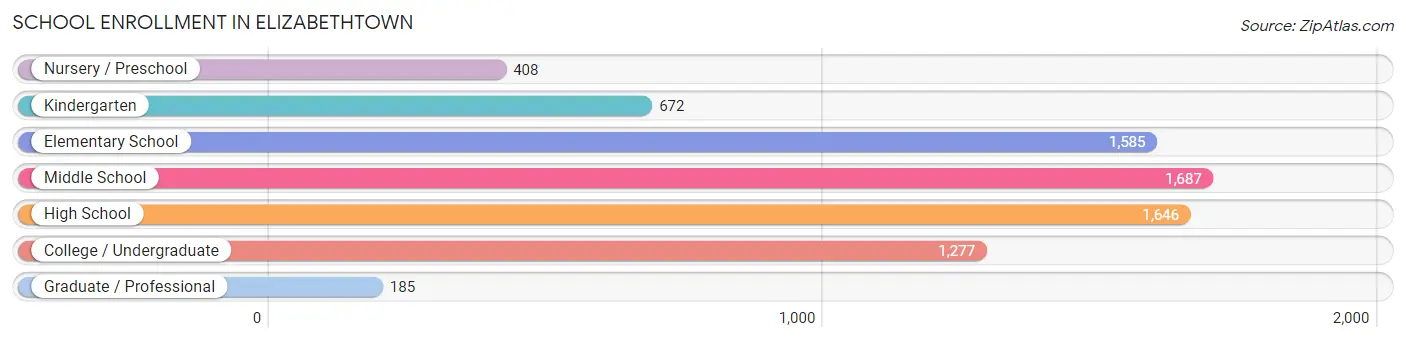
| School Level | # Students | % Students |
| Nursery / Preschool | 408 | 5.5% |
| Kindergarten | 672 | 9.0% |
| Elementary School | 1,585 | 21.2% |
| Middle School | 1,687 | 22.6% |
| High School | 1,646 | 22.1% |
| College / Undergraduate | 1,277 | 17.1% |
| Graduate / Professional | 185 | 2.5% |
| Total | 7,460 | 100.0% |
School Enrollment by Age by Funding Source in Elizabethtown
Out of a total of 7,460 students who are enrolled in schools in Elizabethtown, 1,589 (21.3%) attend a private institution, while the remaining 5,871 (78.7%) are enrolled in public schools. The age group of 3 to 4 year olds has the highest likelihood of being enrolled in private schools, with 214 (66.5% in the age bracket) enrolled. Conversely, the age group of 18 to 19 year olds has the lowest likelihood of being enrolled in a private school, with 346 (92.8% in the age bracket) attending a public institution.
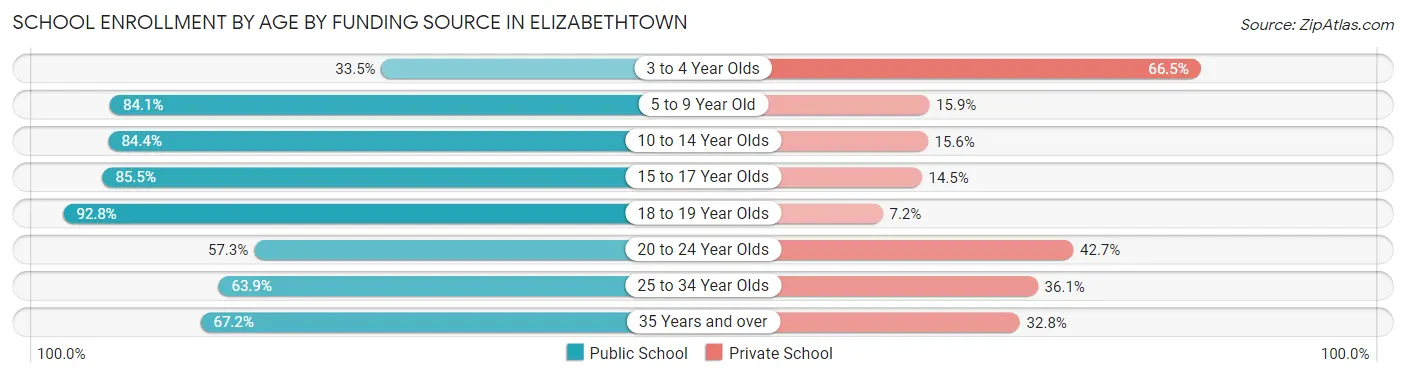
| Age Bracket | Public School | Private School |
| 3 to 4 Year Olds | 108 (33.5%) | 214 (66.5%) |
| 5 to 9 Year Old | 1,769 (84.1%) | 335 (15.9%) |
| 10 to 14 Year Olds | 1,933 (84.4%) | 358 (15.6%) |
| 15 to 17 Year Olds | 872 (85.5%) | 148 (14.5%) |
| 18 to 19 Year Olds | 346 (92.8%) | 27 (7.2%) |
| 20 to 24 Year Olds | 288 (57.3%) | 215 (42.7%) |
| 25 to 34 Year Olds | 274 (63.9%) | 155 (36.1%) |
| 35 Years and over | 281 (67.2%) | 137 (32.8%) |
| Total | 5,871 (78.7%) | 1,589 (21.3%) |
Educational Attainment by Field of Study in Elizabethtown
Business (1,339 | 20.1%), education (1,044 | 15.7%), science & technology (821 | 12.3%), social sciences (514 | 7.7%), and arts & humanities (412 | 6.2%) are the most common fields of study among 6,651 individuals in Elizabethtown who have obtained a bachelor's degree or higher.
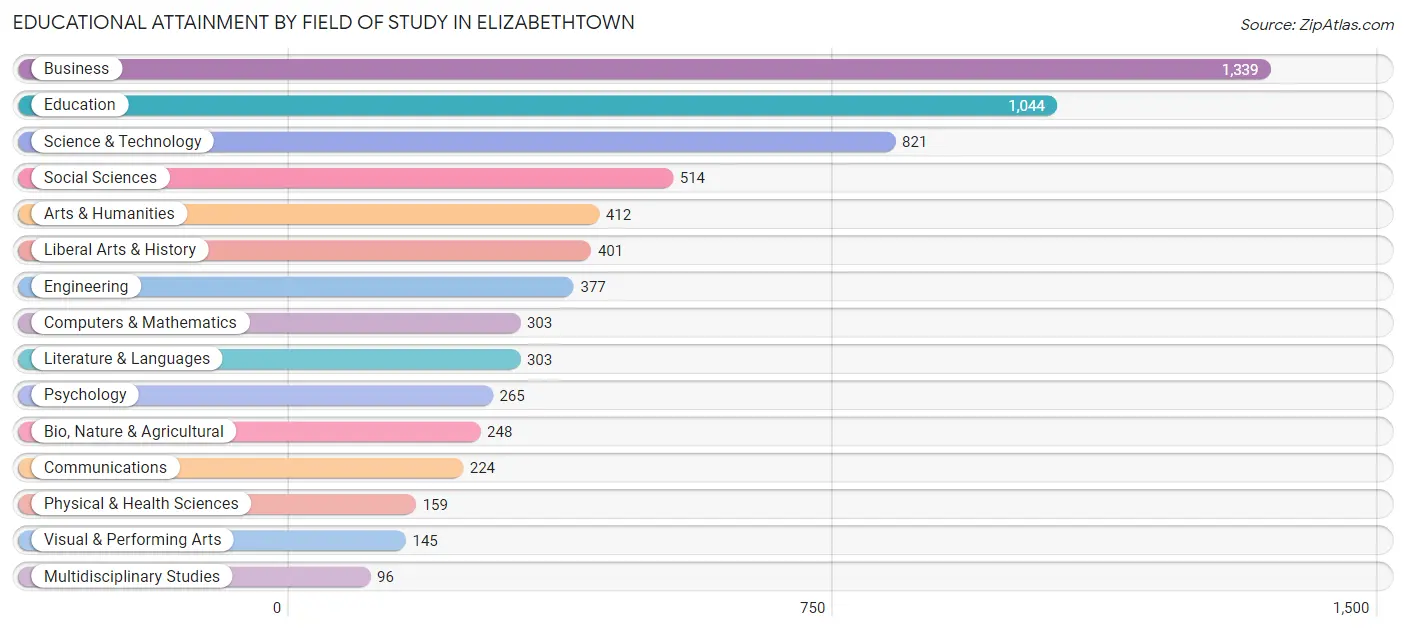
| Field of Study | # Graduates | % Graduates |
| Computers & Mathematics | 303 | 4.6% |
| Bio, Nature & Agricultural | 248 | 3.7% |
| Physical & Health Sciences | 159 | 2.4% |
| Psychology | 265 | 4.0% |
| Social Sciences | 514 | 7.7% |
| Engineering | 377 | 5.7% |
| Multidisciplinary Studies | 96 | 1.4% |
| Science & Technology | 821 | 12.3% |
| Business | 1,339 | 20.1% |
| Education | 1,044 | 15.7% |
| Literature & Languages | 303 | 4.6% |
| Liberal Arts & History | 401 | 6.0% |
| Visual & Performing Arts | 145 | 2.2% |
| Communications | 224 | 3.4% |
| Arts & Humanities | 412 | 6.2% |
| Total | 6,651 | 100.0% |
Transportation & Commute in Elizabethtown
Vehicle Availability by Sex in Elizabethtown
The most prevalent vehicle ownership categories in Elizabethtown are males with 2 vehicles (2,960, accounting for 41.9%) and females with 2 vehicles (2,735, making up 41.4%).
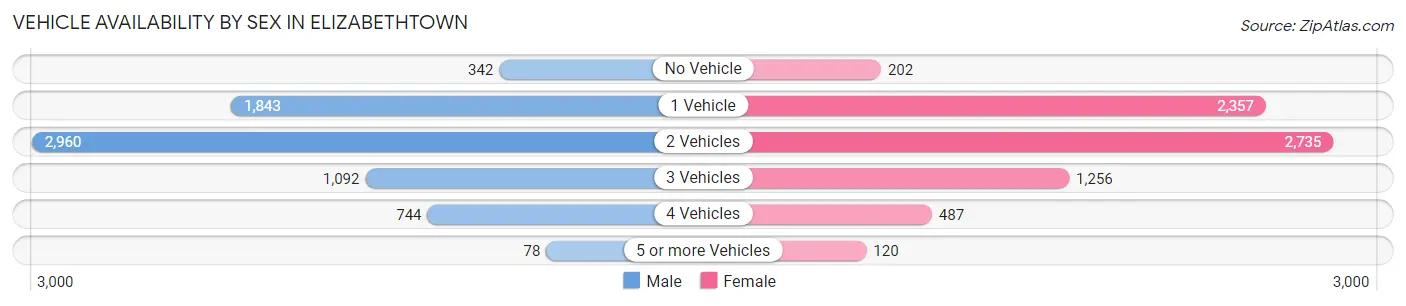
| Vehicles Available | Male | Female |
| No Vehicle | 342 (4.8%) | 202 (2.8%) |
| 1 Vehicle | 1,843 (26.1%) | 2,357 (32.9%) |
| 2 Vehicles | 2,960 (41.9%) | 2,735 (38.2%) |
| 3 Vehicles | 1,092 (15.5%) | 1,256 (17.5%) |
| 4 Vehicles | 744 (10.5%) | 487 (6.8%) |
| 5 or more Vehicles | 78 (1.1%) | 120 (1.7%) |
| Total | 7,059 (100.0%) | 7,157 (100.0%) |
Commute Time in Elizabethtown
The most frequently occuring commute durations in Elizabethtown are 10 to 14 minutes (3,797 commuters, 27.7%), 5 to 9 minutes (2,719 commuters, 19.9%), and 15 to 19 minutes (1,714 commuters, 12.5%).
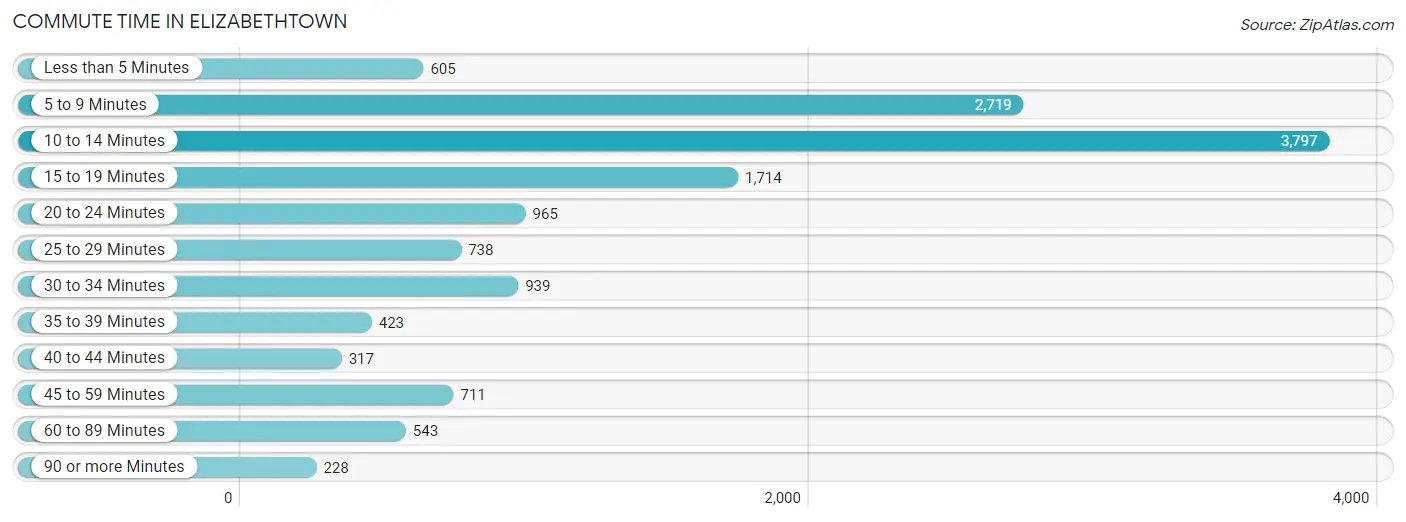
| Commute Time | # Commuters | % Commuters |
| Less than 5 Minutes | 605 | 4.4% |
| 5 to 9 Minutes | 2,719 | 19.9% |
| 10 to 14 Minutes | 3,797 | 27.7% |
| 15 to 19 Minutes | 1,714 | 12.5% |
| 20 to 24 Minutes | 965 | 7.0% |
| 25 to 29 Minutes | 738 | 5.4% |
| 30 to 34 Minutes | 939 | 6.9% |
| 35 to 39 Minutes | 423 | 3.1% |
| 40 to 44 Minutes | 317 | 2.3% |
| 45 to 59 Minutes | 711 | 5.2% |
| 60 to 89 Minutes | 543 | 4.0% |
| 90 or more Minutes | 228 | 1.7% |
Commute Time by Sex in Elizabethtown
The most common commute times in Elizabethtown are 10 to 14 minutes (1,838 commuters, 26.8%) for males and 10 to 14 minutes (1,959 commuters, 28.6%) for females.
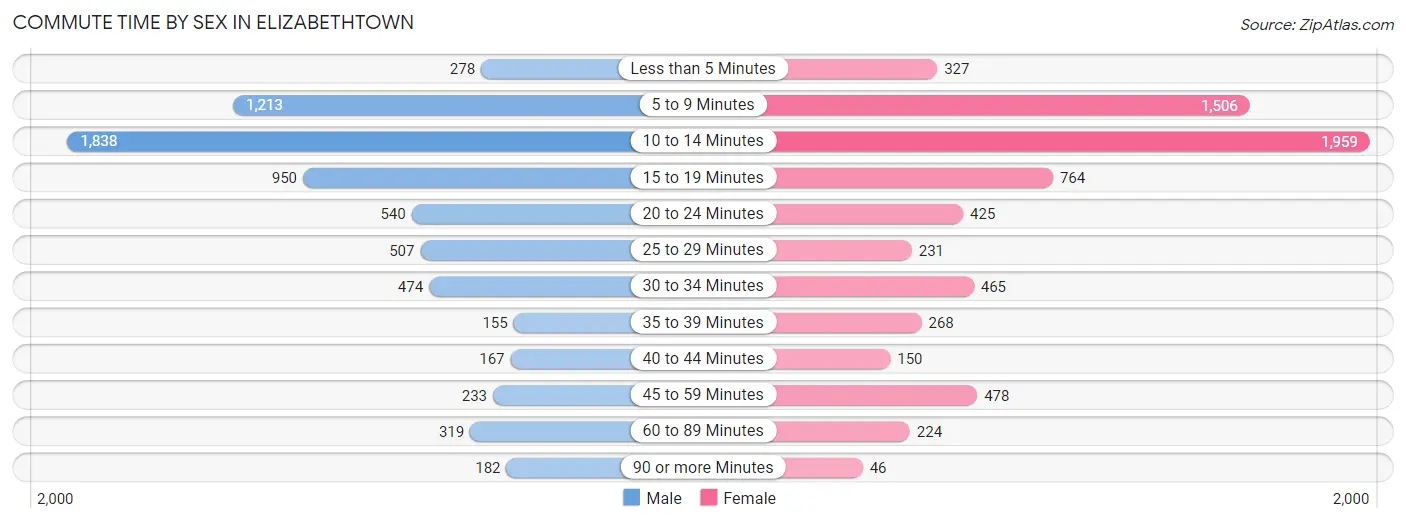
| Commute Time | Male | Female |
| Less than 5 Minutes | 278 (4.1%) | 327 (4.8%) |
| 5 to 9 Minutes | 1,213 (17.7%) | 1,506 (22.0%) |
| 10 to 14 Minutes | 1,838 (26.8%) | 1,959 (28.6%) |
| 15 to 19 Minutes | 950 (13.9%) | 764 (11.2%) |
| 20 to 24 Minutes | 540 (7.9%) | 425 (6.2%) |
| 25 to 29 Minutes | 507 (7.4%) | 231 (3.4%) |
| 30 to 34 Minutes | 474 (6.9%) | 465 (6.8%) |
| 35 to 39 Minutes | 155 (2.3%) | 268 (3.9%) |
| 40 to 44 Minutes | 167 (2.4%) | 150 (2.2%) |
| 45 to 59 Minutes | 233 (3.4%) | 478 (7.0%) |
| 60 to 89 Minutes | 319 (4.6%) | 224 (3.3%) |
| 90 or more Minutes | 182 (2.6%) | 46 (0.7%) |
Time of Departure to Work by Sex in Elizabethtown
The most frequent times of departure to work in Elizabethtown are 7:00 AM to 7:29 AM (1,273, 18.6%) for males and 7:00 AM to 7:29 AM (1,071, 15.7%) for females.
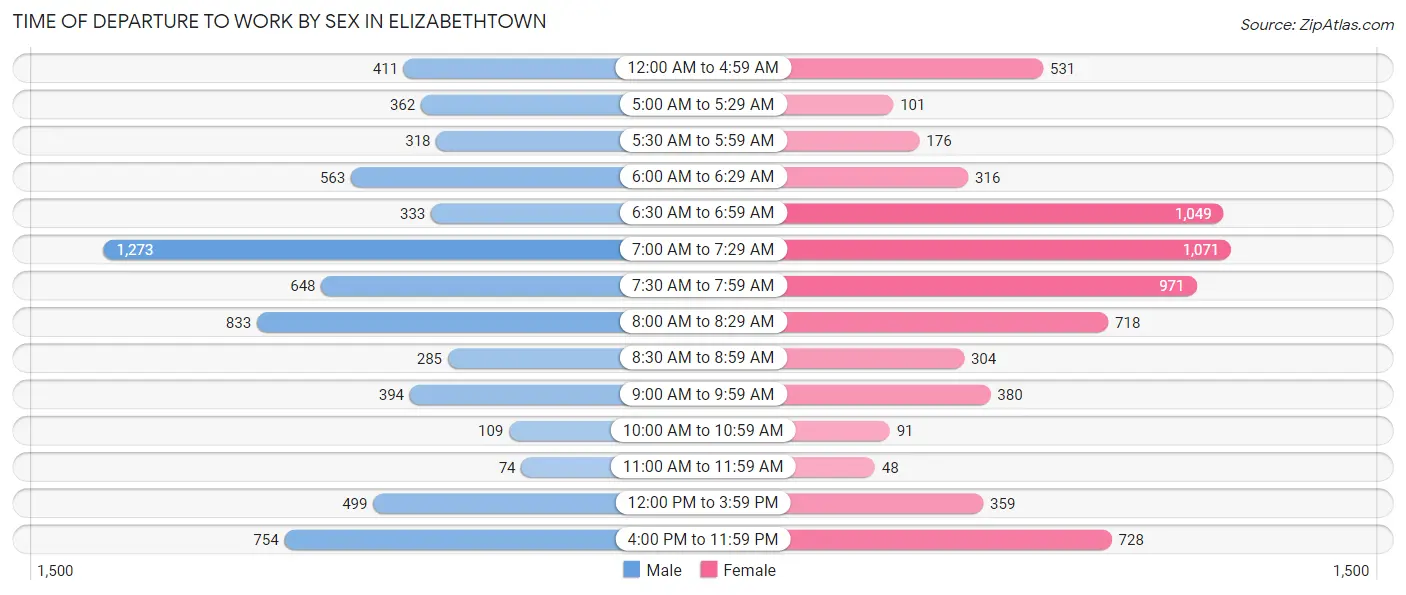
| Time of Departure | Male | Female |
| 12:00 AM to 4:59 AM | 411 (6.0%) | 531 (7.8%) |
| 5:00 AM to 5:29 AM | 362 (5.3%) | 101 (1.5%) |
| 5:30 AM to 5:59 AM | 318 (4.6%) | 176 (2.6%) |
| 6:00 AM to 6:29 AM | 563 (8.2%) | 316 (4.6%) |
| 6:30 AM to 6:59 AM | 333 (4.9%) | 1,049 (15.3%) |
| 7:00 AM to 7:29 AM | 1,273 (18.6%) | 1,071 (15.7%) |
| 7:30 AM to 7:59 AM | 648 (9.5%) | 971 (14.2%) |
| 8:00 AM to 8:29 AM | 833 (12.1%) | 718 (10.5%) |
| 8:30 AM to 8:59 AM | 285 (4.2%) | 304 (4.4%) |
| 9:00 AM to 9:59 AM | 394 (5.8%) | 380 (5.6%) |
| 10:00 AM to 10:59 AM | 109 (1.6%) | 91 (1.3%) |
| 11:00 AM to 11:59 AM | 74 (1.1%) | 48 (0.7%) |
| 12:00 PM to 3:59 PM | 499 (7.3%) | 359 (5.2%) |
| 4:00 PM to 11:59 PM | 754 (11.0%) | 728 (10.6%) |
| Total | 6,856 (100.0%) | 6,843 (100.0%) |
Housing Occupancy in Elizabethtown
Occupancy by Ownership in Elizabethtown
Of the total 13,463 dwellings in Elizabethtown, owner-occupied units account for 6,505 (48.3%), while renter-occupied units make up 6,958 (51.7%).
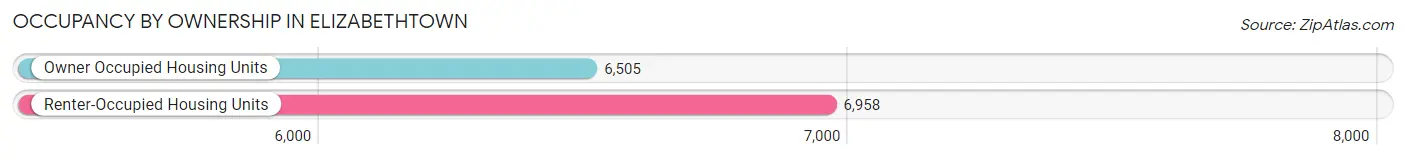
| Occupancy | # Housing Units | % Housing Units |
| Owner Occupied Housing Units | 6,505 | 48.3% |
| Renter-Occupied Housing Units | 6,958 | 51.7% |
| Total Occupied Housing Units | 13,463 | 100.0% |
Occupancy by Household Size in Elizabethtown
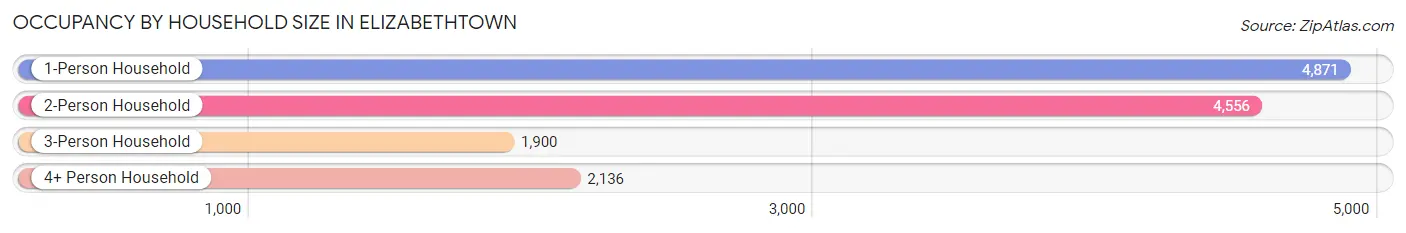
| Household Size | # Housing Units | % Housing Units |
| 1-Person Household | 4,871 | 36.2% |
| 2-Person Household | 4,556 | 33.8% |
| 3-Person Household | 1,900 | 14.1% |
| 4+ Person Household | 2,136 | 15.9% |
| Total Housing Units | 13,463 | 100.0% |
Occupancy by Ownership by Household Size in Elizabethtown
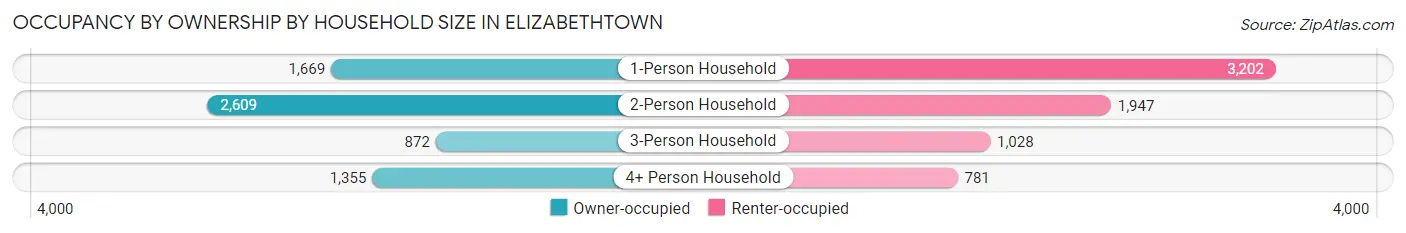
| Household Size | Owner-occupied | Renter-occupied |
| 1-Person Household | 1,669 (34.3%) | 3,202 (65.7%) |
| 2-Person Household | 2,609 (57.3%) | 1,947 (42.7%) |
| 3-Person Household | 872 (45.9%) | 1,028 (54.1%) |
| 4+ Person Household | 1,355 (63.4%) | 781 (36.6%) |
| Total Housing Units | 6,505 (48.3%) | 6,958 (51.7%) |
Occupancy by Educational Attainment in Elizabethtown
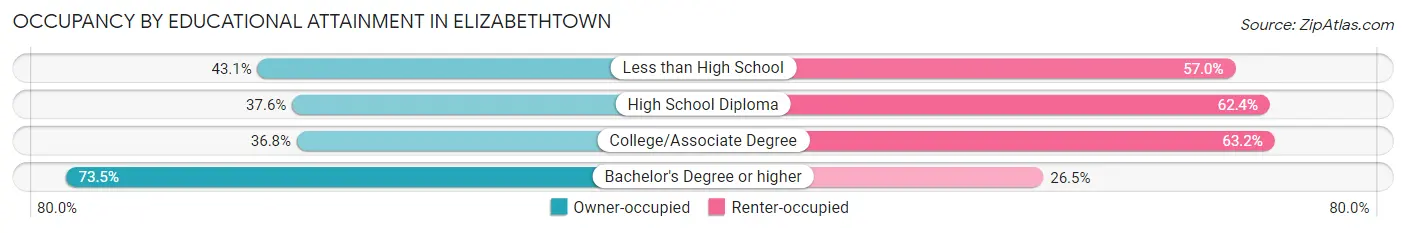
| Household Size | Owner-occupied | Renter-occupied |
| Less than High School | 409 (43.0%) | 541 (57.0%) |
| High School Diploma | 1,157 (37.6%) | 1,923 (62.4%) |
| College/Associate Degree | 2,001 (36.8%) | 3,434 (63.2%) |
| Bachelor's Degree or higher | 2,938 (73.5%) | 1,060 (26.5%) |
Occupancy by Age of Householder in Elizabethtown
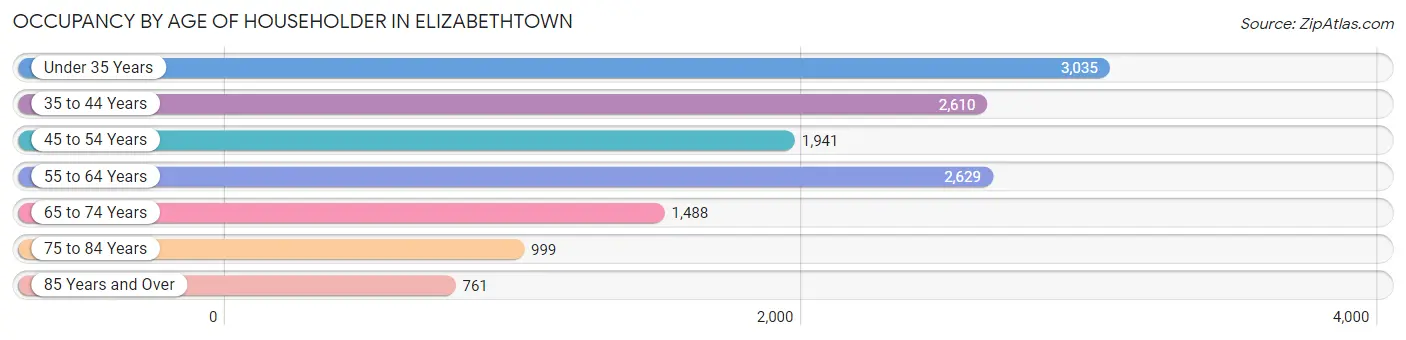
| Age Bracket | # Households | % Households |
| Under 35 Years | 3,035 | 22.5% |
| 35 to 44 Years | 2,610 | 19.4% |
| 45 to 54 Years | 1,941 | 14.4% |
| 55 to 64 Years | 2,629 | 19.5% |
| 65 to 74 Years | 1,488 | 11.1% |
| 75 to 84 Years | 999 | 7.4% |
| 85 Years and Over | 761 | 5.7% |
| Total | 13,463 | 100.0% |
Housing Finances in Elizabethtown
Median Income by Occupancy in Elizabethtown
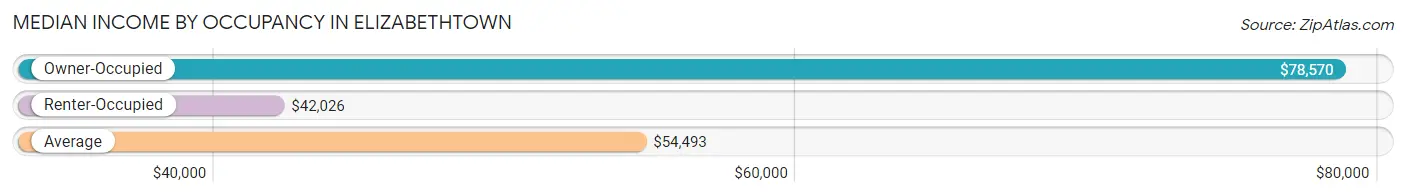
| Occupancy Type | # Households | Median Income |
| Owner-Occupied | 6,505 (48.3%) | $78,570 |
| Renter-Occupied | 6,958 (51.7%) | $42,026 |
| Average | 13,463 (100.0%) | $54,493 |
Occupancy by Householder Income Bracket in Elizabethtown
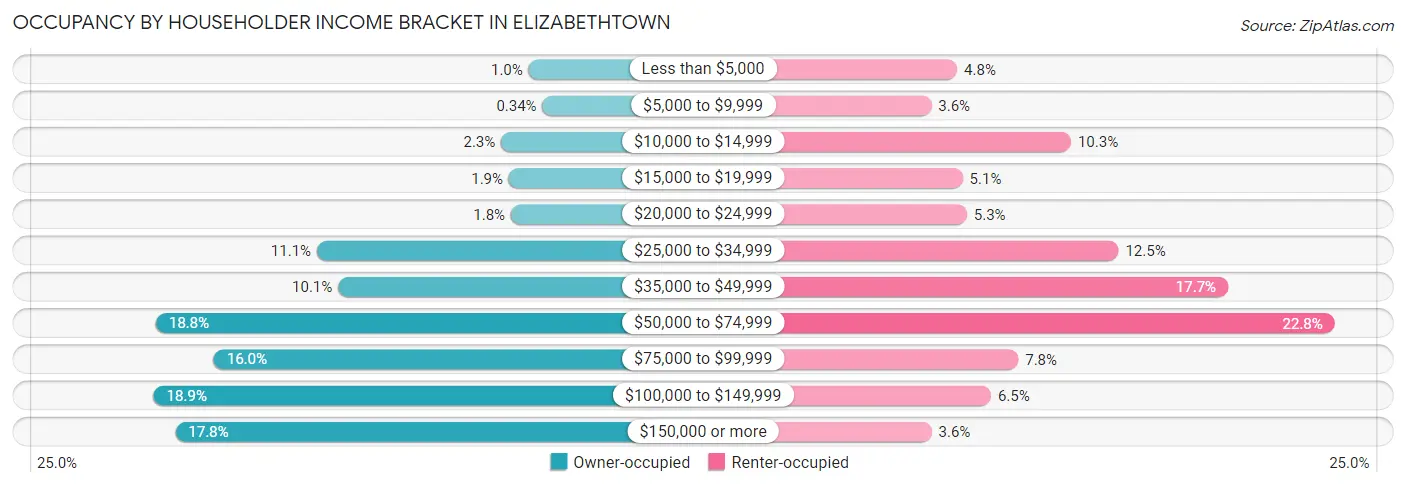
| Income Bracket | Owner-occupied | Renter-occupied |
| Less than $5,000 | 65 (1.0%) | 337 (4.8%) |
| $5,000 to $9,999 | 22 (0.3%) | 251 (3.6%) |
| $10,000 to $14,999 | 150 (2.3%) | 714 (10.3%) |
| $15,000 to $19,999 | 126 (1.9%) | 355 (5.1%) |
| $20,000 to $24,999 | 120 (1.8%) | 369 (5.3%) |
| $25,000 to $34,999 | 721 (11.1%) | 871 (12.5%) |
| $35,000 to $49,999 | 655 (10.1%) | 1,234 (17.7%) |
| $50,000 to $74,999 | 1,220 (18.8%) | 1,587 (22.8%) |
| $75,000 to $99,999 | 1,040 (16.0%) | 539 (7.7%) |
| $100,000 to $149,999 | 1,227 (18.9%) | 449 (6.5%) |
| $150,000 or more | 1,159 (17.8%) | 252 (3.6%) |
| Total | 6,505 (100.0%) | 6,958 (100.0%) |
Monthly Housing Cost Tiers in Elizabethtown
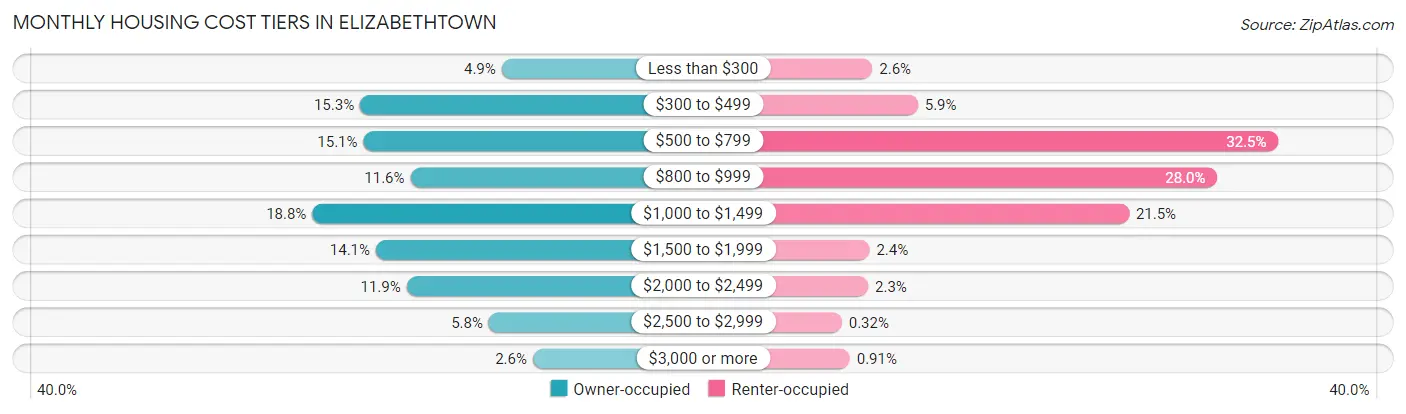
| Monthly Cost | Owner-occupied | Renter-occupied |
| Less than $300 | 317 (4.9%) | 179 (2.6%) |
| $300 to $499 | 995 (15.3%) | 412 (5.9%) |
| $500 to $799 | 979 (15.0%) | 2,259 (32.5%) |
| $800 to $999 | 754 (11.6%) | 1,947 (28.0%) |
| $1,000 to $1,499 | 1,224 (18.8%) | 1,494 (21.5%) |
| $1,500 to $1,999 | 919 (14.1%) | 164 (2.4%) |
| $2,000 to $2,499 | 772 (11.9%) | 157 (2.3%) |
| $2,500 to $2,999 | 378 (5.8%) | 22 (0.3%) |
| $3,000 or more | 167 (2.6%) | 63 (0.9%) |
| Total | 6,505 (100.0%) | 6,958 (100.0%) |
Physical Housing Characteristics in Elizabethtown
Housing Structures in Elizabethtown
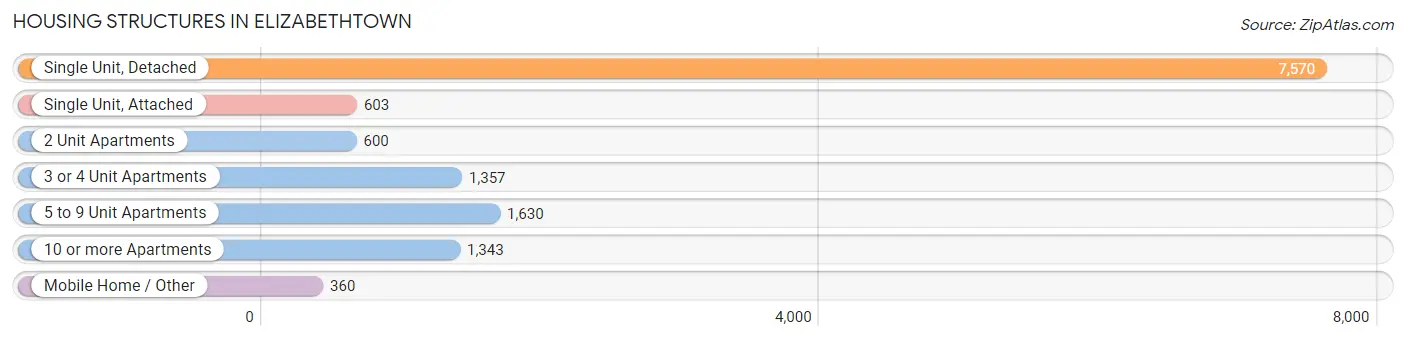
| Structure Type | # Housing Units | % Housing Units |
| Single Unit, Detached | 7,570 | 56.2% |
| Single Unit, Attached | 603 | 4.5% |
| 2 Unit Apartments | 600 | 4.5% |
| 3 or 4 Unit Apartments | 1,357 | 10.1% |
| 5 to 9 Unit Apartments | 1,630 | 12.1% |
| 10 or more Apartments | 1,343 | 10.0% |
| Mobile Home / Other | 360 | 2.7% |
| Total | 13,463 | 100.0% |
Housing Structures by Occupancy in Elizabethtown
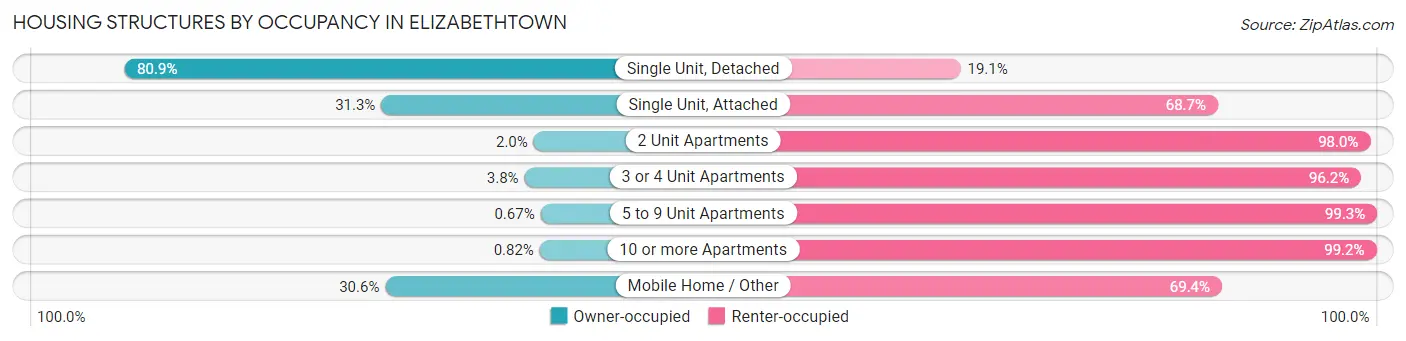
| Structure Type | Owner-occupied | Renter-occupied |
| Single Unit, Detached | 6,121 (80.9%) | 1,449 (19.1%) |
| Single Unit, Attached | 189 (31.3%) | 414 (68.7%) |
| 2 Unit Apartments | 12 (2.0%) | 588 (98.0%) |
| 3 or 4 Unit Apartments | 51 (3.8%) | 1,306 (96.2%) |
| 5 to 9 Unit Apartments | 11 (0.7%) | 1,619 (99.3%) |
| 10 or more Apartments | 11 (0.8%) | 1,332 (99.2%) |
| Mobile Home / Other | 110 (30.6%) | 250 (69.4%) |
| Total | 6,505 (48.3%) | 6,958 (51.7%) |
Housing Structures by Number of Rooms in Elizabethtown
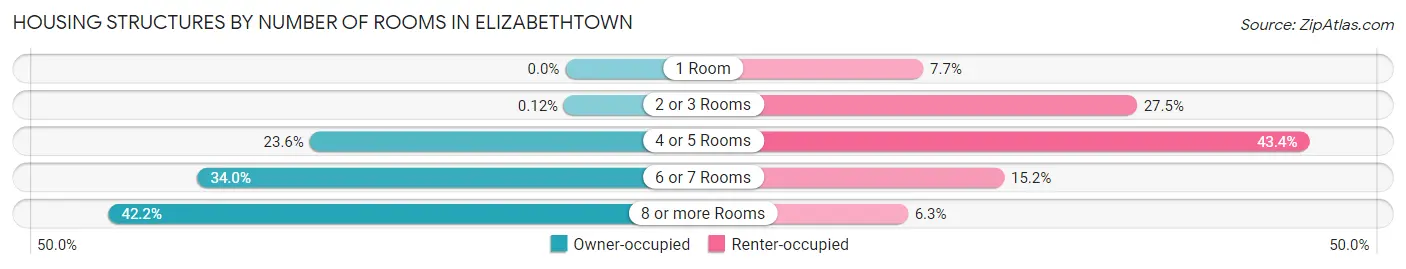
| Number of Rooms | Owner-occupied | Renter-occupied |
| 1 Room | 0 (0.0%) | 536 (7.7%) |
| 2 or 3 Rooms | 8 (0.1%) | 1,910 (27.5%) |
| 4 or 5 Rooms | 1,538 (23.6%) | 3,020 (43.4%) |
| 6 or 7 Rooms | 2,212 (34.0%) | 1,056 (15.2%) |
| 8 or more Rooms | 2,747 (42.2%) | 436 (6.3%) |
| Total | 6,505 (100.0%) | 6,958 (100.0%) |
Housing Structure by Heating Type in Elizabethtown
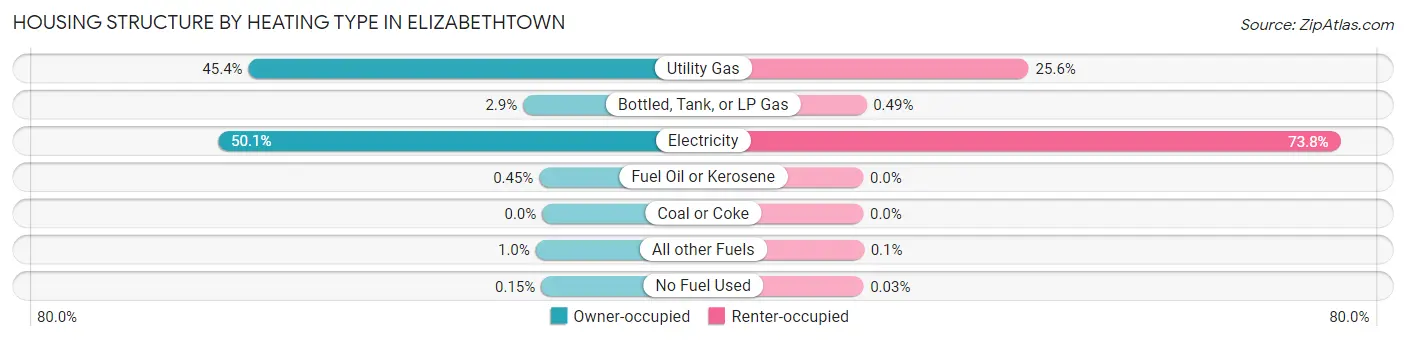
| Heating Type | Owner-occupied | Renter-occupied |
| Utility Gas | 2,953 (45.4%) | 1,781 (25.6%) |
| Bottled, Tank, or LP Gas | 191 (2.9%) | 34 (0.5%) |
| Electricity | 3,257 (50.1%) | 5,134 (73.8%) |
| Fuel Oil or Kerosene | 29 (0.4%) | 0 (0.0%) |
| Coal or Coke | 0 (0.0%) | 0 (0.0%) |
| All other Fuels | 65 (1.0%) | 7 (0.1%) |
| No Fuel Used | 10 (0.2%) | 2 (0.0%) |
| Total | 6,505 (100.0%) | 6,958 (100.0%) |
Household Vehicle Usage in Elizabethtown
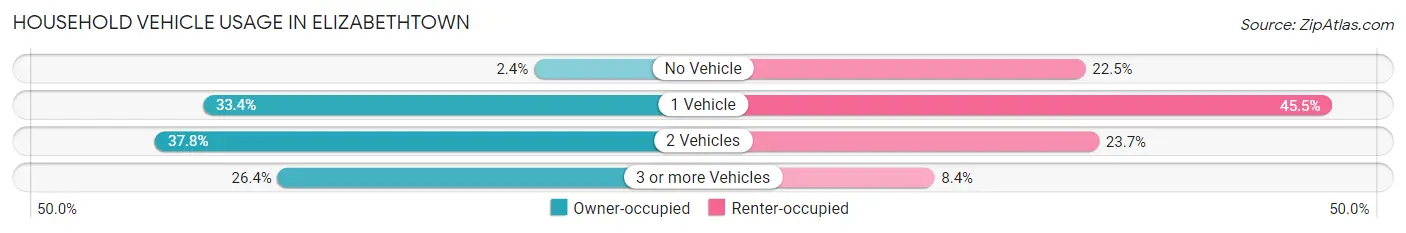
| Vehicles per Household | Owner-occupied | Renter-occupied |
| No Vehicle | 159 (2.4%) | 1,562 (22.5%) |
| 1 Vehicle | 2,170 (33.4%) | 3,165 (45.5%) |
| 2 Vehicles | 2,460 (37.8%) | 1,650 (23.7%) |
| 3 or more Vehicles | 1,716 (26.4%) | 581 (8.4%) |
| Total | 6,505 (100.0%) | 6,958 (100.0%) |
Real Estate & Mortgages in Elizabethtown
Real Estate and Mortgage Overview in Elizabethtown
| Characteristic | Without Mortgage | With Mortgage |
| Housing Units | 2,205 | 4,300 |
| Median Property Value | $192,500 | $217,700 |
| Median Household Income | $68,232 | $844 |
| Monthly Housing Costs | $464 | $167 |
| Real Estate Taxes | $1,487 | $106 |
Property Value by Mortgage Status in Elizabethtown
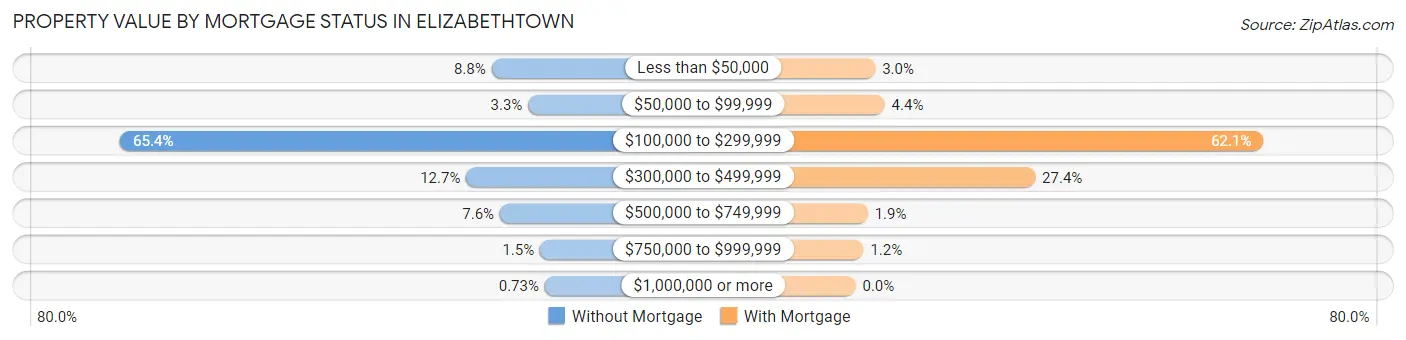
| Property Value | Without Mortgage | With Mortgage |
| Less than $50,000 | 195 (8.8%) | 129 (3.0%) |
| $50,000 to $99,999 | 72 (3.3%) | 191 (4.4%) |
| $100,000 to $299,999 | 1,443 (65.4%) | 2,671 (62.1%) |
| $300,000 to $499,999 | 280 (12.7%) | 1,177 (27.4%) |
| $500,000 to $749,999 | 167 (7.6%) | 80 (1.9%) |
| $750,000 to $999,999 | 32 (1.5%) | 52 (1.2%) |
| $1,000,000 or more | 16 (0.7%) | 0 (0.0%) |
| Total | 2,205 (100.0%) | 4,300 (100.0%) |
Household Income by Mortgage Status in Elizabethtown
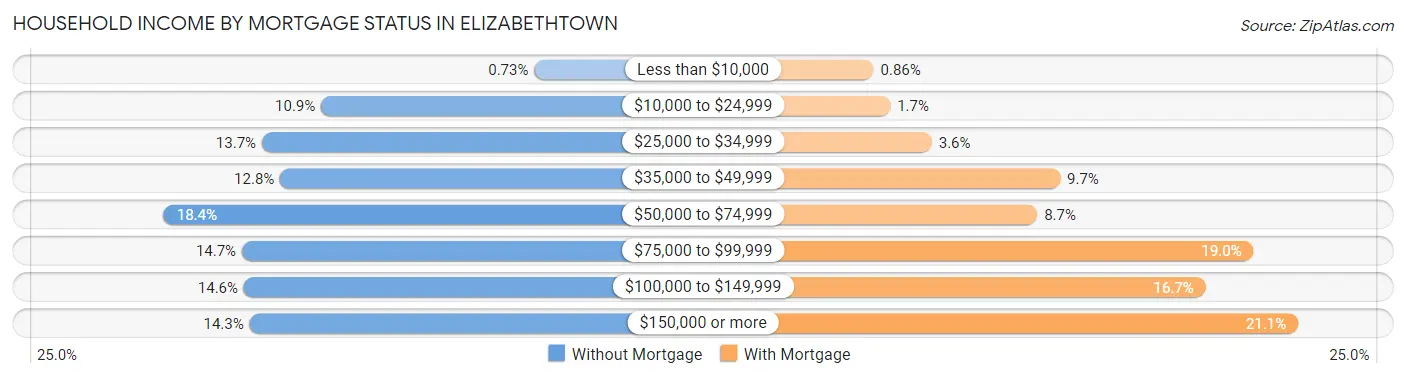
| Household Income | Without Mortgage | With Mortgage |
| Less than $10,000 | 16 (0.7%) | 37 (0.9%) |
| $10,000 to $24,999 | 240 (10.9%) | 71 (1.7%) |
| $25,000 to $34,999 | 302 (13.7%) | 156 (3.6%) |
| $35,000 to $49,999 | 283 (12.8%) | 419 (9.7%) |
| $50,000 to $74,999 | 405 (18.4%) | 372 (8.6%) |
| $75,000 to $99,999 | 323 (14.6%) | 815 (19.0%) |
| $100,000 to $149,999 | 321 (14.6%) | 717 (16.7%) |
| $150,000 or more | 315 (14.3%) | 906 (21.1%) |
| Total | 2,205 (100.0%) | 4,300 (100.0%) |
Property Value to Household Income Ratio in Elizabethtown
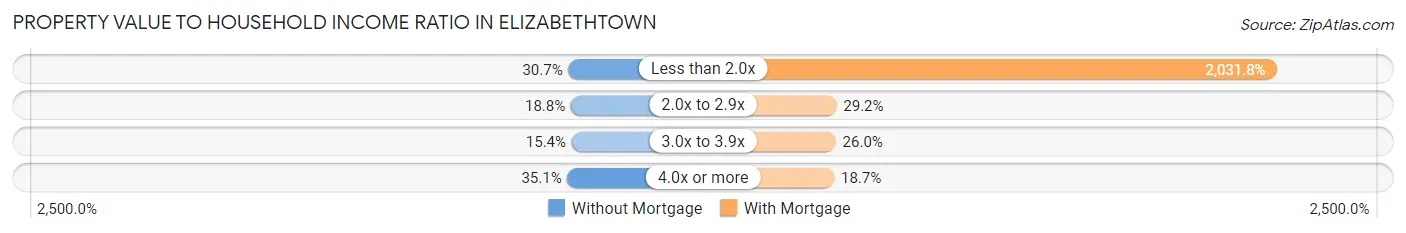
| Value-to-Income Ratio | Without Mortgage | With Mortgage |
| Less than 2.0x | 676 (30.7%) | 87,366 (2,031.8%) |
| 2.0x to 2.9x | 415 (18.8%) | 1,254 (29.2%) |
| 3.0x to 3.9x | 340 (15.4%) | 1,118 (26.0%) |
| 4.0x or more | 774 (35.1%) | 804 (18.7%) |
| Total | 2,205 (100.0%) | 4,300 (100.0%) |
Real Estate Taxes by Mortgage Status in Elizabethtown
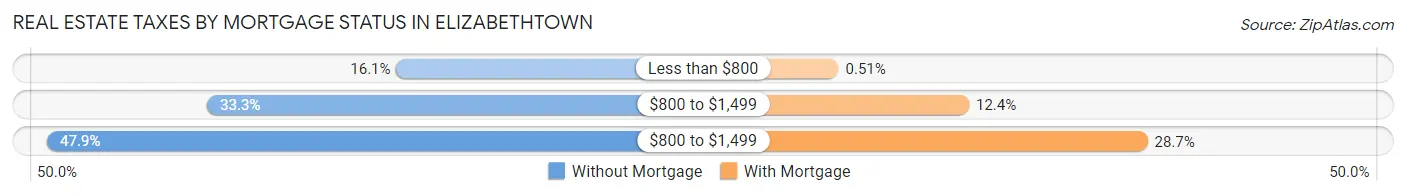
| Property Taxes | Without Mortgage | With Mortgage |
| Less than $800 | 354 (16.1%) | 22 (0.5%) |
| $800 to $1,499 | 735 (33.3%) | 534 (12.4%) |
| $800 to $1,499 | 1,057 (47.9%) | 1,235 (28.7%) |
| Total | 2,205 (100.0%) | 4,300 (100.0%) |
Health & Disability in Elizabethtown
Health Insurance Coverage by Age in Elizabethtown
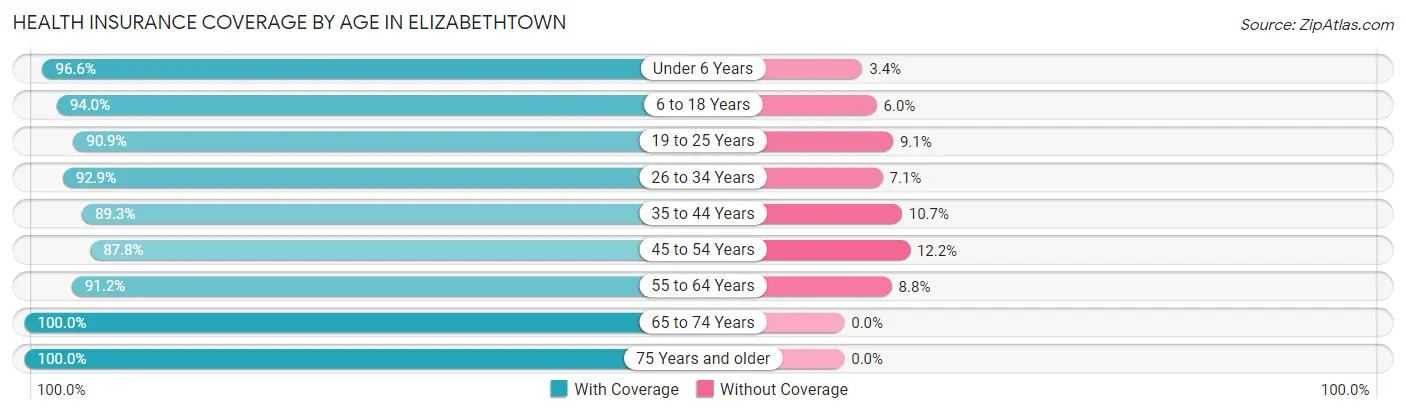
| Age Bracket | With Coverage | Without Coverage |
| Under 6 Years | 2,102 (96.6%) | 73 (3.4%) |
| 6 to 18 Years | 5,262 (94.0%) | 337 (6.0%) |
| 19 to 25 Years | 2,513 (90.9%) | 251 (9.1%) |
| 26 to 34 Years | 3,279 (92.9%) | 252 (7.1%) |
| 35 to 44 Years | 4,116 (89.3%) | 494 (10.7%) |
| 45 to 54 Years | 2,905 (87.8%) | 405 (12.2%) |
| 55 to 64 Years | 3,458 (91.2%) | 335 (8.8%) |
| 65 to 74 Years | 2,111 (100.0%) | 0 (0.0%) |
| 75 Years and older | 2,321 (100.0%) | 0 (0.0%) |
| Total | 28,067 (92.9%) | 2,147 (7.1%) |
Health Insurance Coverage by Citizenship Status in Elizabethtown
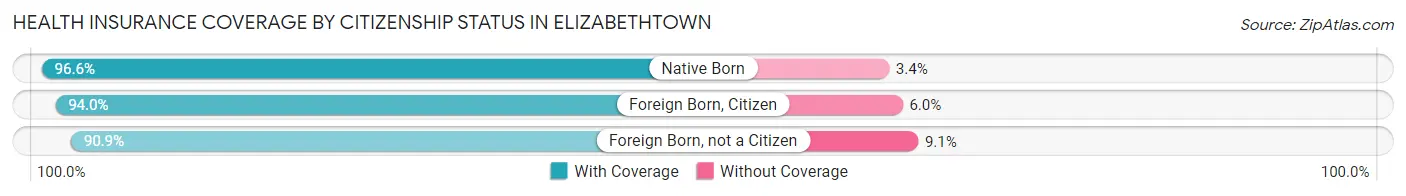
| Citizenship Status | With Coverage | Without Coverage |
| Native Born | 2,102 (96.6%) | 73 (3.4%) |
| Foreign Born, Citizen | 5,262 (94.0%) | 337 (6.0%) |
| Foreign Born, not a Citizen | 2,513 (90.9%) | 251 (9.1%) |
Health Insurance Coverage by Household Income in Elizabethtown
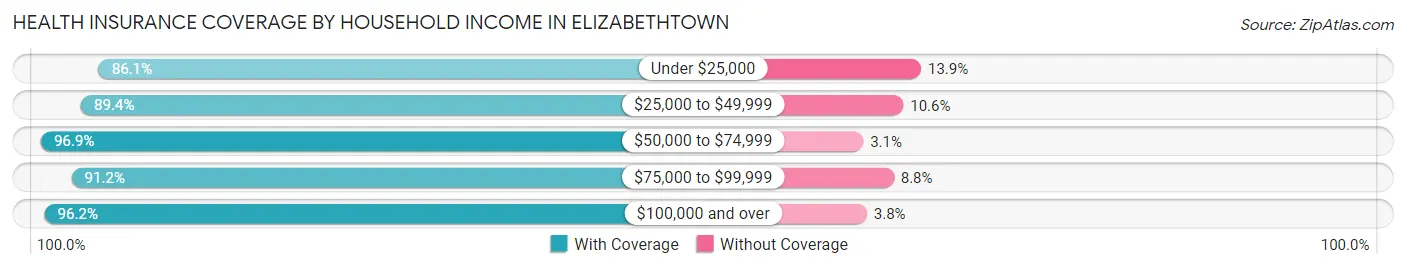
| Household Income | With Coverage | Without Coverage |
| Under $25,000 | 3,273 (86.1%) | 529 (13.9%) |
| $25,000 to $49,999 | 5,848 (89.4%) | 692 (10.6%) |
| $50,000 to $74,999 | 6,065 (96.9%) | 193 (3.1%) |
| $75,000 to $99,999 | 4,074 (91.2%) | 393 (8.8%) |
| $100,000 and over | 8,656 (96.2%) | 338 (3.8%) |
Public vs Private Health Insurance Coverage by Age in Elizabethtown
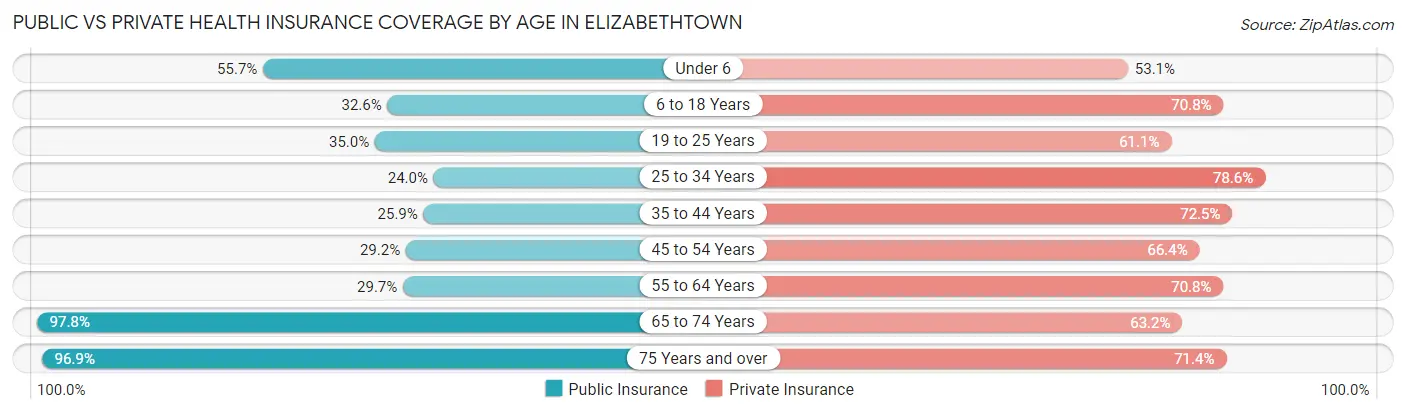
| Age Bracket | Public Insurance | Private Insurance |
| Under 6 | 1,212 (55.7%) | 1,155 (53.1%) |
| 6 to 18 Years | 1,827 (32.6%) | 3,966 (70.8%) |
| 19 to 25 Years | 966 (34.9%) | 1,690 (61.1%) |
| 25 to 34 Years | 849 (24.0%) | 2,774 (78.6%) |
| 35 to 44 Years | 1,196 (25.9%) | 3,341 (72.5%) |
| 45 to 54 Years | 967 (29.2%) | 2,198 (66.4%) |
| 55 to 64 Years | 1,128 (29.7%) | 2,686 (70.8%) |
| 65 to 74 Years | 2,064 (97.8%) | 1,334 (63.2%) |
| 75 Years and over | 2,248 (96.9%) | 1,656 (71.4%) |
| Total | 12,457 (41.2%) | 20,800 (68.8%) |
Disability Status by Sex by Age in Elizabethtown
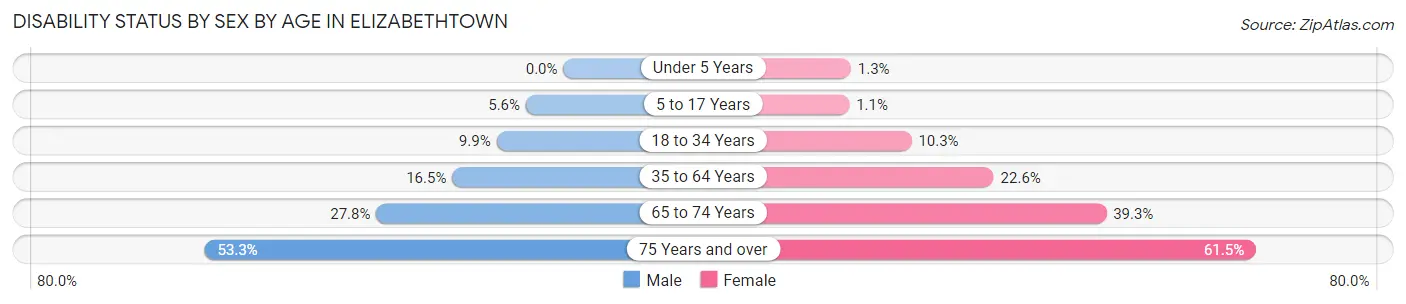
| Age Bracket | Male | Female |
| Under 5 Years | 0 (0.0%) | 13 (1.3%) |
| 5 to 17 Years | 154 (5.6%) | 30 (1.1%) |
| 18 to 34 Years | 302 (9.9%) | 380 (10.3%) |
| 35 to 64 Years | 937 (16.5%) | 1,361 (22.6%) |
| 65 to 74 Years | 258 (27.8%) | 464 (39.3%) |
| 75 Years and over | 413 (53.3%) | 951 (61.5%) |
Disability Class by Sex by Age in Elizabethtown
Disability Class: Hearing Difficulty
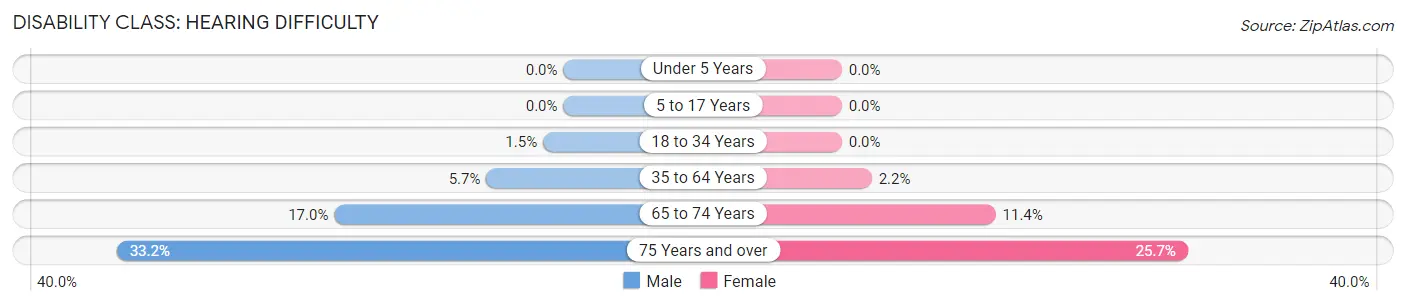
| Age Bracket | Male | Female |
| Under 5 Years | 0 (0.0%) | 0 (0.0%) |
| 5 to 17 Years | 0 (0.0%) | 0 (0.0%) |
| 18 to 34 Years | 46 (1.5%) | 0 (0.0%) |
| 35 to 64 Years | 325 (5.7%) | 134 (2.2%) |
| 65 to 74 Years | 158 (17.0%) | 135 (11.4%) |
| 75 Years and over | 257 (33.2%) | 397 (25.7%) |
Disability Class: Vision Difficulty
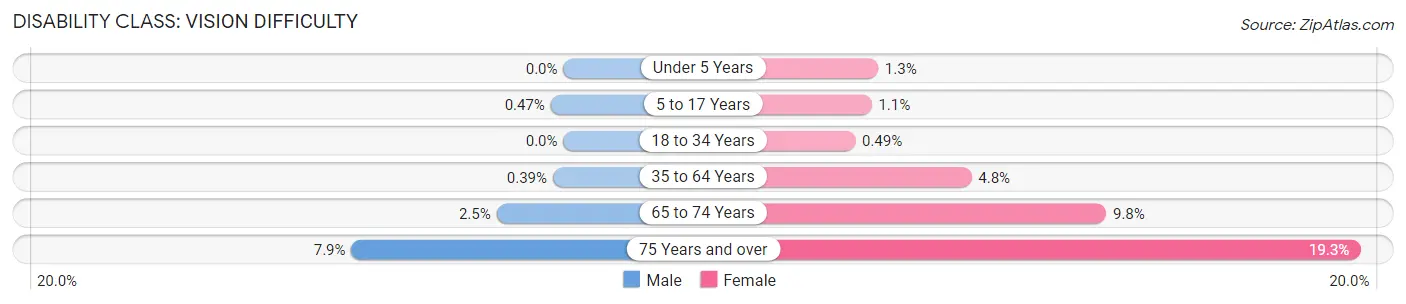
| Age Bracket | Male | Female |
| Under 5 Years | 0 (0.0%) | 13 (1.3%) |
| 5 to 17 Years | 13 (0.5%) | 30 (1.1%) |
| 18 to 34 Years | 0 (0.0%) | 18 (0.5%) |
| 35 to 64 Years | 22 (0.4%) | 290 (4.8%) |
| 65 to 74 Years | 23 (2.5%) | 116 (9.8%) |
| 75 Years and over | 61 (7.9%) | 298 (19.3%) |
Disability Class: Cognitive Difficulty
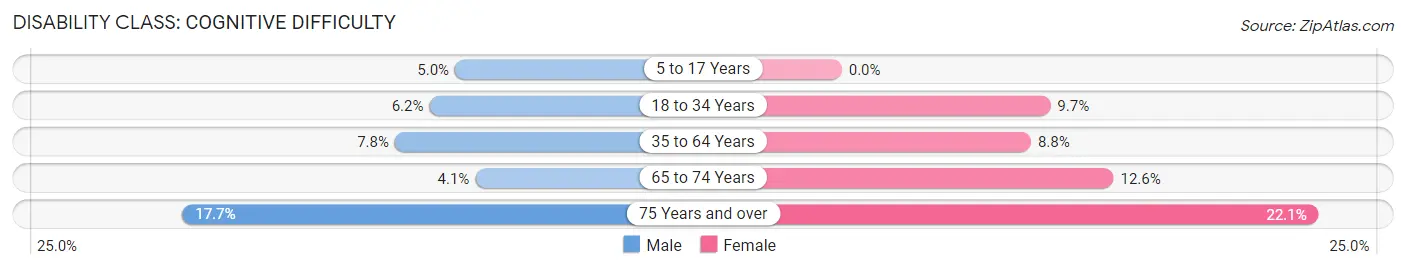
| Age Bracket | Male | Female |
| 5 to 17 Years | 139 (5.0%) | 0 (0.0%) |
| 18 to 34 Years | 189 (6.2%) | 356 (9.7%) |
| 35 to 64 Years | 444 (7.8%) | 530 (8.8%) |
| 65 to 74 Years | 38 (4.1%) | 149 (12.6%) |
| 75 Years and over | 137 (17.7%) | 342 (22.1%) |
Disability Class: Ambulatory Difficulty
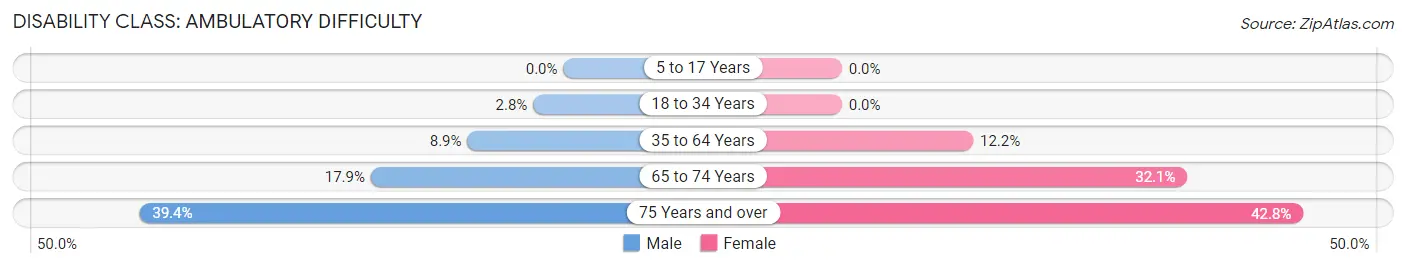
| Age Bracket | Male | Female |
| 5 to 17 Years | 0 (0.0%) | 0 (0.0%) |
| 18 to 34 Years | 85 (2.8%) | 0 (0.0%) |
| 35 to 64 Years | 506 (8.9%) | 735 (12.2%) |
| 65 to 74 Years | 166 (17.9%) | 379 (32.1%) |
| 75 Years and over | 305 (39.4%) | 662 (42.8%) |
Disability Class: Self-Care Difficulty
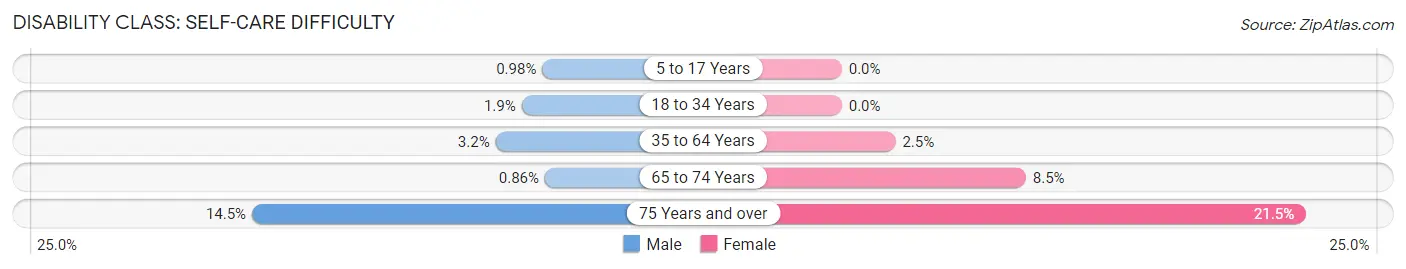
| Age Bracket | Male | Female |
| 5 to 17 Years | 27 (1.0%) | 0 (0.0%) |
| 18 to 34 Years | 59 (1.9%) | 0 (0.0%) |
| 35 to 64 Years | 179 (3.2%) | 150 (2.5%) |
| 65 to 74 Years | 8 (0.9%) | 101 (8.5%) |
| 75 Years and over | 112 (14.4%) | 333 (21.5%) |
Technology Access in Elizabethtown
Computing Device Access in Elizabethtown
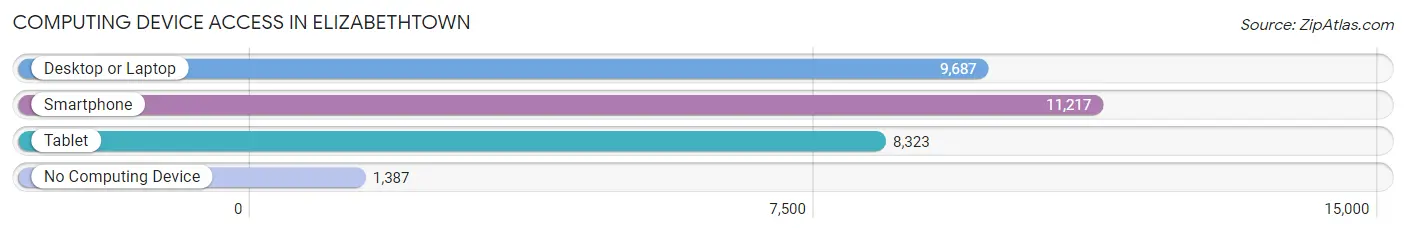
| Device Type | # Households | % Households |
| Desktop or Laptop | 9,687 | 72.0% |
| Smartphone | 11,217 | 83.3% |
| Tablet | 8,323 | 61.8% |
| No Computing Device | 1,387 | 10.3% |
| Total | 13,463 | 100.0% |
Internet Access in Elizabethtown
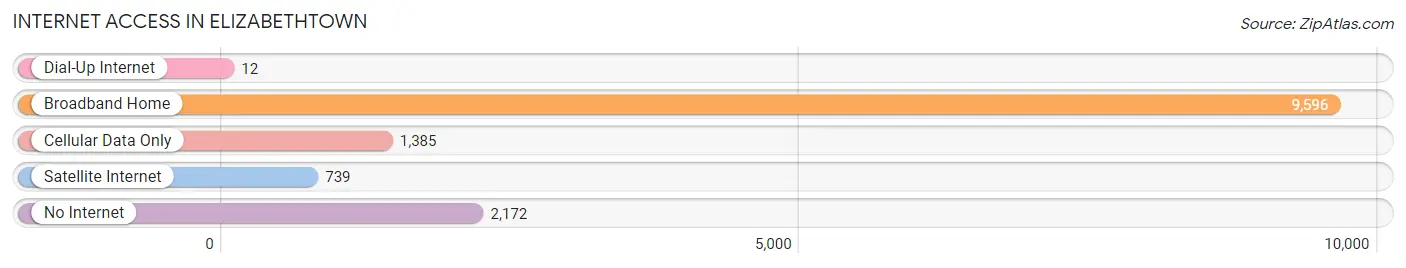
| Internet Type | # Households | % Households |
| Dial-Up Internet | 12 | 0.1% |
| Broadband Home | 9,596 | 71.3% |
| Cellular Data Only | 1,385 | 10.3% |
| Satellite Internet | 739 | 5.5% |
| No Internet | 2,172 | 16.1% |
| Total | 13,463 | 100.0% |
Elizabethtown Summary
Elizabethtown, Kentucky is a city located in Hardin County, Kentucky. It is the county seat of Hardin County and is located just south of Louisville. The city is home to a population of 28,531 people, according to the 2010 census.
History
Elizabethtown was founded in 1793 by Colonel Andrew Hynes, a Revolutionary War veteran. The city was named after his wife, Elizabeth, and was originally known as Hynes Town. The city was incorporated in 1827 and was the first city in Hardin County.
In the early 19th century, Elizabethtown was a major stop on the stagecoach route between Louisville and Nashville. The city was also a major stop on the Louisville and Nashville Railroad, which was completed in 1859.
The city was the site of a major Civil War battle in 1862, when Confederate forces under General Braxton Bragg attempted to take the city from Union forces. The Union forces were successful in defending the city and the battle is now known as the Battle of Elizabethtown.
Geography
Elizabethtown is located in central Hardin County, in the western part of the state. The city is situated at the intersection of Interstate 65 and U.S. Route 62. The city is located about 40 miles south of Louisville and about 60 miles north of Nashville.
The city is located in a hilly region of the state, with the highest point in the city being the Elizabethtown Hill, which is located at an elevation of 845 feet. The city is located in the Central Kentucky Uplands region, which is characterized by rolling hills and limestone outcroppings.
The city is located in the Central Hardin County watershed, which is part of the larger Ohio River watershed. The city is located along the Nolin River, which is a tributary of the Ohio River.
Economy
Elizabethtown is the economic center of Hardin County and the surrounding region. The city is home to a number of major employers, including the Elizabethtown Community and Technical College, the Elizabethtown Independent School District, and the Elizabethtown Regional Medical Center.
The city is also home to a number of manufacturing companies, including the Elizabethtown Manufacturing Company, which produces automotive parts, and the Elizabethtown Glass Company, which produces glass products.
The city is also home to a number of retail stores, including the Elizabethtown Mall, which is the largest shopping mall in the region.
Demographics
According to the 2010 census, the population of Elizabethtown was 28,531. The city has a population that is predominantly white (86.3%), with smaller percentages of African Americans (7.3%), Hispanics (3.2%), and Asians (1.2%).
The median household income in the city is $41,945, and the median home value is $133,400. The city has a poverty rate of 17.3%, which is higher than the national average.
Conclusion
Elizabethtown, Kentucky is a city located in Hardin County, Kentucky. It is the county seat of Hardin County and is located just south of Louisville. The city is home to a population of 28,531 people, according to the 2010 census. The city was founded in 1793 and was the site of a major Civil War battle in 1862. The city is located in a hilly region of the state and is the economic center of Hardin County and the surrounding region. The population of the city is predominantly white, with smaller percentages of African Americans, Hispanics, and Asians. The median household income in the city is $41,945, and the median home value is $133,400.
Common Questions
What is Per Capita Income in Elizabethtown?
Per Capita income in Elizabethtown is $34,216.
What is the Median Family Income in Elizabethtown?
Median Family Income in Elizabethtown is $73,527.
What is the Median Household income in Elizabethtown?
Median Household Income in Elizabethtown is $54,493.
What is Income or Wage Gap in Elizabethtown?
Income or Wage Gap in Elizabethtown is 22.8%.
Women in Elizabethtown earn 77.2 cents for every dollar earned by a man.
What is Inequality or Gini Index in Elizabethtown?
Inequality or Gini Index in Elizabethtown is 0.47.
What is the Total Population of Elizabethtown?
Total Population of Elizabethtown is 31,425.
What is the Total Male Population of Elizabethtown?
Total Male Population of Elizabethtown is 14,867.
What is the Total Female Population of Elizabethtown?
Total Female Population of Elizabethtown is 16,558.
What is the Ratio of Males per 100 Females in Elizabethtown?
There are 89.79 Males per 100 Females in Elizabethtown.
What is the Ratio of Females per 100 Males in Elizabethtown?
There are 111.37 Females per 100 Males in Elizabethtown.
What is the Median Population Age in Elizabethtown?
Median Population Age in Elizabethtown is 37.4 Years.
What is the Average Family Size in Elizabethtown
Average Family Size in Elizabethtown is 2.9 People.
What is the Average Household Size in Elizabethtown
Average Household Size in Elizabethtown is 2.2 People.
How Large is the Labor Force in Elizabethtown?
There are 15,281 People in the Labor Forcein in Elizabethtown.
What is the Percentage of People in the Labor Force in Elizabethtown?
61.7% of People are in the Labor Force in Elizabethtown.
What is the Unemployment Rate in Elizabethtown?
Unemployment Rate in Elizabethtown is 5.8%.