Marietta, GA Map & Demographics
Marietta Map
Marietta Overview
$40,767
PER CAPITA INCOME
$83,282
AVG FAMILY INCOME
$67,589
AVG HOUSEHOLD INCOME
12.5%
WAGE / INCOME GAP [ % ]
87.5¢/ $1
WAGE / INCOME GAP [ $ ]
$10,231
FAMILY INCOME DEFICIT
0.48
INEQUALITY / GINI INDEX
61,387
TOTAL POPULATION
29,914
MALE POPULATION
31,473
FEMALE POPULATION
95.05
MALES / 100 FEMALES
105.21
FEMALES / 100 MALES
35.2
MEDIAN AGE
3.1
AVG FAMILY SIZE
2.4
AVG HOUSEHOLD SIZE
33,704
LABOR FORCE [ PEOPLE ]
67.9%
PERCENT IN LABOR FORCE
3.4%
UNEMPLOYMENT RATE
Income in Marietta
Income Overview in Marietta
Per Capita Income in Marietta is $40,767, while median incomes of families and households are $83,282 and $67,589 respectively.
| Characteristic | Number | Measure |
| Per Capita Income | 61,387 | $40,767 |
| Median Family Income | 13,960 | $83,282 |
| Mean Family Income | 13,960 | $120,058 |
| Median Household Income | 24,403 | $67,589 |
| Mean Household Income | 24,403 | $99,812 |
| Income Deficit | 13,960 | $10,231 |
| Wage / Income Gap (%) | 61,387 | 12.48% |
| Wage / Income Gap ($) | 61,387 | 87.52¢ per $1 |
| Gini / Inequality Index | 61,387 | 0.48 |
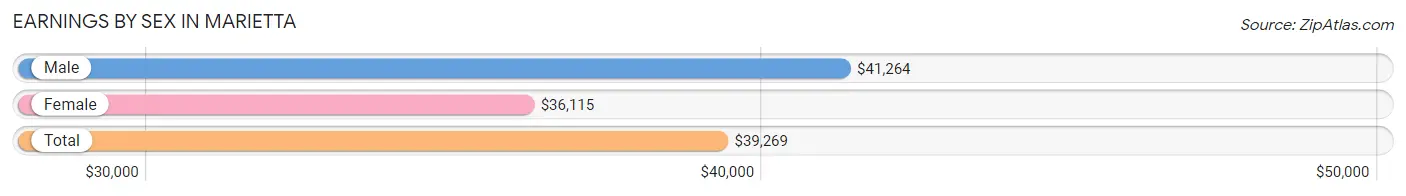
Earnings by Sex in Marietta
Average Earnings in Marietta are $39,269, $41,264 for men and $36,115 for women, a difference of 12.5%.
| Sex | Number | Average Earnings |
| Male | 18,695 (53.0%) | $41,264 |
| Female | 16,604 (47.0%) | $36,115 |
| Total | 35,299 (100.0%) | $39,269 |
Earnings by Sex by Income Bracket in Marietta
The most common earnings brackets in Marietta are $100,000+ for men (3,475 | 18.6%) and $100,000+ for women (1,709 | 10.3%).
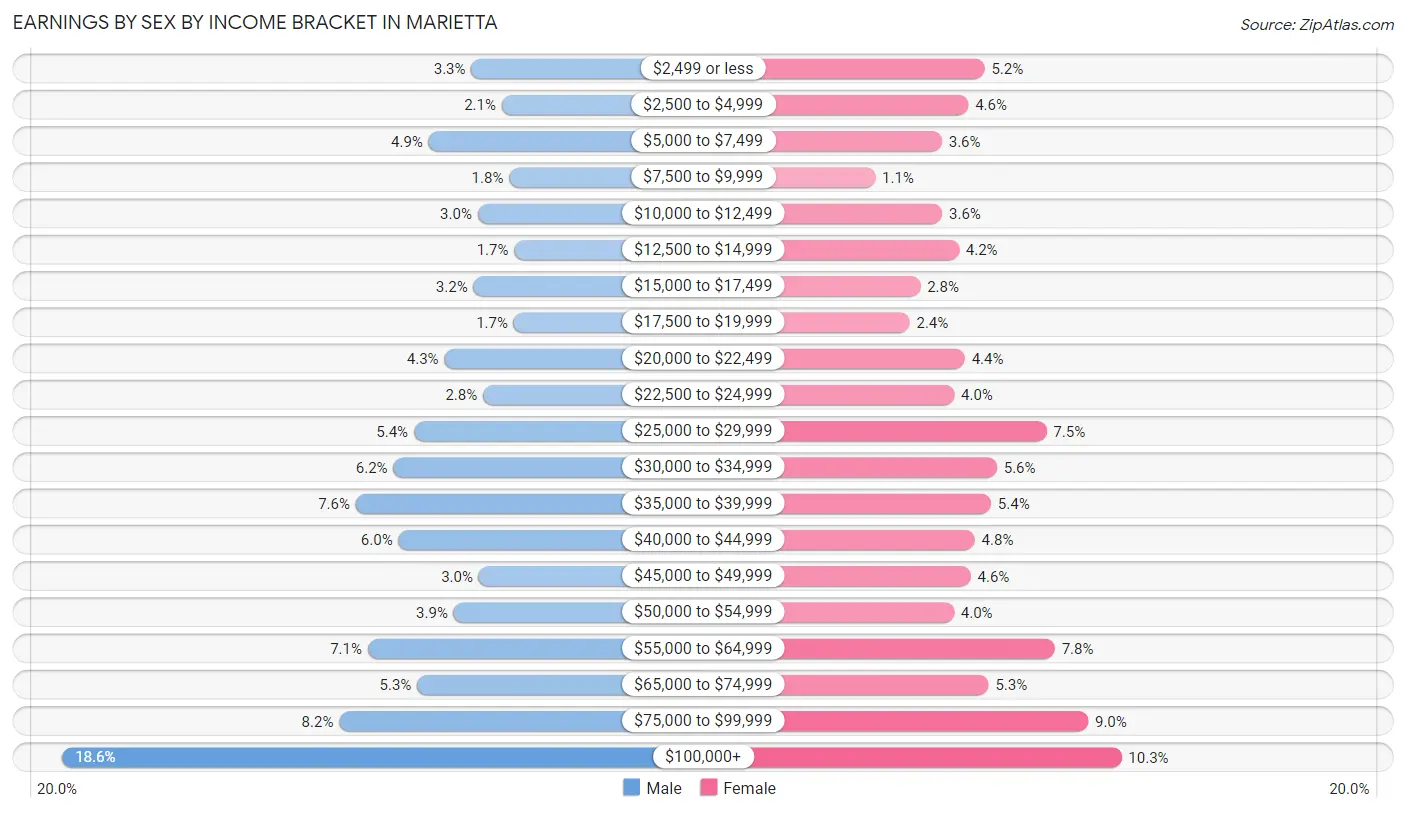
| Income | Male | Female |
| $2,499 or less | 609 (3.3%) | 856 (5.2%) |
| $2,500 to $4,999 | 397 (2.1%) | 755 (4.5%) |
| $5,000 to $7,499 | 909 (4.9%) | 591 (3.6%) |
| $7,500 to $9,999 | 344 (1.8%) | 176 (1.1%) |
| $10,000 to $12,499 | 565 (3.0%) | 592 (3.6%) |
| $12,500 to $14,999 | 308 (1.7%) | 697 (4.2%) |
| $15,000 to $17,499 | 595 (3.2%) | 457 (2.8%) |
| $17,500 to $19,999 | 313 (1.7%) | 390 (2.4%) |
| $20,000 to $22,499 | 799 (4.3%) | 734 (4.4%) |
| $22,500 to $24,999 | 528 (2.8%) | 668 (4.0%) |
| $25,000 to $29,999 | 1,011 (5.4%) | 1,242 (7.5%) |
| $30,000 to $34,999 | 1,155 (6.2%) | 933 (5.6%) |
| $35,000 to $39,999 | 1,419 (7.6%) | 896 (5.4%) |
| $40,000 to $44,999 | 1,120 (6.0%) | 796 (4.8%) |
| $45,000 to $49,999 | 557 (3.0%) | 771 (4.6%) |
| $50,000 to $54,999 | 733 (3.9%) | 665 (4.0%) |
| $55,000 to $64,999 | 1,335 (7.1%) | 1,293 (7.8%) |
| $65,000 to $74,999 | 989 (5.3%) | 882 (5.3%) |
| $75,000 to $99,999 | 1,534 (8.2%) | 1,501 (9.0%) |
| $100,000+ | 3,475 (18.6%) | 1,709 (10.3%) |
| Total | 18,695 (100.0%) | 16,604 (100.0%) |
Earnings by Sex by Educational Attainment in Marietta
Average earnings in Marietta are $50,924 for men and $43,550 for women, a difference of 14.5%. Men with an educational attainment of graduate degree enjoy the highest average annual earnings of $106,149, while those with less than high school education earn the least with $31,062. Women with an educational attainment of graduate degree earn the most with the average annual earnings of $63,519, while those with high school diploma education have the smallest earnings of $24,696.
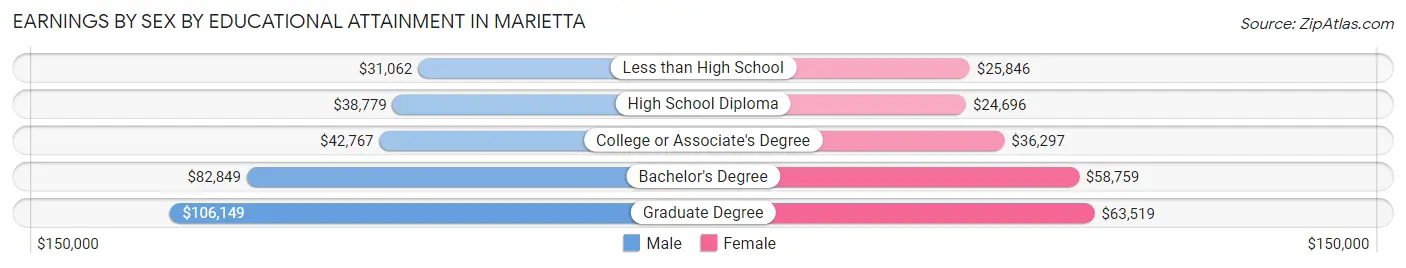
| Educational Attainment | Male Income | Female Income |
| Less than High School | $31,062 | $25,846 |
| High School Diploma | $38,779 | $24,696 |
| College or Associate's Degree | $42,767 | $36,297 |
| Bachelor's Degree | $82,849 | $58,759 |
| Graduate Degree | $106,149 | $63,519 |
| Total | $50,924 | $43,550 |
Family Income in Marietta
Family Income Brackets in Marietta
According to the Marietta family income data, there are 2,708 families falling into the $200,000+ income range, which is the most common income bracket and makes up 19.4% of all families. Conversely, the $10,000 to $14,999 income bracket is the least frequent group with only 419 families (3.0%) belonging to this category.
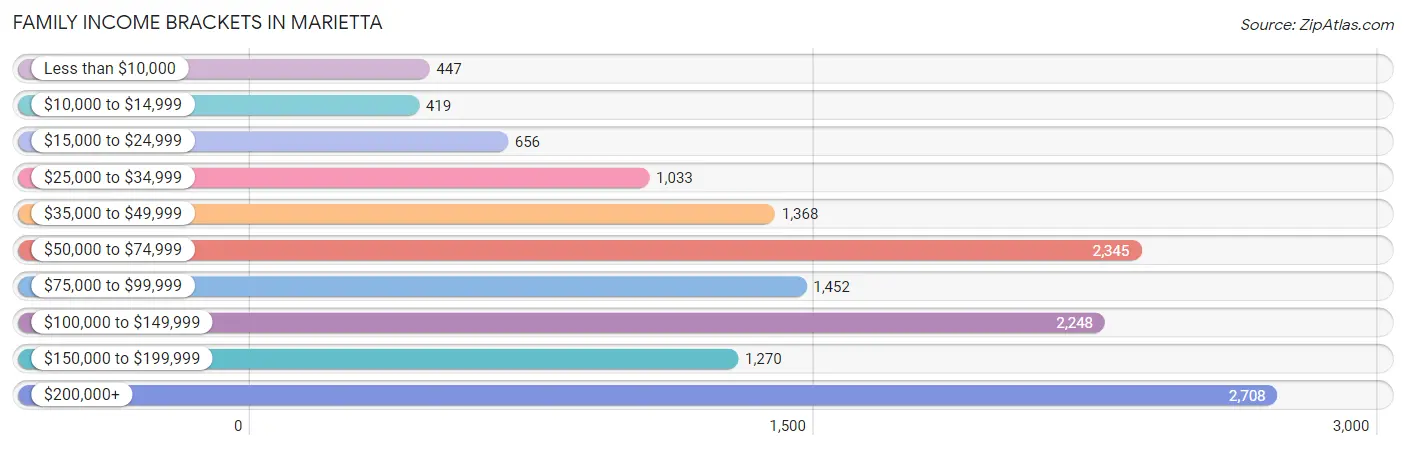
| Income Bracket | # Families | % Families |
| Less than $10,000 | 447 | 3.2% |
| $10,000 to $14,999 | 419 | 3.0% |
| $15,000 to $24,999 | 656 | 4.7% |
| $25,000 to $34,999 | 1,033 | 7.4% |
| $35,000 to $49,999 | 1,368 | 9.8% |
| $50,000 to $74,999 | 2,345 | 16.8% |
| $75,000 to $99,999 | 1,452 | 10.4% |
| $100,000 to $149,999 | 2,248 | 16.1% |
| $150,000 to $199,999 | 1,270 | 9.1% |
| $200,000+ | 2,708 | 19.4% |
Family Income by Famaliy Size in Marietta
5-person families (1,071 | 7.7%) account for the highest median family income in Marietta with $124,484 per family, while 2-person families (6,768 | 48.5%) have the highest median income of $40,831 per family member.
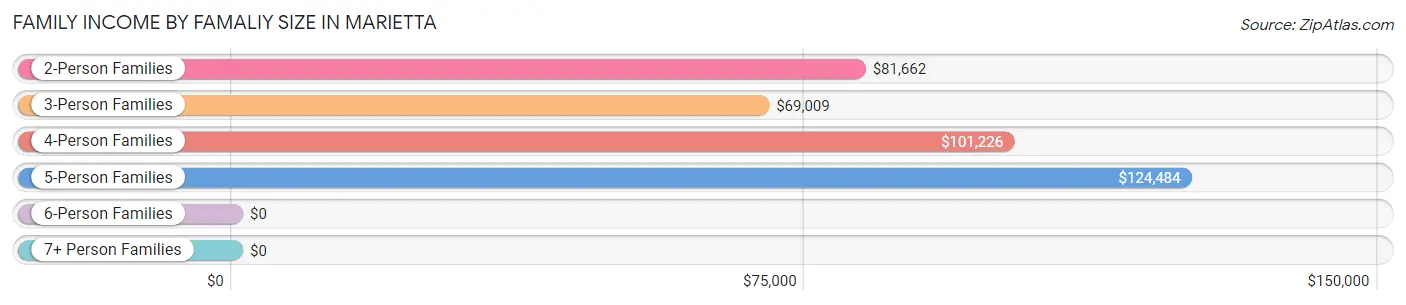
| Income Bracket | # Families | Median Income |
| 2-Person Families | 6,768 (48.5%) | $81,662 |
| 3-Person Families | 3,505 (25.1%) | $69,009 |
| 4-Person Families | 2,291 (16.4%) | $101,226 |
| 5-Person Families | 1,071 (7.7%) | $124,484 |
| 6-Person Families | 213 (1.5%) | $0 |
| 7+ Person Families | 112 (0.8%) | $0 |
| Total | 13,960 (100.0%) | $83,282 |
Family Income by Number of Earners in Marietta
The median family income in Marietta is $83,282, with families comprising 2 earners (6,417) having the highest median family income of $118,578, while families with 1 earner (5,132) have the lowest median family income of $53,691, accounting for 46.0% and 36.8% of families, respectively.
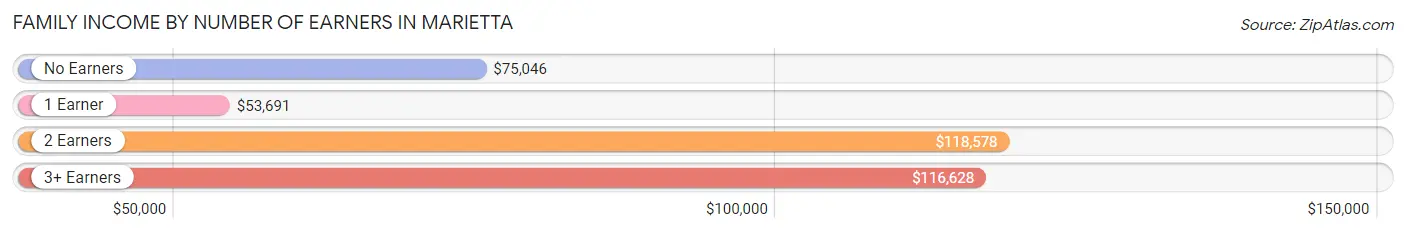
| Number of Earners | # Families | Median Income |
| No Earners | 1,241 (8.9%) | $75,046 |
| 1 Earner | 5,132 (36.8%) | $53,691 |
| 2 Earners | 6,417 (46.0%) | $118,578 |
| 3+ Earners | 1,170 (8.4%) | $116,628 |
| Total | 13,960 (100.0%) | $83,282 |
Household Income in Marietta
Household Income Brackets in Marietta
With 4,344 households falling in the category, the $50,000 to $74,999 income range is the most frequent in Marietta, accounting for 17.8% of all households. In contrast, only 1,049 households (4.3%) fall into the less than $10,000 income bracket, making it the least populous group.
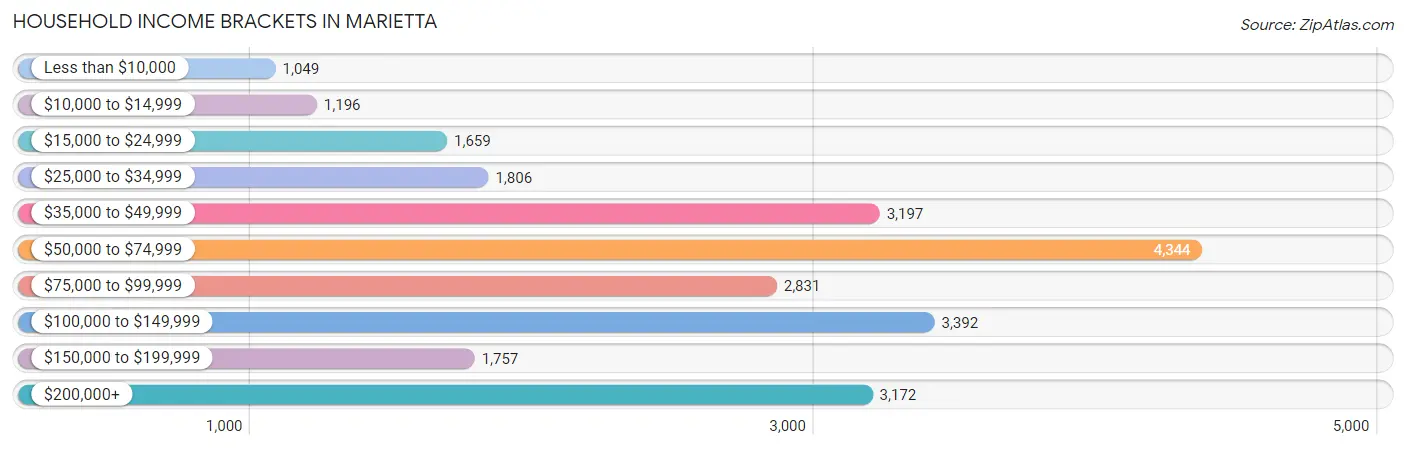
| Income Bracket | # Households | % Households |
| Less than $10,000 | 1,049 | 4.3% |
| $10,000 to $14,999 | 1,196 | 4.9% |
| $15,000 to $24,999 | 1,659 | 6.8% |
| $25,000 to $34,999 | 1,806 | 7.4% |
| $35,000 to $49,999 | 3,197 | 13.1% |
| $50,000 to $74,999 | 4,344 | 17.8% |
| $75,000 to $99,999 | 2,831 | 11.6% |
| $100,000 to $149,999 | 3,392 | 13.9% |
| $150,000 to $199,999 | 1,757 | 7.2% |
| $200,000+ | 3,172 | 13.0% |
Household Income by Householder Age in Marietta
The median household income in Marietta is $67,589, with the highest median household income of $80,655 found in the 45 to 64 years age bracket for the primary householder. A total of 7,859 households (32.2%) fall into this category. Meanwhile, the 15 to 24 years age bracket for the primary householder has the lowest median household income of $34,408, with 1,373 households (5.6%) in this group.
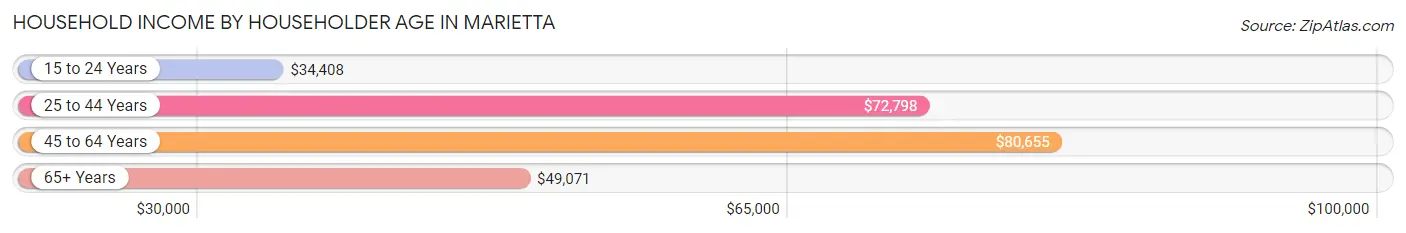
| Income Bracket | # Households | Median Income |
| 15 to 24 Years | 1,373 (5.6%) | $34,408 |
| 25 to 44 Years | 9,481 (38.9%) | $72,798 |
| 45 to 64 Years | 7,859 (32.2%) | $80,655 |
| 65+ Years | 5,690 (23.3%) | $49,071 |
| Total | 24,403 (100.0%) | $67,589 |
Poverty in Marietta
Income Below Poverty by Sex and Age in Marietta
With 11.3% poverty level for males and 14.1% for females among the residents of Marietta, 18 to 24 year old males and 15 year old females are the most vulnerable to poverty, with 864 males (28.0%) and 155 females (34.6%) in their respective age groups living below the poverty level.
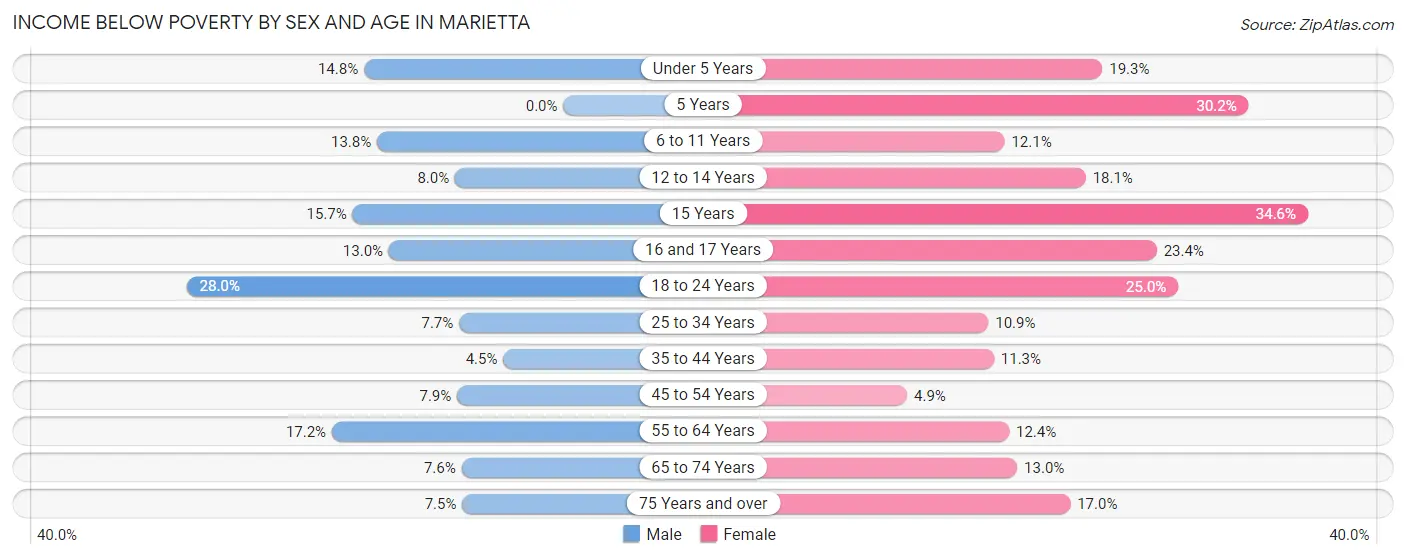
| Age Bracket | Male | Female |
| Under 5 Years | 292 (14.8%) | 334 (19.3%) |
| 5 Years | 0 (0.0%) | 135 (30.2%) |
| 6 to 11 Years | 287 (13.8%) | 233 (12.1%) |
| 12 to 14 Years | 81 (8.0%) | 239 (18.1%) |
| 15 Years | 41 (15.7%) | 155 (34.6%) |
| 16 and 17 Years | 50 (13.0%) | 126 (23.4%) |
| 18 to 24 Years | 864 (28.0%) | 662 (25.0%) |
| 25 to 34 Years | 393 (7.7%) | 531 (10.9%) |
| 35 to 44 Years | 196 (4.5%) | 508 (11.3%) |
| 45 to 54 Years | 296 (7.9%) | 158 (4.9%) |
| 55 to 64 Years | 490 (17.2%) | 415 (12.4%) |
| 65 to 74 Years | 142 (7.6%) | 366 (13.0%) |
| 75 Years and over | 80 (7.5%) | 388 (17.0%) |
| Total | 3,212 (11.3%) | 4,250 (14.1%) |
Income Above Poverty by Sex and Age in Marietta
According to the poverty statistics in Marietta, males aged 5 years and females aged 45 to 54 years are the age groups that are most secure financially, with 100.0% of males and 95.2% of females in these age groups living above the poverty line.
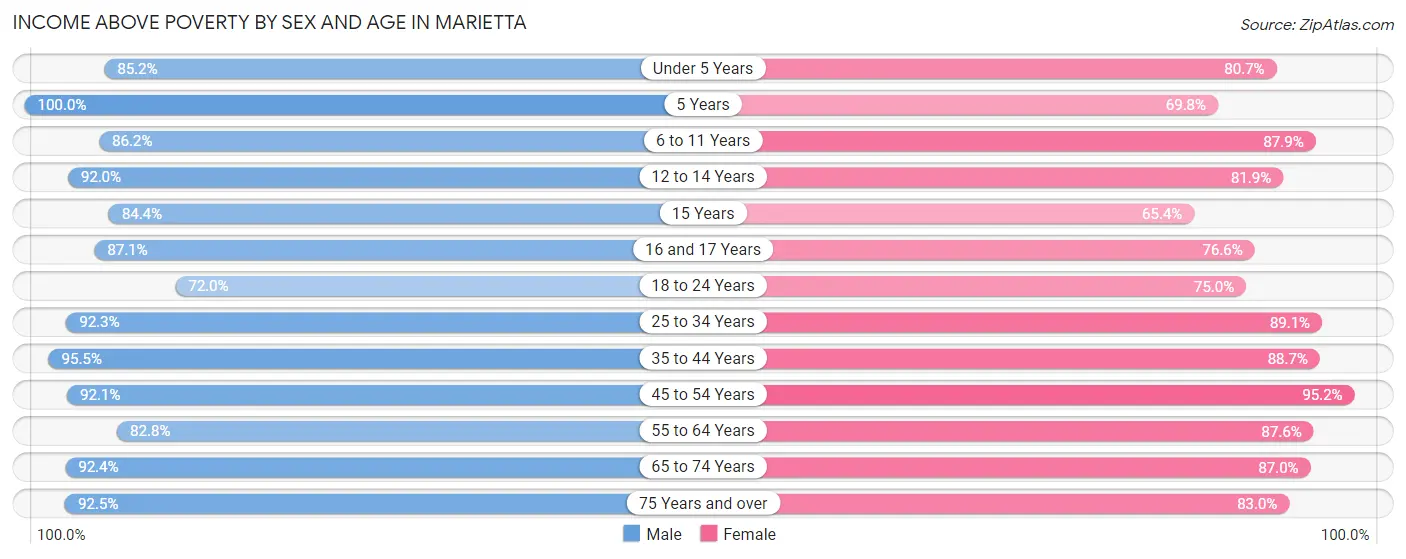
| Age Bracket | Male | Female |
| Under 5 Years | 1,681 (85.2%) | 1,393 (80.7%) |
| 5 Years | 532 (100.0%) | 312 (69.8%) |
| 6 to 11 Years | 1,788 (86.2%) | 1,696 (87.9%) |
| 12 to 14 Years | 927 (92.0%) | 1,081 (81.9%) |
| 15 Years | 221 (84.4%) | 293 (65.4%) |
| 16 and 17 Years | 336 (87.1%) | 413 (76.6%) |
| 18 to 24 Years | 2,225 (72.0%) | 1,989 (75.0%) |
| 25 to 34 Years | 4,683 (92.3%) | 4,350 (89.1%) |
| 35 to 44 Years | 4,203 (95.5%) | 3,992 (88.7%) |
| 45 to 54 Years | 3,454 (92.1%) | 3,103 (95.2%) |
| 55 to 64 Years | 2,362 (82.8%) | 2,926 (87.6%) |
| 65 to 74 Years | 1,736 (92.4%) | 2,445 (87.0%) |
| 75 Years and over | 987 (92.5%) | 1,900 (83.0%) |
| Total | 25,135 (88.7%) | 25,893 (85.9%) |
Income Below Poverty Among Married-Couple Families in Marietta
The poverty statistics for married-couple families in Marietta show that 5.9% or 531 of the total 8,998 families live below the poverty line. Families with 5 or more children have the highest poverty rate of 33.8%, comprising of 25 families. On the other hand, families with no children have the lowest poverty rate of 4.7%, which includes 257 families.
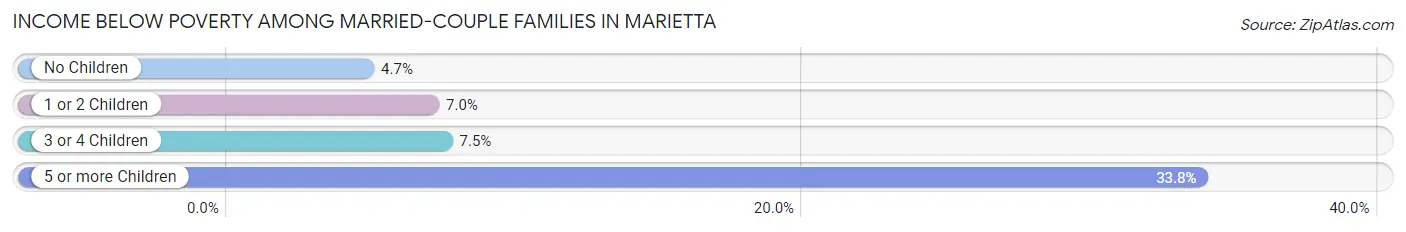
| Children | Above Poverty | Below Poverty |
| No Children | 5,161 (95.3%) | 257 (4.7%) |
| 1 or 2 Children | 2,576 (93.0%) | 194 (7.0%) |
| 3 or 4 Children | 681 (92.5%) | 55 (7.5%) |
| 5 or more Children | 49 (66.2%) | 25 (33.8%) |
| Total | 8,467 (94.1%) | 531 (5.9%) |
Income Below Poverty Among Single-Parent Households in Marietta
According to the poverty data in Marietta, 16.4% or 212 single-father households and 14.2% or 522 single-mother households are living below the poverty line. Among single-father households, those with no children have the highest poverty rate, with 137 households (22.6%) experiencing poverty. Likewise, among single-mother households, those with 3 or 4 children have the highest poverty rate, with 85 households (51.8%) falling below the poverty line.
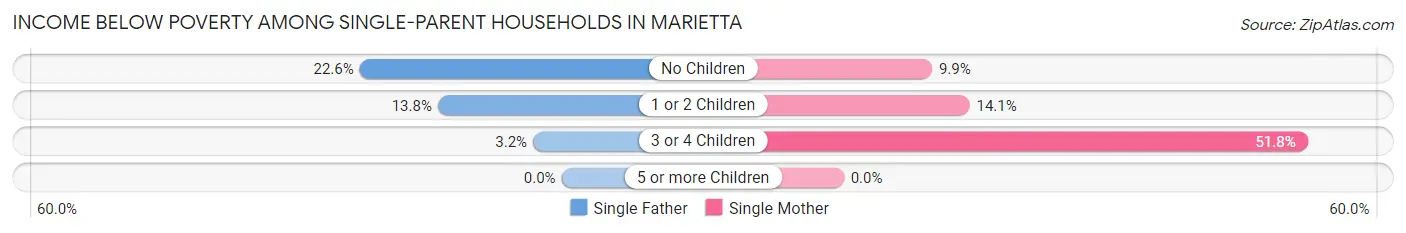
| Children | Single Father | Single Mother |
| No Children | 137 (22.6%) | 132 (9.9%) |
| 1 or 2 Children | 69 (13.8%) | 305 (14.1%) |
| 3 or 4 Children | 6 (3.2%) | 85 (51.8%) |
| 5 or more Children | 0 (0.0%) | 0 (0.0%) |
| Total | 212 (16.4%) | 522 (14.2%) |
Income Below Poverty Among Married-Couple vs Single-Parent Households in Marietta
The poverty data for Marietta shows that 531 of the married-couple family households (5.9%) and 734 of the single-parent households (14.8%) are living below the poverty level. Within the married-couple family households, those with 5 or more children have the highest poverty rate, with 25 households (33.8%) falling below the poverty line. Among the single-parent households, those with 3 or 4 children have the highest poverty rate, with 91 household (25.9%) living below poverty.
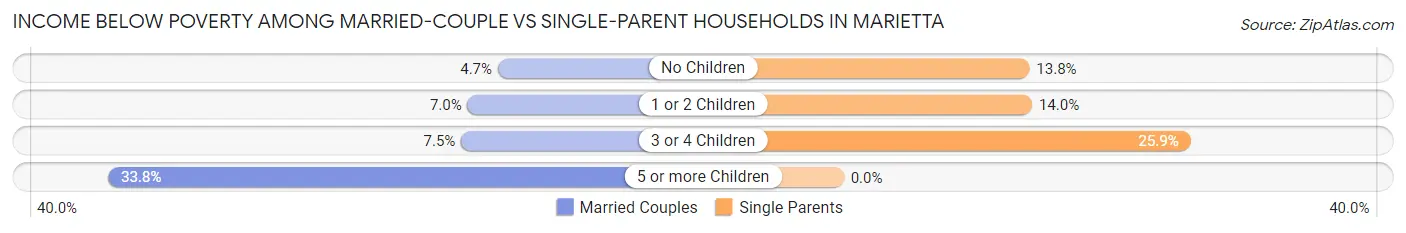
| Children | Married-Couple Families | Single-Parent Households |
| No Children | 257 (4.7%) | 269 (13.8%) |
| 1 or 2 Children | 194 (7.0%) | 374 (14.0%) |
| 3 or 4 Children | 55 (7.5%) | 91 (25.9%) |
| 5 or more Children | 25 (33.8%) | 0 (0.0%) |
| Total | 531 (5.9%) | 734 (14.8%) |
Race in Marietta
The most populous races in Marietta are White / Caucasian (27,783 | 45.3%), Black / African American (18,879 | 30.7%), and Hispanic or Latino (11,571 | 18.9%).
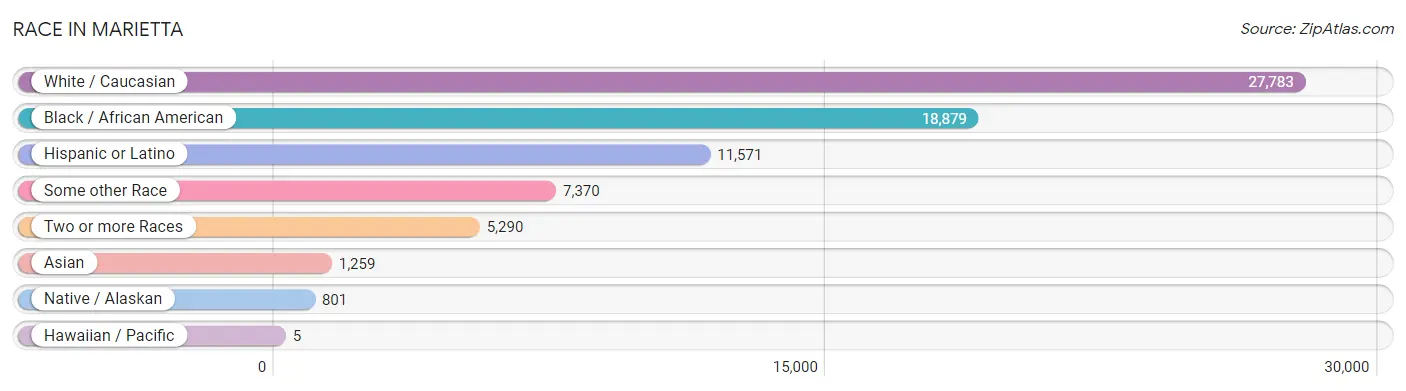
| Race | # Population | % Population |
| Asian | 1,259 | 2.1% |
| Black / African American | 18,879 | 30.7% |
| Hawaiian / Pacific | 5 | 0.0% |
| Hispanic or Latino | 11,571 | 18.9% |
| Native / Alaskan | 801 | 1.3% |
| White / Caucasian | 27,783 | 45.3% |
| Two or more Races | 5,290 | 8.6% |
| Some other Race | 7,370 | 12.0% |
| Total | 61,387 | 100.0% |
Ancestry in Marietta
The most populous ancestries reported in Marietta are English (7,238 | 11.8%), Mexican (5,287 | 8.6%), Irish (4,288 | 7.0%), German (4,186 | 6.8%), and Central American (3,515 | 5.7%), together accounting for 39.9% of all Marietta residents.
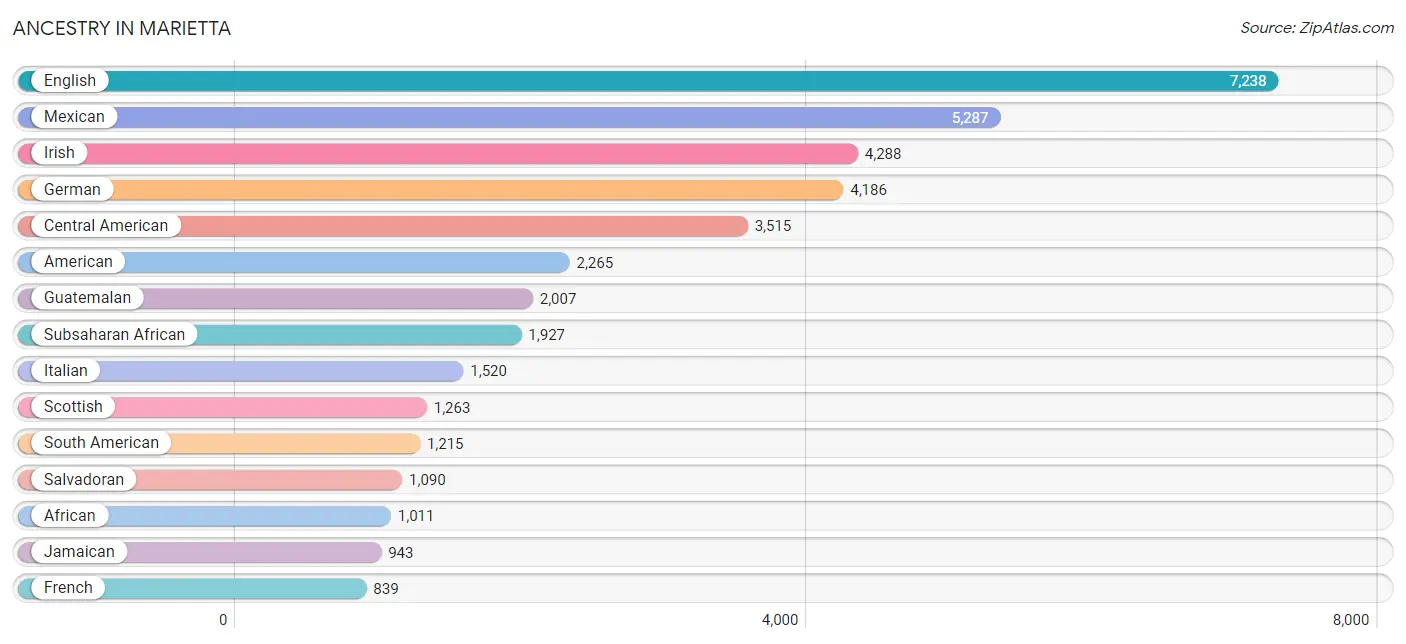
| Ancestry | # Population | % Population |
| African | 1,011 | 1.7% |
| American | 2,265 | 3.7% |
| Arab | 111 | 0.2% |
| Argentinean | 73 | 0.1% |
| Armenian | 52 | 0.1% |
| Austrian | 59 | 0.1% |
| Bahamian | 392 | 0.6% |
| Barbadian | 17 | 0.0% |
| Belgian | 70 | 0.1% |
| Bhutanese | 90 | 0.2% |
| Blackfeet | 133 | 0.2% |
| Bolivian | 61 | 0.1% |
| Brazilian | 399 | 0.6% |
| British | 398 | 0.6% |
| British West Indian | 31 | 0.1% |
| Bulgarian | 24 | 0.0% |
| Burmese | 115 | 0.2% |
| Cajun | 19 | 0.0% |
| Canadian | 53 | 0.1% |
| Cape Verdean | 25 | 0.0% |
| Celtic | 14 | 0.0% |
| Central American | 3,515 | 5.7% |
| Central American Indian | 447 | 0.7% |
| Cherokee | 263 | 0.4% |
| Choctaw | 27 | 0.0% |
| Colombian | 350 | 0.6% |
| Creek | 13 | 0.0% |
| Croatian | 10 | 0.0% |
| Crow | 19 | 0.0% |
| Cuban | 220 | 0.4% |
| Czech | 123 | 0.2% |
| Czechoslovakian | 81 | 0.1% |
| Danish | 39 | 0.1% |
| Dominican | 192 | 0.3% |
| Dutch | 293 | 0.5% |
| Eastern European | 249 | 0.4% |
| Ecuadorian | 57 | 0.1% |
| English | 7,238 | 11.8% |
| Ethiopian | 48 | 0.1% |
| European | 696 | 1.1% |
| Filipino | 4 | 0.0% |
| Finnish | 193 | 0.3% |
| French | 839 | 1.4% |
| French American Indian | 17 | 0.0% |
| French Canadian | 120 | 0.2% |
| German | 4,186 | 6.8% |
| Greek | 283 | 0.5% |
| Guatemalan | 2,007 | 3.3% |
| Guyanese | 45 | 0.1% |
| Haitian | 300 | 0.5% |
| Honduran | 363 | 0.6% |
| Hungarian | 50 | 0.1% |
| Icelander | 19 | 0.0% |
| Indian (Asian) | 285 | 0.5% |
| Iranian | 194 | 0.3% |
| Irish | 4,288 | 7.0% |
| Iroquois | 13 | 0.0% |
| Italian | 1,520 | 2.5% |
| Jamaican | 943 | 1.5% |
| Japanese | 31 | 0.1% |
| Kenyan | 90 | 0.2% |
| Korean | 545 | 0.9% |
| Laotian | 122 | 0.2% |
| Lebanese | 6 | 0.0% |
| Liberian | 13 | 0.0% |
| Lithuanian | 74 | 0.1% |
| Maltese | 16 | 0.0% |
| Mexican | 5,287 | 8.6% |
| Mexican American Indian | 365 | 0.6% |
| Moroccan | 28 | 0.1% |
| Native Hawaiian | 68 | 0.1% |
| Nicaraguan | 42 | 0.1% |
| Nigerian | 590 | 1.0% |
| Northern European | 63 | 0.1% |
| Norwegian | 279 | 0.4% |
| Pakistani | 15 | 0.0% |
| Palestinian | 9 | 0.0% |
| Panamanian | 13 | 0.0% |
| Pennsylvania German | 9 | 0.0% |
| Polish | 584 | 0.9% |
| Portuguese | 223 | 0.4% |
| Puerto Rican | 594 | 1.0% |
| Romanian | 27 | 0.0% |
| Russian | 65 | 0.1% |
| Salvadoran | 1,090 | 1.8% |
| Scandinavian | 128 | 0.2% |
| Scotch-Irish | 561 | 0.9% |
| Scottish | 1,263 | 2.1% |
| Slovak | 31 | 0.1% |
| Somali | 7 | 0.0% |
| South American | 1,215 | 2.0% |
| South American Indian | 19 | 0.0% |
| Spaniard | 138 | 0.2% |
| Spanish | 17 | 0.0% |
| Sri Lankan | 210 | 0.3% |
| Subsaharan African | 1,927 | 3.1% |
| Swedish | 341 | 0.6% |
| Swiss | 183 | 0.3% |
| Syrian | 36 | 0.1% |
| Thai | 503 | 0.8% |
| Trinidadian and Tobagonian | 54 | 0.1% |
| Turkish | 35 | 0.1% |
| U.S. Virgin Islander | 16 | 0.0% |
| Ukrainian | 255 | 0.4% |
| Venezuelan | 674 | 1.1% |
| Vietnamese | 85 | 0.1% |
| Welsh | 149 | 0.2% |
| West Indian | 771 | 1.3% |
| Yugoslavian | 45 | 0.1% |
| Zimbabwean | 29 | 0.1% | View All 110 Rows |
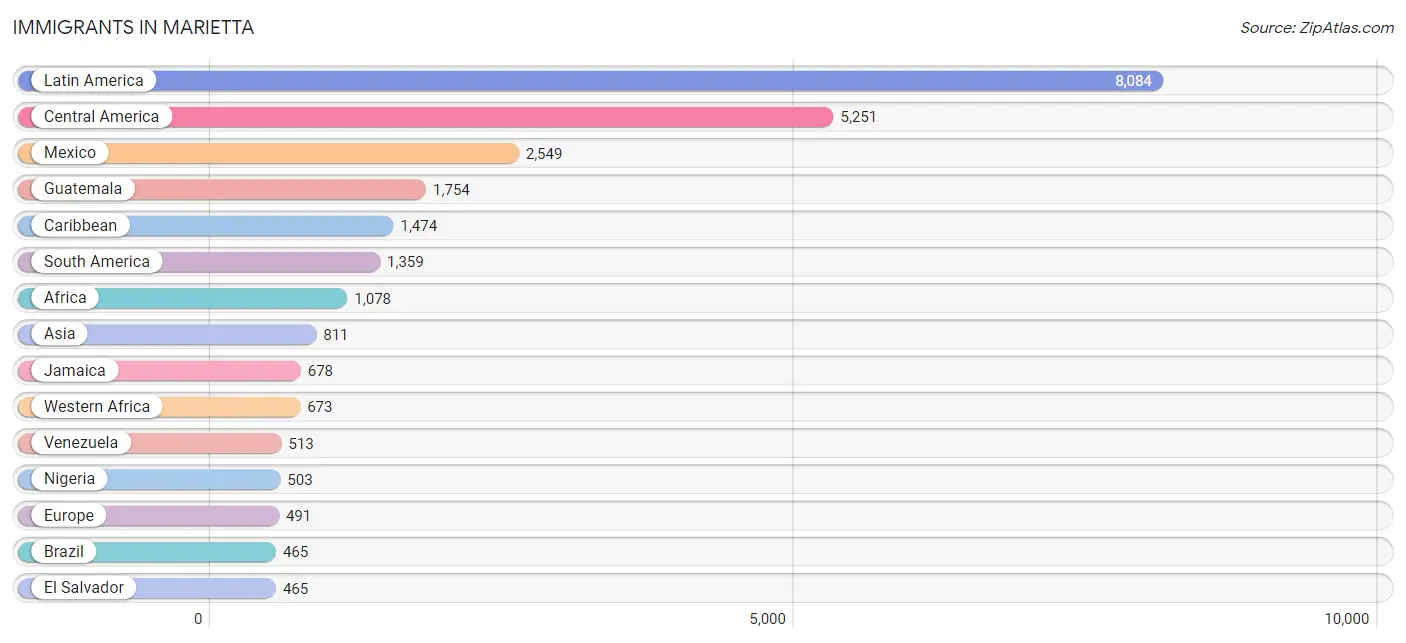
Immigrants in Marietta
The most numerous immigrant groups reported in Marietta came from Latin America (8,084 | 13.2%), Central America (5,251 | 8.6%), Mexico (2,549 | 4.2%), Guatemala (1,754 | 2.9%), and Caribbean (1,474 | 2.4%), together accounting for 31.1% of all Marietta residents.
| Immigration Origin | # Population | % Population |
| Africa | 1,078 | 1.8% |
| Argentina | 18 | 0.0% |
| Asia | 811 | 1.3% |
| Bahamas | 392 | 0.6% |
| Bangladesh | 85 | 0.1% |
| Belgium | 42 | 0.1% |
| Bolivia | 15 | 0.0% |
| Brazil | 465 | 0.8% |
| Bulgaria | 24 | 0.0% |
| Cameroon | 9 | 0.0% |
| Canada | 67 | 0.1% |
| Caribbean | 1,474 | 2.4% |
| Central America | 5,251 | 8.6% |
| China | 135 | 0.2% |
| Colombia | 191 | 0.3% |
| Cuba | 70 | 0.1% |
| Czechoslovakia | 8 | 0.0% |
| Dominica | 31 | 0.1% |
| Dominican Republic | 32 | 0.1% |
| Eastern Africa | 299 | 0.5% |
| Eastern Asia | 155 | 0.3% |
| Eastern Europe | 82 | 0.1% |
| Ecuador | 27 | 0.0% |
| Egypt | 11 | 0.0% |
| El Salvador | 465 | 0.8% |
| England | 181 | 0.3% |
| Ethiopia | 83 | 0.1% |
| Europe | 491 | 0.8% |
| Germany | 41 | 0.1% |
| Grenada | 3 | 0.0% |
| Guatemala | 1,754 | 2.9% |
| Guyana | 95 | 0.2% |
| Haiti | 260 | 0.4% |
| Honduras | 441 | 0.7% |
| India | 130 | 0.2% |
| Iran | 64 | 0.1% |
| Israel | 7 | 0.0% |
| Italy | 12 | 0.0% |
| Jamaica | 678 | 1.1% |
| Japan | 5 | 0.0% |
| Kenya | 141 | 0.2% |
| Korea | 15 | 0.0% |
| Latin America | 8,084 | 13.2% |
| Liberia | 28 | 0.1% |
| Lithuania | 11 | 0.0% |
| Malaysia | 14 | 0.0% |
| Mexico | 2,549 | 4.2% |
| Middle Africa | 9 | 0.0% |
| Morocco | 83 | 0.1% |
| Nepal | 32 | 0.1% |
| Nicaragua | 42 | 0.1% |
| Nigeria | 503 | 0.8% |
| Northern Africa | 94 | 0.2% |
| Northern Europe | 246 | 0.4% |
| Norway | 17 | 0.0% |
| Pakistan | 39 | 0.1% |
| Peru | 35 | 0.1% |
| Philippines | 120 | 0.2% |
| Poland | 23 | 0.0% |
| Portugal | 8 | 0.0% |
| Romania | 16 | 0.0% |
| Senegal | 12 | 0.0% |
| Singapore | 17 | 0.0% |
| South America | 1,359 | 2.2% |
| South Central Asia | 368 | 0.6% |
| South Eastern Asia | 203 | 0.3% |
| Southern Europe | 66 | 0.1% |
| Spain | 30 | 0.1% |
| Switzerland | 14 | 0.0% |
| Syria | 36 | 0.1% |
| Taiwan | 5 | 0.0% |
| Thailand | 15 | 0.0% |
| Trinidad and Tobago | 8 | 0.0% |
| Turkey | 33 | 0.1% |
| Uganda | 31 | 0.1% |
| Uzbekistan | 18 | 0.0% |
| Venezuela | 513 | 0.8% |
| Vietnam | 37 | 0.1% |
| Western Africa | 673 | 1.1% |
| Western Asia | 76 | 0.1% |
| Western Europe | 97 | 0.2% |
| Zimbabwe | 29 | 0.1% | View All 82 Rows |
Sex and Age in Marietta
Sex and Age in Marietta
The most populous age groups in Marietta are 30 to 34 Years (2,995 | 10.0%) for men and 25 to 29 Years (2,592 | 8.2%) for women.
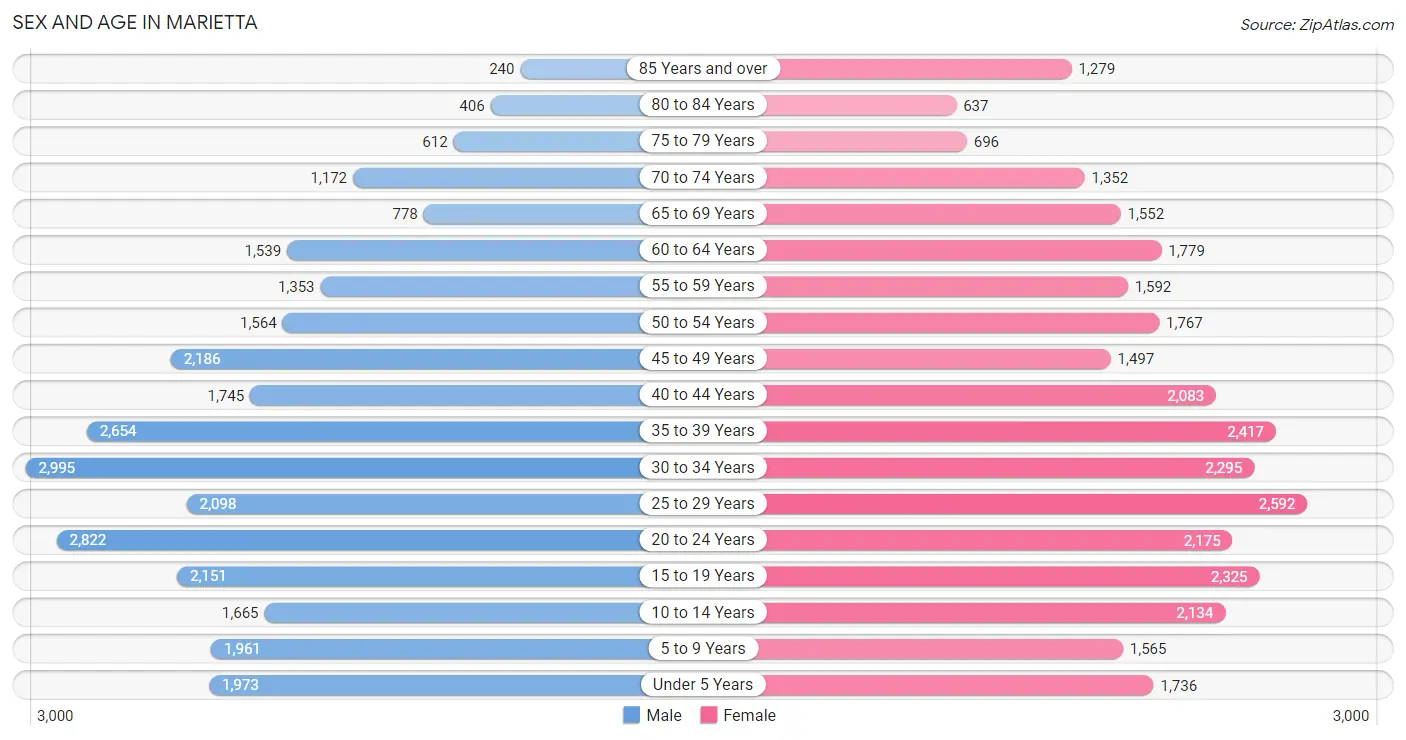
| Age Bracket | Male | Female |
| Under 5 Years | 1,973 (6.6%) | 1,736 (5.5%) |
| 5 to 9 Years | 1,961 (6.6%) | 1,565 (5.0%) |
| 10 to 14 Years | 1,665 (5.6%) | 2,134 (6.8%) |
| 15 to 19 Years | 2,151 (7.2%) | 2,325 (7.4%) |
| 20 to 24 Years | 2,822 (9.4%) | 2,175 (6.9%) |
| 25 to 29 Years | 2,098 (7.0%) | 2,592 (8.2%) |
| 30 to 34 Years | 2,995 (10.0%) | 2,295 (7.3%) |
| 35 to 39 Years | 2,654 (8.9%) | 2,417 (7.7%) |
| 40 to 44 Years | 1,745 (5.8%) | 2,083 (6.6%) |
| 45 to 49 Years | 2,186 (7.3%) | 1,497 (4.8%) |
| 50 to 54 Years | 1,564 (5.2%) | 1,767 (5.6%) |
| 55 to 59 Years | 1,353 (4.5%) | 1,592 (5.1%) |
| 60 to 64 Years | 1,539 (5.1%) | 1,779 (5.7%) |
| 65 to 69 Years | 778 (2.6%) | 1,552 (4.9%) |
| 70 to 74 Years | 1,172 (3.9%) | 1,352 (4.3%) |
| 75 to 79 Years | 612 (2.1%) | 696 (2.2%) |
| 80 to 84 Years | 406 (1.4%) | 637 (2.0%) |
| 85 Years and over | 240 (0.8%) | 1,279 (4.1%) |
| Total | 29,914 (100.0%) | 31,473 (100.0%) |
Families and Households in Marietta
Median Family Size in Marietta
The median family size in Marietta is 3.06 persons per family, with married-couple families (8,998 | 64.5%) accounting for the largest median family size of 3.17 persons per family. On the other hand, single male/father families (1,294 | 9.3%) represent the smallest median family size with 2.73 persons per family.
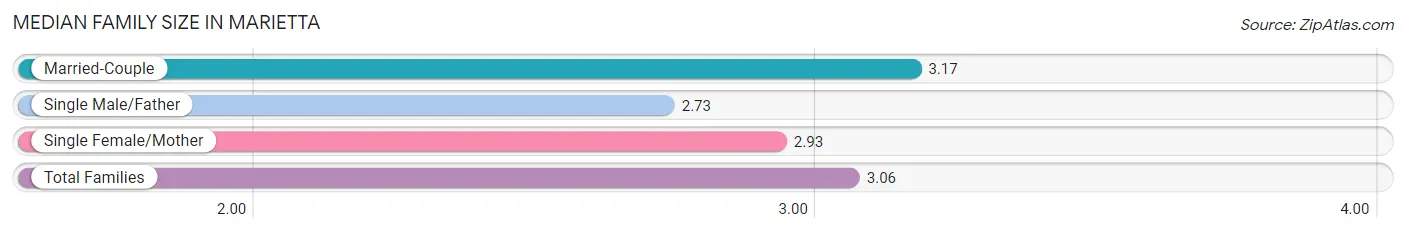
| Family Type | # Families | Family Size |
| Married-Couple | 8,998 (64.5%) | 3.17 |
| Single Male/Father | 1,294 (9.3%) | 2.73 |
| Single Female/Mother | 3,668 (26.3%) | 2.93 |
| Total Families | 13,960 (100.0%) | 3.06 |
Median Household Size in Marietta
The median household size in Marietta is 2.39 persons per household, with single female/mother households (3,668 | 15.0%) accounting for the largest median household size of 3.26 persons per household. non-family households (10,443 | 42.8%) represent the smallest median household size with 1.30 persons per household.
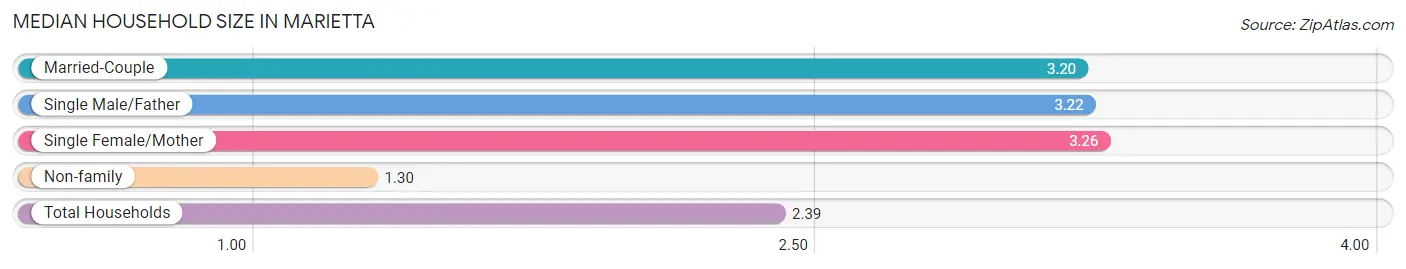
| Household Type | # Households | Household Size |
| Married-Couple | 8,998 (36.9%) | 3.20 |
| Single Male/Father | 1,294 (5.3%) | 3.22 |
| Single Female/Mother | 3,668 (15.0%) | 3.26 |
| Non-family | 10,443 (42.8%) | 1.30 |
| Total Households | 24,403 (100.0%) | 2.39 |
Household Size by Marriage Status in Marietta
Out of a total of 24,403 households in Marietta, 13,960 (57.2%) are family households, while 10,443 (42.8%) are nonfamily households. The most numerous type of family households are 2-person households, comprising 6,040, and the most common type of nonfamily households are 1-person households, comprising 8,350.
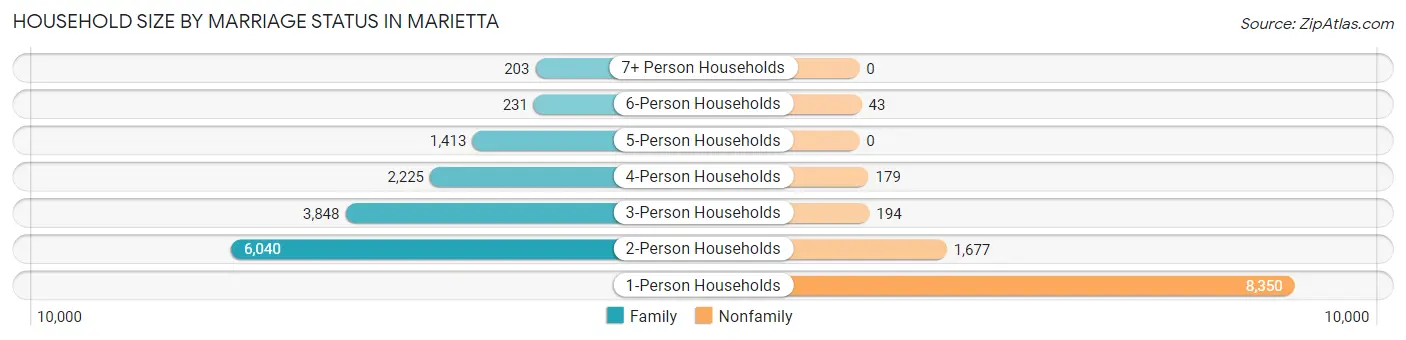
| Household Size | Family Households | Nonfamily Households |
| 1-Person Households | - | 8,350 (34.2%) |
| 2-Person Households | 6,040 (24.7%) | 1,677 (6.9%) |
| 3-Person Households | 3,848 (15.8%) | 194 (0.8%) |
| 4-Person Households | 2,225 (9.1%) | 179 (0.7%) |
| 5-Person Households | 1,413 (5.8%) | 0 (0.0%) |
| 6-Person Households | 231 (0.9%) | 43 (0.2%) |
| 7+ Person Households | 203 (0.8%) | 0 (0.0%) |
| Total | 13,960 (57.2%) | 10,443 (42.8%) |
Female Fertility in Marietta
Fertility by Age in Marietta
Average fertility rate in Marietta is 55.0 births per 1,000 women. Women in the age bracket of 20 to 34 years have the highest fertility rate with 91.0 births per 1,000 women. Women in the age bracket of 20 to 34 years acount for 74.1% of all women with births.
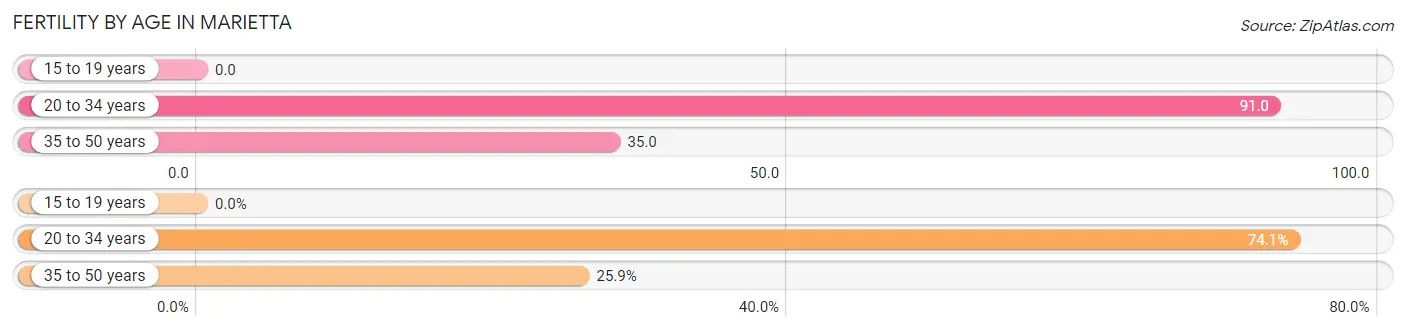
| Age Bracket | Women with Births | Births / 1,000 Women |
| 15 to 19 years | 0 (0.0%) | 0.0 |
| 20 to 34 years | 644 (74.1%) | 91.0 |
| 35 to 50 years | 225 (25.9%) | 35.0 |
| Total | 869 (100.0%) | 55.0 |
Fertility by Age by Marriage Status in Marietta
51.9% of women with births (869) in Marietta are married. The highest percentage of unmarried women with births falls into 20 to 34 years age bracket with 58.5% of them unmarried at the time of birth, while the lowest percentage of unmarried women with births belong to 35 to 50 years age bracket with 18.2% of them unmarried.
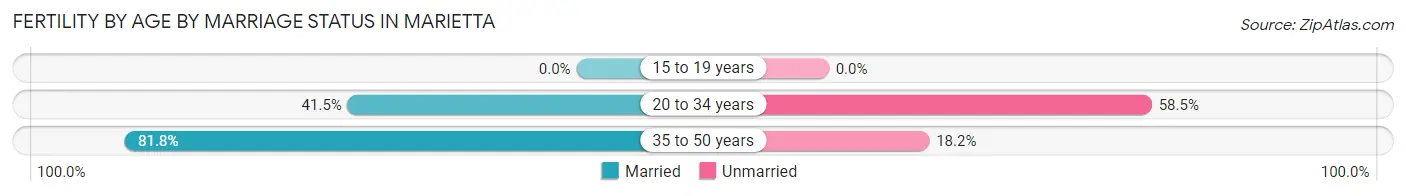
| Age Bracket | Married | Unmarried |
| 15 to 19 years | 0 (0.0%) | 0 (0.0%) |
| 20 to 34 years | 267 (41.5%) | 377 (58.5%) |
| 35 to 50 years | 184 (81.8%) | 41 (18.2%) |
| Total | 451 (51.9%) | 418 (48.1%) |
Fertility by Education in Marietta
Average fertility rate in Marietta is 55.0 births per 1,000 women. Women with the education attainment of graduate degree have the highest fertility rate of 95.0 births per 1,000 women, while women with the education attainment of high school diploma have the lowest fertility at 5.0 births per 1,000 women. Women with the education attainment of college or associate's degree represent 30.6% of all women with births.
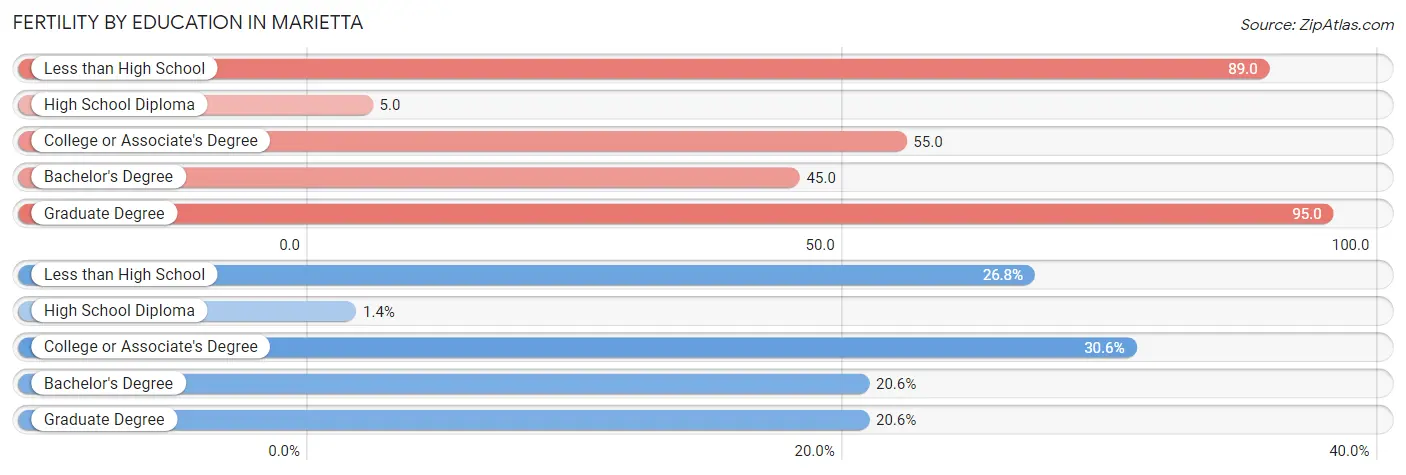
| Educational Attainment | Women with Births | Births / 1,000 Women |
| Less than High School | 233 (26.8%) | 89.0 |
| High School Diploma | 12 (1.4%) | 5.0 |
| College or Associate's Degree | 266 (30.6%) | 55.0 |
| Bachelor's Degree | 179 (20.6%) | 45.0 |
| Graduate Degree | 179 (20.6%) | 95.0 |
| Total | 869 (100.0%) | 55.0 |
Fertility by Education by Marriage Status in Marietta
48.1% of women with births in Marietta are unmarried. Women with the educational attainment of high school diploma are most likely to be married with 100.0% of them married at childbirth, while women with the educational attainment of college or associate's degree are least likely to be married with 69.2% of them unmarried at childbirth.
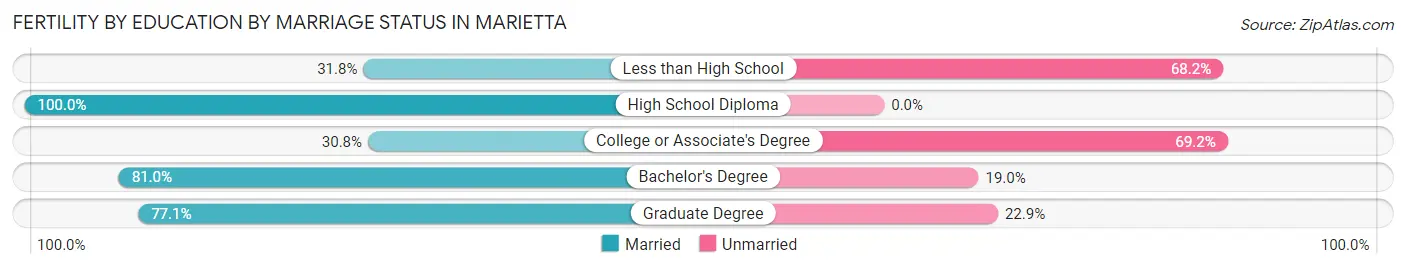
| Educational Attainment | Married | Unmarried |
| Less than High School | 74 (31.8%) | 159 (68.2%) |
| High School Diploma | 12 (100.0%) | 0 (0.0%) |
| College or Associate's Degree | 82 (30.8%) | 184 (69.2%) |
| Bachelor's Degree | 145 (81.0%) | 34 (19.0%) |
| Graduate Degree | 138 (77.1%) | 41 (22.9%) |
| Total | 451 (51.9%) | 418 (48.1%) |
Employment Characteristics in Marietta
Employment by Class of Employer in Marietta
Among the 31,807 employed individuals in Marietta, private company employees (22,899 | 72.0%), not-for-profit organizations (2,102 | 6.6%), and self-employed (not incorporated) (1,905 | 6.0%) make up the most common classes of employment.
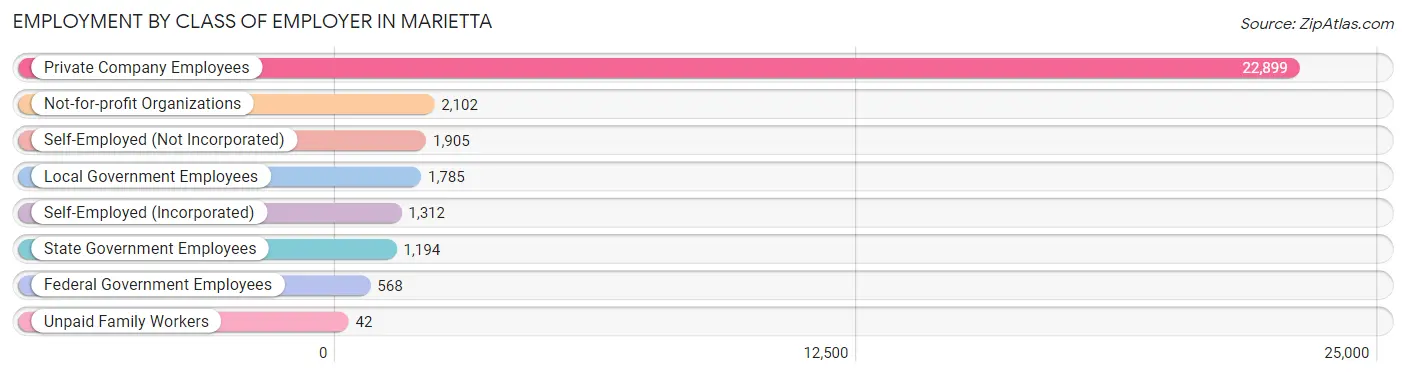
| Employer Class | # Employees | % Employees |
| Private Company Employees | 22,899 | 72.0% |
| Self-Employed (Incorporated) | 1,312 | 4.1% |
| Self-Employed (Not Incorporated) | 1,905 | 6.0% |
| Not-for-profit Organizations | 2,102 | 6.6% |
| Local Government Employees | 1,785 | 5.6% |
| State Government Employees | 1,194 | 3.7% |
| Federal Government Employees | 568 | 1.8% |
| Unpaid Family Workers | 42 | 0.1% |
| Total | 31,807 | 100.0% |
Employment Status by Age in Marietta
According to the labor force statistics for Marietta, out of the total population over 16 years of age (49,638), 67.9% or 33,704 individuals are in the labor force, with 3.4% or 1,146 of them unemployed. The age group with the highest labor force participation rate is 45 to 54 years, with 91.7% or 6,432 individuals in the labor force. Within the labor force, the 16 to 19 years age range has the highest percentage of unemployed individuals, with 9.1% or 159 of them being unemployed.
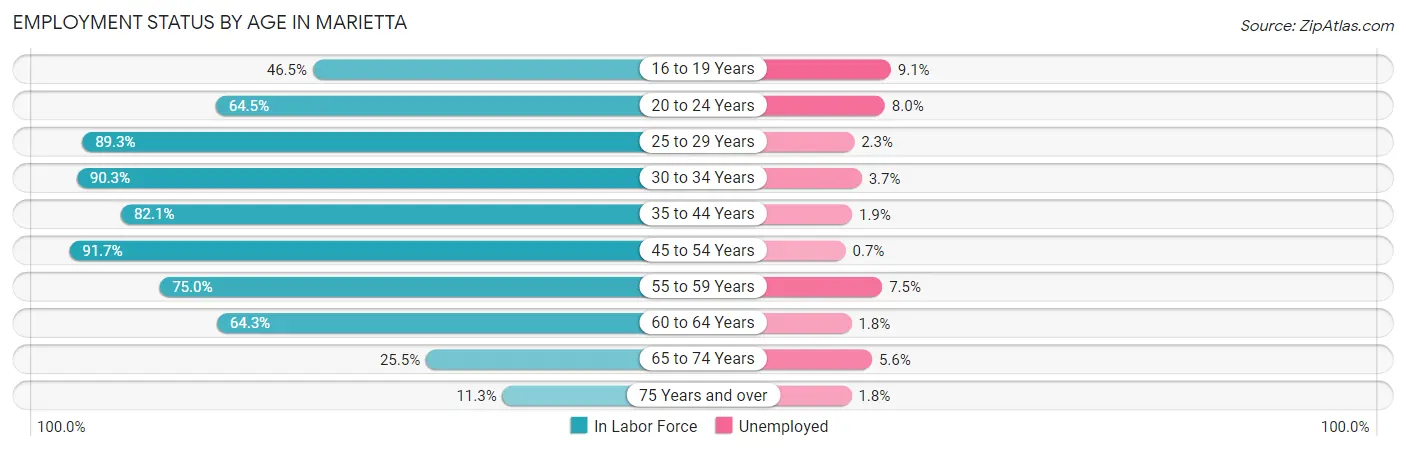
| Age Bracket | In Labor Force | Unemployed |
| 16 to 19 Years | 1,749 (46.5%) | 159 (9.1%) |
| 20 to 24 Years | 3,223 (64.5%) | 258 (8.0%) |
| 25 to 29 Years | 4,188 (89.3%) | 96 (2.3%) |
| 30 to 34 Years | 4,777 (90.3%) | 177 (3.7%) |
| 35 to 44 Years | 7,306 (82.1%) | 139 (1.9%) |
| 45 to 54 Years | 6,432 (91.7%) | 45 (0.7%) |
| 55 to 59 Years | 2,209 (75.0%) | 166 (7.5%) |
| 60 to 64 Years | 2,133 (64.3%) | 38 (1.8%) |
| 65 to 74 Years | 1,238 (25.5%) | 69 (5.6%) |
| 75 Years and over | 437 (11.3%) | 8 (1.8%) |
| Total | 33,704 (67.9%) | 1,146 (3.4%) |
Employment Status by Educational Attainment in Marietta
According to labor force statistics for Marietta, 84.1% of individuals (27,043) out of the total population between 25 and 64 years of age (32,156) are in the labor force, with 2.5% or 676 of them being unemployed. The group with the highest labor force participation rate are those with the educational attainment of bachelor's degree or higher, with 87.3% or 13,206 individuals in the labor force. Within the labor force, individuals with college / associate degree education have the highest percentage of unemployment, with 4.3% or 281 of them being unemployed.
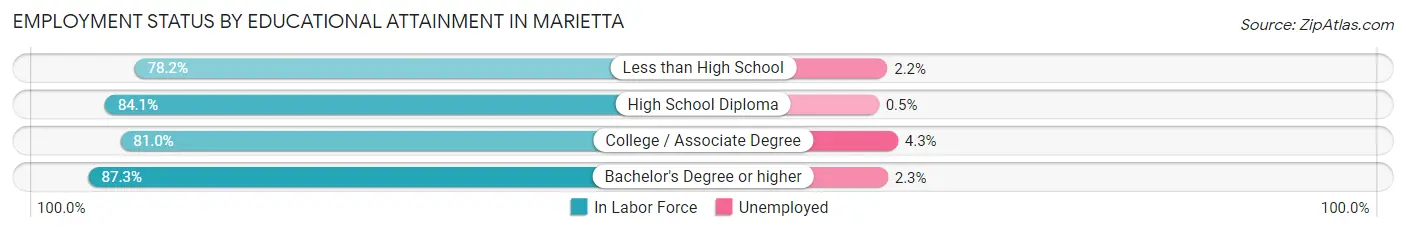
| Educational Attainment | In Labor Force | Unemployed |
| Less than High School | 3,008 (78.2%) | 85 (2.2%) |
| High School Diploma | 4,293 (84.1%) | 26 (0.5%) |
| College / Associate Degree | 6,543 (81.0%) | 347 (4.3%) |
| Bachelor's Degree or higher | 13,206 (87.3%) | 348 (2.3%) |
| Total | 27,043 (84.1%) | 804 (2.5%) |
Employment Occupations by Sex in Marietta
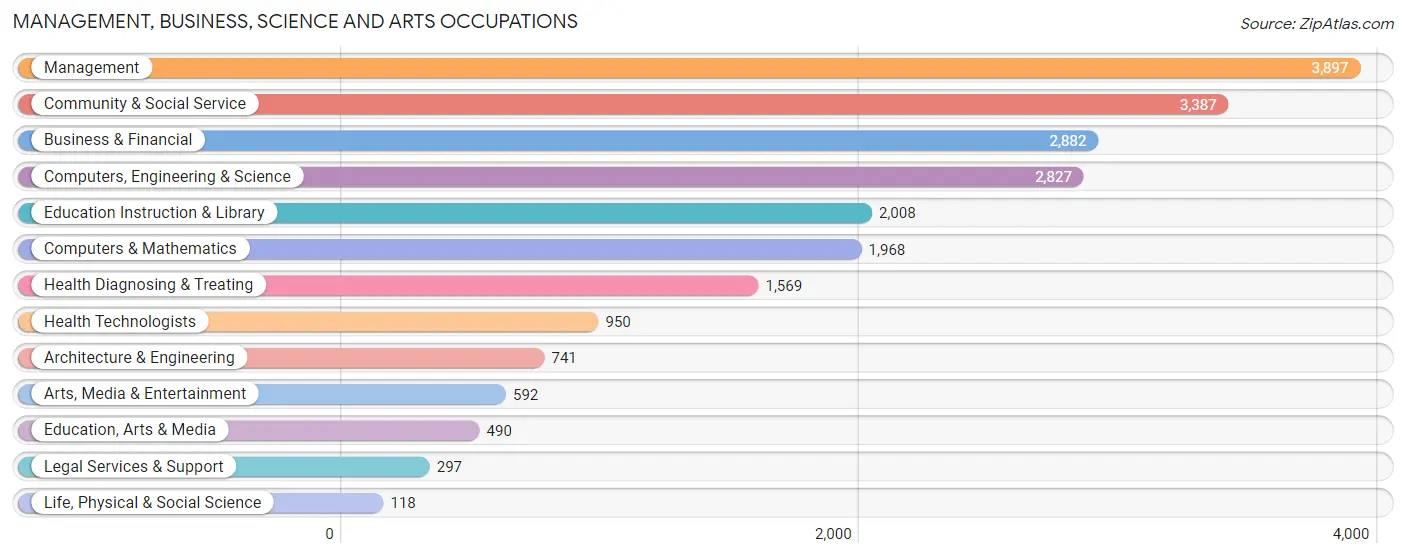
Management, Business, Science and Arts Occupations
The most common Management, Business, Science and Arts occupations in Marietta are Management (3,897 | 12.0%), Community & Social Service (3,387 | 10.4%), Business & Financial (2,882 | 8.9%), Computers, Engineering & Science (2,827 | 8.7%), and Education Instruction & Library (2,008 | 6.2%).
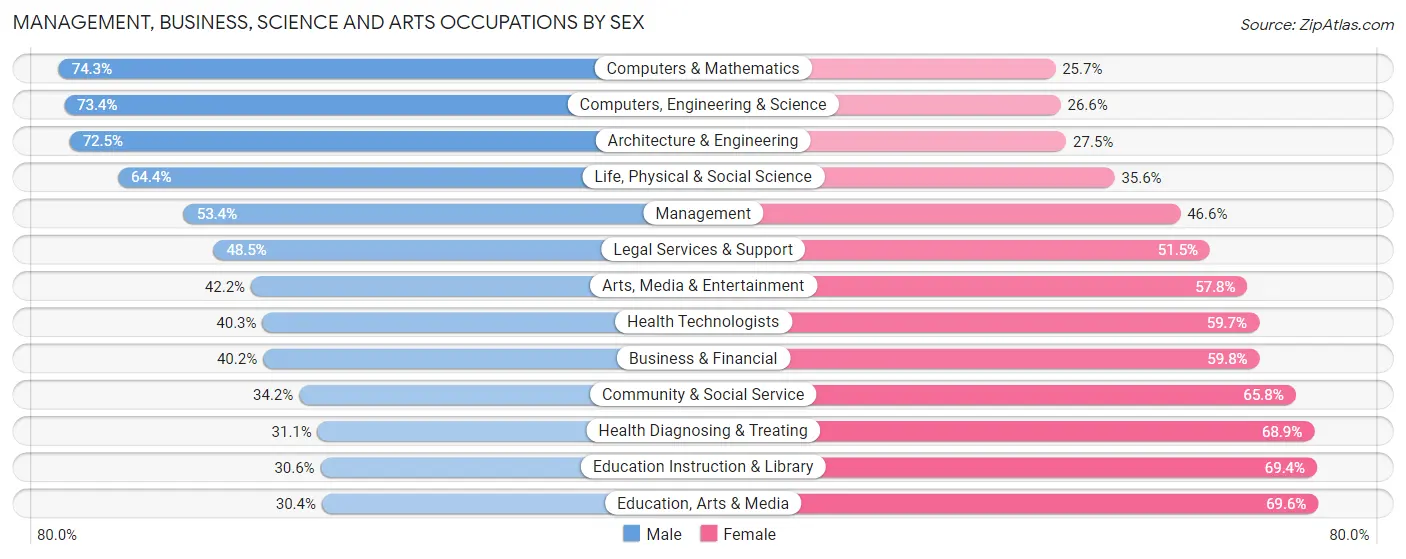
Management, Business, Science and Arts Occupations by Sex
Within the Management, Business, Science and Arts occupations in Marietta, the most male-oriented occupations are Computers & Mathematics (74.3%), Computers, Engineering & Science (73.4%), and Architecture & Engineering (72.5%), while the most female-oriented occupations are Education, Arts & Media (69.6%), Education Instruction & Library (69.4%), and Health Diagnosing & Treating (68.9%).
| Occupation | Male | Female |
| Management | 2,082 (53.4%) | 1,815 (46.6%) |
| Business & Financial | 1,159 (40.2%) | 1,723 (59.8%) |
| Computers, Engineering & Science | 2,075 (73.4%) | 752 (26.6%) |
| Computers & Mathematics | 1,462 (74.3%) | 506 (25.7%) |
| Architecture & Engineering | 537 (72.5%) | 204 (27.5%) |
| Life, Physical & Social Science | 76 (64.4%) | 42 (35.6%) |
| Community & Social Service | 1,158 (34.2%) | 2,229 (65.8%) |
| Education, Arts & Media | 149 (30.4%) | 341 (69.6%) |
| Legal Services & Support | 144 (48.5%) | 153 (51.5%) |
| Education Instruction & Library | 615 (30.6%) | 1,393 (69.4%) |
| Arts, Media & Entertainment | 250 (42.2%) | 342 (57.8%) |
| Health Diagnosing & Treating | 488 (31.1%) | 1,081 (68.9%) |
| Health Technologists | 383 (40.3%) | 567 (59.7%) |
| Total (Category) | 6,962 (47.8%) | 7,600 (52.2%) |
| Total (Overall) | 17,425 (53.7%) | 14,995 (46.3%) |
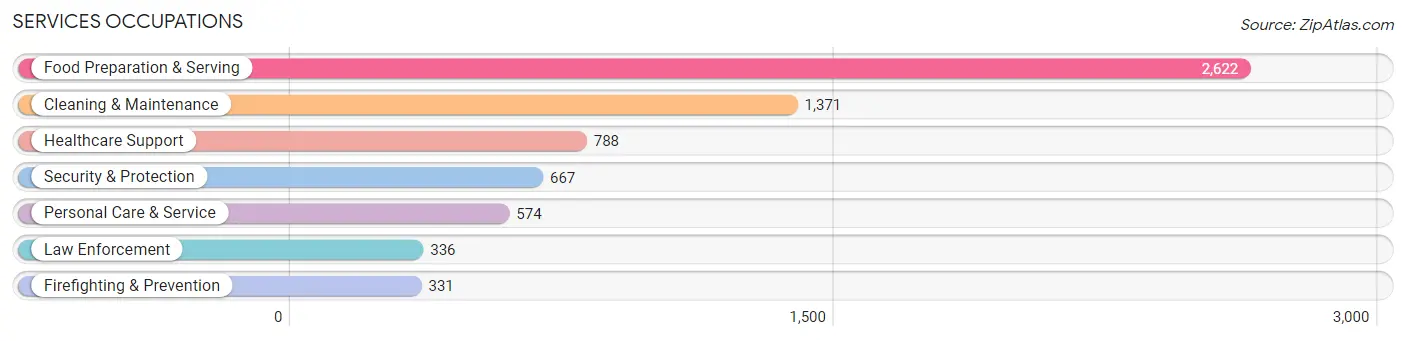
Services Occupations
The most common Services occupations in Marietta are Food Preparation & Serving (2,622 | 8.1%), Cleaning & Maintenance (1,371 | 4.2%), Healthcare Support (788 | 2.4%), Security & Protection (667 | 2.1%), and Personal Care & Service (574 | 1.8%).
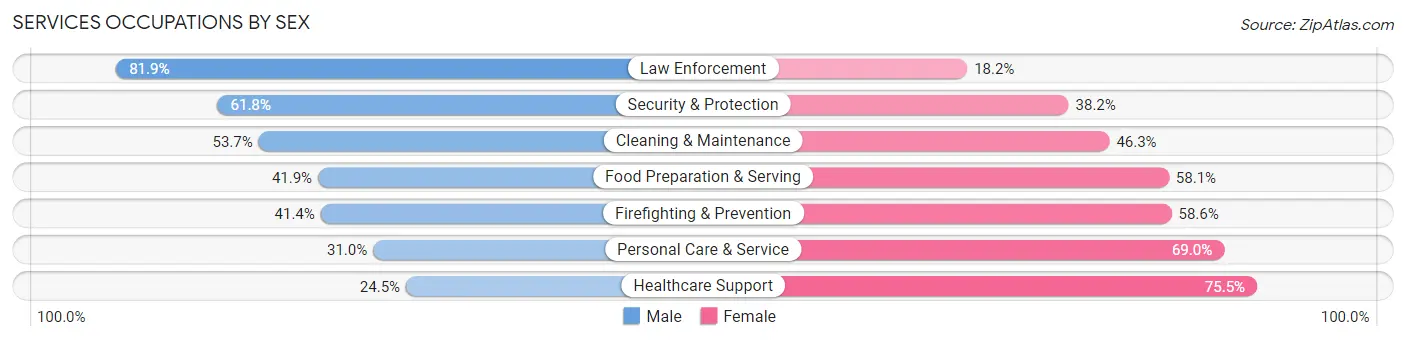
Services Occupations by Sex
Within the Services occupations in Marietta, the most male-oriented occupations are Law Enforcement (81.9%), Security & Protection (61.8%), and Cleaning & Maintenance (53.7%), while the most female-oriented occupations are Healthcare Support (75.5%), Personal Care & Service (69.0%), and Firefighting & Prevention (58.6%).
| Occupation | Male | Female |
| Healthcare Support | 193 (24.5%) | 595 (75.5%) |
| Security & Protection | 412 (61.8%) | 255 (38.2%) |
| Firefighting & Prevention | 137 (41.4%) | 194 (58.6%) |
| Law Enforcement | 275 (81.9%) | 61 (18.1%) |
| Food Preparation & Serving | 1,099 (41.9%) | 1,523 (58.1%) |
| Cleaning & Maintenance | 736 (53.7%) | 635 (46.3%) |
| Personal Care & Service | 178 (31.0%) | 396 (69.0%) |
| Total (Category) | 2,618 (43.5%) | 3,404 (56.5%) |
| Total (Overall) | 17,425 (53.7%) | 14,995 (46.3%) |
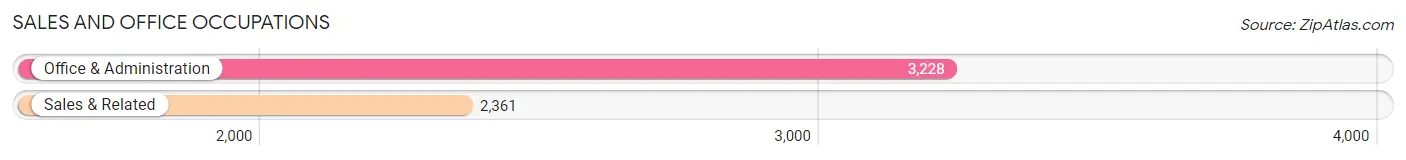
Sales and Office Occupations
The most common Sales and Office occupations in Marietta are Office & Administration (3,228 | 10.0%), and Sales & Related (2,361 | 7.3%).
Sales and Office Occupations by Sex
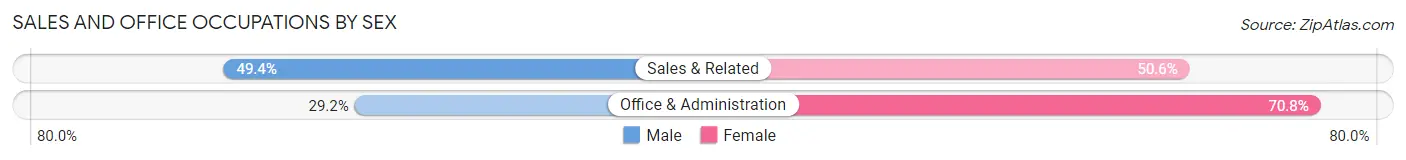
| Occupation | Male | Female |
| Sales & Related | 1,166 (49.4%) | 1,195 (50.6%) |
| Office & Administration | 944 (29.2%) | 2,284 (70.8%) |
| Total (Category) | 2,110 (37.8%) | 3,479 (62.3%) |
| Total (Overall) | 17,425 (53.7%) | 14,995 (46.3%) |
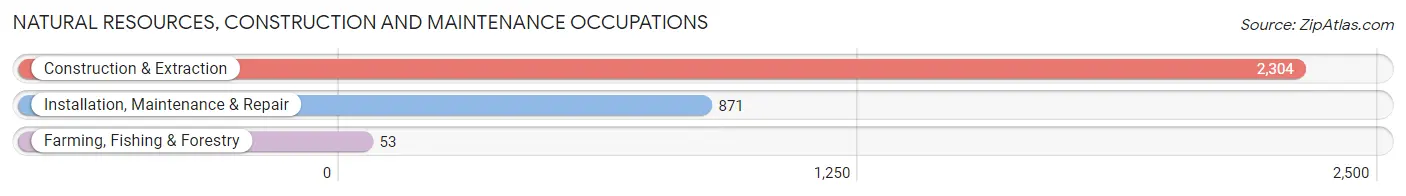
Natural Resources, Construction and Maintenance Occupations
The most common Natural Resources, Construction and Maintenance occupations in Marietta are Construction & Extraction (2,304 | 7.1%), Installation, Maintenance & Repair (871 | 2.7%), and Farming, Fishing & Forestry (53 | 0.2%).
Natural Resources, Construction and Maintenance Occupations by Sex
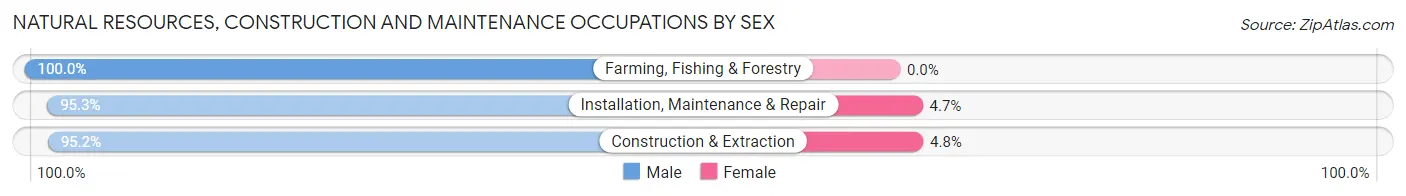
| Occupation | Male | Female |
| Farming, Fishing & Forestry | 53 (100.0%) | 0 (0.0%) |
| Construction & Extraction | 2,193 (95.2%) | 111 (4.8%) |
| Installation, Maintenance & Repair | 830 (95.3%) | 41 (4.7%) |
| Total (Category) | 3,076 (95.3%) | 152 (4.7%) |
| Total (Overall) | 17,425 (53.7%) | 14,995 (46.3%) |
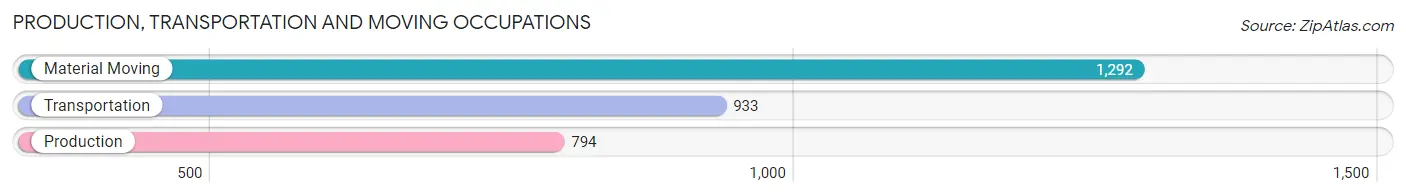
Production, Transportation and Moving Occupations
The most common Production, Transportation and Moving occupations in Marietta are Material Moving (1,292 | 4.0%), Transportation (933 | 2.9%), and Production (794 | 2.5%).
Production, Transportation and Moving Occupations by Sex
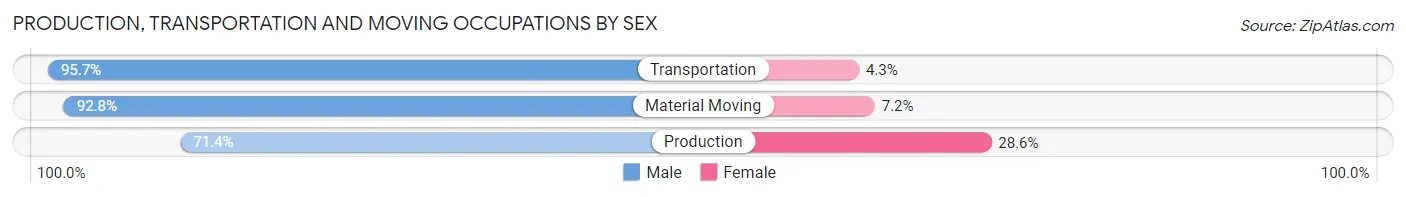
| Occupation | Male | Female |
| Production | 567 (71.4%) | 227 (28.6%) |
| Transportation | 893 (95.7%) | 40 (4.3%) |
| Material Moving | 1,199 (92.8%) | 93 (7.2%) |
| Total (Category) | 2,659 (88.1%) | 360 (11.9%) |
| Total (Overall) | 17,425 (53.7%) | 14,995 (46.3%) |
Employment Industries by Sex in Marietta
Employment Industries in Marietta
The major employment industries in Marietta include Health Care & Social Assistance (3,651 | 11.3%), Professional & Scientific (3,427 | 10.6%), Retail Trade (3,299 | 10.2%), Construction (3,159 | 9.7%), and Accommodation & Food Services (2,832 | 8.7%).
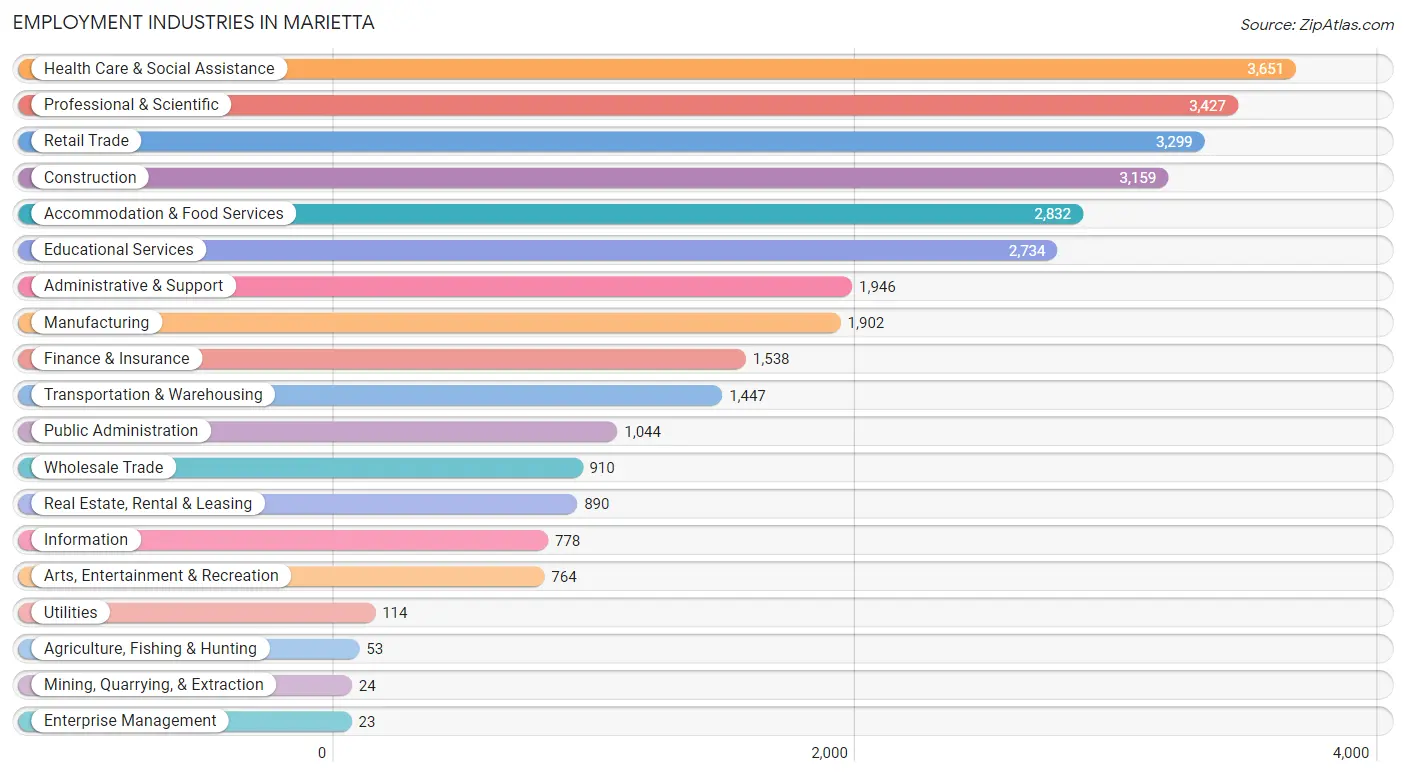
Employment Industries by Sex in Marietta
The Marietta industries that see more men than women are Agriculture, Fishing & Hunting (100.0%), Construction (90.6%), and Transportation & Warehousing (89.4%), whereas the industries that tend to have a higher number of women are Mining, Quarrying, & Extraction (100.0%), Enterprise Management (100.0%), and Health Care & Social Assistance (72.7%).
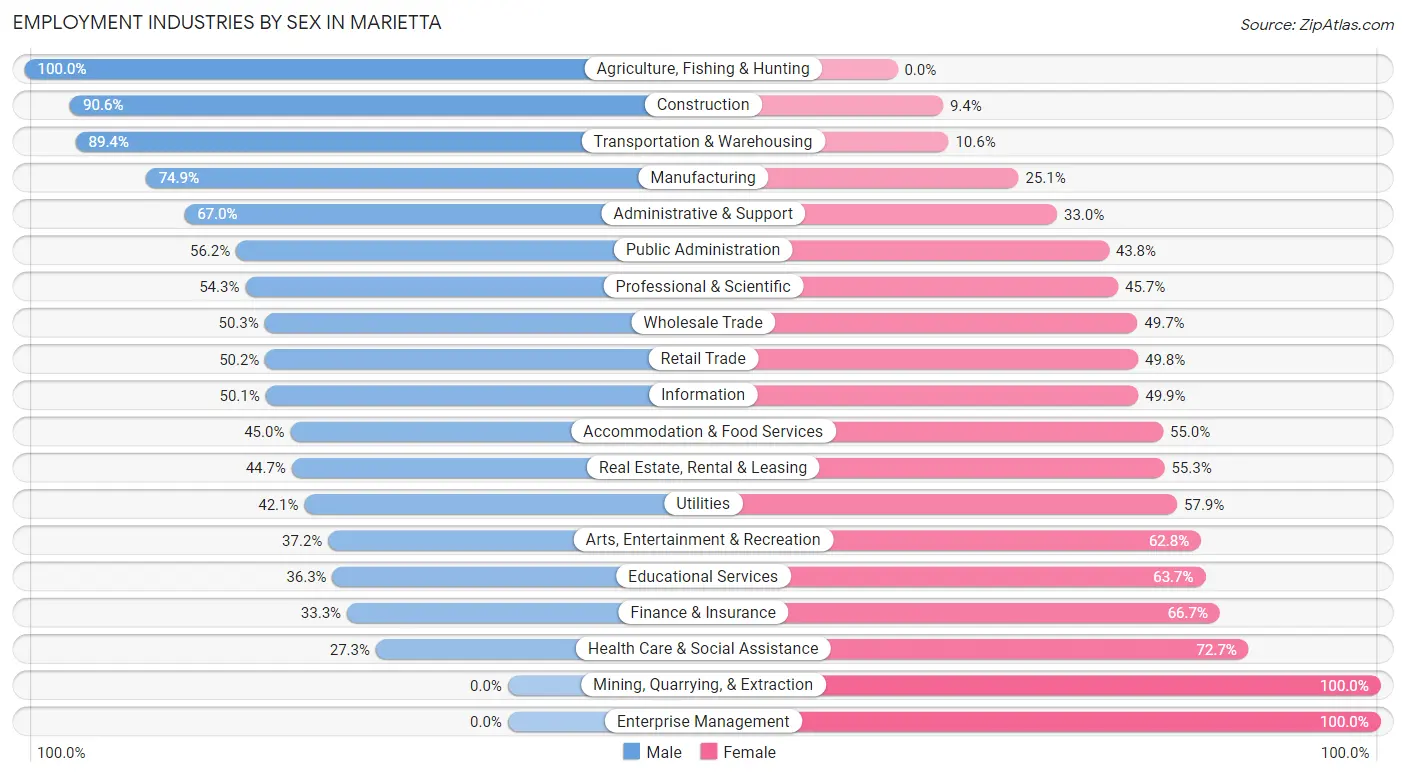
| Industry | Male | Female |
| Agriculture, Fishing & Hunting | 53 (100.0%) | 0 (0.0%) |
| Mining, Quarrying, & Extraction | 0 (0.0%) | 24 (100.0%) |
| Construction | 2,861 (90.6%) | 298 (9.4%) |
| Manufacturing | 1,425 (74.9%) | 477 (25.1%) |
| Wholesale Trade | 458 (50.3%) | 452 (49.7%) |
| Retail Trade | 1,656 (50.2%) | 1,643 (49.8%) |
| Transportation & Warehousing | 1,294 (89.4%) | 153 (10.6%) |
| Utilities | 48 (42.1%) | 66 (57.9%) |
| Information | 390 (50.1%) | 388 (49.9%) |
| Finance & Insurance | 512 (33.3%) | 1,026 (66.7%) |
| Real Estate, Rental & Leasing | 398 (44.7%) | 492 (55.3%) |
| Professional & Scientific | 1,862 (54.3%) | 1,565 (45.7%) |
| Enterprise Management | 0 (0.0%) | 23 (100.0%) |
| Administrative & Support | 1,303 (67.0%) | 643 (33.0%) |
| Educational Services | 992 (36.3%) | 1,742 (63.7%) |
| Health Care & Social Assistance | 997 (27.3%) | 2,654 (72.7%) |
| Arts, Entertainment & Recreation | 284 (37.2%) | 480 (62.8%) |
| Accommodation & Food Services | 1,275 (45.0%) | 1,557 (55.0%) |
| Public Administration | 587 (56.2%) | 457 (43.8%) |
| Total | 17,425 (53.7%) | 14,995 (46.3%) |
Education in Marietta
School Enrollment in Marietta
The most common levels of schooling among the 15,605 students in Marietta are college / undergraduate (4,704 | 30.1%), middle school (2,777 | 17.8%), and high school (2,569 | 16.5%).
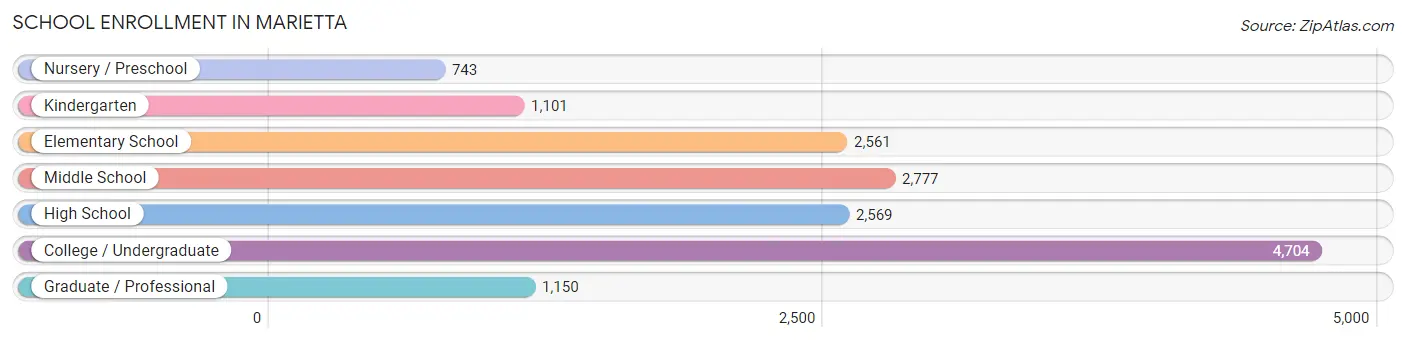
| School Level | # Students | % Students |
| Nursery / Preschool | 743 | 4.8% |
| Kindergarten | 1,101 | 7.1% |
| Elementary School | 2,561 | 16.4% |
| Middle School | 2,777 | 17.8% |
| High School | 2,569 | 16.5% |
| College / Undergraduate | 4,704 | 30.1% |
| Graduate / Professional | 1,150 | 7.4% |
| Total | 15,605 | 100.0% |
School Enrollment by Age by Funding Source in Marietta
Out of a total of 15,605 students who are enrolled in schools in Marietta, 2,434 (15.6%) attend a private institution, while the remaining 13,171 (84.4%) are enrolled in public schools. The age group of 3 to 4 year olds has the highest likelihood of being enrolled in private schools, with 265 (51.9% in the age bracket) enrolled. Conversely, the age group of 5 to 9 year old has the lowest likelihood of being enrolled in a private school, with 3,155 (91.9% in the age bracket) attending a public institution.
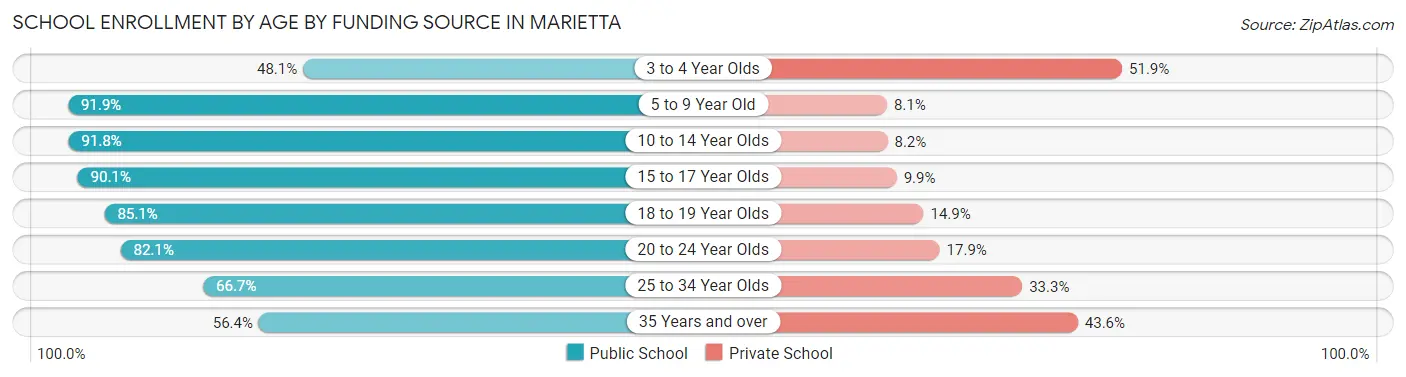
| Age Bracket | Public School | Private School |
| 3 to 4 Year Olds | 246 (48.1%) | 265 (51.9%) |
| 5 to 9 Year Old | 3,155 (91.9%) | 277 (8.1%) |
| 10 to 14 Year Olds | 3,406 (91.8%) | 303 (8.2%) |
| 15 to 17 Year Olds | 1,451 (90.1%) | 159 (9.9%) |
| 18 to 19 Year Olds | 2,031 (85.1%) | 355 (14.9%) |
| 20 to 24 Year Olds | 1,644 (82.1%) | 358 (17.9%) |
| 25 to 34 Year Olds | 855 (66.7%) | 426 (33.3%) |
| 35 Years and over | 380 (56.4%) | 294 (43.6%) |
| Total | 13,171 (84.4%) | 2,434 (15.6%) |
Educational Attainment by Field of Study in Marietta
Business (4,850 | 24.9%), social sciences (1,739 | 8.9%), education (1,705 | 8.7%), engineering (1,641 | 8.4%), and science & technology (1,495 | 7.7%) are the most common fields of study among 19,500 individuals in Marietta who have obtained a bachelor's degree or higher.
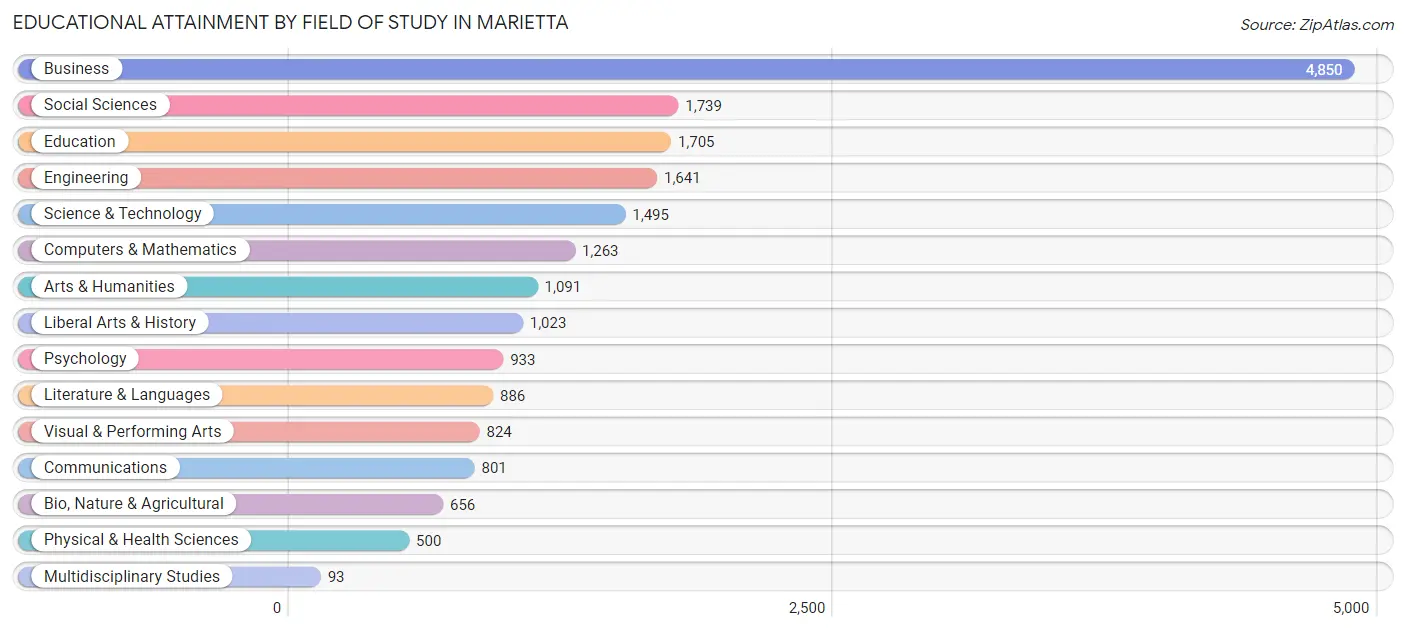
| Field of Study | # Graduates | % Graduates |
| Computers & Mathematics | 1,263 | 6.5% |
| Bio, Nature & Agricultural | 656 | 3.4% |
| Physical & Health Sciences | 500 | 2.6% |
| Psychology | 933 | 4.8% |
| Social Sciences | 1,739 | 8.9% |
| Engineering | 1,641 | 8.4% |
| Multidisciplinary Studies | 93 | 0.5% |
| Science & Technology | 1,495 | 7.7% |
| Business | 4,850 | 24.9% |
| Education | 1,705 | 8.7% |
| Literature & Languages | 886 | 4.5% |
| Liberal Arts & History | 1,023 | 5.2% |
| Visual & Performing Arts | 824 | 4.2% |
| Communications | 801 | 4.1% |
| Arts & Humanities | 1,091 | 5.6% |
| Total | 19,500 | 100.0% |
Transportation & Commute in Marietta
Vehicle Availability by Sex in Marietta
The most prevalent vehicle ownership categories in Marietta are males with 2 vehicles (7,165, accounting for 43.0%) and females with 2 vehicles (6,017, making up 49.0%).
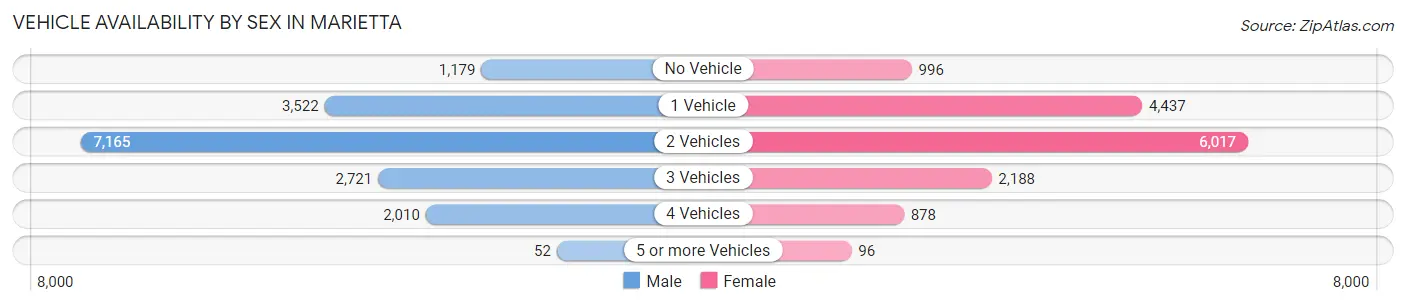
| Vehicles Available | Male | Female |
| No Vehicle | 1,179 (7.1%) | 996 (6.8%) |
| 1 Vehicle | 3,522 (21.1%) | 4,437 (30.4%) |
| 2 Vehicles | 7,165 (43.0%) | 6,017 (41.2%) |
| 3 Vehicles | 2,721 (16.3%) | 2,188 (15.0%) |
| 4 Vehicles | 2,010 (12.1%) | 878 (6.0%) |
| 5 or more Vehicles | 52 (0.3%) | 96 (0.7%) |
| Total | 16,649 (100.0%) | 14,612 (100.0%) |
Commute Time in Marietta
The most frequently occuring commute durations in Marietta are 30 to 34 minutes (5,774 commuters, 21.4%), 20 to 24 minutes (3,882 commuters, 14.4%), and 15 to 19 minutes (3,387 commuters, 12.6%).
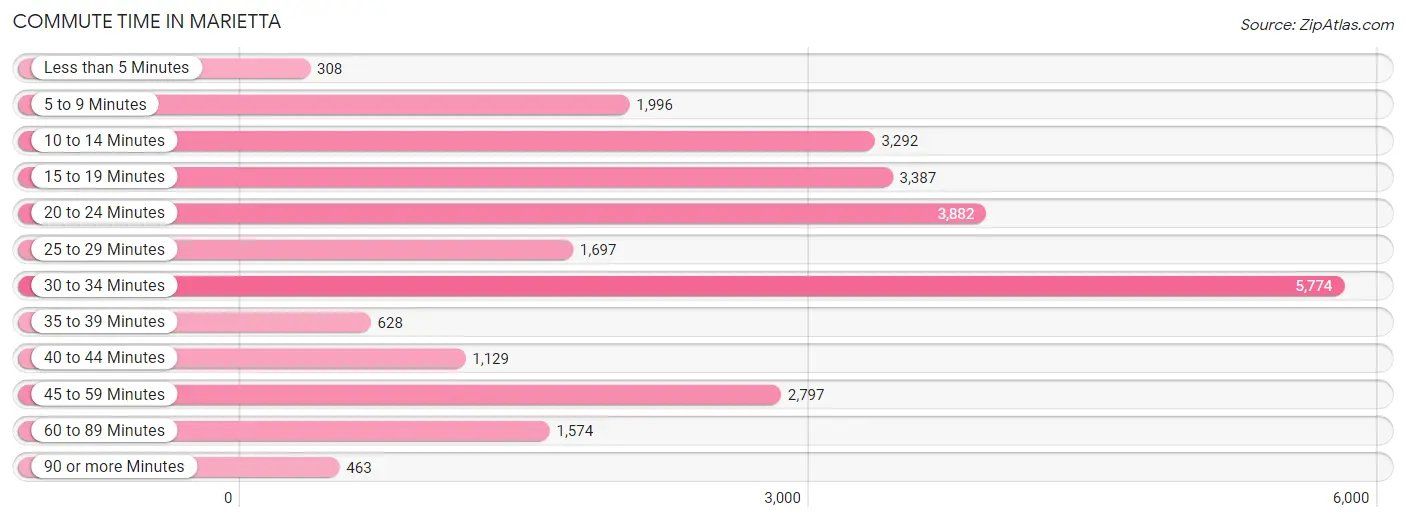
| Commute Time | # Commuters | % Commuters |
| Less than 5 Minutes | 308 | 1.1% |
| 5 to 9 Minutes | 1,996 | 7.4% |
| 10 to 14 Minutes | 3,292 | 12.2% |
| 15 to 19 Minutes | 3,387 | 12.6% |
| 20 to 24 Minutes | 3,882 | 14.4% |
| 25 to 29 Minutes | 1,697 | 6.3% |
| 30 to 34 Minutes | 5,774 | 21.4% |
| 35 to 39 Minutes | 628 | 2.3% |
| 40 to 44 Minutes | 1,129 | 4.2% |
| 45 to 59 Minutes | 2,797 | 10.4% |
| 60 to 89 Minutes | 1,574 | 5.9% |
| 90 or more Minutes | 463 | 1.7% |
Commute Time by Sex in Marietta
The most common commute times in Marietta are 30 to 34 minutes (3,635 commuters, 24.4%) for males and 20 to 24 minutes (2,142 commuters, 17.8%) for females.
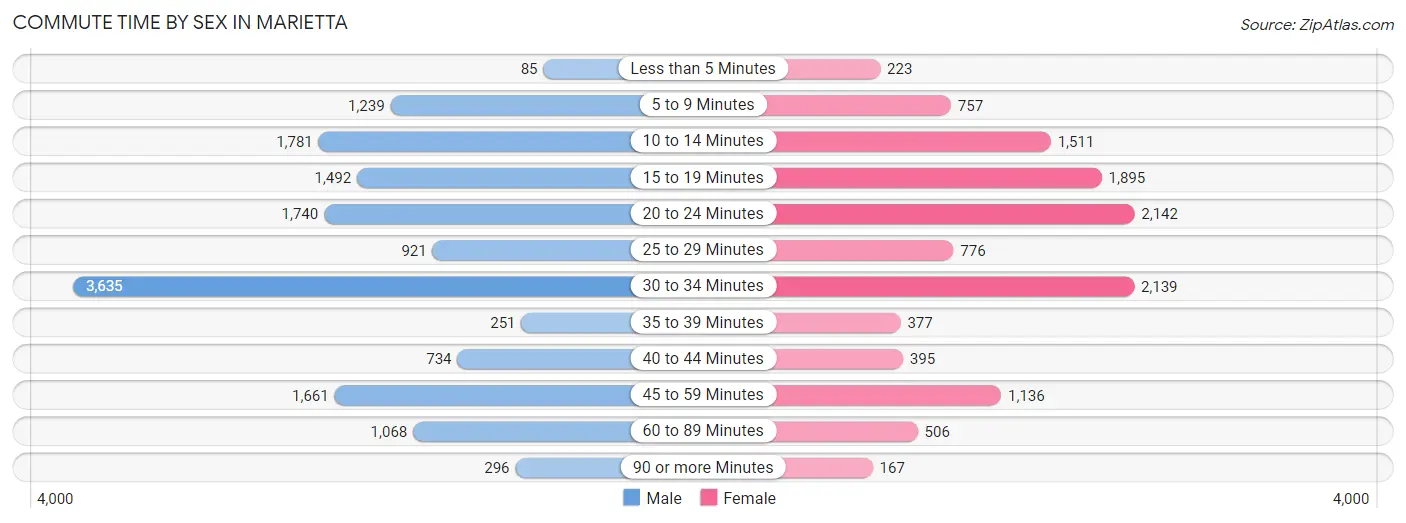
| Commute Time | Male | Female |
| Less than 5 Minutes | 85 (0.6%) | 223 (1.8%) |
| 5 to 9 Minutes | 1,239 (8.3%) | 757 (6.3%) |
| 10 to 14 Minutes | 1,781 (11.9%) | 1,511 (12.6%) |
| 15 to 19 Minutes | 1,492 (10.0%) | 1,895 (15.8%) |
| 20 to 24 Minutes | 1,740 (11.7%) | 2,142 (17.8%) |
| 25 to 29 Minutes | 921 (6.2%) | 776 (6.5%) |
| 30 to 34 Minutes | 3,635 (24.4%) | 2,139 (17.8%) |
| 35 to 39 Minutes | 251 (1.7%) | 377 (3.1%) |
| 40 to 44 Minutes | 734 (4.9%) | 395 (3.3%) |
| 45 to 59 Minutes | 1,661 (11.2%) | 1,136 (9.5%) |
| 60 to 89 Minutes | 1,068 (7.2%) | 506 (4.2%) |
| 90 or more Minutes | 296 (2.0%) | 167 (1.4%) |
Time of Departure to Work by Sex in Marietta
The most frequent times of departure to work in Marietta are 7:00 AM to 7:29 AM (2,320, 15.6%) for males and 8:00 AM to 8:29 AM (1,830, 15.2%) for females.
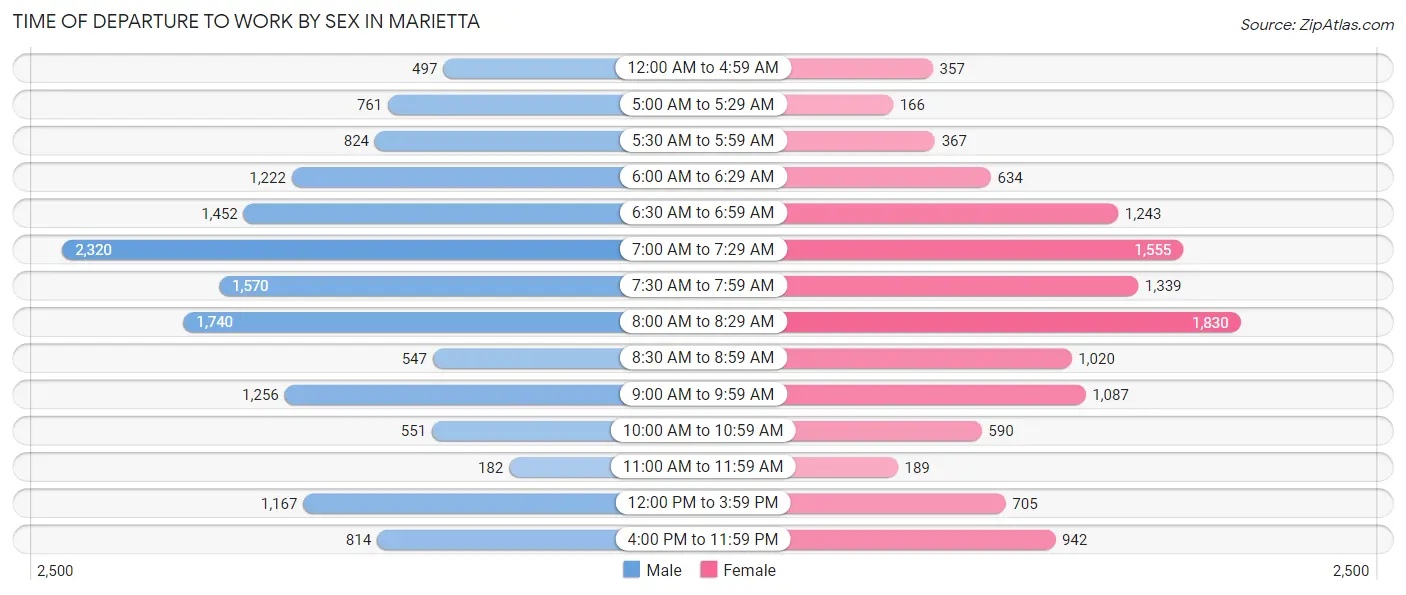
| Time of Departure | Male | Female |
| 12:00 AM to 4:59 AM | 497 (3.3%) | 357 (3.0%) |
| 5:00 AM to 5:29 AM | 761 (5.1%) | 166 (1.4%) |
| 5:30 AM to 5:59 AM | 824 (5.5%) | 367 (3.0%) |
| 6:00 AM to 6:29 AM | 1,222 (8.2%) | 634 (5.3%) |
| 6:30 AM to 6:59 AM | 1,452 (9.7%) | 1,243 (10.3%) |
| 7:00 AM to 7:29 AM | 2,320 (15.6%) | 1,555 (12.9%) |
| 7:30 AM to 7:59 AM | 1,570 (10.5%) | 1,339 (11.1%) |
| 8:00 AM to 8:29 AM | 1,740 (11.7%) | 1,830 (15.2%) |
| 8:30 AM to 8:59 AM | 547 (3.7%) | 1,020 (8.5%) |
| 9:00 AM to 9:59 AM | 1,256 (8.4%) | 1,087 (9.0%) |
| 10:00 AM to 10:59 AM | 551 (3.7%) | 590 (4.9%) |
| 11:00 AM to 11:59 AM | 182 (1.2%) | 189 (1.6%) |
| 12:00 PM to 3:59 PM | 1,167 (7.8%) | 705 (5.9%) |
| 4:00 PM to 11:59 PM | 814 (5.5%) | 942 (7.8%) |
| Total | 14,903 (100.0%) | 12,024 (100.0%) |
Housing Occupancy in Marietta
Occupancy by Ownership in Marietta
Of the total 24,403 dwellings in Marietta, owner-occupied units account for 11,284 (46.2%), while renter-occupied units make up 13,119 (53.8%).
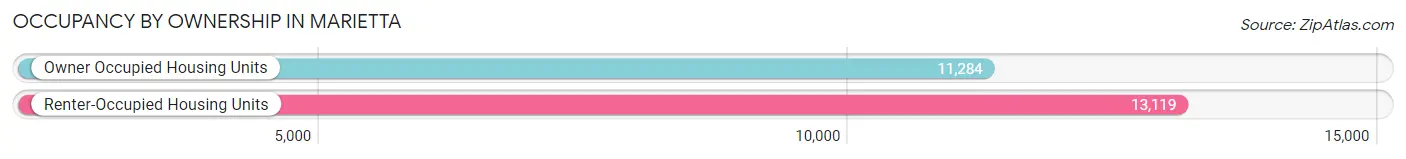
| Occupancy | # Housing Units | % Housing Units |
| Owner Occupied Housing Units | 11,284 | 46.2% |
| Renter-Occupied Housing Units | 13,119 | 53.8% |
| Total Occupied Housing Units | 24,403 | 100.0% |
Occupancy by Household Size in Marietta
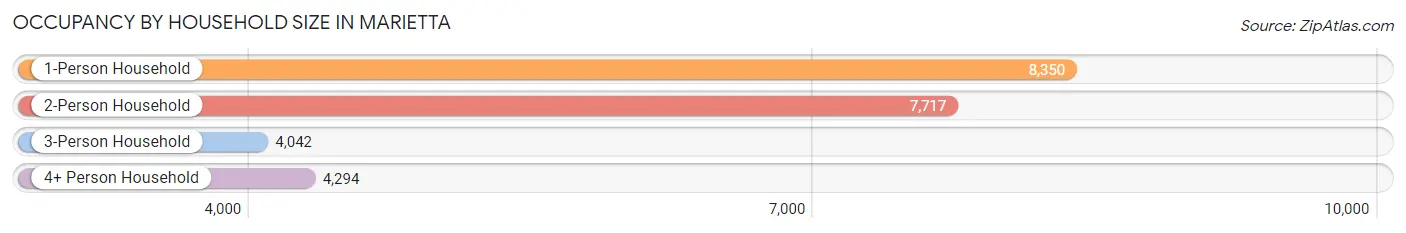
| Household Size | # Housing Units | % Housing Units |
| 1-Person Household | 8,350 | 34.2% |
| 2-Person Household | 7,717 | 31.6% |
| 3-Person Household | 4,042 | 16.6% |
| 4+ Person Household | 4,294 | 17.6% |
| Total Housing Units | 24,403 | 100.0% |
Occupancy by Ownership by Household Size in Marietta
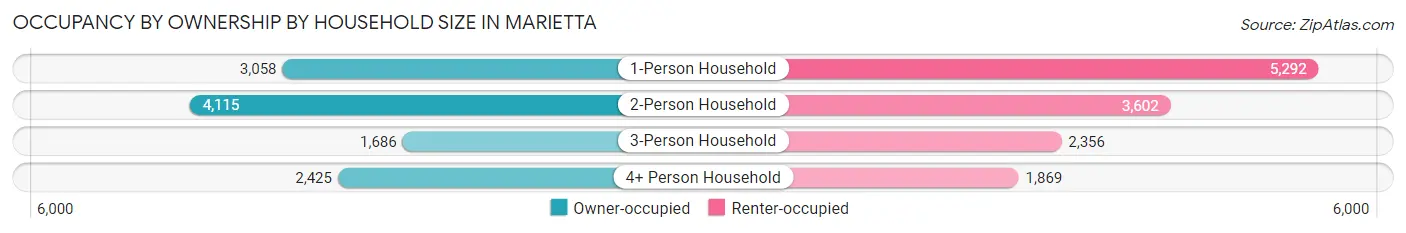
| Household Size | Owner-occupied | Renter-occupied |
| 1-Person Household | 3,058 (36.6%) | 5,292 (63.4%) |
| 2-Person Household | 4,115 (53.3%) | 3,602 (46.7%) |
| 3-Person Household | 1,686 (41.7%) | 2,356 (58.3%) |
| 4+ Person Household | 2,425 (56.5%) | 1,869 (43.5%) |
| Total Housing Units | 11,284 (46.2%) | 13,119 (53.8%) |
Occupancy by Educational Attainment in Marietta
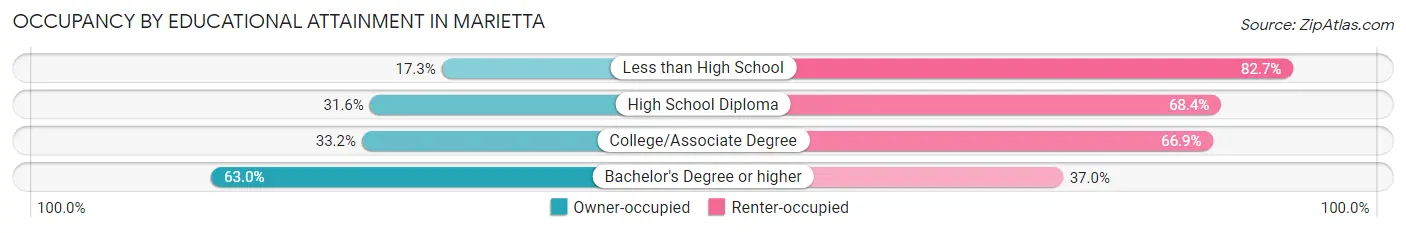
| Household Size | Owner-occupied | Renter-occupied |
| Less than High School | 375 (17.3%) | 1,789 (82.7%) |
| High School Diploma | 1,013 (31.6%) | 2,193 (68.4%) |
| College/Associate Degree | 2,327 (33.2%) | 4,693 (66.8%) |
| Bachelor's Degree or higher | 7,569 (63.0%) | 4,444 (37.0%) |
Occupancy by Age of Householder in Marietta
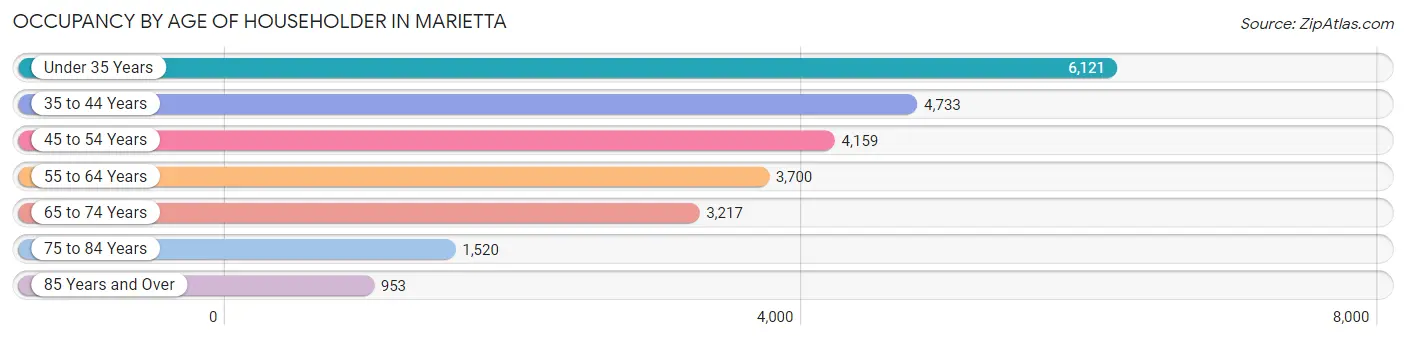
| Age Bracket | # Households | % Households |
| Under 35 Years | 6,121 | 25.1% |
| 35 to 44 Years | 4,733 | 19.4% |
| 45 to 54 Years | 4,159 | 17.0% |
| 55 to 64 Years | 3,700 | 15.2% |
| 65 to 74 Years | 3,217 | 13.2% |
| 75 to 84 Years | 1,520 | 6.2% |
| 85 Years and Over | 953 | 3.9% |
| Total | 24,403 | 100.0% |
Housing Finances in Marietta
Median Income by Occupancy in Marietta
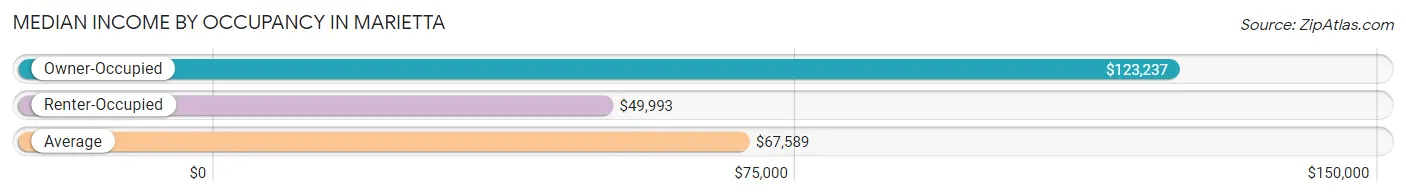
| Occupancy Type | # Households | Median Income |
| Owner-Occupied | 11,284 (46.2%) | $123,237 |
| Renter-Occupied | 13,119 (53.8%) | $49,993 |
| Average | 24,403 (100.0%) | $67,589 |
Occupancy by Householder Income Bracket in Marietta
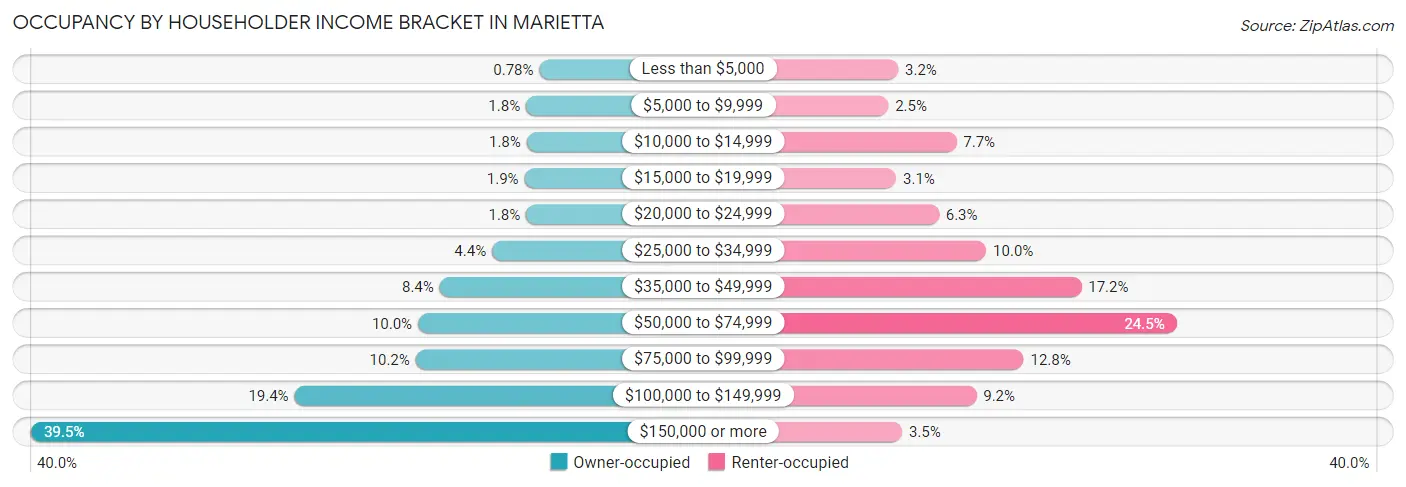
| Income Bracket | Owner-occupied | Renter-occupied |
| Less than $5,000 | 88 (0.8%) | 425 (3.2%) |
| $5,000 to $9,999 | 203 (1.8%) | 327 (2.5%) |
| $10,000 to $14,999 | 197 (1.8%) | 1,008 (7.7%) |
| $15,000 to $19,999 | 217 (1.9%) | 406 (3.1%) |
| $20,000 to $24,999 | 202 (1.8%) | 832 (6.3%) |
| $25,000 to $34,999 | 495 (4.4%) | 1,305 (10.0%) |
| $35,000 to $49,999 | 946 (8.4%) | 2,257 (17.2%) |
| $50,000 to $74,999 | 1,132 (10.0%) | 3,208 (24.4%) |
| $75,000 to $99,999 | 1,152 (10.2%) | 1,679 (12.8%) |
| $100,000 to $149,999 | 2,194 (19.4%) | 1,207 (9.2%) |
| $150,000 or more | 4,458 (39.5%) | 465 (3.5%) |
| Total | 11,284 (100.0%) | 13,119 (100.0%) |
Monthly Housing Cost Tiers in Marietta
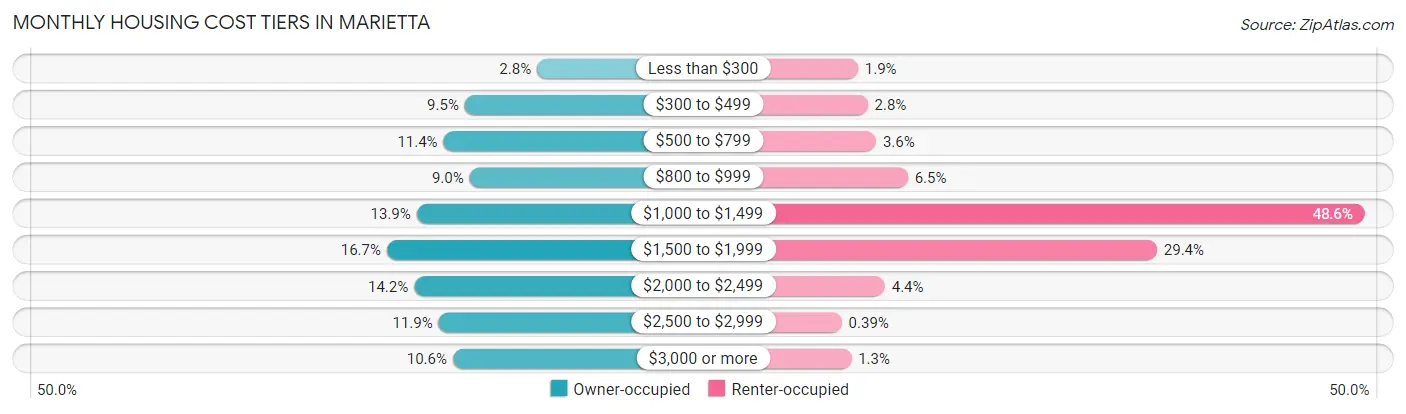
| Monthly Cost | Owner-occupied | Renter-occupied |
| Less than $300 | 319 (2.8%) | 247 (1.9%) |
| $300 to $499 | 1,070 (9.5%) | 365 (2.8%) |
| $500 to $799 | 1,291 (11.4%) | 466 (3.5%) |
| $800 to $999 | 1,020 (9.0%) | 849 (6.5%) |
| $1,000 to $1,499 | 1,571 (13.9%) | 6,369 (48.5%) |
| $1,500 to $1,999 | 1,880 (16.7%) | 3,858 (29.4%) |
| $2,000 to $2,499 | 1,597 (14.1%) | 572 (4.4%) |
| $2,500 to $2,999 | 1,342 (11.9%) | 51 (0.4%) |
| $3,000 or more | 1,194 (10.6%) | 166 (1.3%) |
| Total | 11,284 (100.0%) | 13,119 (100.0%) |
Physical Housing Characteristics in Marietta
Housing Structures in Marietta
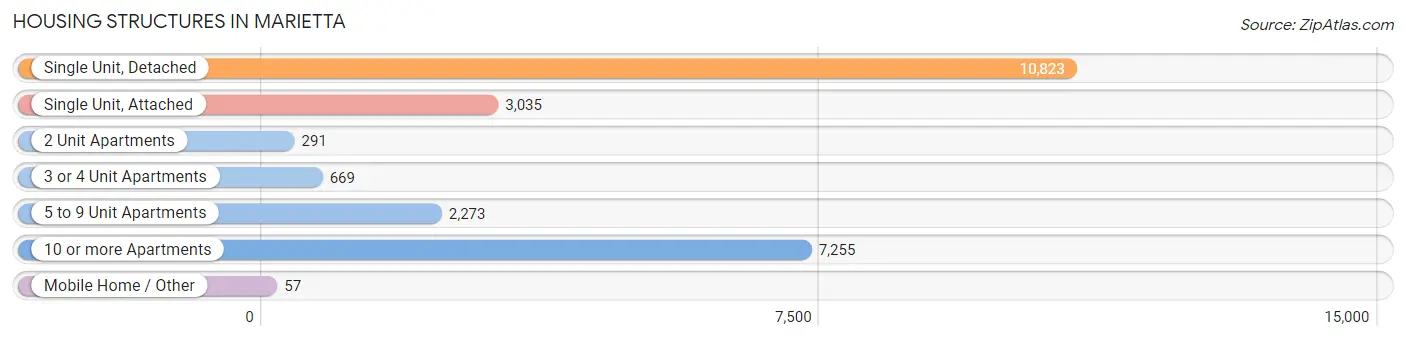
| Structure Type | # Housing Units | % Housing Units |
| Single Unit, Detached | 10,823 | 44.4% |
| Single Unit, Attached | 3,035 | 12.4% |
| 2 Unit Apartments | 291 | 1.2% |
| 3 or 4 Unit Apartments | 669 | 2.7% |
| 5 to 9 Unit Apartments | 2,273 | 9.3% |
| 10 or more Apartments | 7,255 | 29.7% |
| Mobile Home / Other | 57 | 0.2% |
| Total | 24,403 | 100.0% |
Housing Structures by Occupancy in Marietta
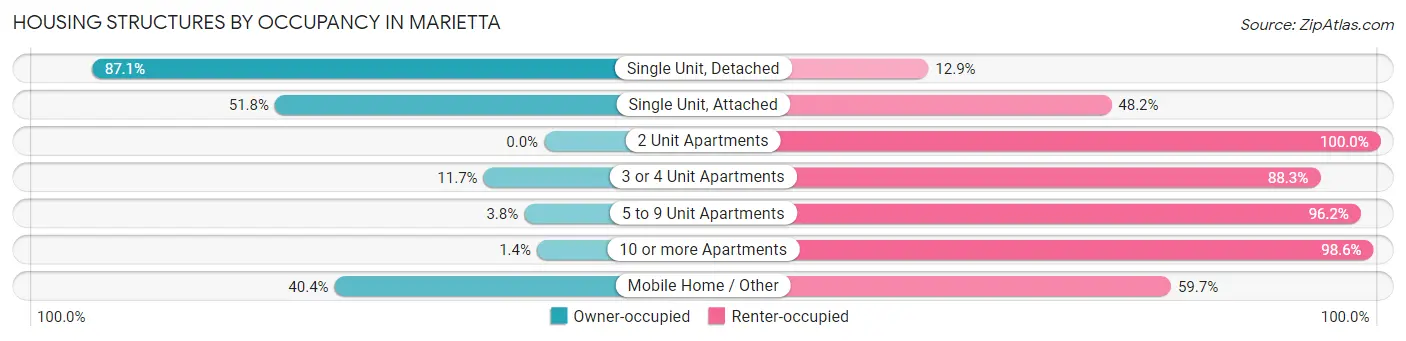
| Structure Type | Owner-occupied | Renter-occupied |
| Single Unit, Detached | 9,423 (87.1%) | 1,400 (12.9%) |
| Single Unit, Attached | 1,573 (51.8%) | 1,462 (48.2%) |
| 2 Unit Apartments | 0 (0.0%) | 291 (100.0%) |
| 3 or 4 Unit Apartments | 78 (11.7%) | 591 (88.3%) |
| 5 to 9 Unit Apartments | 87 (3.8%) | 2,186 (96.2%) |
| 10 or more Apartments | 100 (1.4%) | 7,155 (98.6%) |
| Mobile Home / Other | 23 (40.4%) | 34 (59.7%) |
| Total | 11,284 (46.2%) | 13,119 (53.8%) |
Housing Structures by Number of Rooms in Marietta
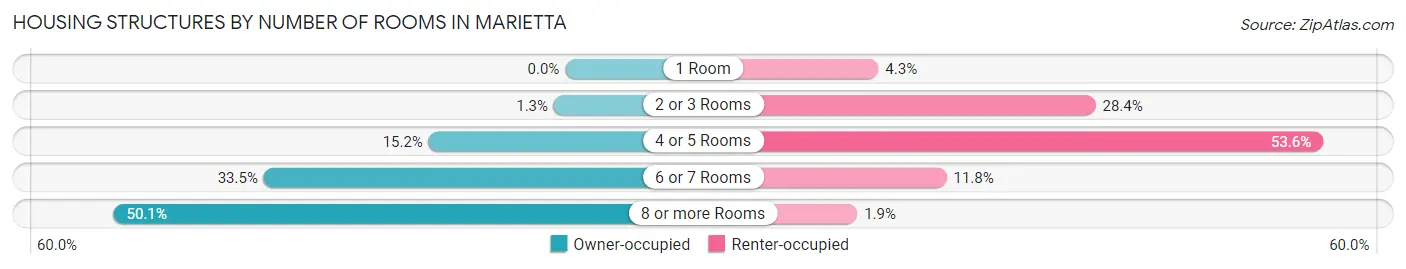
| Number of Rooms | Owner-occupied | Renter-occupied |
| 1 Room | 0 (0.0%) | 560 (4.3%) |
| 2 or 3 Rooms | 142 (1.3%) | 3,722 (28.4%) |
| 4 or 5 Rooms | 1,710 (15.1%) | 7,033 (53.6%) |
| 6 or 7 Rooms | 3,776 (33.5%) | 1,552 (11.8%) |
| 8 or more Rooms | 5,656 (50.1%) | 252 (1.9%) |
| Total | 11,284 (100.0%) | 13,119 (100.0%) |
Housing Structure by Heating Type in Marietta
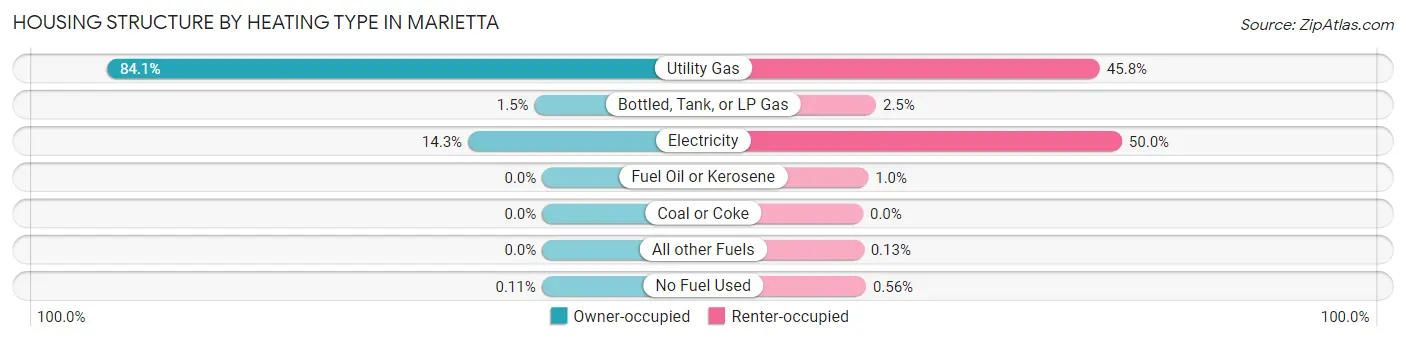
| Heating Type | Owner-occupied | Renter-occupied |
| Utility Gas | 9,487 (84.1%) | 6,004 (45.8%) |
| Bottled, Tank, or LP Gas | 167 (1.5%) | 329 (2.5%) |
| Electricity | 1,618 (14.3%) | 6,562 (50.0%) |
| Fuel Oil or Kerosene | 0 (0.0%) | 133 (1.0%) |
| Coal or Coke | 0 (0.0%) | 0 (0.0%) |
| All other Fuels | 0 (0.0%) | 17 (0.1%) |
| No Fuel Used | 12 (0.1%) | 74 (0.6%) |
| Total | 11,284 (100.0%) | 13,119 (100.0%) |
Household Vehicle Usage in Marietta
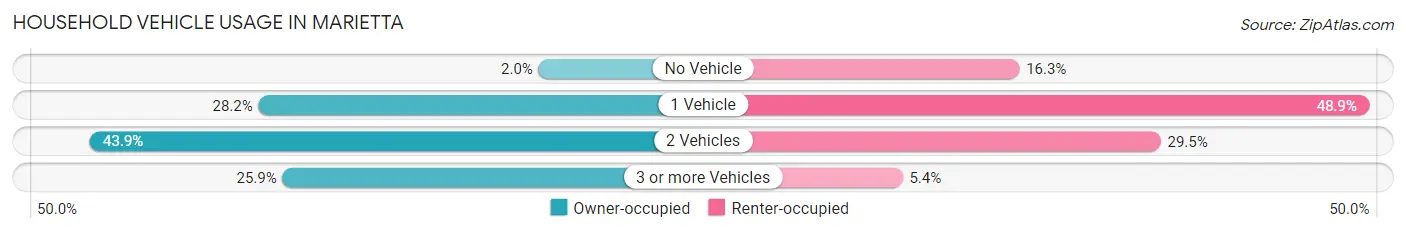
| Vehicles per Household | Owner-occupied | Renter-occupied |
| No Vehicle | 227 (2.0%) | 2,135 (16.3%) |
| 1 Vehicle | 3,178 (28.2%) | 6,415 (48.9%) |
| 2 Vehicles | 4,954 (43.9%) | 3,865 (29.5%) |
| 3 or more Vehicles | 2,925 (25.9%) | 704 (5.4%) |
| Total | 11,284 (100.0%) | 13,119 (100.0%) |
Real Estate & Mortgages in Marietta
Real Estate and Mortgage Overview in Marietta
| Characteristic | Without Mortgage | With Mortgage |
| Housing Units | 3,407 | 7,877 |
| Median Property Value | $344,200 | $388,900 |
| Median Household Income | $86,420 | $3,530 |
| Monthly Housing Costs | $569 | $1,194 |
| Real Estate Taxes | $1,504 | $35 |
Property Value by Mortgage Status in Marietta
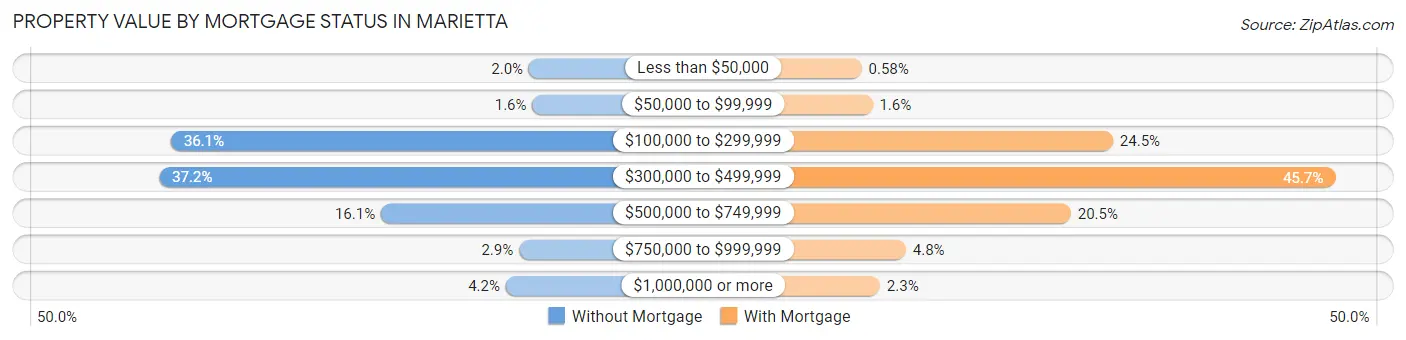
| Property Value | Without Mortgage | With Mortgage |
| Less than $50,000 | 67 (2.0%) | 46 (0.6%) |
| $50,000 to $99,999 | 56 (1.6%) | 127 (1.6%) |
| $100,000 to $299,999 | 1,229 (36.1%) | 1,931 (24.5%) |
| $300,000 to $499,999 | 1,267 (37.2%) | 3,598 (45.7%) |
| $500,000 to $749,999 | 547 (16.1%) | 1,615 (20.5%) |
| $750,000 to $999,999 | 99 (2.9%) | 377 (4.8%) |
| $1,000,000 or more | 142 (4.2%) | 183 (2.3%) |
| Total | 3,407 (100.0%) | 7,877 (100.0%) |
Household Income by Mortgage Status in Marietta
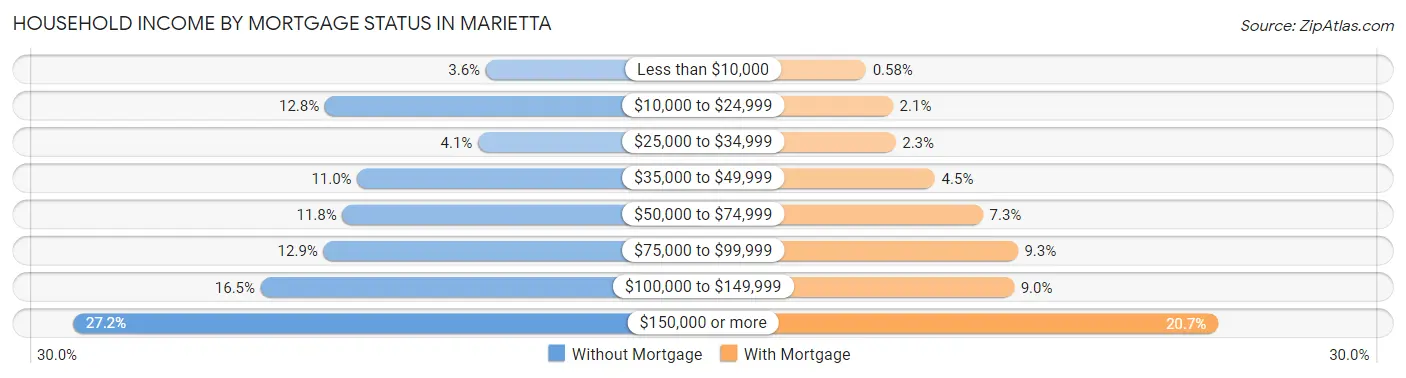
| Household Income | Without Mortgage | With Mortgage |
| Less than $10,000 | 124 (3.6%) | 46 (0.6%) |
| $10,000 to $24,999 | 437 (12.8%) | 167 (2.1%) |
| $25,000 to $34,999 | 139 (4.1%) | 179 (2.3%) |
| $35,000 to $49,999 | 374 (11.0%) | 356 (4.5%) |
| $50,000 to $74,999 | 403 (11.8%) | 572 (7.3%) |
| $75,000 to $99,999 | 440 (12.9%) | 729 (9.2%) |
| $100,000 to $149,999 | 562 (16.5%) | 712 (9.0%) |
| $150,000 or more | 928 (27.2%) | 1,632 (20.7%) |
| Total | 3,407 (100.0%) | 7,877 (100.0%) |
Property Value to Household Income Ratio in Marietta
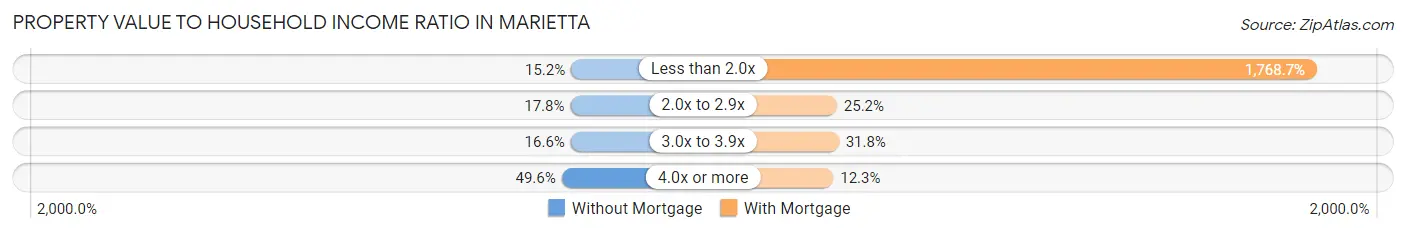
| Value-to-Income Ratio | Without Mortgage | With Mortgage |
| Less than 2.0x | 518 (15.2%) | 139,317 (1,768.7%) |
| 2.0x to 2.9x | 607 (17.8%) | 1,987 (25.2%) |
| 3.0x to 3.9x | 566 (16.6%) | 2,508 (31.8%) |
| 4.0x or more | 1,688 (49.5%) | 971 (12.3%) |
| Total | 3,407 (100.0%) | 7,877 (100.0%) |
Real Estate Taxes by Mortgage Status in Marietta
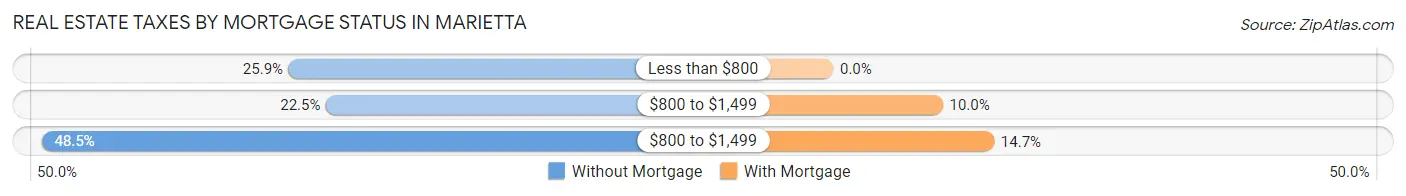
| Property Taxes | Without Mortgage | With Mortgage |
| Less than $800 | 881 (25.9%) | 0 (0.0%) |
| $800 to $1,499 | 765 (22.5%) | 788 (10.0%) |
| $800 to $1,499 | 1,651 (48.5%) | 1,157 (14.7%) |
| Total | 3,407 (100.0%) | 7,877 (100.0%) |
Health & Disability in Marietta
Health Insurance Coverage by Age in Marietta
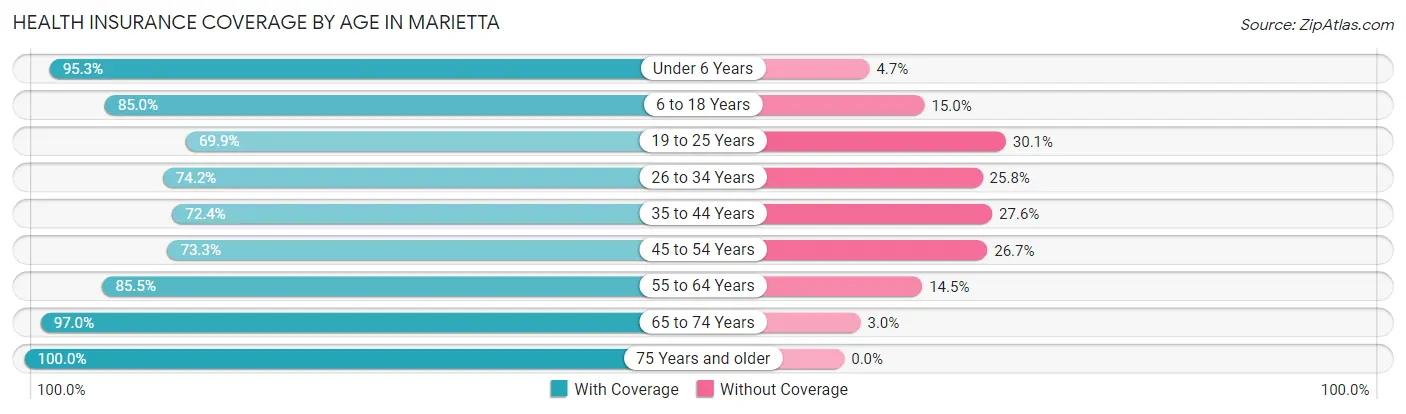
| Age Bracket | With Coverage | Without Coverage |
| Under 6 Years | 4,470 (95.3%) | 220 (4.7%) |
| 6 to 18 Years | 8,165 (85.0%) | 1,436 (15.0%) |
| 19 to 25 Years | 4,948 (69.9%) | 2,134 (30.1%) |
| 26 to 34 Years | 6,686 (74.2%) | 2,325 (25.8%) |
| 35 to 44 Years | 6,420 (72.4%) | 2,444 (27.6%) |
| 45 to 54 Years | 5,141 (73.3%) | 1,870 (26.7%) |
| 55 to 64 Years | 5,293 (85.5%) | 900 (14.5%) |
| 65 to 74 Years | 4,547 (97.0%) | 142 (3.0%) |
| 75 Years and older | 3,355 (100.0%) | 0 (0.0%) |
| Total | 49,025 (81.0%) | 11,471 (19.0%) |
Health Insurance Coverage by Citizenship Status in Marietta
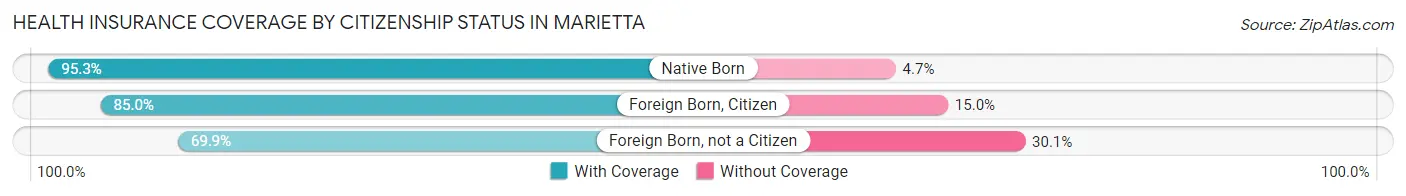
| Citizenship Status | With Coverage | Without Coverage |
| Native Born | 4,470 (95.3%) | 220 (4.7%) |
| Foreign Born, Citizen | 8,165 (85.0%) | 1,436 (15.0%) |
| Foreign Born, not a Citizen | 4,948 (69.9%) | 2,134 (30.1%) |
Health Insurance Coverage by Household Income in Marietta
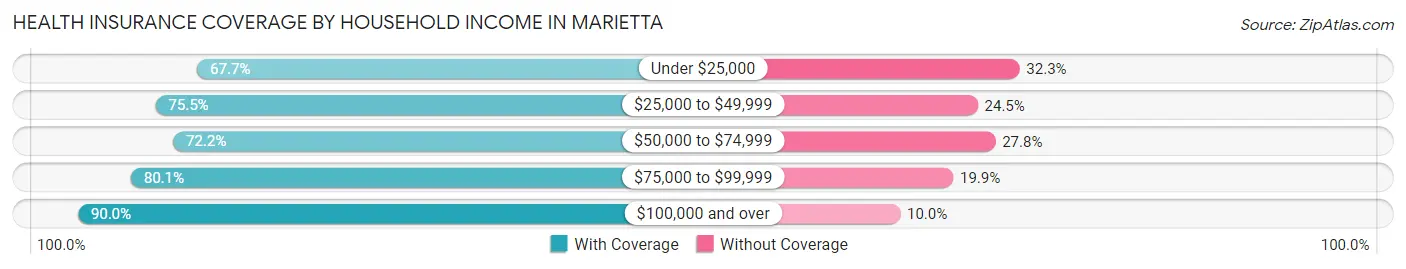
| Household Income | With Coverage | Without Coverage |
| Under $25,000 | 4,506 (67.7%) | 2,154 (32.3%) |
| $25,000 to $49,999 | 7,663 (75.5%) | 2,488 (24.5%) |
| $50,000 to $74,999 | 7,296 (72.2%) | 2,810 (27.8%) |
| $75,000 to $99,999 | 5,364 (80.1%) | 1,333 (19.9%) |
| $100,000 and over | 22,208 (90.0%) | 2,463 (10.0%) |
Public vs Private Health Insurance Coverage by Age in Marietta
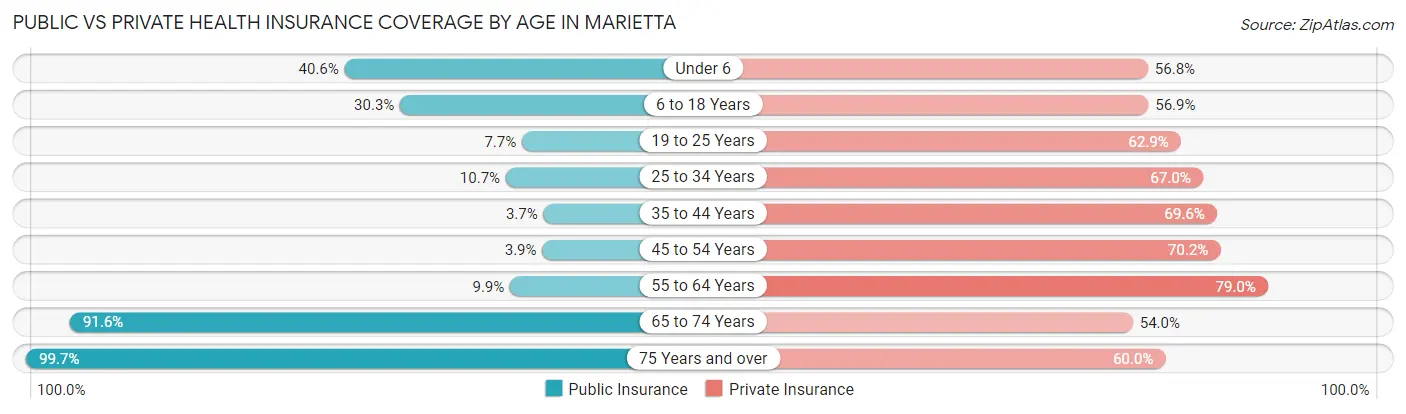
| Age Bracket | Public Insurance | Private Insurance |
| Under 6 | 1,904 (40.6%) | 2,665 (56.8%) |
| 6 to 18 Years | 2,908 (30.3%) | 5,462 (56.9%) |
| 19 to 25 Years | 543 (7.7%) | 4,454 (62.9%) |
| 25 to 34 Years | 961 (10.7%) | 6,035 (67.0%) |
| 35 to 44 Years | 326 (3.7%) | 6,167 (69.6%) |
| 45 to 54 Years | 273 (3.9%) | 4,923 (70.2%) |
| 55 to 64 Years | 612 (9.9%) | 4,895 (79.0%) |
| 65 to 74 Years | 4,294 (91.6%) | 2,533 (54.0%) |
| 75 Years and over | 3,346 (99.7%) | 2,014 (60.0%) |
| Total | 15,167 (25.1%) | 39,148 (64.7%) |
Disability Status by Sex by Age in Marietta
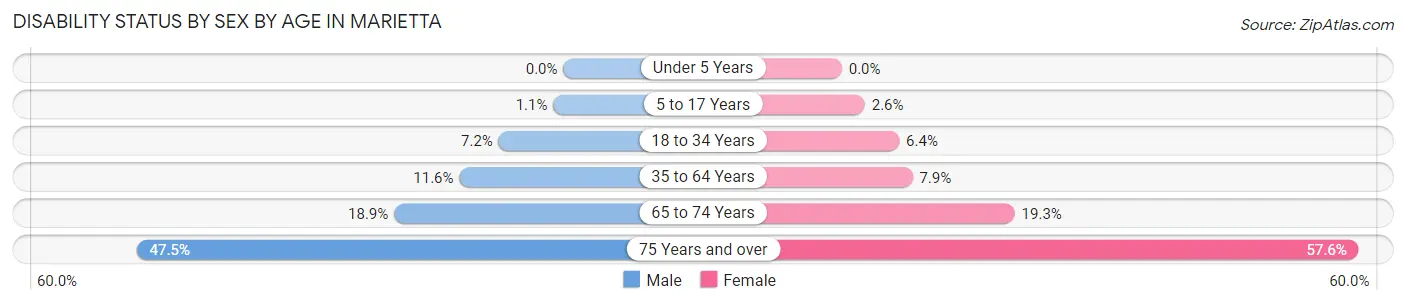
| Age Bracket | Male | Female |
| Under 5 Years | 0 (0.0%) | 0 (0.0%) |
| 5 to 17 Years | 48 (1.1%) | 121 (2.6%) |
| 18 to 34 Years | 672 (7.2%) | 532 (6.4%) |
| 35 to 64 Years | 1,270 (11.6%) | 874 (7.9%) |
| 65 to 74 Years | 354 (18.9%) | 541 (19.3%) |
| 75 Years and over | 507 (47.5%) | 1,317 (57.6%) |
Disability Class by Sex by Age in Marietta
Disability Class: Hearing Difficulty
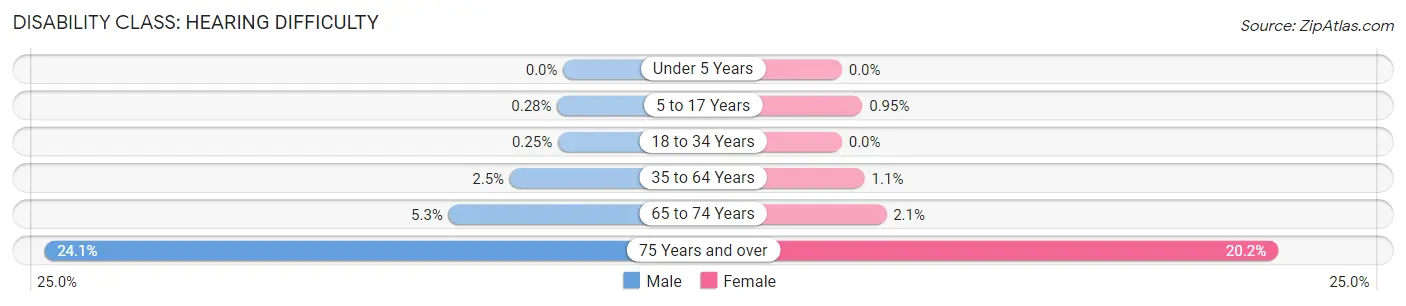
| Age Bracket | Male | Female |
| Under 5 Years | 0 (0.0%) | 0 (0.0%) |
| 5 to 17 Years | 12 (0.3%) | 45 (0.9%) |
| 18 to 34 Years | 23 (0.3%) | 0 (0.0%) |
| 35 to 64 Years | 272 (2.5%) | 118 (1.1%) |
| 65 to 74 Years | 100 (5.3%) | 58 (2.1%) |
| 75 Years and over | 257 (24.1%) | 463 (20.2%) |
Disability Class: Vision Difficulty
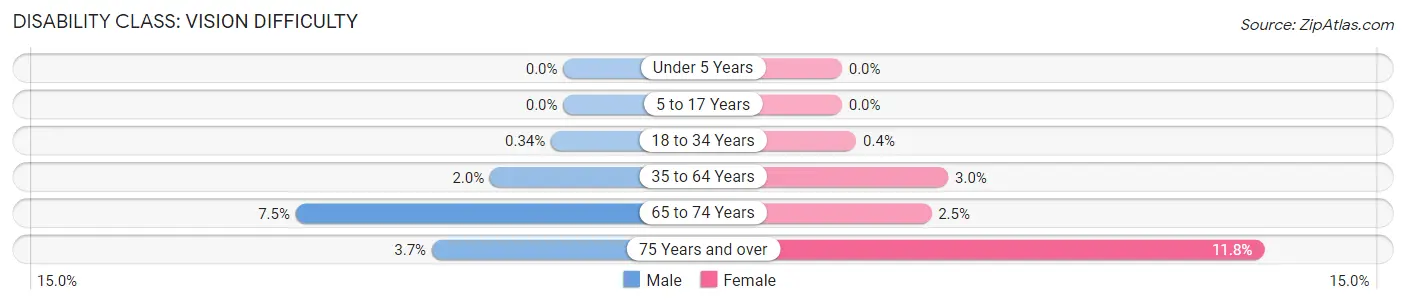
| Age Bracket | Male | Female |
| Under 5 Years | 0 (0.0%) | 0 (0.0%) |
| 5 to 17 Years | 0 (0.0%) | 0 (0.0%) |
| 18 to 34 Years | 32 (0.3%) | 33 (0.4%) |
| 35 to 64 Years | 224 (2.0%) | 329 (3.0%) |
| 65 to 74 Years | 140 (7.4%) | 70 (2.5%) |
| 75 Years and over | 39 (3.7%) | 269 (11.8%) |
Disability Class: Cognitive Difficulty
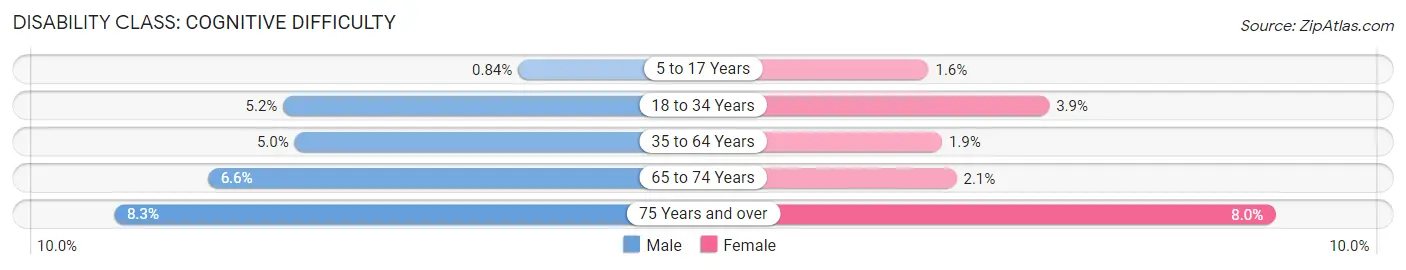
| Age Bracket | Male | Female |
| 5 to 17 Years | 36 (0.8%) | 76 (1.6%) |
| 18 to 34 Years | 485 (5.2%) | 321 (3.8%) |
| 35 to 64 Years | 547 (5.0%) | 206 (1.9%) |
| 65 to 74 Years | 124 (6.6%) | 60 (2.1%) |
| 75 Years and over | 89 (8.3%) | 184 (8.0%) |
Disability Class: Ambulatory Difficulty
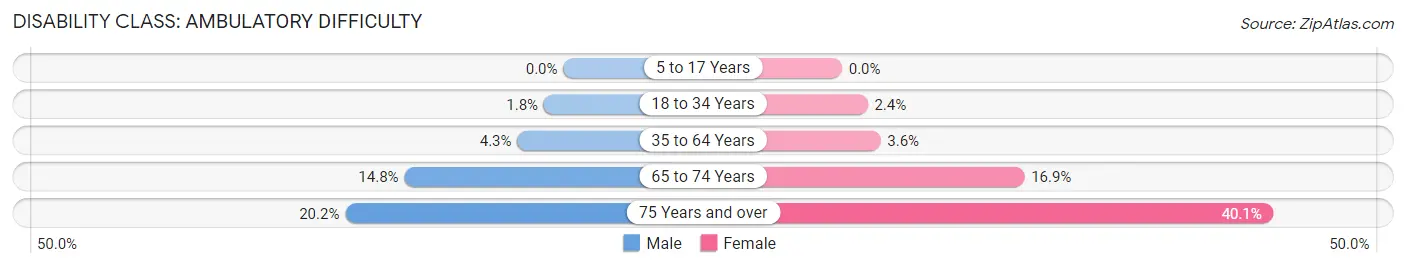
| Age Bracket | Male | Female |
| 5 to 17 Years | 0 (0.0%) | 0 (0.0%) |
| 18 to 34 Years | 168 (1.8%) | 198 (2.4%) |
| 35 to 64 Years | 468 (4.3%) | 397 (3.6%) |
| 65 to 74 Years | 277 (14.7%) | 476 (16.9%) |
| 75 Years and over | 216 (20.2%) | 917 (40.1%) |
Disability Class: Self-Care Difficulty
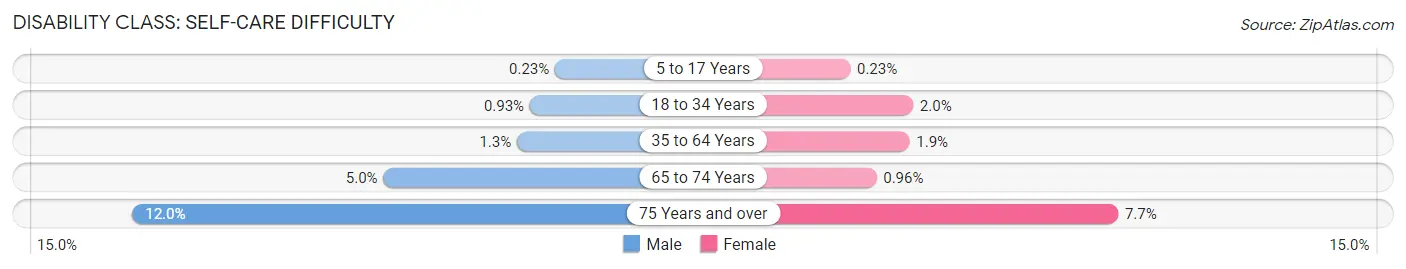
| Age Bracket | Male | Female |
| 5 to 17 Years | 10 (0.2%) | 11 (0.2%) |
| 18 to 34 Years | 87 (0.9%) | 165 (2.0%) |
| 35 to 64 Years | 141 (1.3%) | 209 (1.9%) |
| 65 to 74 Years | 94 (5.0%) | 27 (1.0%) |
| 75 Years and over | 128 (12.0%) | 176 (7.7%) |
Technology Access in Marietta
Computing Device Access in Marietta
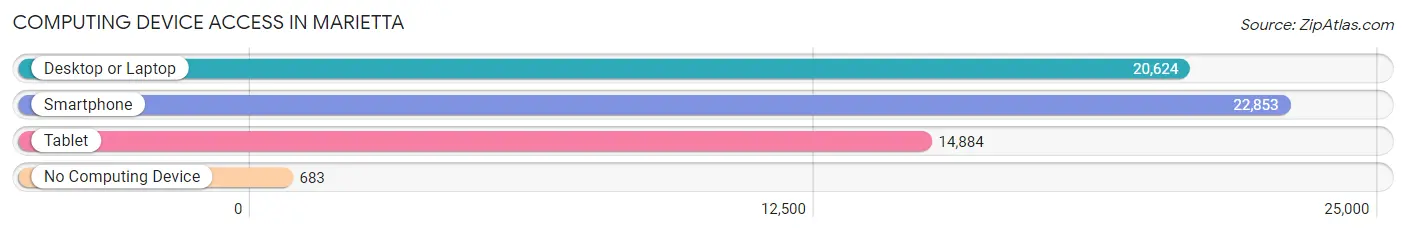
| Device Type | # Households | % Households |
| Desktop or Laptop | 20,624 | 84.5% |
| Smartphone | 22,853 | 93.6% |
| Tablet | 14,884 | 61.0% |
| No Computing Device | 683 | 2.8% |
| Total | 24,403 | 100.0% |
Internet Access in Marietta
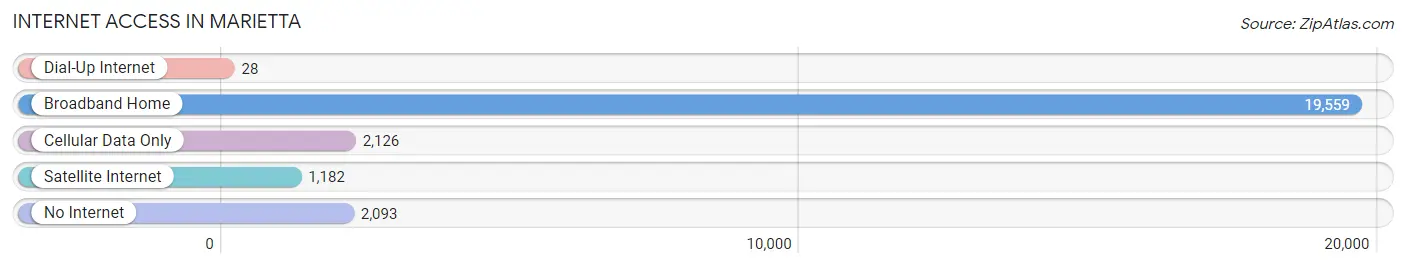
| Internet Type | # Households | % Households |
| Dial-Up Internet | 28 | 0.1% |
| Broadband Home | 19,559 | 80.1% |
| Cellular Data Only | 2,126 | 8.7% |
| Satellite Internet | 1,182 | 4.8% |
| No Internet | 2,093 | 8.6% |
| Total | 24,403 | 100.0% |
Marietta Summary
Marietta, Georgia is a city located in the northwestern part of the state, in Cobb County. It is the county seat and the largest city in the county. Marietta is located approximately 20 miles northwest of Atlanta and is part of the Atlanta metropolitan area. The city has a population of 61,048 as of the 2019 census, making it the largest city in Cobb County.
History
Marietta was founded in 1824 by a group of settlers led by General James Rozar, who named the city after his wife, Mary. The city was incorporated in 1834 and was the first permanent settlement in Cobb County. Marietta was an important center of the cotton trade in the 19th century and was the site of the Battle of Kennesaw Mountain during the Civil War. After the war, the city experienced a period of growth and development, becoming a major industrial center in the late 19th and early 20th centuries.
Geography
Marietta is located in northwestern Georgia, in Cobb County. It is situated at the confluence of the Chattahoochee and the Etowah rivers. The city covers an area of 24.3 square miles and has an elevation of 1,000 feet. The city is located approximately 20 miles northwest of Atlanta and is part of the Atlanta metropolitan area.
Economy
Marietta’s economy is largely based on manufacturing, retail, and services. The city is home to several large companies, including Lockheed Martin, Dobbins Air Reserve Base, and the Cobb County School District. The city also has a thriving tourism industry, with attractions such as the Marietta Square, the Marietta Museum of History, and the Gone with the Wind Museum.
Demographics
As of the 2019 census, Marietta had a population of 61,048. The racial makeup of the city was 73.2% White, 15.3% African American, 5.2% Asian, and 4.3% Hispanic or Latino. The median household income was $60,945, and the median home value was $223,400. The city has a poverty rate of 11.3%.
Marietta is a diverse and vibrant city with a rich history and a strong economy. The city is home to a variety of businesses, attractions, and cultural institutions, making it an attractive destination for visitors and residents alike.
Common Questions
What is Per Capita Income in Marietta?
Per Capita income in Marietta is $40,767.
What is the Median Family Income in Marietta?
Median Family Income in Marietta is $83,282.
What is the Median Household income in Marietta?
Median Household Income in Marietta is $67,589.
What is Income or Wage Gap in Marietta?
Income or Wage Gap in Marietta is 12.5%.
Women in Marietta earn 87.5 cents for every dollar earned by a man.
What is Family Income Deficit in Marietta?
Family Income Deficit in Marietta is $10,231.
Families that are below poverty line in Marietta earn $10,231 less on average than the poverty threshold level.
What is Inequality or Gini Index in Marietta?
Inequality or Gini Index in Marietta is 0.48.
What is the Total Population of Marietta?
Total Population of Marietta is 61,387.
What is the Total Male Population of Marietta?
Total Male Population of Marietta is 29,914.
What is the Total Female Population of Marietta?
Total Female Population of Marietta is 31,473.
What is the Ratio of Males per 100 Females in Marietta?
There are 95.05 Males per 100 Females in Marietta.
What is the Ratio of Females per 100 Males in Marietta?
There are 105.21 Females per 100 Males in Marietta.
What is the Median Population Age in Marietta?
Median Population Age in Marietta is 35.2 Years.
What is the Average Family Size in Marietta
Average Family Size in Marietta is 3.1 People.
What is the Average Household Size in Marietta
Average Household Size in Marietta is 2.4 People.
How Large is the Labor Force in Marietta?
There are 33,704 People in the Labor Forcein in Marietta.
What is the Percentage of People in the Labor Force in Marietta?
67.9% of People are in the Labor Force in Marietta.
What is the Unemployment Rate in Marietta?
Unemployment Rate in Marietta is 3.4%.