Pea Ridge, AR Map & Demographics
Pea Ridge Map
Pea Ridge Overview
$34,606
PER CAPITA INCOME
$101,515
AVG FAMILY INCOME
$93,113
AVG HOUSEHOLD INCOME
11.5%
WAGE / INCOME GAP [ % ]
88.5¢/ $1
WAGE / INCOME GAP [ $ ]
0.35
INEQUALITY / GINI INDEX
6,851
TOTAL POPULATION
3,612
MALE POPULATION
3,239
FEMALE POPULATION
111.52
MALES / 100 FEMALES
89.67
FEMALES / 100 MALES
35.6
MEDIAN AGE
3.0
AVG FAMILY SIZE
2.7
AVG HOUSEHOLD SIZE
3,347
LABOR FORCE [ PEOPLE ]
69.2%
PERCENT IN LABOR FORCE
1.8%
UNEMPLOYMENT RATE
Pea Ridge Zip Codes
Pea Ridge Area Codes
Income in Pea Ridge
Income Overview in Pea Ridge
Per Capita Income in Pea Ridge is $34,606, while median incomes of families and households are $101,515 and $93,113 respectively.
| Characteristic | Number | Measure |
| Per Capita Income | 6,851 | $34,606 |
| Median Family Income | 2,002 | $101,515 |
| Mean Family Income | 2,002 | $112,209 |
| Median Household Income | 2,528 | $93,113 |
| Mean Household Income | 2,528 | $98,906 |
| Income Deficit | 2,002 | $0 |
| Wage / Income Gap (%) | 6,851 | 11.49% |
| Wage / Income Gap ($) | 6,851 | 88.51¢ per $1 |
| Gini / Inequality Index | 6,851 | 0.35 |
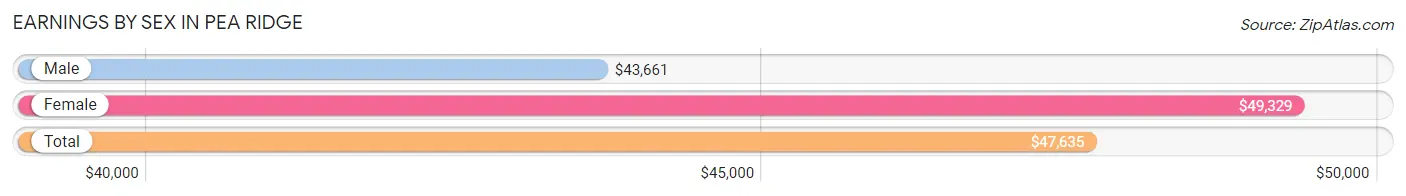
Earnings by Sex in Pea Ridge
Average Earnings in Pea Ridge are $47,635, $43,661 for men and $49,329 for women, a difference of 11.5%.
| Sex | Number | Average Earnings |
| Male | 1,935 (52.6%) | $43,661 |
| Female | 1,746 (47.4%) | $49,329 |
| Total | 3,681 (100.0%) | $47,635 |
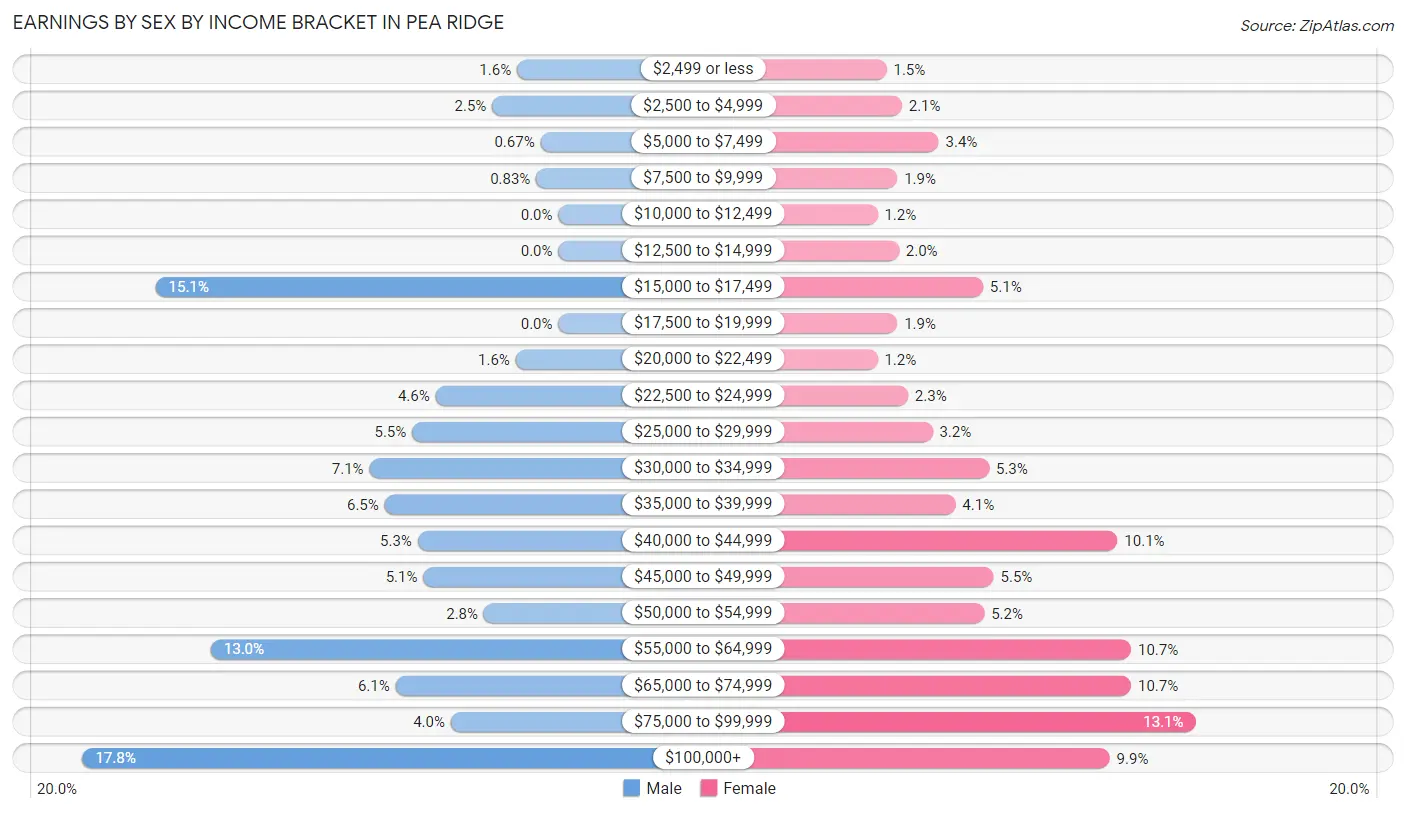
Earnings by Sex by Income Bracket in Pea Ridge
The most common earnings brackets in Pea Ridge are $100,000+ for men (345 | 17.8%) and $75,000 to $99,999 for women (228 | 13.1%).
| Income | Male | Female |
| $2,499 or less | 30 (1.5%) | 26 (1.5%) |
| $2,500 to $4,999 | 48 (2.5%) | 36 (2.1%) |
| $5,000 to $7,499 | 13 (0.7%) | 60 (3.4%) |
| $7,500 to $9,999 | 16 (0.8%) | 33 (1.9%) |
| $10,000 to $12,499 | 0 (0.0%) | 20 (1.1%) |
| $12,500 to $14,999 | 0 (0.0%) | 34 (1.9%) |
| $15,000 to $17,499 | 292 (15.1%) | 89 (5.1%) |
| $17,500 to $19,999 | 0 (0.0%) | 33 (1.9%) |
| $20,000 to $22,499 | 31 (1.6%) | 20 (1.1%) |
| $22,500 to $24,999 | 89 (4.6%) | 40 (2.3%) |
| $25,000 to $29,999 | 106 (5.5%) | 56 (3.2%) |
| $30,000 to $34,999 | 137 (7.1%) | 93 (5.3%) |
| $35,000 to $39,999 | 126 (6.5%) | 71 (4.1%) |
| $40,000 to $44,999 | 102 (5.3%) | 177 (10.1%) |
| $45,000 to $49,999 | 98 (5.1%) | 96 (5.5%) |
| $50,000 to $54,999 | 54 (2.8%) | 90 (5.1%) |
| $55,000 to $64,999 | 252 (13.0%) | 186 (10.6%) |
| $65,000 to $74,999 | 118 (6.1%) | 186 (10.6%) |
| $75,000 to $99,999 | 78 (4.0%) | 228 (13.1%) |
| $100,000+ | 345 (17.8%) | 172 (9.9%) |
| Total | 1,935 (100.0%) | 1,746 (100.0%) |
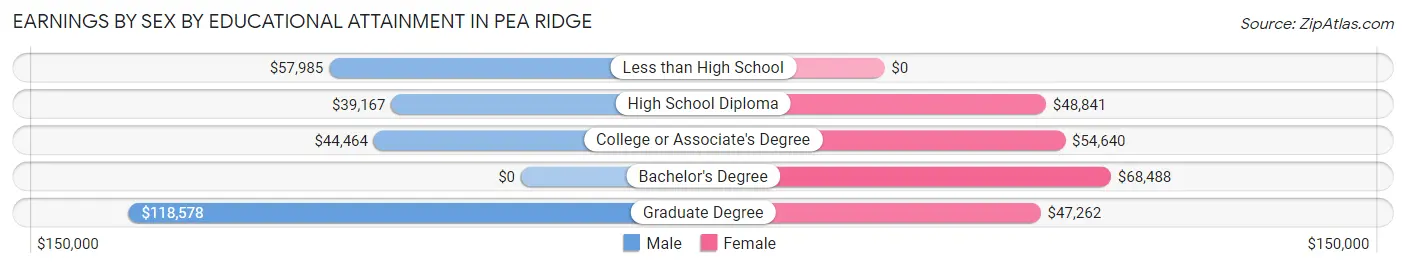
Earnings by Sex by Educational Attainment in Pea Ridge
Average earnings in Pea Ridge are $43,810 for men and $53,454 for women, a difference of 18.0%. Men with an educational attainment of graduate degree enjoy the highest average annual earnings of $118,578, while those with high school diploma education earn the least with $39,167. Women with an educational attainment of bachelor's degree earn the most with the average annual earnings of $68,488, while those with graduate degree education have the smallest earnings of $47,262.
| Educational Attainment | Male Income | Female Income |
| Less than High School | $57,985 | $0 |
| High School Diploma | $39,167 | $48,841 |
| College or Associate's Degree | $44,464 | $54,640 |
| Bachelor's Degree | - | - |
| Graduate Degree | $118,578 | $47,262 |
| Total | $43,810 | $53,454 |
Family Income in Pea Ridge
Family Income Brackets in Pea Ridge
According to the Pea Ridge family income data, there are 773 families falling into the $100,000 to $149,999 income range, which is the most common income bracket and makes up 38.6% of all families.
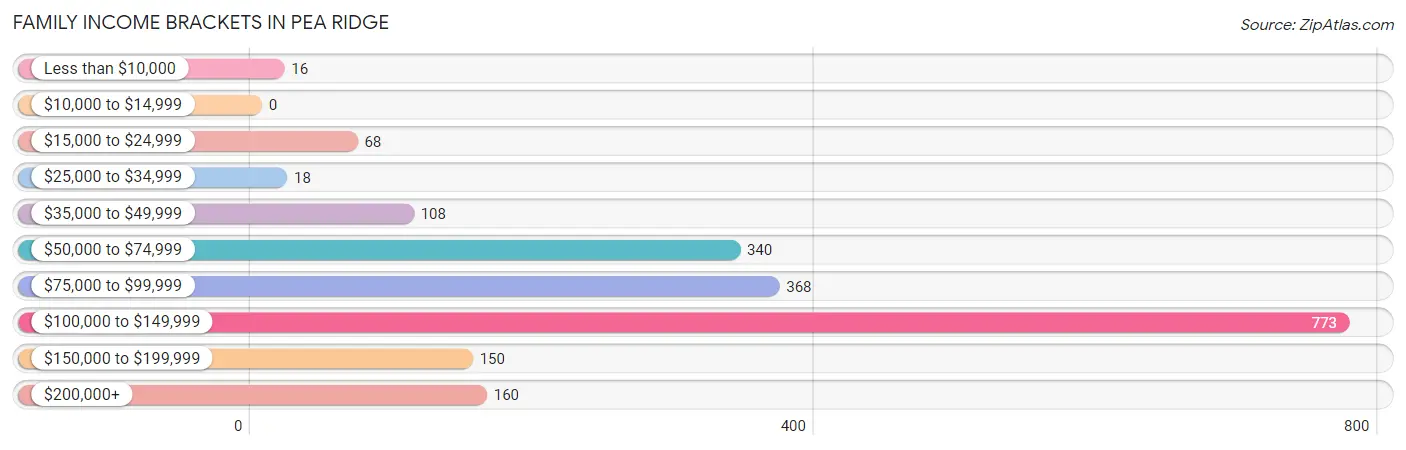
| Income Bracket | # Families | % Families |
| Less than $10,000 | 16 | 0.8% |
| $10,000 to $14,999 | 0 | 0.0% |
| $15,000 to $24,999 | 68 | 3.4% |
| $25,000 to $34,999 | 18 | 0.9% |
| $35,000 to $49,999 | 108 | 5.4% |
| $50,000 to $74,999 | 340 | 17.0% |
| $75,000 to $99,999 | 368 | 18.4% |
| $100,000 to $149,999 | 773 | 38.6% |
| $150,000 to $199,999 | 150 | 7.5% |
| $200,000+ | 160 | 8.0% |
Family Income by Famaliy Size in Pea Ridge
4-person families (497 | 24.8%) account for the highest median family income in Pea Ridge with $110,476 per family, while 2-person families (829 | 41.4%) have the highest median income of $50,375 per family member.
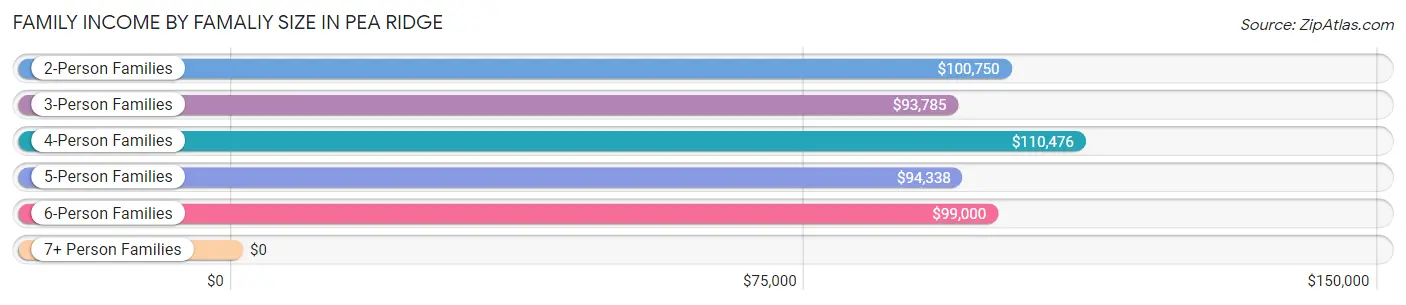
| Income Bracket | # Families | Median Income |
| 2-Person Families | 829 (41.4%) | $100,750 |
| 3-Person Families | 389 (19.4%) | $93,785 |
| 4-Person Families | 497 (24.8%) | $110,476 |
| 5-Person Families | 141 (7.0%) | $94,338 |
| 6-Person Families | 146 (7.3%) | $99,000 |
| 7+ Person Families | 0 (0.0%) | $0 |
| Total | 2,002 (100.0%) | $101,515 |
Family Income by Number of Earners in Pea Ridge
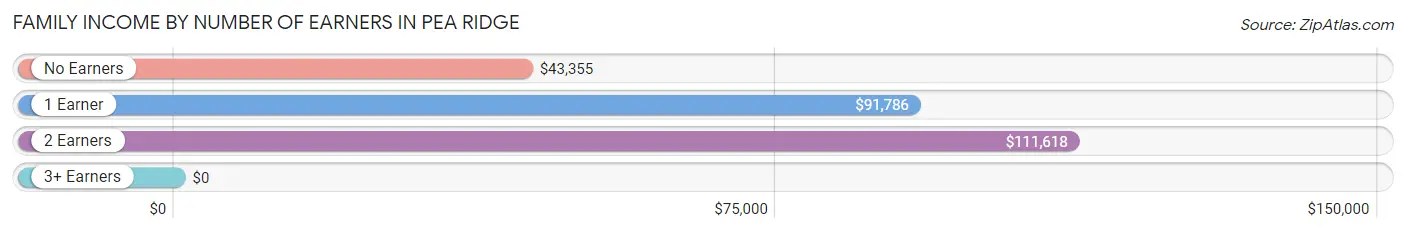
| Number of Earners | # Families | Median Income |
| No Earners | 127 (6.3%) | $43,355 |
| 1 Earner | 542 (27.1%) | $91,786 |
| 2 Earners | 1,248 (62.3%) | $111,618 |
| 3+ Earners | 85 (4.3%) | $0 |
| Total | 2,002 (100.0%) | $101,515 |
Household Income in Pea Ridge
Household Income Brackets in Pea Ridge
With 786 households falling in the category, the $100,000 to $149,999 income range is the most frequent in Pea Ridge, accounting for 31.1% of all households. In contrast, only 15 households (0.6%) fall into the less than $10,000 income bracket, making it the least populous group.
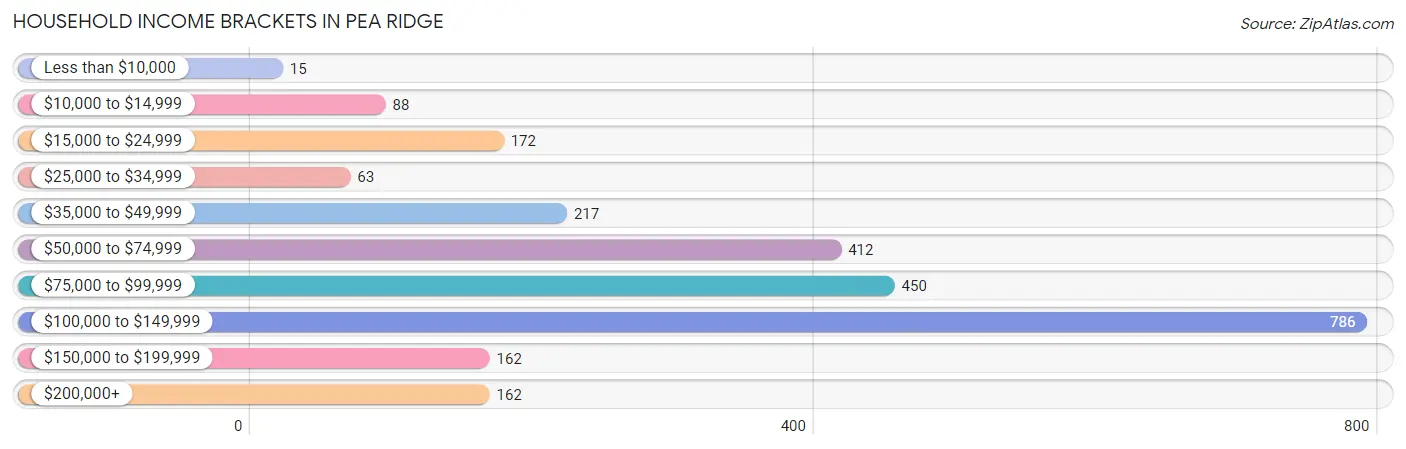
| Income Bracket | # Households | % Households |
| Less than $10,000 | 15 | 0.6% |
| $10,000 to $14,999 | 88 | 3.5% |
| $15,000 to $24,999 | 172 | 6.8% |
| $25,000 to $34,999 | 63 | 2.5% |
| $35,000 to $49,999 | 217 | 8.6% |
| $50,000 to $74,999 | 412 | 16.3% |
| $75,000 to $99,999 | 450 | 17.8% |
| $100,000 to $149,999 | 786 | 31.1% |
| $150,000 to $199,999 | 162 | 6.4% |
| $200,000+ | 162 | 6.4% |
Household Income by Householder Age in Pea Ridge
The median household income in Pea Ridge is $93,113, with the highest median household income of $99,375 found in the 25 to 44 years age bracket for the primary householder. A total of 1,070 households (42.3%) fall into this category. Meanwhile, the 15 to 24 years age bracket for the primary householder has the lowest median household income of $0, with 27 households (1.1%) in this group.
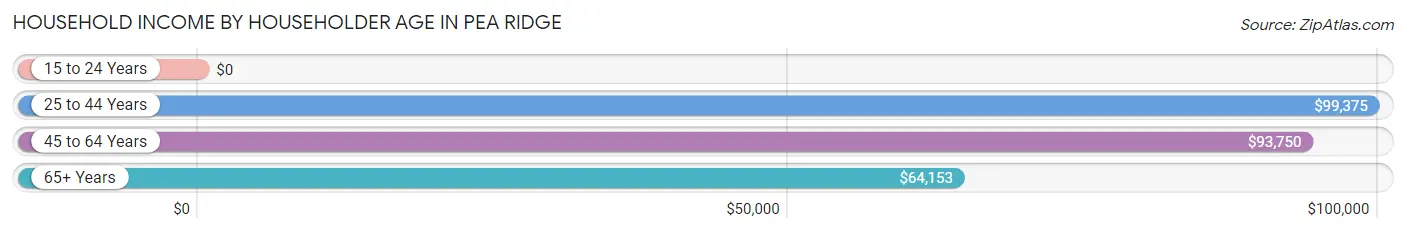
| Income Bracket | # Households | Median Income |
| 15 to 24 Years | 27 (1.1%) | $0 |
| 25 to 44 Years | 1,070 (42.3%) | $99,375 |
| 45 to 64 Years | 760 (30.1%) | $93,750 |
| 65+ Years | 671 (26.5%) | $64,153 |
| Total | 2,528 (100.0%) | $93,113 |
Poverty in Pea Ridge
Income Below Poverty by Sex and Age in Pea Ridge
With 2.9% poverty level for males and 7.9% for females among the residents of Pea Ridge, 25 to 34 year old males and 65 to 74 year old females are the most vulnerable to poverty, with 48 males (10.8%) and 89 females (41.2%) in their respective age groups living below the poverty level.
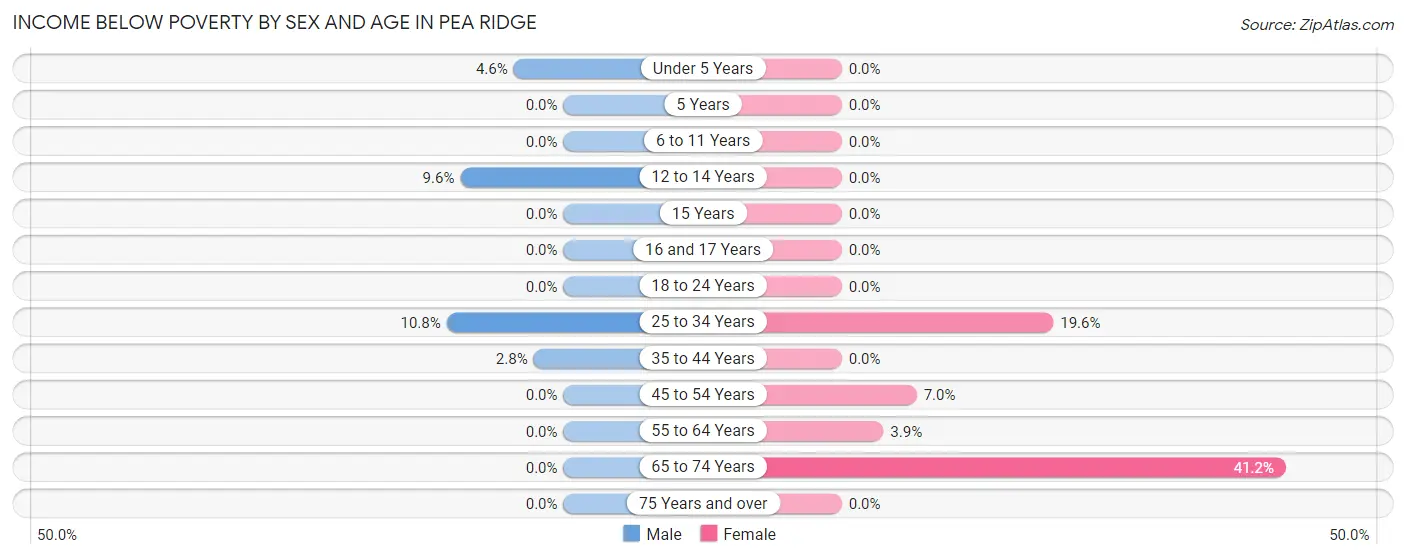
| Age Bracket | Male | Female |
| Under 5 Years | 20 (4.6%) | 0 (0.0%) |
| 5 Years | 0 (0.0%) | 0 (0.0%) |
| 6 to 11 Years | 0 (0.0%) | 0 (0.0%) |
| 12 to 14 Years | 22 (9.6%) | 0 (0.0%) |
| 15 Years | 0 (0.0%) | 0 (0.0%) |
| 16 and 17 Years | 0 (0.0%) | 0 (0.0%) |
| 18 to 24 Years | 0 (0.0%) | 0 (0.0%) |
| 25 to 34 Years | 48 (10.8%) | 116 (19.6%) |
| 35 to 44 Years | 16 (2.8%) | 0 (0.0%) |
| 45 to 54 Years | 0 (0.0%) | 31 (7.0%) |
| 55 to 64 Years | 0 (0.0%) | 16 (3.9%) |
| 65 to 74 Years | 0 (0.0%) | 89 (41.2%) |
| 75 Years and over | 0 (0.0%) | 0 (0.0%) |
| Total | 106 (2.9%) | 252 (7.9%) |
Income Above Poverty by Sex and Age in Pea Ridge
According to the poverty statistics in Pea Ridge, males aged 5 years and females aged under 5 years are the age groups that are most secure financially, with 100.0% of males and 100.0% of females in these age groups living above the poverty line.
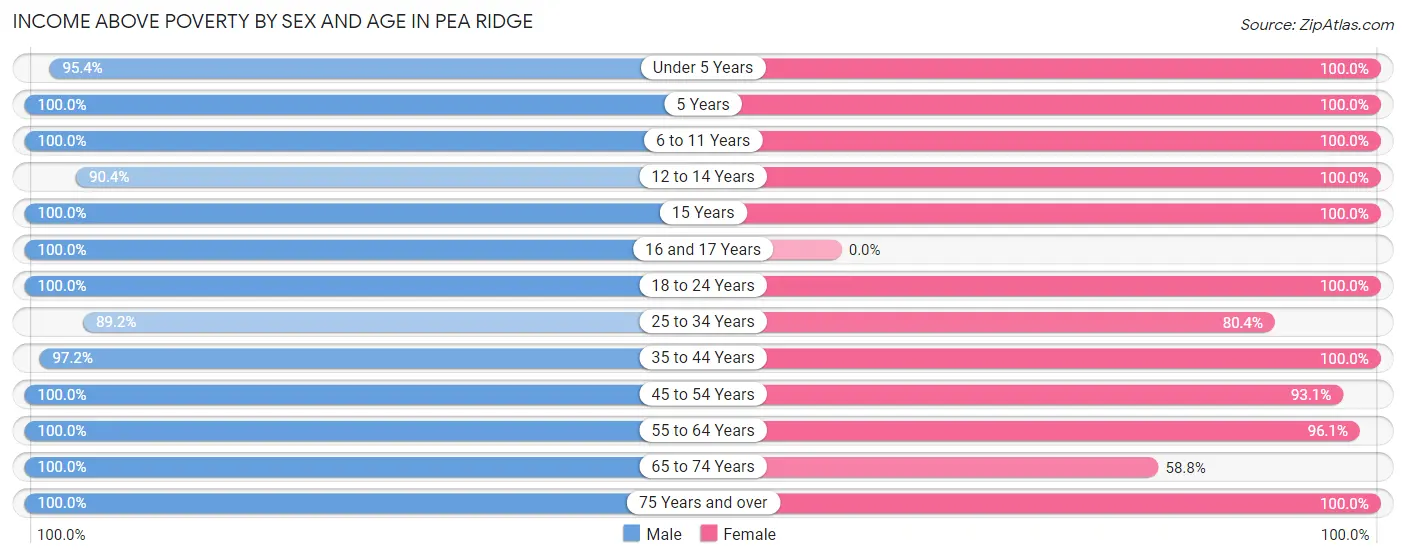
| Age Bracket | Male | Female |
| Under 5 Years | 413 (95.4%) | 356 (100.0%) |
| 5 Years | 26 (100.0%) | 37 (100.0%) |
| 6 to 11 Years | 475 (100.0%) | 285 (100.0%) |
| 12 to 14 Years | 208 (90.4%) | 69 (100.0%) |
| 15 Years | 34 (100.0%) | 14 (100.0%) |
| 16 and 17 Years | 43 (100.0%) | 0 (0.0%) |
| 18 to 24 Years | 123 (100.0%) | 148 (100.0%) |
| 25 to 34 Years | 395 (89.2%) | 475 (80.4%) |
| 35 to 44 Years | 561 (97.2%) | 473 (100.0%) |
| 45 to 54 Years | 341 (100.0%) | 415 (93.0%) |
| 55 to 64 Years | 328 (100.0%) | 398 (96.1%) |
| 65 to 74 Years | 454 (100.0%) | 127 (58.8%) |
| 75 Years and over | 86 (100.0%) | 135 (100.0%) |
| Total | 3,487 (97.1%) | 2,932 (92.1%) |
Income Below Poverty Among Married-Couple Families in Pea Ridge
The poverty statistics for married-couple families in Pea Ridge show that 3.1% or 51 of the total 1,622 families live below the poverty line. Families with no children have the highest poverty rate of 4.6%, comprising of 32 families. On the other hand, families with 3 or 4 children have the lowest poverty rate of 0.0%, which includes 0 families.
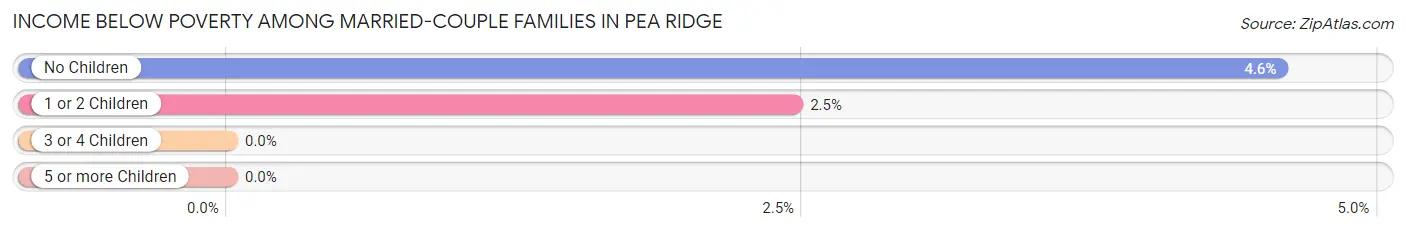
| Children | Above Poverty | Below Poverty |
| No Children | 668 (95.4%) | 32 (4.6%) |
| 1 or 2 Children | 752 (97.5%) | 19 (2.5%) |
| 3 or 4 Children | 151 (100.0%) | 0 (0.0%) |
| 5 or more Children | 0 (0.0%) | 0 (0.0%) |
| Total | 1,571 (96.9%) | 51 (3.1%) |
Income Below Poverty Among Single-Parent Households in Pea Ridge
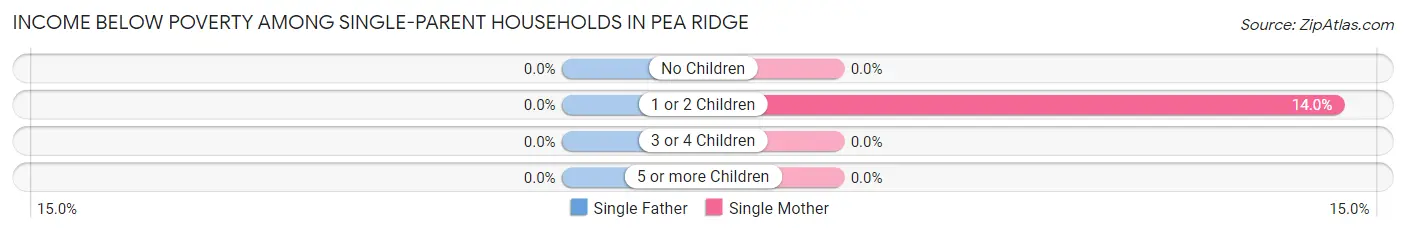
| Children | Single Father | Single Mother |
| No Children | 0 (0.0%) | 0 (0.0%) |
| 1 or 2 Children | 0 (0.0%) | 26 (14.0%) |
| 3 or 4 Children | 0 (0.0%) | 0 (0.0%) |
| 5 or more Children | 0 (0.0%) | 0 (0.0%) |
| Total | 0 (0.0%) | 26 (9.5%) |
Income Below Poverty Among Married-Couple vs Single-Parent Households in Pea Ridge
The poverty data for Pea Ridge shows that 51 of the married-couple family households (3.1%) and 26 of the single-parent households (6.8%) are living below the poverty level. Within the married-couple family households, those with no children have the highest poverty rate, with 32 households (4.6%) falling below the poverty line. Among the single-parent households, those with 1 or 2 children have the highest poverty rate, with 26 household (10.6%) living below poverty.
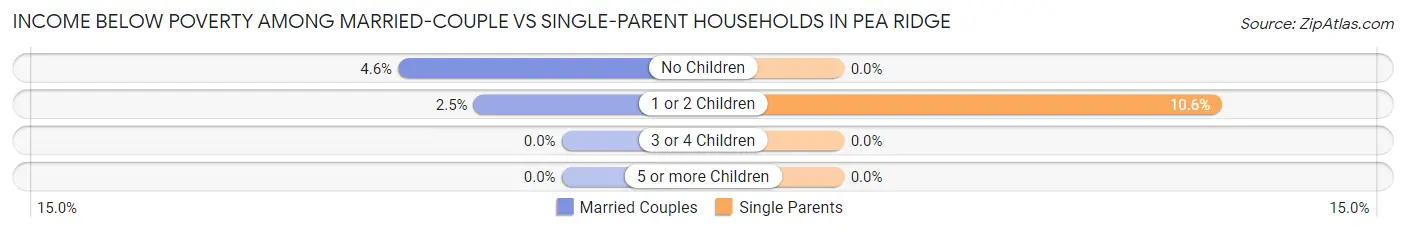
| Children | Married-Couple Families | Single-Parent Households |
| No Children | 32 (4.6%) | 0 (0.0%) |
| 1 or 2 Children | 19 (2.5%) | 26 (10.6%) |
| 3 or 4 Children | 0 (0.0%) | 0 (0.0%) |
| 5 or more Children | 0 (0.0%) | 0 (0.0%) |
| Total | 51 (3.1%) | 26 (6.8%) |
Race in Pea Ridge
The most populous races in Pea Ridge are White / Caucasian (4,709 | 68.7%), Two or more Races (1,149 | 16.8%), and Hispanic or Latino (696 | 10.2%).
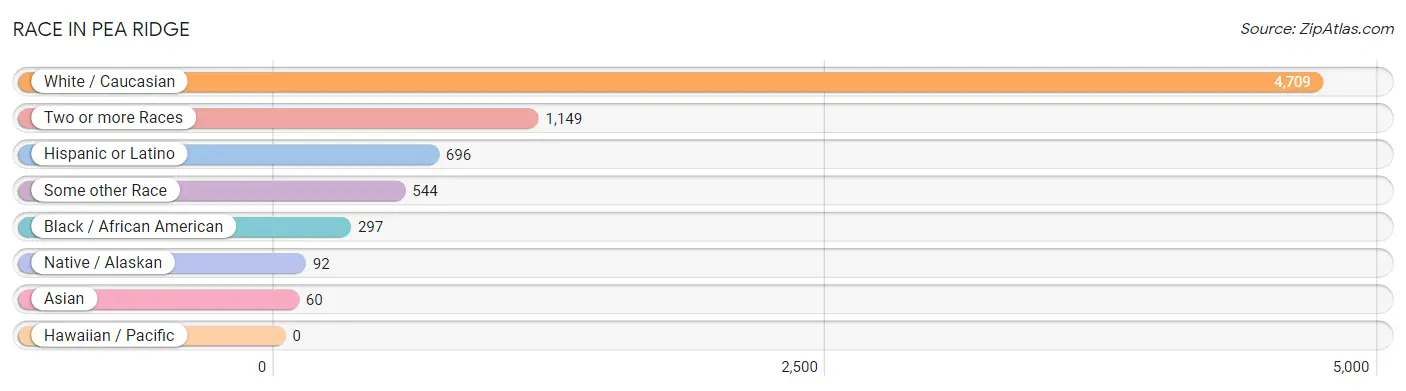
| Race | # Population | % Population |
| Asian | 60 | 0.9% |
| Black / African American | 297 | 4.3% |
| Hawaiian / Pacific | 0 | 0.0% |
| Hispanic or Latino | 696 | 10.2% |
| Native / Alaskan | 92 | 1.3% |
| White / Caucasian | 4,709 | 68.7% |
| Two or more Races | 1,149 | 16.8% |
| Some other Race | 544 | 7.9% |
| Total | 6,851 | 100.0% |
Ancestry in Pea Ridge
The most populous ancestries reported in Pea Ridge are German (1,068 | 15.6%), Mexican (483 | 7.0%), Irish (372 | 5.4%), Trinidadian and Tobagonian (354 | 5.2%), and West Indian (354 | 5.2%), together accounting for 38.4% of all Pea Ridge residents.
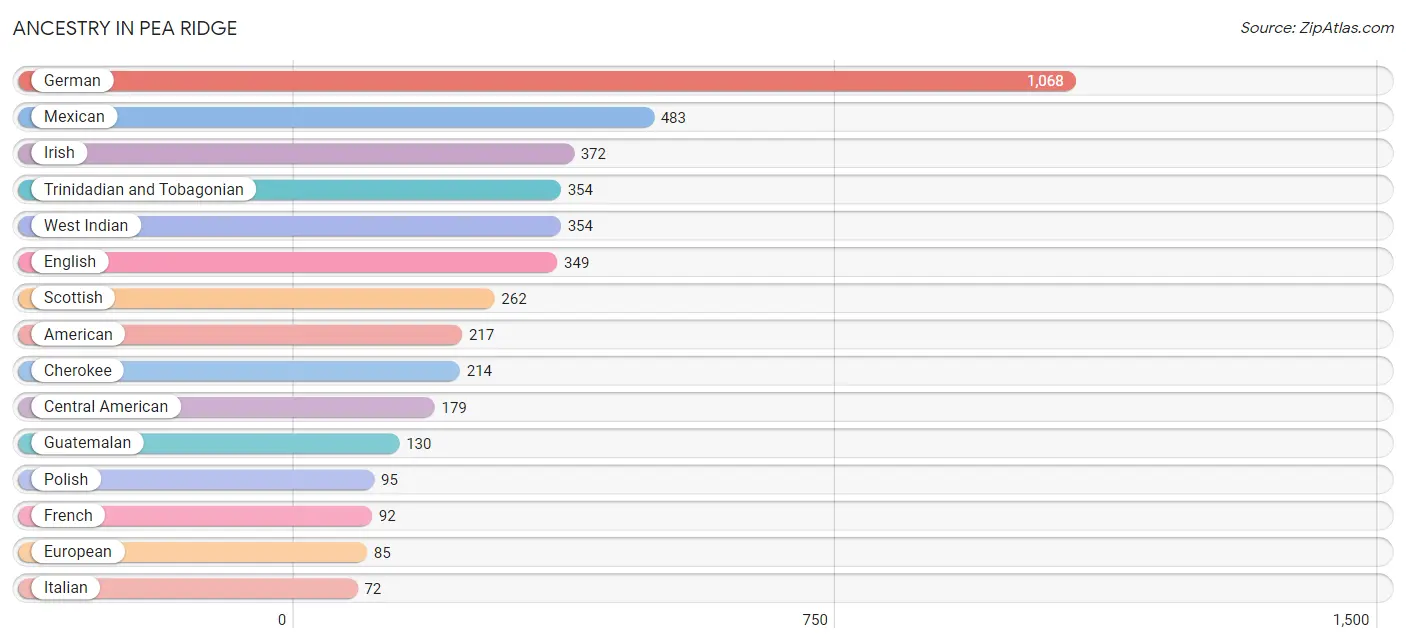
| Ancestry | # Population | % Population |
| American | 217 | 3.2% |
| Austrian | 14 | 0.2% |
| British | 23 | 0.3% |
| Central American | 179 | 2.6% |
| Central American Indian | 31 | 0.4% |
| Cherokee | 214 | 3.1% |
| Chippewa | 47 | 0.7% |
| Choctaw | 29 | 0.4% |
| Creek | 7 | 0.1% |
| Danish | 14 | 0.2% |
| Dutch | 55 | 0.8% |
| English | 349 | 5.1% |
| European | 85 | 1.2% |
| Finnish | 43 | 0.6% |
| French | 92 | 1.3% |
| French Canadian | 19 | 0.3% |
| German | 1,068 | 15.6% |
| Guatemalan | 130 | 1.9% |
| Inupiat | 17 | 0.3% |
| Irish | 372 | 5.4% |
| Italian | 72 | 1.1% |
| Korean | 36 | 0.5% |
| Mexican | 483 | 7.0% |
| Norwegian | 45 | 0.7% |
| Panamanian | 18 | 0.3% |
| Polish | 95 | 1.4% |
| Portuguese | 21 | 0.3% |
| Salvadoran | 31 | 0.4% |
| Scandinavian | 61 | 0.9% |
| Scotch-Irish | 28 | 0.4% |
| Scottish | 262 | 3.8% |
| Sri Lankan | 60 | 0.9% |
| Swedish | 46 | 0.7% |
| Trinidadian and Tobagonian | 354 | 5.2% |
| West Indian | 354 | 5.2% |
| Yugoslavian | 17 | 0.3% | View All 36 Rows |
Immigrants in Pea Ridge
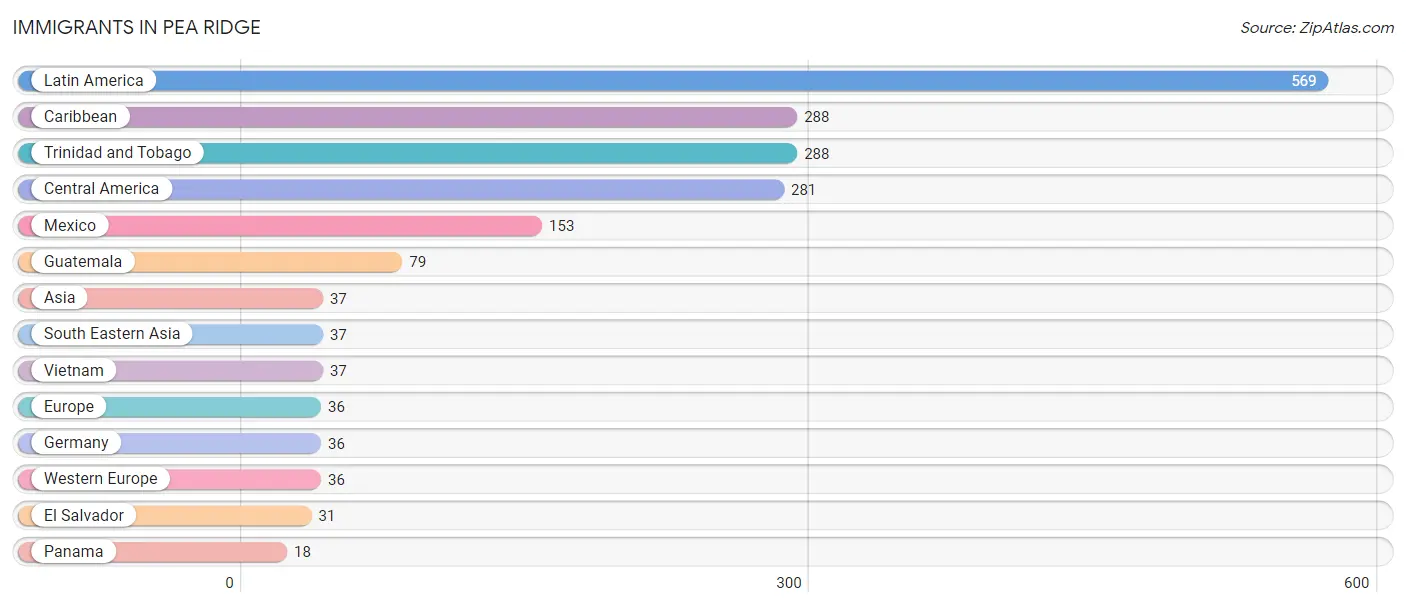
The most numerous immigrant groups reported in Pea Ridge came from Latin America (569 | 8.3%), Caribbean (288 | 4.2%), Trinidad and Tobago (288 | 4.2%), Central America (281 | 4.1%), and Mexico (153 | 2.2%), together accounting for 23.0% of all Pea Ridge residents.
| Immigration Origin | # Population | % Population |
| Asia | 37 | 0.5% |
| Caribbean | 288 | 4.2% |
| Central America | 281 | 4.1% |
| El Salvador | 31 | 0.4% |
| Europe | 36 | 0.5% |
| Germany | 36 | 0.5% |
| Guatemala | 79 | 1.1% |
| Latin America | 569 | 8.3% |
| Mexico | 153 | 2.2% |
| Panama | 18 | 0.3% |
| South Eastern Asia | 37 | 0.5% |
| Trinidad and Tobago | 288 | 4.2% |
| Vietnam | 37 | 0.5% |
| Western Europe | 36 | 0.5% | View All 14 Rows |
Sex and Age in Pea Ridge
Sex and Age in Pea Ridge
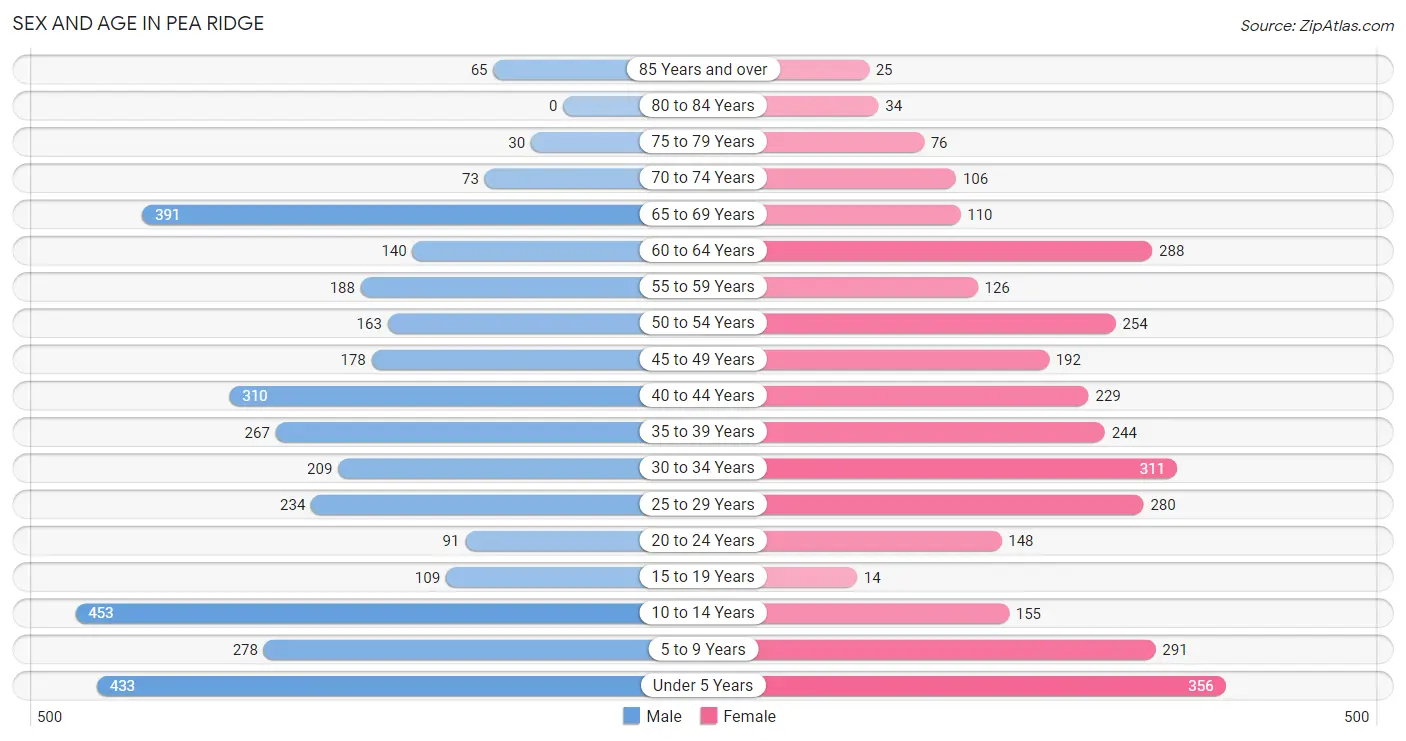
The most populous age groups in Pea Ridge are 10 to 14 Years (453 | 12.5%) for men and Under 5 Years (356 | 11.0%) for women.
| Age Bracket | Male | Female |
| Under 5 Years | 433 (12.0%) | 356 (11.0%) |
| 5 to 9 Years | 278 (7.7%) | 291 (9.0%) |
| 10 to 14 Years | 453 (12.5%) | 155 (4.8%) |
| 15 to 19 Years | 109 (3.0%) | 14 (0.4%) |
| 20 to 24 Years | 91 (2.5%) | 148 (4.6%) |
| 25 to 29 Years | 234 (6.5%) | 280 (8.6%) |
| 30 to 34 Years | 209 (5.8%) | 311 (9.6%) |
| 35 to 39 Years | 267 (7.4%) | 244 (7.5%) |
| 40 to 44 Years | 310 (8.6%) | 229 (7.1%) |
| 45 to 49 Years | 178 (4.9%) | 192 (5.9%) |
| 50 to 54 Years | 163 (4.5%) | 254 (7.8%) |
| 55 to 59 Years | 188 (5.2%) | 126 (3.9%) |
| 60 to 64 Years | 140 (3.9%) | 288 (8.9%) |
| 65 to 69 Years | 391 (10.8%) | 110 (3.4%) |
| 70 to 74 Years | 73 (2.0%) | 106 (3.3%) |
| 75 to 79 Years | 30 (0.8%) | 76 (2.4%) |
| 80 to 84 Years | 0 (0.0%) | 34 (1.1%) |
| 85 Years and over | 65 (1.8%) | 25 (0.8%) |
| Total | 3,612 (100.0%) | 3,239 (100.0%) |
Families and Households in Pea Ridge
Median Family Size in Pea Ridge
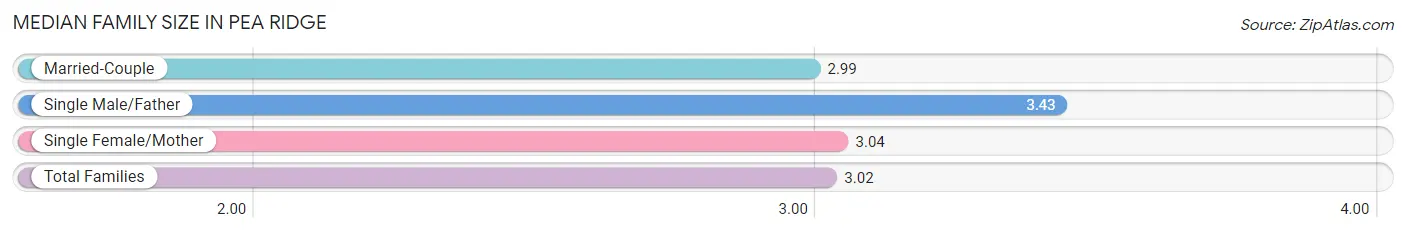
The median family size in Pea Ridge is 3.02 persons per family, with single male/father families (107 | 5.3%) accounting for the largest median family size of 3.43 persons per family. On the other hand, married-couple families (1,622 | 81.0%) represent the smallest median family size with 2.99 persons per family.
| Family Type | # Families | Family Size |
| Married-Couple | 1,622 (81.0%) | 2.99 |
| Single Male/Father | 107 (5.3%) | 3.43 |
| Single Female/Mother | 273 (13.6%) | 3.04 |
| Total Families | 2,002 (100.0%) | 3.02 |
Median Household Size in Pea Ridge
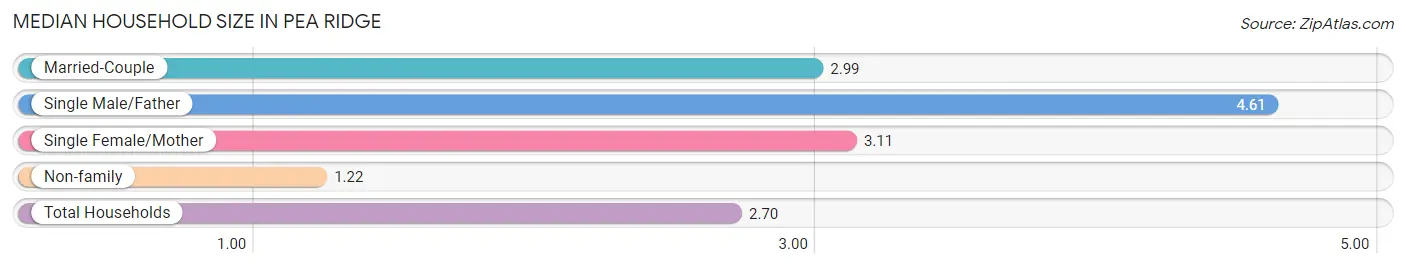
The median household size in Pea Ridge is 2.70 persons per household, with single male/father households (107 | 4.2%) accounting for the largest median household size of 4.61 persons per household. non-family households (526 | 20.8%) represent the smallest median household size with 1.22 persons per household.
| Household Type | # Households | Household Size |
| Married-Couple | 1,622 (64.2%) | 2.99 |
| Single Male/Father | 107 (4.2%) | 4.61 |
| Single Female/Mother | 273 (10.8%) | 3.11 |
| Non-family | 526 (20.8%) | 1.22 |
| Total Households | 2,528 (100.0%) | 2.70 |
Household Size by Marriage Status in Pea Ridge
Out of a total of 2,528 households in Pea Ridge, 2,002 (79.2%) are family households, while 526 (20.8%) are nonfamily households. The most numerous type of family households are 2-person households, comprising 743, and the most common type of nonfamily households are 1-person households, comprising 416.
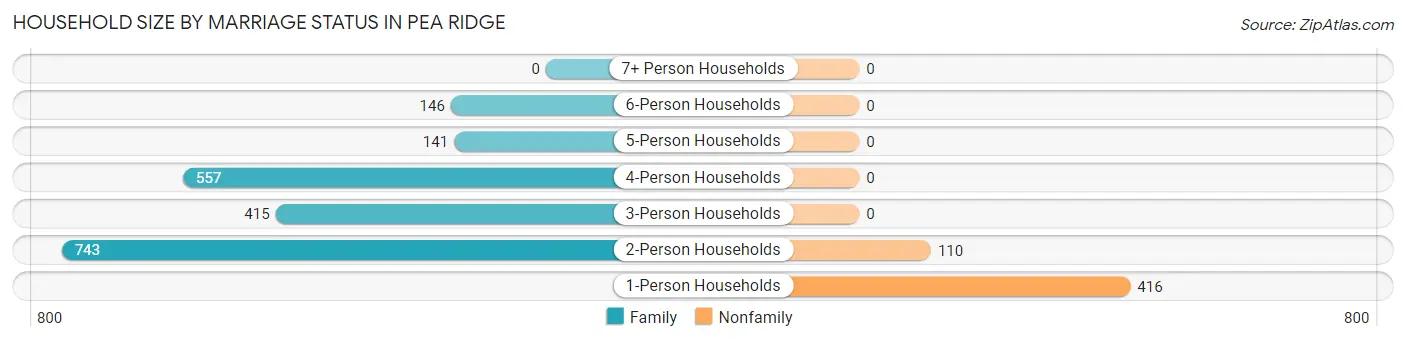
| Household Size | Family Households | Nonfamily Households |
| 1-Person Households | - | 416 (16.5%) |
| 2-Person Households | 743 (29.4%) | 110 (4.3%) |
| 3-Person Households | 415 (16.4%) | 0 (0.0%) |
| 4-Person Households | 557 (22.0%) | 0 (0.0%) |
| 5-Person Households | 141 (5.6%) | 0 (0.0%) |
| 6-Person Households | 146 (5.8%) | 0 (0.0%) |
| 7+ Person Households | 0 (0.0%) | 0 (0.0%) |
| Total | 2,002 (79.2%) | 526 (20.8%) |
Female Fertility in Pea Ridge
Fertility by Age in Pea Ridge
Average fertility rate in Pea Ridge is 132.0 births per 1,000 women. Women in the age bracket of 20 to 34 years have the highest fertility rate with 265.0 births per 1,000 women. Women in the age bracket of 20 to 34 years acount for 100.0% of all women with births.
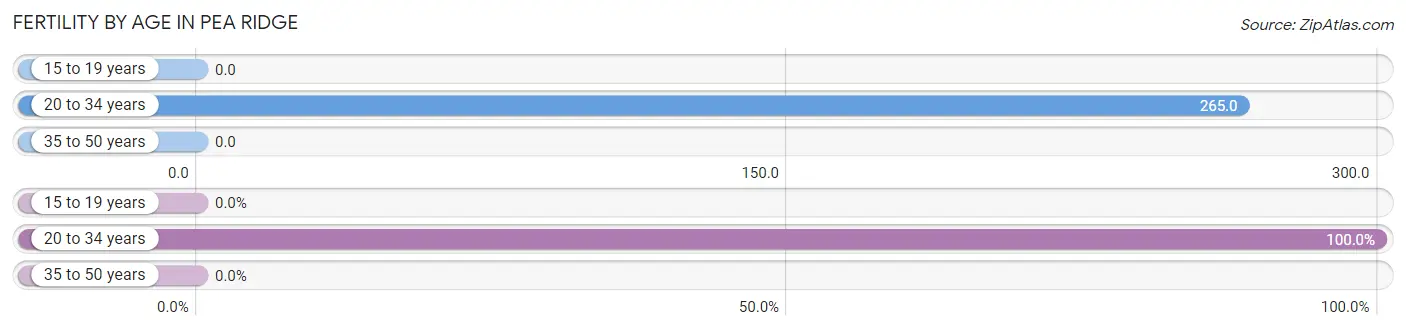
| Age Bracket | Women with Births | Births / 1,000 Women |
| 15 to 19 years | 0 (0.0%) | 0.0 |
| 20 to 34 years | 196 (100.0%) | 265.0 |
| 35 to 50 years | 0 (0.0%) | 0.0 |
| Total | 196 (100.0%) | 132.0 |
Fertility by Age by Marriage Status in Pea Ridge
43.4% of women with births (196) in Pea Ridge are married. The highest percentage of unmarried women with births falls into 20 to 34 years age bracket with 56.6% of them unmarried at the time of birth, while the lowest percentage of unmarried women with births belong to 20 to 34 years age bracket with 56.6% of them unmarried.
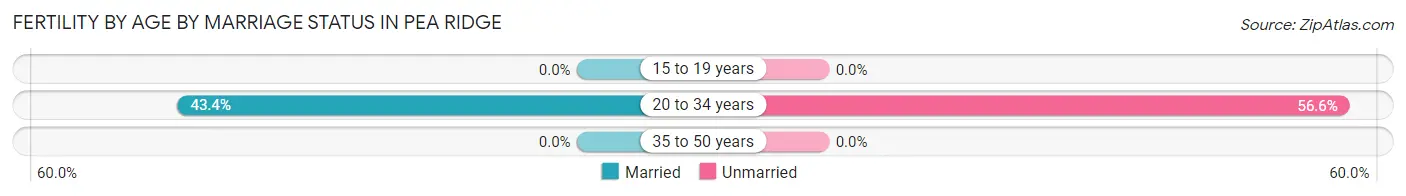
| Age Bracket | Married | Unmarried |
| 15 to 19 years | 0 (0.0%) | 0 (0.0%) |
| 20 to 34 years | 85 (43.4%) | 111 (56.6%) |
| 35 to 50 years | 0 (0.0%) | 0 (0.0%) |
| Total | 85 (43.4%) | 111 (56.6%) |
Fertility by Education in Pea Ridge
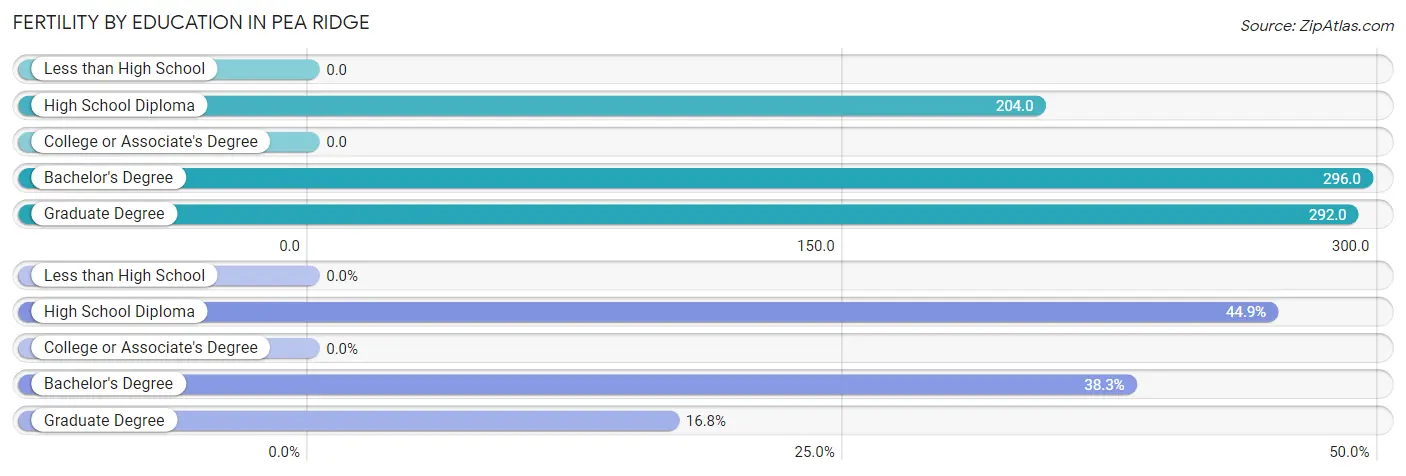
| Educational Attainment | Women with Births | Births / 1,000 Women |
| Less than High School | 0 (0.0%) | 0.0 |
| High School Diploma | 88 (44.9%) | 204.0 |
| College or Associate's Degree | 0 (0.0%) | 0.0 |
| Bachelor's Degree | 75 (38.3%) | 296.0 |
| Graduate Degree | 33 (16.8%) | 292.0 |
| Total | 196 (100.0%) | 132.0 |
Fertility by Education by Marriage Status in Pea Ridge
56.6% of women with births in Pea Ridge are unmarried. Women with the educational attainment of graduate degree are most likely to be married with 100.0% of them married at childbirth, while women with the educational attainment of high school diploma are least likely to be married with 80.7% of them unmarried at childbirth.
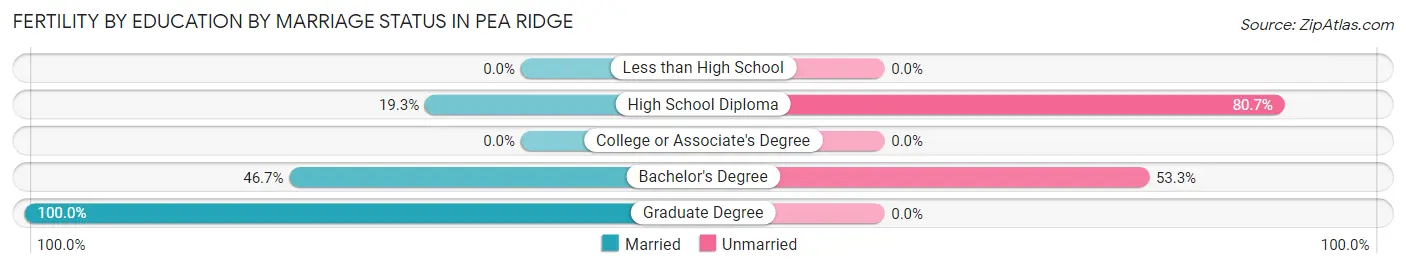
| Educational Attainment | Married | Unmarried |
| Less than High School | 0 (0.0%) | 0 (0.0%) |
| High School Diploma | 17 (19.3%) | 71 (80.7%) |
| College or Associate's Degree | 0 (0.0%) | 0 (0.0%) |
| Bachelor's Degree | 35 (46.7%) | 40 (53.3%) |
| Graduate Degree | 33 (100.0%) | 0 (0.0%) |
| Total | 85 (43.4%) | 111 (56.6%) |
Employment Characteristics in Pea Ridge
Employment by Class of Employer in Pea Ridge
Among the 3,272 employed individuals in Pea Ridge, private company employees (2,339 | 71.5%), self-employed (not incorporated) (306 | 9.3%), and not-for-profit organizations (205 | 6.3%) make up the most common classes of employment.
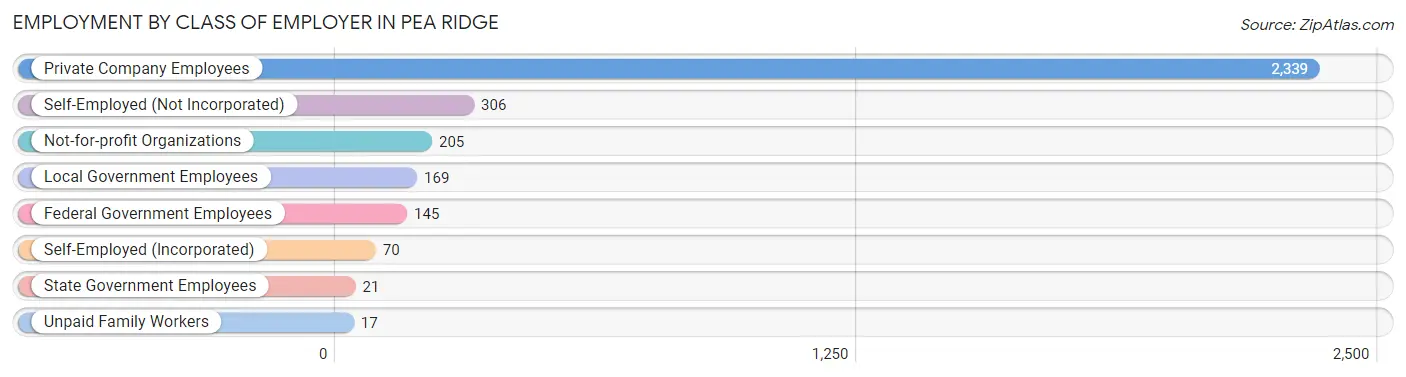
| Employer Class | # Employees | % Employees |
| Private Company Employees | 2,339 | 71.5% |
| Self-Employed (Incorporated) | 70 | 2.1% |
| Self-Employed (Not Incorporated) | 306 | 9.3% |
| Not-for-profit Organizations | 205 | 6.3% |
| Local Government Employees | 169 | 5.2% |
| State Government Employees | 21 | 0.6% |
| Federal Government Employees | 145 | 4.4% |
| Unpaid Family Workers | 17 | 0.5% |
| Total | 3,272 | 100.0% |
Employment Status by Age in Pea Ridge
According to the labor force statistics for Pea Ridge, out of the total population over 16 years of age (4,837), 69.2% or 3,347 individuals are in the labor force, with 1.8% or 60 of them unemployed. The age group with the highest labor force participation rate is 25 to 29 years, with 96.9% or 498 individuals in the labor force. Within the labor force, the 25 to 29 years age range has the highest percentage of unemployed individuals, with 7.6% or 38 of them being unemployed.
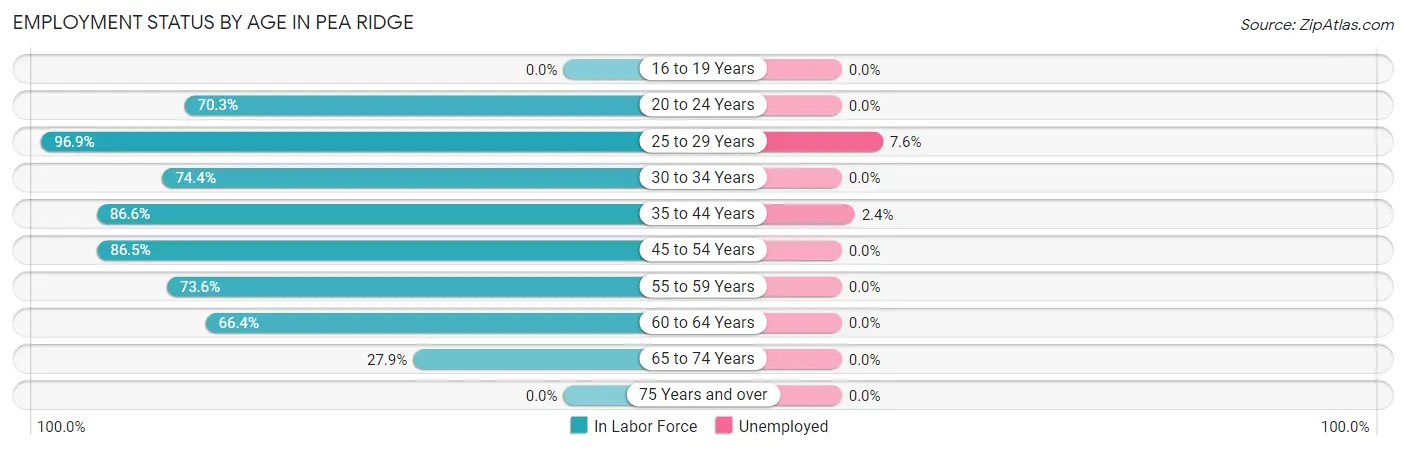
| Age Bracket | In Labor Force | Unemployed |
| 16 to 19 Years | 0 (0.0%) | 0 (0.0%) |
| 20 to 24 Years | 168 (70.3%) | 0 (0.0%) |
| 25 to 29 Years | 498 (96.9%) | 38 (7.6%) |
| 30 to 34 Years | 387 (74.4%) | 0 (0.0%) |
| 35 to 44 Years | 909 (86.6%) | 22 (2.4%) |
| 45 to 54 Years | 681 (86.5%) | 0 (0.0%) |
| 55 to 59 Years | 231 (73.6%) | 0 (0.0%) |
| 60 to 64 Years | 284 (66.4%) | 0 (0.0%) |
| 65 to 74 Years | 190 (27.9%) | 0 (0.0%) |
| 75 Years and over | 0 (0.0%) | 0 (0.0%) |
| Total | 3,347 (69.2%) | 60 (1.8%) |
Employment Status by Educational Attainment in Pea Ridge
According to labor force statistics for Pea Ridge, 82.8% of individuals (2,992) out of the total population between 25 and 64 years of age (3,613) are in the labor force, with 2.0% or 60 of them being unemployed. The group with the highest labor force participation rate are those with the educational attainment of less than high school, with 100.0% or 332 individuals in the labor force. Within the labor force, individuals with less than high school education have the highest percentage of unemployment, with 11.4% or 38 of them being unemployed.
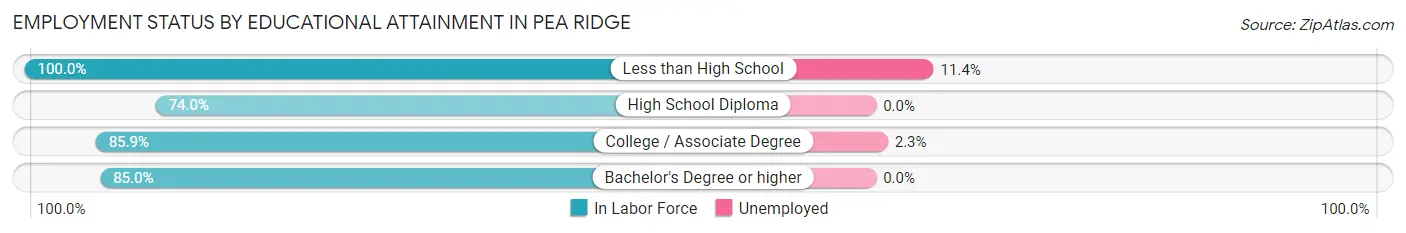
| Educational Attainment | In Labor Force | Unemployed |
| Less than High School | 332 (100.0%) | 38 (11.4%) |
| High School Diploma | 952 (74.0%) | 0 (0.0%) |
| College / Associate Degree | 977 (85.9%) | 26 (2.3%) |
| Bachelor's Degree or higher | 729 (85.0%) | 0 (0.0%) |
| Total | 2,992 (82.8%) | 72 (2.0%) |
Employment Occupations by Sex in Pea Ridge
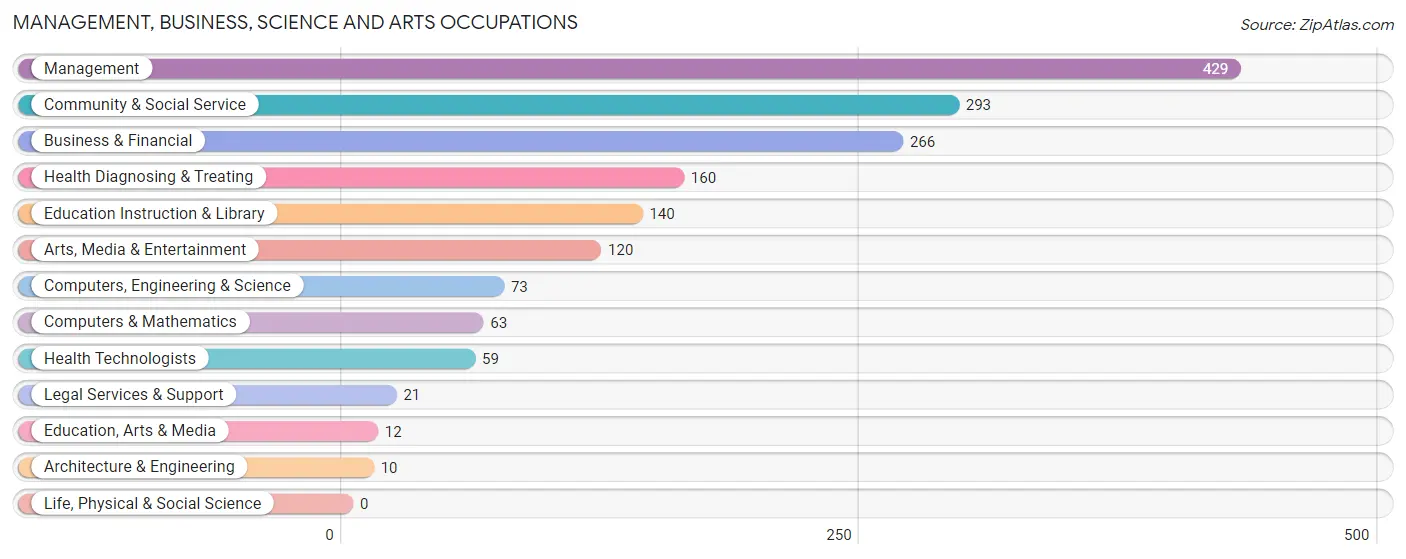
Management, Business, Science and Arts Occupations
The most common Management, Business, Science and Arts occupations in Pea Ridge are Management (429 | 13.1%), Community & Social Service (293 | 8.9%), Business & Financial (266 | 8.1%), Health Diagnosing & Treating (160 | 4.9%), and Education Instruction & Library (140 | 4.3%).
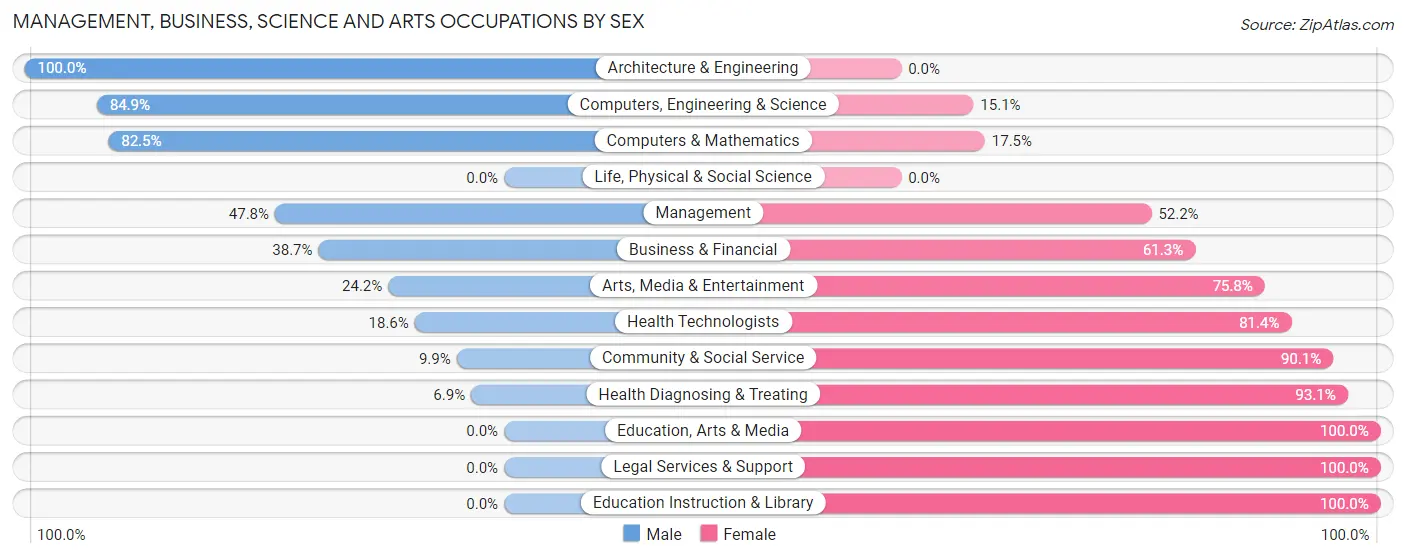
Management, Business, Science and Arts Occupations by Sex
Within the Management, Business, Science and Arts occupations in Pea Ridge, the most male-oriented occupations are Architecture & Engineering (100.0%), Computers, Engineering & Science (84.9%), and Computers & Mathematics (82.5%), while the most female-oriented occupations are Education, Arts & Media (100.0%), Legal Services & Support (100.0%), and Education Instruction & Library (100.0%).
| Occupation | Male | Female |
| Management | 205 (47.8%) | 224 (52.2%) |
| Business & Financial | 103 (38.7%) | 163 (61.3%) |
| Computers, Engineering & Science | 62 (84.9%) | 11 (15.1%) |
| Computers & Mathematics | 52 (82.5%) | 11 (17.5%) |
| Architecture & Engineering | 10 (100.0%) | 0 (0.0%) |
| Life, Physical & Social Science | 0 (0.0%) | 0 (0.0%) |
| Community & Social Service | 29 (9.9%) | 264 (90.1%) |
| Education, Arts & Media | 0 (0.0%) | 12 (100.0%) |
| Legal Services & Support | 0 (0.0%) | 21 (100.0%) |
| Education Instruction & Library | 0 (0.0%) | 140 (100.0%) |
| Arts, Media & Entertainment | 29 (24.2%) | 91 (75.8%) |
| Health Diagnosing & Treating | 11 (6.9%) | 149 (93.1%) |
| Health Technologists | 11 (18.6%) | 48 (81.4%) |
| Total (Category) | 410 (33.6%) | 811 (66.4%) |
| Total (Overall) | 1,684 (51.2%) | 1,604 (48.8%) |
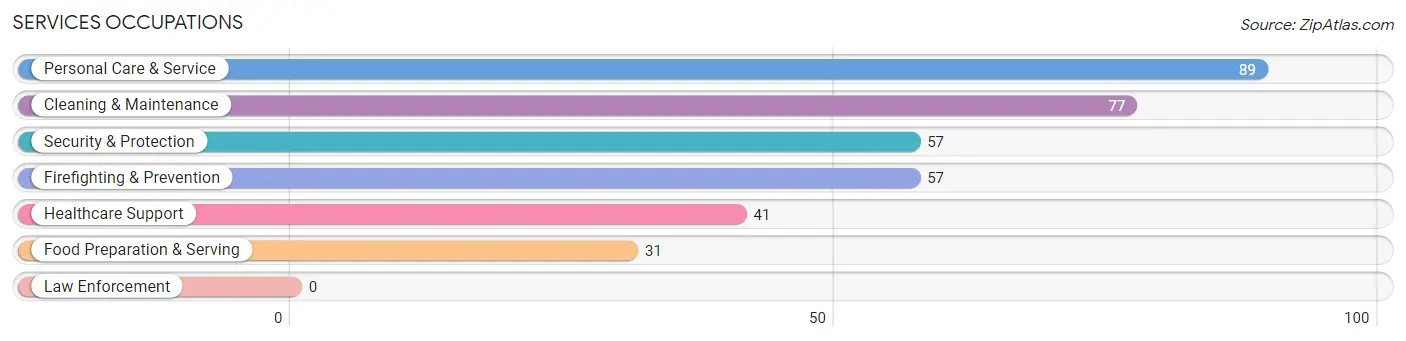
Services Occupations
The most common Services occupations in Pea Ridge are Personal Care & Service (89 | 2.7%), Cleaning & Maintenance (77 | 2.3%), Security & Protection (57 | 1.7%), Firefighting & Prevention (57 | 1.7%), and Healthcare Support (41 | 1.3%).
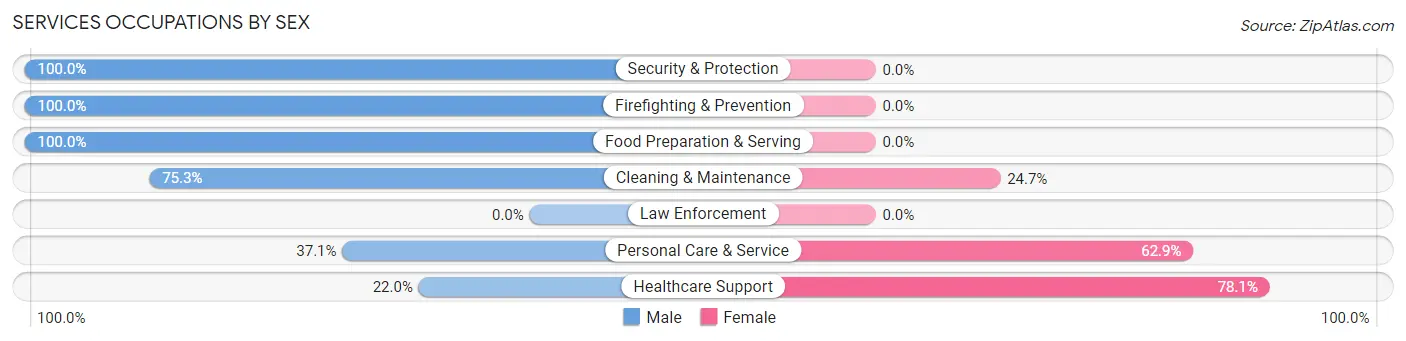
Services Occupations by Sex
Within the Services occupations in Pea Ridge, the most male-oriented occupations are Security & Protection (100.0%), Firefighting & Prevention (100.0%), and Food Preparation & Serving (100.0%), while the most female-oriented occupations are Healthcare Support (78.0%), Personal Care & Service (62.9%), and Cleaning & Maintenance (24.7%).
| Occupation | Male | Female |
| Healthcare Support | 9 (22.0%) | 32 (78.0%) |
| Security & Protection | 57 (100.0%) | 0 (0.0%) |
| Firefighting & Prevention | 57 (100.0%) | 0 (0.0%) |
| Law Enforcement | 0 (0.0%) | 0 (0.0%) |
| Food Preparation & Serving | 31 (100.0%) | 0 (0.0%) |
| Cleaning & Maintenance | 58 (75.3%) | 19 (24.7%) |
| Personal Care & Service | 33 (37.1%) | 56 (62.9%) |
| Total (Category) | 188 (63.7%) | 107 (36.3%) |
| Total (Overall) | 1,684 (51.2%) | 1,604 (48.8%) |
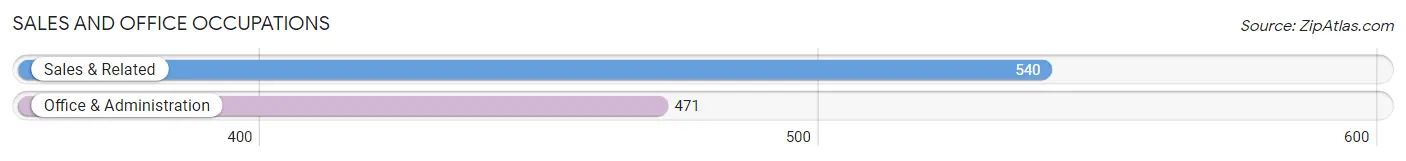
Sales and Office Occupations
The most common Sales and Office occupations in Pea Ridge are Sales & Related (540 | 16.4%), and Office & Administration (471 | 14.3%).
Sales and Office Occupations by Sex
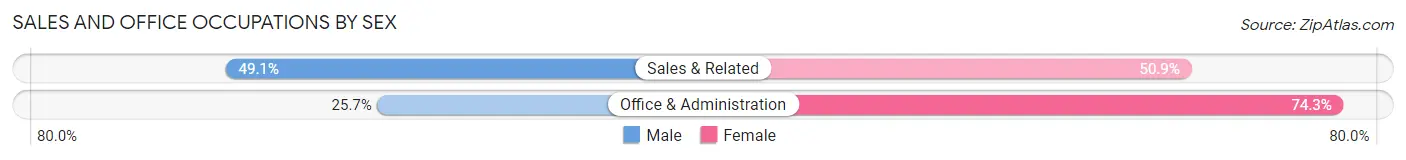
| Occupation | Male | Female |
| Sales & Related | 265 (49.1%) | 275 (50.9%) |
| Office & Administration | 121 (25.7%) | 350 (74.3%) |
| Total (Category) | 386 (38.2%) | 625 (61.8%) |
| Total (Overall) | 1,684 (51.2%) | 1,604 (48.8%) |
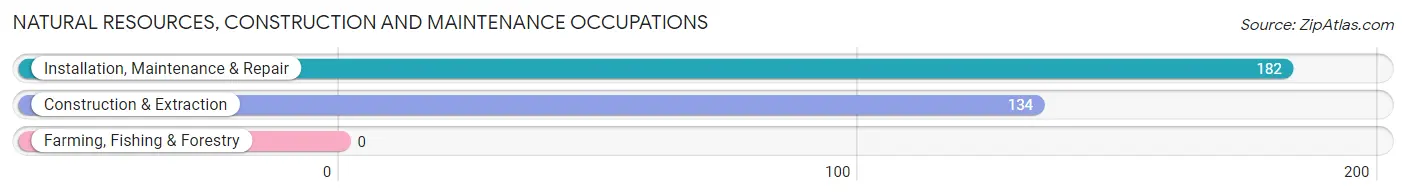
Natural Resources, Construction and Maintenance Occupations
The most common Natural Resources, Construction and Maintenance occupations in Pea Ridge are Installation, Maintenance & Repair (182 | 5.5%), and Construction & Extraction (134 | 4.1%).
Natural Resources, Construction and Maintenance Occupations by Sex
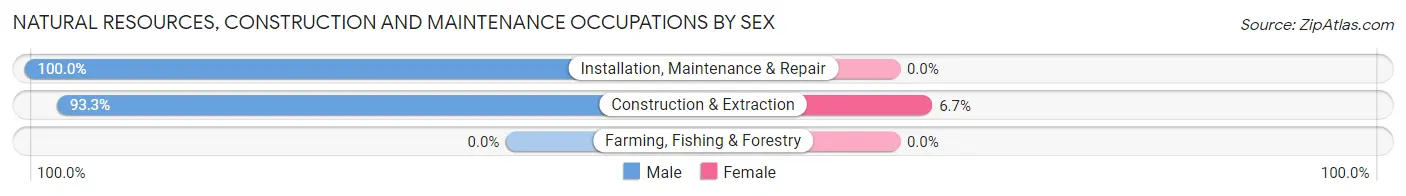
| Occupation | Male | Female |
| Farming, Fishing & Forestry | 0 (0.0%) | 0 (0.0%) |
| Construction & Extraction | 125 (93.3%) | 9 (6.7%) |
| Installation, Maintenance & Repair | 182 (100.0%) | 0 (0.0%) |
| Total (Category) | 307 (97.2%) | 9 (2.9%) |
| Total (Overall) | 1,684 (51.2%) | 1,604 (48.8%) |
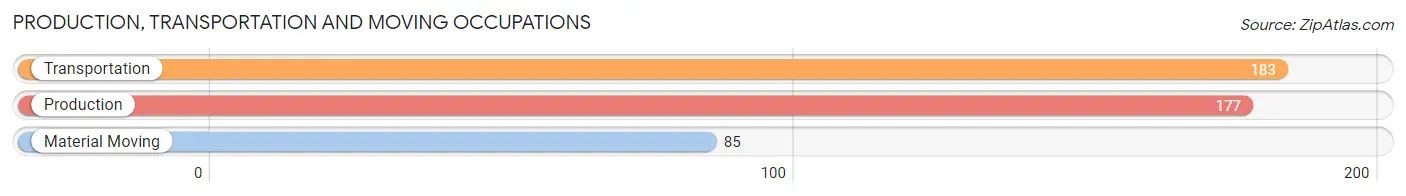
Production, Transportation and Moving Occupations
The most common Production, Transportation and Moving occupations in Pea Ridge are Transportation (183 | 5.6%), Production (177 | 5.4%), and Material Moving (85 | 2.6%).
Production, Transportation and Moving Occupations by Sex
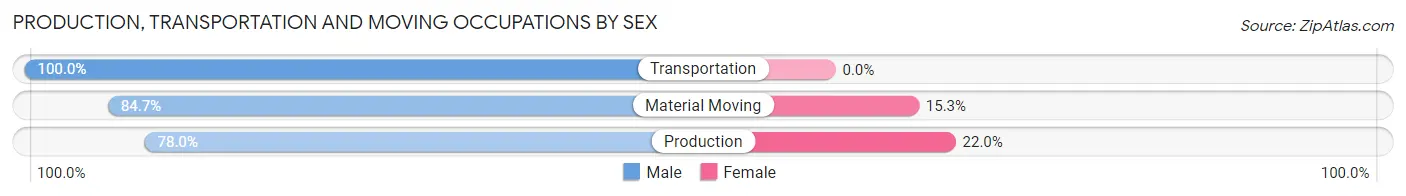
| Occupation | Male | Female |
| Production | 138 (78.0%) | 39 (22.0%) |
| Transportation | 183 (100.0%) | 0 (0.0%) |
| Material Moving | 72 (84.7%) | 13 (15.3%) |
| Total (Category) | 393 (88.3%) | 52 (11.7%) |
| Total (Overall) | 1,684 (51.2%) | 1,604 (48.8%) |
Employment Industries by Sex in Pea Ridge
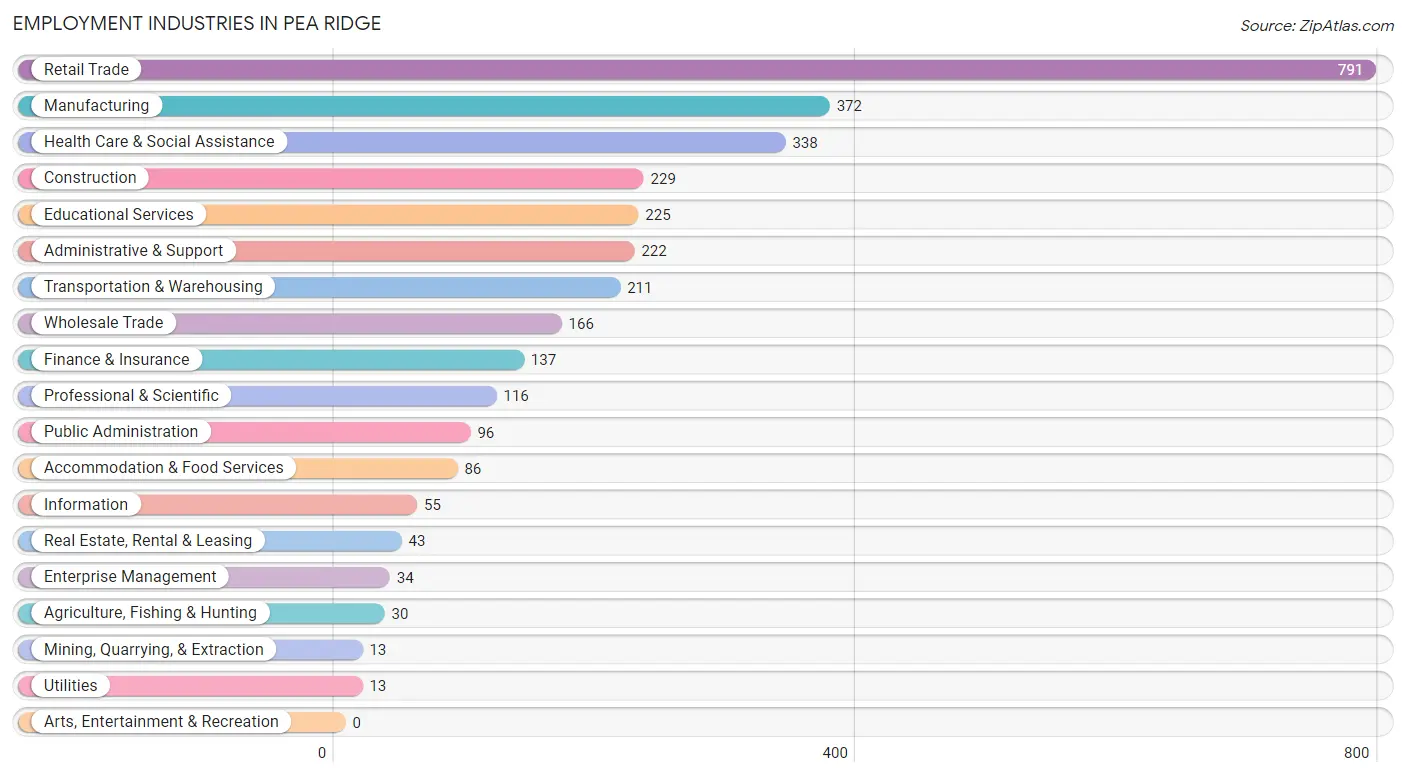
Employment Industries in Pea Ridge
The major employment industries in Pea Ridge include Retail Trade (791 | 24.1%), Manufacturing (372 | 11.3%), Health Care & Social Assistance (338 | 10.3%), Construction (229 | 7.0%), and Educational Services (225 | 6.8%).
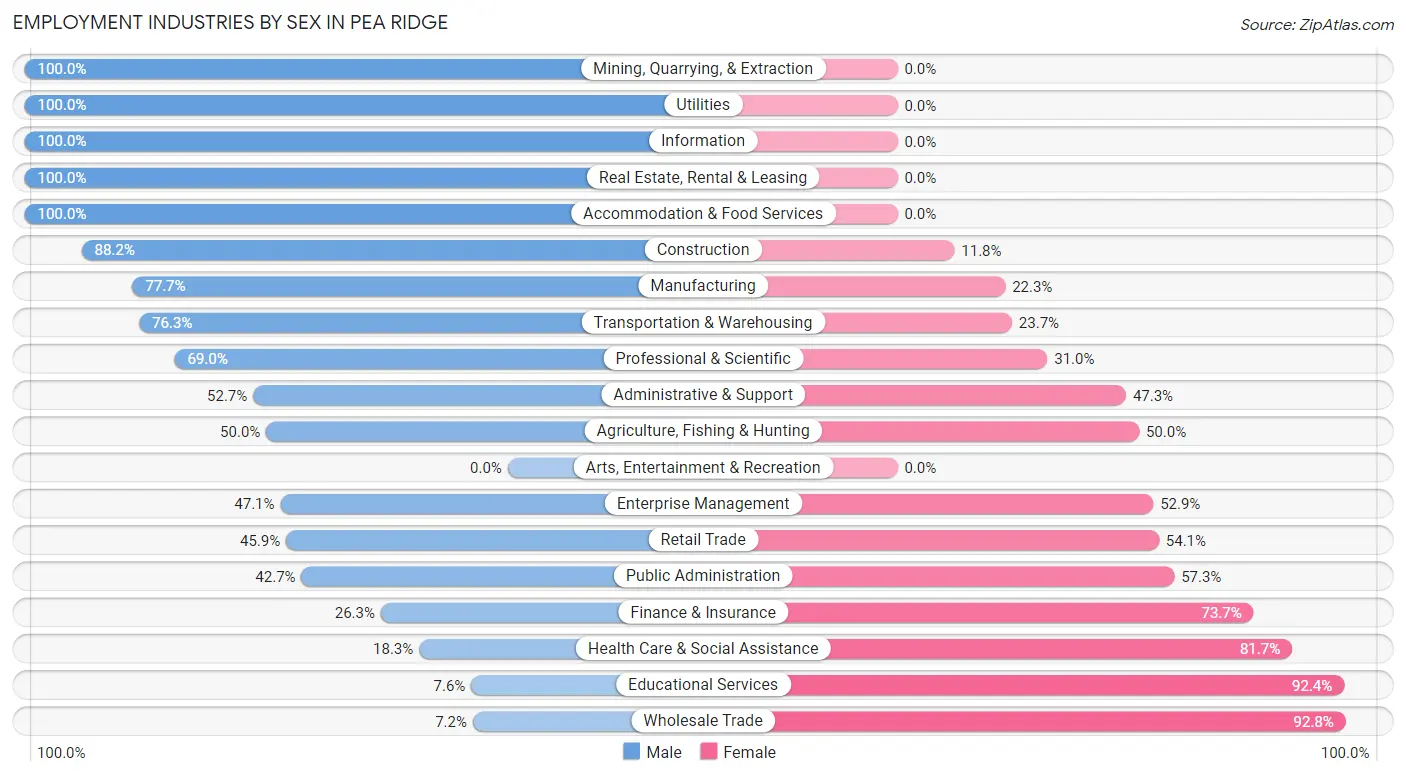
Employment Industries by Sex in Pea Ridge
The Pea Ridge industries that see more men than women are Mining, Quarrying, & Extraction (100.0%), Utilities (100.0%), and Information (100.0%), whereas the industries that tend to have a higher number of women are Wholesale Trade (92.8%), Educational Services (92.4%), and Health Care & Social Assistance (81.7%).
| Industry | Male | Female |
| Agriculture, Fishing & Hunting | 15 (50.0%) | 15 (50.0%) |
| Mining, Quarrying, & Extraction | 13 (100.0%) | 0 (0.0%) |
| Construction | 202 (88.2%) | 27 (11.8%) |
| Manufacturing | 289 (77.7%) | 83 (22.3%) |
| Wholesale Trade | 12 (7.2%) | 154 (92.8%) |
| Retail Trade | 363 (45.9%) | 428 (54.1%) |
| Transportation & Warehousing | 161 (76.3%) | 50 (23.7%) |
| Utilities | 13 (100.0%) | 0 (0.0%) |
| Information | 55 (100.0%) | 0 (0.0%) |
| Finance & Insurance | 36 (26.3%) | 101 (73.7%) |
| Real Estate, Rental & Leasing | 43 (100.0%) | 0 (0.0%) |
| Professional & Scientific | 80 (69.0%) | 36 (31.0%) |
| Enterprise Management | 16 (47.1%) | 18 (52.9%) |
| Administrative & Support | 117 (52.7%) | 105 (47.3%) |
| Educational Services | 17 (7.6%) | 208 (92.4%) |
| Health Care & Social Assistance | 62 (18.3%) | 276 (81.7%) |
| Arts, Entertainment & Recreation | 0 (0.0%) | 0 (0.0%) |
| Accommodation & Food Services | 86 (100.0%) | 0 (0.0%) |
| Public Administration | 41 (42.7%) | 55 (57.3%) |
| Total | 1,684 (51.2%) | 1,604 (48.8%) |
Education in Pea Ridge
School Enrollment in Pea Ridge
The most common levels of schooling among the 1,513 students in Pea Ridge are elementary school (529 | 35.0%), middle school (464 | 30.7%), and nursery / preschool (159 | 10.5%).
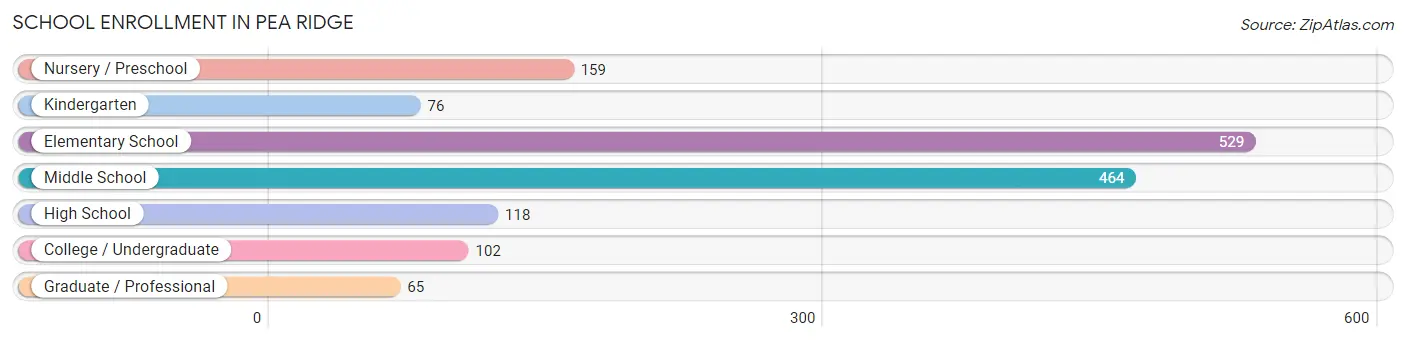
| School Level | # Students | % Students |
| Nursery / Preschool | 159 | 10.5% |
| Kindergarten | 76 | 5.0% |
| Elementary School | 529 | 35.0% |
| Middle School | 464 | 30.7% |
| High School | 118 | 7.8% |
| College / Undergraduate | 102 | 6.7% |
| Graduate / Professional | 65 | 4.3% |
| Total | 1,513 | 100.0% |
School Enrollment by Age by Funding Source in Pea Ridge
Out of a total of 1,513 students who are enrolled in schools in Pea Ridge, 324 (21.4%) attend a private institution, while the remaining 1,189 (78.6%) are enrolled in public schools. The age group of 3 to 4 year olds has the highest likelihood of being enrolled in private schools, with 112 (76.2% in the age bracket) enrolled. Conversely, the age group of 15 to 17 year olds has the lowest likelihood of being enrolled in a private school, with 91 (100.0% in the age bracket) attending a public institution.
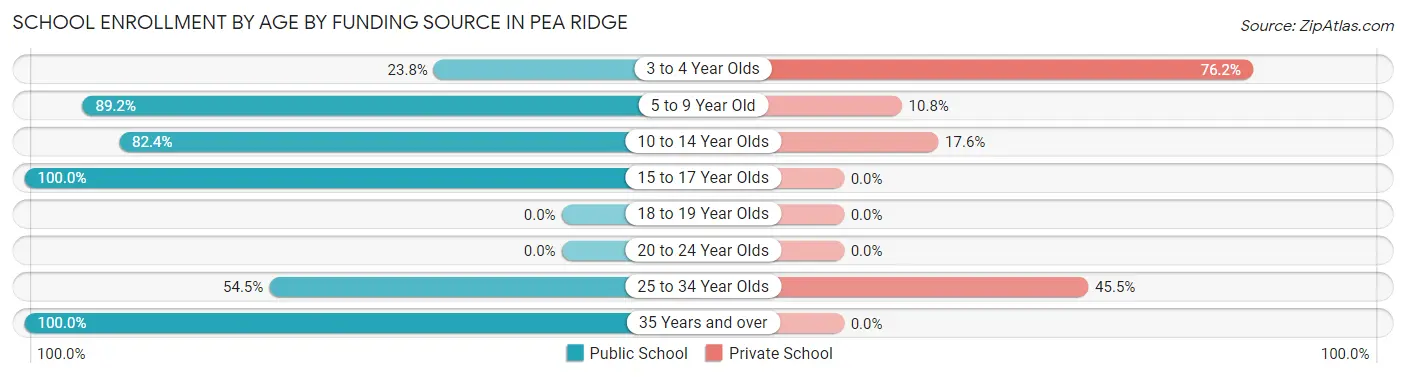
| Age Bracket | Public School | Private School |
| 3 to 4 Year Olds | 35 (23.8%) | 112 (76.2%) |
| 5 to 9 Year Old | 446 (89.2%) | 54 (10.8%) |
| 10 to 14 Year Olds | 501 (82.4%) | 107 (17.6%) |
| 15 to 17 Year Olds | 91 (100.0%) | 0 (0.0%) |
| 18 to 19 Year Olds | 0 (0.0%) | 0 (0.0%) |
| 20 to 24 Year Olds | 0 (0.0%) | 0 (0.0%) |
| 25 to 34 Year Olds | 61 (54.5%) | 51 (45.5%) |
| 35 Years and over | 55 (100.0%) | 0 (0.0%) |
| Total | 1,189 (78.6%) | 324 (21.4%) |
Educational Attainment by Field of Study in Pea Ridge
Business (554 | 47.7%), education (158 | 13.6%), arts & humanities (102 | 8.8%), science & technology (78 | 6.7%), and liberal arts & history (77 | 6.6%) are the most common fields of study among 1,161 individuals in Pea Ridge who have obtained a bachelor's degree or higher.
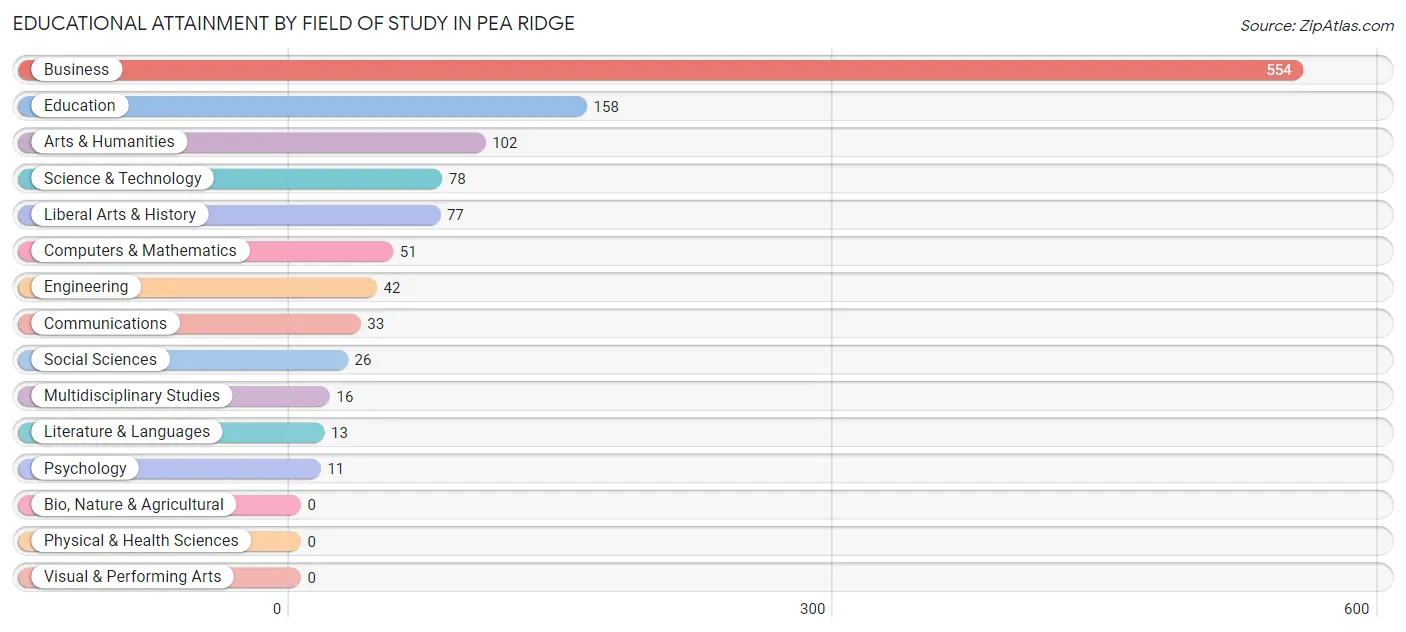
| Field of Study | # Graduates | % Graduates |
| Computers & Mathematics | 51 | 4.4% |
| Bio, Nature & Agricultural | 0 | 0.0% |
| Physical & Health Sciences | 0 | 0.0% |
| Psychology | 11 | 0.9% |
| Social Sciences | 26 | 2.2% |
| Engineering | 42 | 3.6% |
| Multidisciplinary Studies | 16 | 1.4% |
| Science & Technology | 78 | 6.7% |
| Business | 554 | 47.7% |
| Education | 158 | 13.6% |
| Literature & Languages | 13 | 1.1% |
| Liberal Arts & History | 77 | 6.6% |
| Visual & Performing Arts | 0 | 0.0% |
| Communications | 33 | 2.8% |
| Arts & Humanities | 102 | 8.8% |
| Total | 1,161 | 100.0% |
Transportation & Commute in Pea Ridge
Vehicle Availability by Sex in Pea Ridge
The most prevalent vehicle ownership categories in Pea Ridge are males with 2 vehicles (924, accounting for 54.9%) and females with 2 vehicles (792, making up 58.2%).
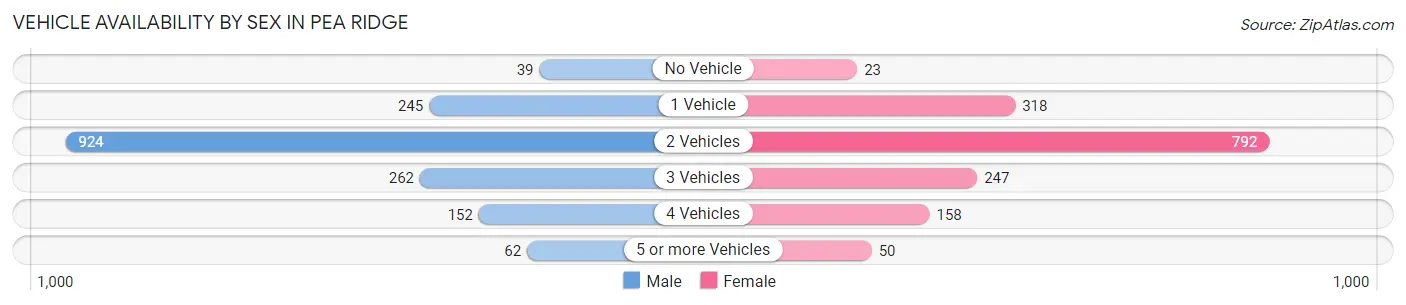
| Vehicles Available | Male | Female |
| No Vehicle | 39 (2.3%) | 23 (1.5%) |
| 1 Vehicle | 245 (14.5%) | 318 (20.0%) |
| 2 Vehicles | 924 (54.9%) | 792 (49.9%) |
| 3 Vehicles | 262 (15.6%) | 247 (15.5%) |
| 4 Vehicles | 152 (9.0%) | 158 (10.0%) |
| 5 or more Vehicles | 62 (3.7%) | 50 (3.2%) |
| Total | 1,684 (100.0%) | 1,588 (100.0%) |
Commute Time in Pea Ridge
The most frequently occuring commute durations in Pea Ridge are 20 to 24 minutes (549 commuters, 20.0%), 30 to 34 minutes (539 commuters, 19.7%), and 25 to 29 minutes (524 commuters, 19.1%).
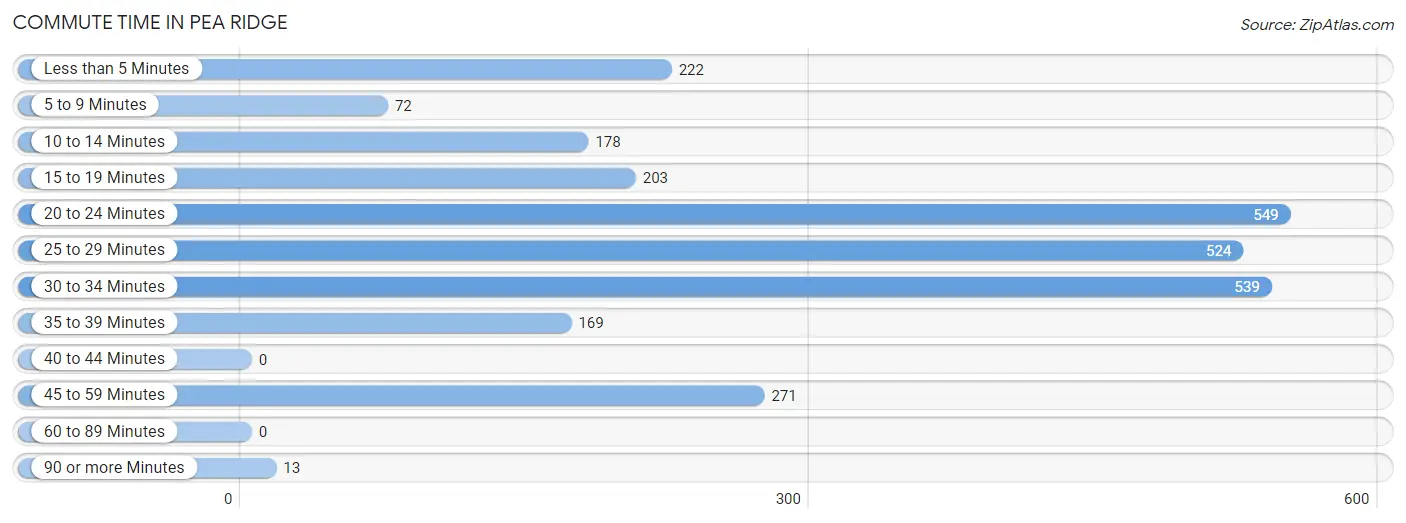
| Commute Time | # Commuters | % Commuters |
| Less than 5 Minutes | 222 | 8.1% |
| 5 to 9 Minutes | 72 | 2.6% |
| 10 to 14 Minutes | 178 | 6.5% |
| 15 to 19 Minutes | 203 | 7.4% |
| 20 to 24 Minutes | 549 | 20.0% |
| 25 to 29 Minutes | 524 | 19.1% |
| 30 to 34 Minutes | 539 | 19.7% |
| 35 to 39 Minutes | 169 | 6.2% |
| 40 to 44 Minutes | 0 | 0.0% |
| 45 to 59 Minutes | 271 | 9.9% |
| 60 to 89 Minutes | 0 | 0.0% |
| 90 or more Minutes | 13 | 0.5% |
Commute Time by Sex in Pea Ridge
The most common commute times in Pea Ridge are 30 to 34 minutes (340 commuters, 23.1%) for males and 25 to 29 minutes (386 commuters, 30.4%) for females.
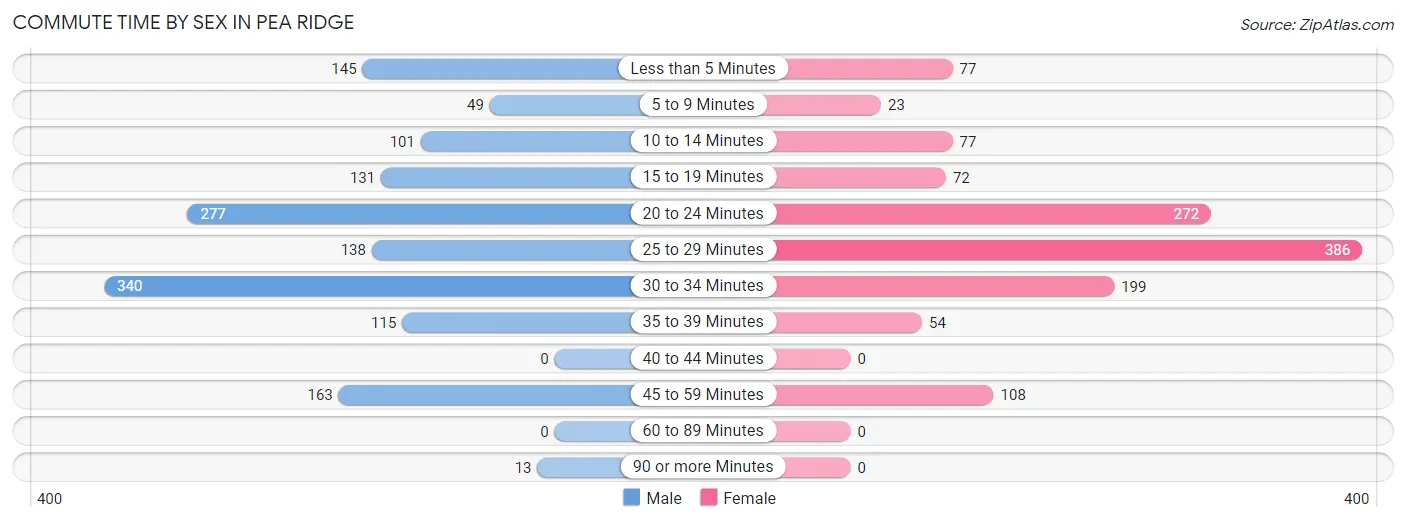
| Commute Time | Male | Female |
| Less than 5 Minutes | 145 (9.9%) | 77 (6.1%) |
| 5 to 9 Minutes | 49 (3.3%) | 23 (1.8%) |
| 10 to 14 Minutes | 101 (6.9%) | 77 (6.1%) |
| 15 to 19 Minutes | 131 (8.9%) | 72 (5.7%) |
| 20 to 24 Minutes | 277 (18.8%) | 272 (21.4%) |
| 25 to 29 Minutes | 138 (9.4%) | 386 (30.4%) |
| 30 to 34 Minutes | 340 (23.1%) | 199 (15.7%) |
| 35 to 39 Minutes | 115 (7.8%) | 54 (4.3%) |
| 40 to 44 Minutes | 0 (0.0%) | 0 (0.0%) |
| 45 to 59 Minutes | 163 (11.1%) | 108 (8.5%) |
| 60 to 89 Minutes | 0 (0.0%) | 0 (0.0%) |
| 90 or more Minutes | 13 (0.9%) | 0 (0.0%) |
Time of Departure to Work by Sex in Pea Ridge
The most frequent times of departure to work in Pea Ridge are 7:00 AM to 7:29 AM (413, 28.1%) for males and 6:30 AM to 6:59 AM (374, 29.5%) for females.
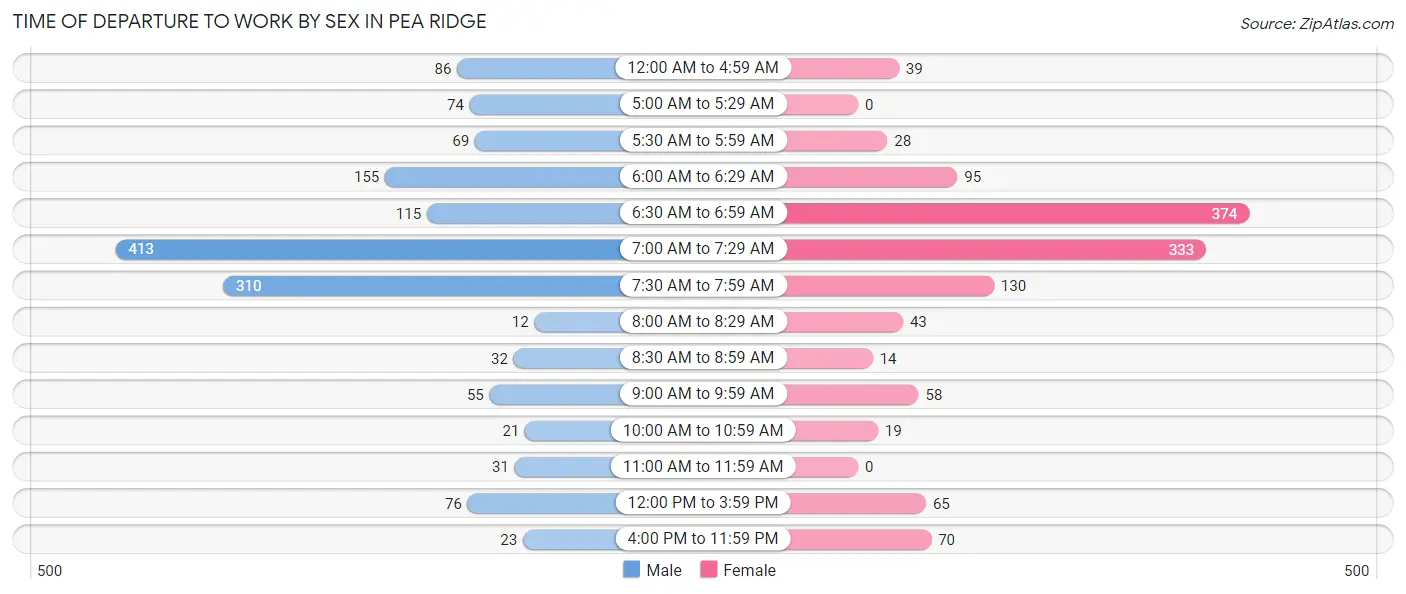
| Time of Departure | Male | Female |
| 12:00 AM to 4:59 AM | 86 (5.8%) | 39 (3.1%) |
| 5:00 AM to 5:29 AM | 74 (5.0%) | 0 (0.0%) |
| 5:30 AM to 5:59 AM | 69 (4.7%) | 28 (2.2%) |
| 6:00 AM to 6:29 AM | 155 (10.5%) | 95 (7.5%) |
| 6:30 AM to 6:59 AM | 115 (7.8%) | 374 (29.5%) |
| 7:00 AM to 7:29 AM | 413 (28.1%) | 333 (26.3%) |
| 7:30 AM to 7:59 AM | 310 (21.1%) | 130 (10.2%) |
| 8:00 AM to 8:29 AM | 12 (0.8%) | 43 (3.4%) |
| 8:30 AM to 8:59 AM | 32 (2.2%) | 14 (1.1%) |
| 9:00 AM to 9:59 AM | 55 (3.7%) | 58 (4.6%) |
| 10:00 AM to 10:59 AM | 21 (1.4%) | 19 (1.5%) |
| 11:00 AM to 11:59 AM | 31 (2.1%) | 0 (0.0%) |
| 12:00 PM to 3:59 PM | 76 (5.2%) | 65 (5.1%) |
| 4:00 PM to 11:59 PM | 23 (1.6%) | 70 (5.5%) |
| Total | 1,472 (100.0%) | 1,268 (100.0%) |
Housing Occupancy in Pea Ridge
Occupancy by Ownership in Pea Ridge
Of the total 2,528 dwellings in Pea Ridge, owner-occupied units account for 1,834 (72.6%), while renter-occupied units make up 694 (27.5%).
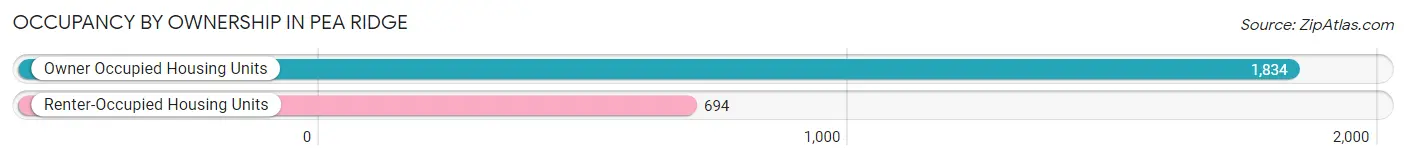
| Occupancy | # Housing Units | % Housing Units |
| Owner Occupied Housing Units | 1,834 | 72.6% |
| Renter-Occupied Housing Units | 694 | 27.5% |
| Total Occupied Housing Units | 2,528 | 100.0% |
Occupancy by Household Size in Pea Ridge
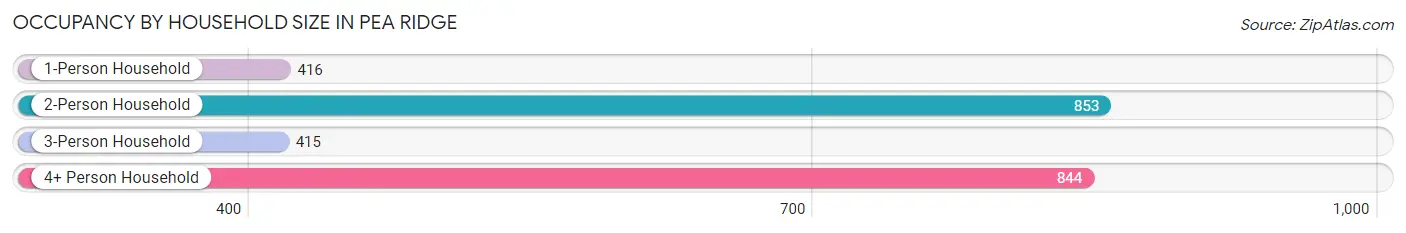
| Household Size | # Housing Units | % Housing Units |
| 1-Person Household | 416 | 16.5% |
| 2-Person Household | 853 | 33.7% |
| 3-Person Household | 415 | 16.4% |
| 4+ Person Household | 844 | 33.4% |
| Total Housing Units | 2,528 | 100.0% |
Occupancy by Ownership by Household Size in Pea Ridge
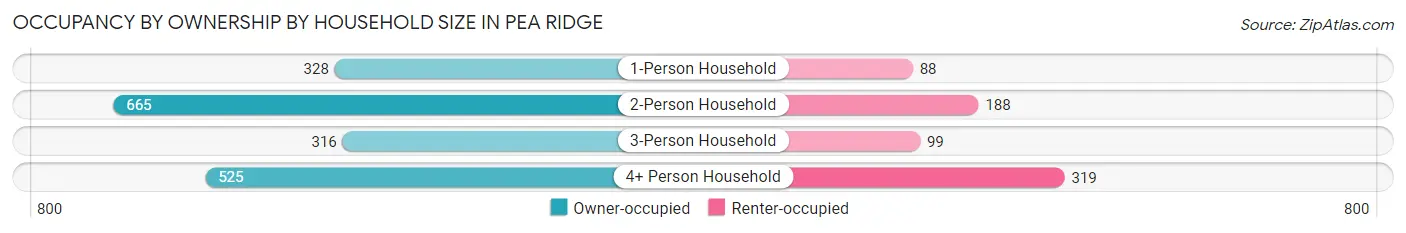
| Household Size | Owner-occupied | Renter-occupied |
| 1-Person Household | 328 (78.8%) | 88 (21.1%) |
| 2-Person Household | 665 (78.0%) | 188 (22.0%) |
| 3-Person Household | 316 (76.1%) | 99 (23.9%) |
| 4+ Person Household | 525 (62.2%) | 319 (37.8%) |
| Total Housing Units | 1,834 (72.6%) | 694 (27.5%) |
Occupancy by Educational Attainment in Pea Ridge
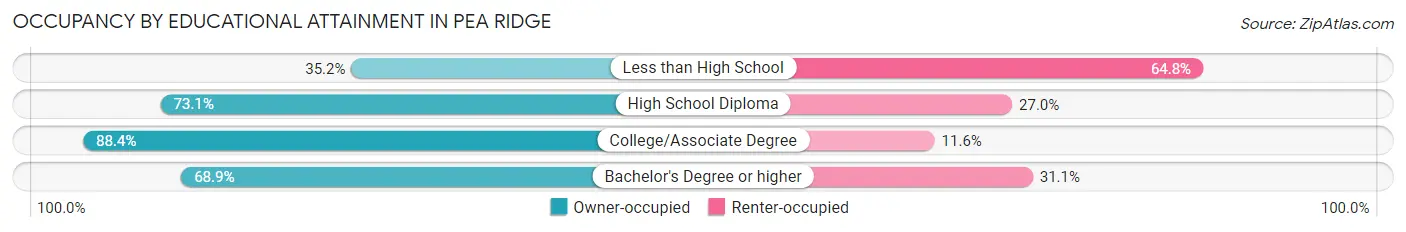
| Household Size | Owner-occupied | Renter-occupied |
| Less than High School | 81 (35.2%) | 149 (64.8%) |
| High School Diploma | 645 (73.1%) | 238 (27.0%) |
| College/Associate Degree | 602 (88.4%) | 79 (11.6%) |
| Bachelor's Degree or higher | 506 (68.9%) | 228 (31.1%) |
Occupancy by Age of Householder in Pea Ridge
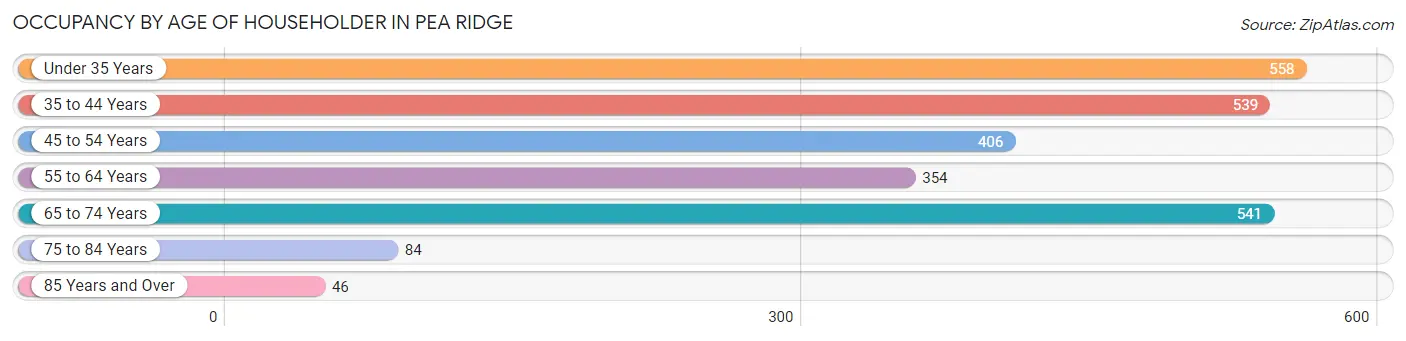
| Age Bracket | # Households | % Households |
| Under 35 Years | 558 | 22.1% |
| 35 to 44 Years | 539 | 21.3% |
| 45 to 54 Years | 406 | 16.1% |
| 55 to 64 Years | 354 | 14.0% |
| 65 to 74 Years | 541 | 21.4% |
| 75 to 84 Years | 84 | 3.3% |
| 85 Years and Over | 46 | 1.8% |
| Total | 2,528 | 100.0% |
Housing Finances in Pea Ridge
Median Income by Occupancy in Pea Ridge
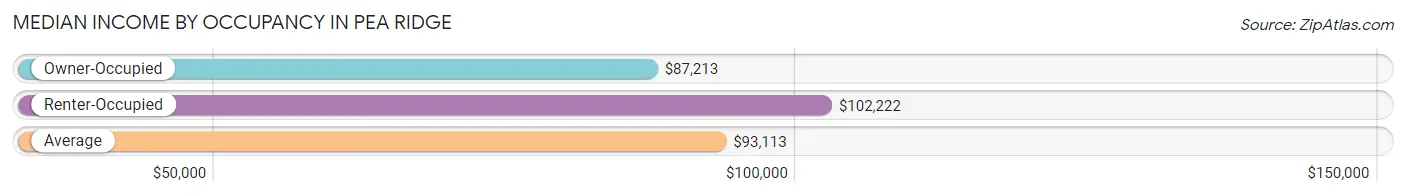
| Occupancy Type | # Households | Median Income |
| Owner-Occupied | 1,834 (72.6%) | $87,213 |
| Renter-Occupied | 694 (27.5%) | $102,222 |
| Average | 2,528 (100.0%) | $93,113 |
Occupancy by Householder Income Bracket in Pea Ridge
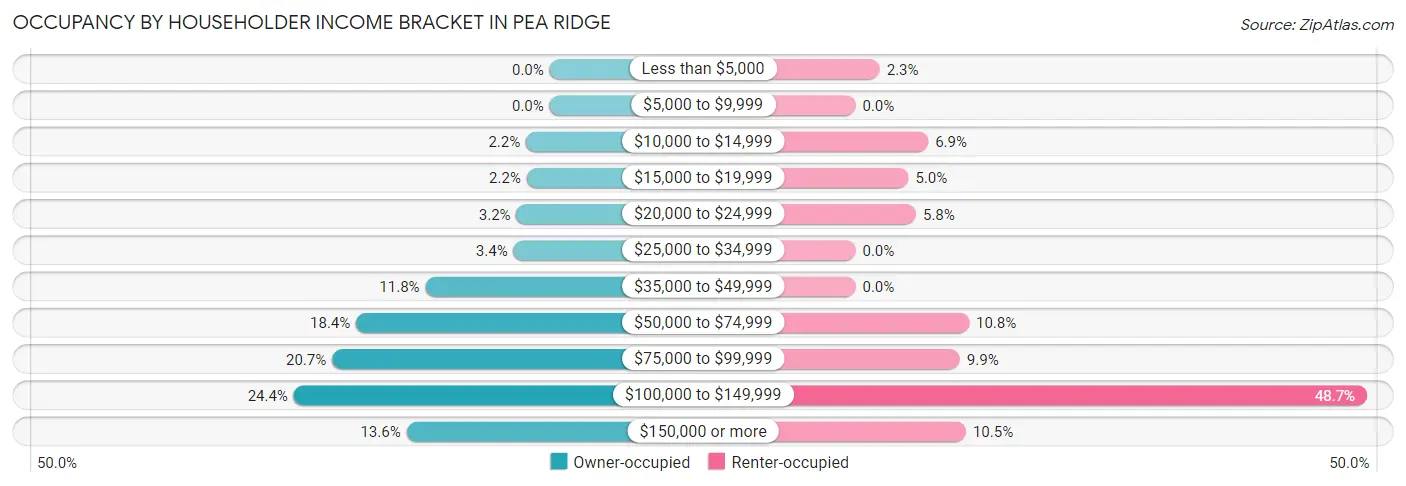
| Income Bracket | Owner-occupied | Renter-occupied |
| Less than $5,000 | 0 (0.0%) | 16 (2.3%) |
| $5,000 to $9,999 | 0 (0.0%) | 0 (0.0%) |
| $10,000 to $14,999 | 41 (2.2%) | 48 (6.9%) |
| $15,000 to $19,999 | 40 (2.2%) | 35 (5.0%) |
| $20,000 to $24,999 | 58 (3.2%) | 40 (5.8%) |
| $25,000 to $34,999 | 63 (3.4%) | 0 (0.0%) |
| $35,000 to $49,999 | 217 (11.8%) | 0 (0.0%) |
| $50,000 to $74,999 | 338 (18.4%) | 75 (10.8%) |
| $75,000 to $99,999 | 380 (20.7%) | 69 (9.9%) |
| $100,000 to $149,999 | 447 (24.4%) | 338 (48.7%) |
| $150,000 or more | 250 (13.6%) | 73 (10.5%) |
| Total | 1,834 (100.0%) | 694 (100.0%) |
Monthly Housing Cost Tiers in Pea Ridge
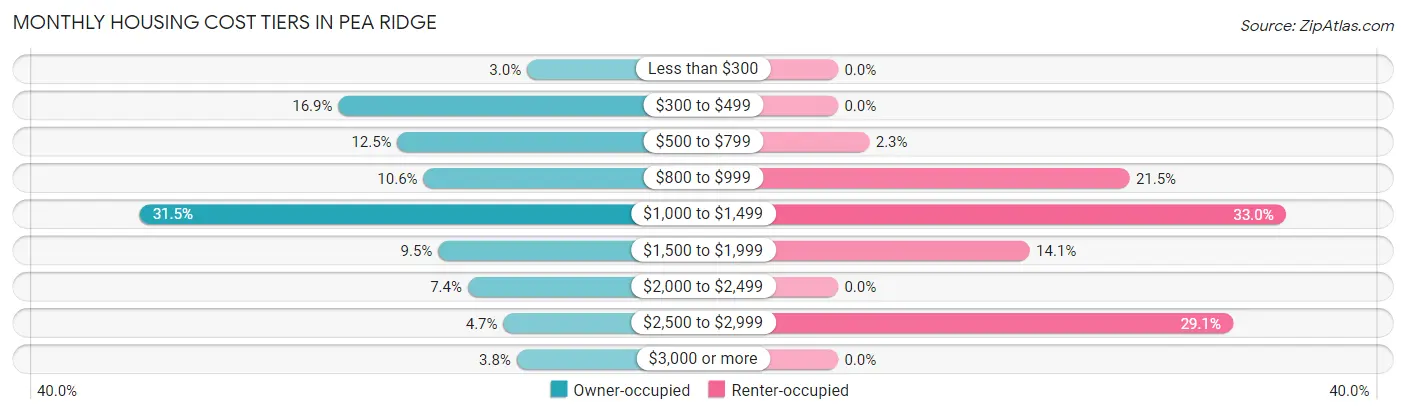
| Monthly Cost | Owner-occupied | Renter-occupied |
| Less than $300 | 55 (3.0%) | 0 (0.0%) |
| $300 to $499 | 310 (16.9%) | 0 (0.0%) |
| $500 to $799 | 230 (12.5%) | 16 (2.3%) |
| $800 to $999 | 195 (10.6%) | 149 (21.5%) |
| $1,000 to $1,499 | 578 (31.5%) | 229 (33.0%) |
| $1,500 to $1,999 | 175 (9.5%) | 98 (14.1%) |
| $2,000 to $2,499 | 135 (7.4%) | 0 (0.0%) |
| $2,500 to $2,999 | 87 (4.7%) | 202 (29.1%) |
| $3,000 or more | 69 (3.8%) | 0 (0.0%) |
| Total | 1,834 (100.0%) | 694 (100.0%) |
Physical Housing Characteristics in Pea Ridge
Housing Structures in Pea Ridge
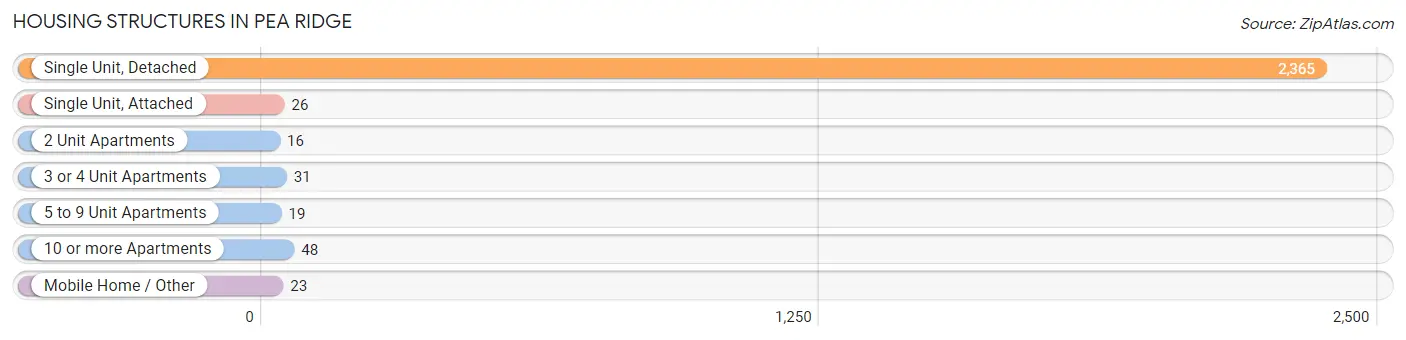
| Structure Type | # Housing Units | % Housing Units |
| Single Unit, Detached | 2,365 | 93.5% |
| Single Unit, Attached | 26 | 1.0% |
| 2 Unit Apartments | 16 | 0.6% |
| 3 or 4 Unit Apartments | 31 | 1.2% |
| 5 to 9 Unit Apartments | 19 | 0.7% |
| 10 or more Apartments | 48 | 1.9% |
| Mobile Home / Other | 23 | 0.9% |
| Total | 2,528 | 100.0% |
Housing Structures by Occupancy in Pea Ridge
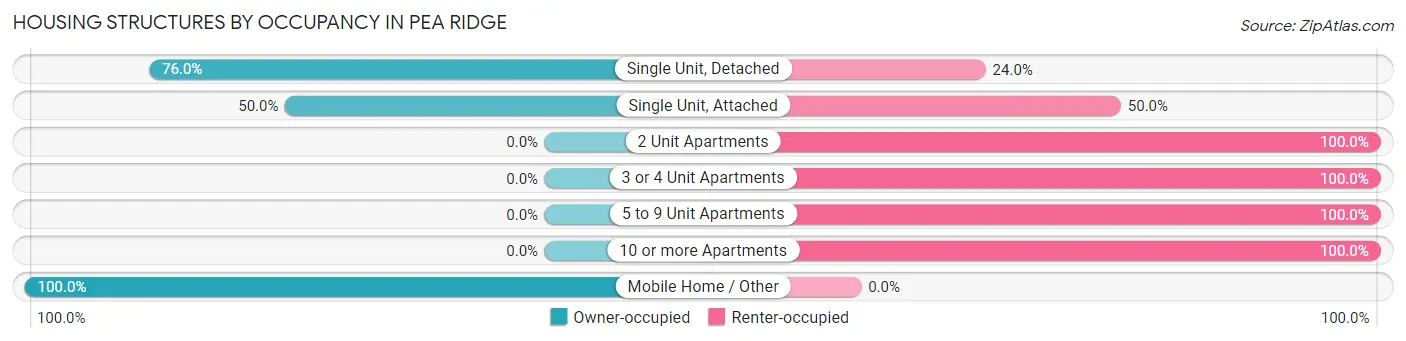
| Structure Type | Owner-occupied | Renter-occupied |
| Single Unit, Detached | 1,798 (76.0%) | 567 (24.0%) |
| Single Unit, Attached | 13 (50.0%) | 13 (50.0%) |
| 2 Unit Apartments | 0 (0.0%) | 16 (100.0%) |
| 3 or 4 Unit Apartments | 0 (0.0%) | 31 (100.0%) |
| 5 to 9 Unit Apartments | 0 (0.0%) | 19 (100.0%) |
| 10 or more Apartments | 0 (0.0%) | 48 (100.0%) |
| Mobile Home / Other | 23 (100.0%) | 0 (0.0%) |
| Total | 1,834 (72.6%) | 694 (27.5%) |
Housing Structures by Number of Rooms in Pea Ridge
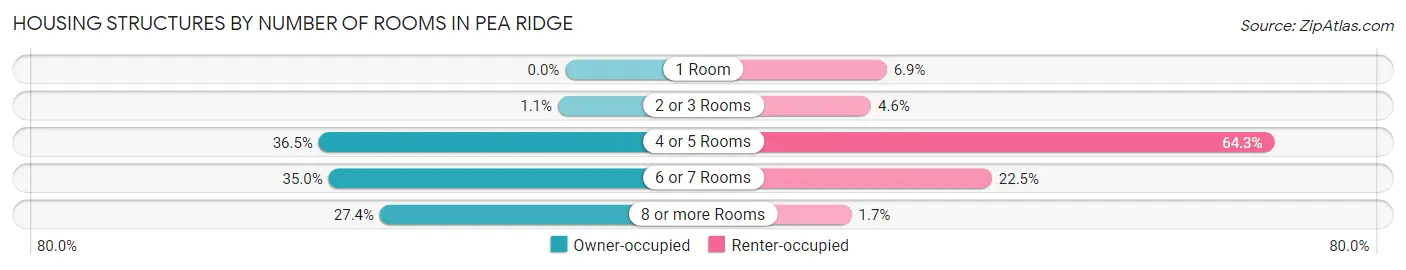
| Number of Rooms | Owner-occupied | Renter-occupied |
| 1 Room | 0 (0.0%) | 48 (6.9%) |
| 2 or 3 Rooms | 20 (1.1%) | 32 (4.6%) |
| 4 or 5 Rooms | 669 (36.5%) | 446 (64.3%) |
| 6 or 7 Rooms | 642 (35.0%) | 156 (22.5%) |
| 8 or more Rooms | 503 (27.4%) | 12 (1.7%) |
| Total | 1,834 (100.0%) | 694 (100.0%) |
Housing Structure by Heating Type in Pea Ridge
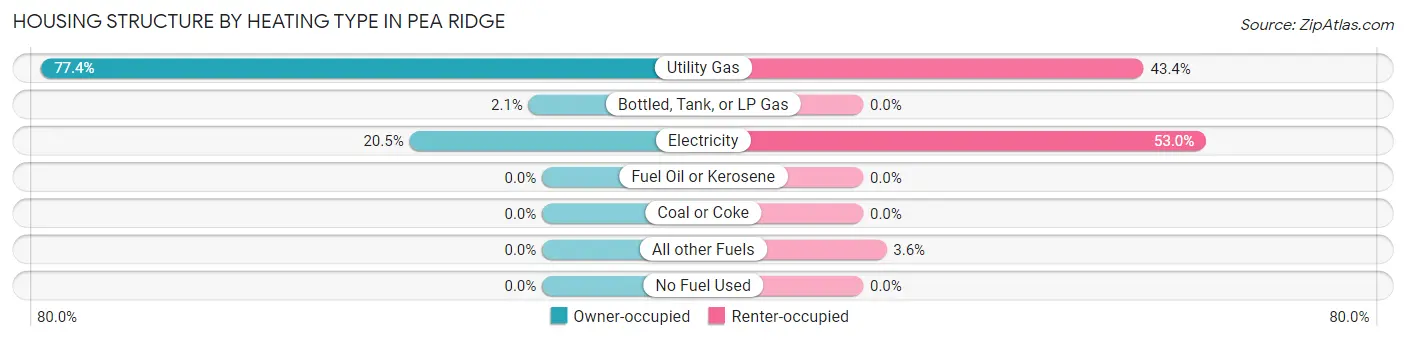
| Heating Type | Owner-occupied | Renter-occupied |
| Utility Gas | 1,420 (77.4%) | 301 (43.4%) |
| Bottled, Tank, or LP Gas | 38 (2.1%) | 0 (0.0%) |
| Electricity | 376 (20.5%) | 368 (53.0%) |
| Fuel Oil or Kerosene | 0 (0.0%) | 0 (0.0%) |
| Coal or Coke | 0 (0.0%) | 0 (0.0%) |
| All other Fuels | 0 (0.0%) | 25 (3.6%) |
| No Fuel Used | 0 (0.0%) | 0 (0.0%) |
| Total | 1,834 (100.0%) | 694 (100.0%) |
Household Vehicle Usage in Pea Ridge
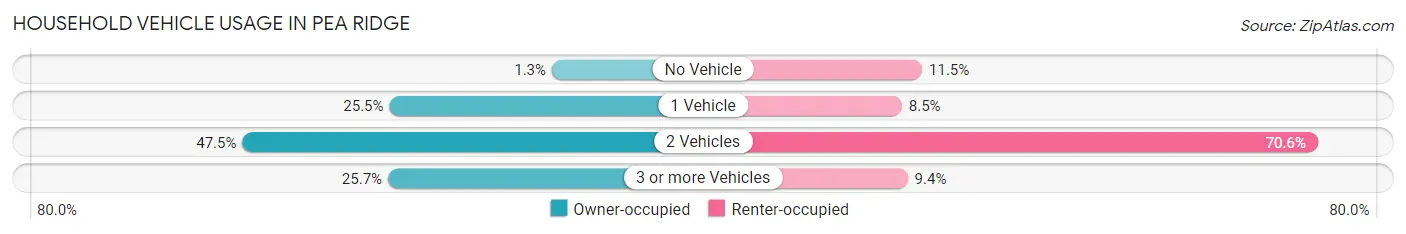
| Vehicles per Household | Owner-occupied | Renter-occupied |
| No Vehicle | 23 (1.3%) | 80 (11.5%) |
| 1 Vehicle | 468 (25.5%) | 59 (8.5%) |
| 2 Vehicles | 871 (47.5%) | 490 (70.6%) |
| 3 or more Vehicles | 472 (25.7%) | 65 (9.4%) |
| Total | 1,834 (100.0%) | 694 (100.0%) |
Real Estate & Mortgages in Pea Ridge
Real Estate and Mortgage Overview in Pea Ridge
| Characteristic | Without Mortgage | With Mortgage |
| Housing Units | 554 | 1,280 |
| Median Property Value | $208,300 | $228,700 |
| Median Household Income | $53,403 | $206 |
| Monthly Housing Costs | $466 | $69 |
| Real Estate Taxes | $866 | $44 |
Property Value by Mortgage Status in Pea Ridge
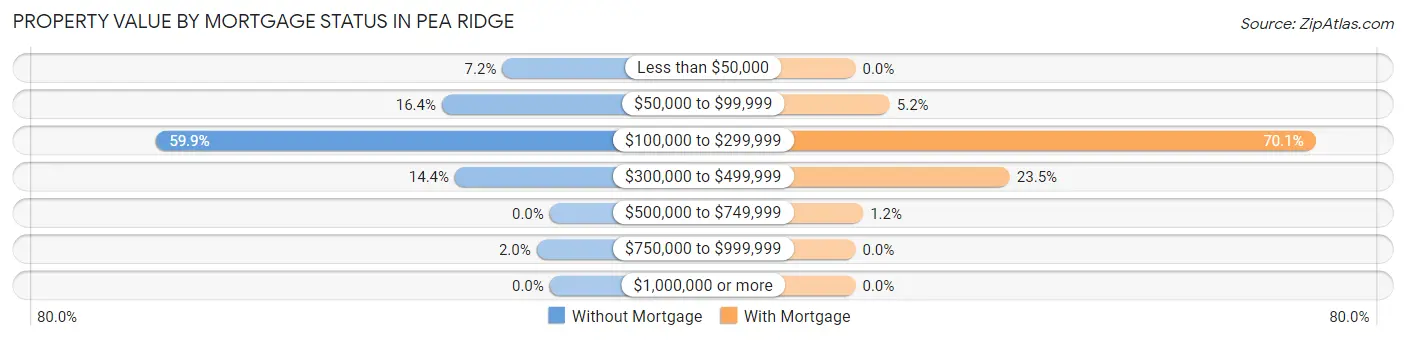
| Property Value | Without Mortgage | With Mortgage |
| Less than $50,000 | 40 (7.2%) | 0 (0.0%) |
| $50,000 to $99,999 | 91 (16.4%) | 67 (5.2%) |
| $100,000 to $299,999 | 332 (59.9%) | 897 (70.1%) |
| $300,000 to $499,999 | 80 (14.4%) | 301 (23.5%) |
| $500,000 to $749,999 | 0 (0.0%) | 15 (1.2%) |
| $750,000 to $999,999 | 11 (2.0%) | 0 (0.0%) |
| $1,000,000 or more | 0 (0.0%) | 0 (0.0%) |
| Total | 554 (100.0%) | 1,280 (100.0%) |
Household Income by Mortgage Status in Pea Ridge
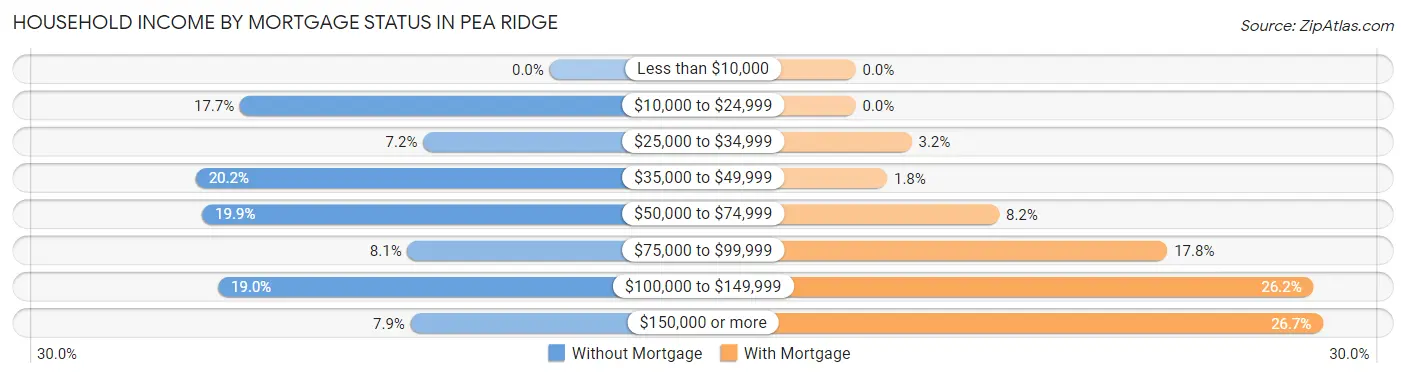
| Household Income | Without Mortgage | With Mortgage |
| Less than $10,000 | 0 (0.0%) | 0 (0.0%) |
| $10,000 to $24,999 | 98 (17.7%) | 0 (0.0%) |
| $25,000 to $34,999 | 40 (7.2%) | 41 (3.2%) |
| $35,000 to $49,999 | 112 (20.2%) | 23 (1.8%) |
| $50,000 to $74,999 | 110 (19.9%) | 105 (8.2%) |
| $75,000 to $99,999 | 45 (8.1%) | 228 (17.8%) |
| $100,000 to $149,999 | 105 (19.0%) | 335 (26.2%) |
| $150,000 or more | 44 (7.9%) | 342 (26.7%) |
| Total | 554 (100.0%) | 1,280 (100.0%) |
Property Value to Household Income Ratio in Pea Ridge
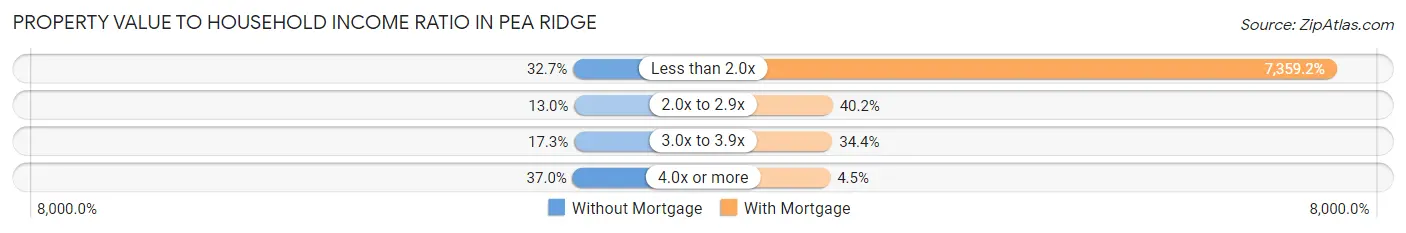
| Value-to-Income Ratio | Without Mortgage | With Mortgage |
| Less than 2.0x | 181 (32.7%) | 94,198 (7,359.2%) |
| 2.0x to 2.9x | 72 (13.0%) | 514 (40.2%) |
| 3.0x to 3.9x | 96 (17.3%) | 440 (34.4%) |
| 4.0x or more | 205 (37.0%) | 58 (4.5%) |
| Total | 554 (100.0%) | 1,280 (100.0%) |
Real Estate Taxes by Mortgage Status in Pea Ridge
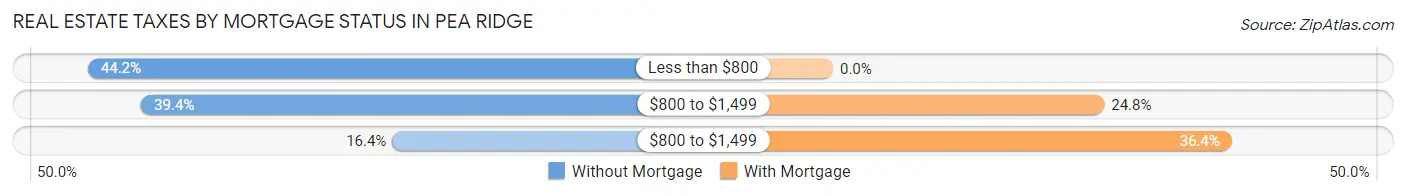
| Property Taxes | Without Mortgage | With Mortgage |
| Less than $800 | 245 (44.2%) | 0 (0.0%) |
| $800 to $1,499 | 218 (39.4%) | 317 (24.8%) |
| $800 to $1,499 | 91 (16.4%) | 466 (36.4%) |
| Total | 554 (100.0%) | 1,280 (100.0%) |
Health & Disability in Pea Ridge
Health Insurance Coverage by Age in Pea Ridge
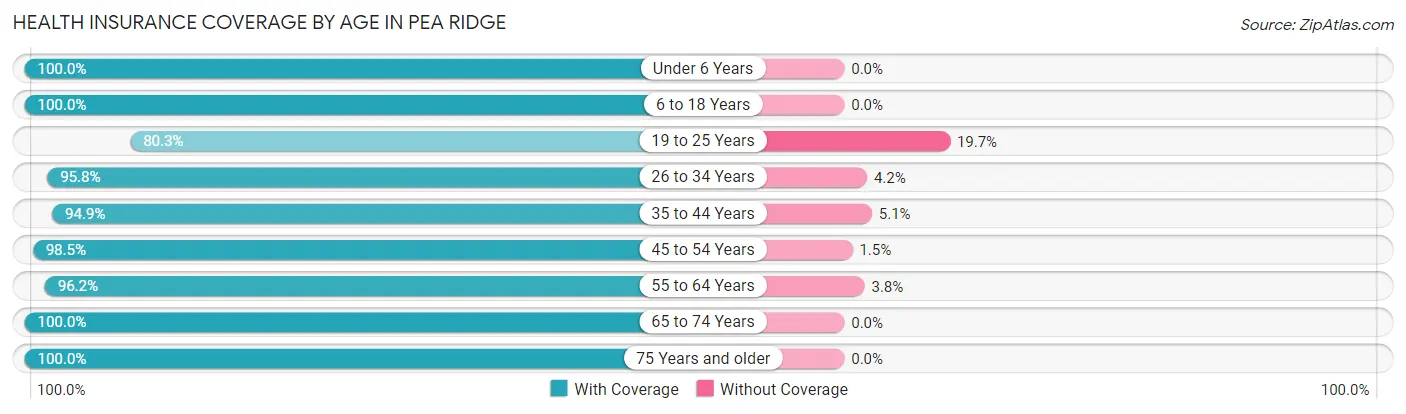
| Age Bracket | With Coverage | Without Coverage |
| Under 6 Years | 907 (100.0%) | 0 (0.0%) |
| 6 to 18 Years | 1,150 (100.0%) | 0 (0.0%) |
| 19 to 25 Years | 269 (80.3%) | 66 (19.7%) |
| 26 to 34 Years | 929 (95.8%) | 41 (4.2%) |
| 35 to 44 Years | 996 (94.9%) | 54 (5.1%) |
| 45 to 54 Years | 775 (98.5%) | 12 (1.5%) |
| 55 to 64 Years | 714 (96.2%) | 28 (3.8%) |
| 65 to 74 Years | 670 (100.0%) | 0 (0.0%) |
| 75 Years and older | 221 (100.0%) | 0 (0.0%) |
| Total | 6,631 (97.1%) | 201 (2.9%) |
Health Insurance Coverage by Citizenship Status in Pea Ridge
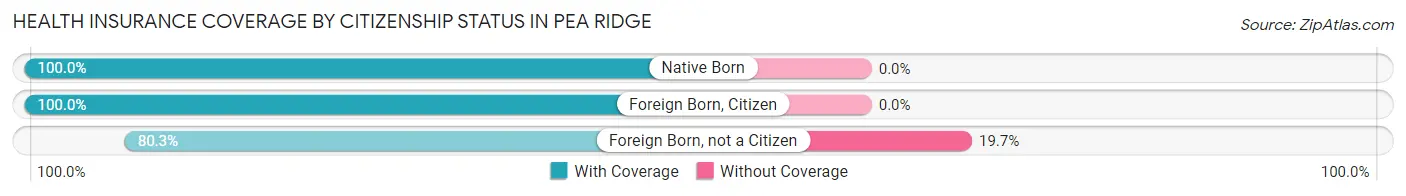
| Citizenship Status | With Coverage | Without Coverage |
| Native Born | 907 (100.0%) | 0 (0.0%) |
| Foreign Born, Citizen | 1,150 (100.0%) | 0 (0.0%) |
| Foreign Born, not a Citizen | 269 (80.3%) | 66 (19.7%) |
Health Insurance Coverage by Household Income in Pea Ridge
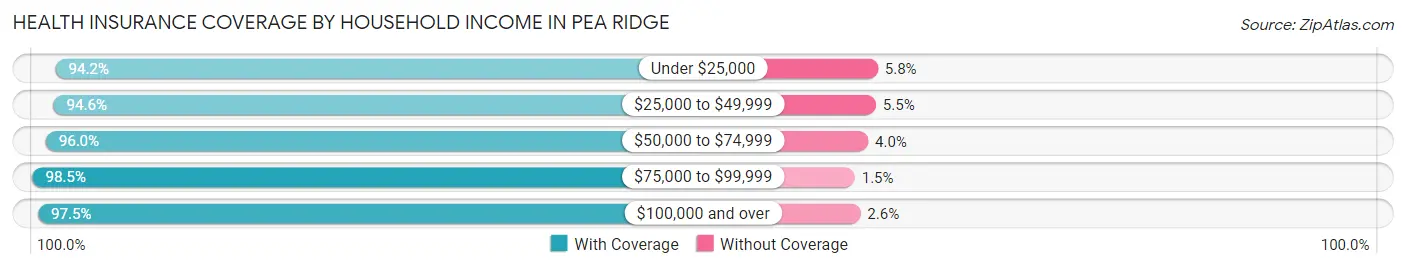
| Household Income | With Coverage | Without Coverage |
| Under $25,000 | 340 (94.2%) | 21 (5.8%) |
| $25,000 to $49,999 | 486 (94.6%) | 28 (5.4%) |
| $50,000 to $74,999 | 1,180 (96.0%) | 49 (4.0%) |
| $75,000 to $99,999 | 1,642 (98.5%) | 25 (1.5%) |
| $100,000 and over | 2,983 (97.5%) | 78 (2.5%) |
Public vs Private Health Insurance Coverage by Age in Pea Ridge
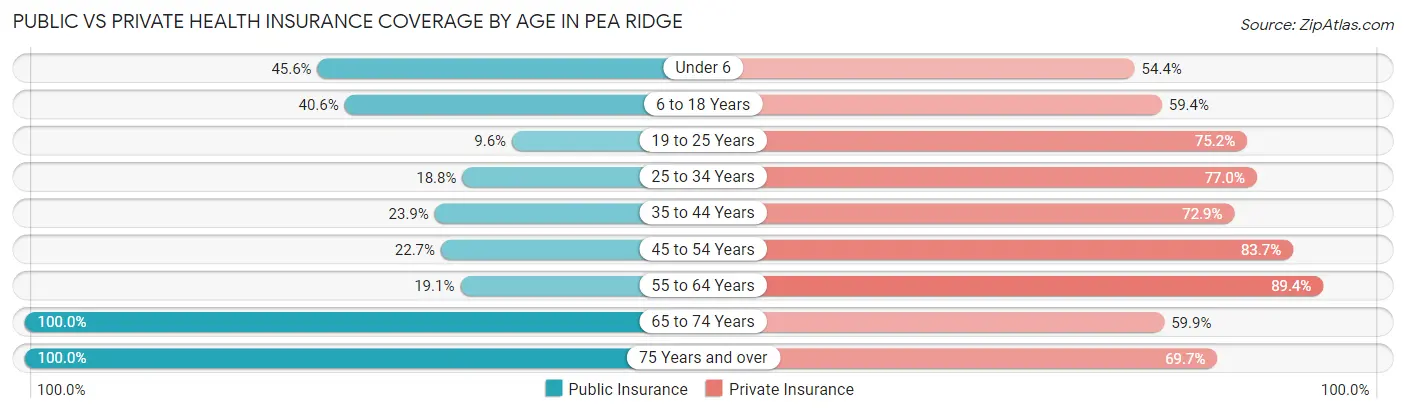
| Age Bracket | Public Insurance | Private Insurance |
| Under 6 | 414 (45.6%) | 493 (54.4%) |
| 6 to 18 Years | 467 (40.6%) | 683 (59.4%) |
| 19 to 25 Years | 32 (9.6%) | 252 (75.2%) |
| 25 to 34 Years | 182 (18.8%) | 747 (77.0%) |
| 35 to 44 Years | 251 (23.9%) | 765 (72.9%) |
| 45 to 54 Years | 179 (22.7%) | 659 (83.7%) |
| 55 to 64 Years | 142 (19.1%) | 663 (89.3%) |
| 65 to 74 Years | 670 (100.0%) | 401 (59.9%) |
| 75 Years and over | 221 (100.0%) | 154 (69.7%) |
| Total | 2,558 (37.4%) | 4,817 (70.5%) |
Disability Status by Sex by Age in Pea Ridge
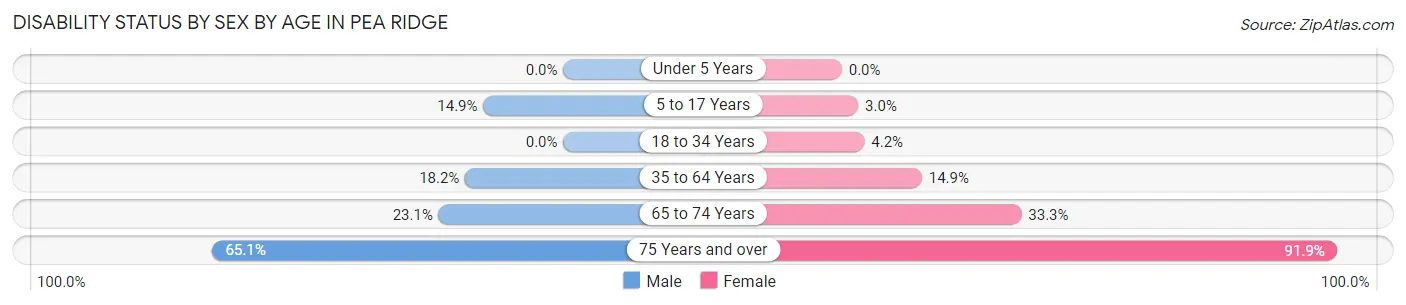
| Age Bracket | Male | Female |
| Under 5 Years | 0 (0.0%) | 0 (0.0%) |
| 5 to 17 Years | 120 (14.8%) | 14 (3.0%) |
| 18 to 34 Years | 0 (0.0%) | 31 (4.2%) |
| 35 to 64 Years | 227 (18.2%) | 198 (14.8%) |
| 65 to 74 Years | 105 (23.1%) | 72 (33.3%) |
| 75 Years and over | 56 (65.1%) | 124 (91.8%) |
Disability Class by Sex by Age in Pea Ridge
Disability Class: Hearing Difficulty
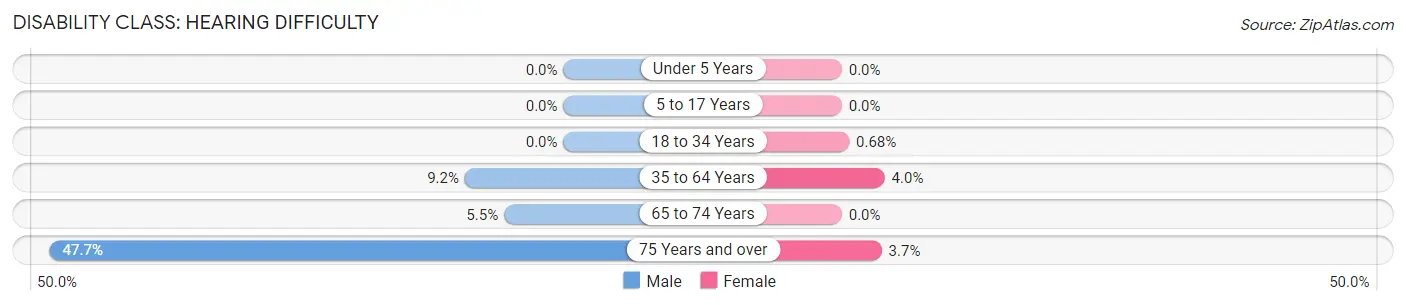
| Age Bracket | Male | Female |
| Under 5 Years | 0 (0.0%) | 0 (0.0%) |
| 5 to 17 Years | 0 (0.0%) | 0 (0.0%) |
| 18 to 34 Years | 0 (0.0%) | 5 (0.7%) |
| 35 to 64 Years | 114 (9.1%) | 53 (4.0%) |
| 65 to 74 Years | 25 (5.5%) | 0 (0.0%) |
| 75 Years and over | 41 (47.7%) | 5 (3.7%) |
Disability Class: Vision Difficulty
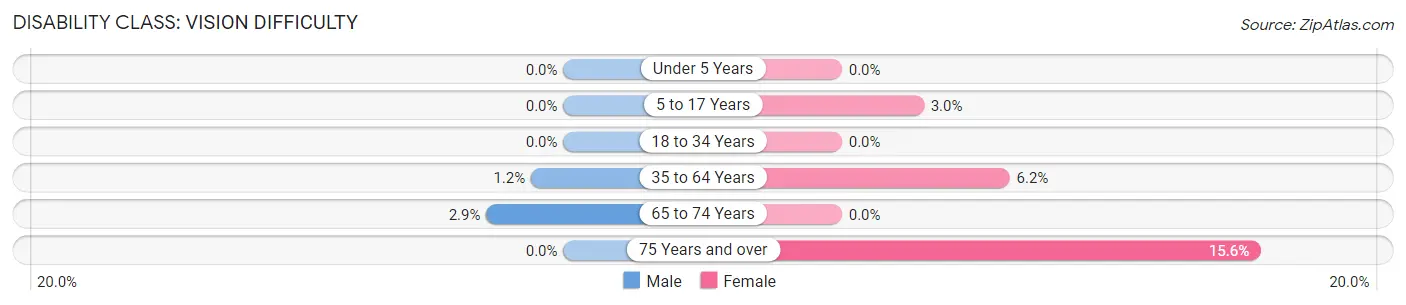
| Age Bracket | Male | Female |
| Under 5 Years | 0 (0.0%) | 0 (0.0%) |
| 5 to 17 Years | 0 (0.0%) | 14 (3.0%) |
| 18 to 34 Years | 0 (0.0%) | 0 (0.0%) |
| 35 to 64 Years | 15 (1.2%) | 83 (6.2%) |
| 65 to 74 Years | 13 (2.9%) | 0 (0.0%) |
| 75 Years and over | 0 (0.0%) | 21 (15.6%) |
Disability Class: Cognitive Difficulty
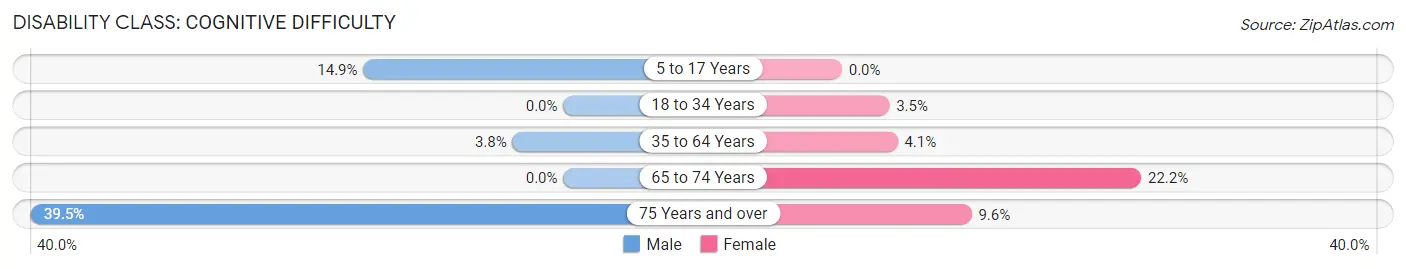
| Age Bracket | Male | Female |
| 5 to 17 Years | 120 (14.8%) | 0 (0.0%) |
| 18 to 34 Years | 0 (0.0%) | 26 (3.5%) |
| 35 to 64 Years | 47 (3.8%) | 55 (4.1%) |
| 65 to 74 Years | 0 (0.0%) | 48 (22.2%) |
| 75 Years and over | 34 (39.5%) | 13 (9.6%) |
Disability Class: Ambulatory Difficulty
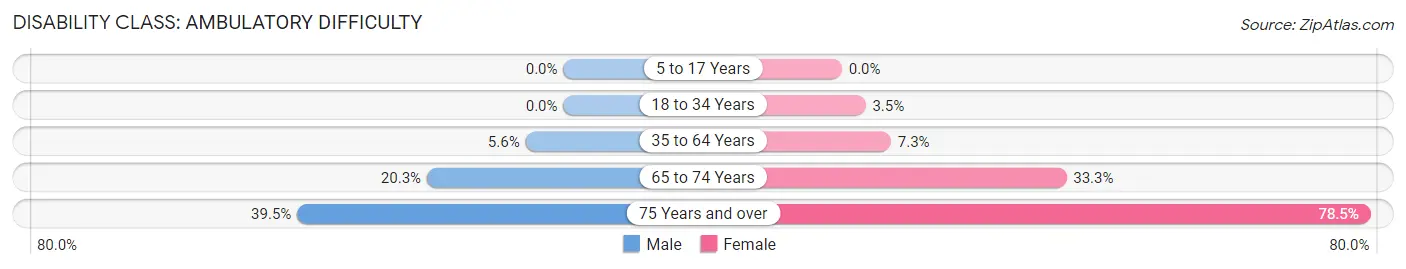
| Age Bracket | Male | Female |
| 5 to 17 Years | 0 (0.0%) | 0 (0.0%) |
| 18 to 34 Years | 0 (0.0%) | 26 (3.5%) |
| 35 to 64 Years | 70 (5.6%) | 97 (7.3%) |
| 65 to 74 Years | 92 (20.3%) | 72 (33.3%) |
| 75 Years and over | 34 (39.5%) | 106 (78.5%) |
Disability Class: Self-Care Difficulty
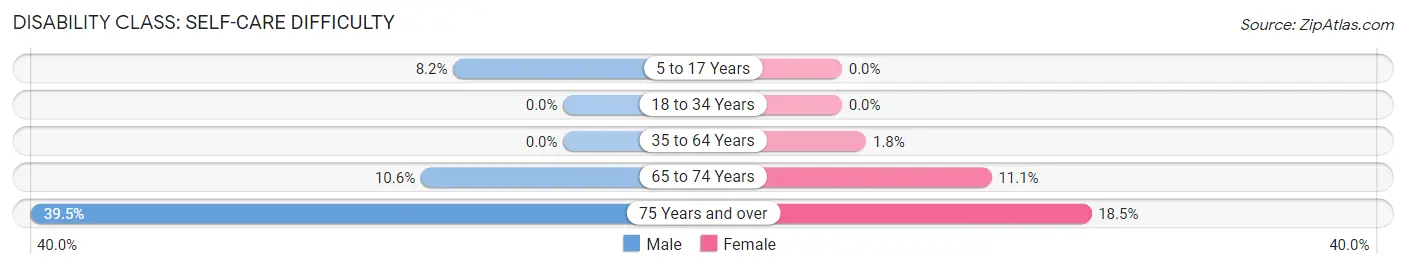
| Age Bracket | Male | Female |
| 5 to 17 Years | 66 (8.2%) | 0 (0.0%) |
| 18 to 34 Years | 0 (0.0%) | 0 (0.0%) |
| 35 to 64 Years | 0 (0.0%) | 24 (1.8%) |
| 65 to 74 Years | 48 (10.6%) | 24 (11.1%) |
| 75 Years and over | 34 (39.5%) | 25 (18.5%) |
Technology Access in Pea Ridge
Computing Device Access in Pea Ridge
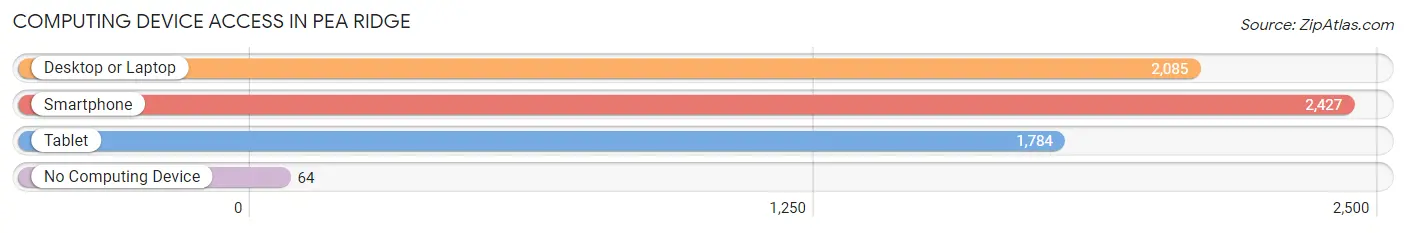
| Device Type | # Households | % Households |
| Desktop or Laptop | 2,085 | 82.5% |
| Smartphone | 2,427 | 96.0% |
| Tablet | 1,784 | 70.6% |
| No Computing Device | 64 | 2.5% |
| Total | 2,528 | 100.0% |
Internet Access in Pea Ridge
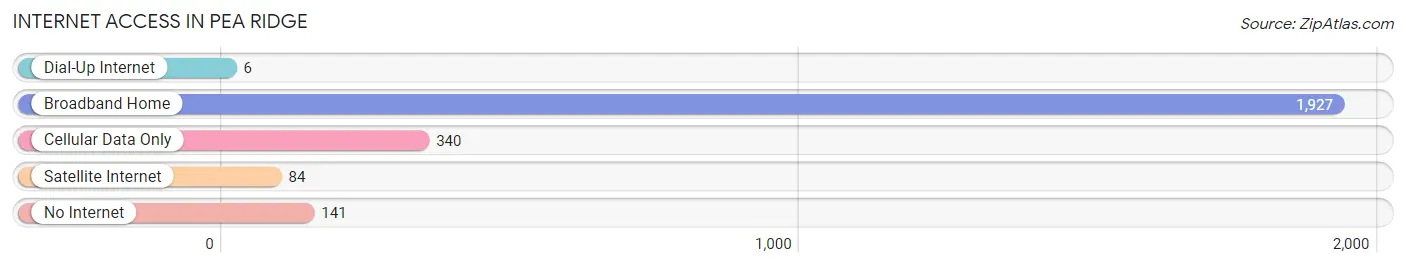
| Internet Type | # Households | % Households |
| Dial-Up Internet | 6 | 0.2% |
| Broadband Home | 1,927 | 76.2% |
| Cellular Data Only | 340 | 13.5% |
| Satellite Internet | 84 | 3.3% |
| No Internet | 141 | 5.6% |
| Total | 2,528 | 100.0% |
Pea Ridge Summary
Pea Ridge is a small town located in the northwest corner of Arkansas, in Benton County. It is situated on the edge of the Ozark Mountains, and is surrounded by rolling hills and lush forests. The town is home to a population of approximately 4,000 people, and is known for its rural charm and friendly atmosphere.
History
Pea Ridge was first settled in the early 1800s by a group of settlers from Tennessee. The town was named after a nearby ridge, which was covered in wild peas. The town was officially incorporated in 1876, and the first post office was established in 1877.
In 1861, the Battle of Pea Ridge was fought in the area, which was a major victory for the Union forces. The battle was the largest Civil War battle fought in Arkansas, and it was a decisive victory for the Union.
Geography
Pea Ridge is located in the northwest corner of Arkansas, in Benton County. It is situated on the edge of the Ozark Mountains, and is surrounded by rolling hills and lush forests. The town is located near the White River, and is about 30 miles from the Arkansas-Missouri border.
The climate in Pea Ridge is humid subtropical, with hot summers and mild winters. The average annual temperature is around 60 degrees Fahrenheit, and the average annual precipitation is around 45 inches.
Economy
The economy of Pea Ridge is largely based on agriculture and tourism. The town is home to several farms, which produce a variety of crops, including corn, soybeans, wheat, and hay. The town is also home to several wineries, which produce a variety of wines.
Tourism is also an important part of the local economy. The town is home to several historic sites, including the Pea Ridge National Military Park, which commemorates the Battle of Pea Ridge. The town is also home to several outdoor recreation areas, including the Ozark National Forest and the White River National Wildlife Refuge.
Demographics
As of the 2010 census, the population of Pea Ridge was 4,065. The racial makeup of the town was 95.3% White, 0.7% African American, 0.3% Native American, 0.3% Asian, 0.1% Pacific Islander, 1.2% from other races, and 2.3% from two or more races. Hispanic or Latino of any race were 3.2% of the population.
The median household income in Pea Ridge was $41,944, and the median family income was $50,917. The per capita income was $20,945. About 11.2% of families and 14.2% of the population were below the poverty line, including 19.2% of those under age 18 and 8.2% of those age 65 or over.
Common Questions
What is Per Capita Income in Pea Ridge?
Per Capita income in Pea Ridge is $34,606.
What is the Median Family Income in Pea Ridge?
Median Family Income in Pea Ridge is $101,515.
What is the Median Household income in Pea Ridge?
Median Household Income in Pea Ridge is $93,113.
What is Income or Wage Gap in Pea Ridge?
Income or Wage Gap in Pea Ridge is 11.5%.
Women in Pea Ridge earn 88.5 cents for every dollar earned by a man.
What is Inequality or Gini Index in Pea Ridge?
Inequality or Gini Index in Pea Ridge is 0.35.
What is the Total Population of Pea Ridge?
Total Population of Pea Ridge is 6,851.
What is the Total Male Population of Pea Ridge?
Total Male Population of Pea Ridge is 3,612.
What is the Total Female Population of Pea Ridge?
Total Female Population of Pea Ridge is 3,239.
What is the Ratio of Males per 100 Females in Pea Ridge?
There are 111.52 Males per 100 Females in Pea Ridge.
What is the Ratio of Females per 100 Males in Pea Ridge?
There are 89.67 Females per 100 Males in Pea Ridge.
What is the Median Population Age in Pea Ridge?
Median Population Age in Pea Ridge is 35.6 Years.
What is the Average Family Size in Pea Ridge
Average Family Size in Pea Ridge is 3.0 People.
What is the Average Household Size in Pea Ridge
Average Household Size in Pea Ridge is 2.7 People.
How Large is the Labor Force in Pea Ridge?
There are 3,347 People in the Labor Forcein in Pea Ridge.
What is the Percentage of People in the Labor Force in Pea Ridge?
69.2% of People are in the Labor Force in Pea Ridge.
What is the Unemployment Rate in Pea Ridge?
Unemployment Rate in Pea Ridge is 1.8%.