University CDP Hillsborough County, FL Map & Demographics
University CDP Hillsborough County Overview
$20,095
PER CAPITA INCOME
$42,746
AVG FAMILY INCOME
$34,833
AVG HOUSEHOLD INCOME
9.2%
WAGE / INCOME GAP [ % ]
90.8¢/ $1
WAGE / INCOME GAP [ $ ]
$10,806
FAMILY INCOME DEFICIT
0.45
INEQUALITY / GINI INDEX
49,148
TOTAL POPULATION
24,507
MALE POPULATION
24,641
FEMALE POPULATION
99.46
MALES / 100 FEMALES
100.55
FEMALES / 100 MALES
27.1
MEDIAN AGE
3.4
AVG FAMILY SIZE
2.3
AVG HOUSEHOLD SIZE
25,965
LABOR FORCE [ PEOPLE ]
63.7%
PERCENT IN LABOR FORCE
6.0%
UNEMPLOYMENT RATE
Income in University CDP Hillsborough County
Income Overview in University CDP Hillsborough County
Per Capita Income in University CDP Hillsborough County is $20,095, while median incomes of families and households are $42,746 and $34,833 respectively.
| Characteristic | Number | Measure |
| Per Capita Income | 49,148 | $20,095 |
| Median Family Income | 7,409 | $42,746 |
| Mean Family Income | 7,409 | $54,646 |
| Median Household Income | 20,399 | $34,833 |
| Mean Household Income | 20,399 | $44,274 |
| Income Deficit | 7,409 | $10,806 |
| Wage / Income Gap (%) | 49,148 | 9.16% |
| Wage / Income Gap ($) | 49,148 | 90.84¢ per $1 |
| Gini / Inequality Index | 49,148 | 0.45 |
Earnings by Sex in University CDP Hillsborough County
Average Earnings in University CDP Hillsborough County are $24,420, $25,365 for men and $23,041 for women, a difference of 9.2%.
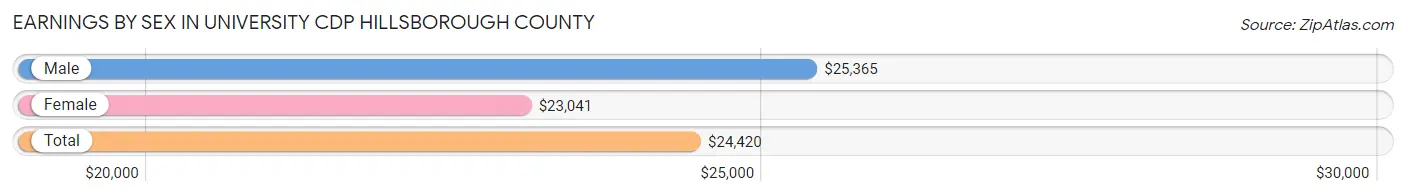
| Sex | Number | Average Earnings |
| Male | 13,920 (51.6%) | $25,365 |
| Female | 13,051 (48.4%) | $23,041 |
| Total | 26,971 (100.0%) | $24,420 |
Earnings by Sex by Income Bracket in University CDP Hillsborough County
The most common earnings brackets in University CDP Hillsborough County are $25,000 to $29,999 for men (1,410 | 10.1%) and $30,000 to $34,999 for women (1,359 | 10.4%).
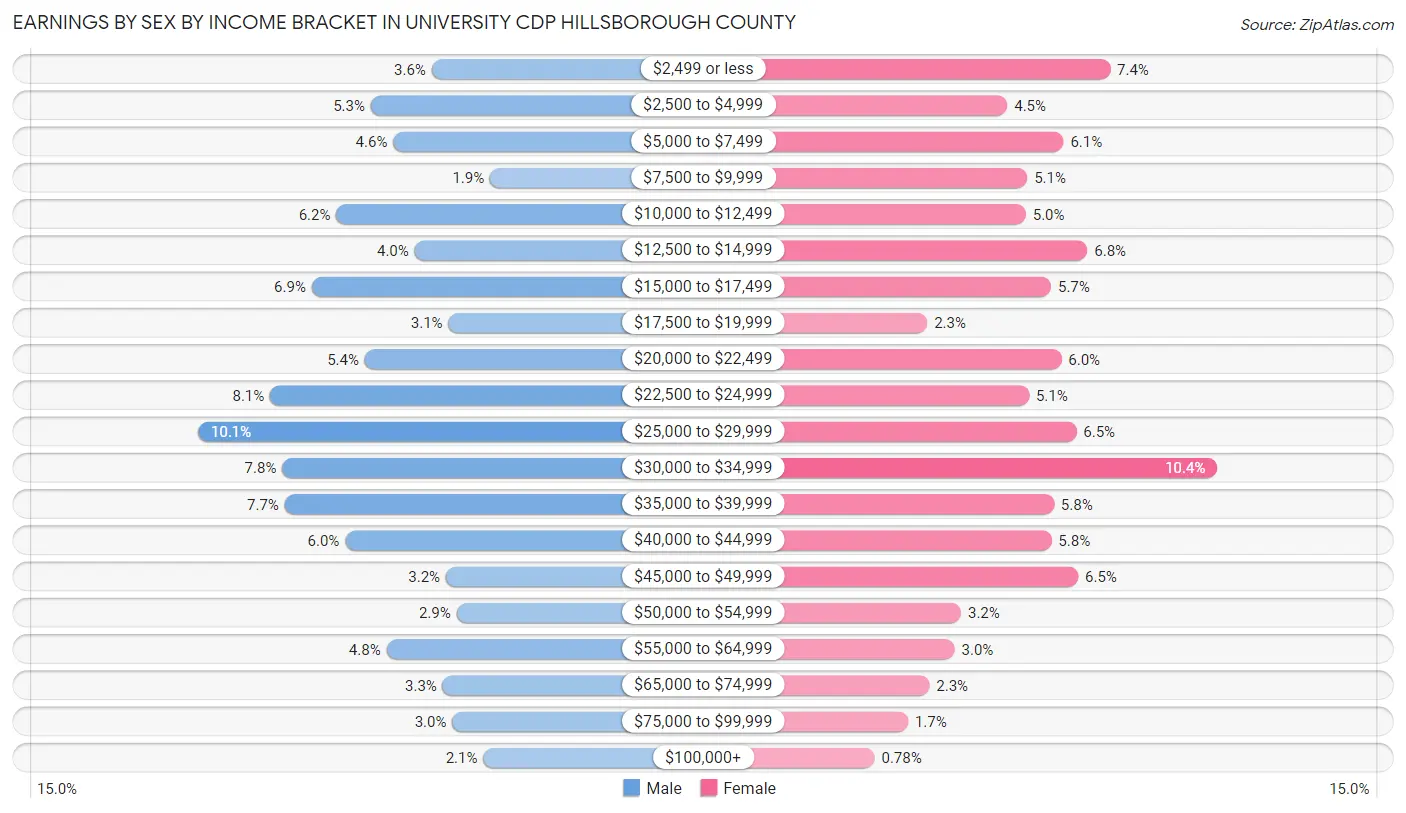
| Income | Male | Female |
| $2,499 or less | 495 (3.6%) | 966 (7.4%) |
| $2,500 to $4,999 | 734 (5.3%) | 588 (4.5%) |
| $5,000 to $7,499 | 646 (4.6%) | 795 (6.1%) |
| $7,500 to $9,999 | 267 (1.9%) | 662 (5.1%) |
| $10,000 to $12,499 | 868 (6.2%) | 657 (5.0%) |
| $12,500 to $14,999 | 563 (4.0%) | 882 (6.8%) |
| $15,000 to $17,499 | 965 (6.9%) | 749 (5.7%) |
| $17,500 to $19,999 | 430 (3.1%) | 295 (2.3%) |
| $20,000 to $22,499 | 757 (5.4%) | 787 (6.0%) |
| $22,500 to $24,999 | 1,128 (8.1%) | 668 (5.1%) |
| $25,000 to $29,999 | 1,410 (10.1%) | 842 (6.5%) |
| $30,000 to $34,999 | 1,080 (7.8%) | 1,359 (10.4%) |
| $35,000 to $39,999 | 1,070 (7.7%) | 760 (5.8%) |
| $40,000 to $44,999 | 834 (6.0%) | 750 (5.8%) |
| $45,000 to $49,999 | 440 (3.2%) | 848 (6.5%) |
| $50,000 to $54,999 | 398 (2.9%) | 419 (3.2%) |
| $55,000 to $64,999 | 673 (4.8%) | 395 (3.0%) |
| $65,000 to $74,999 | 453 (3.3%) | 303 (2.3%) |
| $75,000 to $99,999 | 415 (3.0%) | 224 (1.7%) |
| $100,000+ | 294 (2.1%) | 102 (0.8%) |
| Total | 13,920 (100.0%) | 13,051 (100.0%) |
Earnings by Sex by Educational Attainment in University CDP Hillsborough County
Average earnings in University CDP Hillsborough County are $31,853 for men and $31,303 for women, a difference of 1.7%. Men with an educational attainment of graduate degree enjoy the highest average annual earnings of $50,536, while those with less than high school education earn the least with $26,717. Women with an educational attainment of graduate degree earn the most with the average annual earnings of $46,651, while those with less than high school education have the smallest earnings of $14,676.
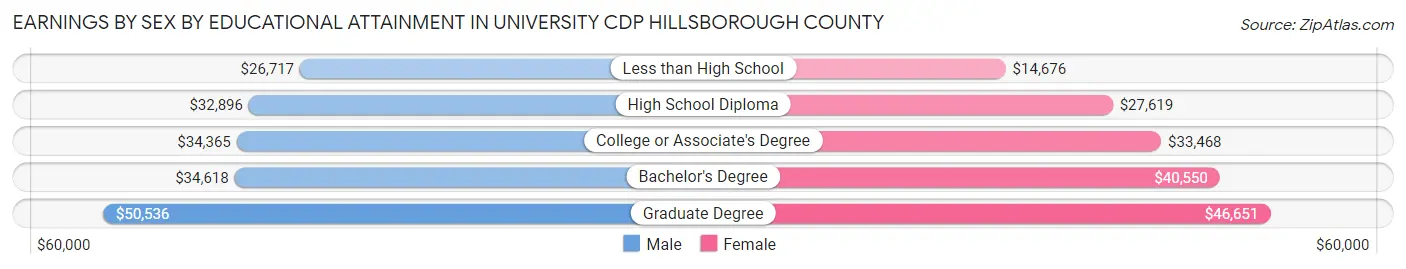
| Educational Attainment | Male Income | Female Income |
| Less than High School | $26,717 | $14,676 |
| High School Diploma | $32,896 | $27,619 |
| College or Associate's Degree | $34,365 | $33,468 |
| Bachelor's Degree | $34,618 | $40,550 |
| Graduate Degree | $50,536 | $46,651 |
| Total | $31,853 | $31,303 |
Family Income in University CDP Hillsborough County
Family Income Brackets in University CDP Hillsborough County
According to the University CDP Hillsborough County family income data, there are 1,334 families falling into the $50,000 to $74,999 income range, which is the most common income bracket and makes up 18.0% of all families. Conversely, the $200,000+ income bracket is the least frequent group with only 119 families (1.6%) belonging to this category.
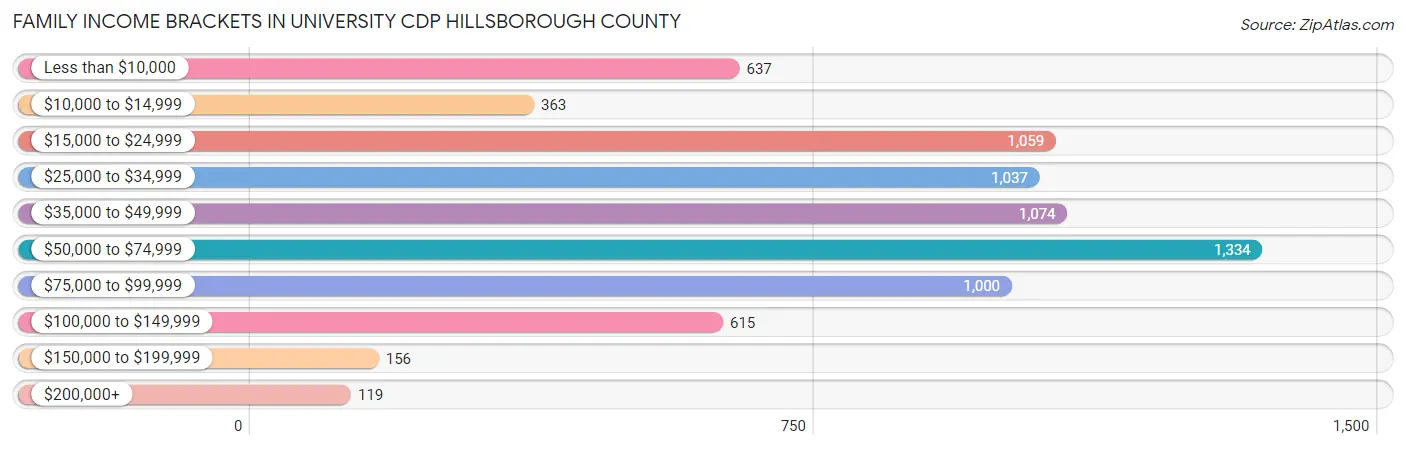
| Income Bracket | # Families | % Families |
| Less than $10,000 | 637 | 8.6% |
| $10,000 to $14,999 | 363 | 4.9% |
| $15,000 to $24,999 | 1,059 | 14.3% |
| $25,000 to $34,999 | 1,037 | 14.0% |
| $35,000 to $49,999 | 1,074 | 14.5% |
| $50,000 to $74,999 | 1,334 | 18.0% |
| $75,000 to $99,999 | 1,000 | 13.5% |
| $100,000 to $149,999 | 615 | 8.3% |
| $150,000 to $199,999 | 156 | 2.1% |
| $200,000+ | 119 | 1.6% |
Family Income by Famaliy Size in University CDP Hillsborough County
7+ person families (170 | 2.3%) account for the highest median family income in University CDP Hillsborough County with $122,391 per family, while 2-person families (3,021 | 40.8%) have the highest median income of $19,650 per family member.
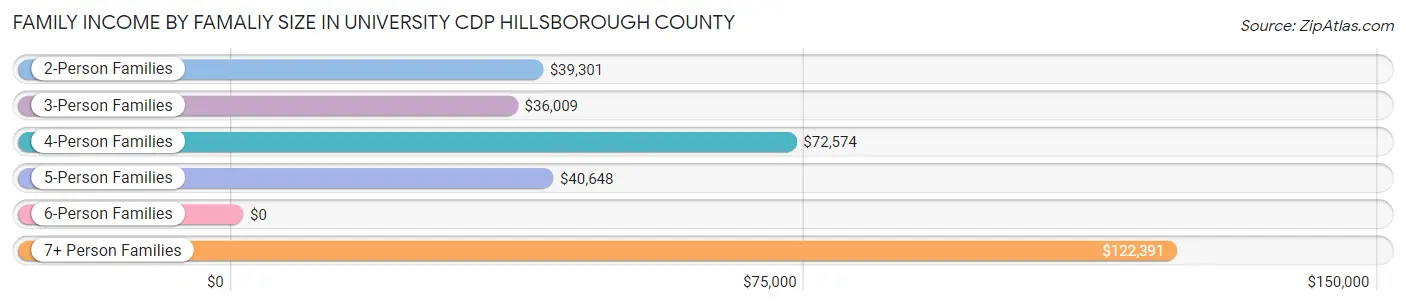
| Income Bracket | # Families | Median Income |
| 2-Person Families | 3,021 (40.8%) | $39,301 |
| 3-Person Families | 1,826 (24.6%) | $36,009 |
| 4-Person Families | 1,547 (20.9%) | $72,574 |
| 5-Person Families | 644 (8.7%) | $40,648 |
| 6-Person Families | 201 (2.7%) | $0 |
| 7+ Person Families | 170 (2.3%) | $122,391 |
| Total | 7,409 (100.0%) | $42,746 |
Family Income by Number of Earners in University CDP Hillsborough County
The median family income in University CDP Hillsborough County is $42,746, with families comprising 3+ earners (605) having the highest median family income of $84,659, while families with no earners (958) have the lowest median family income of $12,262, accounting for 8.2% and 12.9% of families, respectively.
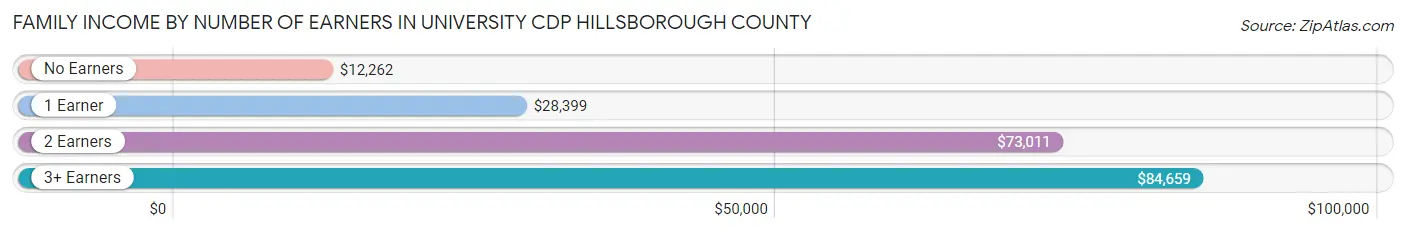
| Number of Earners | # Families | Median Income |
| No Earners | 958 (12.9%) | $12,262 |
| 1 Earner | 3,259 (44.0%) | $28,399 |
| 2 Earners | 2,587 (34.9%) | $73,011 |
| 3+ Earners | 605 (8.2%) | $84,659 |
| Total | 7,409 (100.0%) | $42,746 |
Household Income in University CDP Hillsborough County
Household Income Brackets in University CDP Hillsborough County
With 3,672 households falling in the category, the $35,000 to $49,999 income range is the most frequent in University CDP Hillsborough County, accounting for 18.0% of all households. In contrast, only 224 households (1.1%) fall into the $150,000 to $199,999 income bracket, making it the least populous group.
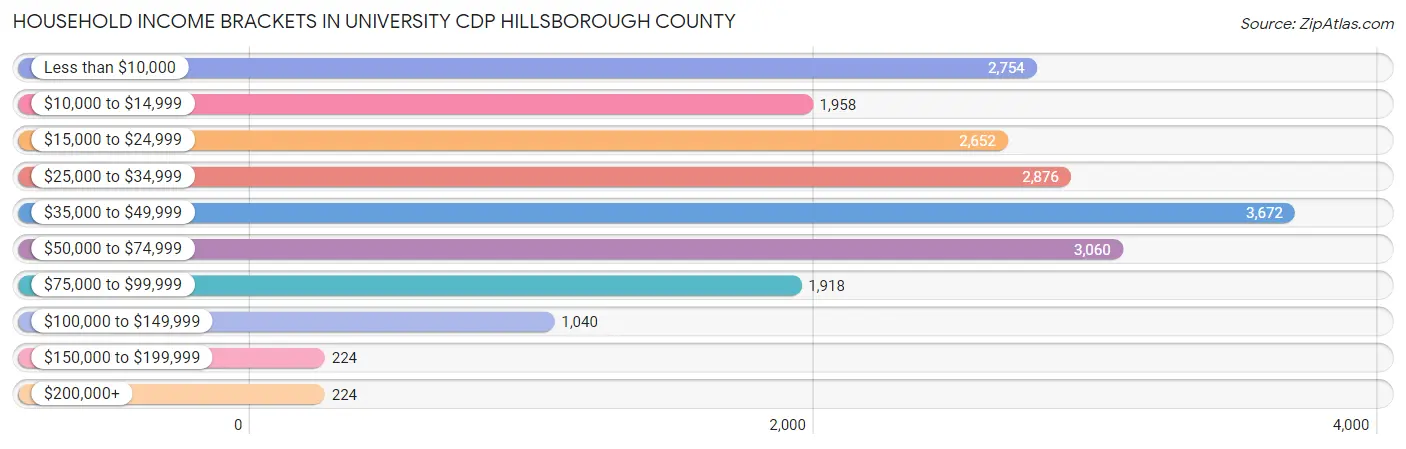
| Income Bracket | # Households | % Households |
| Less than $10,000 | 2,754 | 13.5% |
| $10,000 to $14,999 | 1,958 | 9.6% |
| $15,000 to $24,999 | 2,652 | 13.0% |
| $25,000 to $34,999 | 2,876 | 14.1% |
| $35,000 to $49,999 | 3,672 | 18.0% |
| $50,000 to $74,999 | 3,060 | 15.0% |
| $75,000 to $99,999 | 1,918 | 9.4% |
| $100,000 to $149,999 | 1,040 | 5.1% |
| $150,000 to $199,999 | 224 | 1.1% |
| $200,000+ | 224 | 1.1% |
Household Income by Householder Age in University CDP Hillsborough County
The median household income in University CDP Hillsborough County is $34,833, with the highest median household income of $38,519 found in the 25 to 44 years age bracket for the primary householder. A total of 8,352 households (40.9%) fall into this category. Meanwhile, the 15 to 24 years age bracket for the primary householder has the lowest median household income of $23,807, with 4,540 households (22.3%) in this group.
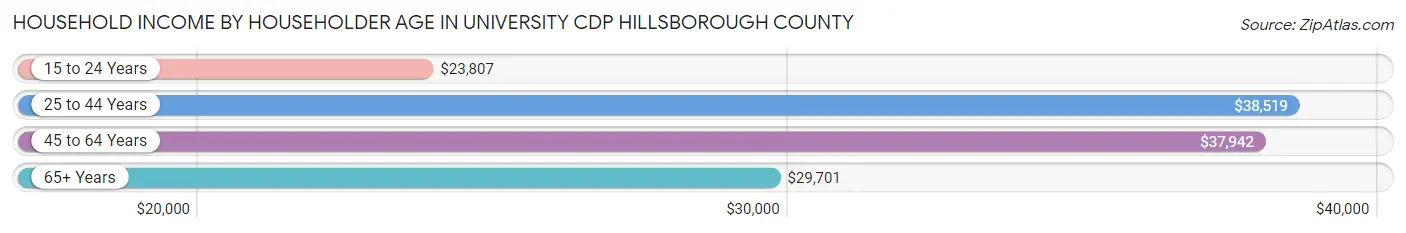
| Income Bracket | # Households | Median Income |
| 15 to 24 Years | 4,540 (22.3%) | $23,807 |
| 25 to 44 Years | 8,352 (40.9%) | $38,519 |
| 45 to 64 Years | 5,103 (25.0%) | $37,942 |
| 65+ Years | 2,404 (11.8%) | $29,701 |
| Total | 20,399 (100.0%) | $34,833 |
Poverty in University CDP Hillsborough County
Income Below Poverty by Sex and Age in University CDP Hillsborough County
With 30.7% poverty level for males and 39.8% for females among the residents of University CDP Hillsborough County, 18 to 24 year old males and 5 year old females are the most vulnerable to poverty, with 2,762 males (43.1%) and 165 females (66.0%) in their respective age groups living below the poverty level.
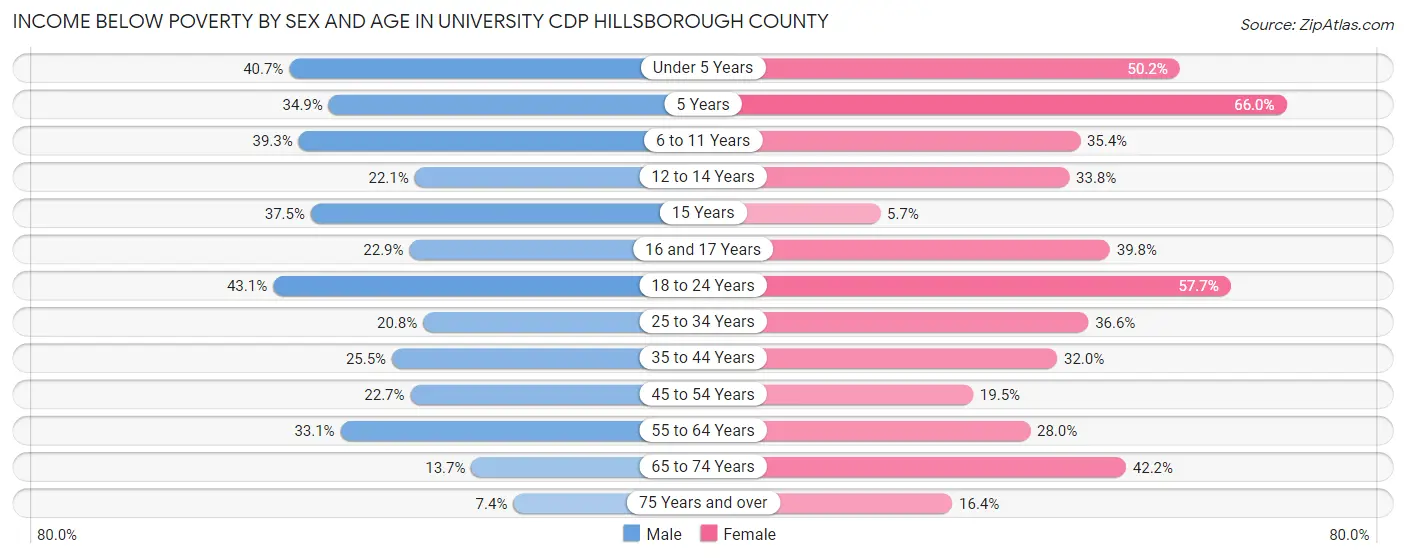
| Age Bracket | Male | Female |
| Under 5 Years | 600 (40.7%) | 792 (50.2%) |
| 5 Years | 61 (34.9%) | 165 (66.0%) |
| 6 to 11 Years | 578 (39.3%) | 424 (35.4%) |
| 12 to 14 Years | 219 (22.1%) | 216 (33.8%) |
| 15 Years | 117 (37.5%) | 5 (5.7%) |
| 16 and 17 Years | 83 (22.9%) | 195 (39.8%) |
| 18 to 24 Years | 2,762 (43.1%) | 3,571 (57.7%) |
| 25 to 34 Years | 972 (20.8%) | 1,571 (36.6%) |
| 35 to 44 Years | 730 (25.5%) | 840 (32.0%) |
| 45 to 54 Years | 437 (22.7%) | 491 (19.5%) |
| 55 to 64 Years | 569 (33.1%) | 478 (28.0%) |
| 65 to 74 Years | 146 (13.7%) | 518 (42.2%) |
| 75 Years and over | 29 (7.4%) | 133 (16.4%) |
| Total | 7,303 (30.7%) | 9,399 (39.8%) |
Income Above Poverty by Sex and Age in University CDP Hillsborough County
According to the poverty statistics in University CDP Hillsborough County, males aged 75 years and over and females aged 15 years are the age groups that are most secure financially, with 92.6% of males and 94.3% of females in these age groups living above the poverty line.
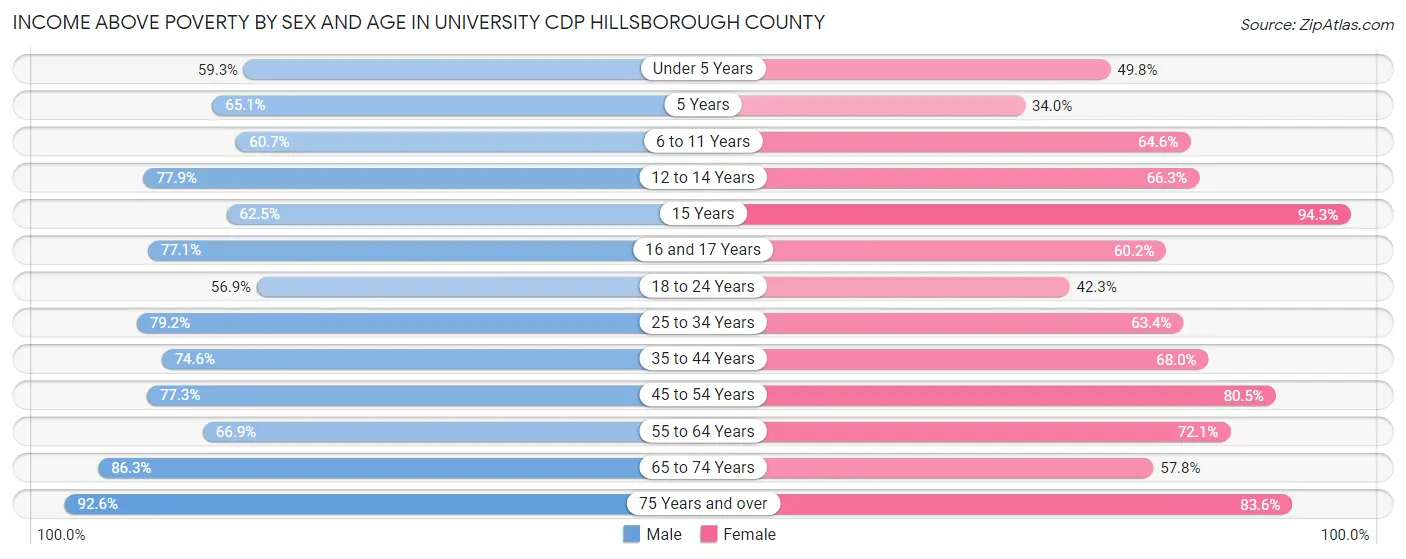
| Age Bracket | Male | Female |
| Under 5 Years | 874 (59.3%) | 787 (49.8%) |
| 5 Years | 114 (65.1%) | 85 (34.0%) |
| 6 to 11 Years | 892 (60.7%) | 775 (64.6%) |
| 12 to 14 Years | 772 (77.9%) | 424 (66.2%) |
| 15 Years | 195 (62.5%) | 83 (94.3%) |
| 16 and 17 Years | 280 (77.1%) | 295 (60.2%) |
| 18 to 24 Years | 3,644 (56.9%) | 2,616 (42.3%) |
| 25 to 34 Years | 3,691 (79.2%) | 2,722 (63.4%) |
| 35 to 44 Years | 2,138 (74.6%) | 1,788 (68.0%) |
| 45 to 54 Years | 1,486 (77.3%) | 2,031 (80.5%) |
| 55 to 64 Years | 1,150 (66.9%) | 1,232 (72.1%) |
| 65 to 74 Years | 922 (86.3%) | 710 (57.8%) |
| 75 Years and over | 361 (92.6%) | 679 (83.6%) |
| Total | 16,519 (69.3%) | 14,227 (60.2%) |
Income Below Poverty Among Married-Couple Families in University CDP Hillsborough County
The poverty statistics for married-couple families in University CDP Hillsborough County show that 13.5% or 393 of the total 2,916 families live below the poverty line. Families with 3 or 4 children have the highest poverty rate of 44.8%, comprising of 139 families. On the other hand, families with 5 or more children have the lowest poverty rate of 0.0%, which includes 0 families.
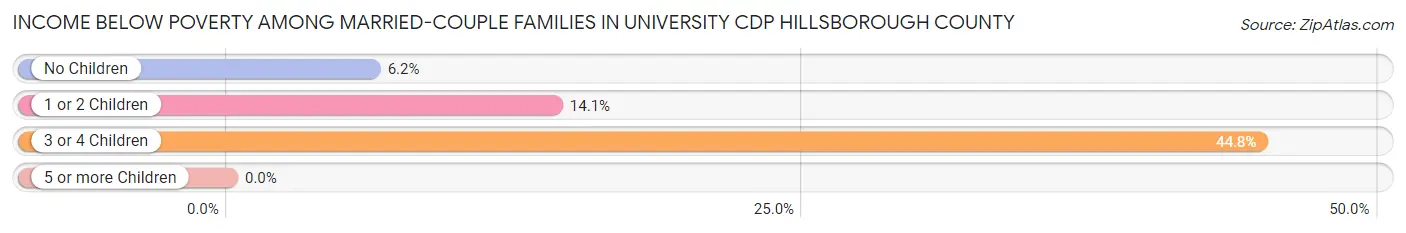
| Children | Above Poverty | Below Poverty |
| No Children | 1,315 (93.8%) | 87 (6.2%) |
| 1 or 2 Children | 1,014 (85.9%) | 167 (14.1%) |
| 3 or 4 Children | 171 (55.2%) | 139 (44.8%) |
| 5 or more Children | 23 (100.0%) | 0 (0.0%) |
| Total | 2,523 (86.5%) | 393 (13.5%) |
Income Below Poverty Among Single-Parent Households in University CDP Hillsborough County
According to the poverty data in University CDP Hillsborough County, 20.3% or 254 single-father households and 41.1% or 1,331 single-mother households are living below the poverty line. Among single-father households, those with 1 or 2 children have the highest poverty rate, with 187 households (41.7%) experiencing poverty. Likewise, among single-mother households, those with 5 or more children have the highest poverty rate, with 43 households (100.0%) falling below the poverty line.
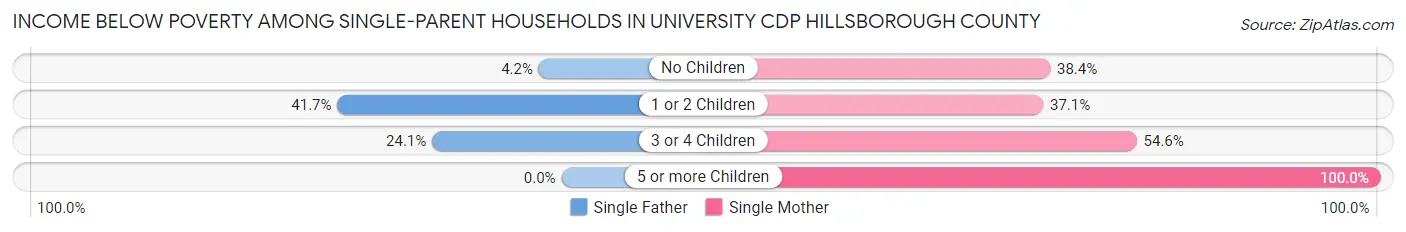
| Children | Single Father | Single Mother |
| No Children | 27 (4.2%) | 321 (38.4%) |
| 1 or 2 Children | 187 (41.7%) | 686 (37.1%) |
| 3 or 4 Children | 40 (24.1%) | 281 (54.6%) |
| 5 or more Children | 0 (0.0%) | 43 (100.0%) |
| Total | 254 (20.3%) | 1,331 (41.1%) |
Income Below Poverty Among Married-Couple vs Single-Parent Households in University CDP Hillsborough County
The poverty data for University CDP Hillsborough County shows that 393 of the married-couple family households (13.5%) and 1,585 of the single-parent households (35.3%) are living below the poverty level. Within the married-couple family households, those with 3 or 4 children have the highest poverty rate, with 139 households (44.8%) falling below the poverty line. Among the single-parent households, those with 5 or more children have the highest poverty rate, with 43 household (100.0%) living below poverty.
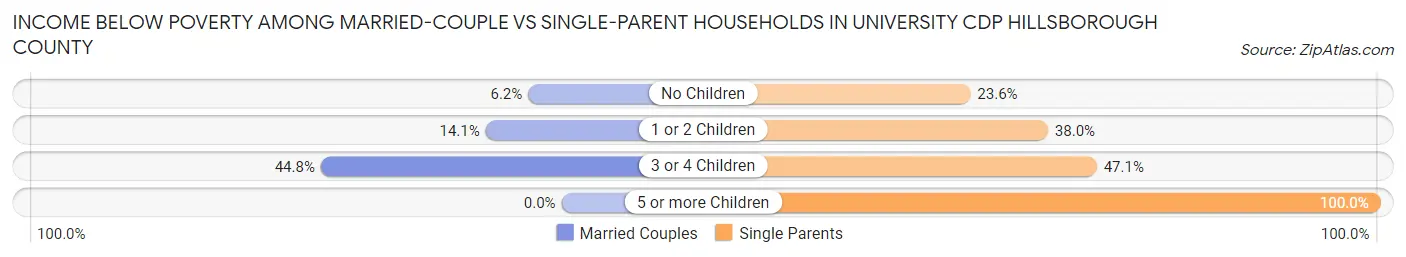
| Children | Married-Couple Families | Single-Parent Households |
| No Children | 87 (6.2%) | 348 (23.6%) |
| 1 or 2 Children | 167 (14.1%) | 873 (38.0%) |
| 3 or 4 Children | 139 (44.8%) | 321 (47.1%) |
| 5 or more Children | 0 (0.0%) | 43 (100.0%) |
| Total | 393 (13.5%) | 1,585 (35.3%) |
Race in University CDP Hillsborough County
The most populous races in University CDP Hillsborough County are White / Caucasian (20,567 | 41.8%), Hispanic or Latino (17,402 | 35.4%), and Black / African American (14,898 | 30.3%).
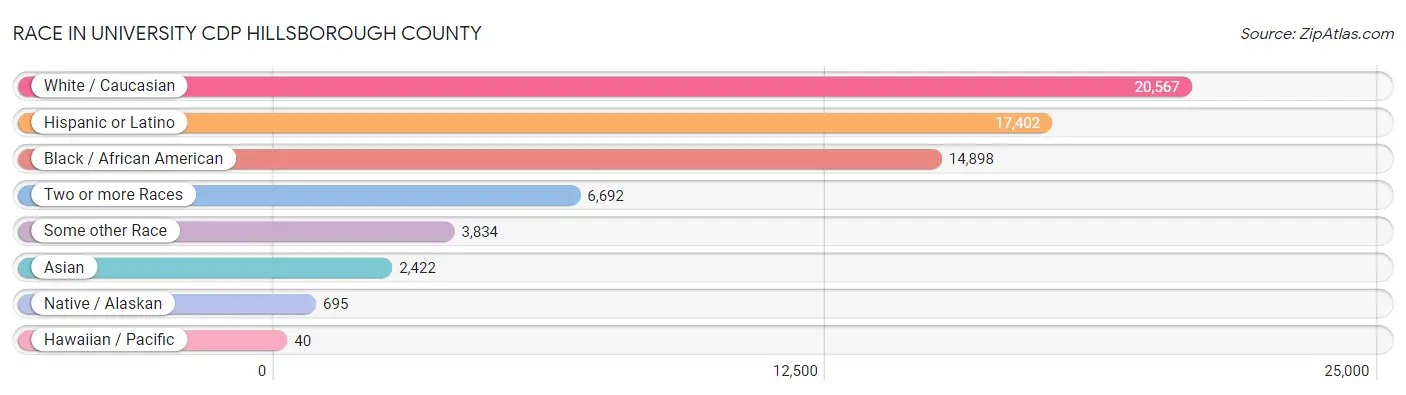
| Race | # Population | % Population |
| Asian | 2,422 | 4.9% |
| Black / African American | 14,898 | 30.3% |
| Hawaiian / Pacific | 40 | 0.1% |
| Hispanic or Latino | 17,402 | 35.4% |
| Native / Alaskan | 695 | 1.4% |
| White / Caucasian | 20,567 | 41.8% |
| Two or more Races | 6,692 | 13.6% |
| Some other Race | 3,834 | 7.8% |
| Total | 49,148 | 100.0% |
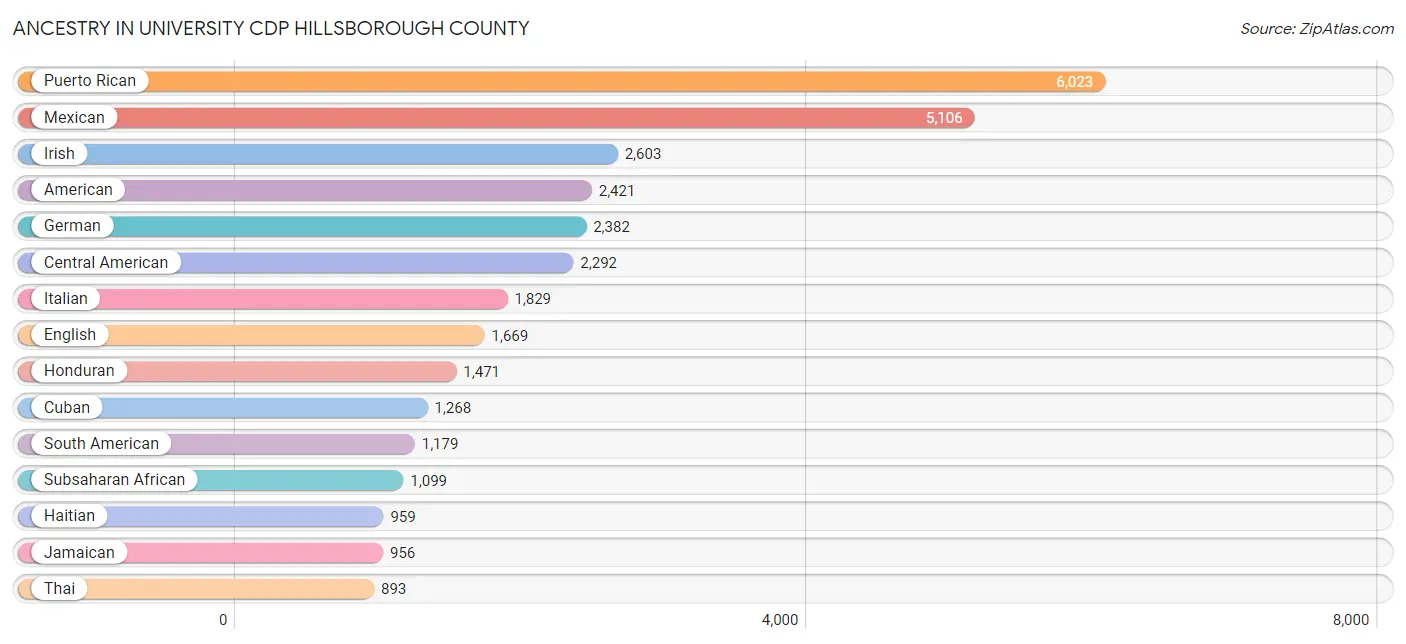
Ancestry in University CDP Hillsborough County
The most populous ancestries reported in University CDP Hillsborough County are Puerto Rican (6,023 | 12.2%), Mexican (5,106 | 10.4%), Irish (2,603 | 5.3%), American (2,421 | 4.9%), and German (2,382 | 4.9%), together accounting for 37.7% of all University CDP Hillsborough County residents.
| Ancestry | # Population | % Population |
| Afghan | 68 | 0.1% |
| African | 738 | 1.5% |
| Albanian | 41 | 0.1% |
| American | 2,421 | 4.9% |
| Arab | 401 | 0.8% |
| Argentinean | 20 | 0.0% |
| Armenian | 23 | 0.1% |
| Austrian | 125 | 0.3% |
| Bahamian | 67 | 0.1% |
| Barbadian | 77 | 0.2% |
| Belgian | 7 | 0.0% |
| Belizean | 13 | 0.0% |
| Bhutanese | 19 | 0.0% |
| Blackfeet | 6 | 0.0% |
| Bolivian | 108 | 0.2% |
| Brazilian | 153 | 0.3% |
| British | 87 | 0.2% |
| British West Indian | 111 | 0.2% |
| Burmese | 162 | 0.3% |
| Canadian | 62 | 0.1% |
| Cape Verdean | 9 | 0.0% |
| Celtic | 19 | 0.0% |
| Central American | 2,292 | 4.7% |
| Central American Indian | 45 | 0.1% |
| Cherokee | 150 | 0.3% |
| Chickasaw | 1 | 0.0% |
| Chilean | 10 | 0.0% |
| Colombian | 604 | 1.2% |
| Costa Rican | 105 | 0.2% |
| Croatian | 13 | 0.0% |
| Cuban | 1,268 | 2.6% |
| Czech | 91 | 0.2% |
| Czechoslovakian | 55 | 0.1% |
| Danish | 54 | 0.1% |
| Dominican | 532 | 1.1% |
| Dutch | 212 | 0.4% |
| Eastern European | 9 | 0.0% |
| Ecuadorian | 55 | 0.1% |
| Egyptian | 46 | 0.1% |
| English | 1,669 | 3.4% |
| European | 231 | 0.5% |
| Filipino | 65 | 0.1% |
| Finnish | 43 | 0.1% |
| French | 509 | 1.0% |
| French Canadian | 120 | 0.2% |
| German | 2,382 | 4.9% |
| Greek | 305 | 0.6% |
| Guatemalan | 238 | 0.5% |
| Guyanese | 76 | 0.2% |
| Haitian | 959 | 1.9% |
| Honduran | 1,471 | 3.0% |
| Hungarian | 148 | 0.3% |
| Indian (Asian) | 841 | 1.7% |
| Indonesian | 32 | 0.1% |
| Iranian | 64 | 0.1% |
| Iraqi | 23 | 0.1% |
| Irish | 2,603 | 5.3% |
| Israeli | 44 | 0.1% |
| Italian | 1,829 | 3.7% |
| Jamaican | 956 | 1.9% |
| Jordanian | 22 | 0.0% |
| Kenyan | 9 | 0.0% |
| Korean | 293 | 0.6% |
| Liberian | 60 | 0.1% |
| Mexican | 5,106 | 10.4% |
| Mexican American Indian | 689 | 1.4% |
| Moroccan | 5 | 0.0% |
| Native Hawaiian | 16 | 0.0% |
| Nicaraguan | 113 | 0.2% |
| Nigerian | 64 | 0.1% |
| Norwegian | 74 | 0.2% |
| Pakistani | 37 | 0.1% |
| Palestinian | 53 | 0.1% |
| Panamanian | 37 | 0.1% |
| Peruvian | 177 | 0.4% |
| Polish | 337 | 0.7% |
| Portuguese | 41 | 0.1% |
| Puerto Rican | 6,023 | 12.2% |
| Russian | 164 | 0.3% |
| Salvadoran | 282 | 0.6% |
| Scotch-Irish | 118 | 0.2% |
| Scottish | 372 | 0.8% |
| Seminole | 21 | 0.0% |
| Senegalese | 15 | 0.0% |
| Slovak | 158 | 0.3% |
| South African | 10 | 0.0% |
| South American | 1,179 | 2.4% |
| South American Indian | 12 | 0.0% |
| Spaniard | 166 | 0.3% |
| Spanish | 53 | 0.1% |
| Sri Lankan | 177 | 0.4% |
| Subsaharan African | 1,099 | 2.2% |
| Swedish | 71 | 0.1% |
| Syrian | 32 | 0.1% |
| Thai | 893 | 1.8% |
| Trinidadian and Tobagonian | 623 | 1.3% |
| Turkish | 34 | 0.1% |
| U.S. Virgin Islander | 105 | 0.2% |
| Ukrainian | 25 | 0.1% |
| Venezuelan | 205 | 0.4% |
| Vietnamese | 98 | 0.2% |
| Welsh | 263 | 0.5% |
| West Indian | 320 | 0.6% | View All 103 Rows |
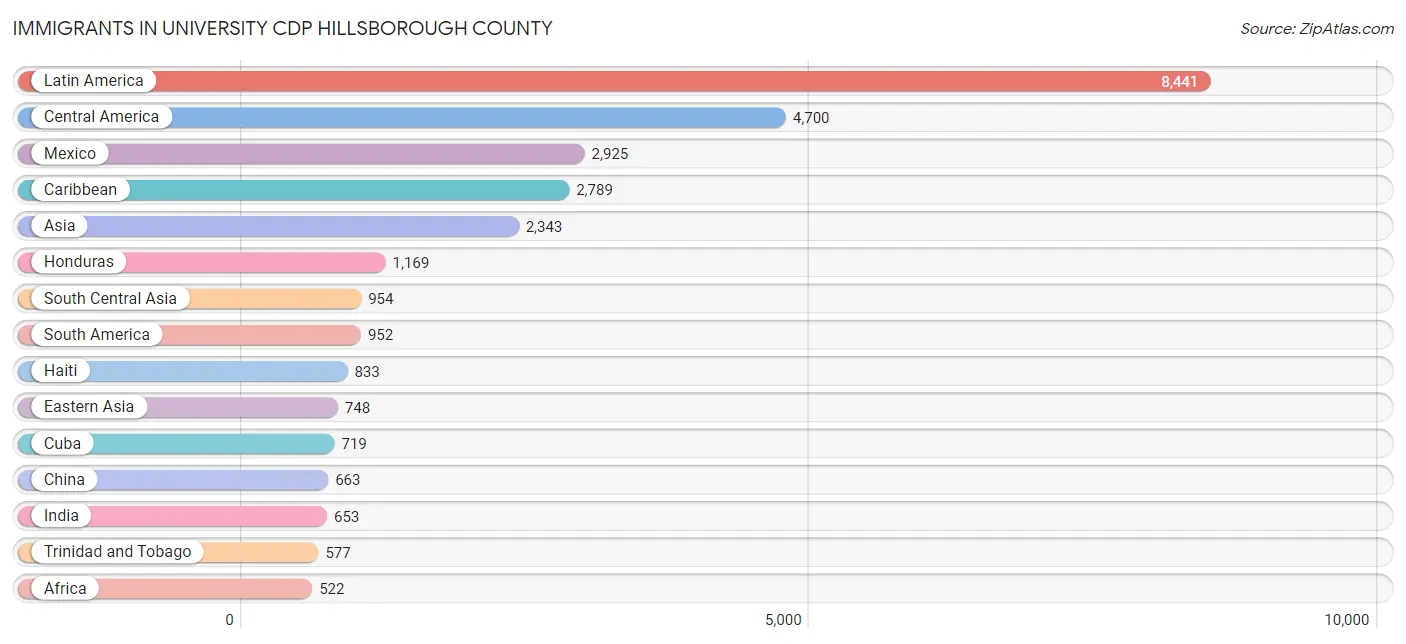
Immigrants in University CDP Hillsborough County
The most numerous immigrant groups reported in University CDP Hillsborough County came from Latin America (8,441 | 17.2%), Central America (4,700 | 9.6%), Mexico (2,925 | 5.9%), Caribbean (2,789 | 5.7%), and Asia (2,343 | 4.8%), together accounting for 43.1% of all University CDP Hillsborough County residents.
| Immigration Origin | # Population | % Population |
| Africa | 522 | 1.1% |
| Albania | 41 | 0.1% |
| Argentina | 6 | 0.0% |
| Asia | 2,343 | 4.8% |
| Bahamas | 35 | 0.1% |
| Bangladesh | 86 | 0.2% |
| Belize | 13 | 0.0% |
| Bolivia | 34 | 0.1% |
| Brazil | 152 | 0.3% |
| Cabo Verde | 9 | 0.0% |
| Canada | 54 | 0.1% |
| Caribbean | 2,789 | 5.7% |
| Central America | 4,700 | 9.6% |
| China | 663 | 1.3% |
| Colombia | 249 | 0.5% |
| Costa Rica | 79 | 0.2% |
| Croatia | 30 | 0.1% |
| Cuba | 719 | 1.5% |
| Dominica | 7 | 0.0% |
| Dominican Republic | 188 | 0.4% |
| Eastern Africa | 70 | 0.1% |
| Eastern Asia | 748 | 1.5% |
| Eastern Europe | 99 | 0.2% |
| Ecuador | 35 | 0.1% |
| Egypt | 54 | 0.1% |
| El Salvador | 230 | 0.5% |
| Europe | 356 | 0.7% |
| Germany | 29 | 0.1% |
| Guatemala | 194 | 0.4% |
| Guyana | 34 | 0.1% |
| Haiti | 833 | 1.7% |
| Honduras | 1,169 | 2.4% |
| India | 653 | 1.3% |
| Iran | 105 | 0.2% |
| Iraq | 23 | 0.1% |
| Israel | 14 | 0.0% |
| Italy | 57 | 0.1% |
| Jamaica | 364 | 0.7% |
| Japan | 6 | 0.0% |
| Jordan | 11 | 0.0% |
| Kazakhstan | 28 | 0.1% |
| Korea | 79 | 0.2% |
| Kuwait | 63 | 0.1% |
| Latin America | 8,441 | 17.2% |
| Liberia | 60 | 0.1% |
| Mexico | 2,925 | 5.9% |
| Morocco | 58 | 0.1% |
| Nepal | 17 | 0.0% |
| Netherlands | 69 | 0.1% |
| Nicaragua | 73 | 0.2% |
| Nigeria | 74 | 0.2% |
| Northern Africa | 122 | 0.3% |
| Northern Europe | 27 | 0.1% |
| Pakistan | 5 | 0.0% |
| Panama | 17 | 0.0% |
| Peru | 282 | 0.6% |
| Philippines | 76 | 0.2% |
| Poland | 12 | 0.0% |
| Russia | 16 | 0.0% |
| Saudi Arabia | 74 | 0.2% |
| Senegal | 15 | 0.0% |
| South America | 952 | 1.9% |
| South Central Asia | 954 | 1.9% |
| South Eastern Asia | 339 | 0.7% |
| Southern Europe | 132 | 0.3% |
| Spain | 35 | 0.1% |
| Sri Lanka | 31 | 0.1% |
| Sudan | 10 | 0.0% |
| Taiwan | 139 | 0.3% |
| Thailand | 46 | 0.1% |
| Trinidad and Tobago | 577 | 1.2% |
| Turkey | 54 | 0.1% |
| Venezuela | 160 | 0.3% |
| Vietnam | 193 | 0.4% |
| West Indies | 5 | 0.0% |
| Western Africa | 330 | 0.7% |
| Western Asia | 302 | 0.6% |
| Western Europe | 98 | 0.2% | View All 78 Rows |
Sex and Age in University CDP Hillsborough County
Sex and Age in University CDP Hillsborough County
The most populous age groups in University CDP Hillsborough County are 20 to 24 Years (5,215 | 21.3%) for men and 20 to 24 Years (5,118 | 20.8%) for women.
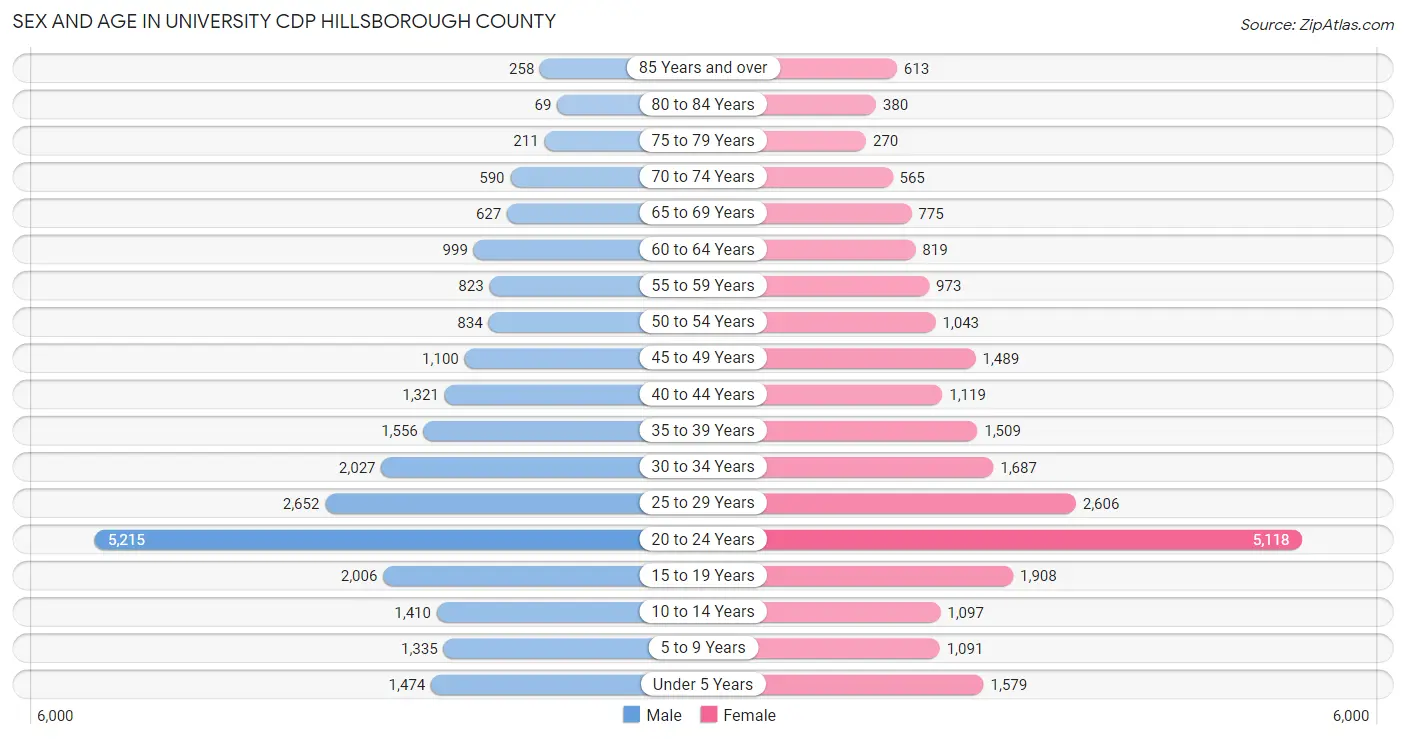
| Age Bracket | Male | Female |
| Under 5 Years | 1,474 (6.0%) | 1,579 (6.4%) |
| 5 to 9 Years | 1,335 (5.4%) | 1,091 (4.4%) |
| 10 to 14 Years | 1,410 (5.8%) | 1,097 (4.4%) |
| 15 to 19 Years | 2,006 (8.2%) | 1,908 (7.7%) |
| 20 to 24 Years | 5,215 (21.3%) | 5,118 (20.8%) |
| 25 to 29 Years | 2,652 (10.8%) | 2,606 (10.6%) |
| 30 to 34 Years | 2,027 (8.3%) | 1,687 (6.9%) |
| 35 to 39 Years | 1,556 (6.4%) | 1,509 (6.1%) |
| 40 to 44 Years | 1,321 (5.4%) | 1,119 (4.5%) |
| 45 to 49 Years | 1,100 (4.5%) | 1,489 (6.0%) |
| 50 to 54 Years | 834 (3.4%) | 1,043 (4.2%) |
| 55 to 59 Years | 823 (3.4%) | 973 (4.0%) |
| 60 to 64 Years | 999 (4.1%) | 819 (3.3%) |
| 65 to 69 Years | 627 (2.6%) | 775 (3.2%) |
| 70 to 74 Years | 590 (2.4%) | 565 (2.3%) |
| 75 to 79 Years | 211 (0.9%) | 270 (1.1%) |
| 80 to 84 Years | 69 (0.3%) | 380 (1.5%) |
| 85 Years and over | 258 (1.1%) | 613 (2.5%) |
| Total | 24,507 (100.0%) | 24,641 (100.0%) |
Families and Households in University CDP Hillsborough County
Median Family Size in University CDP Hillsborough County
The median family size in University CDP Hillsborough County is 3.40 persons per family, with married-couple families (2,916 | 39.4%) accounting for the largest median family size of 3.63 persons per family. On the other hand, single male/father families (1,253 | 16.9%) represent the smallest median family size with 3.07 persons per family.
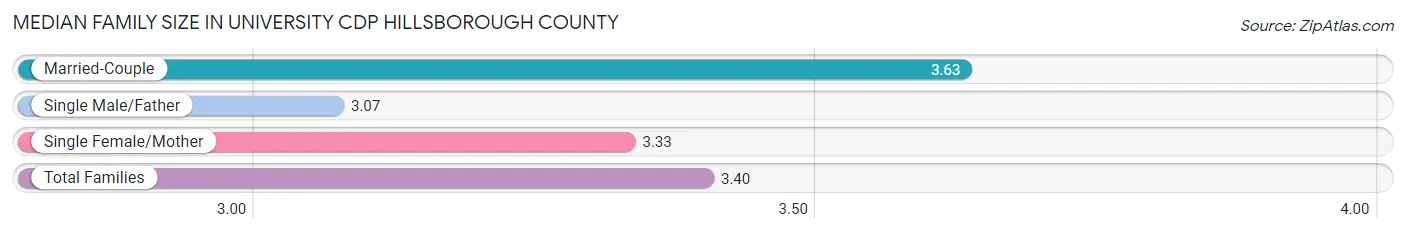
| Family Type | # Families | Family Size |
| Married-Couple | 2,916 (39.4%) | 3.63 |
| Single Male/Father | 1,253 (16.9%) | 3.07 |
| Single Female/Mother | 3,240 (43.7%) | 3.33 |
| Total Families | 7,409 (100.0%) | 3.40 |
Median Household Size in University CDP Hillsborough County
The median household size in University CDP Hillsborough County is 2.32 persons per household, with married-couple households (2,916 | 14.3%) accounting for the largest median household size of 3.67 persons per household. non-family households (12,990 | 63.7%) represent the smallest median household size with 1.61 persons per household.
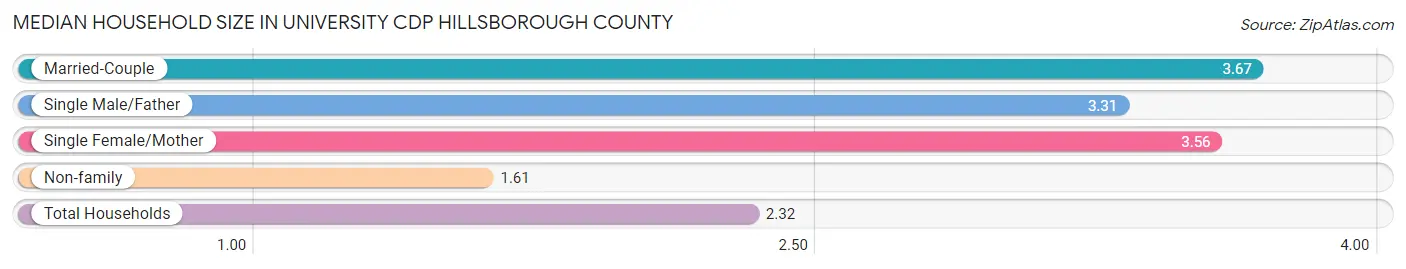
| Household Type | # Households | Household Size |
| Married-Couple | 2,916 (14.3%) | 3.67 |
| Single Male/Father | 1,253 (6.1%) | 3.31 |
| Single Female/Mother | 3,240 (15.9%) | 3.56 |
| Non-family | 12,990 (63.7%) | 1.61 |
| Total Households | 20,399 (100.0%) | 2.32 |
Household Size by Marriage Status in University CDP Hillsborough County
Out of a total of 20,399 households in University CDP Hillsborough County, 7,409 (36.3%) are family households, while 12,990 (63.7%) are nonfamily households. The most numerous type of family households are 2-person households, comprising 2,569, and the most common type of nonfamily households are 1-person households, comprising 9,336.
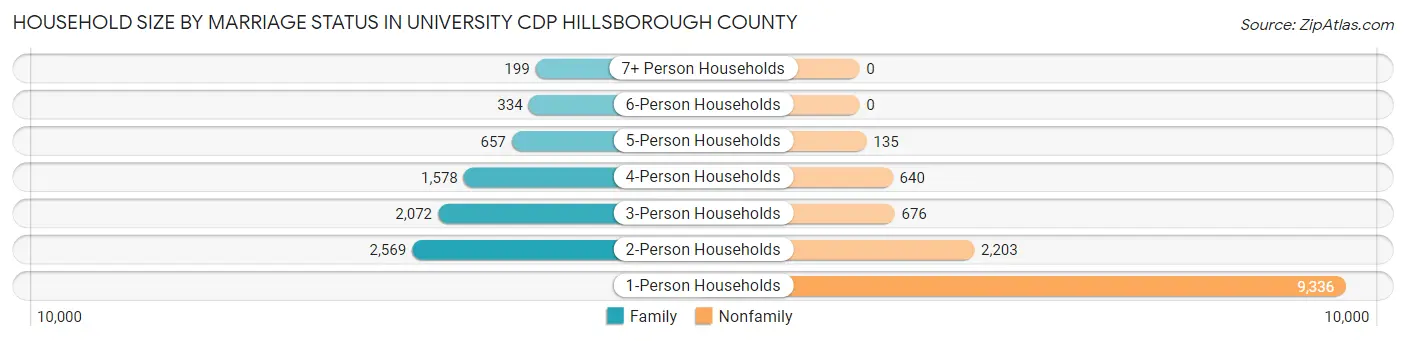
| Household Size | Family Households | Nonfamily Households |
| 1-Person Households | - | 9,336 (45.8%) |
| 2-Person Households | 2,569 (12.6%) | 2,203 (10.8%) |
| 3-Person Households | 2,072 (10.2%) | 676 (3.3%) |
| 4-Person Households | 1,578 (7.7%) | 640 (3.1%) |
| 5-Person Households | 657 (3.2%) | 135 (0.7%) |
| 6-Person Households | 334 (1.6%) | 0 (0.0%) |
| 7+ Person Households | 199 (1.0%) | 0 (0.0%) |
| Total | 7,409 (36.3%) | 12,990 (63.7%) |
Female Fertility in University CDP Hillsborough County
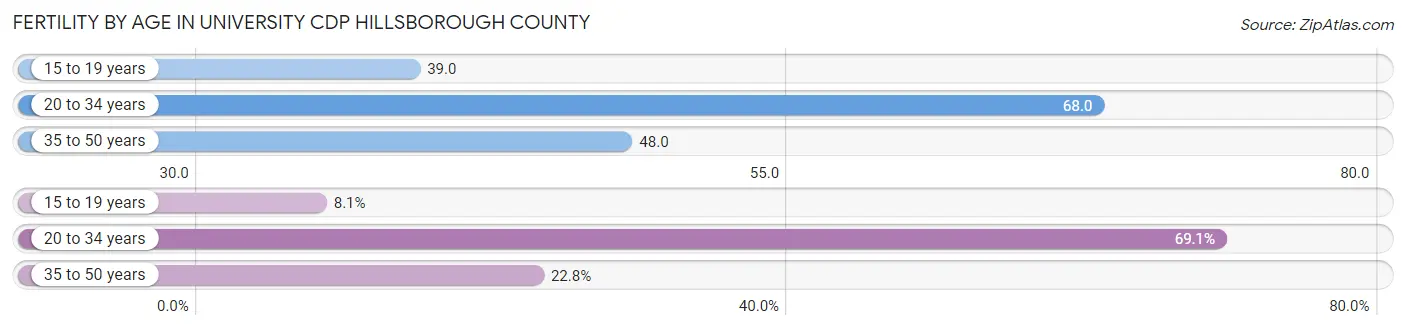
Fertility by Age in University CDP Hillsborough County
Average fertility rate in University CDP Hillsborough County is 59.0 births per 1,000 women. Women in the age bracket of 20 to 34 years have the highest fertility rate with 68.0 births per 1,000 women. Women in the age bracket of 20 to 34 years acount for 69.1% of all women with births.
| Age Bracket | Women with Births | Births / 1,000 Women |
| 15 to 19 years | 75 (8.1%) | 39.0 |
| 20 to 34 years | 643 (69.1%) | 68.0 |
| 35 to 50 years | 212 (22.8%) | 48.0 |
| Total | 930 (100.0%) | 59.0 |
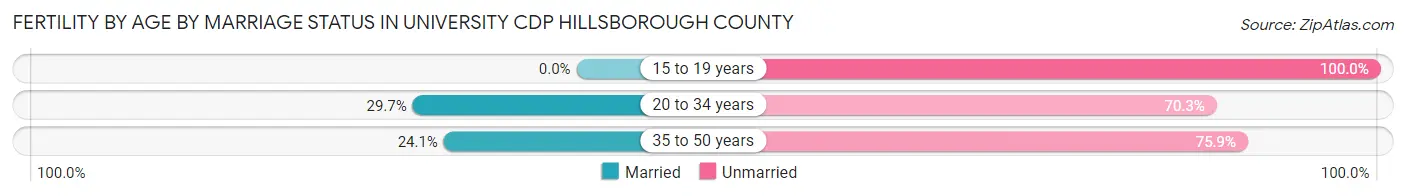
Fertility by Age by Marriage Status in University CDP Hillsborough County
26.0% of women with births (930) in University CDP Hillsborough County are married. The highest percentage of unmarried women with births falls into 15 to 19 years age bracket with 100.0% of them unmarried at the time of birth, while the lowest percentage of unmarried women with births belong to 20 to 34 years age bracket with 70.3% of them unmarried.
| Age Bracket | Married | Unmarried |
| 15 to 19 years | 0 (0.0%) | 75 (100.0%) |
| 20 to 34 years | 191 (29.7%) | 452 (70.3%) |
| 35 to 50 years | 51 (24.1%) | 161 (75.9%) |
| Total | 242 (26.0%) | 688 (74.0%) |
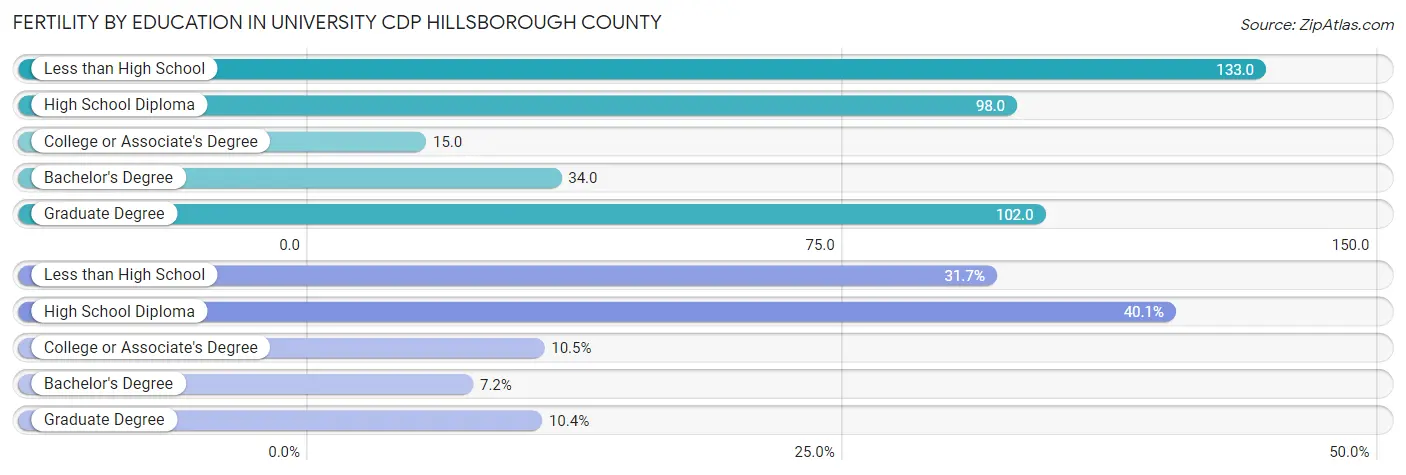
Fertility by Education in University CDP Hillsborough County
Average fertility rate in University CDP Hillsborough County is 59.0 births per 1,000 women. Women with the education attainment of less than high school have the highest fertility rate of 133.0 births per 1,000 women, while women with the education attainment of college or associate's degree have the lowest fertility at 15.0 births per 1,000 women. Women with the education attainment of high school diploma represent 40.1% of all women with births.
| Educational Attainment | Women with Births | Births / 1,000 Women |
| Less than High School | 295 (31.7%) | 133.0 |
| High School Diploma | 373 (40.1%) | 98.0 |
| College or Associate's Degree | 98 (10.5%) | 15.0 |
| Bachelor's Degree | 67 (7.2%) | 34.0 |
| Graduate Degree | 97 (10.4%) | 102.0 |
| Total | 930 (100.0%) | 59.0 |
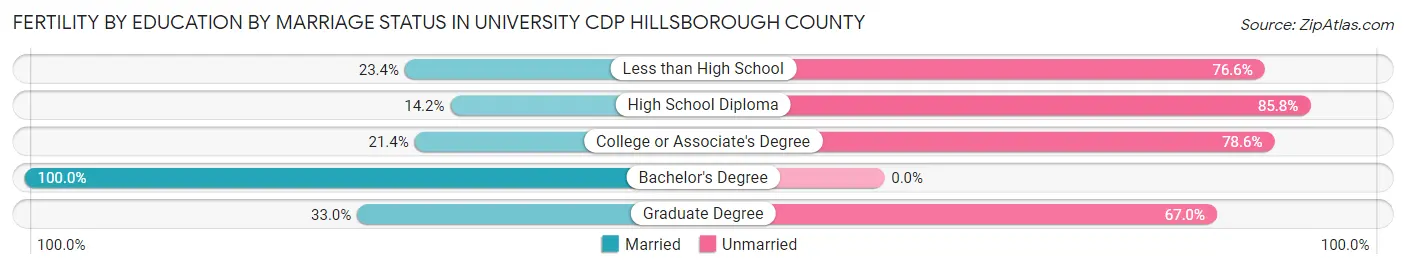
Fertility by Education by Marriage Status in University CDP Hillsborough County
74.0% of women with births in University CDP Hillsborough County are unmarried. Women with the educational attainment of bachelor's degree are most likely to be married with 100.0% of them married at childbirth, while women with the educational attainment of high school diploma are least likely to be married with 85.8% of them unmarried at childbirth.
| Educational Attainment | Married | Unmarried |
| Less than High School | 69 (23.4%) | 226 (76.6%) |
| High School Diploma | 53 (14.2%) | 320 (85.8%) |
| College or Associate's Degree | 21 (21.4%) | 77 (78.6%) |
| Bachelor's Degree | 67 (100.0%) | 0 (0.0%) |
| Graduate Degree | 32 (33.0%) | 65 (67.0%) |
| Total | 242 (26.0%) | 688 (74.0%) |
Employment Characteristics in University CDP Hillsborough County
Employment by Class of Employer in University CDP Hillsborough County
Among the 23,641 employed individuals in University CDP Hillsborough County, private company employees (18,759 | 79.3%), not-for-profit organizations (1,596 | 6.8%), and self-employed (not incorporated) (1,010 | 4.3%) make up the most common classes of employment.

| Employer Class | # Employees | % Employees |
| Private Company Employees | 18,759 | 79.3% |
| Self-Employed (Incorporated) | 504 | 2.1% |
| Self-Employed (Not Incorporated) | 1,010 | 4.3% |
| Not-for-profit Organizations | 1,596 | 6.8% |
| Local Government Employees | 484 | 2.1% |
| State Government Employees | 960 | 4.1% |
| Federal Government Employees | 308 | 1.3% |
| Unpaid Family Workers | 20 | 0.1% |
| Total | 23,641 | 100.0% |
Employment Status by Age in University CDP Hillsborough County
According to the labor force statistics for University CDP Hillsborough County, out of the total population over 16 years of age (40,762), 63.7% or 25,965 individuals are in the labor force, with 6.0% or 1,558 of them unemployed. The age group with the highest labor force participation rate is 30 to 34 years, with 87.5% or 3,250 individuals in the labor force. Within the labor force, the 16 to 19 years age range has the highest percentage of unemployed individuals, with 22.2% or 368 of them being unemployed.
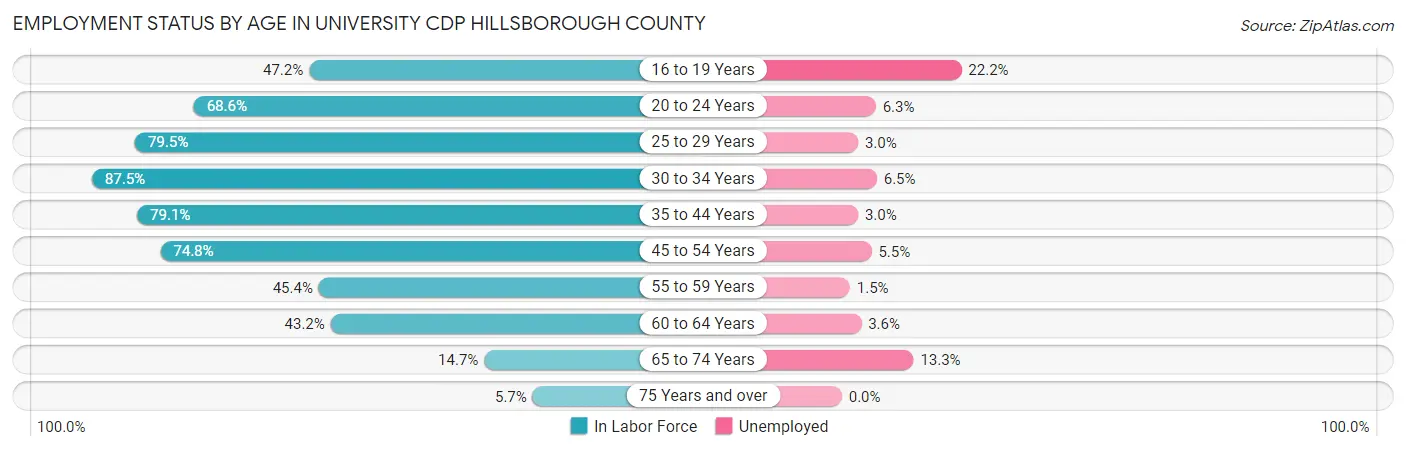
| Age Bracket | In Labor Force | Unemployed |
| 16 to 19 Years | 1,659 (47.2%) | 368 (22.2%) |
| 20 to 24 Years | 7,088 (68.6%) | 447 (6.3%) |
| 25 to 29 Years | 4,180 (79.5%) | 125 (3.0%) |
| 30 to 34 Years | 3,250 (87.5%) | 211 (6.5%) |
| 35 to 44 Years | 4,354 (79.1%) | 131 (3.0%) |
| 45 to 54 Years | 3,341 (74.8%) | 184 (5.5%) |
| 55 to 59 Years | 815 (45.4%) | 12 (1.5%) |
| 60 to 64 Years | 785 (43.2%) | 28 (3.6%) |
| 65 to 74 Years | 376 (14.7%) | 50 (13.3%) |
| 75 Years and over | 103 (5.7%) | 0 (0.0%) |
| Total | 25,965 (63.7%) | 1,558 (6.0%) |
Employment Status by Educational Attainment in University CDP Hillsborough County
According to labor force statistics for University CDP Hillsborough County, 74.1% of individuals (16,715) out of the total population between 25 and 64 years of age (22,557) are in the labor force, with 4.2% or 702 of them being unemployed. The group with the highest labor force participation rate are those with the educational attainment of college / associate degree, with 79.0% or 4,799 individuals in the labor force. Within the labor force, individuals with less than high school education have the highest percentage of unemployment, with 8.1% or 274 of them being unemployed.
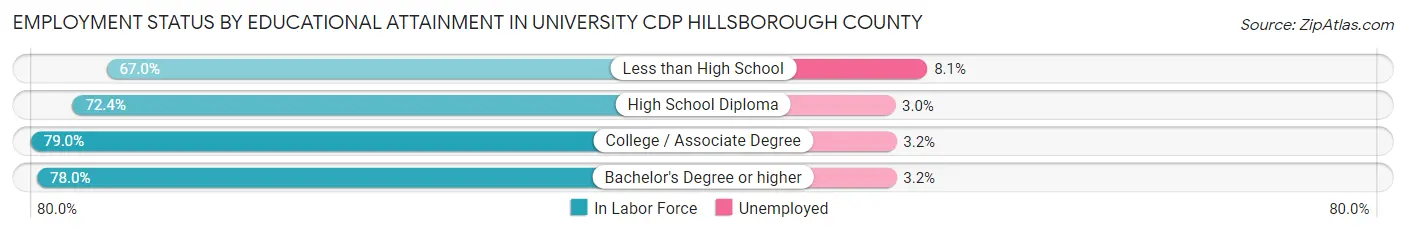
| Educational Attainment | In Labor Force | Unemployed |
| Less than High School | 3,379 (67.0%) | 408 (8.1%) |
| High School Diploma | 4,925 (72.4%) | 204 (3.0%) |
| College / Associate Degree | 4,799 (79.0%) | 194 (3.2%) |
| Bachelor's Degree or higher | 3,617 (78.0%) | 148 (3.2%) |
| Total | 16,715 (74.1%) | 947 (4.2%) |
Employment Occupations by Sex in University CDP Hillsborough County
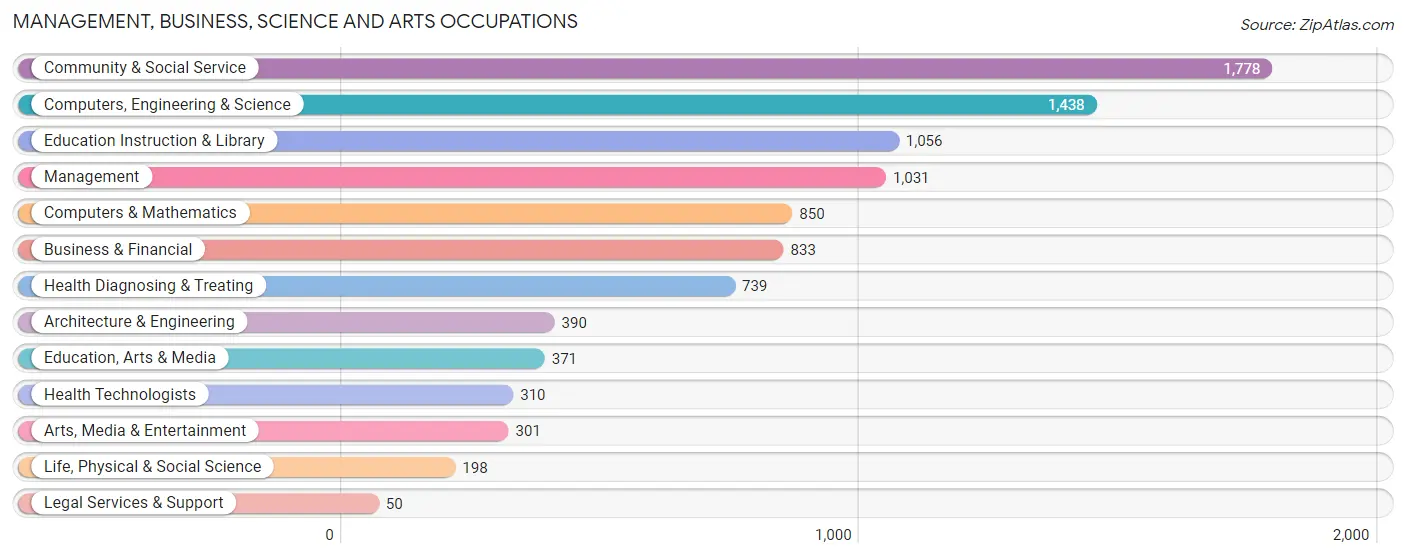
Management, Business, Science and Arts Occupations
The most common Management, Business, Science and Arts occupations in University CDP Hillsborough County are Community & Social Service (1,778 | 7.3%), Computers, Engineering & Science (1,438 | 5.9%), Education Instruction & Library (1,056 | 4.3%), Management (1,031 | 4.2%), and Computers & Mathematics (850 | 3.5%).
Management, Business, Science and Arts Occupations by Sex
Within the Management, Business, Science and Arts occupations in University CDP Hillsborough County, the most male-oriented occupations are Architecture & Engineering (77.7%), Life, Physical & Social Science (75.8%), and Computers, Engineering & Science (73.2%), while the most female-oriented occupations are Business & Financial (77.2%), Health Technologists (73.2%), and Education, Arts & Media (69.5%).
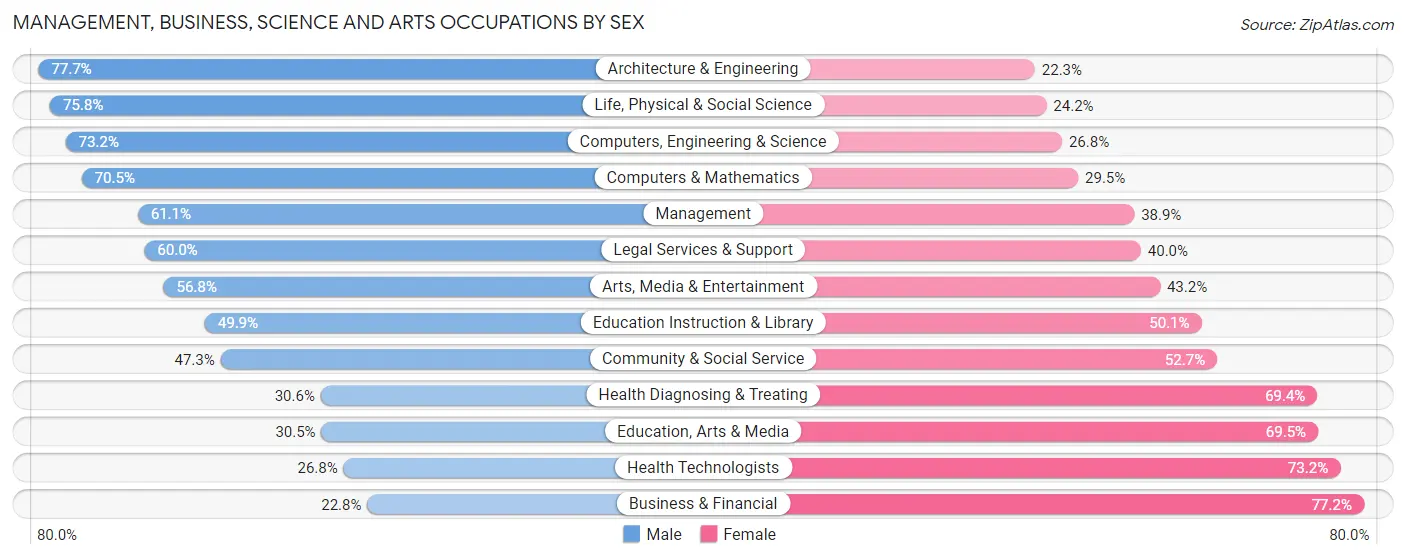
| Occupation | Male | Female |
| Management | 630 (61.1%) | 401 (38.9%) |
| Business & Financial | 190 (22.8%) | 643 (77.2%) |
| Computers, Engineering & Science | 1,052 (73.2%) | 386 (26.8%) |
| Computers & Mathematics | 599 (70.5%) | 251 (29.5%) |
| Architecture & Engineering | 303 (77.7%) | 87 (22.3%) |
| Life, Physical & Social Science | 150 (75.8%) | 48 (24.2%) |
| Community & Social Service | 841 (47.3%) | 937 (52.7%) |
| Education, Arts & Media | 113 (30.5%) | 258 (69.5%) |
| Legal Services & Support | 30 (60.0%) | 20 (40.0%) |
| Education Instruction & Library | 527 (49.9%) | 529 (50.1%) |
| Arts, Media & Entertainment | 171 (56.8%) | 130 (43.2%) |
| Health Diagnosing & Treating | 226 (30.6%) | 513 (69.4%) |
| Health Technologists | 83 (26.8%) | 227 (73.2%) |
| Total (Category) | 2,939 (50.5%) | 2,880 (49.5%) |
| Total (Overall) | 12,566 (51.6%) | 11,781 (48.4%) |
Services Occupations
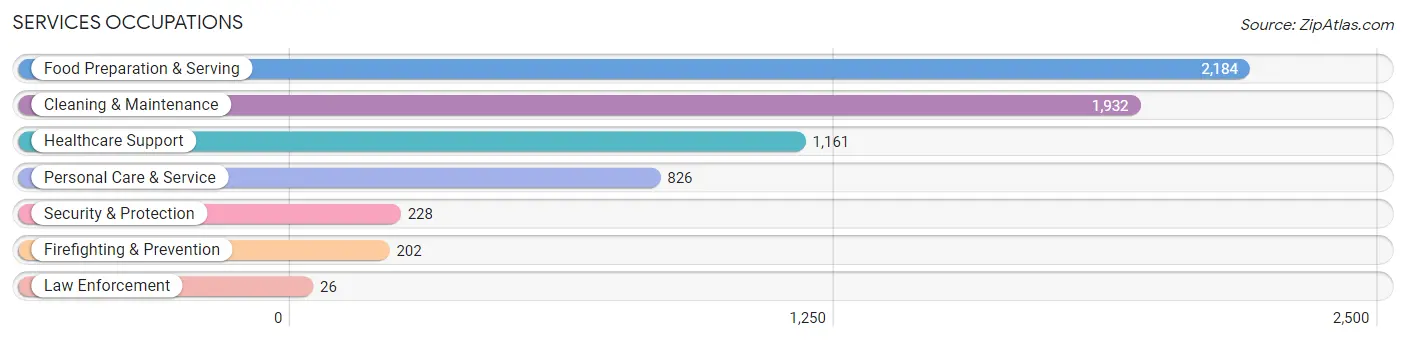
The most common Services occupations in University CDP Hillsborough County are Food Preparation & Serving (2,184 | 9.0%), Cleaning & Maintenance (1,932 | 7.9%), Healthcare Support (1,161 | 4.8%), Personal Care & Service (826 | 3.4%), and Security & Protection (228 | 0.9%).
Services Occupations by Sex
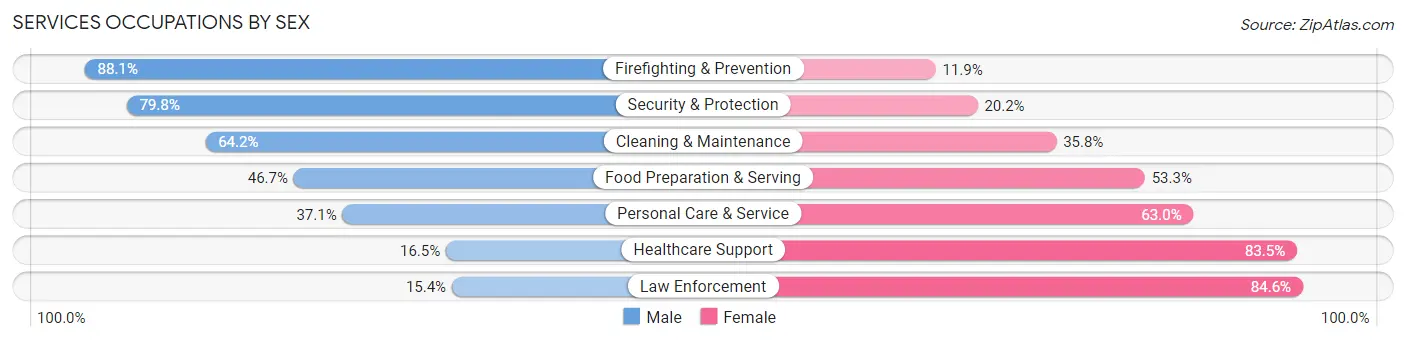
Within the Services occupations in University CDP Hillsborough County, the most male-oriented occupations are Firefighting & Prevention (88.1%), Security & Protection (79.8%), and Cleaning & Maintenance (64.2%), while the most female-oriented occupations are Law Enforcement (84.6%), Healthcare Support (83.5%), and Personal Care & Service (62.9%).
| Occupation | Male | Female |
| Healthcare Support | 192 (16.5%) | 969 (83.5%) |
| Security & Protection | 182 (79.8%) | 46 (20.2%) |
| Firefighting & Prevention | 178 (88.1%) | 24 (11.9%) |
| Law Enforcement | 4 (15.4%) | 22 (84.6%) |
| Food Preparation & Serving | 1,020 (46.7%) | 1,164 (53.3%) |
| Cleaning & Maintenance | 1,241 (64.2%) | 691 (35.8%) |
| Personal Care & Service | 306 (37.0%) | 520 (62.9%) |
| Total (Category) | 2,941 (46.5%) | 3,390 (53.5%) |
| Total (Overall) | 12,566 (51.6%) | 11,781 (48.4%) |
Sales and Office Occupations
The most common Sales and Office occupations in University CDP Hillsborough County are Office & Administration (3,687 | 15.1%), and Sales & Related (2,327 | 9.6%).

Sales and Office Occupations by Sex

| Occupation | Male | Female |
| Sales & Related | 1,281 (55.0%) | 1,046 (45.0%) |
| Office & Administration | 439 (11.9%) | 3,248 (88.1%) |
| Total (Category) | 1,720 (28.6%) | 4,294 (71.4%) |
| Total (Overall) | 12,566 (51.6%) | 11,781 (48.4%) |
Natural Resources, Construction and Maintenance Occupations
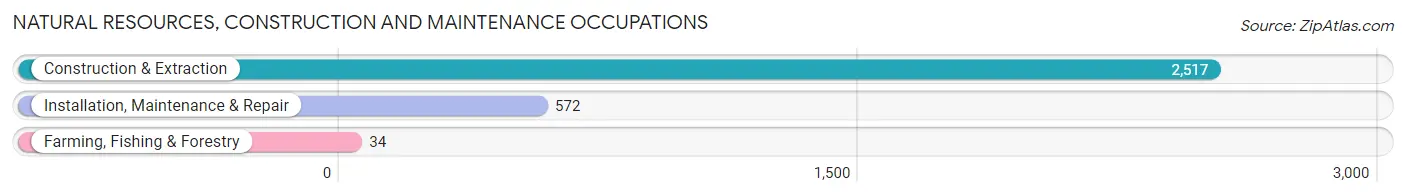
The most common Natural Resources, Construction and Maintenance occupations in University CDP Hillsborough County are Construction & Extraction (2,517 | 10.3%), Installation, Maintenance & Repair (572 | 2.4%), and Farming, Fishing & Forestry (34 | 0.1%).
Natural Resources, Construction and Maintenance Occupations by Sex
| Occupation | Male | Female |
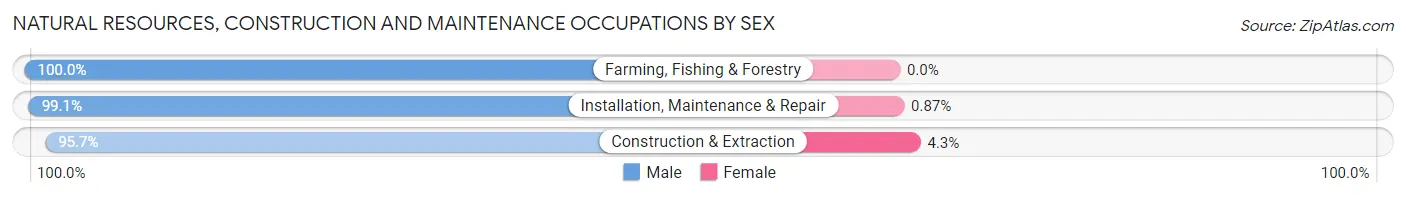
| Farming, Fishing & Forestry | 34 (100.0%) | 0 (0.0%) |
| Construction & Extraction | 2,409 (95.7%) | 108 (4.3%) |
| Installation, Maintenance & Repair | 567 (99.1%) | 5 (0.9%) |
| Total (Category) | 3,010 (96.4%) | 113 (3.6%) |
| Total (Overall) | 12,566 (51.6%) | 11,781 (48.4%) |
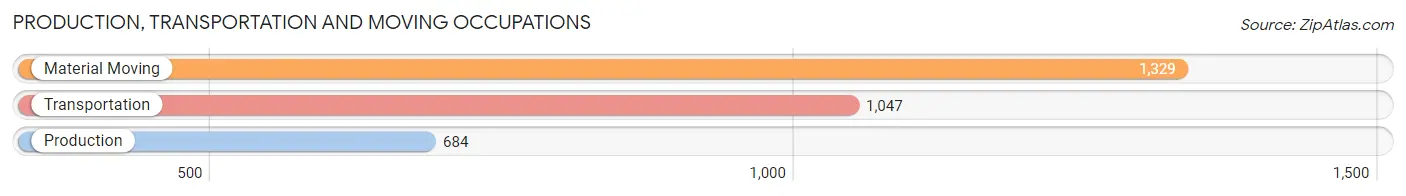
Production, Transportation and Moving Occupations
The most common Production, Transportation and Moving occupations in University CDP Hillsborough County are Material Moving (1,329 | 5.5%), Transportation (1,047 | 4.3%), and Production (684 | 2.8%).
Production, Transportation and Moving Occupations by Sex
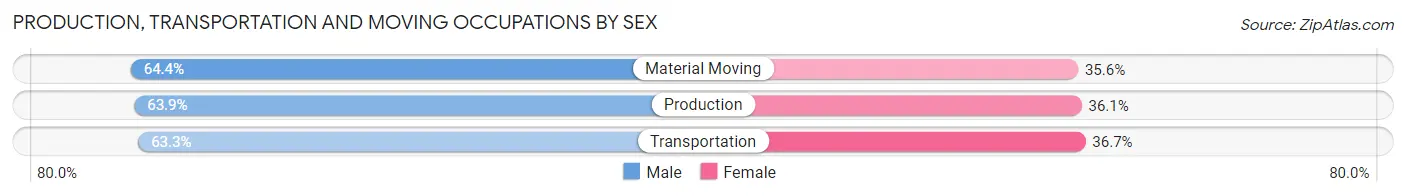
| Occupation | Male | Female |
| Production | 437 (63.9%) | 247 (36.1%) |
| Transportation | 663 (63.3%) | 384 (36.7%) |
| Material Moving | 856 (64.4%) | 473 (35.6%) |
| Total (Category) | 1,956 (63.9%) | 1,104 (36.1%) |
| Total (Overall) | 12,566 (51.6%) | 11,781 (48.4%) |
Employment Industries by Sex in University CDP Hillsborough County
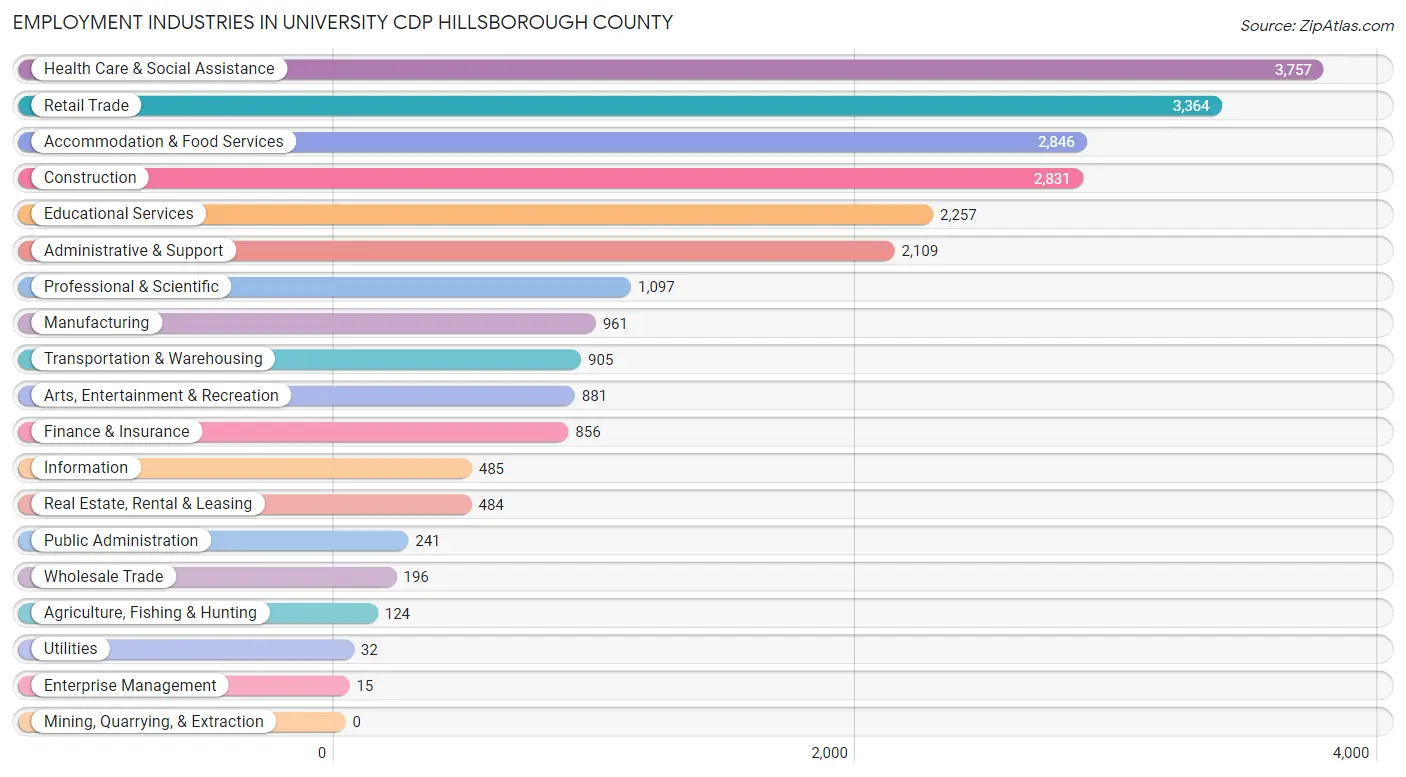
Employment Industries in University CDP Hillsborough County
The major employment industries in University CDP Hillsborough County include Health Care & Social Assistance (3,757 | 15.4%), Retail Trade (3,364 | 13.8%), Accommodation & Food Services (2,846 | 11.7%), Construction (2,831 | 11.6%), and Educational Services (2,257 | 9.3%).
Employment Industries by Sex in University CDP Hillsborough County
The University CDP Hillsborough County industries that see more men than women are Utilities (100.0%), Enterprise Management (100.0%), and Construction (94.8%), whereas the industries that tend to have a higher number of women are Information (79.0%), Health Care & Social Assistance (77.4%), and Finance & Insurance (75.3%).
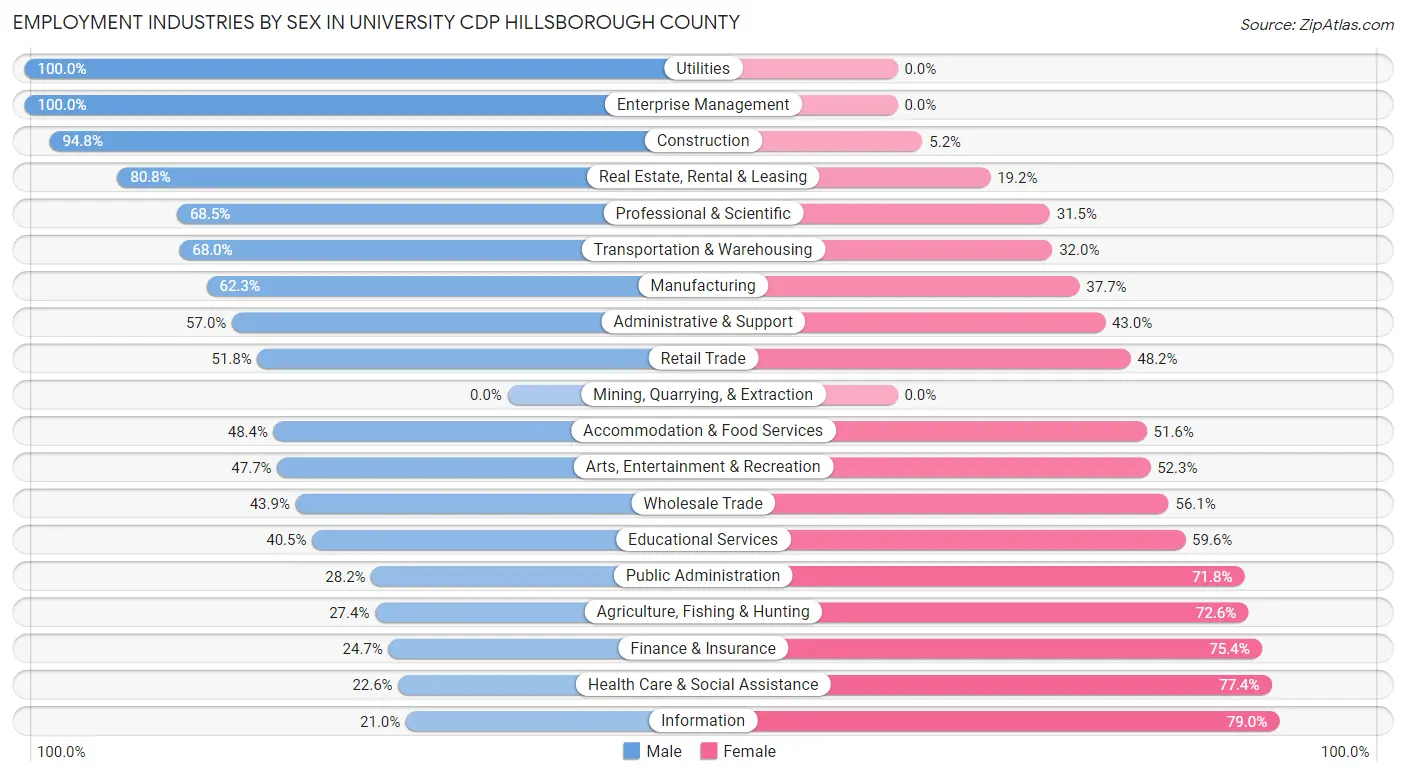
| Industry | Male | Female |
| Agriculture, Fishing & Hunting | 34 (27.4%) | 90 (72.6%) |
| Mining, Quarrying, & Extraction | 0 (0.0%) | 0 (0.0%) |
| Construction | 2,685 (94.8%) | 146 (5.2%) |
| Manufacturing | 599 (62.3%) | 362 (37.7%) |
| Wholesale Trade | 86 (43.9%) | 110 (56.1%) |
| Retail Trade | 1,742 (51.8%) | 1,622 (48.2%) |
| Transportation & Warehousing | 615 (68.0%) | 290 (32.0%) |
| Utilities | 32 (100.0%) | 0 (0.0%) |
| Information | 102 (21.0%) | 383 (79.0%) |
| Finance & Insurance | 211 (24.6%) | 645 (75.3%) |
| Real Estate, Rental & Leasing | 391 (80.8%) | 93 (19.2%) |
| Professional & Scientific | 751 (68.5%) | 346 (31.5%) |
| Enterprise Management | 15 (100.0%) | 0 (0.0%) |
| Administrative & Support | 1,203 (57.0%) | 906 (43.0%) |
| Educational Services | 913 (40.5%) | 1,344 (59.6%) |
| Health Care & Social Assistance | 850 (22.6%) | 2,907 (77.4%) |
| Arts, Entertainment & Recreation | 420 (47.7%) | 461 (52.3%) |
| Accommodation & Food Services | 1,378 (48.4%) | 1,468 (51.6%) |
| Public Administration | 68 (28.2%) | 173 (71.8%) |
| Total | 12,566 (51.6%) | 11,781 (48.4%) |
Education in University CDP Hillsborough County
School Enrollment in University CDP Hillsborough County
The most common levels of schooling among the 17,206 students in University CDP Hillsborough County are college / undergraduate (9,248 | 53.7%), middle school (2,009 | 11.7%), and elementary school (1,732 | 10.1%).
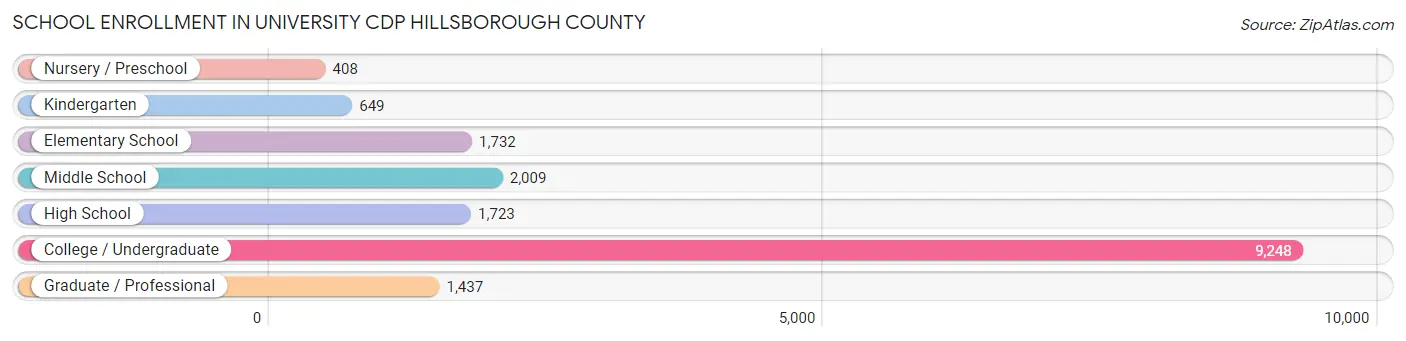
| School Level | # Students | % Students |
| Nursery / Preschool | 408 | 2.4% |
| Kindergarten | 649 | 3.8% |
| Elementary School | 1,732 | 10.1% |
| Middle School | 2,009 | 11.7% |
| High School | 1,723 | 10.0% |
| College / Undergraduate | 9,248 | 53.7% |
| Graduate / Professional | 1,437 | 8.4% |
| Total | 17,206 | 100.0% |
School Enrollment by Age by Funding Source in University CDP Hillsborough County
Out of a total of 17,206 students who are enrolled in schools in University CDP Hillsborough County, 1,979 (11.5%) attend a private institution, while the remaining 15,227 (88.5%) are enrolled in public schools. The age group of 35 years and over has the highest likelihood of being enrolled in private schools, with 195 (26.7% in the age bracket) enrolled. Conversely, the age group of 15 to 17 year olds has the lowest likelihood of being enrolled in a private school, with 1,110 (99.0% in the age bracket) attending a public institution.
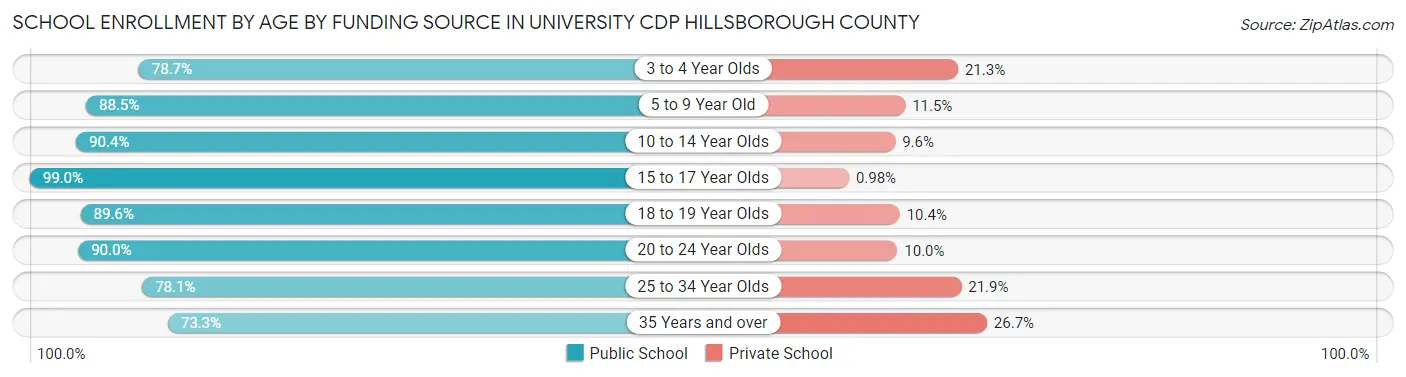
| Age Bracket | Public School | Private School |
| 3 to 4 Year Olds | 292 (78.7%) | 79 (21.3%) |
| 5 to 9 Year Old | 1,947 (88.5%) | 252 (11.5%) |
| 10 to 14 Year Olds | 2,259 (90.4%) | 240 (9.6%) |
| 15 to 17 Year Olds | 1,110 (99.0%) | 11 (1.0%) |
| 18 to 19 Year Olds | 1,853 (89.6%) | 216 (10.4%) |
| 20 to 24 Year Olds | 6,191 (90.0%) | 688 (10.0%) |
| 25 to 34 Year Olds | 1,044 (78.1%) | 293 (21.9%) |
| 35 Years and over | 536 (73.3%) | 195 (26.7%) |
| Total | 15,227 (88.5%) | 1,979 (11.5%) |
Educational Attainment by Field of Study in University CDP Hillsborough County
Business (872 | 14.5%), social sciences (741 | 12.3%), science & technology (723 | 12.0%), engineering (691 | 11.5%), and education (621 | 10.3%) are the most common fields of study among 6,027 individuals in University CDP Hillsborough County who have obtained a bachelor's degree or higher.
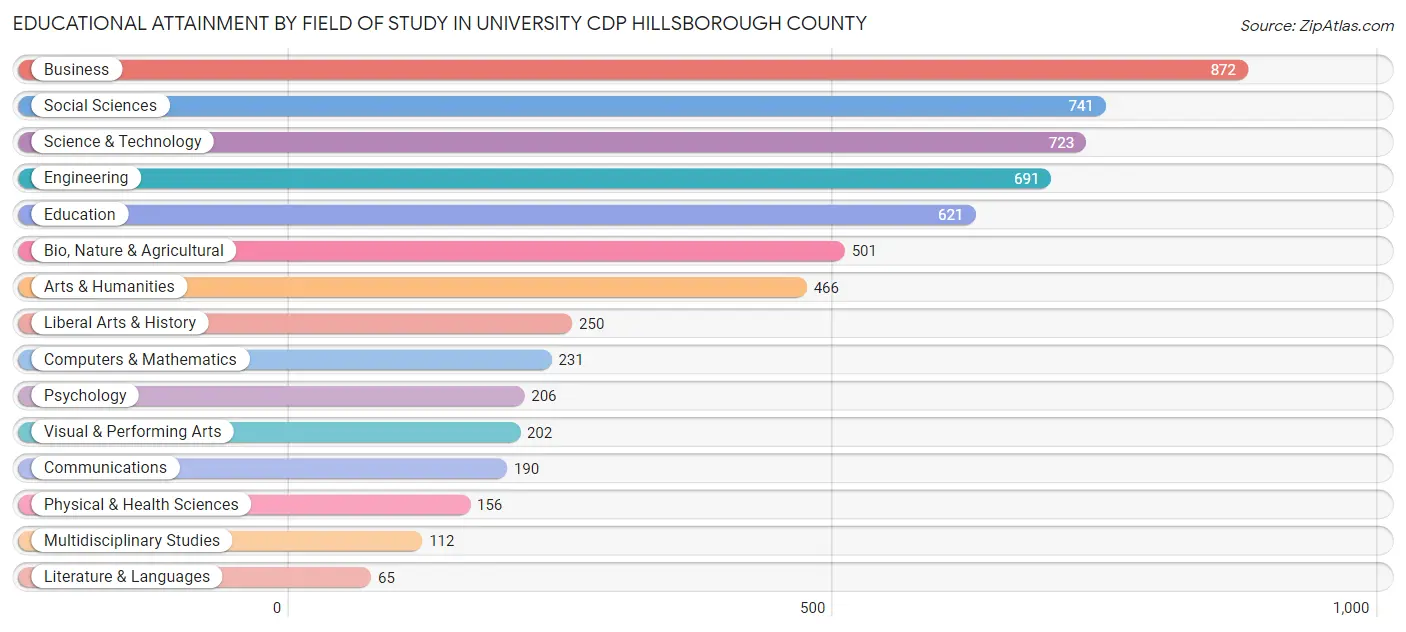
| Field of Study | # Graduates | % Graduates |
| Computers & Mathematics | 231 | 3.8% |
| Bio, Nature & Agricultural | 501 | 8.3% |
| Physical & Health Sciences | 156 | 2.6% |
| Psychology | 206 | 3.4% |
| Social Sciences | 741 | 12.3% |
| Engineering | 691 | 11.5% |
| Multidisciplinary Studies | 112 | 1.9% |
| Science & Technology | 723 | 12.0% |
| Business | 872 | 14.5% |
| Education | 621 | 10.3% |
| Literature & Languages | 65 | 1.1% |
| Liberal Arts & History | 250 | 4.2% |
| Visual & Performing Arts | 202 | 3.4% |
| Communications | 190 | 3.2% |
| Arts & Humanities | 466 | 7.7% |
| Total | 6,027 | 100.0% |
Transportation & Commute in University CDP Hillsborough County
Vehicle Availability by Sex in University CDP Hillsborough County
The most prevalent vehicle ownership categories in University CDP Hillsborough County are males with 1 vehicle (4,598, accounting for 37.3%) and females with 1 vehicle (5,003, making up 41.2%).
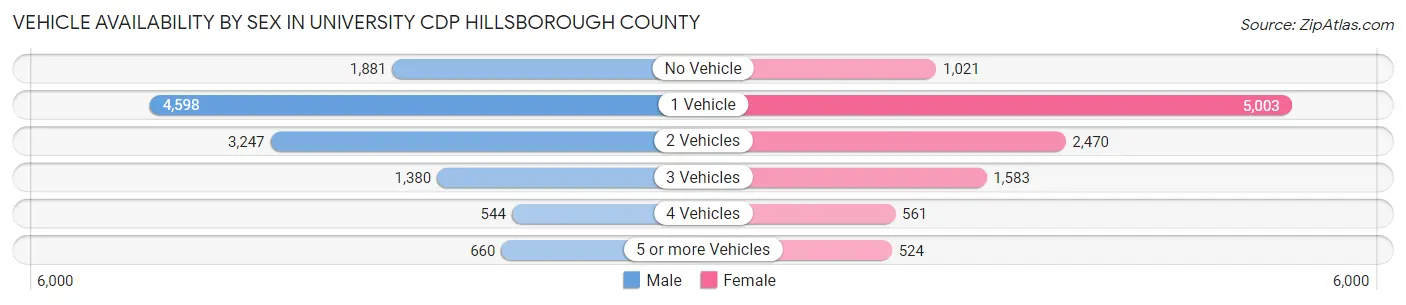
| Vehicles Available | Male | Female |
| No Vehicle | 1,881 (15.3%) | 1,021 (9.1%) |
| 1 Vehicle | 4,598 (37.3%) | 5,003 (44.8%) |
| 2 Vehicles | 3,247 (26.4%) | 2,470 (22.1%) |
| 3 Vehicles | 1,380 (11.2%) | 1,583 (14.2%) |
| 4 Vehicles | 544 (4.4%) | 561 (5.0%) |
| 5 or more Vehicles | 660 (5.4%) | 524 (4.7%) |
| Total | 12,310 (100.0%) | 11,162 (100.0%) |
Commute Time in University CDP Hillsborough County
The most frequently occuring commute durations in University CDP Hillsborough County are 20 to 24 minutes (3,636 commuters, 16.8%), 30 to 34 minutes (3,471 commuters, 16.0%), and 15 to 19 minutes (2,574 commuters, 11.9%).
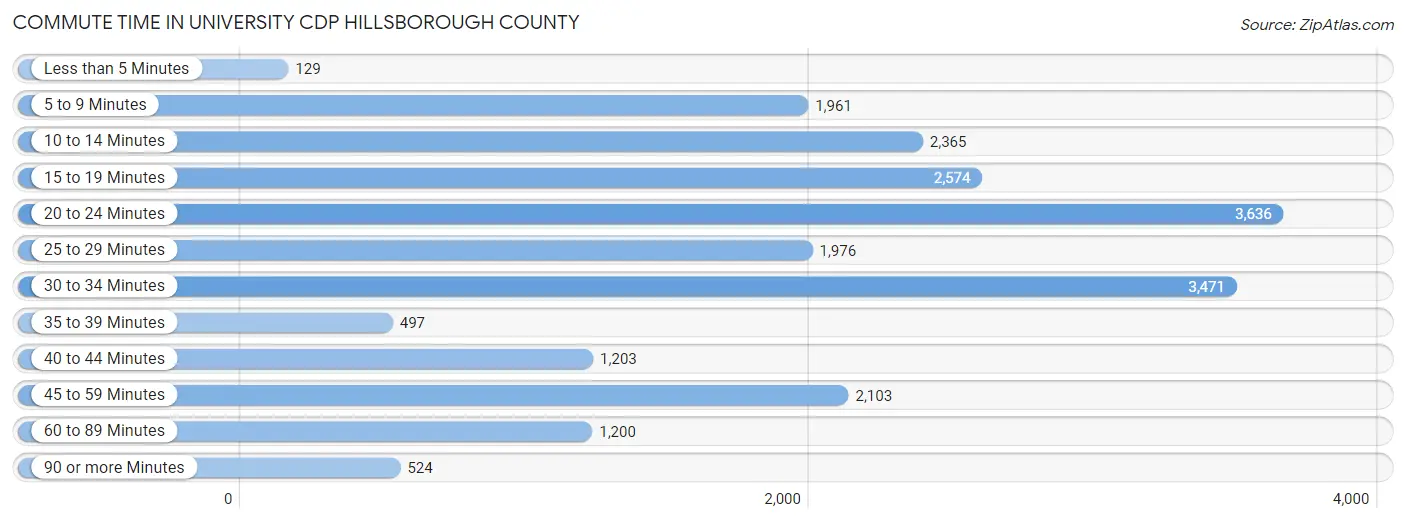
| Commute Time | # Commuters | % Commuters |
| Less than 5 Minutes | 129 | 0.6% |
| 5 to 9 Minutes | 1,961 | 9.1% |
| 10 to 14 Minutes | 2,365 | 10.9% |
| 15 to 19 Minutes | 2,574 | 11.9% |
| 20 to 24 Minutes | 3,636 | 16.8% |
| 25 to 29 Minutes | 1,976 | 9.1% |
| 30 to 34 Minutes | 3,471 | 16.0% |
| 35 to 39 Minutes | 497 | 2.3% |
| 40 to 44 Minutes | 1,203 | 5.6% |
| 45 to 59 Minutes | 2,103 | 9.7% |
| 60 to 89 Minutes | 1,200 | 5.6% |
| 90 or more Minutes | 524 | 2.4% |
Commute Time by Sex in University CDP Hillsborough County
The most common commute times in University CDP Hillsborough County are 20 to 24 minutes (1,948 commuters, 16.6%) for males and 20 to 24 minutes (1,688 commuters, 17.0%) for females.
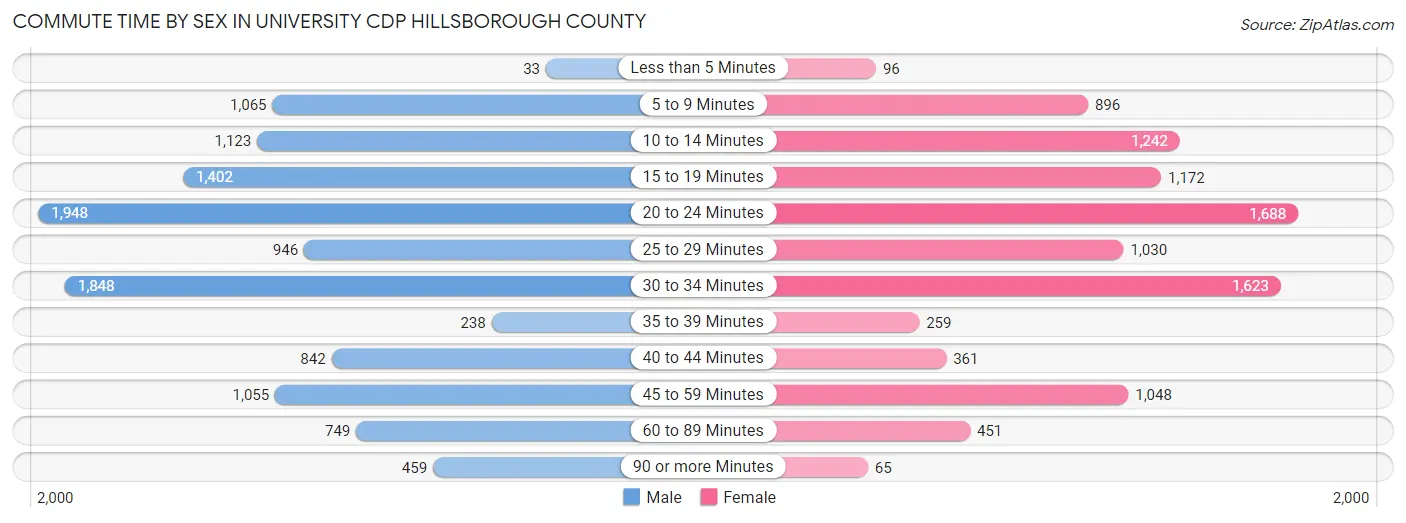
| Commute Time | Male | Female |
| Less than 5 Minutes | 33 (0.3%) | 96 (1.0%) |
| 5 to 9 Minutes | 1,065 (9.1%) | 896 (9.0%) |
| 10 to 14 Minutes | 1,123 (9.6%) | 1,242 (12.5%) |
| 15 to 19 Minutes | 1,402 (12.0%) | 1,172 (11.8%) |
| 20 to 24 Minutes | 1,948 (16.6%) | 1,688 (17.0%) |
| 25 to 29 Minutes | 946 (8.1%) | 1,030 (10.4%) |
| 30 to 34 Minutes | 1,848 (15.8%) | 1,623 (16.3%) |
| 35 to 39 Minutes | 238 (2.0%) | 259 (2.6%) |
| 40 to 44 Minutes | 842 (7.2%) | 361 (3.6%) |
| 45 to 59 Minutes | 1,055 (9.0%) | 1,048 (10.5%) |
| 60 to 89 Minutes | 749 (6.4%) | 451 (4.5%) |
| 90 or more Minutes | 459 (3.9%) | 65 (0.6%) |
Time of Departure to Work by Sex in University CDP Hillsborough County
The most frequent times of departure to work in University CDP Hillsborough County are 6:00 AM to 6:29 AM (1,473, 12.6%) for males and 4:00 PM to 11:59 PM (1,397, 14.1%) for females.
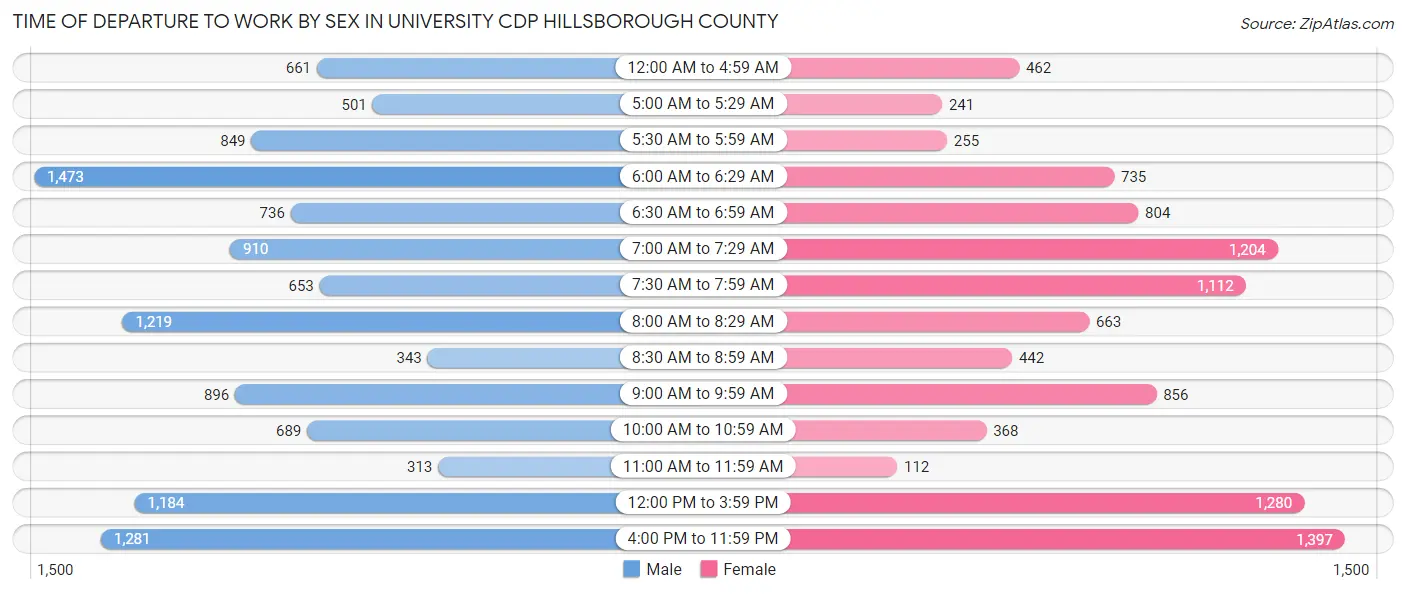
| Time of Departure | Male | Female |
| 12:00 AM to 4:59 AM | 661 (5.7%) | 462 (4.6%) |
| 5:00 AM to 5:29 AM | 501 (4.3%) | 241 (2.4%) |
| 5:30 AM to 5:59 AM | 849 (7.2%) | 255 (2.6%) |
| 6:00 AM to 6:29 AM | 1,473 (12.6%) | 735 (7.4%) |
| 6:30 AM to 6:59 AM | 736 (6.3%) | 804 (8.1%) |
| 7:00 AM to 7:29 AM | 910 (7.8%) | 1,204 (12.1%) |
| 7:30 AM to 7:59 AM | 653 (5.6%) | 1,112 (11.2%) |
| 8:00 AM to 8:29 AM | 1,219 (10.4%) | 663 (6.7%) |
| 8:30 AM to 8:59 AM | 343 (2.9%) | 442 (4.4%) |
| 9:00 AM to 9:59 AM | 896 (7.6%) | 856 (8.6%) |
| 10:00 AM to 10:59 AM | 689 (5.9%) | 368 (3.7%) |
| 11:00 AM to 11:59 AM | 313 (2.7%) | 112 (1.1%) |
| 12:00 PM to 3:59 PM | 1,184 (10.1%) | 1,280 (12.9%) |
| 4:00 PM to 11:59 PM | 1,281 (10.9%) | 1,397 (14.1%) |
| Total | 11,708 (100.0%) | 9,931 (100.0%) |
Housing Occupancy in University CDP Hillsborough County
Occupancy by Ownership in University CDP Hillsborough County
Of the total 20,399 dwellings in University CDP Hillsborough County, owner-occupied units account for 2,821 (13.8%), while renter-occupied units make up 17,578 (86.2%).
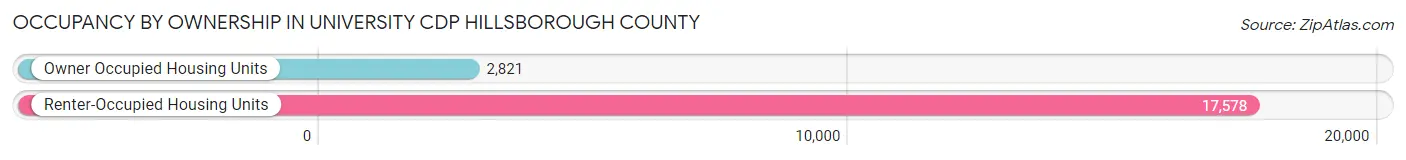
| Occupancy | # Housing Units | % Housing Units |
| Owner Occupied Housing Units | 2,821 | 13.8% |
| Renter-Occupied Housing Units | 17,578 | 86.2% |
| Total Occupied Housing Units | 20,399 | 100.0% |
Occupancy by Household Size in University CDP Hillsborough County
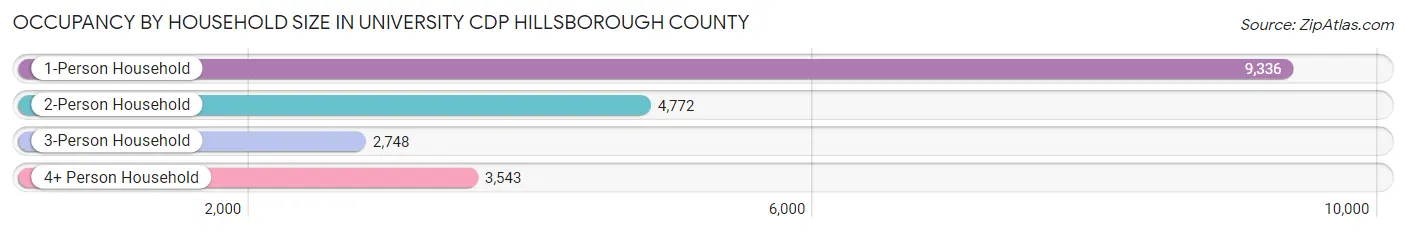
| Household Size | # Housing Units | % Housing Units |
| 1-Person Household | 9,336 | 45.8% |
| 2-Person Household | 4,772 | 23.4% |
| 3-Person Household | 2,748 | 13.5% |
| 4+ Person Household | 3,543 | 17.4% |
| Total Housing Units | 20,399 | 100.0% |
Occupancy by Ownership by Household Size in University CDP Hillsborough County
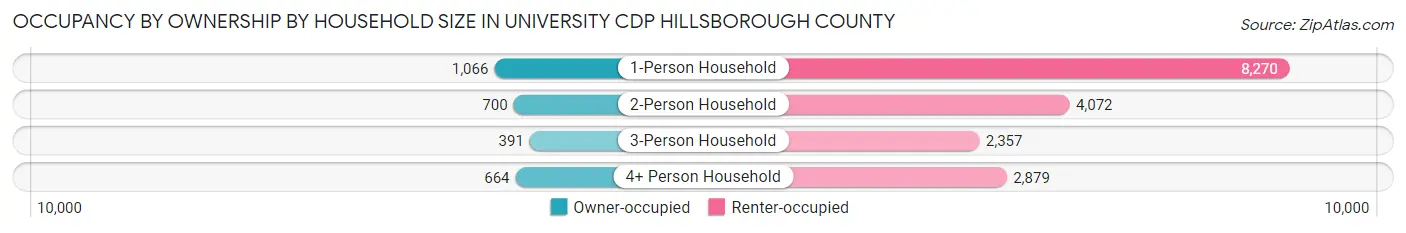
| Household Size | Owner-occupied | Renter-occupied |
| 1-Person Household | 1,066 (11.4%) | 8,270 (88.6%) |
| 2-Person Household | 700 (14.7%) | 4,072 (85.3%) |
| 3-Person Household | 391 (14.2%) | 2,357 (85.8%) |
| 4+ Person Household | 664 (18.7%) | 2,879 (81.3%) |
| Total Housing Units | 2,821 (13.8%) | 17,578 (86.2%) |
Occupancy by Educational Attainment in University CDP Hillsborough County
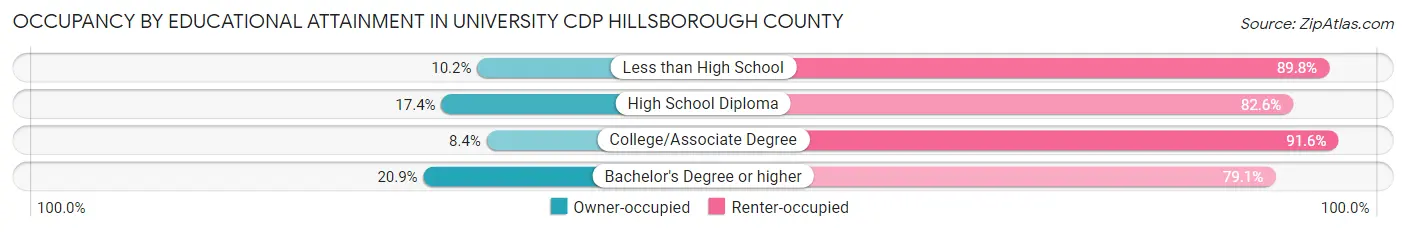
| Household Size | Owner-occupied | Renter-occupied |
| Less than High School | 311 (10.2%) | 2,725 (89.8%) |
| High School Diploma | 902 (17.4%) | 4,295 (82.6%) |
| College/Associate Degree | 626 (8.4%) | 6,846 (91.6%) |
| Bachelor's Degree or higher | 982 (20.9%) | 3,712 (79.1%) |
Occupancy by Age of Householder in University CDP Hillsborough County
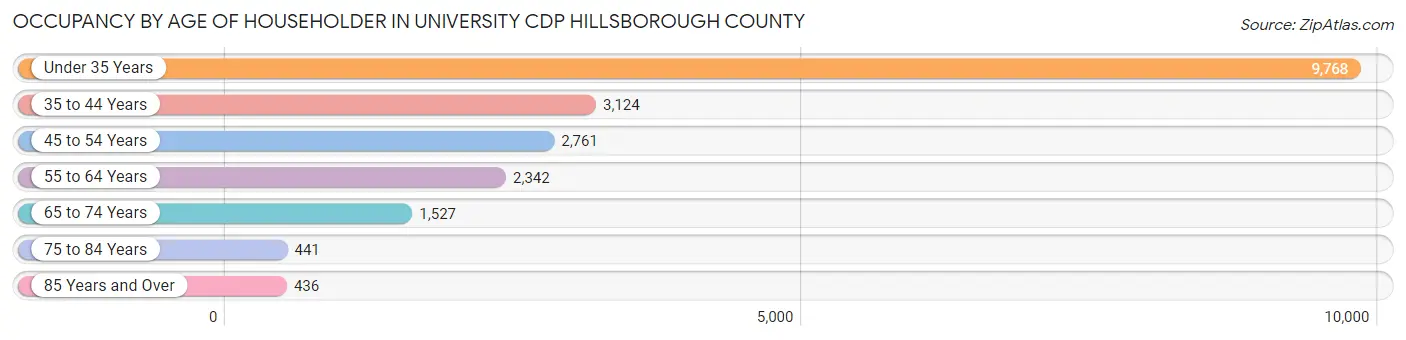
| Age Bracket | # Households | % Households |
| Under 35 Years | 9,768 | 47.9% |
| 35 to 44 Years | 3,124 | 15.3% |
| 45 to 54 Years | 2,761 | 13.5% |
| 55 to 64 Years | 2,342 | 11.5% |
| 65 to 74 Years | 1,527 | 7.5% |
| 75 to 84 Years | 441 | 2.2% |
| 85 Years and Over | 436 | 2.1% |
| Total | 20,399 | 100.0% |
Housing Finances in University CDP Hillsborough County
Median Income by Occupancy in University CDP Hillsborough County
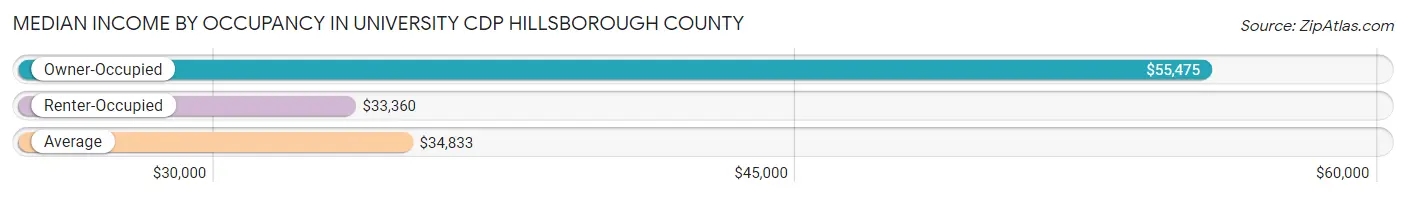
| Occupancy Type | # Households | Median Income |
| Owner-Occupied | 2,821 (13.8%) | $55,475 |
| Renter-Occupied | 17,578 (86.2%) | $33,360 |
| Average | 20,399 (100.0%) | $34,833 |
Occupancy by Householder Income Bracket in University CDP Hillsborough County
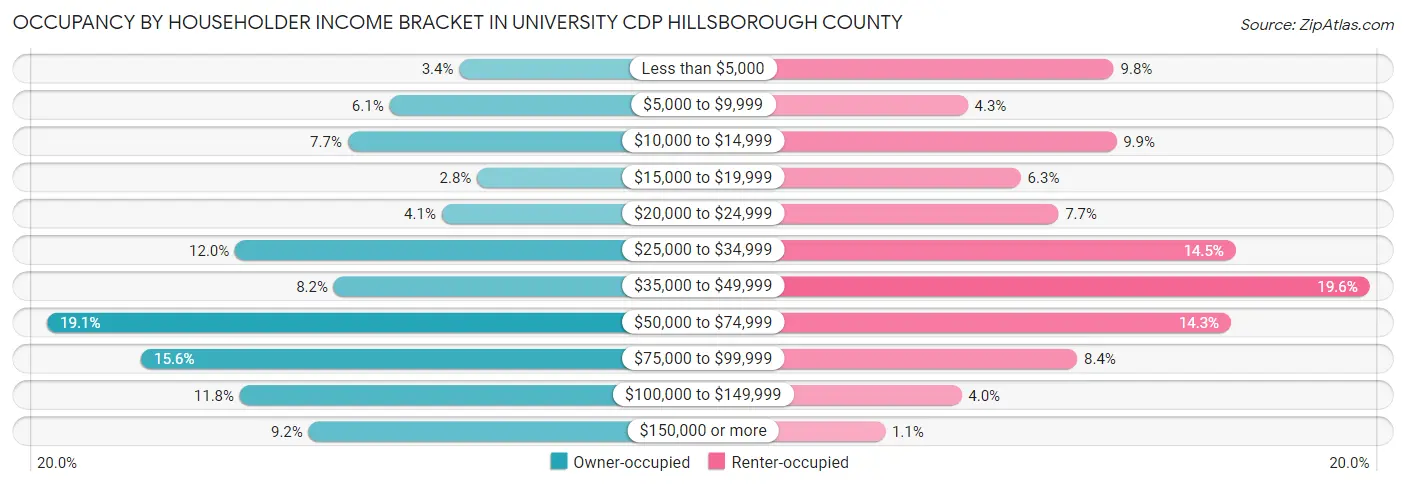
| Income Bracket | Owner-occupied | Renter-occupied |
| Less than $5,000 | 97 (3.4%) | 1,728 (9.8%) |
| $5,000 to $9,999 | 172 (6.1%) | 751 (4.3%) |
| $10,000 to $14,999 | 217 (7.7%) | 1,746 (9.9%) |
| $15,000 to $19,999 | 78 (2.8%) | 1,106 (6.3%) |
| $20,000 to $24,999 | 116 (4.1%) | 1,357 (7.7%) |
| $25,000 to $34,999 | 338 (12.0%) | 2,545 (14.5%) |
| $35,000 to $49,999 | 232 (8.2%) | 3,442 (19.6%) |
| $50,000 to $74,999 | 540 (19.1%) | 2,514 (14.3%) |
| $75,000 to $99,999 | 439 (15.6%) | 1,484 (8.4%) |
| $100,000 to $149,999 | 333 (11.8%) | 709 (4.0%) |
| $150,000 or more | 259 (9.2%) | 196 (1.1%) |
| Total | 2,821 (100.0%) | 17,578 (100.0%) |
Monthly Housing Cost Tiers in University CDP Hillsborough County
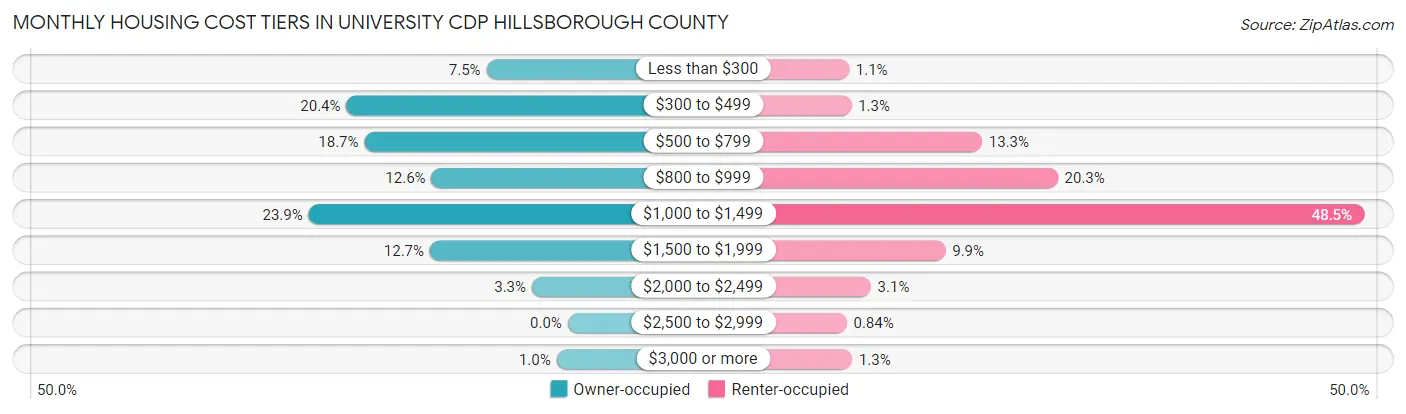
| Monthly Cost | Owner-occupied | Renter-occupied |
| Less than $300 | 211 (7.5%) | 185 (1.1%) |
| $300 to $499 | 575 (20.4%) | 224 (1.3%) |
| $500 to $799 | 528 (18.7%) | 2,338 (13.3%) |
| $800 to $999 | 354 (12.6%) | 3,563 (20.3%) |
| $1,000 to $1,499 | 673 (23.9%) | 8,519 (48.5%) |
| $1,500 to $1,999 | 358 (12.7%) | 1,746 (9.9%) |
| $2,000 to $2,499 | 93 (3.3%) | 538 (3.1%) |
| $2,500 to $2,999 | 0 (0.0%) | 147 (0.8%) |
| $3,000 or more | 29 (1.0%) | 235 (1.3%) |
| Total | 2,821 (100.0%) | 17,578 (100.0%) |
Physical Housing Characteristics in University CDP Hillsborough County
Housing Structures in University CDP Hillsborough County
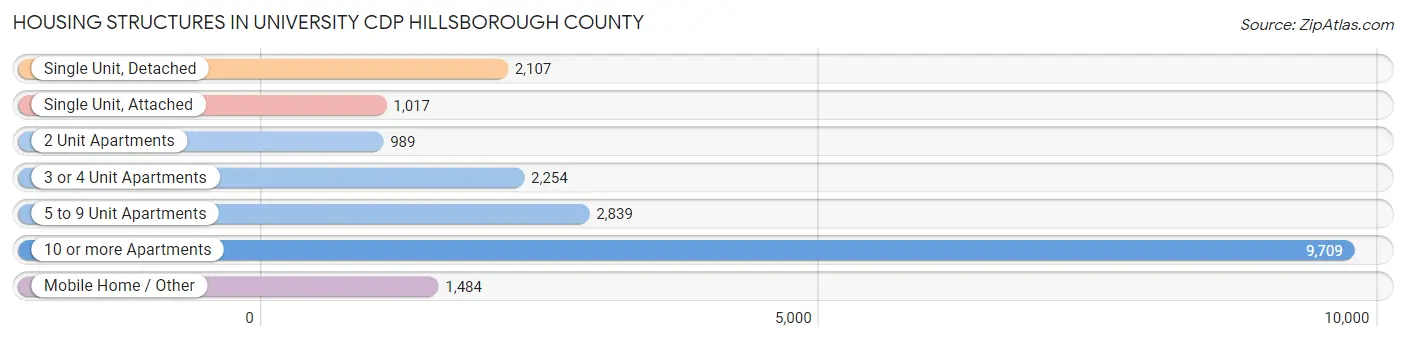
| Structure Type | # Housing Units | % Housing Units |
| Single Unit, Detached | 2,107 | 10.3% |
| Single Unit, Attached | 1,017 | 5.0% |
| 2 Unit Apartments | 989 | 4.9% |
| 3 or 4 Unit Apartments | 2,254 | 11.1% |
| 5 to 9 Unit Apartments | 2,839 | 13.9% |
| 10 or more Apartments | 9,709 | 47.6% |
| Mobile Home / Other | 1,484 | 7.3% |
| Total | 20,399 | 100.0% |
Housing Structures by Occupancy in University CDP Hillsborough County
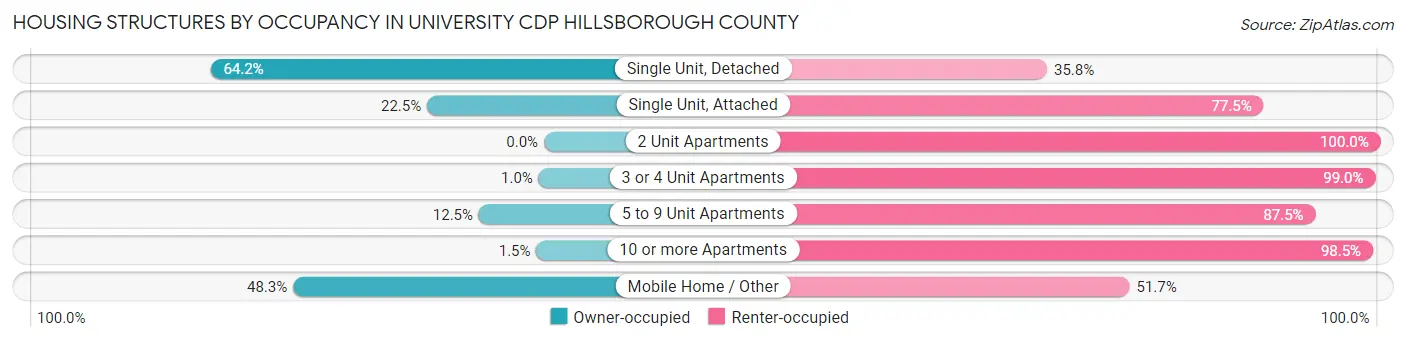
| Structure Type | Owner-occupied | Renter-occupied |
| Single Unit, Detached | 1,353 (64.2%) | 754 (35.8%) |
| Single Unit, Attached | 229 (22.5%) | 788 (77.5%) |
| 2 Unit Apartments | 0 (0.0%) | 989 (100.0%) |
| 3 or 4 Unit Apartments | 23 (1.0%) | 2,231 (99.0%) |
| 5 to 9 Unit Apartments | 356 (12.5%) | 2,483 (87.5%) |
| 10 or more Apartments | 143 (1.5%) | 9,566 (98.5%) |
| Mobile Home / Other | 717 (48.3%) | 767 (51.7%) |
| Total | 2,821 (13.8%) | 17,578 (86.2%) |
Housing Structures by Number of Rooms in University CDP Hillsborough County
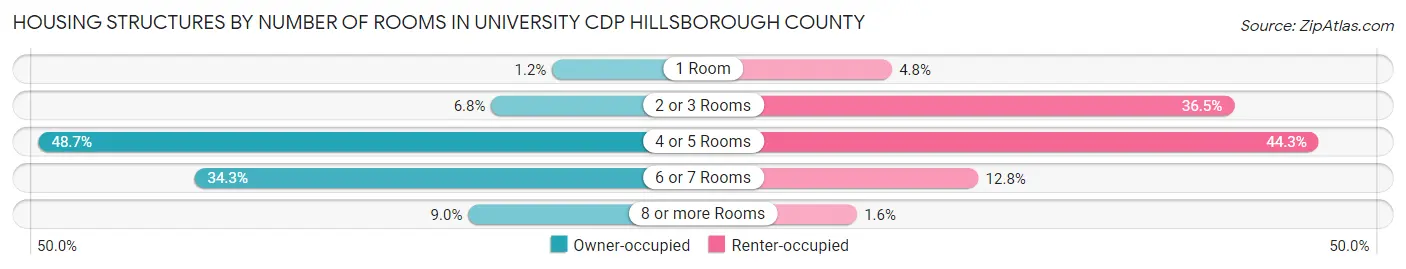
| Number of Rooms | Owner-occupied | Renter-occupied |
| 1 Room | 34 (1.2%) | 851 (4.8%) |
| 2 or 3 Rooms | 193 (6.8%) | 6,408 (36.4%) |
| 4 or 5 Rooms | 1,374 (48.7%) | 7,781 (44.3%) |
| 6 or 7 Rooms | 967 (34.3%) | 2,256 (12.8%) |
| 8 or more Rooms | 253 (9.0%) | 282 (1.6%) |
| Total | 2,821 (100.0%) | 17,578 (100.0%) |
Housing Structure by Heating Type in University CDP Hillsborough County
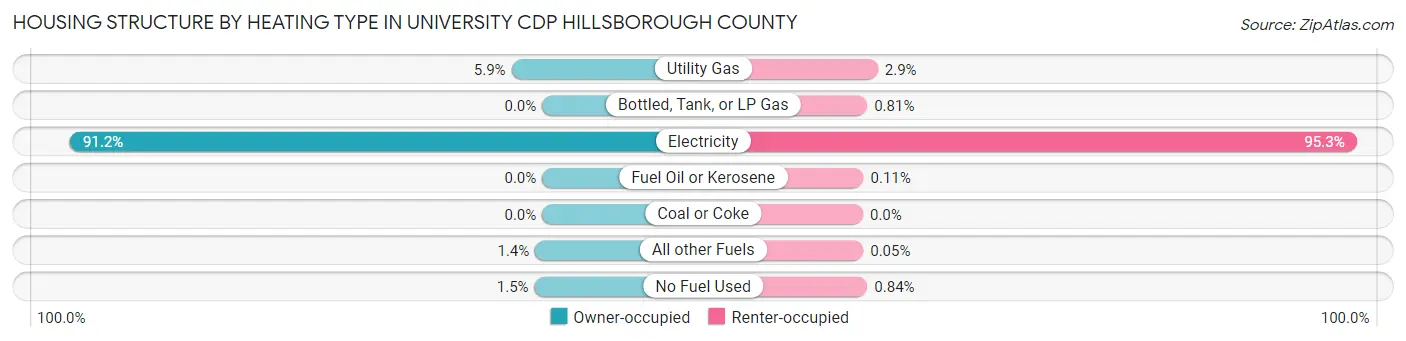
| Heating Type | Owner-occupied | Renter-occupied |
| Utility Gas | 167 (5.9%) | 503 (2.9%) |
| Bottled, Tank, or LP Gas | 0 (0.0%) | 142 (0.8%) |
| Electricity | 2,574 (91.2%) | 16,758 (95.3%) |
| Fuel Oil or Kerosene | 0 (0.0%) | 20 (0.1%) |
| Coal or Coke | 0 (0.0%) | 0 (0.0%) |
| All other Fuels | 38 (1.3%) | 8 (0.1%) |
| No Fuel Used | 42 (1.5%) | 147 (0.8%) |
| Total | 2,821 (100.0%) | 17,578 (100.0%) |
Household Vehicle Usage in University CDP Hillsborough County
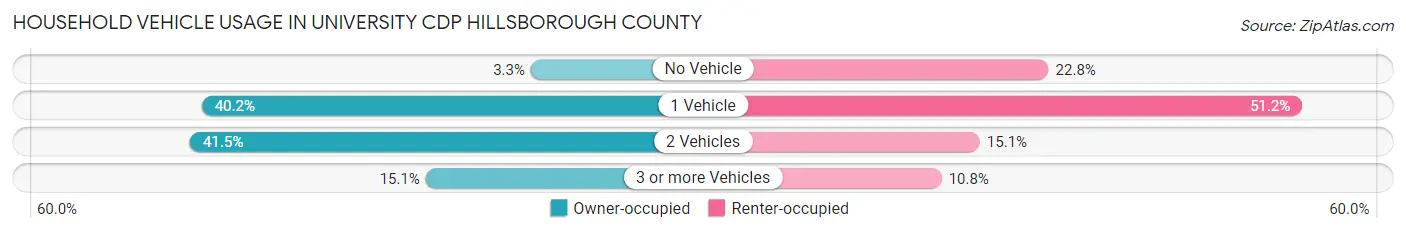
| Vehicles per Household | Owner-occupied | Renter-occupied |
| No Vehicle | 93 (3.3%) | 4,011 (22.8%) |
| 1 Vehicle | 1,133 (40.2%) | 9,003 (51.2%) |
| 2 Vehicles | 1,170 (41.5%) | 2,658 (15.1%) |
| 3 or more Vehicles | 425 (15.1%) | 1,906 (10.8%) |
| Total | 2,821 (100.0%) | 17,578 (100.0%) |
Real Estate & Mortgages in University CDP Hillsborough County
Real Estate and Mortgage Overview in University CDP Hillsborough County
| Characteristic | Without Mortgage | With Mortgage |
| Housing Units | 1,500 | 1,321 |
| Median Property Value | $108,200 | $176,300 |
| Median Household Income | $35,724 | $153 |
| Monthly Housing Costs | $482 | $29 |
| Real Estate Taxes | $857 | $89 |
Property Value by Mortgage Status in University CDP Hillsborough County
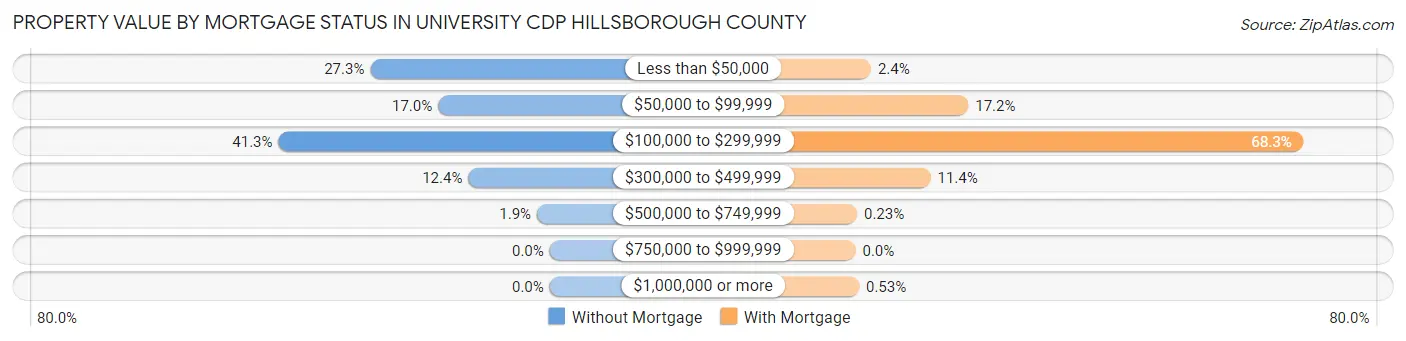
| Property Value | Without Mortgage | With Mortgage |
| Less than $50,000 | 410 (27.3%) | 31 (2.4%) |
| $50,000 to $99,999 | 255 (17.0%) | 227 (17.2%) |
| $100,000 to $299,999 | 620 (41.3%) | 902 (68.3%) |
| $300,000 to $499,999 | 186 (12.4%) | 151 (11.4%) |
| $500,000 to $749,999 | 29 (1.9%) | 3 (0.2%) |
| $750,000 to $999,999 | 0 (0.0%) | 0 (0.0%) |
| $1,000,000 or more | 0 (0.0%) | 7 (0.5%) |
| Total | 1,500 (100.0%) | 1,321 (100.0%) |
Household Income by Mortgage Status in University CDP Hillsborough County
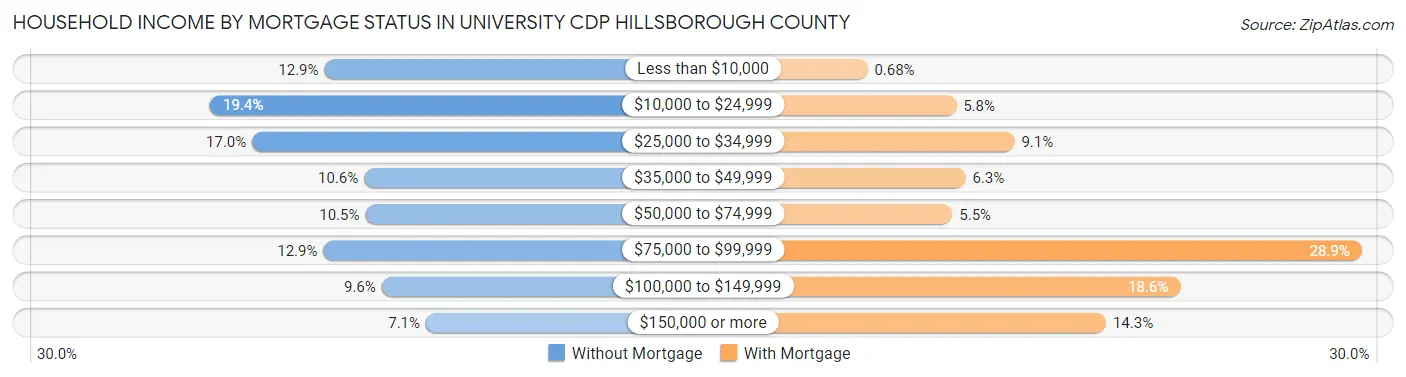
| Household Income | Without Mortgage | With Mortgage |
| Less than $10,000 | 193 (12.9%) | 9 (0.7%) |
| $10,000 to $24,999 | 291 (19.4%) | 76 (5.8%) |
| $25,000 to $34,999 | 255 (17.0%) | 120 (9.1%) |
| $35,000 to $49,999 | 159 (10.6%) | 83 (6.3%) |
| $50,000 to $74,999 | 158 (10.5%) | 73 (5.5%) |
| $75,000 to $99,999 | 194 (12.9%) | 382 (28.9%) |
| $100,000 to $149,999 | 144 (9.6%) | 245 (18.5%) |
| $150,000 or more | 106 (7.1%) | 189 (14.3%) |
| Total | 1,500 (100.0%) | 1,321 (100.0%) |
Property Value to Household Income Ratio in University CDP Hillsborough County
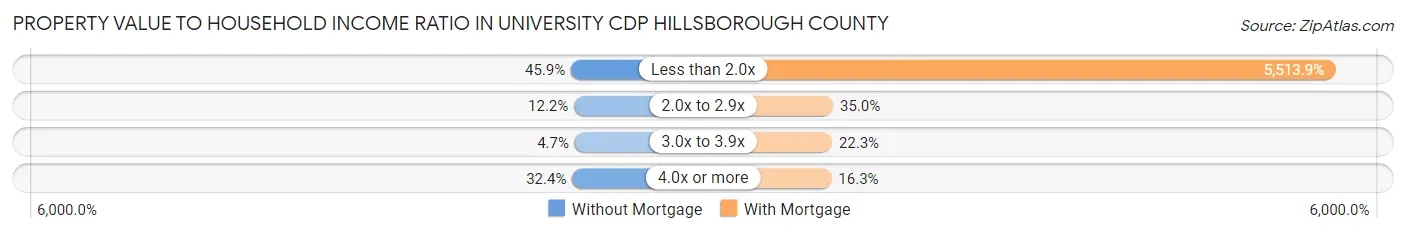
| Value-to-Income Ratio | Without Mortgage | With Mortgage |
| Less than 2.0x | 689 (45.9%) | 72,838 (5,513.9%) |
| 2.0x to 2.9x | 183 (12.2%) | 462 (35.0%) |
| 3.0x to 3.9x | 71 (4.7%) | 294 (22.3%) |
| 4.0x or more | 486 (32.4%) | 215 (16.3%) |
| Total | 1,500 (100.0%) | 1,321 (100.0%) |
Real Estate Taxes by Mortgage Status in University CDP Hillsborough County
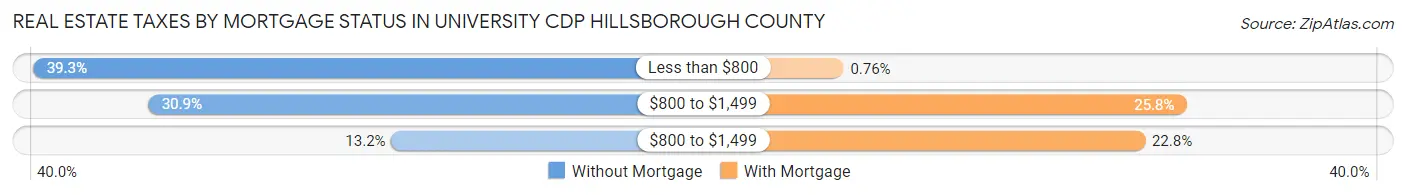
| Property Taxes | Without Mortgage | With Mortgage |
| Less than $800 | 590 (39.3%) | 10 (0.8%) |
| $800 to $1,499 | 464 (30.9%) | 341 (25.8%) |
| $800 to $1,499 | 198 (13.2%) | 301 (22.8%) |
| Total | 1,500 (100.0%) | 1,321 (100.0%) |
Health & Disability in University CDP Hillsborough County
Health Insurance Coverage by Age in University CDP Hillsborough County
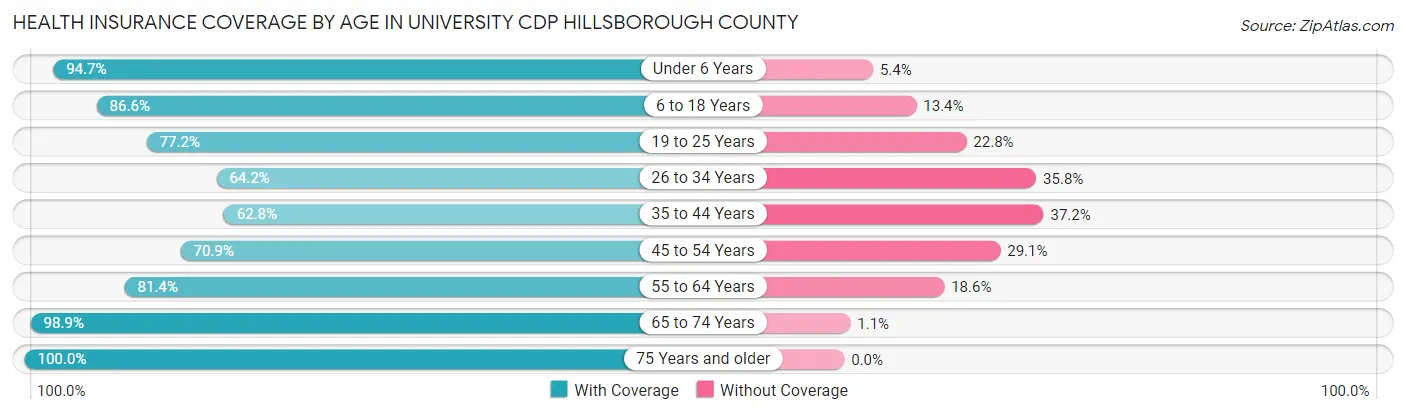
| Age Bracket | With Coverage | Without Coverage |
| Under 6 Years | 3,292 (94.7%) | 186 (5.3%) |
| 6 to 18 Years | 5,733 (86.6%) | 890 (13.4%) |
| 19 to 25 Years | 10,322 (77.2%) | 3,044 (22.8%) |
| 26 to 34 Years | 4,939 (64.2%) | 2,752 (35.8%) |
| 35 to 44 Years | 3,444 (62.8%) | 2,037 (37.2%) |
| 45 to 54 Years | 3,152 (70.9%) | 1,293 (29.1%) |
| 55 to 64 Years | 2,790 (81.4%) | 639 (18.6%) |
| 65 to 74 Years | 2,270 (98.9%) | 26 (1.1%) |
| 75 Years and older | 1,202 (100.0%) | 0 (0.0%) |
| Total | 37,144 (77.4%) | 10,867 (22.6%) |
Health Insurance Coverage by Citizenship Status in University CDP Hillsborough County
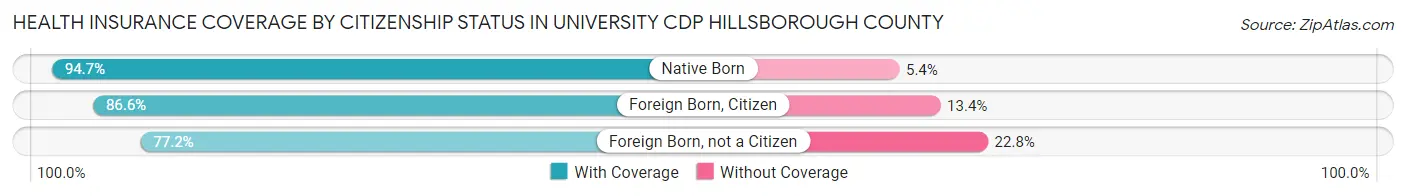
| Citizenship Status | With Coverage | Without Coverage |
| Native Born | 3,292 (94.7%) | 186 (5.3%) |
| Foreign Born, Citizen | 5,733 (86.6%) | 890 (13.4%) |
| Foreign Born, not a Citizen | 10,322 (77.2%) | 3,044 (22.8%) |
Health Insurance Coverage by Household Income in University CDP Hillsborough County
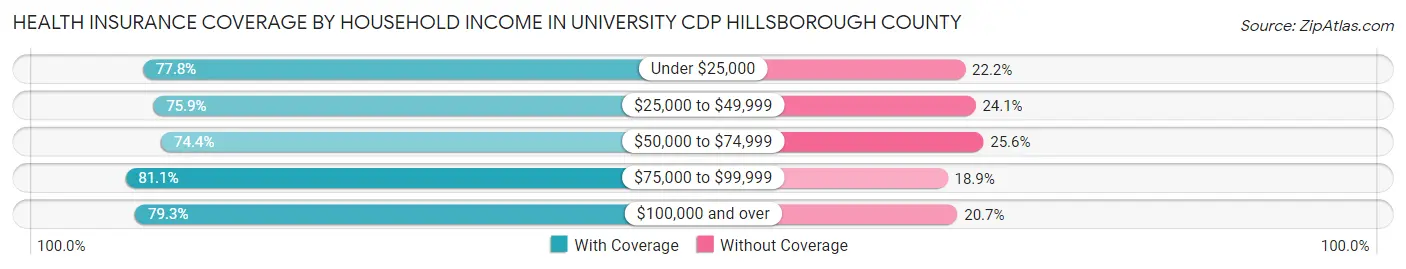
| Household Income | With Coverage | Without Coverage |
| Under $25,000 | 10,143 (77.8%) | 2,890 (22.2%) |
| $25,000 to $49,999 | 11,063 (75.9%) | 3,513 (24.1%) |
| $50,000 to $74,999 | 5,809 (74.4%) | 1,997 (25.6%) |
| $75,000 to $99,999 | 4,638 (81.1%) | 1,079 (18.9%) |
| $100,000 and over | 4,843 (79.3%) | 1,264 (20.7%) |
Public vs Private Health Insurance Coverage by Age in University CDP Hillsborough County
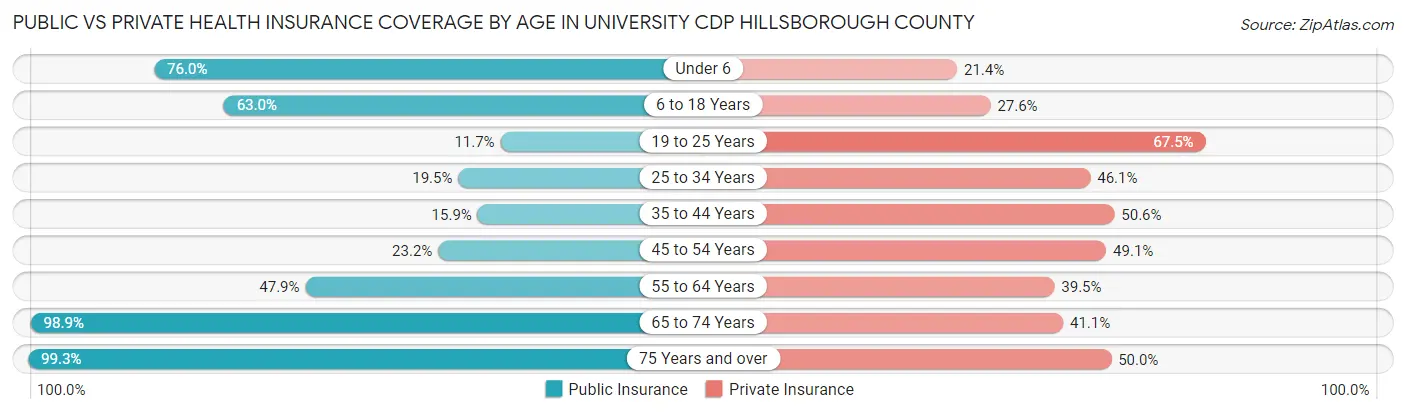
| Age Bracket | Public Insurance | Private Insurance |
| Under 6 | 2,642 (76.0%) | 744 (21.4%) |
| 6 to 18 Years | 4,175 (63.0%) | 1,827 (27.6%) |
| 19 to 25 Years | 1,561 (11.7%) | 9,021 (67.5%) |
| 25 to 34 Years | 1,500 (19.5%) | 3,547 (46.1%) |
| 35 to 44 Years | 872 (15.9%) | 2,773 (50.6%) |
| 45 to 54 Years | 1,033 (23.2%) | 2,181 (49.1%) |
| 55 to 64 Years | 1,642 (47.9%) | 1,353 (39.5%) |
| 65 to 74 Years | 2,270 (98.9%) | 943 (41.1%) |
| 75 Years and over | 1,194 (99.3%) | 601 (50.0%) |
| Total | 16,889 (35.2%) | 22,990 (47.9%) |
Disability Status by Sex by Age in University CDP Hillsborough County
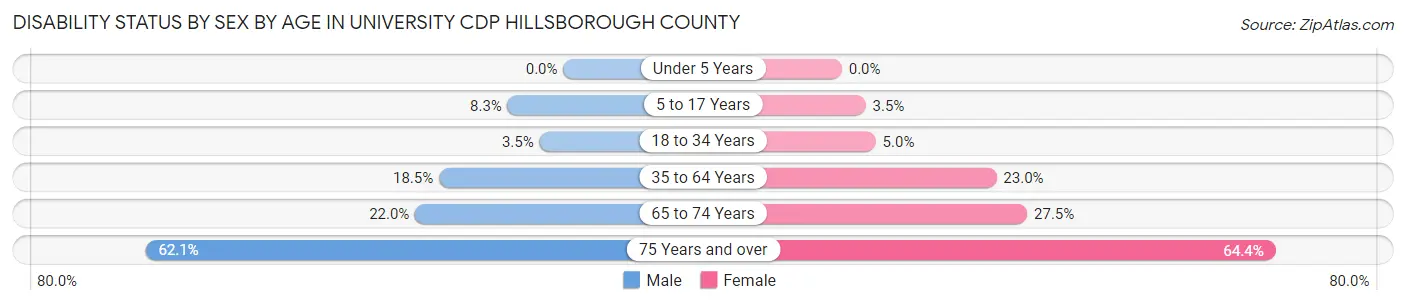
| Age Bracket | Male | Female |
| Under 5 Years | 0 (0.0%) | 0 (0.0%) |
| 5 to 17 Years | 283 (8.3%) | 98 (3.5%) |
| 18 to 34 Years | 396 (3.5%) | 540 (5.0%) |
| 35 to 64 Years | 1,199 (18.5%) | 1,575 (23.0%) |
| 65 to 74 Years | 235 (22.0%) | 338 (27.5%) |
| 75 Years and over | 242 (62.1%) | 523 (64.4%) |
Disability Class by Sex by Age in University CDP Hillsborough County
Disability Class: Hearing Difficulty
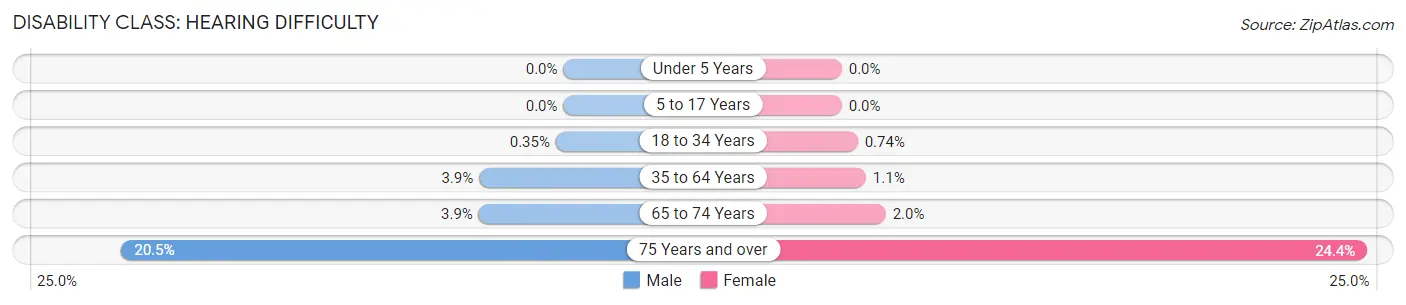
| Age Bracket | Male | Female |
| Under 5 Years | 0 (0.0%) | 0 (0.0%) |
| 5 to 17 Years | 0 (0.0%) | 0 (0.0%) |
| 18 to 34 Years | 39 (0.4%) | 80 (0.7%) |
| 35 to 64 Years | 254 (3.9%) | 77 (1.1%) |
| 65 to 74 Years | 42 (3.9%) | 25 (2.0%) |
| 75 Years and over | 80 (20.5%) | 198 (24.4%) |
Disability Class: Vision Difficulty
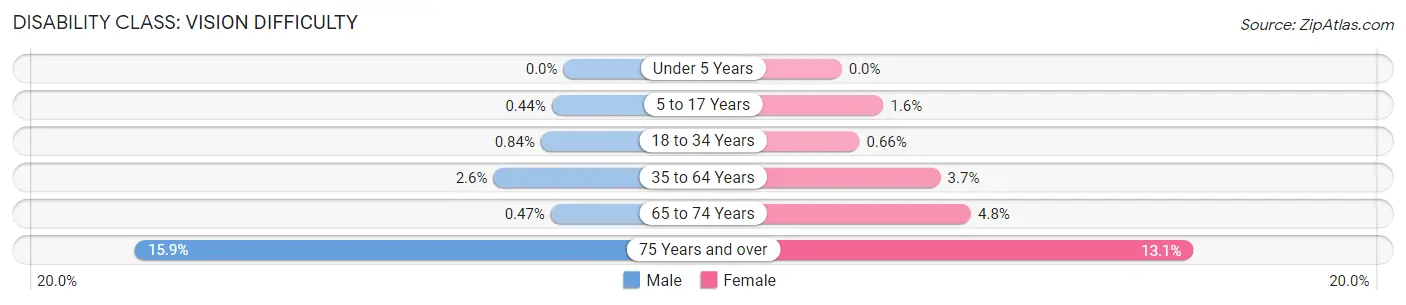
| Age Bracket | Male | Female |
| Under 5 Years | 0 (0.0%) | 0 (0.0%) |
| 5 to 17 Years | 15 (0.4%) | 43 (1.5%) |
| 18 to 34 Years | 94 (0.8%) | 71 (0.7%) |
| 35 to 64 Years | 169 (2.6%) | 252 (3.7%) |
| 65 to 74 Years | 5 (0.5%) | 59 (4.8%) |
| 75 Years and over | 62 (15.9%) | 106 (13.1%) |
Disability Class: Cognitive Difficulty
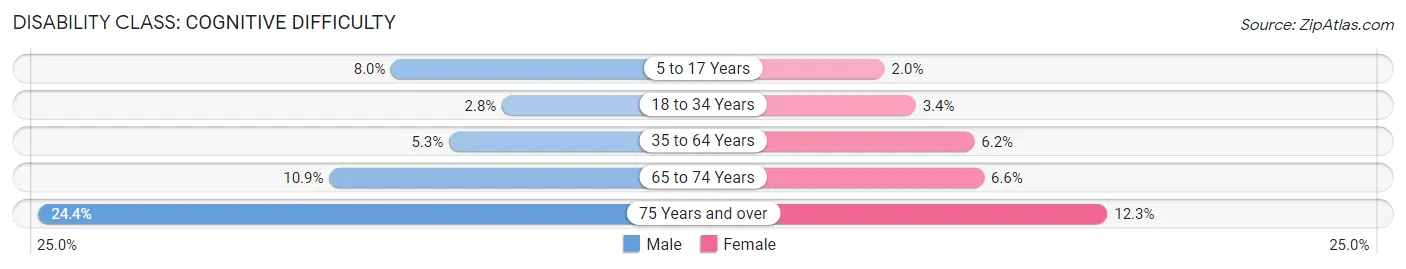
| Age Bracket | Male | Female |
| 5 to 17 Years | 273 (8.0%) | 55 (2.0%) |
| 18 to 34 Years | 317 (2.8%) | 368 (3.4%) |
| 35 to 64 Years | 344 (5.3%) | 422 (6.1%) |
| 65 to 74 Years | 116 (10.9%) | 81 (6.6%) |
| 75 Years and over | 95 (24.4%) | 100 (12.3%) |
Disability Class: Ambulatory Difficulty
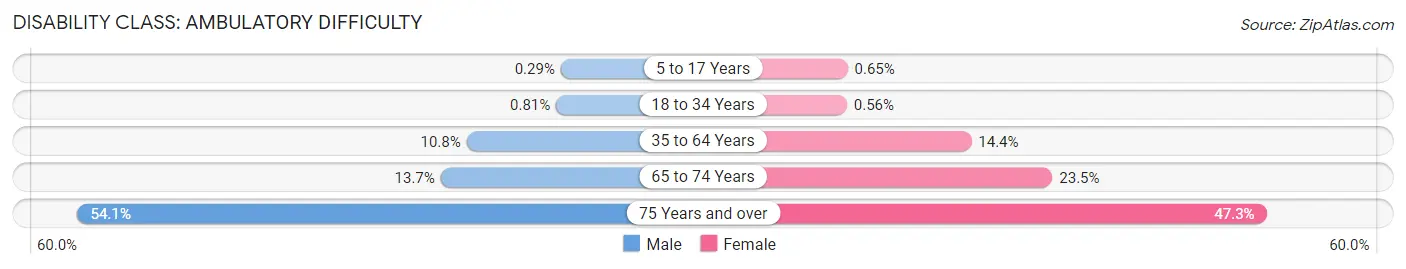
| Age Bracket | Male | Female |
| 5 to 17 Years | 10 (0.3%) | 18 (0.6%) |
| 18 to 34 Years | 91 (0.8%) | 60 (0.6%) |
| 35 to 64 Years | 700 (10.8%) | 990 (14.4%) |
| 65 to 74 Years | 146 (13.7%) | 288 (23.4%) |
| 75 Years and over | 211 (54.1%) | 384 (47.3%) |
Disability Class: Self-Care Difficulty
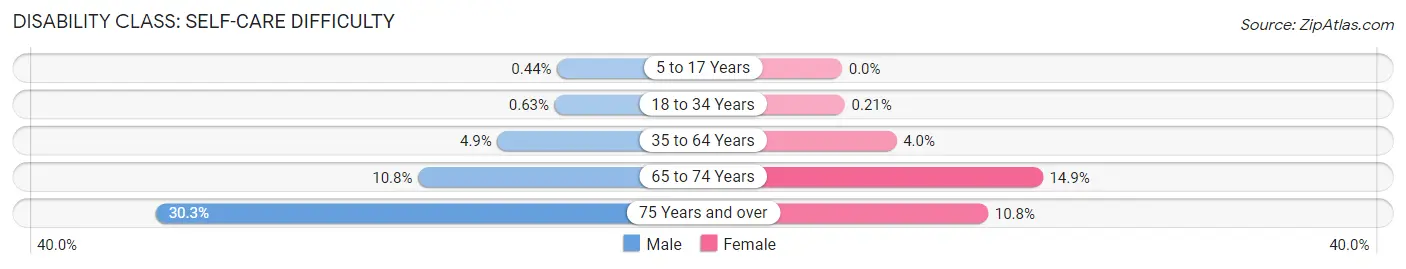
| Age Bracket | Male | Female |
| 5 to 17 Years | 15 (0.4%) | 0 (0.0%) |
| 18 to 34 Years | 70 (0.6%) | 23 (0.2%) |
| 35 to 64 Years | 317 (4.9%) | 277 (4.0%) |
| 65 to 74 Years | 115 (10.8%) | 183 (14.9%) |
| 75 Years and over | 118 (30.3%) | 88 (10.8%) |
Technology Access in University CDP Hillsborough County
Computing Device Access in University CDP Hillsborough County
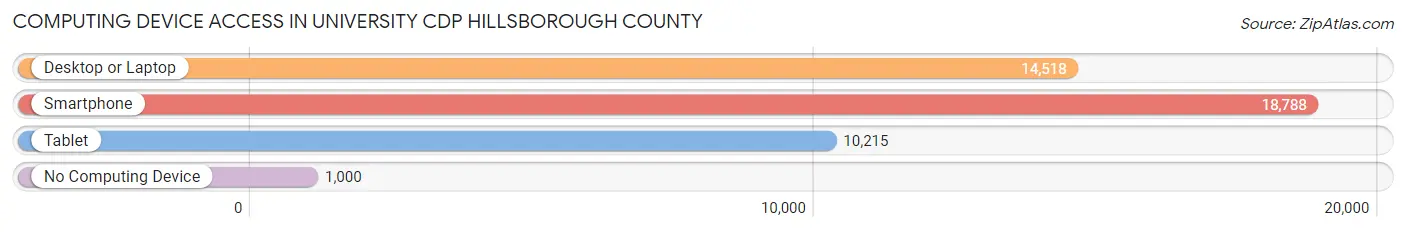
| Device Type | # Households | % Households |
| Desktop or Laptop | 14,518 | 71.2% |
| Smartphone | 18,788 | 92.1% |
| Tablet | 10,215 | 50.1% |
| No Computing Device | 1,000 | 4.9% |
| Total | 20,399 | 100.0% |
Internet Access in University CDP Hillsborough County
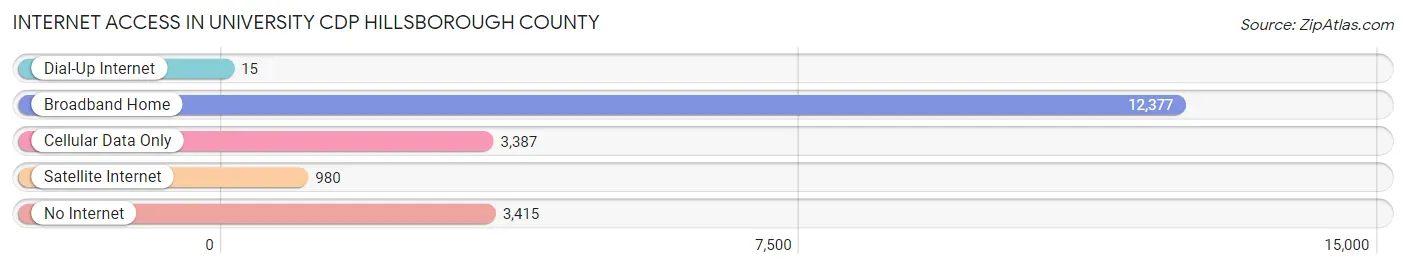
| Internet Type | # Households | % Households |
| Dial-Up Internet | 15 | 0.1% |
| Broadband Home | 12,377 | 60.7% |
| Cellular Data Only | 3,387 | 16.6% |
| Satellite Internet | 980 | 4.8% |
| No Internet | 3,415 | 16.7% |
| Total | 20,399 | 100.0% |
University CDP Hillsborough County Summary
University Cdp Hillsborough County, FL is a census-designated place (CDP) located in Hillsborough County, Florida. The CDP is located in the Tampa-St. Petersburg-Clearwater metropolitan area and is part of the Tampa-St. Petersburg-Clearwater Metropolitan Statistical Area. As of the 2010 census, the population of University Cdp Hillsborough County, FL was 8,945.
History
University Cdp Hillsborough County, FL was first settled in the late 19th century. The area was originally part of the larger Hillsborough County, which was established in 1834. The area was initially used for farming and ranching, but by the early 20th century, the area had become a popular destination for students attending the University of South Florida. The area was officially designated as a CDP in the 2000 census.
Geography
University Cdp Hillsborough County, FL is located in Hillsborough County, Florida. The CDP is located in the Tampa-St. Petersburg-Clearwater metropolitan area and is part of the Tampa-St. Petersburg-Clearwater Metropolitan Statistical Area. The CDP has a total area of 4.3 square miles, all of which is land.
Economy
University Cdp Hillsborough County, FL has a diverse economy. The area is home to a number of businesses, including retail stores, restaurants, and professional services. The University of South Florida is also located in the CDP, providing a significant source of employment for the area.
Demographics
As of the 2010 census, there were 8,945 people, 3,845 households, and 2,072 families residing in University Cdp Hillsborough County, FL. The population density was 2,072.3 people per square mile. The racial makeup of the CDP was 79.2% White, 8.3% African American, 0.3% Native American, 5.2% Asian, 0.1% Pacific Islander, 4.2% from other races, and 2.7% from two or more races. Hispanic or Latino of any race were 15.3% of the population.
The median income for a household in the CDP was $37,917, and the median income for a family was $50,917. Males had a median income of $35,917 versus $30,917 for females. The per capita income for the CDP was $20,917. About 11.2% of families and 16.3% of the population were below the poverty line, including 22.3% of those under age 18 and 8.3% of those age 65 or over.
Common Questions
What is Per Capita Income in University CDP Hillsborough County?
Per Capita income in University CDP Hillsborough County is $20,095.
What is the Median Family Income in University CDP Hillsborough County?
Median Family Income in University CDP Hillsborough County is $42,746.
What is the Median Household income in University CDP Hillsborough County?
Median Household Income in University CDP Hillsborough County is $34,833.
What is Income or Wage Gap in University CDP Hillsborough County?
Income or Wage Gap in University CDP Hillsborough County is 9.2%.
Women in University CDP Hillsborough County earn 90.8 cents for every dollar earned by a man.
What is Family Income Deficit in University CDP Hillsborough County?
Family Income Deficit in University CDP Hillsborough County is $10,806.
Families that are below poverty line in University CDP Hillsborough County earn $10,806 less on average than the poverty threshold level.
What is Inequality or Gini Index in University CDP Hillsborough County?
Inequality or Gini Index in University CDP Hillsborough County is 0.45.
What is the Total Population of University CDP Hillsborough County?
Total Population of University CDP Hillsborough County is 49,148.
What is the Total Male Population of University CDP Hillsborough County?
Total Male Population of University CDP Hillsborough County is 24,507.
What is the Total Female Population of University CDP Hillsborough County?
Total Female Population of University CDP Hillsborough County is 24,641.
What is the Ratio of Males per 100 Females in University CDP Hillsborough County?
There are 99.46 Males per 100 Females in University CDP Hillsborough County.
What is the Ratio of Females per 100 Males in University CDP Hillsborough County?
There are 100.55 Females per 100 Males in University CDP Hillsborough County.
What is the Median Population Age in University CDP Hillsborough County?
Median Population Age in University CDP Hillsborough County is 27.1 Years.
What is the Average Family Size in University CDP Hillsborough County
Average Family Size in University CDP Hillsborough County is 3.4 People.
What is the Average Household Size in University CDP Hillsborough County
Average Household Size in University CDP Hillsborough County is 2.3 People.
How Large is the Labor Force in University CDP Hillsborough County?
There are 25,965 People in the Labor Forcein in University CDP Hillsborough County.
What is the Percentage of People in the Labor Force in University CDP Hillsborough County?
63.7% of People are in the Labor Force in University CDP Hillsborough County.
What is the Unemployment Rate in University CDP Hillsborough County?
Unemployment Rate in University CDP Hillsborough County is 6.0%.