South Fulton, GA Map & Demographics
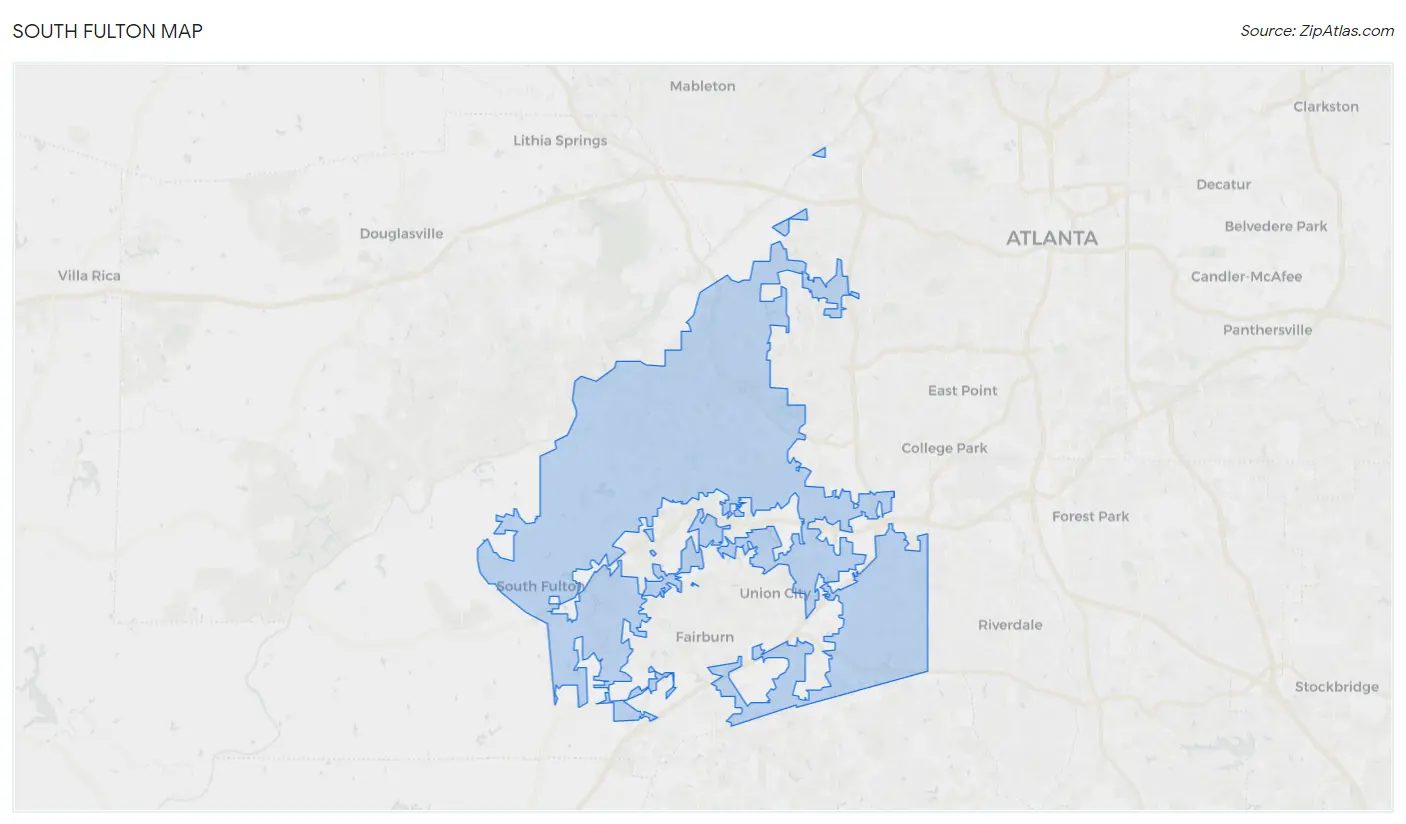
South Fulton Map
South Fulton Overview
$36,153
PER CAPITA INCOME
$92,810
AVG FAMILY INCOME
$77,488
AVG HOUSEHOLD INCOME
13.6%
WAGE / INCOME GAP [ % ]
86.4¢/ $1
WAGE / INCOME GAP [ $ ]
$14,199
FAMILY INCOME DEFICIT
0.42
INEQUALITY / GINI INDEX
107,865
TOTAL POPULATION
49,261
MALE POPULATION
58,604
FEMALE POPULATION
84.06
MALES / 100 FEMALES
118.97
FEMALES / 100 MALES
37.1
MEDIAN AGE
3.5
AVG FAMILY SIZE
2.7
AVG HOUSEHOLD SIZE
59,749
LABOR FORCE [ PEOPLE ]
69.8%
PERCENT IN LABOR FORCE
7.8%
UNEMPLOYMENT RATE
Income in South Fulton
Income Overview in South Fulton
Per Capita Income in South Fulton is $36,153, while median incomes of families and households are $92,810 and $77,488 respectively.
| Characteristic | Number | Measure |
| Per Capita Income | 107,865 | $36,153 |
| Median Family Income | 25,644 | $92,810 |
| Mean Family Income | 25,644 | $110,899 |
| Median Household Income | 39,600 | $77,488 |
| Mean Household Income | 39,600 | $94,926 |
| Income Deficit | 25,644 | $14,199 |
| Wage / Income Gap (%) | 107,865 | 13.57% |
| Wage / Income Gap ($) | 107,865 | 86.43¢ per $1 |
| Gini / Inequality Index | 107,865 | 0.42 |
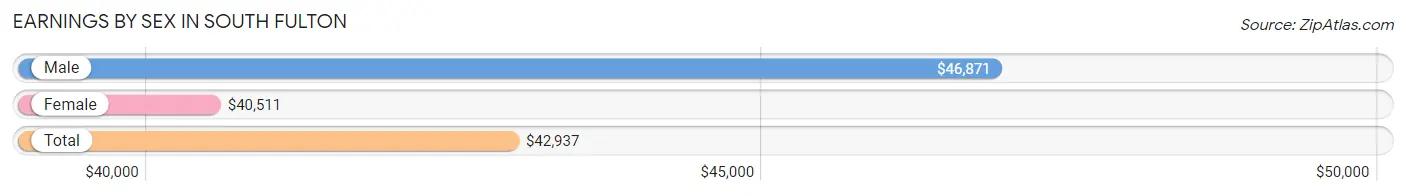
Earnings by Sex in South Fulton
Average Earnings in South Fulton are $42,937, $46,871 for men and $40,511 for women, a difference of 13.6%.
| Sex | Number | Average Earnings |
| Male | 27,132 (45.3%) | $46,871 |
| Female | 32,790 (54.7%) | $40,511 |
| Total | 59,922 (100.0%) | $42,937 |
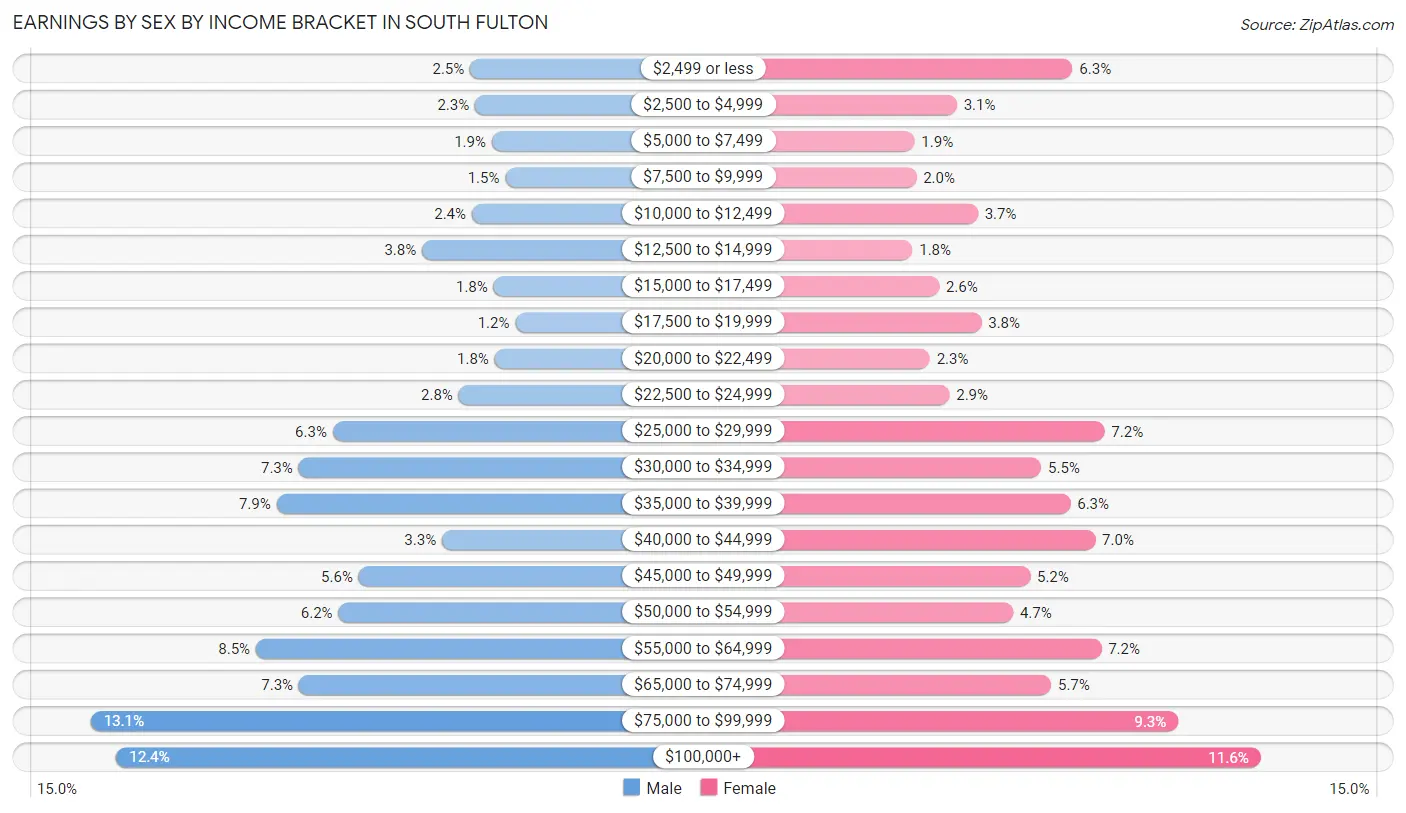
Earnings by Sex by Income Bracket in South Fulton
The most common earnings brackets in South Fulton are $75,000 to $99,999 for men (3,566 | 13.1%) and $100,000+ for women (3,815 | 11.6%).
| Income | Male | Female |
| $2,499 or less | 672 (2.5%) | 2,078 (6.3%) |
| $2,500 to $4,999 | 634 (2.3%) | 1,012 (3.1%) |
| $5,000 to $7,499 | 507 (1.9%) | 622 (1.9%) |
| $7,500 to $9,999 | 405 (1.5%) | 641 (1.9%) |
| $10,000 to $12,499 | 658 (2.4%) | 1,208 (3.7%) |
| $12,500 to $14,999 | 1,040 (3.8%) | 604 (1.8%) |
| $15,000 to $17,499 | 494 (1.8%) | 850 (2.6%) |
| $17,500 to $19,999 | 327 (1.2%) | 1,241 (3.8%) |
| $20,000 to $22,499 | 485 (1.8%) | 764 (2.3%) |
| $22,500 to $24,999 | 759 (2.8%) | 943 (2.9%) |
| $25,000 to $29,999 | 1,719 (6.3%) | 2,375 (7.2%) |
| $30,000 to $34,999 | 1,981 (7.3%) | 1,791 (5.5%) |
| $35,000 to $39,999 | 2,148 (7.9%) | 2,058 (6.3%) |
| $40,000 to $44,999 | 886 (3.3%) | 2,288 (7.0%) |
| $45,000 to $49,999 | 1,522 (5.6%) | 1,690 (5.1%) |
| $50,000 to $54,999 | 1,677 (6.2%) | 1,531 (4.7%) |
| $55,000 to $64,999 | 2,306 (8.5%) | 2,345 (7.1%) |
| $65,000 to $74,999 | 1,977 (7.3%) | 1,882 (5.7%) |
| $75,000 to $99,999 | 3,566 (13.1%) | 3,052 (9.3%) |
| $100,000+ | 3,369 (12.4%) | 3,815 (11.6%) |
| Total | 27,132 (100.0%) | 32,790 (100.0%) |
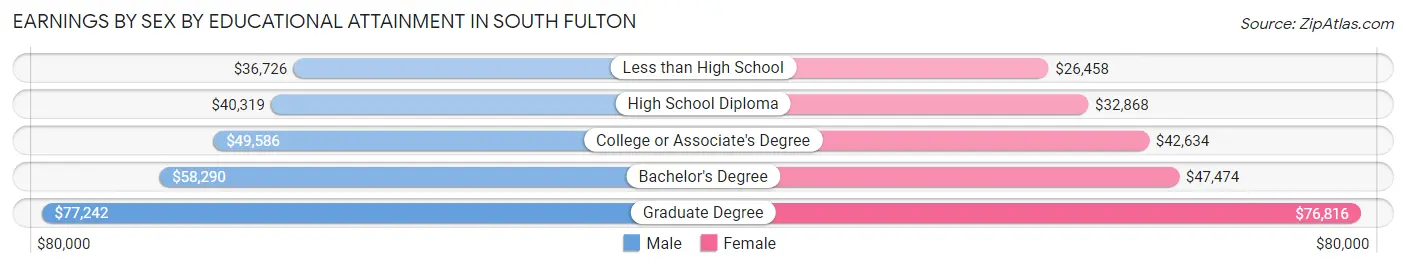
Earnings by Sex by Educational Attainment in South Fulton
Average earnings in South Fulton are $52,525 for men and $44,741 for women, a difference of 14.8%. Men with an educational attainment of graduate degree enjoy the highest average annual earnings of $77,242, while those with less than high school education earn the least with $36,726. Women with an educational attainment of graduate degree earn the most with the average annual earnings of $76,816, while those with less than high school education have the smallest earnings of $26,458.
| Educational Attainment | Male Income | Female Income |
| Less than High School | $36,726 | $26,458 |
| High School Diploma | $40,319 | $32,868 |
| College or Associate's Degree | $49,586 | $42,634 |
| Bachelor's Degree | $58,290 | $47,474 |
| Graduate Degree | $77,242 | $76,816 |
| Total | $52,525 | $44,741 |
Family Income in South Fulton
Family Income Brackets in South Fulton
According to the South Fulton family income data, there are 5,821 families falling into the $100,000 to $149,999 income range, which is the most common income bracket and makes up 22.7% of all families. Conversely, the $10,000 to $14,999 income bracket is the least frequent group with only 154 families (0.6%) belonging to this category.
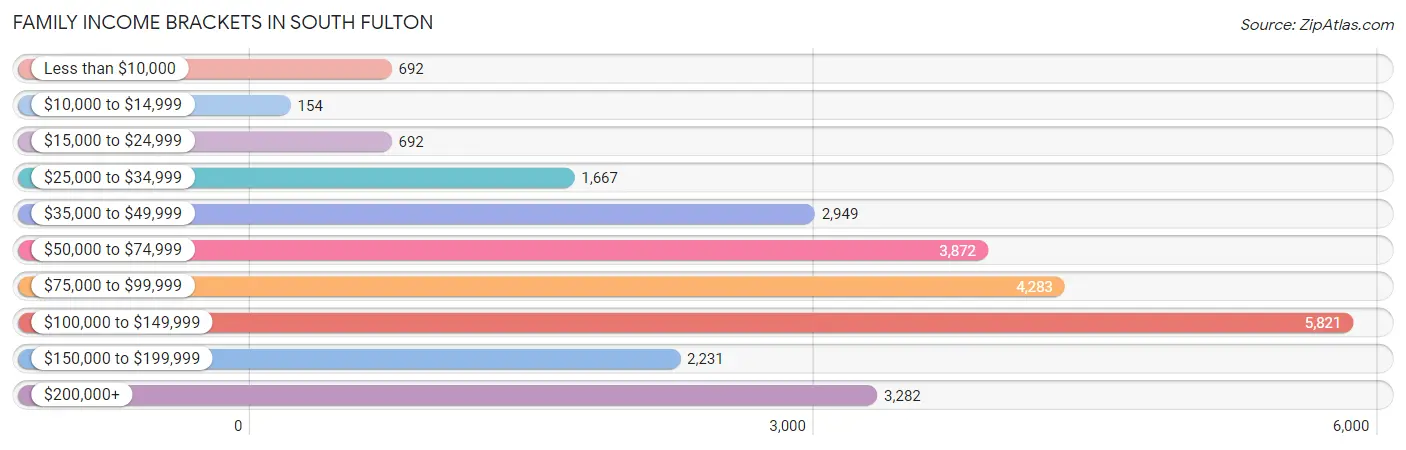
| Income Bracket | # Families | % Families |
| Less than $10,000 | 692 | 2.7% |
| $10,000 to $14,999 | 154 | 0.6% |
| $15,000 to $24,999 | 692 | 2.7% |
| $25,000 to $34,999 | 1,667 | 6.5% |
| $35,000 to $49,999 | 2,949 | 11.5% |
| $50,000 to $74,999 | 3,872 | 15.1% |
| $75,000 to $99,999 | 4,283 | 16.7% |
| $100,000 to $149,999 | 5,821 | 22.7% |
| $150,000 to $199,999 | 2,231 | 8.7% |
| $200,000+ | 3,282 | 12.8% |
Family Income by Famaliy Size in South Fulton
7+ person families (617 | 2.4%) account for the highest median family income in South Fulton with $222,864 per family, while 2-person families (9,902 | 38.6%) have the highest median income of $40,948 per family member.
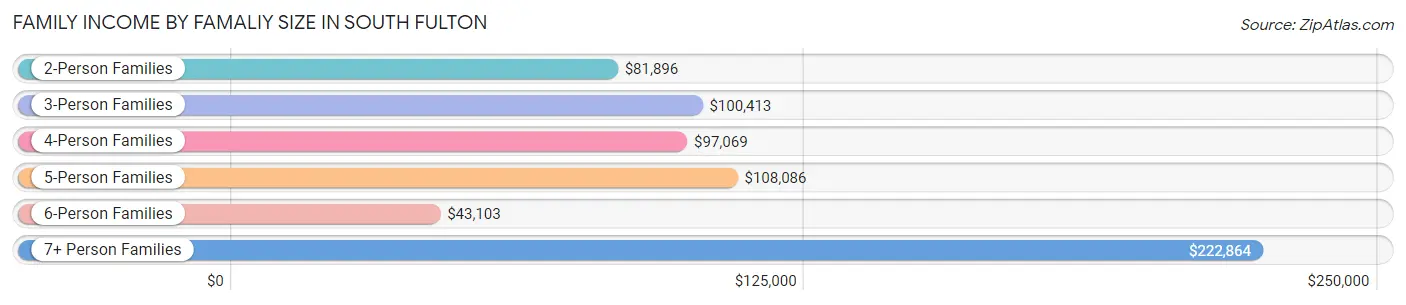
| Income Bracket | # Families | Median Income |
| 2-Person Families | 9,902 (38.6%) | $81,896 |
| 3-Person Families | 7,027 (27.4%) | $100,413 |
| 4-Person Families | 5,464 (21.3%) | $97,069 |
| 5-Person Families | 1,747 (6.8%) | $108,086 |
| 6-Person Families | 887 (3.5%) | $43,103 |
| 7+ Person Families | 617 (2.4%) | $222,864 |
| Total | 25,644 (100.0%) | $92,810 |
Family Income by Number of Earners in South Fulton
The median family income in South Fulton is $92,810, with families comprising 3+ earners (3,124) having the highest median family income of $147,500, while families with no earners (2,161) have the lowest median family income of $31,170, accounting for 12.2% and 8.4% of families, respectively.
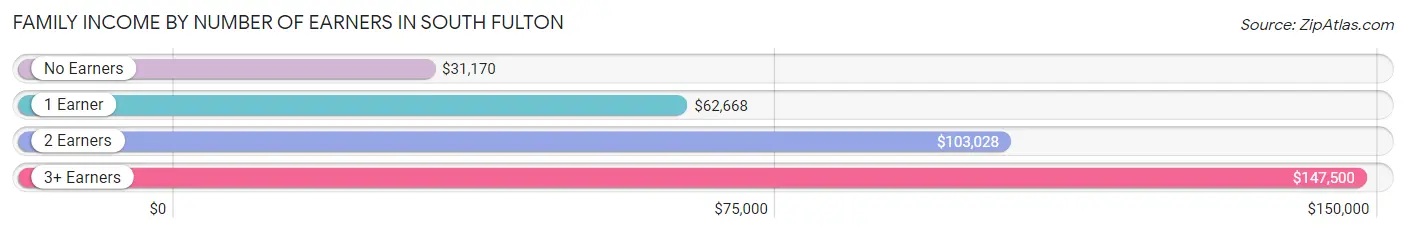
| Number of Earners | # Families | Median Income |
| No Earners | 2,161 (8.4%) | $31,170 |
| 1 Earner | 8,859 (34.5%) | $62,668 |
| 2 Earners | 11,500 (44.8%) | $103,028 |
| 3+ Earners | 3,124 (12.2%) | $147,500 |
| Total | 25,644 (100.0%) | $92,810 |
Household Income in South Fulton
Household Income Brackets in South Fulton
With 8,158 households falling in the category, the $100,000 to $149,999 income range is the most frequent in South Fulton, accounting for 20.6% of all households. In contrast, only 871 households (2.2%) fall into the $10,000 to $14,999 income bracket, making it the least populous group.
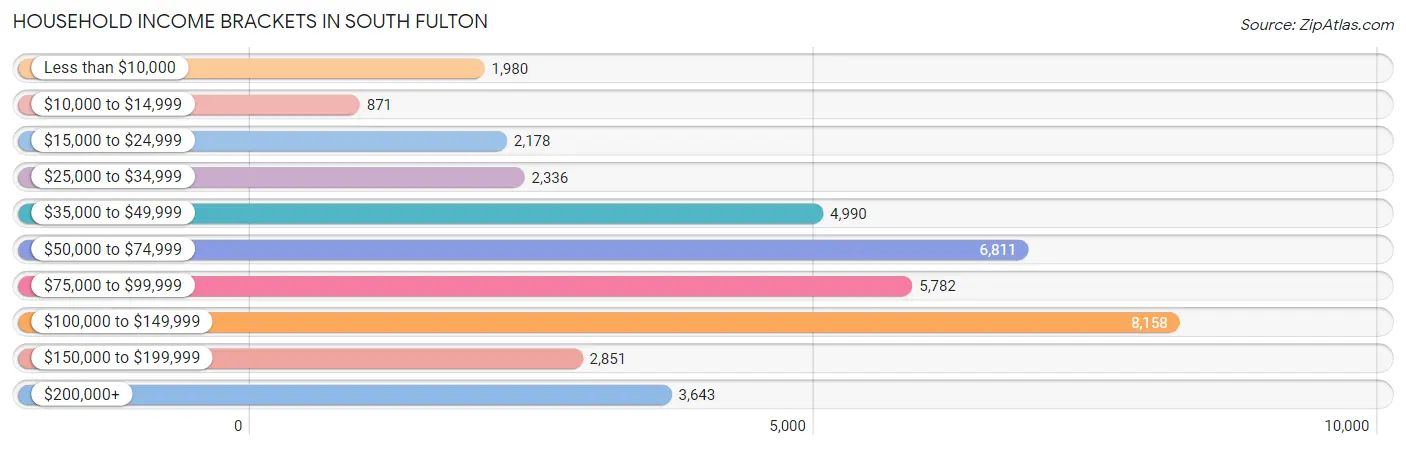
| Income Bracket | # Households | % Households |
| Less than $10,000 | 1,980 | 5.0% |
| $10,000 to $14,999 | 871 | 2.2% |
| $15,000 to $24,999 | 2,178 | 5.5% |
| $25,000 to $34,999 | 2,336 | 5.9% |
| $35,000 to $49,999 | 4,990 | 12.6% |
| $50,000 to $74,999 | 6,811 | 17.2% |
| $75,000 to $99,999 | 5,782 | 14.6% |
| $100,000 to $149,999 | 8,158 | 20.6% |
| $150,000 to $199,999 | 2,851 | 7.2% |
| $200,000+ | 3,643 | 9.2% |
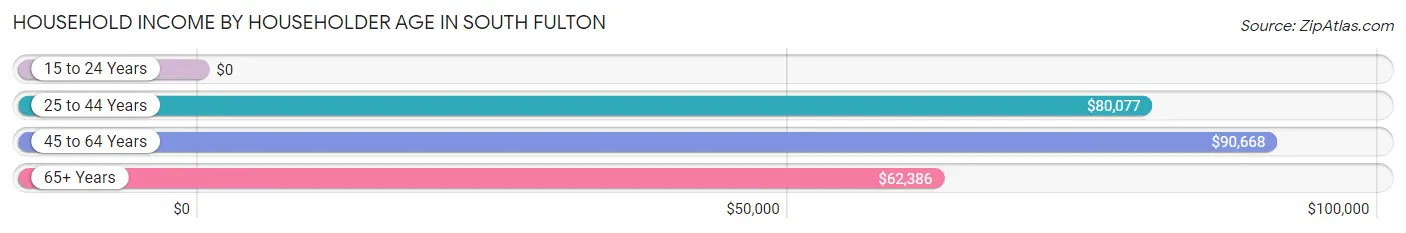
Household Income by Householder Age in South Fulton
The median household income in South Fulton is $77,488, with the highest median household income of $90,668 found in the 45 to 64 years age bracket for the primary householder. A total of 16,570 households (41.8%) fall into this category. Meanwhile, the 15 to 24 years age bracket for the primary householder has the lowest median household income of $0, with 324 households (0.8%) in this group.
| Income Bracket | # Households | Median Income |
| 15 to 24 Years | 324 (0.8%) | $0 |
| 25 to 44 Years | 14,631 (36.9%) | $80,077 |
| 45 to 64 Years | 16,570 (41.8%) | $90,668 |
| 65+ Years | 8,075 (20.4%) | $62,386 |
| Total | 39,600 (100.0%) | $77,488 |
Poverty in South Fulton
Income Below Poverty by Sex and Age in South Fulton
With 9.1% poverty level for males and 9.6% for females among the residents of South Fulton, 12 to 14 year old males and 5 year old females are the most vulnerable to poverty, with 520 males (21.4%) and 116 females (38.9%) in their respective age groups living below the poverty level.
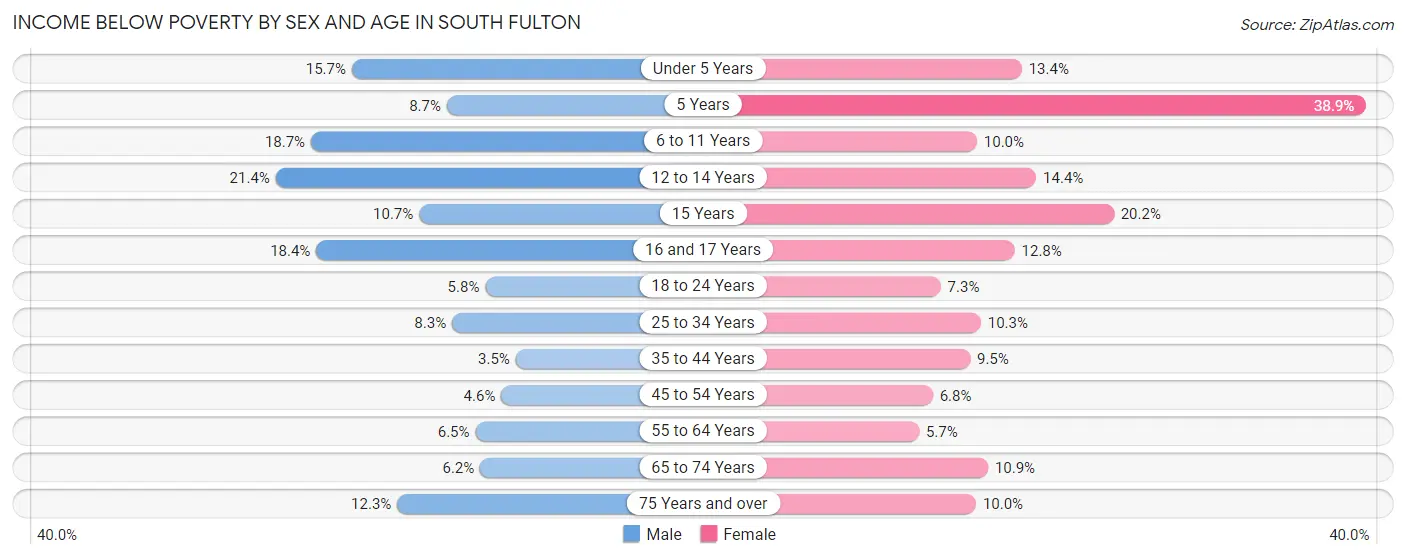
| Age Bracket | Male | Female |
| Under 5 Years | 411 (15.7%) | 453 (13.4%) |
| 5 Years | 45 (8.6%) | 116 (38.9%) |
| 6 to 11 Years | 868 (18.7%) | 371 (10.0%) |
| 12 to 14 Years | 520 (21.4%) | 410 (14.4%) |
| 15 Years | 85 (10.7%) | 191 (20.2%) |
| 16 and 17 Years | 388 (18.3%) | 211 (12.8%) |
| 18 to 24 Years | 295 (5.8%) | 381 (7.3%) |
| 25 to 34 Years | 548 (8.3%) | 900 (10.3%) |
| 35 to 44 Years | 242 (3.5%) | 795 (9.5%) |
| 45 to 54 Years | 380 (4.6%) | 658 (6.8%) |
| 55 to 64 Years | 277 (6.5%) | 370 (5.7%) |
| 65 to 74 Years | 208 (6.2%) | 483 (10.8%) |
| 75 Years and over | 199 (12.3%) | 272 (10.0%) |
| Total | 4,466 (9.1%) | 5,611 (9.6%) |
Income Above Poverty by Sex and Age in South Fulton
According to the poverty statistics in South Fulton, males aged 35 to 44 years and females aged 55 to 64 years are the age groups that are most secure financially, with 96.5% of males and 94.3% of females in these age groups living above the poverty line.
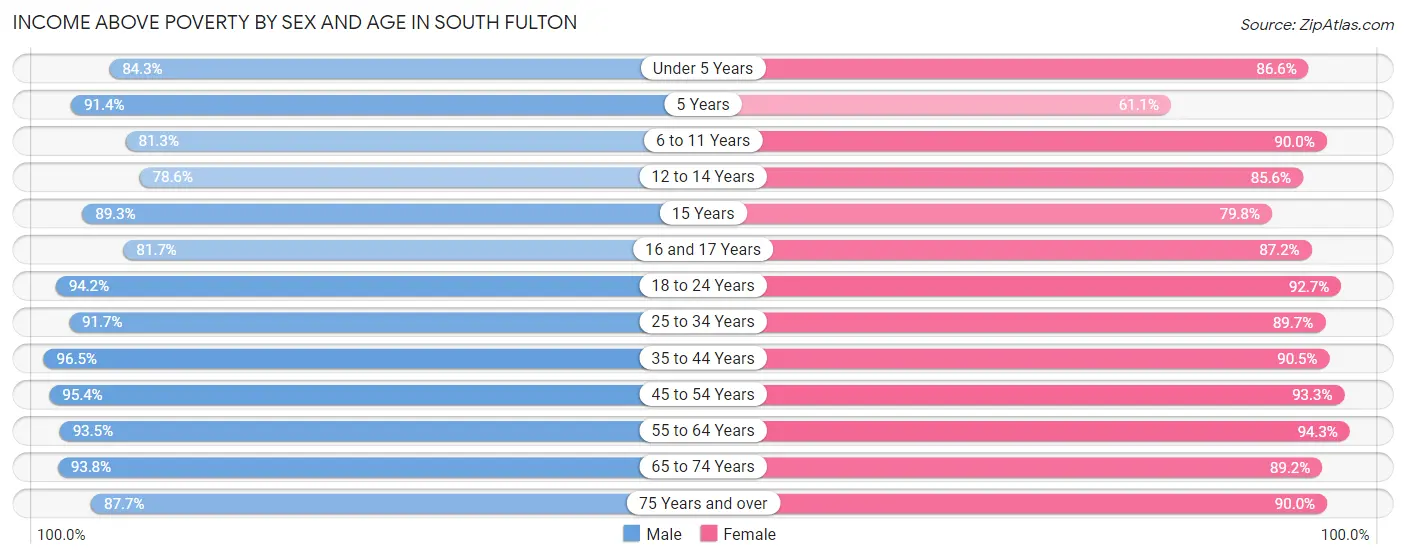
| Age Bracket | Male | Female |
| Under 5 Years | 2,206 (84.3%) | 2,938 (86.6%) |
| 5 Years | 475 (91.3%) | 182 (61.1%) |
| 6 to 11 Years | 3,764 (81.3%) | 3,327 (90.0%) |
| 12 to 14 Years | 1,914 (78.6%) | 2,432 (85.6%) |
| 15 Years | 709 (89.3%) | 755 (79.8%) |
| 16 and 17 Years | 1,726 (81.7%) | 1,434 (87.2%) |
| 18 to 24 Years | 4,795 (94.2%) | 4,808 (92.7%) |
| 25 to 34 Years | 6,081 (91.7%) | 7,817 (89.7%) |
| 35 to 44 Years | 6,603 (96.5%) | 7,554 (90.5%) |
| 45 to 54 Years | 7,871 (95.4%) | 9,087 (93.2%) |
| 55 to 64 Years | 3,964 (93.5%) | 6,086 (94.3%) |
| 65 to 74 Years | 3,155 (93.8%) | 3,970 (89.1%) |
| 75 Years and over | 1,413 (87.7%) | 2,458 (90.0%) |
| Total | 44,676 (90.9%) | 52,848 (90.4%) |
Income Below Poverty Among Married-Couple Families in South Fulton
The poverty statistics for married-couple families in South Fulton show that 3.3% or 433 of the total 13,292 families live below the poverty line. Families with 3 or 4 children have the highest poverty rate of 35.8%, comprising of 275 families. On the other hand, families with 5 or more children have the lowest poverty rate of 0.0%, which includes 0 families.
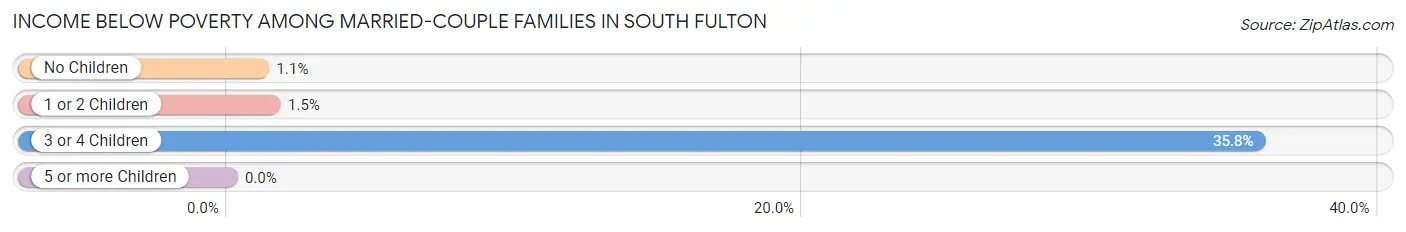
| Children | Above Poverty | Below Poverty |
| No Children | 6,300 (98.9%) | 70 (1.1%) |
| 1 or 2 Children | 5,764 (98.5%) | 88 (1.5%) |
| 3 or 4 Children | 494 (64.2%) | 275 (35.8%) |
| 5 or more Children | 301 (100.0%) | 0 (0.0%) |
| Total | 12,859 (96.7%) | 433 (3.3%) |
Income Below Poverty Among Single-Parent Households in South Fulton
According to the poverty data in South Fulton, 3.8% or 116 single-father households and 11.7% or 1,084 single-mother households are living below the poverty line. Among single-father households, those with 1 or 2 children have the highest poverty rate, with 81 households (6.6%) experiencing poverty. Likewise, among single-mother households, those with 3 or 4 children have the highest poverty rate, with 450 households (68.7%) falling below the poverty line.
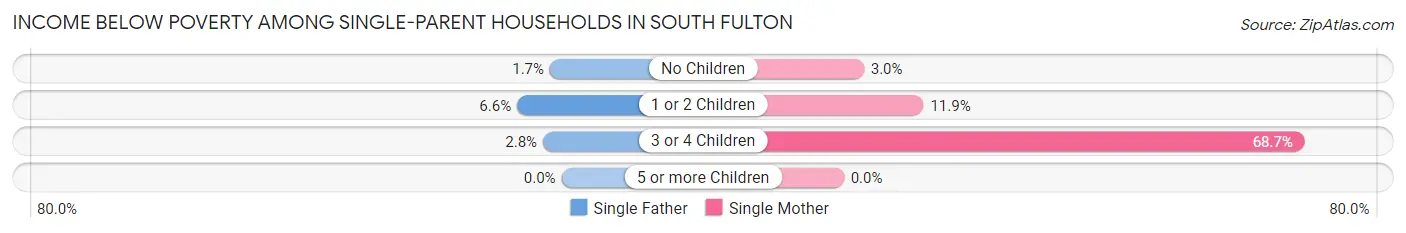
| Children | Single Father | Single Mother |
| No Children | 27 (1.7%) | 131 (3.0%) |
| 1 or 2 Children | 81 (6.6%) | 503 (11.9%) |
| 3 or 4 Children | 8 (2.8%) | 450 (68.7%) |
| 5 or more Children | 0 (0.0%) | 0 (0.0%) |
| Total | 116 (3.8%) | 1,084 (11.7%) |
Income Below Poverty Among Married-Couple vs Single-Parent Households in South Fulton
The poverty data for South Fulton shows that 433 of the married-couple family households (3.3%) and 1,200 of the single-parent households (9.7%) are living below the poverty level. Within the married-couple family households, those with 3 or 4 children have the highest poverty rate, with 275 households (35.8%) falling below the poverty line. Among the single-parent households, those with 3 or 4 children have the highest poverty rate, with 458 household (48.5%) living below poverty.
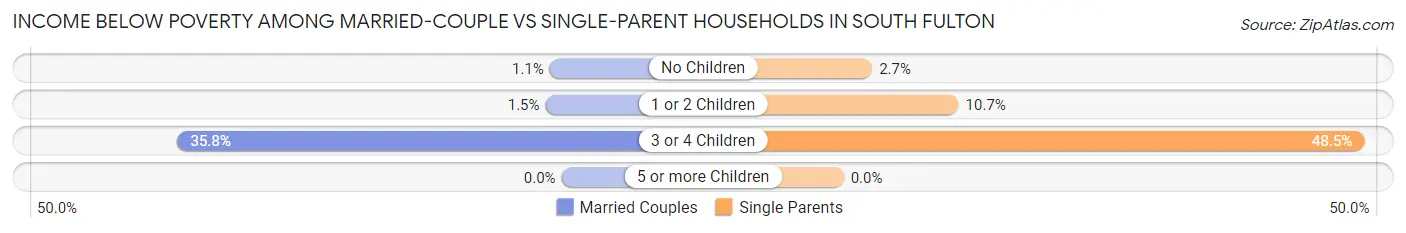
| Children | Married-Couple Families | Single-Parent Households |
| No Children | 70 (1.1%) | 158 (2.7%) |
| 1 or 2 Children | 88 (1.5%) | 584 (10.7%) |
| 3 or 4 Children | 275 (35.8%) | 458 (48.5%) |
| 5 or more Children | 0 (0.0%) | 0 (0.0%) |
| Total | 433 (3.3%) | 1,200 (9.7%) |
Race in South Fulton
The most populous races in South Fulton are Black / African American (98,483 | 91.3%), White / Caucasian (4,730 | 4.4%), and Hispanic or Latino (2,723 | 2.5%).
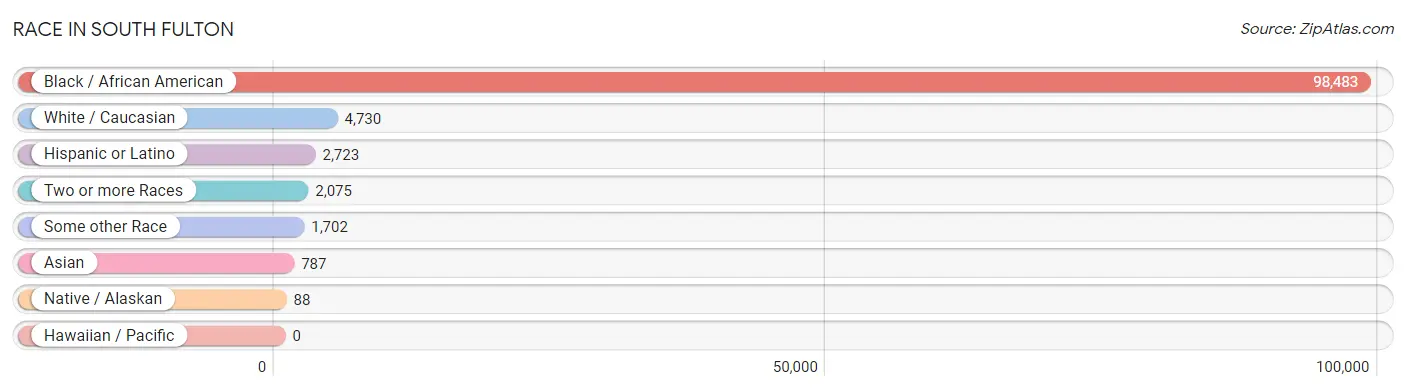
| Race | # Population | % Population |
| Asian | 787 | 0.7% |
| Black / African American | 98,483 | 91.3% |
| Hawaiian / Pacific | 0 | 0.0% |
| Hispanic or Latino | 2,723 | 2.5% |
| Native / Alaskan | 88 | 0.1% |
| White / Caucasian | 4,730 | 4.4% |
| Two or more Races | 2,075 | 1.9% |
| Some other Race | 1,702 | 1.6% |
| Total | 107,865 | 100.0% |
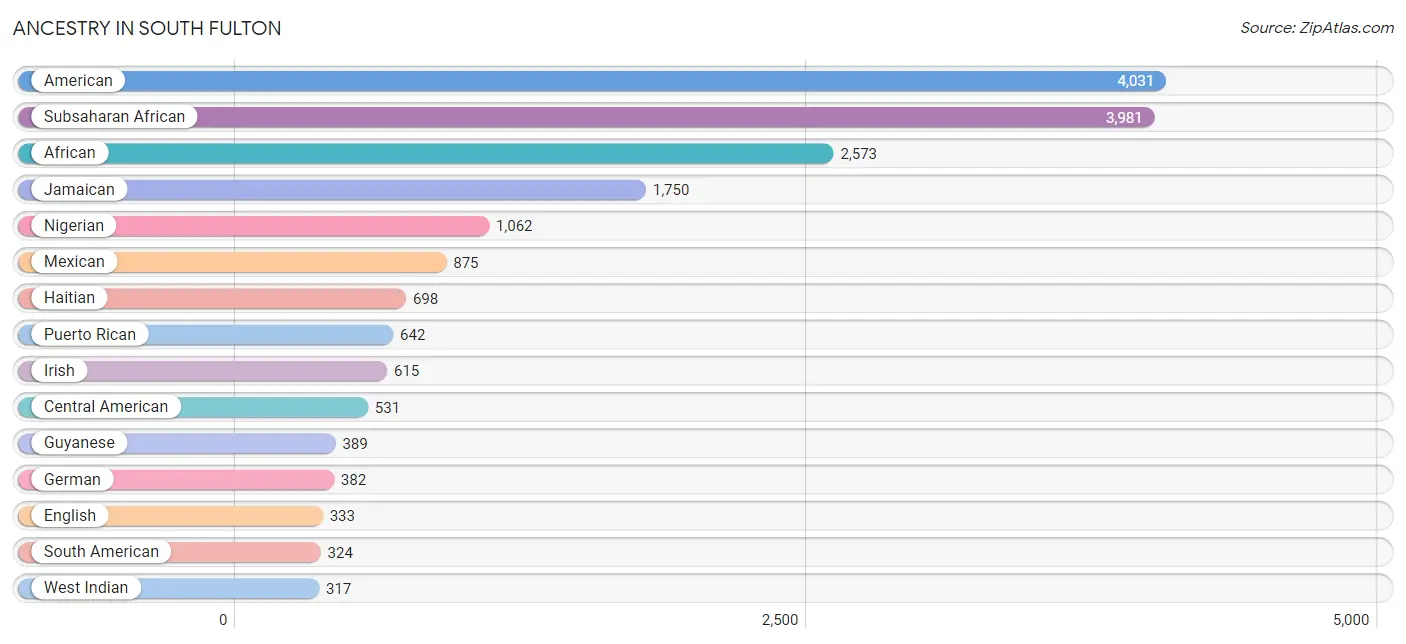
Ancestry in South Fulton
The most populous ancestries reported in South Fulton are American (4,031 | 3.7%), Subsaharan African (3,981 | 3.7%), African (2,573 | 2.4%), Jamaican (1,750 | 1.6%), and Nigerian (1,062 | 1.0%), together accounting for 12.4% of all South Fulton residents.
| Ancestry | # Population | % Population |
| African | 2,573 | 2.4% |
| Alaskan Athabascan | 7 | 0.0% |
| American | 4,031 | 3.7% |
| Arab | 55 | 0.1% |
| Bahamian | 10 | 0.0% |
| Barbadian | 193 | 0.2% |
| Belgian | 31 | 0.0% |
| Bermudan | 12 | 0.0% |
| Bhutanese | 50 | 0.1% |
| Blackfeet | 135 | 0.1% |
| Brazilian | 13 | 0.0% |
| British | 41 | 0.0% |
| British West Indian | 28 | 0.0% |
| Burmese | 1 | 0.0% |
| Central American | 531 | 0.5% |
| Cherokee | 33 | 0.0% |
| Colombian | 101 | 0.1% |
| Creek | 53 | 0.1% |
| Cuban | 140 | 0.1% |
| Danish | 130 | 0.1% |
| Dominican | 135 | 0.1% |
| Dutch | 9 | 0.0% |
| English | 333 | 0.3% |
| Ethiopian | 12 | 0.0% |
| European | 241 | 0.2% |
| French | 76 | 0.1% |
| French American Indian | 21 | 0.0% |
| German | 382 | 0.4% |
| German Russian | 12 | 0.0% |
| Ghanaian | 298 | 0.3% |
| Guatemalan | 193 | 0.2% |
| Guyanese | 389 | 0.4% |
| Haitian | 698 | 0.6% |
| Honduran | 96 | 0.1% |
| Indian (Asian) | 240 | 0.2% |
| Iranian | 47 | 0.0% |
| Irish | 615 | 0.6% |
| Israeli | 62 | 0.1% |
| Italian | 51 | 0.1% |
| Jamaican | 1,750 | 1.6% |
| Korean | 206 | 0.2% |
| Lebanese | 39 | 0.0% |
| Liberian | 31 | 0.0% |
| Lithuanian | 2 | 0.0% |
| Lumbee | 78 | 0.1% |
| Malaysian | 99 | 0.1% |
| Mexican | 875 | 0.8% |
| Moroccan | 16 | 0.0% |
| Nigerian | 1,062 | 1.0% |
| Panamanian | 72 | 0.1% |
| Polish | 1 | 0.0% |
| Puerto Rican | 642 | 0.6% |
| Russian | 22 | 0.0% |
| Salvadoran | 170 | 0.2% |
| Scandinavian | 33 | 0.0% |
| Scottish | 26 | 0.0% |
| Senegalese | 36 | 0.0% |
| Sierra Leonean | 60 | 0.1% |
| South American | 324 | 0.3% |
| Spaniard | 61 | 0.1% |
| Subsaharan African | 3,981 | 3.7% |
| Sudanese | 10 | 0.0% |
| Swedish | 14 | 0.0% |
| Thai | 110 | 0.1% |
| Trinidadian and Tobagonian | 127 | 0.1% |
| Venezuelan | 223 | 0.2% |
| Vietnamese | 214 | 0.2% |
| Welsh | 35 | 0.0% |
| West Indian | 317 | 0.3% | View All 69 Rows |
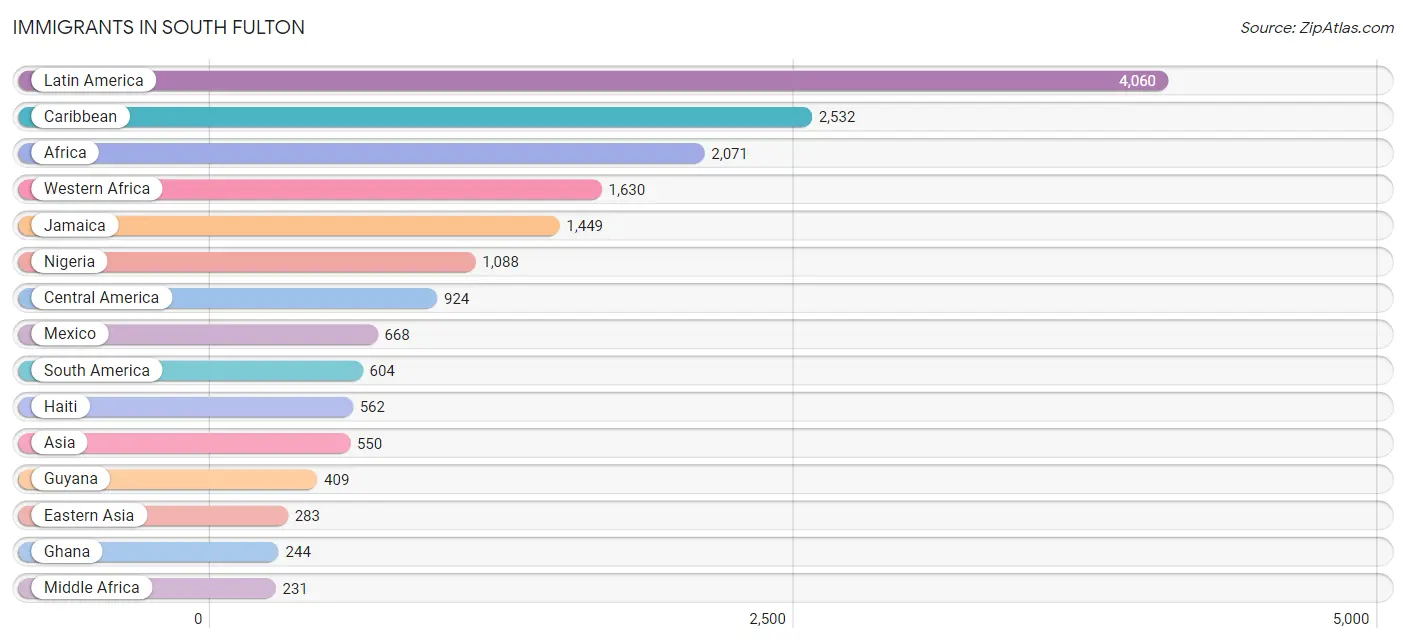
Immigrants in South Fulton
The most numerous immigrant groups reported in South Fulton came from Latin America (4,060 | 3.8%), Caribbean (2,532 | 2.4%), Africa (2,071 | 1.9%), Western Africa (1,630 | 1.5%), and Jamaica (1,449 | 1.3%), together accounting for 10.9% of all South Fulton residents.
| Immigration Origin | # Population | % Population |
| Africa | 2,071 | 1.9% |
| Asia | 550 | 0.5% |
| Bahamas | 70 | 0.1% |
| Bangladesh | 192 | 0.2% |
| Barbados | 193 | 0.2% |
| Brazil | 94 | 0.1% |
| Cameroon | 190 | 0.2% |
| Canada | 8 | 0.0% |
| Caribbean | 2,532 | 2.4% |
| Central America | 924 | 0.9% |
| China | 91 | 0.1% |
| Colombia | 101 | 0.1% |
| Congo | 6 | 0.0% |
| Cuba | 43 | 0.0% |
| Eastern Africa | 146 | 0.1% |
| Eastern Asia | 283 | 0.3% |
| El Salvador | 73 | 0.1% |
| Eritrea | 14 | 0.0% |
| Ethiopia | 8 | 0.0% |
| Europe | 69 | 0.1% |
| Germany | 69 | 0.1% |
| Ghana | 244 | 0.2% |
| Guatemala | 91 | 0.1% |
| Guyana | 409 | 0.4% |
| Haiti | 562 | 0.5% |
| Honduras | 68 | 0.1% |
| Hong Kong | 1 | 0.0% |
| India | 21 | 0.0% |
| Jamaica | 1,449 | 1.3% |
| Japan | 192 | 0.2% |
| Kenya | 110 | 0.1% |
| Latin America | 4,060 | 3.8% |
| Mexico | 668 | 0.6% |
| Middle Africa | 231 | 0.2% |
| Morocco | 36 | 0.0% |
| Nigeria | 1,088 | 1.0% |
| Northern Africa | 36 | 0.0% |
| Panama | 24 | 0.0% |
| Philippines | 54 | 0.1% |
| Senegal | 166 | 0.2% |
| Sierra Leone | 95 | 0.1% |
| South America | 604 | 0.6% |
| South Central Asia | 213 | 0.2% |
| South Eastern Asia | 54 | 0.1% |
| St. Vincent and the Grenadines | 73 | 0.1% |
| Trinidad and Tobago | 114 | 0.1% |
| Western Africa | 1,630 | 1.5% |
| Western Europe | 69 | 0.1% |
| Zaire | 35 | 0.0% | View All 49 Rows |
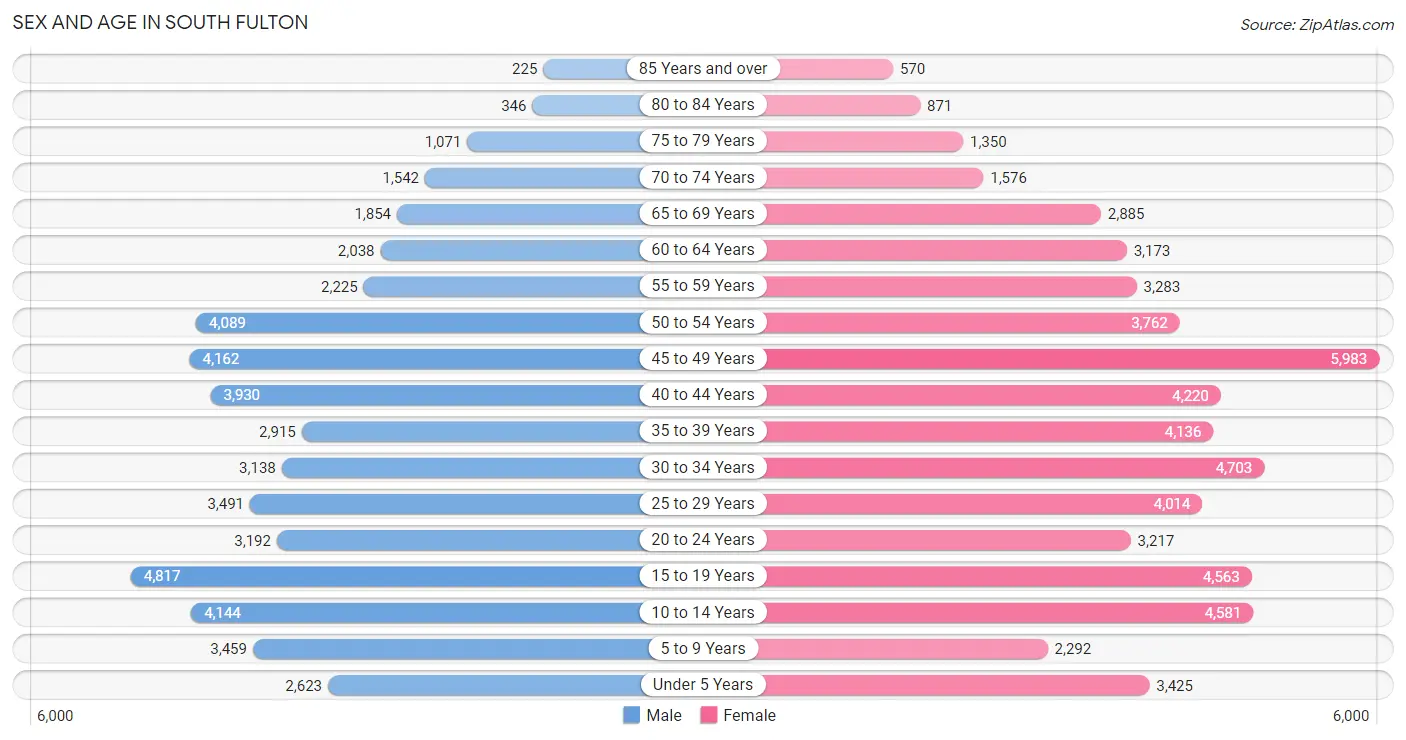
Sex and Age in South Fulton
Sex and Age in South Fulton
The most populous age groups in South Fulton are 15 to 19 Years (4,817 | 9.8%) for men and 45 to 49 Years (5,983 | 10.2%) for women.
| Age Bracket | Male | Female |
| Under 5 Years | 2,623 (5.3%) | 3,425 (5.8%) |
| 5 to 9 Years | 3,459 (7.0%) | 2,292 (3.9%) |
| 10 to 14 Years | 4,144 (8.4%) | 4,581 (7.8%) |
| 15 to 19 Years | 4,817 (9.8%) | 4,563 (7.8%) |
| 20 to 24 Years | 3,192 (6.5%) | 3,217 (5.5%) |
| 25 to 29 Years | 3,491 (7.1%) | 4,014 (6.9%) |
| 30 to 34 Years | 3,138 (6.4%) | 4,703 (8.0%) |
| 35 to 39 Years | 2,915 (5.9%) | 4,136 (7.1%) |
| 40 to 44 Years | 3,930 (8.0%) | 4,220 (7.2%) |
| 45 to 49 Years | 4,162 (8.5%) | 5,983 (10.2%) |
| 50 to 54 Years | 4,089 (8.3%) | 3,762 (6.4%) |
| 55 to 59 Years | 2,225 (4.5%) | 3,283 (5.6%) |
| 60 to 64 Years | 2,038 (4.1%) | 3,173 (5.4%) |
| 65 to 69 Years | 1,854 (3.8%) | 2,885 (4.9%) |
| 70 to 74 Years | 1,542 (3.1%) | 1,576 (2.7%) |
| 75 to 79 Years | 1,071 (2.2%) | 1,350 (2.3%) |
| 80 to 84 Years | 346 (0.7%) | 871 (1.5%) |
| 85 Years and over | 225 (0.5%) | 570 (1.0%) |
| Total | 49,261 (100.0%) | 58,604 (100.0%) |
Families and Households in South Fulton
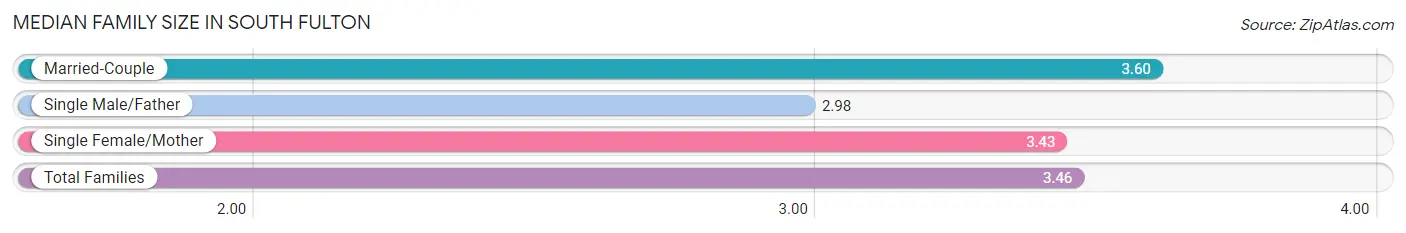
Median Family Size in South Fulton
The median family size in South Fulton is 3.46 persons per family, with married-couple families (13,292 | 51.8%) accounting for the largest median family size of 3.6 persons per family. On the other hand, single male/father families (3,071 | 12.0%) represent the smallest median family size with 2.98 persons per family.
| Family Type | # Families | Family Size |
| Married-Couple | 13,292 (51.8%) | 3.60 |
| Single Male/Father | 3,071 (12.0%) | 2.98 |
| Single Female/Mother | 9,281 (36.2%) | 3.43 |
| Total Families | 25,644 (100.0%) | 3.46 |
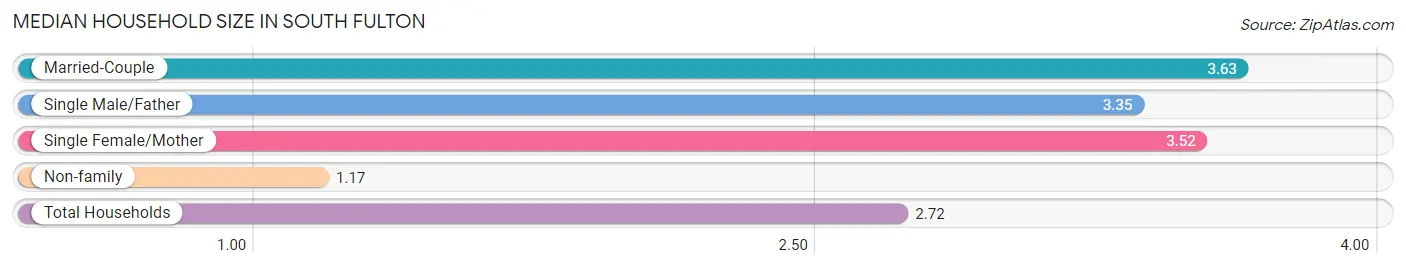
Median Household Size in South Fulton
The median household size in South Fulton is 2.72 persons per household, with married-couple households (13,292 | 33.6%) accounting for the largest median household size of 3.63 persons per household. non-family households (13,956 | 35.2%) represent the smallest median household size with 1.17 persons per household.
| Household Type | # Households | Household Size |
| Married-Couple | 13,292 (33.6%) | 3.63 |
| Single Male/Father | 3,071 (7.8%) | 3.35 |
| Single Female/Mother | 9,281 (23.4%) | 3.52 |
| Non-family | 13,956 (35.2%) | 1.17 |
| Total Households | 39,600 (100.0%) | 2.72 |
Household Size by Marriage Status in South Fulton
Out of a total of 39,600 households in South Fulton, 25,644 (64.8%) are family households, while 13,956 (35.2%) are nonfamily households. The most numerous type of family households are 2-person households, comprising 8,740, and the most common type of nonfamily households are 1-person households, comprising 12,130.
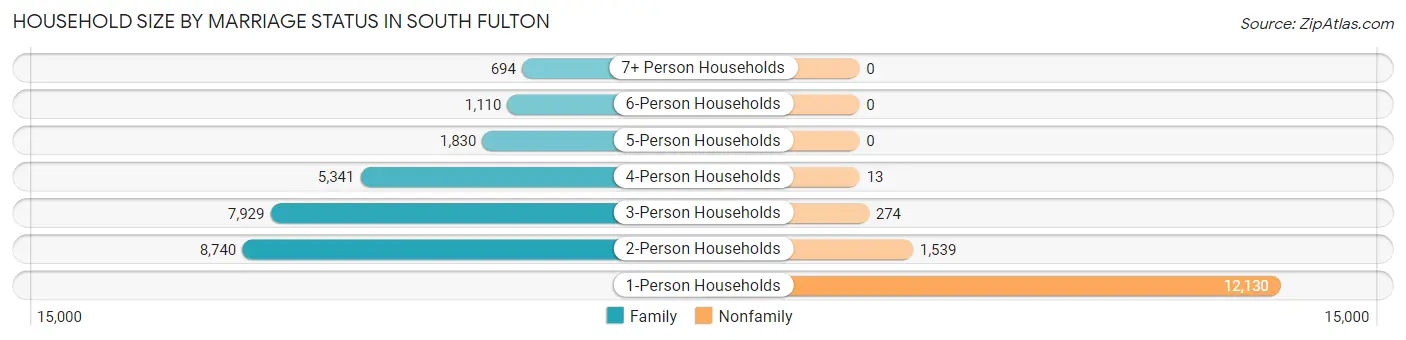
| Household Size | Family Households | Nonfamily Households |
| 1-Person Households | - | 12,130 (30.6%) |
| 2-Person Households | 8,740 (22.1%) | 1,539 (3.9%) |
| 3-Person Households | 7,929 (20.0%) | 274 (0.7%) |
| 4-Person Households | 5,341 (13.5%) | 13 (0.0%) |
| 5-Person Households | 1,830 (4.6%) | 0 (0.0%) |
| 6-Person Households | 1,110 (2.8%) | 0 (0.0%) |
| 7+ Person Households | 694 (1.8%) | 0 (0.0%) |
| Total | 25,644 (64.8%) | 13,956 (35.2%) |
Female Fertility in South Fulton
Fertility by Age in South Fulton
Average fertility rate in South Fulton is 48.0 births per 1,000 women. Women in the age bracket of 20 to 34 years have the highest fertility rate with 77.0 births per 1,000 women. Women in the age bracket of 20 to 34 years acount for 60.4% of all women with births.
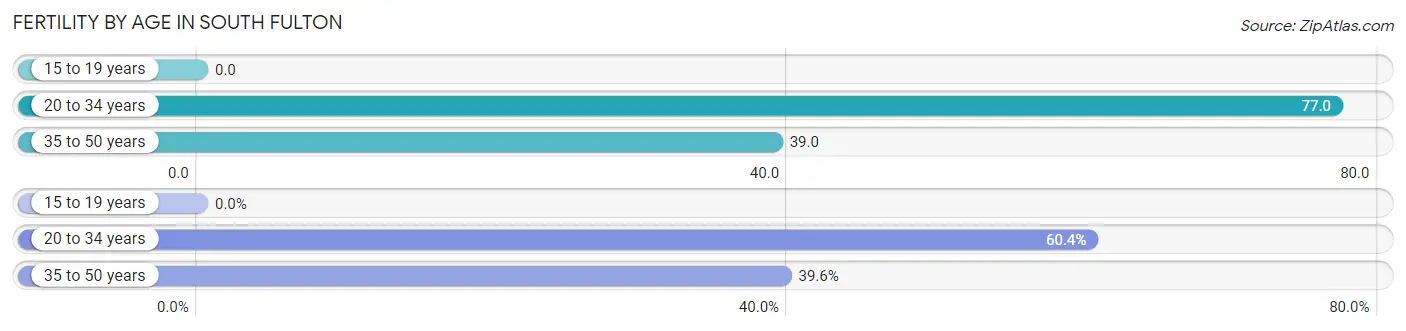
| Age Bracket | Women with Births | Births / 1,000 Women |
| 15 to 19 years | 0 (0.0%) | 0.0 |
| 20 to 34 years | 915 (60.4%) | 77.0 |
| 35 to 50 years | 600 (39.6%) | 39.0 |
| Total | 1,515 (100.0%) | 48.0 |
Fertility by Age by Marriage Status in South Fulton
74.0% of women with births (1,515) in South Fulton are married. The highest percentage of unmarried women with births falls into 20 to 34 years age bracket with 39.7% of them unmarried at the time of birth, while the lowest percentage of unmarried women with births belong to 35 to 50 years age bracket with 5.2% of them unmarried.
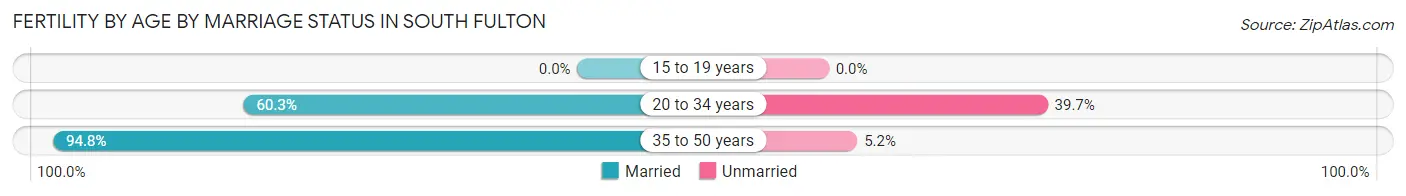
| Age Bracket | Married | Unmarried |
| 15 to 19 years | 0 (0.0%) | 0 (0.0%) |
| 20 to 34 years | 552 (60.3%) | 363 (39.7%) |
| 35 to 50 years | 569 (94.8%) | 31 (5.2%) |
| Total | 1,121 (74.0%) | 394 (26.0%) |
Fertility by Education in South Fulton
Average fertility rate in South Fulton is 48.0 births per 1,000 women. Women with the education attainment of graduate degree have the highest fertility rate of 78.0 births per 1,000 women, while women with the education attainment of less than high school have the lowest fertility at 10.0 births per 1,000 women. Women with the education attainment of college or associate's degree represent 30.0% of all women with births.
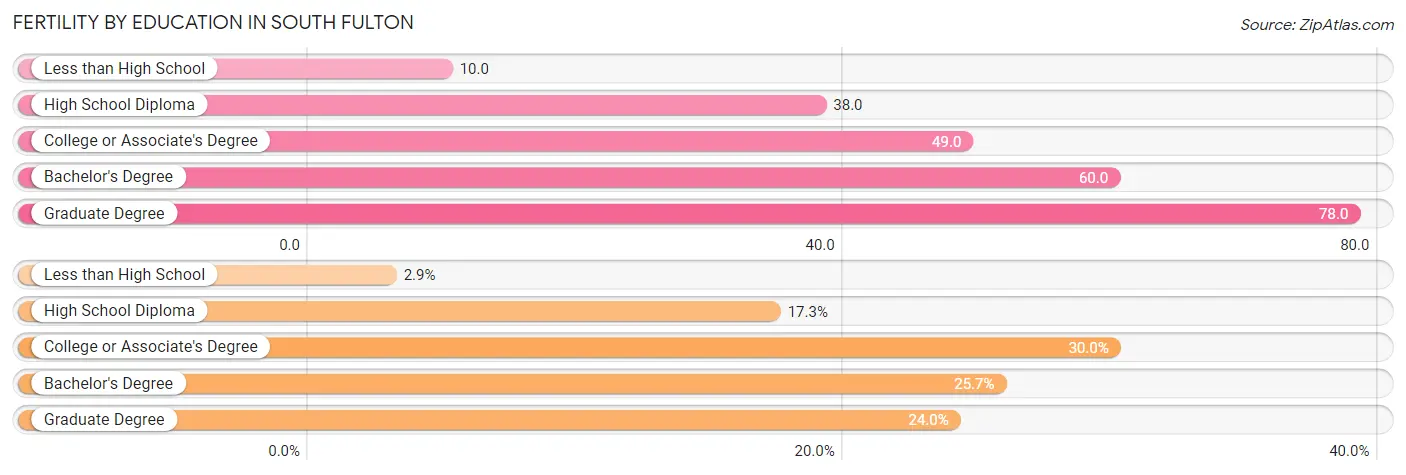
| Educational Attainment | Women with Births | Births / 1,000 Women |
| Less than High School | 44 (2.9%) | 10.0 |
| High School Diploma | 262 (17.3%) | 38.0 |
| College or Associate's Degree | 455 (30.0%) | 49.0 |
| Bachelor's Degree | 390 (25.7%) | 60.0 |
| Graduate Degree | 364 (24.0%) | 78.0 |
| Total | 1,515 (100.0%) | 48.0 |
Fertility by Education by Marriage Status in South Fulton
26.0% of women with births in South Fulton are unmarried. Women with the educational attainment of graduate degree are most likely to be married with 92.3% of them married at childbirth, while women with the educational attainment of high school diploma are least likely to be married with 82.8% of them unmarried at childbirth.
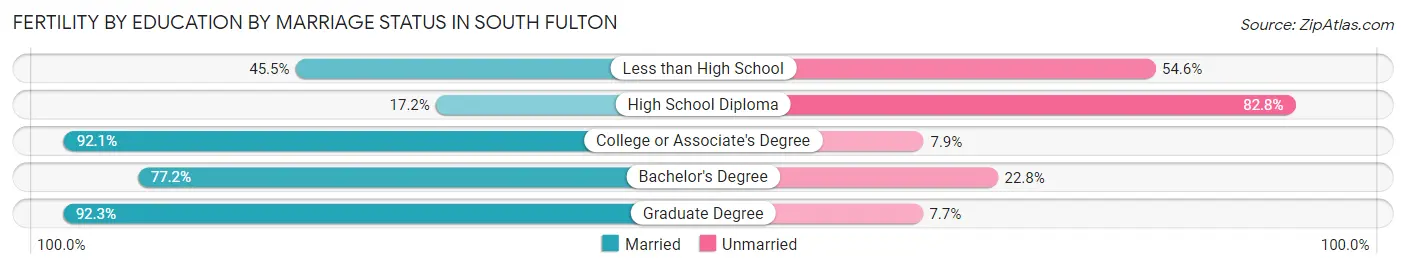
| Educational Attainment | Married | Unmarried |
| Less than High School | 20 (45.5%) | 24 (54.5%) |
| High School Diploma | 45 (17.2%) | 217 (82.8%) |
| College or Associate's Degree | 419 (92.1%) | 36 (7.9%) |
| Bachelor's Degree | 301 (77.2%) | 89 (22.8%) |
| Graduate Degree | 336 (92.3%) | 28 (7.7%) |
| Total | 1,121 (74.0%) | 394 (26.0%) |
Employment Characteristics in South Fulton
Employment by Class of Employer in South Fulton
Among the 53,880 employed individuals in South Fulton, private company employees (35,951 | 66.7%), local government employees (4,461 | 8.3%), and not-for-profit organizations (3,496 | 6.5%) make up the most common classes of employment.
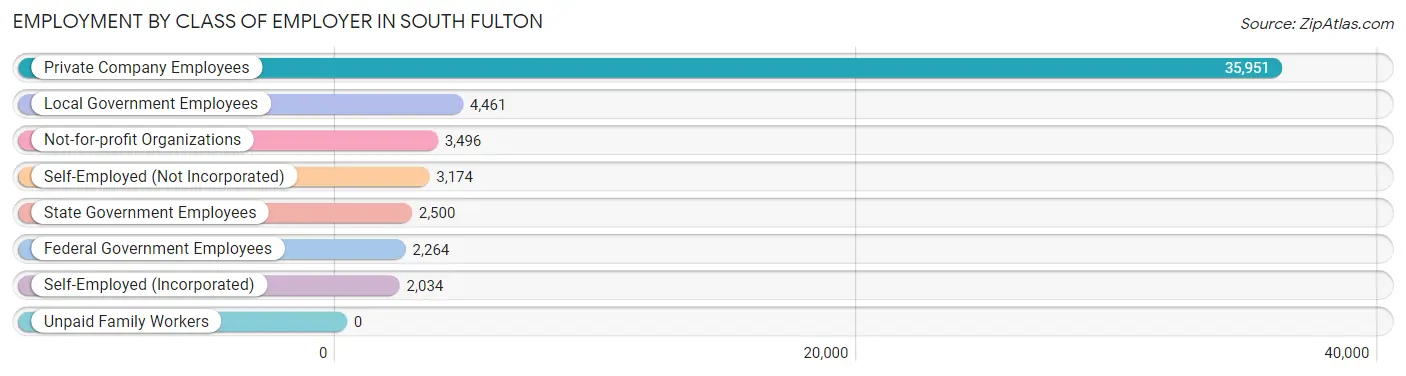
| Employer Class | # Employees | % Employees |
| Private Company Employees | 35,951 | 66.7% |
| Self-Employed (Incorporated) | 2,034 | 3.8% |
| Self-Employed (Not Incorporated) | 3,174 | 5.9% |
| Not-for-profit Organizations | 3,496 | 6.5% |
| Local Government Employees | 4,461 | 8.3% |
| State Government Employees | 2,500 | 4.6% |
| Federal Government Employees | 2,264 | 4.2% |
| Unpaid Family Workers | 0 | 0.0% |
| Total | 53,880 | 100.0% |
Employment Status by Age in South Fulton
According to the labor force statistics for South Fulton, out of the total population over 16 years of age (85,601), 69.8% or 59,749 individuals are in the labor force, with 7.8% or 4,660 of them unemployed. The age group with the highest labor force participation rate is 35 to 44 years, with 90.7% or 13,787 individuals in the labor force. Within the labor force, the 16 to 19 years age range has the highest percentage of unemployed individuals, with 31.9% or 787 of them being unemployed.
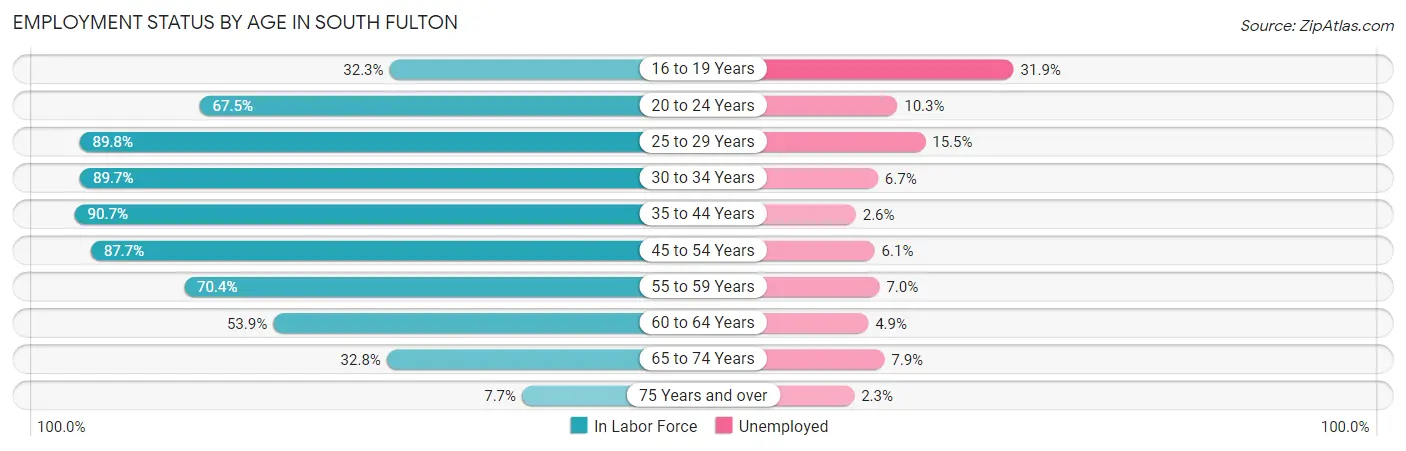
| Age Bracket | In Labor Force | Unemployed |
| 16 to 19 Years | 2,468 (32.3%) | 787 (31.9%) |
| 20 to 24 Years | 4,326 (67.5%) | 446 (10.3%) |
| 25 to 29 Years | 6,739 (89.8%) | 1,045 (15.5%) |
| 30 to 34 Years | 7,033 (89.7%) | 471 (6.7%) |
| 35 to 44 Years | 13,787 (90.7%) | 358 (2.6%) |
| 45 to 54 Years | 15,782 (87.7%) | 963 (6.1%) |
| 55 to 59 Years | 3,878 (70.4%) | 271 (7.0%) |
| 60 to 64 Years | 2,809 (53.9%) | 138 (4.9%) |
| 65 to 74 Years | 2,577 (32.8%) | 204 (7.9%) |
| 75 Years and over | 341 (7.7%) | 8 (2.3%) |
| Total | 59,749 (69.8%) | 4,660 (7.8%) |
Employment Status by Educational Attainment in South Fulton
According to labor force statistics for South Fulton, 84.4% of individuals (50,017) out of the total population between 25 and 64 years of age (59,262) are in the labor force, with 6.5% or 3,251 of them being unemployed. The group with the highest labor force participation rate are those with the educational attainment of bachelor's degree or higher, with 90.6% or 21,937 individuals in the labor force. Within the labor force, individuals with high school diploma education have the highest percentage of unemployment, with 15.5% or 1,687 of them being unemployed.
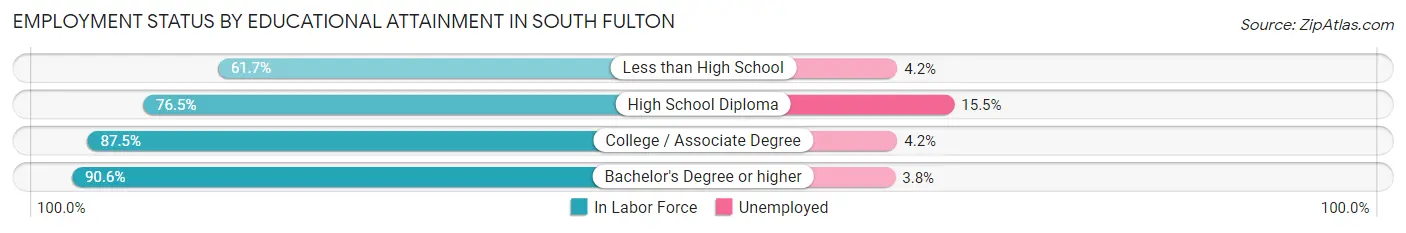
| Educational Attainment | In Labor Force | Unemployed |
| Less than High School | 2,412 (61.7%) | 164 (4.2%) |
| High School Diploma | 10,883 (76.5%) | 2,205 (15.5%) |
| College / Associate Degree | 14,800 (87.5%) | 710 (4.2%) |
| Bachelor's Degree or higher | 21,937 (90.6%) | 920 (3.8%) |
| Total | 50,017 (84.4%) | 3,852 (6.5%) |
Employment Occupations by Sex in South Fulton
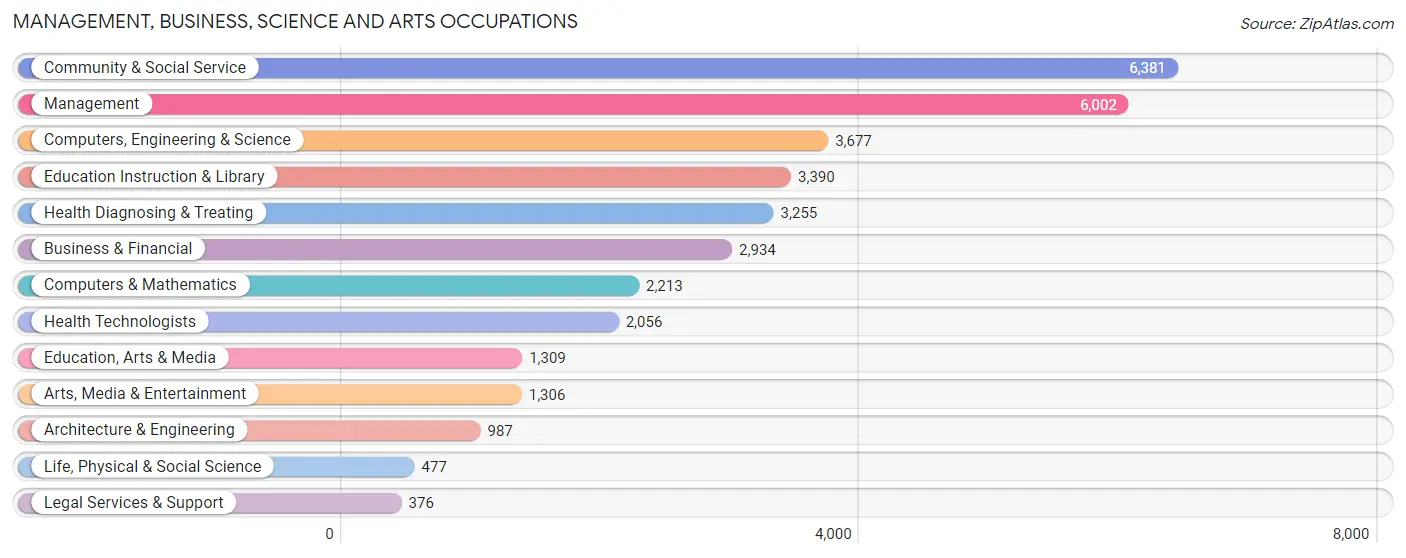
Management, Business, Science and Arts Occupations
The most common Management, Business, Science and Arts occupations in South Fulton are Community & Social Service (6,381 | 11.7%), Management (6,002 | 11.0%), Computers, Engineering & Science (3,677 | 6.7%), Education Instruction & Library (3,390 | 6.2%), and Health Diagnosing & Treating (3,255 | 5.9%).
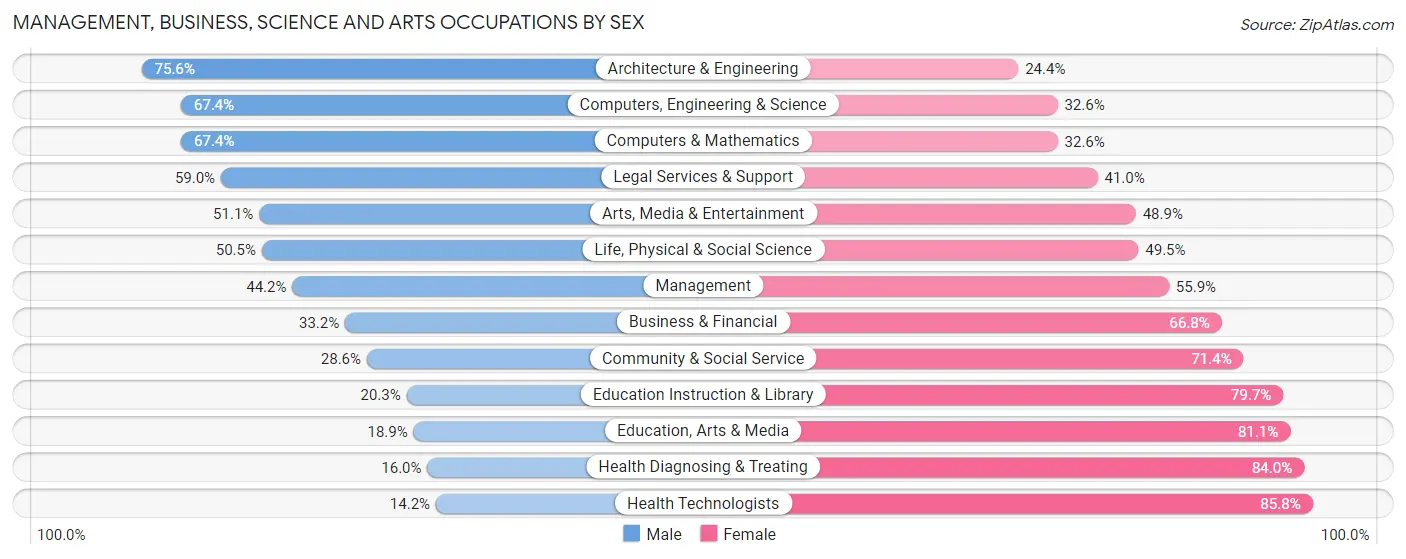
Management, Business, Science and Arts Occupations by Sex
Within the Management, Business, Science and Arts occupations in South Fulton, the most male-oriented occupations are Architecture & Engineering (75.6%), Computers, Engineering & Science (67.4%), and Computers & Mathematics (67.4%), while the most female-oriented occupations are Health Technologists (85.8%), Health Diagnosing & Treating (84.0%), and Education, Arts & Media (81.1%).
| Occupation | Male | Female |
| Management | 2,650 (44.2%) | 3,352 (55.8%) |
| Business & Financial | 973 (33.2%) | 1,961 (66.8%) |
| Computers, Engineering & Science | 2,478 (67.4%) | 1,199 (32.6%) |
| Computers & Mathematics | 1,491 (67.4%) | 722 (32.6%) |
| Architecture & Engineering | 746 (75.6%) | 241 (24.4%) |
| Life, Physical & Social Science | 241 (50.5%) | 236 (49.5%) |
| Community & Social Service | 1,825 (28.6%) | 4,556 (71.4%) |
| Education, Arts & Media | 247 (18.9%) | 1,062 (81.1%) |
| Legal Services & Support | 222 (59.0%) | 154 (41.0%) |
| Education Instruction & Library | 689 (20.3%) | 2,701 (79.7%) |
| Arts, Media & Entertainment | 667 (51.1%) | 639 (48.9%) |
| Health Diagnosing & Treating | 520 (16.0%) | 2,735 (84.0%) |
| Health Technologists | 292 (14.2%) | 1,764 (85.8%) |
| Total (Category) | 8,446 (38.0%) | 13,803 (62.0%) |
| Total (Overall) | 25,335 (46.2%) | 29,461 (53.8%) |
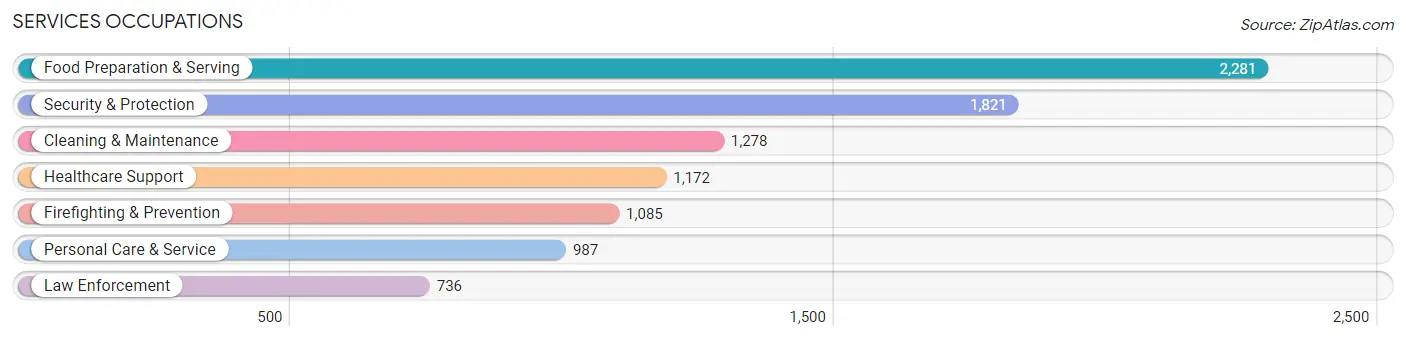
Services Occupations
The most common Services occupations in South Fulton are Food Preparation & Serving (2,281 | 4.2%), Security & Protection (1,821 | 3.3%), Cleaning & Maintenance (1,278 | 2.3%), Healthcare Support (1,172 | 2.1%), and Firefighting & Prevention (1,085 | 2.0%).
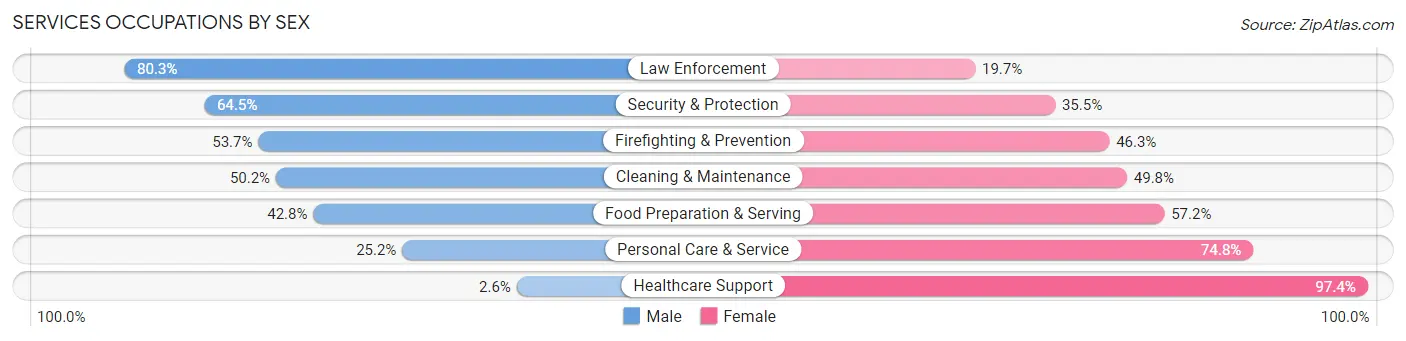
Services Occupations by Sex
Within the Services occupations in South Fulton, the most male-oriented occupations are Law Enforcement (80.3%), Security & Protection (64.5%), and Firefighting & Prevention (53.7%), while the most female-oriented occupations are Healthcare Support (97.4%), Personal Care & Service (74.8%), and Food Preparation & Serving (57.2%).
| Occupation | Male | Female |
| Healthcare Support | 30 (2.6%) | 1,142 (97.4%) |
| Security & Protection | 1,174 (64.5%) | 647 (35.5%) |
| Firefighting & Prevention | 583 (53.7%) | 502 (46.3%) |
| Law Enforcement | 591 (80.3%) | 145 (19.7%) |
| Food Preparation & Serving | 977 (42.8%) | 1,304 (57.2%) |
| Cleaning & Maintenance | 642 (50.2%) | 636 (49.8%) |
| Personal Care & Service | 249 (25.2%) | 738 (74.8%) |
| Total (Category) | 3,072 (40.7%) | 4,467 (59.3%) |
| Total (Overall) | 25,335 (46.2%) | 29,461 (53.8%) |
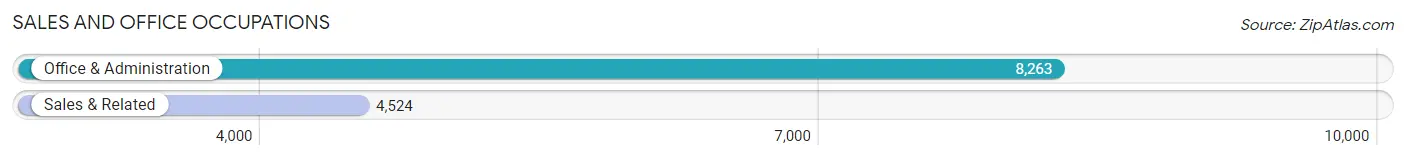
Sales and Office Occupations
The most common Sales and Office occupations in South Fulton are Office & Administration (8,263 | 15.1%), and Sales & Related (4,524 | 8.3%).
Sales and Office Occupations by Sex
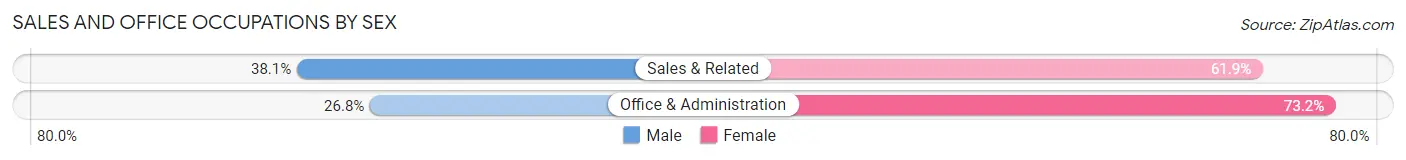
| Occupation | Male | Female |
| Sales & Related | 1,723 (38.1%) | 2,801 (61.9%) |
| Office & Administration | 2,218 (26.8%) | 6,045 (73.2%) |
| Total (Category) | 3,941 (30.8%) | 8,846 (69.2%) |
| Total (Overall) | 25,335 (46.2%) | 29,461 (53.8%) |
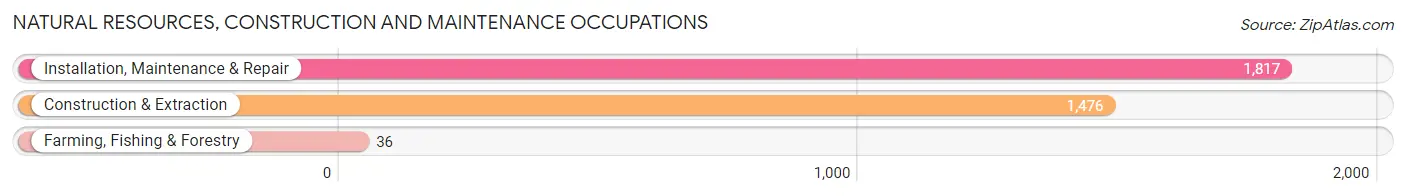
Natural Resources, Construction and Maintenance Occupations
The most common Natural Resources, Construction and Maintenance occupations in South Fulton are Installation, Maintenance & Repair (1,817 | 3.3%), Construction & Extraction (1,476 | 2.7%), and Farming, Fishing & Forestry (36 | 0.1%).
Natural Resources, Construction and Maintenance Occupations by Sex
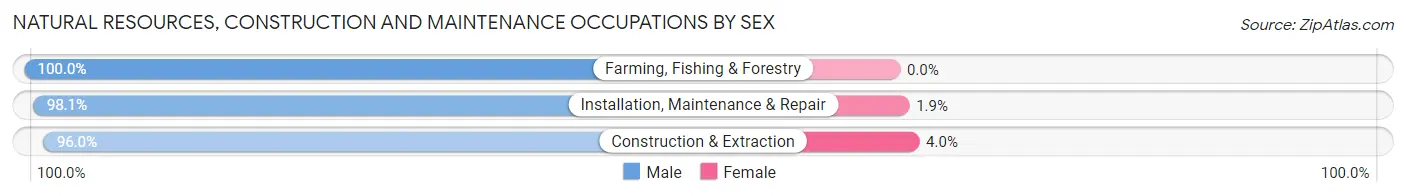
| Occupation | Male | Female |
| Farming, Fishing & Forestry | 36 (100.0%) | 0 (0.0%) |
| Construction & Extraction | 1,417 (96.0%) | 59 (4.0%) |
| Installation, Maintenance & Repair | 1,782 (98.1%) | 35 (1.9%) |
| Total (Category) | 3,235 (97.2%) | 94 (2.8%) |
| Total (Overall) | 25,335 (46.2%) | 29,461 (53.8%) |
Production, Transportation and Moving Occupations
The most common Production, Transportation and Moving occupations in South Fulton are Transportation (4,808 | 8.8%), Material Moving (2,924 | 5.3%), and Production (1,160 | 2.1%).
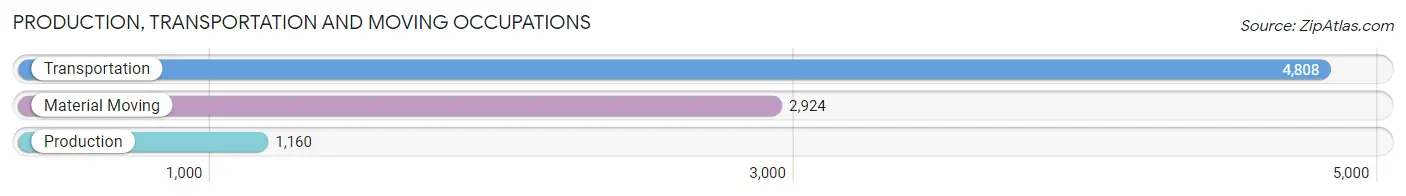
Production, Transportation and Moving Occupations by Sex
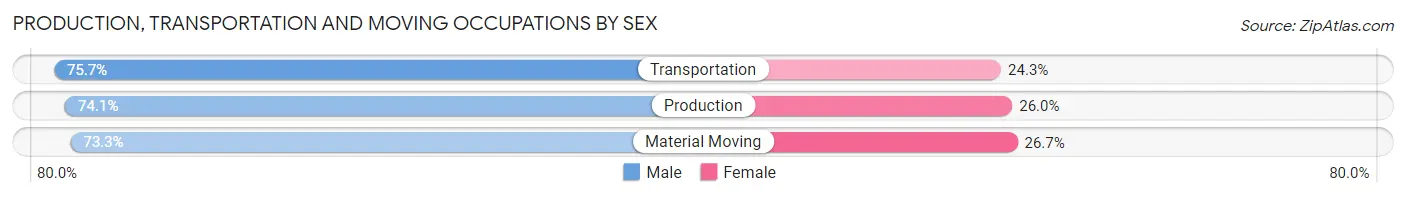
| Occupation | Male | Female |
| Production | 859 (74.1%) | 301 (26.0%) |
| Transportation | 3,639 (75.7%) | 1,169 (24.3%) |
| Material Moving | 2,143 (73.3%) | 781 (26.7%) |
| Total (Category) | 6,641 (74.7%) | 2,251 (25.3%) |
| Total (Overall) | 25,335 (46.2%) | 29,461 (53.8%) |
Employment Industries by Sex in South Fulton
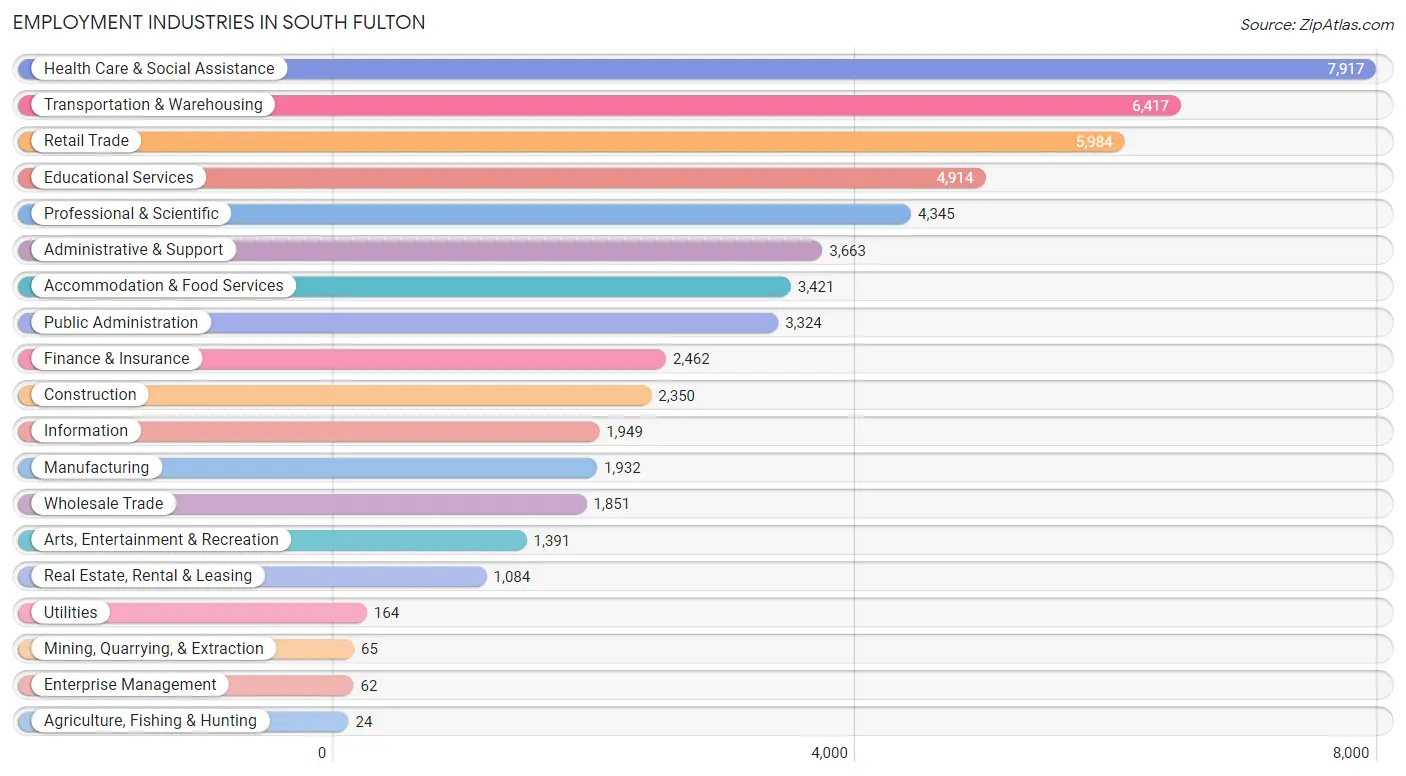
Employment Industries in South Fulton
The major employment industries in South Fulton include Health Care & Social Assistance (7,917 | 14.4%), Transportation & Warehousing (6,417 | 11.7%), Retail Trade (5,984 | 10.9%), Educational Services (4,914 | 9.0%), and Professional & Scientific (4,345 | 7.9%).
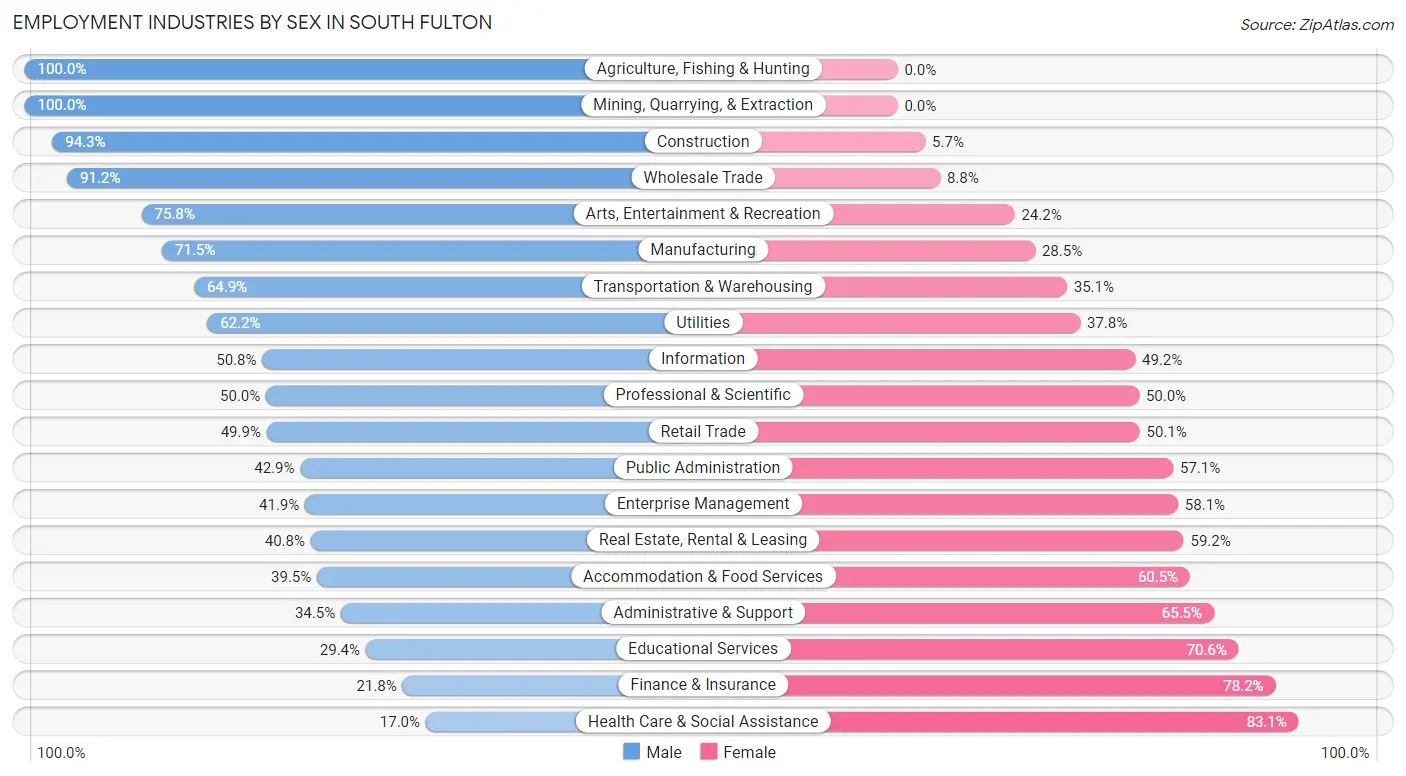
Employment Industries by Sex in South Fulton
The South Fulton industries that see more men than women are Agriculture, Fishing & Hunting (100.0%), Mining, Quarrying, & Extraction (100.0%), and Construction (94.3%), whereas the industries that tend to have a higher number of women are Health Care & Social Assistance (83.1%), Finance & Insurance (78.2%), and Educational Services (70.6%).
| Industry | Male | Female |
| Agriculture, Fishing & Hunting | 24 (100.0%) | 0 (0.0%) |
| Mining, Quarrying, & Extraction | 65 (100.0%) | 0 (0.0%) |
| Construction | 2,215 (94.3%) | 135 (5.7%) |
| Manufacturing | 1,382 (71.5%) | 550 (28.5%) |
| Wholesale Trade | 1,688 (91.2%) | 163 (8.8%) |
| Retail Trade | 2,985 (49.9%) | 2,999 (50.1%) |
| Transportation & Warehousing | 4,167 (64.9%) | 2,250 (35.1%) |
| Utilities | 102 (62.2%) | 62 (37.8%) |
| Information | 990 (50.8%) | 959 (49.2%) |
| Finance & Insurance | 536 (21.8%) | 1,926 (78.2%) |
| Real Estate, Rental & Leasing | 442 (40.8%) | 642 (59.2%) |
| Professional & Scientific | 2,173 (50.0%) | 2,172 (50.0%) |
| Enterprise Management | 26 (41.9%) | 36 (58.1%) |
| Administrative & Support | 1,264 (34.5%) | 2,399 (65.5%) |
| Educational Services | 1,443 (29.4%) | 3,471 (70.6%) |
| Health Care & Social Assistance | 1,342 (17.0%) | 6,575 (83.1%) |
| Arts, Entertainment & Recreation | 1,054 (75.8%) | 337 (24.2%) |
| Accommodation & Food Services | 1,350 (39.5%) | 2,071 (60.5%) |
| Public Administration | 1,427 (42.9%) | 1,897 (57.1%) |
| Total | 25,335 (46.2%) | 29,461 (53.8%) |
Education in South Fulton
School Enrollment in South Fulton
The most common levels of schooling among the 30,682 students in South Fulton are high school (8,440 | 27.5%), middle school (6,278 | 20.5%), and college / undergraduate (5,683 | 18.5%).
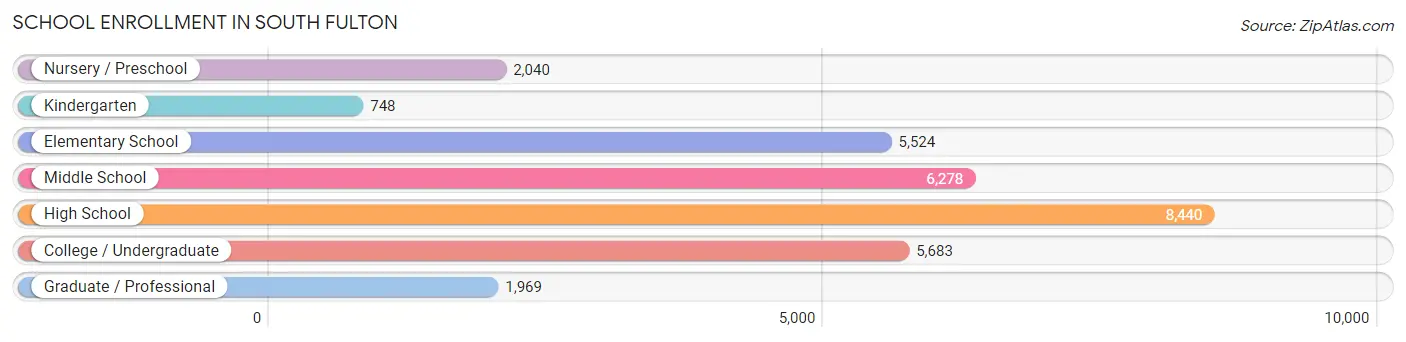
| School Level | # Students | % Students |
| Nursery / Preschool | 2,040 | 6.7% |
| Kindergarten | 748 | 2.4% |
| Elementary School | 5,524 | 18.0% |
| Middle School | 6,278 | 20.5% |
| High School | 8,440 | 27.5% |
| College / Undergraduate | 5,683 | 18.5% |
| Graduate / Professional | 1,969 | 6.4% |
| Total | 30,682 | 100.0% |
School Enrollment by Age by Funding Source in South Fulton
Out of a total of 30,682 students who are enrolled in schools in South Fulton, 3,958 (12.9%) attend a private institution, while the remaining 26,724 (87.1%) are enrolled in public schools. The age group of 35 years and over has the highest likelihood of being enrolled in private schools, with 966 (45.2% in the age bracket) enrolled. Conversely, the age group of 15 to 17 year olds has the lowest likelihood of being enrolled in a private school, with 5,005 (96.2% in the age bracket) attending a public institution.
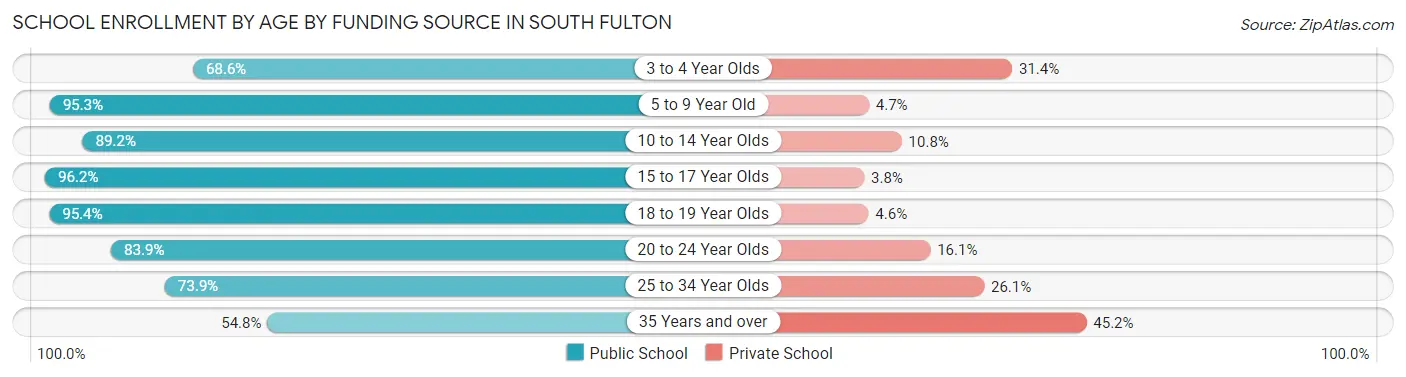
| Age Bracket | Public School | Private School |
| 3 to 4 Year Olds | 1,265 (68.6%) | 578 (31.4%) |
| 5 to 9 Year Old | 5,241 (95.3%) | 258 (4.7%) |
| 10 to 14 Year Olds | 7,664 (89.2%) | 928 (10.8%) |
| 15 to 17 Year Olds | 5,005 (96.2%) | 198 (3.8%) |
| 18 to 19 Year Olds | 2,873 (95.4%) | 139 (4.6%) |
| 20 to 24 Year Olds | 2,211 (83.9%) | 425 (16.1%) |
| 25 to 34 Year Olds | 1,300 (73.9%) | 460 (26.1%) |
| 35 Years and over | 1,171 (54.8%) | 966 (45.2%) |
| Total | 26,724 (87.1%) | 3,958 (12.9%) |
Educational Attainment by Field of Study in South Fulton
Business (8,787 | 29.7%), education (3,619 | 12.2%), science & technology (2,797 | 9.5%), arts & humanities (2,777 | 9.4%), and social sciences (2,177 | 7.4%) are the most common fields of study among 29,559 individuals in South Fulton who have obtained a bachelor's degree or higher.
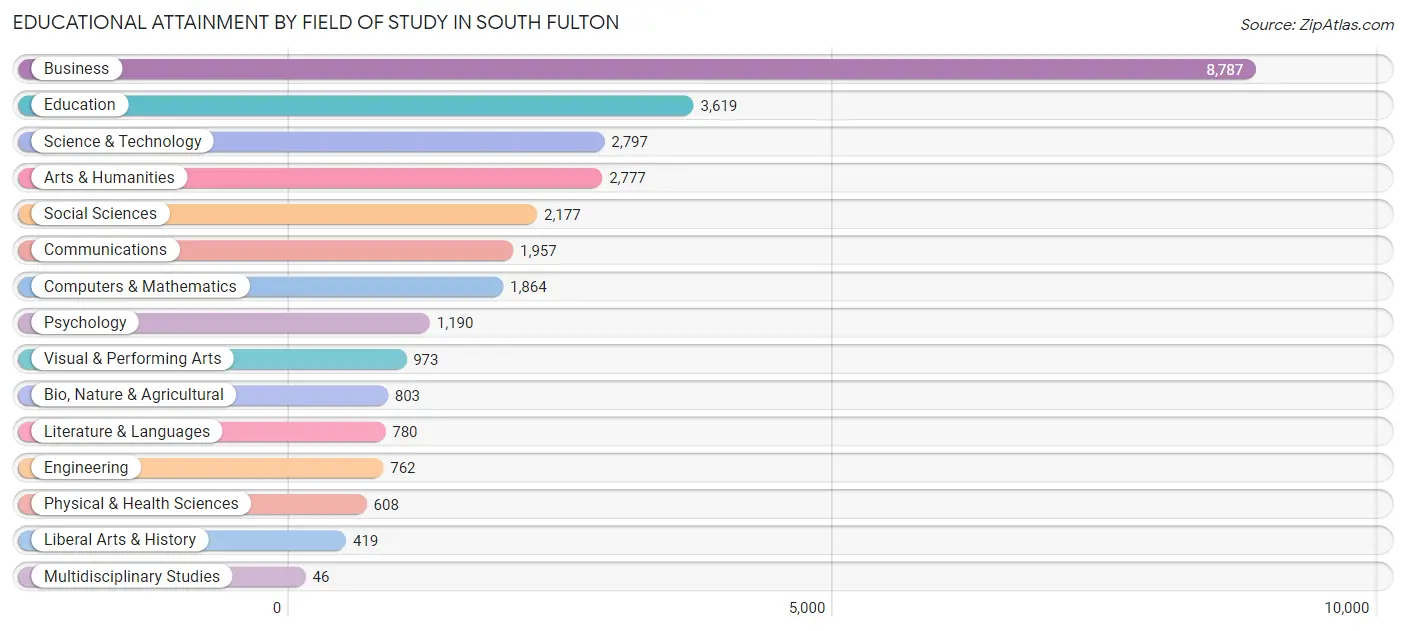
| Field of Study | # Graduates | % Graduates |
| Computers & Mathematics | 1,864 | 6.3% |
| Bio, Nature & Agricultural | 803 | 2.7% |
| Physical & Health Sciences | 608 | 2.1% |
| Psychology | 1,190 | 4.0% |
| Social Sciences | 2,177 | 7.4% |
| Engineering | 762 | 2.6% |
| Multidisciplinary Studies | 46 | 0.2% |
| Science & Technology | 2,797 | 9.5% |
| Business | 8,787 | 29.7% |
| Education | 3,619 | 12.2% |
| Literature & Languages | 780 | 2.6% |
| Liberal Arts & History | 419 | 1.4% |
| Visual & Performing Arts | 973 | 3.3% |
| Communications | 1,957 | 6.6% |
| Arts & Humanities | 2,777 | 9.4% |
| Total | 29,559 | 100.0% |
Transportation & Commute in South Fulton
Vehicle Availability by Sex in South Fulton
The most prevalent vehicle ownership categories in South Fulton are males with 2 vehicles (10,642, accounting for 42.1%) and females with 2 vehicles (11,380, making up 37.2%).
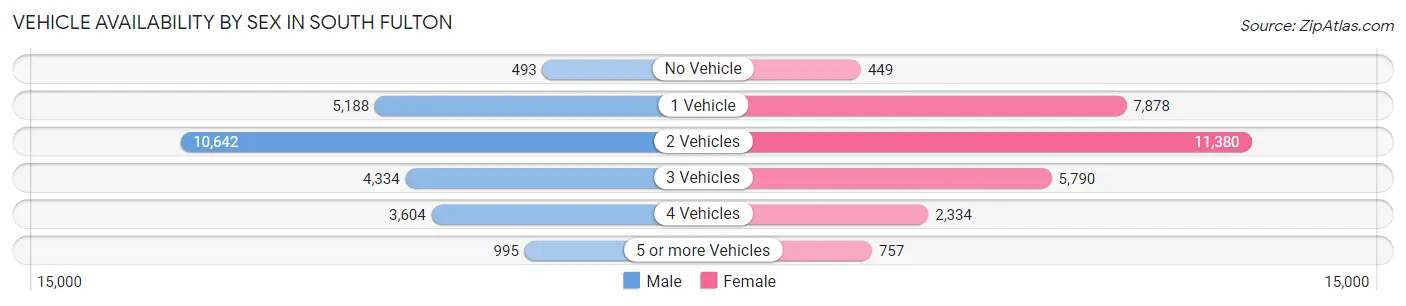
| Vehicles Available | Male | Female |
| No Vehicle | 493 (1.9%) | 449 (1.6%) |
| 1 Vehicle | 5,188 (20.5%) | 7,878 (27.6%) |
| 2 Vehicles | 10,642 (42.1%) | 11,380 (39.8%) |
| 3 Vehicles | 4,334 (17.2%) | 5,790 (20.3%) |
| 4 Vehicles | 3,604 (14.3%) | 2,334 (8.2%) |
| 5 or more Vehicles | 995 (3.9%) | 757 (2.6%) |
| Total | 25,256 (100.0%) | 28,588 (100.0%) |
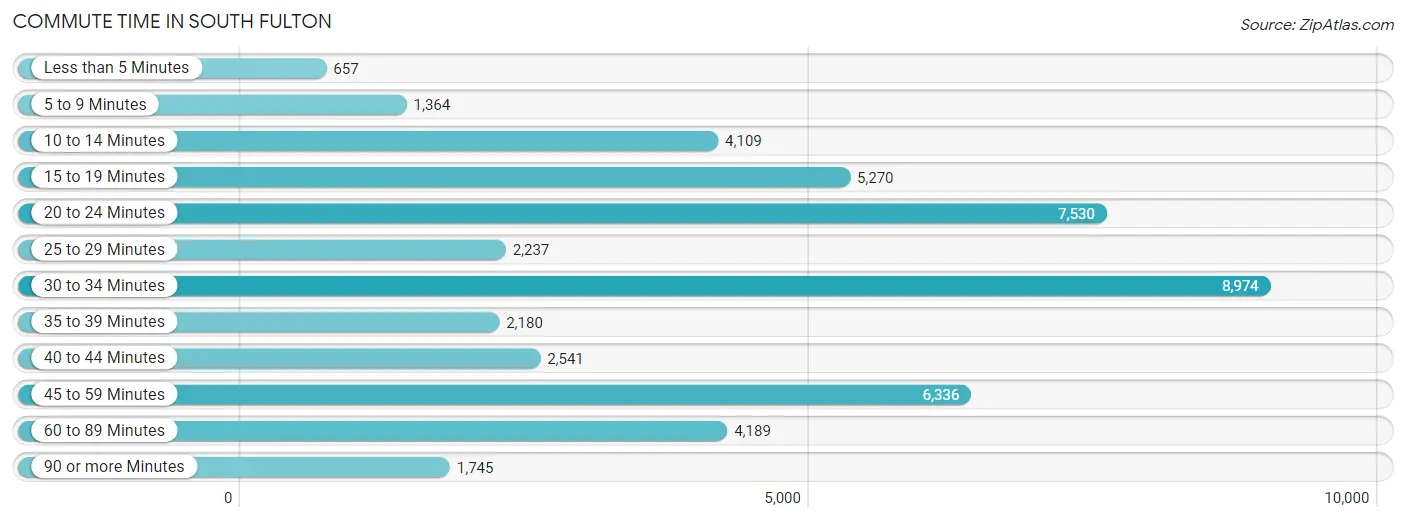
Commute Time in South Fulton
The most frequently occuring commute durations in South Fulton are 30 to 34 minutes (8,974 commuters, 19.0%), 20 to 24 minutes (7,530 commuters, 16.0%), and 45 to 59 minutes (6,336 commuters, 13.4%).
| Commute Time | # Commuters | % Commuters |
| Less than 5 Minutes | 657 | 1.4% |
| 5 to 9 Minutes | 1,364 | 2.9% |
| 10 to 14 Minutes | 4,109 | 8.7% |
| 15 to 19 Minutes | 5,270 | 11.2% |
| 20 to 24 Minutes | 7,530 | 16.0% |
| 25 to 29 Minutes | 2,237 | 4.8% |
| 30 to 34 Minutes | 8,974 | 19.0% |
| 35 to 39 Minutes | 2,180 | 4.6% |
| 40 to 44 Minutes | 2,541 | 5.4% |
| 45 to 59 Minutes | 6,336 | 13.4% |
| 60 to 89 Minutes | 4,189 | 8.9% |
| 90 or more Minutes | 1,745 | 3.7% |
Commute Time by Sex in South Fulton
The most common commute times in South Fulton are 20 to 24 minutes (4,449 commuters, 19.6%) for males and 30 to 34 minutes (5,244 commuters, 21.4%) for females.
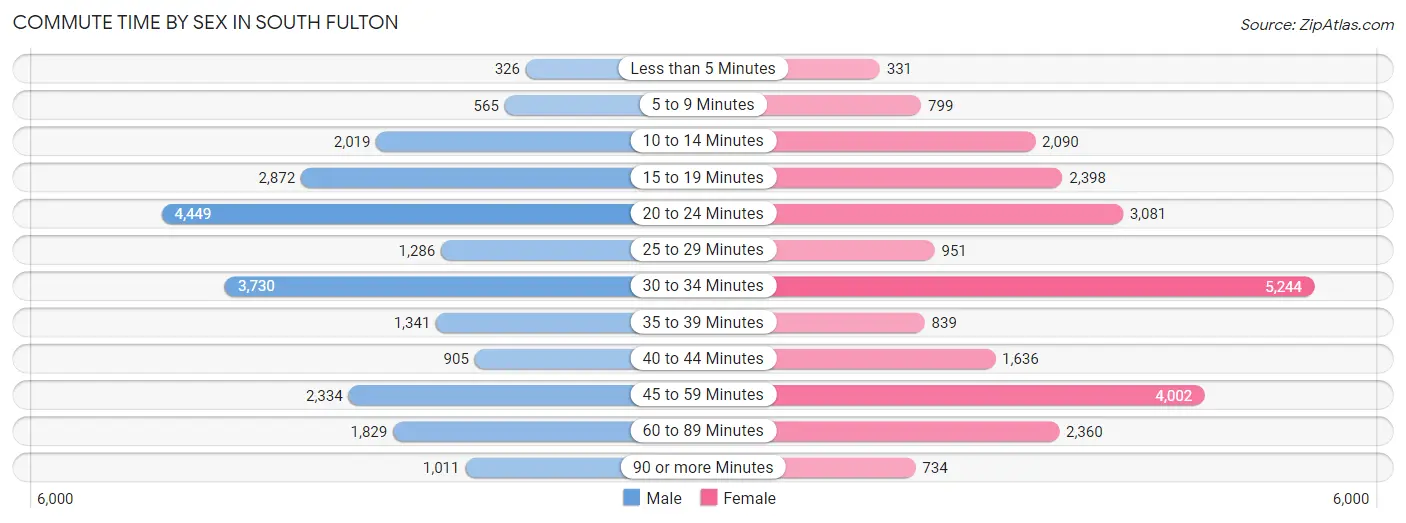
| Commute Time | Male | Female |
| Less than 5 Minutes | 326 (1.4%) | 331 (1.3%) |
| 5 to 9 Minutes | 565 (2.5%) | 799 (3.3%) |
| 10 to 14 Minutes | 2,019 (8.9%) | 2,090 (8.5%) |
| 15 to 19 Minutes | 2,872 (12.7%) | 2,398 (9.8%) |
| 20 to 24 Minutes | 4,449 (19.6%) | 3,081 (12.6%) |
| 25 to 29 Minutes | 1,286 (5.7%) | 951 (3.9%) |
| 30 to 34 Minutes | 3,730 (16.5%) | 5,244 (21.4%) |
| 35 to 39 Minutes | 1,341 (5.9%) | 839 (3.4%) |
| 40 to 44 Minutes | 905 (4.0%) | 1,636 (6.7%) |
| 45 to 59 Minutes | 2,334 (10.3%) | 4,002 (16.4%) |
| 60 to 89 Minutes | 1,829 (8.1%) | 2,360 (9.7%) |
| 90 or more Minutes | 1,011 (4.5%) | 734 (3.0%) |
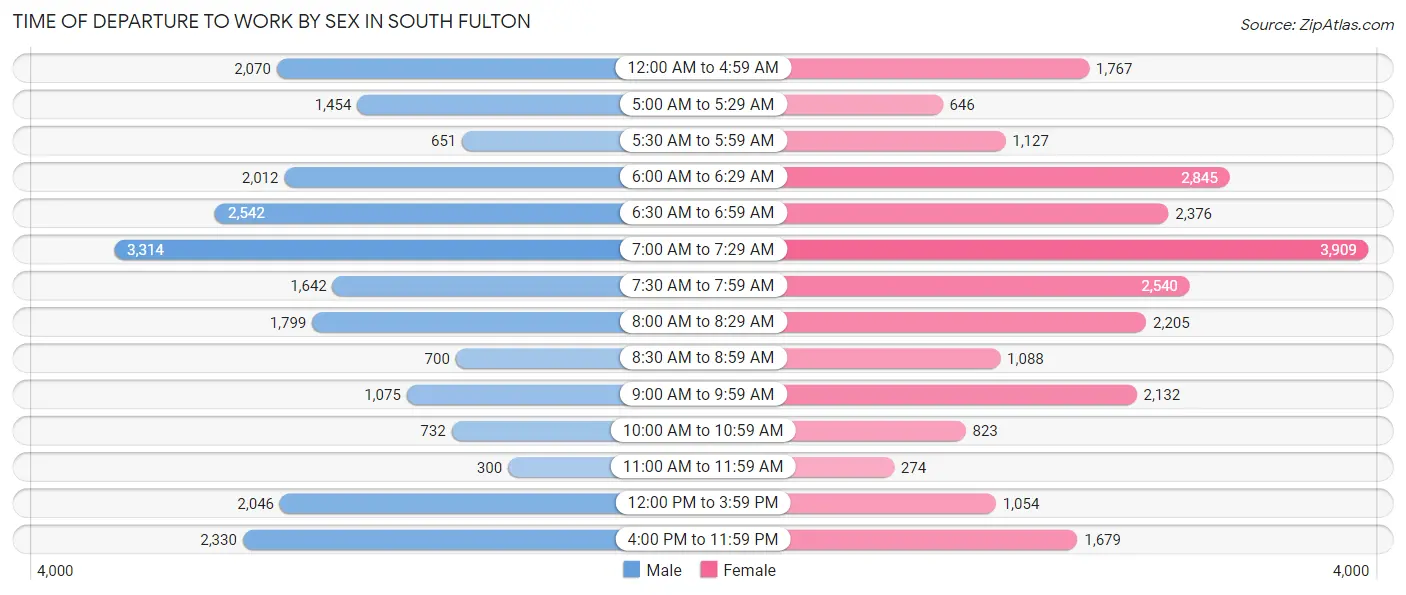
Time of Departure to Work by Sex in South Fulton
The most frequent times of departure to work in South Fulton are 7:00 AM to 7:29 AM (3,314, 14.6%) for males and 7:00 AM to 7:29 AM (3,909, 16.0%) for females.
| Time of Departure | Male | Female |
| 12:00 AM to 4:59 AM | 2,070 (9.1%) | 1,767 (7.2%) |
| 5:00 AM to 5:29 AM | 1,454 (6.4%) | 646 (2.6%) |
| 5:30 AM to 5:59 AM | 651 (2.9%) | 1,127 (4.6%) |
| 6:00 AM to 6:29 AM | 2,012 (8.9%) | 2,845 (11.6%) |
| 6:30 AM to 6:59 AM | 2,542 (11.2%) | 2,376 (9.7%) |
| 7:00 AM to 7:29 AM | 3,314 (14.6%) | 3,909 (16.0%) |
| 7:30 AM to 7:59 AM | 1,642 (7.2%) | 2,540 (10.4%) |
| 8:00 AM to 8:29 AM | 1,799 (7.9%) | 2,205 (9.0%) |
| 8:30 AM to 8:59 AM | 700 (3.1%) | 1,088 (4.4%) |
| 9:00 AM to 9:59 AM | 1,075 (4.7%) | 2,132 (8.7%) |
| 10:00 AM to 10:59 AM | 732 (3.2%) | 823 (3.4%) |
| 11:00 AM to 11:59 AM | 300 (1.3%) | 274 (1.1%) |
| 12:00 PM to 3:59 PM | 2,046 (9.0%) | 1,054 (4.3%) |
| 4:00 PM to 11:59 PM | 2,330 (10.3%) | 1,679 (6.9%) |
| Total | 22,667 (100.0%) | 24,465 (100.0%) |
Housing Occupancy in South Fulton
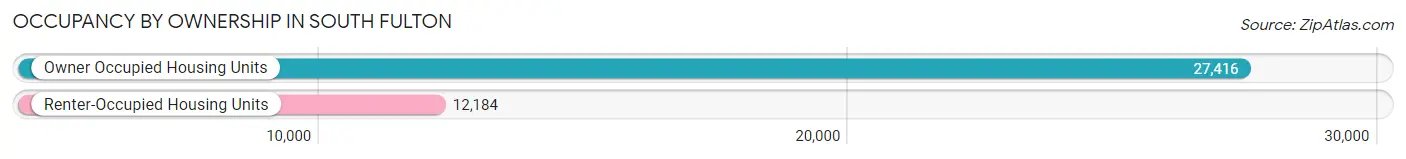
Occupancy by Ownership in South Fulton
Of the total 39,600 dwellings in South Fulton, owner-occupied units account for 27,416 (69.2%), while renter-occupied units make up 12,184 (30.8%).
| Occupancy | # Housing Units | % Housing Units |
| Owner Occupied Housing Units | 27,416 | 69.2% |
| Renter-Occupied Housing Units | 12,184 | 30.8% |
| Total Occupied Housing Units | 39,600 | 100.0% |
Occupancy by Household Size in South Fulton
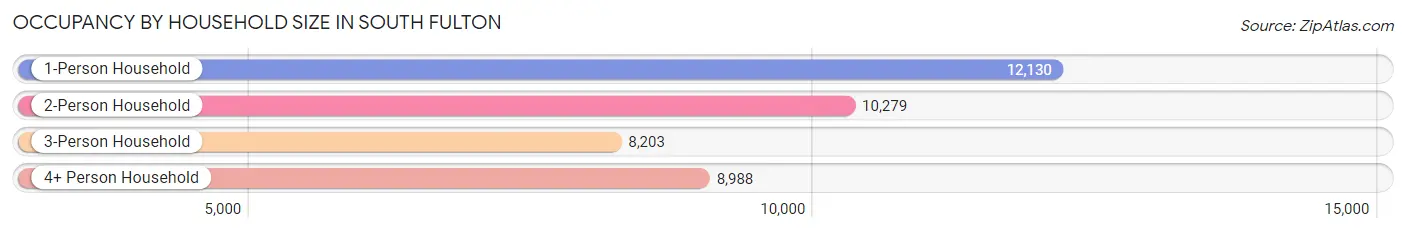
| Household Size | # Housing Units | % Housing Units |
| 1-Person Household | 12,130 | 30.6% |
| 2-Person Household | 10,279 | 26.0% |
| 3-Person Household | 8,203 | 20.7% |
| 4+ Person Household | 8,988 | 22.7% |
| Total Housing Units | 39,600 | 100.0% |
Occupancy by Ownership by Household Size in South Fulton
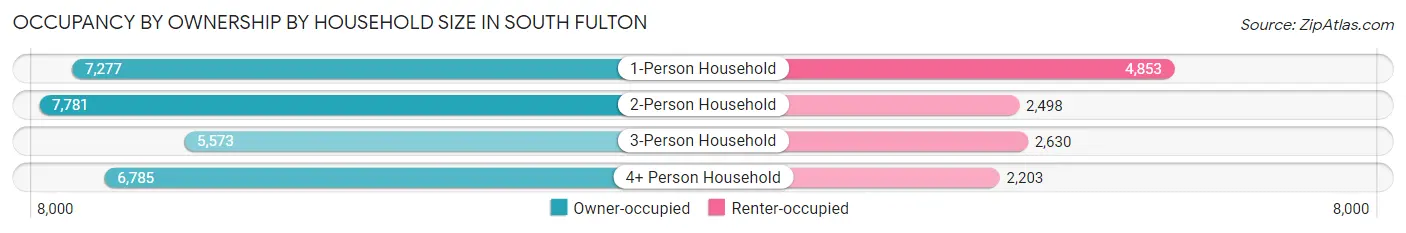
| Household Size | Owner-occupied | Renter-occupied |
| 1-Person Household | 7,277 (60.0%) | 4,853 (40.0%) |
| 2-Person Household | 7,781 (75.7%) | 2,498 (24.3%) |
| 3-Person Household | 5,573 (67.9%) | 2,630 (32.1%) |
| 4+ Person Household | 6,785 (75.5%) | 2,203 (24.5%) |
| Total Housing Units | 27,416 (69.2%) | 12,184 (30.8%) |
Occupancy by Educational Attainment in South Fulton
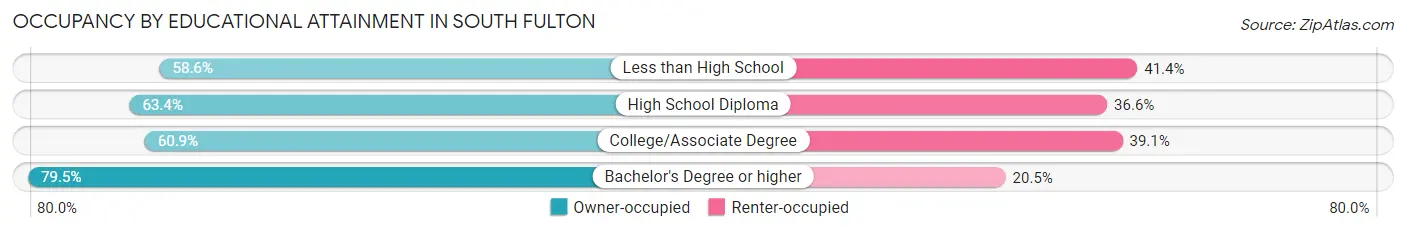
| Household Size | Owner-occupied | Renter-occupied |
| Less than High School | 1,250 (58.6%) | 884 (41.4%) |
| High School Diploma | 6,510 (63.4%) | 3,764 (36.6%) |
| College/Associate Degree | 6,412 (60.9%) | 4,113 (39.1%) |
| Bachelor's Degree or higher | 13,244 (79.5%) | 3,423 (20.5%) |
Occupancy by Age of Householder in South Fulton
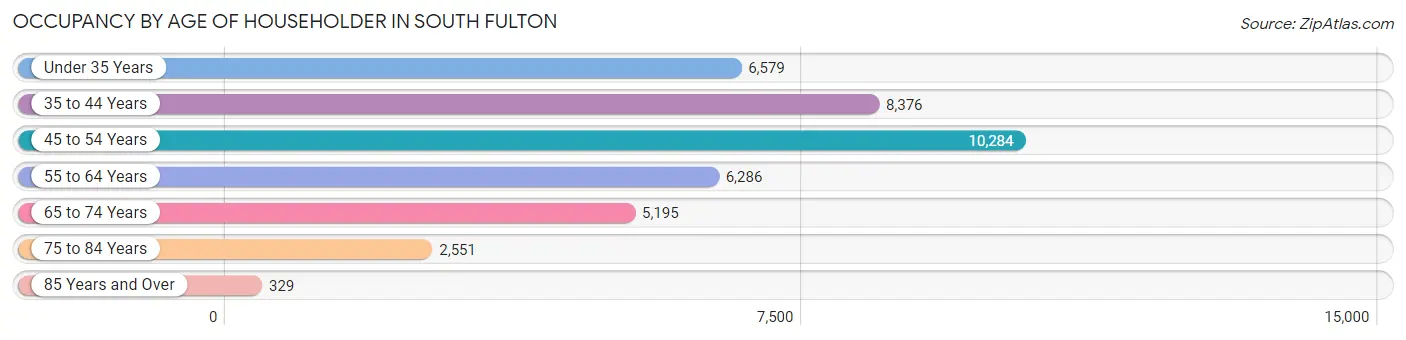
| Age Bracket | # Households | % Households |
| Under 35 Years | 6,579 | 16.6% |
| 35 to 44 Years | 8,376 | 21.1% |
| 45 to 54 Years | 10,284 | 26.0% |
| 55 to 64 Years | 6,286 | 15.9% |
| 65 to 74 Years | 5,195 | 13.1% |
| 75 to 84 Years | 2,551 | 6.4% |
| 85 Years and Over | 329 | 0.8% |
| Total | 39,600 | 100.0% |
Housing Finances in South Fulton
Median Income by Occupancy in South Fulton
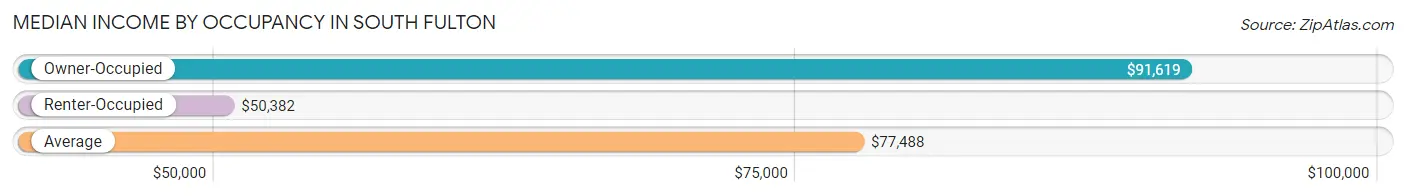
| Occupancy Type | # Households | Median Income |
| Owner-Occupied | 27,416 (69.2%) | $91,619 |
| Renter-Occupied | 12,184 (30.8%) | $50,382 |
| Average | 39,600 (100.0%) | $77,488 |
Occupancy by Householder Income Bracket in South Fulton
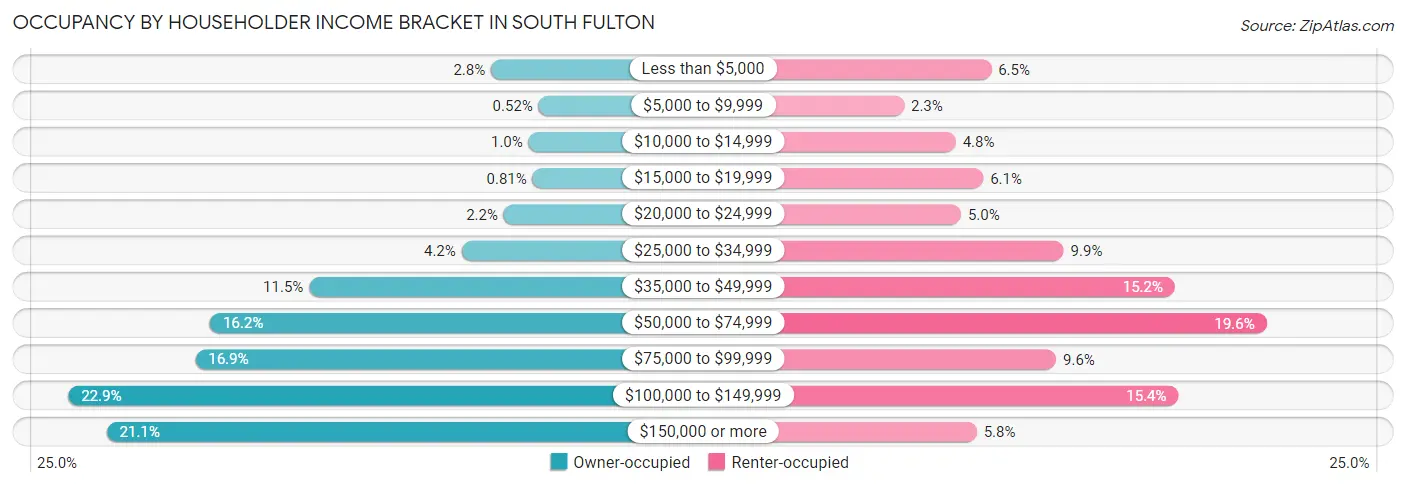
| Income Bracket | Owner-occupied | Renter-occupied |
| Less than $5,000 | 764 (2.8%) | 787 (6.5%) |
| $5,000 to $9,999 | 143 (0.5%) | 281 (2.3%) |
| $10,000 to $14,999 | 274 (1.0%) | 581 (4.8%) |
| $15,000 to $19,999 | 222 (0.8%) | 741 (6.1%) |
| $20,000 to $24,999 | 599 (2.2%) | 612 (5.0%) |
| $25,000 to $34,999 | 1,148 (4.2%) | 1,207 (9.9%) |
| $35,000 to $49,999 | 3,139 (11.5%) | 1,852 (15.2%) |
| $50,000 to $74,999 | 4,434 (16.2%) | 2,384 (19.6%) |
| $75,000 to $99,999 | 4,626 (16.9%) | 1,163 (9.6%) |
| $100,000 to $149,999 | 6,283 (22.9%) | 1,873 (15.4%) |
| $150,000 or more | 5,784 (21.1%) | 703 (5.8%) |
| Total | 27,416 (100.0%) | 12,184 (100.0%) |
Monthly Housing Cost Tiers in South Fulton
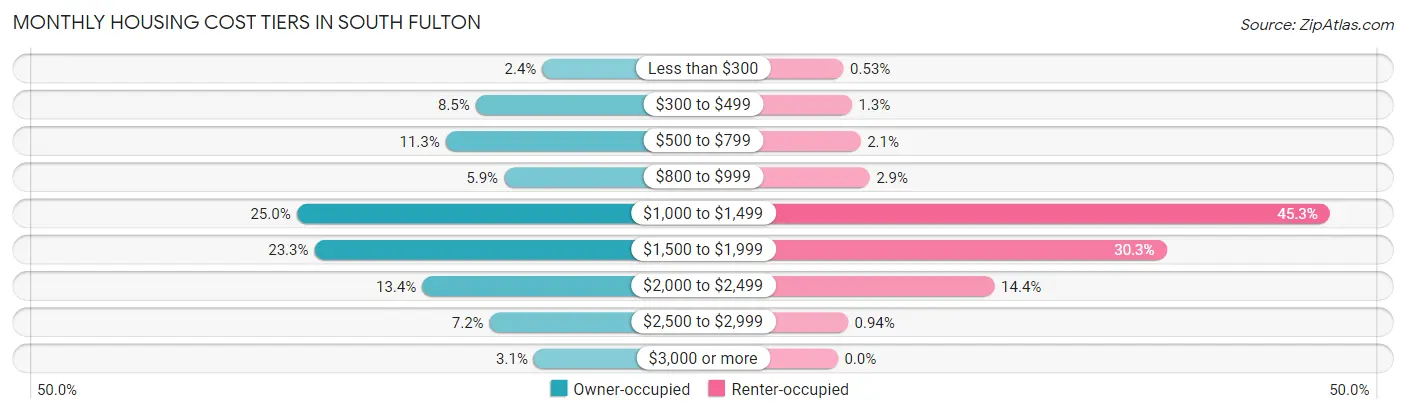
| Monthly Cost | Owner-occupied | Renter-occupied |
| Less than $300 | 645 (2.4%) | 64 (0.5%) |
| $300 to $499 | 2,324 (8.5%) | 158 (1.3%) |
| $500 to $799 | 3,084 (11.3%) | 256 (2.1%) |
| $800 to $999 | 1,609 (5.9%) | 357 (2.9%) |
| $1,000 to $1,499 | 6,846 (25.0%) | 5,520 (45.3%) |
| $1,500 to $1,999 | 6,397 (23.3%) | 3,689 (30.3%) |
| $2,000 to $2,499 | 3,677 (13.4%) | 1,758 (14.4%) |
| $2,500 to $2,999 | 1,976 (7.2%) | 114 (0.9%) |
| $3,000 or more | 858 (3.1%) | 0 (0.0%) |
| Total | 27,416 (100.0%) | 12,184 (100.0%) |
Physical Housing Characteristics in South Fulton
Housing Structures in South Fulton
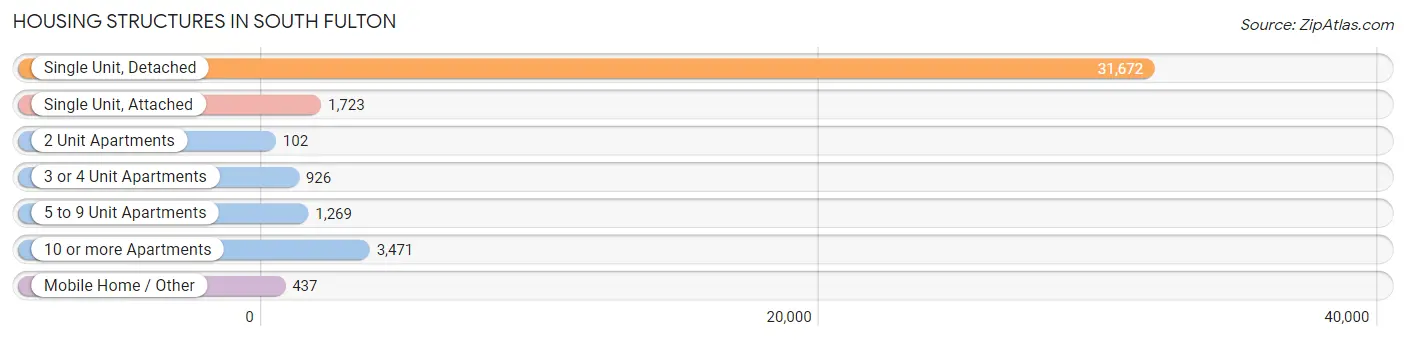
| Structure Type | # Housing Units | % Housing Units |
| Single Unit, Detached | 31,672 | 80.0% |
| Single Unit, Attached | 1,723 | 4.3% |
| 2 Unit Apartments | 102 | 0.3% |
| 3 or 4 Unit Apartments | 926 | 2.3% |
| 5 to 9 Unit Apartments | 1,269 | 3.2% |
| 10 or more Apartments | 3,471 | 8.8% |
| Mobile Home / Other | 437 | 1.1% |
| Total | 39,600 | 100.0% |
Housing Structures by Occupancy in South Fulton
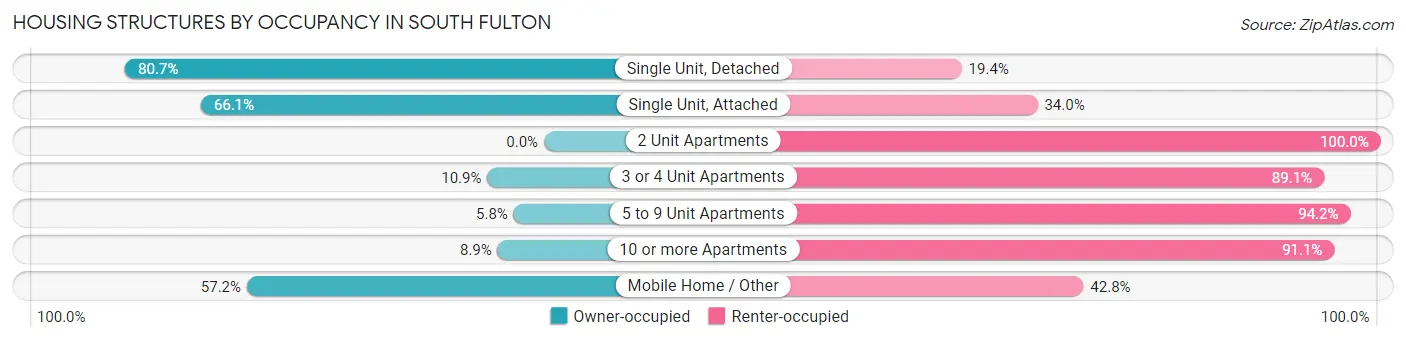
| Structure Type | Owner-occupied | Renter-occupied |
| Single Unit, Detached | 25,543 (80.6%) | 6,129 (19.4%) |
| Single Unit, Attached | 1,138 (66.0%) | 585 (34.0%) |
| 2 Unit Apartments | 0 (0.0%) | 102 (100.0%) |
| 3 or 4 Unit Apartments | 101 (10.9%) | 825 (89.1%) |
| 5 to 9 Unit Apartments | 74 (5.8%) | 1,195 (94.2%) |
| 10 or more Apartments | 310 (8.9%) | 3,161 (91.1%) |
| Mobile Home / Other | 250 (57.2%) | 187 (42.8%) |
| Total | 27,416 (69.2%) | 12,184 (30.8%) |
Housing Structures by Number of Rooms in South Fulton
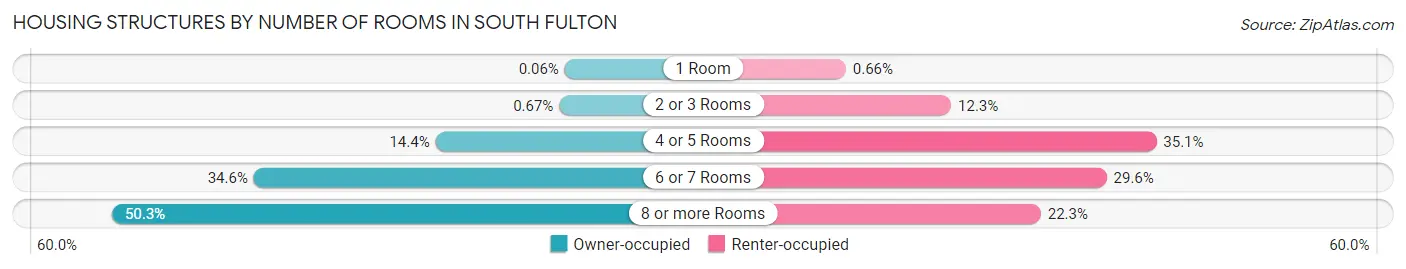
| Number of Rooms | Owner-occupied | Renter-occupied |
| 1 Room | 16 (0.1%) | 80 (0.7%) |
| 2 or 3 Rooms | 185 (0.7%) | 1,503 (12.3%) |
| 4 or 5 Rooms | 3,947 (14.4%) | 4,279 (35.1%) |
| 6 or 7 Rooms | 9,478 (34.6%) | 3,606 (29.6%) |
| 8 or more Rooms | 13,790 (50.3%) | 2,716 (22.3%) |
| Total | 27,416 (100.0%) | 12,184 (100.0%) |
Housing Structure by Heating Type in South Fulton
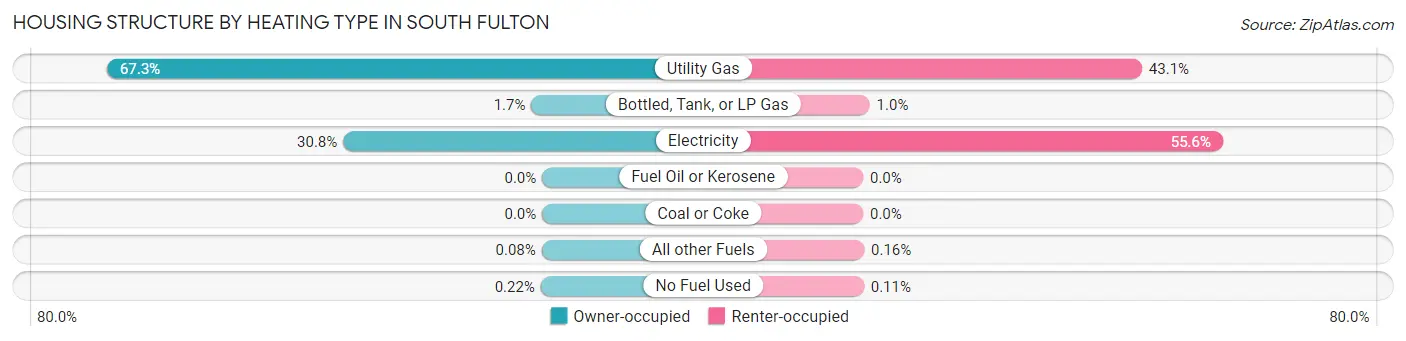
| Heating Type | Owner-occupied | Renter-occupied |
| Utility Gas | 18,443 (67.3%) | 5,252 (43.1%) |
| Bottled, Tank, or LP Gas | 457 (1.7%) | 124 (1.0%) |
| Electricity | 8,434 (30.8%) | 6,776 (55.6%) |
| Fuel Oil or Kerosene | 0 (0.0%) | 0 (0.0%) |
| Coal or Coke | 0 (0.0%) | 0 (0.0%) |
| All other Fuels | 23 (0.1%) | 19 (0.2%) |
| No Fuel Used | 59 (0.2%) | 13 (0.1%) |
| Total | 27,416 (100.0%) | 12,184 (100.0%) |
Household Vehicle Usage in South Fulton
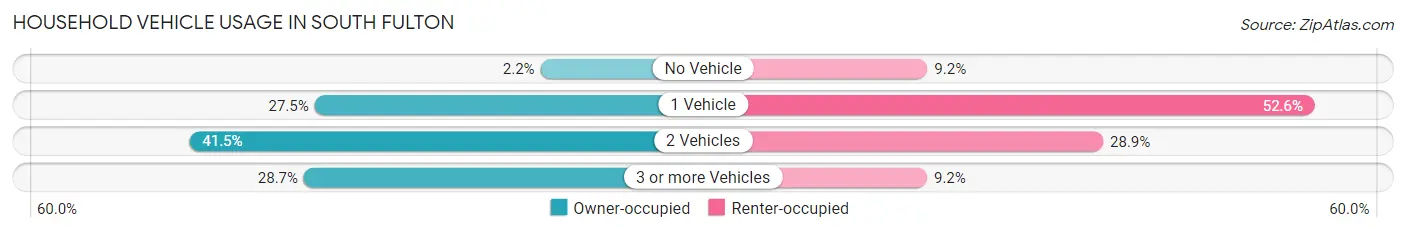
| Vehicles per Household | Owner-occupied | Renter-occupied |
| No Vehicle | 610 (2.2%) | 1,126 (9.2%) |
| 1 Vehicle | 7,545 (27.5%) | 6,413 (52.6%) |
| 2 Vehicles | 11,388 (41.5%) | 3,524 (28.9%) |
| 3 or more Vehicles | 7,873 (28.7%) | 1,121 (9.2%) |
| Total | 27,416 (100.0%) | 12,184 (100.0%) |
Real Estate & Mortgages in South Fulton
Real Estate and Mortgage Overview in South Fulton
| Characteristic | Without Mortgage | With Mortgage |
| Housing Units | 5,916 | 21,500 |
| Median Property Value | $183,500 | $259,900 |
| Median Household Income | $63,460 | $5,064 |
| Monthly Housing Costs | $511 | $858 |
| Real Estate Taxes | $1,248 | $957 |
Property Value by Mortgage Status in South Fulton
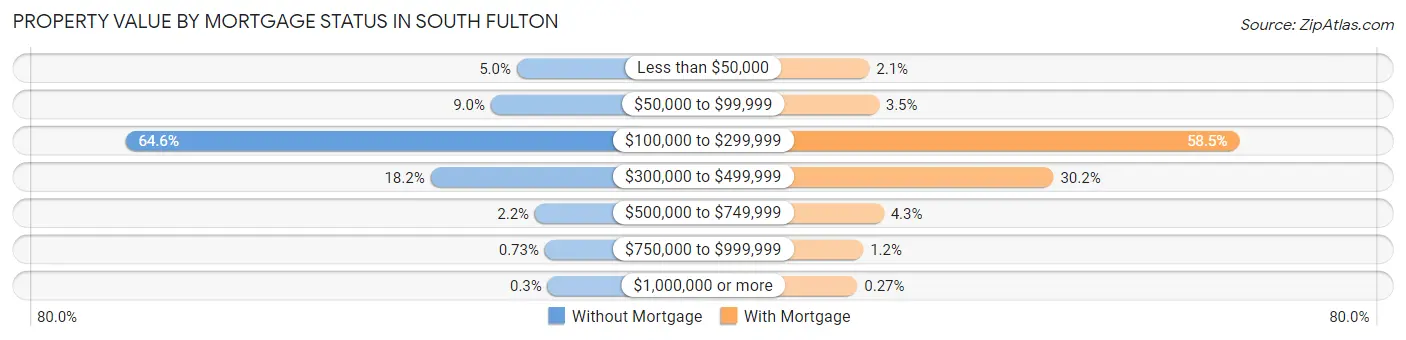
| Property Value | Without Mortgage | With Mortgage |
| Less than $50,000 | 296 (5.0%) | 452 (2.1%) |
| $50,000 to $99,999 | 530 (9.0%) | 762 (3.5%) |
| $100,000 to $299,999 | 3,823 (64.6%) | 12,569 (58.5%) |
| $300,000 to $499,999 | 1,074 (18.1%) | 6,484 (30.2%) |
| $500,000 to $749,999 | 132 (2.2%) | 923 (4.3%) |
| $750,000 to $999,999 | 43 (0.7%) | 251 (1.2%) |
| $1,000,000 or more | 18 (0.3%) | 59 (0.3%) |
| Total | 5,916 (100.0%) | 21,500 (100.0%) |
Household Income by Mortgage Status in South Fulton
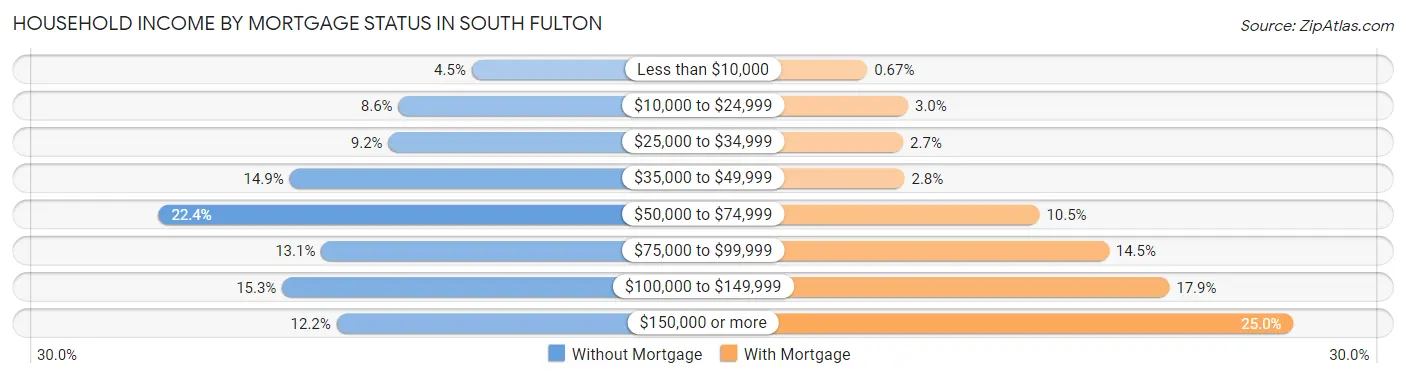
| Household Income | Without Mortgage | With Mortgage |
| Less than $10,000 | 263 (4.4%) | 143 (0.7%) |
| $10,000 to $24,999 | 511 (8.6%) | 644 (3.0%) |
| $25,000 to $34,999 | 545 (9.2%) | 584 (2.7%) |
| $35,000 to $49,999 | 879 (14.9%) | 603 (2.8%) |
| $50,000 to $74,999 | 1,322 (22.4%) | 2,260 (10.5%) |
| $75,000 to $99,999 | 772 (13.1%) | 3,112 (14.5%) |
| $100,000 to $149,999 | 904 (15.3%) | 3,854 (17.9%) |
| $150,000 or more | 720 (12.2%) | 5,379 (25.0%) |
| Total | 5,916 (100.0%) | 21,500 (100.0%) |
Property Value to Household Income Ratio in South Fulton
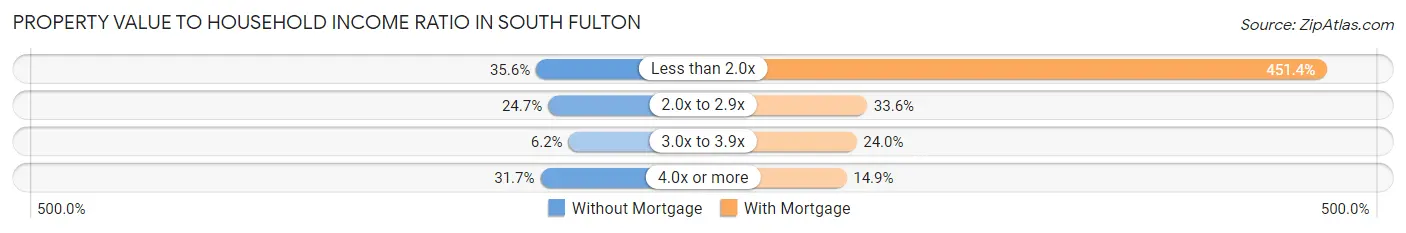
| Value-to-Income Ratio | Without Mortgage | With Mortgage |
| Less than 2.0x | 2,108 (35.6%) | 97,055 (451.4%) |
| 2.0x to 2.9x | 1,463 (24.7%) | 7,222 (33.6%) |
| 3.0x to 3.9x | 367 (6.2%) | 5,150 (23.9%) |
| 4.0x or more | 1,875 (31.7%) | 3,192 (14.8%) |
| Total | 5,916 (100.0%) | 21,500 (100.0%) |
Real Estate Taxes by Mortgage Status in South Fulton
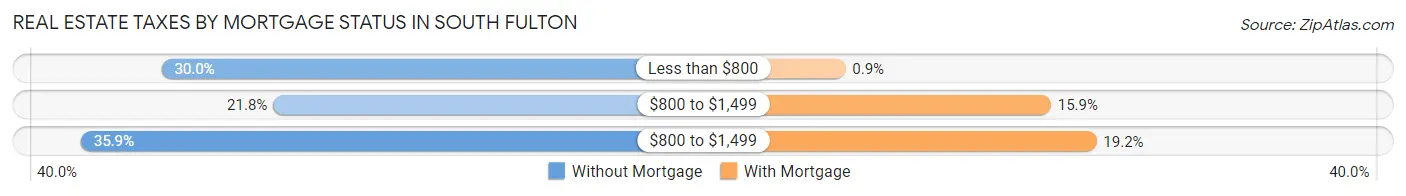
| Property Taxes | Without Mortgage | With Mortgage |
| Less than $800 | 1,775 (30.0%) | 194 (0.9%) |
| $800 to $1,499 | 1,292 (21.8%) | 3,421 (15.9%) |
| $800 to $1,499 | 2,123 (35.9%) | 4,136 (19.2%) |
| Total | 5,916 (100.0%) | 21,500 (100.0%) |
Health & Disability in South Fulton
Health Insurance Coverage by Age in South Fulton
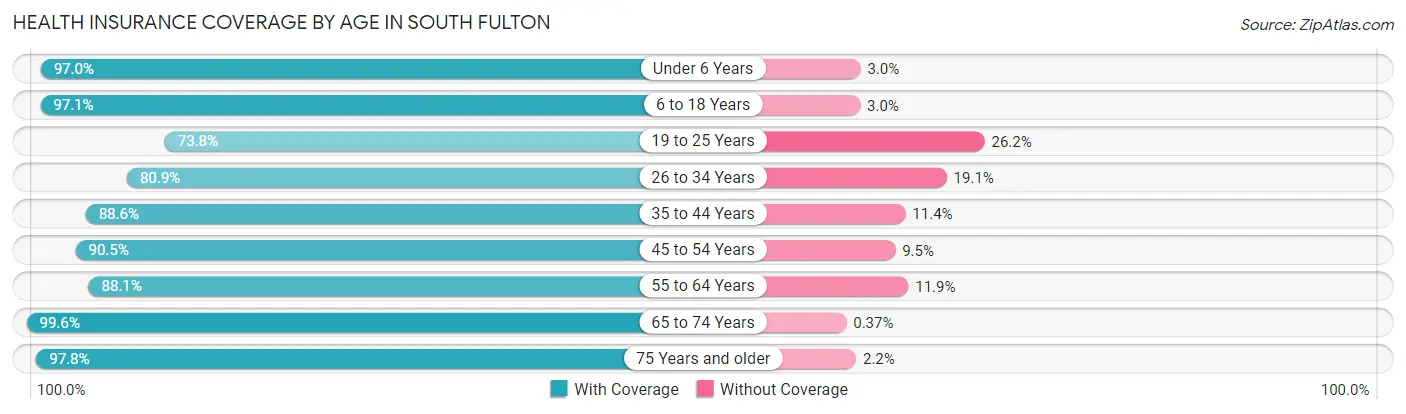
| Age Bracket | With Coverage | Without Coverage |
| Under 6 Years | 6,659 (97.0%) | 207 (3.0%) |
| 6 to 18 Years | 20,877 (97.1%) | 634 (2.9%) |
| 19 to 25 Years | 7,010 (73.8%) | 2,484 (26.2%) |
| 26 to 34 Years | 10,983 (80.9%) | 2,591 (19.1%) |
| 35 to 44 Years | 13,446 (88.6%) | 1,730 (11.4%) |
| 45 to 54 Years | 16,231 (90.5%) | 1,703 (9.5%) |
| 55 to 64 Years | 9,420 (88.1%) | 1,277 (11.9%) |
| 65 to 74 Years | 7,787 (99.6%) | 29 (0.4%) |
| 75 Years and older | 4,247 (97.8%) | 95 (2.2%) |
| Total | 96,660 (90.0%) | 10,750 (10.0%) |
Health Insurance Coverage by Citizenship Status in South Fulton
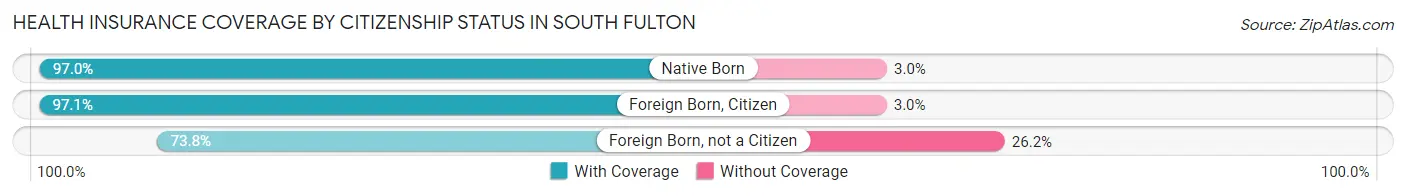
| Citizenship Status | With Coverage | Without Coverage |
| Native Born | 6,659 (97.0%) | 207 (3.0%) |
| Foreign Born, Citizen | 20,877 (97.1%) | 634 (2.9%) |
| Foreign Born, not a Citizen | 7,010 (73.8%) | 2,484 (26.2%) |
Health Insurance Coverage by Household Income in South Fulton
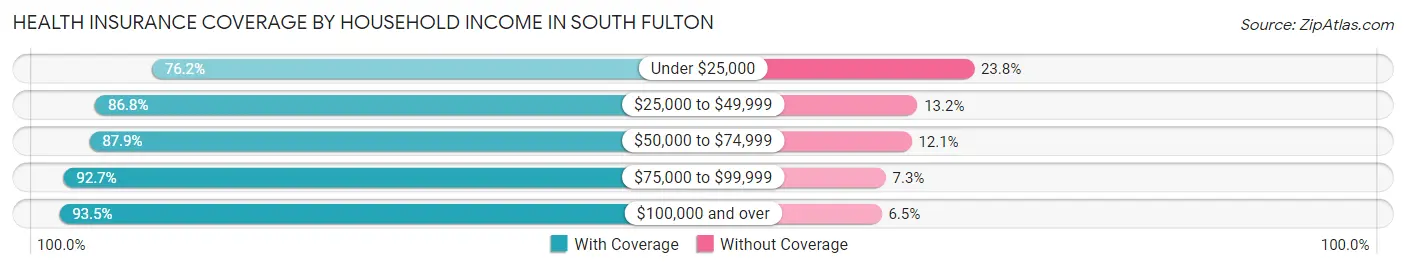
| Household Income | With Coverage | Without Coverage |
| Under $25,000 | 7,057 (76.2%) | 2,208 (23.8%) |
| $25,000 to $49,999 | 15,263 (86.8%) | 2,322 (13.2%) |
| $50,000 to $74,999 | 12,763 (87.9%) | 1,759 (12.1%) |
| $75,000 to $99,999 | 15,664 (92.7%) | 1,228 (7.3%) |
| $100,000 and over | 45,828 (93.5%) | 3,183 (6.5%) |
Public vs Private Health Insurance Coverage by Age in South Fulton
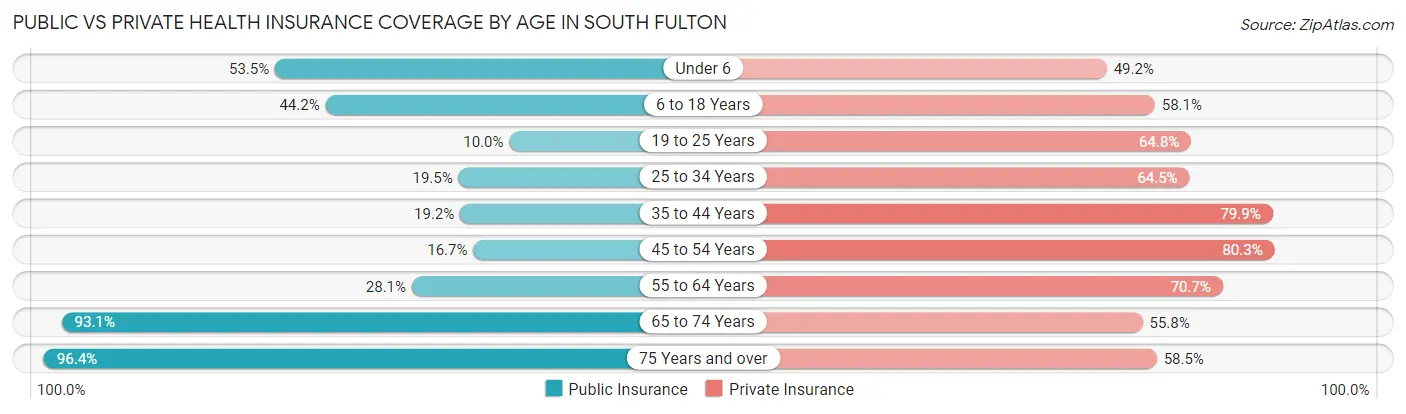
| Age Bracket | Public Insurance | Private Insurance |
| Under 6 | 3,675 (53.5%) | 3,376 (49.2%) |
| 6 to 18 Years | 9,497 (44.2%) | 12,497 (58.1%) |
| 19 to 25 Years | 953 (10.0%) | 6,156 (64.8%) |
| 25 to 34 Years | 2,642 (19.5%) | 8,758 (64.5%) |
| 35 to 44 Years | 2,907 (19.2%) | 12,131 (79.9%) |
| 45 to 54 Years | 2,999 (16.7%) | 14,402 (80.3%) |
| 55 to 64 Years | 3,008 (28.1%) | 7,562 (70.7%) |
| 65 to 74 Years | 7,278 (93.1%) | 4,363 (55.8%) |
| 75 Years and over | 4,186 (96.4%) | 2,538 (58.5%) |
| Total | 37,145 (34.6%) | 71,783 (66.8%) |
Disability Status by Sex by Age in South Fulton
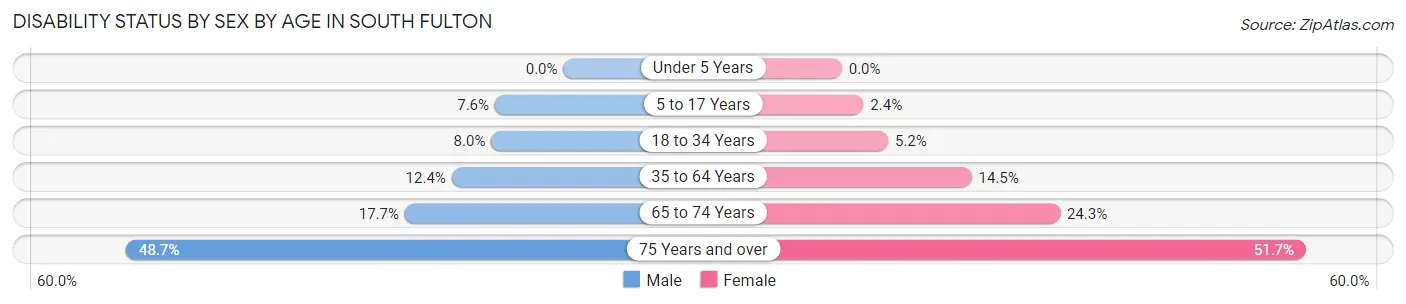
| Age Bracket | Male | Female |
| Under 5 Years | 0 (0.0%) | 0 (0.0%) |
| 5 to 17 Years | 802 (7.6%) | 228 (2.4%) |
| 18 to 34 Years | 937 (8.0%) | 709 (5.1%) |
| 35 to 64 Years | 2,398 (12.4%) | 3,544 (14.4%) |
| 65 to 74 Years | 594 (17.7%) | 1,082 (24.3%) |
| 75 Years and over | 785 (48.7%) | 1,411 (51.7%) |
Disability Class by Sex by Age in South Fulton
Disability Class: Hearing Difficulty
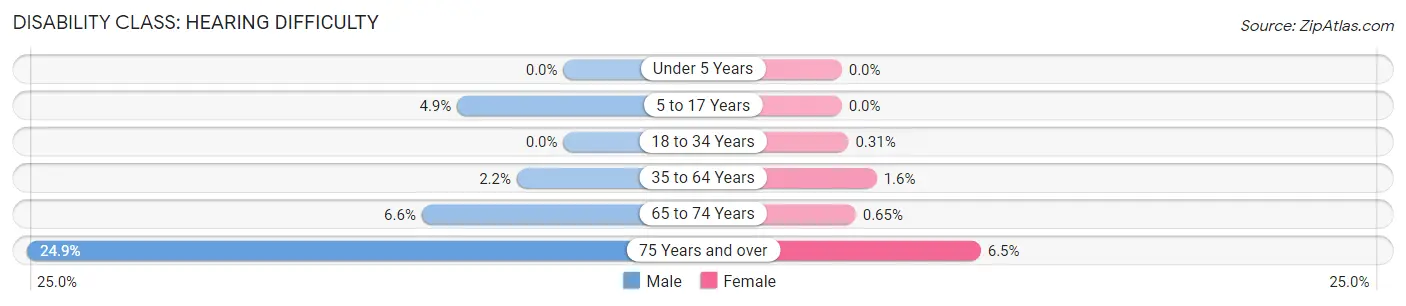
| Age Bracket | Male | Female |
| Under 5 Years | 0 (0.0%) | 0 (0.0%) |
| 5 to 17 Years | 518 (4.9%) | 0 (0.0%) |
| 18 to 34 Years | 0 (0.0%) | 43 (0.3%) |
| 35 to 64 Years | 416 (2.2%) | 398 (1.6%) |
| 65 to 74 Years | 221 (6.6%) | 29 (0.6%) |
| 75 Years and over | 401 (24.9%) | 176 (6.5%) |
Disability Class: Vision Difficulty
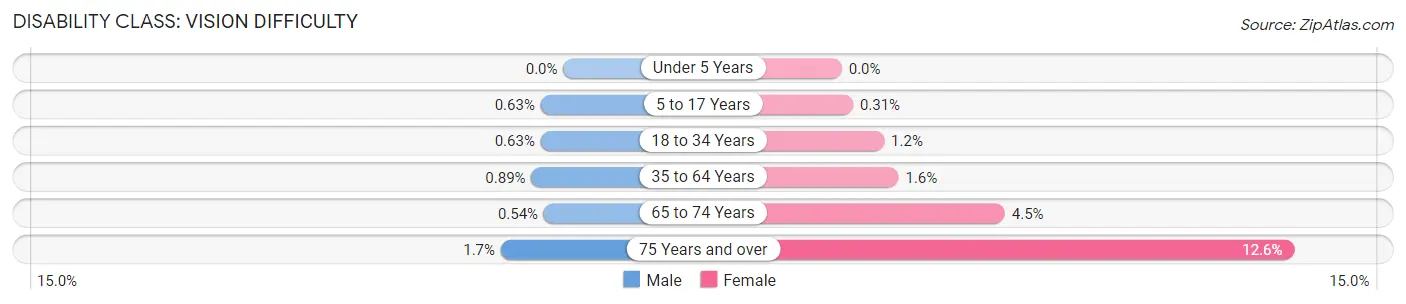
| Age Bracket | Male | Female |
| Under 5 Years | 0 (0.0%) | 0 (0.0%) |
| 5 to 17 Years | 66 (0.6%) | 29 (0.3%) |
| 18 to 34 Years | 74 (0.6%) | 162 (1.2%) |
| 35 to 64 Years | 172 (0.9%) | 388 (1.6%) |
| 65 to 74 Years | 18 (0.5%) | 202 (4.5%) |
| 75 Years and over | 28 (1.7%) | 344 (12.6%) |
Disability Class: Cognitive Difficulty
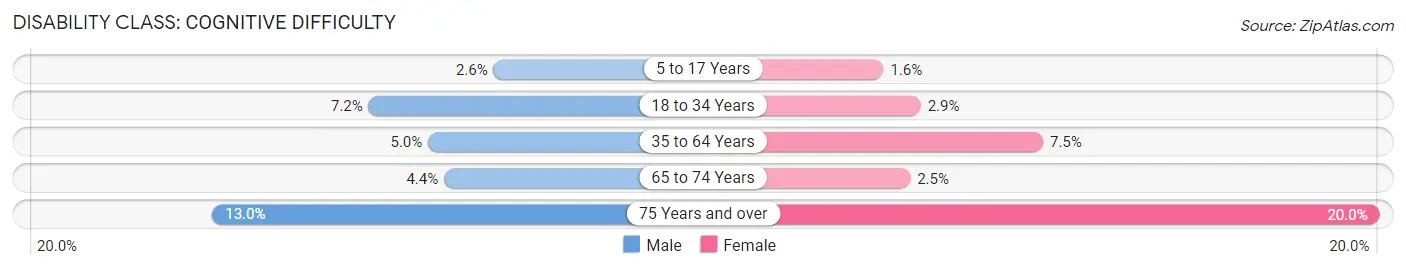
| Age Bracket | Male | Female |
| 5 to 17 Years | 272 (2.6%) | 147 (1.5%) |
| 18 to 34 Years | 843 (7.2%) | 403 (2.9%) |
| 35 to 64 Years | 968 (5.0%) | 1,832 (7.5%) |
| 65 to 74 Years | 149 (4.4%) | 113 (2.5%) |
| 75 Years and over | 210 (13.0%) | 545 (20.0%) |
Disability Class: Ambulatory Difficulty
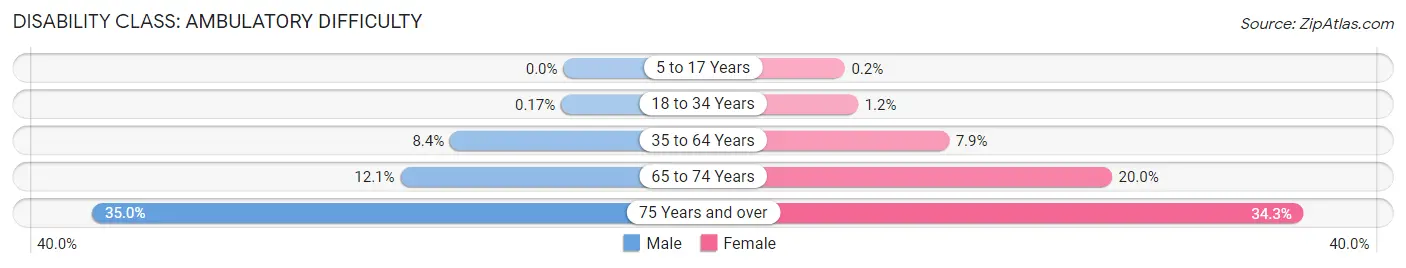
| Age Bracket | Male | Female |
| 5 to 17 Years | 0 (0.0%) | 19 (0.2%) |
| 18 to 34 Years | 20 (0.2%) | 163 (1.2%) |
| 35 to 64 Years | 1,622 (8.4%) | 1,947 (7.9%) |
| 65 to 74 Years | 407 (12.1%) | 892 (20.0%) |
| 75 Years and over | 564 (35.0%) | 936 (34.3%) |
Disability Class: Self-Care Difficulty
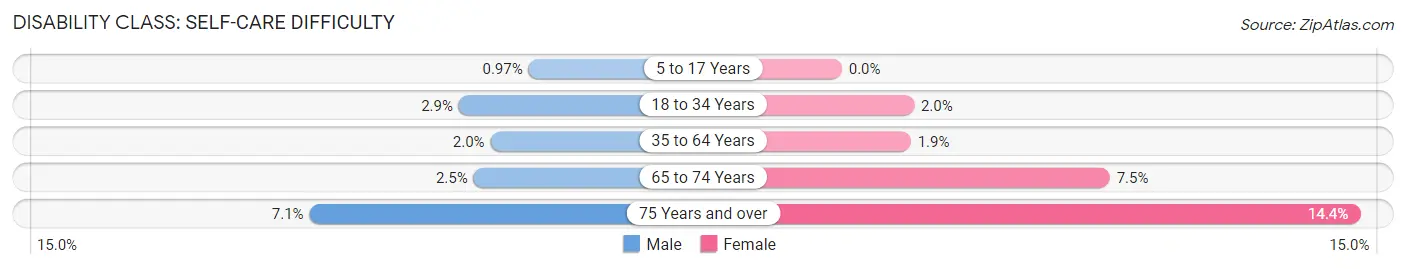
| Age Bracket | Male | Female |
| 5 to 17 Years | 102 (1.0%) | 0 (0.0%) |
| 18 to 34 Years | 340 (2.9%) | 277 (2.0%) |
| 35 to 64 Years | 391 (2.0%) | 472 (1.9%) |
| 65 to 74 Years | 84 (2.5%) | 332 (7.5%) |
| 75 Years and over | 114 (7.1%) | 394 (14.4%) |
Technology Access in South Fulton
Computing Device Access in South Fulton
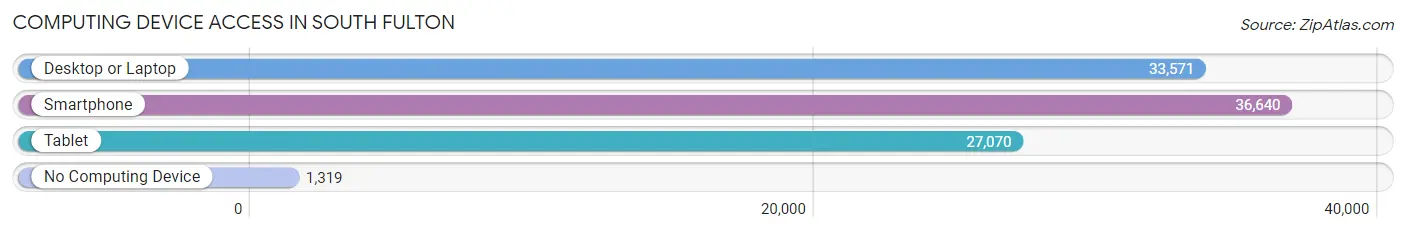
| Device Type | # Households | % Households |
| Desktop or Laptop | 33,571 | 84.8% |
| Smartphone | 36,640 | 92.5% |
| Tablet | 27,070 | 68.4% |
| No Computing Device | 1,319 | 3.3% |
| Total | 39,600 | 100.0% |
Internet Access in South Fulton
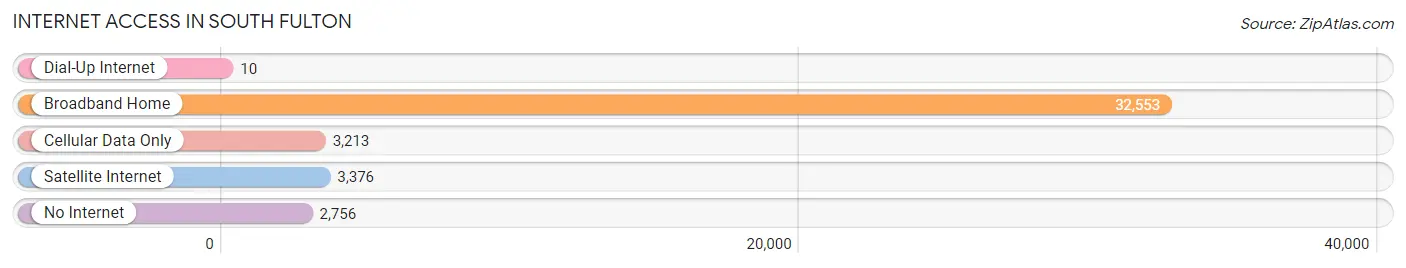
| Internet Type | # Households | % Households |
| Dial-Up Internet | 10 | 0.0% |
| Broadband Home | 32,553 | 82.2% |
| Cellular Data Only | 3,213 | 8.1% |
| Satellite Internet | 3,376 | 8.5% |
| No Internet | 2,756 | 7.0% |
| Total | 39,600 | 100.0% |
South Fulton Summary
History
South Fulton, Georgia is a city located in the southern part of Fulton County, Georgia. It is the county seat of Fulton County and is located just south of Atlanta. The city was founded in 1854 and was originally known as Campbellton. It was renamed South Fulton in 2017 after the city of Atlanta annexed the northern part of Fulton County.
South Fulton has a rich history that dates back to the early 1800s. The area was originally inhabited by the Creek and Cherokee Native American tribes. In 1821, the area was ceded to the United States government and the land was opened up for settlement. The first settlers in the area were mostly farmers and the area quickly grew into a thriving agricultural community.
In 1854, the city of Campbellton was founded and the area quickly grew into a bustling town. The city was named after the Campbell family, who were some of the first settlers in the area. The city was a major hub for the cotton industry and was home to several cotton mills.
In the late 1800s, the city began to experience a period of growth and development. The city was connected to the rest of the state by the Georgia Railroad and the city's population began to grow. The city was also home to several educational institutions, including the University of Georgia and Emory University.
In the early 1900s, the city experienced a period of decline as the cotton industry began to decline. The city's population began to decline and the city's economy began to suffer. In the late 1900s, the city began to experience a period of revitalization as new businesses began to move into the area.
Geography
South Fulton is located in the southern part of Fulton County, Georgia. It is located just south of Atlanta and is bordered by the cities of East Point, College Park, and Union City. The city covers an area of approximately 11.5 square miles and has a population of approximately 60,000 people.
The city is located in the Piedmont region of Georgia and is characterized by rolling hills and lush forests. The city is located along the Chattahoochee River and is home to several parks and recreational areas. The city is also home to several historic sites, including the Atlanta History Center and the Martin Luther King Jr. National Historic Site.
Economy
South Fulton has a diverse economy that is driven by a variety of industries. The city is home to several large corporations, including Delta Air Lines, Coca-Cola, and Home Depot. The city is also home to several small businesses, including restaurants, retail stores, and professional services.
The city is also home to several educational institutions, including the University of Georgia and Emory University. The city is also home to several medical centers, including the Atlanta Medical Center and the Grady Memorial Hospital.
Demographics
As of the 2010 census, South Fulton had a population of 60,000 people. The city is racially diverse and is home to a variety of ethnic and racial groups. The city is predominantly African American, with approximately 57% of the population identifying as African American. The city is also home to a large Hispanic population, with approximately 15% of the population identifying as Hispanic or Latino. The city is also home to a small Asian population, with approximately 3% of the population identifying as Asian. The city is also home to a small Native American population, with approximately 1% of the population identifying as Native American.
Common Questions
What is Per Capita Income in South Fulton?
Per Capita income in South Fulton is $36,153.
What is the Median Family Income in South Fulton?
Median Family Income in South Fulton is $92,810.
What is the Median Household income in South Fulton?
Median Household Income in South Fulton is $77,488.
What is Income or Wage Gap in South Fulton?
Income or Wage Gap in South Fulton is 13.6%.
Women in South Fulton earn 86.4 cents for every dollar earned by a man.
What is Family Income Deficit in South Fulton?
Family Income Deficit in South Fulton is $14,199.
Families that are below poverty line in South Fulton earn $14,199 less on average than the poverty threshold level.
What is Inequality or Gini Index in South Fulton?
Inequality or Gini Index in South Fulton is 0.42.
What is the Total Population of South Fulton?
Total Population of South Fulton is 107,865.
What is the Total Male Population of South Fulton?
Total Male Population of South Fulton is 49,261.
What is the Total Female Population of South Fulton?
Total Female Population of South Fulton is 58,604.
What is the Ratio of Males per 100 Females in South Fulton?
There are 84.06 Males per 100 Females in South Fulton.
What is the Ratio of Females per 100 Males in South Fulton?
There are 118.97 Females per 100 Males in South Fulton.
What is the Median Population Age in South Fulton?
Median Population Age in South Fulton is 37.1 Years.
What is the Average Family Size in South Fulton
Average Family Size in South Fulton is 3.5 People.
What is the Average Household Size in South Fulton
Average Household Size in South Fulton is 2.7 People.
How Large is the Labor Force in South Fulton?
There are 59,749 People in the Labor Forcein in South Fulton.
What is the Percentage of People in the Labor Force in South Fulton?
69.8% of People are in the Labor Force in South Fulton.
What is the Unemployment Rate in South Fulton?
Unemployment Rate in South Fulton is 7.8%.